green chemistry in the pharmaceutical...
TRANSCRIPT
Green Chemistryin the
PharmaceuticalIndustry
Peter J. Dunn, Andrew S. Wells, andMichael T. Williams, Editors
WILEY-VCH Verlag GmbH & Co.

Green Chemistry in the Pharmaceutical Industry
Edited by Peter J. Dunn, Andrew S. Wells, and Michael T. Williams


Green Chemistry in the Pharmaceutical Industry
Edited by
Peter J. Dunn, Andrew S. Wells,
and Michael T. Williams

Related Titles
Blaser, H.-U., Federsel, H.-J. (eds.)
Asymmetric Catalysis on Industrial ScaleChallenges, Approaches and Solutions
Second Edition
2010
ISBN: 978-3-527-32489-7
Series Editor: Anastas, P.Volume Editor: Crabtree, R. H.
Handbook of Green Chemistry – Green Catalysis
3-Volume Set
2009
ISBN: 978-3-527-31577-2
Series Editor: Anastas, P.Volume Editors: Leitner, W., Jessop, P. G., Li, C.-J., Wasserscheid, P., Stark, A.
Handbook of Green Chemistry – Green Solvents
3-Volume Set
2010
ISBN: 978-3-527-31574-1
Tanaka, K.
Solvent-free Organic Synthesis
2009
ISBN: 978-3-527-32264-0
Wasserscheid, P., Welton, T. (eds.)
Ionic Liquids in Synthesis
2008
ISBN: 978-3-527-31239-9
Sheldon, R. A., Arends, I., Hanefeld, U.
Green Chemistry and Catalysis
2007
ISBN: 978-3-527-30715-9
Loupy, A. (ed.)
Microwaves in Organic Synthesis
2006
ISBN: 978-3-527-31452-2
Kemmere, M. F., Meyer, T. (eds.)
Supercritical Carbon Dioxidein Polymer Reaction Engineering
2005
ISBN: 978-3-527-31092-0

Green Chemistry in the Pharmaceutical Industry
Edited by Peter J. Dunn, Andrew S. Wells, and Michael T. Williams

The Editors
Dr. Peter J. DunnPfi zer Green Chemistry LeadRamsgate RoadSandwich, KentCT13 9NJUnited Kingdom
Dr. Andrew S. WellsAstra ZenecaProcess Research & DevelopmentBakewell RoadLoughboroughLE11 5RHUnited Kingdom
Dr. Michael T. WilliamsCMC Consultant133, London RoadDeal, KentCT14 9TYUnited Kingdom
All books published by Wiley-VCH are carefully produced. Nevertheless, authors, editors, and publisher do not warrant the information contained in these books, including this book, to be free of errors. Readers are advised to keep in mind that statements, data, illustrations, procedural details or other items may inadvertently be inaccurate.
Library of Congress Card No.: applied for
British Library Cataloguing-in-Publication DataA catalogue record for this book is available from the British Library.
Bibliographic information published by the Deutsche NationalbibliothekThe Deutsche Nationalbibliothek lists this publication in the Deutsche Nationalbibliografi e; detailed bibliographic data are available on the Internet at <http://dnb.d-nb.de>.
© 2010 WILEY-VCH Verlag GmbH & Co. KGaA, Weinheim
All rights reserved (including those of translation into other languages). No part of this book may be reproduced in any form – by photoprinting, microfi lm, or any other means – nor transmitted or translated into a machine language without written permission from the publishers. Registered names, trademarks, etc. used in this book, even when not specifi cally marked as such, are not to be considered unprotected by law.
Typesetting Toppan Best-set Premedia LimitedPrinting and Binding Strauss GmbH, M ö rlenbach
Printed in the Federal Republic of GermanyPrinted on acid-free paper
ISBN: 978-3-527-32418-7
V
Foreword
While we all recognize the value and benefi ts to mankind of the healing drugs that are used worldwide, we often take for granted how these precious materials are discovered and made. The expectations of modern society for improved safety, lower environmental impact, more sustainable practices, and lower energy use at a fair cost place tremendous demands and responsibility on us all, and the complex task of manufacturing pharmaceuticals has to balance current knowledge and the robustness and durability of the chemical and biological processes used with these regulatory pressures and escalating costs. Nevertheless, chemists and production engineers owe it to their profession and to future generations to adopt a charter which promotes the ‘ Green ’ agenda.
I therefore welcome this new text, which promotes improved and sustainable practices. It demonstrates clearly how through innovation, understanding, and commitment one can effect change and drive standards even higher. The chapters discuss all the relevant issues of the day as they relate to solvents, energy, new technologies, metrics, and lifecycle appreciation. The articles describing illustra-tive processes used by the major practitioners for producing worked - up pharma-ceutical products amply demonstrate the attitude and advantages that can accrue by a more refl ective and committed approach. Clean chemo - enzymatic processes alone, with continuous fl ow methods and improved optimization protocols, are beginning to make an impact and are certainly trends for the future. Our ability to better and more rapidly profi le for impurities and evaluate alternative routes is leading to new opportunities and creating better understanding.
The future image of the industry and society ’ s respect for it will hinge upon a clear demonstration of its belief in and stewardship of the principles of Green Chemistry. Indeed, there is nothing more worthy than our desire to improve our ability to meet healthcare needs for the betterment of everyone through sustain-able practices.
Steven V. Ley Cambridge, UK
Green Chemistry in the Pharmaceutical Industry. Edited by Peter J. Dunn, Andrew S. Wells and Michael T. Williams© 2010 WILEY-VCH Verlag GmbH & Co. KGaA, WeinheimISBN: 978-3-527-32418-7


VII
Contents
Green Chemistry in the Pharmaceutical Industry. Edited by Peter J. Dunn, Andrew S. Wells and Michael T. Williams© 2010 WILEY-VCH Verlag GmbH & Co. KGaA, WeinheimISBN: 978-3-527-32418-7
Foreword V List of Contributors XV
1 Introduction to Green Chemistry, Organic Synthesis and Pharmaceuticals 1Roger Sheldon
1.1 The Development of Organic Synthesis 11.2 The Environmental Factor 41.3 The Role of Catalysis 71.4 Green Chemistry: Benign by Design 101.5 Ibuprofen Manufacture 111.6 The Question of Solvents: Alternative Reaction Media 111.7 Biocatalysis: Green Chemistry Meets White Biotechnology 151.8 Conclusions and Prospects 18 References 18
2 Green Chemistry Metrics 21Richard K. Henderson, David J.C. Constable, and Concepción Jiménez-González
2.1 Introduction 212.2 Measuring Resource Usage 242.2.1 Focus on Solvents 262.2.2 Focus on Renewables 282.2.3 Cleaning and Maintenance 302.3 Life Cycle Assessment (LCA) 302.4 Measuring Chemistry and Process Effi ciency 342.5 Measuring Process Parameters and Emissions 352.6 Real Time Analysis 362.6.1 Scalability 362.6.2 Controllability 372.6.3 Robustness 38
VIII Contents
2.7 Operational Effi ciency 382.8 Measuring Energy 392.9 Measuring the Toxicity of All the Substrates 402.9.1 Occupational Exposure Hazard and Risk 402.10 Measuring Degradation Potential 432.11 Measuring the Inherent Safety or Lack of Inherent Safety 452.12 Conclusions 45 References 46
3 Solvent Use and Waste Issues 49C. Stewart Slater, Mariano J. Savelski, William A. Carole, and David J.C. Constable
3.1 Introduction to Solvent Use and Waste Issues 493.1.1 Introduction 493.1.2 Process Effi ciency Metrics 503.1.3 Impact Beyond the Plant − Solvent Life Cycle 513.1.4 Solvent Utilization 523.1.5 Solvents Used in the Pharmaceutical Industry 543.1.6 Solvent Use in Process Development 573.1.7 Consequences of Excessive Solvent Use 593.1.8 Waste Management Practices in the United States 613.2 Solvent and Process Greenness Scoring and Selection Tools 643.2.1 Review of Solvent and Process Scoring Methods 643.2.1.1 Greenness Assessment of Pharmaceutical Processes and
Technology 643.2.1.2 Greenness Scoring Methods for Solvents 663.2.1.3 The GSK Solvent Selection Guide 683.2.1.4 The Rowan Solvent Greenness Index Method 703.3 Waste Minimization and Solvent Recovery 733.3.1 Minimizing Solvent Use 733.3.1.1 Batch versus Continuous Reactors 743.3.1.2 Biosynthetic Processes 743.3.1.3 Solid-State Chemistry 753.3.1.4 Telescoping 753.3.2 Recycling Solvents 763.3.2.1 Methods to Recover and Reuse Solvents 763.3.2.2 Issues with Solvent Recovery and Reuse 79 Acknowledgments 80 References 81
4 Environmental and Regulatory Aspects 83David Taylor and Vyvyan T. Coombe
4.1 Historical Perspective 834.2 Pharmaceuticals in the Environment 844.2.1 Presence 844.2.2 Persistence 864.2.3 Bioaccumulation 86

Contents IX
4.2.4 Ecotoxicology 874.2.5 The Current State of the Science 904.3 Environmental Regulations 904.3.1 Product Regulations 914.3.2 Process Regulations 934.3.2.1 Chemicals Control 934.3.2.2 Integrated Pollution Control 954.3.3 Environmental Quality Regulations 974.4 A Look to the Future 98 References 99
5 Synthesis of Sitagliptin, the Active Ingredient in Januvia® and Janumet® 101Jaume Balsells, Yi Hsiao, Karl B. Hansen, Feng Xu, Norihiro Ikemoto, Andrew Clausen, and Joseph D. Armstrong III
5.1 Introduction 1015.2 First-Generation Route 1025.3 Sitagliptin through Diastereoselective Hydrogenation of an Enamine.
The PGA Enamine-Ester Route 1055.4 The Triazole Fragment 1095.5 Direct Preparation of β-Keto Amides 1125.6 Second-Generation Chiral Auxiliary Route. The PGA Enamine-amide
Route 1155.7 The Asymmetric Hydrogenation Route 1165.8 Purifi cation and Isolation of Sitagliptin (Pharmaceutical Form) 1225.9 The Final Manufacturing Route 123 Acknowledgments 125 References 125
6 The Development of Short, Effi cient, Economic, and Sustainable Chemoenzymatic Processes for Statin Side Chains 127Martin Schürmann, Michael Wolberg, Sven Panke, and Hans Kierkels
6.1 Introduction: Biocatalysis 1276.2 The Relevance of Statins 1286.3 Biocatalytic Routes to Statin Side Chains 1296.4 2-Deoxy-d-Ribose 5-Phosphate Aldolase (DERA)-Based Routes to Statin
Intermediates 1316.4.1 Chemical Transformations of the DERA Product Toward
Statins 1316.4.2 Optimization and Scale-Up of the DERA Reaction 1336.4.2.1 Deactivation of DERA 1366.4.2.2 Enzyme Kinetics 1366.4.2.3 Conclusions and Outlook 1386.4.3 Improvement of DERA by Directed Evolution 1396.5 Conclusions 142 Acknowledgments 143 References 143
X Contents
7 The Taxol® Story – Development of a Green Synthesis via Plant Cell Fermentation 145Pia G. Mountford
7.1 Introduction 1457.2 Discovery and Early Development 1467.3 From Extraction of Taxol® from Pacifi c Yew Tree Bark to Semi-
Synthetic Taxol® 1477.4 Taxol® from Plant Cell Fermentation 1507.5 Comparison of Semi-Synthetic versus PCF Taxol® Processes: The
Environmental Impact 1547.5.1 Semi-Synthetic Process 1547.5.1.1 Taxus Baccata Plantations 1547.5.1.2 Biomass Waste from Isolating 10-DAB 1547.5.1.3 Chemical Synthesis 1547.5.2 Plant Cell Fermentation Process 1557.5.2.1 Plant Cell Fermentation 1557.5.2.2 Crude Paclitaxel Isolation 1557.5.2.3 Chromatographic Purifi cation of Crude Paclitaxel 1557.6 Comparison of Semi-Synthetic versus PCF Taxol®: Green Chemistry
Principles 1567.6.1 Reagent Use 1567.6.2 Solvent Use 1567.6.3 Energy and Handling Implications 1577.7 Final Words 158 Acknowledgments 158 References 159
8 The Development of a Green, Energy Effi cient, Chemoenzymatic Manufacturing Process for Pregabalin 161Peter J. Dunn, Kevin Hettenbach, Patrick Kelleher, and Carlos A. Martinez
8.1 Introduction 1618.2 Process Routes to Pregabalin 1618.2.1 Classical Resolution Route 1628.2.2 Asymmetric Hydrogenation Route to Pregabalin 1638.2.3 Non-Pfi zer/Parke-Davis Routes to Pregabalin 1658.3 Biocatalytic Route to Pregabalin 1658.3.1 Enzyme Screening, Optimization, and Recycling of Undesired
Enantiomer 1668.3.2 Subsequent Chemical Steps to Pregabalin 1708.4 Green Chemistry Considerations 1718.4.1 Material Usage 1728.4.2 Energy Usage 1738.5 Conclusions 176 Acknowledgments 176 References 176

Contents XI
9 Green Processes for Peptide Mimetic Diabetic Drugs 179Yasuhiro Sawai and Mitsuhisa Yamano
9.1 Introduction 1799.2 Green Chemistry Considerations in Peptide-like API
Manufacture 1799.3 Purifi cation Process to Manufacture Amorphous API 1829.3.1 Cation Exchange Chromatography 1849.3.2 Extraction 1869.4 Preparation of Unnatural Amino Acids 1879.4.1 Crystallization-Induced Diastereomer Transformation 1889.4.2 Optical Resolution via Diastereomeric Salt Formation 1919.5 Summary 193 Acknowledgments 193 References 193
10 The Development of an Environmentally Sustainable Process for Radafaxine 197Trevor Grinter
10.1 Introduction 19710.1.1 Background 19810.2 Chemistry Process and the Dynamic Kinetic Resolution (DKR) 19910.2.1 General Description of the Chemistry 20110.2.2 Route 2 20210.2.3 Route 3 20210.3 Multicolumn Chromatography – Development of Route 4 20610.4 Environmental Assessment 21210.4.1 Life Cycle Metrics 21410.4.2 Eco-Effi ciency Benefi ts 21610.5 Summary 217 Acknowledgments 218 References 218
11 Continuous Processing in the Pharmaceutical Industry 221Lee Proctor, Peter J. Dunn, Joel M. Hawkins, Andrew S. Wells, and Michael T. Williams
11.1 Introduction 22111.2 Continuous Production of a Key Intermediate for Atorvastatin 22311.2.1 Laboratory Screening 22311.2.2 Reaction Scale-up 22511.2.3 Product Isolation and Waste Treatment 22611.3 Continuous Process to Prepare Celecoxib 22811.4 Continuous Oxidation of Alcohols to Aldehydes 23211.5 Continuous Production of Bromonitromethane 23411.6 Continuous Production and Use of Diazomethane 23511.7 A Snapshot of Some Further Continuous Processes Used in the
Preparation of Pharmaceutical Agents 238
XII Contents
11.8 Conclusions 241 Acknowledgments 241 References 241
12 Preparative and Industrial Scale Chromatography: Green and Integrated Processes 243Eric Lang, Eric Valéry, Olivier Ludemann-Hombourger, Wieslaw Majewski, and Jean Bléhaut
12.1 Introduction 24312.2 Basic Principles of Chromatography 24412.3 Process Optimization to Reduce Eluent Consumption 24612.3.1 Batch Processes 24712.3.1.1 Increasing Injected Amount 24712.3.1.2 Reducing Cycle Time with Stacked Injections (Case of Isocratic
Eluents) 24712.3.1.3 Reducing Cycle Time Using Gradients 24812.3.2 Continuous Processes 24912.4 Use of a Green Solvent: Supercritical Carbon Dioxide 25212.5 Solvent Recycling Technologies 25512.5.1 Recycling Devices for Isocratic Chromatography 25612.5.2 Recycling Devices for Gradient Chromatography 25712.5.3 Recycling Devices for Supercritical Carbon Dioxide 25812.6 Application Examples 25912.6.1 Optimization of a Batch Process 25912.6.2 Selection of the Chromatographic Conditions 25912.6.3 Scale-up on a Pilot SFC Unit 26112.6.4 Optimization of an MCC Process 26412.7 Conclusion: An Environmentally Friendly Solution for Each
Separation 264 Acknowledgment 266 References 266
13 Dynamic Resolution of Chiral Amine Pharmaceuticals: Turning Waste Isomers into Useful Product 269John Blacker and Catherine E. Headley
13.1 Background 26913.1.1 Chiral Amine Resolution Processes 26913.1.2 Homochiral Amine Racemization Processes 27213.2 Integration of Chiral Amine Resolution and Racemization 27613.2.1 Dynamic Resolution Processes 27613.3 Case Studies 27913.3.1 Asymmetric Transformation of
(S)-7-Methoxy-1,2,3,4-tetrahydronaphthalen-2-amine 27913.3.2 Asymmetric Transformation of
(R)-1-tert-butyloxycarbonyl-3-aminopyrrolidine 281

Contents XIII
13.3.3 Sertraline 28213.4 Conclusions 286 Acknowledgments 287 References 287
14 Green Technologies in the Generic Pharmaceutical Industry 289Apurba Bhattacharya and Rakeshwar Bandichhor
14.1 Introduction 28914.2 ‘Waste’: Defi nition and Remedy 29214.3 Amidation 29314.3.1 Carbodiimide and Acid Chloride Mediated Transformation 29314.3.2 Metal-Catalyzed Oxidative Amide Synthesis 29414.3.2.1 Copper-Catalyzed Amide Synthesis 29414.3.2.2 Palladium-Catalyzed Amide Synthesis 29414.3.2.3 Ruthenium-Catalyzed Amide Synthesis 29514.3.3 N-Heterocyclic Carbene (NHC-Catalyzed Amidation) 29614.3.4 Amidation Catalyzed by Boric Acid Derivatives 29714.4 Synthesis of Galanthamine 29814.5 Synthesis of Solefi nacin 29814.5.1 Precedented Approach 29814.5.2 A Greener Approach 29914.6 Synthesis of Levetiracetam 30014.6.1 Established Approach 30014.6.2 A More Eco-Friendly Synthesis 30114.7 Synthesis of a Finasteride Intermediate 30114.7.1 The Classical Approach 30114.7.2 Problems with the Existing Synthesis 30214.7.3 A Catalytic Approach 30214.8 Bromination 30414.8.1 Current Zafi rlukast Bromination Method 30414.8.2 Environmental Burden 30514.8.3 Waste-Minimized Bromination 30514.9 Sulfoxidation in the Synthesis of Rabeprazole 30614.9.1 The Traditional Approach 30614.9.2 A Greener Approach 30714.10 Conclusions 307 Acknowledgments 308 References 308
15 Environmental Considerations in Biologics Manufacture 311Sa V. Ho
15.1 Introduction 31115.2 Therapeutic Biologics 31215.2.1 Types of Therapeutic Biologics 31215.2.2 General Features of Therapeutic Protein Manufacture 314

XIV Contents
15.3 Environmental Impact Considerations 31715.3.1 Microbially Produced Proteins 31715.3.1.1 Insulin Production Process 31715.3.1.2 Production of a Typical Medium-Sized Protein 31815.3.1.3 Highly Effi cient Protein Manufacturing Process 31915.3.2 Monoclonal Antibodies and Mammalian Cell Culture Processes 32115.3.2.1 Typical-to-Optimized Manufacturing Process for mAbs 32215.3.2.2 Projected ‘Intensifi ed’ Large-Scale Monoclonal Antibody
Manufacturing Process 32215.4 Overall Comparison 32415.5 Environmental Indices for Therapeutic Protein Manufacture 32515.6 Technologies with Potential Environmental Impact 32715.7 Single-Use Biologics Manufacture 32815.8 Summary 329 Acknowledgments 330 References 330
16 Future Trends for Green Chemistry in the Pharmaceutical Industry 333Peter J. Dunn, Andrew S. Wells, and Michael T. Williams
16.1 Introduction 33316.2 Waste Minimization in Drug Discovery 33416.3 Greener Synthetic Methods in Primary Manufacturing 33816.3.1 Synthesis Design and Execution 33816.3.2 Reduction and Oxidation 33916.3.3 C–C Bond Formation 34016.3.4 Heteroatom Alkylation and Acylation 34116.3.5 Biocatalysis Now and Into the Future 34116.3.6 Application of Technology 34316.4 Alternative Solvents in the Pharmaceutical Industry 34416.4.1 Water 34516.4.2 Ionic Liquids (ILs) 34516.4.3 Fluorous Solvents 34616.4.4 Supercritical CO2 (SC-CO2) and Gas-Expanded Liquids (GXL) 34616.4.5 Molecular Solvents from Renewable Sources 34716.4.6 Solid-Phase Reactions 34816.4.7 The Work-Up 34816.4.8 Obstacles to Change 34916.5 Green Chemistry in Secondary Pharmaceutical Operations 34916.6 Global Cooperation in Green Chemistry 35116.6.1 The Pharmaceutical Roundtable 35116.6.2 Recognition 35216.6.3 The Global Impact 35216.7 Conclusions 353 References 353
Index 357

XV
List of Contributors
Green Chemistry in the Pharmaceutical Industry. Edited by Peter J. Dunn, Andrew S. Wells and Michael T. Williams© 2010 WILEY-VCH Verlag GmbH & Co. KGaA, WeinheimISBN: 978-3-527-32418-7
Joseph D. Armstrong III Merck Research Laboratories Department of Process Research PO Box 2000 Rahway, NJ 07065 USA
Jaume Balsells Merck Research Laboratories Department of Process Research PO Box 2000 Rahway, NJ 07065 USA
Rakeshwar Bandichhor Center of Excellence, Research & Development Integrated Product Development Dr. Reddy ’ s Laboratories Ltd. Survey Nos. 42, 45, 46 & 54 Bachupally Qutubullapur Ranga Reddy Dist 500072 Andhra Pradesh India
Apurba Bhattacharya Texas A & M University Department of Chemistry 920 W. Santa Gertrudes Kingsville, TX 78363 USA
John Blacker University of Leeds Institute of Process R + D School of Chemistry Woodhouse Lane Leeds, LS2 9JT UK
Jean Bl é haut Groupe Novasep SAS 82, Boulevard de la Moselle - BP50 Pompey - 54340 France
William A. Carole Rowan University Department of Chemical Engineering Glassboro, NJ 08028 USA
Andrew Clausen Amgen Inc. Chemical Process R & D One Kendall Square Bldg 1000 Cambridge, MA02139 USA

XVI List of Contributors
David J.C. Constable V.P. Energy, Environment, Safety and Health Lockeed Martin 6801 Rockledge Drive MP: CCT-246 Bethesda, MD 20817 USA
Vyvyan T. Coombe AstraZeneca Gloal SHE Brixham Environmental Laboratory Freshwater Quarry Brixham, Devon TQ5 8BA UK
Peter J. Dunn Pfi zer Global Research and Development Ramsgate Road Sandwich Kent CT13 9NJ UK
Trevor Grinter Roystons New Road Rotherfi eld East Sussex TN6 3JS UK
Karl B. Hansen Amgen Inc. Chemical Process R & D One Kendall Square Bldg 1000 Cambridge, MA02139 USA
Joel M. Hawkins Pfi zer Global R & D Chemical R & D Department MS 4073, Eastern Point Road Groton, CT 06340 USA
Catherine E. Headley University of Manchester Business Relations Team Oxford Road Manchester, MI3 9PL UK
Richard K. Henderson GlaxoSmithKline Plc Park Road Ware, Herts. SG12 0DP UK
Kevin Hettenbach Pfi zer Global R & D Chemical R & D Department MS 4073, Eastern Point Road Groton, CT 06340 USA
Sa V. Ho Pfi zer Global Biologics 700 Chesterfi eld Parkway BB3D Chesterfi eld, MO 63017 USA
Yi Hsiao Bristol Myers Squibb NB50 - 358 One Squibb Drive New Brunswick, NJ 08903 USA
Norihiro Ikemoto Merck Research Laboratories Department of Process Research PO Box 2000 Rahway, NJ 07065 USA

List of Contributors XVII
Concepci ó n Jim é nez - Gonz á lez GlaxoSmithKline Pharmaceuticals Five Moore Drive Research Triangle Park, NC 27709 USA
Patrick Kelleher Pfi zer Global Manufactuing Process Development Centre Loughbeg Ireland
Hans Kierkels DSM Pharma Chemicals Department: DSM Innovative Synthesis BV P.O. Box 18 6160 MD Geleen The Netherlands
Eric Lang Groupe Novasep SAS 82, Boulevard de la Moselle - BP50 Pompey-54340 France
Olivier Ludemann - Hombourger Lonza Braine SA Chaus é e de Tubize 297 Braine - l ’ Alleud - 1420 Belgium
Wieslaw Majewski Novasep Process SAS 81, Boulevard de la Moselle - BP50 Pompey - 54340 France
Carlos Martinez Pfi zer Global R & D Chemical R & D Department MS 4073, Eastern Point Road Groton, CT 06340 USA
Pia G. Mountford Bristol Myers Squibb 777 Scudders Mill Road Plainsboro, NJ 08536 USA
Sven Panke ETH Z ü rich Department of Biosystems Science and Engineering Mattenstrasse 26 4058 Basel Switzerland
Lee Proctor Phoenix Chemicals Ltd. Croft Business Park 34 Thursby Road Bromborough Wirral CH62 3PW UK
Mariano J. Savelski Rowan University Department of Chemical Engineering Glassboro, NJ 08028 USA
Yasuhiro Sawai Takeda Pharmaceutical Company Ltd. Chemical Development Laboratories 17 - 85 Jusohonmachi 2 - Chome Yodogawa - ku Osaka 532 - 8686 Japan
Martin Sch ü rmann DSM Pharma Chemicals Department: DSM Innovative Synthesis BV P.O. Box 18 6160 MD Geleen The Netherlands

XVIII List of Contributors
Roger Sheldon Delft University of Technology Julianalaan 136 2628 BL Delft The Netherlands
C. Stewart Slater Rowan University Department of Chemical Engineering Glassboro, NJ 08028 USA
David Taylor WCA Environment Ltd Brunel House Volunteer Way Farington Oxfordshire SN7 7YR UK
Eric Val é ry Novasep Process SAS 81, Boulevard de la Moselle 54340 Pompey France
Andrew S. Wells Astra Zeneca Process Research & Development Bakewell Road Loughborough LE11 5RH United Kingdom
Michael T. Williams CMC Consultant 133, London Road Deal Kent CT14 9TY UK
Michael Wolberg DSM Pharma Chemicals - ResCom DPC Regensburg GmbH Donaustaufer Str. 378 93055 Regensburg Germany
Feng Xu Merck Research Laboratories Department of Process Research PO Box 2000 Rahway, NJ 07065 USA
Mitsuhisa Yamano Takeda Pharmaceutical Company Ltd. Chemical Development Laboratories 17 - 85 Jusohonmachi 2 - Chome Yodogawa - ku Osaka 532 - 8686 Japan

1
1 Introduction to Green Chemistry, Organic Synthesis and Pharmaceuticals Roger Sheldon
1.1 The Development of Organic Synthesis
The well - being of modern society is unimaginable without the myriad products of industrial organic synthesis. Our quality of life is strongly dependent on, inter alia , the products of the pharmaceutical industry, such as antibiotics for combating disease and analgesics or anti - infl ammatory drugs for relieving pain. The origins of this industry date back to 1935, when Domagk discovered the antibacterial properties of the red dye, prontosil, the prototype of a range of sulfa drugs that quickly found their way into medical practice.
The history of organic synthesis is generally traced back to W ö hler ’ s synthesis of the natural product urea from ammonium isocyanate in 1828. This laid to rest the vis vitalis (vital force) theory, which maintained that a substance produced by a living organism could not be produced synthetically. The discovery had monu-mental signifi cance, because it showed that, in principle, all organic compounds are amenable to synthesis in the laboratory.
The next landmark in the development of organic synthesis was the preparation of the fi rst synthetic dye, mauveine (aniline purple) by Perkin in 1856, generally regarded as the fi rst industrial organic synthesis. It is also a remarkable example of serendipity. Perkin was trying to synthesize the anti - malarial drug quinine by oxidation of N - allyl toluidine with potassium dichromate. This noble but na ï ve attempt, bearing in mind that only the molecular formula of quinine (C 20 H 24 N 2 O 2 ) was known at the time, was doomed to fail. In subsequent experiments with aniline, fortuitously contaminated with toluidines, Perkin obtained a low yield of a purple - colored product. Apparently, the young Perkin was not only a good chemist but also a good businessman, and he quickly recognized the commercial potential of his fi nding. The rapid development of the product, and the process to make it, culminated in the commercialization of mauveine, which replaced the natural dye, Tyrian purple. At the time of Perkin ’ s discovery Tyrian purple, which was extracted from a species of Mediterranean snail, cost more per kg than gold.
Green Chemistry in the Pharmaceutical Industry. Edited by Peter J. Dunn, Andrew S. Wells and Michael T. Williams© 2010 WILEY-VCH Verlag GmbH & Co. KGaA, WeinheimISBN: 978-3-527-32418-7
2 1 Introduction to Green Chemistry, Organic Synthesis and Pharmaceuticals
This serendipitous discovery marked the advent of the synthetic dyestuffs indus-try based on coal tar, a waste product from steel manufacture. The development of mauveine was followed by the industrial synthesis of the natural dyes alizarin and indigo by Graebe and Liebermann in 1868 and Adolf Baeyer in 1870, respec-tively. The commercialization of these dyes marked the demise of their agricultural production and the birth of a science - based, predominantly German, chemical industry.
By the turn of the 20th century the germ theory of disease had been developed by Pasteur and Koch, and for chemists seeking new uses for coal tar derivatives which were unsuitable as dyes, the burgeoning fi eld of pharmaceuticals was an obvious one for exploitation. A leading light in this fi eld was Paul Ehrlich, who coined the term chemotherapy. He envisaged that certain chemicals could act as ‘ magic bullets ’ by being extremely toxic to an infecting microbe but harmless to the host. This led him to test dyes as chemotherapeutic agents and to the discovery of an effective treatment for syphilis. Because Ehrlich had studied dye molecules as ‘ magic bullets ’ it became routine to test all dyes as chemotherapeutic agents, and this practice led to the above - mentioned discovery of prontosil as an antibacte-rial agent. Thus, the modern pharmaceutical industry was born as a spin - off of the manufacture of synthetic dyestuffs from coal tar.
The introduction of the sulfa drugs was followed by the development of the penicillin antibiotics. Fleming ’ s chance observation of the anti - bacterial action of the penicillin mold in 1928 and the subsequent isolation and identifi cation of its active constituent by Florey and Chain in 1940 marked the beginning of the anti-biotics era that still continues today. At roughly the same time, the steroid hor-mones found their way into medical practice. Cortisone was introduced by the pharmaceutical industry in 1944 as a drug for the treatment of arthritis and rheu-matic fever. This was followed by the development of steroid hormones as the active constituents of the contraceptive pill.
The penicillins, the related cephalosporins, and the steroid hormones repre-sented considerably more complicated synthetic targets than the earlier men-tioned sulfa drugs. Indeed, as the target molecules shifted from readily available natural compounds and relatively simple synthetic molecules to complex semi - synthetic structures, a key factor in their successful introduction into medical practice became the availability of a cost - effective synthesis. For example, the discovery [1] of the regio - and enantiospecifi c microbial hydroxylation of proges-terone to 11 α - hydroxyprogesterone (Figure 1.1 ) by Peterson and Murray at the Upjohn Company led to a commercially viable synthesis of cortisone that replaced a 31 - step chemical synthesis from a bile acid and paved the way for the subsequent commercial success of the steroid hormones. According to Peterson [2] , when he proposed the microbial hydroxylation, many outstanding organic chemists were of the opinion that it couldn ’ t be done. Peterson ’ s response was that the microbes didn ’ t know that. Although this chemistry was invented four decades before the term Green Chemistry was offi cially coined, it remains one of the outstanding applications of Green Chemistry within the pharmaceutical industry.

1.1 The Development of Organic Synthesis 3
This monumental discovery marked the beginning of the development, over the following decades, of drugs of ever - increasing molecular complexity. In order to meet this challenge, synthetic organic chemists aspired to increasing levels of sophistication. A case in point is the anticancer drug, Taxol ® [3] , derived from the bark of the Pacifi c yew tree, Taxus brevifolia, and introduced into medical practice in the 1990s (see Figure 1.2 ). The breakthrough was made possible by Holton ’ s invention [4] of a commercially viable and sustainable semi - synthesis from 10 - deacetylbaccatin III, a constituent of the needles of the English yew, Taxus baccata . The Bristol - Myers Squibb Company subsequently developed and commercialized a fermentation process that avoids the semi - synthetic process (see Chapter 7 ).
In short, the success of the modern pharmaceutical industry is fi rmly built on the remarkable achievements of organic synthesis over the last century. However, the down side is that many of these time - honored and trusted synthetic method-ologies were developed in an era when the toxic properties of many reagents and
O
O
H
H
H
progesterone
O
OOHHO
O
H
H
H
cortisone
O
O
H
H
H
11- hydroxyprogesterone
Rhizopus nigr icans
O2
HO
9 steps
Figure 1.1 Cortisone synthesis.
OPh
NHPh
O
O
O
OH
AcO
OCOPh
OH
OH
HO
OHO
OCOPh
OH
OH
HO OAc OAcHO
TaxolTM 10-deacetylbaccatin III
Figure 1.2 Structure of the anticancer drug Taxol ® and 10 - deacetylbaccatin III.

4 1 Introduction to Green Chemistry, Organic Synthesis and Pharmaceuticals
solvents were not known and the issues of waste minimization and sustainability were largely unheard of.
1.2 The Environmental Factor
In the last two decades it has become increasingly clear that the chemical and allied industries, such as pharmaceuticals, are faced with serious environmental problems. Many of the classical synthetic methodologies have broad scope but generate copious amounts of waste, and the chemical industry has been subjected to increasing pressure to minimize or, preferably, eliminate this waste. An illustra-tive example is provided by the manufacture of phloroglucinol, a reprographic chemical and pharmaceutical intermediate. Up until the mid - 1980s it was pro-duced mainly from 2,4,6 - trinitrotoluene ( TNT ) by the process shown in Figure 1.3 , a perfect example of vintage nineteenth - century organic chemistry.
For every kg of phloroglucinol produced ca. 40 kg of solid waste, containing Cr 2 (SO 4 ) 3 , NH 4 Cl, FeCl 2 , and KHSO 4 , were generated. This process was eventually discontinued as the costs associated with the disposal of this chromium - containing waste approached or exceeded the selling price of the product. That such an enor-mous amount of waste is formed is easily understood by examining the stoichio-metric equation (see Figure 1.3 ) of the overall process, something very rarely done by organic chemists. This predicts the formation of ca. 20 kg of waste per kg of phloroglucinol, assuming 100% chemical yield and exactly stoichiometric quanti-ties of the various reagents. In practice, an excess of the oxidant and reductant and a large excess of sulfuric acid, which subsequently has to be neutralized with base,
OH
HO OHO2N H2N
NH2
NH21. K2Cr2O7 / H2SO4 / SO3
phloroglucinol
2. Fe / HCl / - CO 2
aq. HClNO2
NO2
80oC
OH
HO OH
M W = 126 392 2 X 136 9 X 127 3 X 53.5 44 9 X 18
Product Byproducts
+ Cr2 (SO4)3 + 2 KHSO4 + 9 FeCl2 + 3 NH4Cl + CO2 + 9 H2O
Atom efficiency + 126 / 2282 = ca. 5%
E factor = ca. 40
Figure 1.3 Manufacture of phloroglucinol from TNT.
1.2 The Environmental Factor 5
is used, and the isolated yield of phloroglucinol is less than 100%. This explains the observed 40 kg of waste per kg of desired product.
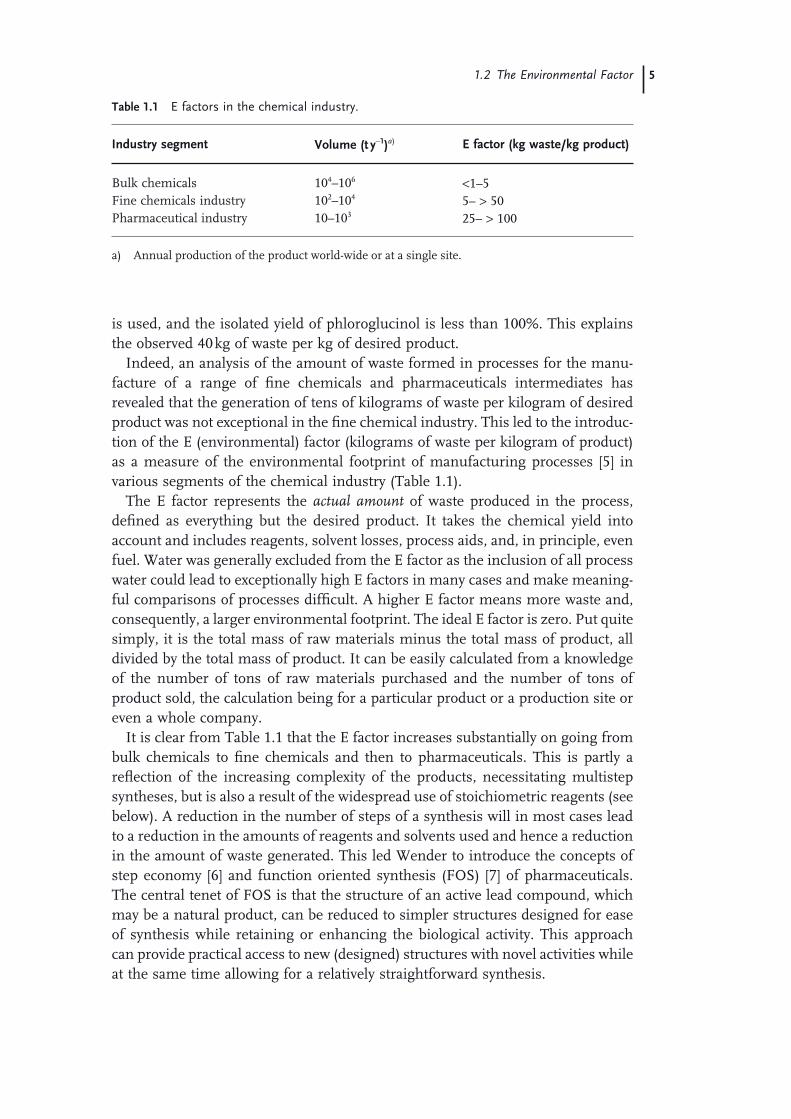
Indeed, an analysis of the amount of waste formed in processes for the manu-facture of a range of fi ne chemicals and pharmaceuticals intermediates has revealed that the generation of tens of kilograms of waste per kilogram of desired product was not exceptional in the fi ne chemical industry. This led to the introduc-tion of the E (environmental) factor (kilograms of waste per kilogram of product) as a measure of the environmental footprint of manufacturing processes [5] in various segments of the chemical industry (Table 1.1 ).
The E factor represents the actual amount of waste produced in the process, defi ned as everything but the desired product. It takes the chemical yield into account and includes reagents, solvent losses, process aids, and, in principle, even fuel. Water was generally excluded from the E factor as the inclusion of all process water could lead to exceptionally high E factors in many cases and make meaning-ful comparisons of processes diffi cult. A higher E factor means more waste and, consequently, a larger environmental footprint. The ideal E factor is zero. Put quite simply, it is the total mass of raw materials minus the total mass of product, all divided by the total mass of product. It can be easily calculated from a knowledge of the number of tons of raw materials purchased and the number of tons of product sold, the calculation being for a particular product or a production site or even a whole company.
It is clear from Table 1.1 that the E factor increases substantially on going from bulk chemicals to fi ne chemicals and then to pharmaceuticals. This is partly a refl ection of the increasing complexity of the products, necessitating multistep syntheses, but is also a result of the widespread use of stoichiometric reagents (see below). A reduction in the number of steps of a synthesis will in most cases lead to a reduction in the amounts of reagents and solvents used and hence a reduction in the amount of waste generated. This led Wender to introduce the concepts of step economy [6] and function oriented synthesis ( FOS ) [7] of pharmaceuticals. The central tenet of FOS is that the structure of an active lead compound, which may be a natural product, can be reduced to simpler structures designed for ease of synthesis while retaining or enhancing the biological activity. This approach can provide practical access to new (designed) structures with novel activities while at the same time allowing for a relatively straightforward synthesis.
Table 1.1 E factors in the chemical industry.
Industry segment Volume (t y − 1 ) a) E factor (kg waste/kg product)
Bulk chemicals 10 4 – 10 6 < 1 – 5 Fine chemicals industry 10 2 – 10 4 5 – > 50 Pharmaceutical industry 10 – 10 3 25 – > 100
a) Annual production of the product world - wide or at a single site.
6 1 Introduction to Green Chemistry, Organic Synthesis and Pharmaceuticals
As noted above, a knowledge of the stoichiometric equation allows one to predict the theoretical minimum amount of waste that can be expected. This led to the concept of atom economy [8] or atom utilization [9] to quickly assess the environ-mental acceptability of alternatives to a particular product before any experiment is performed. It is a theoretical number, that is, it assumes a chemical yield of 100% and exactly stoichiometric amounts and disregards substances which do not appear in the stoichiometric equation.
In short, the key to minimizing waste is precision or selectivity in organic syn-thesis which is a measure of how effi ciently a synthesis is performed. The standard defi nition of selectivity is the yield of product divided by the amount of substrate converted, expressed as a percentage. Organic chemists distinguish between dif-ferent categories of selectivity:
• Chemoselectivity (competition between different functional groups) • Regioselectivity (selective formation of one regioisomer, for example ortho
vs para substitution in aromatic rings) • Diastereoselectivity (the selective formation of one diastereomer) • Enantioselectivity (the selective formation of one of a pair of enantiomers)
However, one category of selectivity was, traditionally, largely ignored by organic chemists: the atom selectivity or atom utilization or atom economy . The virtually complete disregard of this important parameter is the root cause of the waste problem in chemicals manufacture. As Lord Kelvin remarked, ‘ To measure is to know ’ . Quantifi cation of the waste generated in chemicals manufacturing, by way of E factors, served to bring the message home and focus the attention of fi ne chemical and pharmaceutical companies on the need for a paradigm shift from a concept of process effi ciency, which was exclusively based on chemical yield, to one that is motivated by elimination of waste and maximization of raw materials utilization. Indeed, the E factor has been widely adopted by the chemical industry and the pharmaceutical industry in particular [10] . To quote from a recent article [11] : ‘ Another aspect of process development mentioned by all pharmaceutical process chemists who spoke with Chemical and Engineering News is the need for determining an E factor. ’
The Green Chemistry Institute ( GCI ) Pharmaceutical Roundtable has used the Process Mass Intensity ( PMI ) [12] , defi ned as the total mass used in a process divided by the mass of product (i.e. PMI = E factor + 1) to benchmark the envi-ronmental acceptability of processes used by its members (see the GCI website). The latter include several leading pharmaceutical companies (Eli Lilly, GlaxoSmithKline, Pfi zer, Merck, AstraZeneca, Schering - Plow, and Johnson & Johnson). The aim was to use this data to drive the greening of the pharmaceutical industry. We believe, however, that the E factor is to be preferred over the PMI since the ideal E factor of 0 is a better refl ection of the goal of zero waste.
The E factor, and derived metrics, takes only the mass of waste generated into account. However, the environmental impact of waste is determined not only by its amount but also by its nature. Hence, we introduced [13] the term ‘ environ-mental quotient ’ , EQ, obtained by multiplying the E factor by an arbitrarily
1.3 The Role of Catalysis 7
assigned unfriendliness quotient, Q. For example, one could arbitrarily assign a Q value of 1 to NaCl and, say, 100 – 1000 to a heavy metal salt, such as chromium, depending on factors like its toxicity or ease of recycling. Although the magnitude of Q is debatable and diffi cult to quantify, ‘ quantitative assessment ’ of the envi-ronmental impact of waste is, in principle, possible. Q is dependent on, inter alia , the ease of disposal or recycling of waste and, generally speaking, organic waste is easier to dispose of or recycle than inorganic waste.
1.3 The Role of Catalysis
The main source of waste is inorganic salts such as sodium chloride, sodium sulfate, and ammonium sulfate that are formed in the reaction or in downstream processing. One of the reasons that the E factor increases dramatically on going from bulk to fi ne chemicals and pharmaceuticals is that the latter are more com-plicated molecules that involve multi - step syntheses. However, the larger E factors in the fi ne chemical and pharmaceutical industries are also a consequence of the widespread use of classical stoichiometric reagents rather than catalysts. Examples which readily come to mind are metal (Na, Mg, Zn, Fe) and metal hydride (LiAlH 4 , NaBH 4 ) reducing agents and oxidants such as permanganate, manganese dioxide, and chromium(VI) reagents. For example, the phloroglucinol process (see above) combines an oxidation by stoichiometric chromium (VI) with a reduction with Fe/HCl. Similarly, a plethora of organic reactions, such as sulfonations, nitrations, halogenations, diazotizations, and Friedel - Crafts acylations, employ stoichiometric amounts of mineral acids (H 2 SO 4 , HF, H 3 PO 4 ) or Lewis acids (AlCl 3 , ZnCl 2 , BF 3 ) and are major sources of inorganic waste.
Once the major cause of the waste has been recognized, the solution to the waste problem is evident: the general replacement of classical syntheses that use stoi-chiometric amounts of inorganic (or organic) reagents by cleaner, catalytic alterna-tives. If the solution is so simple, why are catalytic processes not as widely used in fi ne and specialty chemicals manufacture as they are in bulk chemicals? One reason is that the volumes involved are much smaller, and thus the need to mini-mize waste is less acute than in bulk chemicals manufacture. Secondly, the eco-nomics of bulk chemicals manufacture dictate the use of the least expensive reagent, which was generally the most atom economical, for example O 2 for oxida-tion H 2 for reduction, and CO for C – C bond formation.
A third reason is the pressure of time. In pharmaceutical manufacture ‘ time to market ’ is crucial, and an advantage of many time - honored classical technologies is that they are well tried and broadly applicable and, hence, can be implemented rather quickly. In contrast, the development of a cleaner, catalytic alternative could be more time consuming. Consequently, environmentally (and economically) infe-rior technologies are often used to meet stringent market deadlines, and subse-quent process changes can be prohibitive owing to problems associated with FDA approval.

8 1 Introduction to Green Chemistry, Organic Synthesis and Pharmaceuticals
Another reason, however, is the more or less separate paths of development of organic synthesis and catalysis (see Figure 1.4 ) since the time of Berzelius, who coined the terms ‘ organic chemistry ’ and ‘ catalysis ’ , in 1807 and 1835, respectively [14] . Subsequently, catalysis developed largely as a sub - discipline of physical chem-istry. With the advent of petrochemicals in the 1930s, catalysis was widely applied in oil refi ning and bulk chemicals manufacture. However, the scientists respon-sible for these developments were, generally speaking, not organic chemists but were chemical engineers and surface scientists.
Industrial organic synthesis, in contrast, followed a largely ‘ stoichiometric ’ line of evolution that can be traced back to Perkin ’ s synthesis of mauveine, the subse-quent development of the dyestuffs industry based on coal tar, and the fi ne chemi-cals and pharmaceuticals industries, which can be regarded as spin - offs from the dyestuffs industry. Consequently, fi ne chemicals and pharmaceuticals manufac-ture, which is largely the domain of synthetic organic chemists, is rampant with classical ‘ stoichiometric ’ processes. Until fairly recently, catalytic methodologies were only sporadically applied, with the exception of catalytic hydrogenation which, incidentally, was invented by an organic chemist, Sabatier, in 1905.
The desperate need for more catalytic methodologies in industrial organic syn-thesis is nowhere more apparent than in oxidation chemistry. For example, as any
J. J. Berzelius 1779-1848
Organic Chemistry (1807) Catalysis (1835)
Urea synthesis 1828( Wöhler )
First synthetic dye 1856Aniline purple
(Perkin)
Dyestuffs Industry(based on coal-tar)
Fine Chemicals
Catalysis in Organic Synthesis
ca. 1900 Catalysis definition (Ostwald)
Catalytic Hydrogenation(Sabatier)
ca. 1920 Petrochemicals
1936 Catalytic cracking1949 Catalytic reforming1955 Ziegler-Natta catalysis
Bulk Chemicals & Polymers
Figure 1.4 The development of organic synthesis and catalysis.

1.3 The Role of Catalysis 9
organic chemistry textbook will tell you, the reagent of choice for the oxidation of secondary alcohols to the corresponding ketones, a pivotal reaction in organic synthesis, is the Jones reagent. The latter consists of chromium trioxide and sul-furic acid and is reminiscent of the phloroglucinol process referred to earlier. The introduction of the storage - stable pyridinium chlorochromate ( PCC ) and pyridin-ium dichromate ( PDC ) in the 1970s, represented a practical improvement, but the stoichiometric amounts of carcinogenic chromium(VI) remain a serious problem. Other stoichiometric oxidants that are popular with synthetic organic chemists are the Swern reagent [15] and Dess - Martin Periodinane [16] ( DMP ). The former produces the evil smelling dimethyl sulfi de as the by - product, the latter is shock sensitive, and oxidations with both reagents are abominably atom ineffi cient (see Figure 1.5 ).
Obviously there is a defi nite need in the fi ne chemical and pharmaceutical industry for catalytic systems that are green and scalable and have broad utility [10] . More recently, oxidations with the inexpensive household bleach (NaOCl) catalyzed by stable nitroxyl radicals, such as TEMPO [17] and PIPO [18] , have emerged as more environmentally friendly methods. It is worth noting at this juncture that ‘ greenness ’ is a relative description and there are many shades of green. Although the use of NaOCl as the terminal oxidant affords NaCl as the by - product and may lead to the formation of chlorinated impurities, it constitutes a dramatic improvement compared to the use of chromium(VI) and other
OH O
Oxidant Atom Efficiency
CrO3 /H2SO4 44%
OI
O
OAcAcOOAc
22%
(CH3)2 SO / (COCl)2
- 2 (H)
37%
NaOCl 48%
O2 87%
Figure 1.5 Atom effi ciencies of alcohol oxidations.

10 1 Introduction to Green Chemistry, Organic Synthesis and Pharmaceuticals
reagents referred to above. Moreover, we note that, in the case of pharmaceutical intermediates, the volumes of NaCl produced as a by - product on an industrial scale are not likely to present a problem. Nonetheless, catalytic methodologies employ-ing the green oxidants, molecular oxygen (air) and hydrogen peroxide, as the terminal oxidant would represent a further improvement in this respect. However, as Dunn and coworkers have pointed out [10] , the use of molecular oxygen presents signifi cant safety issues associated with the fl ammability of mixtures of oxygen with volatile organic solvents in the gas phase. Even when these concerns are reduced by using 10% oxygen diluted with nitrogen, these methods are on the edge of acceptability [10] . An improved safety profi le and more acceptable scalability are obtained by performing the oxidation in water as an inert solvent. For fi ne chemicals or large volume pharmaceuticals the environmental and cost benefi ts of using simple air or oxygen as the oxidant would justify the capital investment in the more specialized equipment required to use these oxidants on a large scale.
1.4 Green Chemistry: Benign by Design
In the mid - 1990s Anastas and coworkers [19] at the United States Environmental Protection Agency ( EPA ) were developing the concept of benign by design , that is designing environmentally benign products and processes to address the environ-mental issues of both chemical products and the processes by which they are produced. This incorporated the concepts of atom economy and E factors and eventually became a guiding principle of Green Chemistry as embodied in the 12 Principles of Green Chemistry [20] , the essence of which can be reduced to the useful working defi nition:
Green chemistry effi ciently utilizes (preferably renewable) raw materials, eliminates waste, and avoids the use of toxic and/or hazardous reagents and solvents in the manu-facture and application of chemical products.
Raw materials include, in principle, the source of energy, as this also leads to waste generation in the form of carbon dioxide. Green Chemistry is primary pol-lution prevention rather than waste remediation (end - of - pipe solutions). More recently, the twelve Principles of Green Engineering were proposed [21] , which contain the same underlying features – conservation of energy and other raw mate-rials and elimination of waste and hazardous materials – but from an engineering standpoint. Poliakoff and coworkers [22] proposed a mnemonic, PRODUCTIVELY, which captures the spirit of the twelve Principles of Green Chemistry in a single slide.
Another concept which has become the focus of attention, both in industry and society at large, in the last decade or more is that of sustainable development, fi rst introduced in the Brundtland report [23] in the late 1980s and defi ned as:
Meeting the needs of the present generation without compromising the ability of future generations to meet their own needs.

1.6 The Question of Solvents: Alternative Reaction Media 11
Sustainable development and Green Chemistry have now become a strategic industrial and societal focus [24 – 27] , the former is our ultimate goal and the latter is a means to achieve it.
1.5 Ibuprofen Manufacture
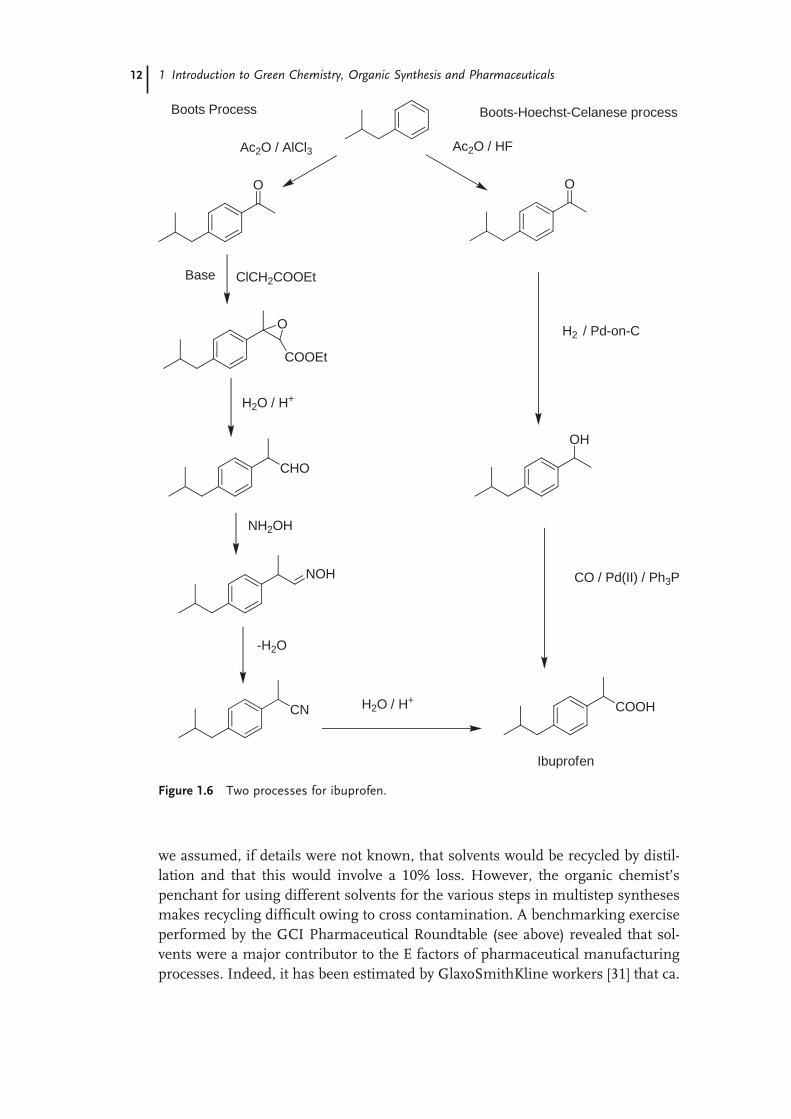
An elegant example of a process with high atom effi ciency is provided by the manufacture of the over - the - counter, non - steroidal anti - infl ammatory drug, ibu-profen. Two routes for the production of ibuprofen via the common intermediate, p - isobutylacetophenone, are compared in Figure 1.6 . The classical route, developed by the Boots Pure Drug Company (the discoverers of ibuprofen), entails 6 steps with stoichiometric reagents, relatively low atom effi ciency, and substantial inor-ganic salt formation. In contrast, the elegant alternative, developed by the Boots - Hoechst - Celanese ( BHC ) company, involves only three catalytic steps [28] . The fi rst step involves the use of anhydrous hydrogen fl uoride as both catalyst and solvent in a Friedel - Crafts acylation. The hydrogen fl uoride is recyclable and waste is essentially eliminated. This is followed by two catalytic steps (hydrogenation and carbonylation), both of which are 100% atom effi cient.
The BHC ibuprofen process was commercialized in 1992 in a ca. 4000 tons per annum facility in Texas. The process was awarded the Kirkpatrick Achievement Award for outstanding advances in chemical engineering technology in 1993 and a Presidential Green Chemistry Challenge Award in 1996. It represents a bench-mark in environmental excellence in chemical processing technology that revolu-tionized bulk pharmaceutical manufacturing. It provides an innovative and excellent solution to the prevalent problem of the large volumes of waste associated with the traditional stoichiometric use of auxiliary chemicals. The anhydrous hydrogen fl uoride is recovered and recycled with greater than 99.9% effi ciency. No other solvent is used in the process, simplifying product recovery and minimizing fugitive emissions. This combined with the almost complete atom utilization of this streamlined process truly makes it a waste - minimizing, environmentally friendly technology and a source of inspiration for other pharmaceutical manufacturers.
1.6 The Question of Solvents: Alternative Reaction Media
Another important issue in green chemistry is the use of organic solvents. The use of many traditional organic solvents, such as chlorinated hydrocarbons, has been severely curtailed. Indeed, so many of the solvents that are favored by organic chemists have been blacklisted that the whole question of solvent use requires rethinking and has become a primary focus, especially in the manufacture of pharmaceuticals [29, 30] . In our original studies of E factors of various processes,
12 1 Introduction to Green Chemistry, Organic Synthesis and Pharmaceuticals
Figure 1.6 Two processes for ibuprofen.
O O
O
COOEt
CHO
NOH
CN
OH
COOH
H2 / Pd-on-C
CO / Pd(II) / Ph3P
Ac2O / AlCl3 Ac2O / HF
Boots Process Boots-Hoechst-Celanese process
ClCH2COOEt
H2O / H+
Base
NH2OH
-H2O
H2O / H+
Ibuprofen
we assumed, if details were not known, that solvents would be recycled by distil-lation and that this would involve a 10% loss. However, the organic chemist ’ s penchant for using different solvents for the various steps in multistep syntheses makes recycling diffi cult owing to cross contamination. A benchmarking exercise performed by the GCI Pharmaceutical Roundtable (see above) revealed that sol-vents were a major contributor to the E factors of pharmaceutical manufacturing processes. Indeed, it has been estimated by GlaxoSmithKline workers [31] that ca.

1.6 The Question of Solvents: Alternative Reaction Media 13
85% of the total mass of chemicals involved in pharmaceutical manufacture com-prises solvents. Consequently, pharmaceutical companies are focusing their effort on minimizing solvent use and in replacement of many traditional organic sol-vents, such as chlorinated and aromatic hydrocarbons, by more environmentally friendly alternatives.
An illustrative example is the redesign of the sertraline manufacturing process [32] , for which Pfi zer received a Presidential Green Chemistry Challenge Award in 2002. Among other waste - minimizing improvements, a three - step sequence was streamlined by employing ethanol as the sole solvent (see Figure 1.7 ). This eliminated the need to use, distill, and recover four solvents (methylene chloride, tetrahydrofuran, toluene, and hexane) and resulted in a reduction in solvent usage from 250 to 25 liters per kilogram of sertraline.
Similarly, Pfi zer workers also reported [33] impressive improvements in solvent usage in the process for sildenafi l (Viagra ® ) manufacture, reducing the solvent usage from 1700 liters per kilogram of product used in the medicinal chemistry route to 7 L kg − 1 in the current commercial process with a target for the future of 4 L kg − 1 . The E factor for the current process is 8, placing it more in the lower end of fi ne chemicals rather than with typical pharmaceutical manufacturing processes.
These issues surrounding a wide range of volatile and nonvolatile, polar aprotic solvents have stimulated the fi ne chemicals and pharmaceutical industries to seek
Figure 1.7 The new sertraline process.
O
Cl
Cl
CH3NH2
EtOH
NCH3
Cl
Cl
H2Pd-on-CaCO3
EtOH
NHCH3
Cl
Cl
NHCH3
Cl
Cl
D-mandelic acid
EtOH
HCl
EtOAc
NH2CH3
Cl
Cl
+
Cl-
Sertraline HCl salt
14 1 Introduction to Green Chemistry, Organic Synthesis and Pharmaceuticals
more benign alternatives. There is a marked trend away from hydrocarbons and chlorinated hydrocarbons toward lower alcohols, esters, and, in some cases, ethers. Inexpensive natural products such as ethanol have the added advantage of being readily biodegradable, and ethyl lactate, produced by combining two innocuous natural products, is currently being promoted as an environmentally attractive solvent for chemical reactions. The problem with solvents is not so much in their use but in the seemingly inherent ineffi ciencies associated with their containment, recovery, and reuse. The best solvent is no solvent at all, but if a solvent is needed there should be provisions for its effi cient removal from the product and reuse.
The subject of alternative reaction media also touches on another issue that is important from both an environmental and an economic viewpoint: recovery and reuse of the catalyst. An insoluble solid, that is heterogeneous, catalyst is easily separated by centrifugation or fi ltration. A homogeneous catalyst, in contrast, presents more of a problem, the serious shortcoming of homogeneous catalysis being the cumbersome separation of the catalyst from the reaction products and its quantitative recovery in an active form. In pharmaceutical manufacture, another important issue is contamination of the product. Attempts to heterogenize homo-geneous catalysts by attachment to organic or inorganic supports have, generally speaking, not resulted in commercially viable processes for a number of reasons, such as leaching of the metal, poor catalyst productivity, irreproducible activity and selectivity, and degradation of the support.
There is a defi nite need, therefore, for systems that combine the advantages of high activity and selectivity of homogeneous catalysts with the facile recovery and recycling characteristic of their heterogeneous counterparts. This can be achieved by employing a different type of heterogeneous system, namely liquid - liquid biphasic catalysis, whereby the catalyst is dissolved in one liquid phase and the reactants and product(s) are in a second liquid phase. The catalyst is recovered and recycled by simple phase separation. Preferably, the catalyst solution remains in the reactor and is reused with a fresh batch of reactants without further treatment or, ideally, it is adapted to continuous operation.
Various nonconventional reaction media have been intensively studied in recent years, including water [34] , supercritical CO 2 [35] , fl uorous biphasic [36] , and ionic liquids [37] alone or in liquid - liquid biphasic combinations. The use of water and supercritical carbon dioxide as reaction media fi ts with the current trend toward the use of renewable, biomass - based raw materials, which are ultimately derived from carbon dioxide and water.
Water has many benefi ts: it is nontoxic, nonfl ammable, abundantly available, and inexpensive. Furthermore, performing the reaction in an aqueous biphasic system [38] , whereby the catalyst resides in the water phase and the product is dissolved in the organic phase, allows for recovery and recycling of the catalyst by simple phase separation. A case in point is the BHC process for ibuprofen manu-facture (see above). The key carbonylation step involves a homogeneous palladium catalyst, and contamination of the product (the active pharmaceutical ingredient) with unacceptably high amounts of palladium necessitates an expensive purifi ca-tion. Replacing the organic soluble palladium(0) triphenylphosphine complex with

1.7 Biocatalysis: Green Chemistry Meets White Biotechnology 15
an analogous complex of the water - soluble trisulfonated triphenylphosphine , TPPTS , affords a catalytic system for the aqueous biphasic carbonylation of alco-hols [39] . For example, when the above - mentioned ibuprofen synthesis was per-formed with TPPTS in an aqueous biphasic system, product contamination by the catalyst was essentially eliminated.
Similarly, a water - soluble palladium complex of a sulfonated phenanthroline ligand catalyzed the highly selective aerobic oxidation of primary and secondary alcohols in an aqueous biphasic system in the absence of any organic solvent (Figure 1.8 ) [40] . The liquid product could be recovered by simple phase separa-tion, and the aqueous phase, containing the catalyst, used with a fresh batch of alcohol substrate, affording a truly green method for the oxidation of alcohols.
1.7 Biocatalysis: Green Chemistry Meets White Biotechnology
Biocatalysis has many attractive features in the context of green chemistry: reac-tions are generally performed in water under mild conditions of temperature and pressure using an environmentally compatible, biodegradable catalyst (an enzyme) derived from renewable raw materials. High activities and chemo - , regio - , and stereoselectivities are obtained in reactions of multifunctional molecules without the need for the functional group activation and protection often required in tra-ditional organic syntheses. This affords more environmentally attractive and cost - effective processes with fewer steps and, hence, less waste. Illustrative exam-ples are provided by the substitution of classical chemical processes with enzymatic counterparts in the synthesis of semi - synthetic penicillins and cephalosporins [41] .
R1
R2
HOH
+ 0.5 O2
R1
R2O
Pd(OAc)2 / L
NaOAc / H2O80oC / 30 bar air
+ H2O
N
N
NaO3S
NaO3S
L =
Figure 1.8 Aqueous biphasic aerobic oxidation of alcohols.
16 1 Introduction to Green Chemistry, Organic Synthesis and Pharmaceuticals
If biocatalysis is so attractive, why was it not widely used in the past? The answer is that only recent advances in biotechnology have made it possible. First, the availability of numerous whole - genome sequences has dramatically increased the number of potentially available enzymes. Second, in vitro evolution has enabled the manipulation of enzymes such that they exhibit the desired properties: sub-strate specifi city, activity, stability, and pH profi le [42] . Third, recombinant DNA techniques have made it, in principle, possible to produce virtually any enzyme for a commercially acceptable price. Fourth, the cost - effective techniques that have now been developed for the immobilization of enzymes afford improved opera-tional stability and enable their facile recovery and recycling [43] .
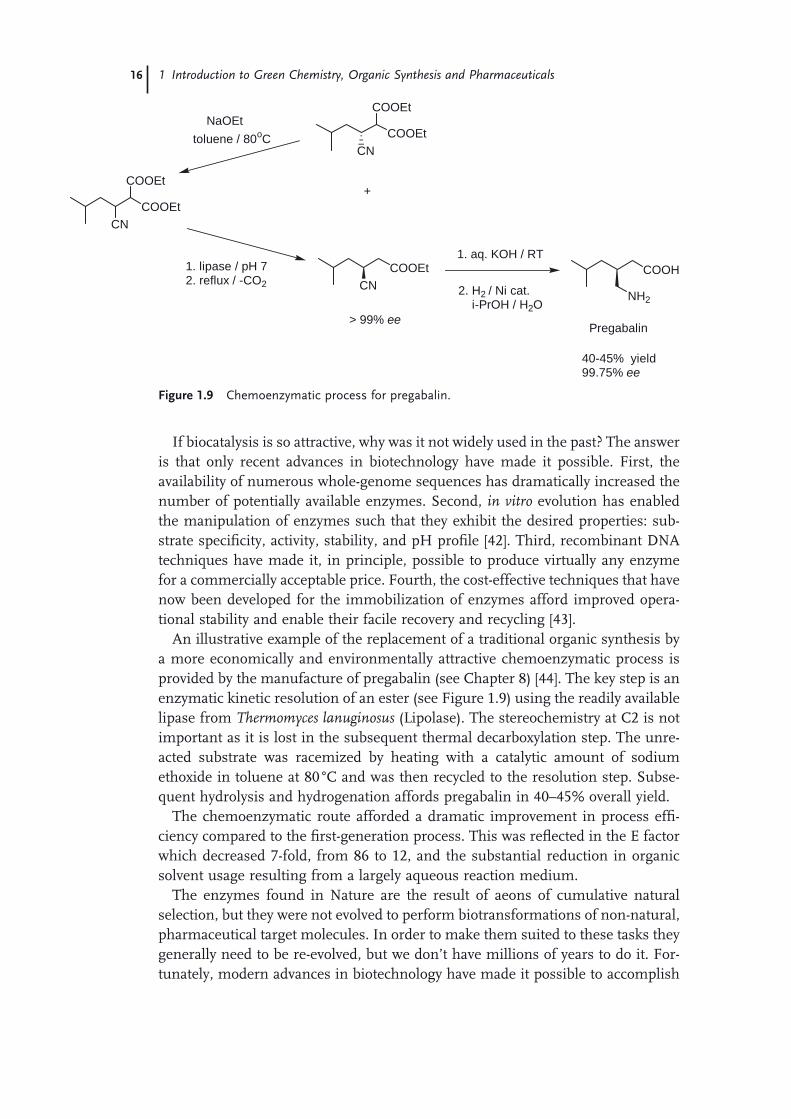
An illustrative example of the replacement of a traditional organic synthesis by a more economically and environmentally attractive chemoenzymatic process is provided by the manufacture of pregabalin (see Chapter 8 ) [44] . The key step is an enzymatic kinetic resolution of an ester (see Figure 1.9 ) using the readily available lipase from Thermomyces lanuginosus (Lipolase). The stereochemistry at C2 is not important as it is lost in the subsequent thermal decarboxylation step. The unre-acted substrate was racemized by heating with a catalytic amount of sodium ethoxide in toluene at 80 ° C and was then recycled to the resolution step. Subse-quent hydrolysis and hydrogenation affords pregabalin in 40 – 45% overall yield.
The chemoenzymatic route afforded a dramatic improvement in process effi -ciency compared to the fi rst - generation process. This was refl ected in the E factor which decreased 7 - fold, from 86 to 12, and the substantial reduction in organic solvent usage resulting from a largely aqueous reaction medium.
The enzymes found in Nature are the result of aeons of cumulative natural selection, but they were not evolved to perform biotransformations of non - natural, pharmaceutical target molecules. In order to make them suited to these tasks they generally need to be re - evolved, but we don ’ t have millions of years to do it. For-tunately, modern advances in biotechnology have made it possible to accomplish
COOEtCN
COOEt
1. lipase / pH 72. reflux / -CO2
COOEtCN
COOEt
COOEt
+
CN
NaOEt toluene / 80oC
1. aq. KOH / RTCOOH
2. H2 / Ni cat. i-PrOH / H2O
NH2
Pregabalin> 99% ee
40-45% yield99.75% ee
Figure 1.9 Chemoenzymatic process for pregabalin.

1.7 Biocatalysis: Green Chemistry Meets White Biotechnology 17
Figure 1.10 Codexis process for atorvastatin intermediate.
OEtCl
O O
OEtCl
OH O
NADPH + H+ NADP+
OEtCl
OH O
glucose gluconate
KRED
GDH
HHDH
aq. NaCN / pH 7
OEtNC
OH O
KRED = ketoreductaseGDH = glucose dehydrogenaseHHDH = halohydrin dehalogenase
95% yield> 99.5% ee
> 99.5% ee
this in weeks in the laboratory using in vitro techniques such as gene shuffl ing [45] .
An illustrative example is provided by the Codexis process for the production of an intermediate for Pfi zer ’ s blockbuster drug Atorvastatin (Lipitor ® ). The two - step process (Figure 1.10 ), for which Codexis received a 2006 Presidential Green Chem-istry Challenge Award, involves three enzymes (one for cofactor regeneration). The low activities of the wild - type enzymes formed a serious obstacle to commercializa-tion, but in vitro evolution of the individual enzymes, using gene shuffl ing, afforded economically viable productivities [46] .
The highly selective biocatalytic reactions afford a substantial reduction in waste. The overall isolated yield is greater than 90%, and the product is more than 98% chemically pure with an enantiomeric excess of > 99.9%. All three evolved enzymes are highly active and are used at such low loadings that counter - current extraction can be used to minimize solvent volumes. Moreover, the butyl acetate solvent is recycled with an effi ciency of 85%.The E factor (kgs waste per kg product) for the overall process is 5.8 if process water is excluded (2.3 for the reduction and 3.5 for the cyanation) [47] . If process water is included, the E factor for the whole process is 18 (6.6 for the reduction and 11.4 for the cyanation). The main contributors to the E factor are solvent losses which accounted for 51% of the waste, sodium gluconate (25%), NaCl and Na 2 SO 4 (combined circa. 22%). The three enzymes and the NADP cofactor account for < 1% of the waste. The main waste streams are aqueous and directly biodegradable.
18 1 Introduction to Green Chemistry, Organic Synthesis and Pharmaceuticals
References
1 Peterson , D.H. , and Murray , H.C. ( 1952 ) J. Am. Chem. Soc. , 71 , 1871 – 1872 .
2 Peterson , D.H. ( 1985 ) Steroids , 45 , 1 – 17 . 3 For a review see Kingston D.G.I. ( 2001 )
Chem. Commun. , 867 – 880 . 4 See in Holton , R.A. , Biediger , R.J. , and
Boatman , P.D. ( 1995 ) Taxol ® : Science and Applications (ed. M. Suffness ), CRC Press , Boca Raton, FL , p. 97 .
5 Sheldon , R.A. ( 1992 ) Chem. Ind. (London) , 903 ; see also Sheldon , R.A. ( 1997 ) Chem. Ind. (London) , 12 ; Sheldon , R.A. ( 1997 ) J. Chem. Tech. Biotechnol. , 68 , 381 ; Sheldon , R.A. ( 2000 ) Pure Appl. Chem. , 72 , 1233 .
6 Wender , P.A. , Croatt , M.P. , and Witulski , B. ( 2007 ) Tetrahedron , 62 , 7505 – 7511 ; Wender , P.A. , Handy , S.T. , and Wright , D.L. ( 1997 ) Chem. Ind. (London) , 765 – 769 ; see also Clarke , P.A. , Santos , S. , and Martin , W.H.C. ( 2007 ) Green Chem. , 9 , 438 – 440 .
7 Wender , P.A. , Verma , V.A. , Paxton , T.J. , and Pillow , T.H. ( 2008 ) Acc. Chem. Res. , 41 , 40 – 49 .
8 Trost , B.M. ( 1991 ) Science , 254 , 1471 – 1477 ; Trost , B.M. ( 1995 ) Angew. Chem. Int. Ed. Engl. , 34 , 259 – 281 .
9 See in Sheldon , R.A. ( 2008 ) Chem. Commun. , 3352 – 3365 .
10 Alfonsi , K. , Colberg , J. , Dunn , P.J. , Fevig , T. , Jennings , S. , Johnson , T.A. , Kleine , H.P. , Knight , C. , Nagy , M.A. , Perry , D.A. , and Stefaniak , M. ( 2008 ) Green Chem. , 10 , 31 – 36 ; see also Dugger , R.W. , Ragan , J.A. , and Brown Ripin , D.H. ( 2005 ) Org. Process Res. Dev. , 9 , 253 – 258 .
11 Thayer , A.N. ( 2007 ) Chem. Eng. News , August 6 , 11 – 19 .
12 Constable , D.J.C. , Curzons , A.D. , and Cunningham , V.L. ( 2002 ) Green Chem. , 4 , 521 – 527 ; see also Curzons , A.D. , Constable , D.J.C. , Mortimer , D.N. , and
1.8 Conclusions and Prospects
Over the last fi fteen years the manufacture of pharmaceuticals has undergone revolutionary changes. Target molecules have become increasingly complex, and legislative pressure, starting in the late 1980s, has stimulated the marketing of chiral molecules as pure enantiomers [47] . This, in turn, stimulated the develop-ment of cost - effective methods for the manufacture of enantiomerically pure compounds. On top of this, there has been a paradigm shift from the traditional concept of process effi ciency to one that assigns economic value to conserving energy and raw materials, eliminating waste, and avoiding the use of toxic and/or hazardous chemicals. Indeed, the concepts of E factors, atom economy, and step economy have gradually become incorporated into mainstream organic synthesis in both industry and academia [48 – 50] .
The pharmaceutical industry has risen to the occasion and is making substantial progress in replacing traditional processes with greener, more sustainable alterna-tives, though there is much still to do. It has adopted the E factor, or its direct equivalent, as its measuring staff, and recent publications have identifi ed key areas where improvement is most needed [51 – 53] . In short, we conclude that the chal-lenge of sustainability and Green Chemistry is leading to fundamental, game - changing innovations in organic synthesis that will ultimately lead to economic, environmental, and societal benefi ts in the pharmaceutical industry and in the chemical and allied industries at large.

References 19
Cunningham , V.L. ( 2002 ) Green Chem. , 3 , 1 – 6 ; Constable , D.J.C. , Curzons , A.D. , Freitas dos Santos , L.M. , Green , G.R. , Hannah , R.E. , Hayler , J.D. , Kittering-ham , J. , McGuire , M.A. , Richardson , J.E. , Smith , P. , Webb , R.L. , and Yu , M. ( 2001 ) Green Chem. , 3 , 7 – 9 .
13 Sheldon , R.A. ( 1994 ) Chemtech , 24 , 38 – 47 .
14 Sheldon , R.A. ( 1991 ) Chemtech , 566 – 576 . 15 Mancuso , A.J. , Huang , S. - L. , and Swern ,
D. ( 1978 ) J. Org. Chem. , 12 , 2480 – 2482 ; Mancuso , A.J. , and Swern , D. ( 1981 ) Synthesis , 165 – 185 .
16 Dess , D.B. , and Martin , J.C. ( 1983 ) J. Org. Chem. , 48 , 4155 – 4156 .
17 de Nooy , A.E.J. , Besemer , A.C. , and van Bekkum , H. ( 1996 ) Synthesis , 1153 – 1174 .
18 Dijksman , A. , Arends , I.W.C.E. , and Sheldon , R.A. ( 2000 ) Chem. Commun. 271 – 272 ; Dijksman , A. , Arends , I.W.C.E. , and Sheldon , R.A. ( 2001 ) Synlett , 102 – 104 .
19 Anastas , P.T. , and Farris , C.A. (eds) ( 1994 ) Benign by Design: Alternative Synthetic Design for Pollution Prevention , Ser. nr. 577 , ACS Symp, American Chemical Society , Washington DC .
20 Anastas , P.T. , and Warner , J.C. (eds) ( 1998 ) Green Chemistry: Theory and Practice , Oxford University Press , Oxford .
21 Anastas , P.T. , and Zimmerman , J.B. ( 2006 ) Sustainability Science and Engineering Defi ning Principles ( M.A. Abrahams ed.), Elsevier , pp. 11 – 32 .
22 Tang , S.L.Y. , Smith , R.L. , and Poliakoff , M. ( 2005 ) Green Chem. , 7 , 761 – 762 .
23 Brundtland , C.G. ( 1987 ) Our Common Future , The World Commission on Environmental Development , Oxford University Press , Oxford .
24 Clark , J.H. , and Macquarrie , D.J. ( 2002 ) Handbook of Green Chemistry and Technology , Blackwell , Abingdon .
25 Matlack , A.S. ( 2001 ) Introduction to Green Chemistry , Marcel Dekker , New York .
26 Lancaster , M. ( 2002 ) Green Chemistry: An Introductory Text , Royal Society of Chemistry , Cambridge .
27 Sheldon , R.A. , Arends , I.W.C.E. , and Hanefeld , U. ( 2007 ) Green Chemistry and
Catalysis , Wiley - VCH Verlag GmbH , Weinheim .
28 Elango , V. , Murhpy , M.A. , Smith , B.L. , Davenport , K.G. , Mott , G.N. , and Moss , G.L. ( 1991 ) US Pat. 4981995 , to Hoechst - Celanese Corp.
29 Sheldon , R.A. ( 2005 ) Green Chem. , 7 , 267 – 278 .
30 Leitner , W. , Seddon , K.R. , and Wasserscheid , P. (eds) ( 2003 ) Special issue on green solvents for catalysis . Green Chem. , 5 , 99 – 284 .
31 Jiminez - Gonzales , C. , Curzons , A.D. , Constable , D.J.C. , and Cunningham , V.L. ( 2004 ) Int. J. Life Cycle Assess. , 9 , 115 – 121 .
32 Taber , G.P. , Pfi sterer , D.M. , and Colberg , J.C. ( 2004 ) Org. Proc. Res. Dev. , 8 , 385 – 388 .
33 Dunn , P.J. , Galvin , S. , and Hettenbach , K. ( 2004 ) Green Chem. , 6 , 43 – 48 .
34 Lindstr ö m , U.M. ( 2007 ) Organic Reactions in Water , Blackwell , Oxford .
35 Leitner , W. ( 2002 ) Acc. Chem. Res. , 35 , 746 – 756 ; Licence , P. , Ke , J. , Sokolova , M. , Ross , S.K. , and Poliakoff , M. ( 2003 ) Green Chem. , 5 , 99 – 104 ; Cole - Hamilton , D.J. ( 2006 ) Adv. Synth. Catal. , 348 , 1341 – 1351 .
36 Horvath , I.T. , and Rabai , J. ( 1994 ) Science , 266 , 72 – 75 ; Horvath , I.T. ( 1998 ) Acc. Chem. Res. , 31 , 641 – 651 ; Gladysz , J.A. , Curran , D.P. , and Horvath , I.T. ( 2004 ) Handbook of Fluorous Chemistry , Wiley - VCH Verlag GmbH , Weinheim .
37 Sheldon , R.A. ( 2001 ) Chem. Commun. , 2399 – 2407 ; Parvulescu , V.I. , and Hardacre , C. ( 2007 ) Chem. Rev. , 107 , 2615 – 2665 ; Rogers , R.D. , and Seddon , K.R. (eds) ( 2003 ) Ionic Liquids as Green Solvents; Progress and Prospects , Ser. 856 , ACS Symp, American Chemical Society , Washington DC .
38 Papadogianakis , G. , and Sheldon , R.A. ( 1997 ) Catalysis , Specialist Periodical Report, vol. 13 , Royal Society of Chemistry , Cambridge , pp. 114 – 193 ; Verspui , G. , Papadogianakis , G. , and Sheldon , R.A. ( 1998 ) Catal. Today , 42 , 449 – 458 .
39 Papadogianakis , G. , Maat , L. , and Sheldon , R.A. ( 1997 ) J. Chem. Tech. Biotechnol. , 70 , 83 ; Papadogianakis , G. ,
20 1 Introduction to Green Chemistry, Organic Synthesis and Pharmaceuticals
Maat , L. , and Sheldon , R.A. ( 1997 ) J. Mol. Catal. A Chem. , 116 , 179 – 190 .
40 ten Brink , G.J. , Arends , I.W.C.E. , and Sheldon , R.A. ( 2000 ) Science , 287 , 1636 – 1639 .
41 Wegman , M.A. , Janssen , M.H.A. , van Rantwijk , F. , and Sheldon , R.A. ( 2001 ) Adv. Synth. Catal. , 343 , 559 – 576 .
42 Powell , K.A. , Ramer , S.W. , del Cardayr é , S.B. , Stemmer , W.P.C. , Tobin , M.B. , Longchamp , P.F. , and Huisman , G.W. ( 2001 ) Angew. Chem. Int. Ed. , 40 , 3948 – 3959 .
43 Sheldon , R.A. ( 2007 ) Adv. Synth. Catal. , 349 , 1289 – 1307 .
44 Martinez , C.A. , Hu , S. , Dumond , Y. , Tao , J. , Kelleher , P. , and Tully , L. ( 2008 ) Org. Process Res. Dev. , 12 , 392 – 398 .
45 Stemmer , W.P.C. ( 1994 ) Nature , 370 , 389 .
46 Fox , R.J. , Davis , C.S. , Mundorff , E.C. , Newman , L.M. , Gavrilovic , V. , Ma , S.K. , Chung , L.M. , Ching , C. , Tam , S. , Muley , S. , Grate , J. , Gruber , J. , Whitman , J.C. , Sheldon , R.A. , and Huisman , G.W.
( 2007 ) Nat. Biotechnol. , 25 , 338 – 344 . 47 Ma , S.K. , Gruber , J. , Davis , C. ,
Newmann , L. , Gray , D. , Wang , A. , Grate , J. , Huisman , G.W. , and Sheldon , R.A. (2010) Green Chem. , Advanced Articles, DOI: 10.1039/b919115c.
48 Sheldon , R.A. ( 1993 ) Chirotechnology: Industrial Synthesis of Optically Active Compounds , Marcel Dekker , New York , pp. 47 – 61 .
49 Sheldon , R.A. ( 2008 ) Chem. Commun. , 3352 – 3365 .
50 Sheldon , R.A. ( 2007 ) Green Chem. , 9 , 1273 – 1283 .
51 Li , C. - J. , and Trost , B.M. ( 2008 ) PNAS , 105 , 13197 – 13202 .
52 Constable , D.J. , Dunn , P.J. , Hayler , J.D. , Humphrey , G.R. , Leazer , J.L. , Linder-man , R.J. , Lorenz , K. , Manley , J. , Pearlman , B.A. , Wells , A. , Zaks , A. , and Zhang , T.Y. ( 2007 ) Green Chem. , 9 , 411 – 420 .
53 Carey , J.S. , Laffan , D. , Thomson , C. , and Williams , M.T. ( 2006 ) Org. Biomol. Chem. , 4 , 2337 – 2347 .

21
2 Green Chemistry Metrics Richard K. Henderson , David J.C. Constable , and Concepci ó n Jim é nez - Gonz á lez
2.1 Introduction
The development of the green chemistry movement has challenged chemists and engineers in all fi elds to consider the environmental impact of a chemistry process as an integral part of its development program. In order to develop greener methods of producing active pharmaceutical ingredient s ( API s), there must be some consideration of Anastas and Warner ’ s 12 Principles of Green Chemistry [1] as an integral part of a project ’ s development plan. Designing greener processes involves, for example,
• Designing effi cient processes that minimize the resources (mass and energy) needed to produce the desired product
• Considering the environmental and health and safety profi le of the materials (toxicity, degradability) used in the process
• Considering the environmental life cycle impacts of the process
• Considering the economic viability of the process
• Considering the waste generated in the process, both in nature and quantity, whether it is hazardous or benign, and whether it can be recycled or recovered and used in this or another process.
This requires a signifi cant behavioral change for both industry and academia, and to support and reinforce this behavioral change one needs to measure progress in developing ‘ greener ’ processes. This desire to measure progress has led to many different proposals to determine the greenness of a process from a chemical and engineering perspective [2 – 14] . In summary, measuring greenness is not just about determining the quantity of waste but requires a holistic approach, taking into account all the factors mentioned above.
There are already many ways of determining whether or not a chemical process is viable and successful [15] based on well - developed methods of analysis:
Green Chemistry in the Pharmaceutical Industry. Edited by Peter J. Dunn, Andrew S. Wells and Michael T. Williams© 2010 WILEY-VCH Verlag GmbH & Co. KGaA, WeinheimISBN: 978-3-527-32418-7

22 2 Green Chemistry Metrics
• Economic
� Will the process make a profi t?
� How big is the profi t margin per unit product?
– Cost of goods
– Cost of processing (OPEX)
– Capital investment (CAPEX)
� Pay back time and return on investment
� Market size, market share, and market state (growing market, mature market, declining market, monopoly market)
� Shut down economics for the competition
• Technical
� Productivity – plant capacity and throughput
� Robustness of the process, which affects processing and OPEX and helps to determine the potential amount of effort and resources wasted in not producing the desired product
� Quality of product, which must meet the needs of the customer
� Processing approach – is it a ‘ me too ’ process or does it take an innovative approach?
• Social
� Does the process provide employment for the local community?
� Does the product provide a benefi t to society?
� Environmental impacts.
Concern for the environmental impacts of industrial chemistry were fi rst prompted by the publication of Silent Spring in 1962 [16] and grew in the next decades fol-lowing a series of environmental disasters: dimethyl mercury poisoning in Minamata Bay in Japan in the 1960s; the explosion at the Flixborough caprolactam plant in 1974 in the UK; the release of dioxin at Seveso, Italy, following an explo-sion; the release of methyl isocyanate in Bhopal, India, in 1984; the release of 100 tonnes of pollutants into the river Harbin following an explosion at a petrochemi-cals plant in Jilin, China.
In 1992, Porteous [17] developed some simple rules of thumb to highlight the economic benefi ts of environmental protection which are consistent with the 12 Principles of Green Chemistry (see Figure 2.1 ):
• Avoid waste creation. • Re - use waste products.

2.1 Introduction
23
12. Inherently safer chemistry for accidentprevention - Substances and the form of asubstance used in a chemical processshould be chosen so as to minimize thepotential for chemical accidents, includingreleases, explosions, and fires.
+
+
+
11. Real-time analysis for PollutionPrevention - Analytical methodologiesneed to be further developed to allow forreal-time, in-process monitoring andcontrol prior to the formation of hazardoussubstances.
4. Designing safer chemicals - Chemicalproducts should be designed to preserveefficacy of function while reducing toxicity
10. Design for degradation - Chemical productsshould be designed so that at the end of theirfunction they do not persist in the environmentand break down into innocuous degradationproducts
6. Design for energy efficiency - Energyrequirements should be recognized fortheir environmental and economicimpacts and should be minimized.Synthetic methods should be conductedat ambient temperature and pressure.
9. Catalysts - Catalytic reagents (asselective as possible) are superior tostoichiometric reagents.
1. Prevention - It is better to preventwaste than to treat or clean up wasteafter it is formed
2. Atom economy - Synthetic methodsshould be designed to maximize theincorporation of all materials used in theprocess into the final product.
8. Reduce derivatives - Unnecessaryderivatization (blocking groups,protection/deprotection strategies,temporary modification ofphysical/chemical processes) should beavoided whenever possible.
measure energy
measure life cycle impacts
measure resource usage
measure chemistryand processefficiency
Measure the inherentsafety or lack of inherentsafety in processes
Measure processparameters andemissions
measure toxicity of all thesubstances
measure degradation potential
GreenChemistry
Metrics
5. Safer solvents and auxiliaries - The use of auxiliary substances (e.g. solvents, separation agents, etc.) should be made unnecessary wherever possible and innocuous when used.7. Use of renewable feedstocks - A rawmaterial feedstock should be renewablerather than depleting wherever technically and economically practicable.
3. Less hazardous chemical synthesis - Wherever practicable, synthetic methodolo-gies should be designed to use and generate substances that possess little or no toxicity to human health and the environment.
Figure 2.1 Mind map showing the relationship of themes for possible green metrics with the 12 principles of green chemistry.
24 2 Green Chemistry Metrics
• If the waste product is not reusable, then recover the primary material for new manufactured products.
• If primary materials recovery is not practicable, then recover for a secondary material, or burn as a fuel if combustible.
• If none of the above is practicable, choose the disposal option with the lowest environmental impact.
The Green Chemistry movement has at its heart a core value that environmental concerns are crucially important to the viability of a process. In this chapter, dif-ferent ways of measuring ‘ greenness ’ are reviewed from the perspective that any way of measuring greenness should drive behavioral change that leads to the achievement of the goals laid out in the 12 Principles of Green Chemistry.
Quality Management Systems have been developed with the aim of driving improvements, for example, making measurements to reduce process variance [18] . In an analogous manner, Green Chemistry metrics can be used as a means of measuring performance to drive improvements in making a chemical reaction or process greener. But as with any process of performance - driven measurement, it is important that the correct measure or metric is recorded, as it is human nature to adapt your system to improve against the benchmarked target, and this in some cases may have a detrimental effect on the whole system.
Grouping the twelve principles together, as seen in Figure 2.1 , gives a frame-work by which one can explore what green metrics are available and being used and how effective they are at driving the behavioral change that is desired. The map suggests that measures of resource usage, energy usage, chemistry and process effi ciency, and life cycle impacts are all related. Next, inherent toxicity and degradation potential are related. There are of course other relationships between the 12 principles, but the map gives a high level view of the important ones.
2.2 Measuring Resource Usage
It is a truism that the simplest concepts are often the most effective, and this can be said of Sheldon ’ s E factor [19, 20] which was developed by Sheldon in order to highlight the amount of waste generated to produce 1 kg of chemical product across different branches of the chemical industry. The E factor is defi ned as the mass ratio of waste to product. E factor is now widely quoted across many different chemical industries in many different fora, as Sheldon provided a simple bench-mark guide for different sectors of the chemical industry and this has been widely published and presented in multiple venues. For examples of processes described in this book where E factors have been calculated see Sections 5.4 and 8.4 .
Different variations on E factor have been proposed and used in the pharma-ceuticals industry (for example, mass intensity, mass productivity [6] , and process mass intensity [21] ). Each of these has the aim of greening pharmaceutical proc-esses by highlighting the amount of material used in a process, either when
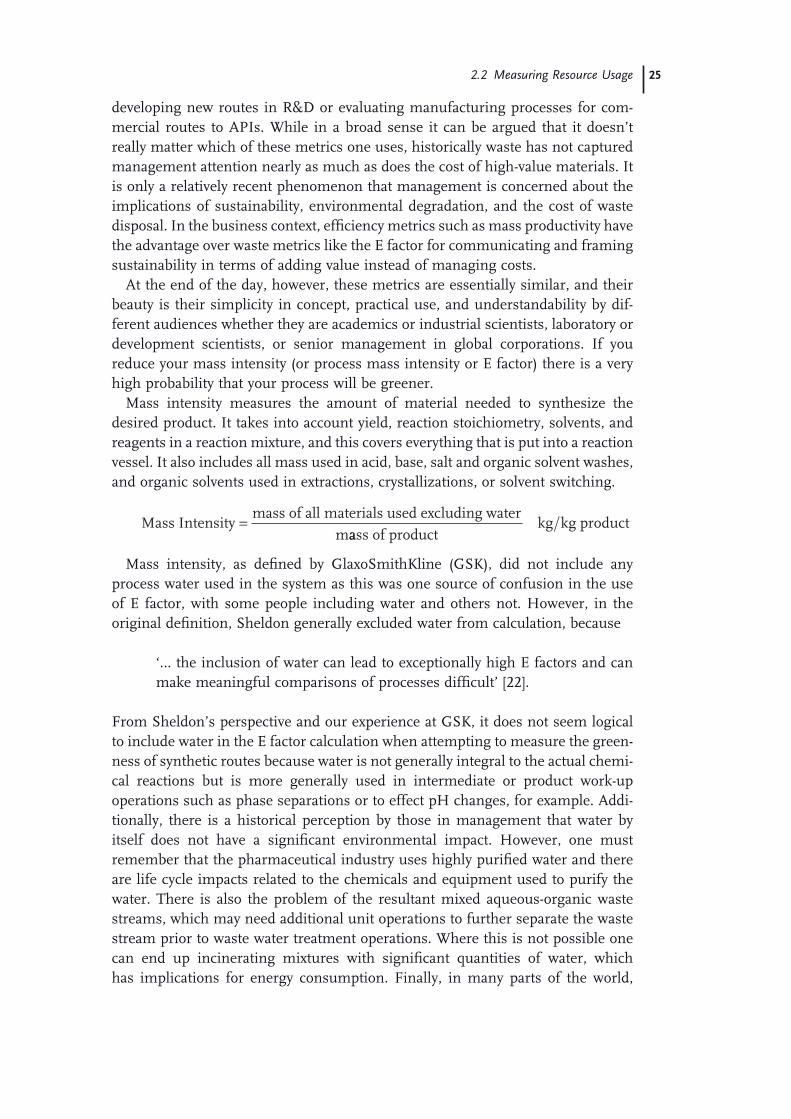
2.2 Measuring Resource Usage 25
developing new routes in R & D or evaluating manufacturing processes for com-mercial routes to APIs. While in a broad sense it can be argued that it doesn ’ t really matter which of these metrics one uses, historically waste has not captured management attention nearly as much as does the cost of high - value materials. It is only a relatively recent phenomenon that management is concerned about the implications of sustainability, environmental degradation, and the cost of waste disposal. In the business context, effi ciency metrics such as mass productivity have the advantage over waste metrics like the E factor for communicating and framing sustainability in terms of adding value instead of managing costs.
At the end of the day, however, these metrics are essentially similar, and their beauty is their simplicity in concept, practical use, and understandability by dif-ferent audiences whether they are academics or industrial scientists, laboratory or development scientists, or senior management in global corporations. If you reduce your mass intensity (or process mass intensity or E factor) there is a very high probability that your process will be greener.
Mass intensity measures the amount of material needed to synthesize the desired product. It takes into account yield, reaction stoichiometry, solvents, and reagents in a reaction mixture, and this covers everything that is put into a reaction vessel. It also includes all mass used in acid, base, salt and organic solvent washes, and organic solvents used in extractions, crystallizations, or solvent switching.
Mass Intensitymass of all materials used excluding water
m=
aass of productkg kg product
Mass intensity, as defi ned by GlaxoSmithKline ( GSK ), did not include any process water used in the system as this was one source of confusion in the use of E factor, with some people including water and others not. However, in the original defi nition, Sheldon generally excluded water from calculation, because
‘ … the inclusion of water can lead to exceptionally high E factors and can make meaningful comparisons of processes diffi cult ’ [22] .
From Sheldon ’ s perspective and our experience at GSK, it does not seem logical to include water in the E factor calculation when attempting to measure the green-ness of synthetic routes because water is not generally integral to the actual chemi-cal reactions but is more generally used in intermediate or product work - up operations such as phase separations or to effect pH changes, for example. Addi-tionally, there is a historical perception by those in management that water by itself does not have a signifi cant environmental impact. However, one must remember that the pharmaceutical industry uses highly purifi ed water and there are life cycle impacts related to the chemicals and equipment used to purify the water. There is also the problem of the resultant mixed aqueous - organic waste streams, which may need additional unit operations to further separate the waste stream prior to waste water treatment operations. Where this is not possible one can end up incinerating mixtures with signifi cant quantities of water, which has implications for energy consumption. Finally, in many parts of the world,
26 2 Green Chemistry Metrics
competition for potable water is becoming more of an issue and will continue to be a greater issue in the future [23] . Consequently, metrics for water use are being used more frequently.
Measuring the E factor or mass intensity gives one the opportunity to explore the next level of detail by looking at the constituent parts of the metric. Using a bill of materials, one can capture other useful mass metrics, as for example:
Solvent Intensity
mass of all solvent used excluding water=
mmass of productkg kg product
% Solvent Intensity
mass of all solvent
mass intensitykg kg= product
Water Intensity
mass of all water used
mass of productkg kg = pproduct
For examples of processes described in this book where solvent usage (or intensity) has been calculated see Sections 5.9 , 7.6 , 8.4 and 10.4 , and for water usage (or intensity) see Sections 5.9 and 10.4 . GSK reported that solvents typically constitute 80 – 90% of the mass intensity of a pharmaceutical process manufactured in a batch operation [24] , and this was validated by a pharmaceutical industry benchmarking exercise in 2007 involving seven inventor pharmaceutical companies [21] . However solvents do not constitute 90% of the price of the manufacturing cost; hence the traditional drive has been to focus largely on increasing reaction yields out of a desire to extract the maximum value from what are considered to be the expensive starting materials. Tucker [25] comments that pharmaceutical green chemistry should be
‘ The quest for benign synthetic processes that reduce the environmental burden ’ … ‘ within the context of enabling the delivery of our current standard of living. ’
So by purely focusing on improving yield, chemists are at risk of missing other opportunities to reduce the environmental burden that also reduce development costs, as shown in Table 2.1 .
The challenge from a green chemist ’ s perspective is to infl uence behavioral change so that synthetic chemists move away from solely focusing on yield improvements toward routinely and systematically considering other environmen-tal impacts. This can be achieved through highlighting the more overt benefi ts shown in Table 2.1 and what have been generally hidden environmental impacts that are exposed through the application of Life Cycle Analysis and life cycle costing (also known as Total Cost Assessment).
2.2.1 Focus on Solvents
Through careful assessment of many pharmaceutical batch reactions conducted over many years, GSK found that solvents are the biggest mass contributor to its

2.2 Measuring Resource Usage 27
Table 2.1 Green Chemistry Principles deliver economic and environmental benefi t [25] .
Thinking environmentally Thinking economically
Atom economy Minimal by - product formation. Reduced environmental burden
More from less. Incorporate total value of materials. Reduced cost
Solvent reduction Less solvent required, less solvent waste. Reduced environmental burden
Reduced capacity requirements, less energy required. Reduced cost
Reagent optimization
Catalytic, low stoichiometry, recyclable. Reduced environmental burden
Higher effi ciency, higher selectivity. Reduced cost
Convergency Reduced environmental burden related to improved process effi ciency.
Higher effi ciency, fewer operations. Reduced cost
Energy reduction Reduced environmental burden related to power generation, transport, and use.
Increased effi ciency, shorter processes, milder conditions. Reduced cost
In situ analysis Reduced potential for exposure or release to the environment.
Real time data increases throughput and effi ciency, fewer reworks. Reduced cost
Safety Nonhazardous materials and processes reduce risk of exposure, release, explosions, and fi res.
Worker safety and reduced downtime. Reduced special control measures. Reduced cost
processes [24] . This prompted the development of methodologies for measuring the relative greenness of common solvents used in the pharmaceutical industry in order to aid chemists to understand the environmental and health and safety issues associated with choosing any particular solvent [26, 27] . This kind of approach was novel in its attempts to quantify, score, and unify a vast array of data and then provide as a consequence simple guidance to development scientists as shown in Figure 2.2 . Other pharmaceutical companies have since adopted similar approaches to classifying solvents to help determine how green a reaction or process is [28, 29] .
In the GSK approach, each factor was given a score based on available physical property data (for example boiling point), life cycle impact data, or experimentally derived data (such as animal toxicity or ecotoxicity data). Related factors were associated together before the combined data was normalized between 1 (worst) and 10 (best) to give fi nal scores for the headline categories (incineration, ecotoxic-ity, exposure potential, and so on). This approach enabled the environmental and health and safety properties of solvents of different types or classes to be easily compared alongside more conventional physical and solvent properties. In an ideal world, a similar approach would be taken with every single chemical to be able to

28 2 Green Chemistry Metrics
determine its relative greenness based on its health and safety and environmental life cycle impacts, and this is frustrated mainly by lack of available data. An alter-native approach will be discussed later in this chapter.
2.2.2 Focus on Renewables
In the discussions around E factor/mass intensity and solvent selection, we have considered metrics that begin to address Green Chemistry Principle # 1 (preven-tion) and # 5 (use safer solvents). Green Chemistry Principle # 7 considers the use of renewable resources.
One approach to addressing the measurement of the use of renewable resources would be to develop mass metrics that record the amount or proportion of renew-able resources used in a process, for example, a renewables intensity analogous to mass intensity.
Renewables Intensity
mass of all renewablyderived material= ss used
mass of productkg kg product
Figure 2.2 GSK ’ s Solvent Selection Guide.
2.2 Measuring Resource Usage 29
While the use of renewably resourced material is on the surface a highly desirable goal, there is more complexity when you consider the proposition in greater depth. For instance, there are the material resources and the energy required to produce renewable materials, which in turn may or may not be renewable; agricultural practices may bring different environmental stressors such as use of toxic com-pounds as herbicides, or may require consideration of a different set of trade - offs of environmental impacts. Therefore it is necessary to assess renewability from a life cycle standpoint. For instance, there are the environmental life cycle impacts associated with growing, harvesting, processing, and purifying a renewable resource that need to be taken into account. An example to consider is the product of a crop extraction process. The crops have to be grown (water, herbicides, energy/fuel, and fertilizer), harvested, dried, and then transported to an extraction plant. In the extraction plant, the biomass may or may not be separated from any unwanted biomass before removing the desired compound using solvent extrac-tion. The desired material is then separated from the extraction solvent through a series of purifi cation steps (for example additional solvent extraction or distillation) and isolated as a fi nal product ready for use in your process [30 – 32] .
Also associated with a life cycle assessment ( LCA ) approach is the ability to consider the renewable and nonrenewable feedstocks that are part of a material ’ s supply chain and the renewable and nonrenewable energy necessary used in proc-esses. One example is the case of furfural sourced from biomass, which can be used in some processes to produce furan or THF (although there are other indus-trial processes to produce THF, for example the Huntsman/Davy Process Technol-ogy process starting from butane and the Mitsubishi process starting from butadiene). The supply chain for furan also requires materials such as sulfuric acid, methanol, or carbon monoxide, which are often derived from fossil feed-stocks; in addition the process energy will be sourced from a mix of renewable and nonrenewable primary energy sources. This may lead one to the concept of a renewability index, explored in GSK, where a score is given say between 1 (no renewables) and 10 (100% renewables) to account for the proportion of renewable resources in any given supply chain. This type of index requires one then to con-sider whether to assign more weight to renewable feedstocks or to renewable energy.
Next, when considering the use of renewable resources, one must make note of the competing uses for land and the consequent impact on the environment, such as the competition between food production and industrial use for agricultural land, as exemplifi ed by the growing biofuels industry or the deforestation of land for plantations of palm oil trees. This is a complex area where there is on - going national and international debate and where there are no easy answers.
A recent example of an attempt to determine whether using a renewable bio-logically - based process for making a particular product exhibits a better environ-mental profi le in comparison to using a synthetic pathway is the comparison of two different processes for the manufacture of the pharmaceutical intermediate 7 - aminocephalosporic acid (7 - ACA) as a case study [33] . The methodology used for the assessment integrates environment, health, safety, and life cycle aspects

30 2 Green Chemistry Metrics
with the measurement of specifi c green chemistry metrics to compare two differ-ent processes [7, 8] . This approach ensures that resource usage is captured and it also includes the wider implications of where the resources came from in addition to the immediate impacts on workers and the working environment. What this approach does not incorporate is an economic assessment, but it should be fairly straightforward to add business case metrics into the framework if they are available.
2.2.3 Cleaning and Maintenance
In a batch chemical plant, because individual unit operations are utilized for mul-tiple products, many pieces of equipment will be cleaned using large solvent volumes and/or aqueous detergents. If possible, clean - in - place protocols that use spray balls or related techniques as opposed to break down and rebuild, or fi ll and boil, are preferred. The cleaning materials and the associated operations (for example heating, refl uxing, steam cleaning) are often not considered as part of a process and so their use is not optimized in the same manner as are other process - related materials and solvents. Frequency of cleaning, length of cleaning, volumes of solvent, water, detergent, energy use, and so on are all important parameters that affect the real mass and energy intensity of a process, as well as the overall equipment effi ciency metric (see below).
In general, a combination of volume per unit of time and/or energy would be a most useful metric, but one should also consider these materials in terms of their intrinsic hazards, just as for any process reagent, solvent, or reactant.
2.3 Life Cycle Assessment ( LCA )
A BSolvent D
C+ ⎯ →⎯⎯⎯⎯
Consider the simple reaction presented above. The environmental impacts of this reaction are not only the ones associated with the use of A, B, and D in the process, but also the ones associated with the production of the materials and energy required to produce A, B, and D as well as the impacts associated with the treat-ment and disposal of any waste derived from the process. To drive behavior toward sustainability, it is necessary to infl uence chemists and engineers to expand the boundaries of reaction systems. As environmental and production systems are intrinsically interrelated, if decisions are made considering only one part of a system those decisions might adversely affect the rest of it. A true green chemist can no longer look at the reaction of A, B, and D in isolation, but has to consider the wider impacts of producing reactants, purifying products and disposing of waste. In other words, it is necessary to expand the boundaries to evaluate greenness.

2.3 Life Cycle Assessment (LCA) 31
Life cycle inventory ( LCI ) is a methodology that is used to expand the environ-mental impact assessment beyond the usual boundaries of a manufacturing plant. This is typically known as a ‘ cradle - to - grave ’ assessment, in which the resource consumption, pollutants emitted, and their environmental impacts are listed in an inventory and assessed at each step, including extraction of raw materials, production, transportation, sales, distribution, use, and fi nal fate. Depending on the goal and scope of the assessment, the boundaries can be set differently; for instance a ‘ cradle - to - gate ’ assessment might be adequate when comparing two chemical routes to the same API; or a ‘ gate - to - grave ’ boundary may suffi ce when comparing two different solvent treatment processes.
Life cycle assessment (LCA) methodology provides a framework for directly applicable green metrics for the life cycle impacts. These metrics can be reported as direct inventory data (for example life cycle energy, life cycle mass, life cycle emissions), measures of individual potential impacts (such as global warming or acidifi cation), or as an aggregate score or index for high - level comparison (for example Eco - Indicator 99). Examples of some metrics for life cycle inventory (LCI) or impact assessment ( LCIA ) used are shown in Figure 2.3 . The scope of this chapter does not cover the details of LCA methodologies, which are reviewed in detail elsewhere [34] , but focuses on some current applications of life cycle meth-odology within the pharmaceuticals industry.
In the area of pharmaceuticals, the application of LCA metrics is still not a widespread practice. A few practitioners apply LCA metrics primarily using case studies to better understand the wider environmental implications of processes, to compare different chemical routes, or to compare the use of different unit
Material
extractionProduction
Transport
Use
Disposal
LCI Metrics LCIA Metrics
• Energy• Exergy• Mass• Land use• Emissions
• Air• Water• Solid
• etc.,
• Resources consumption
• Global warming• Acidification• Eutrophication• Smog formation• Human toxicity• Eco-toxicity• Workplace safety• etc., …
I
M
P
A
C
T
S
I
N
D
E
X
E
S
• Eco-Indicator 99• FLASCTM score• etc.,…
‘cradle-to-grave’ boundary
Material
extractionProduction
Transport
Use
Disposal
• Energy• Exergy• Mass• Land use• Emissions
• Air• Water• Solid
• etc.,
• Resources consumption
• Global warming• Acidification• Eutrophication• Smog formation• Human toxicity• Eco-toxicity• Workplace safety• etc., …
• Eco-Indicator 99• FLASCTM score• etc.,…
Figure 2.3 Examples of Life Cycle Inventory and Assessment (LCI and LCIA) metrics.
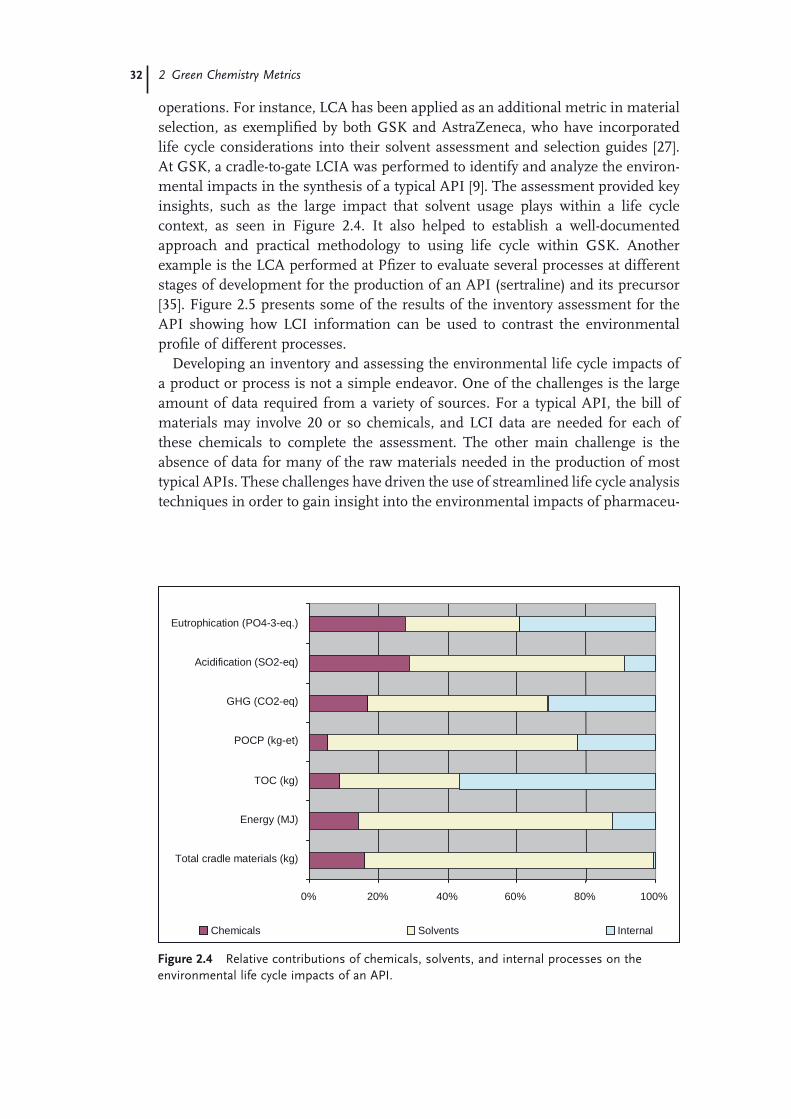
32 2 Green Chemistry Metrics
0% 20% 40% 60% 80% 100%
Total cradle materials (kg)
Energy (MJ)
TOC (kg)
POCP (kg-et)
GHG (CO2-eq)
Acidification (SO2-eq)
Eutrophication (PO4-3-eq.)
Chemicals Solvents Internal
Figure 2.4 Relative contributions of chemicals, solvents, and internal processes on the environmental life cycle impacts of an API.
operations. For instance, LCA has been applied as an additional metric in material selection, as exemplifi ed by both GSK and AstraZeneca, who have incorporated life cycle considerations into their solvent assessment and selection guides [27] . At GSK, a cradle - to - gate LCIA was performed to identify and analyze the environ-mental impacts in the synthesis of a typical API [9] . The assessment provided key insights, such as the large impact that solvent usage plays within a life cycle context, as seen in Figure 2.4 . It also helped to establish a well - documented approach and practical methodology to using life cycle within GSK. Another example is the LCA performed at Pfi zer to evaluate several processes at different stages of development for the production of an API (sertraline) and its precursor [35] . Figure 2.5 presents some of the results of the inventory assessment for the API showing how LCI information can be used to contrast the environmental profi le of different processes.
Developing an inventory and assessing the environmental life cycle impacts of a product or process is not a simple endeavor. One of the challenges is the large amount of data required from a variety of sources. For a typical API, the bill of materials may involve 20 or so chemicals, and LCI data are needed for each of these chemicals to complete the assessment. The other main challenge is the absence of data for many of the raw materials needed in the production of most typical APIs. These challenges have driven the use of streamlined life cycle analysis techniques in order to gain insight into the environmental impacts of pharmaceu-
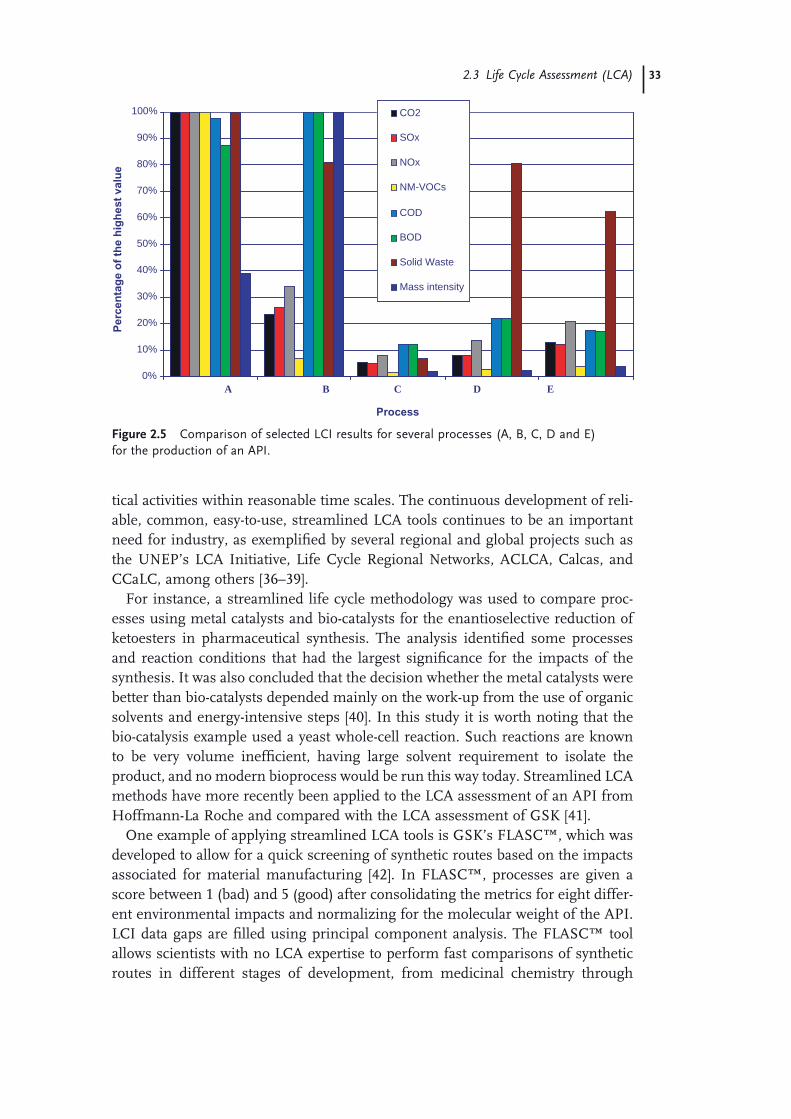
2.3 Life Cycle Assessment (LCA) 33
0%
10%
20%
30%
40%
50%
60%
70%
80%
90%
100%
Process
Pe
rce
nta
ge
of
the
hig
he
st
va
lue
A B C D E
CO2
SOx
NOx
NM-VOCs
COD
BOD
Solid Waste
Mass intensity
CO2
SOx
NOx
NM-VOCs
COD
BOD
Solid Waste
Mass intensity
Figure 2.5 Comparison of selected LCI results for several processes (A, B, C, D and E) for the production of an API.
tical activities within reasonable time scales. The continuous development of reli-able, common, easy - to - use, streamlined LCA tools continues to be an important need for industry, as exemplifi ed by several regional and global projects such as the UNEP ’ s LCA Initiative, Life Cycle Regional Networks, ACLCA, Calcas, and CCaLC, among others [36 – 39] .
For instance, a streamlined life cycle methodology was used to compare proc-esses using metal catalysts and bio - catalysts for the enantioselective reduction of ketoesters in pharmaceutical synthesis. The analysis identifi ed some processes and reaction conditions that had the largest signifi cance for the impacts of the synthesis. It was also concluded that the decision whether the metal catalysts were better than bio - catalysts depended mainly on the work - up from the use of organic solvents and energy - intensive steps [40] . In this study it is worth noting that the bio - catalysis example used a yeast whole - cell reaction. Such reactions are known to be very volume ineffi cient, having large solvent requirement to isolate the product, and no modern bioprocess would be run this way today. Streamlined LCA methods have more recently been applied to the LCA assessment of an API from Hoffmann - La Roche and compared with the LCA assessment of GSK [41] .
One example of applying streamlined LCA tools is GSK ’ s FLASC ™ , which was developed to allow for a quick screening of synthetic routes based on the impacts associated for material manufacturing [42] . In FLASC ™ , processes are given a score between 1 (bad) and 5 (good) after consolidating the metrics for eight differ-ent environmental impacts and normalizing for the molecular weight of the API. LCI data gaps are fi lled using principal component analysis. The FLASC ™ tool allows scientists with no LCA expertise to perform fast comparisons of synthetic routes in different stages of development, from medicinal chemistry through

34 2 Green Chemistry Metrics
manufacturing. The score is currently tracked for most of the GSK chemical routes under development. An example of the high level outcome is shown in Figure 2.6 .
Given the data challenges discussed previously and the increasing use of stream-lined methods, it is necessary to continuously improve the consistency and trans-parency of the information and the assumptions used in such tools to ensure the quality and the validity of the decisions made with the aid of LCA metrics. The inclusion of quality indicators (such as sensitivity and uncertainty analysis) will continue to be an important step to estimate the uncertainties involved in the inventory and impact models. Finally, there is a need to continuously perform peer review assessments by LCA experts, as the current LCA expertise in pharmaceu-ticals is very limited. When these requirements are fulfi lled, LCA metrics are powerful tools to aid the decision making leading to more sustainable pharmaceu-tical processes. For further examples of FLASC ™ scores and other LCA analyzes being applied, see Section 10.4.1 .
2.4 Measuring Chemistry and Process Effi ciency
Measurements of the chemistry and process effi ciency are attempts to address Green Chemistry Principles # 2 (atom economy) and # 8 (reduce derivatives). Atom economy is one of the most widely known measures of chemistry effi ciency [43 – 45] and is calculated from
Atom Economy
molecular weight of desired product
molecular =
wweight of all products× 100%
While the concept of atom economy is simple, unlike the E factor it does not take into account the actual yield or stoichiometry (actual masses or molar excesses)
Figure 2.6 Example of FLASC high - level outcome of the comparison of a chemical and a bio - catalytic route for the production of 7 - ACA.

2.5 Measuring Process Parameters and Emissions 35
of reactants, solvents, or other reagents used in a system, so there is scope for misrepresentation of the effi ciencies of a real system. To address these issues, the concept of reaction mass effi ciency ( RME ) was developed [6] .
Reaction Mass EfficiencyMass of product
Mass of all reacta=
nnts× 100%
Because RME accounts for the mass of all reactants, that is, the actual stoichio-metric quantities used, and therefore includes yield and atom economy, this combined metric is probably one of the most helpful metrics for chemists to focus attention on how far from ‘green’ their current processes actually is. However, like many green chemistry metrics, it does take a little bit of thought to calculate in practice, as one has to work to strict defi nitions of what to include and what to exclude [46] :
• A Reactant is defi ned as any material (organic or inorganic), including starting materials, that contributes mass to the fi nal product or any of the intermediates .
• Examples of Reactants include
� Starting materials, resolving agents, reducing agents, protecting groups, acids or bases that are used to form an intermediate or fi nal product salt, acids or bases used to convert the previous salts into free acid or base, acids or bases used for hydrolyses, strong bases used to extract acidic protons from organic substrates, activating agents, stoichiometrically used catalysts.
• Examples of materials that are NOT Reactants include
� Catalysts, solvents, acids and bases used in the neutralization of by - products or in repeated aqueous washes.
• If the Solvent is also the Reactant , then the mass of the part that is reactant needs to be estimated separately (otherwise the resultant RME will be artifi cially low).
For an example of reaction mass effi ciency being used to compare four different processes please see Section 10.4.1 .
2.5 Measuring Process Parameters and Emissions
Both the atom economy and the RME try to account for the chemistry effi ciency, but they do not measure process effi ciency. Achieving good process effi ciency is more than just getting the chemistry right. Good process effi ciency will be achieved through optimizing the chemistry, the chemical engineering, and the plant opera-tions. None of these are independent of each other, and, as in any large or complex system, compromises will be needed in order to achieve a global maximum effi -ciency. There is not one simple metric that measures the process effi ciency in the context above; one should take a multivariate approach and determine which factors are the most important to one ’ s process.

36 2 Green Chemistry Metrics
2.6 Real Time Analysis
Green Chemistry Principle # 11 (real - time analysis for pollution prevention) expresses a desire to have real time analysis and monitoring of a process in place. The aim of this principle is simple enough – to prevent waste by identifying excur-sions when they are actually occurring. By doing so, there may be suffi cient time to modify process controls such that the excursion may be reversed such that there is no subsequent impact on the fi nal product quality. Real time analysis and control is becoming more available in pilot and full - scale plants through the imple-mentation of Distributed Control System s ( DCS ). The use of such systems allows monitoring of a vast array of process parameters: inputs such as pump settings, heater power settings, valve settings, refl ux ratio settings, and outputs such as temperature at different points in the reactor system, liquid levels, liquid fl ow rates, and so on. Real time monitoring allows for the trends of these parameters to be followed, so that the impact of making a change can be followed throughout the process. When these are combined with chemical information from process samples (such as physical analysis by HPLC or GC, the use of probes to acquire other chemical information such as FT - IR, or compound - specifi c probes), it enables faster understanding of where the optimum processing window lies. More importantly, monitoring trends enables faster identifi cation of the root causes of an excursion that may have affected the fi nal product quality. In addition, more information is often gained after an unexpected event has occurred and the sub-sequent understanding of how to prevent that event from occurring again is more likely. In a laboratory environment, simple feedback control systems have been available for years, and the widespread availability of cheap computing power facilitates the automation of monitoring processes. But, failing that, there is nothing to stop one from using a paper and pen to record inputs and outputs, including taking samples at regular intervals, rather than waiting until the end of the reaction to see what has happened.
2.6.1 Scalability
Process scalability is an indication of how well a process would handle the rigors of moving to different production sizes as the process develops. Scalabil-ity in chemical processes implies that there is suffi cient understanding of the process such that it can be controlled and operated in different and/or larger or smaller equipment and there is confi dence that product quality and yield will not be adversely affected by the change. For a petrochemical continuous process, for example, scalability is determined by ensuring that the materials fl ow, mixing and heat transfer regimes desired in the large scale plant have been modeled and then tested in smaller scale equipment to validate the models. These models are then continuously refi ned based on real plant data to continuously improve process understanding, and often the most valuable

2.6 Real Time Analysis 37
information arises from unexpected events, such as the presence of by - products in unexpected parts of the plant.
Smooth scale - ups from R & D laboratory or bench scale to pilot scale and then to commercial size batch - operated, multi - purpose chemical plants are often not easy to achieve for a variety of reasons, often resulting from compromises due to the need to use existing equipment. The consequences of this lack of scalability can be a reduction in product quality and yield, increased by - product formation, longer cycle times, and, in some cases, an inability to reproduce key product properties such as color, size, or crystal structure. These consequences invariably result in an increased use of mass and energy and a production of greater waste per unit mass of product.
To measure the scalability of a process it is necessary to understand the chem-istry and reaction kinetics involved and then to determine their impact on well - defi ned critical quality attributes desired of the product in order to fi nd the optimum processing window within which there is certainty that the product will be of acceptable quality. However, these data are not readily available for many pharmaceutical chemistry reactions, so a subjective measure of a the scalability, robustness, and greenness of many processes has been developed by Pfi zer based on operator knowledge and experience to assist development teams both in the laboratory and in pilot plants to develop greener processes [28] .
2.6.2 Controllability
While in petrochemical and bulk commodity chemical manufacture real - time process control has been a fact of life for many years, in batch chemical operations a similar level of real - time process control is rarely achieved. In fact, despite increasing efforts in recent years to achieve greater statistical process control, the batch chemical industry is generally only able to operate at about three, or occa-sionally four, sigma , which is equivalent to one defect in 1000 – 10 000.
From a green perspective, processes that are not under tight control are obvi-ously going to produce a greater quantity of waste, consume more materials and energy per unit of fi nished product, and lead to reduced throughput and cycle time. In some cases, not holding the process under control will lead to a failure to meet product specifi cations, with the follow - on need of having to either reproc-ess the off - specifi cation product or having to discard the product entirely. Either way, through the production of additional waste or through the materials con-sumed, an out - of - control process is a problem.
One can use statistical software packages to calculate the level of control the process is under, and one may, for example, use process capability indices that compare the output of an in - control process to the specifi cation limits. Indirect proxies for controllability metrics could also be the amount of materials and/or energy consumed per kg of product caused by excursions outside the control zone. For example, a rejected batch will become waste, and additional mass and energy will be required to replace or rework the rejected batch.

38 2 Green Chemistry Metrics
2.6.3 Robustness
From a simplistic perspective, process robustness may be thought of as the extent to which process excursions adversely affect product quality and yield. A process that is not greatly affected by variations in process temperatures, mixing, minor variations in rates of addition, and so on, would be considered robust. Good process understanding may be gained through appropriate statistical design of experiments and the testing of various process inputs and parameters. The process understanding gained through testing is the key to understanding process robust-ness. The main difference between controllability and robustness is that a control-led process will stay within the desired parameters while a robust process can exhibit excursions outside the control parameters without affecting the critical attributes of the product. A similar proxy metric for process robustness, as was the case for controllability, is to measure the mass or energy required for rework following an excursion.
2.7 Operational Effi ciency
Rarely in the pharmaceutical industry is a new plant built to accommodate a new process or product. It may happen in the petrochemical industry, where econo-mies of scale mean that product - specifi c plants are designed from scratch and then continuously de - bottlenecked over a number of years to increase and optimize productivity, but it is not the case in the pharmaceutical industry, where the number of types of unit operations in use is generally fairly small and fi xed. Within a multi - purpose chemical plant commonly found in the batch chemical industry, it is common practice for process designers to ‘ make do ’ with what is available on a given site to avoid capital expenditure and plant shut - down for modifi cations.
The optimization of the operations and management of the processes of a multi - plant multi - purpose chemical plant leads us into the fi eld of operations manage-ment for which there are many textbooks for the reader to investigate. The desired optimum will depend to some extent on the operating model that has been adopted to meet variations in demand, be it a level - capacity model (where operational fl ex-ibility is diffi cult to achieve), a chase - demand model (where operational fl exibility is easier to achieve through use of overtime, or temporary staff for example), or a yield management model, where capacity is fairly fi xed and the product price is varied to either restrict or encourage demand (as in the low - cost airlines ’ ticket price variations) [47] . The chosen combination of capacity management will have an impact on the desire to optimize processes in manufacturing, as there may be other pressures to keep staff busy rather than have extended periods of down time.
In the pharmaceutical industry, a metric used to measure performance is the overall equipment effectiveness ( OEE ), which takes into account
2.8 Measuring Energy 39
• The throughput of the equipment (its cycle time) • The quality of the product • The time available to operate.
This metric gives an indication of the performance of equipment against its design capacity. Typically, the OEE is recorded for as many unit operations or equipment lines as possible in a manufacturing plant.
The more complex the process, the greater will be the number of unit opera-tions, which will include combinations of reaction, separation, and purifi cation operations. When the equipment used in an operation is not specifi cally designed for a process, there is an impact on the mass and energy resources required as a result of adapting the process to fi t the equipment. The knock - on consequence of this is that the optimum processing conditions required for the reactor may well not match the optimum processing conditions for the chemistry (effi ciency of mixing, reaction rate, by - product formation, control of reaction exo - or endo-therms, phase separations), so that compromises have to be made. The more complex the process, the greater the impacts on
• overall processing time • process effi ciency • product quality • the environment, health and safety impacts from loading, operating and
discharging the materials processed in each unit operation • throughput and cycle time.
This results in an inherent ineffi ciency built into the overall process.
2.8 Measuring Energy
It is not unusual for many pharmaceutical batch chemical operations to have both heating and cooling requirements associated with any given step or stage of a chemical synthesis. While this may be avoided through closer attention to the combination of chemistry with reactor type and confi guration, it is generally not routinely achieved for a variety of reasons. It is also generally true that the exist-ence of a large installed base of reactors with their supporting unit operations is a barrier to the installation and implementation of newer technologies. Existing in - ground capital that has been paid for many times over is diffi cult to stop using unless the gains in effi ciency or the reduction in costs are overwhelming.
One of the biggest challenges in measuring processing energy is having the measuring equipment in place such that the energy of individual unit operations can be easily measured and separated from a building ’ s or site ’ s overall energy use. If this were to be done, it would be apparent that the energy required to keep a plant operational is often the major component of energy use in a chemical plant. Once this base load energy is understood, different accounting rules can then be applied to allocate the overall plant energy to individual processes, if desired.

40 2 Green Chemistry Metrics
For an individual process, energy metrics that are similar to those for mass can be used, for example, following the total energy used per kg of product or the total energy required for heating or cooling. As mentioned before, a green chemist needs to be aware that the system boundaries extend beyond the current process, so the life cycle energy requirements should also be accounted for. This means we have to add to the processing energy the energy required to produce raw materi-als, the energy to recycle materials (in - process or externally), and the waste treat-ment energy.
By taking this approach, the benefi ts from recovering solvent versus incineration can be evaluated with greater confi dence. Over time, robust models can be devel-oped which show the life cycle energy and economic benefi ts of recovery versus incineration and provide an understanding of where the transition point for the process comes.
2.9 Measuring the Toxicity of All the Substrates
By measuring the toxicity of all substances used in a given chemical synthesis, we are able to address Green Chemistry Principles #3 (less hazardous chemical syn-thesis) and #4 (designing safer chemicals).
The wide availability of solvent toxicity data that are publicly available through systems such as the European chemical Substances Information System ( ESIS ) facilitated the development of solvent selection guides that accounted for solvent toxicity impacts in a user - friendly format [48] . There is, however, a general lack of equivalent toxicity data for the vast majority of chemicals used in pharmaceutical processing. This is in part being addressed by the introduction of the REACH regulations in the EU ( R egistration, E valuation, A uthorization and Restriction of Ch emical substances), but there continues to be a wide variety of chemicals with little or no toxicity information available. A considerable amount of mammalian and human toxicity data and, more recently, ecotoxicity data is generated by phar-maceutical companies for new pharmaceutical APIs and, to a lesser extent, any isolated intermediates formed in the process. However, pharmaceutical compa-nies, like all other users of chemicals, rely on toxicity data generated by third parties for commodity chemicals purchased from third party suppliers.
2.9.1 Occupational Exposure Hazard and Risk
Toxicity data are used to assess occupational exposure hazards associated with materials used in a process and are communicated through the use of Permissible or Occupational Exposure Limit s ( PEL or OEL ). OELs are usually set based on a combination of the inherent toxicological hazard of a chemical and a series of safety factors such as intra - species variability in test results, the nature and severity of the effect, and the adequacy and quality of the information. OELs are set to protect workers under the general assumption that they are being exposed to any
2.9 Measuring the Toxicity of All the Substrates 41
given chemical for eight hours a day and fi ve days a week continually. When toxic-ity data are not available, most pharmaceutical companies use a banding approach for categorizing the occupational hazard of materials to facilitate occupational exposure risk assessments. Occupational hazard banding in combination with a risk assessment allows one to rapidly identify issues and potential opportunities for elimination or substitution of materials, or the need to manage an issue through an appropriate control approach, for example, by containment or layers of protection.
The potential for occupational exposure can be assessed through close attention to the materials being handled and the unit operations employed in a process. Tools such as Dow ’ s Exposure Index [49] enable a standard approach to perform-ing an occupational exposure risk assessment by coupling the exposure assess-ment with a given set of hazards. A variety of approaches is possible here, from simply summing the number of materials in a given hazard band through to more sophisticated approaches that take into account additional toxicological concerns such as the potential for carcinogenicity, mutagenicity, or reproductive effects, for example. These materials are usually to be found in regulatory lists such as the list of materials on the EU Annex I of Directive 67/548/EEC [50] . It is also possible to simply sum the mass of materials in a given band or to do a high - level assess-ment of potential risk based on the mass used, its physical form, the type of unit operations in the process, or the potential for accidental release into the workspace.
This approach enables the early identifi cation of materials that appear on regula-tory lists and/or whose use on a larger scale will be accompanied by the need for signifi cant engineering or abatement controls to protect staff, property, and the environment, or in some cases may even be prohibited, all of which adds cost to a development program in terms of both time and money.
To help determine the relative greenness of a process one can also adapt such systems already used in major companies to determine hazards of materials and processes as exemplifi ed in Figure 2.7 [34] . Materials are listed according to type, and then a hazard ranking is applied. This hazard ranking is based on an assess-ment of a variety of potential hazards associated with each given material. The hazard data can be presented as a table of individual materials or as a high - level score based on combining the hazards along with the quantities of materials used. In the example shown in Figure 2.7 ,
• Each material used is given a hazard ranking.
• The scores for each class of material have been grouped together using a weighted average (hazard ranking times mass of material used).
• A score for the process is determined either by taking a geometric mean of the solvent, reactant, and reagent scores or by taking a geometric mean of all the weighted averages for each material.
This example shows the pros and cons of grouping and averaging scores and weighted hazard rankings. Averaging overall scores makes the process seem fairly green, but this may be masking particular hazards associated with specifi c
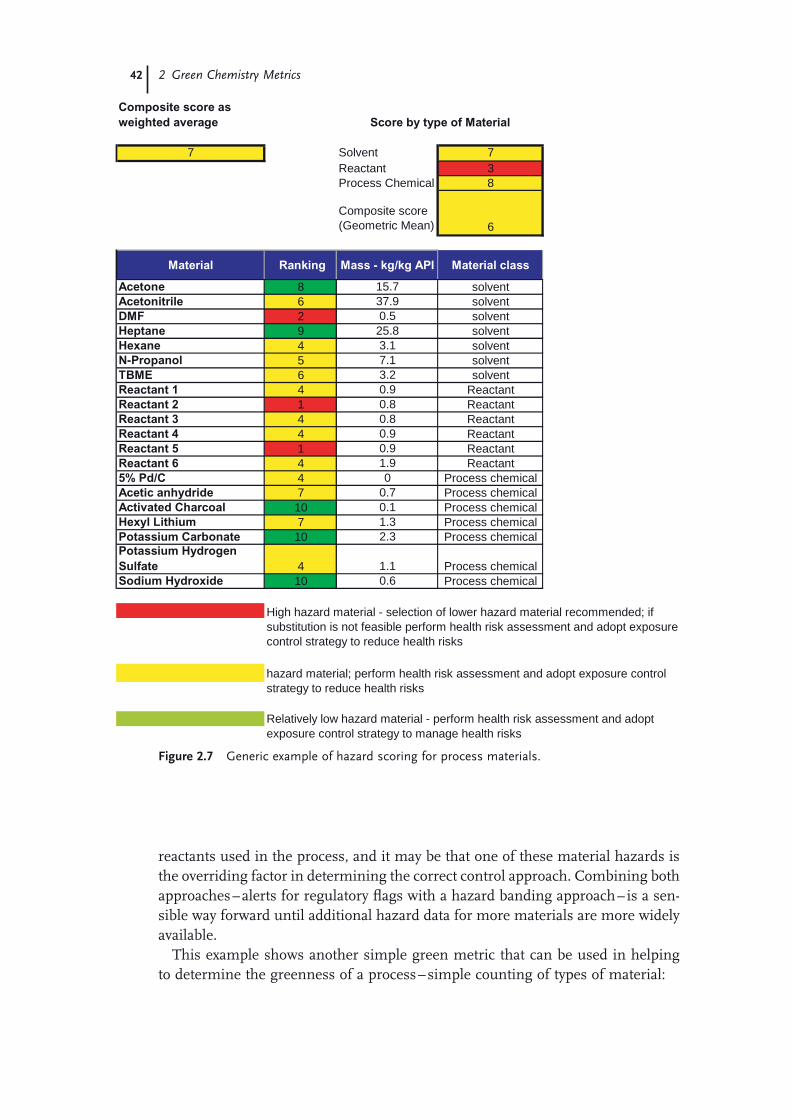
42 2 Green Chemistry Metrics
reactants used in the process, and it may be that one of these material hazards is the overriding factor in determining the correct control approach. Combining both approaches – alerts for regulatory fl ags with a hazard banding approach – is a sen-sible way forward until additional hazard data for more materials are more widely available.
This example shows another simple green metric that can be used in helping to determine the greenness of a process – simple counting of types of material:
Composite score as
weighted average
7tnevloS7Reactant 3Process Chemical 8
Composite score(Geometric Mean) 6
Material Ranking Mass - kg/kg API Material class
Acetone 8 15.7 solventAcetonitrile 6 37.9 solventDMF 2 0.5 solventHeptane 9 25.8 solventHexane 4 3.1 solventN-Propanol 5 7.1 solventTBME 6 3.2 solventReactant 1 4 0.9 ReactantReactant 2 1 0.8 ReactantReactant 3 4 0.8 ReactantReactant 4 4 0.9 ReactantReactant 5 1 0.9 ReactantReactant 6 4 1.9 Reactant5% Pd/C 4 0 Process chemicalAcetic anhydride 7 0.7 Process chemicalActivated Charcoal 10 0.1 Process chemicalHexyl Lithium 7 1.3 Process chemicalPotassium Carbonate 10 2.3 Process chemicalPotassium Hydrogen
Sulfate 4 1.1 Process chemicalSodium Hydroxide 10 0.6 Process chemical
hazard material; perform health risk assessment and adopt exposure control strategy to reduce health risks
Relatively low hazard material - perform health risk assessment and adopt exposure control strategy to manage health risks
High hazard material - selection of lower hazard material recommended; if substitution is not feasible perform health risk assessment and adopt exposure control strategy to reduce health risks
Score by type of Material
Figure 2.7 Generic example of hazard scoring for process materials.
2.10 Measuring Degradation Potential 43
• number of solvents, reagents, and reactants in the process • number of solvents per stage of the process.
From a green engineering perspective, the number and types of unit operations can also be counted:
• number of distillations • number of solvent swaps • number of phase separations and washes • number of stages in a process.
These are very simple metrics to record, and yet they shed light on a process by highlighting opportunities to simplify or telescope a multistage process through, for example, reducing the number of solvents by using a common solvent in more than one stage or reducing the number of stages in a process. Telescoping usually leads to signifi cant reductions in mass intensity and hence has a big impact on greening a process.
2.10 Measuring Degradation Potential
There is some way to go before all toxicity data of all commonly used materials will have been determined and made readily available, but the pharmaceutical industry does already measure the toxicity data of its APIs. Linked to toxicity are the impacts associated with degradation of chemicals (Green Chemistry Principle # 10 – design for degradation). The challenge for the pharmaceutical industry is to design drugs that will survive in the harsh environments inside the human body for long enough to reach the target receptor and then provide an effective dose. This means that APIs are designed to have some inherent resistance to biodegrad-ability, which has led to societal concerns regarding the level of risk from phar-maceuticals in the environment. There has been an EU - funded study, KNAPPE [51] , which has led to the general consensus that current environmental levels of pharmaceuticals are not a risk to human health and are unlikely to result in acute effects on organisms. The evaluation of the chronic impact of pharmaceuticals, however, is on - going, and further research is needed.
There are a number of strategies that can be employed to assess the collective environmental risk associated with a process. A number of general areas should be considered as part of the overall assessment, independently of whatever strategy is chosen, such as consideration of
• the inherent hazard, fate, and effects of materials used in the process • the potential for release from the process and its unit operations • issues related to the transportation, storage, and disposal options related to the
materials used in the process • the life cycle impacts of producing those materials.

44 2 Green Chemistry Metrics
For the purposes of metrics to account for the inherent hazard, fate, and effects, it is helpful to have a good understanding of the chemical properties of the mate-rial as this will fundamentally drive overall environmental risk. The environmental fate of a chemical means fi rst of all where it will go (air, water, soil) once it is released. It is then necessary to know what potential effects a chemical may have on organisms, including man. In general, insuffi cient attention is paid to the chemical mechanisms in the environment that impact on chemical fate or distri-bution, most attention being paid to the potential effects a chemical will have on certain organisms. Just because a compound is inherently hazardous to plants or animals does not mean that once released it will necessarily present a great risk to the environment. It is important to carefully evaluate distribution and degrada-tion mechanisms that will directly affect the potential for exposure from any given chemical. The reader is referred elsewhere for a more complete treatment of this important topic [52, 53] .
From an environmental hazard assessment perspective, most chemicals in recent years have been categorized according to their potential for persistence, bioaccumulation, and toxicity. Persistence is associated with whether or not a chemical will be resistant to chemical or biological degradation or breakdown. Various tests are used to determine a chemical ’ s environmental depletion mecha-nism [54] . Bioaccumulation is the tendency for chemicals to become increasingly concentrated, usually in fat, as one moves up the food chain from micro - organisms to large fi sh, birds or mammals. The water : octanol partition coeffi cient, log K ow or D ow (corrected for pH and ionizability of a compound in water) is usually used to estimate the tendency for bioaccumulation. Toxicity is generally the most con-tentious area of concern, and there are a wide variety of tests that can be used to assess it. Generally, one conducts multiple acute toxicity tests at three levels of the food chain (where the endpoint is lethality), using, for example, algae, aquatic fl ea ( Daphnia magna ), and fi sh ( Pimephelas [fathead minnow], Onchorynchus [trout]). There are variations in the type of test used that depend on the fate of the com-pound (for example, will it be released to a fresh water or marine environment or applied to land as for a pesticide?) and the type of application for the chemical. Recently, there has been increasing concern about chronic exposures to chemicals, so there has been a movement toward requiring toxicity testing that assesses chronic exposures and different endpoints (for example, fecundity and endocrine disruption). The reader is referred elsewhere for an extensive treatment of ecotox-icity testing [54] .
In terms of environmental metrics to assess processes, it is clear that a consider-able testing burden exists to assess potential environmental hazards that lead to a credible risk assessment. As a fi rst step, one would typically screen compounds from an environmental hazard perspective to assess their tendency for persistence, bioaccumulation, and toxicity. Depending on the fi nal application of the com-pound, one might then avoid commercial production of a particular compound or devise processes that would use the compound but control the environmental risk to acceptable levels. For this, it is important to perform a process - specifi c risk assessment, as the impact of a given chemical, or set of chemicals, will be affected
2.11 Measuring the Inherent Safety or Lack of Inherent Safety 45
by the inherent hazard, environmental fate, and the specifi c characteristics of the process, available treatment, and volumes, among others.
2.11 Measuring the Inherent Safety or Lack of Inherent Safety
Process safety is addressed by Green Chemistry Principle # 12 (inherently safer chemistry for accident prevention). There are a variety of process safety risks that need to be assessed for chemical processes. These will lead to an evaluation of the potential for sudden changes in temperature and/or pressure during the process, leading to secondary events such as detonations, explosions, excessive pressures, fi res, and so on. The most cost - effective way of avoiding these sorts of risks is through the adoption of inherent safety principles, these being very similar and complementary to pollution prevention principles, where the approach is to use a hierarchy of controls to avoid and/or reduce the risk of an adverse event. The reader is referred elsewhere for a more complete treatment of this important area of process design [55] .
For processes under development, the most cost - effective means of avoiding potential risk is to eliminate those materials that are inherently unsafe, that is those materials whose physical or physico - chemical properties lead to them being highly reactive or unstable. This is somewhat diffi cult to achieve for several reasons. First, without a full battery of tests to determine properties such as fl am-mability, upper and lower explosion limits and their variation with scale, minimum ignition temperatures, and so on, it is almost impossible to tell how a particular chemical will behave in a given process. Second, the chemical instability of a mate-rial may make a compound attractive to use because its inherent reactivity ensures that a reaction will proceed to completion at a rapid enough rate to be useful; that is, the reaction is kinetically and thermodynamically favored.
The approach to developing metrics for process safety is analogous to the approach that might be used to assess Occupational Exposure risk. Several indices that have been developed as metrics for estimating and ranking the safety of a given process or chemical reaction, such as the Dow Fire and Explosion Index [56] , the Stoessel Index [57] for hazard assessment and classifi cation of chemical reac-tions, the Inherent Safety Index, and the Prototype Index for Inherent Safety, among others [58, 59] .
2.12 Conclusions
This chapter presents a number of different green metrics that can be used to assess a process or system in the pharmaceutical industry. It is clear that there is not one single unifi ed metric available to measure the ‘ greenness ’ of a chemical process. The green metrics one chooses to use must be adapted for their context
46 2 Green Chemistry Metrics
and continuously evaluated as to their utility, applicability, and appropriateness. They should also be tested and validated regularly to ensure that they are success-fully driving towards the desired goals set by the organization. They must also be easily understood and accepted by key stakeholders. Existing data collection methods or business systems should ideally be used for collecting information to calculate the green metrics, so that there is built - in reliability and integrity in the data, which helps to ensure their broad acceptance.
Another general principle for measuring green metrics is that they should promote strategic analysis and continuous improvement. If the metrics are being collected but not evaluated on a regular basis, and decisions based upon the metrics results are not made, there is no point in collecting them. This may seem to be an obvious point, but metrics are not always routinely questioned, assessed, evaluated, and evolved to help make strategic decisions or make them more useful to a business.
Developing green metrics for chemical processes requires a holistic, systems point of view across a range of disciplines. Metrics are also generally context dependent; one kind or one set of metrics does not fi t all situations. Instead, dif-ferent organizations or companies will have to undertake some very hard work to identify, assess, and implement metrics that are most applicable to their needs. The good news is that there are a large number of metrics that have already been identifi ed, and many of these will meet the needs of most organizations or companies.
Any one individual is unlikely to possess suffi cient knowledge in all areas of interest to identify key metrics, so it should be common practice for green metrics to be developed drawing on the resources of multi - disciplinary teams. In addition, to truly drive in the right direction, namely toward the design of greener, safer processes, there is a need to resist the temptation of addressing metrics in a com-partmentalized manner, as many of these metrics are interrelated. Finally, one should apply the 80/20 rule liberally, don ’ t strive for the perfect set of metrics that covers all situations if a few meet your needs for most of the time.
References
1 Anastas , P.T. , and Warner , J.C. ( 1998 ) Green Chemistry: Theory and Practice , Oxford University Press , Oxford, UK .
2 Constable , D.J.C. , Curzons , A.D. , dos Santos , L.M.F. , Geen , G.R. , Hannah , R.E. , Hayler , J.D. , Kitteringham , J. , McGuire , M.A. , Richardson , J.E. , Smith , P. , Webb , R.L. , and Yu , M. ( 2001 ) Green Chem. , 3 , 7 – 9 .
3 CWRT (2000) Baseline metric and other documents posted on the website of the Centre for Waste Reduction Technolo-
gies , http://www. aiche. org/cwrt/ (last accessed 22 October 2008) http://198. 6. 4. 175/cwrt/ (last accessed 22 October 2008); http://www. aiche. org/uploaded-Files/IFS/Products/TCAM. pdf (last accessed 22 October 2008); http://www. aiche. org/uploadedFiles/IFS/Forum/Uploads/Automating_Sustainability_Metrics. pdf (last accessed 22 October 2008).
4 IChemE ( 2003 ) The Sustainability Metrics , The Institution of Chemical Engineers , Rugby, UK . http://www.
References 47
icheme. org/sustainability/metrics. pdf (last accessed 22 October 2008).
5 Curzons , A.D. , Constable , D.J.C. , Mortimer , D.N. , and Cunningham , V.L. ( 2001 ) Green Chem. , 3 , 1 – 6 .
6 Constable , D.J.C. , Curzons , A.D. , and Cunningham , V.L. ( 2002 ) Green Chem. , 4 , 521 – 527 .
7 Jim é nez - Gonz á lez , C. , Curzons , A.D. , Constable , D.J.C. , Overcash , M.R. , and Cunningham , V.L. ( 2001 ) Clean Prod. Process , 3 , 35 – 41 .
8 Jim é nez - Gonz á lez , C. , Constable , D.J.C. , Curzons , A.D. , and Cunningham , V.L. ( 2002 ) Clean Technol. Environ. Policy , 4 , 44 – 53 .
9 Jim é nez - Gonz á lez , C. , Curzons , A.D. , Constable , D.J.C. , and Cunningham , V.L. ( 2004 ) Int. J. LCA , 9 ( 2 ), 114 – 121 .
10 Butters , M. , Catterick , D. , Craig , A. , Curzons , A.D. , Dale , D. , Gillmore , A. , Green , S.P. , Marziano , I. , Sherlock , J. - P. , and White , W. ( 2006 ) Chem. Rev. , 106 ( 7 ), 3002 – 3027 .
11 Marteel , A.E. , Davies , J.A. , Olson , W.W. , and Abraham , M.A. ( 2003 ) Annu. Rev. Environ. Resour. , 28 , 401 – 428 .
12 Wrisberg , N. , de Haes , H.A.U. , Bilitewski , B. , Bringezu , S. , Bro - Rasmus-sen , F. , Clift , R. , Eder , P. , Ekins , P. , Frischknecht , R. , and Triebswetter , U. ( 2002 ) Analytical Tools for Environmental Design and Management in a Systems Perspective (eds N. Wrisberg , H.A.U. de Haes , U. Triebswetter , P. Eder , and R. Clift ), Kluwer Academic Publishers (Springer) , Dordrecht, The Netherlands , pp. 45 – 73 .
13 Lapkin , A. ( 2006 ) Renewables - Based Technology: Sustainability Assessment (eds J. Dewulf , I.H.V. Langenhove ), John Wiley & Sons, Ltd , Chichester, UK , pp. 39 – 53 .
14 Brunner , N. , and Starkl , M. ( 2004 ) Environ. Impact Assess. Rev. , 24 , 441 – 469 .
15 Heaton , C.A. ( 1995 ) An Introduction to Industrial Chemistry , 3rd edn , Blackie Academic and Professional (Springer) , London, UK .
16 Carson , R. ( 1962 ) Silent Spring , Hamish Hamilton , London, UK .
17 Porteous , A. ( 1992 ) Dictionary of Environmental Science and Technology , John Wiley & Sons, Ltd , Chichester, UK .
18 Dale , B. ( 2003 ) Managing Quality , 4th edn , John Wiley & Sons, Ltd , Oxford, UK .
19 Sheldon , R.A. ( 1992 ) Chem. Ind. (London) , 23 , 903 – 906 Sheldon , R.A. ( 2007 ) Green Chem. , 9 , 1273 – 1283 .
20 Sheldon , R.A. ( 1994 ) Chemtech , 24 , 38 – 47 .
21 ACS Green Chemistry Institute Pharmaceutical Roundtable (20007) Lessons learned through measuring green chemistry performance – the pharmaceutical experience , presentation on website http://portal. acs. org/portal/fi leFetch/C/CTP_005585/pdf/CTP_005585. pdf (last accessed 16 October 2008).
22 Sheldon , R.A. ( 1997 ) J. Chem. Technol. Biotechnol. , 68 , 381 – 388 .
23 Thomas , M. ( 2008 ) Belching Out the Devil: Global Adventures with Coca - Cola , Ebury Press , England .
24 Constable , D.J.C. , Jim é nez - Gonz á lez , C. , and Henderson , R.K. ( 2007 ) Org. Process Res. Dev. , 11 , 133 – 137 .
25 Tucker , J.L. ( 2006 ) Org. Process Res. Dev. , 10 ( 2 ), 315 – 319 .
26 Curzons , A.D. , Constable , D.J.C. , and Cunningham , V.L. ( 1999 ) Clean Prod. Process , 1 , 82 – 90 .
27 Jim é nez - Gonz á lez , C. , Curzons , A.D. , Constable , D.J.C. , and Cunningham , V.L. ( 2005 ) J. Clean Technol. Environ. Policy , 7 , 42 – 50 .
28 Alfonsi , K. , Colberg , J. , Dunn , P.J. , Fevig , T. , Jennings , S. , Johnson , T.A. , Kleine , H.P. , Knight , C. , Nagy , M.A. , Perry , D.A. and Stefaniak , M. ( 2008 ) Green Chem. , 1 , 31 – 36 .
29 ACS GCI Pharmaceutical Roundtable ( 2008 ) Collaboration to deliver a solvent selection guide for the pharmaceutical industry . Presentation at the AIChE Annual Conference , http://aiche. confex. com/aiche/2008/techprogram/P125149. HTM (last accessed 22 October 2008).
30 Kim , S. , and Dale , B. ( 2005 ) Int. J. LCA , 10 ( 2 ), 200 – 210 .
31 Kim , S. , and Dale , B. ( 2006 ) Int. J. LCA , 11 ( 2 ), 117 – 121 .
32 Kl ø verpris , J.H. , Wenzel , H. , and Nielsen , P.H. ( 2008 ) Int. J. LCA , 13 ( 1 ), 13 – 21 .

48 2 Green Chemistry Metrics
33 Henderson , R.K. , Jim é nez - Gonz á lez , C. , Preston , C. , Constable , D.J.C. , and Woodley , J.M. ( 2008 ) Ind. Biotechnol. , 4 ( 2 ), 180 – 192 .
34 Jim é nez - Gonz á lez , C. , and Constable , D.J.C. ( 2008 ) Green Chemistry Metrics , Chapter 7 (eds A. Lapkin and D.J.C. Constable ), John Wiley & Sons, Ltd , Chichester, UK .
35 Jim é nez - Gonz á lez , C. ( 2000 ) Life Cycle Assessment in Pharmaceutical Applications , Ph.D. Thesis, North Carolina State University, Raleigh NC.
36 CALCAS (2006) Coordination Action for innovation in Life Cycle Analysis for Sustainability, a pan - European project, fi nanced by the Sixth Framework Programme of the European Commission . http://www. calcasproject. net/ (last accessed 22 October 2008).
37 ACLCA (2001) American Center for Life Cycle Assessment , http://lcacenter. org/index. html (last accessed 7 December 2008).
38 Azapagic , A. (2007) Carbon Calculations over the Life Cycle of Industrial Activities (CCaLC) , a project to develop a life cycle methodology and decision - support tools for calculation and reduction of carbon footprints of different industrial sectors along complete supply chains. http://innovation. globalwatchonline. com/epicentric_portal/site/Innovation/menuitem. 8e9f93a252aab8e-962c40a108680e1a0/ (last accessed 22 October 2008).
39 UNEP (2001) The Life Cycle Initiative , http://lcinitiative. unep. fr/ (last accessed 7 December 2008).
40 J ö dicke , G. , Zenklusen , O. , Weiden-haupt , A. , and Hungerb ü hler , K. ( 1999 ) J. Clean. Prod. , 7 , 159 – 166 .
41 Conradt , S. ( 2008 ) Life Cycle Assess-ment of a Pharmaceutical Compound , M.Sc. Thesis, ETH - Z ü rich.
42 Curzons , A.D. , Jim é nez - Gonz á lez , C. , Duncan , A.L. , Constable , D.J.C. and Cunningham , V.L. ( 2007 ) Int. J. LCA , 12 ( 4 ), 272 – 280 .
43 Trost , B.M. ( 1991 ) Science , 254 , 1471 – 1477 .
44 Trost , B.M. ( 1995 ) Angew. Chem. Int. Ed. , 34 , 259 – 281 .
45 Li , C. - J. , and Trost , B.M. ( 2008 ) Proc. Natl. Acad. Sci. U. S. A. , 105 , 13197 – 13202 .
46 GlaxoSmithKline (2003) Green Chemistry Guide , GlaxoSmithKline .
47 Slack , N. , Chambers , S. , and Johnson , R. ( 2001 ) Operations Management , 3rd edn , Chapter 11, FT Prentice Hall , UK .
48 Anallou , R. (1993 – 2008) European Chemical Substance Information System (ESIS), Euroean Chemicals Bureau , http://ecb. jrc. ec. europa. eu/esis/ (last accessed 22 October 2008).
49 AIChE ( 1998 ) Dow ’ s Chemical Exposure Index Guide , 1st edn , AIChE , USA .
50 E Ú Council Directive 67/548/EEC ( 1967 ) and its subsequent amendments , http://ecb. jrc. ec. europa. eu/esis/index. php?PGM=cla (last accessed 22 October 2008).
51 Touraud , E. , and Roig , B. (2008) KNAPPE (Knowledge and Need Assessment on Pharmaceutical Products in Environmental Waters) http://www. knappe-eu. org/fi chiers/60-D6.6%20fi nal%20report%20fi nal.pdf (last accessed 4 January 2010).
52 MacKay , D. , Shiu , W.Y. , Ma , K. , and Lee , S.C. ( 2006 ) Handbook of Physical - Chemical Properties and Environmental Fate for Organic Chemicals , 2nd edn , CRC Press , Florida, USA .
53 Cronin , M. , and Livingstone , D. (eds) ( 2004 ) Predicting Chemical Toxicity and Fate , CRC Press , Florida, USA .
54 OECD ( 2001 ) Guidelines for the Testing of Chemicals , 13th Addendum, OECD Publishing , Paris, France .
55 Hurme , M. , Rahman , M. , and Loss , J. ( 2005 ) Prev. Process Ind. , 18 ( 4 – 6 ), 238 – 244 .
56 AIChE ( 1994 ) Dow ’ s Fire & Explosion Index Hazard Classifi cation Guide , 7th edn , AIChE , USA .
57 Stoessel , F. ( 1993 ) Chem. Eng. Prog. , 89 ( 10 ), 68 – 75 .
58 Edwards , D.W. , and Lawrence , D. ( 1993 ) Trans. Inst. Chem. Eng. , 71 , Part B, 252 – 258 .
59 Heikkil ä , A. - M. , Hurme , M. , and J ä rvel ä inen , M. ( 1996 ) Comput. Chem. Eng , 20 , S115 – S120 .

49
3 Solvent Use and Waste Issues C. Stewart Slater , Mariano J. Savelski , William A. Carole , and David J.C. Constable
3.1 Introduction to Solvent Use and Waste Issues
3.1.1 Introduction
The pharmaceutical and fi ne chemical industries produce the majority of their products utilizing batch processes, which often contain multiple reaction and purifi cation steps [1, 2] . Most active pharmaceutical ingredient s ( API s) are pro-duced using liquid phase organic reactions which often require large quantities of different solvents. These solvents are used to facilitate reactions and purifi cation processes to ensure the integrity of intermediates or fi nal products. Depending on the chemical reactions performed and the physical properties of the reactants and products, both the types of solvents and the amounts required can vary widely. Solvents are also used in the pharmaceutical industry for cleaning process equip-ment and for a plethora of analytical instruments employed for process control and quality assurance.
For a typical batch chemical process in the pharmaceutical industry, solvent use can account for as much as 80 – 90% (30% water/60% organic solvents) of the total mass in the process. As solvents comprise the larger fraction of this mass, they are also a major contributor to the overall toxicity potential associated with the process, and most of the spent solvent(s) are recycled or disposed of as waste [3] . Typically, the amount of waste generated from solvents in a pharmaceutical chemi-cal synthetic processing step ranges from 25 to considerably more than 100 kg of solvent per kilogram of API produced [4] . Historically, the generation of solvent waste has usually been due to poor solvent selection and processing ineffi ciencies.
The waste generated by pharmaceutical companies have increased concerns about environmental and human safety. Direct releases of treated solvent wastes, hazardous work conditions, and accidental releases of toxic chemicals into the environment have led to the implementation of many laws and regulations
Green Chemistry in the Pharmaceutical Industry. Edited by Peter J. Dunn, Andrew S. Wells and Michael T. Williams© 2010 WILEY-VCH Verlag GmbH & Co. KGaA, WeinheimISBN: 978-3-527-32418-7
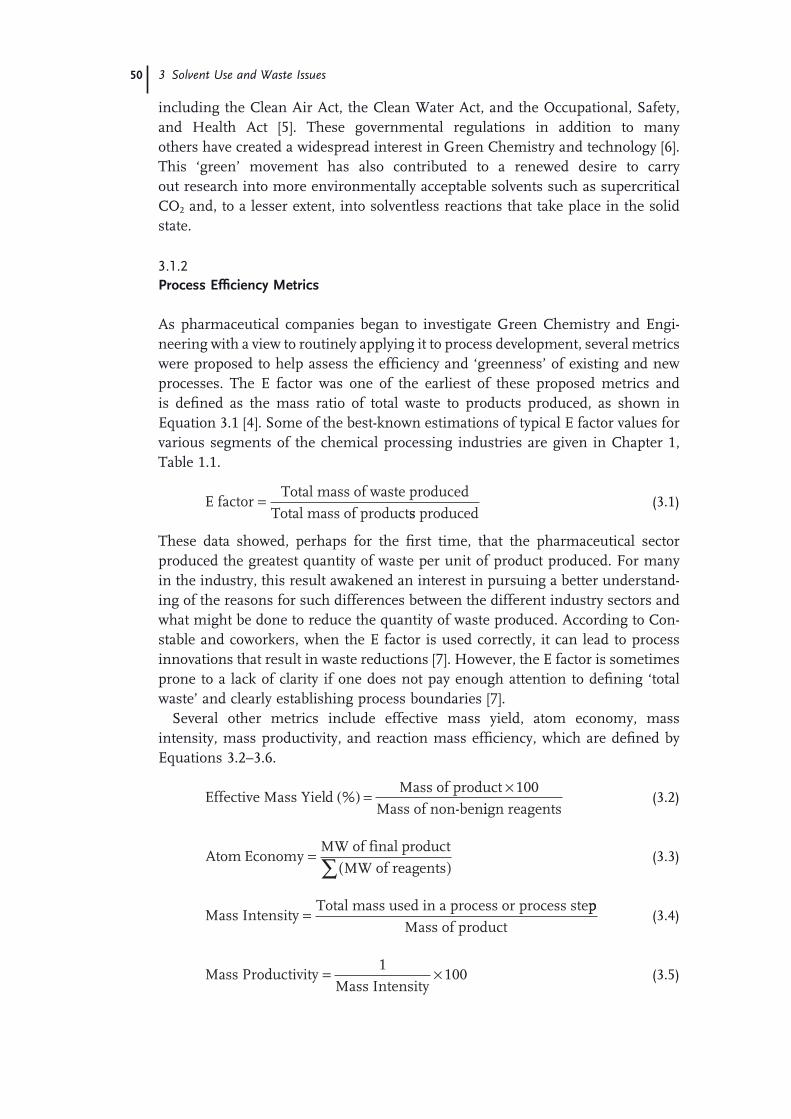
50 3 Solvent Use and Waste Issues
including the Clean Air Act, the Clean Water Act, and the Occupational, Safety, and Health Act [5] . These governmental regulations in addition to many others have created a widespread interest in Green Chemistry and technology [6] . This ‘ green ’ movement has also contributed to a renewed desire to carry out research into more environmentally acceptable solvents such as supercritical CO 2 and, to a lesser extent, into solventless reactions that take place in the solid state.
3.1.2 Process Effi ciency Metrics
As pharmaceutical companies began to investigate Green Chemistry and Engi-neering with a view to routinely applying it to process development, several metrics were proposed to help assess the effi ciency and ‘ greenness ’ of existing and new processes. The E factor was one of the earliest of these proposed metrics and is defi ned as the mass ratio of total waste to products produced, as shown in Equation 3.1 [4] . Some of the best - known estimations of typical E factor values for various segments of the chemical processing industries are given in Chapter 1 , Table 1.1 .
E factorTotal mass of waste produced
Total mass of product=
ss produced (3.1)
These data showed, perhaps for the fi rst time, that the pharmaceutical sector produced the greatest quantity of waste per unit of product produced. For many in the industry, this result awakened an interest in pursuing a better understand-ing of the reasons for such differences between the different industry sectors and what might be done to reduce the quantity of waste produced. According to Con-stable and coworkers, when the E factor is used correctly, it can lead to process innovations that result in waste reductions [7] . However, the E factor is sometimes prone to a lack of clarity if one does not pay enough attention to defi ning ‘ total waste ’ and clearly establishing process boundaries [7] .
Several other metrics include effective mass yield, atom economy, mass intensity, mass productivity, and reaction mass effi ciency, which are defi ned by Equations 3.2 – 3.6 .
Effective Mass YieldMass of product
Mass of non-ben%( ) =
× 100
iign reagents (3.2)
Atom EconomyMW of final product
MW of reagents=
( )∑ (3.3)
Mass IntensityTotal mass used in a process or process ste
=pp
Mass of product (3.4)
Mass ProductivityMass Intensity
= ×1
100 (3.5)
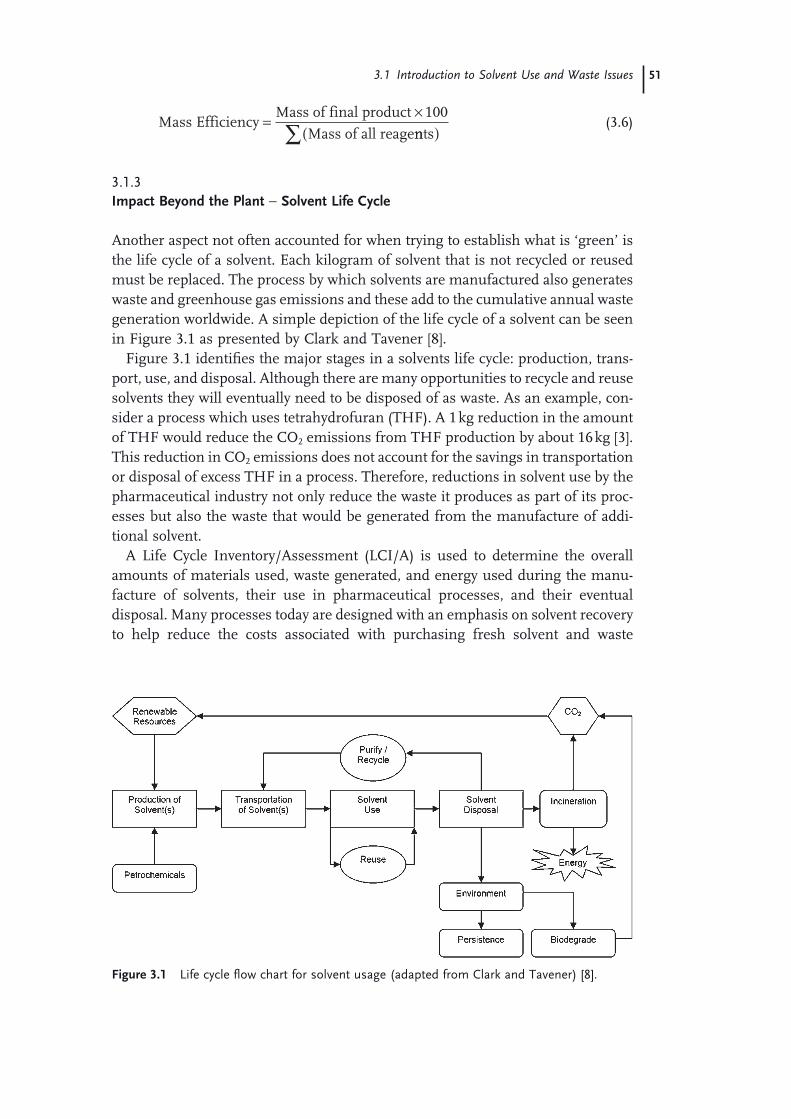
3.1 Introduction to Solvent Use and Waste Issues 51
Mass EfficiencyMass of final product
Mass of all reage=
× 100
nnts( )∑ (3.6)
3.1.3 Impact Beyond the Plant − Solvent Life Cycle
Another aspect not often accounted for when trying to establish what is ‘ green ’ is the life cycle of a solvent. Each kilogram of solvent that is not recycled or reused must be replaced. The process by which solvents are manufactured also generates waste and greenhouse gas emissions and these add to the cumulative annual waste generation worldwide. A simple depiction of the life cycle of a solvent can be seen in Figure 3.1 as presented by Clark and Tavener [8] .
Figure 3.1 identifi es the major stages in a solvents life cycle: production, trans-port, use, and disposal. Although there are many opportunities to recycle and reuse solvents they will eventually need to be disposed of as waste. As an example, con-sider a process which uses tetrahydrofuran ( THF ). A 1 kg reduction in the amount of THF would reduce the CO 2 emissions from THF production by about 16 kg [3] . This reduction in CO 2 emissions does not account for the savings in transportation or disposal of excess THF in a process. Therefore, reductions in solvent use by the pharmaceutical industry not only reduce the waste it produces as part of its proc-esses but also the waste that would be generated from the manufacture of addi-tional solvent.
A Life Cycle Inventory/Assessment ( LCI/A ) is used to determine the overall amounts of materials used, waste generated, and energy used during the manu-facture of solvents, their use in pharmaceutical processes, and their eventual disposal. Many processes today are designed with an emphasis on solvent recovery to help reduce the costs associated with purchasing fresh solvent and waste
Figure 3.1 Life cycle fl ow chart for solvent usage (adapted from Clark and Tavener) [8] .
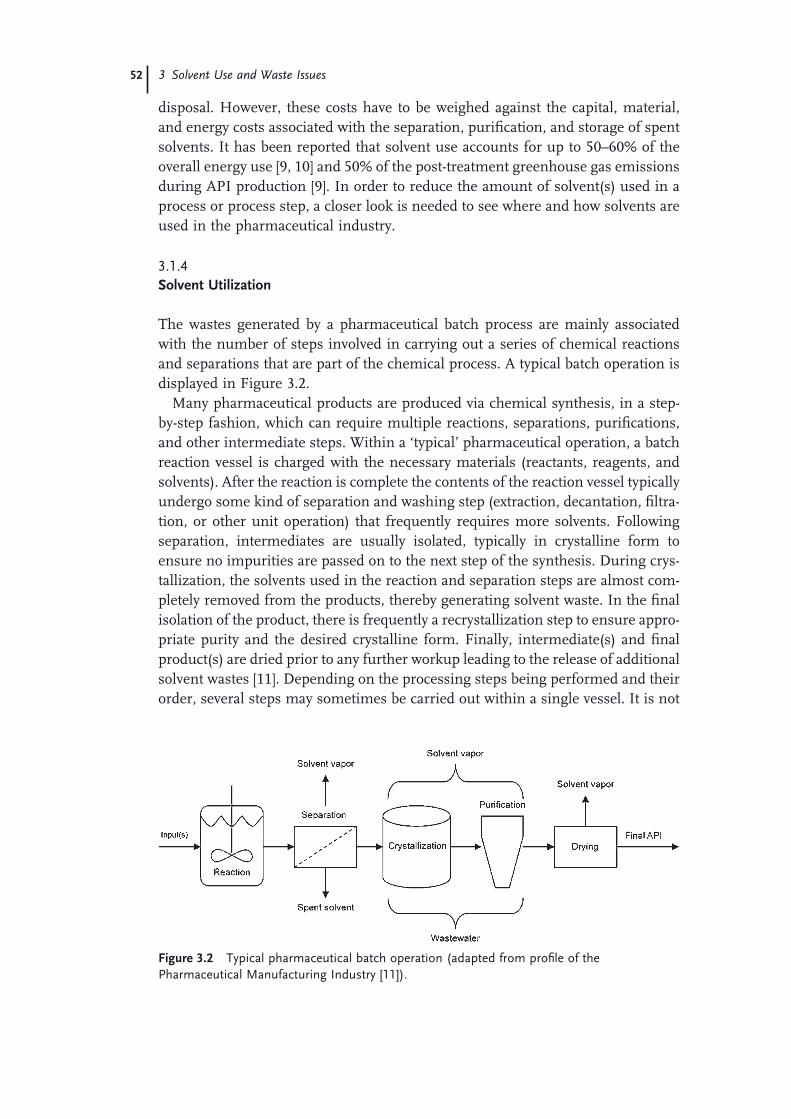
52 3 Solvent Use and Waste Issues
Figure 3.2 Typical pharmaceutical batch operation ( adapted from profi le of the Pharmaceutical Manufacturing Industry [11] ).
disposal. However, these costs have to be weighed against the capital, material, and energy costs associated with the separation, purifi cation, and storage of spent solvents. It has been reported that solvent use accounts for up to 50 – 60% of the overall energy use [9, 10] and 50% of the post - treatment greenhouse gas emissions during API production [9] . In order to reduce the amount of solvent(s) used in a process or process step, a closer look is needed to see where and how solvents are used in the pharmaceutical industry.
3.1.4 Solvent Utilization
The wastes generated by a pharmaceutical batch process are mainly associated with the number of steps involved in carrying out a series of chemical reactions and separations that are part of the chemical process. A typical batch operation is displayed in Figure 3.2 .
Many pharmaceutical products are produced via chemical synthesis, in a step - by - step fashion, which can require multiple reactions, separations, purifi cations, and other intermediate steps. Within a ‘ typical ’ pharmaceutical operation, a batch reaction vessel is charged with the necessary materials (reactants, reagents, and solvents). After the reaction is complete the contents of the reaction vessel typically undergo some kind of separation and washing step (extraction, decantation, fi ltra-tion, or other unit operation) that frequently requires more solvents. Following separation, intermediates are usually isolated, typically in crystalline form to ensure no impurities are passed on to the next step of the synthesis. During crys-tallization, the solvents used in the reaction and separation steps are almost com-pletely removed from the products, thereby generating solvent waste. In the fi nal isolation of the product, there is frequently a recrystallization step to ensure appro-priate purity and the desired crystalline form. Finally, intermediate(s) and fi nal product(s) are dried prior to any further workup leading to the release of additional solvent wastes [11] . Depending on the processing steps being performed and their order, several steps may sometimes be carried out within a single vessel. It is not

3.1 Introduction to Solvent Use and Waste Issues 53
uncommon for reaction vessels to be used not only for reactions, but also for extractions, distillations, and crystallizations [12] . Each step produces different amounts of liquid and vapor solvent waste, in addition to wastewater that may contain solvents, intermediates, APIs, and other unconverted reactants.
The API must then be formulated into the fi nal drug product ( DP ). The phar-maceutical industry does not report as many issues with solvent usage and wastes during DP manufacturing as it does in API manufacturing processes. According to Constable, formulation processes at GSK for oral solid dose formulations are often very mass effi cient, with reported API yields greater than 92% (D. Constable, private communication). Common formulations include compressed solids (tablets), uncompressed solids (capsules), and liquid formulations. The most common form of solid medication taken today is tablets, which are usually manufactured by direct compression, dry granulation, or a wet granulation process. A simple schematic of a wet granulation tableting process can be viewed in Figure 3.3 [11] .
During wet granulation, the powdered API is mixed with one or more excipients and wetted. Excipients are additives such as fi llers (dilutants), binders, disinte-grants, and lubricants. These are added for several reasons, for example, to help tablets break up after ingestion or to improve the ease of manufacture [11, 13] . Following the compression of the tablet, a coating is often added to control dissolu-tion, hide unpleasant tastes, or to give a desired appearance. Solvent - and aqueous - based coatings were frequently used in the past; however, solvent - based coatings are very rarely used now, and there are only a few cases in which aqueous - based coatings cannot be used (D. Constable, private communication). As excipients and coatings are added with the intention of their being consumed by the patient, they are not harmful to humans or the environment when they are used or disposed of. Therefore, in general, wastes from formulation processes are of less concern to pharmaceutical companies when compared to those generated during API manufacture.
Process ineffi ciencies also lead to large amounts of solvent waste, and since purchasing and disposing of solvents can be expensive it is desirable to recover and reuse them whenever possible. However, after a drug has been approved by the Food and Drug Administration ( FDA ) there is a perception that process modi-fi cations, including those that incorporate widespread green improvements, are diffi cult and expensive to implement (see below) [14] . Despite these challenges,
Figure 3.3 Wet granulation tableting method.
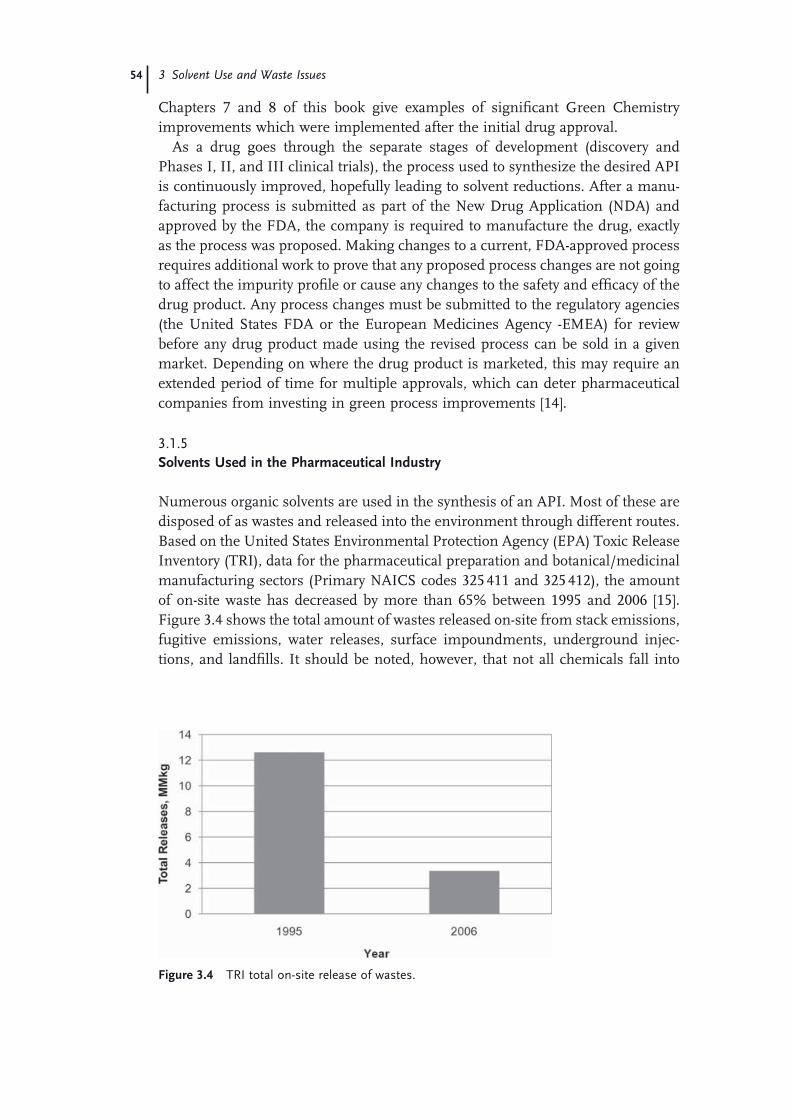
54 3 Solvent Use and Waste Issues
Chapters 7 and 8 of this book give examples of signifi cant Green Chemistry improvements which were implemented after the initial drug approval.
As a drug goes through the separate stages of development (discovery and Phases I, II, and III clinical trials), the process used to synthesize the desired API is continuously improved, hopefully leading to solvent reductions. After a manu-facturing process is submitted as part of the New Drug Application ( NDA ) and approved by the FDA, the company is required to manufacture the drug, exactly as the process was proposed. Making changes to a current, FDA - approved process requires additional work to prove that any proposed process changes are not going to affect the impurity profi le or cause any changes to the safety and effi cacy of the drug product. Any process changes must be submitted to the regulatory agencies (the United States FDA or the European Medicines Agency - EMEA) for review before any drug product made using the revised process can be sold in a given market. Depending on where the drug product is marketed, this may require an extended period of time for multiple approvals, which can deter pharmaceutical companies from investing in green process improvements [14] .
3.1.5 Solvents Used in the Pharmaceutical Industry
Numerous organic solvents are used in the synthesis of an API. Most of these are disposed of as wastes and released into the environment through different routes. Based on the United States Environmental Protection Agency ( EPA ) Toxic Release Inventory (TRI), data for the pharmaceutical preparation and botanical/medicinal manufacturing sectors (Primary NAICS codes 325 411 and 325 412), the amount of on - site waste has decreased by more than 65% between 1995 and 2006 [15] . Figure 3.4 shows the total amount of wastes released on - site from stack emissions, fugitive emissions, water releases, surface impoundments, underground injec-tions, and landfi lls. It should be noted, however, that not all chemicals fall into
Figure 3.4 TRI total on - site release of wastes.
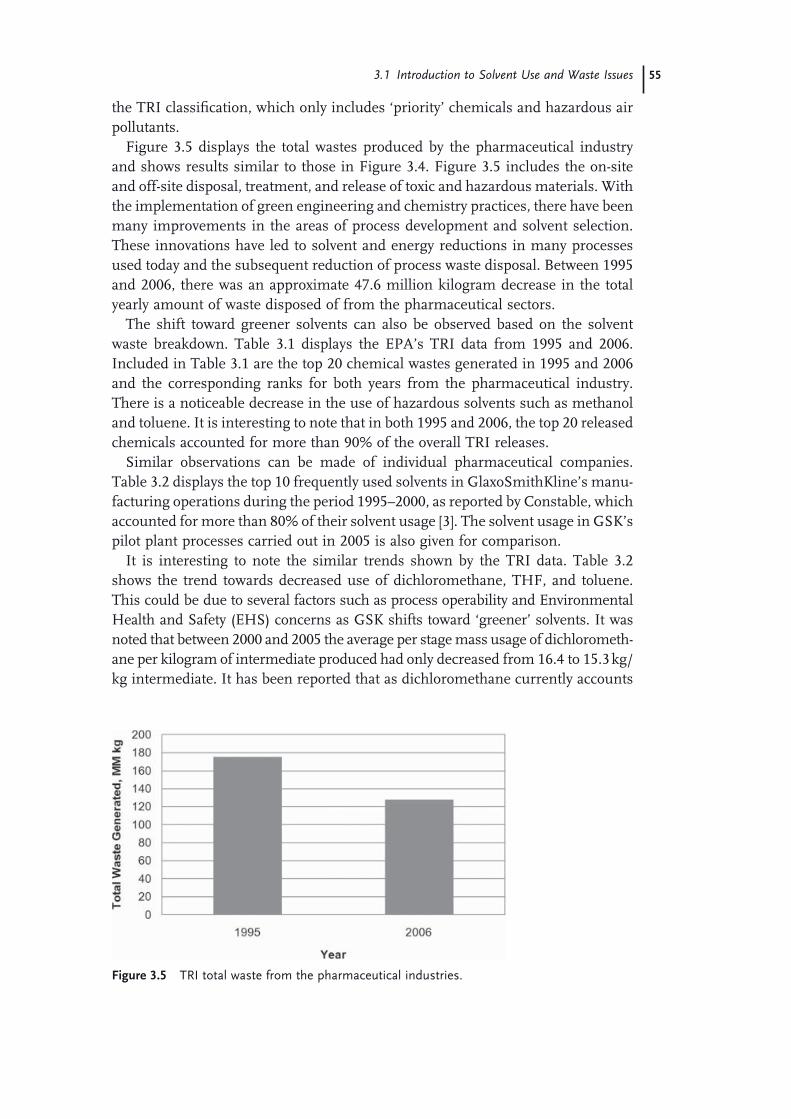
3.1 Introduction to Solvent Use and Waste Issues 55
the TRI classifi cation, which only includes ‘ priority ’ chemicals and hazardous air pollutants.
Figure 3.5 displays the total wastes produced by the pharmaceutical industry and shows results similar to those in Figure 3.4 . Figure 3.5 includes the on - site and off - site disposal, treatment, and release of toxic and hazardous materials. With the implementation of green engineering and chemistry practices, there have been many improvements in the areas of process development and solvent selection. These innovations have led to solvent and energy reductions in many processes used today and the subsequent reduction of process waste disposal. Between 1995 and 2006, there was an approximate 47.6 million kilogram decrease in the total yearly amount of waste disposed of from the pharmaceutical sectors.
The shift toward greener solvents can also be observed based on the solvent waste breakdown. Table 3.1 displays the EPA ’ s TRI data from 1995 and 2006. Included in Table 3.1 are the top 20 chemical wastes generated in 1995 and 2006 and the corresponding ranks for both years from the pharmaceutical industry. There is a noticeable decrease in the use of hazardous solvents such as methanol and toluene. It is interesting to note that in both 1995 and 2006, the top 20 released chemicals accounted for more than 90% of the overall TRI releases.
Similar observations can be made of individual pharmaceutical companies. Table 3.2 displays the top 10 frequently used solvents in GlaxoSmithKline ’ s manu-facturing operations during the period 1995 – 2000, as reported by Constable, which accounted for more than 80% of their solvent usage [3] . The solvent usage in GSK ’ s pilot plant processes carried out in 2005 is also given for comparison.
It is interesting to note the similar trends shown by the TRI data. Table 3.2 shows the trend towards decreased use of dichloromethane, THF, and toluene. This could be due to several factors such as process operability and Environmental Health and Safety ( EHS ) concerns as GSK shifts toward ‘ greener ’ solvents. It was noted that between 2000 and 2005 the average per stage mass usage of dichlorometh-ane per kilogram of intermediate produced had only decreased from 16.4 to 15.3 kg/kg intermediate. It has been reported that as dichloromethane currently accounts
Figure 3.5 TRI total waste from the pharmaceutical industries.

56 3 Solvent Use and Waste Issues
Table 3.2 Comparison of solvent use at GSK based on overall manufacturing operations (1995 – 2000) and more recent pilot plant operations (2005) ( adapted from Ref. [3] ).
Chemical GSK pilot plant processes (2005 rank)
GSK manufacturing processes (1995 – 2000 rank)
2 - Propanol 1 5 Ethyl acetate 2 4 Methanol 3 6 Denatured ethanol 4 8 n - Heptane 5 12 Tetrahydrofuran 6 2 Toluene 7 1 Dichloromethane 8 3 Acetic acid 9 11 Acetonitrile 10 14
Table 3.1 Top 20 chemical wastes generated by the pharmaceutical and medicinal/botanical sectors according to the United States EPA TRI from 1995 and 2006.
Chemical 1995 2006
Rank Amount generated (10 6 kg y − 1 )
Rank Amount generated (10 6 kg y − 1 )
Methanol 1 62.5 1 44.8 Dichloromethane 2 21.0 2 22.3 Toluene 3 20.0 3 12.1 Acetonitrile 6 7.39 4 7.90 Hydrochloric acid 4 17.4 5 7.03 Nitrate compounds 12 1.99 6 5.21 Chloroform 21 0.61 7 3.71 n - Hexane 11 2.30 8 2.99 n - Butyl alcohol 13 1.53 9 2.86 N,N - dimethylformamide 8 4.60 10 2.79 Formic acid 9 3.24 11 2.42 N - Methyl - 2 - pyrrolidone 36 0.17 12 2.02 Xylene (mixed isomers) 16 1.27 13 1.47 Arsenic compounds 83 0.004 14 1.26 1,1,2 - Trichloroethane n/a 0.00 15 1.23 Methyl tert . - butyl ether 19 0.77 16 1.20 Ammonia 7 6.27 17 1.01 Ethylene glycol 18 0.90 18 0.82 Sulfuric acid 5 8.79 19 0.71 Certain glycol ethers 31 0.28 20 0.63 Total (top 20 in 2006) 161 124 Total (for all TRI chemicals) 175 128

3.1 Introduction to Solvent Use and Waste Issues 57
for more than 70% of the mass of materials of concern in GSK processes, large decreases in the total solvent use are not expected without alternative solvents or improved processes. Overall, GSK has reported a 20% reduction in total solvent use between 2000 and 2005 (from 94 to 74 kg solvent /kg API, based on an average 7 steps in any GSK process [3] ). This reduction was primarily due to the elimina-tion of DCM from many processes (D.J.C. Constable, private communication).
The issues of waste generation and disposal in the United States are also being addressed at State level. According to a 2002 California EPA report of various pharmaceutical/medicinal companies in California, approximately 73% of the total waste generated comes from pharmaceutical preparation facilities. The next largest contributor was from biological products, which accounted for 24% of the total waste generated in 2002. This is interesting to note, as there are a large number of biotechnology companies in California. The remaining 3% was generated by medicinal and diagnostic companies. It was estimated that the total amount of hazardous waste generated from these facilities doubled from 1998 to 2002. This was reportedly due to the rapid expansion and construction of new pharmaceutical companies and production increases in current facilities. However, as a result of source reductions throughout the state, approximately 1.4 × 10 6 kg (3.1 × 10 6 lbs) per year of waste generation was avoided over the same time period [16] . Therefore, although the pharmaceutical industry is still growing, the implementation of Green Chemistry and engineering can slow the rate of waste generation resulting from process scale - ups and new pharmaceutical facilities.
3.1.6 Solvent Use in Process Development
As the development of synthetic routes to drugs progresses from laboratory scale medicinal chemistry (discovery) to its fi nal chemical route, the amount, type, and number of solvents used, and the waste generated decrease signifi cantly. During the early stages of drug development, most emphasis is on producing enough API of required purity for pre - clinical work and early clinical trials. Process optimiza-tion and solvent selection at this stage are of little importance as the number of drug candidates that fail to pass these early stages is quite high [17] . During early pre - clinical work extremely small amounts of API are produced ( < 1 g) and proc-esses are highly ineffi cient. Often column chromatography, which in general uses solvent ineffi ciently on a small scale, is used to obtain milligram quantities of pure APIs. Depending on the solvent selected and the type of impurities associated with the API synthesis, the amount of solvent(s) required for reactions, separation, and purifi cation can vary widely. As a process is scaled up to the kilo scale and later to the pilot plant scale ( > 100 kg), there continue to be incremental reductions in the overall amount of solvent used, and frequently toxic solvents are replaced by less toxic solvents or are removed entirely. Process optimizations lead to fewer processing steps and washes, while at the same time increasing yield and main-taining an API ’ s impurity profi le [1] . It has been reported that as a drug proceeds from discovery to manufacturing the number of steps can decrease signifi cantly, and therefore the amounts of solvents used and waste generated are reduced.
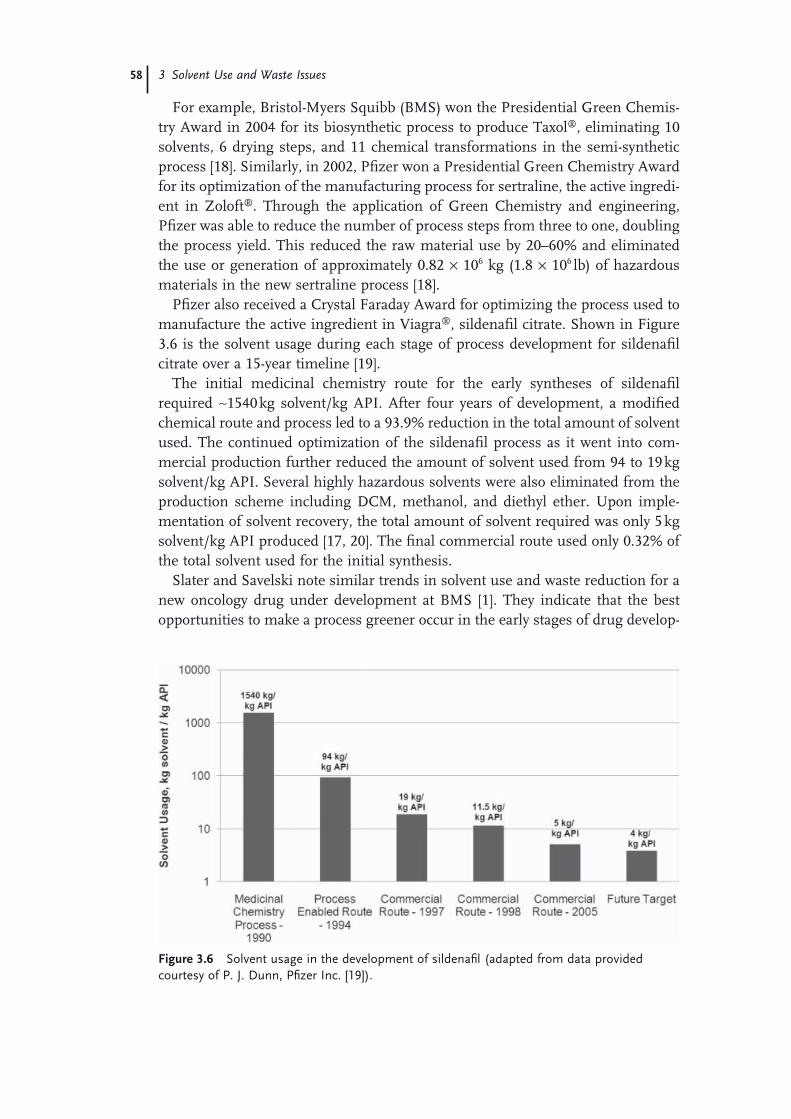
58 3 Solvent Use and Waste Issues
For example, Bristol - Myers Squibb ( BMS ) won the Presidential Green Chemis-try Award in 2004 for its biosynthetic process to produce Taxol ® , eliminating 10 solvents, 6 drying steps, and 11 chemical transformations in the semi - synthetic process [18] . Similarly, in 2002, Pfi zer won a Presidential Green Chemistry Award for its optimization of the manufacturing process for sertraline, the active ingredi-ent in Zoloft ® . Through the application of Green Chemistry and engineering, Pfi zer was able to reduce the number of process steps from three to one, doubling the process yield. This reduced the raw material use by 20 – 60% and eliminated the use or generation of approximately 0.82 × 10 6 kg (1.8 × 10 6 lb) of hazardous materials in the new sertraline process [18] .
Pfi zer also received a Crystal Faraday Award for optimizing the process used to manufacture the active ingredient in Viagra ® , sildenafi l citrate. Shown in Figure 3.6 is the solvent usage during each stage of process development for sildenafi l citrate over a 15 - year timeline [19] .
The initial medicinal chemistry route for the early syntheses of sildenafi l required ∼ 1540 kg solvent/kg API. After four years of development, a modifi ed chemical route and process led to a 93.9% reduction in the total amount of solvent used. The continued optimization of the sildenafi l process as it went into com-mercial production further reduced the amount of solvent used from 94 to 19 kg solvent/kg API. Several highly hazardous solvents were also eliminated from the production scheme including DCM, methanol, and diethyl ether. Upon imple-mentation of solvent recovery, the total amount of solvent required was only 5 kg solvent/kg API produced [17, 20] . The fi nal commercial route used only 0.32% of the total solvent used for the initial synthesis.
Slater and Savelski note similar trends in solvent use and waste reduction for a new oncology drug under development at BMS [1] . They indicate that the best opportunities to make a process greener occur in the early stages of drug develop-
Figure 3.6 Solvent usage in the development of sildenafi l ( adapted from data provided courtesy of P. J. Dunn, Pfi zer Inc. [19] ).
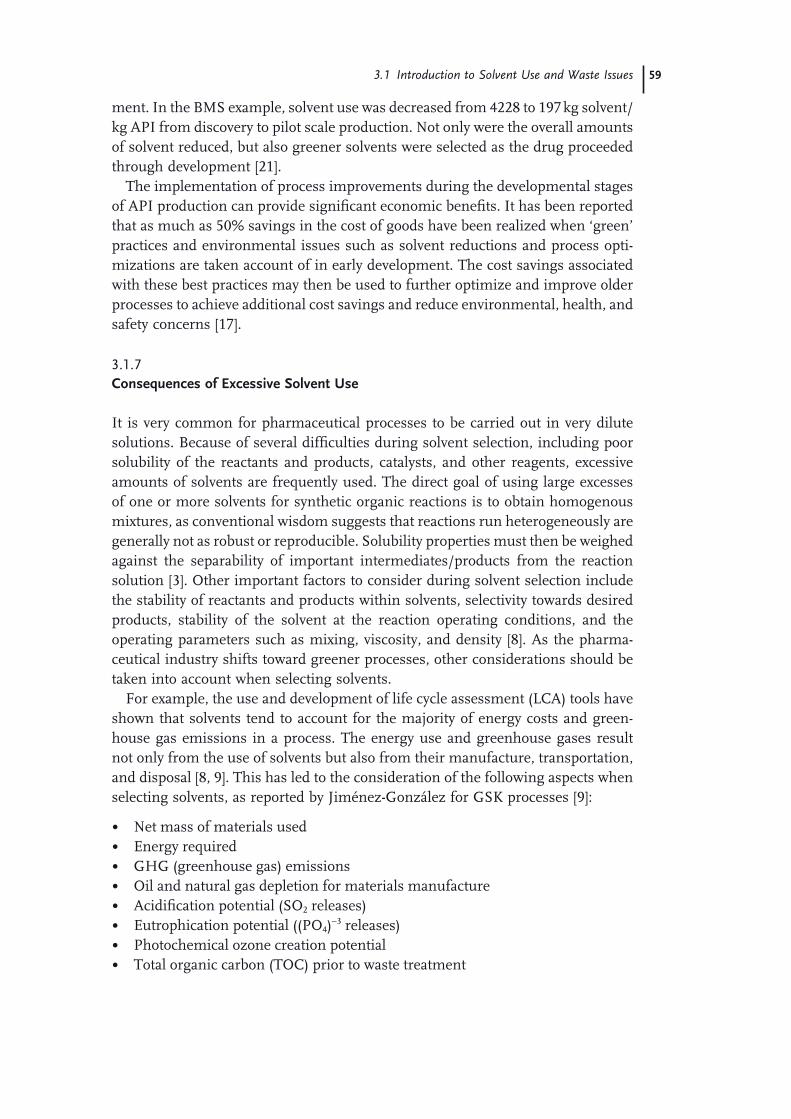
3.1 Introduction to Solvent Use and Waste Issues 59
ment. In the BMS example, solvent use was decreased from 4228 to 197 kg solvent/kg API from discovery to pilot scale production. Not only were the overall amounts of solvent reduced, but also greener solvents were selected as the drug proceeded through development [21] .
The implementation of process improvements during the developmental stages of API production can provide signifi cant economic benefi ts. It has been reported that as much as 50% savings in the cost of goods have been realized when ‘ green ’ practices and environmental issues such as solvent reductions and process opti-mizations are taken account of in early development. The cost savings associated with these best practices may then be used to further optimize and improve older processes to achieve additional cost savings and reduce environmental, health, and safety concerns [17] .
3.1.7 Consequences of Excessive Solvent Use
It is very common for pharmaceutical processes to be carried out in very dilute solutions. Because of several diffi culties during solvent selection, including poor solubility of the reactants and products, catalysts, and other reagents, excessive amounts of solvents are frequently used. The direct goal of using large excesses of one or more solvents for synthetic organic reactions is to obtain homogenous mixtures, as conventional wisdom suggests that reactions run heterogeneously are generally not as robust or reproducible. Solubility properties must then be weighed against the separability of important intermediates/products from the reaction solution [3] . Other important factors to consider during solvent selection include the stability of reactants and products within solvents, selectivity towards desired products, stability of the solvent at the reaction operating conditions, and the operating parameters such as mixing, viscosity, and density [8] . As the pharma-ceutical industry shifts toward greener processes, other considerations should be taken into account when selecting solvents.
For example, the use and development of life cycle assessment (LCA) tools have shown that solvents tend to account for the majority of energy costs and green-house gas emissions in a process. The energy use and greenhouse gases result not only from the use of solvents but also from their manufacture, transportation, and disposal [8, 9] . This has led to the consideration of the following aspects when selecting solvents, as reported by Jim é nez - Gonz á lez for GSK processes [9] :
• Net mass of materials used • Energy required • GHG ( greenhouse gas ) emissions • Oil and natural gas depletion for materials manufacture • Acidifi cation potential (SO 2 releases) • Eutrophication potential ((PO 4 ) − 3 releases) • Photochemical ozone creation potential • Total organic carbon ( TOC ) prior to waste treatment
60 3 Solvent Use and Waste Issues
As previously mentioned, solvent use tends to account for the majority of reaction mass (80 – 90%) and energy use ( ∼ 60%). The 60% energy use does not include the manufacture of the solvent, just the in - process energy use. When considering the waste generated and the cumulative energy use throughout a solvent ’ s life cycle, excessive solvent use is a major contributor to a pharmaceutical company ’ s ‘ carbon footprint ’ . The disposal of excessive solvent waste then further contributes to the release of greenhouse gases and other emissions. It has been estimated that incin-eration alone creates 6.7 kg CO 2 /kg organic carbon treated [22] .
Purchasing excessive solvent increases raw material costs as well as waste treat-ment costs for the disposal of these solvents. Waste treatment in particular can be quite costly depending on the quantity and type of waste. It has been estimated that as much as 10 – 35% of the total plant investment is consumed during the handling, storage, and treatment of waste streams [23] . According to Lee - Jeffs and Constable, the most common waste disposal method in the pharmaceutical indus-try today is incineration, which can cost from three to six dollars per gallon of organics treated (A. Lee - Jeffs, private communication; D.J.C. Constable, private communication). The cost to purchase fresh solvents can also be very expensive. Table 3.3 gives the price range of three common solvents that are contained in the top 10 TRI in 2006 (shown in Table 3.1 ). The prices in Table 3.3 vary based on the method of transport, the quantity purchased, and the cost of manufacture.
As an example, consider the cost of methanol. Based on Table 3.3 [24] , the average cost per kilogram of methanol as of February of 2008 was $2.77. In 2006, approximately 45 million kilograms of methanol were disposed as waste. Assum-ing a negligible change in the price of methanol since 2006, the cost to purchase the 45 million kilograms of methanol which were disposed of was $124.7 million. Assuming that 70% of the methanol was disposed of via incineration at an average $4.5 per gallon, the cost to dispose of the methanol would be approximately $47.3 million. The cost to purchase and treat just methanol in 2006 was therefore ∼ $172 million. Thus, the high cost of solvents and their treatment can be a large driving force for pharmaceutical companies to reduce solvent waste and usage.
EHS considerations must also be taken into account when selecting solvents. In previous years, it was very common for synthetic chemists to design processes which utilized highly hazardous and carcinogenic solvents such as benzene,
Table 3.3 US market price for solvents as of Feb. 8, 2008 (based on report from ICIS Pricing) [24] .
Solvent Price range (USD kg − 1 )
Methanol 2.55 – 2.99 Dichloromethane 4.16 – 5.87 Toluene 4.31 – 4.49
3.1 Introduction to Solvent Use and Waste Issues 61
carbon tetrachloride, and chloroform [8] . Other toxic solvents still in use today include dichloromethane, methanol, and N,N - dimethylformamide, as shown in Table 3.1 . Although the pharmaceutical industry has made attempts to reduce or eliminate hazardous solvents through process optimizations and alternative sol-vents, it can be a challenging task. Alternative solvents are usually chosen to replace toxic, volatile solvents and thereby reduce potential EHS impacts from accidental releases during their handling, use, and disposal [8] . For example, alternative solvents for dichloromethane have been researched by many pharma-ceutical companies. However, there are still some who would argue that it is greener to maintain the use of chlorinated solvents, like dichloromethane, if it reduces the total amount of solvent required [3] . It can therefore be quite diffi cult to fi nd suitable replacements for many hazardous solvents depending on what is considered when selecting an alternative solvent.
3.1.8 Waste Management Practices in the U nited S tates
Good engineering practice is to design chemical processes with an emphasis on recovering and reusing spent solvents [8] . However, not all solvents will be recov-ered, and these will eventually need to be disposed. When disposing of solvent waste, there are several factors which must be considered to determine the appro-priate waste treatment or disposal method. Some of these factors include the cost of disposal methods, overall toxicity of the waste, and environmental impact in the case of accidental and intentional releases.
Common methods of on - site solvent waste disposal in the United States involve direct releases into the environment. In the case of on - site releases, the emissions are usually pre - treated via scrubbers and incinerators or involve the direct release of solvents which do not pose long term environmental, health, and safety risks. These include stack and fugitive emissions to the air, direct releases to water (rivers, lakes), and releases to land (landfi lls, surface impoundments). Another solvent disposal method is the injection of solvent wastes underground. Under-ground injections involve the release of hazardous liquid wastes into the earth, usually below the lowest available source of underground drinking water. There are instances in which certain wastes are injected above underground sources of drinking water, and until recently no distinction was made between the two. This is interesting as the two methods pose different environmental risks [11] . In the United States, underground injection disposal is typically regulated by an EPA permit.
The breakdown of on - site waste disposal practices from the United States phar-maceutical industry in 1995 and 2006 is shown in Table 3.4 . Table 3.5 displays some of the commonly used solvents in the pharmaceutical industry and the amount of each directly released on - site in 1995 and 2006. As shown in Table 3.4 , in 1995 the majority of on - site releases were due to stack emissions. By 2006 the amount of fugitive, stack, and water releases decreased signifi cantly, whereas the amount of wastes injected underground remained the same. This suggests that

62 3 Solvent Use and Waste Issues
pharmaceutical companies have worked to reduce releases to land and water where solvent wastes could potentially impact humans and other organisms in the envi-ronment. However, underground injections involve the placement of solvent waste under the earth ’ s surface, removing the direct contact of potentially toxic sub-stances from the surface environment. This could be one reason why there has been no change in the amount of solvent wastes injected underground in the past decade, but it is more likely a refl ection of the relative cost of waste disposal and treatment.
Off - site waste disposal methods involve the transfer of solvent wastes to an alternative location before their treatment, reuse, or release into the environment. One such method commonly used both on - and off - site is incineration. Solvent wastes are often incinerated, especially when they contain toxic substances and pose long - term EHS risks if directly released. The process of waste incineration releases a large amount of CO 2 into the environment, but often the heat generated from this process may be recovered for use within a plant. When contaminated
Table 3.4 TRI on - site releases in 1995 and 2006.
Method of release Amount released (10 6 kg)
1995 2006
Fugitive emissions 3.0 0.5 Stack emissions 5.3 0.7 Water releases 2.3 0.5 Underground injections 1.7 1.7 Landfi lls 4.5 × 10 − 4 1.6 × 10 − 4 Other 0.2 1.1 × 10 − 2 Total 12.6 3.4
Table 3.5 Common solvents and release amounts in 1995 and 2006.
Chemical Amount released (10 6 kg)
1995 2006
Methanol 3.3 1.8 Dichloromethane 3.2 0.2 Ammonia 1.4 0.1 Toluene 0.6 0.1 N,N - dimethylformamide 0.5 0.2 Acetonitrile 0.3 0.1 n - Hexane 0.2 0.1

3.1 Introduction to Solvent Use and Waste Issues 63
and halogenated solvents are incinerated, there is often a solid residue that remains that must be further treated before being released to the environment [8] . Publicly Owned Treatments Work s ( POTW ) facilities are also frequently used to treat wastewater contaminated with small amounts of organic impurities. However, some TRI chemicals cannot be treated by a POTW because of their nature. Solvent wastes are also often sent for off - site purifi cation or reuse within other manufac-turing facilities [11] . Figure 3.7 shows a comparison of the amounts of solvent wastes disposed via on - and off - site release and treatment methods.
As shown in Figure 3.7 , since 1995 there has been a large reduction in the amount of solvent wastes directly released, treated, and used for energy recovery on - site. There have also been moderate reductions in the amount of wastes used for energy recovery and treatment off - site. However, there were increases in every other form of on - and off - site waste treatment. In 2006, about 70% of solvent waste was treated for disposal or recycled. The remaining 30% was either directly released or treated for energy recovery. The fractions of solvent wastes treated and recycled are very close to the values reported earlier by Lee - Jeffs and Constable in 2008 (A. Lee - Jeffs, private communication; D.J.C. Constable, private communication). This shows an increasing trend in the amount of solvents recycled in order to reduce
Figure 3.7 Comparison of on - and off - site treatment methods based on TRI data [15] .
64 3 Solvent Use and Waste Issues
the amount of solvent wastes released or treated. As the pharmaceutical industry continues to incorporate Green Chemistry and engineering practices, the recovery rate of solvents is expected to increase, thereby reducing the amount of solvents used and the wastes generated.
3.2 Solvent and Process Greenness Scoring and Selection Tools
3.2.1 Review of Solvent and Process Scoring Methods
The overall reduction and selection of greener solvents is a key goal as the phar-maceutical industry examines greener approaches to R & D and manufacturing processes. Beyond the use of simple solvent and waste metrics, various methods have been developed to evaluate the greenness of solvents and processes by aca-demic, industrial, governmental, and non - governmental organization s ( NGO s). Greenness scoring methods are used to measure and rank solvents and processes based on several factors such as EHS impacts, economics, and life cycle analysis. The resulting scores from any one method are typically used comparatively to identify greener alternative solvents and technologies. First, the methods used to evaluate pharmaceutical processes will be discussed. Each method has a means of evaluating either the solvents and/or the mass intensity of a process. As solvents account for most of the mass within a process, even those methods that reduce the number of material streams or total mass will result in a reduction in the amount of solvent used.
3.2.1.1 Greenness Assessment of Pharmaceutical Processes and Technology In the past decade, several methods have been developed which focus on assessing pharmaceutical processes based on ecological, economic, and effi ciency criteria. Heinzl [25] proposed a method to assess pharmaceutical processes as they progress from R & D to manufacturing based on three indices: mass loss, environmental impact, and economics. This method begins with the defi nition of process develop-ment goals after which the mass loss indice s ( MLI s) are calculated. MLIs are calculated for by - product formation, substrate impurities, solvent loss, catalyst loss, and reactant loss. If the MLIs for a process are acceptable, the environmental indice s ( EI s) and cost indice s ( CI s) are calculated. The CIs are calculated using the same indices as those for the MLIs with the addition of a cost factor (price per unit mass). The EIs are evaluated using an A - B - C grading system where the input and output streams are ranked according to environmental impacts such as air and water pollution and synthesis complexity. In this method, grade A is the ‘ greenest ’ rank and C is the least green. All three indices are normalized to a ‘ best case ’ scenario and weighted based on their importance in each category. A com-bination of these indices provides an overall score that can serve as a comparison for alternative processes [25] .
3.2 Solvent and Process Greenness Scoring and Selection Tools 65
A similar method proposed by Hoffmann [26] involves analyzing process alter-natives based on two indices. The total annualized profi t per service unit ( TAPPS ) and material intensity per service unit ( MIPS ) are calculated as economic and environmental factors, respectively. TAPPS is used to calculate the maximum profi t per unit of product produced. MIPS is used to calculate the number of input and output streams in a process. MIPS was used based on the knowledge that a global reduction in material streams (solvents, reactants,) is necessary to lead toward sustainable development. TAPPS and MIPS are determined for several process alternatives, which are analyzed using a Pareto Chart for their feasibility within a plant. However, MIPS does not account for the release of toxic solvents and reagents into the environment. Therefore it has been noted that it should be used in conjunction with LCA and other methods to avoid the use of highly toxic solvents and other raw materials [26] .
Chen and Shonnard [27] proposed a hierarchical approach to environmentally conscious process design ( ECD ), which utilizes multiple software packages. In this method, an integrated software package SCENE (simultaneous comparison of environmental and non - environmental process criteria) is used to evaluate both economic and environmental parameters for a process using DORT (design option ranking tool) and EFRAT (environmental fate and risk assessment tool), respec-tively. DORT is a program used to evaluate several cost elements such as capital costs, raw material (for example, solvents) costs, and operating costs to determine three indices: net present value ( NPV ), payback period ( PP ), and fi xed capital investment ( FCI ). EFRAT is used to measure process environmental impacts such as fi sh and human toxicity, carcinogenic toxicity, global warming, ozone depletion, smog formation, and acid rain potential. The overall economic and environmental indices are then compared to alternative processes based on a user - defi ned optimization objective such as a reduction in solvent waste or the use of less toxic solvents.
BMS developed a method known as the Process Greenness Scorecard. The scorecard ranks processes in sixteen areas such as solvent waste generation, process emissions, by - product formation, the number of isolations, and the types of solvents used. Its primary use is to track the greenness of processes as they develop from R & D to manufacturing. The process variables (by - product formation, yield, emissions) are measured on a one - to - four scale, where four is the greenest score for each. The types of solvents used are categorized on a zero - to - four scale, where four is again the greenest score. The score for each variable is weighted accordingly and summed to achieve a fi nal score with a maximum value of 100. The closer the score is to 100, the greener the process is. Since there are several factors, this scorecard can make it easier to focus on the least green aspects of a process to improve its greenness. This can result in the use of greener solvents, lower process waste, and higher process effi ciencies.
GSK has also developed a number of methodologies to evaluate pharma-ceutical process greenness including a methodology to assess commonly used technology. This methodology is known as the framework for ‘ Clean Technology Guidance ’ and is a four - step, systematic approach toward the evaluation of ‘ green ’

66 3 Solvent Use and Waste Issues
technologies. First, a set of objectives or goals is determined for a given case sce-nario (a comparison of batch, micro - and mini - reactors or different membrane technologies to achieve a given separation). Next, a set of metrics based on energy, environment, safety, and effi ciency parameters are calculated for the technologies that are known to satisfy the specifi ed objectives. The metrics used are based on an LCA approach to obtain a broad view of the various aspects of the technology being evaluated; for example, the life cycle of solvents and other raw materials used. A base case scenario is then formulated to compare available technologies. The technologies are ranked based on their individual scores and a panel of experts evaluates these scores. The role of the evaluation panel is to rank the results of the calculated metrics based on a zero - to - ten scale, 10 being the most green. The assigned scores are then averaged for a fi nal score. This allows for a comparative ranking of alternative technologies, which can also lead to reductions in solvent use and waste, lower costs, and overall greener processes [6, 28] .
A similar approach was taken by Hossain [29] , who developed E - Green, a risk - based environmental assessment approach for chemical processes. This method also uses LCA data, but breaks it down into two halves: the raw material produc-tion and transportation domain and the gate - to - gate domain. The purpose of having two domains is to give an insight into the environmental impacts of each domain separately. Several risk - based indices were formulated to determine the impact of multiple EHS criteria based on their infl uence in three categories for each domain: human health, ecosystem health, and climatic impact. Processes are evaluated based on their risk to various weighted factors within each category. The scores are then added to yield a total score for a process for each domain. A com-parative ranking of alternative processes is performed by dividing the total risk scores for each process by the lowest score. This can be used to identify greener solvents that generate less waste during their manufacture and pose fewer EHS concerns when disposed of.
In each of the previously mentioned methods lies the possibility for improving the greenness and effi ciency of existing and developing processes. This can lead to the reduction and elimination of hazardous solvents, improved process yields, and lower operation costs. However, it is important to note that each method requires a signifi cant amount of data in order to evaluate a pharmaceutical process and appropriate process alternatives. To date, there is not an all - inclusive method that accounts for every possible environmental, human safety, and economic factor of interest.
3.2.1.2 Greenness Scoring Methods for Solvents Along with methods to evaluate different pharmaceutical processes and unit oper-ations, several methods have also been developed to evaluate commonly used solvents in the pharmaceutical industry. Solvents still account for a majority of the mass utilization in any pharmaceutical process. Therefore, various methods have been developed which focus on measuring the greenness of solvents, locating possible alternatives and reducing the overall amount of solvent used in any given process. Some of these methods use a combination of physical property data, LCA
3.2 Solvent and Process Greenness Scoring and Selection Tools 67
data, and process operability. Although it is desirable to use green solvents, it is not always possible, as their use must be balanced with process effi ciency, oper-ability, and cost. Many methods have been developed which only use the physical property data of solvents in an effort to achieve higher operability and effi ciency. However, although a process may become more effi cient and less wasteful, it could still be less green if the EHS aspects associated with the materials being used are not taken into account.
One of the earlier solvent assessment tools developed was SMART (Solvent Measurement, Assessment, and Revampment Tool), which ranks solvents based on their EHS impacts and physical properties. SMART is an integrated software program that contains EHS and regulatory information for over 320 commonly used industrial solvents. SMART also employs several property estimators to aid in solvent selection. One uses SMART in one of three different modes: user - defi ned, operation - based, and plant - wide selection. Depending on the design objective and operating parameters, SMART searches its database to compile a list of possible solvent choices for further investigation. This can lead to more effi cient processes by reducing the amount and number of solvents required. This method attempts to identify solvents that may be used to optimize a process while consid-ering a limited set of EHS impacts [30] .
Gani [31] proposed a four - step solvent scoring method, which was extended in 2008 to a fi ve - step method to include multi - step reaction systems. In the fi rst step the functions to be satisfi ed by a solvent are defi ned. Next, a database of 75 solvents commonly used in the pharmaceutical industry is searched, the solvents being defi ned in terms of the search criteria known as R - indices. The parameters to be reviewed include the physical and chemical properties of the solvent, EHS char-acteristics, and operational properties. A list of potential solvents is then generated for which a reaction - solvent ( RS ) index is calculated based on a list of pre - defi ned rules. The feasible solvents are weighted and assigned a fi nal score. In the fi fth step, a matrix of solvents is compiled which lists possible solvents for each reaction step and identifi es where a single solvent may be used [32] . This solvent scoring method can lead to an overall greener process by reducing the number of solvents used, increasing process effi ciency, and determining alternative solvents that pose lower EHS impacts.
A similar solvent selection tool was developed by Pfi zer, which ‘ bundles ’ solvents into groups based on their nature and then ranks them according to worker safety, process safety, and environmental and regulatory considerations [33] . Pfi zer uses a rigorous scoring methodology and scores the solvents in nine separate categories but then simplifi es the information for the end user scientist by placing the sol-vents in one of three categories: Preferred (green), Usable (amber), and Undesir-able (red). This method allows for the easy identifi cation of what it considers to be greener solvent alternatives to toxic and hazardous solvents. It was reported by Pfi zer that after the implementation of this simple solvent scoring method, they realized a 50% reduction in chlorinated solvent use across their entire R & D divi-sion between 2004 and 2006.

68 3 Solvent Use and Waste Issues
Likewise, a method developed at Johnson and Johnson (J & J) divides solvents into either a preferred or undesirable category and is known as the Solvent Pre-ferred List. This is used in conjunction with their Design for Environment ( DfE ) program as promoted by the United States EPA. Areas of concern that are accounted for in categorizing solvents at J & J include physical properties, operabil-ity, and environmental and human safety. The goal of the Solvent Preferred List is to aid in the selection of greener solvents where possible. This is not a set list of solvents to be used, but rather a set of guidelines to keep in mind while design-ing and developing manufacturing processes. Through the use of the Solvent Preferred List, in combination with the principles of DfE, J & J hope to lower their hazardous solvent waste generation by 10% between 2005 and 2010 (A. Lee - Jeffs, private communication).
A method proposed by Capello [34] involves scoring solvents based on both EHS and LCI energy. In the fi rst step a solvent index is calculated between zero and one for nine EHS impact categories that are summed to yield a fi nal score. Next, the cumulative energy demand ( CED ) is calculated for each solvent based on the energy used in manufacture, transportation, and disposal. The EHS and CED scores are then combined to determine solvent greenness. The Capello methodol-ogy typically favors volatile solvents such as pentane and diethyl ether because of their low energy requirements. However, solvents such as pentane and diethyl ether, which score well with the Capello methodology, are not favored by the pharmaceutical industry as they have very low fl ashpoints, and their high volatility gives greater possibility of air emissions.
Solvent selection methods have also been developed by the United States EPA. One of the earlier programs developed was SAGE ( Solvent Alternatives GuidE ). SAGE is a logic - tree program that evaluates a user - defi ned scenario and suggests alternative solvents and processes based on EHS, economic, regulatory, and opera-tional criteria [35] . Another software program, PARIS II ( Program for Assisting the Replacement of Industrial Solvent s), was developed to suggest alternative solvents to those currently in use. This is done by searching for solvents that have similar physical and chemical properties to those in use but which carry lower environmental impacts [36] . While these tools are generally available, they are for the most part geared to different types of industries than the chemical batch processing industries and therefore have limited applicability for pharmaceutical manufacturing.
Thus, solvent selection and scoring tools specifi cally focus on solvent use. As solvents account for the majority of the mass utilization in a process, solvent selec-tion, together with reductions in the number and amount of solvents used, can lead to greener, safer, and more effi cient processes. GSK and Rowan University have also developed two further methods which specifi cally aim at scoring sol-vents, and these are described in more detail in the following sections.
3.2.1.3 The GSK Solvent Selection Guide In addition to GSK ’ s Green Chemistry and Technologies Guidance for pharma-ceutical processes, they have also developed the GSK Solvent Selection Guide
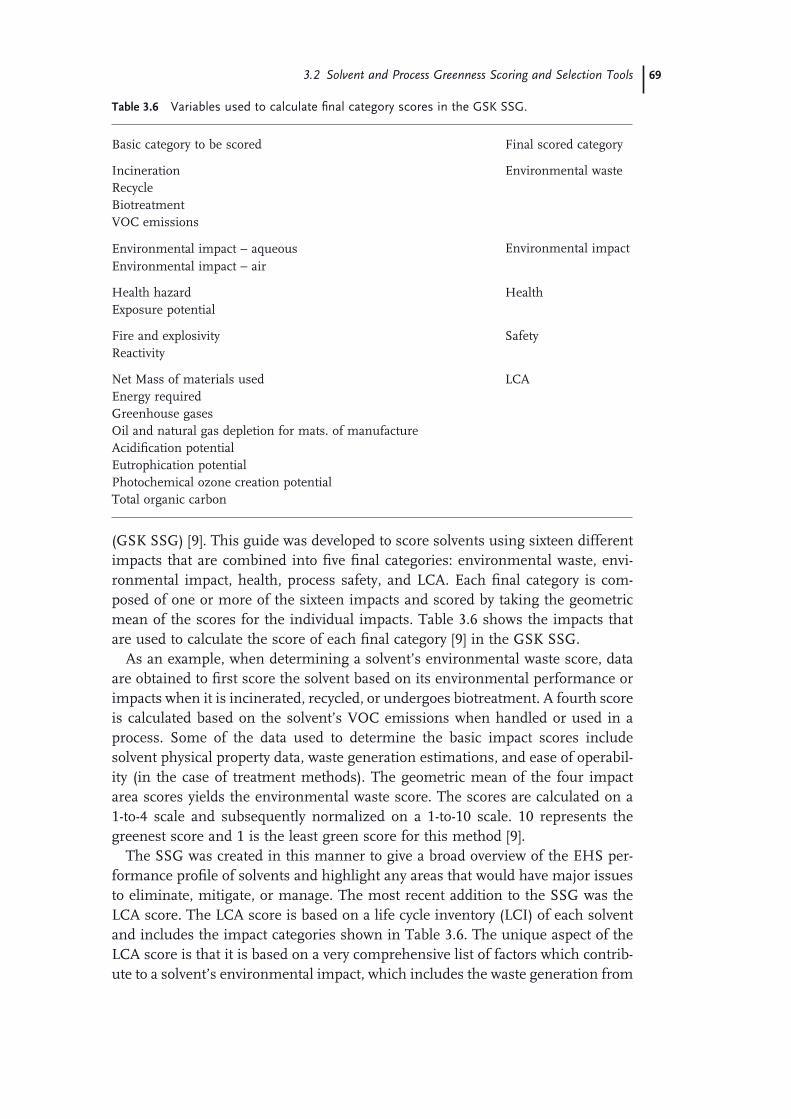
3.2 Solvent and Process Greenness Scoring and Selection Tools 69
( GSK SSG ) [9] . This guide was developed to score solvents using sixteen different impacts that are combined into fi ve fi nal categories: environmental waste, envi-ronmental impact, health, process safety, and LCA. Each fi nal category is com-posed of one or more of the sixteen impacts and scored by taking the geometric mean of the scores for the individual impacts. Table 3.6 shows the impacts that are used to calculate the score of each fi nal category [9] in the GSK SSG.
As an example, when determining a solvent ’ s environmental waste score, data are obtained to fi rst score the solvent based on its environmental performance or impacts when it is incinerated, recycled, or undergoes biotreatment. A fourth score is calculated based on the solvent ’ s VOC emissions when handled or used in a process. Some of the data used to determine the basic impact scores include solvent physical property data, waste generation estimations, and ease of operabil-ity (in the case of treatment methods). The geometric mean of the four impact area scores yields the environmental waste score. The scores are calculated on a 1 - to - 4 scale and subsequently normalized on a 1 - to - 10 scale. 10 represents the greenest score and 1 is the least green score for this method [9] .
The SSG was created in this manner to give a broad overview of the EHS per-formance profi le of solvents and highlight any areas that would have major issues to eliminate, mitigate, or manage. The most recent addition to the SSG was the LCA score. The LCA score is based on a life cycle inventory ( LCI ) of each solvent and includes the impact categories shown in Table 3.6 . The unique aspect of the LCA score is that it is based on a very comprehensive list of factors which contrib-ute to a solvent ’ s environmental impact, which includes the waste generation from
Table 3.6 Variables used to calculate fi nal category scores in the GSK SSG.
Basic category to be scored Final scored category
Incineration Environmental waste Recycle Biotreatment VOC emissions
Environmental impact − aqueous Environmental impact Environmental impact − air
Health hazard Health Exposure potential
Fire and explosivity Reactivity
Safety
Net Mass of materials used LCA Energy required Greenhouse gases Oil and natural gas depletion for mats. of manufacture Acidifi cation potential Eutrophication potential Photochemical ozone creation potential Total organic carbon
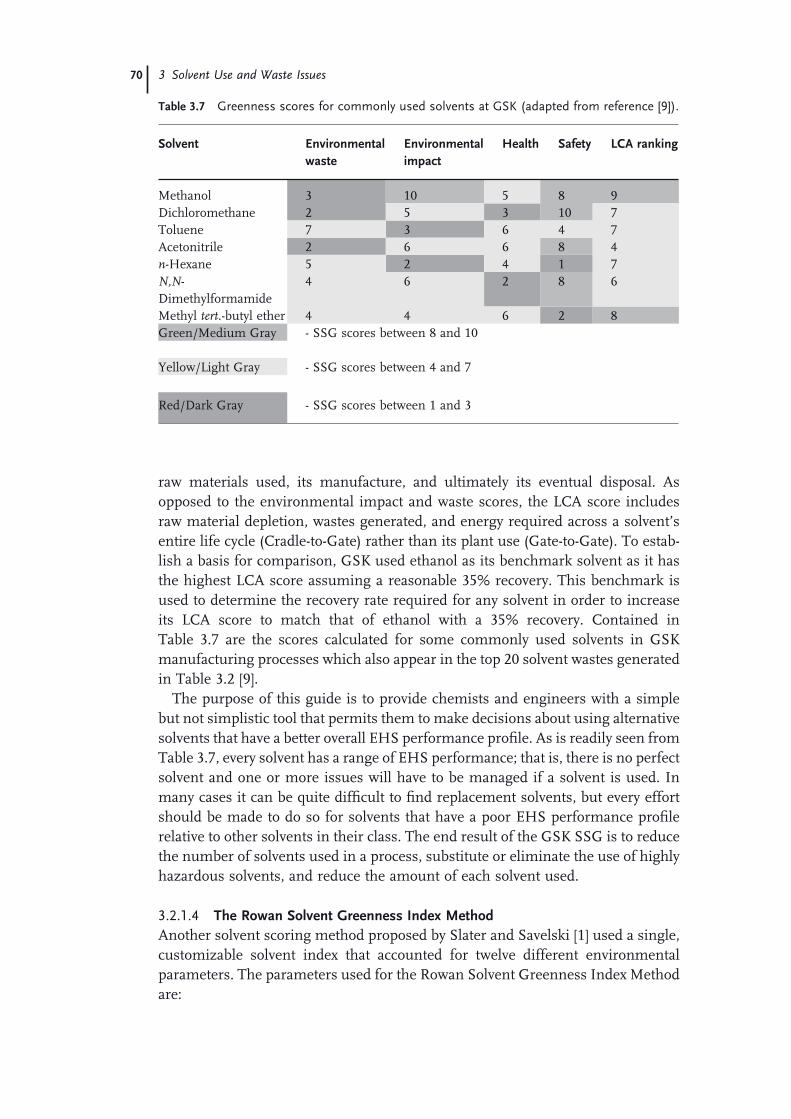
70 3 Solvent Use and Waste Issues
raw materials used, its manufacture, and ultimately its eventual disposal. As opposed to the environmental impact and waste scores, the LCA score includes raw material depletion, wastes generated, and energy required across a solvent ’ s entire life cycle (Cradle - to - Gate) rather than its plant use (Gate - to - Gate). To estab-lish a basis for comparison, GSK used ethanol as its benchmark solvent as it has the highest LCA score assuming a reasonable 35% recovery. This benchmark is used to determine the recovery rate required for any solvent in order to increase its LCA score to match that of ethanol with a 35% recovery. Contained in Table 3.7 are the scores calculated for some commonly used solvents in GSK manufacturing processes which also appear in the top 20 solvent wastes generated in Table 3.2 [9] .
The purpose of this guide is to provide chemists and engineers with a simple but not simplistic tool that permits them to make decisions about using alternative solvents that have a better overall EHS performance profi le. As is readily seen from Table 3.7 , every solvent has a range of EHS performance; that is, there is no perfect solvent and one or more issues will have to be managed if a solvent is used. In many cases it can be quite diffi cult to fi nd replacement solvents, but every effort should be made to do so for solvents that have a poor EHS performance profi le relative to other solvents in their class. The end result of the GSK SSG is to reduce the number of solvents used in a process, substitute or eliminate the use of highly hazardous solvents, and reduce the amount of each solvent used.
3.2.1.4 The Rowan Solvent Greenness Index Method Another solvent scoring method proposed by Slater and Savelski [1] used a single, customizable solvent index that accounted for twelve different environmental parameters. The parameters used for the Rowan Solvent Greenness Index Method are:
Table 3.7 Greenness scores for commonly used solvents at GSK ( adapted from reference [9] ).
Solvent Environmental waste
Environmental impact
Health Safety LCA ranking
Methanol 3 10 5 8 9 Dichloromethane 2 5 3 10 7 Toluene 7 3 6 4 7 Acetonitrile 2 6 6 8 4 n - Hexane 5 2 4 1 7 N,N - Dimethylformamide
4 6 2 8 6
Methyl tert . - butyl ether 4 4 6 2 8 Green/Medium Gray - SSG scores between 8 and 10 Yellow/Light Gray - SSG scores between 4 and 7
Red/Dark Gray - SSG scores between 1 and 3
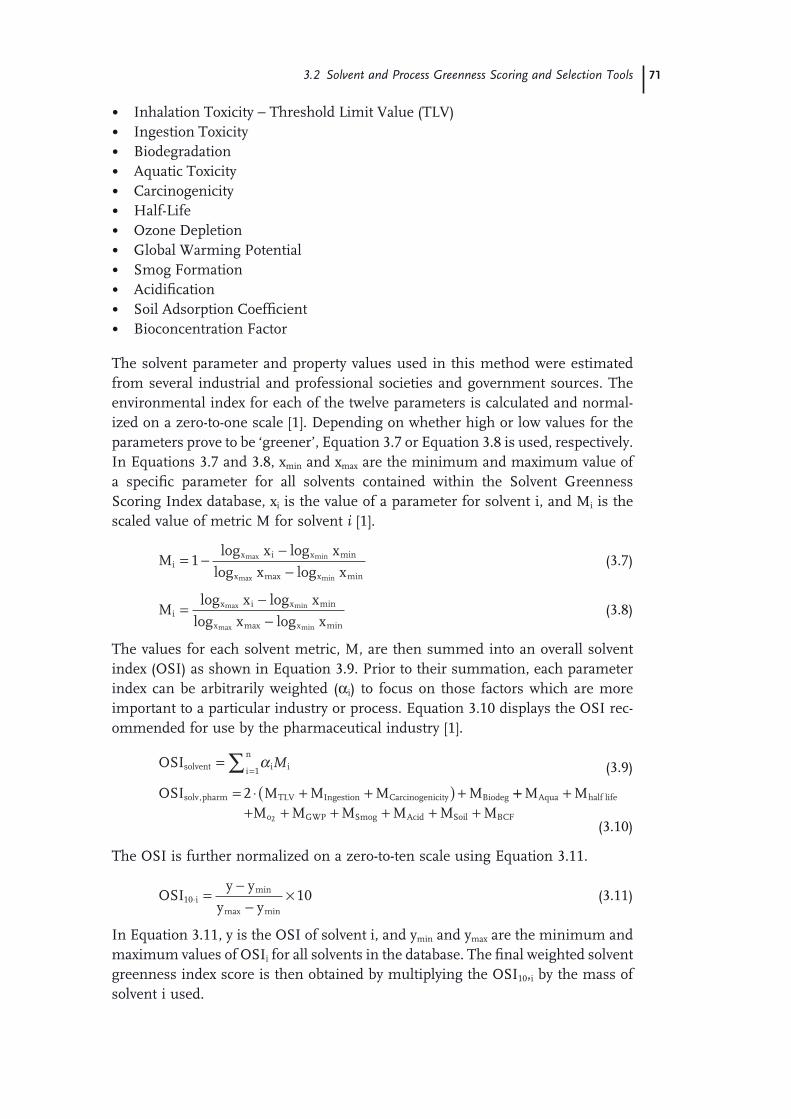
3.2 Solvent and Process Greenness Scoring and Selection Tools 71
• Inhalation Toxicity − Threshold Limit Value ( TLV ) • Ingestion Toxicity • Biodegradation • Aquatic Toxicity • Carcinogenicity • Half - Life • Ozone Depletion • Global Warming Potential • Smog Formation • Acidifi cation • Soil Adsorption Coeffi cient • Bioconcentration Factor
The solvent parameter and property values used in this method were estimated from several industrial and professional societies and government sources. The environmental index for each of the twelve parameters is calculated and normal-ized on a zero - to - one scale [1] . Depending on whether high or low values for the parameters prove to be ‘ greener ’ , Equation 3.7 or Equation 3.8 is used, respectively. In Equations 3.7 and 3.8 , x min and x max are the minimum and maximum value of a specifi c parameter for all solvents contained within the Solvent Greenness Scoring Index database, x i is the value of a parameter for solvent i, and M i is the scaled value of metric M for solvent i [1] .
Mx x
x xi
x i x
x x
= −−−
1log log
log logmax min
max min
min
max min
(3.7)
Mx x
x xi
x i x
x x
=−−
log log
log logmax min
max min
min
max min
(3.8)
The values for each solvent metric, M, are then summed into an overall solvent index ( OSI ) as shown in Equation 3.9 . Prior to their summation, each parameter index can be arbitrarily weighted ( α i ) to focus on those factors which are more important to a particular industry or process. Equation 3.10 displays the OSI rec-ommended for use by the pharmaceutical industry [1] .
OSIsolvent i ii
n=
=∑ α M1 (3.9)
OSI M M M Msolv pharm TLV Ingestion Carcinogenicity Biodeg, = ⋅ + +( ) +2 ++ +
+ + + + + +M M
M M M M M MAqua half life
o GWP Smog Acid Soil BCF2
(3.10)
The OSI is further normalized on a zero - to - ten scale using Equation 3.11 .
OSIy y
y yi10 10⋅ =
−−
×min
max min
(3.11)
In Equation 3.11 , y is the OSI of solvent i, and y min and y max are the minimum and maximum values of OSI i for all solvents in the database. The fi nal weighted solvent greenness index score is then obtained by multiplying the OSI 10 , i by the mass of solvent i used.

72 3 Solvent Use and Waste Issues
Weighted Solvent Greenness Index OSI MasSolvent solvent= ( )⋅10 sssolvent( ) (3.12)
To obtain a process greenness index, all of the weighted solvent greenness indices are summed as shown in Equation 3.13 .
Total Process Greenness Index Weighted Solvent Greenness I= nndexsolvent∑ (3.13)
The higher the score, the less green a particular solvent or process is. Depending on the chosen weight factors for each impact category, the scores for solvents and processes can vary between different industries. The weighted solvent greenness index or total process greenness index can then be used to compare individual solvents or processes, respectively [1] . The Solvent Greenness Index also contains an algorithm which estimates vapor pressure using Antoine ’ s equation to deter-mine how easily solvent mixtures can be separated. It is interesting to note that this method only considers the gate - to - gate or plant use of a solvent and does not incorporate LCA data. This method can also lead toward the identifi cation of greener solvents to be used within a pharmaceutical process.
As an example, the Solvent Greenness Scoring Index was used to estimate an environmental impact score (OSI) for some of the solvents contained in Table 3.7 . The scores can be viewed in Table 3.8 along with a comparison to the GSK SSG scores. As shown in Table 3.8 , both methods are able to measure solvent greenness with similar relative standings. In order to achieve the closest match, the weighting factors for the pharmaceutical industry were used when calculating the OSI using the Rowan Solvent Greenness Index as given in Equation 3.10 . As the solvent greenness score relationship is reversed for each method it is expected that the higher the SSG score is, the lower the Solvent Greenness Scoring Index score will be.
To demonstrate the ability of the Solvent Greenness Scoring Index to measure the greenness of a process, consider a hypothetical waste stream which contains 25 kg of four different solvents: methanol, DMF, THF, and DCM. First the metric
Table 3.8 Solvent greenness scoring index scores and GSK SSG comparison.
Solvent Environmental impact – Solvent Greenness Scoring Index
Environmental impact – GSK SSG
Methanol 2.5 10 N,N - Dimethylformamide ( DMF )
4.4 6
Tetrahydrofuran (THF) 4.5 6 Dichloromethane ( DCM ) 5.4 5 Toluene 6.3 3
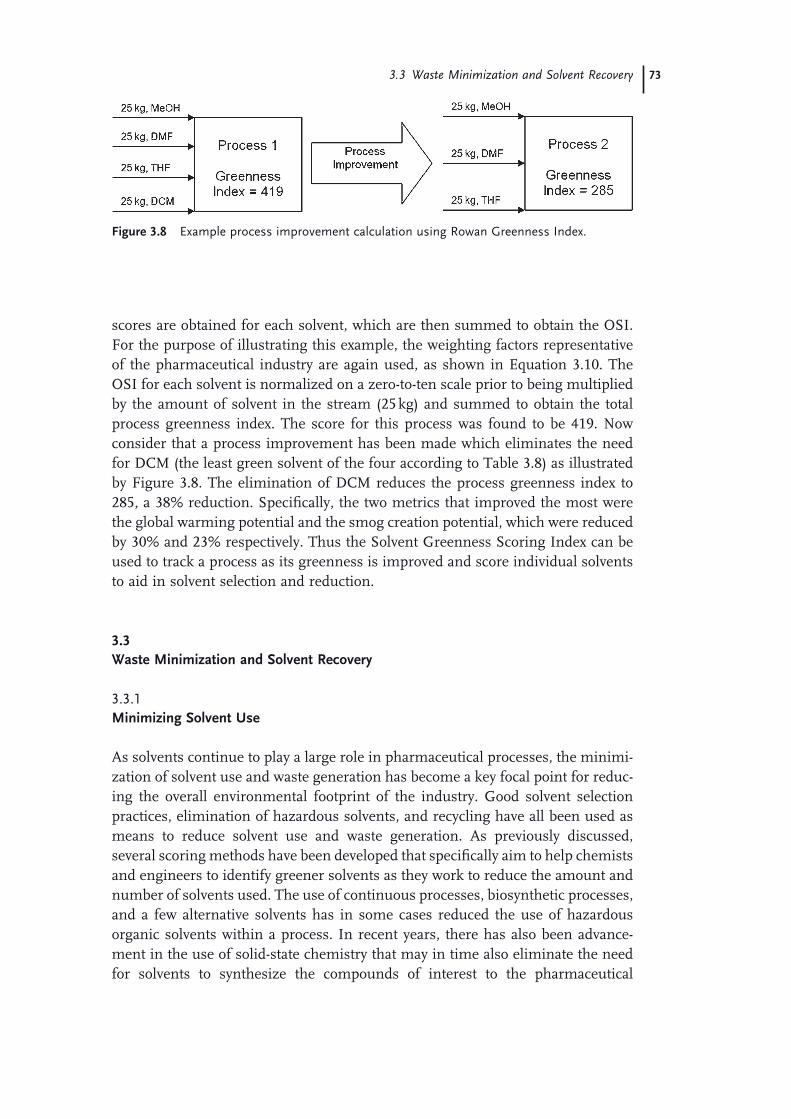
3.3 Waste Minimization and Solvent Recovery 73
scores are obtained for each solvent, which are then summed to obtain the OSI. For the purpose of illustrating this example, the weighting factors representative of the pharmaceutical industry are again used, as shown in Equation 3.10 . The OSI for each solvent is normalized on a zero - to - ten scale prior to being multiplied by the amount of solvent in the stream (25 kg) and summed to obtain the total process greenness index. The score for this process was found to be 419. Now consider that a process improvement has been made which eliminates the need for DCM (the least green solvent of the four according to Table 3.8 ) as illustrated by Figure 3.8 . The elimination of DCM reduces the process greenness index to 285, a 38% reduction. Specifi cally, the two metrics that improved the most were the global warming potential and the smog creation potential, which were reduced by 30% and 23% respectively. Thus the Solvent Greenness Scoring Index can be used to track a process as its greenness is improved and score individual solvents to aid in solvent selection and reduction.
3.3 Waste Minimization and Solvent Recovery
3.3.1 Minimizing Solvent Use
As solvents continue to play a large role in pharmaceutical processes, the minimi-zation of solvent use and waste generation has become a key focal point for reduc-ing the overall environmental footprint of the industry. Good solvent selection practices, elimination of hazardous solvents, and recycling have all been used as means to reduce solvent use and waste generation. As previously discussed, several scoring methods have been developed that specifi cally aim to help chemists and engineers to identify greener solvents as they work to reduce the amount and number of solvents used. The use of continuous processes, biosynthetic processes, and a few alternative solvents has in some cases reduced the use of hazardous organic solvents within a process. In recent years, there has also been advance-ment in the use of solid - state chemistry that may in time also eliminate the need for solvents to synthesize the compounds of interest to the pharmaceutical
Figure 3.8 Example process improvement calculation using Rowan Greenness Index.
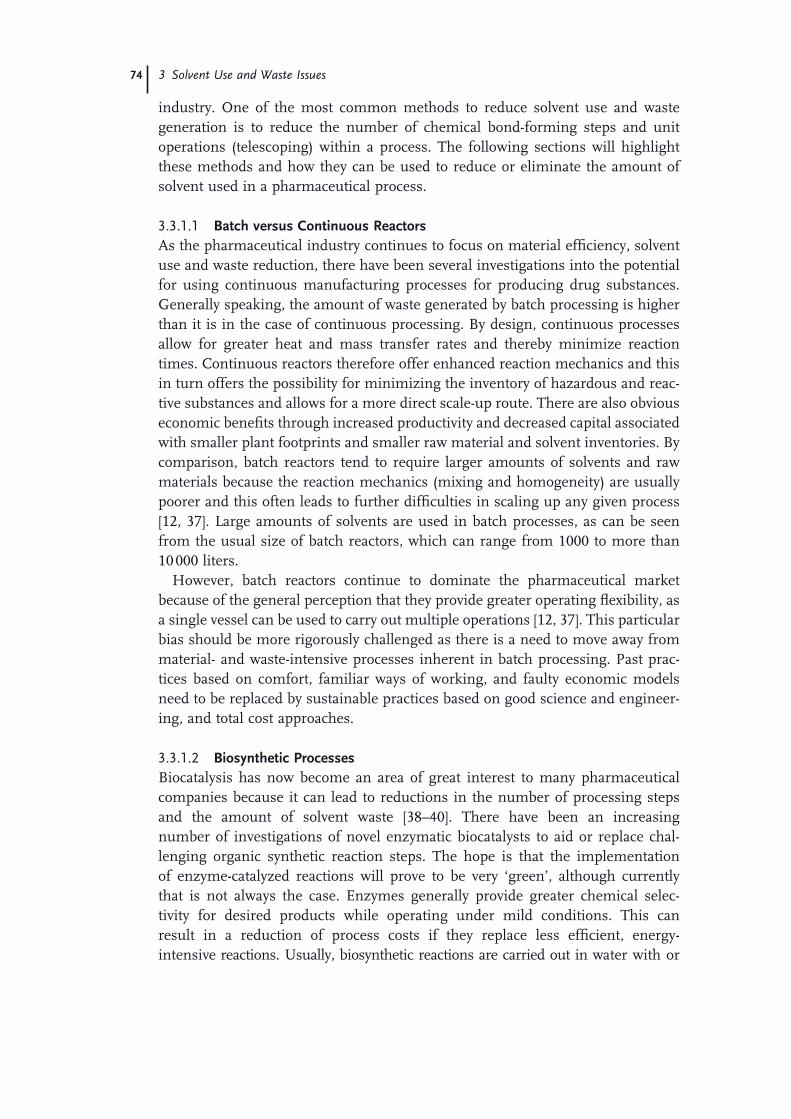
74 3 Solvent Use and Waste Issues
industry. One of the most common methods to reduce solvent use and waste generation is to reduce the number of chemical bond - forming steps and unit operations (telescoping) within a process. The following sections will highlight these methods and how they can be used to reduce or eliminate the amount of solvent used in a pharmaceutical process.
3.3.1.1 Batch versus Continuous Reactors As the pharmaceutical industry continues to focus on material effi ciency, solvent use and waste reduction, there have been several investigations into the potential for using continuous manufacturing processes for producing drug substances. Generally speaking, the amount of waste generated by batch processing is higher than it is in the case of continuous processing. By design, continuous processes allow for greater heat and mass transfer rates and thereby minimize reaction times. Continuous reactors therefore offer enhanced reaction mechanics and this in turn offers the possibility for minimizing the inventory of hazardous and reac-tive substances and allows for a more direct scale - up route. There are also obvious economic benefi ts through increased productivity and decreased capital associated with smaller plant footprints and smaller raw material and solvent inventories. By comparison, batch reactors tend to require larger amounts of solvents and raw materials because the reaction mechanics (mixing and homogeneity) are usually poorer and this often leads to further diffi culties in scaling up any given process [12, 37] . Large amounts of solvents are used in batch processes, as can be seen from the usual size of batch reactors, which can range from 1000 to more than 10 000 liters.
However, batch reactors continue to dominate the pharmaceutical market because of the general perception that they provide greater operating fl exibility, as a single vessel can be used to carry out multiple operations [12, 37] . This particular bias should be more rigorously challenged as there is a need to move away from material - and waste - intensive processes inherent in batch processing. Past prac-tices based on comfort, familiar ways of working, and faulty economic models need to be replaced by sustainable practices based on good science and engineer-ing, and total cost approaches.
3.3.1.2 Biosynthetic Processes Biocatalysis has now become an area of great interest to many pharmaceutical companies because it can lead to reductions in the number of processing steps and the amount of solvent waste [38 – 40] . There have been an increasing number of investigations of novel enzymatic biocatalysts to aid or replace chal-lenging organic synthetic reaction steps. The hope is that the implementation of enzyme - catalyzed reactions will prove to be very ‘ green ’ , although currently that is not always the case. Enzymes generally provide greater chemical selec-tivity for desired products while operating under mild conditions. This can result in a reduction of process costs if they replace less effi cient, energy - intensive reactions. Usually, biosynthetic reactions are carried out in water with or

3.3 Waste Minimization and Solvent Recovery 75
without organic solvents. This offers the possibility of reducing or eliminating the use of hazardous solvents and wastes. Enzymes may also remove the need for toxic heavy/rare metal catalysts used in some reaction steps. This would reduce solvent waste generated from additional washing and purifi cation steps.
Optimization of the production of paclitaxel (Taxol ® ) is a good example of a biosynthetic route being used as an alternative to a semi - synthetic route [18] . This reduced the number of unit operations and solvents required in the process, thereby increasing its greenness and effi ciency (see Chapter 7 ). Since the produc-tion and use of enzymes in organic synthesis is not a mature industrial practice (unlike the synthetic chemical industry), there is potential to develop biocatalysts in a way that they will improve process effi ciency and produce a greener operation as a whole. As with all alternative syntheses, it is important to evaluate environ-mental impacts from various perspectives such as using an LCI/A to determine which route is greener.
3.3.1.3 Solid - State Chemistry The use of solid - state chemistry has become a major research area for the green production of many pharmaceutical compounds [41, 42] . Recently, many solid - state reactions have proven to be highly effi cient, environmentally benign processes. There have been multiple reports of solid - state reactions used to produce APIs at 100% yield in a solventless system that produces no waste or by - products [42] . The products are made in a state of very high purity and therefore do not require any additional workup, which also reduces solvent use and waste generation. The typical solid - state reaction involves the grinding of two organic solids together, usually in a ball mill, under ambient operating conditions (room temperature and atmospheric pres-sure). While the solids are ground together, the solid - state mechanism, which involves phase rebuilding, phase transformation, and crystal disintegration results in the production of the fi nal solid product. It should be noted that no solid - state reactions have so far been operated on any scale to make either APIs or intermediates, and there could well be issues with homogeneity, reproducibility, and exotherm control.
3.3.1.4 Telescoping One of the most widely used methods to improve overall process effi ciency is to reduce the number of steps and unit operations in a synthetic route. This is more commonly known as telescoping. This can lead to more effi cient, less wasteful processes that require fewer solvents because of the smaller number of steps. An example of this technique was illustrated earlier in Section 3.1.6 , where the process optimization of the sertraline (Zoloft ® ) production process by Pfi zer was described. In this case the number of process steps (unit operations) was reduced from 3 to 1, which led to huge savings due to higher productivity, fewer inputs, and less waste generation [18] .

76 3 Solvent Use and Waste Issues
3.3.2 Recycling Solvents
Although several methods are used to reduce or eliminate solvent consumption within a pharmaceutical process, solvents are often used in excess in order to carry out reactions in a dilute environment because of solubility and product selectivity issues [2] . As solvents still have a great infl uence on the quality of the fi nal products, it can be very diffi cult to fi nd suitable replacements [43] . It is therefore desirable to fi nd solvents for a process that can be easily recovered, separated, and purifi ed for reuse. Spent solvents that are not recovered must be disposed of as wastes, which can be quite costly and add to the environmental burden.
Currently, distillation is used for approximately 95% of all solvent separation processes [44] . However, it leads to waste generation, such as the release of GHGs, high energy requirements, the inadequate condensing of overhead (distillate) products , and other ineffi ciencies [44] . Solvent recycling systems are often used on - site in many pharmaceutical plants; however, there are many instances of pharmaceutical companies have their wastes purifi ed and recycled off - site. The use of internal or external solvent recycling depends on the plant and region.
3.3.2.1 Methods to Recover and Reuse Solvents The main distillation types include atmospheric, vacuum, steam, azeotropic, extractive, and pressure distillation [45] . All of these distillation methods can be carried out in a batch or continuous manner with the exception of extractive distil-lation, which is solely continuous by nature. Complex solvent systems often require the use of multiple distillation columns in series to purify certain solvents that are not easily separated. The energy consumption in distillation columns can therefore be quite large because of the continuous operation of condensers and reboilers over extended periods of time. In order to cut down on these costs, both vacuum and steam distillation can be employed [45] .
Some solvent mixtures can be very diffi cult and energy intensive to separate because of the closeness of boiling points and the formation of azeotropic mixtures [45] . Azeotropic or extractive distillation can be used for azeotropic solvent mix-tures and solvents which have very low relative volatilities [43, 45] . Azeotropic and extractive distillation involves the addition of another solvent, known as an entrainer, which will form its own azeotrope with one of the components to be separated [45] . However, the additional solvent required for azeotropic and extrac-tive distillation can also generate more wastes depending on how easily the entrainer itself can be recycled and reused.
There are several companies today which specialize in the manufacture of dif-ferent distillation systems to recover solvents for further reuse within a pharma-ceutical plant [46, 47] . According to ProsCon ™ , the major cost benefi ts that their customers realize when using their solvent recovery systems are reductions in solvent purchases, waste disposal costs, and transportation costs [46] .
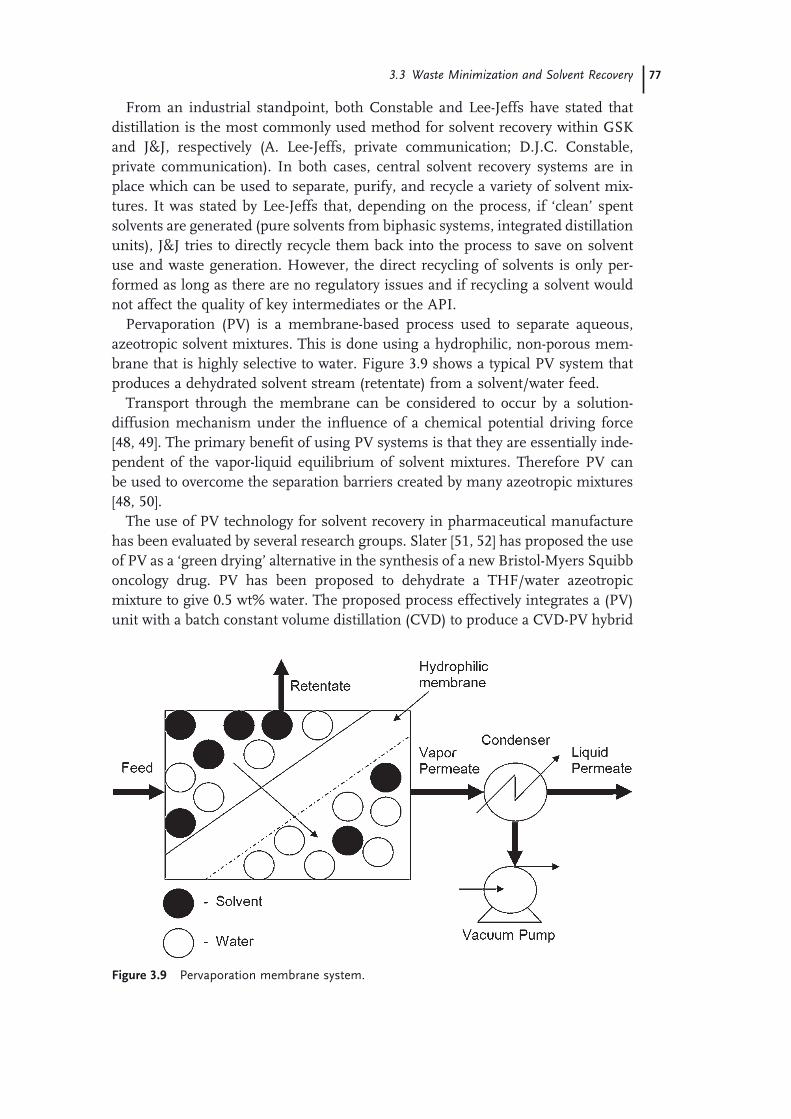
3.3 Waste Minimization and Solvent Recovery 77
From an industrial standpoint, both Constable and Lee - Jeffs have stated that distillation is the most commonly used method for solvent recovery within GSK and J & J, respectively (A. Lee - Jeffs, private communication; D.J.C. Constable, private communication). In both cases, central solvent recovery systems are in place which can be used to separate, purify, and recycle a variety of solvent mix-tures. It was stated by Lee - Jeffs that, depending on the process, if ‘ clean ’ spent solvents are generated (pure solvents from biphasic systems, integrated distillation units), J & J tries to directly recycle them back into the process to save on solvent use and waste generation. However, the direct recycling of solvents is only per-formed as long as there are no regulatory issues and if recycling a solvent would not affect the quality of key intermediates or the API.
Pervaporation ( PV ) is a membrane - based process used to separate aqueous, azeotropic solvent mixtures. This is done using a hydrophilic, non - porous mem-brane that is highly selective to water. Figure 3.9 shows a typical PV system that produces a dehydrated solvent stream (retentate) from a solvent/water feed.
Transport through the membrane can be considered to occur by a solution - diffusion mechanism under the infl uence of a chemical potential driving force [48, 49] . The primary benefi t of using PV systems is that they are essentially inde-pendent of the vapor - liquid equilibrium of solvent mixtures. Therefore PV can be used to overcome the separation barriers created by many azeotropic mixtures [48, 50] .
The use of PV technology for solvent recovery in pharmaceutical manufacture has been evaluated by several research groups. Slater [51, 52] has proposed the use of PV as a ‘ green drying ’ alternative in the synthesis of a new Bristol - Myers Squibb oncology drug. PV has been proposed to dehydrate a THF/water azeotropic mixture to give 0.5 wt% water. The proposed process effectively integrates a (PV) unit with a batch constant volume distillation ( CVD ) to produce a CVD - PV hybrid
Figure 3.9 Pervaporation membrane system.

78 3 Solvent Use and Waste Issues
process. In this mode of operation, the PV membrane is used to dehydrate the distillate vapor at azeotropic conditions and recycle the ‘ dry ’ THF back to the CVD vessel. The new process reduces the need for the additional solvent entrainer and reduces the waste produced. Waste disposal cost was reduced by 93%, and the cost of purchase of THF was reduced by 56%. A life cycle analysis was performed, which showed a 95% reduction in greenhouse gas emissions when using the ‘ green drying ’ CVD - PV process.
Savelski et al. [53 – 55] have done a design case study on using PV for the recovery of isopropanol (IPA) solvent in the Pfi zer celecoxib (Celebrex ® ) process. The waste stream had approximately equal amounts of IPA and water, with small amounts of methanol, ethanol ( < 1%), and other dissolved solids ( < 0.5%). The proposed separation scheme fi rst uses distillation to increase the IPA concentration until the azeotropic mixture is reached, and then employs PV. This optimizes the capabilities of each process, since distillation is typically more effective in concen-trating dilute organic - water mixtures and PV is more effective in dehydrating high organic - water concentration mixtures. When a combined distillation - PV - distillation scheme is simulated with the equipment sizes available at the plant, an IPA purity of 99.1 wt% was obtained. The proposed process provides a 72% overall operating cost saving for the plant when IPA purchase costs and waste disposal costs are analyzed. An LCA indicates that this option would reduce emis-sions by 92% and would reduce the carbon footprint of the process by 95% com-pared with the base case. Urtiaga [48] have also investigated the dehydration of azeotropic IPA mixtures. They compared extractive distillation methods to a hybrid distillation - PV process and showed that with the improved design there is no need for additional entrainers, making a more environmentally effi cient system. These studies show the potential for integrating novel membrane processes with tradi-tional distillation for a green design alternative.
Another approach to separating homogeneous azeotropic mixtures in pharma-ceutical manufacture is through the middle - vessel batch distillation confi guration [43, 56] . Because of the small production volumes of many pharmaceutical processes, there is typically not enough feed to maintain a steady - state continuous distillation operation. The middle - vessel batch distillation confi gura-tion (Figure 3.10 ) enables a batch distillation to be carried out as if it were per-formed in a continuous distillation column through the addition of a stripping section. The main advantage of this system is that it can be used as a multipurpose solvent recovery system which is fed by a single batch vessel [43] .
Solvent mixtures that contain heat - sensitive compounds, are viscous, or have high boiling points can be separated using wiped - fi lm evaporator s ( WFE ) [57, 58] . A WFE operates by receiving a liquid feed into a column that contains several wiper blades. The walls of the WFE are heated at a constant temperature in order to vaporize the solvent fi lm. As the solvent vapors migrate to the center of the WFE, they come into contact with a cooling unit that condenses the vapors, allow-ing them to fl ow down the condenser to the outlet receiver. The thin solvent fi lm and reduced system pressure (in the case of vacuum operation) allows the solvents to be separated slowly at lower temperatures [57 – 59] .
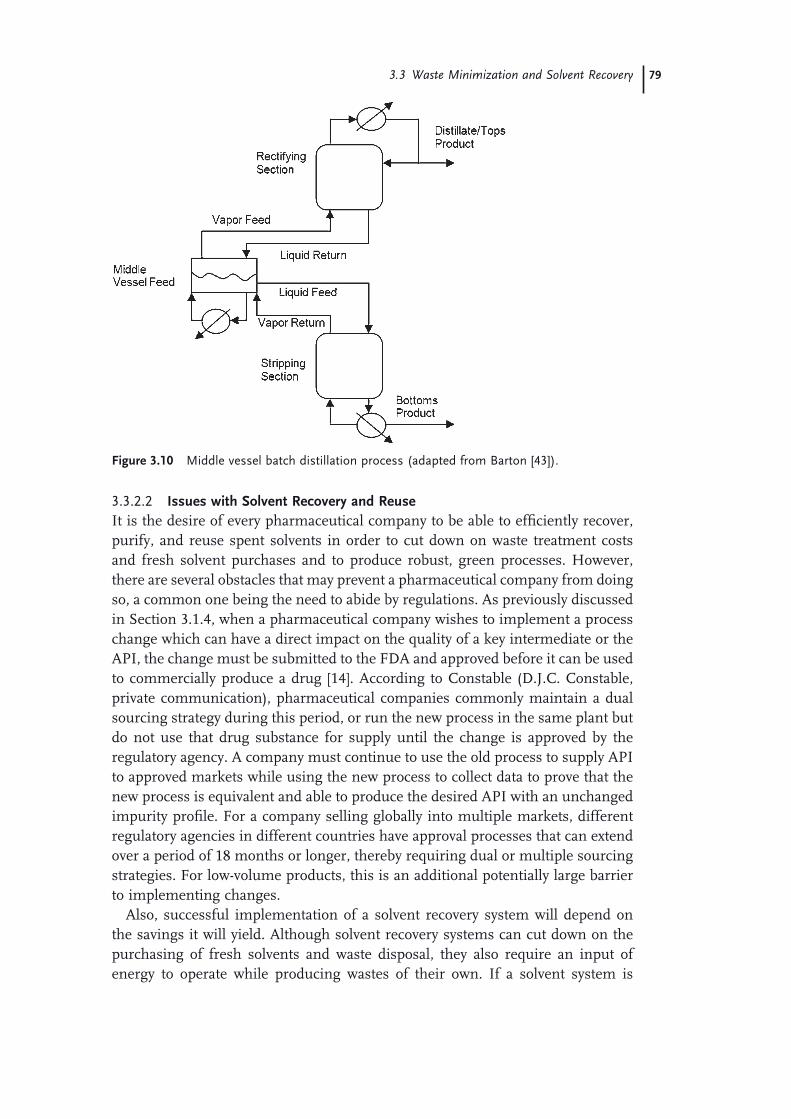
3.3 Waste Minimization and Solvent Recovery 79
3.3.2.2 Issues with Solvent Recovery and Reuse It is the desire of every pharmaceutical company to be able to effi ciently recover, purify, and reuse spent solvents in order to cut down on waste treatment costs and fresh solvent purchases and to produce robust, green processes. However, there are several obstacles that may prevent a pharmaceutical company from doing so, a common one being the need to abide by regulations. As previously discussed in Section 3.1.4 , when a pharmaceutical company wishes to implement a process change which can have a direct impact on the quality of a key intermediate or the API, the change must be submitted to the FDA and approved before it can be used to commercially produce a drug [14] . According to Constable (D.J.C. Constable, private communication), pharmaceutical companies commonly maintain a dual sourcing strategy during this period, or run the new process in the same plant but do not use that drug substance for supply until the change is approved by the regulatory agency. A company must continue to use the old process to supply API to approved markets while using the new process to collect data to prove that the new process is equivalent and able to produce the desired API with an unchanged impurity profi le. For a company selling globally into multiple markets, different regulatory agencies in different countries have approval processes that can extend over a period of 18 months or longer, thereby requiring dual or multiple sourcing strategies. For low - volume products, this is an additional potentially large barrier to implementing changes.
Also, successful implementation of a solvent recovery system will depend on the savings it will yield. Although solvent recovery systems can cut down on the purchasing of fresh solvents and waste disposal, they also require an input of energy to operate while producing wastes of their own. If a solvent system is
Figure 3.10 Middle vessel batch distillation process (adapted from Barton [43] ) .
80 3 Solvent Use and Waste Issues
diffi cult to separate, capital and operating costs for a recovery process may out-weigh the benefi ts. However, certain solvent recovery systems such as membrane - based operations are less energy intensive than distillation operations. Therefore a thorough design analysis needs to be conducted for each case to evaluate both environmental and economic benefi ts [60] .
However, there are several alternatives for dealing with solvent mixtures that are diffi cult to separate. For example, they can be resold to other companies where the solvent purity requirements are much lower. Solvents containing small amounts of impurities may be used as substitute fuels for internal power stations and waste - gas treatment facilities, but this is arguably not a good idea if, for example, the solvent consists of straight - chain alkanes and the process for produc-ing it is more complicated than fractionating petroleum to obtain it. It also does not make sense from a resource consumption and sustainability point of view to be burning fossil fuels of higher value. Solvents can also be incinerated both on - and off - site. The incineration of solvent wastes with high British Thermal Unit ( BTU ) content can be used for producing steam and electricity for direct use in a plant [61] . Another option is to resupply the energy generated from the incinerated solvent(s) to the local electricity provider for credit towards the plants total energy consumption. Each of these options needs to be evaluated from a life cycle perspec-tive to fi nd the best option for disposal of solvent wastes.
Finally, one of the main reasons which often hinders the use of novel solvent recovery and purifi cation systems is the ‘ fear of change ’ within many pharmaceuti-cal companies (D.J.C. Constable, private communication). While the pharmaceuti-cal industry has been producing drugs for many years, only very recently has it felt the need for highly effi cient solvent recovery and treatment methods to obtain economically feasible processes. Therefore, aside from minor cost savings, it is fair to say that pharmaceutical companies in the past did not believe they had as much incentive to recycle solvents as they do today. However, owing to increasing pressure from regulatory agencies on pharmaceutical companies to recycle sol-vents, coupled with the increasing cost of solvents and waste disposal methods, many pharmaceutical companies are now developing effi cient recovery techniques to purify and reuse solvents.
Acknowledgments
The authors would like to thank the following people: Nora Lopez of the United States Environmental Protection Agency for her assistance in supplying and helping to interpret the Toxic Release Inventory data for the pharmaceutical indus-try sectors, Ann Lee - Jeffs of Johnson & Johnson for lending her insight into pharmaceutical manufacturing and solvent waste disposal practices at J & J, Julie Manley of the ACS GCI Pharmaceutical Roundtable for supplying information on typical pharmaceutical waste metrics, and Stephan Taylor of BMS for supplying information on greenness scoring methods. The authors also thank the United States EPA for their support through the Pollution Prevention grant program (NP97257006 - 0).

References 81
References
1 Slater , C.S. , and Savelski , M. ( 2007 ) J. Environ. Sci. Health , 42 , 1595 – 1605 .
2 Elgue , S. , Prat , L. , Cabassud , M. , and Cezerac , J. ( 2006 ) Chem. Eng. J. , 117 , 169 – 177 .
3 Constable , D.J.C. , Jim é nez - Gonz á lez , C. , and Henderson , R.K. ( 2007 ) Org. Process Res. Dev. , 11 , 133 – 137 .
4 Sheldon , R.A. ( 1997 ) Chem. Ind. , 1 , 12 – 15 .
5 Allen , D.T. , and Shonnard , D.R. ( 2002 ) Green Engineering: Environmentally Conscious Design of Chemical Processes , Prentice Hall , Upper Saddle River, NJ , pp. 475 – 489 .
6 Jim é nez - Gonz á lez , C. , Curzons , A.D. , Constable , D.J. , and Overcash , M.R. ( 2001 ) Clean Prod. Processes , 3 , 35 – 41 .
7 Constable , D.J.C. , Curzons , A.D. , and Cunningham , V.L. ( 2002 ) Green Chem. , 4 , 521 – 527 .
8 Clark , J.H. , and Tavener , S.J. ( 2007 ) Org. Process Res. Dev. , 11 , 149 – 155 .
9 Jim é nez - Gonz á lez , C. , Curzons , A.D. , Constable , D.J.C. , and Cunningham , V.L. ( 2005 ) Clean Tech. Environ. Policy , 7 , 42 – 50 .
10 Kim , S. , and Overcash , M. ( 2003 ) J. Chem. Tech. Biotechnol. , 78 , 995 – 1005 .
11 United States Environmental Protection Agency ( 1997 ) EPA Offi ce of Complience Sector Notebook Project: Profi le of the Pharmaceutical Manufacturing Industry , United States Environmental Protection Agency , Washington DC , pp. 17 – 57 .
12 LaPorte , T.L. , and Wang , C. ( 2007 ) Curr. Opin. Drug Discovery Dev. , 10 , 738 – 745 .
13 Gad , S.C. ( 2008 ) Pharmaceutical Manufacturing Handbook: Production and Processes , John Wiley & Sons, Inc , Hoboken, NJ , pp. 881 – 895 .
14 United States Food and Drug Adminis-tration ( 2006 ) Drug quality assurance , in FDA Compliance Program Guidance Manual , Ch. 56, United States Food and Drug Administration , pp. 1 – 28 .
15 United States Environmental Protection Agency ( 1995, 2004, 2005, 2006 ) Toxic Release Inventory , United States Environmental Protection Agency , Washington, DC, courtesy of Nora Lopez.
16 Phelps , D. , Schnell , J. , and Shah , A. ( 2002 ) California Pharmaceutical Industry Hazardous Waste Source Reduction 2002 Assessment Report . California Environmental Protection Agency, Sacramento, CA, 96 – 110 .
17 Butters , M. , Catterick , D. , Craig , A. , Curzons , A. , Dale , D. , Gillmore , A. , Green , S.P. , Marziano , I. , Sherlock , J. - P. , and White , W. ( 2006 ) Chem. Rev. , 106 , 3002 – 3027 .
18 United States Environmental Protection Agency ( 2008 ) The Presidential Green Chemistry Challenge: Award Recipients, 1996 – 2008 , June 2008.
19 Dunn , P.J. , Galvin , S. , and Hettenbach , K. ( 2004 ) Green Chem. , 6 , 43 – 48 .
20 Dale , D.J. , Dunn , P.J. , Golightly , C. , Hughes , M.L. , Levett , P.C. , Pearce , A.K. , Searle , P.M. , Ward , G. , and Wood , A.S. ( 2000 ) Org. Process Res. Dev. , 4 , 17 – 22 .
21 Slater , C.S. , and Savelski , M. ( 2008 ) EPA Conference on Green Quality through Green Chemistry and Green Engineering in the Pharmaceutical Industry, New York, NY, January, 2008 , p. 1 .
22 Jim é nez - Gonz á lez , C. , Curzons , A.D. , Constable , D.J.C. , and Cunningham , V.L. ( 2004 ) Int. J. LCA , 9 ( 2 ), 114 – 121 .
23 Mulholland , K.L. , and Dyer , J.A. ( 2001 ) Environ. Prog. , 20 , 75 – 79 .
24 ICIS Pricing ( 2008 ) www.icispricing.com (accessed 8 February 2008).
25 Heinzle , E. , Weirich , D. , Brogli , F. , Hoffmann , V.H. , Koller , G. , Verduyn , M.A. , and Hungerbuhler , K. ( 1998 ) Ind. Eng. Chem. Res. , 37 , 3395 – 3407 .
26 Hoffmann , V.H. , Hungerbuhler , K. , and McRae , G.J. ( 2001 ) Ind. Eng. Chem. Res. , 40 , 4513 – 4524 .
27 Chen , H. , and Shonnard , D.R. ( 2004 ) Ind. Eng. Chem. Res. , 43 , 535 – 552 .
28 Jim é nez - Gonz á lez , C. , Constable , D.J.C. , Curzons , A.D. , and Cunningham , V.L. ( 2002 ) Clean Tech. Environ. Policy , 4 , 44 – 53 .
29 Hossain , K.A. , Khan , F.I. , and Hawboldt , K. ( 2007 ) Ind. Eng. Chem. Res. , 46 , 8787 – 8795 .
30 Modi , A. , Aumond , J.P. , Mavrovouniotis , M. , and Stephanopoulos , G. ( 1996 ) Comput. Chem. Eng. , 20 , S375 – S380 .
82 3 Solvent Use and Waste Issues
31 Gani , R. , Jim é nez - Gonz á lez , C. , and Constable , D.J.C. ( 2005 ) Comput. Chem. Eng. , 29 , 1661 – 1676 .
32 Gani , R. , Gomez , P.A. , Folic , M. , Jim é nez - Gonz á lez , C. , and Constable , D.J.C. ( 2008 ) Comput. Chem. Eng. , 32 , 2420 – 2444 .
33 Alfonsi , K. , Colberg , J. , Dunn , P.J. , Fevig , T. , Jennings , S. , Johnson , T.A. , Kleine , H.P. , Knight , C. , Nagy , M.A. , Perry , D.A. , and Stefaniak , M. ( 2008 ) Green Chem. , 10 , 31 – 36 .
34 Capello , C. , Fischer , U. , and Hungerbuh-ler , K. ( 2007 ) Green Chem. , 9 , 917 – 934 .
35 United States Environmental Protection Agency ( 1995 ) SAGE 2.1, Solvent Alternatives GuidE: User Manual , United States Environmental Protection Agency , Research Triangle Park, NC .
36 Harten , P. ( 2002 ) Waste Minimization of Toxic Industrial Solvents Using the EPA Software Tool, PARIS II (Program for Assisting the Replacement of Industrial Solvents) . RCRA National Meeting, United States Environmental Protection Agency, Washington, DC, January 2002 .
37 Gorsek , A. , and Glavic , P. ( 1997 ) Trans. IChemE Part A , 75 , 709 – 723 .
38 Yazbeck , D.R. , Carlos , A.M. , Hu , S. , and Tao , J. ( 2004 ) Tetrahedron Asymmetry , 15 , 2757 – 2763 .
39 Pollard , D.J. , and Woodley , J.M. ( 2006 ) Trends Biotechnol. , 25 , 66 – 73 .
40 Woodley , J.M. ( 2008 ) Trends Biotechnol. , 26 , 321 – 327 .
41 Abdel - Latif , E. , and Metwally , M.A. ( 2007 ) Monatsh. Chem. , 138 , 771 – 776 .
42 Kaupp , G. ( 2005 ) Top. Curr. Chem. , 254 , 95 – 183 .
43 Barton , P.I. ( 2000 ) Curr. Opin. Drug Discovery Dev. , 3 , 707 – 713 .
44 Ramzan , N. , Degenkolbe , S. , and Witt , W. ( 2008 ) Chem. Eng. J. , 140 , 201 – 213 .
45 Smallwood , I. ( 2002 ) Solvent Recovery Handbook , 2nd edn , Taylor & Francis , Boca Raton, FL , pp. 77 – 114 .
46 Rockwell Automation (2008) ProsCon ™ : Process & Control Solutions , Rockwell Automation , Milwaukee, WI , www.rockwellautomation.com (accessed October 2008).
47 Solutex TM Ltd ( 2008 ) Ellesmere, Shropshire, UK, www.solutex.co.uk (accessed September 2008).
48 Urtiaga , A.M. , Gorri , E.D. , G ó mez , P. , Casado , C. , Ib á ñ ez , R. , and Ortiz , I. ( 2007 ) Drying Tech. , 25 , 1819 – 1828 .
49 Slater , C.S. ( 1997 ) J. Environ. Sci. Health , A32 , 1339 – 1352 .
50 Urtiaga , A.M. , Gorri , D. , and Ortiz , I. ( 2005 ) Sep. Purif. Technol. , 49 , 245 – 252 .
51 Slater , C.S. , Savelski , M.J. , Taylor , S. , Kiang , S. , LaPorte , T. , and Spangler , L. ( 2007 ) American Institute of Chemical Engineers, Annual Meeting, Salt Lake City, UT, November 2007 , p. 223f .
52 Taylor , S. , Kiang , S. , Spangler , L. , Slater , C.S. , Savelski , M.J. , and Hesketh , R. ( 2007 ) 11th Annual ACS Green Chemistry and Engineering Conference, Washington, DC, June 2007 , p. 37 .
53 Savelski , M.J. , Slater , C.S. , Hounsell , G. , Pilipauskas , D. , and Urbanski , F. ( 2008 ) 12th Annual ACS Green Chemistry and Engineering Conference, Washington, DC, June 2008 , p. 133 .
54 Slater , C.S. , Savelski , M.J. , Hounsell , G. , Pilipauskas , D. , and Urbanski , F. ( 2008 ) Proc. 2008 Meeting Amer. Inst. Chem. Eng. Philadelphia, PA, November 2008 , p. 290b .
55 Scot , A. (2008) Chemical Week , http://www.chemweek.com/people_and_busi-ness/green_issues/12391.html (accessed June 2008).
56 Cheong , W. , and Barton , P.I. ( 1999 ) Ind. Eng. Chem. Res. , 38 , 1504 – 1564 .
57 Zeboudj , S. , Belhaneche - Bensemra , N. , Belabbes , R. , and Bourseau , P. ( 2006 ) Chem. Eng. Sci. , 61 , 1293 – 1299 .
58 McKenna , T.F. ( 1994 ) Chem. Eng. Sci. , 50 , 453 – 467 .
59 Pfaudler, Inc. (2008) Rochester, NY, www.pfaudler.com (accessed October 2008).
60 Slater , C.S. , Savelski , M.J. , Lefebvre , B. , and Hesketh , R.P. ( 2008 ) 12th Annual ACS Green Chemistry and Engineering Conference Washington, DC, June 2008 , p. 173 .
61 Seyler , C. , Capello , C. , Hellweg , S. , Bruder , C. , Bayne , D. , Huwiler , A. , and Hungerb ü hler , K. ( 2006 ) Ind. Eng. Chem. Res. , 45 , 7700 – 7709 .

83
4 Environmental and Regulatory Aspects David Taylor and Vyvyan T. Coombe
4.1 Historical Perspective
There is a tendency to think that the issue of Pharmaceuticals in the Environment ( PIE ) is a relatively recent one brought to prominence over the past decade by high profi le works such as the treatise ‘ Our Stolen Future ’ [1] and ever more lurid newspaper headlines. However, reviews of the issue were appearing at least a decade earlier including some remarkably prescient content. The publication in 1985 of a review of the fate of pharmaceutical chemicals in the environment [2] raised many of the issues that are still of concern today.
Indeed, as early as 1981 a study carried out into trace organic substances in the river Lee [3] identifi ed a number of pharmaceutical derived species including metabolites of the benzodiazepines, phenobarbitone, ethinyl estradiol, and clofi -bric and salicylic acids. They recognized that pharmaceuticals can enter the aquatic environment through two main channels – from manufacturing processes and through patient use – and that the latter route was the most important and the more diffi cult to control.
They also recognized that there are three principal possible fates for pharma-ceuticals discharged to the aquatic environment: biodegradation, metabolism/partial degradation, or persistence. They realized that treatment at sewage treat-ment works to remove pharmaceuticals would require advanced techniques and would be costly, and, fi nally, they raised the question of what effects long - term exposure to low levels of pharmaceutical compounds in potable water might have on the general populace.
Their conclusions were that many pharmaceuticals would degrade to innocuous substances but that degradation testing should take place as part of the portfolio of drug testing and also that analytical methods available at the time were inade-quate to measure the expected concentrations of pharmaceuticals in the environ-mental matrices concerned.
One of the next big realizations came with the publication of a paper by Buser [4] . These researchers had been analyzing samples from Swiss lakes and the North
Green Chemistry in the Pharmaceutical Industry. Edited by Peter J. Dunn, Andrew S. Wells and Michael T. Williams© 2010 WILEY-VCH Verlag GmbH & Co. KGaA, WeinheimISBN: 978-3-527-32418-7

84 4 Environmental and Regulatory Aspects
Sea for contamination by phenoxyalkanoic acids, a group of widely used herbi-cides. They discovered that one of the analytes, which was practically ubiquitous in their samples, was in fact the structurally analogous clofi bric acid, a high - vol-ume pharmaceutical used as a blood lipid regulator. The concentrations found in the North Sea (1 – 2 ng L − 1 ) suggested that the lifetime of clofi bric acid in the envi-ronment was much longer than had been anticipated and brought forward the notion that some pharmaceuticals in the environment might be very persistent.
There have been numerous examples in the past twenty years of pharmaceuti-cals being detected in tiny quantities almost ubiquitously in the environment, but the big unknown was whether they could be having any effect. This question was answered, at least for one type of compound, in the latter half of the 1990s. Research at that time clearly demonstrated that sewage effl uent from municipal treatment works contained chemicals that had estrogenic properties [5 – 9] and that these materials were having a signifi cant detrimental effect on the male fi sh in populations living near the effl uent sources. In 1998 using Toxicity Identifi cation and Evaluation ( TIE ) techniques and sample fractionation, three of the compounds responsible were identifi ed as two natural hormones (17 β - estradiol and estrone) and one synthetic steroid 17 α - ethinyl estradiol. These female estrogens were found to have a feminizing effect, causing the formation of ova in the testes and signifi cantly raising the level of an egg yolk protein, vitellogenin, in the blood of male fi sh. These effects had a signifi cant impact on the population viability of affected fi sh, causing population declines. For the fi rst time pharmacologically active substances had been shown to have a signifi cant, long - lasting environmental effect. The issue of PIE had truly arrived.
4.2 Pharmaceuticals in the Environment
4.2.1 Presence
One of the pivotal papers to raise awareness of the issue of PIE, particularly in the United States, was the US Geological Survey ( USGS ) National Reconnaissance programme on pharmaceuticals, hormones, and other wastewater contaminants in United States streams [10] . The work provided the fi rst nationwide survey for these contaminants in the United States, and the results were, to many people, startling. The study analyzed samples from a network of 139 streams across the country for 95 organic wastewater contaminant s ( OWC s) including 30 veterinary and human antibiotics and prescription medications and 14 artifi cial and naturally occurring steroids and hormones. Out of the 95 OWCs analyzed, 82 were detected in at least one sample and at least one OWC was detected in 80% of the samples collected.
One of the main reasons that PIE has been a growing issue over the past decade is undoubtedly the improvement in techniques available to the analytical chemist.

4.2 Pharmaceuticals in the Environment 85
In 1981 the Waggott study [3] employed extraordinarily tedious liquid - liquid extrac-tions on very large volumes of sample (125 L), liquid - solid extractions, distillations, XAD resin concentrations, and derivatizations before fi nal analysis by HPLC or GC coupled to MS (GC - MS). While the use of GC - MS would have undoubtedly led to the unambiguous identifi cation of target species, the nonvolatility of many of the species of interest would have rendered the technique unusable. The study reported detection levels in 3 tranches, ‘ trace ’ ( < 1 ng L − 1 ), small ( < 0.1 μ g L − 1 ), and large ( > 0.1 μ g L − 1 ). Considering the techniques available, these detection limits were remarkable, but as the author states in the conclusions to the work ‘ … at present the state of the art of liquid chromatography is not suffi ciently advanced for its application as a method of broad survey analysis. ’
By contrast, the USGS survey used relatively simple tandem solid - phase extrac-tion techniques on 500 – 1000 mL samples followed by LC - MS using positive elec-trospray ionization and selected ion monitoring, or continuous liquid - liquid extraction techniques followed by GC - MS. Interestingly, minimum reporting levels were not dissimilar to those of the Waggott study [3] , lying between 5 ng L − 1 and 1 μ g L − 1 (with most being below 0.1 μ g L − 1 ). However, there were big differ-ences in the quantities of sample required and the complexities of sample workup between the two studies which admirably illustrate the changes that have taken place in state - of - the art analysis in the intervening three decades.
Another pivotal investigation in the United States was the fi ve - month study by the Associated Press organization [11] on drugs contaminating water supplies in the United States. Drug residues were found in the drinking water supplies of 24 major metropolitan areas leading to inevitable questions on what effects a mixture of pharmaceuticals, albeit in minute quantities compared to therapeutic doses, might be having on the health of the human population.
So what causes some drugs to appear in samples taken from the natural envi-ronment? Inevitably, whether a drug is present or not in a particular sample depends on many factors. The sheer amount of drug prescribed is an important factor. Popular over the counter ( OTC ) drugs for analgesia, for example, are manu-factured on a scale of many thousands of tons per year, whereas highly potent biologically active molecules for treating cancer or controlling reproduction may only be produced in quantities of a few kilograms per year.
The amount of the drug that is metabolized in the human body is also impor-tant, as is the mode of metabolism. The work of Panter [12] showed that whilst the synthetic estrogen ethinyl estradiol was conjugated in the human body to form the glucuronic metabolite (which is considerably less estrogenically potent than the parent estrogen), this conjugate was subsequently broken down during the sewage treatment process to reform the parent estrogen with the concomitant reactivation of its estrogenic potency.
Undoubtedly the most important features of what determines whether a drug is detected in the environment are its physical and ecotoxicological properties, and these will be discussed in the following sections.
86 4 Environmental and Regulatory Aspects
4.2.2 Persistence
Persistence is defi ned as the act or fact of continuing in existence. This is a concept that is relatively easy for the lay individual to grasp but one that is extremely dif-fi cult to quantify accurately. The problem is that whether a pharmaceutical is persistent or not depends, not only on its physical properties but also, critically, on the nature of the environment in which it fi nds itself. Persistence is usually quanti-fi ed by making reference to the half life of the material, which is the interval required for the quantity to decay to half of its initial value.
It is often stated that since pharmaceuticals are found in the environment they must be very persistent. This is not the case. Simple arithmetic demonstrates that if one mole of a material with a half life of only one day (relatively short by most standards) was released to the environment then it would still take 80 days before it was statistically likely that all of the material had disappeared. Since pharma-ceuticals are being discharged to the environment on a more or less continuous basis it is unsurprising that they are often detected whether they are persistent or not.
There are a number of mechanisms by which substances can be degraded in the natural environment. Hydrolysis, photolysis, and biodegradation may all play a part. One of the most important mechanisms is considered to be biodegrada-tion – the breakdown of substances by living organisms, usually microorganisms such as bacteria and fungi. Indeed, measurement of the biodegradability is recom-mended by environmental risk assessment guidelines both in Europe [13] and around the world. The major problem is that the tests available for measuring biodegradability can only provide a proxy for what will take place in the natural environment – and not a very good one at that. This is because no test can repro-duce the staggering variety of organisms that the substance concerned will come into contact with in the real world. In addition, laboratory testing usually involves the use of microorganism concentrations at much lower levels than those found in typical municipal treatment works and use unadapted inocula (ones that have not been exposed to the substance before), and thus the results of such tests are very precautionary. Whilst this precaution is to be condoned, in the authors ’ expe-rience virtually no pharmaceutical substance ever passes this so call ‘ ready biode-gradability ’ testing and the data are therefore of little use in determining whether a pharmaceutical substance will actually be persistent in the real environment.
4.2.3 Bioaccumulation
Bioaccumulation occurs when an organism absorbs a chemical substance at a rate greater than that at which the substance is lost. Thus, even if environmental levels of the substance are very low, the concentration of the substance in living organ-isms can be much higher. One indicator of whether particular substances will bioaccumulate is the partition coeffi cient P.

4.2 Pharmaceuticals in the Environment 87
The partition coeffi cient is defi ned as the ratio of the concentration of a sub-stance in the aqueous phase to the concentration of the substance in a water - immiscible solvent (usually n - octanol) as the neutral molecule . Partition coeffi cients are often quoted as log 10 values. Thus, a substance with a partition coeffi cient of 1000 would have a log P value of 3. This latter point on neutrality is very important. If the molecule in question contains groups that can act as proton (H + ) donors or acceptors, then the neutrality of the molecule will be signifi cantly affected by pH, and thus the pH at which the partition coeffi cient must be measured could be anywhere along the pH scale. Since bioaccumulation (which is effectively enhanced partitioning of a substance into the lipid tissues of an organism) will generally only occur for neutral molecules, measurement of the partition coeffi cient at extreme pH values (which are unlikely to exist in nature) is environmentally irrelevant.
A more pragmatic study is the determination of the distribution coeffi cient D. This is defi ned as the ratio between the concentration of the unionized substance in the water - immiscible organic solvent and the concentration of both ionized and unionized substance in the aqueous phase, and this also is usually quoted as its log 10 value. This value is not a constant but varies with pH. Its advantage is that it can be measured for any pH value (normally around pH 7), which provides an environmentally relevant measure of lipophilicity and thus a clear indication of whether the substance in question is likely to bioaccumulate via partitioning.
Actual measurement of the bioaccumulation of pharmaceuticals using living organisms (usually fi sh) is relatively rare. Bioconcentration factor s ( BCF ) are gen-erally determined using fi sh and, apart from the high cost (around US$ 70 000 per test in 2008), there are the ethical issues associated with using higher vertebrates in animal testing, and thus the practice is discouraged unless necessary. However, where the log D value exceeds a certain threshold (4.5 in current European guid-ance [13] ) suggesting a highly lipophilic compound at an environmentally relevant pH, then in vivo bioaccumulation testing is usually recommended. However even a high log D value does not necessarily result in a high BCF.
4.2.4 Ecotoxicology
The term ecotoxicology has been defi ned as ‘ the branch of toxicology concerned with the study of toxic effects, caused by natural or synthetic pollutants, to the constituents of ecosystems, animal (including human), vegetable and microbial, in an integral context ’ [14] .
The ecotoxicology of pharmaceuticals is of critical concern to the issue of PIE. The all important question is not whether pharmaceuticals are present in the environment – there is ample evidence that they are – but, at the concentrations at which they are found, whether they do any harm? The almost universally used paradigm for attempting to answer this question is the comparison of the Pre-dicted Environmental Concentration ( PEC ) with the Predicted No Effect Concen-tration ( PNEC ) – the so called PEC/PNEC ratio.
88 4 Environmental and Regulatory Aspects
Interestingly, until recently there have been signifi cant derogations on the regu-latory requirements for the ecotoxicity testing of pharmaceuticals. The United States Environmental Protection Agency ( EPA ) exempted all testing for com-pounds which were not expected to be in the environment at concentrations greater than 1 μ g L − 1 (this is the equivalent to a total usage in the United States of around 44 t y − 1 ) and similar exemptions existed in Europe.
Where ecotoxicity testing was carried out, the emphasis was on short - term, acute testing, usually over a period of no more than 96 h. This situation has changed as our understanding of the ecotoxicology of pharmaceuticals has improved and as regulators have come to recognize that the environment might not be suffi ciently safeguarded even with exposures down at these very low levels. Importantly, because of the work on endocrine disruptors [5 – 9] , our understanding of the chronic effects of pharmaceuticals is particularly enhanced compared to past decades and for some pharmaceuticals this is particularly important.
In the past it has been generally considered that acute short - term (eco)toxicity of a substance and its longer term chronic toxicity would roughly parallel one another and that, within an order of magnitude, the ratio of the acute toxicity value to the chronic toxicity value was relatively constant at between around 3 – 10. Indeed, a scan through the list of acceptable long - term Environmental Quality Standard ( EQS ) values (based on chronic toxicity testing) and the short term Maximum Acceptable Concentration ( MAC ) values (based on acute toxicity testing) published by the UK Environment Agency [15] generally bears this out.
This may not be the case for some pharmaceutical products. A major review in 1999 [16] highlighted the fact that while our knowledge of the biochemical effects of pharmaceuticals is considerable it is by no means comprehensive and that unpredicted and unknown side effects are often the norm. It also pointed out that the major concern is not necessarily the acute effects, which to some extent were amenable to analysis by historically used acute ecotoxicity tests, but is in actual fact the subtle effects that may be occurring over the entire lifespan of an organ-ism, (or indeed over short periods of a particularly sensitive life stage) together with possible additive effects of different pharmaceuticals acting on the same biological receptor. For these reasons regulators around the world are reviewing the guidelines associated with pharmaceutical environmental risk assessments. The European Medicines Evaluation Agency ( EMEA ) has recently completely revised its guidelines [13] with much greater emphasis on longer - term chronic ecotoxicity testing and longer - term fate of pharmaceuticals in the aquatic and ter-restrial environment.
This reemphasis has also led to an increase in the interest of particular organiza-tions in comparing the environmental properties of one drug with another – particularly if they are in the same drug class or have the same mode of action. One organization that has been particularly active in this regard is the Swedish Association of the Pharmaceutical Industry or L ä kemedelsindustrif ö reningen ( LIF ) in Swedish. This organization produces the Swedish offi cial drugs catalog – www.fass.se – which now provides for the fi rst time signifi cant environ-mental information on many of the pharmaceuticals authorized for prescription in Sweden [17] .

4.2 Pharmaceuticals in the Environment 89
Information is presented in three tiers:
Level 1 provides a simple environmental risk phrase based on the PEC/PNEC ratio:
PEC/PNEC ≤ 0.1 Use of the medicine has been considered to result in insignifi cant environmental risk.
0.1 < PEC/PNEC ≤ 1 Use of the medicine has been considered to result in low environmental risk.
1 < PEC/PNEC ≤ 10 Use of the medicine has been considered to result in moderate environmental risk.
PEC/PNEC > 10 Use of the medicine has been considered to result in high envi-ronmental risk.
If there is not suffi cient data to calculate the PEC/PNEC, the following statement will be used: Risk of environmental impact cannot be excluded due to lack of data.
Level 2 provides information to the prescribing medical practitioner on persistence and bioaccumulation:
Degradation:
The medicine is degraded in the environment or
The medicine is slowly degraded in the environment .
Bioaccumulation:
No signifi cant bioaccumulation potential or
Potential to bioaccumulate in aquatic organisms.
If the pharmaceutical fulfi lls the criteria for PBT (Persistent, Bioaccumulative and Toxic) and/or vPvB (very Persistent and very Bioaccumulative), the follow-ing phrase is added: The substance fulfi lls the EU criteria for PBT/vPvB classifi cation.
Finally, level 3 provides specialist environmental information such as:
Results from ecotoxicity tests.
Results from degradation tests.
Partition coeffi cient, for example, octanol/water or other indicator of bioaccu-mulation if more appropriate).
Test guidelines used, for example Organization for Economic Cooperation and Development ( OECD ), Food and Drug Administration ( FDA ).
Information about forms in which the pharmaceutical is excreted, parent com-pound as well as metabolites, and the percentages thereof
90 4 Environmental and Regulatory Aspects
Results of CMR ( Carcinogenic, Mutagenic, Reprotoxic ) tests and statement on endocrine disrupting potential.
Pharmacological activity of the metabolites.
Total sold amount in kilograms of Active Pharmaceutical Ingredient ( API ) on the Swedish market (including all products containing the same API) in the most recent year for which data are available.
Data interpretation in the context of risk and hazard assessment.
Risk assessment calculations.
4.2.5 The Current State of the Science
There are a number of areas which are currently very active with respect to research in the PIE arena.
The fi rst is improving our knowledge of environmental fate. In order to stem the fl ow of pharmaceuticals to the environment in the fi rst place, one of the main weapons is the biological sewage treatment plant. Improving our understanding and knowledge of why some pharmaceuticals are treated successfully and some are not and indeed why treatment varies so widely from plant to plant will undoubt-edly help, and thus much research is continuing into the adsorption and degrada-tion mechanisms that these plants facilitate.
The second area is a much greater emphasis on understanding the potential for long - term effects of pharmaceuticals in the natural environment. New guidelines [13] place much greater reliance on long - term chronic testing and sub - lethal end-points than previously. There is a greater emphasis on the possible effects of mixtures of pharmaceuticals and whether there are interactions between them in the environment.
Finally there is the question of ‘ how low is low enough ’ . With improvements in analytical techniques and technology carrying on apace there is little doubt that more pharmaceuticals will be found in more samples at ever lower levels. At some point the balance between societal benefi t and environmental risk must be made.
4.3 Environmental Regulations
The research, clinical trials, and manufacturing of pharmaceuticals are covered by rigorous compliance regulations with the object of ensuring consistent high quality. These Good Laboratory Practice ( GLP ) and Good Clinical Practice ( GCP ) regulations are strictly enforced and subject to random inspection. No new medici-nal product can be introduced onto the market until the appropriate medicines regulator, such as the EMEA or the FDA, has approved its safety, effectiveness, and quality.

4.3 Environmental Regulations 91
When a medicine does fi nally receive approval for marketing, that authorization relates to both the medicine and the method by which it was manufactured. Simple product sampling techniques, as used in other industries, are insuffi cient to ensure the quality that is needed, and medicines regulators require manufacturers to follow strict Good Manufacturing Practice guideline s ( GMP ) [18] . These involve a holistic approach to the whole manufacturing cycle. There is a requirement for extensive and rigorous qualifi cation and validation of equipment and procedures, together with comprehensive documentation of every aspect of the process. Regu-latory agencies undertake regular, often unannounced inspections and will expect to inspect any new manufacture prior to start - up. These manufacturing quality requirements are intended to ensure consistency between the medicine that was tested in the clinical trials and the product eventually used by the patient.
These G × P regulations have led to a perception that the industry is already very strictly regulated. However, until the end of the twentieth century almost all of this regulation was focused entirely on human safety, and little attention was paid by the medicines regulators to environmental issues. The last decade has seen a gradual change in some aspects of medicines regulation. For example, strict application of the GMP regulations, perversely, often inhibited the implementa-tion of improvements to the environmental sustainability of manufacturing proc-esses, since any signifi cant changes triggered a requirement for further confi rmatory clinical data. A more pragmatic approach is now being taken which enables some improvements to the manufacturing process to continue to be made. Similarly, although the medicines approval process remains dominated by considerations of human safety it now increasingly includes an assessment of environmental risk.
Many people within the pharmaceutical industry seem to think that the only regulations which apply to pharmaceuticals are those derived from the medicines regulators such as the United States FDA and the EMEA. However, this is not the case, and increasingly pharmaceuticals are coming to the attention of environmen-tal regulators.
The remainder of this section summarizes the key pieces of regulation in three sections; the fi rst considers those regulations related to the product as placed on the market, the second examines the regulation of manufacturing processes and associated waste management, while the fi nal section looks at broader environ-mental quality regulations that can have a signifi cant impact on both product and manufacturing processes. We have chosen to concentrate on current EU regula-tions since at present these are the most comprehensive in the world with respect to environmental risk assessment and are being used as a blueprint by many other countries.
4.3.1 Product Regulations
Until recently the requirements for the evaluation of the environmental impact of APIs were rudimentary and only required in the United States and Europe.

92 4 Environmental and Regulatory Aspects
However, the emergence of the PIE issue has fundamentally changed this. In 2007, the EMEA released a guidance document setting out a comprehensive methodology for the evaluation of the environmental risk assessment of medi-cines for human use [13] . This applies, with some exceptions, to all new active ingredients entering the EU market and to any existing substance where a change in use patterns would lead to a signifi cant increase in environmental exposure. The fi rst pre - screening step in the assessment provides, with some caveats, for an exclusion from any further assessment for substances whose pre-dicted environmental concentration is < 0.01 μ g L − 1 In practice very few sub-stances fall below this limit, which equates to a patient dose of < 2 mg d − 1 . Although the result of this assessment cannot be used to prevent the granting of a marketing authorization [19] the information can be used by environmental regulators to exert controls on the discharge of the material into the environ-ment (see Section 4.3.2 ).
Similar legislation is currently being drafted in other countries, with imple-mentation expected in Canada in 2009 [20] and Japan by 2011. In 1997, the FDA relaxed its requirements for the environmental risk assessment of active ingredi-ents as part of a deregulation initiative in the United States [21] .The new requirements provided a ‘ categorical exclusion ’ , that is an exemption from envi-ronmental assessment for all active ingredients unless they exceeded a concen-tration of 1 μ g L − 1 at the point of entry into the aquatic environment. In essence, provided that the applicant confi rms that there are no ‘ extraordinary circum-stances ’ to prevent it, an environmental risk assessment for a product is only required when sales exceed 44 tonnes per year. It is possible that the United States will introduce similar regulations to those being developed elsewhere during the next few years.
The collection of unused and life - expired medicines is another area where regu-lations are developing. Several countries in Europe, France, Sweden and the United Kingdom have had collection systems in place for many years. However, in 2004 the EU required all its Member States to establish formal collection systems [19, 22] . A similar situation exists in Canada where there are a number of different provincial systems, and the Federal Government is evaluating the benefi ts of introducing a national scheme (E. Gagnon, personal communication). In the United States there is a wide range of local initiatives, but continuous col-lection systems are more diffi cult to operate because of requirements of the United States Drug Enforcement Agencies related to potential public access to controlled drugs.
Environmental regulation also applies, at least in Europe, to the packaging of human medicines [23] . The Directive on packaging and packaging waste is primarily aimed at increased recycling, but it also contains (Article 9 and Annex II) a set of ‘ essential requirements ’ with which all packaging introduced into the market after 1997 had to comply. In essence manufacturers must be able to demonstrate that their packaging is either reusable or recoverable and has been specifi cally designed to minimize the resources used in its manufacture.

4.3 Environmental Regulations 93
4.3.2 Process Regulations
In addition to the environmental regulations specifi cally related to the pharmaceu-tical product itself, a range of regulations also apply to the manufacturing process by which the product is made. These seek to minimize the overall environmental impact of the manufacturing facility both during normal operations and under abnormal conditions. Historically such regulation has been concerned solely with direct emissions from the facility to air and water. However, in recent years there has been a trend toward a more integrated approach encompassing the broader life - cycle of the manufacturing process. Most of these regulations are not specifi c to pharmaceutical manufacture, but they nevertheless can act as a driver to improve process design.
4.3.2.1 Chemicals Control The fi rst systematic approach to the regulation of chemical use was the introduc-tion in the United States in 1976 of the Toxic Substance Control Act. This was followed by a series of similar laws in many countries including Australia, Canada, China, and Japan. The principal object of these regulations was to ensure that relevant information was available concerning the hazardous properties of chemi-cals in order that users and regulators could assess any risks to human health or the environment resulting from their use. Most systems adopted a two - stage approach: an inventory of ‘ existing ’ substances currently on the market was assem-bled, and, after a set date, all substances introduced into the market that were not on the inventory were declared to be ‘ new ’ substances. New substances needed to have a minimum package of hazard data before manufacture or use, and a system was put in place to ensure that data on ‘ existing ’ chemicals would be retrospec-tively provided.
In the EU, a similar series of Directives and Regulations eventually culminated in the introduction in 2006 of the R egistration E valuation A uthorization and Restriction of Ch emical substances ( REACH ) Regulation concerning the registra-tion, evaluation, authorization, and restriction of chemicals [24] . However, in addition to requiring the provision of hazard data the REACH Regulation also enables the competent authorities to directly control the use to which substances may be put. A ‘ Restriction ’ , can be applied preventing the substance being used for specifi ed purposes, or a substance may require an ‘ Authorization ’ which only allows the substance to be used for specifi ed purposes.
Substances used in human medicines, including excipients, are exempt from many of the provisions of REACH, including Authorization, but they are not exempt from the Restriction provisions in REACH Title VIII. This enables the European Commission to restrict the manufacture, marketing, and use of any substance including pharmaceuticals.
‘ When there is an unacceptable risk to human health or the environment, arising from the manufacture, use or placing on the market of substances,
94 4 Environmental and Regulatory Aspects
which needs to be addressed on a Community - wide basis, Annex XVII shall be amended in accordance with the procedure referred to in Article 133(4) by adopting new restrictions, or amending current restrictions in Annex XVII, for the manufacture, use or placing on the market of substances on their own, in preparations or in articles, pursuant to the procedure set out in Articles 69 to 73. Any such decision shall take into account the socio - economic impact of the restriction, including the availability of alternatives. ’
EC Regulation 1907/2006. Art. 68
This provision is unlikely to be used in practice but it could be used to restrict sales of a pharmaceutical which, post launch, was found to be posing an unaccept-able risk to the environment.
Although substances used ‘ in human medicines ’ are exempt from most of the REACH Regulation, substances used ‘ in the manufacture of human medicines ’ are covered by the Regulation. Thus, pharmaceutical companies also need to comply with the registration provisions of REACH for all the substances used in their manufacturing processes. They also need to take into account the stringent and potentially very time - consuming procedures that will apply to substances on Annex XIV, those requiring ‘ Authorization ’ .
One of the objectives of REACH is that ‘ substances of very high concern ’ should, in principle, only be used where there is no satisfactory alternative and where the socioeconomic benefi t outweighs the potential damage to human health and/or the environment. Substances of very high concern are defi ned in Article 57 of the REACH Regulation and include carcinogens, mutagens and reprotoxins together with substances that are ‘ persistent, bioaccumulative and toxic ’ ( PBT s) or ‘ very persistent and very bioaccumulative ’ ( vPvB s). A pharmaceutical company that wishes to use, or continue to use, a substance in its manufacturing processes that has been included in Annex XIV will have to seek authorization. It should not be diffi cult to demonstrate a positive socioeconomic analysis for a human medicine, but before being granted an ‘ Authorization ’ the applicant will have to demonstrate that all alternative substances and process routes have been investigated. A prudent company will be rigorously applying the principles of Green Chemistry in its process design and pursuing an active avoidance policy with respect to substances that might be candidates for Annex XIV.
Although REACH involved a revision of most EU chemical control legislation, one existing directive that was not incorporated into REACH is the Solvent Emis-sions Directive [26] . The aim of this Directive is to prevent or reduce the effects of volatile organic compound s ( VOC s) on the environment (mainly via the atmos-phere) and reduce the potential human health risks from solvent - based activities. Most of the provisions of the directive relate to emission and inventory control, but one part of the directive has potentially negative consequences in terms of Green Chemistry.
Article 5.6 requires that installations which use substances or preparations containing VOCs that are classifi ed as carcinogenic, mutagenic, or toxic to

4.3 Environmental Regulations 95
reproduction, and which carry specifi ed risk phrases, have to take steps to replace them, as far as possible, with less harmful substances and preparations within the shortest possible time. This is a hazard - based substitution requirement that does not allow risk (exposure) to be taken into account. As a consequence it may lead to the mandatory substitution of low - risk solvents by ones which pose a higher risk. For example a proposal was recently considered by the European Chemicals Bureau (document no. ECBI/74/95 - Add 3) for the classifi cation and labeling of ethanol as a mutagen under the Dangerous Substances Directive (67/548/EEC). The consequence of such a classifi cation would be that ethanol would need to be replaced in pharmaceutical manufacturing processes despite it being probably the safest and greenest of all organic solvents.
4.3.2.2 Integrated Pollution Control In most parts of the world the local or national regulator(s) responsible for the environment also have powers to limit the amount of material that may be released from a manufacturing process into the atmosphere or local watercourses. In some cases, where the factory effl uent is discharged into a sewerage system, this control may be exerted indirectly via limits on the eventual release by the sewerage system operator.
In the United States a comprehensive document has been published by the EPA [25] outlining Best Available Treatment options and the regulatory treatment of effl uents arising from pharmaceutical manufacture. However, the most compre-hensive control system is currently that provided in the EU by the Directive on Integrated Pollution Prevention and Control [26] , and this is becoming a model for the development of similar legislation across the world.
The purpose of the Directive is to achieve integrated prevention and control of pollution arising from those industries considered to pose the largest risk to the environment (these activities are listed in Annex I). It lays down measures designed to prevent or, where that is not practicable, to reduce emissions to the air, water, and land from these activities, including measures concerning waste, in order to achieve a high level of protection of the environment taken as a whole. Research and development is excluded from the provisions of the Directive, but pharma-ceutical manufacturing is specifi cally included in Annex I of the Directive under Section 4.5 ‘ Installations using a chemical or biological process for the production of basic pharmaceutical products. ’ Secondary manufacturing is, in principle, exempted unless it is deemed by the regulatory authorities to be ‘ … other directly associated activities which have a technical connection with the activities carried out on that site and which could have an effect on emissions and pollution ’ (Article 2.3). This somewhat ambiguous situation is likely to change in the near future. The Directive is currently being revised [27] , and the proposed rewording of Annex I Section 4.5 is very clear ‘ Production of pharmaceutical products including intermediates. ’
The six general principles are laid out in Article 3, which requires the Competent Authorities in each Member State to ensure that installations are operated in such a way that

96 4 Environmental and Regulatory Aspects
(a) all the appropriate preventive measures are taken against pollution, in particular through application of the best available techniques;
(b) no signifi cant pollution is caused;
(c) waste production is avoided; where waste is produced, it is recovered or, where that is technically and economically impossible, it is disposed of while avoiding or reducing any impact on the environment;
(d) energy is used effi ciently;
(e) the necessary measures are taken to prevent accidents and limit their consequences;
(f ) the necessary measures are taken upon defi nitive cessation of activities to avoid any pollution risk and return the site of operation to a satisfactory state.
The key principle from the perspective of the pharmaceutical sector is (a) sup-ported by (c) and (d). In essence, to obtain a permit to operate a manufacturing facility the operator needs to be able to demonstrate that ‘ best available technique s ’ ( BAT ) are in use for all the products being manufactured. Article 6.1 makes it clear that the application for a permit, a document which is in the public domain, must include ‘ the proposed technology and other techniques for preventing or, where this is not possible, reducing emissions from the installation. ’ In other words a simple statement that this process is BAT is not suffi cient; the applicant must document both the rationale and a description of the alternatives that have been rejected.
Unlike the majority of ‘ bulk ’ chemicals, most pharmaceuticals are very complex organic molecules that have to be constructed using multiple synthetic steps, often involving the isolation and purifi cation of intermediate products. As a conse-quence, process effi ciency has historically been very low [28] . In recent years, driven by both cost and sustainability issues, the research pharmaceutical compa-nies have become industry leaders in the introduction of Green Chemistry and technology techniques into their process design. The implementation of environ-mental legislation such as this directive provides a further stimulus.
The permit granted to the operator by the competent authority will set out a range of conditions that must be met. These normally include limitations on what may be discharged into air and water. These can relate either to integrated param-eters such as pH or Biological Oxygen Demand or to specifi c substances such as copper. Until recently, competent authorities have not set specifi c limits on indi-vidual pharmaceutical active ingredients, but as the IPPC directive has come into full effect in the last few years a number of specifi c limits have started to appear [29] . With the growing interest and public concern about the presence of pharmaceutical residues in drinking water, the number of specifi c limits imposed on the release of active ingredients from manufacturing facilities can be expected to rise.
Potentially of greater signifi cance is the provision (Article 10) in the Directive that forbids a competent authority to grant a permit to any installation whose

4.3 Environmental Regulations 97
emissions would lead to an environmental quality standard being exceeded. An increasing number of precautionary environmental water quality standards are being produced by Member States as part of the implementation of the EU Water Framework Directive (See Section 4.3.3 ), and this is likely to provide additional pressure to reduce emissions from pharmaceutical manufacturing facilities.
4.3.3 Environmental Quality Regulations
In addition to regulations governing products and manufacturing processes, a further series of regulations also apply to general environmental quality which, although not directly impacting the pharmaceutical industry, can nevertheless have a signifi cant secondary impact.
In 2000 the EU introduced a new holistic framework directive on water quality [30] , which subsumed a number of previous Directives into a single piece of leg-islation. The aim of this Directive is for all community waters to be of ‘ good ecological quality ’ by 2016. This may have implications for pharmaceutical com-panies in a number of ways. There is unlikely to be any signifi cant impact on point source discharges from manufacturing facilities since these have been under stringent control for many years. However the release of pharmaceutical products from wastewater treatment plants may become an issue in some areas.
Each Member State has to evaluate its own water quality, identify why some areas do not reach the required standard, and then implement improvement plans. If a pharmaceutical residue is perceived to be contributing to the poor water quality it is probable that an environmental quality standard will be set for it. Compliance with this standard will then be needed, and this can only be accomplished by improving wastewater treatment or restricting sales. Draft standards have already been set in Germany for carbamazepine (0.5 μ g L − 1 ), diclofenac (0.1 μ g L − 1 ), eryth-romycin (0.02 μ g L − 1 ), ibuprofen (7.1 μ g L − 1 ), and metoprolol (7.3 μ g L − 1 ) [31] , and in the United Kingdom for 17 α - ethinyl estradiol (0.0001 μ g L − 1 ).
In addition to this activity within Member States, Article 16 of the Directive requires the European Commission to identify a list of ‘ priority pollutants ’ for control by standards set at Community level. In addition, emissions of a subset of this list, the ‘ priority hazardous pollutants ’ , need to be reduced to zero by 2015. At the present time no pharmaceuticals appear on this list of priority pollutants [32] , although the European Parliament did try unsuccessfully to have carbamazepine, clotrimazole, and diclofenac added to the list during the negotiations.
Many countries also have stringent regulations governing the quality of drinking water. Although these increasingly place limitations on a range of micro contami-nants there are no countries at present that explicitly include pharmaceuticals in these listings. In Australia [33] , the Environment Protection and Heritage Council, the Natural Resource Management Ministerial Council, and the Australian Health Ministers ’ Conference have published, in connection with water reuse, draft drink-ing water standards for 87 individual pharmaceuticals. These are based on human toxicological data and range from 0.01 μ g L − 1 to 35 mg L − 1 .
98 4 Environmental and Regulatory Aspects
In the United States, contaminant levels in drinking water are regulated under the Safe Drinking Water Act. The EPA regularly reviews these contaminants, and in 2008 they released a third draft Contaminant Candidate List for public review and comment [34] . As part of the process to develop the list, the Agency evaluated pharmaceuticals and personal care products to identify those that had the potential to occur in drinking water provided by public utilities. EPA considered 287 chemi-cals identifi ed as pharmaceuticals and personal care products; however, only one, nitroglycerin, was included on the draft list because most occurred at levels far below those currently associated with any adverse health effects, based on the best available human health effects data
In the EU Directive on Drinking Water Quality [35] , 23 individual chemical parameters have specifi c limits together with two group limits for polycyclic aro-matic hydrocarbons and pesticides. In the case of pesticides, no individual pesti-cide is permitted to exceed 0.1 μ g L − 1 , and pesticides in total should not exceed 0.5 μ g L − 1 . These limits were a compromise, the original demand having been for a ‘ zero ’ limit for pesticides in drinking water, and these standards were set, in 1998, as the effective analytical detection limit. The revision of this directive and its application to pharmaceuticals is currently under discussion, although it seems unlikely that specifi c limits will be set for individual pharmaceuticals [36] .
4.4 A Look to the Future
A lot has been learnt since this issue fi rst came to light in the late 1990s, but more work is still needed to deal with uncertainties. Further elucidation of the fate of pharmaceuticals in wastewater treatment plants together with a better understand-ing of how such processes can be optimized to ensure maximum removal effi -ciency is urgently needed. We can also expect major advances in our understanding of the interaction of pharmaceuticals with biological systems other than mammals, enabling more intelligent testing strategies to be devised.
Advances in the development of ‘ green pharmaceuticals ’ will also take place, albeit somewhat slowly [37] . The biggest change is likely to be derived from the development of biopharmaceuticals which are inherently degradable. Improve-ments in the environmental degradability of conventional pharmaceuticals will take longer, and is predicated on achieving a greater understanding of the relation-ship between chemical structure and degradability.
Further developments in transparency of the potential environmental impact of pharmaceuticals can be expected. The pharmaceutical research industry has made a good start with the voluntary development of the Swedish Environmental Clas-sifi cation Scheme [38] , and this has generated much interest in other countries (E. Gagnon, personal communication) [39, 40] .
There is probably little need for additional primary regulation in either Europe or the United States. However, it is likely that the existing legal instruments such as the Clean Drinking Water Act in the United States and the Water Framework
References 99
Directive in the EU will be applied more explicitly to pharmaceuticals in order to control discharges to the aquatic environment. The environmental risk assessment of active ingredients is likely to become more sophisticated and uniform among Europe, Japan, and North America. However, a referral to the International Con-ference on Harmonization ( ICH ) of Technical Requirements for Registration of Pharmaceuticals for Human Use is probably premature in view of the rapid sci-entifi c developments in this area. Nevertheless, harmonization by ICH is possible within the next 10 years.
References
1 Colborn , T. , Dumanoski , D. , and Myers , J.P. ( 1996 ) Our Stolen Future: Are We Threatening Our Fertility, Intelligence, and Survival? A Scientifi c Detective Story , Dutton , New York .
2 Richardson , M.L. , and Bowron , J.M. ( 1985 ) J. Pharm. Pharmacol. , 37 , 1 – 12 .
3 Waggott , A. ( 1981 ) Chem. Water Reuse , 2 , 55 – 99 .
4 Buser , H.R. , M ü ser , M.D. , and Theobald , N. ( 1998 ) Environ. Sci. Technol. , 32 , 188 – 192 .
5 Purdom , C.E. , Hardiman , P.A. , Bye , V.J. , Eno , N.C. , Tyler , C.R. , and Sumpter , J.P. ( 1994 ) Chem. Ecol. , 8 , 274 – 285 .
6 Folmar , L.C. , Denslow , N.D. , Rao , V. , Chow , M. , Crain , D.A. , Enblom , J. , Marcino , J. , and Guillette , L.J. , Jr. ( 1996 ) Environ. Health Perspect. , 104 , 1096 – 1101 .
7 Harries , J.E. , Sheahan , D.A. , Jobling , S. , Matthiessen , P. , Neall , P. , Routledge , E.J. , Rycroft , R. , Sumpter , J.P. , and Tylor , T. ( 1996 ) Environ. Toxicol. Chem. , 15 , 1993 – 2002 .
8 Harries , J.E. , Sheahan , D.A. , Jobling , S. , Matthiessen , P. , Neall , P. , Sumpter , J.P. , Tylor , T. , and Zaman , N. ( 1997 ) Environ. Toxicol. Chem. , 16 , 534 – 542 .
9 Lye , C.M. , Frid , C.L.J. , Gill , M.E. , and McCormick , D. ( 1997 ) Mar. Pollut. Bull. , 34 , 34 – 41 .
10 Kolpin , D.W. , Furlong , E.T. , Meyer , M.T. , Thurman , E.M. , Zaugg , S.D. , Barber , L.B. , and Buxton , H.T. ( 2002 ) Environ. Sci. Technol. , 36 , 1202 – 1211 .
11 Donn , J. , Mendoza , M. , and Pritchard , J. ( 2008 ) Associated Press http://hosted.
ap.org/specials/interactives/pharmawa-ter_site/index.html (accessed 25 November 2008).
12 Panter , G.H. , Thompson , R.S. , Beresford , N. , and Sumpter , J.P. ( 1999 ) Chemosphere , 38 , 3579 – 3596 .
13 European Medicines Agency ( 2007 ) Guideline on the environmental risk assessment of medicinal products for human use . European Medicines Evaluation Agency Guidance Note. EMEA/CHMP/SWP/4447/00.Web: http://www.emea.europa.eu/pdfs/human/swp/444700en.pdf (accessed 25 November 2008).
14 Truhaut , R. ( 1997 ) Ecotoxicol. Environ. Saf. , 1 , 151 – 173 .
15 UK Environment Agency ( 2003 ) Integrated Pollution Prevention and Control (IPPC) Environmental Assessment and Appraisal of BAT. Horizontal Guidance Note H1 , UK Environment Agency .
16 Daughton , C.G. , and Ternes , T.A. ( 1999 ) Environ. Health. Perspect. , 107 ( Suppl. 6 ) 907 – 938 .
17 Fass ( 2008 ) Web: http://www.fass.se (accessed 7 January 2010).
18 European Commission ( 2003 ) laying down the principles and guidelines of good manufacturing practice in respect of medicinal products for human use and investigational medicinal products for human use . Offi cial Journal L262, 14/10/2003, 22 – 26 .
19 European Parliament & Council ( 2004 ) amending Directive 2001/83/EC on the Community code relating to medicinal products for human use . Offi cial Journal L136, 30/04/2004, 34 – 57 .
100 4 Environmental and Regulatory Aspects
20 Health Canada ( 2005 ) An Environmental Assessment Regime for New Substances in Products Regulated under the Food and Drugs Act . Health Canada – Options Analysis Paper.
21 US Center for Drug Evaluation and Research ( 1998 ) Guidance for Industry: Environmental Assessment of Human Drug and Biologics Applications . US Center for Drug Evaluation and Research CMC 6 (Rev 1).
22 Taylor , D. , and Poulmaire , M. , ( 2008 ) Poster Presentation Pharmaceutical Products in the Environment: Towards Lowering Occurrence and Impact KNAPPE International Conference, Nimes (France) .
23 European Parliament & Council ( 1994 ) on packaging and packaging waste . Offi cial Journal L365, 31/12/1994, 10 – 23 .
24 European Parliament & Council ( 2006 ) concerning the Registration, Evaluation, Authorisation and Restriction of Chemicals (REACH), establishing a European Chemicals Agency, amending Directive 1999/45/EC and repealing Council Regulation (EEC) No 793/93 and Commission Regulation (EC) No 1488/94 as well as Council Directive 76/769/EEC and Commission Directives 91/155/EEC, 93/67/EEC, 93/105/EC and 2000/21/EC . Offi cial Journal L396, 30/12/2006, 1 – 849 .
25 US Environmental protection Agency ( 1998 ). Development Document for Final Effl uent Limitations Guidelines and Standards for the Pharmaceutical Manufacturing Point Source Category , EPA - 821 - R - 98 - 005 .
26 European Council ( 1996 ) concerning integrated pollution prevention and control . Offi cial Journal L257, 10/10/1996, 26 – 40 .
27 European Commission ( 2007 ) Proposal for a directive of the European Parliament and of the Council on industrial emissions (integrated pollution prevention and control) (recast), COM(2007) 843 fi nal.
28 Sheldon , R.A. ( 1994 ) Chemtech , 24 , 38 – 47 .
29 EPA(Eire) ( 2004 ) Integrated Pollution Control License 673 .
30 European Parliament & Council ( 2000 ) establishing a framework for Commu-nity action in the fi eld of water policy . Offi cial Journal L327, 22/12/2000, 1 – 72 .
31 Umwelt Bundesamt ( 2008 ) ETOX: Information System Ecotoxicology and Environmental Quality Targets UBA . Web: http://webetox.uba.de/webETOX/public/search/ziel.do (accessed 10 January 2009).
32 European Commission ( 2008 ) EC Interinstitutional File, 2006/0129COD.
33 Australian Natural Resource Manage-ment Ministerial Council and the Australian Environment Protection and Heritage Council ( 2007 ) Australian Guidelines for Water Recycling – Augmentation of Drinking Water Supplies , ISBN: 1 921173 20 3 .
34 US Government ( 2008 ) Fed. Regist. , 73 , 9627 – 9654 .
35 European Council ( 1998 ) on the quality of water intended for human consump-tion . Offi cial Journal L330, 5/12/1998, 32 – 54 .
36 J ø rgensen , C. , Buchardt , B.H. , Fawell , J. , and Hydes , O. ( 2008 ) Preliminary draft fi nal report on Establishment of a list of chemical parameters for the revision of the Drinking Water Directive , ENV.D.2/ETU/2007/0077r.
37 Taylor , D. ( 2009 ) Ecopharmacosteward-ship: a pharmaceutical industry perspective , in Sustainable Pharmacy (ed. K. Kummerer ), Springer - Verlag , Heidelberg , (in press).
38 Mattson , B. , N ä sman , I. , and Str ö m , J. ( 2007 ) RAJ Pharmakol. , 2007 , 153 – 158 .
39 Roig , B. ( 2009 ) KNAPPE Project . EU Contract no. 036864, Report D6.5 Priority Actions, http://www.knappe-eu.org/fi chiers/60-D6.6%20fi nal%20report%20fi nal.pdf
40 Keil , F. ( 2008 ) Pharmaceuticals for Human Use: Options of Action for Reducing the Contamination of Water Bodies A Practical Guide , Institute for Social - Ecological Research (ISOE) GmbH .
41 European Council ( 1999 ) on the limitation of emissions of volatile organic compounds due to the use of organic solvents in certain activities and installations . Offi cial Journal L851, 1/03/1999, 1 – 22 .
101
5 Synthesis of Sitagliptin, the Active Ingredient in J anuvia ® and J anumet ® 1) Jaume Balsells , Yi Hsiao , Karl B. Hansen , Feng Xu , Norihiro Ikemoto , Andrew Clausen , and Joseph D. Armstrong III
5.1 Introduction
The large - scale preparation of drug candidates during their clinical development phase is a balance between speed and effi ciency. Early in development, the neces-sity of initiating clinical programs in a timely fashion results in the use of a process, often closely based on a discovery chemistry synthesis, which utilizes chemistry that is not optimal in terms of either effi ciency or environmental impact. As a drug candidate progresses through clinical trials, the emphasis is usually put on developing a process which can be transferred to a manufacturing setting with high levels of control. In many cases, the time frame for development at this point precludes the introduction of a completely new route because of the need to closely match the impurity profi le tested in both animal safety testing and the clinic. Unfortunately, the synthetic route used in a discovery synthesis is often not designed to effi ciently prepare a single compound; rather it is designed to access a number of analogs to test against a biological model.
The focus of these laboratories has been to design the most effi cient and robust process for the preparation of Merck ’ s drug candidates and products. The end result has been a number of synthetic routes which not only deliver the base requirements of a highly controllable active pharmaceutical ingredient ( API ) syn-thesis suitable for a Good Manufacturing Practice environment but also chemistry which is highly effi cient, cost effective and inherently green in nature. In order to accomplish these goals over the past decades, new chemistry has been developed to address the synthetic challenges that drug molecule structures call for. The end result has been a series of contributions to further the fi eld of synthetic chemistry which provide effi cient, green solutions to challenging synthetic problems.
An example of this is the story of the process development of sitagliptin, ( R ) - 3 - amino - 1 - [3 - (trifl uoromethyl) - 5,6 - dihydro - [1,2,4]triazolo[4,3 - α ]pyrazin - 7(8 H ) - yl] - 4 - (2,4,5 - trifl uorophenyl)butan - 1 - one, an active ingredient in Januvia ® and
Green Chemistry in the Pharmaceutical Industry. Edited by Peter J. Dunn, Andrew S. Wells and Michael T. Williams© 2010 WILEY-VCH Verlag GmbH & Co. KGaA, WeinheimISBN: 978-3-527-32418-7
1) Dedicated to Edward J. J. Grabowski on the occasion of his 70th birthday.

102 5 Synthesis of Sitagliptin, the Active Ingredient in Januvia® and Janumet®
Janumet ® . Sitagliptin is a fi rst - in - class treatment for type II diabetes [1] , a disease which is staggering in its effect on society. Sitagliptin has been shown to be effec-tive in the treatment of Type II diabetes either alone (Januvia ® ) or in fi xed - dose combination with metformin (Janumet ® ). Given the size of the global diabetes epidemic, the demand for a fi rst - in - class treatment like sitagliptin was projected to be quite high, requiring Merck to develop an effi cient and robust manufacturing process for the API.
Sitagliptin ( 1 ) is a β - amino amide composed of a chiral β - amino acid ( 2a ) and a trifl uoromethyl substituted bicyclic heterocycle ( 3 ). Chemistry to prepare sitaglip-tin on multi - gram scale was available; however, the route employed by the discov-ery chemists needed development in the case of the heterocycle and was not scalable even to the kilogram level in the case of the β - amino acid portion. In order to support the timeline for the program, a fi rst - generation route was developed and implemented to prepare 100 kg of 1 . While this route certainly could have been developed and commercialized, its overall effi ciency left a signifi cant oppor-tunity for improvement. To seize this opportunity, completely new routes were developed which involve not only a new synthetic pathway to prepare sitagliptin but also novel, innovative approaches to some of its key structural aspects. This review describes the evolution of this chemistry, starting with the fi rst - generation process synthesis and ending in a highly innovative, effi cient, and robust manu-facturing route for sitagliptin which not surprisingly makes signifi cant improve-ments in its ‘ greenness ’ .
5.2 First - Generation Route
Sitagliptin ( 1 ) was originally synthesized by coupling β - amino acid 2a to triazole 3 prepared by hydrogenation of the unsaturated triazolopyrazine 4 (Scheme 5.1 ) [2] . While the original synthetic approach to the preparation of triazolopiperazine
NH2
FF
F
O
NN
NN
CF3
NH
FF
F
OHN
NN
N
CF3
OH+
R
2a R = H2b R = BnO
FF
F
N O
OBnN
NN
N
CF3
1 3
5 4
Scheme 5.1 Retrosynthetic approach.

5.2 First-Generation Route 103
3 was followed for the fi rst large - scale preparation of 1, the discovery route to prepare 2a utilized a relatively diffi cult - to - prepare chiral auxiliary which required entirely new chemistry to be employed even for the preparation of several hundred grams of drug [3] .
A method to prepare 2a based on the work of a related analog [4] was employed for the fi rst multi - kilogram campaign. In this approach, 2a was prepared from lactam 5 , which is derived from an optically enriched β - hydroxy acid. This method requires introduction of the amino group as an O - benzylhydroxylamine, which we hoped would suffi ciently protect the amino group of 2b during amide formation with triazole 3 .
The original synthesis of triazole 3 began with the reaction of chloropyrazine 6 with hydrazine (Scheme 5.2 ). While these two compounds readily react at elevated temperature, the reaction possessed several unsafe aspects. First, heating 6 in isopropanol ( IPA ) with an excess of hydrazine allowed for a high potential for dangerous free hydrazine to be present in the head space. 2) Second, the thermal profi le of this step showed the potential for an uncontrollable reaction at elevated temperatures with a large amount of gas evolution. 3) , 4) Lastly, the hydrazine adduct 7 was observed to crystallize from the reaction as a toxic and explosive hydrazine co - crystal.
NN
Cl35% NH2NH2 / H2O N
N
HN
NH2
1. H2, Pd (C)2. HCl, IPA N
NN
N
CF3
H
HCl
NN
NN
CF3
Superphos, 75 °C
NN
NNH
O CF3
O CF36 7 8
4 3
49%
51%
F3C O CF3
OO
Scheme 5.2 Synthesis of the triazole heterocycle.
2) Information about hydrazine and its safe use can be obtained at www.hydrazine.com .
3) Calorimetry studies of the reaction of hydrazine with 6 reveal a strong exotherm at temperatures above 85 ° C.
4 ) As a safety precaution, the reaction temperature was carefully monitored upon scale - up. If the temperature of the reaction
had exceeded 70 ° C, a quench vessel of water was connected to the vessel to quickly stop the reaction. However there was no issue with maintaining the temperature of reaction in the 60 – 65 ° C range.
5) 35 wt% hydrazine aqueous solution has no fl ashpoint.
The reaction conditions were successfully engineered to allow for operation in a safe fashion on a multi - kilogram scale. The reaction was carried out in a 35 wt% aqueous solution of hydrazine under rigorously controlled conditions to prevent any thermal events. 5) Rather than isolate 7 , it was simply extracted at the end of reaction and carried into the next step which involved trifl uoroacetylation with

104 5 Synthesis of Sitagliptin, the Active Ingredient in Januvia® and Janumet®
trifl uoroacetic anhydride. Hydrazide 8 was isolated from the reaction by crystalliza-tion with heptane in 49% yield for two steps. The solids were then heated in superphosphoric acid (Superphos), a less viscous form of polyphosphoric acid, to afford the heterocycle 4 , which was then hydrogenated to afford the piperazine 3 . The desired heterocycle was isolated as its HCl salt in 51% yield for two steps.
Preparation of 2b started with acid 9 , which was converted to β - keto ester 10 under Masamune conditions (Scheme 5.3 ) [5] . The asymmetric hydrogenation of 10 was carried out using ( S ) - BinapRuCl 2 - triethylamine complex and a catalytic amount of HBr, which allowed the loading of the catalyst to be reduced to < 0.1 mol% without affecting the ee or the yield of β - hydroxy ester 11 [6] . Following the reduction, the ester was hydrolyzed and the carboxylic acid 12 isolated in 83% yield and 94% ee . This key building block was then elaborated to lactam 5 in a two - step sequence. First, hydroxamate 13 was formed by coupling the carboxylic acid with BnONH 2 ⋅ HCl using N - (3 - dimethylaminopropyl) - N ′ - ethylcarbodiimide hydrochloride ( EDC ). After aqueous work - up of the crude reaction, the organic extracts were dried azeotropically and used directly in the subsequent reaction. The cyclization to form 5 was carried out using di - isopropyl azodicarboxylate ( DIAD ) and PPh 3 [7] . Lactam 5 was isolated in 81% yield by crystallizing from methanol/water. The optical purity of 5 was upgraded to > 99% ee in the crystalliza-tion when the ee of 12 used in the two step sequence was at least 94% ee .
O
F
F
F
O
OMe
OH
F
F
F
O
OH
F
F
F
N O
OBn
1. (S)-BinapRuCl2, HBr, 90 psi H2, MeOH, 80 °C2. NaOH, MeOH / H2O
BnONH2-HCl, EDC, LiOHTHF / H2O
DIAD, PPh3, THFOH
F
F
F
O
NH
OBn
10
12
13 5
83%
81%
OH
O
F
F
F 9 86%
1. CDI2. K methyl malonate, MgCl2, Et3N
Scheme 5.3 Synthesis of the β - lactam intermediate.
Control of the optical purity of 5 was deemed to be crucial at this point of the synthesis. Crystallization of 1 as its desired phosphoric acid salt with ee below the fi nal desired specifi cation did not upgrade its optical purity and we intended to process 5 to 1 in a through process with only a fi nal isolation.
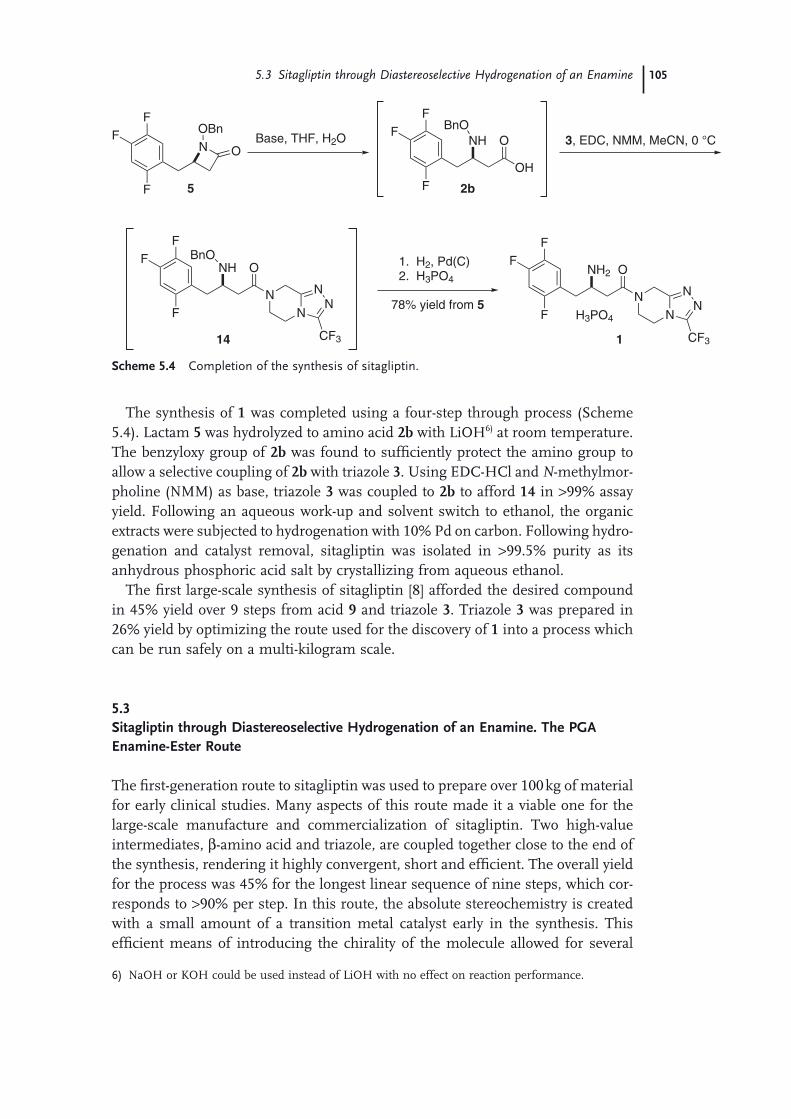
The synthesis of 1 was completed using a four - step through process (Scheme 5.4 ). Lactam 5 was hydrolyzed to amino acid 2b with LiOH 6) at room temperature. The benzyloxy group of 2b was found to suffi ciently protect the amino group to allow a selective coupling of 2b with triazole 3 . Using EDC - HCl and N - methylmor-pholine ( NMM ) as base, triazole 3 was coupled to 2b to afford 14 in > 99% assay yield. Following an aqueous work - up and solvent switch to ethanol, the organic extracts were subjected to hydrogenation with 10% Pd on carbon. Following hydro-genation and catalyst removal, sitagliptin was isolated in > 99.5% purity as its anhydrous phosphoric acid salt by crystallizing from aqueous ethanol.
The fi rst large - scale synthesis of sitagliptin [8] afforded the desired compound in 45% yield over 9 steps from acid 9 and triazole 3 . Triazole 3 was prepared in 26% yield by optimizing the route used for the discovery of 1 into a process which can be run safely on a multi - kilogram scale.
5.3 Sitagliptin through Diastereoselective Hydrogenation of an Enamine. The PGA Enamine - Ester Route
The fi rst - generation route to sitagliptin was used to prepare over 100 kg of material for early clinical studies. Many aspects of this route made it a viable one for the large - scale manufacture and commercialization of sitagliptin. Two high - value intermediates, β - amino acid and triazole, are coupled together close to the end of the synthesis, rendering it highly convergent, short and effi cient. The overall yield for the process was 45% for the longest linear sequence of nine steps, which cor-responds to > 90% per step. In this route, the absolute stereochemistry is created with a small amount of a transition metal catalyst early in the synthesis. This effi cient means of introducing the chirality of the molecule allowed for several
NH2
F
F
F
O
N
NN
N
CF3
H3PO4
F
F
F
NHBnO
O
OH
Base, THF, H2O
1. H2, Pd(C)2. H3PO4
NH
F
F
F
O
N
NN
N
CF3
BnO
3, EDC, NMM, MeCN, 0 °C
2b
14 1
78% yield from 5
F
F
F
N O
OBn
5
Scheme 5.4 Completion of the synthesis of sitagliptin.
6) NaOH or KOH could be used instead of LiOH with no effect on reaction performance.
5.3 Sitagliptin through Diastereoselective Hydrogenation of an Enamine 105

106 5 Synthesis of Sitagliptin, the Active Ingredient in Januvia® and Janumet®
subsequent isolation points to remove the unwanted enantiomer and the transi-tion metal catalyst from the product.
Despite the strengths of this route, several negative aspects gave cause for concern. Although each step afforded relatively high yields, nine steps with an additional four steps to prepare the triazole heterocycle is a high number overall. The Masamune reaction at the beginning of the synthesis was not very productive, requiring a maximum reaction volume of 30 L/kg of intermediate produced. Most concerning was the Mitsunobu conditions required to install the amine functional-ity via benzyloxy lactam 5 . This sequence utilized several reagents of high molecu-lar weight just to convert a hydroxyl group to an amine. The large amount of waste that this sequence generated invited attempts to explore more direct means to prepare the β - amino acid functionality.
The amide - forming steps using EDC as the acid - activating reagent also stood out as being poorly atom economic. Rather than trying to optimize each of these steps individually, we decided to explore completely different synthetic approaches.
Looking at the current route, we realized that installing the chiral center across a carbon - oxygen double bond, although an effi cient process by itself, required an additional 4 steps of functional group manipulation in order to convert the chiral alcohol into a chiral amine (Scheme 5.5 , top). By contrast, if we could introduce the chiral center with the nitrogen functionality already present (Scheme 5.5 , bottom), this would cut down several steps of functional group manipulation. The absolute confi guration could be controlled, for example, using a chiral auxiliary on the nitrogen center [9] .
F
F
F
NHR*
COOR
F
F
F
O
COOR
F
F
F
NHR*
COOR1 Step 1 Step
F
F
F
OH
COOMe
F
F
F
O
COOMe
F
F
F
NH
OBn
1 Step 4 Steps OH
O
Scheme 5.5 Generating the chiral center across C – O bond or with N functionality present.
Among the alternative routes evaluated to prepare chiral β - amino esters, a promising approach involved the formation and hydrogenation of chiral enamine derivatives obtained from chiral amines. Chiral amines such as α - methylbenzylamine are readily available and have been employed for asymmetrically installing amino groups [10] . We thus screened several chiral benzylamine auxiliaries and hetero-geneous catalysts. The enamine prepared from ( R ) - methylbenzylamine and β - keto ester 10 was hydrogenated using PtO 2 catalyst, but no diastereoselectivity was observed.

Next the ( S ) - phenylglycinamide chiral auxiliary ( PGA ) was evaluated (Scheme 5.6 ). Keto ester 10 was condensed in methanol to afford enamine 15 with 85 – 90% conversion, and pure Z - enamine isomer was crystallized from the reaction mixture and isolated in 80% yield. 7)
Hydrogenation screenings were conducted using various heterogeneous cata-lysts (Pd/C, Rh/C, Raney Ni, Pt/Al 2 O 3 , Pd 2 O, and Pt/C), but the best diastereose-lectivity and conversion was obtained with PtO 2 . Addition of acid was essential for the reduction, and 5 equivalents of acetic acid were optimal in enhancing the rate of hydrogenation. With less acid, conversion was poor, and, using more than 5 equivalents, Z - E isomerization of enamine 15 resulted in lower diastereoselectiv-ity. Under the optimized conditions described on Scheme 5.7 , hydrogenation of PGA - enamine 15 afforded amine 16 in 90% assay yield and 91% de .
F
F
FNH O
OMe
CONH2Ph
F
F
FO O
OMe
F
F
FNH O
OMe
CONH2Ph
F
F
FNH2 O
N
NN
N
CF3
NH2
CONH2Ph
Hydrogenation
1) NaOH, H2O
10 15 16
F
F
FNH O
N
NN
N
CF3
CONH2Ph
H2, Pd
2)HN
NN
N
CF3HCl
17
(S)-PGA
1
Scheme 5.6 The PGA enamine - ester route.
90% yield, 91% de15
10 wt% PtO2 (Adam's Catalyst)
5 equiv HOAc, THF90 psi H2, 16 h, RTF
FF
NH O
OMe
CONH2Ph
F
FF
NH O
OMe
CONH2Ph
16
Scheme 5.7 Diastereoselective hydrogenation. Optimized reaction conditions.
7) The olefi n stereochemistry was determined by nOe studies.
An advantage of the chiral auxiliary approach was that the minor diastereomer has the potential to be rejected to enhance the diastereomeric purity of the product, and this was in fact achieved in our case. Crystallization from toluene allowed for the isolation of the desired diastereomer in 76% overall yield with 99.0% de purity.
The amino ester 16 was then hydrolyzed to the carboxylic acid and isolated in 90% yield (Scheme 5.6 ). Subsequently, the amino acid was coupled with triazole 3 using EDC activation to afford the amide 17 in 90% assay yield. Removal of the chiral auxiliary was achieved via hydrogenolysis using Pd/C or Pd(OH) 2 as catalyst to obtain sitagliptin in 83% assay yield.
5.3 Sitagliptin through Diastereoselective Hydrogenation of an Enamine 107
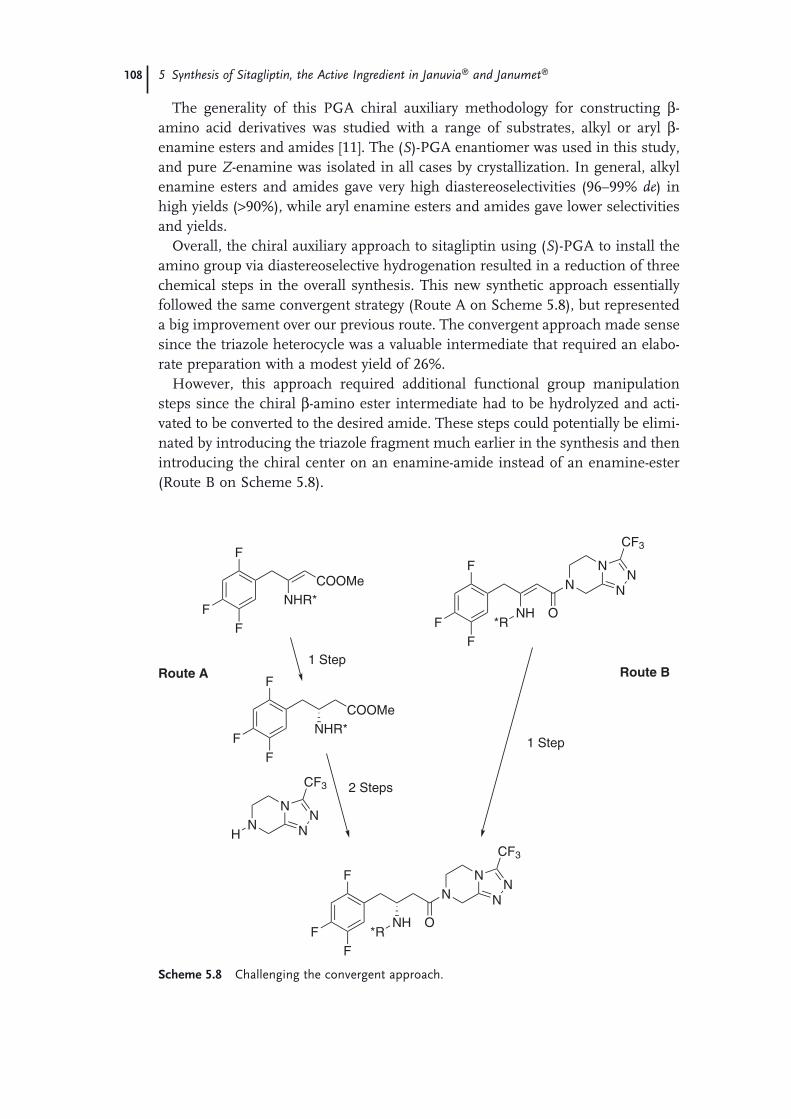
108 5 Synthesis of Sitagliptin, the Active Ingredient in Januvia® and Janumet®
The generality of this PGA chiral auxiliary methodology for constructing β - amino acid derivatives was studied with a range of substrates, alkyl or aryl β - enamine esters and amides [11] . The ( S ) - PGA enantiomer was used in this study, and pure Z - enamine was isolated in all cases by crystallization. In general, alkyl enamine esters and amides gave very high diastereoselectivities (96 – 99% de ) in high yields ( > 90%), while aryl enamine esters and amides gave lower selectivities and yields.
Overall, the chiral auxiliary approach to sitagliptin using ( S ) - PGA to install the amino group via diastereoselective hydrogenation resulted in a reduction of three chemical steps in the overall synthesis. This new synthetic approach essentially followed the same convergent strategy (Route A on Scheme 5.8 ), but represented a big improvement over our previous route. The convergent approach made sense since the triazole heterocycle was a valuable intermediate that required an elabo-rate preparation with a modest yield of 26%.
However, this approach required additional functional group manipulation steps since the chiral β - amino ester intermediate had to be hydrolyzed and acti-vated to be converted to the desired amide. These steps could potentially be elimi-nated by introducing the triazole fragment much earlier in the synthesis and then introducing the chiral center on an enamine - amide instead of an enamine - ester (Route B on Scheme 5.8 ).
N
NN
N
CF3
H
F
F
F
NHR*
COOMe
F
F
F
NHR*
COOMe
F
F
F
NH
N
*RO
N
NN
CF3
F
F
F
NH
N
*RO
N
NN
CF3
1 Step
2 Steps
1 Step
Route A Route B
Scheme 5.8 Challenging the convergent approach.

5.4 The Triazole Fragment 109
In order for this strategy to be competitive with the convergent approach, we would have to fi rst improve the synthesis of the triazole fragment and then fi nd an alternative to the Masamune chemistry to get access to β - keto amides directly.
5.4 The Triazole Fragment
While the fi rst - generation triazole route had been successfully carried out on plant scale, several concerns needed to be addressed. The overall yield for the four - step sequence was modest (26%), and the cost of some raw materials such as the chlo-ropyrazine and the palladium catalyst was high. The process required multiple challenging extractions and distillations, making it ineffi cient and susceptible to control issues. The greatest concern was the fi rst step, which required the use of excess hydrazine under conditions which may not have a high level of safety for a manufacturing route. In order to address these concerns, a completely new route was pursued for this compound which would increase the overall effi ciency, lower the cost of raw materials, and eliminate the issues with handling hydrazine.
An alternative method had been reported in the literature [12] to prepare [1,2,4]triazolo[4,3 - α ]piperazines (Route B, Scheme 5.9 ) via the condensation of a chlo-romethyl oxadiazole with 1,2 - phenylenediamine to afford the benzo fused com-pounds. The reaction conditions reported for this approach were harsh and the yields were low, presumably due to the poor nucleophilicity of 1,2 - phenylenedi-amine. However, we felt that the synthesis of 3 could potentially be accomplished under milder reaction conditions because of the enhanced nucleophilicity of
N
NN
N
F3C
3
HRoute A
N
NN
N
F3C
NN
OF3C
Cl
H2N
NH2
N
NCl
F3C NH
O
NH
O
Cl
NH2
H2N
F3C
XO
Route B
184
19
Scheme 5.9 3 - Trifl uoromethyl - [1,2,4]triazolo[4,3 - α ]piperazine.

110 5 Synthesis of Sitagliptin, the Active Ingredient in Januvia® and Janumet®
ethylenediamine and the electron - withdrawing nature of the trifl uoromethyl [13] group of the required chloromethyl oxadiazole 18 . In order to reduce this strategy to practice, a synthesis of 18 from bishydrazide 19 was developed.
The key intermediate chloromethyloxadiazole 18 was prepared in two steps from inexpensive, commercially available materials as shown in Scheme 5.10 . Bishy-drazide 19 was prepared in a one - pot procedure by reaction of 35% aqueous hydrazine 8) with ethyl trifl uoroacetate in acetonitrile and subsequent addition of chloroacetyl chloride and base. This procedure affords the unsymmetrical bis(hydrazide) 19 in higher than 95% assay yield. While a number of dehydrating agents were found to be effective in the dehydration to prepare 18 , phosphorus oxychloride was chosen because of its low cost and relatively benign waste stream. Sub - stoichiometric (0.3 equiv.) amounts were found to be as effective as full equivalents in the reaction when used in conjunction with catalytic amounts of DMAP as a nucleophilic catalyst. The entire sequence was transformed into a one - pot through process in order to improve effi ciency. Following the cyclization, an aqueous work - up was performed and the organic extracts carried directly into the next step.
N N
OCl
F3C
18, 79%
N2H4
1) CF3COOEt, 25 oC2) NaOH, ClCH2COCl
F3C NH
O
NH
Cl
O1 eq. POCl380 oC, 17h
19, 97%
Scheme 5.10 Preparation of oxadiazole 18 .
N
NHN
N
F3C
N N
OCl
F3C
18 3, 92%
MeOH, -20 oC
H2NNH2
F3C NH
N
ONH
HN MeOHreflux
20, 74%
Scheme 5.11 Preparation of triazole 3 .
8) A nonexplosive form of hydrazine is used as the limiting reagent. Hydrazine is completely consumed after the addition of trifl uoroacetate. In this manner, no hazardous waste containing hydrazine is generated.
Treatment of 18 with ethylenediamine afforded the desired triazolo piperazine 3 at room temperature albeit in low yields. Attempts to improve the reaction revealed that when the oxadiazole was added to two equivalents of ethylenediamine in methanol at 0 ° C, a new species crystallized directly from the reaction mixture. This solid was isolated, identifi ed as the amidine 20 , and was found to convert to 3 by refl uxing in methanol for 4 h (Scheme 5.11 ). The formation of amidine 20 was curious since it suggested that initial attack of ethylenediamine did not occur at the carbon of the oxadiazole vicinal to the trifl uoromethyl group. Of the three carbons of the oxadiazole which need to react with ethylenediamine, this would easily be rationalized as the most electrophilic. In order to understand the mecha-

5.4 The Triazole Fragment 111
nism better and to ultimately improve the overall process, a careful study of this reaction was carried out.
Since the amidine was a competent intermediate that could be isolated prior to formation of 3 , its synthesis and isolation were pursued. Amidine was observed to form readily at temperatures as low as − 40 ° C. At temperatures higher than 5 ° C, further cyclization to triazole 3 was observed. Methanol was found to be uniquely suited for this reaction, with other solvents both protic and aprotic providing inferior results. Amidine 20 was isolated in the highest yields with the highest purity when the reaction was carried out at − 20 ° C, using 2.8 equivalents of ethyl-enediamine. While complete reaction conversion can be achieved using only 1.7 equivalents of ethylenediamine, these conditions resulted in the isolation of 20 contaminated with ethylene diaminedihy drochloride. Use of an excess of ethyl-enediamine shifts the excess reagent present at the end of the reaction to its methanol - soluble mono HCl salt by Schlenk equilibrium, which is easily removed under the isolation conditions.
Isolated amidine 20 could be converted to 3 thermally or by acid or base catalysis. Since 3 was best isolated as its HCl salt, the reaction was run by addition of 1 equivalent of concentrated HCl to a slurry of amidine 20 at refl ux in methanol. Under optimized conditions, triazole 3 was isolated by fi ltration of the reaction slurry at 0 ° C in 92% yield [14] .
NMR experiments provided an explanation for two interesting observations in the conversion of 18 to amidine 20 : the presumed addition of ethylenediamine to one of the less electrophilic centers of 18 and the unique utility of methanol in the reaction. Addition of ethylenediamine to a solution of 18 at − 40 ° C was observed to provide only the product of chloride displacement, which, upon warming, afforded amidine 20 . Careful examination of the NMR spectra during the reaction revealed that two other compounds were formed in small quantities. These compounds disappeared at the end of the reaction, consistent with them being intermediates along the pathway to 21 . Spectroscopic determination of the struc-tures of these two intermediates provided methanol adduct 22 arising from addi-tion of solvent to the trifl uoromethyl - fl anked carbon and compound 23 , which arises from the addition of ethylenediamine to 22 . Together, this picture of the reaction provides a plausible mechanism which explains the formation of 20 as well as the unique nature of methanol in the reaction [15] (Scheme 5.12 ).
The overall yield for the new synthetic route to triazole 3 was 52% – nearly double that of the fi rst generation route. The use of reagents in stoichiometric or sub - stoichiometric (with the notable exception of the ethylenediamine) amounts results in a dramatic improvement of the effi ciency for the new process. Table 5.1 summarizes other parameters relevant for comparison of the two routes. Although the number of synthetic steps and isolations is the same for both routes, the new route requires fewer processing manipulations, which results in a lower E factor for the overall process. The improved yield is another major contributor to reduc-ing the E factor. Most importantly, the sequence requires the use of a single equivalent of aqueous hydrazine, which is completely consumed in the fi rst step, resulting in safer operating conditions and cleaner waste streams.

112 5 Synthesis of Sitagliptin, the Active Ingredient in Januvia® and Janumet®
Table 5.1 E factor calculations for the syntheses of triazole 3 .
Chloropyrazine route Oxadiazole route
Steps 4 4 Isolations 2 2 Aqueous work - ups 2 1 Solvent switches/distillations 3 1 Overall yield (%) 26 52 E factor 373 68
O
O
O
O
R
OH
Nu
O
R
ONu-
Nu = alcohol, amineO
O
O
O
Scheme 5.13 Preparation of β - keto esters and amides from acyl Meldrum ’ s acids
20N N
OCl
F3C
CH3OH, -40 oC18
N N
ONH
F3C R1
22
21
23, R1= (CH2)2NH2
N N
OF3CO
HN N
ONH
F3C R1
O
Cl - CH3OH
OCH3
HN
R1
H
N
R1
HH3C H3C
H
Scheme 5.12 Proposed mechanism for the formation of 20 .
5.5 Direct Preparation of β - Keto Amides
With an improved synthesis of the triazole fragment in hand, which would allow for its introduction much earlier in the synthesis, we started searching for a direct preparation of the β - keto amide intermediate from trifl uorophenylacetic acid ( 9 ). This type of transformation has been accomplished in the past using acyl Mel-drum ’ s acid adducts [16] . This methodology involves reaction of Meldrum ’ s acid with activated carboxylic acids followed by decarboxylation in the presence of nucleophiles such as alcohols or amines (Scheme 5.13 ). The ability of readily avail-

5.5 Direct Preparation of β-Keto Amides 113
able acyl Meldrum ’ s acids adducts to react with various nucleophiles allows quick access to a variety of functionalized compounds including β - keto amides.
Proof of concept for this route was established by activating acid 9 with N,N ′ - carbonyldi - imidazole ( CDI ) and treating it with Meldrum ’ s acid to afford adduct 24 (Scheme 5.14 ). Despite its relatively high instability, adduct 24 was isolated by crystallization after aqueous work - up. Isolated 24 was easily converted to 25 in moderate yield by treatment with triazole salt 3 and Hunig ’ s base. Because of the limited stability of intermediate 24 and in order to maximize the effi ciency of the transformation, we decided to attempt the two - step sequence in a one - pot procedure.
F
F
F
COOH
O
O
O
OF
F
F
OH
O
O
O
O
HN
NN
N
CF3
HCl
F
F
F
O
N
O
NN
N
CF32524
3
9
Scheme 5.14 Preparation of β - keto amide 25 .
Use of pivaloyl chloride instead of CDI provided a more inexpensive alternative to activating acid 9 . Coupling of the activated acid with Meldrum ’ s acid in the presence of Hunig ’ s base to scavenge the HCl formed in the reaction resulted in conversion to the desired adduct 24 in high (95%) yield. However, complete con-version upon the addition of triazole salt 3 could still not be reached. Careful range - fi nding revealed that the second step of the process is very sensitive to the amount of base in the overall reaction. Reactions using a large excess of Hunig ’ s base were observed to convert very poorly to keto amide 25 . Reduction of the base charge below the 2 equivalents necessary for the neutralization of one equivalent of HCl produced in the reaction as well as the relatively acidic (pKa = 3.1) Mel-drum ’ s adduct produced in the reaction compromised the conversion of acid 9 to 24 . In order to develop a more robust process, a charge of acid was added with the triazole salt following complete conversion to 24 . After considerable screening, the optimum acid to promote the conversion of 24 was found to be trifl uoroacetic acid ( TFA ). The addition of 0.3 equivalents of TFA with the triazole salt to the reaction resulted in reproducibly complete conversion of 24 to 25 . Addition of water to the reaction allowed for the direct isolation of 25 in 84% yield from 9 .
The observed poor conversion of 24 under more basic conditions suggested that the neutral protonated form of 24 may be the more reactive form of this intermedi-ate in the reaction. Evidence for the participation of the free acid form of 24 in the reaction was obtained with a react - IR study of the decarboxylation process, which allowed us to differentiate between the neutral (HA) and anionic (A − ) forms of 24 (Figure 5.1 ).The reaction profi le (combination of the anion and free acid of 24 vs

114 5 Synthesis of Sitagliptin, the Active Ingredient in Januvia® and Janumet®
HA
Time (min)0 60 120 180 240 300 360 420
0.0
0.2
0.4
0.6
0.8
1.0
1.2
HA
A
HA + A
25N
orm
aliz
ed C
once
ntra
tion
Figure 5.1 Plots of concentration of the free acid and anion forms of 24 , and 3 in MeCN process solution vs time. Reaction condi-tions: 0.3 equiv. of TFA and 1.0 equiv. of
triazole HCl salt 3 at 49.5 ° C. [HA] plus [A − ]: dashed line is based on online IR data. Circles are obtained by HPLC analysis.
time) obtained by HPLC analysis also matched the online IR data. Formation of the free acid form 24 (HA) was immediately observed upon addition of a catalytic amount of TFA. This clearly shows that constant liberation of the free acid form HA through a fast acid - base proton exchange during the reaction was the key to achieving complete conversion.
At the time this work was carried out, the mechanistic basis for the conversion of acyl Meldrum ’ s acid adducts to corresponding β - keto esters/amides such as 25 was not well understood [16] 9) . The IR method used to determine the nature of the protonation state of 24 presented an excellent opportunity to perform kinetic studies. These studies [17] showed that the reaction of 24 with amine nucleophile 3 was pseudo zero order in the anionic form 24 . The reaction k obs was almost the same in the one - pot process as when the isolated 24 was used. This was consistent with the rate - determining step being the formation of the α - oxoketene intermedi-ate 26 (Scheme 5.15 ).
The mechanistic proposal shown in Scheme 5.15 explains all of the observations above as well as the overall robust nature of the process. Under the more basic conditions of its formation, Meldrum ’ s adduct 24 is initially obtained as its anionic form (A − ), which stabilizes it and prevents its decomposition. This also means that subsequent reactivity with 3 is enhanced by adjustment of the pH with an exog-enous acid capable of shifting the equilibrium back to 24 , (HA). The acid is only needed in a catalytic amount since, as decarboxylation of 24 proceeds, the triazole HCl salt 3 converts to amide 25 , turning over a proton.
9) The mechanism involving acyl Meldrum ’ s acids in solution was never clarifi ed. Several proposed reaction pathways are often found in the same publication.
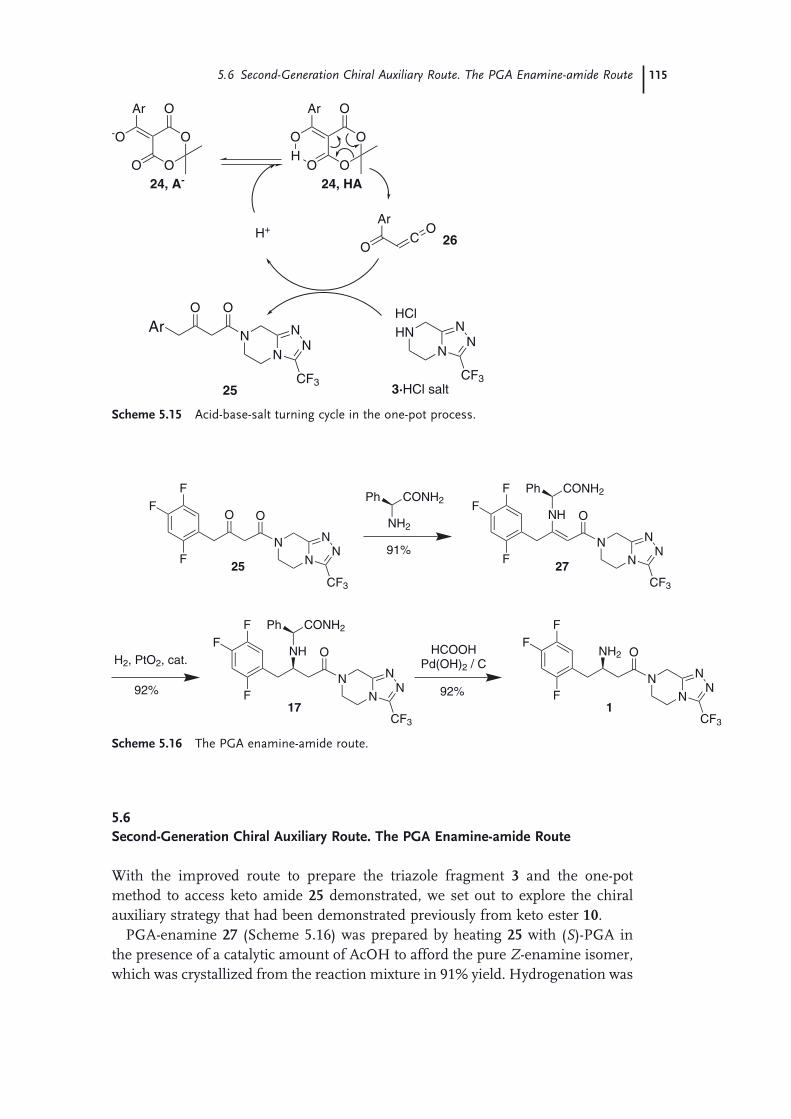
5.6 Second-Generation Chiral Auxiliary Route. The PGA Enamine-amide Route 115
3∙HCl salt
O
O
O
-O
O
Ar
24, A- 24, HA
CO
ArOH+
O
O
O
O
HO
Ar
HN
NN
N
CF3
HClAr
O
N
O
NN
N
CF325
26
Scheme 5.15 Acid - base - salt turning cycle in the one - pot process.
F
F
FNH O
N
NN
N
CF3
CONH2Ph
F
F
FO O
N
NN
N
CF3
F
F
FNH O
N
NN
N
CF3
CONH2Ph
NH2
CONH2Ph
H2, PtO2, cat.
25 27
17F
F
FNH2 O
N
NN
N
CF3
HCOOHPd(OH)2 / C
1
91%
92% 92%
Scheme 5.16 The PGA enamine - amide route.
5.6 Second - Generation Chiral Auxiliary Route. The PGA Enamine - amide Route
With the improved route to prepare the triazole fragment 3 and the one - pot method to access keto amide 25 demonstrated, we set out to explore the chiral auxiliary strategy that had been demonstrated previously from keto ester 10 .
PGA - enamine 27 (Scheme 5.16 ) was prepared by heating 25 with ( S ) - PGA in the presence of a catalytic amount of AcOH to afford the pure Z - enamine isomer, which was crystallized from the reaction mixture in 91% yield. Hydrogenation was

116 5 Synthesis of Sitagliptin, the Active Ingredient in Januvia® and Janumet®
performed in a THF - MeOH mixture using activated, acid - washed PtO 2 to afford the PGA - amine 17 with high selectivity (97.4% de ) and 92% assay yield. After removal of the catalyst by fi ltration, the crude solution was processed directly in the subsequent hydrogenolysis step.
The hydrogenolysis of PGA - amine 17 was initially accomplished using Pearl-man ’ s catalyst to afford sitagliptin free base 1 in 92% assay yield. Subsequently, transfer hydrogenation conditions were developed to eliminate the need for a second high - pressure hydrogenation step in the overall synthesis. The transfer hydrogenation performed best using excess formic acid at 60 ° C in aqueous THF/MeOH using Pd(OH) 2 /C catalyst and, after fi ltration and recovery of the catalyst, afforded sitagliptin 1 in 92% assay yield.
Purifi cation of this crude stream, which contains a stoichiometric amount of 2 - phenylacetamide, was achieved by crystallization of the amine 1 as its L - tartrate salt with 90% recovery and upgrade in purity to 99.9% ee . The 2 - phenylacetamide was completely rejected during this crystallization.
The tartrate salt was then converted to the phosphate salt, the desired salt form of sitagliptin by free - basing fi rst with KOH in aqueous THF, solvent - switching the organic phase to ethanol and adding phosphoric acid to crystallize the phosphate salt in 93% yield with high enantiomeric and chemical purities.
With the ( S ) - PGA enamine - amide route, sitagliptin was prepared in 65% overall yield from 2,4,5 - trifl uorophenylacetic acid ( 9 ) in 4 chemical steps [18] . Two addi-tional crystallization steps are required for enantiomeric purity upgrade and fi nal salt formation. The ( S ) - PGA enamine - amide hydrogenation approach eliminated the ester hydrolysis and amide formation steps of the ( S ) - PGA enamine - ester route by incorporating the newly developed Meldrum ’ s acid chemistry, which enabled direct amidation with triazole 3 .
Although up to this point we had achieved a signifi cant reduction in the number of chemical steps from our fi rst - generation synthesis, there were still some prob-lems associated with the PGA enamine - based process. Since this is a chiral auxil-iary approach, a stoichiometric amount of ( S ) - PGA is required in the process, and the subsequent generation of 2 - phenylacetamide as a by - product of the hydroge-nolysis step adds to the waste burden. Further improvement of the chemistry would require moving away from chiral auxiliaries and exploring asymmetric catalysis as the means of installing the sitagliptin chiral center.
5.7 The Asymmetric Hydrogenation Route
Prior to the beginning of our work on sitagliptin, there had been some reports in the literature of catalytic asymmetric hydrogenation of enamines to access chiral secondary amines [19] . The synthesis of β - amino acids had also been established by catalytic asymmetric hydrogenation of enamides [20] . All these reports relied on N - acylenamines as substrates, since it was believed that the N - acyl group was required in order to achieve good reactivity and selectivity [21] .
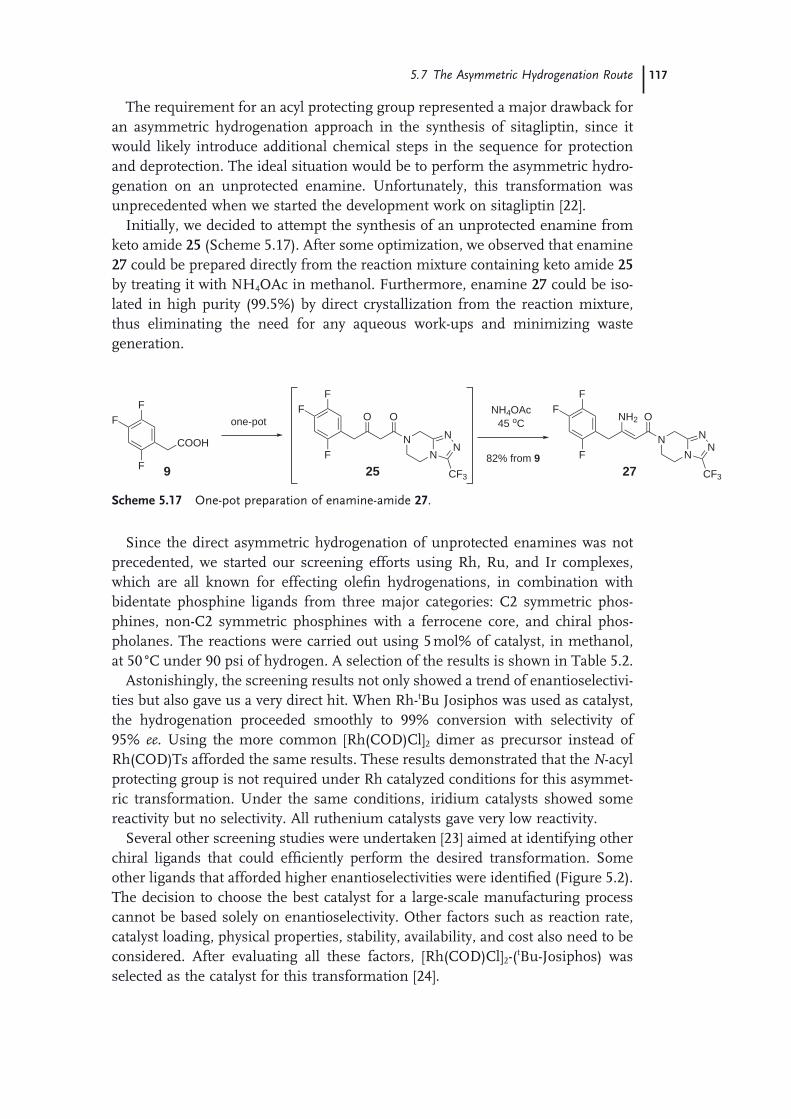
5.7 The Asymmetric Hydrogenation Route 117
The requirement for an acyl protecting group represented a major drawback for an asymmetric hydrogenation approach in the synthesis of sitagliptin, since it would likely introduce additional chemical steps in the sequence for protection and deprotection. The ideal situation would be to perform the asymmetric hydro-genation on an unprotected enamine. Unfortunately, this transformation was unprecedented when we started the development work on sitagliptin [22] .
Initially, we decided to attempt the synthesis of an unprotected enamine from keto amide 25 (Scheme 5.17 ). After some optimization, we observed that enamine 27 could be prepared directly from the reaction mixture containing keto amide 25 by treating it with NH 4 OAc in methanol. Furthermore, enamine 27 could be iso-lated in high purity (99.5%) by direct crystallization from the reaction mixture, thus eliminating the need for any aqueous work - ups and minimizing waste generation.
FF
F
COOH
FF
F
NH2
N
O
NN
N
CF3279
FF
F
O
N
O
NN
N
CF325
one-potNH4OAc
45 oC
82% from 9
Scheme 5.17 One - pot preparation of enamine - amide 27 .
Since the direct asymmetric hydrogenation of unprotected enamines was not precedented, we started our screening efforts using Rh, Ru, and Ir complexes, which are all known for effecting olefi n hydrogenations, in combination with bidentate phosphine ligands from three major categories: C2 symmetric phos-phines, non - C2 symmetric phosphines with a ferrocene core, and chiral phos-pholanes. The reactions were carried out using 5 mol% of catalyst, in methanol, at 50 ° C under 90 psi of hydrogen. A selection of the results is shown in Table 5.2 .
Astonishingly, the screening results not only showed a trend of enantioselectivi-ties but also gave us a very direct hit. When Rh - t Bu Josiphos was used as catalyst, the hydrogenation proceeded smoothly to 99% conversion with selectivity of 95% ee . Using the more common [Rh(COD)Cl] 2 dimer as precursor instead of Rh(COD)Ts afforded the same results. These results demonstrated that the N - acyl protecting group is not required under Rh catalyzed conditions for this asymmet-ric transformation. Under the same conditions, iridium catalysts showed some reactivity but no selectivity. All ruthenium catalysts gave very low reactivity.
Several other screening studies were undertaken [23] aimed at identifying other chiral ligands that could effi ciently perform the desired transformation. Some other ligands that afforded higher enantioselectivities were identifi ed (Figure 5.2 ). The decision to choose the best catalyst for a large - scale manufacturing process cannot be based solely on enantioselectivity. Other factors such as reaction rate, catalyst loading, physical properties, stability, availability, and cost also need to be considered. After evaluating all these factors, [Rh(COD)Cl] 2 - ( t Bu - Josiphos) was selected as the catalyst for this transformation [24] .
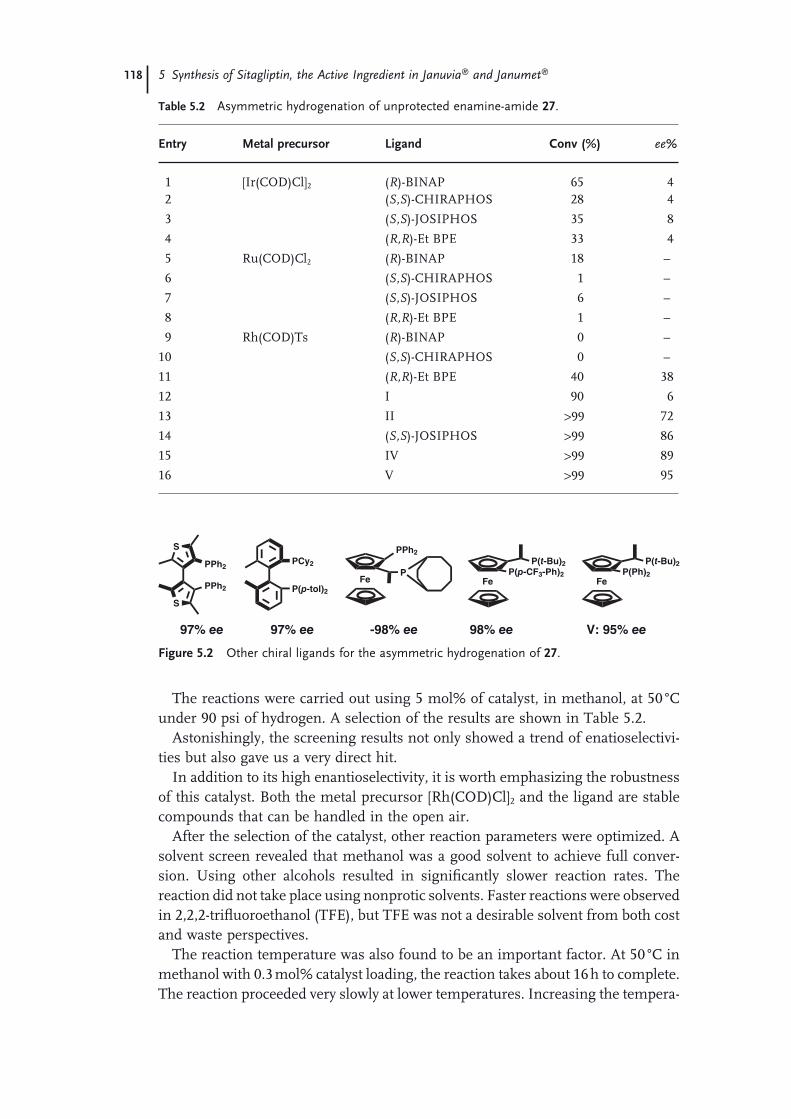
118 5 Synthesis of Sitagliptin, the Active Ingredient in Januvia® and Janumet®
The reactions were carried out using 5 mol% of catalyst, in methanol, at 50 ° C under 90 psi of hydrogen. A selection of the results are shown in Table 5.2 .
Astonishingly, the screening results not only showed a trend of enatioselectivi-ties but also gave us a very direct hit.
In addition to its high enantioselectivity, it is worth emphasizing the robustness of this catalyst. Both the metal precursor [Rh(COD)Cl] 2 and the ligand are stable compounds that can be handled in the open air.
After the selection of the catalyst, other reaction parameters were optimized. A solvent screen revealed that methanol was a good solvent to achieve full conver-sion. Using other alcohols resulted in signifi cantly slower reaction rates. The reaction did not take place using nonprotic solvents. Faster reactions were observed in 2,2,2 - trifl uoroethanol ( TFE ), but TFE was not a desirable solvent from both cost and waste perspectives.
The reaction temperature was also found to be an important factor. At 50 ° C in methanol with 0.3 mol% catalyst loading, the reaction takes about 16 h to complete. The reaction proceeded very slowly at lower temperatures. Increasing the tempera-
97% ee 97% ee -98% ee 98% ee V: 95% ee
P(Ph)2
P(t-Bu)2
FeP(p-CF3-Ph)2
P(t-Bu)2
Fe
PPh2
PFe
PCy2
P(p-tol)2
S
S
PPh2
PPh2
Figure 5.2 Other chiral ligands for the asymmetric hydrogenation of 27 .
Table 5.2 Asymmetric hydrogenation of unprotected enamine - amide 27 .
Entry Metal precursor Ligand Conv (%) ee %
1 [Ir(COD)Cl] 2 ( R ) - BINAP 65 4 2 ( S,S ) - CHIRAPHOS 28 4
3 ( S,S ) - JOSIPHOS 35 8
4 ( R,R ) - Et BPE 33 4
5 Ru(COD)Cl 2 ( R ) - BINAP 18 –
6 ( S,S ) - CHIRAPHOS 1 –
7 ( S,S ) - JOSIPHOS 6 –
8 ( R,R ) - Et BPE 1 –
9 Rh(COD)Ts ( R ) - BINAP 0 –
10 ( S,S ) - CHIRAPHOS 0 –
11 ( R,R ) - Et BPE 40 38
12 I 90 6
13 II > 99 72
14 ( S,S ) - JOSIPHOS > 99 86
15 IV > 99 89
16 V > 99 95
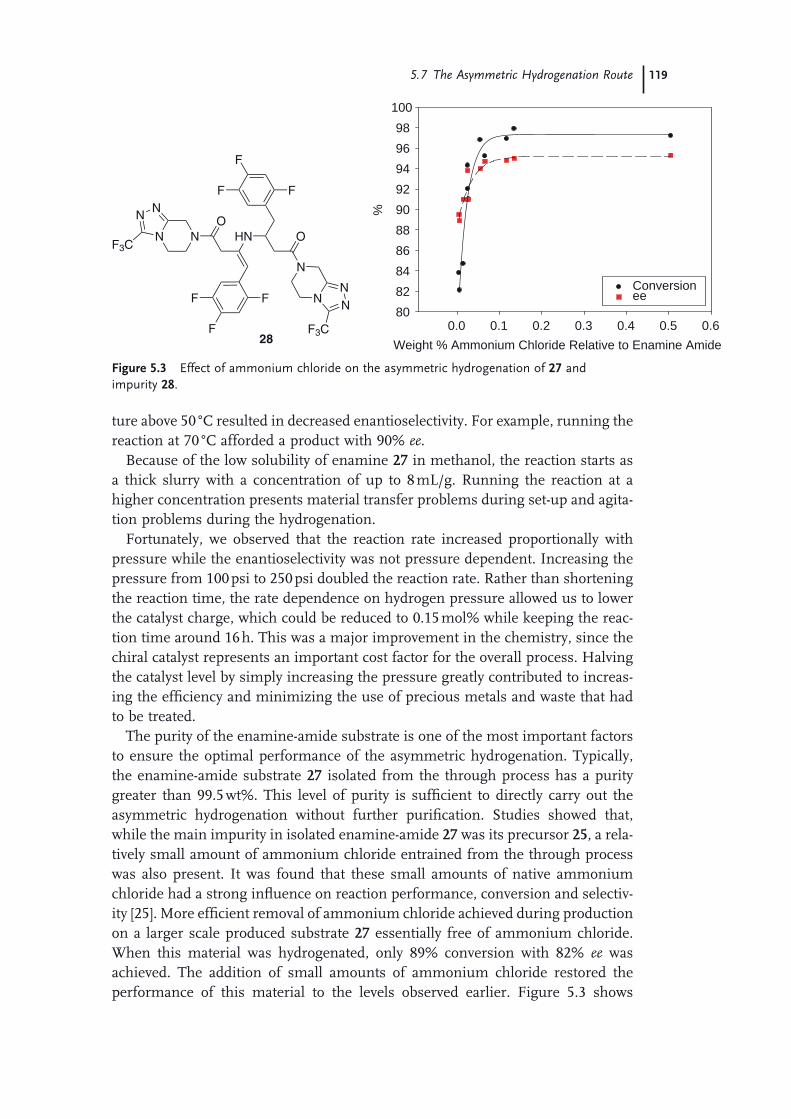
5.7 The Asymmetric Hydrogenation Route 119
ture above 50 ° C resulted in decreased enantioselectivity. For example, running the reaction at 70 ° C afforded a product with 90% ee .
Because of the low solubility of enamine 27 in methanol, the reaction starts as a thick slurry with a concentration of up to 8 mL/g. Running the reaction at a higher concentration presents material transfer problems during set - up and agita-tion problems during the hydrogenation.
Fortunately, we observed that the reaction rate increased proportionally with pressure while the enantioselectivity was not pressure dependent. Increasing the pressure from 100 psi to 250 psi doubled the reaction rate. Rather than shortening the reaction time, the rate dependence on hydrogen pressure allowed us to lower the catalyst charge, which could be reduced to 0.15 mol% while keeping the reac-tion time around 16 h. This was a major improvement in the chemistry, since the chiral catalyst represents an important cost factor for the overall process. Halving the catalyst level by simply increasing the pressure greatly contributed to increas-ing the effi ciency and minimizing the use of precious metals and waste that had to be treated.
The purity of the enamine - amide substrate is one of the most important factors to ensure the optimal performance of the asymmetric hydrogenation. Typically, the enamine - amide substrate 27 isolated from the through process has a purity greater than 99.5 wt%. This level of purity is suffi cient to directly carry out the asymmetric hydrogenation without further purifi cation. Studies showed that, while the main impurity in isolated enamine - amide 27 was its precursor 25 , a rela-tively small amount of ammonium chloride entrained from the through process was also present. It was found that these small amounts of native ammonium chloride had a strong infl uence on reaction performance, conversion and selectiv-ity [25] . More effi cient removal of ammonium chloride achieved during production on a larger scale produced substrate 27 essentially free of ammonium chloride. When this material was hydrogenated, only 89% conversion with 82% ee was achieved. The addition of small amounts of ammonium chloride restored the performance of this material to the levels observed earlier. Figure 5.3 shows
Weight % Ammonium Chloride Relative to Enamine Amide
%
80828486889092949698
100
Conversionee
F
F
F
HN
NNN
F3C
O
N
FF
F
ONN
NN
F3C
280.0 0.1 0.2 0.3 0.4 0.5 0.6
Figure 5.3 Effect of ammonium chloride on the asymmetric hydrogenation of 27 and impurity 28 .

120 5 Synthesis of Sitagliptin, the Active Ingredient in Januvia® and Janumet®
conversion and selectivity increase up to approximately 0.1 weight percent (0.3 mol%) ammonium chloride relative to 27 . Beyond 0.1 weight percent there is no further improvement in reaction performance, but production of the impurity 28 (Figure 5.3 ) becomes a concern.
Other acidic additives such as tartaric or phosphoric acids also increased the hydrogenation rate without affecting the selectivity. However, in the presence of these acidic additives, large amounts of dimer 28 were formed.
A typical reaction profi le plotted with in - line FTIR is shown in Figure 5.4 . The hydrogenation reaction starts as a slurry because of the low solubility of the sub-strate in MeOH. The concentration of enamine 27 in solution increases slowly as the reaction progresses. About 7 h into the reaction, the reaction mixture becomes homogeneous. Most of substrate has been consumed and conversion is approxi-mately 80% at this point. It takes another 8 – 10 h to reach the end point ( > 98% conversion).
Since the product of the reaction is an amine, some type of coordination or interaction with the catalyst is possible. This could potentially have an effect on the reaction rate and the asymmetric environment of the catalyst. Although the enantioselectivity does not change throughout the course of the reaction, this product - catalyst interaction can be detected as a product inhibition phenomenon. This was confi rmed by a product doping experiment (Figure 5.5 ), in which we observed lower reaction rates with increasing amounts of product present at the beginning of the reaction. Fortunately, the inhibitory effect is not strong enough to make the reaction impractical.
In order to gain some insight into the mechanism of this transformation, we performed the asymmetric transformation using deuterium instead of hydrogen. The product obtained had incorporated deuterium only in the β - position (Scheme 5.18 ). An NMR study also revealed that there is no H - D exchange between meth-anol - d 4 and sitagliptin ( 1 ) at either the α or β positions. These results suggested
0
Con
cent
ratio
n, m
ol/L
5 10Time [h]
15 200
0.02
0.04
0.06
0.08Product
Substrate
0.1
0.12
Figure 5.4 Reaction profi le by FTIR.
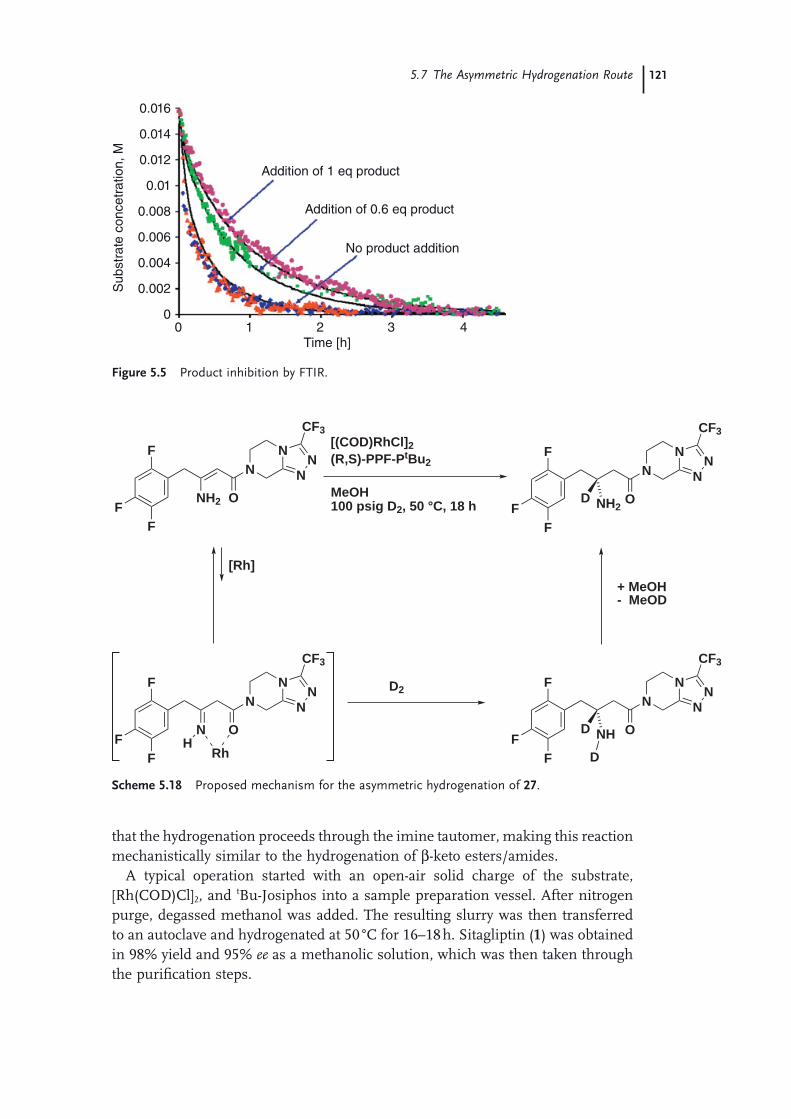
5.7 The Asymmetric Hydrogenation Route 121
Time [h]0 1 2 3 4
0
0.002
0.004
0.006
0.008
0.01
0.012Addition of 1 eq product
Addition of 0.6 eq product
No product addition
Sub
stra
te c
once
trat
ion,
M0.014
0.016
Figure 5.5 Product inhibition by FTIR.
NH2
FF
F
O
NN
NN
CF3
NH2
FF
F
O
NN
NN
CF3[(COD)RhCl]2(R,S)-PPF-PtBu2
MeOH100 psig D2, 50 °C, 18 h D
N
FF
F
O
NN
NN
CF3
NH
FF
F
O
NN
NN
CF3
D
D
+ MeOH- MeOD
D2
[Rh]
RhH
Scheme 5.18 Proposed mechanism for the asymmetric hydrogenation of 27 .
that the hydrogenation proceeds through the imine tautomer, making this reaction mechanistically similar to the hydrogenation of β - keto esters/amides.
A typical operation started with an open - air solid charge of the substrate, [Rh(COD)Cl] 2 , and t Bu - Josiphos into a sample preparation vessel. After nitrogen purge, degassed methanol was added. The resulting slurry was then transferred to an autoclave and hydrogenated at 50 ° C for 16 – 18 h. Sitagliptin ( 1 ) was obtained in 98% yield and 95% ee as a methanolic solution, which was then taken through the purifi cation steps.
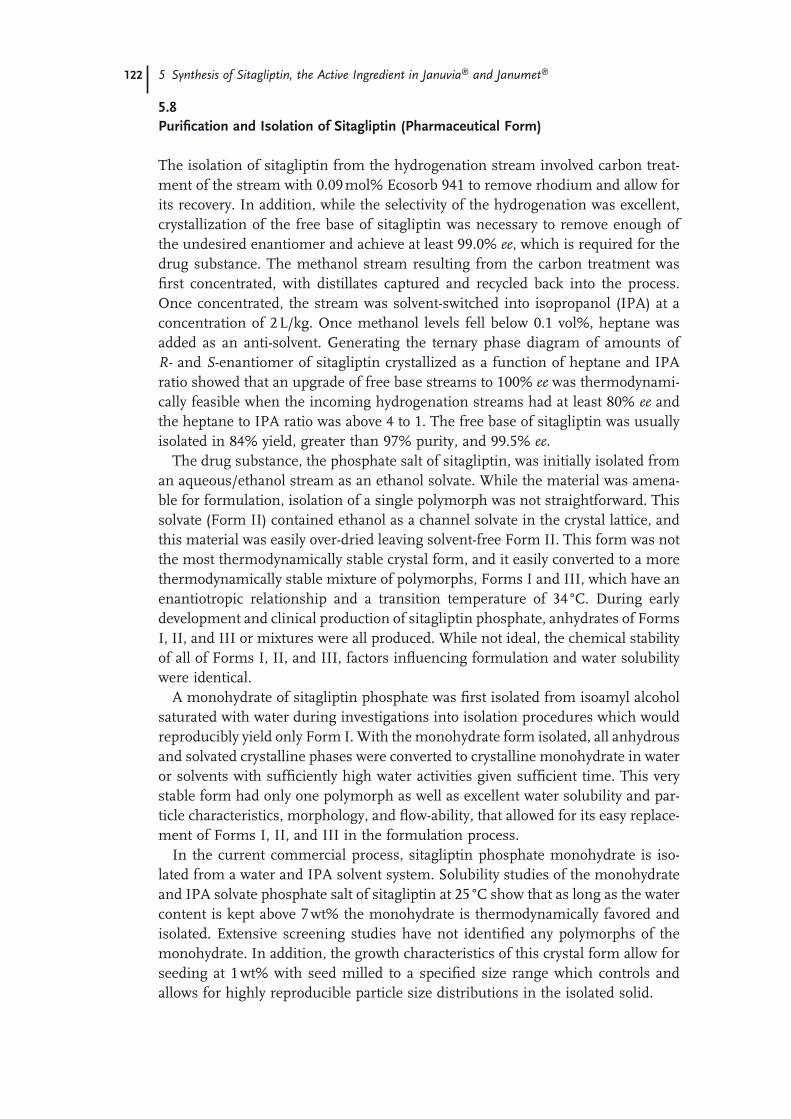
122 5 Synthesis of Sitagliptin, the Active Ingredient in Januvia® and Janumet®
5.8 Purifi cation and Isolation of Sitagliptin (Pharmaceutical Form)
The isolation of sitagliptin from the hydrogenation stream involved carbon treat-ment of the stream with 0.09 mol% Ecosorb 941 to remove rhodium and allow for its recovery. In addition, while the selectivity of the hydrogenation was excellent, crystallization of the free base of sitagliptin was necessary to remove enough of the undesired enantiomer and achieve at least 99.0% ee , which is required for the drug substance. The methanol stream resulting from the carbon treatment was fi rst concentrated, with distillates captured and recycled back into the process. Once concentrated, the stream was solvent - switched into isopropanol (IPA) at a concentration of 2 L/kg. Once methanol levels fell below 0.1 vol%, heptane was added as an anti - solvent. Generating the ternary phase diagram of amounts of R - and S - enantiomer of sitagliptin crystallized as a function of heptane and IPA ratio showed that an upgrade of free base streams to 100% ee was thermodynami-cally feasible when the incoming hydrogenation streams had at least 80% ee and the heptane to IPA ratio was above 4 to 1. The free base of sitagliptin was usually isolated in 84% yield, greater than 97% purity, and 99.5% ee .
The drug substance, the phosphate salt of sitagliptin, was initially isolated from an aqueous/ethanol stream as an ethanol solvate. While the material was amena-ble for formulation, isolation of a single polymorph was not straightforward. This solvate (Form II) contained ethanol as a channel solvate in the crystal lattice, and this material was easily over - dried leaving solvent - free Form II. This form was not the most thermodynamically stable crystal form, and it easily converted to a more thermodynamically stable mixture of polymorphs, Forms I and III, which have an enantiotropic relationship and a transition temperature of 34 ° C. During early development and clinical production of sitagliptin phosphate, anhydrates of Forms I, II, and III or mixtures were all produced. While not ideal, the chemical stability of all of Forms I, II, and III, factors infl uencing formulation and water solubility were identical.
A monohydrate of sitagliptin phosphate was fi rst isolated from isoamyl alcohol saturated with water during investigations into isolation procedures which would reproducibly yield only Form I. With the monohydrate form isolated, all anhydrous and solvated crystalline phases were converted to crystalline monohydrate in water or solvents with suffi ciently high water activities given suffi cient time. This very stable form had only one polymorph as well as excellent water solubility and par-ticle characteristics, morphology, and fl ow - ability, that allowed for its easy replace-ment of Forms I, II, and III in the formulation process.
In the current commercial process, sitagliptin phosphate monohydrate is iso-lated from a water and IPA solvent system. Solubility studies of the monohydrate and IPA solvate phosphate salt of sitagliptin at 25 ° C show that as long as the water content is kept above 7 wt% the monohydrate is thermodynamically favored and isolated. Extensive screening studies have not identifi ed any polymorphs of the monohydrate. In addition, the growth characteristics of this crystal form allow for seeding at 1 wt% with seed milled to a specifi ed size range which controls and allows for highly reproducible particle size distributions in the isolated solid.
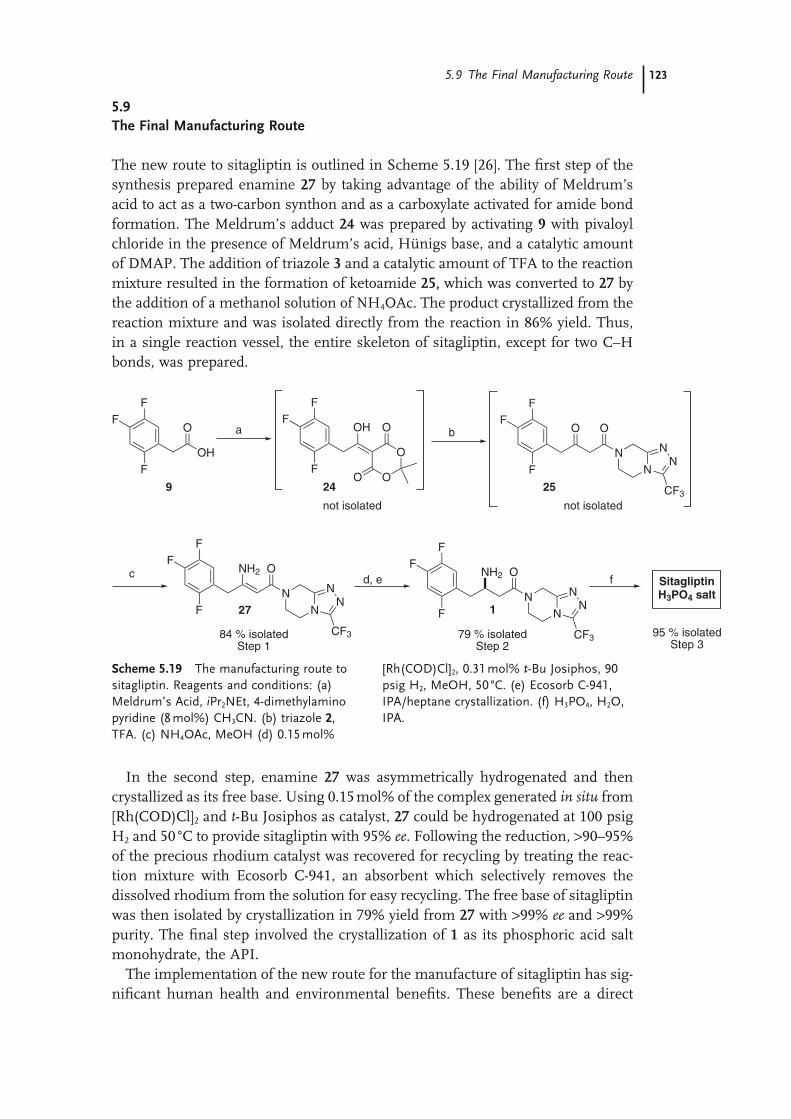
5.9 The Final Manufacturing Route 123
5.9 The Final Manufacturing Route
The new route to sitagliptin is outlined in Scheme 5.19 [26] . The fi rst step of the synthesis prepared enamine 27 by taking advantage of the ability of Meldrum ’ s acid to act as a two - carbon synthon and as a carboxylate activated for amide bond formation. The Meldrum ’ s adduct 24 was prepared by activating 9 with pivaloyl chloride in the presence of Meldrum ’ s acid, H ü nigs base, and a catalytic amount of DMAP. The addition of triazole 3 and a catalytic amount of TFA to the reaction mixture resulted in the formation of ketoamide 25, which was converted to 27 by the addition of a methanol solution of NH 4 OAc. The product crystallized from the reaction mixture and was isolated directly from the reaction in 86% yield. Thus, in a single reaction vessel, the entire skeleton of sitagliptin, except for two C – H bonds, was prepared.
NH2
FF
F
O
NN
NN
CF3
O
FF
FOH
d, e
79 % isolatedStep 2
f
95 % isolatedStep 3
OH
F
F
FO
O
O
O
O
F
F
O
N
NN
N
CF3
Fa b
c
84 % isolatedStep 1
SitagliptinH3PO4 salt
NH2
FF
F
O
NN
NN
CF3
24 25
27
9
not isolated not isolated
1
Scheme 5.19 The manufacturing route to sitagliptin. Reagents and conditions: (a) Meldrum ’ s Acid, i Pr 2 NEt, 4 - dimethylamino pyridine (8 mol%) CH 3 CN. (b) triazole 2 , TFA. (c) NH 4 OAc, MeOH (d) 0.15 mol%
[Rh(COD)Cl] 2 , 0.31 mol% t - Bu Josiphos, 90 psig H 2 , MeOH, 50 ° C. (e) Ecosorb C - 941, IPA/heptane crystallization. (f) H 3 PO 4 , H 2 O, IPA.
In the second step, enamine 27 was asymmetrically hydrogenated and then crystallized as its free base. Using 0.15 mol% of the complex generated in situ from [Rh(COD)Cl] 2 and t - Bu Josiphos as catalyst, 27 could be hydrogenated at 100 psig H 2 and 50 ° C to provide sitagliptin with 95% ee . Following the reduction, > 90 – 95% of the precious rhodium catalyst was recovered for recycling by treating the reac-tion mixture with Ecosorb C - 941, an absorbent which selectively removes the dissolved rhodium from the solution for easy recycling. The free base of sitagliptin was then isolated by crystallization in 79% yield from 27 with > 99% ee and > 99% purity. The fi nal step involved the crystallization of 1 as its phosphoric acid salt monohydrate, the API.
The implementation of the new route for the manufacture of sitagliptin has sig-nifi cant human health and environmental benefi ts. These benefi ts are a direct

124 5 Synthesis of Sitagliptin, the Active Ingredient in Januvia® and Janumet®
result of a highly effi cient and convergent synthesis which essentially constructs sitagliptin with near perfect optical and chemical purity in only three steps and 63% overall yield, a 40% increase in overall yield compared to the β - lactam route. In contrast to the fi rst - generation route, all of the stoichiometric reagents used in the new route are incorporated into the fi nal molecule, with the exception of H ü nig ’ s base used in the fi rst step. The reduction in the number of steps coupled with the effi ciency of each transformation has dramatically reduced the number of distillations and isolations and completely removed all aqueous extractions, thus producing less waste and requiring signifi cantly less time and energy for processing.
A comparison of the amount of waste produced per kilogram of sitagliptin manufactured by the two processes demonstrates the improved effi ciency of the new route (Figure 5.6 ). 10) Overall, the new route reduces the total waste output of the process by approximately 80%. This will result in over 220 000 kg less waste per 1000 kg of sitagliptin produced. While the fi rst - generation synthesis produced over 60 L of aqueous waste per kg of 1 , the new route produces no aqueous waste; only 2 liters of water per kg of sitagliptin is now required for its preparation.
By implementing the new route early in the development of sitagliptin, the environmental benefi ts will be realized over the entire lifetime of the product. The total amount of waste which will be eliminated by the new route may well exceed 150 000 metric tons over the lifetime of this important new treatment for type II diabetes, including nearly 50 000 metric tons of aqueous waste which will never be produced. Since the amount of raw materials and waste as well as processing time and energy has been reduced in the new route, it is a more cost - effective option for the manufacture of sitagliptin.
0
50
100
150
200
250
300
Total Waste Aqueous Waste
Was
te g
ener
ated
(kg/
kg 1
)
1st generation New route
Figure 5.6 Waste generation per kilogram of sitagliptin produced.
10) The fi gures calculated are prior to any recycling of solvent. Two of the four waste streams are easily recyclable by distillation.
References 125
Acknowledgments
The chemistry described in this chapter is the result of the creativity and incredibly hard work of many people and we want to use these last paragraphs to acknowl-edge their many scientifi c contributions.
The sitagliptin project helped rewrite the way that small - molecule pharmaceu-ticals are developed at Merck Process Research and set the foundations to realizing new ways for different groups to work together as a team in pursuit of a common goal. Dr. Rich D. Tillyer led the Process Research Department during this time of transformation, and we are thankful for his vision and for his support of innova-tion as the best way to develop new pharmaceutical compounds.
A successful team begins with leadership that is both strong and kind. We thank Dr. Edward J. J. Grabowski for providing that leadership, for his inspiration, and for making available to the team his experience over thirty years of Process Research.
We thank the rest of the members of Process Research who, at one point or another, contributed to the project in its initial stages, in the development of interim or long - term synthetic routes, in the discovery and development of new technologies, in mechanistic studies, or just in the preparation of bulk drug to support the pre - clinical or clinical programs: Charles Bazaral, Lisa DiMichele, Peter G. Dormer, Spencer D. Dreher, Tony Houck, Jinchu Liu, Chris McWilliams, Eugenia Njolito, Michelle Kubryk, Shane W. Krska, Robert A. Reamer, Nelo R. Rivera, Thorsten Rosner, Bryon L. Simmons, Yongkui Sun, David M. Tellers, and Michael Williams.
We also thank our colleagues from Global Pharmaceutical Commercialization led by Cindy Starbuck for their help in transitioning the different synthetic routes from kilogram scale to piloting and factory settings and our colleagues from Early Development Analytical Research for their support with analytical development. Finally, we thank our colleagues at SOLVIAS, Felix Spindler, Marc Thommen, and Christof Malan, for their work on the development of the catalytic asymmetric hydrogenation technology.
References
1 (a) Weber , A. ( 2004 ) J. Med. Chem. , 48 , 4135 – 4141 .
(b) Drucker , D.J. ( 2003 ) Exp. Opin. Investig. Drugs , 12 , 87 – 100 .
(c) Wiedeman , P.E. , and Trevillyan , J.M. ( 2003 ) Curr. Opin. Investig. Drugs , 4 , 412 – 420 .
2 Nelson , P.J. , and Potts , K.T. ( 1962 ) J. Org. Chem. , 27 , 3243 – 3248 .
3 (a) Xu , J. , Ok , H.O. , Gonzalez , E.J. , Colwell , L.F. , Jr. , Habulihaz , B. , He , H. , Leiting , B. , Lyons , K.A. , Marsilio , F. ,
Patel , R.A. , Wu , J.K. , Thornberry , N.A. , Weber , A.E. , and Parmee , E.R. ( 2004 ) Biorg. Med. Chem. Lett. , 14 , 4759 – 4762 .
(b) Sch ö llkopf , U. , Groth , U. , and Deng , C. ( 1981 ) Angew. Chem. Int. Ed. , 20 , 798 – 799 .
4 Angelaud , R. , Zhong , Y. - L. , Maligres , P. , Lee , J. , and Askin , D. ( 2005 ) J. Org. Chem. , 70 , 1949 – 1952 .
5 Brooks , D.W. , Lu , L.D. - L. , and Masa-mune , S. ( 1979 ) Angew. Chem. Int. Ed. , 18 , 72 – 73 .
126 5 Synthesis of Sitagliptin, the Active Ingredient in Januvia® and Janumet®
6 King , S.A. , Thompson , A.S. , King , A.O. , and Verhoeven , T.R. ( 1992 ) J. Org. Chem. , 57 , 6689 – 6691 .
7 Miller , M.J. , Mattingly , P.G. , Morrison , M.A. , and Kerwin , J.F. ( 1980 ) J. Am. Chem. Soc. , 102 , 7026 – 7032 .
8 Hansen , K.B. , Balsells , J. , Dreher , S. , Hsiao , Y. , Kubryk , M. , Palucki , M. , Rivera , N. , Steinhuebel , D. , Armstrong , J.D. , III , Askin , D. , and Grabowski E.J.J. ( 2005 ) Org. Process Res. Dev. , 9 , 634 – 639 .
9 Cimarelli , C. , and Palmieri , G. ( 1996 ) J. Org. Chem. , 61 , 5557 – 5563 .
10 Cohen , J.H. , Abdel - Magid , A.F. , Almond , H.R. , Jr. , and Maryanoff C.A. ( 2002 ) Tetrahedron Lett. , 43 , 1977 – 1981 .
11 Ikemoto , N. , Tellers , D.M. , Dreher , S.D. , Liu , J. , Huang , A. , Rivera , N.R. , Njolito , E. , Hsiao , Y. , McWilliams , J.C. , Williams , J.M. , Armstrong , J.D. , III , Sun , Y. , Mathre , D.J. , Grabowski , E.J.J. , and Tillyer R.D. ( 2004 ) J. Am. Chem. Soc. , 126 , 3048 – 3049 .
12 Makino , T. , and Kato , T. ( 1994 ) JP06128261(A) .
13 Perfl uoroalkyl substituted oxadiazoles are known to react readily with ammonia at room temperature to produce triazoles. (a) Brown , H.C. , and Cheng , M.T. ( 1962 ) J. Org. Chem. , 27 , 3240 – 3243 .
(b) Brown , H.C. , Cheng , M.T. , and Parcell , L.J. ( 1961 ) J. Org. Chem. , 26 , 4407 – 4409 .
(c) Reitz , D.B. , and Finkes , M.J. ( 1989 ) J. Het . Chem. , 26 , 225 – 230 .
(d) Reitz , D.B. , and Finkes , M.J. ( 1989 ) J. Org. Chem. , 54 , 1760 – 1762 .
(e) Barlow , M.C. , Bell , D. , O ’ Reilly , N.J. , and Tipping , A.E. ( 1983 ) J. Fluor. Chem. , 23 , 293 – 299 . , J
14 Balsells , J. , DiMichele , L. , Liu , J. , Kubryk , M. , Hansen , K. , and Armstrong , J.D. , III ( 2005 ) Org. Lett. , 7 , 1039 – 1042 .
15 Similar reactivity has been reported on furans: (a) Divald , S. , Chun , M.C. , and Joullie , M.M. ( 1976 ) J. Org. Chem. , 41 , 2835 – 2846 .
(b) Yamamoto , K. , and Tanaka , A. ( 1979 ) J. Het. Chem. , 16 , 1293 – 1294 .
16 For reviews, see: (a) Far , A.D. ( 2003 ) Angew. Chem. Int. Ed. , 42 , 2340 – 2348 .
(b) Gaber , A.E.M. , and McNab , H. ( 2001 ) Synthesis , 2059 – 2074 .
(c) Chen , B.C. ( 1991 ) Heterocycles , 32 , 529 – 597 .
(d) Huang , X. ( 1986 ) Youji Huaxue , 6 , 329 – 334 .
17 For detailed mechanistic studies, see: Xu , F. , Armstrong , J.D. , III , Zhou , G.X. , Simmons , B. , Hughes , D. , Ge , Z. , and Grabowski , E.J.J. ( 2004 ) J. Am. Chem. Soc. , 126 , 13002 – 13009 .
18 Ikemoto , N. , Tellers , D. , Dreher , S.D. , Liu , J. , Rivera , N. , Njolito , E. , Hsiao , Y. , McWilliams , J.C. , Williams , J.M. , Armstrong , J.D. , III , and Grabowski , E.J.J. Manuscript Submitted For Publication.
19 For previous examples of asymmetric hydrogenation of electron - rich N - alkyl and N,N - dialkyl enamines, see: (a) Lee , N.E. , and Buchwald , S.L. ( 1994 ) J. Am. Chem. Soc. , 116 , 5985 .
(b) Tararov , V.I. , Kadyrov , R. , Riermeier , T.H. , Holz , J. , and B ö rner , A. ( 2000 ) Tetrahedron Lett. , 41 , 2351 .
(c) Seido , N. , Nishikawa , T. , Sotoguch , T. , Yuasa , Y. , Miura , T. , Kumobayashi , H. ( 1999 ) U.S. Patent 5859249 .
20 First report: Lubell , W.D. , Kitamura , M. , and Noyori , R. ( 1991 ) Tetrahedron Asymmetry , 2 , 543 – 554 .
21 Halpern , J. ( 1982 ) Science , 217 , 401 – 407 . 22 Three reviews which refl ect the status of
beta - amino acid synthesis prior to the work described in this chapter are (a) Abdel - Magid , A. F. , Cohen , J. H. , and Maryanoff , C.A. ( 1999 ) Curr. Med. Chem. , 6 , 955 – 970 .
(b) Drexler , H. - J. , You , J. , Zhang , S. , Fischer , C. , Baumann , W. , Spannen-berg , A. , and Heller , D. ( 2003 ) Org. Process Res. Dev. , 7 , 355 – 361 .
(c) Ma , J. - A. ( 2003 ) Angew. Chem. Int. Ed. , 42 , 4290 – 4299 .
23 Schultz , C.S. , and Krska , S.W. ( 2007 ) Acc. Chem. Res. , 40 , 1320 – 1326 .
24 Hsiao , Y. , Rivera , N.R. , Rosner , T. , Krska , S.W. , Njolito , E. , Wang , F. , Sun , Y. , Armstrong , J.D. , III , Grabowski , E.J.J. , Tillyer , R.D. , Spindler , F. , and Malan C. ( 2004 ) J. Am. Chem. Soc. , 126 , 9918 – 9919 .
25 Clausen , A.M. , Dziadul , B. , Cappuccio , K.L. , Kaba , M. , Starbuck , C. , Hsiao , Y. , and Dowling , T.M. ( 2006 ) Org. Process Res. Dev , 10 , 723 – 726 .
26 Hansen , K.B. , Hsiao , Y. , Xu , F. , Rivera , N. , Clausen , A. , Kubryk , M. , Krska , S. , Rosner , T. , Simmons , B. , Balsells , J. , Ikemoto , N. , Sun , Y. , Spindler , F. , Malan , C. , Grabowski , E.J.J. , and Armstrong , J.D. , III ( 2009 ) J. Am. Chem. Soc. , 131 , 8798 – 8804 .
127
6 The Development of Short, Effi cient, Economic, and Sustainable Chemoenzymatic Processes for Statin Side Chains Martin Sch ü rmann , Michael Wolberg , Sven Panke , and Hans Kierkels
6.1 Introduction: Biocatalysis
The application of biocatalysis, that is the use of enzymes as catalysts in synthetic organic chemistry, has a number of attractions for the chemist wishing to design greener manufacturing processes:
• highly stereo - , chemo - and regio - selective catalysis
• effi ciency – potential for very high turnover numbers
• economics – simple whole - cell reactions, recovery and re - use of a supported enzyme, use of bulk industrial enzymes which can give manufacturing processes with favorable economics
• enzymes catalyze reactions under mild conditions – can use sensitive substrates
• may be able to access reactions/selectivity that are diffi cult or impossible via chemical catalysis/synthesis
• potential for clean/green processes.
A classical chemical synthesis of a statin side chain is shown in Scheme 6.1 . Typically, a β - keto ester is reduced to set the fi rst chiral center, and the Claisen
condensation employs a strong base and cryogenic conditions. Following manipu-lation to the desired R functionality, the second chiral center is set by reduction with sodium borohydride and a boron complex at − 78 ° C.
Many biocatalytic processes have been discovered that access statin side chains using cleaner and greener processes, often with better E factors, working in largely aqueous media instead of organic solvents, close to ambient rather than cryogenic temperatures, and removing the need for precious metal catalysis. Often a limiting factor in the establishment of effi cient bioprocesses is enzyme stability. This chapter describes the development of a green and effi cient route to a key statin intermediate using an enzyme that had to be modifi ed to enable robust operation
Green Chemistry in the Pharmaceutical Industry. Edited by Peter J. Dunn, Andrew S. Wells and Michael T. Williams© 2010 WILEY-VCH Verlag GmbH & Co. KGaA, WeinheimISBN: 978-3-527-32418-7

128 6 The Development of Short, Effi cient, Economic, and Sustainable Chemoenzymatic Processes
under harsh processing conditions. Further examples of biocatalysis are given in Chapters 8 and 16 and an interesting application of plant cell biotechnology in Chapter 7 .
6.2 The Relevance of Statins
Vastatins – generally known as statins – constitute an important class of 3 - hydroxy - 3 - methylglutaryl - Coenzyme A ( HMG - CoA ) reductase inhibitors as they can be applied as effective cholesterol - lowering drugs. As the most prominent second - generation vastatins, atorvastatin (marketed by Pfi zer under the brand name Lipitor ® ) and rosuvastatin (marketed by AstraZeneca under the brand name Crestor ® ) have generated world - wide sales of more than 12.4 and 3.6 billion US$ in 2008, respectively (from the Pfi zer and AstraZeneca Annual Reports), with Lipitor ® still being the world ’ s leading selling prescription drug. The common molecular feature of all statins is a homochiral 3,5 - dihydroxycarboxylic acid side chain connected to a (hetero)aromatic or carbocyclic residue (Figure 6.1 ). Conse-
ClO
O O
ClO
OH O
O
OtBu
OH OH
O
OR
OH O
O
OR
catalyst H2
base
Cl to R
NaBH4
Et2BOMe
Scheme 6.1 Typical chemical route to statin side chains.
Figure 6.1 Structures of atorvastatin (Lipitor ® ) and rosuvastatin (Crestor ® ).

6.3 Biocatalytic Routes to Statin Side Chains 129
quently, the development of effi cient synthetic routes to the chiral side chains, especially of second - generation statins such as atorvastatin and rosuvastatin, has attracted much industrial and academic attention.
6.3 Biocatalytic Routes to Statin Side Chains
Biocatalysis plays a central role in the manufacturing of statin side chains (Figure 6.2 ). A fi rst set of approaches exploits enzymatic desymmetrization reactions, for example, of the methoxyacetyl ester of glutaric acid diethyl ester with commercially available α - chymotrypsin as explored by Ciba SC with a yield of 94% and enantio-meric excess of up to 98% [1] . In the optimized procedure, the substrate was available in a concentration of 1 M at an enzyme/substrate ratio of 7% (wt/wt), and the reaction took approximately a day. The subsequent steps to the fi nal aceto-nide also involved a pig - liver esterase ( PLE ) catalyzed selective hydrolysis of the methoxyacetyl group (Figure 6.2 a).
An alternative approach, explored by Dowpharma, involved the desymmetriza-tion of prochiral dinitrile ( meso ) - 3 - hydroxyglutaronitrile ( 3 - HGN ) with a nitrilase provided by Diversa (Figure 6.2 b). The resulting ( R ) - 3 - hydroxy - 4 - cyanobutyrate can in several steps be converted into ethyl 6 - cyano - 3 R ,5 R - dihydroxyhexanoate, an advanced intermediate to atorvastatin. 3 - HGN could be easily prepared from
OCl NC CN
OHNC
OH
EtOOEtO
OOC(O)CH2OMe
COOH
a-Chymo-trypsin
Nitrilase
98.1% ee
KCN
ROH OOH
OR
HOOEtO
OOC(O)CH2OMe
>95 % ee
OC(CH3)3
O OOCl
OC(CH3)3
OOCl
OH
ClO O
ClOH OOH O
Cl
OH
OHDERA
2 eq.
+
> 99.5% ee
96.6% de
HOOEtO
OOH
ClO O
OEtCl
(S)
OH O
OEt (S)
O
OEt
ONC
(R)
OH O
OEt
ADH
PLE
A
B
C
DADH HHDH HHDH
E
> 99% ee
Figure 6.2 Overview of biocatalytic routes to vastatin side chains. PLE: pig - liver esterase, ADH: alcohol dehydrogenase, HHDH: halohydrin dehalogenase, DERA: 2 - deoxy - D - ribose 5 - phosphate aldolase.

130 6 The Development of Short, Effi cient, Economic, and Sustainable Chemoenzymatic Processes
epichlorohydrin on large scale in a two - step procedure: fi rst the conversion to 4 - chloro - 3 - hydroxybutyronitrile with hydrogen cyanide and then the replacement of the chlorine with sodium cyanide in an overall yield of 63% [2] . Hydrolysis of 3 - HGN by a nitrilase (BD9570, [3, 4] ) at a substrate concentration of 3 M, an enzyme loading of 6% (wt/wt), and a reaction time of 16 h proceeded in a yield of 99% and an ee of 98.6%. Overproduction of the enzyme in Pseudomonas fl uorescens was easily possible, with fi nal enzyme concentrations of more than 25 g/L of fer-mentation volume.
A theoretical yield of 100% can also be achieved with biocatalytic enantioselective reduction of prochiral ketones. For example, a 3,5 - diketocarboxylate could be reduced with excellent enantioselectivity by employing a recombinant NADPH - dependent Lactobacillus brevis alcohol dehydrogenase (typical reaction conditions: substrate concentration 30 mM, 24 h, yields > 70%) (Figure 6.2 c) [5] . The reduction proceeded with excellent enantio - and regioselectivity even for such sterically chal-lenging products as tert - butyl - ( S ) - chloro - 5 - hydroxy - 3 - oxohexanoate ( ee > 99.5%). The reaction was also scaled up to the 10 L scale [6] , and biocatalytic reduction of the second keto - function has been demonstrated [7, 8] .
An interesting multi - enzyme route to a regulated intermediate in statin side chain synthesis is also available via the reduction of chloro - acetoacetates with subsequent application of a halohydrin dehalogenase ( HHDH ) to replace the chlorine by a nitrile (Figure 6.2 d). The enantioselective reduction of the keto group can be achieved via various alcohol dehydrogenases [9] and was successfully opti-mized for the production of ( S ) - 4 - chloro - 3 - hydroxybutanoate [10] . An Escherichia coli strain producing a recombinant alcohol dehydrogenase ( > 99% ee ) from Candida magnoliae and a glucose dehydrogenase for cofactor regeneration from Bacillus megaterium were applied in a one - or aqueous/organic two - phase system consist-ing of butyl acetate and aqueous bacterial culture. Both approaches gave excellent product concentrations of 1.25 M in the aqueous phase for the one - phase approach or 2.7 M in the organic phase for the two - phase approach, with yields around and beyond 90% in 13 and 34 h, respectively. The resulting ethyl ( S ) - 4 - chloro - 3 - hy-droxybutyrate was converted with an HHDH to ( R ) - 4 - cyano - 3 - hydroxybutyrate, the regulated intermediate for the synthesis of atorvastatin, as demonstrated by Codexis [11] . The required enzyme was evolved from an Agrobacterium radiobacter enzyme with weak starting activity in E. coli to a fi nal performance of conversion of 130 g/L of substrate in 3 – 4 h with 1% of enzyme loading (wt/wt, relative to substrate). This step is also claimed by DSM for a variant of the HHDH from Arthrobacter sp. strain AD2 [12] .
Another promising route was reported in patent and open literature by both DSM and Diversa [13, 14] . This route employs a 2 - deoxy - D - ribose 5 - phosphate aldolase ( DERA ) that catalyzes a tandem aldol addition in which two equivalents of acetaldehyde ( AA ) are added in sequence to chloroacetaldehyde ( ClAA ) to produce a lactol derivative that is similar to the 3,5 - dihydoxy side chain of synthetic statins (Figure 6.2 e). Diversa screened environmental libraries for novel wild - type DERAs and identifi ed an enzyme that was both tolerant to increased substrate concentrations and more active than DERA from E. coli in the target reaction [13] .

6.4 2-Deoxy-d-Ribose 5-Phosphate Aldolase (DERA)-Based Routes to Statin Intermediates 131
A wild - type DERA with less than 30% sequence identity to the E. coli enzyme led to a signifi cant improvement over the E. coli wild - type DERA - based process origi-nally described by Wong [15] . The application of rational mutagenesis, based on the available crystal structure of the E. coli enzyme, expanded the range of suitable acceptor substrates for DERA to azido - substituted aldehydes, further facilitating access to, for example, the atorvastatin side chain [16] .
6.4 2 - Deoxy - D - Ribose 5 - Phosphate Aldolase ( DERA ) - Based Routes to Statin Intermediates
The beauty and the economic advantage of the DERA - based processes to certain statin side chains is based on the fact that the carbon skeleton and the two chiral centers of the side chains are built up in one step from the simple, cheap starting materials acetaldehyde and chloroacetaldehyde. This compensates for the higher biocatalyst loading required by the DERA approach compared with the other bio-catalytic processes summarized above, as will be described in the following sections.
6.4.1 Chemical Transformations of the DERA Product Toward Statins
We will elaborate further in this section how DERA can be used to manufacture the triketide - like lactol 1 in only one operational step from the bulk raw materials acetaldehyde and chloroacetaldehyde in a highly enantio - and diastereoselective manner. Lactol 1 contains the complete carbon skeleton of the chiral dihydroxy-carboxylate side chain of statins with both carbinol stereocenters in the correct absolute confi guration. The C - 6 chloro substituent enables the terminal function-alization required for coupling to the aromatic moiety typically found in synthetic statins. For derivatization of this key building block to synthetically applicable intermediates the following functional group transformations are required: (i) oxidation of the C - 1 carbon of lactol 1 – formally an aldehyde group – to a carboxylic derivative, (ii) protection of all three protic oxygen functions, and (iii) electrophilic activation of the C - 6 terminus in a manner suitable for C – C bond formation (or displacement of Cl by CN in the case of atorvastatin). Well - known intermediates of this type are typically protected with an isopropylidene group for the 1,3 - diol substructure and with a t - Bu group for the carboxylate moiety ( t - Bu ester). The electrophilic activation at C - 6 en route to statins other than atorvastatin is advanta-geously brought about by transformation of the chloro group to the primary alcohol, which can be oxidized to an aldehyde applicable in Wittig - type olefi nation reactions (Scheme 6.2 ) [17] .
The DERA - catalyzed synthesis of lactol 1 is performed in a purely aqueous medium under pH control, which allows the achievement of commercially attrac-tive product concentrations of more than 200 g/L [14] . Since lactol 1 is a highly
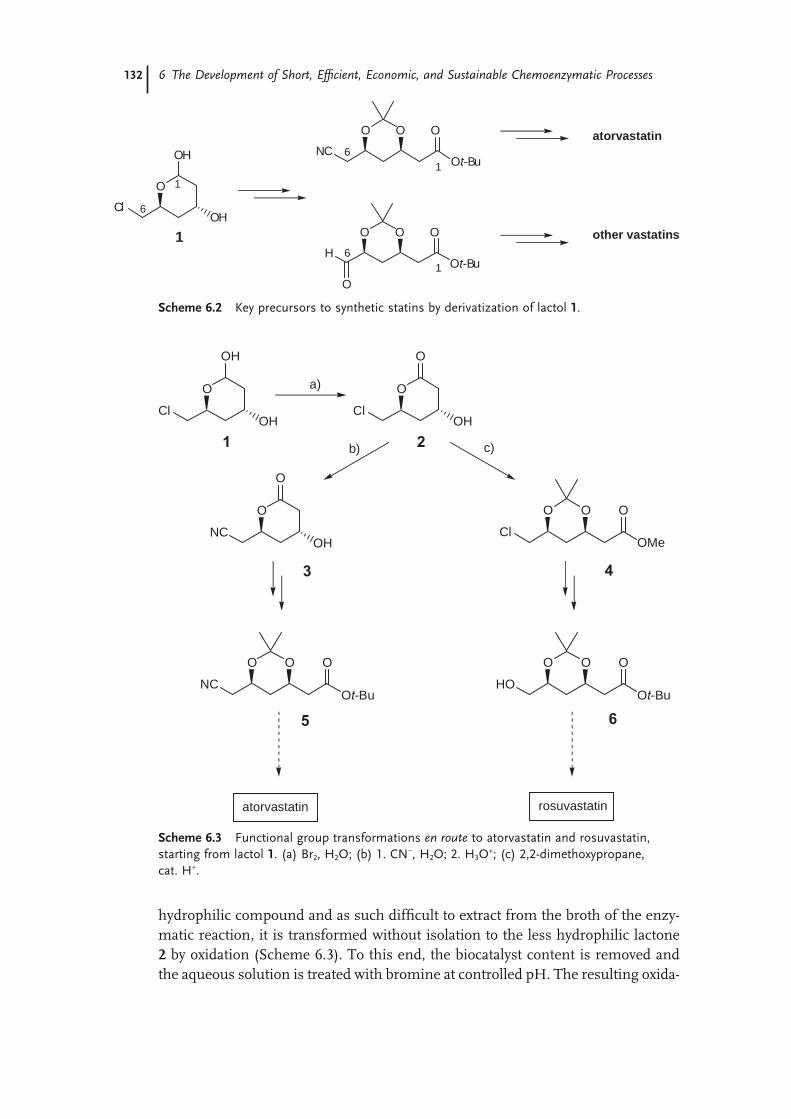
132 6 The Development of Short, Effi cient, Economic, and Sustainable Chemoenzymatic Processes
hydrophilic compound and as such diffi cult to extract from the broth of the enzy-matic reaction, it is transformed without isolation to the less hydrophilic lactone 2 by oxidation (Scheme 6.3 ). To this end, the biocatalyst content is removed and the aqueous solution is treated with bromine at controlled pH. The resulting oxida-
O
OH
ClOH
O O O
Ot-BuNC
O O O
Ot-Bu
O
H1
1
6
atorvastatin
other vastatins
16
16
Scheme 6.2 Key precursors to synthetic statins by derivatization of lactol 1 .
Cl
O O O
OMe
O
O
ClOH
O O O
Ot-BuHO
O
OH
ClOH
O
O
NCOH
NC
O O O
Ot-Bu
atorvastatin rosuvastatin
a)
b) c)21
3 4
5 6
Scheme 6.3 Functional group transformations en route to atorvastatin and rosuvastatin, starting from lactol 1 . (a) Br 2 , H 2 O; (b) 1. CN − , H 2 O; 2. H 3 O + ; (c) 2,2 - dimethoxypropane, cat. H + .
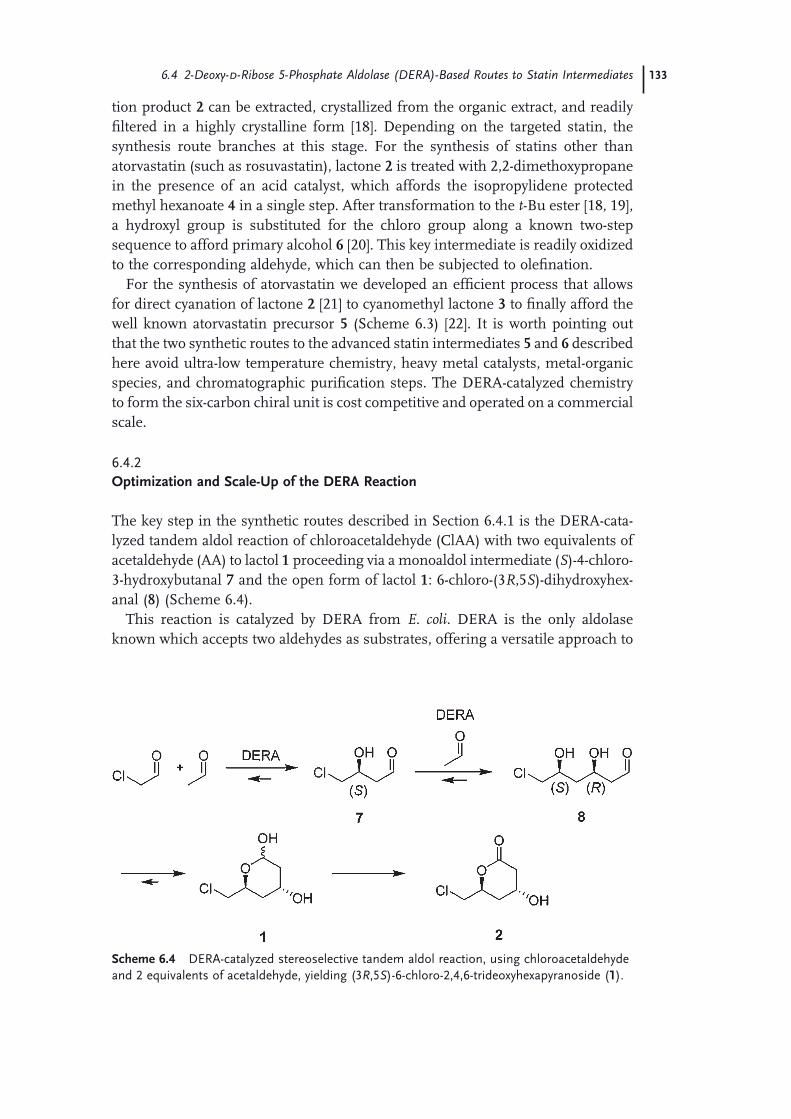
Scheme 6.4 DERA - catalyzed stereoselective tandem aldol reaction, using chloroacetaldehyde and 2 equivalents of acetaldehyde, yielding (3 R ,5 S ) - 6 - chloro - 2,4,6 - trideoxyhexapyranoside ( 1 ).
6.4 2-Deoxy-d-Ribose 5-Phosphate Aldolase (DERA)-Based Routes to Statin Intermediates 133
tion product 2 can be extracted, crystallized from the organic extract, and readily fi ltered in a highly crystalline form [18] . Depending on the targeted statin, the synthesis route branches at this stage. For the synthesis of statins other than atorvastatin (such as rosuvastatin), lactone 2 is treated with 2,2 - dimethoxypropane in the presence of an acid catalyst, which affords the isopropylidene protected methyl hexanoate 4 in a single step. After transformation to the t - Bu ester [18, 19] , a hydroxyl group is substituted for the chloro group along a known two - step sequence to afford primary alcohol 6 [20] . This key intermediate is readily oxidized to the corresponding aldehyde, which can then be subjected to olefi nation.
For the synthesis of atorvastatin we developed an effi cient process that allows for direct cyanation of lactone 2 [21] to cyanomethyl lactone 3 to fi nally afford the well known atorvastatin precursor 5 (Scheme 6.3 ) [22] . It is worth pointing out that the two synthetic routes to the advanced statin intermediates 5 and 6 described here avoid ultra - low temperature chemistry, heavy metal catalysts, metal - organic species, and chromatographic purifi cation steps. The DERA - catalyzed chemistry to form the six - carbon chiral unit is cost competitive and operated on a commercial scale.
6.4.2 Optimization and Scale - Up of the DERA Reaction
The key step in the synthetic routes described in Section 6.4.1 is the DERA - cata-lyzed tandem aldol reaction of chloroacetaldehyde (ClAA) with two equivalents of acetaldehyde (AA) to lactol 1 proceeding via a monoaldol intermediate ( S ) - 4 - chloro - 3 - hydroxybutanal 7 and the open form of lactol 1 : 6 - chloro - (3 R ,5 S ) - dihydroxyhex-anal ( 8 ) (Scheme 6.4 ).
This reaction is catalyzed by DERA from E. coli . DERA is the only aldolase known which accepts two aldehydes as substrates, offering a versatile approach to

134 6 The Development of Short, Effi cient, Economic, and Sustainable Chemoenzymatic Processes
a number of interesting multi - chiral - center building blocks for the fi ne chemicals industry.
The fi rst step in this sequence is the binding of a molecule of acetaldehyde ( ‘ donor ’ ) to the aldolase to form a Schiff base with the active site lysine followed by addition to ClAA, which acts as the ‘ acceptor ’ aldehyde. This reaction delivers the mono - addition product, which then acts as an acceptor again to react with a second molecule of AA, yielding the double addition product which cyclizes spon-taneously to the stable lactol 1 (Scheme 6.4 ).
DERA has shown low affi nity for ClAA and a number of other acceptor alde-hydes in contrast to its affi nity toward acetaldehyde for which a Km of 1.7 mM has been reported [23] . Hence, only by using relatively large amounts of DERA can a signifi cant conversion be achieved in the fi rst stereoselective aldol reac-tion, to yield the fi nal chiral trideoxyhexoses after a subsequent stereoselective aldol reaction was observed. This observation, from our own results and those published by Wong and coworkers [24] shows that the amount of DERA added to the reaction has a strong effect on the extent of conversion, and the amount of product from the second aldol reaction. In fact, the product isolated from a reaction between ClAA and acetaldehyde, using half the amount of DERA, was predominantly the monoaldol product 7 . Apparently the amount of enzyme added to the reaction is rather critical for obtaining high yields of the desired lactol product 1 .
To overcome problems of poor acceptor substrate acceptance, high concentra-tions of aldehyde substrates are required to obtain synthetically useful product yields. Unfortunately, DERA shows rather poor resistance to such high aldehyde concentrations, especially toward ClAA, resulting in rapid, irreversible inactivation of the enzyme. Therefore, the organic synthesis of (3 R ,5 S ) - 6 - chloro - 2,4,6 - trideoxy-hexapyranoside 1 requires very high amounts of DERA. Thus, despite the synthetic usefulness of DERA to produce chiral intermediates for statin side chains, the large - scale application is seriously hampered by its poor stability at industrially relevant aldehyde concentrations. The production capacity for such 2,4,6 - trideoxy-hexoses of wild - type E. coli DERA is rather low [15] .
In our attempt to improve the synthetic usefulness of DERA toward the synthe-sis of the lactol 1 , the reaction pathway was investigated in detail. NMR studies have provided valuable information and a better understanding about the product and by - product formation during a DERA - catalyzed addition of AA to ClAA. Scheme 6.5 shows a simplifi cation of a more complex reaction profi le in which ClAA and 2.5 equivalents of acetaldehyde were allowed to react in the presence of a large amount of DERA. Both the monoaldol product and the starting aldehydes form acetals. Not unexpectedly, the double aldol addition product of three acetal-dehyde molecules to form 2,4,6, - trideoxyhexose, previously reported by Gijsen and Wong [24] , was also formed. Among the by - products the most predominant are dimer complexes formed from the monoaldol product 7 via homo acetalization or cross acetalization with acetaldehyde. During the initial stage of the reaction, formation of the desired (3 R ,5 S ) - 6 - chloro - 2,4,6 - trideoxyhexapyranoside ( 1 ) is also observed.

Although it is diffi cult to accurately quantify the relative molar ratio of the reac-tion components (especially AA and ClAA), Figure 6.3 shows that ClAA is rapidly consumed, resulting in the formation of several monoaldol condensation products and derivatives. Interestingly, formation of the 2,4,6, - trideoxyhexose 1 starts once the ClAA and approximately 90% of the AA has been consumed. At this point, more than 80% of the ClAA has been converted to lactol 1 . Interestingly, the rate of this lactol formation at the start of the reaction is almost independent of the concentrations of monoaldol product 7 and AA, and decreases once most of the AA and monoaldol product 7 have been consumed. This is in line with Km values reported in the literature. Conversion of ClAA to the fi nal (3 R ,5 S ) - 6 - chloro - 2,4,6 - trideoxyhexapyranoside 1 is almost quantitative.
In order to improve this reaction, a proper understanding of all parameters affecting product yield is desired. Clearly, the high enzyme consumption is a major obstacle for an effi cient and economically feasible process. A likely cause of the ineffi cient use of DERA in this conversion is enzyme deactivation resulting from a reaction of the substrates and (by - ) products with the enzyme. In general, alde-hydes and α - halo carbonyls tend to denature enzymes because of irreversible reactions with amino acid residues, especially lysine residues. From the three - dimensional structure it is known that DERA contains several solvent - accessible lysine residues [25] . Moreover, the complicated reaction profi le as shown in Scheme 6.5 indicates the potential pitfalls of this reaction.
Scheme 6.5 NMR elucidation of the DERA - catalyzed reaction of ClAA and 2.5 equivalents of AA using on - line monitoring of the reaction mixture by 600 MHz NMR.
6.4 2-Deoxy-d-Ribose 5-Phosphate Aldolase (DERA)-Based Routes to Statin Intermediates 135
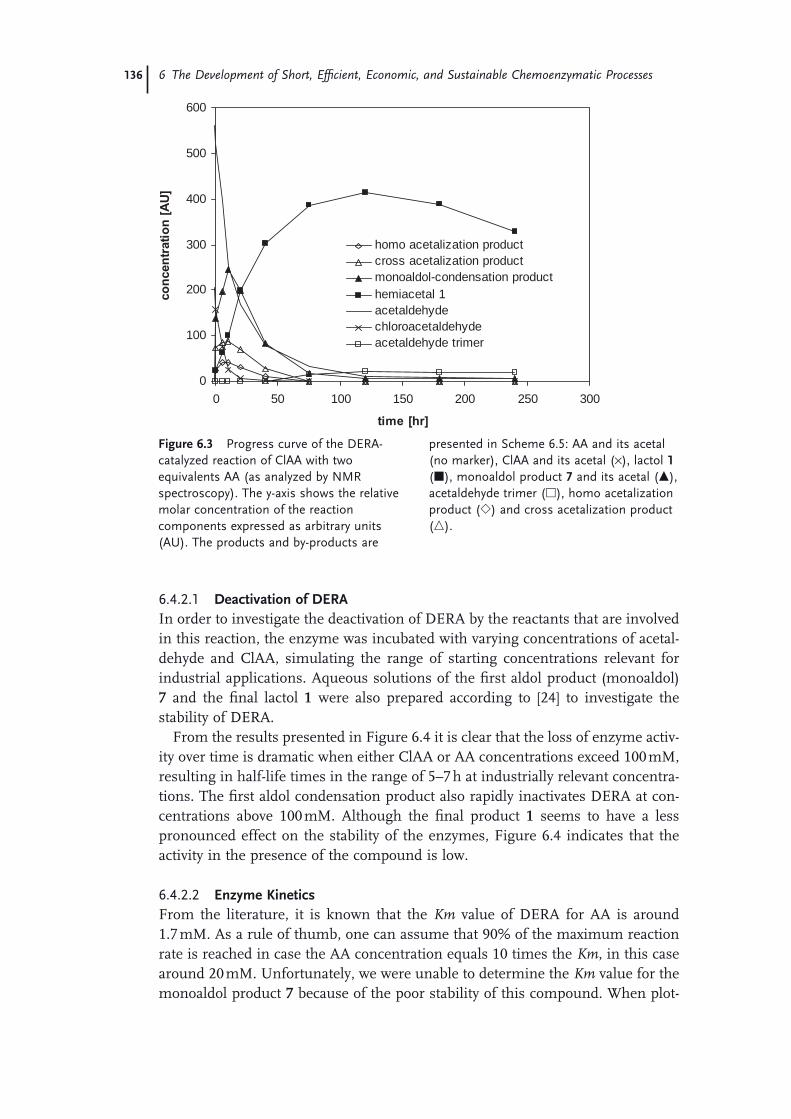
136 6 The Development of Short, Effi cient, Economic, and Sustainable Chemoenzymatic Processes
6.4.2.1 Deactivation of DERA In order to investigate the deactivation of DERA by the reactants that are involved in this reaction, the enzyme was incubated with varying concentrations of acetal-dehyde and ClAA, simulating the range of starting concentrations relevant for industrial applications. Aqueous solutions of the fi rst aldol product (monoaldol) 7 and the fi nal lactol 1 were also prepared according to [24] to investigate the stability of DERA.
From the results presented in Figure 6.4 it is clear that the loss of enzyme activ-ity over time is dramatic when either ClAA or AA concentrations exceed 100 mM, resulting in half - life times in the range of 5 – 7 h at industrially relevant concentra-tions. The fi rst aldol condensation product also rapidly inactivates DERA at con-centrations above 100 mM. Although the fi nal product 1 seems to have a less pronounced effect on the stability of the enzymes, Figure 6.4 indicates that the activity in the presence of the compound is low.
6.4.2.2 Enzyme Kinetics From the literature, it is known that the Km value of DERA for AA is around 1.7 mM. As a rule of thumb, one can assume that 90% of the maximum reaction rate is reached in case the AA concentration equals 10 times the Km , in this case around 20 mM. Unfortunately, we were unable to determine the Km value for the monoaldol product 7 because of the poor stability of this compound. When plot-
0
100
200
300
400
500
600
0 50 100 150 200 250 300
time [hr]
co
ncen
trati
on
[A
U]
homo acetalization productcross acetalization productmonoaldol-condensation producthemiacetal 1acetaldehydechloroacetaldehydeacetaldehyde trimer
Figure 6.3 Progress curve of the DERA - catalyzed reaction of ClAA with two equivalents AA (as analyzed by NMR spectroscopy). The y - axis shows the relative molar concentration of the reaction components expressed as arbitrary unit s ( AU ). The products and by - products are
presented in Scheme 6.5 : AA and its acetal (no marker), ClAA and its acetal ( × ), lactol 1 ( � ), monoaldol product 7 and its acetal ( � ), acetaldehyde trimer ( � ), homo acetalization product ( � ) and cross acetalization product ( � ).
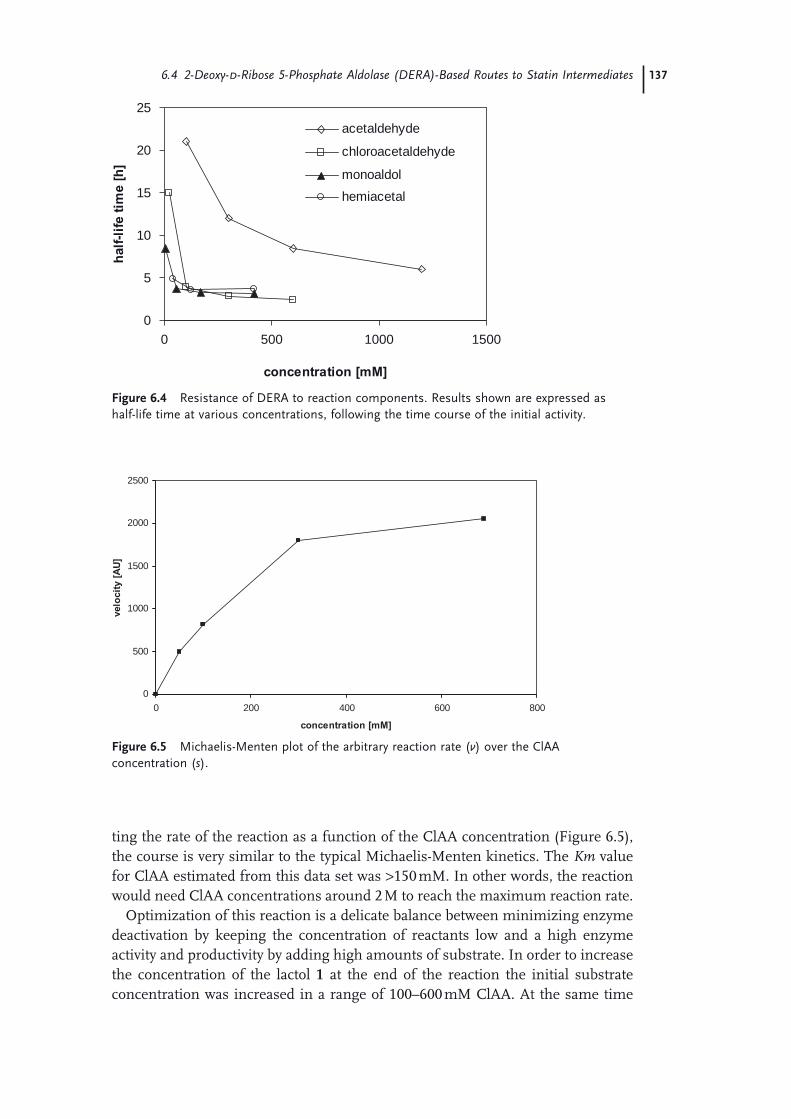
ting the rate of the reaction as a function of the ClAA concentration (Figure 6.5 ), the course is very similar to the typical Michaelis - Menten kinetics. The Km value for ClAA estimated from this data set was > 150 mM. In other words, the reaction would need ClAA concentrations around 2 M to reach the maximum reaction rate.
Optimization of this reaction is a delicate balance between minimizing enzyme deactivation by keeping the concentration of reactants low and a high enzyme activity and productivity by adding high amounts of substrate. In order to increase the concentration of the lactol 1 at the end of the reaction the initial substrate concentration was increased in a range of 100 – 600 mM ClAA. At the same time
0
5
10
15
20
25
0 500 1000 1500
concentration [mM]
half
-lif
e t
ime [
h]
acetaldehyde
chloroacetaldehyde
monoaldol
hemiacetal
Figure 6.4 Resistance of DERA to reaction components. Results shown are expressed as half - life time at various concentrations, following the time course of the initial activity.
0
500
1000
1500
2000
2500
0 200 400 600 800
concentration [mM]
velo
cit
y [
AU
]
Figure 6.5 Michaelis - Menten plot of the arbitrary reaction rate ( v ) over the ClAA concentration ( s ).
6.4 2-Deoxy-d-Ribose 5-Phosphate Aldolase (DERA)-Based Routes to Statin Intermediates 137
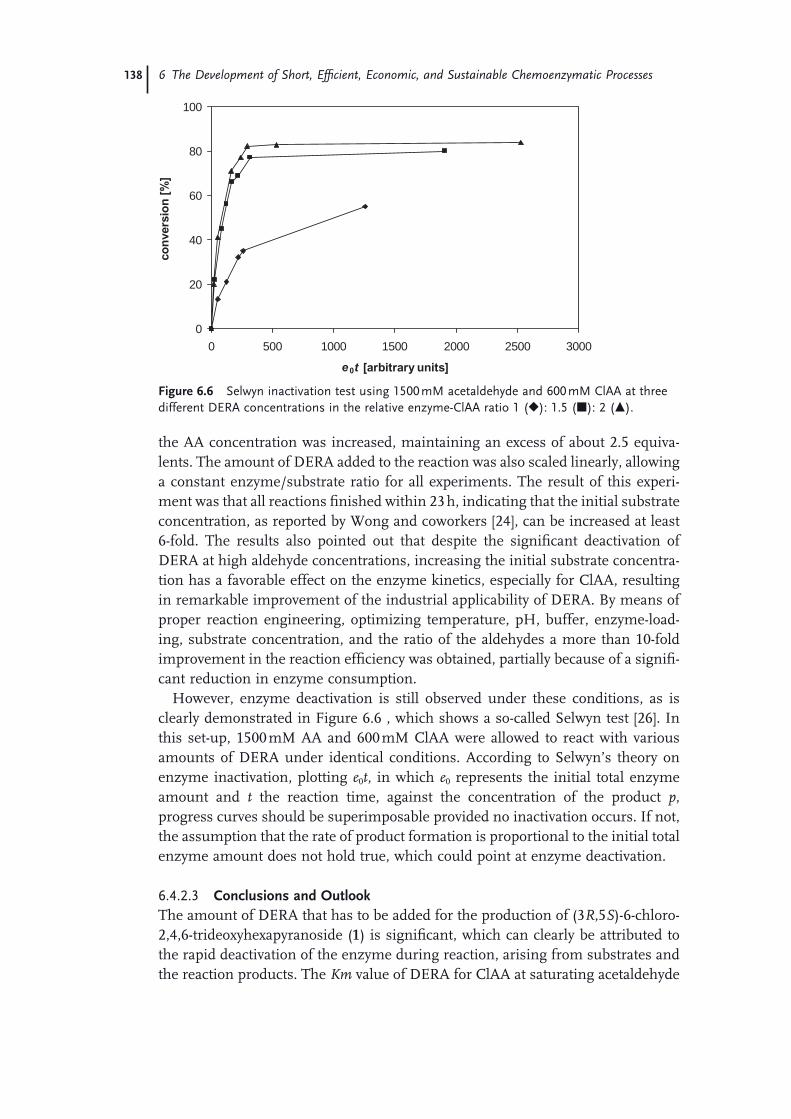
138 6 The Development of Short, Effi cient, Economic, and Sustainable Chemoenzymatic Processes
the AA concentration was increased, maintaining an excess of about 2.5 equiva-lents. The amount of DERA added to the reaction was also scaled linearly, allowing a constant enzyme/substrate ratio for all experiments. The result of this experi-ment was that all reactions fi nished within 23 h, indicating that the initial substrate concentration, as reported by Wong and coworkers [24] , can be increased at least 6 - fold. The results also pointed out that despite the signifi cant deactivation of DERA at high aldehyde concentrations, increasing the initial substrate concentra-tion has a favorable effect on the enzyme kinetics, especially for ClAA, resulting in remarkable improvement of the industrial applicability of DERA. By means of proper reaction engineering, optimizing temperature, pH, buffer, enzyme - load-ing, substrate concentration, and the ratio of the aldehydes a more than 10 - fold improvement in the reaction effi ciency was obtained, partially because of a signifi -cant reduction in enzyme consumption.
However, enzyme deactivation is still observed under these conditions, as is clearly demonstrated in Figure 6.6 , which shows a so - called Selwyn test [26] . In this set - up, 1500 mM AA and 600 mM ClAA were allowed to react with various amounts of DERA under identical conditions. According to Selwyn ’ s theory on enzyme inactivation, plotting e 0 t , in which e 0 represents the initial total enzyme amount and t the reaction time, against the concentration of the product p , progress curves should be superimposable provided no inactivation occurs. If not, the assumption that the rate of product formation is proportional to the initial total enzyme amount does not hold true, which could point at enzyme deactivation.
6.4.2.3 Conclusions and Outlook The amount of DERA that has to be added for the production of (3 R ,5 S ) - 6 - chloro - 2,4,6 - trideoxyhexapyranoside ( 1 ) is signifi cant, which can clearly be attributed to the rapid deactivation of the enzyme during reaction, arising from substrates and the reaction products. The Km value of DERA for ClAA at saturating acetaldehyde
0
20
40
60
80
100
0 500 1000 1500 2000 2500 3000
e 0t [arbitrary units]
co
nvers
ion
[%
]
Figure 6.6 Selwyn inactivation test using 1500 mM acetaldehyde and 600 mM ClAA at three different DERA concentrations in the relative enzyme - ClAA ratio 1 ( � ): 1.5 ( � ): 2 ( � ).

6.4 2-Deoxy-d-Ribose 5-Phosphate Aldolase (DERA)-Based Routes to Statin Intermediates 139
concentrations is > 150 mM, indicating that ClAA amounts of at least 2 M are required to reach optimal reaction rates.
The presented data indicate that reaction engineering for this particular reaction is complicated, requiring a compromise between minimizing enzyme deactivation and increasing productivity. To obtain a fast reaction, high concentrations of ClAA are needed; however, this also causes a rapid deactivation of DERA. To fi nd this balance between high activity and productivity together with a reasonable enzyme stability one could think of a substrate - feeding protocol. However, one has to keep in mind that the Km for ClAA is high; consequently a feeding protocol for this compound is prohibitive. A feeding protocol for ClAA means a constant low con-centration of this compound and hence a low overall reaction rate. Consequently, almost no desired product is formed and all substrates end up forming by - prod-ucts. Feeding AA may have the potential to decrease enzyme consumption, but still the overall concentration of aldehyde derivatives is high, resulting in a signifi -cant deactivation of DERA.
High enzyme consumption is caused by two enzyme properties: fi rstly, the enzyme is inactivated by essentially each of the reactants, and secondly, DERA ’ s high Km for ClAA demands high ClAA concentrations to avoid long process times, which leads in turn to fast deactivation. Both of these factors can be the subject of an enzyme evolution trajectory, aiming at: (i) improving the stability of the enzyme in the presence of large amounts of reactants; and (ii) reducing the K m value for ClAA, so that the reaction proceeds rapidly at low concentrations of chloroacetaldehyde and acetaldehyde.
6.4.3 Improvement of DERA by Directed Evolution
Despite the signifi cant inactivation of wild - type E. coli DERA by its substrates and products, especially ClAA, and its rather low activity with ClAA as acceptor sub-strate compared to DERA ’ s natural substrate glyceraldehyde 3 - phosphate, it was possible to develop an effi cient process with this enzyme. However, biocatalyst loadings and therefore the biocatalyst cost contribution to the process were higher than desirable. Hence we decided to perform random mutagenesis and high - throughput ( HTP ) screening to identify variants of the E. coli DERA with improved stability against ClAA and improved productivities in the target reaction with ClAA.
Two complementary screening strategies were developed to tackle the two obsta-cles: one spectrophotometric method based on the standard DERA activity assay addressing inactivation by ClAA and one HTP - GC/MS method for the direct detec-tion of the DERA reaction products (Figure 6.7 ). After generation of sequence diversity by simple error - prone polymerase chain reaction (epPCR) the E. coli deoC library was expressed in micro - titer plate s ( MTP s). The cell - free extract generated in the MTPs was directly used for the different screenings. Because of the higher throughput, about 10 000 clones were screened in the stability screening compared to 3000 clones in the productivity screening [27] .
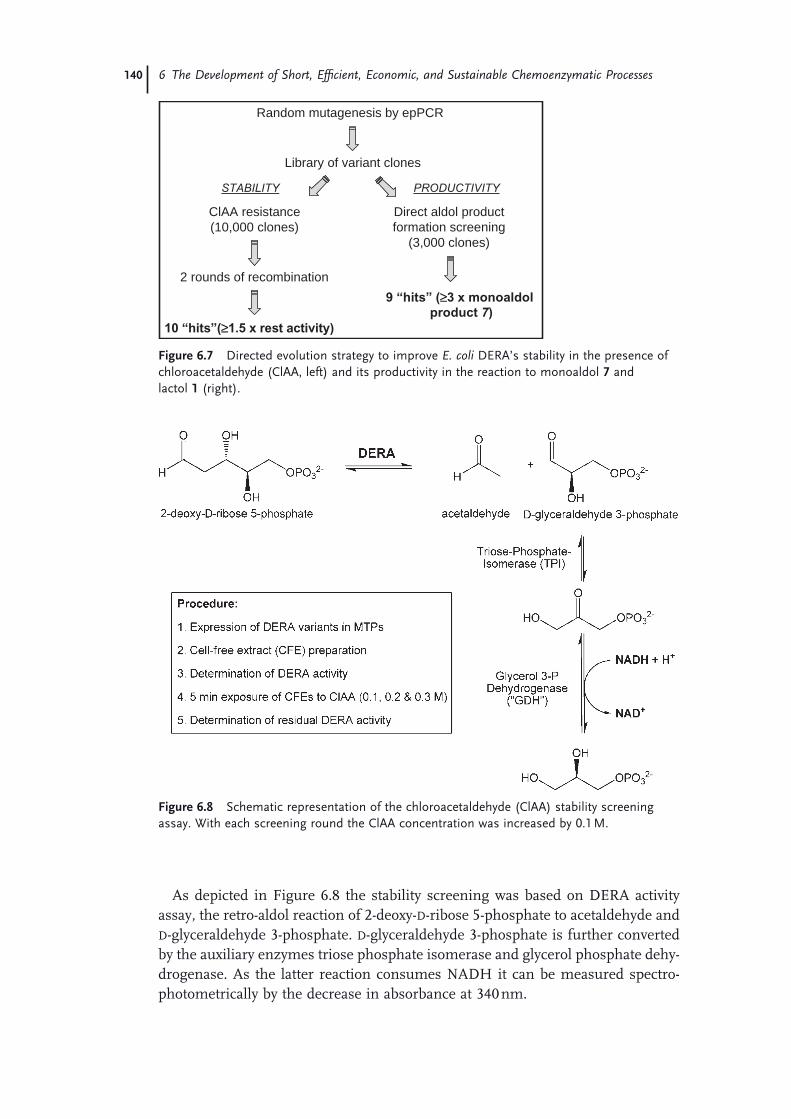
140 6 The Development of Short, Effi cient, Economic, and Sustainable Chemoenzymatic Processes
As depicted in Figure 6.8 the stability screening was based on DERA activity assay, the retro - aldol reaction of 2 - deoxy - D - ribose 5 - phosphate to acetaldehyde and D - glyceraldehyde 3 - phosphate. D - glyceraldehyde 3 - phosphate is further converted by the auxiliary enzymes triose phosphate isomerase and glycerol phosphate dehy-drogenase. As the latter reaction consumes NADH it can be measured spectro-photometrically by the decrease in absorbance at 340 nm.
Random mutagenesis by epPCR
9 “hits” (≥3 x monoaldol
product 7)
2 rounds of recombination
ClAA resistance(10,000 clones)
Direct aldol productformation screening
(3,000 clones)
Library of variant clones
10 “hits”(≥1.5 x rest activity)
STABILITY PRODUCTIVITY
Figure 6.7 Directed evolution strategy to improve E. coli DERA ’ s stability in the presence of chloroacetaldehyde (ClAA, left) and its productivity in the reaction to monoaldol 7 and lactol 1 (right).
Figure 6.8 Schematic representation of the chloroacetaldehyde (ClAA) stability screening assay. With each screening round the ClAA concentration was increased by 0.1 M.

After screening about 10 000 individual variant clones, more than 60 primary ‘ hit ’ clones with more than 50% increased stability were selected and recombined using a proprietary recombination method [28] . After two rounds of recombination and screening with increased ClAA concentrations, ten clones were selected for retesting on shake - fl ask scale.
In the GC/MS based productivity screening we focused on the detection of monoaldol 7 , because the DERA activities produced on the MTP scale would not be suffi cient to produce reasonably detectable amounts of the target lactol 1 . This screening delivered 9 primary ‘ hit ’ clones out of 3000 clones with at least 3 times increased monoaldol 7 formation. The ‘ hit ’ clones from both screenings were cultivated on a shake - fl ask level and the corresponding DERA variants were tested in the target reaction to lactol 1 in comparison with wild - type E. coli DERA [27] . Diluted concentrations of 0.2 M ClAA and 2.3 equivalents of acetaldehyde were incubated with the DERA variants. Interestingly, we found that the improved stability in the presence of ClAA did not necessarily relate to an improved produc-tion of lactol 1 as observed for variants 25 - 6A and 19 - 10A (Figure 6.9 ). For variant 17 - 2D, only having a deletion of the C - terminal tyrosine residue 259, on the other hand, a threefold increased stability also led to a threefold increased product for-mation. However, the clearly most productive variant from the productivity screen-ing was 9 - 11H, which contained a single amino acid exchange of phenylalanine 200 to isoleucine. Under these diluted conditions, the Phe200Ile variant showed a 14 - fold increased productivity in the reaction to lactol 1 .
Finally, we rationally combined the most effi cient mutations from both screen-ing strategies. This resulted in two new E. coli DERA variants, both containing the
0100200300400500600700800900
10001100120013001400150016001700
wildtyp
e13
-2H17
-2D22
-4H 8-6D
25-6A
22-2C 2-3
H5-1
2H19
-3B
25-10
H25
-1D
21-10
F
19-10
A1-4
A4-4
A1-1
0A9-1
1H 9-9F
15-2F
15-10
B1-1
1C10
-4C
ClAA stability [% WT]
lactol 1 [% WT]
monoaldol 7 [% WT]
Figure 6.9 Retest results of the primary ‘ hit ’ clones from ClAA stability (13 - 2H to 19 - 10A) and productivity screening (1 - 4A to 10 - 4C). Comparable amounts of DERA cell - free
extracts were incubated with 0.2 M ClAA and 2.3 equiv. acetaldehyde for 16 h and analyzed for lactol 1 formation.
6.4 2-Deoxy-d-Ribose 5-Phosphate Aldolase (DERA)-Based Routes to Statin Intermediates 141

142 6 The Development of Short, Effi cient, Economic, and Sustainable Chemoenzymatic Processes
0.00
0.05
0.10
0.15
0.20
0.25
0.30
0.35
0.40
0 2 4 6 8 10time [h]
lac
tol 1
[m
ol/L
] wild-type DERAPhe200IlePhe200Ile/-Tyr259Phe200Ile+C-term. ext.
Figure 6.10 Comparison of lactol 1 production by wild - type DERA with variants Phe200Ile and the double mutants containing additional C - terminal
modifi cations. 0.5 M ClAA was reacted with 1 M acetaldehyde and the same DERA amount per liter reaction volume of each DERA variant, respectively.
Phe200Ile exchange plus either the deletion of Tyr259 or a frame - shift mutation close to the Stop - Codon. The frame - shift caused the deletion of the two terminal residues (S258 and Tyr259) and an extension by 11 amino acid residues (ThrThr-LysThrGlnLeuSerCysThrLysTrp). We compared these variants with wild - type DERA and Phe200Ile in the reaction with 0.5 M ClAA and 1 M acetaldehyde at identical biocatalyst loadings. Both double mutants performed signifi cantly better than wild - type but also than variant Phe200Ile DERA. Under these conditions both double variants produced 3 and 10 times more lactol 1 than Phe200Ile and wild - type DERA, respectively (Figure 6.10 ).
At about the same time, Greenberg and coworkers identifi ed several new wild - type DERAs from metagenomic libraries. One of these enzymes was scaled up to 100 g level and proved to be more effi cient than wild - type E. coli DERA in a dosing protocol. With a 2.4 - fold lower biocatalyst loading this new wild - type DERA pro-duced 558 mM compared to 456 mM of lactol 1 obtained with wild - type E. coli DERA [13] , resulting in an overall three times higher effi ciency.
6.5 Conclusions
Several effi cient biocatalytic processes to statin side chain intermediates have been developed in the last two decades, and all have their characteristic advantages and
References 143
disadvantages. Aldolases such as DERAs, for instance, have intrinsically lower K cat values compared to, for example, lipases or alcohol dehydrogenases even for their physiological substrates. Still it was possible to develop commercially viable proc-esses based on wild - type E. coli DERA, and their economics were further improved by reaction and enzyme engineering.
This, together with the short synthetic route starting from simple and cheap raw materials and the applicability of the DERA product as a common statin building block, makes the DERA process one of the economically most attractive routes for the manufacture of statin side chain intermediates.
Acknowledgments
We gratefully acknowledge the contributions and support of our colleagues Daniel Mink, Theo Sonke, and Marcel Wubbolts.
References
1 Ö hrlein , R. , and Baisch , G. ( 2003 ) Adv. Synth. Catal. , 345 , 713 – 715 .
2 Bergeron , S. , Chaplin , D.A. , Edwards , J.H. , Ellis , B.S.W. , Hill , C.L. , Holt - Tiffi n , K. , Knight , J.R. , Mahoney , T. , Osborne , A.P. , and Ruecroft , G. ( 2006 ) Org. Process Res. Dev. , 10 , 661 – 665 .
3 Burk , M. , Desantis , G. , Morgan , B. , and Zhu , Z. ( 2003 ) WO 2003/106415 .
4 DeSantis , G. , Wong , K. , Farwell , B. , Chatman , K. , Zhu , Z. , Tomlinson , G. , Huang , H. , Tan , X. , Bibbs , L. , Chen , P. , Kretz , K. , and Burk , M.J. ( 2003 ) J. Am. Chem. Soc. , 125 , 11476 – 11477 .
5 Wolberg , M. , Hummel , W. , Wandrey , C. , and M ü ller , M. ( 2000 ) Angew. Chem. Int. Ed. , 39 , 4306 – 4308 .
6 Wolberg , M. , Filho , M.V. , Bode , S. , Geilenkirchen , P. , Feldmann , R. , Liese , A. , Hummel , W. , and M ü ller , M. ( 2008 ) Bioprocess Biosyst. Eng. , 31 , 183 – 191 .
7 Patel , R.N. , Banerjee , A. , McNamee , C.G. , Brzozowski , D. , Hanson , R.L. , and Szarka , L.J. ( 1993 ) Enz. Microb. Technol. , 15 , 1014 – 1021 .
8 Holt , R.A. , Blacker , A.J. , and Reeve , C.D. ( 2001 ) WO 01/85975 .
9 Ernst , M. , Kaup , B. , M ü ller , M. , Bringer - Meyer , S. , and Sahm , H. ( 2005 ) Appl. Microbiol. Biotechnol. , 66 , 629 – 634 .
10 Kizaki , N. , Yasohara , Y. , Hasegawa , J. , Wada , M. , Kataoka , M. , and Shimizu , S. ( 2001 ) Appl. Microbiol. Biotechnol. , 55 , 590 – 595 .
11 Fox , R.J. , Davis , S.C. , Mundorff , E.C. , Newman , L.M. , Gavrilovic , V. , Ma , S.K. , Chung , L.M. , Ching , C. , Tam , S. , Muley , S. , Grate , J. , Gruber , J. , Whitman , J.C. , Sheldon , R.A. , and Huisman , G.W. ( 2007 ) Nat. Biotechnol. , 25 , 338 – 344 .
12 Mink , D. , Lutje Spelberg , J.H. , and de Vries , E. ( 2007 ) WO 2007/137816 .
13 Greenberg , W.A. , Varvak , A. , Hanson , S.R. , Wong , K. , Huang , H.J. , Chen , P. , and Burk , M.J. ( 2004 ) Proc. Natl. Acad. Sci. U. S. A. , 101 , 5788 – 5793 .
14 Kierkels , J.G.T. , Mink , D. , Panke , S. , Lommen , F.A.M. , and Heemskerk , D. ( 2003 ) WO 03/006656 .
15 Wong , C.H. , Garciajunceda , E. , Chen , L.R. , Blanco , O. , Gijsen , H.J.M. , and Steensma , D.H. ( 1995 ) J. Am. Chem. Soc. , 117 , 3333 – 3339 .
16 Desantis , G. , Liu , J.J. , Clark , D.P. , Heine , A. , Wilson , I.A. , and Wong , C.H. ( 2003 ) Bioorg. Med. Chem. , 11 , 43 – 52 .
17 An inverse olefi nation protocol based on the intermediate 6 has appeared in the patent literature recently (nucleophilic activation for Julia - Kocienski olefi nation):

144 6 The Development of Short, Effi cient, Economic, and Sustainable Chemoenzymatic
(a) Robl , J.A. , Chen , B. - C. , and Sun , C. - Q. ( 2004 ) US 6812345 ;
(b) Brodfuehrer , P.R. , Sattelberg , T.R. , Kant , J. , and Qian , X. ( 2005 ) US 6875867 .
18 Kooistra , J.H.M.H. , Zeegers , H.J.M. , Mink , D. , and Mulders , J.M.C.A. ( 2002 ) WO 02/06266 .
19 van Bakel , H.C.C.K. , Callant , D.M.C. , Kooistra , J.H.M.H. , and Maas , P.J.D. ( 2008 ) US 7442811 .
20 Thottathil , J.K. , Pendri , Y. , Li , W.S. , and Kronenthal , D.R. ( 1994 ) US 5278313 .
21 (a) Wolberg , M. ( 2003 ) Chemoenzymatic synthesis of the chiral side - chain of lipitor, Pt. 2: aldolase technology . 6th International Symposium on Biocatalysis and Biotransformations, Olomouc .
(b) Mink , D. , Wolberg , M. , Boesten , W.H.J. , and Sereinig , N. ( 2004 ) WO 2004/096788 .
22 (a) Baumann , K.L. , Butler , D.E. , Deering , C.F. , Mennen , K.E. , Millar , A. , Nanninga , T.N. , Palmer , C.W. , and Roth , B.D. ( 1992 ) Tetrahedron Lett. , 33 , 2283 – 2284 .
(b) Brower , P.L. , Butler , D.E. , Deering , C.F. , Le , T.V. , Millar , A. , Nanninga , T.N. , and Roth , B.D. ( 1992 ) Tetrahedron Lett. , 33 , 2279 – 2282 .
23 Chen , L. , Dumas , D.P. , and Wong , C.H. ( 1992 ) J. Am. Chem. Soc. , 114 , 741 – 748 .
24 Gijsen , H.J. , and Wong , C.H. ( 1994 ) J. Am. Chem. Soc. , 116 , 8422 – 8423 .
25 Heine , A. , DeSantis , G. , Luz , J.G. , Mitchell , M. , Wong , C.H. , and Wilson , I.A. ( 2001 ) Science , 294 , 369 – 374 .
26 Selwyn , M.J. ( 1965 ) Biochim. Biophys. Acta , 105 , 193 – 195 .
27 (a) Jennewein , S.M. , Sch ü rmann , M. , Mommers , J.H.M. , Mink , D. , Wolberg , M. , and Wubbolts , M.G. ( 2005 ) WO 05/118794 ;
(b) Jennewein , S. , Sch ü rmann , M. , Wolberg , M. , Hilker , I. , Luiten , R. , Wubbolts , M. , and Mink , D. ( 2006 ) Biotechnol. J. , 1 , 537 – 548 .
28 Bovenberg , R.A.L. , and Kerkman , R. ( 2003 ) WO 03/010311 .

145
7 The Taxol ® Story – Development of a Green Synthesis via Plant Cell Fermentation 1) Pia G. Mountford
7.1 Introduction
The Taxol ® story has spanned over 40 years, from the discovery of a potentially potent anti - tumor agent to the development of commercially viable means of producing an active pharmaceutical ingredient ( API ) that is still a widely used weapon in the oncologist ’ s arsenal. This story has been told in a number of dif-ferent forums over the last few years, commencing with the formal presentation given on the receipt by Bristol - Myers Squibb ( BMS ) of the 2004 Presidential Green Chemistry Challenge Award [1] . However, the re - telling of the story is always fun and typically fi nds a fascinated audience. Indeed, this was my experience when presenting the Taxol ® story at the 2006 Puerto Rico Chemical Association meeting during the Green Chemistry session [2] . I hope the readers of this chapter will fi nd the story as relevant and fresh as when it was fi rst told.
Taxol ® is a natural product that has impacted the lives of hundreds of thousands of people. Since 1992, it has been the API in certain chemotherapy agents provided to patients suffering from a variety of cancers and is approved for the treatment of ovarian, breast, non - small - cell lung cancers and AIDS - related Kaposi ’ s sarcoma in over 50 countries.
Taxol ® is the trademark name given to the complex small molecule, paclitaxel (Figure 7.1 ). The molecular complexity of paclitaxel is evident in the tetracyclic nucleus and 11 chiral centers. Throughout this text, I will use the brand name Taxol ® synonymously with its generic name, paclitaxel.
Green Chemistry in the Pharmaceutical Industry. Edited by Peter J. Dunn, Andrew S. Wells and Michael T. Williams© 2010 WILEY-VCH Verlag GmbH & Co. KGaA, WeinheimISBN: 978-3-527-32418-7
1) At the outset, it is pivotal to note that, as the author of this chapter, I can claim absolutely none of the credit for the dedication and commitment of the scientists, clinicians and hosts of other people who were the actual inventors and developers of Taxol ® through its various incarnations. I will simply try to tell the story.

146 7 The Taxol® Story – Development of a Green Synthesis via Plant Cell Fermentation
7.2 Discovery and Early Development
Taxol ® has had a most unusual clinical development history. As with many natural products that have been discovered to provide therapeutic benefi t to humans, it was the extract of a plant that provided the fi rst hint of the oncological potential of this product. Natural product chemists typically subject purifi ed plant extracts to screening for therapeutic activity. In 1963, an extract of the bark of the Pacifi c yew tree ( Taxus brevifolia ) (Figure 7.2 ) showed anti - tumor activity. This early work was done by Monroe Wall and Monsukh Wani of the Research Triangle Institute ( RTI ) under the auspices of the National Cancer Institute ( NCI ) [3] .
Dr Monroe Wall was recruited by the RTI to establish a chemistry program and natural products group, where he applied his experience in isolating small quanti-ties of natural products from plants to pioneer techniques for isolating drug metabolites. Dr. Wall ’ s program in natural products research had not been long in operation when he was given his fi rst sample of leaves, twigs, and bark of the Pacifi c yew ( Taxus brevifolia ) in 1964. He and Dr Mansukh Wani, a junior colleague at the time, found and isolated the tree ’ s active ingredient in 1966, and Dr. Wall named it ‘ Taxol ’ . The two scientists published Taxol ® ’ s chemical structure in 1971
O
OAcHO OBzH
OHOAc O
O
OH
ONH
O
Figure 7.1 Paclitaxel.
Figure 7.2 Pacifi c yew tree ( Taxus brevifolia) : tree and bark detail.

[4] and promptly turned all of their research work over to their government con-tractor, the NCI.
Eight years later, Dr Susan Horowitz, professor of molecular pharmacology at the Albert Einstein College of Medicine in the Bronx, defi ned the mechanism of action of Taxol ® in the cell division process. Microtubules are part of a structural network (the cytoskeleton) within the cell ’ s cytoplasm, but, in addition to structural support, microtubules take part in many other processes. A notable structure involving microtubules is the mitotic spindle used by eukaryotic cells to segregate their chromosomes correctly during cell division. The anti - tumor activity of Taxol ® was shown to arise from the molecule ’ s ability to block dynamic dissociation of microtubules by stabilizing guanosine diphosphate ( GDP ) - bound tubulin in the microtubule. Thus, even when hydrolysis of guanosine triphosphate ( GTP ) reaches the tip of the microtubule, there is no depolymerization of microtubules; cell divi-sion is stalled and leads to cell apoptosis (Figure 7.3 ) [5] .
7.3 From Extraction of T axol ® from Pacifi c Yew Tree Bark to Semi - Synthetic T axol ®
Phase I clinical trials using Taxol ® began in 1983, and it soon became clear that the quantities required for the clinical phases, as well as the projected commercial
Figure 7.3 Microtubule. Note: This image is the work of an employee of the United States Department of Energy (or predecessor organization) and was taken or made during
the course of the employee ’ s offi cial duties. As a work of the United States federal government, the image is in the public domain.
7.3 From Extraction of Taxol® from Pacifi c Yew Tree Bark to Semi-Synthetic Taxol® 147
148 7 The Taxol® Story – Development of a Green Synthesis via Plant Cell Fermentation
quantities that would be required based on the drug ’ s excellent performance, were going to be a major issue. Up to this point, Taxol ® continued to be isolated from the bark of the Pacifi c yew tree, which only contains about 0.0004% paclitaxel. The molecule is a secondary metabolite produced by the tree as a defense mechanism against insects and fungi [6] . Bark - stripping for the purposes of extracting Taxol ® is fatal for the yew trees, which take up to 200 years to reach maturity. Furthermore, the same trees comprise the signifi cant habitat of the endangered northern spotted owl (S trix occidentalis caurina ) [7] . When the NCI released the results of the Phase II trials of Taxol ® against the most virulent forms of ovarian cancer in 1988 [8] , the demand for the drug soared. Simultaneously, environmentalists in Oregon suc-ceeded in raising the huge - scale destruction of yew trees into a highly visible politi-cal issue [9, 10] . Clearly, the need to develop a more sustainable and productive source of Taxol ® was key to continuing to tap into this novel drug ’ s potential.
The molecular complexity of paclitaxel created enormous barriers to a complete synthetic solution to this supply issue. Although some researchers did make headway in the race toward a total synthesis, their efforts proved non - viable com-mercially, with published reports from successful research laboratories describing 40 - step syntheses with overall yields of about 2% [11, 12] .
In the early 1980s, a group of French researchers under the leadership of Pierre Potier and Andrew Greene commenced looking for semi - synthetic pathways to Taxol ® [14] . Their approach was to identify advanced ‘ fragments ’ of the Taxol ® nucleus in other yew species and use these as starting points for shortened syn-thetic routes to the target molecule. Such a starting point was identifi ed in the European yew tree ( Taxus baccata ). Leaves and twigs of this yew tree (Figure 7.4 ) were found to contain about 0.1% of a compound called 10 - deacetylbaccatin III, or 10 - DAB (Figure 7.5 ).
10 - DAB contains most of the structural elements of Taxol ® . The tetracyclic nucleus is assembled and contains the necessary stereochemistry. The acetyl group required at the 10 - position is missing, as is the side chain at C - 13, which is vital to the anti - tumor activity of the molecule. 10 - DAB thus provided a tempting starting point for a semi - synthetic approach to Taxol ® . Furthermore, harvesting of these leaves and twigs has been possible through cultivation of the yew tree throughout Europe, as the tree is not harmed in the process.
The unique properties of 10 - DAB and Taxol ® , however, created many unex-pected synthetic chemistry challenges. Extensive research funding by the NCI paved the way for the conversion of 10 - DAB to Taxol ® to become a high priority in many synthetic organic chemistry laboratories. However, by 1988 the United States government could no longer justify the huge ongoing costs of developing Taxol ® – the NCI had spent over $25 million by this point – and in late December 1989 BMS was granted a Cooperative Research and Development Agreement ( CRADA ) based on their detailed proposal for resolving the supply issue. This partnership leveraged both the clinical trial and distribution network that BMS had created, in addition to accessing the process development, scale - up, and manufacturing skills of BMS scientists for the synthesis of suffi cient quantities of the molecule for clinical trials and future commercial purposes.

Much of the basis of the BMS CRADA proposal was built on the ability of BMS to tap into the tremendous synthetic knowledge contained in Robert Holton ’ s research group at Florida State University ( FSU ). This research group had been actively studying the chemistry of Taxol ® and had made signifi cant strides toward a total synthesis and a viable semi - synthetic pathway from 10 - DAB. A licensing agreement between BMS and FSU was created, and in 1992 the fi rst commercially viable semi - synthetic route from 10 - DAB to Taxol ® was discovered [13] .
Acetylation of the 10 - hydroxy group of 10 - DAB proved to be far more compli-cated than fi rst anticipated, with the different reactivities of the three secondary hydroxyl groups (at C - 7, C - 10 and C - 13) requiring a multi - step protection sequence, low - temperatures (cryogenics), and hazardous reagents and solvents (Scheme 7.1 ).
Figure 7.4 European yew tree ( Taxus baccata) : close - up of leaves.
O
OAcHO OBzH
OHOH O
HO
10
13 23 5
7
Figure 7.5 10 - DAB (showing numbering).
7.3 From Extraction of Taxol® from Pacifi c Yew Tree Bark to Semi-Synthetic Taxol® 149

150 7 The Taxol® Story – Development of a Green Synthesis via Plant Cell Fermentation
Synthesis and coupling of the side chain to the tetracyclic nucleus also proved to be a non - trivial synthetic challenge. Potier and Greene fi nally succeeded in a synthesis, but, with the low yields (approximately 50%), theirs was not a commer-cially viable approach [14] . Eventually, however, BMS scientists, in collaboration with the Holton team from FSU, developed a synthesis of the β - lactam for the side chain using the sequence shown in Scheme 7.2 .
The coupling and protection - deprotection reactions to yield Taxol ® were fully licensed by BMS from FSU as part of the original licensing agreement (Scheme 7.3 ). This so - called ‘ metal alkoxide process ’ was patented by Holton in 1992 [13] .
With this process fi nally developed, the yield of Taxol ® was increased to the point that the synthesis became commercially viable in preparation for market launch of Taxol ® in 1993.
7.4 T axol ® from Plant Cell Fermentation
With the successful development and commercial manufacture of semi - synthetic Taxol ® , the destruction of the Pacifi c yew tree forests was halted. However, this successful move away from an essentially non - renewable source (extraction of the Pacifi c yew tree bark) to a renewable source (harvested European yew tree leaves and twigs to obtain 10 - DAB, followed by synthetic transformation to Taxol ® ) still presented signifi cant environmental challenges. The use of 13 different solvents,
O
OAcHO OBzH
OHOH O
HO O
OAcHO OBzH
OSiEt3OH O
HO
Silylation
O
OAcHO OBzH
OSiEt3OAc O
HO
Acetylation
Scheme 7.1 Semi - synthetic Taxol ® : acetylation.

some of them hazardous, 13 organic reagents, many of them toxic, waste streams from the process and the energy - intensive processing steps all led BMS to pursue an environmentally sustainable solution for Taxol ® production. The application of aqueous - based plant cell fermentation ( PCF ) provided the solution.
Techniques for the propagation of plant cells were developed in the 1950s when it was realized that plant cell cultures had the potential to synthesize a variety of useful, low molecular weight molecules. Although the use of plant cells to produce such molecules has been studied extensively, there has been limited commercial application in the production of secondary metabolites owing to low yields [15] . The Phyton Biotech GmbH process to generate paclitaxel is the largest commercial application of plant cell fermentation to date.
Using technology licensed from Phyton Biotech GmbH [16] , BMS scientists developed a PCF process using cells cultured from the needles of the Chinese yew
2+2 Addition
NO
O PhMeO
Ph
O
NHO
AcO PhN
N
Ph
Ph
Ph N
N
Ph
Ph
Ph
Hydrolysis
Enzymatic Resolution
NHO
AcO PhHydrolysis
NHO
HO Ph'Mopylation'
O
NHO
O PhMeO
Benzoylation
AcO
Acetoxyacetylchloride, DIPEADCM
Acetic acid, H2ONaOH, H2OHeptanes
Pen V AmidaseAq. (pH 7) buffer
Racemate
NaHCO3, NaOHMethanol, H2O
2-MethoxypropenePyridinium-p-toluene-sulfonateAcetonitrile
Benzoyl chlorideDIPEA/DMAPAcetonitile
Scheme 7.2 Semi - synthetic Taxol ® : side - chain precursor.
7.4 Taxol® from Plant Cell Fermentation 151

152 7 The Taxol® Story – Development of a Green Synthesis via Plant Cell Fermentation
tree ( Taxus chinensis) . Figure 7.6 shows a number of ‘ calluses ’ (a ‘ callus ’ is a mass of undifferentiated cells, usually sustained on a solid agar medium much in the same manner as bacteria are grown) derived from the Chinese yew tree.
Figure 7.7 summarizes the very lengthy plant cell fermentation process for the manufacture of Taxol ® . In this process, approximately 1 g of cells, comprising the contents of one frozen vial of the production cell bank, are grown on a solid agar medium plate to form calluses, which are subsequently transferred to a liquid growth medium. The seed build - up phase is followed by the growth phase (fer-mentation I), during which period the cell mass is built up, with weekly replace-ment of the fresh growth medium. This is followed by a production phase (fermentation II), in which the cells are fed with a special production medium and Taxol ® is produced as a secondary metabolite. The cell whole broth is subsequently extracted to recover crude Taxol ® , and this extract is further purifi ed by chroma-tography and crystallization to yield the active medicinal compound.
O
OAcHO OBzH
OSiEt3OAc O
HO
Coupling
+N
O
O PhMeO
Ph
O
OAcHO OBzH
OSiEt3OAc O
O
O
ONH
O
MeO
O
OAcHO OBzH
OHOAc O
O
OH
ONH
O
Deprotection
O
Scheme 7.3 Semi - synthetic Taxol ® : coupling and deprotection.
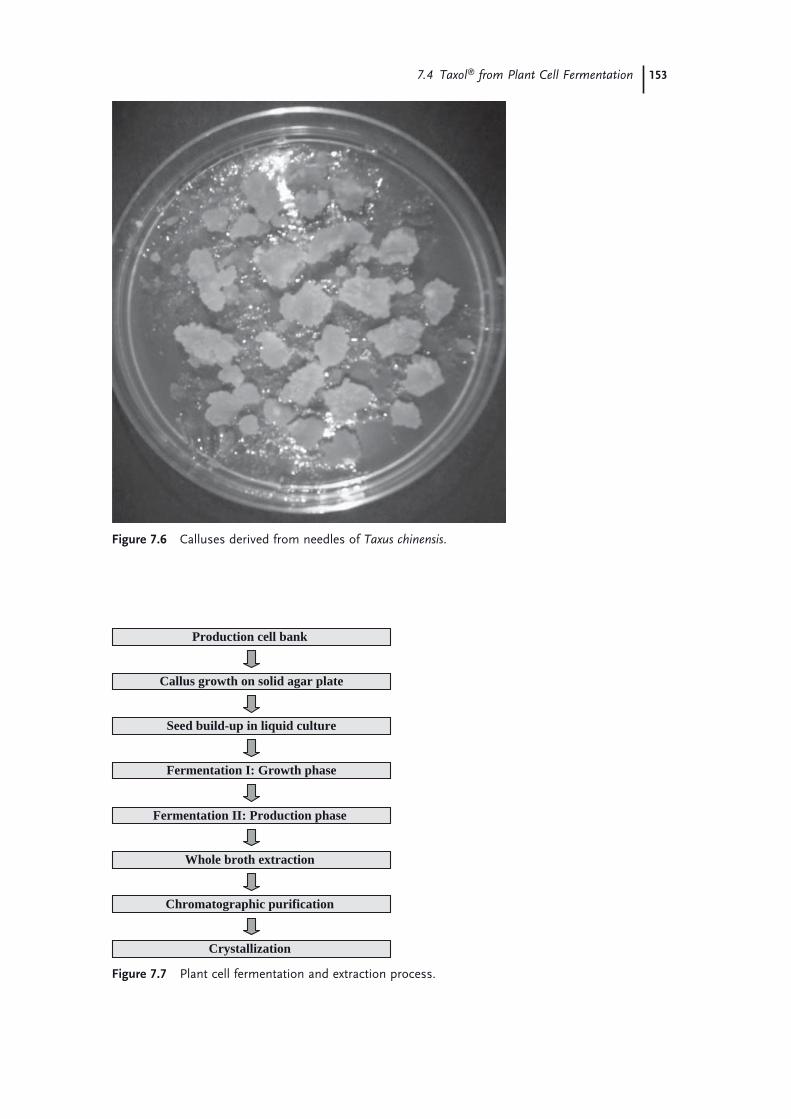
Figure 7.6 Calluses derived from needles of Taxus chinensis .
Production cell bank
Seed build-up in liquid culture
Fermentation I: Growth phase
Fermentation II: Production phase
Callus growth on solid agar plate
Whole broth extraction
Chromatographic purification
Crystallization
Figure 7.7 Plant cell fermentation and extraction process.
7.4 Taxol® from Plant Cell Fermentation 153

154 7 The Taxol® Story – Development of a Green Synthesis via Plant Cell Fermentation
Based on successful development and implementation on a commercial scale, BMS made the decision in 2002 to discontinue the semi - synthetic Taxol ® route and focus solely on the PCF route. The factors infl uencing this decision were primarily related to the Environmental, Health and Safety ( EHS ) challenges, although there was also signifi cant fi nancial incentive for BMS to pursue the alternative technology.
7.5 Comparison of Semi - Synthetic versus PCF T axol ® Processes: The Environmental Impact
7.5.1 Semi - Synthetic Process
The semi - synthetic process can be broken down into three sections to highlight the EHS consequences:
7.5.1.1 Taxus Baccata Plantations Large plantations of Taxus baccata had to be established to grow the bushes from which leaves and twigs were harvested on an annual basis. This process utilizes signifi cant amounts of land and essentially comprises a monocrop. Furthermore, the harvesting process consumes energy and produces emissions.
7.5.1.2 Biomass Waste from Isolating 10 - DAB The advanced intermediate, 10 - DAB, is isolated from the yew cuttings. Comparing the amount of paclitaxel manufactured over a fi ve year period against the PCF process, the semi - synthetic process would generate nearly 1200 tonnes of biomass waste (note: ∼ 0.1% 10 - DAB in needles typically).
7.5.1.3 Chemical Synthesis Paclitaxel is prepared in a convergent synthesis starting from 10 - DAB and hyd-robenzamide and entails 11 chemical transformations and 7 isolations. Issues arising from this process include:
• Use of 13 different organic solvents, plus water, which are not amenable to recovery for recycling due to cross - contamination during solvent exchanges, separations, and use of solvent mixtures during crystallizations and isolations (washing). Owing to potential contamination with cytotoxic Taxol ® residues, all waste solvent from the process requires incineration.
• Six of the 11 synthetic steps are extremely sensitive to water, requiring stringent, utility - intensive precautions to prevent moisture ingress during processing.
• Two of the process steps require cryogenic temperatures ( < − 70 ° C), necessitating specialized equipment and energy - intensive cooling. Furthermore, three other steps require cooling to − 30 to 0 ° C.

7.5 Comparison of Semi-Synthetic versus PCF Taxol® Processes: The Environmental Impact 155
• Corrosive chemicals are used in a number of steps.
• There are seven drying steps in the process. This is energy intensive and requires solids to be handled (charging and discharging the dryer), the exposure potential for operators increasing with each solids handling operation.
7.5.2 Plant Cell Fermentation Process
The PCF technology route can be broken down into three sections to summarize EHS impact:
7.5.2.1 Plant Cell Fermentation In the cell fermentation stage of the process, calluses are propagated in a wholly aqueous medium in large fermenters under controlled conditions at ambient temperature and pressure. The feedstock for cell growth consists of renewable nutrients, sugars, amino acids, vitamins, and trace elements.
Advantages of PCF over biomass harvesting include:
• Paclitaxel can be ‘ harvested ’ all year round – not seasonally as with the Taxus baccata plantations.
• Since the process is controlled, the yield is consistent and not susceptible to the vagaries of weather, pests, and disease.
• There is no delay while waiting for the biomass to mature. • There is no solid biomass waste (approximately 240 tonnes of biomass waste
from 10 - DAB production annually).
7.5.2.2 Crude Paclitaxel Isolation The crude paclitaxel is recovered from the rich aqueous fermentation broth by liquid/liquid extraction with a mixture of isobutyl acetate ( IBA ) and isopropanol ( IPA ), both class 3 solvents. The waste aqueous phase is stripped to remove residual organic solvents (IBA/IPA), treated with sodium hydroxide to deactivate any paclitaxel residues, and processed through a standard wastewater treatment facility. The amount of solid waste biomass generated in the process is negligible.
7.5.2.3 Chromatographic Purifi cation of Crude Paclitaxel The crude paclitaxel is dissolved in dichloromethane, fi ltered, and solvent - exchanged into a mixture of dimethylformamide ( DMF ) and formamide. This solution is loaded onto a chromatography column and eluted with acetonitrile/water as the mobile phase. The acceptably pure fractions are combined and con-centrated to remove acetonitrile, and the paclitaxel is extracted into dichlorometh-ane. Finally, the dichloromethane is replaced with IPA (distillative exchange) and paclitaxel API is isolated by crystallization.
Key features of the PCF process are listed below.

156 7 The Taxol® Story – Development of a Green Synthesis via Plant Cell Fermentation
• No solid waste is generated in the process. • No chemical transformations are performed; hence no reagents are required. • There is only one drying step, with associated reduction in operator exposure
potential and energy requirements. • Only fi ve organic solvents plus water are used.
7.6 Comparison of Semi - Synthetic versus PCF T axol ® : Green Chemistry Principles
A comparison of the semi - synthetic process with the PCF process can be made, applying the twelve Green Chemistry Principles as outlined by Anastas and Warner [17] .
7.6.1 Reagent Use
The amounts of materials eliminated by switching to the PCF technology, based on a 5 - year production period, are detailed in Table 7.1 .
From a life cycle perspective, consideration should also be given to the removal of environmental stresses caused by the manufacture of these materials and the waste treatment ensuing from their use in the semi - synthetic route to paclitaxel.
7.6.2 Solvent Use
Solvent use, based on a 5 - year production period, is summarized in Table 7.2 .
Table 7.1 Elimination of processing materials with PCF route.
Material Quantity a) Material Quantity a)
Hydrobenzamide 3.15 t 2 - Methoxypropene 0.74 t Diisopropylethylamine 2 t Dimethylaminopyridine 32 kg Acetoxyacetyl chloride 1.58 t Benzoyl chloride 0.53 t Sodium hydroxide 3.7 t Ammonium hydroxide 1.89 t Hydrochloric acid 315 L Imidazole 0.42 t Pen - V amidase enzyme 1.58 t Triethylsilylchloride 0.53 t Potassium phosphate 1.05 t Lithium
hexamethyldisilazide 3.15 t
Sodium phosphate 2.94 t Acetic anhydride 0.21 t Sodium bicarbonate 0.11 t Sodium chloride 5.78 t Diatomaceous earth 0.11 t Butylated hydroxytoluene 42 kg Activated carbon 0.11 t Trifl uoroacetic acid 0.84 t Pyridinium - p - toluenesulfonate 42 kg Sodium acetate 1.26 t
a) t = tonnes, kg = kilograms, L = liters.

While the overall solvent usage in the PCF process is higher, the bulk of the organic solvent is acetonitrile (used for chromatography), which can be recovered for re - use in the chromatography step. The main solvent waste components of the PCF route are DMF and formamide. These should be compared against the plethora of organic solvents used in the semi - synthetic process. Furthermore, the greater bioburden in aqueous wastes, which contain all the inorganic materials and amines listed above from the semi - synthetic route, should also be considered.
From Table 7.2 it can be seen that 10 solvents have been removed from Taxol ® processing by switching to the PCF route. In particular, the use of tetrahydrofuran, which can form explosive peroxides, has been totally eliminated.
7.6.3 Energy and Handling Implications
Other benefi ts when changing from the semi - synthetic process to PCF technology include:
• Two cryogenic cooling steps and three low - temperature processing steps have been eliminated, with consequent energy savings.
• Two protection and deprotection sequences have been eliminated, with associated reduction in processing (energy, materials, solvents, waste – covered previously).
• Six drying steps have been eliminated, with consequent energy savings and reduction in employee exposure through reduced solids - handling operations.
Table 7.2 Reduction and elimination of process solvents with PCF route.
Solvent Semi - synthetic route (L) PCF route (L)
Toluene 52 500 0 Isobutyl acetate 25 200 0 Heptanes 73 500 0 Acetone 210 000 0 Methanol 27 300 0 Tetrahydrofuran 96 600 0 Methyl t - butyl ether 29 400 0 Ethanol 38 850 0 Ethyl acetate 22 050 0 Glacial acetic acid 21 000 0 Dichloromethane 210 000 328 650 Dimethylformamide 30 450 5 775 Formamide 0 12 075 Acetonitrile 14 700 1 071 000 Isopropanol 53 550 31 500 Total organic solvents 905 100 1 449 000 Water 432 600 1 031 100
7.6 Comparison of Semi-Synthetic versus PCF Taxol®: Green Chemistry Principles 157
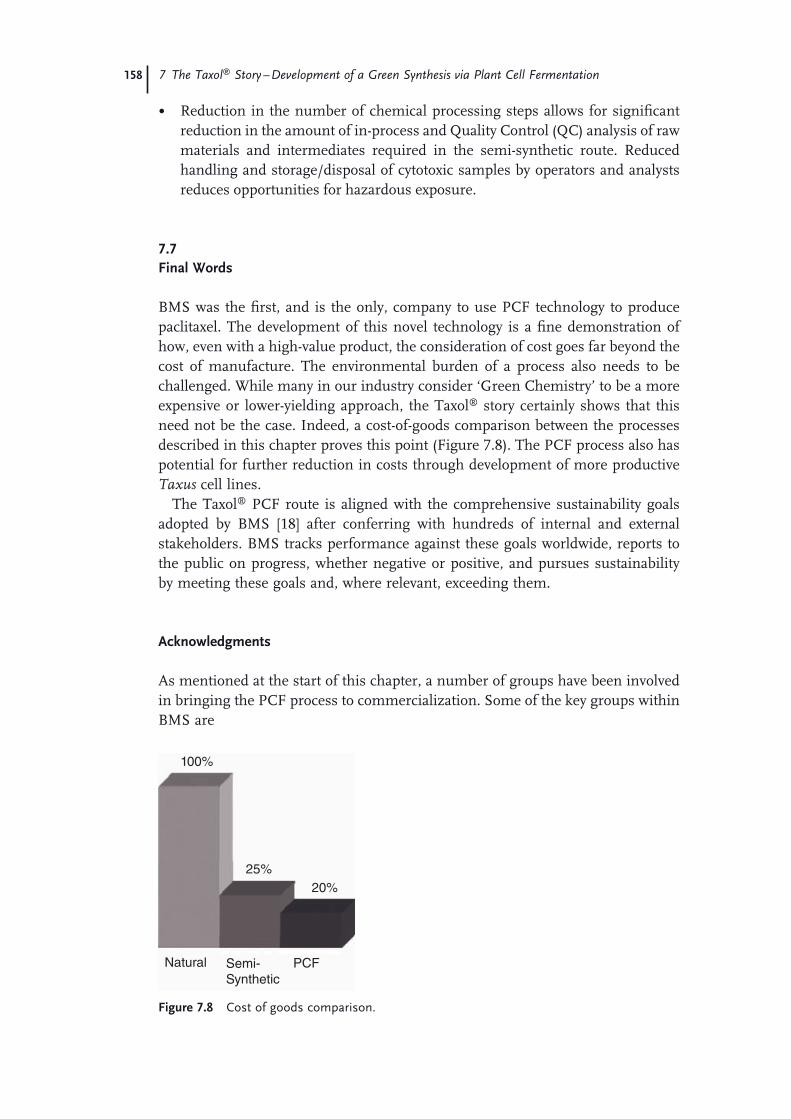
158 7 The Taxol® Story – Development of a Green Synthesis via Plant Cell Fermentation
• Reduction in the number of chemical processing steps allows for signifi cant reduction in the amount of in - process and Quality Control ( QC ) analysis of raw materials and intermediates required in the semi - synthetic route. Reduced handling and storage/disposal of cytotoxic samples by operators and analysts reduces opportunities for hazardous exposure.
7.7 Final Words
BMS was the fi rst, and is the only, company to use PCF technology to produce paclitaxel. The development of this novel technology is a fi ne demonstration of how, even with a high - value product, the consideration of cost goes far beyond the cost of manufacture. The environmental burden of a process also needs to be challenged. While many in our industry consider ‘ Green Chemistry ’ to be a more expensive or lower - yielding approach, the Taxol ® story certainly shows that this need not be the case. Indeed, a cost - of - goods comparison between the processes described in this chapter proves this point (Figure 7.8 ). The PCF process also has potential for further reduction in costs through development of more productive Taxus cell lines.
The Taxol ® PCF route is aligned with the comprehensive sustainability goals adopted by BMS [18] after conferring with hundreds of internal and external stakeholders. BMS tracks performance against these goals worldwide, reports to the public on progress, whether negative or positive, and pursues sustainability by meeting these goals and, where relevant, exceeding them.
Acknowledgments
As mentioned at the start of this chapter, a number of groups have been involved in bringing the PCF process to commercialization. Some of the key groups within BMS are
100%
25%20%
Natural Semi-Synthetic
PCF
Figure 7.8 Cost of goods comparison.

References 159
• Technical Operations • Process R & D, Pharmaceutical Research Institute • Environmental Health and Safety • Quality Assurance and Compliance • Business Development • Legal Affairs • Global Regulatory Sciences.
External partners to BMS who have been key to the success of this product are
• Phyton Biotech GmbH • Indena SpA • National Cancer Institute • Florida State University.
References
1 Ritter , S.K. ( 2004 ) Chem. Eng. News , 82 ( 27 ), 4 . Also ‘ Development of a Green Synthesis for Taxol Manufacture via Plant Cell Fermentation and Extraction ’ submitted for 2004 EPA Greener Synthetic Chemistry award, http://www.epa.gov/greenchemistry/pubs/pgcc/winners/gspa04.html (accessed May 2009).
2 Mountford , P.G. ( 2006 ) Development of a Green Synthesis for Taxol ® Manufac-ture via Plant Cell Fermentation and Extraction. Hosted by Colegio de Quimicos de Puerto Rico, Westin RioMar, PR, Aug. 15 – 18.
3 Wall , M.E. , and Wani , M.C. ( 1995 ) Cancer Res. , 55 , 753 – 760 . Also, 13th Bruce F. Cain Memorial Award Lecture, presented at 85th annual meeting of the American Association for Cancer Research, April 13 1994, San Francisco.
4 Wani , M.C. , Taylor , H.L. , Wall , M.E. , Coggon , P. , and McPhail , A.T. ( 1971 ) J. Am. Chem. Soc. , 93 , 2325 – 2327 .
5 For example, Kumar , N. ( 1981 ) J. Biol. Chem. , 256 ( 20 ), 10435 – 10441 .
6 For example, N ü rnberger , T. ( 1999 ) Cell Mol. Life Sci. , 55 , 167 – 182 .
7 Busing , R.T. , and Spies , T.A. ( 1995 ) Modeling the Population Dynamics of Pacifi c Yew , US Dept. of Agriculture , Forest Service Research note PNW - RN - 55, March 1995.
8 Mc Guire , W.P. , Rowinsky , E.K. , Rosenheim , N.B. , Grumbine , F.C. , Ettinger , D.S. , Armstrong , D.K. , and Donehower , R.C. ( 1989 ) Ann. Intern. Med. , 3 , 273 .
9 Kaufman , D.G. , and Franz , C.M. ( 2000 ) Biosphere 2000: Protecting Our Global Environment , 3rd edn , Kendall/Hunt , pp. 537 – 538 .
10 Goodman , J. , and Walsh , V. ( 2001 ) The Story of Taxol: Nature and Politics in the Pursuit of an Anti - Cancer Drug , Cambridge University Press , Cambridge , p. 120 .
11 For example, Nicolaou , K.C. , Yang , Z. , Liu , J.J. , Ueno , H. , Nantermet , P.G. , Guy , R.K. , Claiborne , C.F. , Renaud , J. , Couladouros , E.A. , Paulvannan , K. , and Sorensen , E.J. ( 1994 ) Nature , 367 , 630 – 634 .
12 Holton , R.A. , Somoza , C. , Kim , H. - B. , Liang , F. , Biediger , R.J. , Boatman , P.D. , Shindo , M. , Smith , C.C. , Kim , S. , Nadizadeh , H. , Suzuki , Y. , Tao , C. , Vu , P. , Tang , S. , Zhang , P. , Murthi , K.K. , Gentile , L.N. , and Liu , J.H. ( 1994 ) J. Am. Chem. Soc. , 116 , 1597 – 1598 and 1599 – 1600 .
13 US Patent 5,136,060 – issued August 4, 1992.
14 Denis , J.N. , Greene , A.E. , Gu é nard , D. , Gu é ritte - Voegelein , F. , Mangatal , L. , and Potier , P. ( 1988 ) J. Am. Chem. Soc. , 110 , 5917 – 5919 .

160 7 The Taxol® Story – Development of a Green Synthesis via Plant Cell Fermentation
15 Tabata , H. ( 2004 ) Adv. Biochem. Eng. Biotechnol. , 87 , 1 – 23 .
16 Venkat , K. ( 1999 ) Paclitaxel production through plant cell culture: an exciting approach to harnessing biodiversity . IUPAC Symposium Proceedings .
17 Anastas , P. , and Warner , J.C. ( 1998 ) Green Chemistry: Theory and Practice , Oxford University Press , Oxford , p. 30 .
18 BMS website. http://www.bms.com/sustainability/pages/home.aspx (last accessed December 2009).
161
8 The Development of a Green, Energy Effi cient, Chemoenzymatic Manufacturing Process for Pregabalin Peter J. Dunn , Kevin Hettenbach , Patrick Kelleher , and Carlos A. Martinez
8.1 Introduction
Pregabalin ( 1 ) is a lipophilic γ - aminobutyric acid ( GABA ) analog that was devel-oped for the treatment of several nervous system disorders including epilepsy, neuropathic pain, anxiety, and social phobia [1, 2] . The drug was launched as Lyrica ® in the United States in September, 2005. The initial launch was for the treatment of neuropathic pain associated with peripheral neuropathy and post herpetic neuralgia, but it is hoped that the drug can also be made available for other patients suffering from other forms of neuropathic pain. Pregabalin achieved rapid success, achieving global sales in 2006, 2007 and 2008 of $1.16 billion, $1.8 billion and $2.57 billion, respectively. The compound was originally reported by Silverman and Andruszkiewicz as a racemate [3, 4] . The Silverman group also reported a variety of racemic 3 - alkyl GABA analogs and showed that pregabalin was by far the most active in vivo anticonvulsant in this class [5] . Subsequently the drug was prepared in enantio - pure form using the chiral alkylation of compound 3 to set the stereochemistry followed by removal of the chiral auxiliary and several function group interconversions to give pregabalin ( 1 ) (Scheme 8.1 ) [6] . This work provided both enantiomers for the fi rst time, demonstrating that the ( S ) - enanti-omer was signifi cantly more potent than the ( R ) - enantiomer, and also that prega-balin ( 1 ) had signifi cantly higher activity and longer duration of action than gabapentin ( 2 ), a drug which had been introduced into the market in 1994 by Parke - Davis.
8.2 Process Routes to Pregabalin
The Chemical Development team assumed that pregabalin, like gabapentin, would be a compound with low toxicity and that large quantities of material would be required for drug safety evaluation. The initial medicinal chemistry synthesis shown in Scheme 8.1 had several issues for scale - up namely:
Green Chemistry in the Pharmaceutical Industry. Edited by Peter J. Dunn, Andrew S. Wells and Michael T. Williams© 2010 WILEY-VCH Verlag GmbH & Co. KGaA, WeinheimISBN: 978-3-527-32418-7
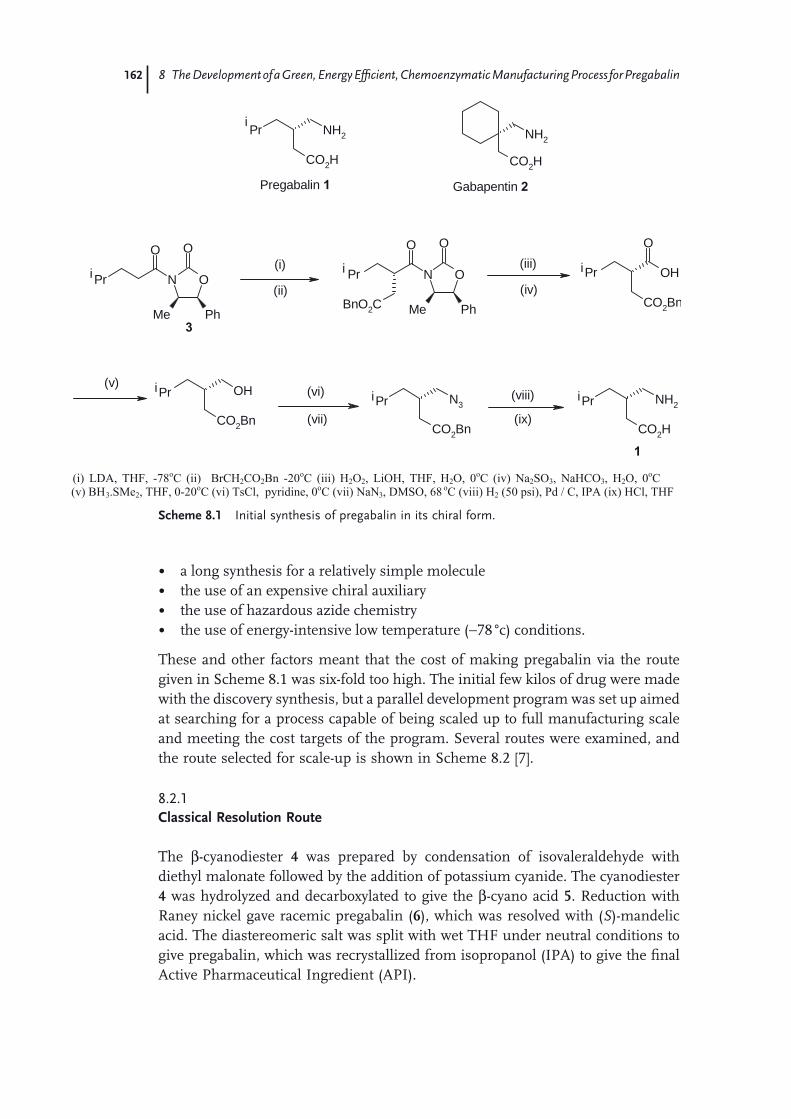
162 8 The Development of a Green, Energy Effi cient, Chemoenzymatic Manufacturing Process for Pregabalin
• a long synthesis for a relatively simple molecule • the use of an expensive chiral auxiliary • the use of hazardous azide chemistry • the use of energy - intensive low temperature ( − 78 ° c) conditions.
These and other factors meant that the cost of making pregabalin via the route given in Scheme 8.1 was six - fold too high. The initial few kilos of drug were made with the discovery synthesis, but a parallel development program was set up aimed at searching for a process capable of being scaled up to full manufacturing scale and meeting the cost targets of the program. Several routes were examined, and the route selected for scale - up is shown in Scheme 8.2 [7] .
8.2.1 Classical Resolution Route
The β - cyanodiester 4 was prepared by condensation of isovaleraldehyde with diethyl malonate followed by the addition of potassium cyanide. The cyanodiester 4 was hydrolyzed and decarboxylated to give the β - cyano acid 5 . Reduction with Raney nickel gave racemic pregabalin ( 6 ), which was resolved with ( S ) - mandelic acid. The diastereomeric salt was split with wet THF under neutral conditions to give pregabalin, which was recrystallized from isopropanol ( IPA ) to give the fi nal Active Pharmaceutical Ingredient ( API ).
ON
O
Me Ph
O
Pr ON
O
Me Ph
O
BnO2C
Pr OH
O
CO2Bn
Pr
CO2Bn
OH
CO2Bn
N3 NH2
CO2H
CO2H
NH2Pr
CO2H
NH2
i i(i)
(ii)
(iii)
(iv)
i
PriPri Pri
(v)(vi)
(vii)
(viii)
(ix)
3
1
i
Gabapentin 2Pregabalin 1
(i) LDA, THF, -78oC (ii) BrCH2CO2Bn -20oC (iii) H2O2, LiOH, THF, H2O, 0oC (iv) Na2SO3, NaHCO3, H2O, 0oC(v) BH3.SMe2, THF, 0-20oC (vi) TsCl, pyridine, 0oC (vii) NaN3, DMSO, 68 oC (viii) H2 (50 psi), Pd / C, IPA (ix) HCl, THF
Scheme 8.1 Initial synthesis of pregabalin in its chiral form.

8.2 Process Routes to Pregabalin 163
A comparative cost analysis showed that the classical resolution route (Scheme 8.2 ) was 12 times cheaper than the discovery route (Scheme 8.1 ). The classical resolution route was successfully scaled up and used to launch the product and provide the fi rst year ’ s market supply. However, using a fi nal - stage resolution meant that by defi nition half of the synthetic materials were thrown away. When an E factor analysis [8] was performed on the pregabalin synthesis it was found that 86 kg of waste was being produced for every kilogram of the desired product, and this inspired a search for more effi cient chemistries.
8.2.2 Asymmetric Hydrogenation Route to Pregabalin
The next route to be developed and scaled up was an asymmetric hydrogenation route shown in Scheme 8.3 [9] . The synthesis started with a 100% atom effi cient Baylis - Hillman reaction to give the alcohol 7 . The alcohol was converted to the ethyl carbonate 8 and subjected to a palladium - catalyzed carbonylation reaction to give the ester 9 , which was hydrolyzed and converted to the t - butylamine salt 10 , a key substrate for asymmetric hydrogenation. 1) The initial asymmetric hydrogena-tion conditions were developed by a collaborative effort between Dowpharma and Pfi zer which identifi ed [( R,R ) - (Me - DuPHOS)Rh(COD)]BF 4 ( 11 ) as an excellent catalyst for the asymmetric hydrogenation, giving an ee of 97.7% with a substrate - to - catalyst ratio of 2700 to 1. However, when a cost analysis of this chemistry was undertaken it was found to be slightly more expensive than the classical resolution route, largely because of the high price of the Me - DuPHOS ligand . Hence, Pfi zer developed its own proprietary ligand [10] . The rhodium catalyst 12 , formed from this ligand also gave excellent ee and enabled a ten - fold increase in substrate - to - catalyst ratios as shown in Table 8.1 . When the Pfi zer ligand was used, the eco-nomics were now favorable compared with the classical resolution route, and,
CO2EtEtO2C
CNPr CN
CO2H
Pr
CO2H
NH2Pr OH
PhHO2C
CO2H
Pr NH2
CO2H
Pr NH2
i
i
i
4 5
(i) i
6
(ii)
i
1
(iii) (iv)
(i) KOH, MeOH, H2O reflux (ii) H2, RaNi, EtOH, H2O; then HOAc; then IPA wash (iii) (S)-Mandelic acid, IPA, H2O; thenrecrystallize from IPA, H2O (iv) THF, H2O; then recrystallize from IPA, H2O
Scheme 8.2 The classical resolution route to pregabalin.
1) For a discussion on why the t - butylamine salt was selected as the starting material for the asymmetric step see reference [9] .
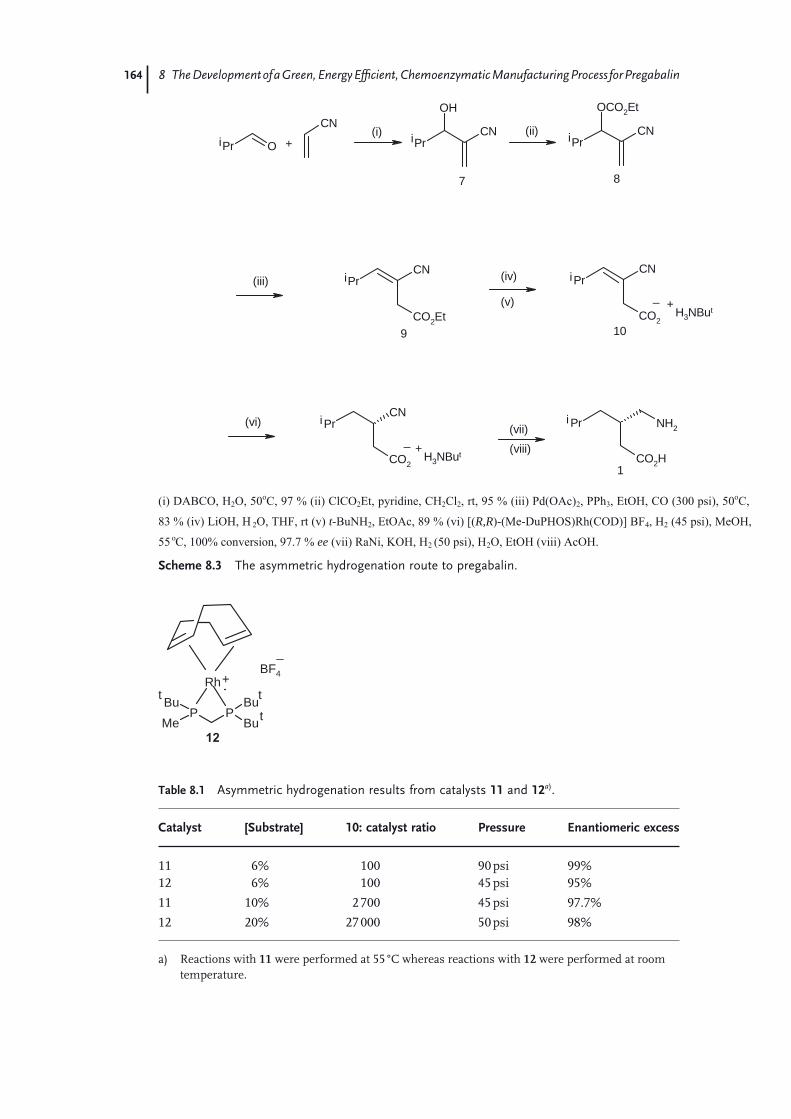
164 8 The Development of a Green, Energy Effi cient, Chemoenzymatic Manufacturing Process for Pregabalin
P PBuBuBu
Me
Rht
t
t
12
+BF4
_
OPr
CO2H
Pr NH2
CO2
PrCN
CO2
PrCN
PrCN
CO2Et
PrCN
OCO2Et
PrCN
OHCN
i
1
i
i
10H3NBut+_
(vi)
H3NBut+_(vii)(viii)
(iv)
(v)
i
9
(iii)
i
8
i
7
(ii)+
(i)i
(i) DABCO, H2O, 50oC, 97 % (ii) ClCO2Et, pyridine, CH2Cl2, rt, 95 % (iii) Pd(OAc)2, PPh3, EtOH, CO (300 psi), 50oC,
83 % (iv) LiOH, H 2O, THF, rt (v) t-BuNH2, EtOAc, 89 % (vi) [(R,R)-(Me-DuPHOS)Rh(COD)] BF4, H2 (45 psi), MeOH,o55 C, 100% conversion, 97.7 % ee (vii) RaNi, KOH, H2 (50 psi), H2O, EtOH (viii) AcOH.
Scheme 8.3 The asymmetric hydrogenation route to pregabalin.
Table 8.1 Asymmetric hydrogenation results from catalysts 11 and 12 a) .
Catalyst [Substrate] 10: catalyst ratio Pressure Enantiomeric excess
11 6% 100 90 psi 99% 12 6% 100 45 psi 95%
11 10% 2 700 45 psi 97.7%
12 20% 27 000 50 psi 98%
a) Reactions with 11 were performed at 55 ° C whereas reactions with 12 were performed at room temperature.

8.3 Biocatalytic Route to Pregabalin 165
importantly, the amount of waste produced by the process was approximately half that from the classical resolution route. However, the development of the asym-metric hydrogenation route was terminated when it became clear that the bio-catalysis route was superior in terms of environmental and cost performance.
8.2.3 Non - Pfi zer/Parke - Davis Routes to Pregabalin
McQuade et al. [11] have published a nice synthesis using a microencapsulated nickel - based catalyst for promoting a Henry reaction based upon the work of Evans [12] . Torrens et al. have published a somewhat longer synthesis from D - mannitol bisacetonide [13] .
8.3 Biocatalytic Route to Pregabalin
As the fi rst - generation route was cost - effective, a search was initiated for alterna-tive routes that could combine the low cost of a racemic precursor and the power of an early resolution method. The routes investigated thus far had not included a signifi cant investigation of biocatalytic methods. Given the outstanding potential of biocatalysis to deliver green, sustainable, and cost effective processes, this needed to be addressed. The use of enzymes for the synthesis of chiral compounds has been extensively reviewed, and their application at a large scale has also been reported [14] . Hydrolases are the biocatalysts most commonly used to perform enantioselective hydrolyses of carboxylic acid derivatives such as esters, nitriles, and amides to the corresponding carboxylic acid because of their broad substrate specifi city.
Several carboxylic acid derivatives that might be accessible using biocatalysis were used as precursors for the synthesis of pregabalin and could potentially be prepared using biocatalysis (Scheme 8.4 ). Among these, 2 - carboxyethyl - 3 - cyano - 5 - methylhexanoic acid ( 13 ) and 3 - cyano - 5 - methylhexanoic acid ( 5 ) appeared as the
CO2Et
CNPr
HO2C
CN
CO2H
Pr
CO2H
Pr NH2
Pr CO2iPr
CO2H
CO2Et
Pr
HO2C
NO2Pr NO2
CO2H
CO2EtEtO2C
CNPr
ii
5
i
1
i
i i
13 14
1516
i
4
Scheme 8.4 Potential carboxylic acid precursors to pregabalin.

166 8 The Development of a Green, Energy Effi cient, Chemoenzymatic Manufacturing Process for Pregabalin
most attractive precursors because they could be converted to pregabalin using methods developed in the fi rst - generation route. Precursors 15 and 16 were con-sidered but not investigated in detail because of the safety hazards associated with the use of nitromethane. The precursor 14 was reported by Hoekstra and collabora-tors and was converted to pregabalin using a Hofmann rearrangement [7] . The advantage of the latter was the potential to run a desymmetrization reaction on the corresponding meso diester precursor, with 100% maximum yield possible. The hydrolysis of a racemic isobutylsuccinonitrile to generate 5 was studied in detail and published elsewhere [15] .
The route development discussed herein utilized the racemic precursor cyano-diester 4 to generate via an enzymatic ester hydrolysis an enantiopure precursor ( 13 ). Conceptually, the generation of compound 13 from 4 involves the hydrolysis of one diastereotopic carboxyethyl group and a desymmetrization of the prochiral C - 2 center. The desired outcome was to fi nd an enzyme that could only perform such a reaction on a single enantiomer of racemic 4 (kinetic resolution), thus generating one (or two) diastereomers from a single enantiomer at the C - 3 chiral center, leaving behind the R enantiomer of 4 . Thus, the diastereoselectivity in the desymmetrization reaction per se was not as important as the enantioselectivity of the kinetic resolution, as the chirality at the C - 2 center will be lost while converting 13 to pregabalin.
8.3.1 Enzyme Screening, Optimization, and Recycling of Undesired Enantiomer
A screening of commercially available hydrolases was carried out in 96 - well format using a methodology that was previously reported in the literature by Pfi zer [16] . Initial screening at a substrate loading of 5% (v/v) revealed many enzymes that catalyzed the hydrolysis of 4 . Chiral GC analysis of the extracted crude sample mixture permitted the calculation of enantiomeric ratios (E values) [17] . The E value can be interpreted as the number of times the enzyme is more reactive towards one enantiomer relative to the other (in reality it represent the ratio of specifi city constants k cat /K m for each enantiomer). A signifi cant portion of the screened enzymes (7%) demonstrated reasonable enantioselectivity (E > 35) for the selective hydrolysis of (S) - 4 (Figure 8.1 ). The lipase from Thermomyces lanugi-nosus ( TlL ), commercially available as Lipolase, was the best in terms of enanti-oselectivity and activity. Rhizopus delemar and Rhizopus niveus lipases were also highly enantioselective, but both showed lower activity relative to Lipolase, based on reaction rates with equivalent amounts of enzyme. The less selective Pseu-domonas sp . and Mucor miehei lipases, and Mucor miehei esterase were not evalu-ated further.
Lipolase was selected for process development based on its high enantioselectiv-ity and activity for the hydrolysis of 4 . The enzyme was also highly diastereoselec-tive ( > 99.5% de ). The commercial availability of Lipolase and its low cost provided further advantages for its potential use in a manufacturing process. The protein has a molecular weight of ∼ 30 kDa (291 amino acids) and belongs to the α / β

8.3 Biocatalytic Route to Pregabalin 167
hydrolase fold family of enzymes, which are subject to interfacial activation [18] . Lipolase displayed good tolerance to high concentrations of 4 (up to 255 g/L) when the reaction was performed at room temperature and neutral pH (maintaining neutral pH using an autotitrator). Higher substrate concentration yielded incom-plete reactions (35 – 40% conversion), indicating that further optimization was required to increase the throughput of this step. A closer look to the pH and tem-perature effects revealed that conditions that increase reaction rate often tend to inactivate the enzyme. Higher temperature and pH did display higher initial rates, but they also deactivated the enzyme faster, leading to lower observed conversions after overnight reactions.
In order to further examine potential sources for the enzyme inactivation at higher substrate concentrations, the mode of addition of 4 was examined. The study revealed that batch additions of 4 gave conversions almost equal to those obtained with a single addition (Figure 8.2 a), clearly indicating that there was no sign of strong substrate inhibition. To test for product inhibition, addition of the sodium salt of acid 13 to the reaction mixture at t 0 was examined. The study revealed that at 0.1 M concentration the product 13 had a signifi cant inhibitory effect on the rate of the reaction (Figure 8.2 b). It then became clear that the main barrier that needed to be overcome in order to increase the throughput of this step was product inhibition.
A review of the literature, examining potential approaches to avoiding product inhibition, suggested the addition of agents that could form a complex or salt with carboxylic acid 13 , thus minimizing its ability to deactivate the enzyme [19] . Ion exchange resins were evaluated, but these did not suppress the inhibition to any extent. The use of bases other than sodium hydroxide that could supply a different
E values for S selective enzyme hits
0
50
100
150
200
TlL RdL RnL MmE PsL MmL RoL CaLA CaLB PLE EP PKA CE
Enzyme
E v
alu
e
a) TlL: Thermomyces lanuginosus lipase, RdL: Rhizopus delemar lipase, RnL: Rhizopus niveus lipase, MmE: Mucor miehei esterase, PsL: Pseudomonas sp. lipase, MmL: Mucor miehei lipase, RoL: Rhizopus oryzae lipase, CaLA: Candida antarctica lipase A, CaLB: Candida antarctica lipase B, PLE: Pig liver esterase, EP: Enteropeptidase, PKA: Porcine kidney acylase, CE: Cholesterol esterase Figure 8.1 ( S ) - Selective enzyme hits from hydrolase screening. a)
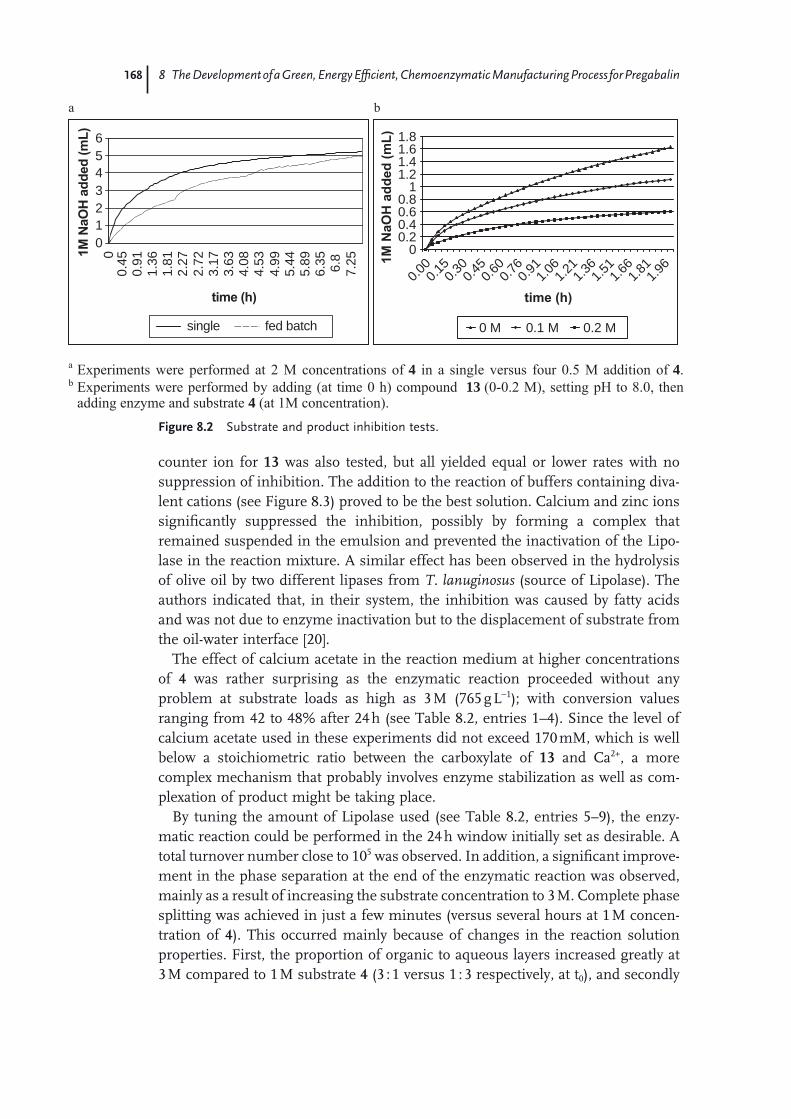
168 8 The Development of a Green, Energy Effi cient, Chemoenzymatic Manufacturing Process for Pregabalin
a b
00.20.40.60.8
11.21.41.61.8
0.000.1
50.3
00.4
50.6
00.7
60.9
11.0
61.2
11.3
61.5
11.6
61.8
11.9
6
time (h)
1M
NaO
H a
dd
ed
(m
L)
0 M 0.1 M 0.2 M
a
b
adding enzyme and substrate 4 (at 1M concentration).
Experiments were performed at 2 M concentrations of 4 in a single versus four 0.5 M addition of 4.Experiments were performed by adding (at time 0 h) compound 13 (0-0.2 M), setting pH to 8.0, then
0123456
00.
450.
911.
361.
812.
272.
723.
173.
634.
084.
534.
995.
445.
896.
35 6.8
7.25
time (h)
1M
NaO
H a
dd
ed
(m
L)
single fed batch
Figure 8.2 Substrate and product inhibition tests.
counter ion for 13 was also tested, but all yielded equal or lower rates with no suppression of inhibition. The addition to the reaction of buffers containing diva-lent cations (see Figure 8.3 ) proved to be the best solution. Calcium and zinc ions signifi cantly suppressed the inhibition, possibly by forming a complex that remained suspended in the emulsion and prevented the inactivation of the Lipo-lase in the reaction mixture. A similar effect has been observed in the hydrolysis of olive oil by two different lipases from T. lanuginosus (source of Lipolase). The authors indicated that, in their system, the inhibition was caused by fatty acids and was not due to enzyme inactivation but to the displacement of substrate from the oil - water interface [20] .
The effect of calcium acetate in the reaction medium at higher concentrations of 4 was rather surprising as the enzymatic reaction proceeded without any problem at substrate loads as high as 3 M (765 g L − 1 ); with conversion values ranging from 42 to 48% after 24 h (see Table 8.2 , entries 1 – 4). Since the level of calcium acetate used in these experiments did not exceed 170 mM, which is well below a stoichiometric ratio between the carboxylate of 13 and Ca 2+ , a more complex mechanism that probably involves enzyme stabilization as well as com-plexation of product might be taking place.
By tuning the amount of Lipolase used (see Table 8.2 , entries 5 – 9), the enzy-matic reaction could be performed in the 24 h window initially set as desirable. A total turnover number close to 10 5 was observed. In addition, a signifi cant improve-ment in the phase separation at the end of the enzymatic reaction was observed, mainly as a result of increasing the substrate concentration to 3 M. Complete phase splitting was achieved in just a few minutes (versus several hours at 1 M concen-tration of 4 ). This occurred mainly because of changes in the reaction solution properties. First, the proportion of organic to aqueous layers increased greatly at 3 M compared to 1 M substrate 4 (3 : 1 versus 1 : 3 respectively, at t 0 ), and secondly
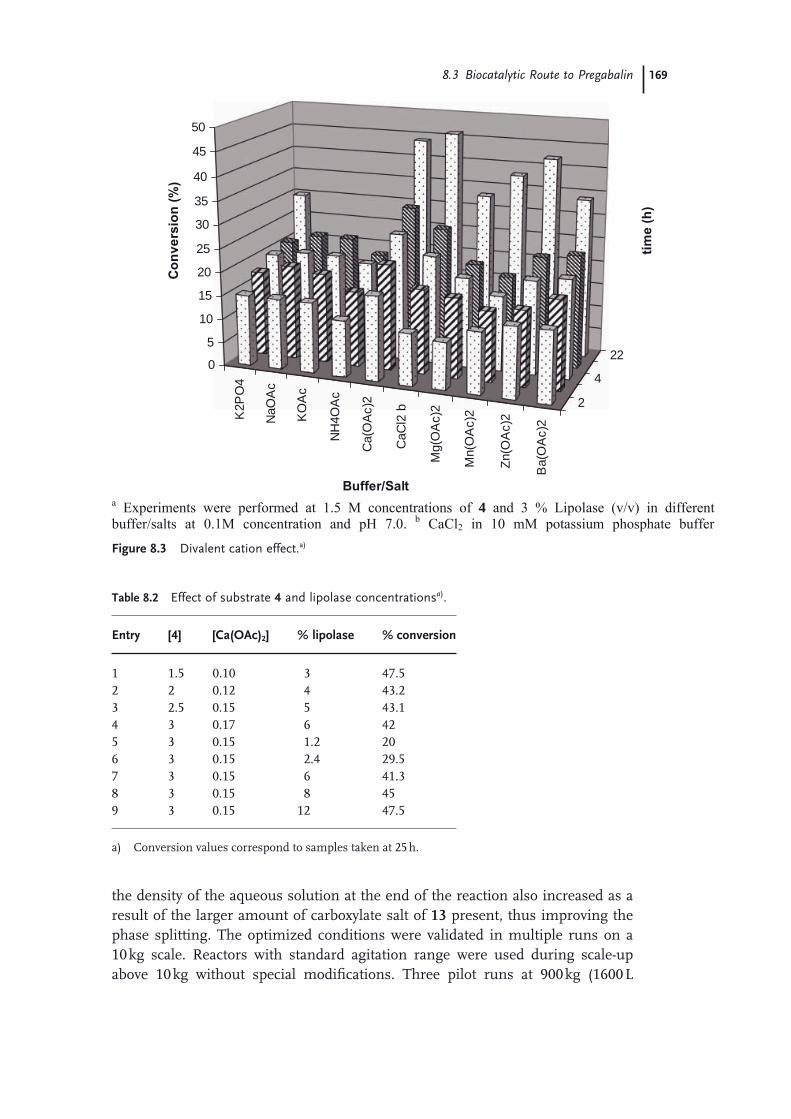
8.3 Biocatalytic Route to Pregabalin 169
the density of the aqueous solution at the end of the reaction also increased as a result of the larger amount of carboxylate salt of 13 present, thus improving the phase splitting. The optimized conditions were validated in multiple runs on a 10 kg scale. Reactors with standard agitation range were used during scale - up above 10 kg without special modifi cations. Three pilot runs at 900 kg (1600 L
K2P
O4
NaO
Ac
KO
Ac
NH
4OA
c
Ca(
OA
c)2
CaC
l2 b
Mg(
OA
c)2
Mn(
OA
c)2
Zn(O
Ac)
2
Ba(
OA
c)2
2
4
220
5
10
15
20
25
30
35
40
45
50
Co
nv
ers
ion
(%
)
Buffer/Salt
tim
e (
h)
a Experiments were performed at 1.5 M concentrations of 4 and 3 % Lipolase (v/v) in different buffer/salts at 0.1M concentration and pH 7.0. b CaCl2 in 10 mM potassium phosphate buffer
Figure 8.3 Divalent cation effect. a)
Table 8.2 Effect of substrate 4 and lipolase concentrations a) .
Entry [ 4 ] [Ca(OAc) 2 ] % lipolase % conversion
1 1.5 0.10 3 47.5 2 2 0.12 4 43.2 3 2.5 0.15 5 43.1 4 3 0.17 6 42 5 3 0.15 1.2 20 6 3 0.15 2.4 29.5 7 3 0.15 6 41.3 8 3 0.15 8 45 9 3 0.15 12 47.5
a) Conversion values correspond to samples taken at 25 h.
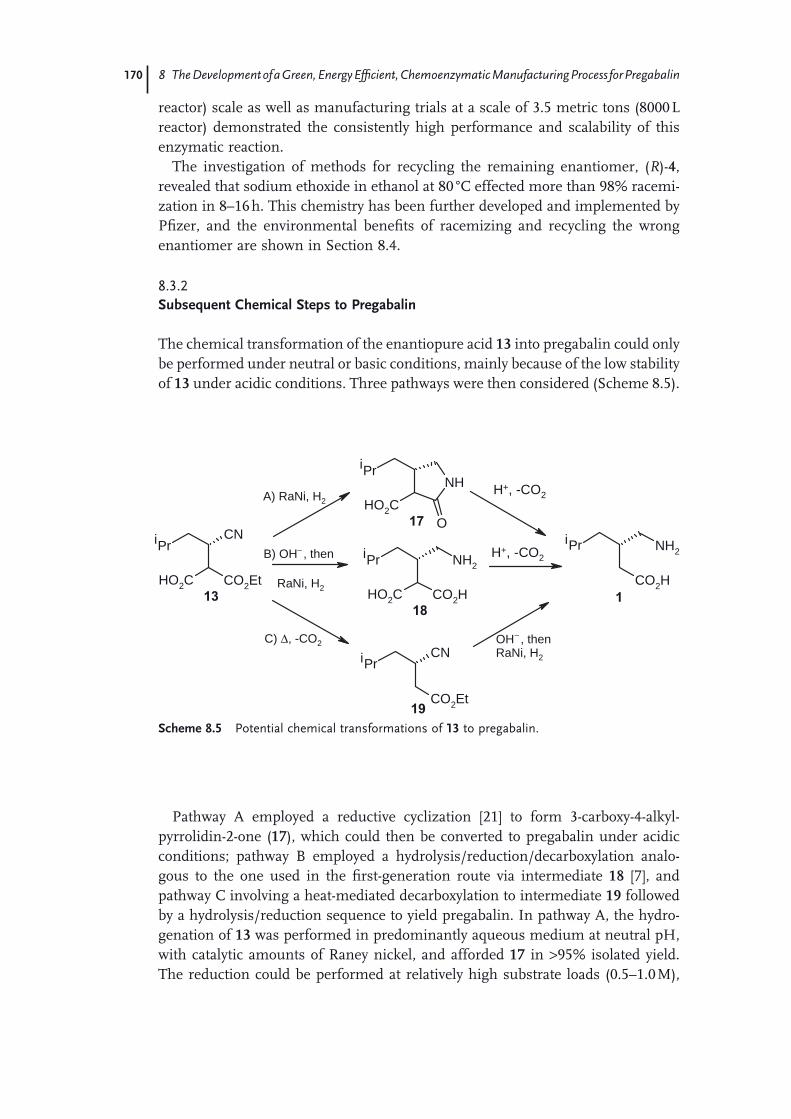
170 8 The Development of a Green, Energy Effi cient, Chemoenzymatic Manufacturing Process for Pregabalin
reactor) scale as well as manufacturing trials at a scale of 3.5 metric tons (8000 L reactor) demonstrated the consistently high performance and scalability of this enzymatic reaction.
The investigation of methods for recycling the remaining enantiomer, ( R ) - 4 , revealed that sodium ethoxide in ethanol at 80 ° C effected more than 98% racemi-zation in 8 – 16 h. This chemistry has been further developed and implemented by Pfi zer, and the environmental benefi ts of racemizing and recycling the wrong enantiomer are shown in Section 8.4 .
8.3.2 Subsequent Chemical Steps to Pregabalin
The chemical transformation of the enantiopure acid 13 into pregabalin could only be performed under neutral or basic conditions, mainly because of the low stability of 13 under acidic conditions. Three pathways were then considered (Scheme 8.5 ).
CO2Et
CNPr
HO2C
CNPr
CO2Et
CO2H
Pr NH2Pr
HO2C
NH2
CO2H
NHPr
HO2CO
i
i
19
i
113
A) RaNi, H2
B) OH–
–
, then
RaNi, H2
C) Δ, -CO2 OH , then RaNi, H2
i
18
i
17
H+, -CO2
H+, -CO2
Scheme 8.5 Potential chemical transformations of 13 to pregabalin.
Pathway A employed a reductive cyclization [21] to form 3 - carboxy - 4 - alkyl - pyrrolidin - 2 - one ( 17 ), which could then be converted to pregabalin under acidic conditions; pathway B employed a hydrolysis/reduction/decarboxylation analo-gous to the one used in the fi rst - generation route via intermediate 18 [7] , and pathway C involving a heat - mediated decarboxylation to intermediate 19 followed by a hydrolysis/reduction sequence to yield pregabalin. In pathway A, the hydro-genation of 13 was performed in predominantly aqueous medium at neutral pH, with catalytic amounts of Raney nickel, and afforded 17 in > 95% isolated yield. The reduction could be performed at relatively high substrate loads (0.5 – 1.0 M),

8.4 Green Chemistry Considerations 171
and the lactam hydrolysis/decarboxylation step associated with this path (using 2.5 equiv. of 4 M HCl and catalytic HOAc at 120 ° C) yielded 70 – 80% crude prega-balin over the two steps. The main drawbacks found with this path came about when testing the reduction reactions at substrate concentrations ranging from 1.0 to 2.5 M. Poisoning of Raney nickel, due to the presence of enzyme in the solution, gave rise to incomplete conversion. To overcome this problem, Raney nickel loads as high as 20 mol% were tested with limited success, seriously hampering the prospects of scaling up this path above one kilogram scale.
Pathway B utilized conditions from the classical resolution route [7] which used 4 as the starting material instead of 13 . Less exploratory work was done on this pathway, mainly because of the higher risk of epimerization of the C3 center under highly alkaline conditions as well as the diffi cult isolation of 18 , which implied carrying enzyme (as well as enzyme by - products) to the API isolation step. The poisoning of the Raney nickel by the enzyme found in pathway A also made this an undesirable option.
Pathway C was fi rst explored using Krapcho decarboxylation conditions on free acid 13 (135 ° C, DMSO - NaCl), yielding a mixture of compound 19 and other uncharacterized decomposition products. The reaction proceeded very slowly and resulted in incomplete conversions. To minimize the exposure of 13 to acidic conditions (required for the preparation of free acid 13 ), a decarboxylation under neutral conditions was attempted. The process consisted of simply heating the aqueous solution from the enzymatic reaction (after phase separation) to just below refl ux or at refl ux (70 – 95 ° C). Under these conditions, a rapid chemical decarboxylation of 13 into 19 took place in less than 5 h without any racemization and in the presence of enzyme in solution. This path turned out to be the best possible solution, as it generated a water - insoluble oil ( 19 ), leaving behind in the aqueous layer potential impurities including enzyme, buffer, and calcium salts, that could affect the hydrogenation step and the purity of the pregabalin at the fi nal step. Carbon dioxide evolution was not an issue during scale - up, and a stand-ard vent was used. Having developed the high - throughput enzymatic resolution and decarboxylation steps, the end game toward pregabalin was carried out with minor modifi cations of already published procedures [7] , that is KOH hydrolysis of 19 followed by hydrogenation catalyzed by Raney nickel to obtain the enantiop-ure pregabalin API (Scheme 8.6 ). The one - pot hydrolysis/reduction reaction occurred without any racemization, and faster rates as well as higher yields and purities compared to the fi rst generation process were obtained: 40 – 45% overall isolated yield for pregabalin (after recycling 4 once) with 99.5% purity and 99.75% ee [22] .
8.4 Green Chemistry Considerations
The improvements in the route can be appreciated by examining the ratio of the kg of total waste to kg of pregabalin product (E factor) [8] . The classical resolution

172 8 The Development of a Green, Energy Effi cient, Chemoenzymatic Manufacturing Process for Pregabalin
route (Scheme 8.2 ) had an E factor of 86, while the enzymatic synthesis route when fi rst introduced had an E factor of 17. When the recycling of the wrong enantiomer was introduced (Scheme 8.6 ) (along with some further improvements) there was a further improvement in the E factor to 12. This is an excellent achieve-ment, as Sheldon has published that the typical E factor for a pharmaceutical compound is between 25 and 100, and the typical E factor for a fi ne chemical is between 10 and 50 [8] .
CO2Et
CNPr
EtO2C
CNPr
CO2Et
CO2H
Pr NH2
CO2Et
CNPr
HO2C
CO2Et
CNPr
EtO2C
i
i
19
i
1
rac-4
NaOEt, Toluene 80 oC, 16 h, quant.
>98% ee, not isolated
Recycling of R-4
heat
70-95 oC -CO2
Lipolase (8%) 150 mM Ca(OAc)2
pH 7.0, room T, 24 h 45-50% conversion
>99% ee, quantitative Isolation step
1) KOH (aq), RT, 1h
2) Sponge Ni, H2 H2O/IPA, < 5 h
40-45% overall isolated yield (after recycling 4 once), 99.5% purity and 99.75% ee
i
13
i
4
Scheme 8.6 Optimized chemoenzymatic pregabalin synthesis.
8.4.1 Material Usage
The examination of the total reagent usage in the two processes (last row in Table 8.3 ) clearly shows that the new enzymatic route (with recycling of 4 ) utilizes 7 times less input of chemicals. This includes 12 times less input of solvents as compared to the fi rst - generation route. Moreover, in the optimized process, every chemical reaction is run in water with minimal solvents used for work - up. Some of the process water can be sent directly to the wastewater treatment plant, and the solvent from the hydrolysis/decarboxylation process is recovered. Further improvements from pilot plant and production scale runs have been demonstrated and will be implemented in the future.
The overall conversion of 4 to API was thus progressively improved from 25.8% for the classical route to 33.4% for the enzymatic route (no recycling) and 42% for the enzymatic route with recycling. Pregabalin is a large - volume product for Pfi zer. Based upon projected sales and the fi gures in Table 8.3 (fi nal column), it is expected that between 2007 and 2020 the environmental savings (versus those in the classical - resolution column) will be:

8.4 Green Chemistry Considerations 173
• 185 000 tonnes of solvent, an 92% reduction • 4800 tonnes of mandelic acid, a 100% reduction • 1890 tonnes of Raney nickel catalyst, an 87% reduction • 10 000 tonnes of starting material 4 , a 39% reduction
8.4.2 Energy Usage
An energy usage assessment was performed on the classical resolution route versus the enzymatic route to pregabalin. The software package chosen to perform the analysis was Batch Plus . 2) Table 8.4 shows the energy usage breakdown for each process based on the three main stages: (i) hydrolysis and decarboxylation, (ii) nitrile reduction, and (iii) isolation and purifi cation. Energy values are based on MJ (1 × 10 6 J) per kg pregabalin.
The enzymatic route resulted in an energy usage reduction of 82% versus the classical resolution process. This energy usage was based on two main factors: (i)
Table 8.3 Key material inputs for classical resolution and enzymatic routes.
Inputs Kilograms/1000 kg API
Classical resolution route (Scheme 8.2 )
Enzymatic route (Scheme 8.6 )
No recycling of 4 With recycling of 4
4 6 212 4 798 3810 Enzyme 0 574 574 ( S ) - mandelic acid 1 135 0 0 Raney nickel 531 80 70 Solvents 50 042 6230 4140 Total 57 920 11 682 8595
Table 8.4 Energy usage results for fi rst - generation and enzymatic routes.
Stage Classical resolution route Energy (MJ/kg 1 )
Enzymatic route (no recycle of 4 ) Energy (MJ/kg 1 )
Hydrolysis and decarboxylation
77.4 6.4
Nitrile reduction 13.7 7.8 Isolation and purifi cation 27.7 7.2 Total 118.8 21.4
2) Batch Plus version 2006.5 by Aspen Technology.

174 8 The Development of a Green, Energy Effi cient, Chemoenzymatic Manufacturing Process for Pregabalin
process yield increase (increasing from 25.8 to 33.4%) and (ii) use of less energy - intensive steps in the process. Breaking this down into a chemical, step - by - step analysis:
• Step 1 hydrolysis and decarboxylation: Here the biggest energy savings are made with the energy being reduced from 77.4 MJ/kg to 6.4 MJ/kg. In the classical resolution route both reactions are performed at refl ux (very energy intensive operations as they require energy for heat of vaporization, as well as cooling capacity for condensing vapors), whereas in the enzymatic process the hydrolysis reaction is run at room temperature and the decarboxylation reaction at a temperature below refl ux.
• Step 2 nitrile reduction: In this step the two processes are very similar: both are Raney nickel - catalyzed nitrile reductions using hydrogen. The reason the enzymatic process has an approximately halved energy is that it is being carried out in the enantiopure form, whereas in the classical resolution process this reaction is performed with a racemic substrate.
• Step 3 isolation purifi cation: In this step, again there are major energy savings with the energy use being reduced from 27.7 to 7.2 MJ/kg. The reasons are that in the classical process there now needs to be a classical resolution and salt - breaking operation, whereas in the enzymatic process the substrate is already chirally pure, and the process is just a simple purifi cation operation.
An alternative way of analyzing the data is to break the process down into unit operations, and Table 8.5 summarizes this approach. The unit operations that were considered for energy usage calculations were: heat/cool, heat to refl ux and
Table 8.5 Energy usage metrics for classical resolution and enzymatic routes.
Operation Energy/kg 1 (MJ/kg)
% of total # operations Avg. energy per operation (MJ/kg)
(a) Classical resolution route Heat/cool 44.0 37.0 12 3.7 Heat to refl ux + age 30.3 25.5 1 30.3 Concentrate 31.8 26.8 2 15.9 Dry 2.2 1.9 2 1.1 Exotherms 10.5 8.8 6 1.8 Totals 118.8 100 23
(b) Enzymatic route (no recycle of 4 ) Heat/cool 12.3 57.7 18 0.7 Concentrate 4.3 20.1 1 4.3 Dry 1.8 8.2 2 0.9 Exotherms 3.0 14.0 8 0.4 Totals 21.4 100 29

8.4 Green Chemistry Considerations 175
age, concentrate, dry, and exotherms via reaction or additions. Table 8.5 shows the energy usage metrics (again in MJ/kg 1 ) for these unit operations for the classical and enzymatic processes, including energy usage per operation, number of opera-tions, and average energy per operation.
Table 8.5 shows heating/cooling, refl ux, and concentration to be the most energy - intensive operations, as they require energy for heat of vaporization as well as cooling of vapors. The avoidance of the heating to refl ux and aging operations (used in the classical process) alone contributes 30.3 MJ/kg 1 of the energy savings achieved on moving to the enzymatic process. It can also be noted that the drying operations typically involve much less energy (an order of magnitude less than for concentration operations) because of the smaller mass associated with drying the intermediate/product. The cooling required for exothermic reactions or additions (that is, neutralizations) resulted in 8.8% and 14.0% of the total energy usage for the classical and enzymatic processes, respectively. Figure 8.4 graphically depicts the total energy usage per operation for the classical resolution and enzymatic process routes. The energy costs per kg of pregabalin at $0.17/kWhr 3) are $5.6/kg and $1.0/kg for the classical and enzymatic routes, respectively.
The energy use for the latest process, which uses the enzymatic process in combination with the recycle of the ( R ) - 4 , has also been calculated by Batch Plus and found to be 42.4 MJ/kg 1 . This number is higher than that for the process without the recycle, because of the energy required for the racemisation of ( R ) - 4 , but needs to be balanced with the savings in energy and materials in the prepara-tion of the reduced requirement of compound 4 . In addition, the undesired ( R ) - 4 has to be incinerated; thus, minimizing this operation by recycling as much ( R ) - 4 as possible avoids the CO 2 emissions produced in the incineration. Overall, we have concluded that the process with the recycle is the greenest process.
0
20
40
60
80
100
120
Classical Enzymatic
MJ/
kg p
rega
balin
heat/cool reflux+age concentrate dry exotherms
Figure 8.4 Energy usages for classical resolution and enzymatic routes.
3) Energy costs have been rising sharply, but this fi gure was provided by Connecticut Light & Power (CL & P), September 2008.
176 8 The Development of a Green, Energy Effi cient, Chemoenzymatic Manufacturing Process for Pregabalin
8.5 Conclusions
Pfi zer has developed and commercialized a new sustainable, enzymatic synthesis of pregabalin in which every process step is performed in water. This has resulted in signifi cant environmental savings in terms of both material and energy usage. This book chapter quantifi es those savings with the hope of encouraging more process chemists to use biocatalysis in their everyday work. Batch Plus was shown to be a valuable tool for performing energy balance analysis and can be applied to other pharmaceutical processes to document process changes and easily calculate green chemistry metrics as the process evolves from laboratory - scale to full - scale production. As energy prices increase, it is hoped that more scientists will include energy assessment in their process selection methodology as part of their drive toward greener and more cost - effective processes.
Acknowledgments
The authors gratefully acknowledge the input and support provided by the teams from Pfi zer Global Research and Development as well as Pfi zer Global Manufac-turing during the research and scale - up of this second - generation route to prega-balin. Although it is impossible to thank everyone, some colleagues we would specially like to thank are David Amspacher, Simon Davies, Yves Dumond, Tim Evans, David Hogan, Shanghui Hu, Padraig Kelly, Vivienne Lee, Xiao Xing Liao, Mike McLoughlin, Junhua Tao, Liam Tully, and Xiaobing Xiong.
References
1 Lauria - Horner , B.A. and Pohl , R.B. ( 2003 ) Expert Opin. Investig. Drugs , 12 , 663 – 672 .
2 Selak , I. ( 2003 ) Curr. Opin. Investig. Drugs , 2 , 828 – 834 .
3 Andruszkiewicz , R. and Silverman , R.B. ( 1989 ) Synthesis , 12 , 953 – 955 .
4 Andruszkiewicz , R. and Silverman , R.B. ( 1990 ) J. Biol. Chem. , 265 , 22288 – 22291 .
5 Silverman , R.B. , Andreszkiewicz , R. , Nanavati , S.M. , Taylor , C.P. , and Vartanian , M.G. ( 1991 ) J. Med. Chem. , 34 , 2295 – 2298 .
6 Kanter , P. - W. , Yuen , G.D. , Taylor , C.P. , and Vartanian , M.G. ( 1994 ) Biorg. Med. Chem. Lett. , 4 , 823 – 826 .
7 Hoekstra , M.S. , Sobieray , D.M. , Schwindt , M.A. , Mulhern , T.A. , Gote , T.M. , Huckabee , B.K. , Hendrickson ,
V.S. , Franklyn , L.C. , Granger , E.J. , and Karrick , G.L. ( 1997 ) Org. Process Res. Dev. , 1 , 26 – 38 .
8 (a) Sheldon , R.A. ( 1992 ) Chem. Ind. , 23 , 903 – 906 .
(b) Sheldon , R.A. ( 1994 ) Chemtech , 24 , 38 – 47 .
(c) Sheldon , R.A. ( 2007 ) Green Chem. , 9 , 1273 – 1283 .
9 Burk , M.J. , de Koning , P.D. , Grote , T.M. , Hoekstra , M.S. , Hoge , G. , Jennings , R.A. , Kissel , W.S. , Le , T.V. , Lennon , I.C. , Mulhern , T.A. , Ramsden , J.A. , and Wade , R.A. ( 2003 ) J. Org. Chem. , 68 , 5731 – 5734 .
10 Hoge , G. , Wu , H. - P. , Kissel , W.S. , Pfl um , D.A. , Greene , D.J. , and Bao , J. ( 2004 ) J. Am. Chem. Soc. , 126 , 5966 – 5967 .
References 177
11 Poe , S.L. , Kobaslija , M. , and McQuade , D.T. ( 2007 ) J. Am. Chem. Soc. , 129 , 9216 – 9221 .
12 Evans , D.A. , Mito , S. , and Seidel , D. ( 2007 ) J. Am. Chem. Soc. , 129 , 11583 – 11592 .
13 Izquierdo , S. , Aguilera , J. , Buschmann , H.H. , Garcia , M. , Torrens , A. , and Ortuno , R.M. ( 2008 ) Tetrahedron Asymmetry , 19 , 651 – 653 .
14 (a) Drauz , K. , and Waldmann , H. ( 2002 ) Enzyme Catalysis in Organic Synthesis , Wiley - VCH Verlag GmbH , Weinheim .
(b) Liese , A. , Seelbach , K. , and Wandrey , C. ( 2006 ) Industrial Biotransformations , 2nd edn , Wiley - VCH Verlag GmbH , Weinheim .
(c) Bornscheuer , U.T. , and Kazlauskas , R.J. ( 2006 ) Hydrolases in Organic Synthesis , 2nd edn , Wiley - VCH Verlag GmbH , Weinheim .
(d) Tao , J. , Zhao , L. , and Ran , N. ( 2007 ) Org. Process Res. Dev. , 11 , 259 – 267 .
15 Burns , M.P. , Weaver , J.K. , and Wong , J. ( 2005 ) PCT Int. Appl. WO 2005100580(A1) .
16 Yazbeck , D.R. , Tao , J. , Martinez , C.A. , Kline , B.J. , and Hu , S. ( 2003 ) Adv. Synth. Catal. , 345 , 524 – 532 .
17 Chen , C. - S. , Fujimoto , Y. , Girdaukas , G. , and Sih , C.J. ( 1982 ) J. Am. Chem. Soc. , 104 , 7294 – 7299 .
18 Esper , B. , and Huge - Jensen , I.B. ( 1995 ) EP0305216B1 .
19 (a) Yazbeck , D.R. , Martinez , C.A. , Hu , S. , and Tao , J. ( 2004 ) Tetrahedron Asymmetry , 15 , 2757 – 2763 . (b) Nomoto , F. , Hirayama , Y. , Ikunaka , M. , Inoue , T. , and Otsuka , K. ( 2003 ) Tetrahedron Asymmetry , 14 , 1871 – 1877 .
20 (a) Omar , I.C. , Hayashi , M. , and Nagai , S. ( 1987 ) Agric. Biol. Chem. , 51 , 37 – 45 .
(b) Liu , W. , Beppu , T. , and Arima , K. ( 1973 ) Agric. Biol. Chem. , 37 , 2487 – 2492 .
21 Koelsch , C.F. , and Stratton , C.H. ( 1944 ) J. Am. Chem. Soc. , 66 , 1883 – 1884 .
22 Martinez , C.A. , Hu , S. , Dumond , Y. , Tao , J. , Kelleher , P. , and Tully , L. ( 2008 ) Org. Process Res. Dev. , 12 , 392 – 398 .


179
9 Green Processes for Peptide Mimetic Diabetic Drugs Yasuhiro Sawai and Mitsuhisa Yamano
9.1 Introduction
Green Chemistry is based on the fundamental principle that we should develop processes to maximize the incorporation of raw materials into the fi nal product with environmentally - friendly substances and methodologies [1] . As for pollution, Green Chemistry places an emphasis on ‘ prevention ’ rather than ‘ containment and treatment ’ and aims to avoid problems before they happen. It is an indispen-sable tool for establishing a sustainable society in which we can enjoy modern life. Scientists from various disciplines are involved in Green Chemistry in the phar-maceutical industry, and process chemists play a major role because process research can contribute to drastic improvements in the manufacture of active pharmaceutical ingredient s ( API ) [2] . In current process chemistry, the term ‘ industrially feasible ’ not only means ‘ safe, scalable, convenient, and cost - effective ’ but also ‘ environmentally friendly ’ [3] . The processes of manufacturing structur-ally complex APIs require multiple steps and consequently generate large amounts of waste. The E factors in the pharmaceutical industry can be greater than 100 [1d] . Peptide mimetic diabetic drugs with peptide - like structures are typical exam-ples of products that are expected to impose an environmental burden during their manufacture. This chapter considers the Green Chemistry aspects of manufactur-ing peptide - like APIs.
9.2 Green Chemistry Considerations in Peptide - like API Manufacture
Peptide - based drug molecules are prevalent in drug discovery studies that target receptors or enzymes [4] . Some native or modifi ed peptides are used as therapeutic agents, such as the osteoporosis drug teriparatide (recombinant human parathy-roid hormone [1 – 34]) [5a] and the anti - cancer drug leuprorelin [5b] (Figure 9.1 ). In most cases, however, the peptide is converted into a low - molecular - weight peptide mimetic compound by reducing the number of peptide bonds and by
Green Chemistry in the Pharmaceutical Industry. Edited by Peter J. Dunn, Andrew S. Wells and Michael T. Williams© 2010 WILEY-VCH Verlag GmbH & Co. KGaA, WeinheimISBN: 978-3-527-32418-7
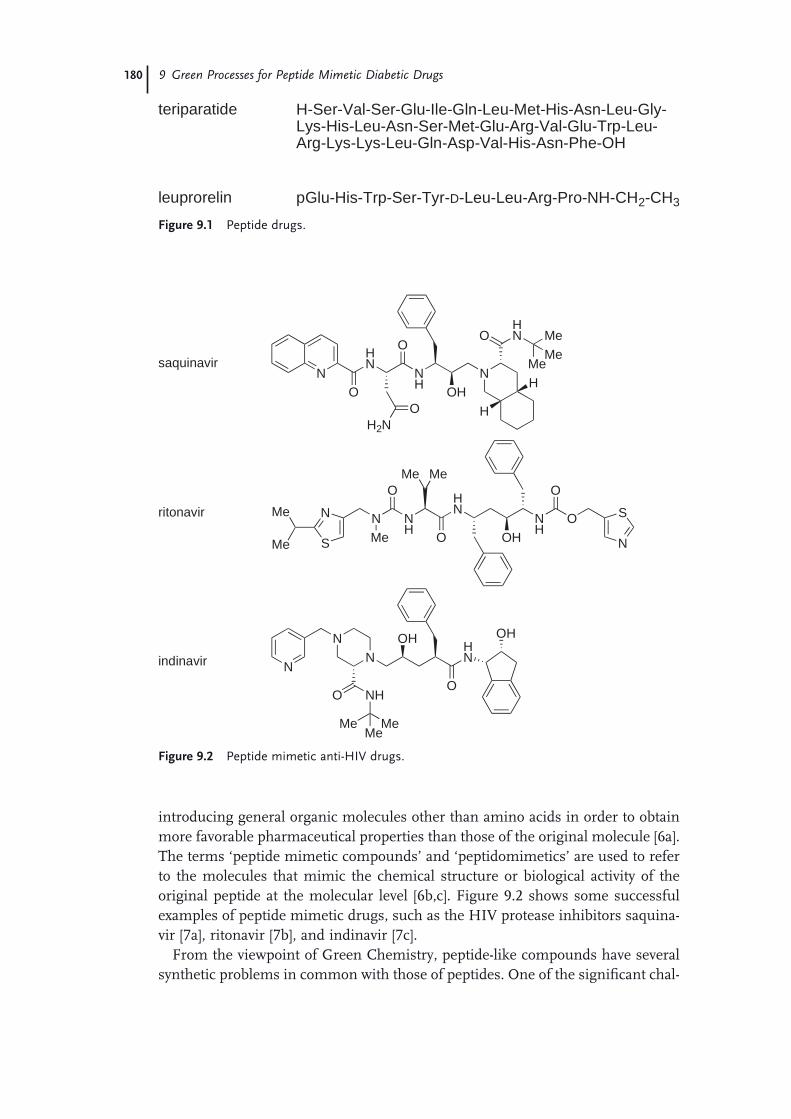
180 9 Green Processes for Peptide Mimetic Diabetic Drugs
introducing general organic molecules other than amino acids in order to obtain more favorable pharmaceutical properties than those of the original molecule [6a] . The terms ‘ peptide mimetic compounds ’ and ‘ peptidomimetics ’ are used to refer to the molecules that mimic the chemical structure or biological activity of the original peptide at the molecular level [6b,c] . Figure 9.2 shows some successful examples of peptide mimetic drugs, such as the HIV protease inhibitors saquina-vir [7a] , ritonavir [7b] , and indinavir [7c] .
From the viewpoint of Green Chemistry, peptide - like compounds have several synthetic problems in common with those of peptides. One of the signifi cant chal-
H-Ser-Val-Ser-Glu-Ile-Gln-Leu-Met-His-Asn-Leu-Gly-Lys-His-Leu-Asn-Ser-Met-Glu-Arg-Val-Glu-Trp-Leu-Arg-Lys-Lys-Leu-Gln-Asp-Val-His-Asn-Phe-OH
teriparatide
pGlu-His-Trp-Ser-Tyr-D-Leu-Leu-Arg-Pro-NH-CH2-CH3leuprorelin Figure 9.1 Peptide drugs.
saquinavir
ritonavir
indinavir
NO
HN
O
NH
NOH
HNO Me
MeMe
H
HH2N
O
S
NMe
Me
NMe
NH
O HN
ONH
O
O
N
S
OH
MeMe
N
NN
OH
O
OHHN
NHO
MeMeMe
Figure 9.2 Peptide mimetic anti - HIV drugs.

9.2 Green Chemistry Considerations in Peptide-like API Manufacture 181
lenges is to develop peptide coupling reactions with improved atom economy [3d] . However, in most cases, purifi cation remains a more critical environmental issue. Purifi cation requires the capability to remove not only unreacted raw materials and related substances that have undergone minor substitutions at particular amino acid residues but also the large amount of residues that have arisen from protecting groups at deprotection steps. Peptide - like compounds, as well as pep-tides with a long - chain structure and a high molecular weight, are often diffi cult to crystallize, and therefore they are obtained as amorphous solids or as crystals with poor solid - state properties. In such cases, crystallization processes cannot be applied to their purifi cation, and chromatography is used as a viable and valid option, which can put a burden on the environment.
Typical peptide drugs have a high potency and thus are used at extraordinarily low doses, such as those for teriparatid (20 μ g/day) and leuprorelin (3.75 mg/4 weeks, sustained - release formulation) (Figure 9.1 ). Consequently, their production volumes are relatively low, and their environmental loads are relatively small, even though their production uses a variety of chromatographic processes. In contrast, general peptide mimetic compounds such as drugs like HIV protease inhibitors have high production volumes. The waste that arises from chromatography, such as the large volumes of eluents and nonrecyclable column packing materials, has become a major issue for Green Chemistry.
Peptide - like compounds raise the further signifi cant issue of chirality control. When all the chiral fragments consist of natural amino acids, the chiral sources are natural amino acids themselves. However, when chiral non - natural amino acids are used as bioisosteres of amino acid residues to construct peptide mimetic compounds, the chirality needs to be constructed as effi ciently as possible. Multi - step or low - yielding processes resulting from the necessity to control chirality often lead to the potential risk of large amounts of waste and a high environmental burden.
In the following section, taking diabetic drug candidates 1 and 2 [8, 9] as case studies (Figure 9.3 ), the purifi cation and chirality control issues of peptide - like API manufacturing are considered from a Green Chemistry perspective.
Cl
N
NMe
Me
O
NH
HN O
N
ONMe
1
amorphous solid
2
NH
Me
HNO
HN
OMe
NMe
Me
N
O
Figure 9.3 Peptide mimetic diabetic drug candidates.
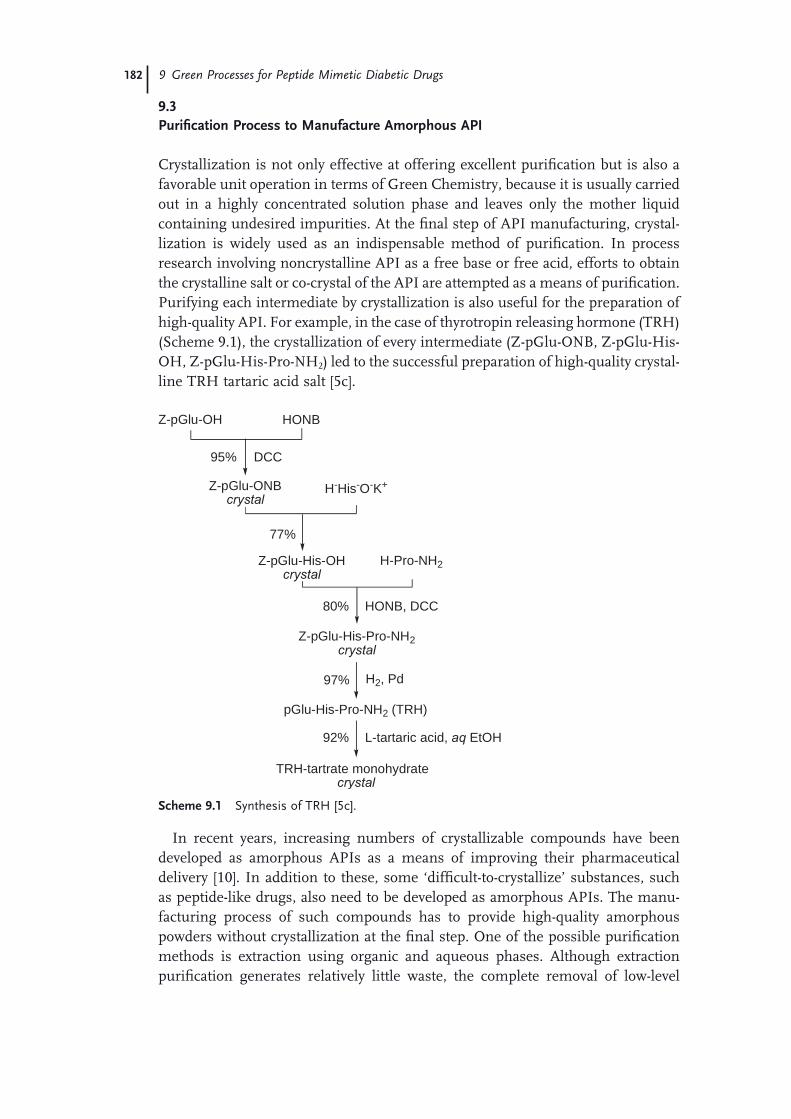
182 9 Green Processes for Peptide Mimetic Diabetic Drugs
9.3 Purifi cation Process to Manufacture Amorphous API
Crystallization is not only effective at offering excellent purifi cation but is also a favorable unit operation in terms of Green Chemistry, because it is usually carried out in a highly concentrated solution phase and leaves only the mother liquid containing undesired impurities. At the fi nal step of API manufacturing, crystal-lization is widely used as an indispensable method of purifi cation. In process research involving noncrystalline API as a free base or free acid, efforts to obtain the crystalline salt or co - crystal of the API are attempted as a means of purifi cation. Purifying each intermediate by crystallization is also useful for the preparation of high - quality API. For example, in the case of thyrotropin releasing hormone ( TRH ) (Scheme 9.1 ), the crystallization of every intermediate (Z - pGlu - ONB, Z - pGlu - His - OH, Z - pGlu - His - Pro - NH 2 ) led to the successful preparation of high - quality crystal-line TRH tartaric acid salt [5c] .
Z-pGlu-OH HONB
DCC
Z-pGlu-ONBcrystal
H-His-O-K+
Z-pGlu-His-OHcrystal
H-Pro-NH2
HONB, DCC
Z-pGlu-His-Pro-NH2crystal
H2, Pd
pGlu-His-Pro-NH2 (TRH)
L-tartaric acid, aq EtOH
TRH-tartrate monohydratecrystal
95%
77%
80%
97%
92%
Scheme 9.1 Synthesis of TRH [5c] .
In recent years, increasing numbers of crystallizable compounds have been developed as amorphous APIs as a means of improving their pharmaceutical delivery [10] . In addition to these, some ‘ diffi cult - to - crystallize ’ substances, such as peptide - like drugs, also need to be developed as amorphous APIs. The manu-facturing process of such compounds has to provide high - quality amorphous powders without crystallization at the fi nal step. One of the possible purifi cation methods is extraction using organic and aqueous phases. Although extraction purifi cation generates relatively little waste, the complete removal of low - level

9.3 Purifi cation Process to Manufacture Amorphous API 183
impurities is diffi cult. Therefore, chromatography is frequently used as the sec-ond - best purifi cation method for amorphous APIs.
When incorporating chromatography into the process, it is important to select the most effi cient separation mode. In recent years, remarkable technological progress in reversed - phase high - performance liquid chromatography ( RP - HPLC ) has been achieved, and the application of this technique for large - scale preparation has been reported [11] . However, its applications are limited, mainly because of diffi culties in increasing the column loading dose. RP - HPLC is commonly used in combination with other types of purifi cation, such as ion exchange chromatog-raphy, to prepare a small amount of a highly purifi ed product. Ion exchange chromatography is applicable to a wide range of compounds with acidic, basic, or amphoteric dissociative functional groups, and usually requires relatively small amounts of the stationary phase. In addition, ion exchange resin is easy to reuse, and therefore the method is widely used in the purifi cation of peptides. Gel per-meation chromatography also allows the reuse of its stationary phase and is applied to the removal of peptidic impurities of different molecular size from long - chain peptides. Synthetic adsorbents are frequently used as the recyclable stationary phase of column chromatography for peptides. For example, decapep-tide leuprorelin (Figure 9.1 ), which is a ‘ diffi cult - to - purify ’ API, is purifi ed by a combination of several separation modes using the above - mentioned recyclable resin chromatography [5d] . The process affords high - quality leuprorelin while reducing resin disposal and keeping the environmental loads low.
Even if there were no alternatives to chromatography as a method of purifying amorphous API, the number of chromatographic operations should be minimized in order to decrease the volume of organic solvent - containing effl uent. It is desir-able that the minimum number of chromatographic operations using the most effi cient separation mode be incorporated into the process where they are most effective.
In the case of diabetic drug candidate 1 (Scheme 9.2 ), the successful develop-ment of a green process depended on the accomplishment of green purifi cation of the amorphous compounds API 1 and chiral fragment 4 . The synthesis of 1 started from the peptide coupling reaction of N - Fmoc - D - tryptophan with ( S ) - 3 . This reaction required strong activation for the carboxyl function of D - tryptophan, such as that provided by acyl chloride, because of the low nucleophilicity of the tetrahydroquinoline ring nitrogen of ( S ) - 3 . The Fmoc protecting group, which is stable under acidic conditions and can be removed under mild basic conditions, was selected for the α - nitrogen protection of D - tryptophan and worked effectively during the transformation sequence. However, in the deprotection step using piperidine, a stoichiometric amount of dibenzofulvene ( 5 ) and its piperidine adduct 6 was produced (structures in Figure 9.4 ), and these were diffi cult to remove [12] . Therefore, the purifi cation of 4 required cation exchange chromatog-raphy ( CEC ) in order to remove these by - products and a wide variety of low - level impurities. On the other hand, the fi nal coupling reaction proceeded relatively cleanly under the optimum conditions with the highest possible purity of 4 . Although all the attempts to crystallize 1 with or without additives have resulted

184 9 Green Processes for Peptide Mimetic Diabetic Drugs
in failure, extraction using aqueous potassium carbonate solution and ethyl acetate was able to provide high - quality 1 . Thus, the chromatography at the fi nal step has been omitted, and a single chromatography of 4 allowed high - quality amorphous API 1 to be prepared on the kilogram scale [9a,b] .
9.3.1 Cation Exchange Chromatography
The development of a purifi cation process involving ion exchange chromatography typically begins with screening for the stationary phase using a variety of com-mercially available ion exchange resins depending on the substrate to be purifi ed. Selecting the resin with the highest total exchange capacity is important for waste
(S)-3
Cl
NH
NMe
MeCl
N
NMe
Me
O
NH
NHFmoc
COCl
NH
NHFmoc
MeOHEt3N, THF
CO2H
NH
NHFmoc
Cl
N
NMe
Me
O
NH
NH2
4
1) CEC or extraction
64-68%
4 0.25H3PO4 0.5H2O
1)
87%
Cl
N
NMe
Me
O
NH
HN O
N
ONMe
1
NH
2) EtOH, H2O
2) H3PO4, aq EtOH
EDCl, HOBt, DMFO
NNMe
CO2H
amorphous solid
(COCl)2, cat. DMF
THF
Scheme 9.2 Synthesis of 1 .

9.3 Purifi cation Process to Manufacture Amorphous API 185
reduction. Mobile phase optimization by assessing impurity profi les also has a signifi cant infl uence on purifi cation effi ciency.
In the case of amorphous intermediate 4 , the weakly acidic cation exchange resin DIAION ® WK100 was selected as the CEC stationary phase. The resin comprises a methacrylate resin matrix and carboxylic acid, which functions as an exchange group with a high ion exchange rate. Figure 9.4 illustrates the concept behind the CEC procedure for 4 :
1) A crude mixture was charged onto the column, which had been fi lled with DIAION ® WK100 pre - conditioned in its H - form.
2) Impurities were eluted while 4 remained adsorbed on the H - form resin. 3) Compound 4 was exchanged with sodium cations and eluted from the Na - form
resin.
The most signifi cant issue was the removal of tertiary amine 6 . An extensive investigation into the mobile phase revealed that the sodium cations in 0.5% sodium chloride aqueous solution/methanol (20 : 80) selectively exchanged 6 , while the sodium cations in 5% sodium chloride aqueous solution/methanol (20 : 80) simultaneously exchanged both 4 and 6 . After the removal of both 5 and 6 with low levels of other impurities, 4 was eluted using 5 M sodium hydroxide aqueous solution/methanol (20 : 80). This fraction gave amorphous solid 4 , 97% pure by HPLC (area analysis) and 80% yield based on ( S ) - 3 . This process has been run on the kilogram scale, and the resin was able to be reused at least 3 times after reconditioning, in which the resin was converted from its Na - form to its H - form using hydrochloric acid and methanol.
cation exchange resin (H-form)
crude mixture
MeOH
0.5% aq NaCl/MeOH
neutral substances (5)
basic substances (4)
cation exchange resin (Na-form)
cation exchange resin (H-form)
MeOH
aq HCl
basic substances (6)
5M aq NaOH/MeOH
CH2
N
5
6
Cl
N
NMe
Me
O
NH
NH2
4
Figure 9.4 CEC of 4 .
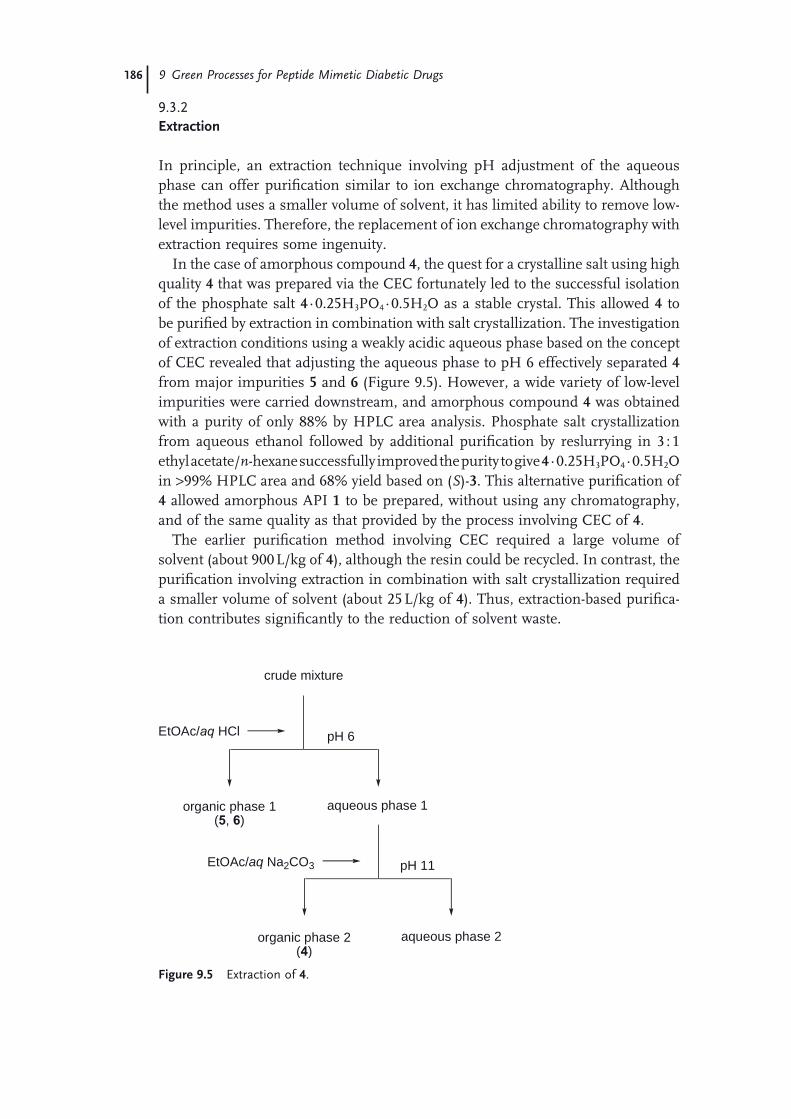
186 9 Green Processes for Peptide Mimetic Diabetic Drugs
9.3.2 Extraction
In principle, an extraction technique involving pH adjustment of the aqueous phase can offer purifi cation similar to ion exchange chromatography. Although the method uses a smaller volume of solvent, it has limited ability to remove low - level impurities. Therefore, the replacement of ion exchange chromatography with extraction requires some ingenuity.
In the case of amorphous compound 4 , the quest for a crystalline salt using high quality 4 that was prepared via the CEC fortunately led to the successful isolation of the phosphate salt 4 · 0.25H 3 PO 4 · 0.5H 2 O as a stable crystal. This allowed 4 to be purifi ed by extraction in combination with salt crystallization. The investigation of extraction conditions using a weakly acidic aqueous phase based on the concept of CEC revealed that adjusting the aqueous phase to pH 6 effectively separated 4 from major impurities 5 and 6 (Figure 9.5 ). However, a wide variety of low - level impurities were carried downstream, and amorphous compound 4 was obtained with a purity of only 88% by HPLC area analysis. Phosphate salt crystallization from aqueous ethanol followed by additional purifi cation by reslurrying in 3 : 1 ethyl acetate/ n - hexane successfully improved the purity to give 4 · 0.25H 3 PO 4 · 0.5H 2 O in > 99% HPLC area and 68% yield based on ( S ) - 3 . This alternative purifi cation of 4 allowed amorphous API 1 to be prepared, without using any chromatography, and of the same quality as that provided by the process involving CEC of 4 .
The earlier purifi cation method involving CEC required a large volume of solvent (about 900 L/kg of 4 ), although the resin could be recycled. In contrast, the purifi cation involving extraction in combination with salt crystallization required a smaller volume of solvent (about 25 L/kg of 4 ). Thus, extraction - based purifi ca-tion contributes signifi cantly to the reduction of solvent waste.
crude mixture
EtOAc/aq HCl
organic phase 1(5, 6)
aqueous phase 1
pH 6
EtOAc/aq Na2CO3
aqueous phase 2organic phase 2(4)
pH 11
Figure 9.5 Extraction of 4 .
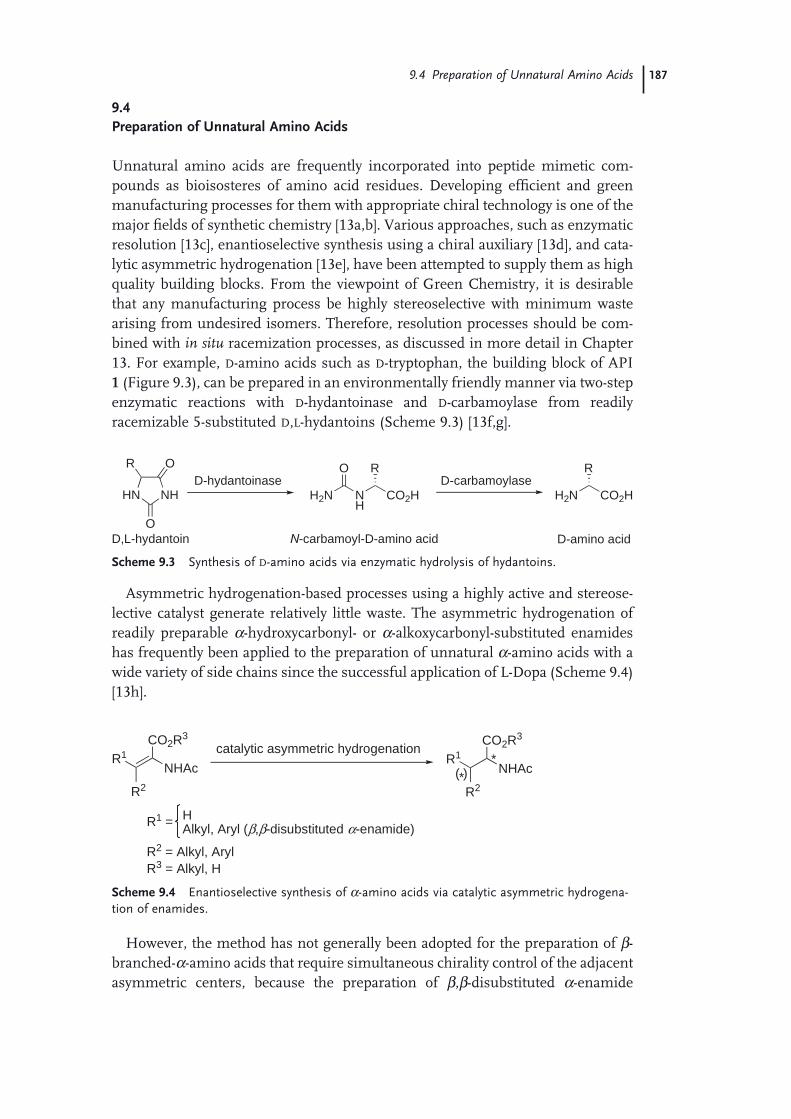
9.4 Preparation of Unnatural Amino Acids 187
9.4 Preparation of Unnatural Amino Acids
Unnatural amino acids are frequently incorporated into peptide mimetic com-pounds as bioisosteres of amino acid residues. Developing effi cient and green manufacturing processes for them with appropriate chiral technology is one of the major fi elds of synthetic chemistry [13a,b] . Various approaches, such as enzymatic resolution [13c] , enantioselective synthesis using a chiral auxiliary [13d] , and cata-lytic asymmetric hydrogenation [13e] , have been attempted to supply them as high quality building blocks. From the viewpoint of Green Chemistry, it is desirable that any manufacturing process be highly stereoselective with minimum waste arising from undesired isomers. Therefore, resolution processes should be com-bined with in situ racemization processes, as discussed in more detail in Chapter 13 . For example, D - amino acids such as D - tryptophan, the building block of API 1 (Figure 9.3 ), can be prepared in an environmentally friendly manner via two - step enzymatic reactions with D - hydantoinase and D - carbamoylase from readily racemizable 5 - substituted D , L - hydantoins (Scheme 9.3 ) [13f,g] .
HN NH
R O
O
H2N NH
CO2H
ROesalyomabrac-Desaniotnadyh-D
H2N CO2H
R
D-amino acidD,L-hydantoin N-carbamoyl-D-amino acid
Scheme 9.3 Synthesis of D - amino acids via enzymatic hydrolysis of hydantoins.
NHAc
CO2R3
R1
R2
catalytic asymmetric hydrogenationNHAc
CO2R3
R2
*R1
R1 = HAlkyl, Aryl (β,β-disubstituted α-enamide)
R2 = Alkyl, ArylR3 = Alkyl, H
*( )
Scheme 9.4 Enantioselective synthesis of α - amino acids via catalytic asymmetric hydrogena-tion of enamides.
Asymmetric hydrogenation - based processes using a highly active and stereose-lective catalyst generate relatively little waste. The asymmetric hydrogenation of readily preparable α - hydroxycarbonyl - or α - alkoxycarbonyl - substituted enamides has frequently been applied to the preparation of unnatural α - amino acids with a wide variety of side chains since the successful application of L - Dopa (Scheme 9.4 ) [13h] .
However, the method has not generally been adopted for the preparation of β - branched - α - amino acids that require simultaneous chirality control of the adjacent asymmetric centers, because the preparation of β , β - disubstituted α - enamide

188 9 Green Processes for Peptide Mimetic Diabetic Drugs
precursors involves additional issues of geometric selectivity [13i] . Therefore, other types of chirality control are required for the preparation of β - branched - α - amino acids. For example, the crystallization - induced diastereomer transformation ( CIDT ) technique has been applied to the synthesis of β - methyltryptophan ( β - MeTrp), the building block of API 2 (Figure 9.3 ), in order to prepare only the desired diastereomer with minimum waste [9a,c] .
9.4.1 Crystallization - Induced Diastereomer Transformation
CIDT is a hybrid process involving selective crystallization of desired diastereomer and in situ epimerization of undesired diastereomer. Figure 9.6 illustrates the system, in which two solid diastereomers, A s and B s can equilibrate with each other via their dissolved counterparts A l and B l . The solubility products of A and B are given by L A = [ A l ] and L B = [ B l ], and the equilibrium constant for A and B in solu-tion is given by K = [ B l ]/[ A l ]. For L A K > L B at a temperature below their melting points, the mixture of A s and B s should eventually be transformed into pure B s , in other words, CIDT occurs [14a] .
CIDT can be applied only to crystalline compounds with more than two chiral centers including more than one epimerizable center. In most cases, each epimeri-zation and crystallization process needs to be investigated separately before the integrated process is optimized. It should be noted that the crystalline products arising from CIDT processes often epimerize when redissolved, and this can complicate downstream processing [14b] . While classical resolution provides the desired diastereomer with a lower than 50% yield per batch and requires several steps such as recovery and racemization for the reuse of the undesired diastere-omer, CIDT theoretically affords the desired diastereomer in 100% yield per batch without the tedious operations that lead to increases in waste.
The fi rst report of CIDT dates back to 1846, when Dubrunfast uncovered the mutarotation of D - glucose [14c] . In recent years, CIDT has been attracting much attention as a green technique and is used in several manufacturing processes for chiral drugs, such as the NK1 receptor antagonist aprepitant [14d] and the PDE5 inhibitor tadalafi l [14e] (Figure 9.7 ). The CIDT - based process for aprepitant
Al
As
Bl
Bs
solution phase
solid phase
Figure 9.6 Schematic representation of a crystallization - induced process [14a] .

9.4 Preparation of Unnatural Amino Acids 189
received the Presidential Green Chemistry Challenge Award in 2005 from the United States Environmental Protection Agency.
In the case of diabetic drug candidate 2 (Scheme 9.5 ), the chirality control of the two asymmetric centers of β - MeTrp ethyl ester threo - 9 was the most critical issue. Since the pioneering work of Snyder [15a] , many attempts at the synthesis of β - MeTrp have been undertaken [15b,c] . For example, optically active β - MeTrp has been prepared by classical resolution of four stereoisomers via diastereomeric salt formation [15d,e] , kinetic resolution using enzymatic hydrolysis [15f] , and enanti-oselective syntheses [15g – k] . Although catalytic enantioselective synthesis of β - MeTrp via asymmetric hydrogenation of an enamide precursor has been reported (Scheme 9.4 ), the process required the chromatographic separation of the E / Z - isomers of enamide from each other and a large number of synthetic steps [15j] . To develop a more straightforward and diastereoselective synthesis of threo - 9 , the CIDT process was applied to the preparation of α - nitro ester threo - 8 [9a,c] .
The C – C bond - forming reaction of the gramine 7 with ethyl nitroacetate pro-ceeded in a nonstereoselective manner to give the α - nitro ester 8 as a 6 : 4 diastere-omeric mixture ( threo - 8 / erythro - 8 ). An investigation into epimerization revealed that the addition of amine to a solution of 8 effectively accelerated the epimeriza-tion, and a crystallization study revealed that using 1 : 2 ethanol/ n - heptane as the solvent threo - 8 crystallized in good yield while erythro - 8 did not crystallize. On the basis of these results, the CIDT process was optimized (Table 9.1 ). In the absence of amine, the crystal was obtained in low yield at 25 ° C (Entry 1) and in low dias-tereomeric ratio ( dr ) at 0 ° C (Entry 2). The dr of their fi ltrate did not reach equilib-rium. In contrast, adding 0.1 equiv. of tertiary, secondary, or primary amine achieved suffi cient CIDT at 0 ° C. In particular, the addition of triethylamine or iso - propylamine was effective for CIDT to give the target diastereomer in 94% yield with > 99% dr (Entries 3 and 5). The slight decrease in the dr in the case involving 0.1 equiv. of diethylamine was due to the formation of a crystalline diastereomix-ture adduct ( threo - 8 / erythro - 8 /Et 2 NH [1 : 1 : 2]) (Entry 4). When adding an equivalent of iso - propylamine, the desired diastereomer was obtained in only 50% yield (Entry 6). Possible reasons for the low yield with an equivalent of iso - propylamine include the higher solubility of threo - 8 in the presence of iso - propylamine and the
N
O O
Me
CF3
CF3
HN N
HN
FO
aprepitant
NH
NN
OMe
O
OO
tadalafil
Figure 9.7 Drugs prepared via CIDT.

190 9 Green Processes for Peptide Mimetic Diabetic Drugs
generation of a more soluble compound such as the adduct of threo - 8 with iso - propylamine. These results suggest that a catalytic amount of amine is pivotal for the CIDT of 8 .
Among these amines, iso - propylamine was the most suitable for this process, because it was released from 7 during the C – C bond - forming reaction as a by - product and was able to be reused for the CIDT without adding any additional amine. In fact, vacuum concentration of the C – C bond - forming reaction mixture left a catalytic amount of iso - propylamine in the residue, and the residual iso - propylamine effectively catalyzed CIDT without the addition of further amine to afford threo - 8 in 89% yield with > 99% dr . The level of residual iso - propylamine was
NH
NH
NH
7
NH
MeCO2Et
NO2
rac-threo-8
%99>,%98%76 dr
89%>99% dr N
H
MeCO2Et
NH2
rac-threo-9
Meaq CH3CHOi-PrNH2, AcOHtoluene
1) O2NCH2CO2Et toluene2) EtOH, n-heptane
ZnAcOHTHF
88%
87%
EDCl, Et3N, DMF
1) CDI, Et3N, DMF
NH
MeCO2H
HN
O
H2NNMe
Me
EtO
1)
2) acetone, H2O
2
NH
Me
HNO
HN
OMe
NMe
Me
N
O
(2R,3S)-9
1) aq NaOH, toluene2) MeSO3H, n-BuOAc, EtOH
n-BuOAc, H2O (1%)
(2R,3S)-9
CO2HO
HOMe
39% (2 steps), >99% ee
(R)-10 (0.5 eq)
NH
MeCO2Et
NH2
CIDT
NH
2) aq NaOH, EtOH3) HCl
Me
Me
92% ee
(R)-10 H2O
MeSO3H
HCl
MeSO3H
N
2HCl
Scheme 9.5 Synthesis of 2 .
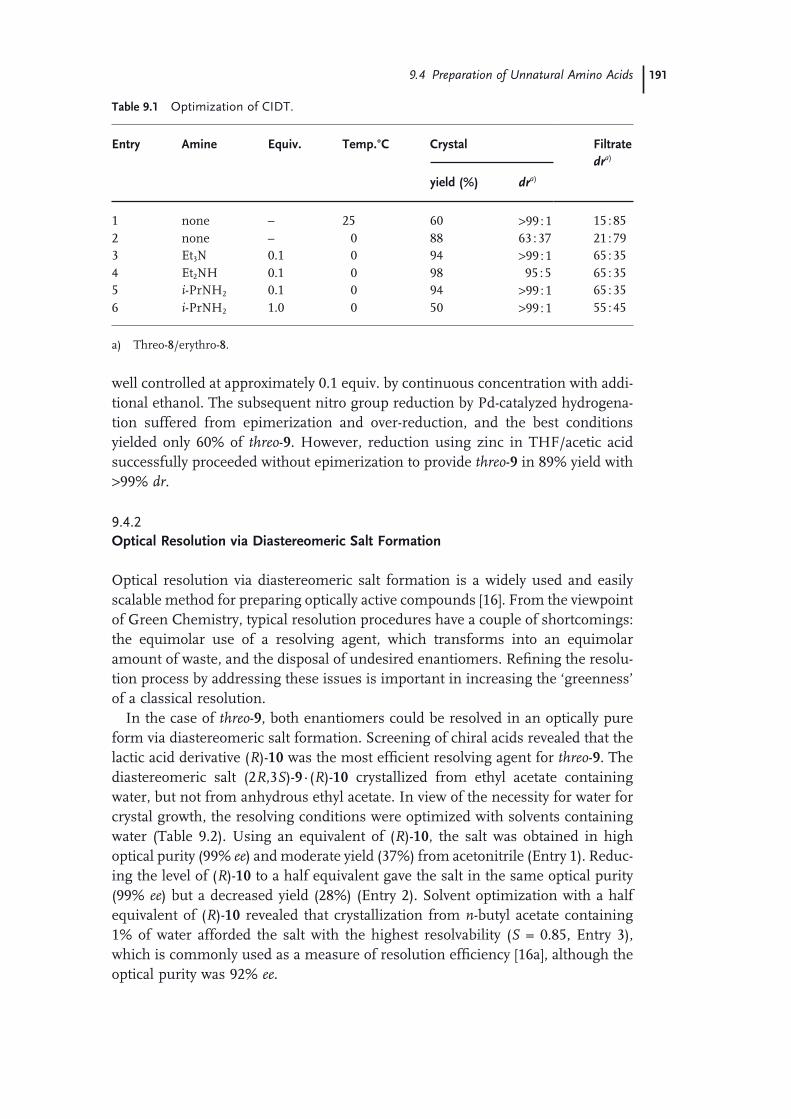
9.4 Preparation of Unnatural Amino Acids 191
well controlled at approximately 0.1 equiv. by continuous concentration with addi-tional ethanol. The subsequent nitro group reduction by Pd - catalyzed hydrogena-tion suffered from epimerization and over - reduction, and the best conditions yielded only 60% of threo - 9 . However, reduction using zinc in THF/acetic acid successfully proceeded without epimerization to provide threo - 9 in 89% yield with > 99% dr .
9.4.2 Optical Resolution via Diastereomeric Salt Formation
Optical resolution via diastereomeric salt formation is a widely used and easily scalable method for preparing optically active compounds [16] . From the viewpoint of Green Chemistry, typical resolution procedures have a couple of shortcomings: the equimolar use of a resolving agent, which transforms into an equimolar amount of waste, and the disposal of undesired enantiomers. Refi ning the resolu-tion process by addressing these issues is important in increasing the ‘ greenness ’ of a classical resolution.
In the case of threo - 9 , both enantiomers could be resolved in an optically pure form via diastereomeric salt formation. Screening of chiral acids revealed that the lactic acid derivative ( R ) - 10 was the most effi cient resolving agent for threo - 9 . The diastereomeric salt (2 R ,3 S ) - 9 · ( R ) - 10 crystallized from ethyl acetate containing water, but not from anhydrous ethyl acetate. In view of the necessity for water for crystal growth, the resolving conditions were optimized with solvents containing water (Table 9.2 ). Using an equivalent of ( R ) - 10 , the salt was obtained in high optical purity (99% ee ) and moderate yield (37%) from acetonitrile (Entry 1). Reduc-ing the level of ( R ) - 10 to a half equivalent gave the salt in the same optical purity (99% ee ) but a decreased yield (28%) (Entry 2). Solvent optimization with a half equivalent of ( R ) - 10 revealed that crystallization from n - butyl acetate containing 1% of water afforded the salt with the highest resolvability ( S = 0.85, Entry 3), which is commonly used as a measure of resolution effi ciency [16a] , although the optical purity was 92% ee .
Table 9.1 Optimization of CIDT .
Entry Amine Equiv. Temp. ° C Crystal Filtrate dr a)
yield (%) dr a)
1 none – 25 60 > 99 : 1 15 : 85 2 none – 0 88 63 : 37 21 : 79 3 Et 3 N 0.1 0 94 > 99 : 1 65 : 35 4 Et 2 NH 0.1 0 98 95 : 5 65 : 35 5 i - PrNH 2 0.1 0 94 > 99 : 1 65 : 35 6 i - PrNH 2 1.0 0 50 > 99 : 1 55 : 45
a) Threo - 8 /erythro - 8 .

192 9 Green Processes for Peptide Mimetic Diabetic Drugs
Fortunately, the optical purity was improved to > 99% ee by the crystallization of the methanesulfonate of (2 R ,3 S ) - 9 . A resolution sequence involving diastereo-meric salt formation, salt splitting, and methanesulfonate crystallization gave (2 R ,3 S ) - 9 · MeSO 3 H in > 99% ee and 39% two - step yield (Scheme 9.6 ). Meanwhile, the addition of methanesulfonic acid to the fi ltrate that was obtained during the diastereomeric salt formation step directly gave (2 S ,3 R ) - 9 · MeSO 3 H in > 99% ee and 40% two - step yield. As a result, using only a half equivalent of ( R ) - 10 allowed both enantiomers to be simultaneously prepared with 79% total recovery from the racemate without any recycling process.
Table 9.2 Optimization of resolution.
Entry ( R ) - 10 equiv. Solvent a) Yield % Optical purity % ee Resolvability b) S
1 1.0 MeCN 37 99 0.73 2 0.5 MeCN 28 99 0.55
3 0.5 n - BuOAc 46 92 0.85
a) Containing 1% of water. b) S = yield (%) × 2 × optical purity (% ee ) × 10 − 4 .
1) aq NaOH, toluene2) MeSO3H, n-BuOAc, EtOH
n-BuOAc, H2O (1%)
(2S,3R)-9
CO2HO
HOMe
(R)-10 (0.5 eq)
MeSO3H, EtOH
rac-threo-9
(2R,3S)-9NH
MeCO2Et
NH2
MeSO3H
MeSO3H
(2S,3R)-9NH
MeCO2Et
NH2
MeSO3H
MeSO3H
40%, >99% ee39%, >99% ee
crystal 92% ee filtrate 82% ee
(2R,3S)-9 (R)-10 H2O
Scheme 9.6 Simultaneous preparation of both enantiomers using a half equivalent of resolving agent.
References 193
9.5 Summary
Peptide - like APIs, such as the diabetic drug candidates 1 and 2 , are typical exam-ples of products that are expected to impose an environmental burden during their manufacture, as their purifi cation processes often require chromatography. In order to reduce the environmental load, it is important that their manufacturing processes incorporate the minimum number of chromatographic operations using the most effi cient separation mode. Alternative purifi cation methods such as extraction - based purifi cation contribute signifi cantly to the reduction of solvent waste. Chiral fragments such as unnatural amino acids should be effi ciently pre-pared using appropriate chiral technology. CIDT is a green technique that provides only the desired diastereomer. Improving resolution effi ciency is also signifi cant for waste reduction.
Although cutting - edge technologies, such as highly effi cient catalysts, organic reactions in aqueous media, and supercritical fl uid processes, are needed to allow drastic innovation in Green Chemistry, refi nements to conventional unit opera-tions, such as chromatography, extraction, and crystallization processes, are still important for current Green Chemistry in the pharmaceutical industry.
Acknowledgments
This chapter represents the outstanding contributions of many scientists within the Takeda Pharmaceutical Company: discovery chemists, process chemists, ana-lytical chemists, and chemical engineers. The authors hereby express their sincere gratitude to many colleagues whose hard work and dedication led to the success of these projects.
References
1 (a) Anastas , P.T. , and Warner , J.C. ( 1998 ) Green Chemistry: Theory and Practice , Oxford University Press , New York .
(b) Anastas , P.T. , and Kirchhoff , M.M. ( 2002 ) Acc. Chem. Res. , 35 , 686 – 694 .
(c) Horv á th , I.T. , and Anastas , P.T. ( 2007 ) Chem. Rev. , 107 , 2169 – 2173 .
(d) Poliakoff , M. , and Licence , P. ( 2007 ) Nature , 450 , 810 – 812 .
2 (a) Anderson , N.G. ( 2000 ) Practical Process Research & Development , Academic Press , San Diego .
(b) Zhang , T.Y. ( 2006 ) Chem. Rev. , 106 , 2583 – 2595 . (c) Butters , M. , Catterick , D. , Craig , A. , Curzons , A. , Dale , D. ,
Gillmore , A. , Green , S.P. , Marziano , I. , Sherlock , J. - P. , and White , W. ( 2006 ) Chem. Rev. , 106 , 3002 – 3027 .
3 (a) Tucker , J.L. ( 2006 ) Org. Process Res. Dev. , 10 , 315 – 319 .
(b) Constable , D.J.C. , Jimenez - Gonzalez , C. , and Henderson , R.K. ( 2007 ) Org. Process Res. Dev. , 11 , 133 – 137 .
(c) Khetan , S.K. , and Collins , T.J. ( 2007 ) Chem. Rev. , 107 , 2319 – 2364 .
(d) Constable , D.J.C. , Dunn , P.J. , Hayler , J.D. , Humphrey , G.R. , Leazer , J.L. , Jr. , Linderman , R.J. , Lorenz , K. , Manley , J. , Pearlman , B.A. , Wells , A. , Zaksh , A. , and Zhang , T.Y. ( 2007 ) Green Chem. , 9 , 411 – 420 .

194 9 Green Processes for Peptide Mimetic Diabetic Drugs
4 (a) Weckbecker , G. , Lewis , I. , Albert , R. , Schmid , H.A. , Hoyer , D. , and Bruns , C. ( 2003 ) Nat. Rev. Drug Discov. , 2 , 999 – 1017 .
(b) Tyndall , J.D.A. , Pfeiffer , B. , Abbenante , G. , and Fairlie , D.P. ( 2005 ) Chem. Rev. , 105 , 793 – 826 .
(c) Blakeney , J.S. , Reid , R.C. , Le , G.T. , and Fairlie , D.P. ( 2007 ) Chem. Rev. , 107 , 2960 – 3041 .
5 (a) Neer , R.M. , Arnaud , C.D. , Zanchetta , J.R. , Prince , R. , Gaich , G.A. , Reginster , J. - Y. , Hodsman , A.B. , Eriksen , E.F. , Ish - Shalom , S. , Genant , H.K. , Wang , O. , and Mitlak , B.H. ( 2001 ) N. Engl. J. Med. , 344 , 1434 – 1441 .
(b) Fujino , M. , Fukuoka , T. , Shinagawa , S. , Kobayashi , S. , Yamaski , I. , Nakayama , R. , Seely , H. , White , W.F. , and Rippel , R.H. ( 1974 ) Biochem. Biophys. Res. Commun. , 60 , 406 – 413 .
(c) Hatanaka , C. , Obayashi , M. , Nishimura , O. , Toukai , N. , and Fujino , M. ( 1974 ) Biochem. Biophys. Res. Commun. , 60 , 1345 – 1350 .
(d) Hatanaka , C. , Abe , Y. , and Yamano , M. ( 2001 ) PCT Int. Appl. WO1997048726(A1) .
6 (a) Giannis , A. , and Kolter , T. ( 1993 ) Angew. Chem. Int. Ed. Engl. , 32 , 1244 – 1267 .
(b) Gante , J. ( 1994 ) Angew. Chem. Int. Ed. Engl. , 33 , 1699 – 1720 .
(c) Wu , Y. - D. , and Gellman , S. ( 2008 ) Acc. Chem. Res. , 41 , 1231 – 1232 .
7 (a) Roberts , N.A. , Martin , J.A. , Kinching-ton , D. , Broadhurst , A.V. , Craig , J.C. , Duncan , I.B. , Galphin , S.A. , Handa , B.K. , Krohn , A. , Lambert , R.W. , Merrett , J.H. , Mills , J.S. , Parkes , K.E.B. , Redshaw , S. , Ritchie , A.J. , Taylor , D.L. , Thomas , G.J. , and Machin , P.J. ( 1990 ) Science , 248 , 358 – 361 .
(b) Kempf , D.J. , Marsh , K.C. , Denissen , J.F. , McDonald , E. , Vasavanonda , S. , Flentge , C.A. , Green , B.E. , Fino , L. , Park , C.H. , Kong , X. - P. , Wideburg , N.E. , Saldivar , A. , Ruiz , L. , Kati , W.M. , Sham , H.L. , Robins , T. , Stewart , K.D. , Hsu , A. , Plattner , J.J. , Leonard , J.M. , and Norbeck , D.W. ( 1995 ) Proc. Natl. Acad. Sci. U. S. A. , 92 , 2484 – 2488 .
(c) Vacca , J.P. , Dorsey , B.D. , Schleif , W.A. , Levin , R.B. , McDaniel , S.L. ,
Darke , P.L. , Zugay , J. , Quintero , J.C. , Blahy , O.M. , and Roth , E. ( 1994 ) Proc. Natl. Acad. Sci. U. S. A. , 91 , 4096 – 4100 .
8 (a) Abe , H. ( 2007 ) Med. Chem. News , 17 ( 3 ), 18 – 22 .
(b) Kato , K. , Terauchi , J. , Suzuki , N. , and Takekawa , S. ( 2001 ) PCT Int. Appl. WO 2001025228(A1) .
(c) Abe , H. , Matsunaga , S. , Takekawa , S. , and Watanabe , M. ( 2004 ) PCT Int. Appl. WO 2004046107(A1) .
9 a) Sawai , Y. ( 2008 ) Process research of peptide mimetic compounds as diabetic drug candidate . Proceedings of The Eighteenth International Conference on Organic Process Research and Develop-ment, Montreal, Canada, June 23 – 26, 2008 ; (b) Sawai , Y. , Yamane , T. , Ikeuchi , M. , Kawaguchi , S. , Yamada , M. , and Yamano , M. Org. Process Res. Dev. , submitted for publication; (c) Sawai , Y. , Mizuno , M. , Ito , T. , Kawakami , J. , and Yamano , M. ( 2009 ) Tetrahedron , 65 , 7122 – 7128
10 Lian , Y. ( 2001 ) Rev. Adv. Drug Deliv. , 48 , 27 – 42 .
11 Welch , C.J. , Fleitz , F. , Antia , F. , Yehl , P. , Waters , R. , Ikemoto , N. , Armstrong , J.D. , III , and Mathre , D.J. ( 2004 ) Org. Process Res. Dev. , 8 , 186 – 191 .
12 (a) Carpino , L.A. ( 1987 ) Acc. Chem. Res. , 20 , 401 – 407 .
(b) Carpino , L.A. , Beyermann , M. , Wenschuh , H. , and Bienert , M. ( 1996 ) Acc. Chem. Res. , 29 , 268 – 274 .
13 (a) Ager , D.J. ( 2007 ) Process Chemistry in the Pharmaceutical Industry , vol. 2 (eds K. Gadamasetti and T. Braish ), CRC Press LLC , Boca Raton , pp. 157 – 176 .
(b) Ager , D.J. ( 2005 ) Handbook of Chiral Chemicals (ed. D.J. Ager ), CRC Press LLC , Boca Raton , pp. 11 – 27 .
(c) Kamphuis , J. , Meijer , E.M. , Boesten , W.H. , Sonke , T. , van den Tweel , W.J. , and Schoemaker , H.E. ( 1992 ) Ann. N. Y. Acad. Sci. , 672 , 510 – 527 .
(d) de Lange , B. , Boesten , W.H.J. , van der Sluis , M. , Uiterweerd , P.G.H. , Elsenberg , H.L.M. , Kellogg , R.M. , and Broxterman , Q.B. ( 2005 ) Handbook of Chiral Chemicals (ed. D.J. Ager ), CRC Press LLC , Boca Raton , pp. 487 – 502 .
(e) Blaser , H. - U. , and Schmidt , E. ( 2004 ) Asymmetric Catalysis on Industrial Scale

References 195
(eds U. Blaser and E. Schmidt ), Wiley - VCH Verlag GmbH , Weinheim , pp. 1 – 15 .
(f) Nozaki , H. , Takenaka , Y. , Kira , I. , Watanabe , K. , and Yokozeki , K. ( 2005 ) J. Mol. Catal. B: Enzym , 32 , 213 – 218 .
(g) Martinez - Rodriguez , S. , Heras - Vazquez , F.J.L. , Clemente - Jimenez , J.M. , Mingorance - Cazorla , L. , and Rodriguez - Vico , F. ( 2002 ) Biotechnol. Prog. , 18 , 1201 – 1206 .
(h) Knowles , W.S. ( 1983 ) Acc. Chem. Res. , 16 , 106 – 112 .
(i) Roff , G.J. , Lloyd , R.C. , and Turner , N.J. ( 2004 ) J. Am. Chem. Soc. , 126 , 4098 – 4099 .
14 (a) Brands , K.M.J. , and Davies , A.J. ( 2006 ) Chem. Rev. , 106 , 2711 – 2733 .
(b) Anderson , N.G. ( 2005 ) Org. Process Res. Dev. , 9 , 800 – 813 .
(c) Dubrunfault , A.P. ( 1846 ) C. R. Acad. Sci. (Paris) , 23 , 38 .
(d) Brands , K.M.J. , Payack , J.F. , Rosen , J.D. , Nelson , T.D. , Candelario , A. , Huffman , M.A. , Zhao , M.M. , Li , J. , Craig , B. , Song , Z.J. , Tschaen , D.M. , Hansen , K. , Devine , P.N. , Pye , P.J. , Rossen , K. , Dormer , P.G. , Reamer , R.A. , Welch , C.J. , Mathre , D.J. , Tsou , N.N. , McNamara , J.M. , and Reider , P.J. ( 2003 ) J. Am. Chem. Soc. , 125 , 2129 – 2135 .
(e) Dunn , P.J. ( 2005 ) Org. Process Res. Dev. , 9 , 88 – 97 .
15 (a) Snyder , H.R. , and Matteson , D.S. ( 1957 ) J. Am. Chem. Soc. , 79 , 2217 – 2221 .
(b) Behforouz , M. , Zarrinmayeh , H. , Ogle , M.E. , Riehle , T.J. , and Bell , F.W. ( 1988 ) J. Het. Chem. , 25 , 1627 – 1632 .
(c) Nemes , C. , Jeannin , L. , Sapi , J. ,
Laronze , M. , Seghir , H. , Auge , F. , and Laronze , J. ( 2000 ) Tetrahedron , 56 , 5479 – 5492 .
(d) Corey , E.J. , Loh , T.P. , Roper , T.D. , Azimioara , M.D. , and Noe , M.C. ( 1992 ) J. Am. Chem. Soc. , 114 , 8290 – 8292 .
(e) Chakravarty , P.K. , Chen , M.H. , Nargung , R. , Patchett , A.A. , Tata , J.R. , Wu , M.T. , and Yang , L. ( 1997 ) PCT Int. Appl. WO 1997036873(A1) .
(f) Cyr , L.V. , Newton , M.G. , and Phillips , R.S. ( 1999 ) Bioorg. Med. Chem ., 7 , 1497 – 1503 .
(g) Boteju , L.W. , Wegner , K. , Qian , X. , and Hruby , V.J. ( 1994 ) Tetrahedron , 50 , 2391 – 2404 .
(h) Bruncko , M. , and Crich , D. ( 1994 ) J. Org. Chem. , 59 , 4239 – 4249 .
(i) Shapiro , G. , Buechler , D. , Marzi , M. , Schmidt , K. , and Gomez - Lor , B. ( 1995 ) J. Org. Chem. , 60 , 4978 – 4979 .
(j) Hoerrner , R.S. , Askin , D. , Volante , R.P. , and Reider , P.J. ( 1998 ) Tetrahedron Lett. , 39 , 3455 – 3458 .
(k) Han , G. , Lewis , A. , and Hruby , V.J. ( 2001 ) Tetrahedron Lett. , 42 , 4601 – 4603 .
16 (a) Kozma , D. ( 2002 ) CRC Handbook of Optical Resolutions via Diastereomeric Salt Formation , CRC Press LLC , Boca Raton .
(b) Astleford , B.A. , and Weigel , L.O. ( 1997 ) Chirality in Industry II (eds A.N. Collins , G.N. Sheldrake , and J. Crosby) , John Wiley & Sons, Ltd , Chichester , pp. 99 – 117 .
(c) Senuma , M. , Shibazaki , M. , Nishimoto , S. , Shibata , K. , Okamura , K. , and Date , T. ( 1989 ) Chem. Pharm. Bull. , 37 , 3204 – 3208 .

197
10 The Development of an Environmentally Sustainable Process for Radafaxine Trevor Grinter
10.1 Introduction
Bupropion ( 1 ) exhibits dual inhibition of norepinephrine and dopamine neuronal reuptake and is marketed as an antidepressant, Wellbutrin ® , and as an aid to smoking cessation, Zyban ® .
During the development and post commercialization, the metabolism of bupro-pion has been extensively investigated [1 – 3] , and it has been demonstrated that the molecule undergoes rapid and extensive metabolism in man as well as most laboratory animal models. The main products of human metabolism are the aryl morpholinols 2 and the amino alcohols 3 , as illustrated in Scheme 10.1 . Similar metabolites are reported for mice and dogs, whereas in rats the compound is metabolized primarily by acid cleavage of the side chain to generate acidic metabo-lites such as 3 - chlorobenzoic acid [4] . The exact role of the metabolites in the clini-cal profi le of bupropion is not fully understood [1, 5] . Reports by Suckow [6] that concentrations of the metabolites detected in human plasma are 100 times greater than those of residual bupropion (and also the reports of Ascher [7] , Cooper [8] , and Martin [9] ) suggest that arylmorpholinol 2 (Scheme 10.1 ) may contribute to the antidepressant activity/profi le of bupropion.
The principal human metabolite having been identifi ed as the aryl morpholinol 2 , subsequent analysis confi rmed that 2 was a mixture of ( S,S ) - and ( R,R ) - enan-tiomers, 2a and 2b respectively. Later studies confi rmed that the ( R,R ) - enantiomer 2b was the major metabolite; typically 90 – 95% compared to 5 – 10% of the ( S,S ) - enantiomer 2a (radafaxine free base), while the amino alcohol 3 was formed as an approximately 1 : 1 mix of the erythro and threo isomers.
Wellbutrin ® and Zyban ® are marketed as a racemic mixture of bupropion as its hydrochloride salt. However, over the past 15 years there has been an increasing trend to develop new drugs as single enantiomers. Several publications have dem-onstrated that the enantiomers of many chiral compounds have distinct pharma-cological profi les and the benefi ts in using a single enantiomer over the racemate
Green Chemistry in the Pharmaceutical Industry. Edited by Peter J. Dunn, Andrew S. Wells and Michael T. Williams© 2010 WILEY-VCH Verlag GmbH & Co. KGaA, WeinheimISBN: 978-3-527-32418-7
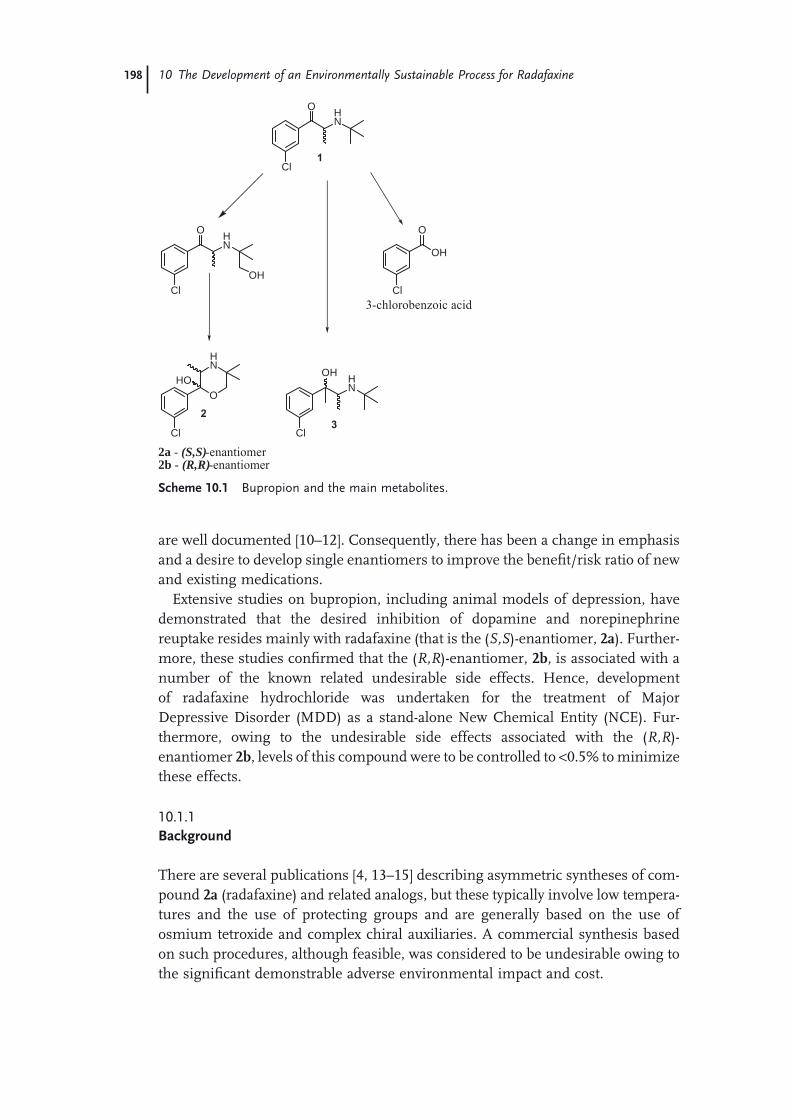
198 10 The Development of an Environmentally Sustainable Process for Radafaxine
are well documented [10 – 12] . Consequently, there has been a change in emphasis and a desire to develop single enantiomers to improve the benefi t/risk ratio of new and existing medications.
Extensive studies on bupropion, including animal models of depression, have demonstrated that the desired inhibition of dopamine and norepinephrine reuptake resides mainly with radafaxine (that is the ( S,S ) - enantiomer, 2a ). Further-more, these studies confi rmed that the ( R,R ) - enantiomer, 2b , is associated with a number of the known related undesirable side effects. Hence, development of radafaxine hydrochloride was undertaken for the treatment of Major Depressive Disorder ( MDD ) as a stand - alone New Chemical Entity ( NCE ). Fur-thermore, owing to the undesirable side effects associated with the ( R,R ) - enantiomer 2b , levels of this compound were to be controlled to < 0.5% to minimize these effects.
10.1.1 Background
There are several publications [4, 13 – 15] describing asymmetric syntheses of com-pound 2a (radafaxine) and related analogs, but these typically involve low tempera-tures and the use of protecting groups and are generally based on the use of osmium tetroxide and complex chiral auxiliaries. A commercial synthesis based on such procedures, although feasible, was considered to be undesirable owing to the signifi cant demonstrable adverse environmental impact and cost.
Cl
HN
O
1
Cl
HN
O
Cl
HN
OH
3
OH
O
HN
HO
Cl
2
2a - (S,S)-enantiomer2b - (R,R)-enantiomer
Cl
OH
O
3-chlorobenzoic acid
Scheme 10.1 Bupropion and the main metabolites.

10.2 Chemistry Process and the Dynamic Kinetic Resolution (DKR) 199
With the generally increasing concerns about the environment, chemical pollution, and green issues, GSK and other pharmaceutical and chemical compa-nies have made signifi cant efforts to incorporate sustainable business practices and procedures in the manufacture of Active Pharmaceutical Ingredient s ( API ) used in pharmaceutical products. This has placed greater emphasis on the role of the process chemist as they seek to discover commercially viable and environmentally sustainable processes for the manufacture of the new medicines.
There are several deliverables from process chemistry [16] , but perhaps the two most important are the rapid development of a supply route to the target molecule (necessary to meet the critical initial development requirements) and the discovery and development of a robust commercially viable route of synthesis (required to meet the demands of the patient population).
As radafaxine contains two asymmetric centers, there are four possible isomers, namely ( R,R ) - , ( R,S ) - , ( S,S ) - and ( S,R ) - . In - house knowledge on related molecules, computer modeling, and various calculations indicated that only two enantiomers, the ( S,S ) - and ( R,R ) - , that is compounds 2a and 2b , were likely to be formed and be stable under normal conditions. 1)
Following the decision to develop radafaxine as a potential NCE, the process chemistry team focused on identifying a supply route to deliver the initial develop-ment quantities of material and a manufacturing route based on the preparation and subsequent separation of a racemic mixture.
A racemic synthesis has implications for the project both from a chemical per-spective (where a highly effi cient process is required to ensure that suffi cient quantities of material can be synthesized at a reasonable cost and rate) and envi-ronmentally, as potentially there will be a signifi cant amount of waste and by - products generated.
It was appreciated for early development supplies that a process that produced 50% of the unwanted enantiomer with its associated adverse economic and envi-ronmental impacts was acceptable. However, for the medium and long term this issue would have to be addressed.
10.2 Chemistry Process and the Dynamic Kinetic Resolution ( DKR )
When a molecule is selected as a potential new drug and enters the development phase a key requirement is for the task of staff in Process Chemistry (Chemical Development) to quickly and safely prepare supplies of the compound to fund
1) It was postulated that the interactions between the bulky 3 - chlorophenyl group and the methyl substituents at C2 and C5 would generate signifi cantly higher energy conformations for the ( R,S ) - and ( S,R ) - enantiomers. Hence, steric constraints and
interactions associated with the 6 - membered ring system would strongly favour formation of only the ( S,S ) - and the ( R,R ) - enaniomers under the reaction conditions.
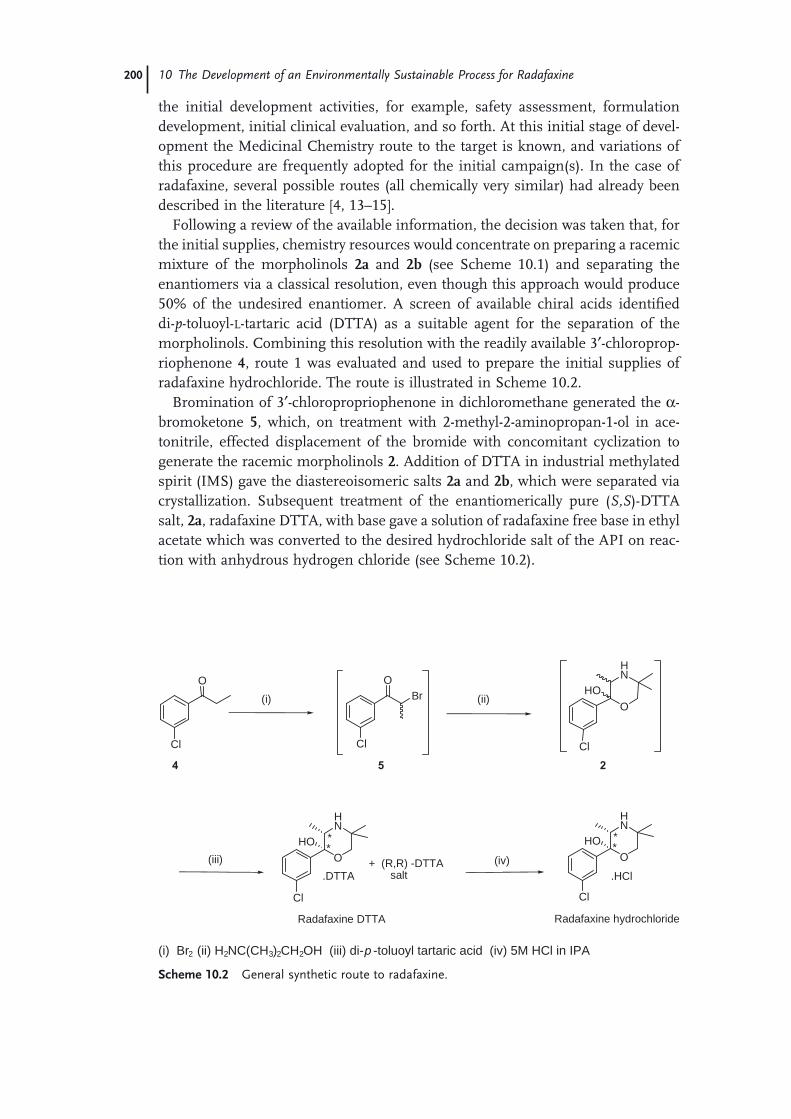
200 10 The Development of an Environmentally Sustainable Process for Radafaxine
the initial development activities, for example, safety assessment, formulation development, initial clinical evaluation, and so forth. At this initial stage of devel-opment the Medicinal Chemistry route to the target is known, and variations of this procedure are frequently adopted for the initial campaign(s). In the case of radafaxine, several possible routes (all chemically very similar) had already been described in the literature [4, 13 – 15] .
Following a review of the available information, the decision was taken that, for the initial supplies, chemistry resources would concentrate on preparing a racemic mixture of the morpholinols 2a and 2b (see Scheme 10.1 ) and separating the enantiomers via a classical resolution, even though this approach would produce 50% of the undesired enantiomer. A screen of available chiral acids identifi ed di - p - toluoyl - L - tartaric acid ( DTTA ) as a suitable agent for the separation of the morpholinols. Combining this resolution with the readily available 3 ′ - chloroprop-riophenone 4 , route 1 was evaluated and used to prepare the initial supplies of radafaxine hydrochloride. The route is illustrated in Scheme 10.2 .
Bromination of 3 ′ - chloropropriophenone in dichloromethane generated the α - bromoketone 5 , which, on treatment with 2 - methyl - 2 - aminopropan - 1 - ol in ace-tonitrile, effected displacement of the bromide with concomitant cyclization to generate the racemic morpholinols 2 . Addition of DTTA in industrial methylated spirit ( IMS ) gave the diastereoisomeric salts 2a and 2b , which were separated via crystallization. Subsequent treatment of the enantiomerically pure ( S,S ) - DTTA salt, 2a , radafaxine DTTA, with base gave a solution of radafaxine free base in ethyl acetate which was converted to the desired hydrochloride salt of the API on reac-tion with anhydrous hydrogen chloride (see Scheme 10.2 ).
Cl
O
HN
HO
Cl
BrO
Cl
O
Cl
O
HN
HO
Cl
O
HN
HO
4
Radafaxine hydrochlorideRadafaxine DTTA
**
**
25
+ (R,R) -DTTA salt
)ii()i(
(iii) (iv).HCl.DTTA
(i) Br2 (ii) H2NC(CH3)2CH2OH (iii) di-p -toluoyl tartaric acid (iv) 5M HCl in IPA
Scheme 10.2 General synthetic route to radafaxine.
10.2 Chemistry Process and the Dynamic Kinetic Resolution (DKR) 201
10.2.1 General Description of the Chemistry
Although the initial process, route 1, has only four stages and on paper looks a reasonable synthesis, the process had several chemical issues and could not be considered environmentally acceptable. For example, bromination of 3 ′ - chloropro-piophenone, although straightforward, did necessitate several base and aqueous washes to remove the hydrogen bromide by - product during the work - up and a change of solvent for the displacement reaction with 2 - methyl - 2 - aminopropan - 1 - ol. This resulted in a long and time - consuming procedure. Similarly, work - up of the stage 2 displacement reaction was exceedingly long, necessitating two solvent changes, numerous aqueous washes to remove the amine salts and excess amino alcohol, plus azeotropic drying of an ethyl acetate extract prior to a further change of solvent for the reaction with L - DTTA and the resolution. The issues are sum-marized below:
• A total of seven different solvents, including dichloromethane and acetonitrile, were used throughout the process, necessitating numerous time - consuming solvent exchanges – especially during the workup of the racemic morpholinols 2 .
• Numerous water and/or brine washes were included; this generated signifi cant aqueous waste and was time - consuming.
• Several stages required anhydrous conditions and hence prolonged azeotropic drying of solutions. For example, the resolution required strictly anhydrous conditions to avoid decomposition of the morpholinol.
• To avoid formation of a 2 : 1 amine - to - acid salt during the resolution of compound 2, a large excess (1.84 equivs.) of the expensive resolving agent, L - DTTA was required. 2)
• The solid - state form of the resolved salt (radafaxine DTTA) was poor, giving rise to long isolation times and consequently poor throughput.
• The hydrochloride salt of 2a (radafaxine hydrochloride), when initially isolated, contained high levels of residual solvent that could not be removed on drying. This required an extra purifi cation stage, reducing yield and adding time to the process.
• Overall the process was very lengthy and produced radafaxine in only 17% overall yield.
• In addition, for cost and environmental reasons, the L - DTTA had to be recovered and recycled. A procedure was available but it was lengthy and ineffi cient,
2) The 2 : 1 salt is extremely insoluble and is formed as a mixture of all possible enantiomeric combinations, that is two ( S,S ) - units, two ( R,R ) - units and an ( S,S ) - and ( R,R ) - unit, generating material of low chiral purity.

202 10 The Development of an Environmentally Sustainable Process for Radafaxine
requiring large quantities of solvent, numerous solvent and water washes, plus extended drying times.
Although route 1 was not ideal it was used to deliver the critical early supplies and allowed the necessary development activities to commence. Having established a procedure for preparing supplies, laboratory investigations on improving the syn-thesis could be undertaken. Key considerations were to ensure that the synthesis was capable of delivering the estimated peak annual volumes (the initial estimate was approximately 100 tonnes per year) and to address the environmental effects of (i) potentially discarding the unwanted isomer and (ii) recovering and recycling the large amounts of L - DTTA.
10.2.2 Route 2
The development of route 2 incorporated signifi cant improvements addressing many of the issues identifi ed in route 1. The chemistry was principally performed in a single solvent, ethyl acetate. This avoided the use of the dichloromethane and acetonitrile, and, in addition, the number and volume of the washes were reduced. Investigative work had identifi ed an improved crystallization and isolation proce-dure for the API, radafaxine hydrochloride, that generated the drug substance without contamination with any residual solvent. This avoided the requirement for the extra recrystallization step (involving loss of compound) and saved the costs associated with the extra processing step. Although incorporation of these improve-ments resulted in an overall yield of ∼ 31% compared with 17% for route 1 there were still some problems to address:
• It was established that the morpholinols 2 were susceptible to decomposition when treated with excess acid. This partially explained the poor solid - state form of the product and the diffi culties experienced during isolation of radafaxine DTTA during the fi rst plant campaign.
• Isolation of radafaxine DTTA was still problematic and time consuming.
• Large quantities of ( L ) - DTTA were still required, (7.5 – 10 kg of DTTA per kg of radafaxine) to effect the separation of the enantiomers.
• An improved process for the recovery and recycle of L - DTTA was still a prerequisite for both environmental and cost reasons.
10.2.3 Route 3
Dynamic Kinetic Resolution s ( DKR ) are documented in the chemical literature [17, 18] , and it was envisaged that such a system was, in theory, possible with the aryl - substituted morpholinols 2 . The morpholinol ring system may exist, in part, as the open chain hydroxyl ketone (see Scheme 10.1 ), and it has been reported [19,

10.2 Chemistry Process and the Dynamic Kinetic Resolution (DKR) 203
20] that aminoketones similar to bupropion could be racemized and/or undergo decomposition on treatment with strong acids. As part of on - going investigations into improving the isolation of the radafaxine DTTA 2a and minimizing decom-position of the morpholinol ring system during the salt resolution, the possibility of effecting a DKR of the racemic mixture of enantiomers 2 was integrated into the work plans.
A proven procedure for improving the solid - state form of compounds is to incorporate a ripening procedure. By applying a cycle of heating and cooling to the suspension it is often possible to improve the particle size and form of a given molecule. The technique is based on the fact that particles have different solubili-ties based on their size when present in a suspension. The difference in solubility results in small particles dissolving when heat is applied to the system and sub-sequently depositing on the larger particles during the cooling phase. The overall effect is to decrease the surface area of the particles and move the system toward a minimum Gibbs free energy, resulting in an increase in the average crystal size.
Microscopy of the initially formed radafaxine DTTA salt indicated that the ‘ crys-tals ’ were agglomerated spherulites (see Figure 10.1 ) and were extremely com-pressible. However, submitting a suspension of the racemic DTTA salts 2a, 2b in IMS to a repeated cycle of heating and cooling had a dramatic effect on crystal form and size. Microscopy of the resulting crystals confi rmed that the crystals were now regular and columnar (see Figure 10.2 ).
The change in form following the ripening process signifi cantly improved the isolation of the product, reducing the isolation time to < 3 h. Detailed analysis of the isolated material confi rmed that the product was still a 1 : 1 salt of high chemi-cal purity, and, more signifi cantly, the enantiomeric ratio had changed – ( S,S ) - : ( R,R ) - ratio ∼ 60 : 40 compared with 50 : 50. Continued evaluation and development
Figure 10.1 Prior to ripening.

204 10 The Development of an Environmentally Sustainable Process for Radafaxine
0
5
10
15
20
25
30
35
0 50 100 150 200 250 300 350
Time (mins)
% R
adaf
axin
e
%(S,S)
Figure 10.3 Conversion of 2b into radafaxine.
confi rmed that treatment of the pure ( R,R ) - enantiomer 2b with ( L ) - DTTA in boiling IMS did indeed effect conversion to the desired ( S,S ) - enantiomer, that is radafax-ine (see Figure 10.3 ). These results were important in confi rming the hypothesis that under acid conditions it should be possible to effect a dynamic resolution of the morpholinols 2 . Unfortunately the recovery of pure DTTA salt after the ripen-ing was only modest ( ∼ 60%), the low recovery being due, in part, to decomposition of the morpholinols under the reaction conditions – a result confi rming the previ-ous fi ndings that solutions of the racemic morpholinols 2 in alcohol are unstable under acidic conditions. This instability had been an issue during the route 1 synthesis and partially explained the rationale for using ethyl acetate with minimal amounts of IMS for the resolution in route 2.
Figure 10.2 Post ripening.

10.2 Chemistry Process and the Dynamic Kinetic Resolution (DKR) 205
Thus, the result of the ripening studies was that the particle size and form of the molecule could be improved, but, more importantly, the basis of a DKR was established. However, under the reaction conditions (excess acid and alcohol as solvent) that had been examined, decomposition of the morpholinols 2 was a competing pathway. A kinetic study established that the racemization (that is ring opening – ring closure) was a relatively slow process, t ½ ≈ 4 h, and that the rate of decomposition, although slower, was a competing process. Having established the viability of a DKR, the problem was to identify appropriate reaction conditions that would eliminate, or at least minimize, decomposition. Solubility studies on the pure ( S,S ) - and ( R,R ) - DTTA salts combined with further investigations led to the discovery of a process incorporating a DKR.
Solvent screening had shown that the ( L ) - DTTA salt of radafaxine 2a was vir-tually insoluble in ethyl acetate, whereas the undesired ( L ) - DTTA salt of the ( R,R ) compound 2b was completely soluble in the same solvent. In addition, it was demonstrated that the ( L ) - DDTA salts of compounds 2a and 2b were stable in ethyl acetate, even after prolonged heating over many hours. After confi rma-tion that the DKR could be effected in boiling ethyl acetate, a kinetic study con-fi rmed a t ½ of ∼ 4 h for the resolution in boiling ethyl acetate. Combining all of the available data gave a fi nal process of adding the racemic mixture 2 to an ethyl acetate solution of ( L ) - DTTA and heating the resulting solution under refl ux for ∼ 14 h (illustrated in Scheme 10.3 ). This procedure facilitated a very effi cient conversion to the desired pure radafaxine DTTA salt, which was iso-lated via fi ltration after cooling.
Cl
O
HN
HO
Cl
O
HN
HO **
.DTTA
L-DTTA
ethyl acetate reflux
2 Radafaxine.DTTA
Scheme 10.3 Dynamic kinetic resolution, route 3.
The result of these studies provided a procedure for effectively doubling the reaction yield and improving the crystal form of the key intermediate, leading to an increase in the overall yield and productivity.
Route 3 had addressed many of the problems associated with the previous routes; it avoided the potential 50% loss of the unwanted enantiomer, produced radafaxine in an overall yield of 64% from 3 ′ - chloropropriophenone (an increase of nearly 400%), dramatically improved the throughput, reduced cost, and had a signifi cantly lower environmental impact. Two key issues remained: large quanti-ties of DTTA were still required to effect the DKR and the recovery and re - use of the DTTA.
206 10 The Development of an Environmentally Sustainable Process for Radafaxine
The discovery and development of route 3 met all of the pre - determined criteria (quality, robustness, safety, cost) and was signifi cantly more environmentally acceptable than route 1. The chemistry was carried out predominantly in a single solvent, ethyl acetate, thereby improving the viability and ease of recovery and re - use of the solvent. Overall, route 3 offered several cost benefi ts owing to a reduc-tion in solvent (down from a total of 232 kg/kg of API for route 1 to ∼ 54 kg/kg of API ) mass intensity, reduced by ∼ 75% compared to route 1. A more detailed environmental assessment of the chemistry is given in Section 10.4 .
10.3 Multicolumn Chromatography – Development of Route 4
With a supply route established (route 2) and supplies of radafaxine available to fund the initial development activities, focus switched to discovering a more effi -cient synthesis. Environmental considerations were a key consideration, and a dual program of work was initiated to address these concerns. One approach was to investigate the feasibility of identifying a Dynamic Resolution to avoid the losses associated with the undesired ( R,R ) - enantiomer, discussed above, while, in paral-lel, the viability of employing continuous chromatography to separate the enanti-omers was examined.
The use of continuous counter - current chromatography was fi rst proposed and demonstrated in 1940 and subsequently introduced as a production tool in the petrochemical and sugar industries as Simulated Moving Bed ( SMB ) chromatog-raphy in the late 1950s. As SMB is a continuous process, the production rate is generally very high, with the system requiring minimal supervision and interven-tion once the unit has achieved steady - state operating conditions. This technique is now more commonly referred to as Multi Column Chromatography ( MCC ), and the two largest - volume applications are the separation of the xylene isomers ( ∼ 1 000 000 t/y per system) and the purifi cation of beet molasses to give fructose and sucrose ( ∼ 150 000 t/y per system) [21] .
Although widely used in the petrochemical and fi ne chemical sectors, the use of MCC for pharmaceutical production has been limited. However, over the past 10 years there has been a steady increase in the use of MCC in the pharmaceutical industry with several companies using the technology during the initial develop-ment phase. The fi rst commercial use of MCC in the pharmaceutial sector was in August 2002 following the Food and Drug Administration ( FDA ) approval of a new process to manufacture the antidepressent sertraline ® . The approval and subsequent commercialization of this chemistry confi rmed the viability of continuous chromatography for pharmaceutical production. The desired (S,S) - enantiomer was produced on a multi - tonne scale.
Based on information available in the public domain, about twelve commercial MCC systems with column diameters ranging from 20 to 100 cm have been installed worldwide since 1997. In 2005 it was estimated that the largest units used in the pharmaceutical industry were processing up to 200 tonnes of material

10.3 Multicolumn Chromatography – Development of Route 4 207
per year [22] and the total installed continuous chromatography capacity was ∼ 1200 t/y.
Although MCC is a chromatographically based technique, the process is gener-ally considered to be environmentally friendly, as high production rates are pos-sible, solvent loss is minimal (it is recovered during product isolation and recycled back into the system), and the silica - based stationary phase is reported to last at least 3 – 4 years.
A schematic diagram of an MCC unit is shown in Figure 10.4 . The theory and application of MCC is further expanded in Section 12.3.2 .
It was envisaged that MCC would address several of the issues associated with the chemistry, for example:
• Obviate the need to use large quantities of DTTA. • Avoid the recovery of the DTTA and the attendant activities with the use of
recovered material for commercial production.
RAFFINATEEXTRACT
MCC SUITE
Falling FilmRAFFINATE
Falling Film
EXTRACT
ELUENT TANK
NAUTA DRYER
NAUTA DRYER
FEEDTANKS
MAKE-UPTANK
Concentrated EXTRACT
Concentrated RAFFINATE
ELUENTMake-up
FEED
F I L T E R
Schematic provided and reproduced with the permission of Olivier Dapremont (Ampac Fine Chemicals LLC)
Figure 10.4 Schematic of multi column chromatography unit.

208 10 The Development of an Environmentally Sustainable Process for Radafaxine
• Avoid the waste streams associated with liberating the radafaxine free base prior to hydrochloride salt formation.
• Improve the production rate. • Save time, solvent and analytical resource, by avoiding the necessity for the
decontamination of several reactors. • In addition, it was thought that there may be environmental benefi ts.
From an initial investigation of possible stationary phases and solvent combina-tions the use of Chiralpak AD as the chiral stationary phase ( CSP ) with 100% acetonitrile as eluent was selected for further studies. Under these conditions the desired ( S,S ) - enantiomer was the fi rst eluting peak in ∼ 3.8 min, known as the raffi nate, with an α value (degree of separation) of ∼ 1.5 and good peak shape. The solubility of the racemate in acetonitrile is ∼ 25 g/L, which is acceptable for a pharmaceutical MCC application. Laboratory experiments confi rmed that the race-mate and single enantiomers were stable during the separation and isolation conditions, and therefore a small scale separation was undertaken. With a ca. 90% recovery of the available ( S,S ) - enantiomer 2a (radafaxine free base), and the iso-lated material meeting all of the quality criteria, the initial evaluation confi rmed that MCC should be a viable technique for the separation of the enantiomers. The combination of Chiralpak AD as CSP with acetonitrile as eluent is good, as the use of a single mobile phase helps to simplify recycling of solvent, and there are industry precedents suggesting that such a combination should allow for the CSP to be used for at least 3 – 4 years providing there is control of the quality of the feed solution and the mobile phase. 3) To ensure a robust and reliable separation in MCC it is important to maintain a consistent quality of the input feed. Minor vari-ations in the number and/or levels of impurities can affect the separation and lead to a loss of purity. For the separation of racemate 2 it was established that the input material must be greater than 98.5% pure with no single impurity > 0.15%. This criteria was routinely achieved by isolation of racemate 2 by crystallization from heptane.
Using the data generated from the initial work, various simulation packages indicated that a productivity of ∼ 1.5 kg racemate per kg of CSP per day would be achievable. In MCC, productivity is associated with many aspects, perhaps the main consideration being the link between the desired purity of the product and productivity. Although a separation of 1.5 kg per day was possible with the initial criteria ( ≥ 99.5% purity and ≥ 96% recovery), if a lower purity specifi cation of 97.5% could be accepted the productivity would increase by ∼ 25% to 2.2 kg racemate per kg of CSP per day (Table 10.1 ). It is worth noting that as the productivity of the MCC separation increases the amount of solvent required would decrease; for example, obtaining a purity of ∼ 98% as opposed to > 99.5% would increase the productivity by ∼ 50% and reduce solvent consumption by 23%. However, to achieve the higher production rate would necessitate introducing an upgrade (recrystallization) in the subsequent downstream processing to ensure that the radafaxine met the overall quality criteria necessary for the API.
3) Private discussions at ‘ MCC User ’ s Group Meetings ’ and with Stationary Phase suppliers.

10.3 Multicolumn Chromatography – Development of Route 4 209
This type of approach has been described by Loren z [23] , who demonstrated the potential for improving MCC throughput by coupling crystallization to the MCC separation. In the case of radafaxine it was established that there is a eutectic at 0.85 (see Figure 10.5 ) and mixtures ≥ than this value result in crystallization of pure ( S,S ) - enantiomer. For example, if an initially lower raffi nate purity ( ∼ 95%) is obtained from the MCC and this is followed by crystallization during isolation it is possible to obtain material that is 99.5% pure.
While establishing the phase diagram illustrated in Figure 10.5 , on - going devel-opment work on the chromatography demonstrated that the α value could be signifi cantly improved by using a mixed solvent system of isopropanol ( IPA ) in acetonitrile. The use of 2 – 5% IPA in acetonitrile as eluent resulted in improved selectivity for the separation of racemate 2 while still retaining good peak shape. With the optimum amount of IPA being 3% ( α value 2.2 compared with 1.5 for 100% acetonitrile, see Figure 10.6 ) and a reasonable range for the amount of IPA (that is 2 – 5%) the indications were that such a separation would be robust.
An added benefi t of the mixed IPA/acetonitrile solvent system is that the race-mate 2 was more soluble in this medium, with the overall result that the produc-tivity doubled to a maximum of ∼ 4.6 kg racemate per kg of CSP per day with eluent consumption decreasing to 270 L/day. Furthermore, the fi ndings described above of combining crystallization with the chromatography could also be applied to this eluent combination.
Table 10.1 Correlation between desired purity, recovery, and productivity.
Purity (%) Recovery (%) Productivity (kg/kg/day) Eluent consumption (L/kg)
99.6 96.2 1.63 378 99.1 96.5 2.04 313 97.8 97.3 2.24 289
112
114
116
118
120
122
0 0,2 0,4 0,6 0,8 1
Molar fraction
Tem
pera
ture
(°C
)
Figure 10.5 Phase diagram for 2 (i.e., the mixture of enantiomers 2a and 2b ).
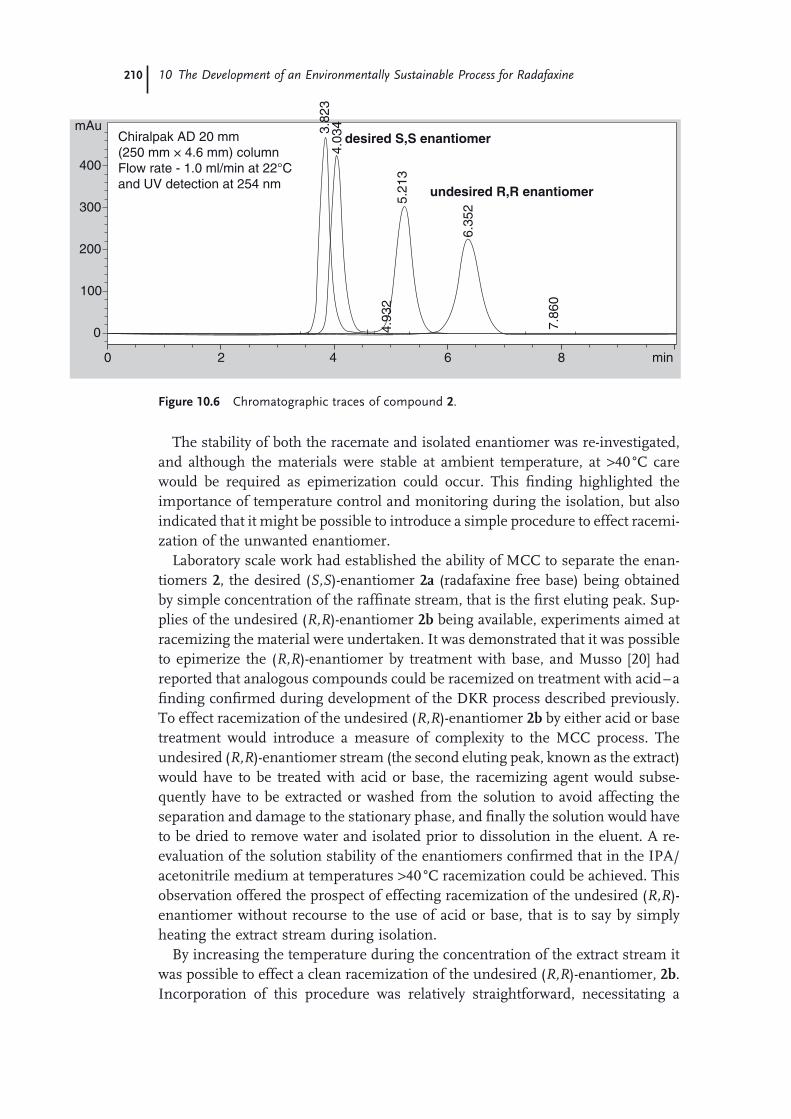
210 10 The Development of an Environmentally Sustainable Process for Radafaxine
The stability of both the racemate and isolated enantiomer was re - investigated, and although the materials were stable at ambient temperature, at > 40 ° C care would be required as epimerization could occur. This fi nding highlighted the importance of temperature control and monitoring during the isolation, but also indicated that it might be possible to introduce a simple procedure to effect racemi-zation of the unwanted enantiomer.
Laboratory scale work had established the ability of MCC to separate the enan-tiomers 2 , the desired ( S,S ) - enantiomer 2a (radafaxine free base) being obtained by simple concentration of the raffi nate stream, that is the fi rst eluting peak. Sup-plies of the undesired ( R,R ) - enantiomer 2b being available, experiments aimed at racemizing the material were undertaken. It was demonstrated that it was possible to epimerize the ( R,R ) - enantiomer by treatment with base, and Musso [20] had reported that analogous compounds could be racemized on treatment with acid – a fi nding confi rmed during development of the DKR process described previously. To effect racemization of the undesired ( R,R ) - enantiomer 2b by either acid or base treatment would introduce a measure of complexity to the MCC process. The undesired ( R,R ) - enantiomer stream (the second eluting peak, known as the extract) would have to be treated with acid or base, the racemizing agent would subse-quently have to be extracted or washed from the solution to avoid affecting the separation and damage to the stationary phase, and fi nally the solution would have to be dried to remove water and isolated prior to dissolution in the eluent. A re - evaluation of the solution stability of the enantiomers confi rmed that in the IPA/acetonitrile medium at temperatures > 40 ° C racemization could be achieved. This observation offered the prospect of effecting racemization of the undesired ( R,R ) - enantiomer without recourse to the use of acid or base, that is to say by simply heating the extract stream during isolation.
By increasing the temperature during the concentration of the extract stream it was possible to effect a clean racemization of the undesired ( R,R ) - enantiomer, 2b . Incorporation of this procedure was relatively straightforward, necessitating a
mAu
400
Chiralpak AD 20 mm (250 mm × 4.6 mm) columnFlow rate - 1.0 ml/min at 22°C and UV detection at 254 nm
desired S,S enantiomer
undesired R,R enantiomer
3.82
34.
034
5.21
34.
932
6.35
2
7.86
0
300
2 4 6 8 min0
200
100
0
Figure 10.6 Chromatographic traces of compound 2 .

10.3 Multicolumn Chromatography – Development of Route 4 211
minor modifi cation to the concentration and isolation procedure. Following the concentration and racemization of the ( R,R ) - enantiomer, this generated ‘ fresh ’ feed for the MCC separation which could be mixed with more racemate or proc-essed separately. By incorporation of the racemization process it was possible (in theory after three cycles) to obtain a > 90% yield of radafaxine free base 2a from the initial 50 : 50 mixture. In practice the racemized material is mixed with fresh racemate and not processed separately.
The overall process, illustrated in Scheme 10.4 , intercepts the racemate ( 2 ) by crystallization from heptane. After separation of the enantiomers using the MCC process, the radafaxine free base is converted to the desired salt directly on treat-ment with anhydrous HCl. Any mixed fractions from the MCC separation are combined with the epimerized ( R,R ) - enantiomer and fresh racemate for process-ing, hence generating further radafaxine free base for conversion to the hydrochlo-ride salt. These results were subsequently confi rmed in a Proof of Concept study performed on the medium - to large - scale in - house MCC equipment prior to scale - up.
Cl
O
HN
HO
Cl
BrO
Cl
O
Cl
O
HN
HO
Cl
O
HN
HO
4
Radafaxine hydrochlorideRadafaxine free base
**
**
25
)ii()i(
(iii) (iv)
.HCl
(i) Br2, 50°C (ii) H2NC(CH3)2CH2OH, EtOAc, reflux, heptane (iii) Chiralpak ADTM, CH3CN – IPA (iv) 5M HCl in IPA, EtOAc
Scheme 10.4 Synthesis of radafaxine, route 4.
Data from the evaluation and Proof of Concept studies indicated that the antici-pated process benefi ts could be realized, and, with the inclusion of the racemiza-tion process, the expected environmental benefi ts could also be achieved. For example, this procedure avoided the use and recovery of DTTA, the desired ( S,S ) - enantiomer could be isolated in > 90% yield, and a productivity of ∼ 5 kg of racemate per kg of CSP per day could be achieved (an above - average value for MCC). Solvent recovery and re - use for the MCC was predicted to be > 99.5%, and the only solid waste would be the spent/exhausted CSP.
To achieve a radafaxine production of 50 t/y would require an MCC unit contain-ing approximately 100 kg of CSP. Assuming the CSP lasts for a minimum of 3

212 10 The Development of an Environmentally Sustainable Process for Radafaxine
years, then 1 kg of CSP will be used in the production of 1500 kg of radafaxine. Thus, in essence there is no solid waste from the resolution process; the undesired enantiomer is racemized and the contribution from the CSP is < 1 g per kg of API.
Continued development and scale - up confi rmed that the recovery, racemization, and quality criteria could all be met from the use of the MCC approach to radafaxine.
10.4 Environmental Assessment
An awareness of the potential impact that manufacturing processes may have on the environment has become a major, and increasing, factor of concern for society. Much debate and discussion has been focused on the chemical industry, especially the pharmaceutical sector. The main focus of the criticism is the high E factor (environmental factor), defi ned as kg of waste per kg of desired product [24] , for pharmaceutical processes when compared to other parts of the chemical industry. A high E factor is indicative of ineffi cient processes that generate large amounts of waste, increase the cost of medicines, and have a negative effect on the environ-ment. The concept of Green Chemistry has been defi ned and interpreted in many ways depending on the particular area of chemistry in which one is employed or interested. Tucker [25] summarized the concept of Green Chemistry from a phar-maceutical perspective as ‘ The quest for benign synthetic processes that reduce the environmental burden within the context of enabling the delivery of our current standard of living ’ . It is within the context of this defi nition and the Twelve Principles of Green Chemistry [26] that this work was undertaken.
The result of all of the process development was that two possible routes for the synthesis of radafaxine (that is route 3 based on the DKR and route 4 based on the MCC separation of the morpholinol enantiomers 2 ) have been identifi ed and verifi ed at scale. Both routes met all of the pre - determined criteria; they produced API that met the quality criteria, gave acceptable production rates, and achieved the desired cost of goods. As both procedures were acceptable it was not obvious which route to further optimize and use for commercial production. Both proc-esses had advantages, but, more importantly, both had some disadvantages. For example, route 3 utilized several vessels (high vessel occupancy and signifi cant burden for cleaning and decontamination at the conclusion of processing, espe-cially analytically), whereas capital investment for introducing the MCC process was higher than that of route 3, and the company had limited experience of MCC from a commercial production standpoint and from a regulatory perspective.
With both procedures meeting the quality and cost criteria, an extensive evalu-ation of the environmental aspects of both routes was undertaken. In addition to the standard data obtained from mass balance analysis (that is comparing the input and output of reagents, products, by - products and process waste streams), a range of different measures and metrics were determined including energy consumption data, environmental impacts (such as generation of greenhouse gases and effect on ozone layer), plus data from several in - house programmes.
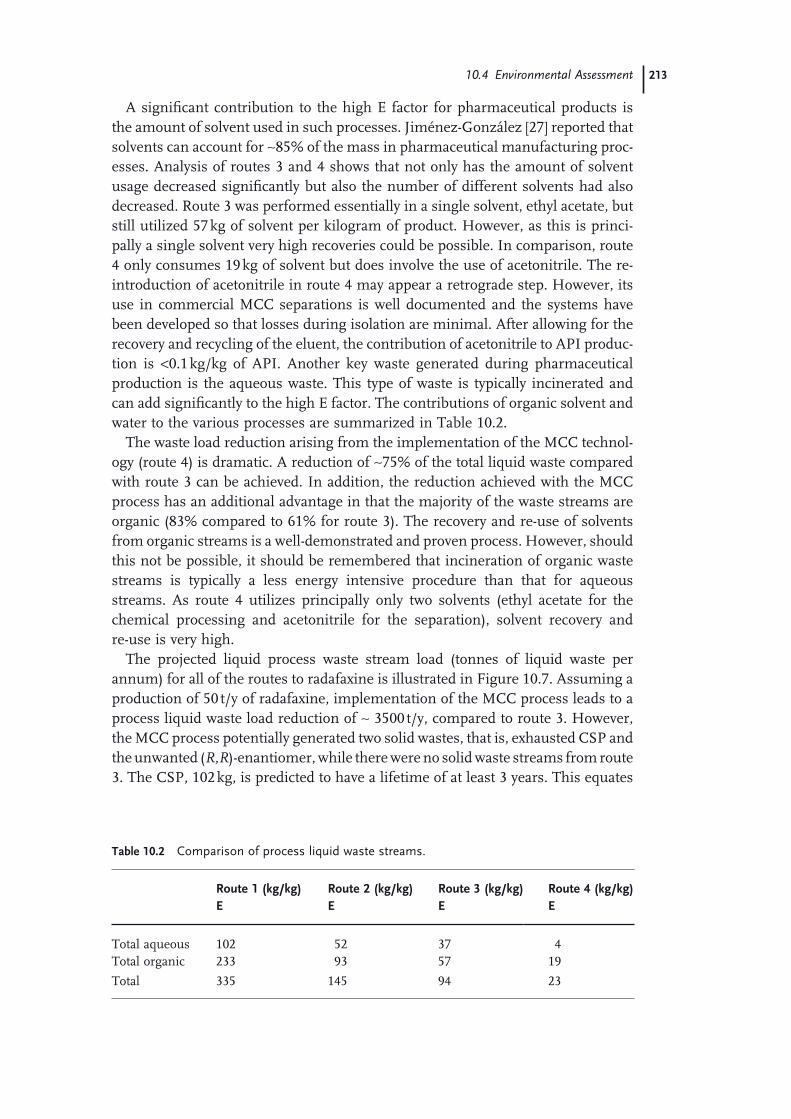
10.4 Environmental Assessment 213
A signifi cant contribution to the high E factor for pharmaceutical products is the amount of solvent used in such processes. Jim é nez - Gonz á lez [27] reported that solvents can account for ∼ 85% of the mass in pharmaceutical manufacturing proc-esses. Analysis of routes 3 and 4 shows that not only has the amount of solvent usage decreased signifi cantly but also the number of different solvents had also decreased. Route 3 was performed essentially in a single solvent, ethyl acetate, but still utilized 57 kg of solvent per kilogram of product. However, as this is princi-pally a single solvent very high recoveries could be possible. In comparison, route 4 only consumes 19 kg of solvent but does involve the use of acetonitrile. The re - introduction of acetonitrile in route 4 may appear a retrograde step. However, its use in commercial MCC separations is well documented and the systems have been developed so that losses during isolation are minimal. After allowing for the recovery and recycling of the eluent, the contribution of acetonitrile to API produc-tion is < 0.1 kg/kg of API. Another key waste generated during pharmaceutical production is the aqueous waste. This type of waste is typically incinerated and can add signifi cantly to the high E factor. The contributions of organic solvent and water to the various processes are summarized in Table 10.2 .
The waste load reduction arising from the implementation of the MCC technol-ogy (route 4) is dramatic. A reduction of ∼ 75% of the total liquid waste compared with route 3 can be achieved. In addition, the reduction achieved with the MCC process has an additional advantage in that the majority of the waste streams are organic (83% compared to 61% for route 3). The recovery and re - use of solvents from organic streams is a well - demonstrated and proven process. However, should this not be possible, it should be remembered that incineration of organic waste streams is typically a less energy intensive procedure than that for aqueous streams. As route 4 utilizes principally only two solvents (ethyl acetate for the chemical processing and acetonitrile for the separation), solvent recovery and re - use is very high.
The projected liquid process waste stream load (tonnes of liquid waste per annum) for all of the routes to radafaxine is illustrated in Figure 10.7 . Assuming a production of 50 t/y of radafaxine, implementation of the MCC process leads to a process liquid waste load reduction of ∼ 3500 t/y, compared to route 3. However, the MCC process potentially generated two solid wastes, that is, exhausted CSP and the unwanted ( R,R ) - enantiomer, while there were no solid waste streams from route 3. The CSP, 102 kg, is predicted to have a lifetime of at least 3 years. This equates
Table 10.2 Comparison of process liquid waste streams.
Route 1 (kg/kg) E
Route 2 (kg/kg) E
Route 3 (kg/kg) E
Route 4 (kg/kg) E
Total aqueous 102 52 37 4 Total organic 233 93 57 19
Total 335 145 94 23

214 10 The Development of an Environmentally Sustainable Process for Radafaxine
0
200
400
600
800
1000
1200
1400
1600
1800
0 10 20 30 40 50 60
Radafaxine Production (MT)
Liqu
id W
aste
(ton
nes)
Route 1
Route 2
Route 3
Route 4
Figure 10.7 Projected process waste stream load for radafaxine production.
to a waste load index of approximately 0.8 g/kg of radafaxine hydrochloride. The waste load index for the ( R,R ) - enantiomer would be ∼ 1.0 kg per kg of radafaxine; however, incorporation of the racemization of the undesired ( R,R ) - enantiomer during isolation regenerates ‘ fresh ’ feed for the MCC, thereby effectively reducing the process solid waste to the CSP only, that is 0.8 g/kg of radafaxine.
10.4.1 Life Cycle Metrics
Analysis of the solid and liquid process waste streams clearly indicates that the MCC process offers environmental benefi ts compared with the chemical resolu-tion procedure. To generate data for the cradle - to - grave emissions and impacts, a streamlined life cycle assessment of all of the processes was performed using the Fast Lifecycle Assessment for Synthetic Chemistry, FLASC TM .
To assist GSK chemists in assessing various routes to a target molecule, FLASC TM [28] , an in - house computer program, was developed. FLASC TM is an internet - based tool that uses a holistic and systematic life cycle approach to evaluate the environ-mental consequences of new or existing processes based on the materials used in the process. The methodology quantifi es the energy required for the manufacture of the raw materials, the mass used in their manufacture, the emissions released, and the potential environmental impacts. This approach not only provides a com-parison of routes to a target molecule but facilitates benchmarking of commercial processes, offers a system for measuring progress to sustainability, and helps to communicate complicated issues simply. The FLASC TM score has been validated. It gives good correlation with process economics and aids in the identifi cation of

10.4 Environmental Assessment 215
critical issues for the pharmaceutical industry and opportunities to improve process effi ciencies. The main outputs from FLASC TM are reaction mass effi ciency ( RME , see Section 2.4 ) , mass intensity (the total mass required to produce 1 kg of product), a FLASC TM rating (a measure of the life cycle environmental impact of the materials used in the process), and a solvent acceptability score, which is a quantitative measure of the EHS impacts associated with the solvents used in the process.
The data generated by FLASC on the four routes to radafaxine were supported and confi rmed by independent analysis of process waste streams, and are sum-marized in Table 10.3 and Figure 10.7 .
The data clearly indicated that the use of route 4 for the synthesis of radafaxine had several advantages, for example, lower Mass Intensity and greater Mass Effi -ciency, in comparison to the DKR procedure, route 3.
With the data indicating route 4 to be the preferred route of manufacture, an evaluation of the potential environmental benefi ts of MCC was undertaken. This comparison of routes 3 and 4 would supplement the Life Cycle data generated by FLASC TM . The process energy, that is, energy in converting raw materials into API, for the main routes was calculated using the standard energy requirement equa-tions reported previously in GSK ’ s Green Technology Methodology [29] . In these calculations it is assumed that the electricity requirements for pumping and vacuum services are negligible in comparison to the heating and cooling require-ments. Energy for the incineration of all process waste streams was also consid-ered as, although this is a worst - case scenario for waste disposal, its likelihood of occurring would be relatively high in the early years of manufacture. In addition, the potential environmental impacts of the processes were estimated.
Analysis of the calculations confi rms that route 4 requires around 2.5 times more process energy than route 3 (line 3, Table 10.4 ). The majority of the energy required by this process was due to the continual solvent recovery operations. In MCC systems the product is isolated by the use of falling fi lm evaporators, with the recovered solvent fed directly back into the system as fresh eluent. However, when assessing the life cycle energy requirements, that is, the summation of the FLASC TM incineration and process energy (representing the total cradle - to - grave
Table 10.3 FLASC TM comparison.
Route RME (%) Mass intensity (kg/kg)
Mass effi ciency (%)
FLASC score a)
Solvent score a)
% Improvement compared to 1 b)
1 4.8 260 0.4 1.2 0.8 – 2 7.9 104 1.0 2.2 2.2 60 3 13.6 65 1.6 2.9 2.8 75 4 27.0 20.6 4.9 4.1 4.21 92
a) Out of a possible score of 5. b) On the basis of mass intensity.
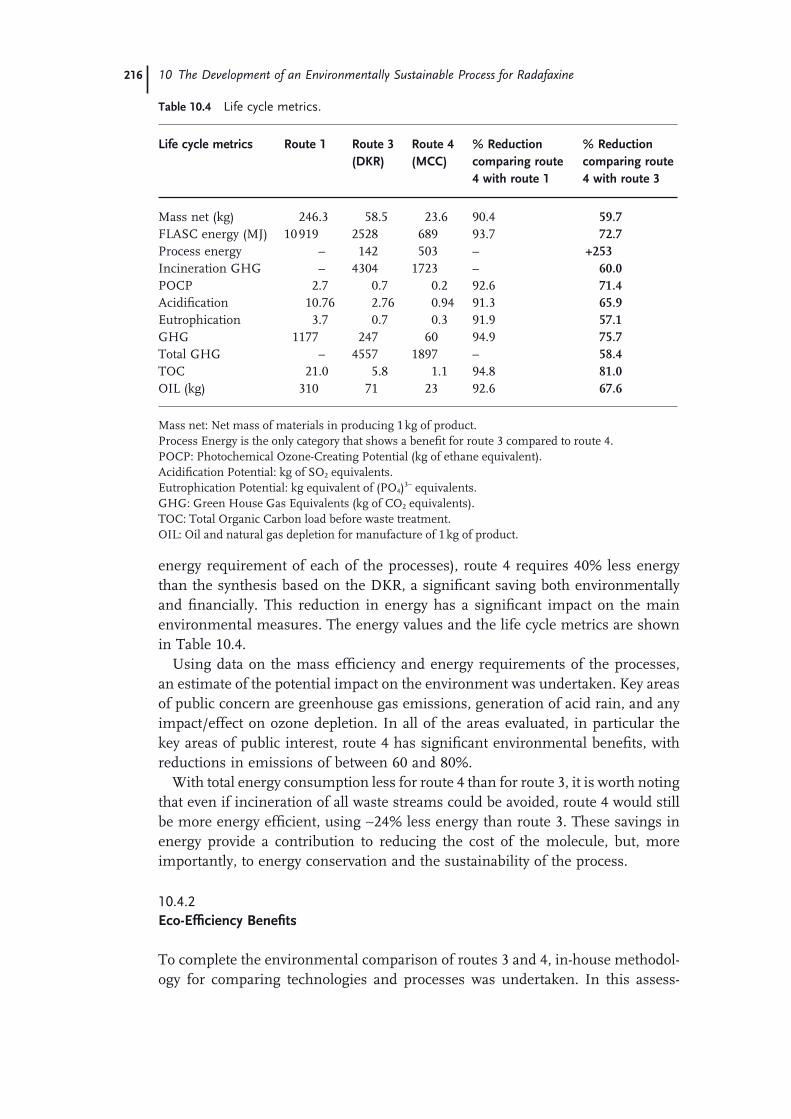
216 10 The Development of an Environmentally Sustainable Process for Radafaxine
Table 10.4 Life cycle metrics.
Life cycle metrics Route 1 Route 3 (DKR)
Route 4 (MCC)
% Reduction comparing route 4 with route 1
% Reduction comparing route 4 with route 3
Mass net (kg) 246.3 58.5 23.6 90.4 59.7 FLASC energy (MJ) 10 919 2528 689 93.7 72.7 Process energy – 142 503 – +253 Incineration GHG – 4304 1723 – 60.0 POCP 2.7 0.7 0.2 92.6 71.4 Acidifi cation 10.76 2.76 0.94 91.3 65.9 Eutrophication 3.7 0.7 0.3 91.9 57.1 GHG 1177 247 60 94.9 75.7 Total GHG – 4557 1897 – 58.4 TOC 21.0 5.8 1.1 94.8 81.0 OIL (kg) 310 71 23 92.6 67.6
Mass net: Net mass of materials in producing 1 kg of product. Process Energy is the only category that shows a benefi t for route 3 compared to route 4. POCP : Photochemical Ozone - Creating Potential (kg of ethane equivalent). Acidifi cation Potential: kg of SO 2 equivalents. Eutrophication Potential: kg equivalent of (PO 4 ) 3 − equivalents. GHG : Green House Gas Equivalents (kg of CO 2 equivalents). TOC : Total Organic Carbon load before waste treatment. OIL: Oil and natural gas depletion for manufacture of 1 kg of product.
energy requirement of each of the processes), route 4 requires 40% less energy than the synthesis based on the DKR, a signifi cant saving both environmentally and fi nancially. This reduction in energy has a signifi cant impact on the main environmental measures. The energy values and the life cycle metrics are shown in Table 10.4 .
Using data on the mass effi ciency and energy requirements of the processes, an estimate of the potential impact on the environment was undertaken. Key areas of public concern are greenhouse gas emissions, generation of acid rain, and any impact/effect on ozone depletion. In all of the areas evaluated, in particular the key areas of public interest, route 4 has signifi cant environmental benefi ts, with reductions in emissions of between 60 and 80%.
With total energy consumption less for route 4 than for route 3, it is worth noting that even if incineration of all waste streams could be avoided, route 4 would still be more energy effi cient, using ∼ 24% less energy than route 3. These savings in energy provide a contribution to reducing the cost of the molecule, but, more importantly, to energy conservation and the sustainability of the process.
10.4.2 Eco - Effi ciency Benefi ts
To complete the environmental comparison of routes 3 and 4, in - house methodol-ogy for comparing technologies and processes was undertaken. In this assess-

10.5 Summary 217
ment, a comparative score is given to the applicable indicators in a series of categories. A score of 0 is given if the indicator is perceived to have a signifi cant disadvantage, 10 if it is perceived as a signifi cant advantage, and 5 if it is not per-ceived to have signifi cant advantages or disadvantages. The average score for each category (environment, energy, safety, and effi ciency) is calculated using the rela-tive scores in the appropriate indicators. The summary of the scores and the fi nal ranking for this scenario is shown in Table 10.5 .
The overall result of all the assessments comparing route 3 and 4 clearly showed that the process based on the separation of the enantiomers of 2 using MCC had signifi cant environmental benefi ts. The benefi ts range from improved mass effi -ciency (4.9% compared to 1.6%), fewer solvents, less process waste, a 40% reduc-tion in total energy usage, and signifi cant improvements in the total Life Cycle Metrics. These include a 58% reduction in greenhouse gases, a 71% reduction in photochemical ozone creation potential, an 81% reduction in TOC, and a 67% saving in oil depletion.
10.5 Summary
By considering all aspects of a process and building into the planning of the work the environmental impacts and benefi ts, a highly successful and innovative labora-tory program led to the discovery of two commercially viable processes. Both of the procedures were demonstrated at scale and produced radafaxine that met all of the pre - agreed criteria, including quality, safety, cost, and throughput. Incorpo-ration of detailed environmental assessments and calculations to assist in the
Table 10.5 Summary of eco - effi ciency benefi ts.
Route 3 Route 4
Environment 5 10 Mass intensity 5 10 Solvent intensity 5 10 Life cycle metrics 5 10 Energy 1.7 6.7 Process energy 5 5 Waste treatment energy 0 5 LCA energy 0 10 Safety 5 6.7 Process 5 5 Materials 5 5 Exposure controls 5 10 Effi ciency 5 8.3 Operability 5 10 Purity 5 5 Number of unit operations 5 10

218 10 The Development of an Environmentally Sustainable Process for Radafaxine
selection of the commercial process demonstrated that route 4 using continuous chromatography in conjunction with an in situ racemization process was the best route for the synthesis of radafaxine, providing environmental, economic, and societal benefi ts.
Acknowledgments
This work was carried out by a highly skilled and motivated team of people from all areas of GSK, and I would like to thank all of them for their commitment and dedication to the project. In addition I would like to acknowledge the assistance from the staff of Novasep (France) and Chiral Technologies Europe for their con-tributions and very helpful discussions to the development of the MCC process. It is to all of these people that this chapter is dedicated.
References
1 Welch , R.M. , Lai , A.A. , and Schroeder , D.H. ( 1987 ) Xenobiotica , 17 , 287 – 298 , and references cited therein.
2 Cooper , T.B. , Perumal , A.S. , Suckow , R.F. , and Glassman , A. ( 1986 ) Drug Metab. Dispos. , 14 ( 6 ), 692 – 697 .
3 Cooper , T.B. , Suckow , R.F. , and Glassman , A. ( 1984 ) J. Pharm. Sci. , 73 , 1104 – 1107 .
4 Kelley , J.L. , Musso , D.L. , Boswell , G.E. , Soroko , F.E. , and Cooper , B.R. ( 1996 ) J. Med. Chem. , 39 , 347 – 349 .
5 Golden , R.N. , DeVane , C.L. , Laizure , S.C. , Rudorfer , M.V. , Sherer , M.A. , and Potter , W.Z. ( 1988 ) Arch. Gen. Psychiatry , 45 , 145 – 149 .
6 Suckow , R.F. , Zhang , M.F. , and Cooper , T.B. ( 1997 ) Biomed. Chromatogr. , 11 , 174 – 179 .
7 Ascher , J.A. , Cole , J.O. , Colin , J. - N. , Feighner , J.P. , Ferris , R.M. , Fibiger , H.C. , Golden , R.N. , Martin , P. , Potter , W.Z. , Richelson , E. , and Sulser , F. ( 1995 ) J. Clin. Psychiatry , 56 , 395 – 401 .
8 Cooper , B.R. , Wang , C.M. , Cox , R.F. , Norton , R. , Shea , V. , and Ferris , R.M. ( 1994 ) Neuropsychopharmacology , 11 , 133 – 141 .
9 Martin , P. , Massol , J. , Colin , J. - N. , Lacomblez , L. , and Peuch , A.J. ( 1990 ) Pharmacopsychiatry , 23 , 187 – 194 .
10 Agranat , I. , Caner , H. , and Caldwell , J. ( 2002 ) Nat. Rev. Drug Discov. , 1 , 753 – 768 , and references cited therein.
11 Szelenyi , I. , Geisslinger , G. , Polymero-poulos , E. , Paul , W. , Herbst , M. , and Brune , K. ( 1998 ) Drug News Perspect. , 11 ( 3 ), 139 – 160 , and references cited therein.
12 Gurjar , M.K. ( 2007 ) J. Ind. Med. Assoc. , 105 , 177 – 178 .
13 Fang , Q.K. , Han , Z. , Grover , P. , Kessler , D. , Senanayake , C.H. , and Wald , S.A. ( 2000 ) Tetrahedron Asymmetry , 11 , 3659 – 3663 .
14 Boswell , G.E. , Musso , D.L. , Davies , A.O. , Kelly , J.L. , Soroko , F.E. , and Cooper , B.R. ( 1997 ) J. Het. Chem. , 34 , 1813 – 1820 .
15 Jerussi , T.P. , McCullough , J.R. , Sananayke , C.H. , and Fang , Q.K. , ( 2002 ) US Patent 6342496B1 .
16 For more information on the role of Process Chemistry and factors that a Process Chemistry team consider when designing a synthetic route see Zhang , T.Y. ( 2006 ) Chem. Rev. , 106 , 2583 – 2595 and Butters , M. , Catterick , D. , Craig , A. , Curzons , A. , Dale , D. , Gillmore , A. , Green , S.P. , Marziano , I. , Sherlock , J. - P. , and White , W. ( 2006 ) Chem. Rev. , 106 , 3002 – 3025 .
17 Noyori , R. , Tokunaga , M. , and Kitamura , M. ( 1995 ) Bull. Chem. Soc. Jpn. , 68 , 36 – 56 .
References 219
18 Ward , R.S. ( 1995 ) Tetrahedron Asymme-try , 6 , 1475 – 1490 .
19 Berrang , B.D. , Lewin , A.H. , and Carroll , F.I. ( 1982 ) J. Org. Chem. , 47 , 2643 – 2647 .
20 Musso , D.L. , Mehta , N.B. , Soroko , F.E. , Ferris , R.M. , Hollingsworth , E.B. , and Kenney , B.T. ( 1993 ) Chirality , 5 , 495 – 500 .
21 Juza , M. , Mazzotti , M. , and Morbidelli , M. ( 2000 ) Trends Biotechnol. , 18 , 108 – 118 .
22 Private communication; see also Rouhi , A.M. ( 2003 ) Chem. Eng. News , 81 ( 18 ), 45 – 55 .
23 Lorenz , H. , Sheehan , P. , and Seidel - Morgenstern , A. ( 2001 ) J. Chromatogr. A , 908 , 201 – 214 .
24 Sheldon , R.A. ( 2000 ) Pure Appl. Chem. , 72 , 1233 – 1246 .
25 Tucker , J.L. ( 2006 ) Org. Process Res. Dev. , 10 , 315 – 319 .
26 Anastas , P. and Warner , J.C. ( 1998 ) Green Chemistry: Theory and Practice , Oxford University Press , Oxford .
27 Jim é nez - Gonz á lez , C. , Curzons , A.D. , Constable , D.J.C. , and Cunningham , V.L. ( 2004 ) Int. J. Life Cycle Assess. , 9 , 114 – 121 .
28 Curzons , A.D. , Jim é nez - Gonz á lez , C. , Duncan , A.L. , Constable , D.J.C. , and Cunningham , V.L. ( 2007 ) Int. J. Life Cycle Assess. , 12 ( 4 ), 272 – 280 .
29 Jim é nez - Gonz á lez , C. , Constable , D.J.C. , Curzons , A.D. , and Cunningham , V.L. ( 2002 ) Clean Tech. Environ. Policy , 4 , 44 – 53 .


221
11 Continuous Processing in the Pharmaceutical Industry Lee Proctor , Peter J. Dunn , Joel M. Hawkins , Andrew S. Wells , and Michael T. Williams
11.1 Introduction
As the fi ne chemical and pharmaceutical industries progress into the 21st century there is an ever - increasing necessity to improve the sustainability of their manu-facturing processes. In 2006 James Clark stated ‘ The three cornerstones of sustain-able development – economic, environmental, and social benefi t – each provide drivers for change that should help to push the application of green chemistry forward ’ [1] . The responsibility, therefore, is on the manufacturer to develop and operate sustainable processes, for example, by (i) reducing waste or treating waste to render it nonhazardous. (ii) improving process effi ciency by using less raw materials and by recycling and re - using solvents whenever appropriate, and (iii) developing cleaner, more energy - effi cient processes and by reducing emissions through effective abatement management.
One useful measure of a process ’ s sustainability is the E factor [2] . As defi ned by Roger Sheldon, the E factor is the ratio (by weight) of the by - products to the desired product(s). The pharmaceutical and fi ne chemical industries routinely operate processes with E factors one to two orders of magnitude higher than their petrochemical counterparts. There are many reasons for this, including the high level of chemical complexity in pharmaceutical products and the high quality standards in the pharmaceutical industry, but another circumstance contributing to this difference between the E factors is the type of manufacturing technology employed. The petrochemical industry tends to operate continuous processes, whereas the fi ne chemical and pharmaceutical industries predominantly use less effi cient batch manufacturing methods. It could be argued that the different pro-duction techniques simply refl ect the volume and complexity of the materials manufactured. Is it correct, however, that relatively simple petrochemical products are produced using modern continuous - based manufacturing technologies whereas pharmaceutical products and intermediates are produced using older batch methods?
In the fi eld of organic chemistry, new synthetic strategies and methodologies are developed at an astonishing rate to access a diverse range of molecules.
Green Chemistry in the Pharmaceutical Industry. Edited by Peter J. Dunn, Andrew S. Wells and Michael T. Williams© 2010 WILEY-VCH Verlag GmbH & Co. KGaA, WeinheimISBN: 978-3-527-32418-7
222 11 Continuous Processing in the Pharmaceutical Industry
Invariably, modern drug substances are extremely complex molecular systems, and a survey of drug candidate molecules [3] showed them to contain multiple functional groups and frequent issues of chirality. It is sobering to think, therefore, that these high - technology chemicals are predominantly manufactured using stirred tank reactor technology which has hardly changed over the last 500 years. The principal advantage of stirred tank reactors is versatility, because virtually any kind of chemical process can be accommodated. However, the inherent versatility of the stirred tank often increases the vulnerability of the process chemistry. This is because many processes have to be operated in a sub - optimum manner to enable the chemistry to be handled safely. An example would be a fast exothermic reaction such as a Claisen condensation between an ester and a lithium enolate. To safely operate this chemistry using stirred tank reactors would require high dilution and low temperatures to prevent degradation of starting materials and to ensure that the desired product selectivity is met. The process becomes a classic case of engineering the chemistry to fi t the manufacturing plant available. This approach becomes very costly in terms of the raw materials required, the quantity of waste produced, and the energy requirement to process the material and isolate the product. In contrast, continuous processing facilitates streamlined and effi -cient manufacturing. The Claisen condensation could be operated at a higher concentration and temperature using a fl ow process, because the reactor system would be designed to provide optimum heat and mass transfer to control the heat of the reaction. In addition, fl ow processes often give enhanced product selectivity because back mixing (that is, contact between products and starting materials) can be eliminated and residence time (the time materials reside inside the reaction zone) can be tuned to the intrinsic reaction kinetics. Unlike batch processing, a continuous process is an example of the manufacturing plant being engineered to fi t the optimum chemical process.
Continuous processes operate in highly automated production plants incorpo-rating numerous digital and analog control loops. The data stream obtained from the various control elements (process factors) provide valuable Process Analytical Technology ( PAT ) information that is continually logged to a central Process Control System ( PCS ). Instruments can also be incorporated into the process streams to provide on - line analytical information 1) (process responses). The com-bination of the process factors and response data can be used to confi rm that the plant is operating under steady state conditions. The data can also be used in a more elegant fashion to derive multivariate statistical models of the process which can be used as an additional process control element 2) or a tool to facilitate process improvement. The ability to control a continuous process at steady state also facilitates the ability to integrate one processing stage with another, for example, reaction followed by work - up followed by second - stage reaction. The ability to telescope multiple stages together greatly improves the overall sustainability of the process by reducing costs of raw materials, energy, and waste, as well as reducing
1) For example mid FT - IR, photoacoustic FT - IR, Raman, pH, GC, HPLC. 2) A technique known as multivariate statistical process control (MVSPC).
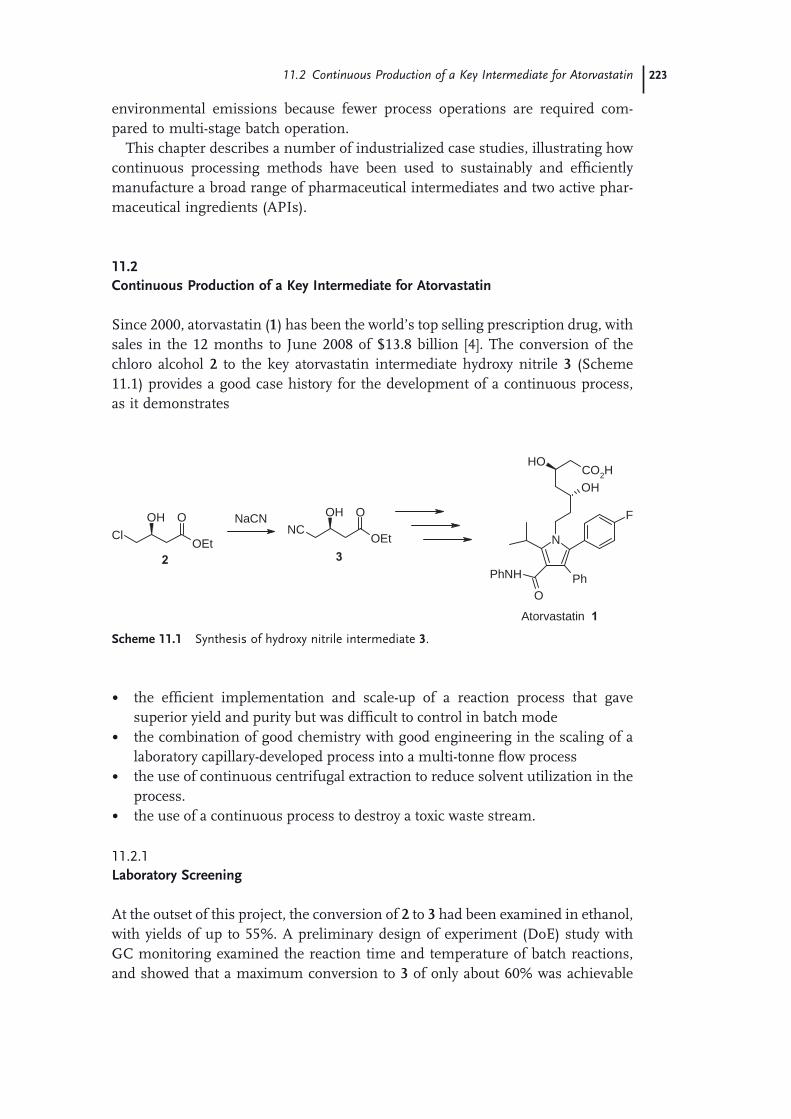
11.2 Continuous Production of a Key Intermediate for Atorvastatin 223
environmental emissions because fewer process operations are required com-pared to multi - stage batch operation.
This chapter describes a number of industrialized case studies, illustrating how continuous processing methods have been used to sustainably and effi ciently manufacture a broad range of pharmaceutical intermediates and two active phar-maceutical ingredients ( APIs ).
11.2 Continuous Production of a Key Intermediate for Atorvastatin
Since 2000, atorvastatin ( 1 ) has been the world ’ s top selling prescription drug, with sales in the 12 months to June 2008 of $13.8 billion [4] . The conversion of the chloro alcohol 2 to the key atorvastatin intermediate hydroxy nitrile 3 (Scheme 11.1 ) provides a good case history for the development of a continuous process, as it demonstrates
ClOOH
OEt
NaCN OH O
OEtNC
N
OHCO2H
Ph
F
O
PhNH
OH
2 3
Atorvastatin 1
Scheme 11.1 Synthesis of hydroxy nitrile intermediate 3 .
• the effi cient implementation and scale - up of a reaction process that gave superior yield and purity but was diffi cult to control in batch mode
• the combination of good chemistry with good engineering in the scaling of a laboratory capillary - developed process into a multi - tonne fl ow process
• the use of continuous centrifugal extraction to reduce solvent utilization in the process.
• the use of a continuous process to destroy a toxic waste stream.
11.2.1 Laboratory Screening
At the outset of this project, the conversion of 2 to 3 had been examined in ethanol, with yields of up to 55%. A preliminary design of experiment ( DoE ) study with GC monitoring examined the reaction time and temperature of batch reactions, and showed that a maximum conversion to 3 of only about 60% was achievable
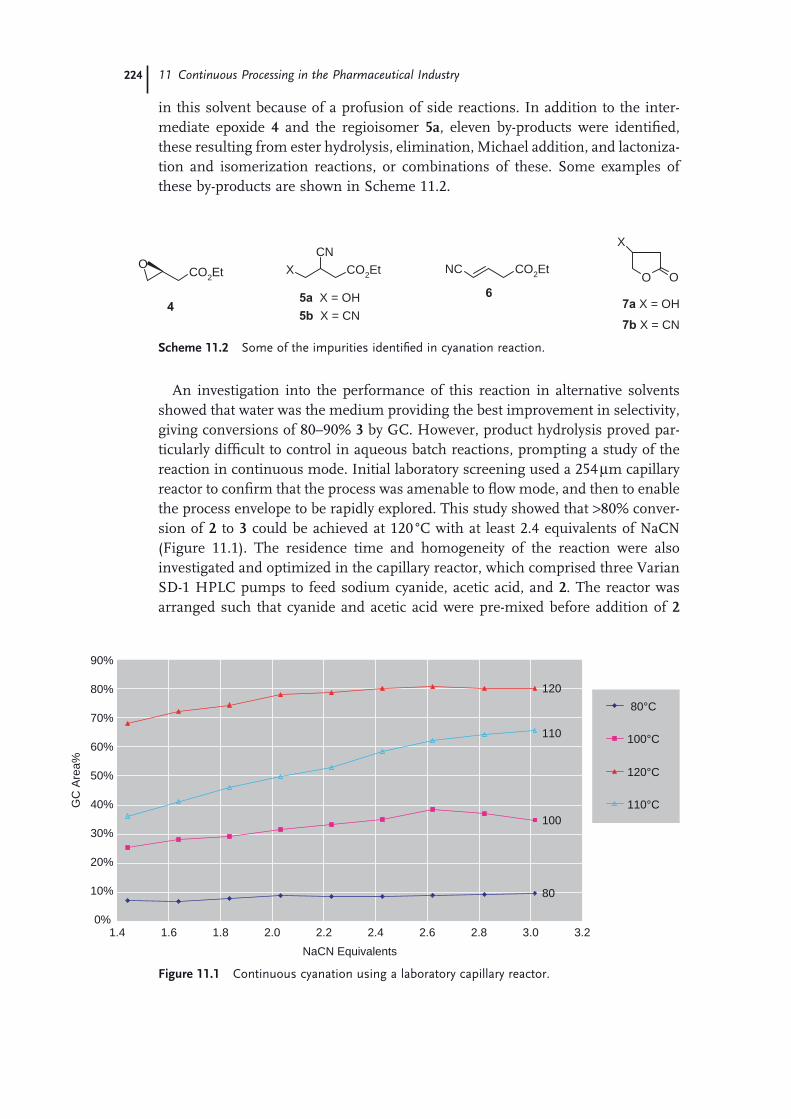
224 11 Continuous Processing in the Pharmaceutical Industry
in this solvent because of a profusion of side reactions. In addition to the inter-mediate epoxide 4 and the regioisomer 5a , eleven by - products were identifi ed, these resulting from ester hydrolysis, elimination, Michael addition, and lactoniza-tion and isomerization reactions, or combinations of these. Some examples of these by - products are shown in Scheme 11.2 .
OCO2Et X
CNCO2Et CO2EtNC
O
X
O
45a X = OH5b X = CN
67a X = OH
7b X = CN
Scheme 11.2 Some of the impurities identifi ed in cyanation reaction.
0%
10%
20%
30%
40%
50%
60%
70%
80%
90%
NaCN Equivalents
GC
Are
a%
80°C120
110
100
80
100°C
120°C
110°C
1.4 1.6 1.8 2.0 2.2 2.4 2.6 2.8 3.0 3.2
Figure 11.1 Continuous cyanation using a laboratory capillary reactor.
An investigation into the performance of this reaction in alternative solvents showed that water was the medium providing the best improvement in selectivity, giving conversions of 80 – 90% 3 by GC. However, product hydrolysis proved par-ticularly diffi cult to control in aqueous batch reactions, prompting a study of the reaction in continuous mode. Initial laboratory screening used a 254 μ m capillary reactor to confi rm that the process was amenable to fl ow mode, and then to enable the process envelope to be rapidly explored. This study showed that > 80% conver-sion of 2 to 3 could be achieved at 120 ° C with at least 2.4 equivalents of NaCN (Figure 11.1 ). The residence time and homogeneity of the reaction were also investigated and optimized in the capillary reactor, which comprised three Varian SD - 1 HPLC pumps to feed sodium cyanide, acetic acid, and 2 . The reactor was arranged such that cyanide and acetic acid were pre - mixed before addition of 2

11.2 Continuous Production of a Key Intermediate for Atorvastatin 225
(typically 0.1 equiv. of acetic acid was used to buffer the process by generating sodium acetate in situ ). 3) These optimized laboratory conditions were then trans-ferred into a 4.4 mm internal diameter ( ID ) jacketed static mixer. Despite the 300 - fold increase in cross - sectional area, the reaction performed identically. This approach of scaling up directly from a 254 - μ m ID capillary reactor directly into a 4.4 - mm ID static mixer has been demonstrated on several different chemistries.
11.2.2 Reaction Scale - up
Static mixers provide optimum heat and mass transfer for a pre - defi ned fl ow envelope. Changing residence time by changing the fl ow rate of materials entering a static mixer should be avoided because it will directly affect the heat and mass transfer. Residence time is the most important parameter for plug fl ow processes, as it governs product composition and quality. The next stage of scale - up, to enable process tuning and optimization at full scale , employed a variable residence time ( VRT ) reactor, 4) which comprises a set of fl ow units which can be switched on or off in series (Figure 11.2 ). In this color diagram the composition of the reactor product stream is indicated, the desired product being represented by green, over - reaction by brown, and under - conversion by blue. The VRT reactor thus enables any residence time within the system parameters to be accessed on - line without changing fl ow rate, thus preserving the optimum heat and mass transfer; the VRT reactor can be viewed in essence as a static mixer that can be stretched or com-pressed at will to achieve the desired residence time. The VRT reactor system can be considered the fl ow equivalent of typical 20 – 100 L batch vessels for scale - up of reactions to the kilo laboratory/pilot plant level. VRT technology has ensured smooth progression from laboratory - developed fl ow processes to commercial con-tinuous manufacture for a number of multi - tonne commercial products.
The conversion of 2 to 3 was optimized at full scale in the VRT reactor. In addi-tion to confi rming the productivity, safety, product quality, and economic benefi t of the process, the robustness of the process was also demonstrated. Finally, this pilot study provided the basis for a full - scale commercial manufacturing design specifi cation. Having fi xed the optimum residence time, the process was then transferred into a plant Fixed Residence Time ( FRT ) cyanation reactor which employed a fi xed length of jacketed static mixer for commercial manufacture. This FRT was capable of producing 300 metric tonnes per year of 3 , with the same purifi ed step yield of 80% that was achieved in the laboratory capillary reactor.
3) Micro - mixer Tees from Swagelock were used to connect the various feeds to a coil of 254 μ m stainless steel HPLC capillary tubing immersed in a Huber oil bath.
4) VRT technology is a patented Phoenix technology (WO 2004103551) that is being
commercially developed by Sapien Process Technologies in the UK. The following link to the Sapien web site includes a downloadable pdf brochure of the VRT system: ( http://www.sapienequipment.com/sapien_website_april_2008_v5_011.htm ).
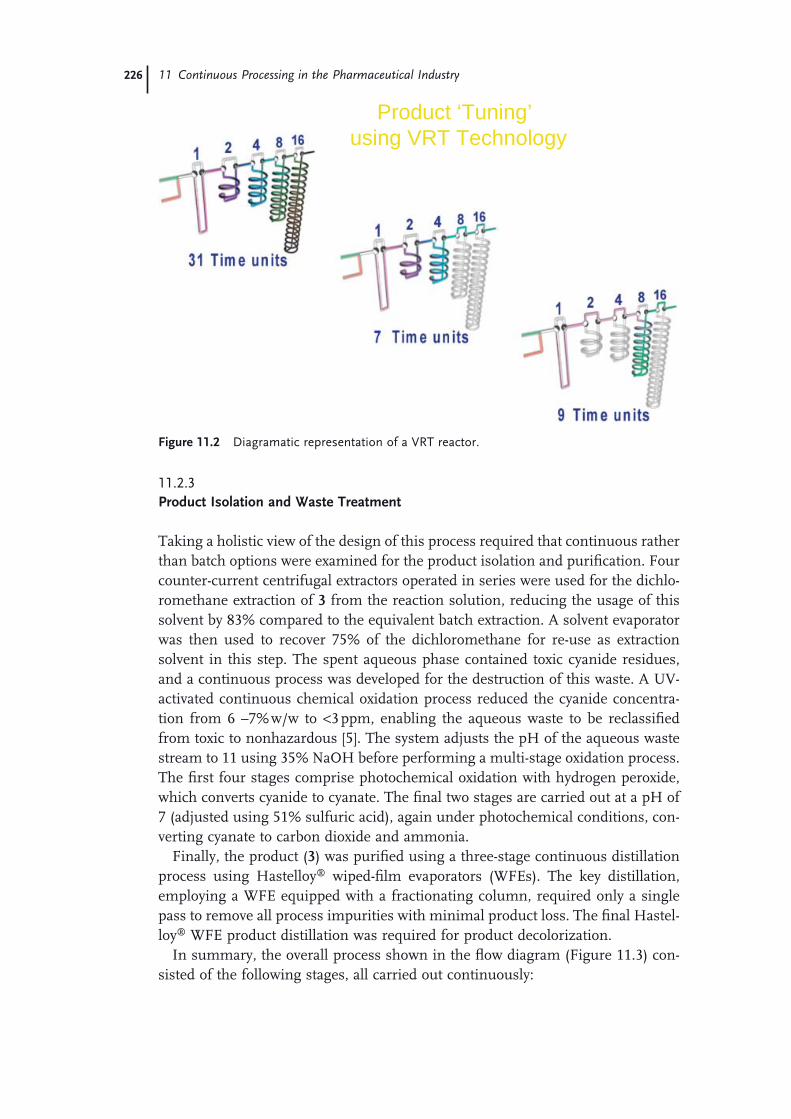
226 11 Continuous Processing in the Pharmaceutical Industry
11.2.3 Product Isolation and Waste Treatment
Taking a holistic view of the design of this process required that continuous rather than batch options were examined for the product isolation and purifi cation. Four counter - current centrifugal extractors operated in series were used for the dichlo-romethane extraction of 3 from the reaction solution, reducing the usage of this solvent by 83% compared to the equivalent batch extraction. A solvent evaporator was then used to recover 75% of the dichloromethane for re - use as extraction solvent in this step. The spent aqueous phase contained toxic cyanide residues, and a continuous process was developed for the destruction of this waste. A UV - activated continuous chemical oxidation process reduced the cyanide concentra-tion from 6 – 7% w/w to < 3 ppm, enabling the aqueous waste to be reclassifi ed from toxic to nonhazardous [5] . The system adjusts the pH of the aqueous waste stream to 11 using 35% NaOH before performing a multi - stage oxidation process. The fi rst four stages comprise photochemical oxidation with hydrogen peroxide, which converts cyanide to cyanate. The fi nal two stages are carried out at a pH of 7 (adjusted using 51% sulfuric acid), again under photochemical conditions, con-verting cyanate to carbon dioxide and ammonia.
Finally, the product ( 3 ) was purifi ed using a three - stage continuous distillation process using Hastelloy ® wiped - fi lm evaporator s ( WFE s). The key distillation, employing a WFE equipped with a fractionating column, required only a single pass to remove all process impurities with minimal product loss. The fi nal Hastel-loy ® WFE product distillation was required for product decolorization.
In summary, the overall process shown in the fl ow diagram (Figure 11.3 ) con-sisted of the following stages, all carried out continuously:
Product ‘Tuning’using VRT Technology
Figure 11.2 Diagramatic representation of a VRT reactor.
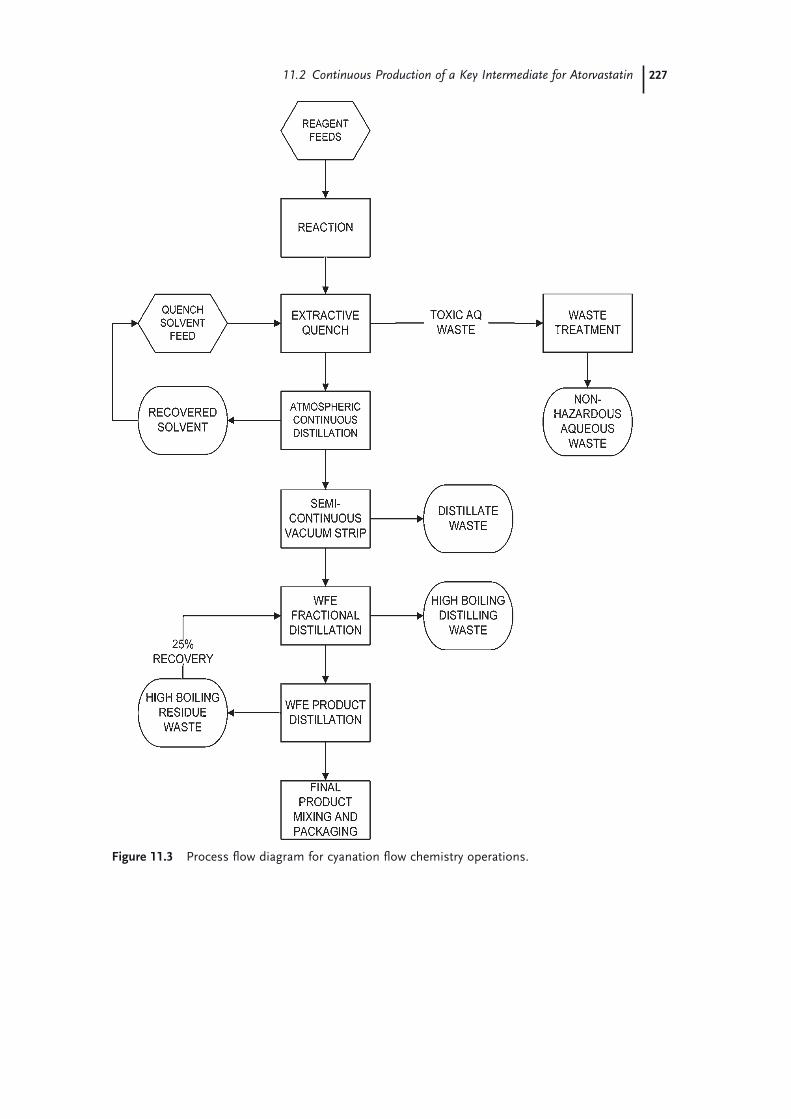
11.2 Continuous Production of a Key Intermediate for Atorvastatin 227
Figure 11.3 Process fl ow diagram for cyanation fl ow chemistry operations .
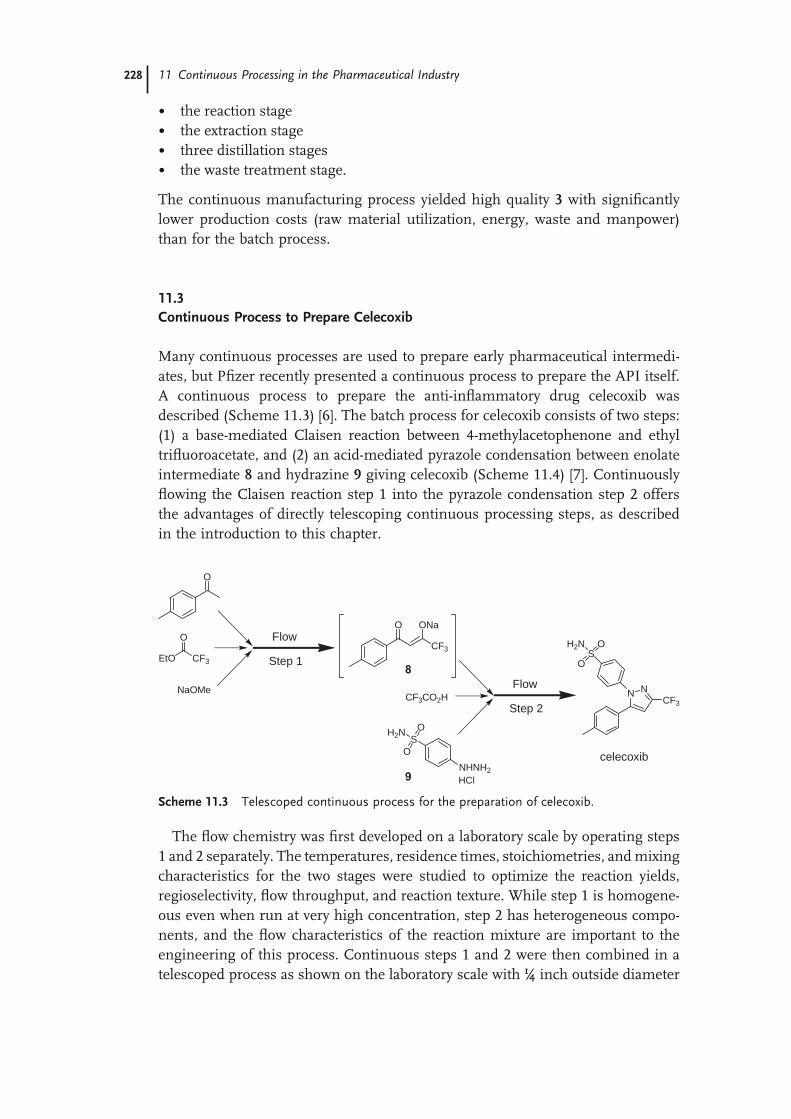
228 11 Continuous Processing in the Pharmaceutical Industry
O
EtO CF3
OO ONa
CF3
N NCF3
SO
O
H2N
celecoxib
NaOMe
NHNH2
SO
OH2N
HCl
CF3CO2H
Flow
Step 1
Flow
Step 2
8
9
Scheme 11.3 Telescoped continuous process for the preparation of celecoxib.
• the reaction stage • the extraction stage • three distillation stages • the waste treatment stage.
The continuous manufacturing process yielded high quality 3 with signifi cantly lower production costs (raw material utilization, energy, waste and manpower) than for the batch process.
11.3 Continuous Process to Prepare Celecoxib
Many continuous processes are used to prepare early pharmaceutical intermedi-ates, but Pfi zer recently presented a continuous process to prepare the API itself. A continuous process to prepare the anti - infl ammatory drug celecoxib was described (Scheme 11.3 ) [6] . The batch process for celecoxib consists of two steps: (1) a base - mediated Claisen reaction between 4 - methylacetophenone and ethyl trifl uoroacetate, and (2) an acid - mediated pyrazole condensation between enolate intermediate 8 and hydrazine 9 giving celecoxib (Scheme 11.4 ) [7] . Continuously fl owing the Claisen reaction step 1 into the pyrazole condensation step 2 offers the advantages of directly telescoping continuous processing steps, as described in the introduction to this chapter.
The fl ow chemistry was fi rst developed on a laboratory scale by operating steps 1 and 2 separately. The temperatures, residence times, stoichiometries, and mixing characteristics for the two stages were studied to optimize the reaction yields, regioselectivity, fl ow throughput, and reaction texture. While step 1 is homogene-ous even when run at very high concentration, step 2 has heterogeneous compo-nents, and the fl ow characteristics of the reaction mixture are important to the engineering of this process. Continuous steps 1 and 2 were then combined in a telescoped process as shown on the laboratory scale with ¼ inch outside diameter

11.3 Continuous Process to Prepare Celecoxib 229
( OD ) tubing in Figure 11.4 and on a pilot plant scale with a series of static mixers followed by a 0.41 - inch ID residence time section in Figure 11.5 . The telescoped continuous process gives yields and quality comparable with those of the batch process for celecoxib.
An important aspect of developing and validating continuous processes is testing robustness with respect to perturbations of the fl owing reaction parame-ters. Batch processes are typically tested by stressing overall conditions rather than instantaneous conditions. For example, the yield and quality of product at the end of a batch process might be tested with respect to the overall stoichiometries of two reactants without necessarily considering the instantaneous concentrations of these reactants at any given time and place in the reactor. In contrast, the output of a continuous processing step needs to be understood over time as a function of the input parameters, that is, what is the response of the system to a perturba-
O
EtO CF3
O 1.2 eq NaOMe / MeOH
iPrOH50°C, 2 h
Step 1
+ 1.3 O ONa
CF3
O ONa
CF3
NHNH2
SO
OH2N 0.5 eq CF3CO2H
iPrOH55°C, 30 min
Step 2
+ N NCF3
SO
O
H2N
celecoxib
HCl
8
8 9
Scheme 11.4 Two - step batch process for the preparation of celecoxib.
Figure 11.4 Telescoped laboratory scale continuous process for the preparation of celecoxib with ¼ - inch OD tubing.

230 11 Continuous Processing in the Pharmaceutical Industry
Figure 11.5 Pilot plant scale continuous process for the preparation of celecoxib. The step 1 reactor with a 0.41 - inch ID residence time section is shown.
tion and how long does it take to return to steady state. Figure 11.6 shows the output of step 1 of the celecoxib process on pilot plant scale. Under normal operat-ing conditions, the level of unreacted 4 - methylacetophenone is low (lower trace) and the level of enolate intermediate 8 is high (upper trace). The vertical lines signify intentional disruptions to the input of the sodium methoxide base for dif-ferent periods of time to test the system ’ s response. After a 1 - min pause in the fl ow of base, the product concentration dips slightly and the unreacted starting material concentration increases briefl y before both levels return to steady state. After 3 - and 5 - min perturbations, larger responses register, but the system still returns to steady state. In this way, the robustness of the output of a continuous process can be established relative to any perturbations of the input parameters.
The pilot plant scale system shown in Figure 11.5 yields up to 300 g h − 1 of celecoxib. Manufacturing scale continuous processing trains sized to produce 400 000 kg of celecoxib per year are shown schematically in Figures 11.7 and 11.8 . The individual reactors for the continuous process are considerably smaller than the reactors used for the corresponding batch process. Note that these two options depict plug fl ow reactor ( PFR ) and continuous stirred tank reactor ( CSTR ) options for step 1 combined with a CSTR train for step 2. In general, the relative merits of PFRs and CSTRs depend on the residence time, residence time distribution, volume, and mixing requirements of the process. Shorter residence time processes with smaller system volumes tend to favor PFRs, while longer residence time processes with larger system volumes tend to favor CSTRs. The number of sequen-tial reactors in a CSTR train, for example, three per step in Figure 11.8 , affects the residence time distribution for the process, whereas a larger number of reactors gives a tighter residence time distribution. Individually or in combination, PFRs
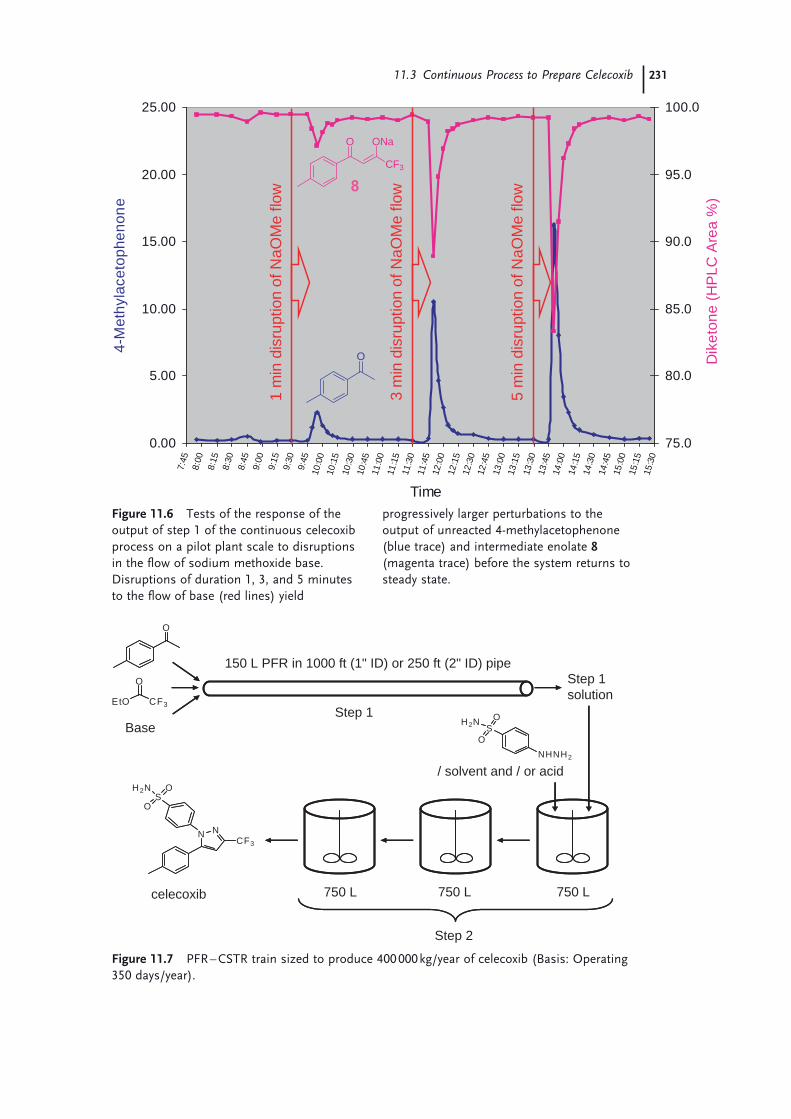
11.3 Continuous Process to Prepare Celecoxib 231
0.00
5.00
10.00
15.00
20.00
25.00
7:45
8:00
8:15
8:30
8:45
9:00
9:15
9:30
9:45
10:0
010
:15
10:3
010
:45
11:0
011
:15
11:3
011
:45
12:0
012
:15
12:3
012
:45
13:0
013
:15
13:3
013
:45
14:0
014
:15
14:3
014
:45
15:0
015
:15
15:3
0
Time
4-M
ethy
lace
toph
enon
e
75.0
80.0
85.0
90.0
95.0
100.0
Dik
eton
e (H
PLC
Are
a %
)
1 m
in d
isru
ptio
n of
NaO
Me
flow
3 m
in d
isru
ptio
n of
NaO
Me
flow
5 m
in d
isru
ptio
n of
NaO
Me
flow
O
O ONa
CF3
8
Figure 11.6 Tests of the response of the output of step 1 of the continuous celecoxib process on a pilot plant scale to disruptions in the fl ow of sodium methoxide base. Disruptions of duration 1, 3, and 5 minutes to the fl ow of base (red lines) yield
progressively larger perturbations to the output of unreacted 4 - methylacetophenone (blue trace) and intermediate enolate 8 (magenta trace) before the system returns to steady state.
O
EtO CF3
O
NHNH2
SO
OH2N
N NCF3
SO
O
H2N
Base
150 L PFR in 1000 ft (1" ID) or 250 ft (2" ID) pipeStep 1solution
/ solvent and / or acid
750 L
Step 1
Step 2
celecoxib 750 L 750 L
Figure 11.7 PFR – CSTR train sized to produce 400 000 kg/year of celecoxib (Basis: Operating 350 days/year).

232 11 Continuous Processing in the Pharmaceutical Industry
O
EtO CF3
O
NHNH 2
SO
OH 2N
N NCF3
SO
O
H 2N
Base
Step 1solution
/ solvent and / or acid
750 L
Step 2
celecoxib 750 L 750 L
Step 1
200 L 200 L 200 L
O
EtO CF3
O
NHNH 2
SO
OH 2N
N NCF3
SO
O
H 2N
Base
Step 1solution
/ solvent and / or acid
750 L
Step 2
celecoxib 750 L 750 L
Step 1
200 L 200 L 200 L
Figure 11.8 CSTR – CSTR train sized to produce 400 000 kg/year of celecoxib (Basis: Operating 350 days/year).
OH
CO2Me
O
CO2Me(i)
(i) NaOCl (aq), TEMPO (0.2 mol %), KBr (10 mol %), CH2Cl2 / H2O pH 9.5 temperature -5oC to 20oC,no yield as product was not isolated but carried through to further chemical operations.
Scheme 11.5 Pilot plant scale oxidation of an alcohol to an aldehyde.
and CSTRs are valuable tools for continuous processing in the pharmaceutical industry.
11.4 Continuous Oxidation of Alcohols to Aldehydes
This is a key transformation in pharmaceutical chemistry, as alcohols are widely available building blocks and aldehydes are particularly useful for carbon - nitrogen bond - forming reactions by reductive amination. Fifty years ago, chromium(VI) - based reagents such as CrO 3 were commonly used for this reaction, and, for example, the Merck synthesis of cortisone from the 1950s used three chromium(VI) oxidations [8] . Obviously, chromium oxide is a carcinogen and chromium wastes have severe environmental issues, so one of the most important Green Chemistry improvements of the last few decades was the discovery of bleach - based oxidations catalyzed by stable nitroxy radicals [9] . In these reactions the by - products are water and sodium chloride, so they represent a signifi cant improvement and have been widely used by process groups in the pharmaceutical industry. An example from the Lilly company is given in Scheme 11.5 [10] .

11.4 Continuous Oxidation of Alcohols to Aldehydes 233
In spite of the improvement, these procedures still have some disadvantages:
• There is a tendency for over - oxidation of the aldehyde to the acid. 5) • Chlorinated solvents such as dichloromethane are often used to suppress the
over - oxidation.
In continuous processing, the aldehyde product is removed from the reaction before any over - oxidation can occur, offering signifi cant Green Chemistry advan-tages. This is shown diagramatically in Scheme 11.6 .
OH
H HR R CHO R CO2H
desired
oxidation
undesiredover oxidation
Short residence time meansthat this desired product iscontinuously removed fromthe reactor before any over oxidation can occur.
Scheme 11.6 Conceptual advantages of continuous processing applied to the oxidation of alcohols.
OHPh Ph CHO
(i)
(i) NaOCl (aq), TEMPO (1 mol %), Bu4NBr (5 mol %), toluene, 0oC, residence time 172 seconds
Scheme 11.7 The oxidation of 2 - phenylethanol using a spinning tube in tube reactor.
5) Another signifi cant by - product is the ester formed by reaction of the aldehyde with the starting alcohol to give the hemi - acetal, which is then oxidized up to the ester.
Hampton and co - workers have published the TEMPO - catalyzed oxidation of alcohols using a spinning tube in tube reactor [11] . In this type of reactor, residence times of 1 – 3 min are possible, and, as seen in Scheme 11.7 , an excellent yield (94 – 96%) of the aldehyde product (2 - phenylethanal) can be obtained using toluene as solvent. Figure 11.9 shows the design of the reactor. In this type of reactor the reagents are introduced into the gap between a rapidly rotating rotor (100 – 12000 RPM) and a stationary outer cylinder. Heat exchangers surround the stationary outer cylinder and allow for effi cient temperature control of the reactor. These rapidly rotating systems set up Taylor vortexes, which keep the residence distribu-tions narrow. The reaction takes place in the gap between the rotor and the stator. Parameters that can be varied include the rotor speed, the fl ow rate, and the resi-dence time in the reactor.
Phoenix technologies have developed and scaled up to pilot scale a procedure using a variable - time reactor [12] . The procedure uses TEMPO, catalyst, bleach,

234 11 Continuous Processing in the Pharmaceutical Industry
Input 2
Input 1
Gap
Rotor
Stator
Stator
Output
rotor shaftto motor
Figure 11.9 Simplifi ed diagram of a spinning tube reactor.
N
F
FN N
F
NH2
H
H
OHO2C
PhCH2N
O
O
Br NO2
PhCH2N
O
O
H
NO2
H
Trovafloxacin 10
base
11
Scheme 11.8 Trovafl oxacin synthesis.
and toluene rather than a chlorinated solvent and results in a signifi cant reduction in the level of over - oxidation. Fritz - Langhals has reported bleach - based oxidations of a variety of alcohols using 4 - hydroxy - TEMPO as the catalyst in a tube reactor using dichloromethane as solvent [13] .
11.5 Continuous Production of Bromonitromethane
Bromonitromethane is a key starting material for the preparation of the broad - spectrum antibiotic trovafl oxacin ( 10 ), which contains the interesting 3 - azabicy-clo[3.1.0]hexane ring system. Pfi zer chemists found that the base - catalyzed reaction of bromonitromethane with N - benzylmaleimide effi ciently assembled the key bicyclic adduct 11 in high yield and with the required exo stereochemistry [14] . The exo addition product 11 could then be converted (Scheme 11.8 ) to trova-fl oxacin ( 10 ) [15] .

11.6 Continuous Production and Use of Diazomethane 235
The trovafl oxacin development program therefore required bulk supplies of bromonitromethane, which can be produced by the bromination of nitromethane. However, there are a number of problems associated with this direct bromination route:
• The bromination is very exothermic (10 ° C to 40 ° C in 2.5 s in batch mode). • The reaction is very fast, with a half - life of < 1 s, which classifi es it as a Type A
reaction in the analysis of Roberge [16] . • The reaction is diffi cult to control in batch mode, with ready over - bromination
to the di - and tribromo products. • The chemistry involves an unstable/explosive nitronate intermediate [17] ;
bromonitromethane is a class I explosive. • The reaction mixture and products are highly corrosive, toxic, and very
lachrymatory.
To address these problems, Phoenix has manufactured bromonitromethane using continuous processing technology in a plant that was engineered to fi t the chem-istry. The bromination was carried out in low - volume static mixer tubes, allowing effi cient heat transfer and accurate process control.
The initial reaction of nitromethane with aqueous sodium hydroxide for a 10 s reaction period generated the nitronate salt. After passage through a heat exchanger to cool the mixture to 5 ° C, the nitronate salt was passed through a bromination reactor (2.5 s residence time), producing an aqueous mixture of bromonitrometh-ane and sodium bromide. The bromination reaction was terminated by continuous addition of aqueous sodium bisulfi te solution to minimize over - bromination. Phase separation and product washing operations then yielded the product stream, with the fl ow process subject to hourly on - line GC analysis. The bromonitrometh-ane was automatically separated into lots whose disposition was determined by the process control system, the purchasing specifi cation requiring < 1.5% dibrom-onitromethane in the product. Suitable batches underwent automated dilution with toluene, the 40% w/w solution was dried by passage through columns of molecular sieve, and the batches were drummed up. The drying columns were themselves subject to automatic regeneration as part of the overall fl ow process.
This continuous production process ensured safe operation by minimizing the inventory of all reactants and intermediates. The entire production platform was of low footprint, approximately the size of a family - sized garage, and involved a capital investment of less than $100 K. This plant had the capacity to manufacture bromonitromethane at the rate of 200 t y − 1 .
11.6 Continuous Production and Use of Diazomethane
Diazomethane, CH 2 N 2, is a toxic, highly reactive, potentially explosive gas [18] . It is often used for the rapid and quantitative methylation of acidic OH groups
and for the conversion of activated acids to diazo ketones, which are versatile

236 11 Continuous Processing in the Pharmaceutical Industry
NH
HO
NH
OHN
S
O
OH
NH2
S
ONH2
S
OH
Cl
NH2
S
O
ClCHN2
NH2
S
O
nelfinavir (Pfizer/Roche)
Scheme 11.9 Retrosynthesis of nelfi navir.
intermediates in organic synthesis [19] . For pharmaceutical applications, a key area is the preparation of chiral β - chloro alcohols (and/or the corresponding chiral epoxides) from diazoketones. These fi nd use as intermediates to HIV protease inhibitors (Scheme 11.9 ) [20] .
Clearly, a number of synthetic choices exist to access such chiral intermediates [21] . However, on large scale , going via diazoketones is an economical and direct route if diazomethane can be generated and safely used on a large enough scale.
Phoenix Chemicals in Merseyside, UK, designed and built a plant that can generate and handle in situ large quantities of this highly reactive substance.
Diazomethane is generated by the reaction of aqueous NaOH with N - methyl - N - nitroso - p - toluenesulfonamide (Diazald ® ) in DMSO. The diazomethane is gener-ated quantitatively and is removed by a stream of N 2 into a packed column containing a stream of mixed anhydride formed from an N - protected (BOC or CBZ) amino acid and ethyl chloroformate. The diazoketone is converted to the chloroketone using HCl, as shown in Scheme 11.10 . The chiral epoxide can then be formed via diastereoselective reduction with NaBH 4 and treatment with base.
In summary, the process consists of
• 4 reaction stages • 2 washing stages • 2 abatement management stages • 1 waste treatment stage • 1 evaporation/solvent recovery stage.
All stages are carried out continuously and are integrated together. Of course, extensive safety and engineering studies had to be completed to design and operate the plant. The use of continuous monitoring (chemical as well as environmental) is also employed to ensure safe running [20] . Of particular note is the use of mid - FT - IR and photoacoustic FT - IR for reaction monitoring, an example of which shown in Figure 11.10 .

11.6 Continuous Production and Use of Diazomethane 237
PHN CO2H
R
PHN
R
O
O
O
OEtPHN
R
O
CHN2
PHN
R
OCl
Diazald®
Stage 1
Stage 3
Stage 4
Stage 2
Protected amino acidMixed Anhydride Diazoketone
Chloroketone
CH2N2
Scheme 11.10 Diazoketone process.
Diazoketone
Mixed anhydride
1.400
Abs
1.200
1.000
0.8000
0.6000
0.4000
3500 3000 2500 2000Wavenumber (cm–1)
1500 1000
0.2000
0.0
Figure 11.10 Mid - FT IR monitoring of reaction of diazomethane with mixed anhydride.
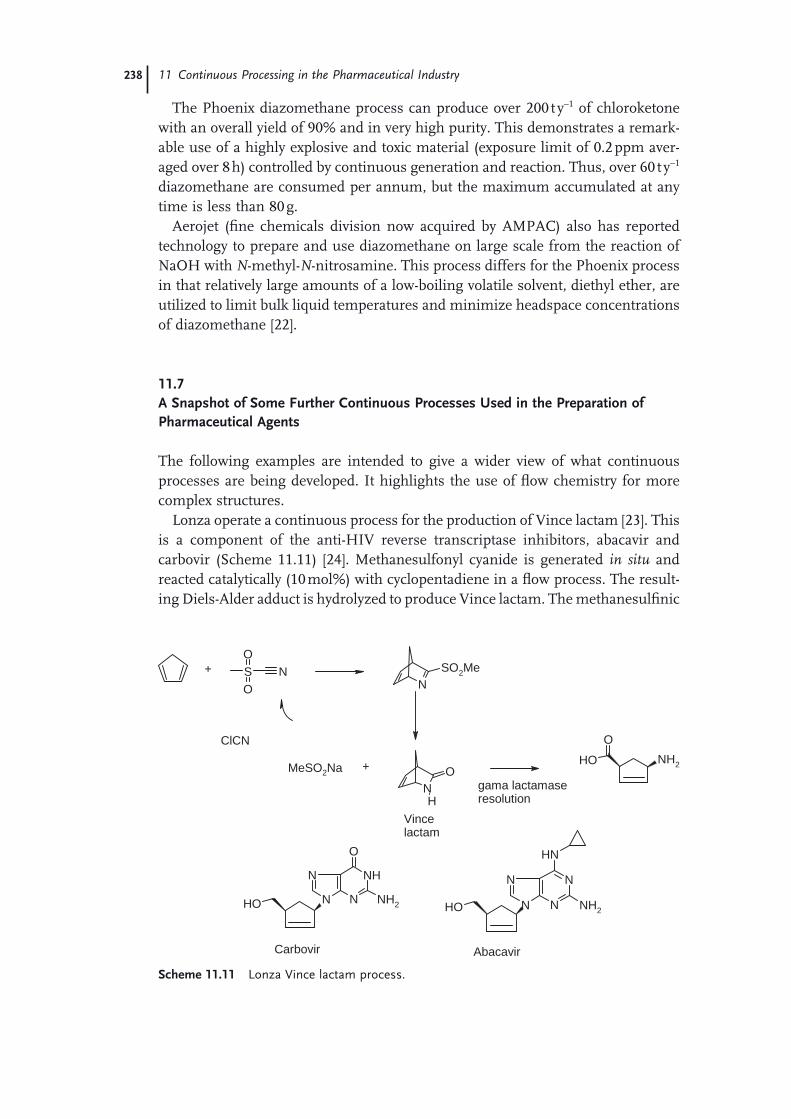
238 11 Continuous Processing in the Pharmaceutical Industry
The Phoenix diazomethane process can produce over 200 t y − 1 of chloroketone with an overall yield of 90% and in very high purity. This demonstrates a remark-able use of a highly explosive and toxic material (exposure limit of 0.2 ppm aver-aged over 8 h) controlled by continuous generation and reaction. Thus, over 60 t y − 1 diazomethane are consumed per annum, but the maximum accumulated at any time is less than 80 g.
Aerojet (fi ne chemicals division now acquired by AMPAC) also has reported technology to prepare and use diazomethane on large scale from the reaction of NaOH with N - methyl - N - nitrosamine. This process differs for the Phoenix process in that relatively large amounts of a low - boiling volatile solvent, diethyl ether, are utilized to limit bulk liquid temperatures and minimize headspace concentrations of diazomethane [22] .
11.7 A Snapshot of Some Further Continuous Processes Used in the Preparation of Pharmaceutical Agents
The following examples are intended to give a wider view of what continuous processes are being developed. It highlights the use of fl ow chemistry for more complex structures.
Lonza operate a continuous process for the production of Vince lactam [23] . This is a component of the anti - HIV reverse transcriptase inhibitors, abacavir and carbovir (Scheme 11.11 ) [24] . Methanesulfonyl cyanide is generated in situ and reacted catalytically (10 mol%) with cyclopentadiene in a fl ow process. The result-ing Diels - Alder adduct is hydrolyzed to produce Vince lactam. The methanesulfi nic
N
NN
N NH2
NH
NOH N
NHN
O
NH2 OH
OH NH2
O
NO
H
S NO
O NSO2Me
gama lactamaseresolution
+
+MeSO2Na
ClCN
AbacavirCarbovir
Vincelactam
Scheme 11.11 Lonza Vince lactam process.

11.7 A Snapshot of Some Further Continuous Processes Used in the Preparation 239
acid is recovered and converted back to methanesulfonyl cyanide with cyanogen chloride. Changing from a stoichiometric process to this catalytic fl ow process reduced the number of unit operations from 17 to 12 and reduced the waste by 35% [25] . Of course, the inventory of toxic and unstable methanesulfonyl cyanide and cyanogen chloride is minimized in this process. Effi cient and very cost - effective production of intermediates like Vince lactam is crucial if vital anti - AIDS medications are to be made available and affordable as therapies for use in third world countries. Lonza production of Vince lactam is ∼ 50 tonnes per year at a cost of ∼ $70 kg − 1 [26] .
DSM has recently announced the successful scale - up in a fl ow micro reactor of a hazardous nitration (nitrate ester synthesis) to produce signifi cant quantities of the API naproxcinod produced to current good manufacturing practice ( cGMP ) standards (Scheme 11.12 ). Twenty - fi ve tonnes of material was processed in four weeks [27] . Nitrations are highly exothermic and prone to thermal runaway, so are ideal candidate reactions for conversion to fl ow reactors. DSM utilized the Corning glass micro reactor system that has also been successfully used in the scale - up of aldol chemistry, oxidation, and organometallic chemistries (50 – 100 tonnes of product per year) [28] .
OMeO
OO
O2N
Scheme 11.12 Naproxcinod.
It would be true to say that while most pharmaceutical companies have had on - going internal interests in automation and fl ow chemistry on the nano and micro scales for some time, the uptake of continuous processing ‘ in house ’ to manufacture multikilogram or tonnage quantities of intermediates or APIs has been more erratic. A possible reason for this is the fairly common myth that ‘ fl ow processes cannot be validated for cGMP manufacture ’ . While space does not permit a comprehensive review of all activities in this area, a few examples are worthy of note to show what can be achieved. Bristol Myers Squibb ( BMS ) is one of the leaders in this fi eld [29] . Some examples from the patent literature show the use of various fl ow reactors to run highly exothermic oxidation reactions by mini-mizing the inventory of unstable high - energy materials. Scheme 11.13 shows the oxidation of an imide enolate used to generate 6 - hydroxybuspirone, an agent for use in the area of central nervous system ( CNS ) therapy. The enolate and reductant (e.g., triethylphosphite) are reacted with O 2 in a counter - current trickle bed fl ow reactor, the initially generated hydroperoxide being reduced in situ to the alcohol. Extensive use of modern analytical technologies, especially PAT techniques like FT - IR are employed for process monitoring and control. The process was scaled up to produce over 100 kg of the desired product [30] .
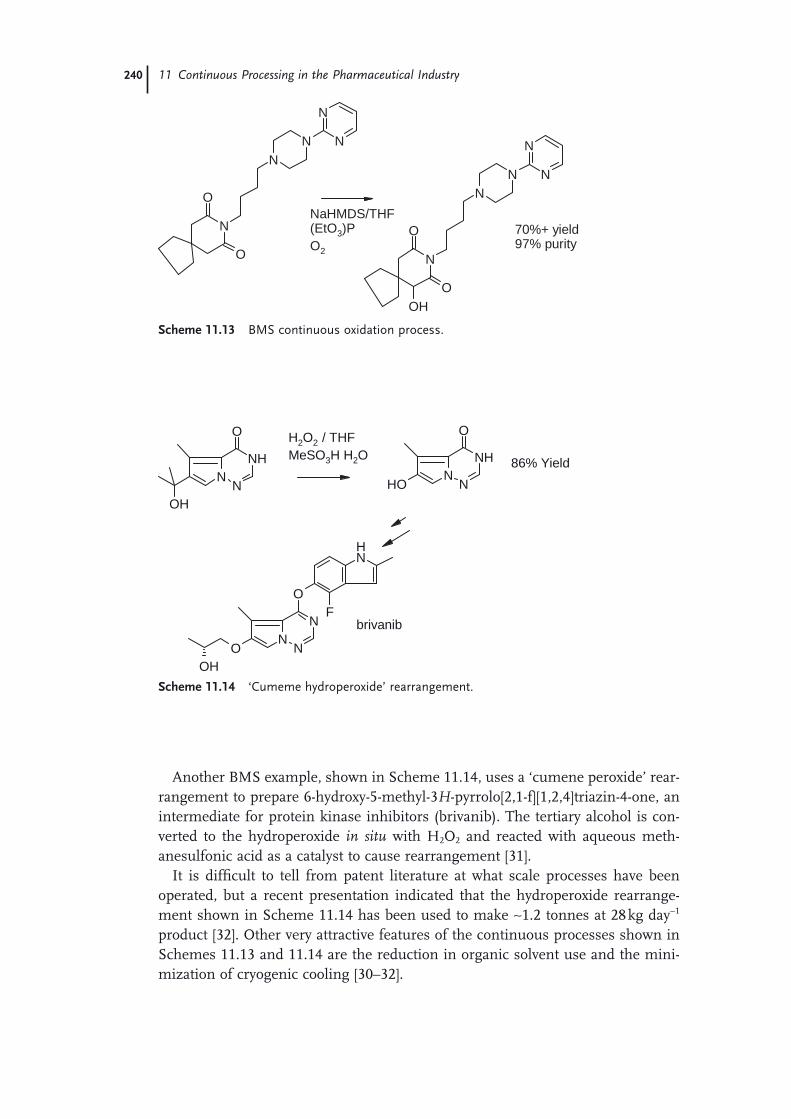
240 11 Continuous Processing in the Pharmaceutical Industry
N
NNN
N
O
O
N
NNN
N
O
O
OH
70%+ yield97% purity
NaHMDS/THF(EtO3)PO2
Scheme 11.13 BMS continuous oxidation process.
N
NHN
O
OHN
NHN
O
OH
N
NN
O
OF
NH
OH
H2O2 / THFMeSO3H H2O 86% Yield
brivanib
Scheme 11.14 ‘ Cumeme hydroperoxide ’ rearrangement.
Another BMS example, shown in Scheme 11.14 , uses a ‘ cumene peroxide ’ rear-rangement to prepare 6 - hydroxy - 5 - methyl - 3 H - pyrrolo[2,1 - f][1,2,4]triazin - 4 - one, an intermediate for protein kinase inhibitors (brivanib). The tertiary alcohol is con-verted to the hydroperoxide in situ with H 2 O 2 and reacted with aqueous meth-anesulfonic acid as a catalyst to cause rearrangement [31] .
It is diffi cult to tell from patent literature at what scale processes have been operated, but a recent presentation indicated that the hydroperoxide rearrange-ment shown in Scheme 11.14 has been used to make ∼ 1.2 tonnes at 28 kg day − 1 product [32] . Other very attractive features of the continuous processes shown in Schemes 11.13 and 11.14 are the reduction in organic solvent use and the mini-mization of cryogenic cooling [30 – 32] .

References 241
11.8 Conclusions
Although a number of recent examples of the use of continuous processing in the pharmaceutical industry are presented in this chapter, it is the view of the authors that the pharmaceutical industry has barely scratched the surface of the opportuni-ties that continuous processing offers. According to an analysis of the kinetics of reactions carried out in the fi ne chemical and pharmaceutical industry, up to 50% of these reactions may be advantageously using continuous processes [16] . The frequent presence of a solid phase currently still hinders the widespread adoption of this technology as a multi - purpose solution, but its application to APIs such as celecoxib and naproxcinod and increasing pricing pressure on pharmaceuticals suggest that wider adoption is inevitable. Broad implementation of continuous processing will require close collaboration between chemists and engineers, and ultimately a mindset change among the chemists devising early synthetic routes. We believe that applying continuous processing to pharmaceutical syntheses will offer many possibilities to improve either the cost effectiveness or the environ-mental performance, ideally both.
Acknowledgments
We would like to thank the entire Phoenix team, in particular Tony Warr, Elliot Latham, Colin Leece, Peter McCormack, Jonathon Eddols, Stuart Grieg, Ian Howells, and Anne Hodgson. We thank all the members of the celecoxib team at Pfi zer, in particular Steven Guiness, David am Ende, Robert Jackson, Jose Garrido, and Tracy Fox.
References
1 Clark , J.H. ( 2006 ) Green Chem. , 6 , 17 – 21 . 2 Sheldon , R.A. ( 1992 ) Chem. Ind.
(London) , 903 – 906 ; Sheldon , R.A. ( 2007 ) Green Chem. , 9 , 1273 .
3 Carey , J.S. , Laffan , D. , Thomson , C. , and Williams , M.T. ( 2006 ) Org. Biomol. Chem. , 4 , 2337 – 2347 .
4 Ainsworth , S.J. ( 2008 ) Chem. Eng. News , 86 , 15 – 24 , December 01 (using source data from IMS Health, MIDAS).
5 The oxidation system installed by Kurion is shown in the top photograph at http://www.kurion.co.uk/uv6_oxidation.html . Pines , S.H. ( 2004 ) Org. Process Res. Dev. , 8 , 708 – 724 .
6 Hawkins , J.M. , Guiness , S. , Jackson , R.P. , and am Ende , D.J. ( 2008 ) 15th
International Process Development Conference, Annapolis, Maryland, May 21, 2008 .
7 Letendre , L.J. , McGhee , W.D. , Snoddy , C. , Klemm , G. , and Gaud , H.T. ( 2003 ) PCT Int. Appl. WO 2003099794 .
8 Pines , S.H. ( 2004 ) Org. Process Res. Dev. , 8 , 708 – 724 .
9 Anelli , P.L. , Biffi , C. , Montanari , F. , and Quici , S. ( 1987 ) J. Org. Chem. , 52 , 2559 – 2562 . de Nooy , A.E.J. , Besemer , A.C. , and van Bekkam , H. ( 1996 ) Synthesis , 1153 – 1174 .
10 Barnett , C.J. , Wilson , T.M. , and Kobierski , M.E. ( 1999 ) Org. Process Res. Dev. , 3 , 184 – 188 . For examples from other companies see Anthes , R. , Bello ,

242 11 Continuous Processing in the Pharmaceutical Industry
O. , Benoit , S. , Chen , C. - K. , Corbett , E. , Corbett , R.M. , DelMonte , A.J. , Gingras , S. , Livingstone , R. , Sausker , J. , and Soumeillant , M. ( 2008 ) Org. Process Res. Dev. , 12 , 168 – 177 ; Pearce , M.E. , Harris , G.D. , Islam , Q. , Radesca , L.A. , Storace , L. , Waltermire , R.E. , Jadhav , P.K. , and Emmett , G.C. ( 1996 ) J. Org. Chem. , 61 , 444 – 450 .
11 Hampton , P.D. , Whealon , M.D. , Roberts , L.M. , Yaeger , A.A. , and Boydson , R. ( 2008 ) Org. Process Res. Dev. , 12 , 946 – 949 .
12 Presented by Proctor , L. , Leece , C. , and McCormack , P. ( 2008 ) AstraZeneca, 20th July, 2008.
13 Fritz - Langhals , E. ( 2005 ) Org. Process Res. Dev. , 9 , 577 – 582 .
14 Ray , S.J. , and Rumpus , J.A. (1997) World Patent 9719921 .
15 Norris , T. , Braish , T.F. , Butters , M. , DeVries , K.M. , Hawkins , J.M. , Massett , S.S. , Rose , P.R. , Santafi anos , D. , and Sklavounos , C. ( 2000 ) J. Chem. Soc. Perkin Trans. 1 , 1615 – 1622 .
16 Roberge , D.M. , Ducry , L. , Bieler , N. , Cretton , P. , and Zimmermann , B. ( 2005 ) Chem. Eng. Technol. , 28 ( 3 ), 318 – 323 ; Roberge , D.M. ( 2004 ) Org. Process Res. Dev. , 8 , 1049 – 1053 .
17 The instability and hazardous nature of alkali metal salts of nitromethane has been reported by Rowe , S.M. (Chilworth Technology Ltd.) ( 2000 ) Mettler Toledo Reaction Calorimetry and In - situ Spectroscopic Analysis Seminar , Chilworth Technology Ltd. , Manchester, UK .
18 Moore , J.A. , and Reed , D.E. (1973) ‘ Diazomethane ’ Organic Syntheses Collective, John Wiley & Sons , vol. 5 , p. 351 .
19 Doyle , M.P. , McKervey , M.A. , and Ye , T. ( 1998 ) Modern Catalytic Methods for
Organic Synthesis with Diazo Compounds , John Wiley & Sons, Inc. , New York .
20 Proctor , L.D. , and Warr , A.J. ( 2002 ) Org. Process Res. Dev. , 6 , 884 – 892 .
21 Izawa , I. , and Onishi , T. ( 2004 ) Chem Rev. , 106 , 2811 – 2827 .
22 Archibald , T.G. ( 2000 ) Chimica Oggi , 18 , 34 – 38 .
23 Griffi ths , G.J. , and Previdoli , F.E. ( 1993 ) J. Org. Chem. , 58 , 6129 – 6131 .
24 Roberts , S.M. ( 1998 ) Idrugs , 1 , 896 – 899 . 25 Rouhi , A.M. ( 2003 ) Chem. Eng. News , 81 ,
40 . 26 Pinheiro , E.D. - S. , Antunes , O.A.C. , and
Fortunak , J.M.D. ( 2007 ) Antiviral Res. , 79 , 143 – 165 .
27 Braune , S. , Poechlauer , P. , Reintjens , R. , Steinhofer , S. , Winter , M. , Lobet , O. , Guidat , R. , Woehl , P. , and Guermeur , C. ( 2009 ) Chimica Oggi , 27 ( 1 ), 26 – 29 ; Braune , S. , Steinhofer , S. , Poechlauer , P. , Reintjens , R. , Wilhelmus , E. , Linssen , N. , Theodora , W. , and Thathagar , M. ( 2009 ) WO 2009080755 .
28 http://www.corning.com/r_d/emerg-ing_technologies/microreactor.aspx (accessed 7 January 2010).
29 Laporte , T.L. , and Wang , C. ( 2007 ) Curr. Opin. Drug Discov. Devel. , 10 , 738 – 745 .
30 LaPorte , T. , Hamedi , M. , DePue , J.S. , Shen , L. , Watson , D. , and Hsieh , D. ( 2008 ) Org. Process Res. Dev. , 12 , 956 – 966 ; WO 2005 048954.
31 Crispino , G.A. , Hamedi , M. , LaPorte , T.L. , Thornton , J.E. , Pesti , J.A. , Xu , Z. , Lobben , P.C. , Leahy , D.K. , Muslehid-dinoglu , J. , Lai , C. , Spangler , L.A. , and Discordia , R.P. ( 2007 ) US Patent 0249610 .
32 Lobben , P.C. ( 2007 ) 25th SCI Process Development Symposium, Cambridge, 7 December 2007 .

243
12 Preparative and Industrial Scale Chromatography: Green and Integrated Processes Eric Lang , Eric Val é ry , Olivier Ludemann - Hombourger , Wieslaw Majewski , and Jean Bl é haut
12.1 Introduction
Preparative chromatography is routinely used in medicinal chemistry for small quantities not exceeding a few grams, but at a larger scale this technique is often discouraged. In the fi eld of process organic chemistry, resorting to preparative chromatography is often perceived as a failure especially because this method is seen as solvent - consuming, inconvenient, and expensive. Although this may have been true a few decades ago, it is no longer the case. Preparative chromatography is now well adapted to development and commercial scales, with fully automated equipment enabling fast and cost - effective separations with little impact on the environment.
Process optimization can, for example, reduce the solvent consumption of proc-esses by as much as a factor of 100. Also, equipment providing effi cient solvent recycling can be integrated in the separation process to minimize the amount of fresh eluent to be added. Fortunately, awareness of the benefi ts of large - scale chromatography is on the rise [1 – 3] , as is the number of molecules being purifi ed using this technique, and habits are consequently starting to change.
In this chapter, a brief overview of the basics of modern preparative chromatog-raphy is presented, followed by a review of the means of reducing eluent consump-tion using process optimization and continuous chromatography techniques. The replacement of organic solvents with supercritical carbon dioxide as a green solvent is also described. The rest of the chapter is dedicated to the integration of eluent recycling into the chromatographic process. All of these points will be illustrated by two case studies.
Green Chemistry in the Pharmaceutical Industry. Edited by Peter J. Dunn, Andrew S. Wells and Michael T. Williams© 2010 WILEY-VCH Verlag GmbH & Co. KGaA, WeinheimISBN: 978-3-527-32418-7

244 12 Preparative and Industrial Scale Chromatography: Green and Integrated Processes
12.2 Basic Principles of Chromatography
Chromatography is based on using different product affi nities between a station-ary phase packed in a column and a percolating mobile phase. Once injected, a component with a strong affi nity for the stationary phase will be retained inside the column more than a component with a lower affi nity. Consequently, compo-nents move at different speeds inside the column and exit at different times, leading to their separation [4] .
Chromatography is a well - known analytical method, but is also a validated industrial purifi cation tool. However, the preparative or production approach is very different from the analytical one. In analytical chromatography, the focus is on analyzing a mixture in order to separate the peaks of each component. The injected amount is small and peak resolution tends to be maximized. Column size is generally small in order to minimize analytical costs. An example of an analytical chromatogram is presented in Figure 12.1 .
For a preparative application, focus is on recovering the targeted products while optimizing production costs. The object of the separation is to reach the purity and recovery yield required for one or more specifi c components of the feed mixture. To maximize production, injections are made as often as possible. The amount of stationary phase used is set in order to minimize the costs of the product, equipment, and eluent consumption. Figure 12.2 presents the preparative chromatogram of the same compounds as in Figure 12.1 , where the injected amount is maximized in order to optimize the process [5] .
One of the most powerful aspects of chromatography is its scalability. Unlike most other processes, the scalability of chromatographic separation is linear, direct, and straightforward. Figure 12.3 depicts the separation of uracil and ace-tophenone on C18 stationary phase. Figure 12.3 a shows the chromatogram of the separation done on an analytical column with an internal diameter (id) of 4.6 mm,
0 5 10 15 20 25 30
0.0
0.2
0.4
0.6
0.8
Inte
nsity
(A
U)
1.0
1.2
Figure 12.1 Analytical chromatogram of a racemic 1 - azabicyclo[2.2.2]octyl derivative. Chiralcel OJ 20 μ m, MeOH + 0.1% DEA, fl ow rate = 1 mL min − 1 , injected amount = 10 μ g.
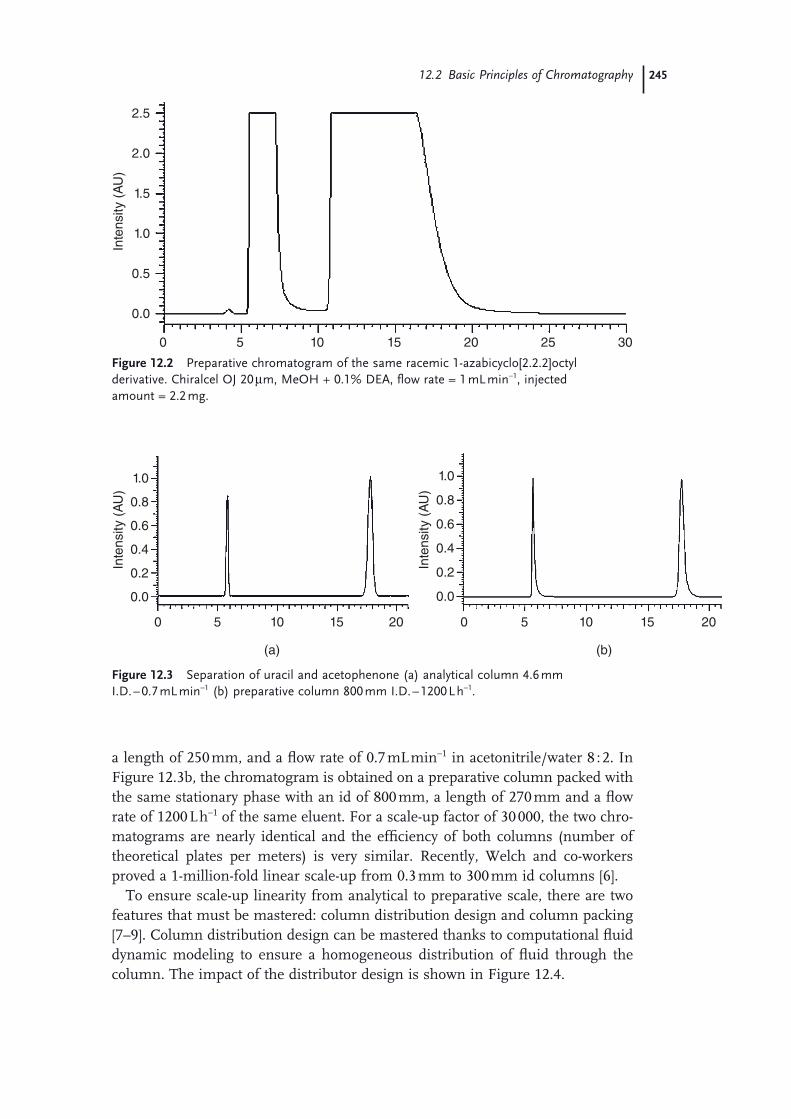
12.2 Basic Principles of Chromatography 245
a length of 250 mm, and a fl ow rate of 0.7 mL min − 1 in acetonitrile/water 8 : 2. In Figure 12.3 b, the chromatogram is obtained on a preparative column packed with the same stationary phase with an id of 800 mm, a length of 270 mm and a fl ow rate of 1200 L h − 1 of the same eluent. For a scale - up factor of 30 000, the two chro-matograms are nearly identical and the effi ciency of both columns (number of theoretical plates per meters) is very similar. Recently, Welch and co - workers proved a 1 - million - fold linear scale - up from 0.3 mm to 300 mm id columns [6] .
To ensure scale - up linearity from analytical to preparative scale, there are two features that must be mastered: column distribution design and column packing [7 – 9] . Column distribution design can be mastered thanks to computational fl uid dynamic modeling to ensure a homogeneous distribution of fl uid through the column. The impact of the distributor design is shown in Figure 12.4 .
0 5 10 15 20 25 30
0.0
0.5
1.0
1.5
2.0
Inte
nsity
(A
U)
2.5
Figure 12.2 Preparative chromatogram of the same racemic 1 - azabicyclo[2.2.2]octyl derivative. Chiralcel OJ 20 μ m, MeOH + 0.1% DEA, fl ow rate = 1 mL min − 1 , injected amount = 2.2 mg.
0 5 10
(a)
15 20
0.0
0.2
0.4
0.6
1.0
0.8
Inte
nsity
(A
U)
0 5 10
(b)
15 20
0.0
0.2
0.4
0.6
1.0
0.8
Inte
nsity
(A
U)
Figure 12.3 Separation of uracil and acetophenone (a) analytical column 4.6 mm I.D. – 0.7 mL min − 1 (b) preparative column 800 mm I.D. – 1200 L h − 1 .

246 12 Preparative and Industrial Scale Chromatography: Green and Integrated Processes
Correct column packing is obtained by using preparative columns equipped with dynamic axial compression ( DAC ) technology [10, 11] . The column includes a movable piston attached to a hydraulic jack. The piston is used to pack and unpack the column and to maintain the stationary phase under dynamic compres-sion, ensuring perfect particle stacking (Figure 12.5 ) and bed stability through time.
12.3 Process Optimization to Reduce Eluent Consumption
Many processes have been developed to improve chromatographic performance and to decrease their environmental impact. The following paragraphs will focus
Figure 12.4 Mastering column distribution design. On the left - hand side are shown computational fl uid dynamic modeling results, and on the right - hand side are displayed pictures of the stationary phase cross section after an experiment with a dye (fl ow goes from the bottom to the top) (a) without a distributor, and (b) with a correctly designed distributor.
Figure 12.5 SEM image of the stationary phase: (a) after a packing by sedimentation (random packing), and (b) after a packing using a DAC system (hexagonal close packing).
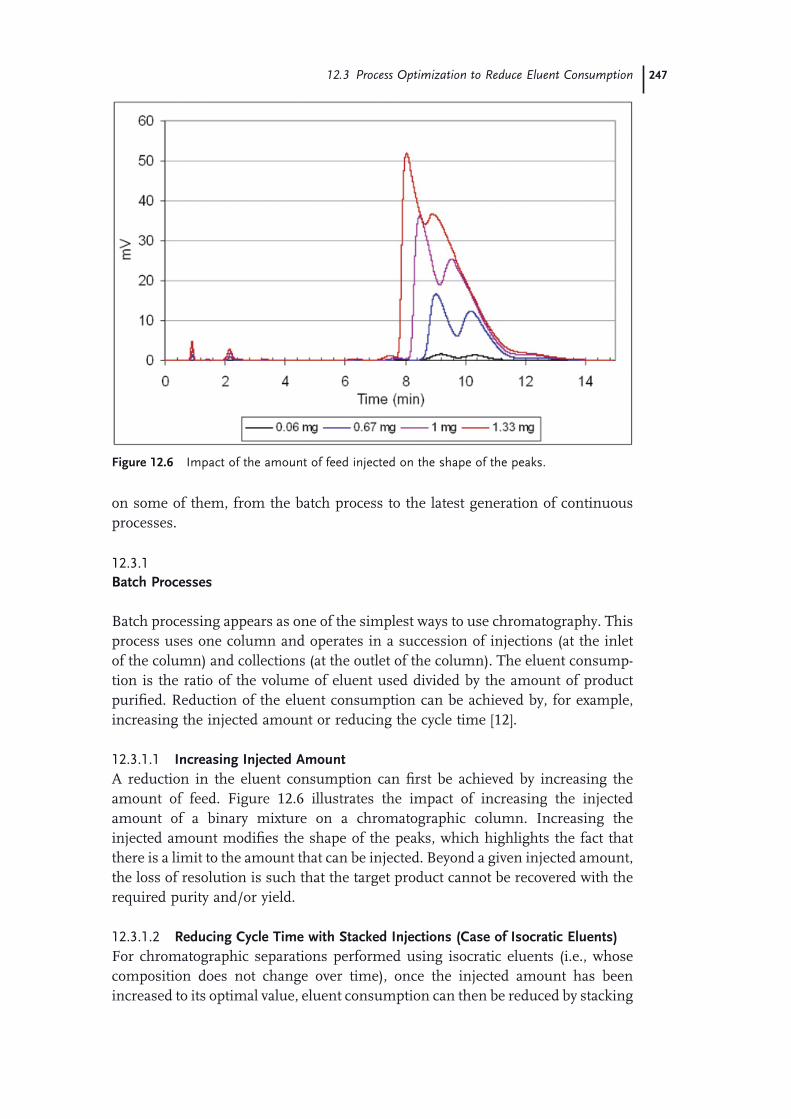
12.3 Process Optimization to Reduce Eluent Consumption 247
on some of them, from the batch process to the latest generation of continuous processes.
12.3.1 Batch Processes
Batch processing appears as one of the simplest ways to use chromatography. This process uses one column and operates in a succession of injections (at the inlet of the column) and collections (at the outlet of the column). The eluent consump-tion is the ratio of the volume of eluent used divided by the amount of product purifi ed. Reduction of the eluent consumption can be achieved by, for example, increasing the injected amount or reducing the cycle time [12] .
12.3.1.1 Increasing Injected Amount A reduction in the eluent consumption can fi rst be achieved by increasing the amount of feed. Figure 12.6 illustrates the impact of increasing the injected amount of a binary mixture on a chromatographic column. Increasing the injected amount modifi es the shape of the peaks, which highlights the fact that there is a limit to the amount that can be injected. Beyond a given injected amount, the loss of resolution is such that the target product cannot be recovered with the required purity and/or yield.
12.3.1.2 Reducing Cycle Time with Stacked Injections (Case of Isocratic Eluents) For chromatographic separations performed using isocratic eluents (i.e., whose composition does not change over time), once the injected amount has been increased to its optimal value, eluent consumption can then be reduced by stacking
Figure 12.6 Impact of the amount of feed injected on the shape of the peaks.

248 12 Preparative and Industrial Scale Chromatography: Green and Integrated Processes
the injections as shown in Figure 12.7 . Using a standard injection process (Figure 12.7 a), a new injection is done once the last compound exits the column. Using this primary sequence, injections can be repeated every 14 min. This method is therefore not the optimum since the eluent takes 7.5 min to exit the column without carrying any product. However, it clearly appears on Figure 12.9 a that the total duration of the collection is only 6.5 minutes.
The best idea is therefore to inject every 6.5 min, so that the feed injections occur in a ‘ non - empty column ’ as the previous injection is still inside the column. Con-sidering the example of Figure 12.7 a, and performing three stacked injections separated by 6.5 minutes, the chromatogram shown in Figure 12.7 b is obtained. The difference between the primary sequence and the stacked injections is a reduc-tion of cycle time from 14 min to 6.5 min. Considering that the eluent is continu-ously injected during one day, 102.8 injections can be performed using the primary method and 221.5 injections using stacked injections. This very simple approach allows the eluent consumption to be decreased by a factor of more than two (Figure 12.8 ).
12.3.1.3 Reducing Cycle Time Using Gradients Some complex mixtures contain components with very different affi nities with the stationary phase, and, as a consequence, the retention times will vary greatly.
1stInjection
2ndInjection
(a) Standard Injections
0 5 10 15Time (min)
Separation Time Separation Time
20 25 300
1
2
3
4
1stInjection
2ndInjection
Cycle Time
Cycle Time
3rdInjection
(b) Staked Injections
0 5 10 15Time (min)
Separation Time
20 25 300
1
2
3
4
Figure 12.7 Use of stacked injections to decrease cycle time.
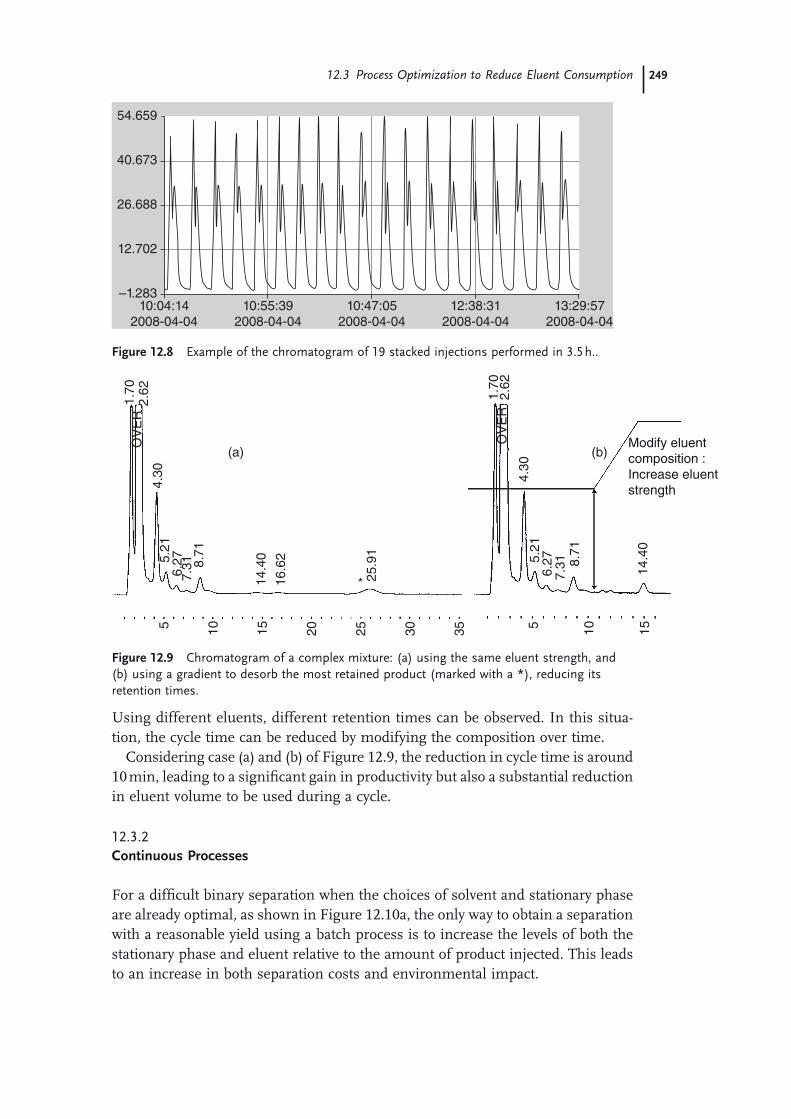
12.3 Process Optimization to Reduce Eluent Consumption 249
Using different eluents, different retention times can be observed. In this situa-tion, the cycle time can be reduced by modifying the composition over time.
Considering case (a) and (b) of Figure 12.9 , the reduction in cycle time is around 10 min, leading to a signifi cant gain in productivity but also a substantial reduction in eluent volume to be used during a cycle.
12.3.2 Continuous Processes
For a diffi cult binary separation when the choices of solvent and stationary phase are already optimal, as shown in Figure 12.10 a, the only way to obtain a separation with a reasonable yield using a batch process is to increase the levels of both the stationary phase and eluent relative to the amount of product injected. This leads to an increase in both separation costs and environmental impact.
(a) (b)
5.21
6.27
1.70
OV
ER
2.62
OV
ER
2.62
4.30 4.30
7.31 8.
71
14.4
0 5.21
6.27
7.31 8.
71
14.4
0
5 10 15 5 10 1520 25 3530
16.6
2
25.9
1
*
1.70
Modify eluent composition :Increase eluent strength
Figure 12.9 Chromatogram of a complex mixture: (a) using the same eluent strength, and (b) using a gradient to desorb the most retained product (marked with a *), reducing its retention times.
10:04:142008-04-04
–1.283
12.702
26.688
40.673
54.659
10:55:392008-04-04
10:47:052008-04-04
12:38:312008-04-04
13:29:572008-04-04
Figure 12.8 Example of the chromatogram of 19 stacked injections performed in 3.5 h..

250 12 Preparative and Industrial Scale Chromatography: Green and Integrated Processes
However, much of the stationary phase and eluent inside the column is not in contact with the product, even in the case of stacked injections. To utilize the unused stationary phase and eluent to perform the separation, the mixture is re - introduced at the inlet of the column via a loop, as depicted in Figure 12.10 b. In this way, separated compounds can be collected continuously while both feed mixture and eluent are injected continuously. Thus, the whole process becomes continuous. 1)
Figure 12.10 From batch to multi - column continuous chromatography.
1) Semi - continuous processes such as steady - state recycling also exist; however, they are beyond the scope of this chapter [11 – 14].

12.3 Process Optimization to Reduce Eluent Consumption 251
One way to achieve this is to replace the column by a loop of three to six smaller columns, as shown in Figure 12.10 c. This is the principle of multi - column con-tinuous chromatography ( MCC ). Since only pure fractions are collected, leaving mixed fractions to re - circulate through the columns, there is no need to achieve a complete separation. Inlet (eluent, feed) and outlet (extract – most retained com-ponent, raffi nate – least retained component) streams are moved periodically by one column according to the direction of the liquid fl ow and following the con-centration profi le inside the column.
Continuous processes are more effi cient than batch processes, as the use of stationary phase is optimized and the amount of eluent needed for the purifi cation is signifi cantly reduced. The concentration of feed mixture inside the column can be much higher than it is in the case of a batch process. As a consequence, pro-ductivity is multiplied by a factor of two to fi ve, less manpower is required, usage of stationary phase is optimized, and the amount of solvent used is reduced by a factor of two to ten. Two multicolumn continuous chromatography processes have been commercially implemented at commercial scale for pharmaceutical chiral separations, these being the simulated moving bed ( SMB ) process and the Varicol ® process [15 – 17] .
In both the SMB and the Varicol ® processes, the columns are distributed between four zones, as shown in Figure 12.11 :
Zone 1: between the injection of eluent and withdrawal of the extract Zone 2: between the withdrawal of extract and the injection of feed Zone 3: between the injection of feed and withdrawal of the raffi nate Zone 4: between withdrawal of the raffi nate and the injection of eluent.
Zone 1
Zone 4 Zone 2
Zone 3
Eluent
Raffinate Feed
Extract
Figure 12.11 Zone distribution of a multi - column continuous chromatography process.
252 12 Preparative and Industrial Scale Chromatography: Green and Integrated Processes
In the SMB process, the number of columns in each zone is kept constant. It is therefore possible to characterize the repartition of the columns in each zone by specifying how many columns are distributed in the zones. For example, a con-fi guration of 1/2/2/1 in a 6 - column system represents a system where zones 1 and 4 always contain one column and zones 2 and 3 always contain two columns.
In the Varicol ® process, lines are shifted asynchronously. In this case, the column distribution between zones does not stay the same during the period, because lines are shifted at different times, so that the allocation changes accord-ingly. Since the number of columns in one zone is not constant over a period of time, the confi guration of columns contains non - integral numbers. For example, a confi guration of 0.5/1.5/1.5/0.5 in a 4 column system is possible. A Varicol ® process is more adaptable than an SMB one as more fl exible options are available for the repartition of columns. It is commonly observed that Varicol ® is 15 – 25% more productive than SMB (typically 5 or 6 columns are used in Varicol ® , whereas 6 to 8 columns are used in SMB) [11, 18] .
12.4 Use of a Green Solvent: Supercritical Carbon Dioxide
Even though preparative GC has been successfully implemented for some indus-trial scale separations of low - molecular - weight and/or volatile compounds, liquid eluents are by far the most common and competitive choice for preparative chro-matography. In the 1960s, Klesper proposed the use of supercritical carbon dioxide for eluting a chromatographic column and developed the fi rst Supercritical Fluid Chromatography ( SFC ) equipment [19] . This development opened a new window for potential applications of preparative chromatography [20] . SFC mainly uses supercritical CO 2 as eluent, as this compound has an acceptable critical pressure (73.8 bar) and its critical temperature is close to ambient conditions (31.1 ° C) [21] .
The ‘ solvent power ’ of supercritical carbon dioxide is relatively weak and is strongly linked to its density (controlled by pressure and temperature), but it can be increased by adding a polar organic solvent (referred to as co - solvent) such as methanol or acetonitrile.
This makes it possible to ‘ tune ’ solvent properties to optimize chromatographic separations. Because of the lower viscosity and higher diffusivity of supercritical fl uids compared to common solvents, a higher mobile phase velocity can be used in the column, leading to a higher process throughput than that of liquid chromatography.
CO 2 can be easily removed from the purifi ed product by decreasing the pressure of the collected fractions (the products are not soluble in the then gaseous CO 2 ). This reduces or, in some cases, eliminates the problem of organic solvent removal encountered with liquid eluents. It must be stressed that the use of CO 2 does not increase the greenhouse effect because it either comes from the chemical industry as a by - product or from natural processes like beverage fermentation. CO 2 , being

12.4 Use of a Green Solvent: Supercritical Carbon Dioxide 253
a natural ‘ ingredient ’ of the eco - system, is a ‘ green ’ , physiologically compatible solvent.
As shown in Figure 12.12 [11] , the SFC process incorporates a cycle of the eluent around its critical point. First, liquid CO 2 is compressed to the desired pressure P and adjusted to the required solvent power and separation selectivity (generally Pc < P < 4Pc, Pc being the critical pressure) [22] . The mixture to be separated is injected into the compressed eluent just before the column inlet. Then, the com-pressed and heated eluent elutes the mixture through a chromatographic column maintained at the same temperature as the eluent. This temperature should be near the critical temperature, T c , for which a supercritical fl uid exhibits its highest ‘ tuneable ’ properties (signifi cant change in density and solvent power versus pres-sure). The eluent leaving the column is then decompressed below its critical pres-sure and the supercritical solvent is transformed into a gas phase. The gaseous CO 2 can then be cleaned, condensed, and in - situ recycled. See Section 12.5.3 for more details about CO 2 recycling.
The elution pressure and temperature must be chosen carefully, because the variation of the solvent power modifi es the retention of the products and also the selectivity, as shown in Figures 12.13 and 12.14 .
Achieving suitable selectivity with pure CO 2 might require too high a pressure, for polar compounds, so pure supercritical CO 2 is often mixed with a co - solvent, modifi er or entrainer. A correctly chosen co - solvent can increase both solvent power and selectivity of chromatographic separations, as shown in Figure 12.15 , and will also strongly infl uence the solubility of the products in the selected eluent.
Liquid
Eluent
Heating
Compression C.P.
Condensation
Separation
Decompression
Column
Feed
SCF
GasPure
Product
Temperature
Pre
ssur
e
Figure 12.12 Principle of supercritical fl uid chromatography.

254 12 Preparative and Industrial Scale Chromatography: Green and Integrated Processes
For a separation with pure CO 2 eluent, the solvent power of the fl uid drastically decreases, leading to solute precipitation (if it is solid at the separation tempera-ture) and eluent - solute separation. When a co - solvent is used, the gaseous CO 2 is removed and the product is recovered in the liquid co - solvent; it is consequently at a much higher concentration than in batch liquid chromatography.
To summarize, separations using SFC are typically 3 to 5 times faster than with HPLC thanks to the low viscosity and high diffusivity of supercritical CO 2 . In
0 5 10 15 20
30°C
40°C
50°C
25
–100000
–50000
0
50000
100000
150000
200000
250000
300000
350000
Figure 12.13 Typical effect of elution temperature on the SFC separation: retention times increase with the temperature.
120 bar
150 bar
180 bar
0 5 10 15 20 25 30 35 40 min
500000
400000
300000
200000
100000
0
Figure 12.14 Typical effect of elution pressure on the SFC separation: retention times decrease when the pressure increases.

12.5 Solvent Recycling Technologies 255
addition, as the CO 2 evaporates, the isolation of the compound of interest is also very quick. This technique also uses 5 to 20 times less organic solvent than for HPLC.
Since a supercritical CO 2 is only a solvent, SFC can be applied to both batch and continuous processes. Supercritical fl uid simulated moving bed ( SF - SMB ) has been developed and tested [23 – 25] , and the principle is identical to standard liquid SMB plus the possibility to work with a pressure gradient that can further improve the performance of the system. Nevertheless, from an industrial point of view, SF - SMB is less interesting than liquid continuous chromatography. On one hand, for liquid SMB, solvent recycling can be so effective at very large scales that costs of eluent are minor (see below the example of the Keppra ® separation). On the other hand, SF - SMB is quite a complex technology, involving very high equipment costs at large scale.
Furthermore, although most of the CO 2 is recycled from the gas - liquid separa-tors, a substantial amount of dissolved CO 2 remains in the co - solvent recovered, which fl ashes away and is lost during the fi nal product recovery. Therefore, CO 2 losses in large - scale SFC systems often lead to higher production costs than those in liquid chromatography systems equipped with appropriate solvent recovery units, as discussed in the next section.
12.5 Solvent Recycling Technologies
The fi rst approach to reducing eluent consumption presented above was the opti-mization of chromatographic processes to reduce the amount of solvent used to
1.8% EtOH
3.7% EtOH
5.4% EtOH
7.1% EtOH
0 1 2 3 4 5 6 7 8 min
2500000
2000000
1500000
1000000
500000
0
Figure 12.15 Effect of a modifi er on the separation.
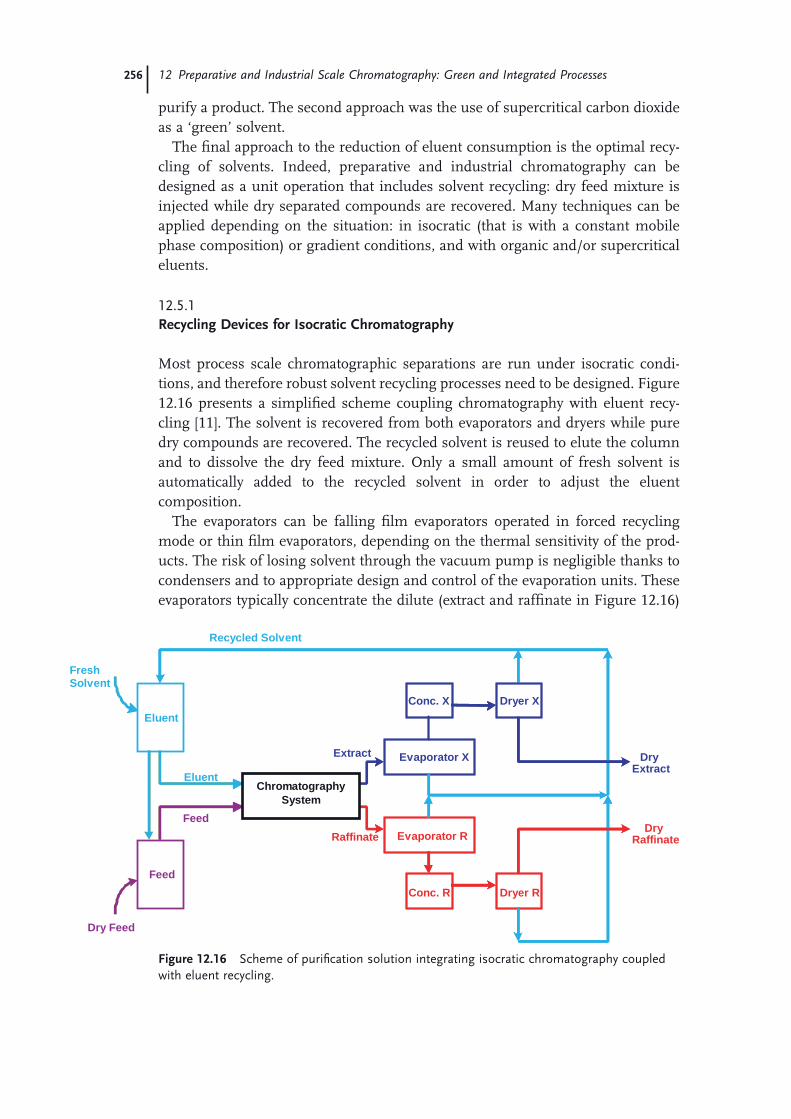
256 12 Preparative and Industrial Scale Chromatography: Green and Integrated Processes
purify a product. The second approach was the use of supercritical carbon dioxide as a ‘ green ’ solvent.
The fi nal approach to the reduction of eluent consumption is the optimal recy-cling of solvents. Indeed, preparative and industrial chromatography can be designed as a unit operation that includes solvent recycling: dry feed mixture is injected while dry separated compounds are recovered. Many techniques can be applied depending on the situation: in isocratic (that is with a constant mobile phase composition) or gradient conditions, and with organic and/or supercritical eluents.
12.5.1 Recycling Devices for Isocratic Chromatography
Most process scale chromatographic separations are run under isocratic condi-tions, and therefore robust solvent recycling processes need to be designed. Figure 12.16 presents a simplifi ed scheme coupling chromatography with eluent recy-cling [11] . The solvent is recovered from both evaporators and dryers while pure dry compounds are recovered. The recycled solvent is reused to elute the column and to dissolve the dry feed mixture. Only a small amount of fresh solvent is automatically added to the recycled solvent in order to adjust the eluent composition.
The evaporators can be falling fi lm evaporators operated in forced recycling mode or thin fi lm evaporators, depending on the thermal sensitivity of the prod-ucts. The risk of losing solvent through the vacuum pump is negligible thanks to condensers and to appropriate design and control of the evaporation units. These evaporators typically concentrate the dilute (extract and raffi nate in Figure 12.16 )
Dryer R
Evaporator X
Evaporator R
EluentConc. X
Conc. RFeed
Eluent
Feed
Recycled Solvent
Extract
Raffinate
DryExtract
DryRaffinate
Fresh Solvent
Dryer X
Dry Feed
Chromatography System
Figure 12.16 Scheme of purifi cation solution integrating isocratic chromatography coupled with eluent recycling.
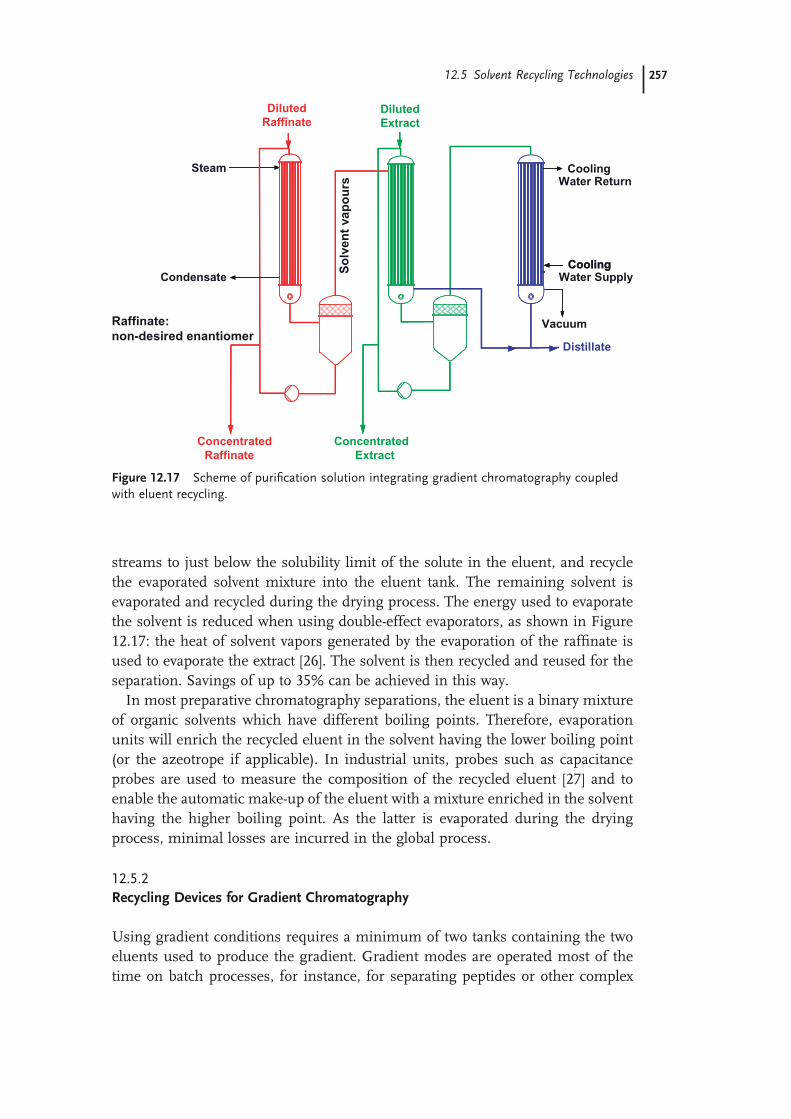
12.5 Solvent Recycling Technologies 257
Steam
Condensate
Diluted
Raffinate
Diluted
Extract
Concentrated
Raffinate
Concentrated
Extract
Vacuum
CoolingWater Supply
CoolingWater Return
Distillate
Raffinate:
non-desired enantiomerS
olv
en
tva
po
ur s
Cooling
Figure 12.17 Scheme of purifi cation solution integrating gradient chromatography coupled with eluent recycling.
streams to just below the solubility limit of the solute in the eluent, and recycle the evaporated solvent mixture into the eluent tank. The remaining solvent is evaporated and recycled during the drying process. The energy used to evaporate the solvent is reduced when using double - effect evaporators, as shown in Figure 12.17 : the heat of solvent vapors generated by the evaporation of the raffi nate is used to evaporate the extract [26] . The solvent is then recycled and reused for the separation. Savings of up to 35% can be achieved in this way.
In most preparative chromatography separations, the eluent is a binary mixture of organic solvents which have different boiling points. Therefore, evaporation units will enrich the recycled eluent in the solvent having the lower boiling point (or the azeotrope if applicable). In industrial units, probes such as capacitance probes are used to measure the composition of the recycled eluent [27] and to enable the automatic make - up of the eluent with a mixture enriched in the solvent having the higher boiling point. As the latter is evaporated during the drying process, minimal losses are incurred in the global process.
12.5.2 Recycling Devices for Gradient Chromatography
Using gradient conditions requires a minimum of two tanks containing the two eluents used to produce the gradient. Gradient modes are operated most of the time on batch processes, for instance, for separating peptides or other complex

258 12 Preparative and Industrial Scale Chromatography: Green and Integrated Processes
mixtures with reversed - phase or normal - phase preparative HPLC. The collected fractions contain different products in different solvent compositions. Many schemes can then be imagined.
As an example (shown in Figure 12.18 ), the gradient starts with an initial com-position of ethyl acetate/cyclohexane 55 : 45 (mixture A) and ends with a fi nal composition of ethyl acetate/cyclohexane 95 : 5 (mixture B). The collected fractions will be mixtures of solvents A and B, and, based on their respective compositions, will be concentrated using an evaporator and/or a distillation column. Eluent composition will be adjusted with systems such as the one described in Section 12.5.1 above.
12.5.3 Recycling Devices for Supercritical Carbon Dioxide
Except for analytical and small preparative instruments, CO 2 recycling after solute separation is common practice. If this were not the case, CO 2 consumption would easily exceed 10 or even 20 kg of liquefi ed gas per hour for a preparative SFC system equipped with a 50 - mm id column. Gas leaving the separators should be brought back into the same physical state and be at the same pressure as a fresh fl uid delivered from the supply unit. Since liquid pumps are most often used in SFC equipment, gaseous eluent must be liquefi ed prior to recycling.
The preferred solution is CO 2 recycling at a pressure of about 40 – 50 bar, slightly below the typical pressure inside CO 2 cylinders stored at ambient temperature. Eluent recycling and condensation at this pressure requires cooling utilities for a temperature range of 0 – 5 ° C. Under these conditions the solute - eluent separation
Eluent BEluent A
ChromatographySystem
COMPOSITIONADJUSTMENT
Feed
product
waste
concentration
distillation
EluentA
Conc.product
wasteFeed
Dry Feed
EluentB
Figure 12.18 Simplifi ed fl ow sheet of a double - effect evaporation unit.

12.6 Application Examples 259
parameters must be carefully controlled to reach the highest effi ciency of solute removal.
However, even the best designed separators and optimized working conditions cannot achieve 100% solute recovery. It should be stressed that the gaseous eluent leaving the separators always contains traces of solute and small amounts of co - solvent. This means that the eluent has to be cleaned before recycling. The design of the cleaning system depends on the eluent composition, the design for pure CO 2 being different from that for CO 2 modifi ed with co - solvent [11] .
12.6 Application Examples
12.6.1 Optimization of a Batch Process
The specifi c development of a batch process is illustrated in the following example, namely the separation of the enantiomers of racemic trans - stilbene oxide (TSO) [28] . For this example, supercritical fl uid chromatography was particularly appro-priate for the resolution.
12.6.2 Selection of the Chromatographic Conditions
After the screening of different chiral stationary phases and modifi ers (for a review of screening methods please refer to the work of Wewers [29] ), the best separation conditions were obtained using the chiral stationary phase ( CSP ) Chi-ralcel OD 20 μ m. An organic modifi er, isopropanol ( IPA ), was used to increase the polarity of the eluent in order to get an acceptable retention of the two enantiomers.
The separation was developed on an analytical SFC system (Series SF3 Gilson System) with a 4.6 × 250 mm analytical column packed with the CSP Chiralcel OD. The impact of the organic modifi er, operating temperature, and pressure was studied on analytical equipment. The retention time and selectivity change with the eluent composition (percentage of IPA), and these variations are presented in Figure 12.19 . The back pressure of the column was set at 80 bar and the tempera-ture at 20 ° C.
Organic modifi ers tend to increase the polarity of the eluent and are perfectly miscible with CO 2 . The situation is identical to what can be observed with a liquid eluent under the same conditions: retention decreases when the percentage of IPA increases.
The impact of the eluent temperature is shown in Figure 12.20 . Increasing temperature tends to increase retention. This effect is usually not observed in liquid chromatography, in accordance with the thermodynamics of the retention phenomenon described by the Gibbs equation. However, temperature has an
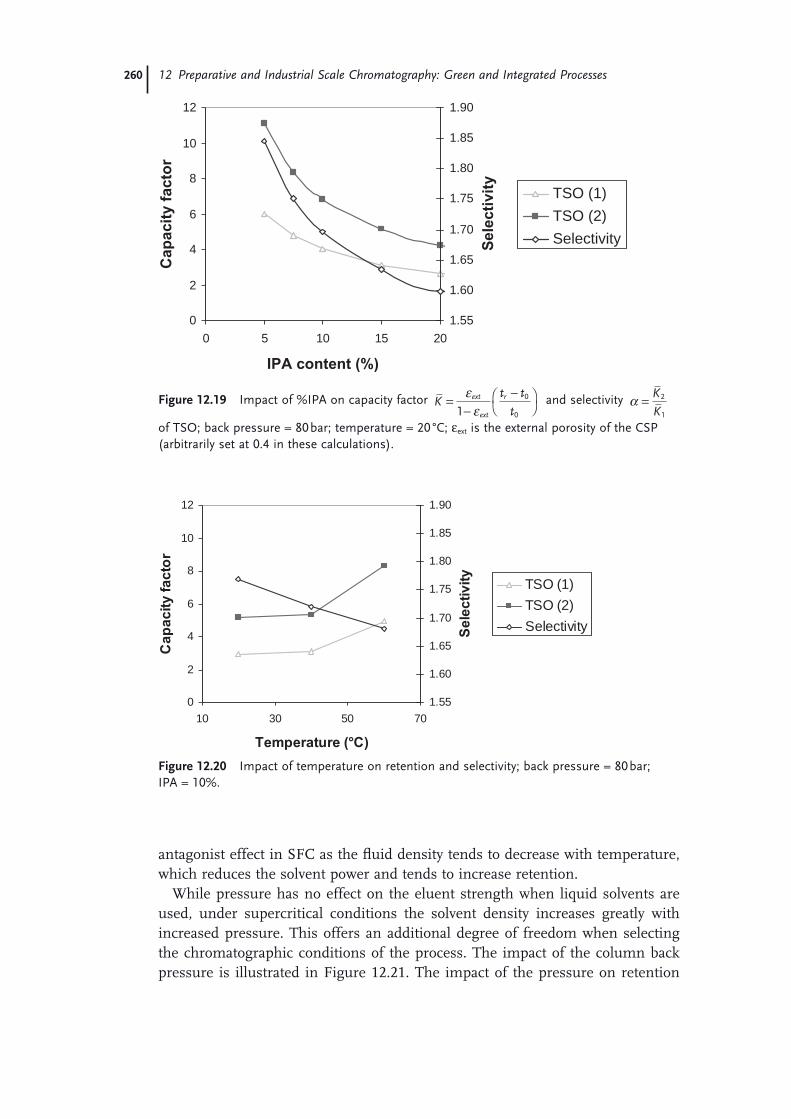
260 12 Preparative and Industrial Scale Chromatography: Green and Integrated Processes
antagonist effect in SFC as the fl uid density tends to decrease with temperature, which reduces the solvent power and tends to increase retention.
While pressure has no effect on the eluent strength when liquid solvents are used, under supercritical conditions the solvent density increases greatly with increased pressure. This offers an additional degree of freedom when selecting the chromatographic conditions of the process. The impact of the column back pressure is illustrated in Figure 12.21 . The impact of the pressure on retention
0
2
4
6
8
10
12
0 5 10 15 20
IPA content (%)
Ca
pa
cit
y f
ac
tor
1.55
1.60
1.65
1.70
1.75
1.80
1.85
1.90
Se
lec
tiv
ity
TSO (1)TSO (2)Selectivity
Figure 12.19 Impact of %IPA on capacity factor Kt t
text
ext
r=−
−⎛⎝
⎞⎠
εε1
0
0
and selectivity α = KK
2
1
of TSO; back pressure = 80 bar; temperature = 20 ° C; ε ext is the external porosity of the CSP (arbitrarily set at 0.4 in these calculations).
0
2
4
6
8
10
12
10 30 50 70
Temperature (°C)
Ca
pa
cit
y f
ac
tor
1.55
1.60
1.65
1.70
1.75
1.80
1.85
1.90
Se
lec
tiv
ity
TSO (1)TSO (2)Selectivity
Figure 12.20 Impact of temperature on retention and selectivity; back pressure = 80 bar; IPA = 10%.

12.6 Application Examples 261
decreases when the amount of co - solvent increases, but a signifi cant effect is still observed even with 10% of IPA.
The optimization of a preparative process not only requires a good resolution between the two compounds: the injected quantity should also be maximized. In this example, TSO racemate was injected into pure IPA (concentration = 31.7 g L − 1 at 20 ° C). The maximum injected amount is directly linked to the loading capacity of the stationary phase. Figure 12.22 shows chromatograms obtained when increasing the injected amount on the analytical column. A classic Langmuirian effect is observed for the adsorption of the TSO enantiomers. Considering that both enantiomers have to be purifi ed with the maximum yield, the highest accept-able volume was 300 μ L on the analytical column.
The process daily throughput is linked to both the injected amount per run and the time between two successive injections. This time has to be minimized using stacked injections in order to optimize the process productivity and further decrease the eluent consumption. Minimum time between two successive injec-tions corresponds to the time needed for eluting the two enantiomer peaks. Under the selected conditions, this time was equal to 100 s.
12.6.3 Scale - up on a Pilot SFC Unit
Analytical SFC units are perfectly suited for optimizing the chromatographic conditions to maximize the process throughput. The separation of TSO racemate developed on an analytical system was therefore successfully extrapolated to a pilot unit equipped with a 50 - mm id DAC column (System Supersep 50, Novasep) and integrating a CO 2 recycling loop.
0
2
4
6
8
10
12
50 100 150 200 250 300
Pressure (bar)
Ca
pa
cit
y f
ac
tor
1.55
1.60
1.65
1.70
1.75
1.80
1.85
1.90
Se
lec
tiv
ity Selectivity
TSO (2)TSO (1)
Figure 12.21 Impact of pressure on retention and selectivity; temperature = 20 ° C; % IPA = 10%. Optimization of the process throughput.

262 12 Preparative and Industrial Scale Chromatography: Green and Integrated Processes
A better resolution of the peaks was observed on the preparative system than on the analytical system. Thus, using a shorter column, cycle time was reduced and injected volume was increased. This small discrepancy can be explained by the fact that analytical systems are controlled by volume fl ow rates while prepara-tive systems are controlled by mass fl ow rates. Thus the co - solvent composition and column internal velocity can be slightly different. Table 12.1 shows the scaled - up operating parameters.
Figure 12.23 shows the superposed chromatograms obtained for 6 stacked injec-tions at preparative scale.
Experimental results for this separation are listed below:
Purity > 99% for both enantiomers Product recovery > 94% for both peaks
0
50
100
150
200
Time (min)
UV
(m
Vo
lts)
UV
(m
Vo
lts)
UV
(m
Vo
lts)
UV
(m
Vo
lts)
UV
(m
Vo
lts)
UV
(m
Vo
lts)
0
50
100
150
200
Time (min)
0
50
100
150
200
Time (min)
0
50
100
150
200
Time (min)
0
50
100
150
200
Time (min)
0
50
100
150
200
Time (min)
300 μL
50 μL 100 μL
150 μL 200 μL
250 μL
0 0.5 1 1.5 2 2.5 3 0 0.5 1 1.5 2 2.5 3
0 0.5 1 1.5 2 2.5 3 0 0.5 1 1.5 2 2.5 3
0 0.5 1 1.5 2 2.5 3 0 0.5 1 1.5 2 2.5 3
Figure 12.22 Effect of the injected quantity (Chiralcel OD 4.6 × 250 mm, 20 μ m); 20 ° C/110 – 80 bar; eluent fl ow rate = 6.7 mL min − 1 ; 11% IPA (v/v); feed concentration = 31.7 g L − 1 , equivalent to 5.9 g min − 1 ; 10 wt.% IPA.

12.6 Application Examples 263
Product concentration of about 12 g L − 1 , starting from feed containing 16 g L − 1 of each enantiomer (dilution factor is only 1.33)
Specifi c productivity = 4.6 kg rac /kg CSP /day
A key point is the amount of CO 2 required in this separation to purify one kilogram of racemate. The eluent fl ow rate is 700 g min − 1 , containing 630 g of CO 2 min − 1 , and 1 g of feed is injected every 80 s. These fi gures lead to a CO 2 consumption of 828 kg CO 2 /kg racemate without recycling and only 57 kg CO 2 /kg racemate with inte-grated recycling, corresponding to a recycling rate of 93%. The amount of IPA used is 92 kg/kg racemate. Of this, 80% is recovered and recycled using a standard 20 - L automatic rotary evaporator, therefore resulting in an IPA consumption of only 18.4 kg/kg racemate.
Table 12.1 Process scale - up from analytical to 50 - mm id DAC column.
Analytical separation Preparative separation
Column length (cm) 25 20 Column diameter (mm) 4.6 50 Injected volume (mL) 0.3 32 Cycle time (s) 100 80 Eluent fl ow rate (g min − 1 ) 5.9 700 Column pressure drop (bar) 30 25 Column outlet pressure (bar) 80 80
0 20 40 60 80Time (s)
Injection 1Injection 2Injection 3Injection 4Injection 5Injection 6
TSO (2) TSO (1)
Figure 12.23 Preparative chromatogram for 6 successive injections.
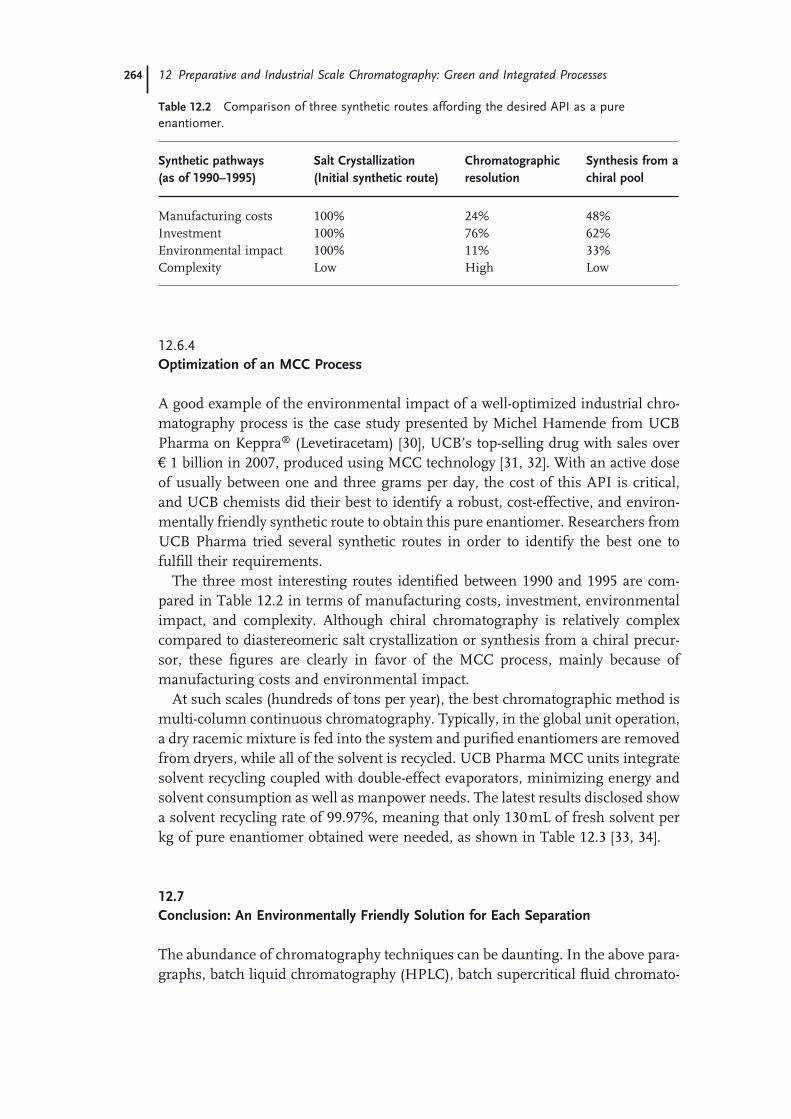
264 12 Preparative and Industrial Scale Chromatography: Green and Integrated Processes
12.6.4 Optimization of an MCC Process
A good example of the environmental impact of a well - optimized industrial chro-matography process is the case study presented by Michel Hamende from UCB Pharma on Keppra ® (Levetiracetam) [30] , UCB ’ s top - selling drug with sales over € 1 billion in 2007, produced using MCC technology [31, 32] . With an active dose of usually between one and three grams per day, the cost of this API is critical, and UCB chemists did their best to identify a robust, cost - effective, and environ-mentally friendly synthetic route to obtain this pure enantiomer. Researchers from UCB Pharma tried several synthetic routes in order to identify the best one to fulfi ll their requirements.
The three most interesting routes identifi ed between 1990 and 1995 are com-pared in Table 12.2 in terms of manufacturing costs, investment, environmental impact, and complexity. Although chiral chromatography is relatively complex compared to diastereomeric salt crystallization or synthesis from a chiral precur-sor, these fi gures are clearly in favor of the MCC process, mainly because of manufacturing costs and environmental impact.
At such scales (hundreds of tons per year), the best chromatographic method is multi - column continuous chromatography. Typically, in the global unit operation, a dry racemic mixture is fed into the system and purifi ed enantiomers are removed from dryers, while all of the solvent is recycled. UCB Pharma MCC units integrate solvent recycling coupled with double - effect evaporators, minimizing energy and solvent consumption as well as manpower needs. The latest results disclosed show a solvent recycling rate of 99.97%, meaning that only 130 mL of fresh solvent per kg of pure enantiomer obtained were needed, as shown in Table 12.3 [33, 34] .
12.7 Conclusion: An Environmentally Friendly Solution for Each Separation
The abundance of chromatography techniques can be daunting. In the above para-graphs, batch liquid chromatography (HPLC), batch supercritical fl uid chromato-
Table 12.2 Comparison of three synthetic routes affording the desired API as a pure enantiomer.
Synthetic pathways (as of 1990 – 1995)
Salt Crystallization (Initial synthetic route)
Chromatographic resolution
Synthesis from a chiral pool
Manufacturing costs 100% 24% 48% Investment 100% 76% 62% Environmental impact 100% 11% 33% Complexity Low High Low

12.7 Conclusion: An Environmentally Friendly Solution for Each Separation 265
graphy ( SFC ), and liquid multi - column continuous chromatography (MCC) have been presented along with methods to recycle both liquid and supercritical eluents. Although these techniques have often been compared in the literature [35 – 37] , they are often not applicable for the same purifi cation problem. Indeed, among these techniques, it is important to select the correct one in order to minimize the environmental impact, while maximizing savings in terms of both cost and time. The choice of the method should often be made on a case - by - case basis; however, general rules can easily be applied, as summarized in Figure 12.24 . These rules are based on the intrinsic properties of each technique.
Table 12.3 Solvent consumption and solvent recycling rates for the 4 MCC units currently producing enantiomerically pure API .
(Units 1 & 2) (Units 3 & 4)
Solvent to be recovered (L/kg product) 405 400 Solvent losses (L/kg product) 1.04 0.13 Recovery effi ciency 99.7% 99.97%
Figure 12.24 Positioning of the different chromatographic techniques depending on the amount of product to purify.

266 12 Preparative and Industrial Scale Chromatography: Green and Integrated Processes
Usually, SFC and HPLC are the methods of choice in early development and for product quantities ranging from grams to several tens of kilograms when time is of utmost importance. Indeed HPLC is easy to use and implement, and method development is fast. Given the low viscosity and high diffusivity of supercritical CO 2 , separations using SFC are quick. At such scales, SFC is probably the greenest technique and should be preferred, in particular for chiral separations. However its scope of application is quite limited to compounds with a relatively low toxicity (for obvious safety reasons) and/or polarity (for solubility reasons). For very polar compounds such as peptides, carbohydrates or most highly potent ingredients, HPLC should be selected.
For late development and commercial production (separations larger than 100 kg), when robustness of the process and its cost - effectiveness are key [38] , MCC is the solution of choice for binary mixtures (such as chiral separations). Although the development time is longer than with a batch process, continuous chromatography is designed to minimize production and operating costs and to optimize both robustness and productivity. With integrated automated solvent recycling, MCC makes the perfect tool to minimize the environmental impact of industrial - scale chromatography. Organic solvent consumption as low: 130 mL/kg of purifi ed product for commercial scale applications has been noted. Although exceptions are described [39, 40] , HPLC with integrated solvent recycling is often preferred for complex mixture separations, from the multi - kilogram to the multi - tonne scale.
In conclusion, preparative chromatography is no longer limited to a handful of specialists and has started to be widely accepted as part of the process chemist ’ s toolbox. More and more chemical routes incorporating preparative chromatogra-phy are being reported in the literature, describing its advantages in terms of time effectiveness [41 – 44] and cost effi ciency [45 – 49] compared to alternative methods. However, there are only a few reports of the low environmental impact of well - optimized chromatographic processing, especially at very large scales. Hopefully, a growing number of examples will present this aspect in the near future.
Acknowledgment
The authors are very grateful to Michel Hamende and Xavier Baert from UCB Pharma and to Velvet Mitchem from Novasep.
References
1 Mann , G. ( 1998 ) Analysis Magazine , 26 , M76 – M82 .
2 Francotte , E.R. ( 2001 ) J. Chromatogr. A , 906 , 379 – 397 .
3 Hostettmann , K. , Hostettmann , M. , and Marston , A. ( 1997 ) Preparative
pressure chromatography , in Preparative Chromatography Techniques: Applications in Natural Product Isolation , 2nd edn (ed. K. Hostettmann , A. Marston , M. Hostettmann ), Springer - Verlag , Berlin and Heidelberg , p. 50 .
References 267
4 Schulte , M. , and Epping , A. ( 2005 ) Fundamentals and general terminology , in Preparative Chromatography , 1st edn (ed. H. Schmidt - Traub ), Wiley - VCH Verlag GmbH , Weinheim , pp. 9 – 49 .
5 Cox , B.G. ( 2005 ) Introduction to preparative chromatography , in Preparative Enantioselective Chromatography , 1st edn (ed. G. Cox ), Wiley - Blackwell , p. 253 .
6 Welch , C.J. , Sajonz , P. , Spencer , G. , Leonard , W. , Henderson , D. , Schafer , W. , and Bernardoni , F. ( 2008 ) Org. Process Res. Dev. , 12 , 674 – 677 .
7 Rathore , S.A. , and Velayudhan , A. ( 2002 ) An overview of scale - up in preparative chromatography , in Scale - Up and Optimization in Preparative Chromatography: Principles and Biopharmaceutical Applications , 1st edn (eds S.A. Rathore and A. Velayudhan ), CRC , Parkway NW , p. 1 .
8 Unger , K.K. , du Fresne von Hohenesche , C. , and Schulte , M. ( 2005 ) Columns, packings and stationary phases , in Preparative Chromatography , 1st edn (ed. H. Schmidt - Traub ), Wiley - VCH Verlag GmbH , Weinheim , pp. 51 – 105 .
9 Dingenen , J. ( 2005 ) Scaling - up of preparative chromatographic enantiomer separations , in Preparative Enantioselective Chromatography , 1st edn (ed. G.B. Cox ), Wiley - Blackwell , Hoboken NJ , pp. 107 – 172 .
10 Colin , H. , Hilaireau , P. , and de Tournemire , J. ( 1990 ) LC GC , 8 , 302 – 312 .
11 Colin , H. , Ludemann - Hombourger , O. and Denet , F. ( 2005 ) Equipment for preparative and large size enantioselective chromatography , in Preparative Enantioselective Chromatography , 1st edn (ed. G. Cox ), Wiley - Blackwell , Hoboken NJ , pp. 224 – 252 .
12 Schulte , M. , Wekenborg , K. , and Wewers , W. ( 2005 ) Process concepts , in Preparative Chromatography , 1st edn (ed. H. Schmidt - Traub ), Wiley - VCH Verlag GmbH , Weinheim , pp. 173 – 214 .
13 Valery , E. , and Ludemann - Hombourger , O. ( 2005 ) WO2007012750 .
14 Grill , C.M. , and Miller , L.M. ( 2005 ) Steady - state recycling and its use in chiral separations , in Preparative Enantioselective Chromatography , 1st edn (ed. G.B. Cox ), Wiley - Blackwell , Hoboken NJ , p. 253 .
15 Bailly , M. , Adam , P. , Ludemann - Hombourger , O. , and Nicoud , R.M. ( 1999 ) WO200025885 .
16 Ludemann - Hombourger , O. , Nicoud , R.M. , and Bailly , M. ( 2000 ) Sep. Sci Technol. , 35 , 1829 .
17 Pais , L.S. , Mata , V.G. , Rodrigues , A.E. ( 2005 ) Simulated moving bed and related techniques , in Preparative Enantioselective Chromatography , 1st edn (ed. G.B. Cox ), Wiley - Blackwell , Hoboken NJ , pp. 176 – 2043 .
18 Ludemann - Hombourger , O. , Pigorini , G. , Nicoud , R.M. , Ross , D.S. , and Terfl oth , G. ( 2002 ) J. Chromatogr. A , 947 , 59 – 68 .
19 Klesper , E. , Corvin , A.H. , and Turner , D.A. ( 1962 ) J. Org. Chem. , 27 , 700 – 701 .
20 Villeneuve , M.S. , and Miller , L.A. ( 2005 ) Preparative - scale supercritical fl uid chromatography , in Preparative Enantioselective Chromatography , 1st edn (ed. G.B. Cox ), Wiley - Blackwell , Hoboken NJ , pp. 205 – 223 .
21 Reid , R.C. , Prausnitz , J.M. , and Poling , B.E. ( 1987 ) The Properties of Gases and Liquids , 4th edn, McGraw - Hill Book Company , New York .
22 Perrut , M. ( 1994 ) J. Chromatogr. A , 658 , 293 – 313 .
23 Denet , F. ( 2002 ) D é veloppement et Mod é lisation de Proc é d é s de Chromatographie Pr é parative avec Eluant Supercritique , Th è se de doctorat INPL .
24 Clavier , J.Y. ( 1995 ) D é veloppement du proc é d é de Lit Mobile Simul é avec é luant supercritique , Th è se de doctorat INPL .
25 Denet , F. , Hauck , W. , Nicoud , R.M. , Di Giovanni , O. , Mazzotti , M. , Jaubert , J.N. , and Morbidelli , M. ( 2001 ) Ind. Eng. Chem. Res. , 40 ( 21 ), 4603 – 4609 .
26 Hamende , M. , Chatel , M. , Rebier , L. , and Nicoud , R.M. ( 2003 ) EP1338316 .
27 Blehaut , J. , and Nicoud , R.M. ( 1999 ) EP0974838 .
28 Majewski , W. , Valery , E. , and Ludman - Hombourger , O. ( 2005 ) J. Liq. Chrom. Rel. Tech. , 28 , 1233 – 1252 .

268 12 Preparative and Industrial Scale Chromatography: Green and Integrated Processes
29 Wewers , W. , Dingenen , J. , Schulte , and M. , Kinkel ( 2005 ) Selection of chromatographic systems , in Preparative Chromatography , 1st edn (ed. H. Schmidt - Traub ), Wiley - VCH Verlag GmbH , Weinheim , pp. 107 – 172 .
30 Hamende , M. ( 2005 ) Case study in production - scale multicolumn continuous chromatography , in Preparative Enantioselective Chromatography , 1st edn (ed. G. Cox ), Wiley - Blackwell , Hoboken NJ , p. 253 .
31 UCB Pharma ( 2004 ) Press Release UCB Pharma – 3th December 2004 .
32 UCB Pharma ( 2004 ) UCB Annual Report , p. 39 .
33 Hamende , M. ( 2004 ) Current and Future Trials in Production Scale by Multi - Column Continuous Chromatography , SPICA , Aachen .
34 Baert , X. ( 2007 ) Multi tons industrial production with MCC technology , in Sanofi - Aventis Seminar on Chromatography Toulouse .
35 Strube , J. , Haumreisser , S. , Schmidt - Traub , S.H. , Schulte , M. , and Ditz , R. ( 1998 ) Org. Process Res. Dev. , 2 , 305 – 319 .
36 Yan , T.Q. , Orihuela , C. , and Swanson , D. ( 2008 ) Chirality , 20 , 139 – 146 .
37 Francotte , E.R. , and Richert , P. ( 1997 ) J. Chromatogr. A , 769 , 101 – 107 .
38 Zhang , T.Y. ( 2006 ) Chem. Rev. , 106 , 2583 – 2595 .
39 Voigt , U. , Kinkel , J. , Hempel , R. , and Nicoud , R.M. ( 2001 ) US Patent 6,306,306 .
40 Huthmann , E. , and Juza , M. ( 2005 ) J. Chromatogr. A , 1092 , 24 – 35 .
41 Hauck , W. , Adam , P. , Bobier , C. , and Landmesser , N. ( 2008 ) Chirality , 20 , 896 – 899 .
42 Welch , C.J. , Fleitz , F. , Antia , F. , Yehl , P. , Waters , R. , Ikemoto , N. , Armstrong , J.D. , and Marthre , D.J. ( 2004 ) Org. Process Res. Dev. , 8 , 186 – 191 .
43 Nelson , T.D. , Welch , C.J. , Rosen , J.D. , Smitrovich , J.H. , Huffman , M.A. , McNamara , J.M. , and Marthre , D.J. ( 2004 ) Chirality , 16 , 609 – 613 .
44 Leonard , W.R. , Henderson , D.W. , Miller , R.A. , Spencer , G.A. , Sudah , O.S. , Biba , M. , and Welch , C.J. ( 2007 ) Chirality , 19 , 693 – 700 .
45 Quallich , G.J. ( 2005 ) Chirality , 17 , S120 – S126 .
46 Pfl um , D.A. , Wilkinson , H.S. , Tanoury , G.J. , Kessler , D.W. , Kraus , H.B. , Senanayake , C.H. , and Wald , S.A. ( 2001 ) Org. Process. Res. Dev. , 5 , 110 – 115 .
47 Dahl , A.C. , Mealy , M.J. , Nielsen , M.A. , Lyngso , L.O. , and Suteu , C. ( 2008 ) Org. Process Res. Dev. , 12 , 429 – 441 .
48 Perrin , S.R. , Hauck , W. , Ndzie , E. , Blehaut , J. , Ludman - Hombourger , O. , Nicoud , R.M. , and Pirkle , W.H. ( 2007 ) Org. Process Res. Dev. , 11 , 817 – 824 .
49 Stuk , T.L. , Assink , B.K. , Bates , R.C. , Erdman , D.T. , Fedij , V. , Jennings , S.M. , Lassig , J.A. , Smith , R.J. , and Smith , T.L. ( 2003 ) Org. Process Res. Dev. , 7 , 851 – 855 .

269
13 Dynamic Resolution of Chiral Amine Pharmaceuticals: Turning Waste Isomers into Useful Product John Blacker and Catherine E. Headley
13.1 Background
Around 70% of the pharmaceuticals on the market are chiral, and approximately one third of these are chiral amines [1] . This represents a substantial number of active drug substances that are typically manufactured at a scale of 1 – 100 t y − 1 . The three main manufacturing processes used to introduce these homochiral centers are from optically active starting materials (the so - called ‘ Chiral Pool ’ approach), by asymmetric synthesis and by resolution. The last technique is widely practiced but results in waste of the undesired enantiomer. This chapter deals with develop-ments in asymmetric transformations, that is to say methods for augmenting the yield of amine resolution processes to theory 100%, resulting in an alternative to asymmetric synthesis and a practical Green Chemistry solution to the synthesis of optically active amines. Figure 13.1 shows different approaches to the asym-metric transformation that will be discussed in the chapter.
13.1.1 Chiral Amine Resolution Processes
Three methods for chiral amine resolution are used in the manufacture of phar-maceuticals: crystallization used most commonly; enzymic resolution used occa-sionally; chromatography used frequently during early phase and increasingly in commercial production. In each of these an isomer waste stream of at least 50% of the starting material is produced.
Enzyme - based processes for the resolution of chiral amines have been widely reported [2, 3] and are used in the manufacture of pharmaceuticals, for example, BASF ’ s process for chiral benzylic amine intermediates, Scheme 13.1 [4] . The methods used are enantioselective hydrolysis of an amide and enantioselective synthesis of an amide, both of which are kinetic resolutions. For high optical purity products the processes depend upon a large difference in the catalyzed reaction rates of each enantiomer.
Green Chemistry in the Pharmaceutical Industry. Edited by Peter J. Dunn, Andrew S. Wells and Michael T. Williams© 2010 WILEY-VCH Verlag GmbH & Co. KGaA, WeinheimISBN: 978-3-527-32418-7
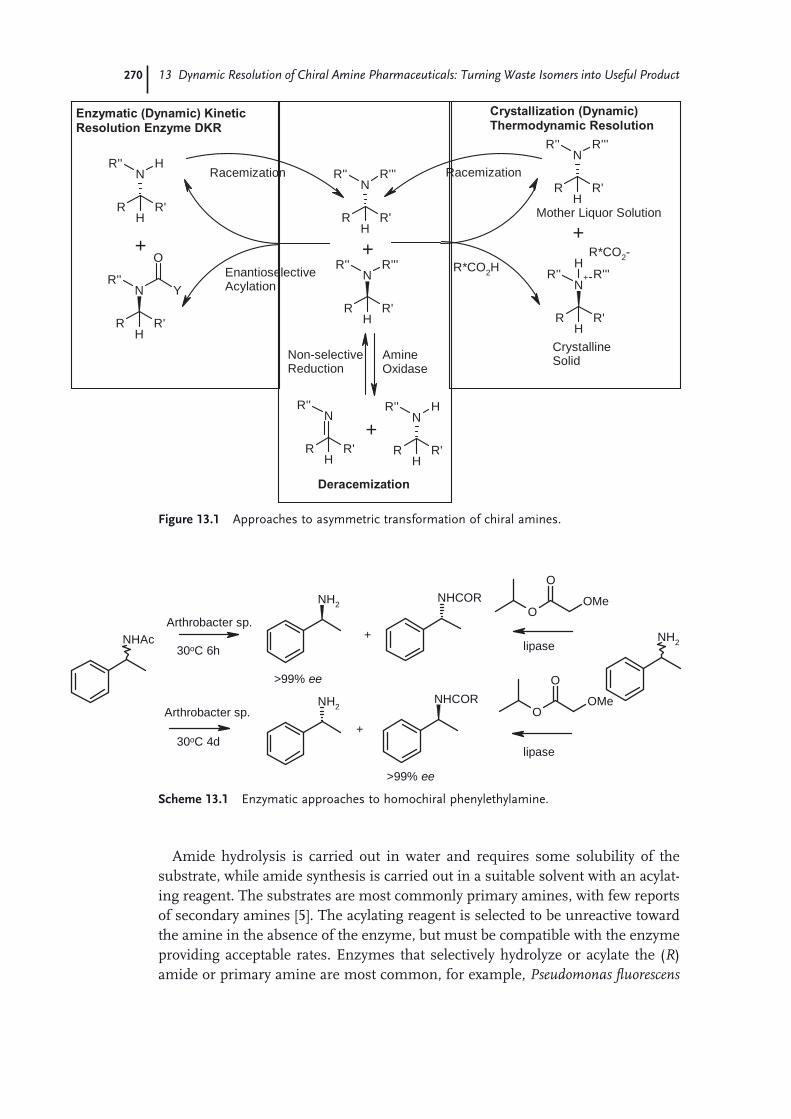
270 13 Dynamic Resolution of Chiral Amine Pharmaceuticals: Turning Waste Isomers into Useful Product
Amide hydrolysis is carried out in water and requires some solubility of the substrate, while amide synthesis is carried out in a suitable solvent with an acylat-ing reagent. The substrates are most commonly primary amines, with few reports of secondary amines [5] . The acylating reagent is selected to be unreactive toward the amine in the absence of the enzyme, but must be compatible with the enzyme providing acceptable rates. Enzymes that selectively hydrolyze or acylate the ( R ) amide or primary amine are most common, for example, Pseudomonas fl uorescens
R R'
NR'''R''
H
R R'
N+ R'''R''
H
HR*CO2-
R*CO2H
R R'
NR'''R''
H
R R'
NR'''R''
H
R R'
NHR''
H
R R'
NR''
H
O
Y
R R'
NHR''
HR R'
NR''
H
CrystallineSolid
Mother Liquor Solution
Racemization
++
Racemization
EnantioselectiveAcylation
+
AmineOxidase
Non-selectiveReduction
Crystallization (Dynamic)
Thermodynamic Resolution
Deracemization
Enzymatic (Dynamic) Kinetic
Resolution Enzyme DKR
+
Figure 13.1 Approaches to asymmetric transformation of chiral amines.
NHAc
NH2
NH2
NHCOR
NHCOR
NH2
O
O
OMe
O
O
OMe
+
+
Arthrobacter sp.
Arthrobacter sp.
30oC 6h
30oC 4d
>99% ee
>99% ee
lipase
lipase
Scheme 13.1 Enzymatic approaches to homochiral phenylethylamine .

13.1 Background 271
lipase, Candida antarctica lipase and Candida rugosa lipase [2] . There are fewer reports of enzymes for the same reaction producing the ( S ) enantiomer [3] . Access to both enantiomers can of course be achieved by separation of the unreacted enantiomer, whether that is the amine in case of acylation reaction or amide in the hydrolysis reaction.
Compared to the chemo - catalyzed kinetic resolution of alcohols, there are few reports of similar reactions for amines. Building on other work, one elegant example from Berkessel uses bifunctional organocatalysts to enantioselectively hydrolyze a racemic azlactone, and the dynamic kinetic resolution ( DKR ) is achieved by in - situ acid - catalyzed racemization of the azlactone under mild condi-tions to give product N - acylamino esters in, for example, 72% ee and 96% conver-sion with phenylalanine [6] .
Preparative chromatography is widely used to separate chiral amines (often with a protecting group to enhance isomer separation). The technique is often used as an expedient method to separate up to kilogram amounts of enantiomers to support early clinical phase development. The ease of isomer separation depends upon the interaction of each enantiomer with the stationary phase. Stationary phases frequently used are the bonded - brush or Pirkle - type based on supported aromatics, the inclusion type often based on cyclodextrins, and the less robust ligand - exchange and protein types. The solvents determine the elution rates and play a role in the column loading. Generally, separations are dilute, requiring large volumes of solvent and post - resolution concentration of the eluent.
Simulated moving bed ( SMB ) chromatography is a production - scale technique that is increasingly practiced for the separation of binary mixtures such as enan-tiomers. The method uses complex engineering design to simulate movement of the stationary phase while collecting the separated isomers from the same spatial points on the column. The process is continuous and is used to manufacture tonnage quantities of several pharmaceuticals. Examples include intermediates for the HIV protease inhibitors, the anti - histamine drug levetiracetam, the anti - depressants escitalopram [7] , and sertraline [8] . As with preparative chromatogra-phy, large volumes of solvents are employed, though recycle is often possible. The other waste emanating from the process is the waste isomer; ex - situ or possibly in - situ racemization via a recycle loop would improve the product cost. Besides the capital and operational cost of the SMB plant, the other critical element contribut-ing to the product cost is the stationary phase, and its lifetime is a critical manu-facturing issue. The environmental implications of large - scale chromatography have been more fully explored in Chapter 12 .
Resolution of chiral amines by crystallization is the most widely used technique. Resolving crystallizations have the advantage of being robust and simple to operate, but the low yields give ineffi cient performance due to low productivity, long cycle times, poor asset usage, and large waste streams, especially if multiple recrystal-lization or chiral acid recovery is required. Nevertheless its use in pharmaceutical and fi ne chemical manufacture is widespread [9] . The two methods that are employed are conglomerate separation (using for example the method of entrain-ment), which is used infrequently, and diastereomeric salt crystallization, which
272 13 Dynamic Resolution of Chiral Amine Pharmaceuticals: Turning Waste Isomers into Useful Product
is used most often. Conglomerates consist of separate crystals of ( R ) and ( S ) enan-tiomers. Unfortunately this type of solid - phase lattice only occurs in around 10% of compounds. A literature survey shows that a number of these are amines and ammonium salts [10] . The method of entrainment is a mechanical separation of the enantiomers effected by alternately seeding a supersaturated solution with a pure ( R ) or ( S ) crystal and collecting the augmented mass of pure enantiomer crystals. This method is simple, has little waste, but is not widely used and suffers multiple processing steps and long cycle times.
Resolution of chiral amines using diastereomeric crystallization is effected by mixing an enantiopure acid with racemic amine in a solvent that enables the less soluble diastereomeric salt to crystallize. Supersaturation is often achieved by cooling a hot solution, and the crystal habit and polymorph can be controlled by seeding with the pure diastereomeric salt. Surprisingly large differences in the solubility of the two isomers can be found by careful selection of the chiral acid resolving reagent, and this can enable high selectivity and up to 50% yields. From the perspective of a manufacturing process, the fewer recrystallizations necessary to produce a high purity salt the better, since this means less processing, less waste, and lower costs. In practice, many processes achieve 40 – 45% yields of diastereomer in > 95% de . However, this still results in 55 – 60% isomeric waste. Following screening of the crystals and washing, they are redissolved, and the optically active amine is separated from the resolving reagent either by acid or base aqueous - organic solvent extraction, then recrystallized or further processed. Figure 13.2 shows some examples of homochiral amines manufactured using diastere-omeric crystallization processes.
13.1.2 Homochiral Amine Racemization Processes
A large proportion of processes utilize the separation of enantiomers from a racemic mixture via resolution. Such techniques naturally lead to large quantities of unwanted isomer and limited yields of the desired products. It is therefore crucial to many industrial processes that the waste isomer be recycled via a racemi-zation at the desired chiral center, a procedure which is highly advantageous from both an economic and environmental waste processing perspective. However, racemization is not always so easily achieved, and a wide variety of techniques have been applied to many different functionalities. The majority of racemization literature is concentrated around racemization of amino acids and their deriva-tives, mainly using base/enzyme catalysis or racemization of a Schiff base inter-mediate. Alcohol racemization is well established with a variety of transition metal catalysts [11, 12] . Amine racemization presents a particular challenge, and the majority of examples are via redox chemistry or base catalysis; many examples require harsh conditions which are often incompatible with other functional groups within the molecule. Cost also plays a major part in the viability of racemiz-ing waste enantiomers, and methods used ideally should be short and high yield-ing, and should preferably utilize cheap reagents.

13.1 Background 273
Early examples of amine racemization are particularly ineffi cient and tend to be very substrate specifi c, with very few general methods that tolerate a wide variety of functional groups [11] . Thermal racemization has been achieved on relatively stable benzylic amines. For example, the isoquinolines shown in Scheme 13.2 were heated at high temperatures under vacuum to effect rapid loss of ee . This is clearly very specifi c to relatively simple, thermally stable amines.
OH
NHMe
HNMe
Cl
Cl
S
N
OMe
OAc
Me2N
OOMe
NH
H
SN
CO2Me
Cl
NH
OH
NH
OH
EphedrinePseudoephedrine
100 tpa Dextromethorphan
Sertraline
Diltiazem300 tpa 300 tpa
100 tpa
Clopidogrel
100 tpa
Ethambutol
1000s tpa
Figure 13.2 Some examples of chiral amine - containing pharmaceuticals manufactured using diastereomeric crystallization processes, and approximate product volumes.
NH
Ar
OH
NH
Ar
OHHeat
Scheme 13.2 Thermal racemization of homochiral benzylisoquinolines.
A few examples of benzylic amines have been racemized using a variety of bases such as NaNH 2 or NaOMe; this method is again very specifi c and ineffi cient. The lack of examples demonstrate the limitations of this method; a particular example is illustrated in Scheme 13.3 .
The vast majority of early amine racemizations involve an oxidation - reduction approach, with the oxidation of the amine center removing the chirality so that subsequent reduction yields the racemate. The most effi cient redox approach is achieved when the oxidized and reduced forms of the substrate are in equilibrium

274 13 Dynamic Resolution of Chiral Amine Pharmaceuticals: Turning Waste Isomers into Useful Product
and the process can take place in one pot. Scheme 13.4 shows a typical example of this approach.
Enzyme - catalyzed racemization and racemization of Schiff base intermediates are also valuable techniques, but are generally restricted to amino acid racemiza-tions, which have been much more widely investigated than the topics discussed in this chapter [11, 12] .
Racemization of chiral benzylic and aliphatic primary, secondary, and tertiary amines was recently reported by Gastaldi et al. using sulfur - based catalysts operat-ing through a radical - based mechanism. These authors have also reported enzyme DKR of chiral amines [13] .
The bulk of amine racemization examples discussed so far represent costly, stepwise, and ineffi cient ways of recycling unwanted enantiomer. A big step forward in the development of racemization as a viable option for waste recycling was to introduce a catalytic process whereby a catalytic hydrogen transfer process takes place under relatively mild conditions at the chiral center, providing a cheap, one - pot method. An early example of catalytic amine racemization by Murahashi is the treatment of ( S ) - ( – ) - α - phenylethylamine with catalytic palladium black in an alkyl group exchange between primary and secondary amines [14] . During the desired alkyl group exchange, loss of ee in the starting amine was observed, and this was attributed to a dehydrogenation/rehydrogenation redox process catalyzed by palladium. Kinetic studies have shown the racemization to occur 3.5 times faster than conversion to the desired product. The authors also commented on a rapid equilibrium between the starting amine and its planar imine intermediate. The utilization of this method as a racemization tool was however clearly limited by the formation of dimer, Scheme 13.5 .
NH2
NaNH2 neatNH2
100-140oC
Scheme 13.3 Racemization of ( R ) - phenylethylamine with base at high temperature.
OH
NH2
OH
NH2
H2 (250psi), Raney-Co
140oC
Scheme 13.4 Catalytic racemization of a secondary amine at high pressure and temperature.
NH2 NH
5 mol% Pd, 100oC
Scheme 13.5 Formation of dimer during catalyzed racemization.
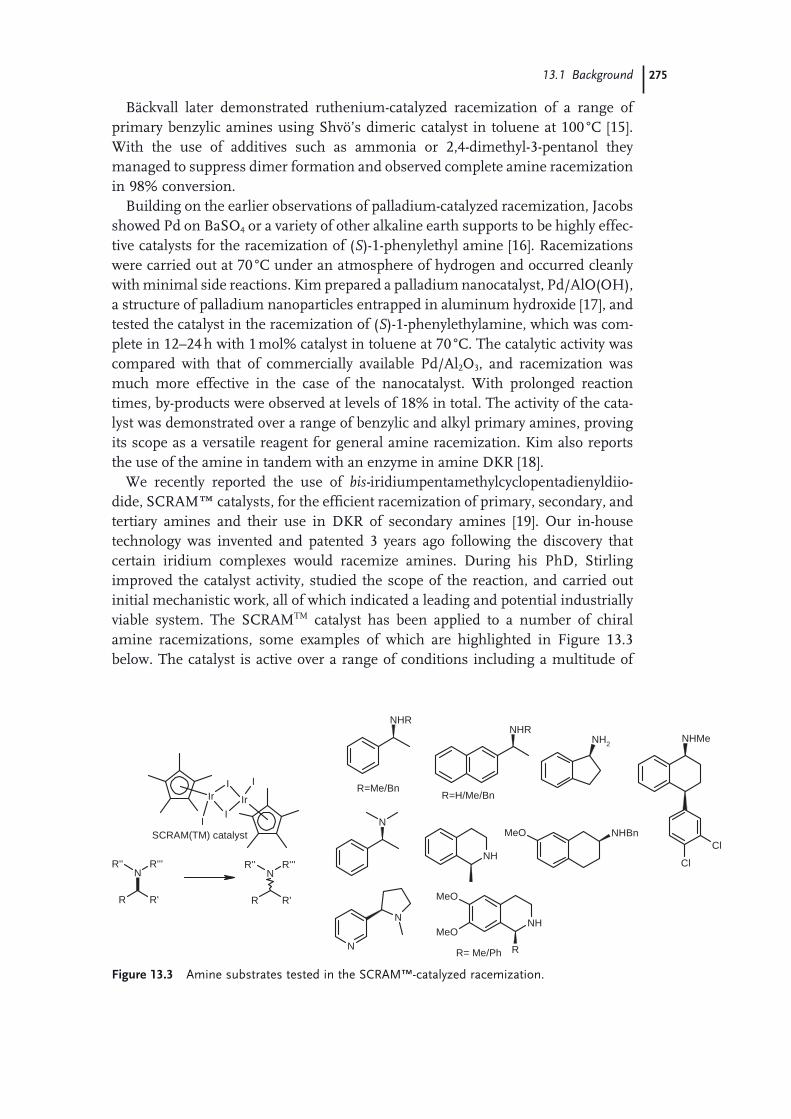
13.1 Background 275
B ä ckvall later demonstrated ruthenium - catalyzed racemization of a range of primary benzylic amines using Shv ö ’ s dimeric catalyst in toluene at 100 ° C [15] . With the use of additives such as ammonia or 2,4 - dimethyl - 3 - pentanol they managed to suppress dimer formation and observed complete amine racemization in 98% conversion.
Building on the earlier observations of palladium - catalyzed racemization, Jacobs showed Pd on BaSO 4 or a variety of other alkaline earth supports to be highly effec-tive catalysts for the racemization of ( S ) - 1 - phenylethyl amine [16] . Racemizations were carried out at 70 ° C under an atmosphere of hydrogen and occurred cleanly with minimal side reactions. Kim prepared a palladium nanocatalyst, Pd/AlO(OH), a structure of palladium nanoparticles entrapped in aluminum hydroxide [17] , and tested the catalyst in the racemization of ( S ) - 1 - phenylethylamine, which was com-plete in 12 – 24 h with 1 mol% catalyst in toluene at 70 ° C. The catalytic activity was compared with that of commercially available Pd/Al 2 O 3 , and racemization was much more effective in the case of the nanocatalyst. With prolonged reaction times, by - products were observed at levels of 18% in total. The activity of the cata-lyst was demonstrated over a range of benzylic and alkyl primary amines, proving its scope as a versatile reagent for general amine racemization. Kim also reports the use of the amine in tandem with an enzyme in amine DKR [18] .
We recently reported the use of bis - iridiumpentamethylcyclopentadienyldiio-dide, SCRAM ™ catalysts, for the effi cient racemization of primary, secondary, and tertiary amines and their use in DKR of secondary amines [19] . Our in - house technology was invented and patented 3 years ago following the discovery that certain iridium complexes would racemize amines. During his PhD, Stirling improved the catalyst activity, studied the scope of the reaction, and carried out initial mechanistic work, all of which indicated a leading and potential industrially viable system. The SCRAM TM catalyst has been applied to a number of chiral amine racemizations, some examples of which are highlighted in Figure 13.3 below. The catalyst is active over a range of conditions including a multitude of
NH
R
MeO
MeO
NH
R= Me/Ph
NHR
R=H/Me/Bn
NH2
NHR
R=Me/Bn
N
NHMe
Cl
ClNHBnMeO
N
N
IrI
II
Ir
I
R R'
NR'' R'''
R R'
NR'' R'''
SCRAM(TM) catalyst
Figure 13.3 Amine substrates tested in the SCRAM ™ - catalyzed racemization.

276 13 Dynamic Resolution of Chiral Amine Pharmaceuticals: Turning Waste Isomers into Useful Product
solvents and temperatures with catalyst loadings as low as 0.025 mol%. Loadings such as these demonstrate the economic potential of the catalyst to become a viable method for use in the manufacture of chiral amines.
Amine racemization has developed markedly over the last 25 years, and a range of complementary techniques from both academic and industrial research labora-tories has come to fruition during this time. From early examples testing out the concept of racemization through to the more recent sophisticated catalytic methods, which have been demonstrated in cost - effi cient industrial applications, there can be no question that this approach to waste recycling has a future in modern phar-maceutical manufacturing.
13.2 Integration of Chiral Amine Resolution and Racemization
To be commercially useful, racemization must be integrated with resolution tech-nology. This can either be done as an end - of - pipe solution, that is to recycle iso-meric waste from an existing resolution processes; or as a new DKR or dynamic thermodynamic resolution ( DTR ) process. With the former this can be applied to currently manufactured drugs, and the implementation plan and potential benefi ts can be clearly defi ned, making the risks low and manageable, and the commercial value high. Large - scale manufacture of drugs employing resolution processes and possibly having large waste streams includes sertraline, diltiazem, paroxetine, ephedrine, and dextromethorphan. To implement a DKR or DTR process with a drug in development, the technology must compete with chiral pool and asym-metric methods. One interesting aspect is that racemization - recycle technology can be implemented in a phased approach, where a simple, robust resolution can be used in initial small - scale manufacture to rapidly satisfy material demands, then, as the project requirements change toward greener chemistry and better economic performance, the racemization can be implemented, thus minimizing changes in product quality, robustness, and reproducibility.
13.2.1 Dynamic Resolution Processes
The integration of a catalyzed kinetic enantiomer resolution and concurrent racemization is known as a dynamic kinetic resolution ( DKR ). This asymmetric transformation can provide a theoretical 100% yield without any requirement for enantiomer separation. Enzymes have been used most commonly as the resolv-ing catalysts and precious metals as the racemizing catalysts. Most examples involve racemic secondary alcohols, but an increasing number of chiral amine enzyme DKRs are being reported. Reetz, in 1996, fi rst reported the DKR of rac - 2 - methylbenzylamine using Candida antarctica lipase B and vinyl acetate with pal-ladium on carbon as the racemization catalyst [20] . The reaction was carried out at 50 ° C over 8 days to give the ( S ) - amide in 99% ee and 64% yield. Rather surpris-

13.2 Integration of Chiral Amine Resolution and Racemization 277
ingly, no further examples or extensions of this work were reported until many years afterwards. B ä ckvall, in 2005, reported the DKR of primary amines using the Shv ö ruthenium - based catalyst and Candida antarctica lipase, which perform across a wide range of substrates with high yield and excellent enantioselectivities but high catalyst loadings and long reaction times Scheme 13.6 [15] .
Jacobs has used Adam ’ s catalyst with a lipase enzyme to effect the DKR of a variety of amines in high yield and optical purity (Table 13.1 [16] ). The nature of the Pd catalysts may prevent wide application, as they are nonspecifi c and can affect other groups in the substrate.
Turner has used a different type of asymmetric transformation, using amine oxidase enzymes to selectively dehydrogenate one enantiomer of a racemic second-ary amine to imine, and then using a nonselective chemical reducing reagent such as sodium cyanoborohydride to reform the racemic amine [21] . After several cycles, the racemic amine is converted to a single isomer. The naturally occurring amine oxidases are selective for the ( S ) - isomer. Genetic engineering has enabled ( R ) - selective amine oxidases to be developed. Alongside screening, enzyme modifi ca-tion has been used to improve the activity and selectivity toward other chiral amine substrates.
O H
Ph
Ph
Ph PhHRu
OC CO
Shvo catalyst
2
ee
ee
ee
ee
ee
ee
ee
ee
Scheme 13.6 B ä ckvall ’ s chiral amine enzyme DKR.
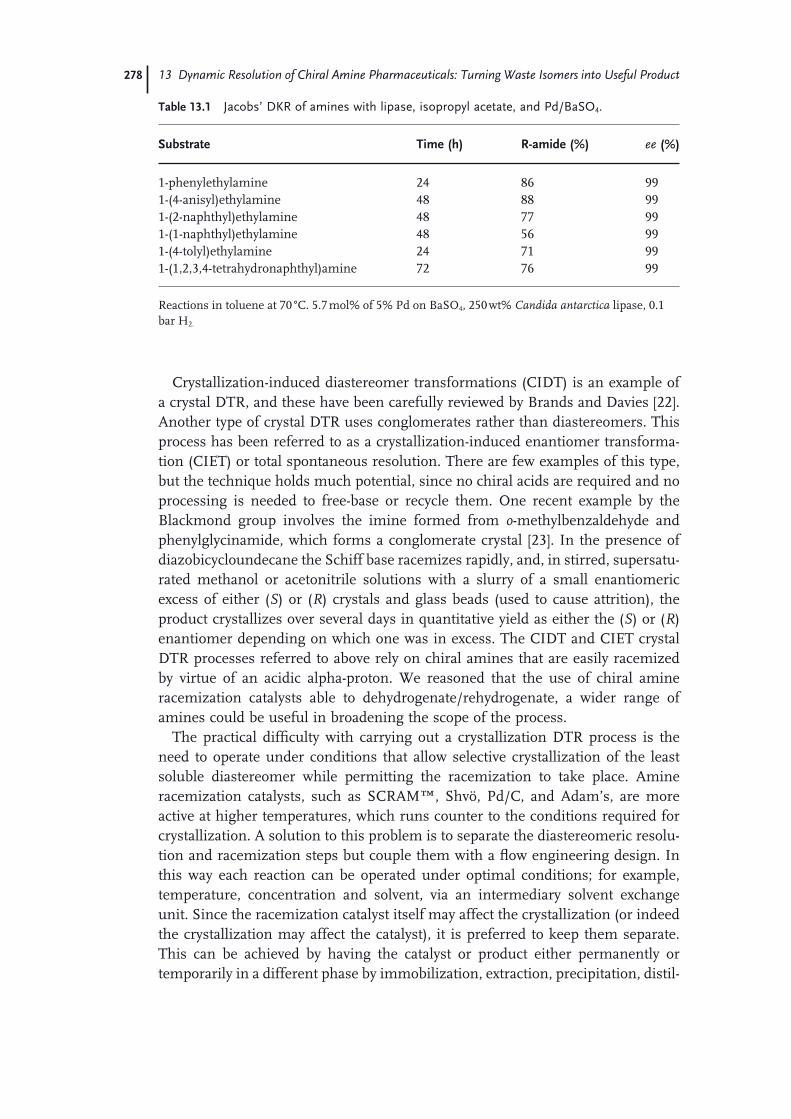
278 13 Dynamic Resolution of Chiral Amine Pharmaceuticals: Turning Waste Isomers into Useful Product
Crystallization - induced diastereomer transformation s ( CIDT ) is an example of a crystal DTR, and these have been carefully reviewed by Brands and Davies [22] . Another type of crystal DTR uses conglomerates rather than diastereomers. This process has been referred to as a crystallization - induced enantiomer transforma-tion ( CIET ) or total spontaneous resolution. There are few examples of this type, but the technique holds much potential, since no chiral acids are required and no processing is needed to free - base or recycle them. One recent example by the Blackmond group involves the imine formed from o - methylbenzaldehyde and phenylglycinamide, which forms a conglomerate crystal [23] . In the presence of diazobicycloundecane the Schiff base racemizes rapidly, and, in stirred, supersatu-rated methanol or acetonitrile solutions with a slurry of a small enantiomeric excess of either ( S ) or ( R ) crystals and glass beads (used to cause attrition), the product crystallizes over several days in quantitative yield as either the ( S ) or ( R ) enantiomer depending on which one was in excess. The CIDT and CIET crystal DTR processes referred to above rely on chiral amines that are easily racemized by virtue of an acidic alpha - proton. We reasoned that the use of chiral amine racemization catalysts able to dehydrogenate/rehydrogenate, a wider range of amines could be useful in broadening the scope of the process.
The practical diffi culty with carrying out a crystallization DTR process is the need to operate under conditions that allow selective crystallization of the least soluble diastereomer while permitting the racemization to take place. Amine racemization catalysts, such as SCRAM ™ , Shv ö , Pd/C, and Adam ’ s, are more active at higher temperatures, which runs counter to the conditions required for crystallization. A solution to this problem is to separate the diastereomeric resolu-tion and racemization steps but couple them with a fl ow engineering design. In this way each reaction can be operated under optimal conditions; for example, temperature, concentration and solvent, via an intermediary solvent exchange unit. Since the racemization catalyst itself may affect the crystallization (or indeed the crystallization may affect the catalyst), it is preferred to keep them separate. This can be achieved by having the catalyst or product either permanently or temporarily in a different phase by immobilization, extraction, precipitation, distil-
Table 13.1 Jacobs ’ DKR of amines with lipase, isopropyl acetate, and Pd/BaSO 4 .
Substrate Time (h) R - amide (%) ee (%)
1 - phenylethylamine 24 86 99 1 - (4 - anisyl)ethylamine 48 88 99 1 - (2 - naphthyl)ethylamine 48 77 99 1 - (1 - naphthyl)ethylamine 48 56 99 1 - (4 - tolyl)ethylamine 24 71 99 1 - (1,2,3,4 - tetrahydronaphthyl)amine 72 76 99
Reactions in toluene at 70 ° C. 5.7 mol% of 5% Pd on BaSO 4 , 250 wt% Candida antarctica lipase, 0.1 bar H 2.

13.3 Case Studies 279
lation, or the like (Figure 13.4 ). This simulated DTR ought to be more versatile than a ‘ single - pot ’ DTR. To test this simulated dynamic thermodynamic crystalliza-tion process we selected three industrially relevant amines. Each one is discussed in turn.
13.3 Case Studies
13.3.1 Asymmetric Transformation of ( S ) - 7 - Methoxy - 1,2,3,4 - tetrahydronaphthalen - 2 - amine
The title compound is a key fragment in the Sanofi - Aventis β - adrenoreceptor antagonist drug candidate SR58611A, Scheme 13.7 . One reported approach to making this intermediate was by asymmetric hydrogenation of the corresponding enamide using a variety of bidentate Rh and Ru phosphine - based catalysts in up to 96% ee [24] . The current process employs a classic diastereomeric crystallization resolution. The amine intermediate presents an ideal candidate for SCRAM ™ - catalyzed racemization and subsequent recycle of the waste stream. We set out to demonstrate and develop the following route as a potential example of a DTR crystallization process.
Product
Mother Liquors
Racemate
Figure 13.4 Conceptual simulated DTR process involving separate but linked resolution and racemization stages.
NH2 ORNH
O
OH
Cl
CO2Et
Cl
O
+.HCl
Scheme 13.7 Retrosynthesis of SR58611A.

280 13 Dynamic Resolution of Chiral Amine Pharmaceuticals: Turning Waste Isomers into Useful Product
We opted for the N - benzyl protected amine as a stable intermediate for the reso-lution/racemization studies, and this fi tted well into our proposed route, with an easy deprotection by hydrogenolysis at the end (Scheme 13.8 ). Resolution using ( R ) - mandelic acid proved successful, with an undeveloped overall yield of 30% in 80 – 90% ee depending upon the conditions for crystallization. We were able to demonstrate racemization using the SCRAM ™ catalyst and observed racemic amine after several hours at 100 ° C in tert - butyl methyl ether ( TBME ) in a sealed tube. Some imine by - product was observed during the racemization process due to loss of hydrogen from the system. In addition to this work we carried out some preliminary studies toward a true crystal DTR process. It was shown qualitatively that racemization in TBME could be carried out in the presence of mandelic acid. Although the racemization is slower in the presence of the chiral acid and there is more by - product formation, it is evident that this result could be manipulated further toward a highly effi cient one - pot process. Rather than a true DTR process we opted for a resolution - recycle process. Carrying out the racemization on pure amine in TBME we were able to take advantage of the poor solubility of the SCRAM ™ catalyst at ambient temperature in this solvent, and the catalyst was reused several times. Having proved that the chemistry worked for the individual stages, the next step was to fi t them together as a recycle process.
Following an initial resolution step with 0.5 mol equivalents ( R ) - mandelic acid in TBME, the crystalline product was fi ltered and the waste isomers in the mother liquors (39% ee ) were washed with base and then subjected to racemization with the SCRAM TM catalyst. Upon completion, the catalyst precipitated and was screened, fresh racemic amine was added, and the whole was resolved a second time. The process was repeated several times, giving the results summarized in Table 13.2 .
Carried out on a small multi - gram scale, the overall yield over the four recycle loops in the unoptimized process was 49% (based on the amount of racemate added throughout the investigation) compared to a traditional single - step resolu-tion yield of ∼ 30% of the N - benzyl amine, demonstrating some improvement from an early stage. The product was isolated in 80 – 90% ee over each loop and required a fi nal crystallization of the combined material from acetone to bring it up to the required specifi cation. The main losses were to the imine, and, in a separate experiment, treatment of this under the SCRAM TM racemization conditions in the
OMeO
MeO NHBn
MeO NHRMeO NHBn1. BnNH2
2. H2, PtO2
Resolution
Racemisation
R=BnR=H
H2, Pd/C
0.5 eq(R)-mandelic acid
Solution
TBME
0.3 mol% SCRAMTM catalyst 2h 110oC
Solid98% ee
(R)-mandelate
TBME
Scheme 13.8 Resolution - racemization approach to the ( S ) - 2 - aminotetralin.
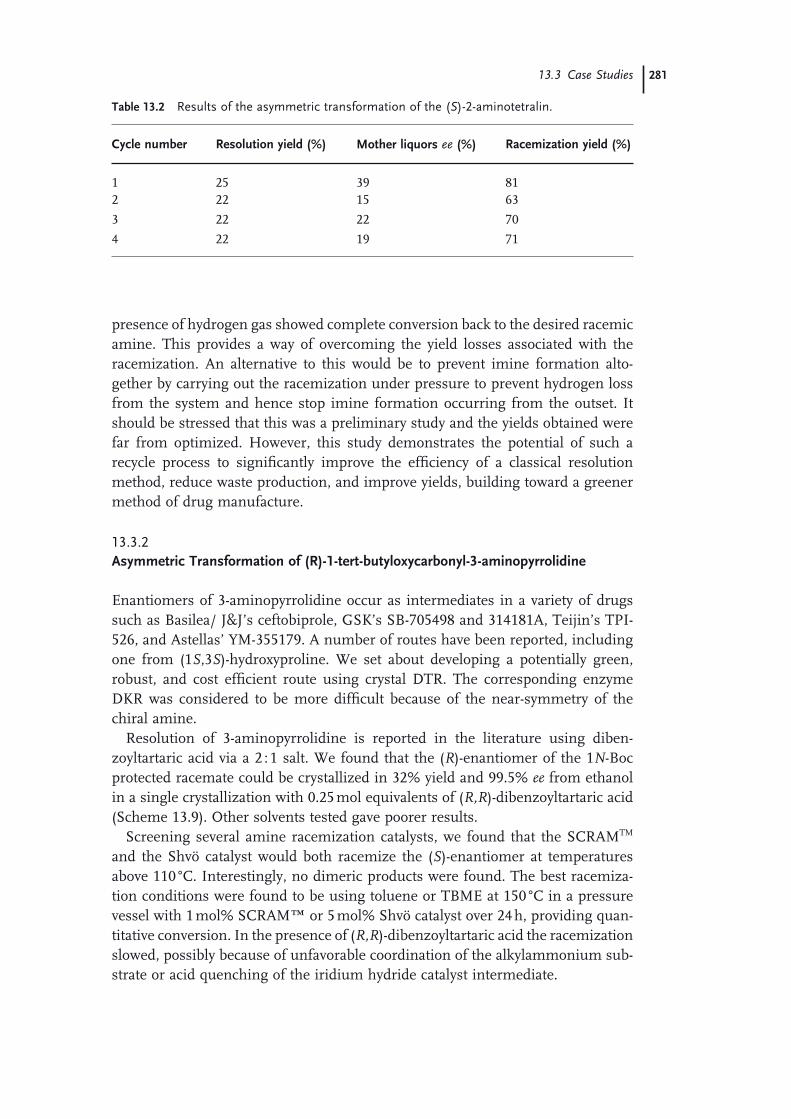
13.3 Case Studies 281
presence of hydrogen gas showed complete conversion back to the desired racemic amine. This provides a way of overcoming the yield losses associated with the racemization. An alternative to this would be to prevent imine formation alto-gether by carrying out the racemization under pressure to prevent hydrogen loss from the system and hence stop imine formation occurring from the outset. It should be stressed that this was a preliminary study and the yields obtained were far from optimized. However, this study demonstrates the potential of such a recycle process to signifi cantly improve the effi ciency of a classical resolution method, reduce waste production, and improve yields, building toward a greener method of drug manufacture.
13.3.2 Asymmetric Transformation of ( R ) - 1 - tert - butyloxycarbonyl - 3 - aminopyrrolidine
Enantiomers of 3 - aminopyrrolidine occur as intermediates in a variety of drugs such as Basilea/ J & J ’ s ceftobiprole, GSK ’ s SB - 705498 and 314181A, Teijin ’ s TPI - 526, and Astellas ’ YM - 355179. A number of routes have been reported, including one from (1 S ,3 S ) - hydroxyproline. We set about developing a potentially green, robust, and cost effi cient route using crystal DTR. The corresponding enzyme DKR was considered to be more diffi cult because of the near - symmetry of the chiral amine.
Resolution of 3 - aminopyrrolidine is reported in the literature using diben-zoyltartaric acid via a 2 : 1 salt. We found that the ( R ) - enantiomer of the 1 N - Boc protected racemate could be crystallized in 32% yield and 99.5% ee from ethanol in a single crystallization with 0.25 mol equivalents of ( R,R ) - dibenzoyltartaric acid (Scheme 13.9 ). Other solvents tested gave poorer results.
Screening several amine racemization catalysts, we found that the SCRAM TM and the Shv ö catalyst would both racemize the ( S ) - enantiomer at temperatures above 110 ° C. Interestingly, no dimeric products were found. The best racemiza-tion conditions were found to be using toluene or TBME at 150 ° C in a pressure vessel with 1 mol% SCRAM ™ or 5 mol% Shv ö catalyst over 24 h, providing quan-titative conversion. In the presence of ( R,R ) - dibenzoyltartaric acid the racemization slowed, possibly because of unfavorable coordination of the alkylammonium sub-strate or acid quenching of the iridium hydride catalyst intermediate.
Table 13.2 Results of the asymmetric transformation of the ( S ) - 2 - aminotetralin.
Cycle number Resolution yield (%) Mother liquors ee (%) Racemization yield (%)
1 25 39 81 2 22 15 63
3 22 22 70
4 22 19 71

282 13 Dynamic Resolution of Chiral Amine Pharmaceuticals: Turning Waste Isomers into Useful Product
The process was developed so that the mother liquors from the crystallization were taken directly, solvent swapped by reverse azeotropic distillation, washed, and racemized. The catalyst can be separated by precipitating as an ammonia complex before switching back to ethanol and repeating the crystallization. Clearly an improvement to the process would be the use of a single solvent, less catalyst, and milder racemization, but unfortunately in this case the racemization catalysts are incompatible with the resolution solvent ethanol. The process was demon-strated on a multi - gram scale, and with no observed losses during the racemization stage to imine or dimeric by - products, extremely high yields of product would be possible over several loops. Dynamic thermodynamic crystallization would be achieved by carrying out racemization simultaneously with crystallization, but unfortunately in this case the systems are incompatible, and a recycle process was developed which through integrated engineering might be made dynamic. Never-theless, it is clear that the overall yield of ( R ) - 1 - tert - butyloxycarbonyl - 3 - aminopyr-rolidine could potentially be increased beyond the 32% yield obtained in a standard resolution and approaching a theoretical quantitative yield, resulting in substan-tially less waste and a more effi cient process.
13.3.3 Sertraline
Sertraline is the active pharmaceutical ingredient ( API ) in Pfi zer ’ s antidepressant Zoloft ™ [25] . The developed commercial process employs an SMB chromato-graphic resolution of tetralone (Scheme 13.10 ) in > 99% ee followed by diastereose-lective reductive amination to give 95% sertraline ( cis - isomer) and 5% trans - isomer; the (4 R ) - tetralone can be racemized with an alkoxide base [8] . Asymmetric proc-esses to sertraline have been described [26] . Our studies started with the original patented process involving palladium - catalyzed reductive amination of a tetralone to give a mixture of 80% racemic - cis and 20% racemic - trans diastereomers [27] . The cis - diastereomer can be purifi ed by selective crystallization from toluene followed by diastereomeric crystallization of the (1 S ,4 S ) - enantiomer using ( R ) -
NH2
N
Boc
NH2
N
Boc
NH3+
N
Boc
0.25 eq(R,R)-dibenzoyltartaric acid
Solution
TBMEor toluene
1mol% SCRAMTM catalyst 24h 150oC
Solid32% yield99.5% ee
(tartrate)1/2
+EtOH
Scheme 13.9 Resolution - racemization approach to the ( R ) - 3 - aminopyrrolidine.

13.3 Case Studies 283
mandelic acid in ethanol in an overall 26% yield from racemic tetralone. By dif-ference, this process produces 74% isomeric waste, besides solvent and resolving reagent. The sertraline API is produced following a salt exchange to the hydro-chloride. While this non - commercial process is robust, it is low yielding, providing us the incentive to improve it using our SCRAM ™ crystal DTR process. This case study was made particularly challenging by the necessity for using the technology at the API stage, introducing product quality issues around the level of racemiza-tion catalysts and potential new impurities and their effect on the crystallization. A further issue was the tight constraints around cost, since the DTR process, to recycle the waste isomers, was required to be less costly than that of the mixed isomer amine starting material, which is widely available at low cost.
In the patent literature, processes are described for the epimerization of the benzylic chiral center at the 4 - position using an alkoxide base [28] and for reagent - based dehydrogenation, then rehydrogenation, of the amine [29] . We envisaged racemization of the chiral amine center using the SCRAM ™ catalyst and the terti-ary carbon center using an alkoxide base (Scheme 13.10 ).
Ideally, both the epimerization steps and the diastereomeric crystallization would be operated in the same solvent using mandelic acid as the resolving reagent. Other important considerations were: the removal and possible recycle of the SCRAM ™ catalyst (as this would have a signifi cant impact on cost and product purity) and the order of racemization: SCRAM ™ then base, or base then SCRAM ™ , or both together. Experimentally, each stage of the process was evaluated sepa-rately and then integrated into a simulated DTR process (Figure 13.5 ). It was recognized from the outset that a single solvent would facilitate the continuous process, and consideration of each of the stages led us to evaluate toluene and TBME as candidates.
HNMe
Cl
Cl
HNMe
Cl
Cl
HNMe
Cl
Cl
HNMe
Cl
Cl
HNMe
Cl
Cl
HNMe
Cl
Cl
HNMe
Cl
Cl
NMe
Cl
Cl
O
Cl
Cl
HNMe
Cl
Cl
+ +
+ + +
1. amine racemization2. methine racemization
waste isomers
diastereomeric crystalresolution
sertraline
tetralone imine
Scheme 13.10 Resolution - racemization route to sertraline.

284 13 Dynamic Resolution of Chiral Amine Pharmaceuticals: Turning Waste Isomers into Useful Product
The selective crystallization of the (1 S ,4 S ) isomer from the mixture of all four diastereomers was achieved using ( R ) - mandelic acid in toluene or TBME in > 99% ee and 90 – 98% de . While the isolated yield of 35% is quite reasonable, it is a feature of the technology that the resolution yield is not critical, as the waste isomers are being recycled and in theory can all be transformed into the product. Taking the mother liquors, we charged an equal volume of 1 M sodium hydroxide base and quantitatively extracted the sodium mandelate, which could be recycled and used in the next resolution. The mixture of waste sertraline isomers in toluene was washed with water and topped up with a fresh racemic sertraline. It was found by screening racemization catalysts that SCRAM ™ catalyst had the highest turnover frequency. Using 0.1 mol% catalyst the (1 S ) chiral center was epimerized with a t 1/2 of 15 min and turnover frequency of 1300 h − 1 (Figure 13.6 ).
It can be seen that the de does not reach zero, as the benzylic chiral center induces diastereoselective imine reduction, depending upon the system thermo-dynamics (that is catalyst, solvent, and temperature). Since the epimerization is fi rst order with respect to the (1 S , 4 R ) isomer but zero order with respect to the mixture of isomers, the process is unaffected by concentration and was conven-iently run at the same high concentration as that of the mother liquors from the resolution process. A critical part of the process was the separation of the catalyst from the product, and its removal after the amine epimerization was preferred as this provided the greatest potential for its recycle. Removal of the catalyst was achieved by forming an insoluble ammonio complex formed by bubbling gaseous
SCRAM TM
Racemization
Catalyst
Separation
Base
Racemization Base
Ammonio-
Catalyst
Complex
Base
Separation
Resolution
Process
Aqueous
Waste
Product
Salt
Sertraline
HCl
Pre-SCRAMTM
Preparation
Water
Resolving
Reagent
Racemic
Sertraline
SCRAM TM
Catalyst
Ammonia
Water
Figure 13.5 Simulated crystal DTR process for sertraline.

13.3 Case Studies 285
ammonia through the reaction solution, the advantage of this method over extrac-tion being that heating the complex reformed active catalyst for use in the next reaction. Epimerization of the benzylic methine chiral center was achieved with 0.1 equiv. potassium tert - butoxide to 16% de in 1 h at 80 ° C in toluene. The process was operated in the laboratory for 5 recycles, and selected results are shown in Tables 13.3 and 13.4 . Cycle 1 was not included as the data is not representative of a typical cycle. In Table 13.3 it can be clearly seen that in each cycle, following resolution, the waste mother liquors contain a low percentage of the desired (1 S , 4 S ) diastereomer (for example 5.7% in cycle 3). Following the treatment of these mother liquors with SCRAM ™ catalyst followed by base, the percentage of (1 S , 4 S ) isomer available for the subsequent resolution has increased signifi cantly (for example to 22.8% in cycle 3), and this is observed consistently in each loop carried out. In each cycle, following epimerization of the two stereocenters, a fresh charge of the starting cis - diastereomer is added which increases the (1 S , 4 S ) further, and this maintains the mass balance throughout each cycle. Table 13.4 shows the quality of the products obtained at each cycle, and even with tetralone and imine build - up during the recycle process this did not impact on the quality of material coming out of each loop.
Ketone and imine do inevitably build up in the system over a number of loops, accounting for losses in yield. There is still scope to improve the overall effi ciency of the process by eliminating by - product formation altogether, either by preventing their formation or removing them at a later stage. We have observed some success in similar systems by carrying out the racemization under pressure to prevent loss of hydrogen from the system and subsequent imine formation. There is also an option to hydrogenate the imine back to the amine, thereby minimizing losses overall and improving the economics of the process as a whole. The process has been successfully scaled up to 250 g, with plans to develop it toward multi - tonne scale manufacture, which is a signifi cant green chemical improvement in the process effi ciency of this API route.
0.0
10.20.30.40.50.60.70.80.90.
100.
0 150 300 450 600 750 900 1050 1200
Time /mins
%
de
NH
Cl
Cl
NH
Cl
Cl
SCRAM(TM) catalyst
Figure 13.6 Epimerization profi le of (1 S ,4 S ) to (1 RS ,4 S ) sertraline.
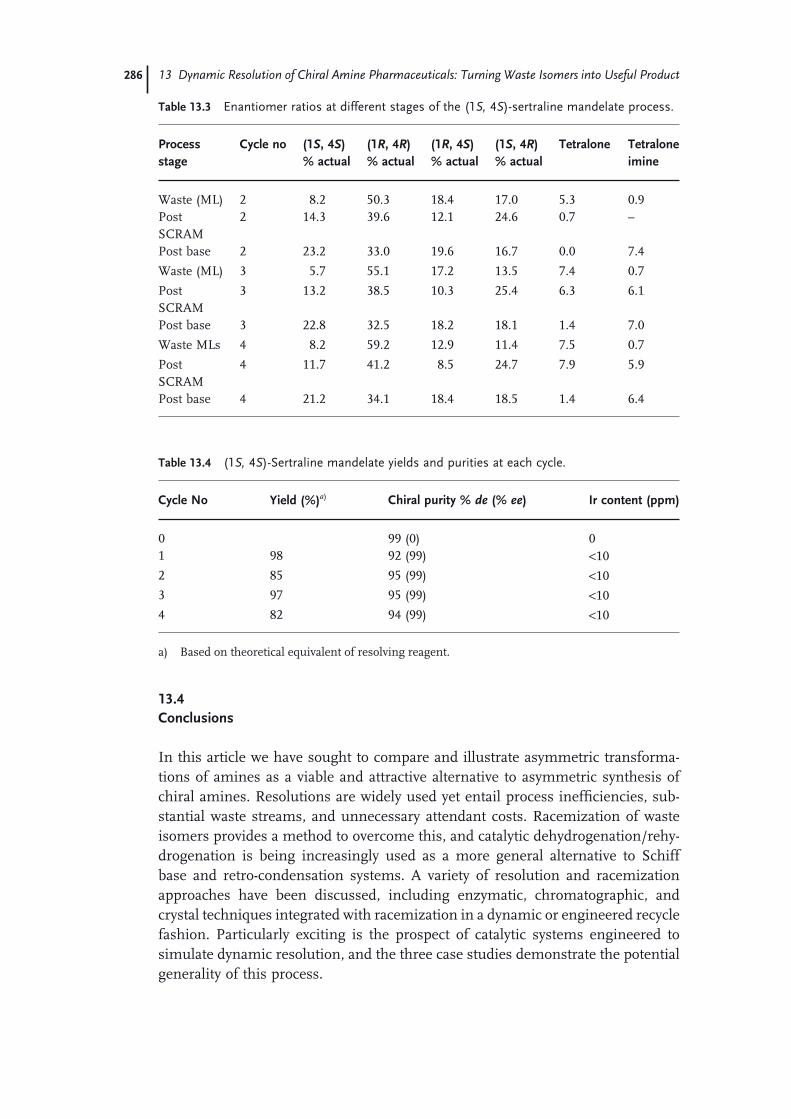
286 13 Dynamic Resolution of Chiral Amine Pharmaceuticals: Turning Waste Isomers into Useful Product
13.4 Conclusions
In this article we have sought to compare and illustrate asymmetric transforma-tions of amines as a viable and attractive alternative to asymmetric synthesis of chiral amines. Resolutions are widely used yet entail process ineffi ciencies, sub-stantial waste streams, and unnecessary attendant costs. Racemization of waste isomers provides a method to overcome this, and catalytic dehydrogenation/rehy-drogenation is being increasingly used as a more general alternative to Schiff base and retro - condensation systems. A variety of resolution and racemization approaches have been discussed, including enzymatic, chromatographic, and crystal techniques integrated with racemization in a dynamic or engineered recycle fashion. Particularly exciting is the prospect of catalytic systems engineered to simulate dynamic resolution, and the three case studies demonstrate the potential generality of this process.
Table 13.3 Enantiomer ratios at different stages of the (1 S, 4 S ) - sertraline mandelate process.
Process stage
Cycle no (1 S , 4 S ) % actual
(1 R , 4 R ) % actual
(1 R , 4 S ) % actual
(1 S , 4 R ) % actual
Tetralone Tetralone imine
Waste (ML) 2 8.2 50.3 18.4 17.0 5.3 0.9 Post SCRAM
2 14.3 39.6 12.1 24.6 0.7 –
Post base 2 23.2 33.0 19.6 16.7 0.0 7.4
Waste (ML) 3 5.7 55.1 17.2 13.5 7.4 0.7
Post SCRAM
3 13.2 38.5 10.3 25.4 6.3 6.1
Post base 3 22.8 32.5 18.2 18.1 1.4 7.0
Waste MLs 4 8.2 59.2 12.9 11.4 7.5 0.7
Post SCRAM
4 11.7 41.2 8.5 24.7 7.9 5.9
Post base 4 21.2 34.1 18.4 18.5 1.4 6.4
Table 13.4 (1 S, 4 S ) - Sertraline mandelate yields and purities at each cycle.
Cycle No Yield (%) a) Chiral purity % de (% ee ) Ir content (ppm)
0 99 (0) 0 1 98 92 (99) < 10
2 85 95 (99) < 10
3 97 95 (99) < 10
4 82 94 (99) < 10
a) Based on theoretical equivalent of resolving reagent.

References 287
Acknowledgments
We would like to acknowledge Yorkshire Forward for support of this work through their Large Company Scheme Award. Grateful thanks are also extended to past and present members of the SCRAM ™ project team for their valuable contribu-tion to the development of this technology.
References
1 Thayer , A.M. ( 2007 ) Chem. Eng. News , 85 ( 32 ), 11 – 19 and Piramal Healthcare unpublished data.
2 Kitaguchi , H. , Fitzpatrick , P.A. , Huber , J.E. , and Klibanov , A.M. ( 1989 ) J. Am. Chem. Soc. , 111 , 3094 – 3095 . Jaeger , K. - E. , Liebeton , K. , Zonta , A. , Schi-mossek , K. , and Reetz , M.T. ( 1996 ) Appl. Microbiol. Biotechnol. , 46 ( 2 ), 99 – 105 . Reetz , M.T. ( 2002 ) Curr. Opin. Chem. Biol. , 6 ( 2 ), 145 – 150 . Shin , J. - S. , Byung - Gee , K. , Liese , A. , and Wandrey , C. ( 2001 ) Biotechnol. Bioeng. , 73 ( 3 ), 179 – 187 .
3 van Rantwijk , F. , and Sheldon , R.A. ( 2004 ) Tetrahedron , 60 ( 3 ), 501 – 519 .
4 Ladner , W.E. , and Ditrich , K. ( 1999 ) Chimica Oggi , 17 ( 7 ), 51 – 54 . Schulze , B. , and Wubbolts , M.G. ( 1999 ) Curr. Opin. Biotechnol. , 10 ( 6 ), 609 – 615 . Schmid , A. , Dordick , J.S. , Hauer , B. , Kiener , A. , Wubbolts , M. , and Witholt , B. ( 2001 ) Nature , 409 , 258 – 266 .
5 Breen , G.F. ( 2004 ) Tetrahedron Asymmetry , 15 ( 9 ), 1427 – 1430 .
6 Seebach , D. , Jaeschke , G. , Gottwald , K. , Matsuda , K. , Formisano , R. , Chaplin , D.A. , Bruenning , M. , and Bringmann , G. ( 1997 ) Tetrahedron , 53 ( 22 ), 7539 – 7556 . Gottwald , K. , and Seebach , D. ( 1999 ) Tetrahedron , 55 ( 3 ), 723 – 738 . Xie , L. , Hua , W. , Chan , A.S.C. , and Leung , Y. - C. ( 1999 ) Tetrahedron Asymmetry , 10 ( 24 ), 4715 – 4728 . Berkessel , A. , Cleemann , F. , Muhkerjee , S. , M ü ller , T.N. , and Lex , J. ( 2005 ) Angew. Chem. Int. Ed. , 44 , 807 – 811 . Berkessel , A. , Muhkerjee , S. , Cleemann , F. , M ü ller , T.N. , and Lex , J. ( 2005 ) Chem. Commun. , 1898 – 1900 .
7 Francotte , E. , Leutert , T. , La Vecchia , L. , Ossola , F. , Richert , P. , and Schmidt , A.
( 2002 ) Chirality , 14 ( 4 ), 313 – 317 . McCormick , D. ( 2006 ) Pharm. Technol. , 30 ( 5 ), 54 – 61 . Hamende , M. ( 2005 ) Preparative Enantioselective Chromatogra-phy (ed. G. Cox ), Blackwell Publishing , Ames , pp. 253 – 276 .
8 Quallich , G.J. ( 2005 ) Chirality , 17 , S120 – S126 .
9 Francotte , E. ( 2006 ) Chirality in Drug Research , vol. 33 (eds E. Francotte and W. Lindner ), Wiley - VCH Verlag GmbH , Weinheim , pp. 155 – 188 .
10 Jacques , J. , Collet , A. , and Wilen , S.H. (eds) ( 1981 ) Enantiomers, Racemates and Resolutions , John Wiley & Sons Inc. , New York .
11 Ebbers , E.J. , Ariaans , G.J.A. , Houbiers , J.P.M. , Bruggink , A. , and Zwanenburg , B. ( 1997 ) Tetrahedron , 53 ( 28 ), 9417 – 9476 and references therein.
12 Huerta , F.F. , Minindis , A.B.E. , and B ä ckvall , J.E. ( 2001 ) Chem. Soc. Rev. , 30 , 321 – 331 and references therein.
13 Escoubet , S. , Gastaldi , S. , Vanthuyne , N. , Gil , G. , Siri , D. , and Bertrand , M. ( 2006 ) Eur. J. Org. Chem. , 14 , 3242 – 3250 .
14 Murahashi , S.I. ( 1983 ) J. Am. Chem. Soc. , 105 ( 15 ), 5002 – 5011 .
15 Paetzold , J. , and B ä ckvall , J. - E. ( 2005 ) J. Am. Chem. Soc. , 127 ( 50 ), 17620 – 17621 . Hoben , C.E. , Kanupp , L. , and B ä ckvall , J. - E. ( 2008 ) Tetrahedron Letts. , 49 ( 6 ), 977 – 979 . P à mies , O. , É ll , A.H. , Samec , J.S.M. , Hermanns , N. , and B ä ckvall , J. - E. ( 2002 ) Tetrahedron Letts. , 43 ( 26 ), 4699 – 4702 .
16 Parvulescu , A. , De Vos , D. , and Jacobs , P. ( 2005 ) Chem. Commun. , 5307 – 5309 .
17 Kim , M. - J. , Kim , W. - H. , Han , K. , Choi , Y.K. , and Park , J. ( 2007 ) Org. Letts. , 9 ( 6 ), 1157 – 1159 .
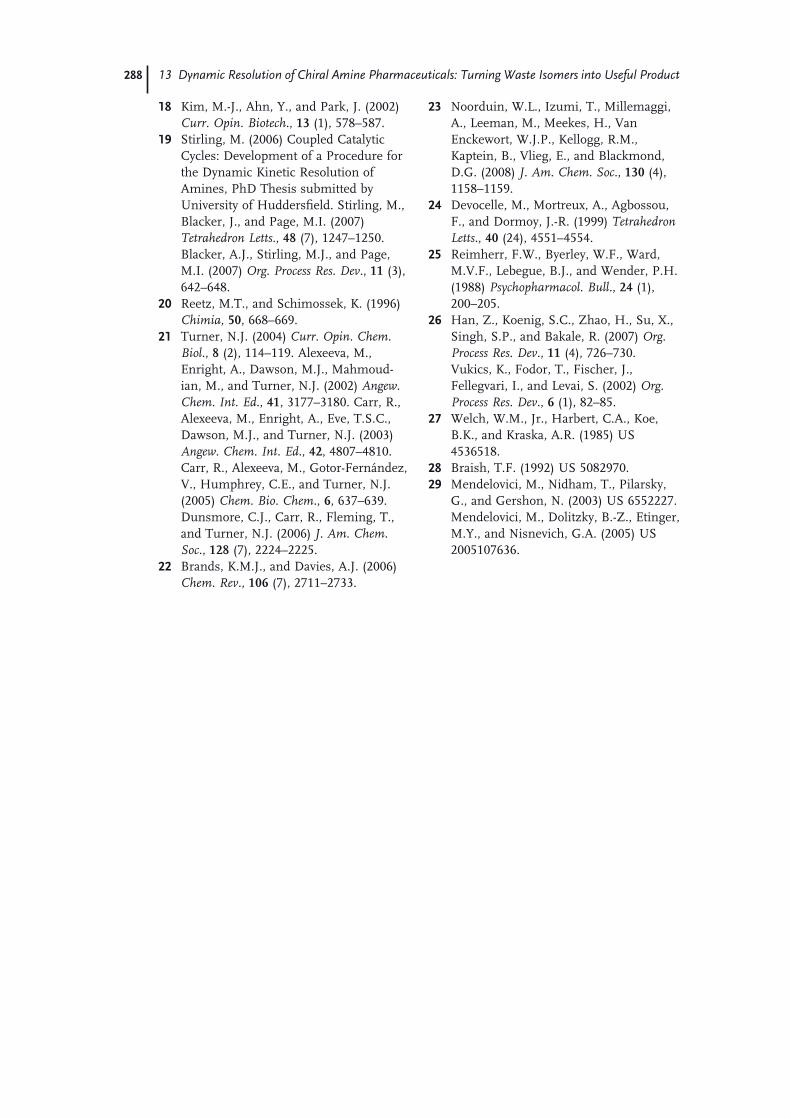
288 13 Dynamic Resolution of Chiral Amine Pharmaceuticals: Turning Waste Isomers into Useful Product
18 Kim , M. - J. , Ahn , Y. , and Park , J. ( 2002 ) Curr. Opin. Biotech. , 13 ( 1 ), 578 – 587 .
19 Stirling , M. ( 2006 ) Coupled Catalytic Cycles: Development of a Procedure for the Dynamic Kinetic Resolution of Amines , PhD Thesis submitted by University of Huddersfi eld. Stirling , M. , Blacker , J. , and Page , M.I. ( 2007 ) Tetrahedron Letts. , 48 ( 7 ), 1247 – 1250 . Blacker , A.J. , Stirling , M.J. , and Page , M.I. ( 2007 ) Org. Process Res. Dev. , 11 ( 3 ), 642 – 648 .
20 Reetz , M.T. , and Schimossek , K. ( 1996 ) Chimia , 50 , 668 – 669 .
21 Turner , N.J. ( 2004 ) Curr. Opin. Chem. Biol. , 8 ( 2 ), 114 – 119 . Alexeeva , M. , Enright , A. , Dawson , M.J. , Mahmoud-ian , M. , and Turner , N.J. ( 2002 ) Angew. Chem. Int. Ed. , 41 , 3177 – 3180 . Carr , R. , Alexeeva , M. , Enright , A. , Eve , T.S.C. , Dawson , M.J. , and Turner , N.J. ( 2003 ) Angew. Chem. Int. Ed. , 42 , 4807 – 4810 . Carr , R. , Alexeeva , M. , Gotor - Fern á ndez , V. , Humphrey , C.E. , and Turner , N.J. ( 2005 ) Chem. Bio. Chem. , 6 , 637 – 639 . Dunsmore , C.J. , Carr , R. , Fleming , T. , and Turner , N.J. ( 2006 ) J. Am. Chem. Soc. , 128 ( 7 ), 2224 – 2225 .
22 Brands , K.M.J. , and Davies , A.J. ( 2006 ) Chem. Rev. , 106 ( 7 ), 2711 – 2733 .
23 Noorduin , W.L. , Izumi , T. , Millemaggi , A. , Leeman , M. , Meekes , H. , Van Enckewort , W.J.P. , Kellogg , R.M. , Kaptein , B. , Vlieg , E. , and Blackmond , D.G. ( 2008 ) J. Am. Chem. Soc. , 130 ( 4 ), 1158 – 1159 .
24 Devocelle , M. , Mortreux , A. , Agbossou , F. , and Dormoy , J. - R. ( 1999 ) Tetrahedron Letts. , 40 ( 24 ), 4551 – 4554 .
25 Reimherr , F.W. , Byerley , W.F. , Ward , M.V.F. , Lebegue , B.J. , and Wender , P.H. ( 1988 ) Psychopharmacol. Bull. , 24 ( 1 ), 200 – 205 .
26 Han , Z. , Koenig , S.C. , Zhao , H. , Su , X. , Singh , S.P. , and Bakale , R. ( 2007 ) Org. Process Res. Dev. , 11 ( 4 ), 726 – 730 . Vukics , K. , Fodor , T. , Fischer , J. , Fellegvari , I. , and Levai , S. ( 2002 ) Org. Process Res. Dev. , 6 ( 1 ), 82 – 85 .
27 Welch , W.M. , Jr. , Harbert , C.A. , Koe , B.K. , and Kraska , A.R. ( 1985 ) US 4536518 .
28 Braish , T.F. ( 1992 ) US 5082970 . 29 Mendelovici , M. , Nidham , T. , Pilarsky ,
G. , and Gershon , N. ( 2003 ) US 6552227 . Mendelovici , M. , Dolitzky , B. - Z. , Etinger , M.Y. , and Nisnevich , G.A. ( 2005 ) US 2005107636 .
289
14 Green Technologies in the Generic Pharmaceutical Industry Apurba Bhattacharya and Rakeshwar Bandichhor
14.1 Introduction
The explosive growth of the generic pharmaceutical industry in the last two decades has been a great boon to human healthcare. Access to expensive drugs that were traditionally unaffordable has now been made affordable in many corners of the globe especially in developing nations, improving the quality of the lives of billions of individuals. With cost containment a focus for all healthcare payers and a growing and aging population, the growth of the generics market has outpaced the branded sector by a considerable margin. The generic pharmaceuti-cal industry accounts for sixty percent of total prescriptions dispensed in the United States and approximately $60 billion in revenues worldwide. Growing expenditure on drug prescriptions has been a major factor for such expansion. Although the growth of this spending has slowed down since 2001, the rate has stayed at double digits. Meanwhile, blockbuster drugs with global sales of almost $82 billion in 2001 might have lost United States patent protection by 2007. Glo-bally, cost containment in health care has been a high priority, and this will favor the increased use of generics. If a Medicare prescription drug benefi t is passed, generic drugs will be poised to further increase their dominance in the United States pharmaceutical market.
The phenomenal growth of generic pharmaceutical production has come with a signifi cant environmental cost. The pharmaceutical industry enjoys the dubious distinction of being the most wasteful, with one of the highest E factors – a measure of the quantity of waste produced compared to the amount of useful material obtained [1 – 3] . Much of the chemistry that is practiced to produce active pharma-ceutical ingredient s ( API s) is antiquated and waste producing. Whenever a drug loses patent protection and becomes generic, the amount of API needed to supply the market increases several fold. The concomitant increase in total drug produc-tion on patent expiry has created a signifi cant worldwide environmental burden. Traditionally, commodity generics require little or no innovation, are easy to manufacture, and return a small profi t margin, although the volume is high. To maximize profi ts, many generic companies make it a top priority to be the fi rst
Green Chemistry in the Pharmaceutical Industry. Edited by Peter J. Dunn, Andrew S. Wells and Michael T. Williams© 2010 WILEY-VCH Verlag GmbH & Co. KGaA, WeinheimISBN: 978-3-527-32418-7
290 14 Green Technologies in the Generic Pharmaceutical Industry
to fi le a generic version so that they can enjoy the six - month marketing exclusivity. This strategy can bring massive revenues in the short term. Also, when a generic company is trying to circumvent a patent, the speed at which the API manufac-turer can develop an alternative non - patent - infringing process is critical to the generic company ’ s success in gaining fi rst approval. As a result of all these factors, the environmental elements of production are often compromised and become a casualty in this scenario for the sake of speed to market.
In the innovative pharmaceutical industry, on the other hand, the drivers for developing new processes are different from those in the generic industry. The drug approval process is costly and long, and hence once the approval process starts it is expensive and time - consuming to change the chemistry. Since pat-ented drugs enjoy no direct competition there is no effective driving force to change the chemistry, as processing costs are relatively low compared to the selling price. As far as environmental impact is concerned, ‘ Get it right fi rst time ’ has been an important priority and aspiration for the innovative pharmaceutical sector, but that is not always considered a ‘ game changer ’ from a business standpoint.
Global demand for environmentally friendly pharmaceutical processes and products requires the development of novel and cost - effective approaches to pol-lution prevention. One of the most attractive concepts for pollution prevention is green chemistry, which is best defi ned as the utilization of a set of principles that reduces or eliminates the use or generation of hazardous substances in the design, manufacture, and application of chemical products [4] . Appropriate utilization of these green principles frequently requires the redesign of chemical products or processes. Consequently, green chemistry focuses on the fundamentals of chemi-cal research. Over the past few years signifi cant research effort in the innovator pharmaceutical community has been directed toward the development of new technologies and methodologies for more environmentally benign processes. Driven by improved process conditions and economics, ever - increasing environ-mental controls and social pressures incorporating green chemistry into the syn-thesis of APIs and intermediates have been steadily gaining priority in the pharmaceutical industry. Incorporation of green principles into synthetic route design has evolved into an institutionalized practice among major pharmaceuti-cal companies. Each year, the Environmental Protection Agency ’ s Presidential Green Challenges Awards recognize advances in green chemistry or environmen-tally favored approaches in all fi elds of chemistry. The aspiration toward green pharmaceutical development is refl ected in the formation of the ACS GCI Phar-maceutical Roundtable in 2005 by the American Chemical Society ( ACS ) Green Chemistry Institute ( GCI ) and the global pharmaceutical corporations to encour-age the integration of Green Chemistry and Green Engineering into the pharma-ceutical industry.
Unfortunately, however, the same has not been true for the generic drug indus-try. Because the drugs are off patent, the innovator companies have little incentive to modify the chemistry, and the generic companies produce the drugs largely by following the existing patents with minimal change. Here, at Dr. Reddy ’ s Labora-

14.1 Introduction 291
tories , we have been involved in developing processes for APIs that have little or no pollution potential or environmental risk and are both economically and tech-nologically feasible. The rapid development of green chemistry in Dr. Reddy ’ s is due to the realization that environmentally friendly generic drug processes will always be more economical in the long term. Our business development is geared toward ambitious environmental goals of innovation, effi cient processes, and inte-grated business fl ow. We realized that Green Chemistry offers a distinctive busi-ness advantage, which is attainable via product optimization, energy conservation, lean manufacturing, operational excellence, good science, and, most importantly, sustainability. We have developed early intervention environmental process review to identify opportunities for waste minimization and established a collaborative Green Chemistry effort between R & D and manufacturing in line with the Triple Bottom Line benefi ts now pursued by many organizations. In the sections that follow, examples will be provided of green syntheses that have been successfully applied to the production of several different APIs in Dr. Reddy ’ s portfolio (Figure 14.1 ).
N OOH
ON O
ON
N O
CONH2NH
H
H
H H
O HN
O
N
NH
O
O
NSO
HN
N
O O
HNO
SO
O
O
Galanthamine 1 Solefinacin 2
Levetiracetam 3 Finasteride 4
Zafirlukast 5 Rabeprazole 6
Figure 14.1 Structures of APIs discussed in this chapter.

292 14 Green Technologies in the Generic Pharmaceutical Industry
14.2 ‘ Waste ’ : Defi nition and Remedy
An environmentally conscious chemist is always confronted by the question ‘ Can we make a carbon - carbon bond in an environmentally acceptable manner? ’ Environmentally harmless by - products would be the components that are already present in the environment, such as H 2 O, NaCl, CO 2 (within limits), and O 2 . The two key components required for C – C bond formation are C (+) and C ( − ) equivalents, which could both be generated from C – H bonds (hydrocarbons). The generation of C ( − ) from C – H by the action of a base is potentially reversi-ble and catalytic and does not necessarily pose an environmental threat. C (+), on the other hand, is the major culprit in waste production since the formation of C (+) from C – X (where X = a leaving group) is accompanied by the departure of X ( − ) (where X behaves as a carrier of two electrons), which essentially consti-tutes the ‘ waste ’ . In other words electrons are the ultimate waste in C – C bond formation; atoms merely serve as the carriers of those electrons (atoms can be considered as the messenger and electrons are the message). The smaller the number of atoms that are utilized to carry a pair of electrons, the better off we are from an environmental perspective and overall ‘ atom economy ’ [5] . The for-mation of C – X [the C (+) surrogate] from C – H (hydrocarbon) also involves the generation of two electron waste (as H – X). Thus the creation of every C – C bond is ultimately associated with the production of four electron waste. Conceptually, this paradigm is not limited to C – C bond formation only but is applicable to any nucleophilic substitutions or elimination reactions as well. Addition reactions leading to C – C formation, on the contrary, are environmentally friendly. There-fore, the central concept of a Green process would involve conversion of the four electron waste to environmentally acceptable by - products via appropriate choice of electron acceptor elements or oxidizing agents. In this respect, the uti-lization of O 2 (or H 2 O 2 ) and Cl + (or NaOCl) would be the two obvious choices as oxidizing agents, since at the end of the process H 2 O (from O 2 or H 2 O 2 ) or NaCl (from Cl + ) would result as the by - product, rendering the entire C – C bond forming process ‘ Green ’ (Figure 14.2 ). Transition metals (such as Cu, Pd, etc), because of their multivalent status, could potentially play an important role in this ‘ Green ’ oxidation process. Thus, oxygen (or Cl + ) can act as a terminal oxi-dizing agent by oxidizing the transition metal to a higher oxidation state which in turn oxidizes the C – H bond to create the all - important C (+) necessary for the C – C bond formation in a catalytic fashion. This concept was successfully applied in the production of fi nasteride, rabeprazole, and zafi rlukast (described in the later sections).
Successful application of some of the fundamental green principles in Dr Reddy ’ s generic pharmaceutical business is exemplifi ed by the syntheses of a number of APIs: galanthamine, solifenacin, levetiracetam, fi nasteride, zafi rlukast, and rabeprazole (Figure 14.1 ).
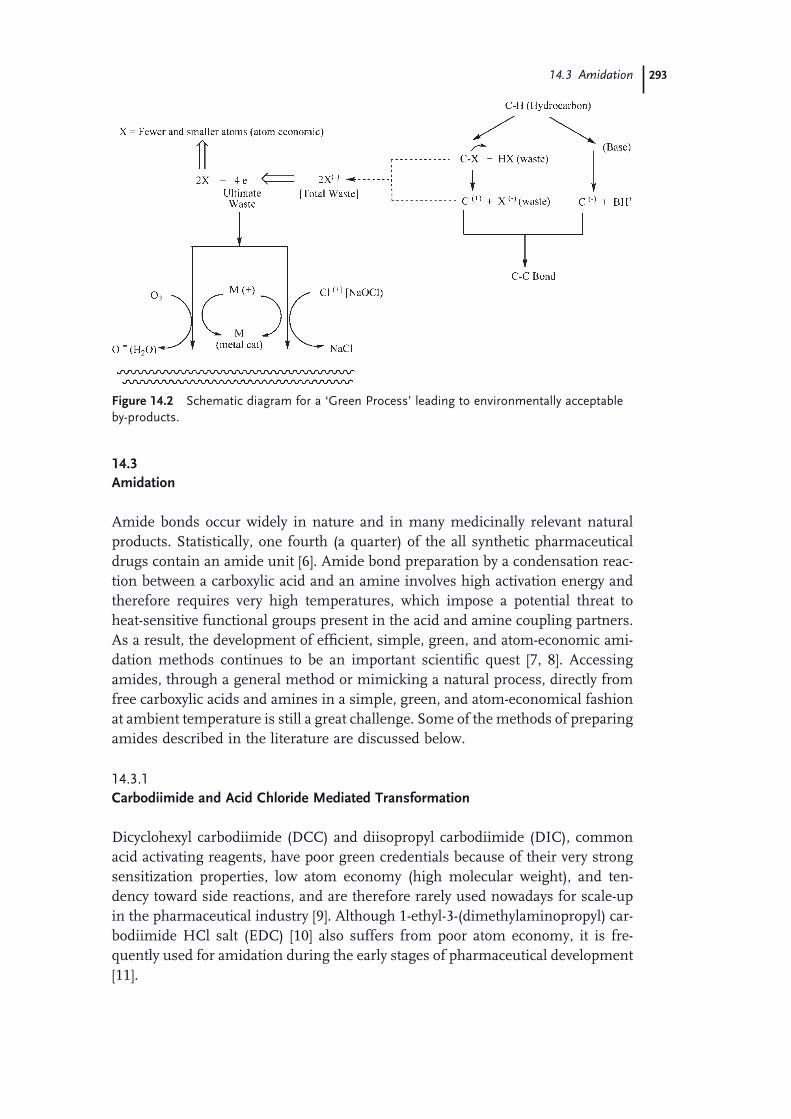
14.3 Amidation 293
14.3 Amidation
Amide bonds occur widely in nature and in many medicinally relevant natural products. Statistically, one fourth (a quarter) of the all synthetic pharmaceutical drugs contain an amide unit [6] . Amide bond preparation by a condensation reac-tion between a carboxylic acid and an amine involves high activation energy and therefore requires very high temperatures, which impose a potential threat to heat - sensitive functional groups present in the acid and amine coupling partners. As a result, the development of effi cient, simple, green, and atom - economic ami-dation methods continues to be an important scientifi c quest [7, 8] . Accessing amides, through a general method or mimicking a natural process, directly from free carboxylic acids and amines in a simple, green, and atom - economical fashion at ambient temperature is still a great challenge. Some of the methods of preparing amides described in the literature are discussed below.
14.3.1 Carbodiimide and Acid Chloride Mediated Transformation
Dicyclohexyl carbodiimide ( DCC ) and diisopropyl carbodiimide ( DIC ), common acid activating reagents, have poor green credentials because of their very strong sensitization properties, low atom economy (high molecular weight), and ten-dency toward side reactions, and are therefore rarely used nowadays for scale - up in the pharmaceutical industry [9] . Although 1 - ethyl - 3 - (dimethylaminopropyl) car-bodiimide HCl salt (EDC) [10] also suffers from poor atom economy, it is fre-quently used for amidation during the early stages of pharmaceutical development [11] .
Figure 14.2 Schematic diagram for a ‘ Green Process ’ leading to environmentally acceptable by - products.

294 14 Green Technologies in the Generic Pharmaceutical Industry
Preparation of acid chlorides is one of the easiest methods to activate an acid. Thionyl chloride (SOCl 2 ) [12, 13] is used widely to generate acid chlorides. The reaction of SOCl 2 with water or other nucleophiles is extremely exothermic, and generates large quantities of sulfur dioxide and HCl. Nevertheless, acid chlorides (via SOCl 2 ) and mixed anhydrides (via acid chlorides or chloroformates), are the most common reagents used for amide formation in the pharmaceutical industry, with N , N ′ - carbonyldiimidazole ( CDI ) growing in popularity [8] .
14.3.2 Metal - Catalyzed Oxidative Amide Synthesis
Catalytic transformations in general are more effi cient than methods which involve stoichiometric amounts of hazardous and toxic reagents. Metals which can take part in redox processes are worth considering for the development of effective catalysts employable for environmentally benign amide synthesis. Although not yet adopted on manufacturing scale so far, these reactions show promise as greener ways to form amides, so the most promising are reviewed here.
14.3.2.1 Copper - Catalyzed Amide Synthesis Recently an oxidative amidation protocol, employing copper (I) as a catalyst, was developed by C. - J. Li [14] . The proposed mechanism, shown in Scheme 14.1 , involves nucleophilic addition of the amine free base 8 to aldehyde 7 to afford hemiaminal intermediate 9 , which is then oxidized by copper(I)/ t - butyl hydrogen-peroxide (Cu(I)/TBHP) to generate the desired amide products 10 [15, 16] .
H
O
NH2R+ NH
OH
HR
NH2R HClbase
Cu(I)/TBHP
987
NH
OR
10
Scheme 14.1 Copper - catalyzed oxidative amidation.
The utility of the method was demonstrated with a variety of electron - rich and electron - poor aryl aldehydes, but the method was not suitable for aliphatic alde-hydes. No racemization was observed in the copper - catalyzed oxidative amidation reaction when an optically active amine, ( S ) - valine methyl ester, was employed.
14.3.2.2 Palladium - Catalyzed Amide Synthesis Torisawa [17] developed an alternative oxidative amidation of aldehydes using pal-ladium chloride (PdCl 2 ) - xantphos complex as a catalyst. The use of hydrogen peroxide (H 2 O 2 ) - urea complex as oxidant prevents the formation of imine from the carbinolamine intermediate and minimizes the level of benzoic acid side
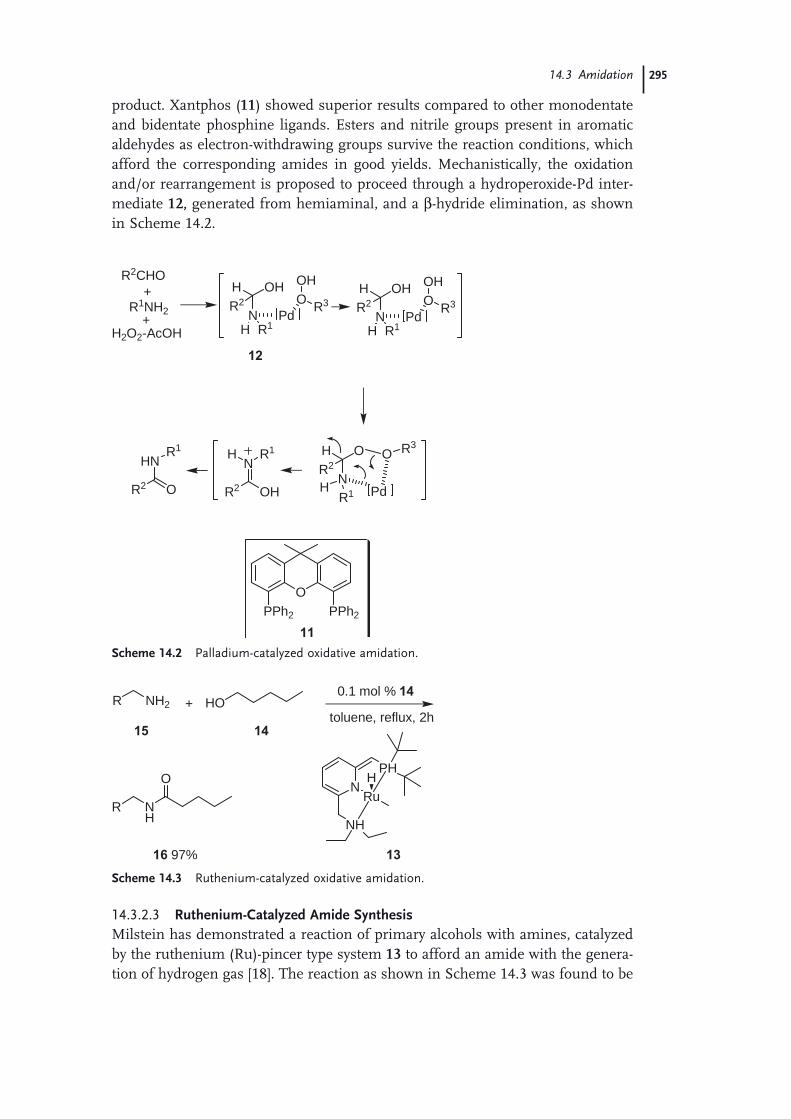
14.3 Amidation 295
product. Xantphos ( 11 ) showed superior results compared to other monodentate and bidentate phosphine ligands. Esters and nitrile groups present in aromatic aldehydes as electron - withdrawing groups survive the reaction conditions, which afford the corresponding amides in good yields. Mechanistically, the oxidation and/or rearrangement is proposed to proceed through a hydroperoxide - Pd inter-mediate 12, generated from hemiaminal, and a β - hydride elimination, as shown in Scheme 14.2 .
+R1NH2
+H2O2-AcOH
NR1H
H OHR2
PdOOH
R3N
R1H
H OHR2
PdOOH
R3
NR1H
H OR2
Pd
O R3
R2 OH
NR1H
R2 O
HNR1
12
OPPh2PPh2
11
R2CHO
Scheme 14.2 Palladium - catalyzed oxidative amidation.
R NH2 HO+0.1 mol %
15 14
14
toluene, reflux, 2h
R NH
O
16 97%
NPH
Ru
NH
H
13
Scheme 14.3 Ruthenium - catalyzed oxidative amidation.
14.3.2.3 Ruthenium - Catalyzed Amide Synthesis Milstein has demonstrated a reaction of primary alcohols with amines, catalyzed by the ruthenium ( Ru ) - pincer type system 13 to afford an amide with the genera-tion of hydrogen gas [18] . The reaction as shown in Scheme 14.3 was found to be
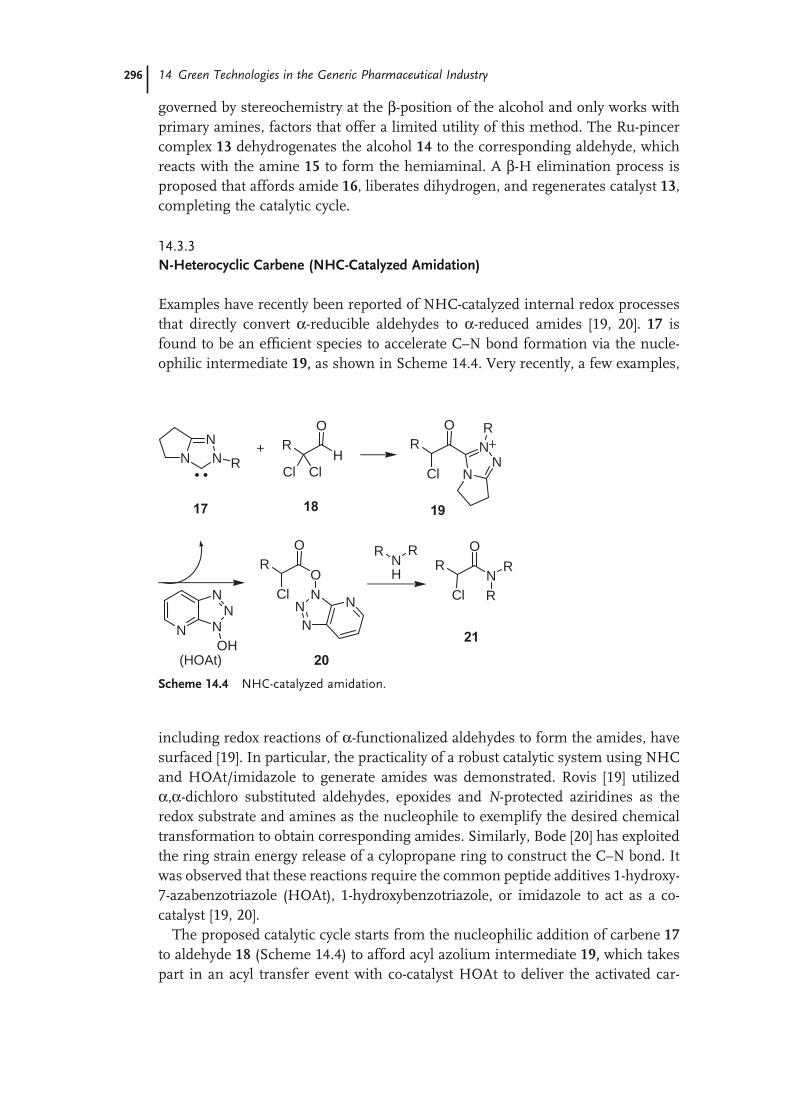
296 14 Green Technologies in the Generic Pharmaceutical Industry
governed by stereochemistry at the β - position of the alcohol and only works with primary amines, factors that offer a limited utility of this method. The Ru - pincer complex 13 dehydrogenates the alcohol 14 to the corresponding aldehyde, which reacts with the amine 15 to form the hemiaminal. A β - H elimination process is proposed that affords amide 16 , liberates dihydrogen, and regenerates catalyst 13 , completing the catalytic cycle.
14.3.3 N - Heterocyclic Carbene ( NHC - Catalyzed Amidation)
Examples have recently been reported of NHC - catalyzed internal redox processes that directly convert α - reducible aldehydes to α - reduced amides [19, 20] . 17 is found to be an effi cient species to accelerate C – N bond formation via the nucle-ophilic intermediate 19, as shown in Scheme 14.4 . Very recently, a few examples,
RH
O
Cl ClN N
N
R
17
+ RO
19
NN
NR
N NN
N
OH
Cl
RO
O
Cl NNN
N
NH
R RR
N
O
Cl
R
R
(HOAt)
18
20
21
Scheme 14.4 NHC - catalyzed amidation.
including redox reactions of α - functionalized aldehydes to form the amides, have surfaced [19] . In particular, the practicality of a robust catalytic system using NHC and HOAt/imidazole to generate amides was demonstrated. Rovis [19] utilized α , α - dichloro substituted aldehydes, epoxides and N - protected aziridines as the redox substrate and amines as the nucleophile to exemplify the desired chemical transformation to obtain corresponding amides. Similarly, Bode [20] has exploited the ring strain energy release of a cylopropane ring to construct the C – N bond. It was observed that these reactions require the common peptide additives 1 - hydroxy - 7 - azabenzotriazole ( HOAt ), 1 - hydroxybenzotriazole, or imidazole to act as a co - catalyst [19, 20] .
The proposed catalytic cycle starts from the nucleophilic addition of carbene 17 to aldehyde 18 (Scheme 14.4 ) to afford acyl azolium intermediate 19, which takes part in an acyl transfer event with co - catalyst HOAt to deliver the activated car-

14.3 Amidation 297
boxylate 20 and regenerate carbene. Finally, nucleophilic attack by an amine affords the amide 21 and regenerates the co - catalyst. Various primary and second-ary alkyl and aryl amines give good to excellent yields, while the aldehyde compo-nent can be varied from haloaldehydes to epoxy and aziridino aldehydes. Although this method lacks broad applicability, it does have some attraction for green amide synthesis.
14.3.4 Amidation Catalyzed by Boric Acid Derivatives
Yamamoto reported the fi rst boron reagent - based catalytic method that allows direct amide formation from a free carboxylic acid and amine as the reaction partners [21] . Aryl boronic acid derivatives bearing electron - withdrawing substitu-ents in the meta and/or para positions were found to be the catalyst of choice for these kinds of transformations. Tang ’ s work [22] featured the use of a cheap, readily available, non - toxic, and eco - friendly boric acid, B(OH) 3 , as a highly effec-tive catalyst that proved to be superior to other known catalysts involved in the amidation process.
Recently, Hall published an account discussing the application of o - bromophenylboronic acid and o - iodophenylboronic acid with 4 Å molecular sieves (diffi cult to use at an industrial scale) as a dehydrating agent [23] . The iodo derivative was adjudged to offer higher yields. In general, both of these cat-alysts were found to be superior to the more commonly used 3,4,5 - trifl uorophe-nylboronic acid and boric acid [21a] . Despite the proven potential of the boric acid catalysts, they have not been explored extensively for amide synthesis, par-ticularly in the preparation of APIs. Our group at Dr. Reddy ’ s Laboratories has applied boric acid - type catalysts in amide synthesis to afford various intermedi-ates useful in the synthesis of a variety of APIs [24] . In this catalyzed transfor-mation, the carboxylic acid 22 gets activated to a boronic acid derivative, 24, with loss of a molecule of water. The activated complex then undergoes a nucle-ophilic attack by amine 23 , yielding the desired amide 25 and regenerating the catalyst, as shown in Scheme 14.5 .
BO
O R1
O
R
H
OH
O
RH2O
R NH2
[catalytic]NHR
O
R
Recycled
B(OH)2R1 B(OH)2R1
22
23
2524
R1 = OH or substituted aromatic moiety
Scheme 14.5 Catalyzed amidation with boric acid or its derivative.
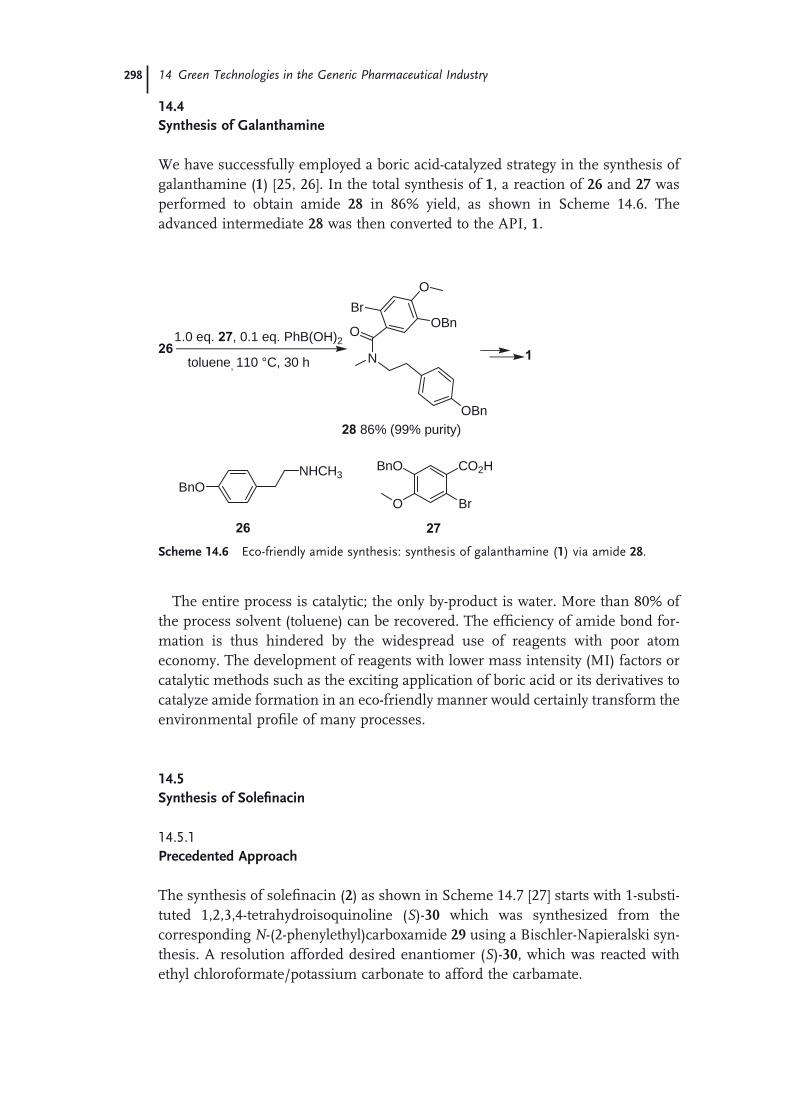
298 14 Green Technologies in the Generic Pharmaceutical Industry
14.4 Synthesis of Galanthamine
We have successfully employed a boric acid - catalyzed strategy in the synthesis of galanthamine ( 1 ) [25, 26] . In the total synthesis of 1 , a reaction of 26 and 27 was performed to obtain amide 28 in 86% yield, as shown in Scheme 14.6 . The advanced intermediate 28 was then converted to the API, 1 .
26 1.0 eq. 27, 0.1 eq. PhB(OH)2
N
O
OBnBr
O
28 86% (99% purity)
toluene, 110 °C, 30 h
CO2HBnO
O
27
BrBnO
NHCH3
26
1
OBn
Scheme 14.6 Eco - friendly amide synthesis: synthesis of galanthamine ( 1 ) via amide 28 .
The entire process is catalytic; the only by - product is water. More than 80% of the process solvent (toluene) can be recovered. The effi ciency of amide bond for-mation is thus hindered by the widespread use of reagents with poor atom economy. The development of reagents with lower mass intensity ( MI ) factors or catalytic methods such as the exciting application of boric acid or its derivatives to catalyze amide formation in an eco - friendly manner would certainly transform the environmental profi le of many processes.
14.5 Synthesis of Solefi nacin
14.5.1 Precedented Approach
The synthesis of solefi nacin ( 2 ) as shown in Scheme 14.7 [27] starts with 1 - substi-tuted 1,2,3,4 - tetrahydroisoquinoline ( S ) - 30 which was synthesized from the corresponding N - (2 - phenylethyl)carboxamide 29 using a Bischler - Napieralski syn-thesis. A resolution afforded desired enantiomer ( S ) - 30 , which was reacted with ethyl chloroformate/potassium carbonate to afford the carbamate.

14.5 Synthesis of Solefi nacin 299
The carbamate was converted to 2 using a stoichiometric amount of NaH (which is associated with safety concerns) and ( R ) - quinuclidin - 3 - ol. Despite using more than one equivalent of the expensive ( R ) - quinuclidin - 3 - ol, the transformation was found to be low yielding, as a substantial amount of unreacted starting material was recovered and the isolation became cumbersome. Thus the process cannot be regarded as green, and the development of an eco - friendly and catalytic synthesis for solefi nacin ( 2 ) is warranted.
14.5.2 A Greener Approach
So, a catalytic synthesis of solefi nacin (2 ) was developed at Dr. Reddy ’ s Laboratories [28] . Mechanistic analysis reveals that the use of stoichiometric NaH is not required, as ethoxide anions are liberated. This anion is basic enough to deprotonate the ( R ) - quinuclidin - 3 - ol ( 31 ) and is capable of driving the reaction to completion, as shown in Scheme 14.8 . The entire process is thus catalytic with respect to NaH!
NH
Ph
Oi) POCl3, P2O5, xylene, reflux ii) NaBH4, EtOH, 25 ° C
iii) ResolutionNH
Ph
N
OH 3.0 eq.(expensive)
1.7 eq. NaH, toluene, 110 ° C
N
Ph
O
ON
unreactedstarting materials+
2 55%
i) EtOCOCl, K2CO3
ii)
29 30
Scheme 14.7 Precedented synthesis of solefi nacin ( 2 ).
N
Ph
N
OH
N
Ph
O
ON
31
EtO
O
cat. NaH
N
O+
2
+OEt
Scheme 14.8 Catalytic synthesis of solefi nacin ( 2 ).

300 14 Green Technologies in the Generic Pharmaceutical Industry
The reduction in the number of equivalents of NaH and ( R ) - quinuclidin - 3 - ol ( 31 ) during the synthesis offers many advantages over the original approach, for example, (i) it is catalytic, (ii) the yield is increased from 50 to 87%, and, last but not least, (iii) it has a 50% cost advantage. Thus, the eventual synthesis was designed to be low waste producing.
14.6 Synthesis of Levetiracetam
14.6.1 Established Approach
The fi rst - generation synthesis of levetiracetam ( 3 ), as shown in Scheme 14.9 [29] , starts with benzoyl protection and oxidation of ( S ) - aminobutanol ( 32 ), which gives rise to the corresponding N - benzoyl protected ( S ) - aminobutyric acid ( 33 ). After N - benzoyl amidation and deprotection, ( S ) - aminobutyramide ( 34 ) is obtained. Chemoselective butyrolactam ring formation using the intermediate 34 and 4 - chlorobutyryl chloride fi nally affords levetiracetam ( 3 ).
H2NOH
Et i) Benzoyl protection
ii) [O]BzNH
OHEt
O32 33
i) amidation
ii) deprotection
H2NNH2
Et
O34
ClClO
NNH2
Et
O3
O
Scheme 14.9 General approach for the synthesis of levetiracetam ( 3 ).
The synthesis of 3 , presented in Scheme 14.9 , involves a protection and depro-tection strategy, which is against one of the green principles in organic synthesis [30] . Furthermore, the use of 4 - chlorobutyryl chloride in lactam ring formation yields a tremendous amount of salt waste. In such cases, there should be a better way of rendering a greener and more cost - effective synthesis. As the use of large solvent volumes in the reactions and isolations was also of concern, the synthesis depicted in Scheme 14.9 was deemed not worth developing for commercial production.

14.7 Synthesis of a Finasteride Intermediate 301
14.6.2 A More Eco - Friendly Synthesis
An eco - friendly synthesis of 3 , as shown in Scheme 14.10 , commences with the solvent - free condensation of ( S ) - aminobutanol ( 32 ) and γ - butyrolactone ( 35 ), affording the condensed alcohol 36 in quantitative yield with water as the only by - product [31] . Potassium permanganate (KMnO 4 ) mediated or ruthenium chlo-ride (RuCl 2 ) catalyzed (in combination with sodium hypochlorite) oxidation of the resulting alcohol 36 afforded intermediate 37 . Ammonia gas treatment of the mixed anhydride of acid 37 yielded the API 3 in comparable yields to those obtained in the fi rst - generation synthesis.
H2NOH
Et
32
N
Et
36
O
O O
solvent freecondensation
OH35
KMnO4 or
cat.RuCl2 / NaOClN
Et
37
O
O
OH i) EtOCOCl
ii) NH3
3
Scheme 14.10 Greener approach to the synthesis of levetiracetam ( 3 ).
The second - generation synthesis of 3 , presented in Scheme 14.10 , features a solvent - free condensation, which is crucial for effi cient synthesis of this API. There are no protection and deprotection steps in the process, and generation of salt waste is completely avoided. In the KMnO 4 - mediated oxidation, since the lactam functionality in 3 itself acts as a self protection, isolation of product is very diffi cult, as the acid 37 becomes trapped in the manganese dioxide (MnO 2) sludge. In the preferred catalytic method, isolation of hygroscopic product 37 was possible with a better yield (64.8%) and purity (91.9%). Moreover, the metal - catalyzed oxidation of alcohol 36 to acid intermediate 37 makes the synthesis more attractive and eco - friendly.
14.7 Synthesis of a Finasteride Intermediate
14.7.1 The Classical Approach
In the synthesis of fi nasteride ( 4 ) (Scheme 14.11 ), 3 - oxo - etien - 20 - oic acid ( 38 ), or the methyl ester derivative, were used as a starting materials. Endocylic olefi n

302 14 Green Technologies in the Generic Pharmaceutical Industry
cleavage of 38 employing NaIO 4 /KMnO 4 as oxidizing agents afforded dioic acid 39 or the corresponding monomethyl ester.
Subsequent ring closure with ammonia, hydrogenation using PtO 2 /H 2 or Pd – C/H 2 [32] , DCC/HOBt - mediated amidation with t - butyl amine, followed by dehydrogenation using benzeneseleninic anhydride or 2,3 - dichloro - 5,6 - dicyano - 1,4 - benzoquinone ( DDQ )/ bis(trimethylsilyl) - trifl uoroacetamide ( BSTFA ) [33] com-bination afforded 4 .
14.7.2 Problems with the Existing Synthesis
The periodate olefi n cleavage generated large amounts of colloidal MnO 2 waste and sodium iodate (NaIO 3 ). The process therefore involved multiple unit opera-tions and suffered from poor volume productivity and oxidation effi ciency (three out of four available oxygens in NaIO 4 are wasted).
As shown in Figure 14.3 , this process involved thirteen unit operations. Apart from colloidal iodate/manganate waste, signifi cant aqueous waste was also gener-ated. Additionally, the usage of multiple solvents ( t - butanol, dichloromethane, water, and petroleum ether) in the reaction and isolation makes the synthesis, presented in Scheme 14.11 , less attractive and more eco - unfriendly.
14.7.3 A Catalytic Approach
The above oxidative cleavage to produce 39 is industrially viable, but not a green process. Therefore, a greener alternative to periodate oxidation is warranted. There is literature precedence [34] regarding endocylic olefi n cleavage using a combina-tion of catalytic Ru IV and NaOCl as the terminal oxidizing agent, as shown in Figure 14.4 .
We therefore employed a similar combination of catalytic Ru IV , with NaOCl as oxidizing agent, to the intermediate 38 to effect endocylic olefi n cleavage affording dioic acid 39 (or corresponding monomethyl ester) in comparable yield, as shown in Scheme 14.12 .
O
COOR
H
H
H
COOR
H
H
HO
HO2C
KMnO4
NaIO4
4
38 39
R = H or CH3
Scheme 14.11 Classical approach for the synthesis of fi nasteride ( 4 ).

14.7 Synthesis of a Finasteride Intermediate 303
KMnO4 /NaIO4 (4 eq)
tBuOHO
CO2Me
O
CO2Me
tBuOH + Steroid Reactor Celite filtrationCelite and colloidal
Iodate/manganate-salt waste
Na2CO3 + H2O
Mix
Extract CH2Cl2 + conc. HClExtractionExtractionExtraction
Organic layer
NaIO4
H2O
Na2S2O5 + H2O
Aq.waste
Vacuum distillation
+
CH2Cl2 Residue
Petether
Vacuum distillation Petether with CH2Cl2impurities
Product
HO2C+ 4 NaIO3 + MnO2
(Waste)
CH2Cl2 layer
Aq.waste
CH2Cl2 CH2Cl2 CH2Cl2
H2O
CH2Cl2CH2Cl2
CH2Cl2
Filtrate
Unit Operations = 13
9383
KMnO4
Figure 14.3 Process fl ow chart for periodate olefi n cleavage to obtain 39 .
Figure 14.4 Greener alternative to periodate oxidation.
O
COOR
H
H
H
COOR
H
H
HO
HO2C
cat.RuO2/ NaOClCH3CN
4
38 39
R = H or CH3
Scheme 14.12 Catalytic approach for the synthesis of fi nasteride ( 4 ).
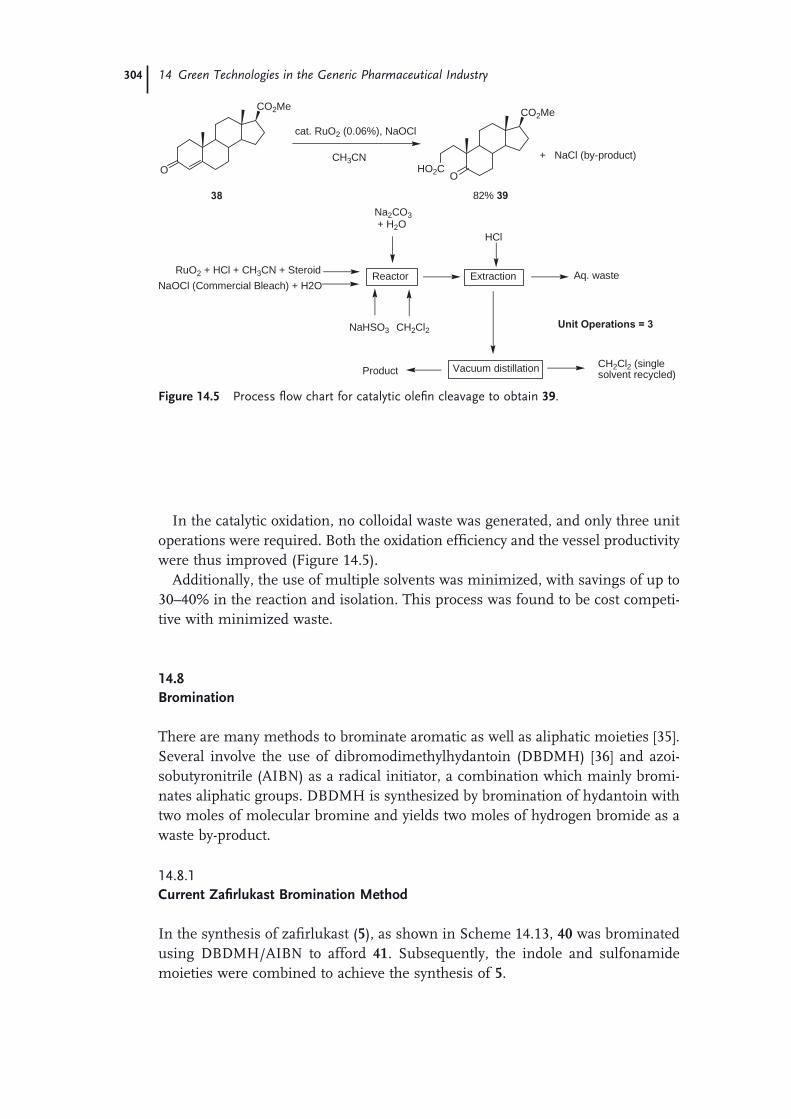
304 14 Green Technologies in the Generic Pharmaceutical Industry
In the catalytic oxidation, no colloidal waste was generated, and only three unit operations were required. Both the oxidation effi ciency and the vessel productivity were thus improved (Figure 14.5 ).
Additionally, the use of multiple solvents was minimized, with savings of up to 30 – 40% in the reaction and isolation. This process was found to be cost competi-tive with minimized waste.
14.8 Bromination
There are many methods to brominate aromatic as well as aliphatic moieties [35] . Several involve the use of dibromodimethylhydantoin ( DBDMH ) [36] and azoi-sobutyronitrile ( AIBN ) as a radical initiator, a combination which mainly bromi-nates aliphatic groups. DBDMH is synthesized by bromination of hydantoin with two moles of molecular bromine and yields two moles of hydrogen bromide as a waste by - product.
14.8.1 Current Zafi rlukast Bromination Method
In the synthesis of zafi rlukast ( 5 ), as shown in Scheme 14.13 , 40 was brominated using DBDMH/AIBN to afford 41 . Subsequently, the indole and sulfonamide moieties were combined to achieve the synthesis of 5 .
cat. RuO2 (0.06%), NaOCl
CH3CNO
CO2Me
O
CO2Me
RuO2 + HCl + CH3CN + Steroid Reactor Extraction
Na2CO3 + H2O
Vacuum distillation
NaOCl (Commercial Bleach) + H2O
NaHSO3 CH2Cl2
Aq. waste
HCl
CH2Cl2 (single solvent recycled)Product
+ NaCl (by-product)HO2C
Unit Operations = 3
38 82% 39
Figure 14.5 Process fl ow chart for catalytic olefi n cleavage to obtain 39 .

14.8 Bromination 305
14.8.2 Environmental Burden
Molecular bromine in organic chemistry is a serious cause for concern because of its toxicity and corrosive properties. Furthermore, in some of the most signifi cant uses of bromine in synthesis, the bromination of aromatic nuclei, allylic or ben-zylic positions utilize only one of the two Br atoms of Br 2 , the other atom becoming the corrosive HBr, a substance which must be neutralized or recycled. Bromina-tion of 40 involves heating with DBDMH and AIBN in a hot organic solvent to afford 41 . Interestingly, the molecular weight of 40 (MW: 180) is less than that of the brominating reagent (MW: 284), and the molecular weight of the product ( 41 ) (MW: 249) is close to the molecular weight of the by - product (MW: 206). Based on this calculation, almost 50% of the reaction mass is waste. This transformation is not atom economical, involves an ineffi cient process at the beginning of the synthesis, and is neither green nor cost effective (molecular bromine is expensive). Moreover, the production of DBDMH is waste producing. To determine the envi-ronmental impact of a process, a ‘ cradle - to - grave ’ life cycle assessment is a must. Thus, shifting the non - green part (DBDMH production) to the supplier of the alkyl halide is not an option and does not minimize the overall up - stream and down - stream global impact on the environment.
14.8.3 Waste - Minimized Bromination
In general, bromination could be much greener if there was a way to recycle HBr or Br − to Br + , so there is a need for a potential two - electron scavenger or oxidizing agent. Indeed, this kind of bromination has been reported [37] . Following the literature procedure, we at Dr. Reddy ’ s attempted the bromination of starting material 40, employing a slightly modifi ed method in a two - phase mixture, aqueous hydrogen peroxide/sulfuric acid under visible light, which offers a simple and convenient system for benzylic bromination of 40 in excellent yield and purity. The proposed mechanism is as follows:
O
O
O
NN
O
O
Br
Br
AIBN40
O
O
O
41
Br
5
Scheme 14.13 DBDMH/AIBN - mediated bromination in the synthesis of zafi rlukast ( 5 ).

306 14 Green Technologies in the Generic Pharmaceutical Industry
2Br– + H2O2 + 2H+ Br2 + 2H2O (14.1)
40 + Br2 41 + Br– + H+ (14.2)
The reaction effi ciency depends on temperature, mole ratio of reagents, and intensity of the visible light. These parameters were easily managed. Moreover, the atomic utilization of bromine is greatly increased. In this method, HBr and water are the reagent and by - product respectively, providing a process that is eco - friendly and cost effective (48% aqueous HBr is inexpensive).
14.9 Sulfoxidation in the Synthesis of Rabeprazole
The synthesis of sulfoxides from sulfi des has been widely explored, and numerous oxidants have been investigated to achieve an effi cient and selective sulfoxidation [38] . However, most of the reagents require carefully controlled conditions, includ-ing the quantity of oxidants, to avoid the formation of sulfone side products. Control to avoid formation of sulfones is particularly diffi cult since the fi rst oxida-tion to sulfoxides requires relatively high energy [38] . m - Chloroperbenzoic acid ( mCPBA ) has been intensively used in the synthesis of prazole derivatives [39] .
14.9.1 The Traditional Approach
As shown in Scheme 14.14 , the sulfi de 42 was oxidized using mCPBA to afford rabeprazole ( 6 ).
NH
NS
N
O
O
42
6
ClO
OO
NaCl
ONa
O
42
Scheme 14.14 mCPBA - mediated sulfoxidation: synthesis of rabeprazole ( 6 ).

14.10 Conclusions 307
Compound 42 was synthesized following the published method [40] . The yield of the mCPBA oxidation of 42 to afford 6 was less than 50% and involved a cum-bersome isolation procedure. This oxidation is the most environmentally unfriendly step in the synthesis of 6 . The addition of one gram of oxygen to the sulfi de gener-ates more than ten grams of m - chlorobenzoic acid as a waste. Thus, this transfor-mation is not green, and furthermore mCPBA is an expensive and shock - sensitive material.
14.9.2 A Greener Approach
The current procedure used at Dr. Reddy ’ s for the oxidation of 42 is shown in Scheme 14.15 . This involves a more eco - friendly reagent, sodium hypochlorite (NaOCl), which can be used in aqueous media. NaOCl - mediated oxidation has been widely exploited for transforming sulfi de to sulfoxide [41] . The method is effi cient, versatile, and produces sulfoxides under mild conditions.
642
NaOCl NaCl
Scheme 14.15 NaOCl - mediated sulfoxidation: synthesis of rabeprazole ( 6 ).
These reactions have also been developed with a large variety of substrates similar in structure to 42 . NaOCl is a readily available and economical reagent, which affords high yields of sulfoxides and minimizes the formation of sulfone by - products. The yield of the sulfoxidation of sulfi de 50 was increased from 45 to 76%. This method produces environmentally acceptable NaCl as the sole by - product, where Cl (+) is acting as the two - electron scavenger. Moreover, the batch time was decreased from 72 to 24 h, and the wt/wt loading of oxidizing agent NaOCl in the new reaction was almost fi ve times less than that of mCPBA. This process is undoubtedly a more eco - friendly and cost - effective one (NaOCl is inex-pensive: $0.009/mole compared to $8.65/mole for mCPBA).
14.10 Conclusions
In conclusion, there has been less commitment thus far to developing novel, simpler, greener, synthetic chemistry in the generic pharmaceutical business, which has been fundamentally driven by short - term objectives and short - term profi t. However, at Dr. Reddy ’ s we have realized at an early stage the importance of green principles in our generic business, to society, and for sustainability in general. Arguably, the business environment for generic development is changing
308 14 Green Technologies in the Generic Pharmaceutical Industry
rapidly as a result of ever - increasing environmental constraints on multiple fronts. Relevant regulations on a global basis leading to a level playing fi eld are encourag-ing adoption of green principles in the generic business as well. A holistic consid-eration is a must in the selection of the greenest route; shifting the environmental burden to suppliers is no longer an option. The greenest process will always be the most cost - effective one in the long run. Successful implementation of green principles in the generic business will only be realized by seamless amalgamation of business, science, and engineering, leading to a more sustainable world for our generation to leave behind.
Acknowledgments
We thank Dr. Reddy ’ s Laboratories for supporting this work.
References
1 Sheldon , R.A. ( 1994 ) Chemtech , 24 , 38 – 47 .
2 Sheldon , R.A. ( 2000 ) C. R. Acad. Sci., Ser. IIc: Chim. , 3 , 541 – 551 .
3 Sheldon , R.A. ( 2005 ) Green Chem. , 7 , 267 – 278 , and references therein.
4 Anastas , P. , and Warner , J. ( 1998 ) Green Chemistry: Theory And Practice , Oxford University Press , Oxford .
5 Trost , B.M. ( 1991 ) Science , 254 , 1471 – 1477 .
6 Ghose , A.K. , Viswanadhan , V.N. , and Wendoloski , J.J. ( 1999 ) J. Comb. Chem. , 1 , 55 – 68 .
7 Montalbetti , A.G.N. , and Falque , V. ( 2005 ) Tetrahedron , 61 , 10827 – 10852 .
8 Carey , J.S. , Laffan , D. , Thomson , C. , and Williams , M.T. ( 2006 ) Org. Biomol. Chem. , 4 , 2337 – 2347 .
9 Alfonsi , K. , Colberg , J. , Dunn , P.J. , Fevig , T. , Jennings , S. , Johnson , T.A. , Kleine , H.P. , Knight , C. , Nagy , M.A. , Perry , D.A. , and Stefaniak , M. ( 2008 ) Green Chem. , 10 , 31 – 36 .
10 Sheehan , J. , and Cruickshank , P.A. ( 1961 ) J. Org. Chem. , 26 , 2525 – 2528 .
11 Dunn , P. , Hughes , M.L. , Searle , P.M. , and Wood , A.S. ( 2003 ) Org. Process Res. Dev. , 7 , 244 – 253 .
12 (a) Jursic , B.S. , and Zdravkovski , Z. ( 1993 ) Synth. Commun. , 23 , 2761 – 2770 .
(b) Beckwith , A.L.J. ( 1970 ) The Chemistry of Amides , in Synthesis of Amides (ed. J. Zabicky ), Interscience , London , pp. 105 – 109 .
13 (a) Pizey , J.S. (ed.) ( 1974 ) Synthetic Reagents , vol. 1 , John Wiley & Sons, Inc. , New York , pp. 321 – 357 .
(b) Pearson , A.J. , and Roush , W.R. ( 1999 ) Handbook of Reagents for Organic Synthesis: Activating Agents and Protecting Groups , John Wiley & Sons, Inc. , New York , pp. 370 – 373 .
(c) Chu , W. , Tu , Z. , McElveen , E. , Xu , J. , Taylor , M. , Luedtke , R.R. , and Mach , R.H. ( 2005 ) Bioorg. Med. Chem. , 13 , 77 – 87 .
14 Yoo , W. - J. , and Li , C. - J. ( 2006 ) J. Am. Chem. Soc. , 128 , 13064 – 13065 .
15 Gopinath , R. , and Patel , B.K. ( 2000 ) Org. Lett. , 2 , 577 – 579 .
16 (a) Himo , F. , Eriksson , L.A. , Maseras , F. , and Siegbahn , P.E.M. ( 2000 ) J. Am. Chem. Soc. , 122 , 8031 – 8036 .
(b) Whittaker , M.M. , Ballou , D.P. , and Whittaker , J.W. ( 1998 ) Biochemistry , 37 , 8426 – 8436 .
(c) Wachter , R.M. , Montague - Smith , M.P. , and Branchaud , B.P. ( 1997 ) J. Am. Chem. Soc. , 119 , 7743 – 7749 .
17 Suto , Y. , Yamagiwa , N. , and Torisawa , Y. ( 2008 ) Tetrahedron Lett. , 49 , 5732 – 5735 .

References 309
18 Gunanathan , C. , Ben - David , Y. , and Milstein , D. ( 2007 ) Science , 317 , 790 – 792 .
19 Vora , H.U. , and Rovis , T. ( 2007 ) J. Am. Chem. Soc. , 129 , 13796 – 13797 .
20 Bode , J.W. , and Sohn , S.S. ( 2007 ) J. Am. Chem. Soc. , 129 , 13798 – 13799 .
21 (a) Ishihara , K. , Ohara , S. , and Yamamoto , H. ( 1996 ) J. Org. Chem. , 61 , 4196 – 4197 .
(b) Ishihara , K. , Kondo , S. , and Yamamoto , H. ( 2001 ) Synlett , 9 , 1371 – 1374 .
(c) Ishihara , K. , Ohara , S. , and Yamamoto , H. ( 2004 ) Org. Synth. Coll. Vol. , X , 80 .
22 Tang , P. ( 2005 ) Org. Synth. , 81 , 262 – 272 . 23 Al - Zoubi , R.M. , Marion , O. , and Hall ,
D.G. ( 2008 ) Angew. Chem. Int. Ed. , 47 , 1 – 5 .
24 Mylavarapu , R.K. , Kondaiah , G.C.M.K. , Kolla , N. , Veeramalla , R. , Koilkonda , P. , Bhattacharya , A. , and Bandichhor , R. ( 2007 ) Org. Process Res. Dev. , 11 , 1065 – 1068 .
25 Challenger , S. , Dudin , L. , DaSilva , J. , Dunn , P. , Govaerts , T. , Hayler , J. , Hinkley , B. , Houpis , Y. , Hunter , T. , Jellet , L. , Leazer , J.L. , Lorenz , K. , Mathew , S. , Rammeloo , T. , Sudini , R. , Wan , Z. , Welch , C. , Wells , A. , Vance , J. , Xie , C. , and Zhang , F. ( 2008 ) Org. Process Res. Dev. , 12 , 807 – 816 .
26 Reddy , J.M. , Kumar , K.V. , Bhaskar , V. , Raju , B.V. , Himabindu , V. , Sundaram , A. , Bhattacharya , V. , Banerjee , R. , Reddy , G.H. , and Bandichhor , R. ( 2008 ) Synthetic Commun. , 38 , 2138 – 2149 .
27 Naito , R. , Yonetoku , Y. , Okamoto , Y. , Toyoshima , A. , Ikeda , K. , and Takeuchi , M. ( 2005 ) J. Med. Chem. , 48 , 6597 – 6606 .
28 Lilakar , J.D. , Kikkuru , S.R. , and Dulipalla , S. ( 2007 ) US 073782 .
29 Ben - Zion , D. , Jean , H. , and Serguei , F. ( 2004 ) US 7132552 .
30 Anastas , P.T. , and Zimmerman , J.B. ( 2003 ) Design through the Twelve Principles of Green Engeneering.
Environmental Science and Technology , 37 (5) , 94A – 101A .
31 Gade , S.R. , Mallepalli , S.R. , Amirisetty , R.T. , Harikeerthi , N.M. , Ramasamy , V.A. , Bandichhor , R.R. , Mylavarapu , R.K. , Kopparapu , R.J.S. , Manudhane , K.S. , and Maddula , S.R. ( 2008 ) WO 077035 .
32 Karrothu , S.B. , Kolla , N. , Lekkala , A.R. , Malakondaiah Golla , C.M. , Anand , R.V. , Gandu , V. , Bhattacharya , A. , Padi , P.R. , and Bandichhor , R. ( 2007 ) Org. Process Res. Dev. , 11 , 889 – 891 .
33 Bhattacharya , A. , DiMichele , L.M. , Dolling , U.H. , Douglas , A.W. , and Grabowski , E.J.J. ( 1988 ) J. Am. Chem. Soc. , 110 , 3318 – 3319 .
34 Quittmann , W. , Roberge , D.M. , and Bessard , Y. ( 2004 ) Org. Process Res. Dev. , 8 , 1036 – 1041 .
35 Tanaka , K. , Shiraishi , R. , and Toda , F. ( 1999 ) J. Chem. Soc. Perkin Trans. 1 , 3069 – 3070 and references therein.
36 Gottumukkala , V.S. , Chava , S. , and Casukhela , S.R. ( 2008 ) WO 035379 .
37 Podgorsek , A. , Stavber , S. , Zupan , M. , and Iskra , J. ( 2006 ) Tetrahedron Lett. , 47 , 7245 – 7247 .
38 (a) Hudlicky , M. ( 1990 ) Oxidations in Organic Chemistry , ACS Monograph , Washington DC , p. 252 .
(b) Mata , E.G. ( 1996 ) Phosphorus. Sulfur. Silicon. Relat. Elem. , 117 , 231 .
39 (a) Nohara , A. , and Maki , Y. ( 1986 ) EP 174726 .
(b) Bosch Rovira , A. , Dalmases Barjoan , P. , Marquillas Olondriz , F. , Caldero , J., and Ges , J.M. ( 1992 ) ES 2023609 .
(c) Buxade Vinas , A. ( 1994 ) ES 2060541 . (d) Kato , M. , Toyoshima , Y. , and Iwano ,
N. ( 1996 ) US 5578732 . 40 Pathi , S.L. , Kankan , R. , and Dharmaraj ,
R. ( 2006 ) WO 117802 . 41 Huang , J. - Y. , Li , S. - J. , and Wang , Y. - G.
( 2006 ) Tetrahedron Lett. , 47 , 5637 – 5640 and reference cited therein.

311
15 Environmental Considerations in Biologics Manufacture Sa V. Ho
15.1 Introduction
The pharmaceutical industry is making a conscientious effort to develop cleaner and more effi cient processes for manufacturing small - molecule drugs. This devel-opment has been guided by the principles of green chemistry and engineering, which stress prevention, for example by atom economy, less hazardous chemical synthesis, use of safer chemicals, design for energy effi ciency, and use of renew-able feedstocks [1, 2] . The work has been spearheaded by the American Chemical Society Pharmaceutical Roundtable ( ACS GCIPR ), a coalition between the ACS Green Chemistry Institute ( ACS GCI ) and a number of major pharmaceutical corporations (Merck, Pfi zer, Eli Lilly, AstraZeneca, Schering - Plough, GlaxoSmith-Kline, Wyeth, Boehringer Ingelheim, and Johnson and Johnson) with the aim of integrating the principles of green chemistry and engineering into the business of drug discovery and production.
The ACS GCIPR group applied the E factor concept originally developed by Sheldon for the chemical industry [3 – 5] in analyzing the overall greenness of pharmaceuticals production. E factor is defi ned as the total amount in kilograms of organic solvents, reagents, and consumables used per kilogram of product produced. Reviewing 19 development projects from the company members, the group reported water usage to be an average of 50 kg per kg product with a range of 10 to 250, and solvents usage to be 100 kg/kg product with a range of 20 to 440; 90% of these solvents are considered to be hazardous [6, 7] .
With the emergence of molecular biology and the advances in large - scale bio-processing capabilities, biotherapeutics – biological compounds used for treating diseases – have emerged in the last two decades as an important class of drugs and are now an integral part of product portfolios in most if not all major pharmaceuti-cal fi rms. Biotherapeutics complement small - molecule drugs by expanding acces-sible targets and, for many indications, provide uniquely effective therapies. A particular group of proteins called monoclonal antibodies has been extensively employed and holds great promise as therapeutic agents for their highly specifi c binding to cellular receptors as well as for their integral roles in the body ’ s immune
Green Chemistry in the Pharmaceutical Industry. Edited by Peter J. Dunn, Andrew S. Wells and Michael T. Williams© 2010 WILEY-VCH Verlag GmbH & Co. KGaA, WeinheimISBN: 978-3-527-32418-7

312 15 Environmental Considerations in Biologics Manufacture
system. Clinically, therapeutic proteins have contributed essential therapies for the treatment of critical diseases, many life - threatening, including diabetes (insulin), end - stage renal disease (erythropoietin), viral hepatitis (interferon or IFN), cancer (trastuzumab for metastatic breast cancer, bevacizumab for metastatic colorectal cancer, I - 131 ch - TNT for advanced lung cancer), growth anomaly (human growth hormone and its antagonist), clotting disorders (Factor VII, VIII, IX), rheumatoid arthritis (anakinra), multiple sclerosis (IFN - β 1a and 1b), and inborn errors of metabolism (lysosomal enzymes) [8 – 10] . Therapeutic vaccines represent an emerg-ing area in which biologics are used to treat infectious diseases, autoimmune diseases, and cancer, Gardasil ® being an example of a recently approved cervical cancer vaccine [11] .
It is thus of interest to extend the work of the ACS GCIPR group to biothera-peutics. Most biologics, especially proteins, are produced by fermentation, not chemical synthesis. Biological processes are generally considered natural and therefore inherently green. Therapeutic biologics, however, span a very broad range of compounds (peptides, proteins, antibodies, nucleotides, and many forms of vaccines) with highly diverse properties and correspondingly varied manufactur-ing processes. Systematic environmental assessment of these systems would fi rst require grouping them into proper classes with common characteristics from a manufacturing standpoint. The work described in this chapter is drawn from an earlier ACS presentation [12] and represents an initial attempt to establish a general framework for consideration, which hopefully would encourage others in the biopharmaceutical industry to join in the effort.
15.2 Therapeutic Biologics
15.2.1 Types of Therapeutic Biologics
Highly diverse in properties and manufacturing processes, therapeutic biologics can be loosely categorized into four main groups, as follows, with an eye toward implementing the E factor concept.
1) Peptides: These are made up of approximately 20 to 40 amino acids, with molecular weights typically below 5000 Da, and are produced by chemical synthesis, primarily via solid - phase synthesis. The manufacture of peptides is thus closer to that of small molecules than to biological processes such as fermentation.
2) Proteins: These are larger than peptides, with molecular weights ranging from around 10 kDa to 200 kDa or higher, and are produced by fermentation using primarily microbes or mammalian cells. Proteins can be further subdivided into two main groups: monoclonal antibody and non - antibody proteins.

15.2 Therapeutic Biologics 313
– Monoclonal antibodies ( mAbs ): these comprise a general class of compounds with defi ned structure and typically with molecular weight around 150 kDa. They are produced by fermentation using mammalian cells. Figure 15.1 shows the general structure for IgG ( immunoglobulin G ), a common class of therapeutic antibodies. The chemical change (amino acid sequence) from one mAb to another is primarily in the variable regions. MAbs may have sugar groups attached at the position shown in the Fc region, a process called glycosylation. Herceptin ® and Rituxan ® are examples of these compounds
– Non - antibody proteins: Unlike mAbs, non - antibody proteins represent a very large and diverse group with highly variable sizes and properties depending upon their original sources and biological functions. They are produced by fermentation using primarily bacterial cells, mostly E. coli , some with yeasts. Examples of therapeutic proteins on the market include insulin, human growth hormone, tissue plasminogen activator, and glucagon.
3) Nucleotides: These are polymers of the nucleic acids that constitute genes, and are used as therapeutics for their binding properties or genetic functions. They can be divided into two groups:
– Oligonucleotides: These typically range from 20 to 40 nucleotides in length and are produced by chemical (primarily solid phase) synthesis. An example
Constant regions
Variable regions
Light chain
Heavy chain
CDR’s
Hypervariable
regions
Fc
Fab
CH1
Constant regions
Hinge region
Constant regions
Antigen binding
Complement
activation
Macrophage
binding
Glycan GlycanCarbohydrate side chain
CH2
CH3
CL
Figure 15.1 General structure of IgG antibodies.

314 15 Environmental Considerations in Biologics Manufacture
of a commercial product is Macugen ® , a 28 - mer oligonucleotide covalently linked to a large polyethylene glycol ( PEG ) molecule. As in the case of peptides, the manufacture of oligonucleotides is closer to that of small - molecule drugs.
– Plasmid DNA: These are circular strands of DNA, much larger than oligonucleotides (from 2 to over 10 kilobases, with molecular weights from a few hundred thousand to several million). They are produced by fermentation using microbial cells.
4) Vaccines: This group represents an entire class by itself with many different forms and functions. They span from the traditional vaccines such as inactivated or attenuated microbes or viruses to peptides, proteins and DNA - to virus - like particles, and usually are in combination with an adjuvant for enhanced effi cacy. They are typically produced by fermentation, except for peptides, which are produced by chemical synthesis, as mentioned above.
According to a review by Walsh [10] , of 165 biopharmaceutical products approved in the United States and Europe by 2006, only two are nucleic acid - based drugs, whereas nine of the 31 therapeutic proteins approved since 2003 are produced in E. coli , and 17 are produced by mammalian cell lines. In 2004 market distribution and manufacture of therapeutic proteins, non - glycosylated (non - antibody) proteins constitutes 40% of the total market, with 12% annual growth rate, and are pro-duced in E. coli or the yeast Saccharomyces cerevisiae ; glycoproteins (primarily mAbs) constitute 60% of the total market, with 26% annual growth rate, and are produced by mammalian cell culture (mostly with cells from Chinese Hamster Ovary, or CHO).
Not only do therapeutic proteins dominate the world of pharmaceutical biolog-ics, they are also produced by biological processes as opposed to chemical synthe-sis, which is the method of choice for production of peptides and oligonucleotides. It thus seems appropriate to focus the green technology assessment on therapeutic proteins in order to complement the ACS GCIPR work on small - molecule drugs.
15.2.2 General Features of Therapeutic Protein Manufacture
Manufacturing processes for therapeutic proteins can vary greatly, especially for non - antibody proteins. However, they share some common features that differ signifi cantly from those of small molecules. The general scheme for protein manufacture is shown in Table 15.1 . It typically involves a product synthesis step (bacterial fermentation or mammalian cell culture) followed with a series of processing steps to recover and purify the protein of interest, commonly called downstream processing ( DSP ). A major difference from the manufacture of small molecules is the need to purify the target protein from a large number of different impurities present in the post - fermentation solution, including chemical reagents used in the process, host cell components (proteins, DNA), and various altered forms of the protein product itself. This diverse mixture of impurities is the main

15.2 Therapeutic Biologics 315
reason for the complex downstream processing, which typically constitutes the bulk of the overall manufacturing process for therapeutic proteins.
Typical raw materials and processing reagents used in the manufacture of thera-peutic proteins are shown in Table 15.2 . This is another area where the manufac-ture of biologics differs greatly from that of small molecules. Owing to the complex machinery of biological cells, raw materials required for protein synthesis com-prise mainly water, sugar, salts, some trace minerals, and some supplements. Similarly, the processing area uses mostly water and salts in buffer solutions and consumables such as fi lters and chromatography resins. Very few organic solvents are used, if any, and they tend to be non - hazardous, such as alcohols.
One major characteristic of biologics manufacture compared to that of small molecules is in the extensive use of water. Concentrations of the protein product formed in the fermenter or bioreactor, called titers, are typically from 1 to 5 g L − 1 .
Table 15.1 General process scheme for therapeutic protein manufacture.
Product synthesis
– Fermentation of bacteria (e.g. E. coli ), yeasts or fungi for non - antibody proteins
– Mammalian cell culture for production of antibodies
Downstream processing
– Isolation/recovery
• Product in fermentation broth: cells and solid removal, volume reduction
• Product inside cells:
• Soluble form: cell disruption, solids removal, volume reduction
• Insoluble form (inclusion bodies): homogenization, differential centrifugation, wash, dissolution
– Purifi cation/reaction
• Bulk and Intermediate Purifi cation : primarily for removal of process - related impurities, e.g. reagents, host cell proteins, DNA, endotoxins; some product - related impurities; common methods:
• precipitation, adsorption, extraction
• chromatography (bind/elution, fl ow - through)
• Ultrafi ltration/Diafi ltration (UF/DF ): used as needed for product concentration (volume reduction) and buffer exchange (prepared for next step or for storage)
• Reaction : used at an appropriate point in purifi cation train for conversion to bioactive forms (e.g. refold / oxidation, dimer formation, PEGylation)
• Polishing : fi nal purifi cation step (invariably using chromatography) to remove close product - related impurities, residual of host cell proteins (HCPs) and endotoxins.
• Final UF/DF and Sterile Filtration : concentration and buffer exchange for long - term product storage or preparation for drug product formulation

316 15 Environmental Considerations in Biologics Manufacture
Titers above 10 g L − 1 are considered highly productive, yet 10 g L − 1 is equal to only 1 wt% of the solution, which means that roughly 100 kg of water is already required per kg of unprocessed protein in the fermentation broth. Two commonly used unit operations in bioprocessing – column chromatography and ultrafi ltration/diafi ltration – also happen to consume large amounts of water. Shown in Table 15.3 , typical water usage for these two units can range from 100 to 1000 kg water per kg product for each step. Actual water usage on the basis of the purifi ed protein weight would be even higher because of product loss occurring in these steps as well as through the rest of the process.
Table 15.2 Typical raw and processing materials used in manufacture of therapeutic proteins.
Fermentation: Product synthesis – Water, inorganic salts, caustic and acids for pH adjustment and cleaning – Carbon source (glucose), nitrogen source, complex protein source (yeast extract,
serum … ), small amounts of organics, antifoam Downstream processing: Purifi cation/Reaction • Processing materials:
– Water – Inorganic salts, bases and acids: pH adjustment, chromatography column operations,
cleaning, and buffer solutions for storage – Urea, Detergents: enhance solubilization or minimize aggregation of certain proteins – C2 - C5 alcohols and/or glycols for certain chromatography modalities (hydrophobic
interactions, reversed phase) – Special Organic Solvents (e.g., CH 3 CN): for post - fermentation modifi cation or
conjugation reactions such as PEGylation • Consumables:
– Dead - end fi lters; disposable bags, tubing and connectors – Ultrafi ltration/Microfi ltration membranes – Chromatographic resins
Table 15.3 Water usage for two common purifi cation unit operations.
Chromatography column a) Typical operating range
Resin loading, g protein/L resin 10 20 50 100 kg water/kg product 1000 500 200 100 Ultrafi ltration/diafi ltration b) Protein concentration, g/L 10 20 50 100 kg water/kg product 1000 500 200 100
a) Chromatography column: number of column volume s ( CV s) of buffer solution used is assumed to be 10; typical range is 10 to 20 CVs.
b) Ultrafi ltration/Diafi ltration: number of turn - over volume s ( TOV s) of buffer solution used is assumed to be 10; typical range is 5 to 20 TOVs.

15.3 Environmental Impact Considerations 317
15.3 Environmental Impact Considerations
Many factors affect the process design for manufacturing therapeutic proteins; they include protein type and size, production scale, and the type of host cells used. The environmental impact considerations are focused on two major groups: non - antibody proteins produced by microbial cells and mAbs produced by mammalian cells.
15.3.1 Microbially Produced Proteins
Recombinant proteins produced in microbes can vary widely in properties, such as size, charge, hydrophobicity, and conformation. Additionally, bioactivity may require the target protein to be in its multimeric forms, that is, dimeric or larger. The manufacturing processes are thus highly variable in complexity, primarily because downstream processing has to adapt to the particular host expression system and the properties of the target protein itself [13 – 17] .
In order to cover the range of process complexity, water and materials usage is analyzed for the three following cases:
• Insulin production process: A small protein with very complex and extensive purifi cation/reaction processing.
• ‘ Typical ’ process: A composite process for medium - sized proteins with complexity typically present in most microbial manufacturing processes.
• Highly effi cient process: A simple, well - optimized process for a mature product in large - scale commercial production.
15.3.1.1 Insulin Production Process Human insulin is a small protein consisting of 51 amino acids with a molecular weight of 5734 and an isoelectric point ( pI ) of 5.4. Insulin is made up of two peptide chains connected by 2 disulfi de bonds: the A chain with 21 amino acids and the B chain with 30 amino acids. This small recombinant protein has been produced on very large scales for over two decades. The various commercial proc-esses in production have been improved over the years but are still very complex [18 – 21] .
The insulin manufacturing process discussed here is similar to Eli Lilly ’ s com-mercial process and is taken from a textbook on bioprocessing [21] . The process consists of a fermentation step to produce proinsulin and a highly complicated downstream processing train to recover the proinsulin from the E. coli cells in the fermenter, convert it to insulin, then purify it to meet the required product quality for use in humans. The recovery train consists of homogenization and centrifuga-tion to extract proinsulin in the form of dense aggregates called inclusion bodies from the cells. The subsequent reaction/purifi cation train consists of a large number of process steps: solubilization of inclusion bodies, CNBr cleavage,
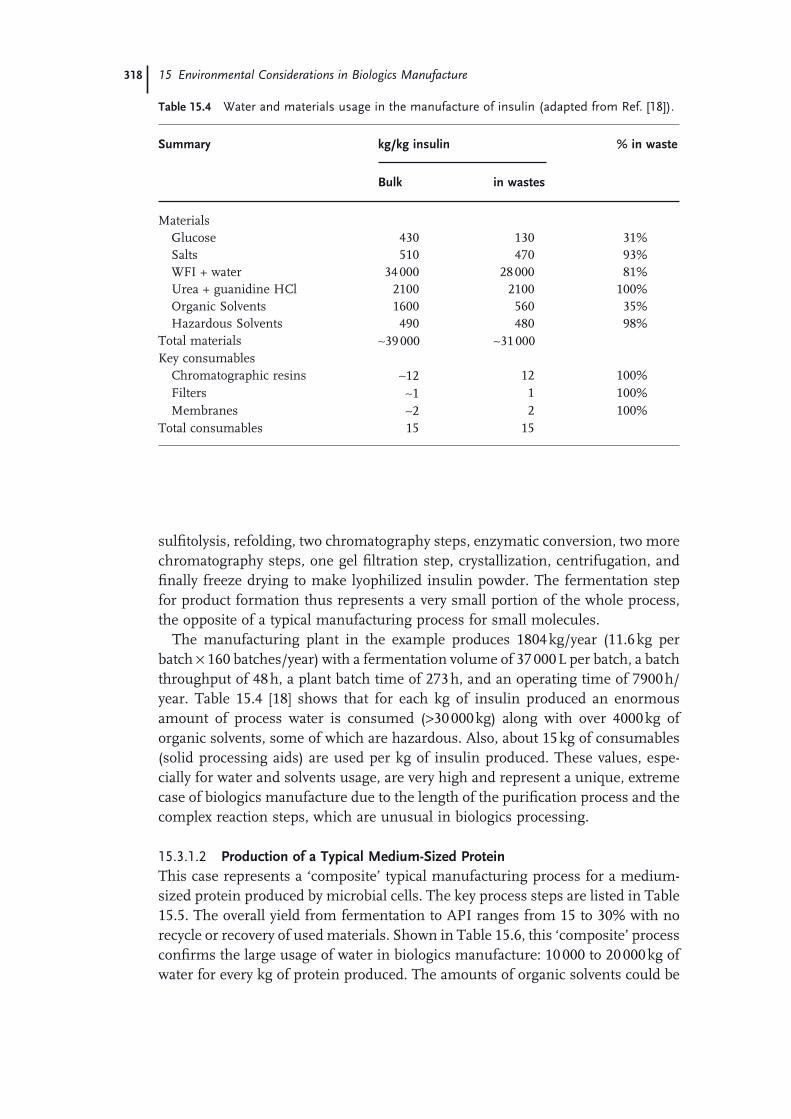
318 15 Environmental Considerations in Biologics Manufacture
sulfi tolysis, refolding, two chromatography steps, enzymatic conversion, two more chromatography steps, one gel fi ltration step, crystallization, centrifugation, and fi nally freeze drying to make lyophilized insulin powder. The fermentation step for product formation thus represents a very small portion of the whole process, the opposite of a typical manufacturing process for small molecules.
The manufacturing plant in the example produces 1804 kg/year (11.6 kg per batch × 160 batches/year) with a fermentation volume of 37 000 L per batch, a batch throughput of 48 h, a plant batch time of 273 h, and an operating time of 7900 h/year. Table 15.4 [18] shows that for each kg of insulin produced an enormous amount of process water is consumed ( > 30 000 kg) along with over 4000 kg of organic solvents, some of which are hazardous. Also, about 15 kg of consumables (solid processing aids) are used per kg of insulin produced. These values, espe-cially for water and solvents usage, are very high and represent a unique, extreme case of biologics manufacture due to the length of the purifi cation process and the complex reaction steps, which are unusual in biologics processing.
15.3.1.2 Production of a Typical Medium - Sized Protein This case represents a ‘ composite ’ typical manufacturing process for a medium - sized protein produced by microbial cells. The key process steps are listed in Table 15.5 . The overall yield from fermentation to API ranges from 15 to 30% with no recycle or recovery of used materials. Shown in Table 15.6 , this ‘ composite ’ process confi rms the large usage of water in biologics manufacture: 10 000 to 20 000 kg of water for every kg of protein produced. The amounts of organic solvents could be
Table 15.4 Water and materials usage in the manufacture of insulin ( adapted from Ref. [18] ).
Summary kg/kg insulin % in waste
Bulk in wastes
Materials Glucose 430 130 31% Salts 510 470 93% WFI + water 34 000 28 000 81% Urea + guanidine HCl 2100 2100 100% Organic Solvents 1600 560 35% Hazardous Solvents 490 480 98% Total materials ∼ 39 000 ∼ 31 000 Key consumables Chromatographic resins ∼ 12 12 100% Filters ∼ 1 1 100% Membranes ∼ 2 2 100% Total consumables 15 15

15.3 Environmental Impact Considerations 319
Table 15.5 A ‘ Composite ’ production process for a typical medium - sized protein.
Fermentation – Microbial ( E. coli ) cells – Product in soluble form inside the cells – Product concentration (titer) = 1 to 5 g/L broth
Downstream processing – Isolation: extraction, centrifugation, fi ltration – Purifi cation/reaction:
• 3 to 4 chromatography steps • 2 to 3 UF/DF steps • 0 to1 Reaction step • Sterile fi ltration to make bulk API
Table 15.6 Water/materials usage for therapeutic proteins for a composite ‘ typical ’ process.
Materials kg/kg protein
Glucose 200 – 400 Salts 200 – 300 Water 10 000 – 20 000 Acid/base buffers 100 – 200 Urea 0 – 1000 Organic solvents 0 – 200 Hazardous solvents 0 – 5 Key consumables Chromatographic resins 2 – 10 Filters 10 – 20 Membranes < 1 Total consumables ∼ 10 – 30
substantial if certain purifi cation steps such as reversed - phase chromatography are used. Some hazardous solvents may be used to carry out chemical reactions such as conjugating another molecule, such as PEG, to the protein to enhance its specifi city and/or stability. For consumables, the amount ranges from 10 to 30 kg per kg protein product. Glucose is the main raw material for cell growth, and urea is commonly used for solubilizing inclusion bodies and in assisting the conversion of a protein to its active conformation.
15.3.1.3 Highly Effi cient Protein Manufacturing Process Since so much water is used in the cases discussed so far, it would be of interest to explore the potential lower limit on its usage for a hypothetical, highly effi cient manufacturing process. This process would be operating at a very large scale for biologics ( > 10 tonnes per year), well optimized in step yields and cycle times, with a minimum number of downstream processing steps, of high overall yield for a

320 15 Environmental Considerations in Biologics Manufacture
microbial process ( > 40%), and recycling water and some key processing materials where possible. It turns out that such a process exists in the commercial produc-tion of bovine somatotropin ( BST ), a natural growth hormone of around 20 000 Da that has been used for over a decade by dairy farmers to increase milk production. Table 15.7 shows the simplifi ed process description for BST production, which uses only one chromatography column. In addition to high titers (5 – 10 g L − 1 broth), the protein is produced as inclusion bodies in the cells, which facilitates their recovery with relatively high purity from the fermenter with simple homogeniza-tion and differential centrifugation. After dissolution of inclusion bodies followed by a simple refold step to form bioactive BST, the purifi cation consists primarily of a precipitation step to remove the bulk of the impurities and then a single chromatography column as a polishing step.
Table 15.8 shows the materials and consumables used. It is remarkable that the amount of water used is reduced to less than 500 kg per kg of BST produced, and with very little urea consumption (B. Storrs and G. Gibb, personal communica-
Table 15.7 Simplifi ed process description for recombinant BST production.
E. coli fermentation • short cycle time and high titers (5 – 10 g L − 1 ), • product in dense, solid particles inside the cells (inclusion bodies)
Downstream process: only 1 chromatography column • Isolation/recovery: homogenization/centrifugation • Solubilization/refold • Bulk purifi cation (precipitation) • Polishing purifi cation (chromatography column) • UF/DF (concentration/buffer exchange) • Sterile fi ltration to make bulk API
Table 15.8 Water/materials usage for the commercial Bovine Somatotropin (BST) manufacturing process.
Materials kg/kg BST
Glucose 96 Salts 8 (Reverse osmosis) water a) 454 Urea a) 26 Consumables Fermentation fi lters 3 Aseptic fi lters 1 Chromatographic resin ∼ 0.1 UF membrane ∼ 0.1 Total consumables ∼ 4
a) With urea and water recycle.

15.3 Environmental Impact Considerations 321
tion) . Note that these are the values obtained with water/urea recycling. While there is no cost driver for recycling process water, the imposed environmental constraints on discharge of urea necessitate its recycle as aqueous solutions, result-ing in water itself being recycled as well. The usage of consumables is also quite low, about 4 kg per kg of BST. This real - life example demonstrates that a highly optimized biologics production process can drastically reduce both usage of water and generation of chemical and solid wastes.
15.3.2 Monoclonal Antibodies and Mammalian Cell Culture Processes
MAbs represent a family of molecules with similar properties. Most therapeutic mAbs are of the IgG family; they are approximately 150 kDa in size and made up of two branches, each one containing a heavy chain and a light chain, connected by several disulfi de linkages. A general structure of IgG is shown in Figure 15.1 .
From the manufacturing standpoint, three main characteristics differentiate the production of mAbs by mammalian cells from production of non - antibody pro-teins by microbial cells. First, the fermentation process during which the protein product is formed is much longer for mammalian cells than for microbial cells, about 14 days versus 2 days for E. coli . Second, the protein produced by mam-malian cells is generally secreted into the culture medium, negating the need for cell lysis to recover the product and thus avoiding release of host cell components into the culture solution. Finally, IgG antibodies bind selectively to protein A, enabling the use of a protein A affi nity chromatography step to capture mAbs with high yield and purity from the clarifi ed fermentation broth.
Many excellent reviews on monoclonal antibody manufacture have been pub-lished [23 – 26] . Given the common properties of mAbs noted above, their manu-facturing processes have become more and more standardized over the years, with enhanced effi ciency. Typically, after the fermentation step (called cell culture for mammalian cells), the cells are removed by centrifugation and depth fi ltration to obtain the clarifi ed broth containing the product protein. The traditional purifi ca-tion process consists of three bind/elution chromatography columns: a Protein A affi nity column where the mAb product is concentrated and host cell proteins and genetic components (DNA) along with cell culture media are removed, an ion - exchange column as an intermediate purifi cation to further remove host cell impurities and aggregate forms of mAb, and fi nally another ion - exchange column (or hydrophobic interactions chromatography) as a polishing step to remove resid-ual impurities. Viral clearance is a major issue with mammalian cell culture proc-esses and is carried out with two different, orthogonal steps, as required by the FDA, typically a chemical virus inactivation step at low pH and a viral fi ltration step for physical removal of the viruses. Key variations in mAb manufacture that could have strong impact on process performance include the operating order of the two ion - exchange columns in the process, fl ow - through versus bind/elution mode of operation for one of them, and even elimination of one ion - exchange column, as in the two - column process.

322 15 Environmental Considerations in Biologics Manufacture
For the intended environmental analysis, it seems reasonable to fi rst evaluate a typical platform process for mAb production that the industry is practicing or moving toward with some expected optimization, then extend the analysis to a projected, highly optimized process based on assessment from experts in the fi eld [27] .
15.3.2.1 Typical - to - Optimized Manufacturing Process for m A bs This case covers manufacturing processes ranging from older ones still in produc-tion to newer and more optimized processes. This composite case consists of one to multiple bioreactors operating in parallel to deliver cell culture broth to a single purifi cation train. The product formation step involves 1 to 6 bioreactors of 15 000 L each, with protein titers from 2 to 5 g mAb/L broth. Downstream processing includes a 3 - column purifi cation train with the last column being either bind/release or fl ow - through. Annual throughput ranges from 400 to 5000 kg mAb, with an overall yield from cell culture to purifi ed mAb of around 65 to 80%, and no recycle or recovery of process chemicals.
Table 15.9 lists the materials and consumables usage for this composite process, showing water consumption ranges from over 3000 to almost 7000 kg per kg mAb produced and consumables from 2 to 8 kg per kg of mAb. Water usage in the cell culture step makes up from 20 to 25% of the total whereas the three chromatog-raphy columns use over 50% of the total. The breakdown of water usage for the optimized, large - scale process is shown in Table 15.10 .
15.3.2.2 Projected ‘ Intensifi ed ’ Large - Scale Monoclonal Antibody Manufacturing Process Strong advocacy for a large - scale mAb manufacturing plant (10 tonnes of purifi ed mAb per year) utilizing conventional unit operations for a highly productive cell
Table 15.9 Overall materials usage for a typical - to - ‘ optimized ’ mAb manufacturing process.
Key materials kg/kg protein
Glucose 10 – 20 Water + WFI 3100 – 6800 Salts 10 – 100 Acid/base buffers 300 – 1000 Organic solvents (alcohols) 8 Total materials ∼ 3400 – 8000
Key consumables (solids) Chromatographic resins 0.7 – 3 Dead - end fi lters + disposable bags 0.3 – 4 UF/DF and viral fi ltration membranes 1 Total consumables 2 – 8
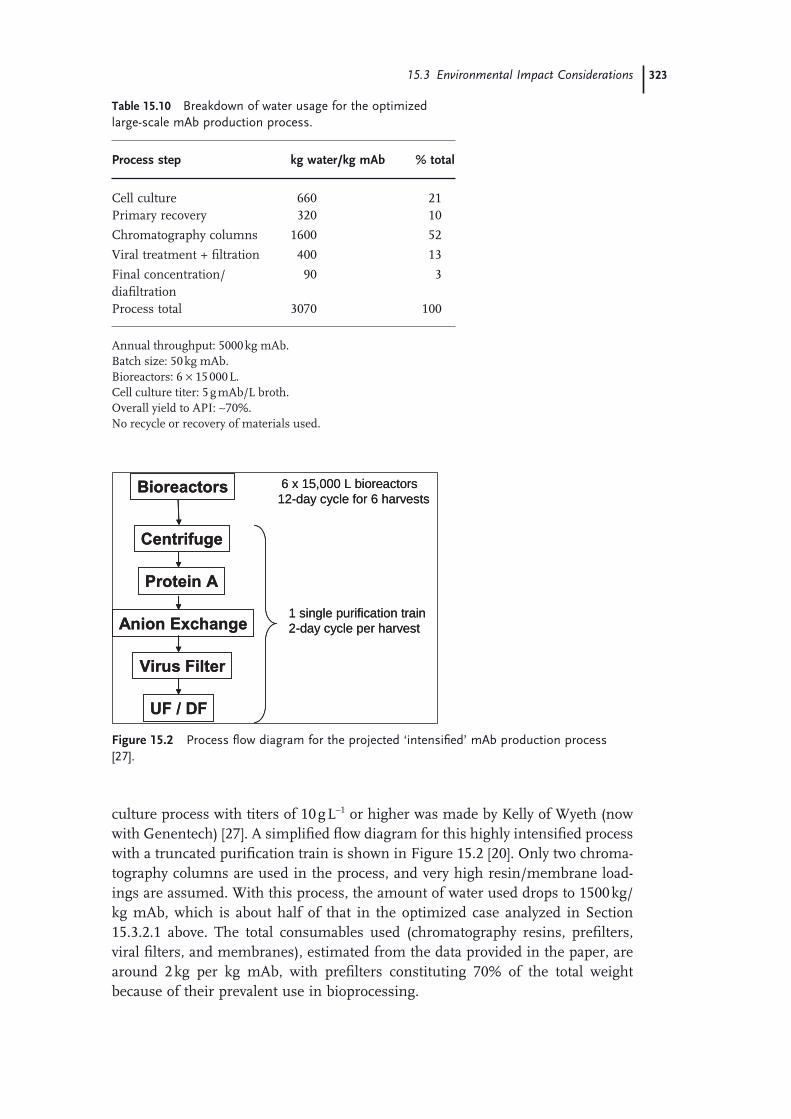
15.3 Environmental Impact Considerations 323
culture process with titers of 10 g L − 1 or higher was made by Kelly of Wyeth (now with Genentech) [27] . A simplifi ed fl ow diagram for this highly intensifi ed process with a truncated purifi cation train is shown in Figure 15.2 [20] . Only two chroma-tography columns are used in the process, and very high resin/membrane load-ings are assumed. With this process, the amount of water used drops to 1500 kg/kg mAb, which is about half of that in the optimized case analyzed in Section 15.3.2.1 above. The total consumables used (chromatography resins, prefi lters, viral fi lters, and membranes), estimated from the data provided in the paper, are around 2 kg per kg mAb, with prefi lters constituting 70% of the total weight because of their prevalent use in bioprocessing.
Table 15.10 Breakdown of water usage for the optimized large - scale mAb production process.
Process step kg water/kg mAb % total
Cell culture 660 21 Primary recovery 320 10
Chromatography columns 1600 52
Viral treatment + fi ltration 400 13
Final concentration/diafi ltration
90 3
Process total 3070 100
Annual throughput: 5000 kg mAb. Batch size: 50 kg mAb. Bioreactors: 6 × 15 000 L. Cell culture titer: 5 g mAb/L broth. Overall yield to API: ∼ 70%. No recycle or recovery of materials used.
Bioreactors
Centrifuge
Protein A
Anion Exchange
Virus Filter
UF / DF
6 x 15,000 L bioreactors12-day cycle for 6 harvests
1 single purification train2-day cycle per harvest
Bioreactors
Centrifuge
Protein A
Anion Exchange
Virus Filter
UF / DF
6 x 15,000 L bioreactors12-day cycle for 6 harvests
1 single purification train2-day cycle per harvest
Figure 15.2 Process fl ow diagram for the projected ‘ intensifi ed ’ mAb production process [27] .

324 15 Environmental Considerations in Biologics Manufacture
15.4 Overall Comparison
Table 15.11 shows the order - of - magnitude comparison of process water and mate-rials consumed per kg of therapeutic protein produced for all the cases considered. Except for the highly unique BST process, mammalian cell processes in general use much less water and consumables than microbial ones. For therapeutic pro-teins overall, process water usage appears to range from about 1000 to over 10 000 kg water per kg protein produced and solid wastes from 1 to over 10 kg per kg protein. Very little solvent or hazardous waste is used or generated. Thus, while the index factor for water usage is quite high for therapeutic proteins manufacture, the aqueous wastes generated are mostly innocuous and, after proper biological inactivation and pH adjustment carried out at the plant, are typically treated as municipal wastes.
Note that within each group (microbial and mammalian) less water is consumed as the process becomes more effi cient, suggesting that the E factor based on water usage would be a strong indicator of the degree of greenness for biologics manu-facture. This observation makes sense since every processing step in biologics manufacture uses aqueous solutions, which in turn require chemicals (salts and buffers) and consumables (fi lters, resins, membranes, disposable bags) for processing.
Total water usage at manufacturing plants, however, includes many more opera-tions than just the direct use of process water to make products, such as
• equipment cleaning: cleaning in place ( CIP ), sanitization in place ( SIP ) • generation of water for injection ( WFI )
Table 15.11 Order - of - magnitude estimate of process water and materials used in manufacture of therapeutic proteins.
Microbially derived proteins mAbs from cell culture
Highly optimized large - scale process
Typical ‘ composite ’ process
Optimized large - scale process
Highly intensifi ed large - scale process
kg per kg API
Water usage < 1000 15 000 4500 1500 Salts + buffers 1 400 300 100 Consumables (solid wastes)
1 20 4 2
Organic solvents ∼ 0 100 (alcohols, may involve some hazardous solvents)
8 (alcohols) 8 (alcohols)

15.5 Environmental Indices for Therapeutic Protein Manufacture 325
• waste disposal (biowastes) • treatment of biowaste streams (ca. 1 – 2 kg steam needed per kg waste solution) • facility maintenance (cleaning, cooling/heating, etc.) • evaporative loss
Genentech published on its website [40] the average amount of water usage for all its manufacturing sites for the period of 2004 to 2006. The numbers reported are on the order of several hundred thousand kg water used per kg of protein pro-duced. Approximate estimates for a Pfi zer pilot plant and a small manufacturing facility appear to be in the same order of magnitude. These large numbers for water usage at a biologics manufacturing plant highlight the tremendous oppor-tunity for reducing water consumption through better plant design and more streamlined operations. One major trend in this area is the movement toward disposable equipment, also known as single - use processing, which is addressed in the next section along with other technologies with potential environmental impacts.
Some of the main observations gleaned from the analysis regarding environ-mental characteristics of biologics manufacture are:
1) A very large amount of water is used in the manufacturing process.
2) Signifi cantly more water is used in supporting operations, such as generation of WFI, equipment cleaning and sterilization, wastes processing, and facility maintenance.
3) Large amounts of common salts such as NaCl and acids/bases are used in processing, which all end up as salts in the aqueous waste discharge.
4) Although the volume of liquid wastes generated is very high, the wastes are mostly aqueous and innocuous.
5) Amounts of consumables (resins, membranes, fi lters, disposable bags, and tubings/connectors) that end up as solid wastes could be large.
Table 15.12 contrasts water usage and solid waste generation for production of small - molecule drugs versus therapeutic proteins. If insulin is disregarded as an atypical case for biologics, small - molecule processes can be seen to require a great deal less water but signifi cantly more solvents, especially hazardous ones. Solid waste generation (fi lter, resin, catalysts, etc.) seems comparable for the two systems.
15.5 Environmental Indices for Therapeutic Protein Manufacture
It is clear from the analysis that the E factor for process water usage can serve as an excellent environmental index for production of therapeutic proteins, simply because every processing step is carried out in aqueous solutions, which carry with

326 15 Environmental Considerations in Biologics Manufacture
them process chemical reagents as well as requiring consumables such as tubings, fi lters, membranes, and resins for handling them. However, there are at least four types of water used in a bioprocessing plant: potable, purifi ed, highly purifi ed, and water for injection or WFI. Figure 15.3 shows a typical process for converting city water (potable) to other types used at the plant, WFI being the highest consumer of material and energy. For instance, it takes 1 kg of potable water to generate 0.8 kg of WFI. The E factor for water should therefore be weighted with respect to
Table 15.12 Comparison of small - molecules manufacture with therapeutic proteins manufacture with respect to usage of water and materials.
Small molecules Therapeutic proteins
19 developmental compounds
Insulin Medium - sized proteins
Monoclonal antibodies
kg/kg product
Process water a) 50 (range: 10 – 250) 34 000 1000 to 20 000 1500 to 4500 Organic solvents a) 100 (range:
20 – 440) 1600 0 to 200 (primarily
alcohols) ∼ 10 (primarily alcohols)
Hazardous solvents
> 90% of total organic solvents
500 0 to 5 None
Consumables (solid wastes)
< 5 14 1 to 30 2 to 4
a) From Pharmaceutical Roundtable benchmarking results.
CITYWATER
WATERSOFTENING
FILTRATIONREVERSEOSMOSIS
CONTINUOUSDEIONIZATION
PURIFIED WATERWATER-FOR-
INJECTION
DISTILLATION
UV LIGHT
Figure 15.3 A typical process for generation of Water For Injection from potable water.

15.6 Technologies with Potential Environmental Impact 327
the type of water used. Also, since so much water is required for non - process operations at a bioprocessing plant, an E factor for non - process water usage is warranted to help monitor the greenness of this part of the plant operation.
Useful environmental indices for biologics manufacture should also include waste generation and energy consumption, and waste generation would include aqueous wastes and solid wastes. Aqueous wastes generated from cleaning and sterilization operations are considered innocuous and discharged as municipal wastes after being subjected to biological kill and pH neutralization. Solid wastes, which include fi lters, membranes, resins, tubing, and disposable equipment, are treated as biohazard and are typically autoclaved and then land - fi lled or inciner-ated. Last but not least, energy consumption would be an important environmental index, differentiating between energy used in the manufacturing process, along with its supporting operations, and in facility maintenance.
15.6 Technologies with Potential Environmental Impact
Several emerging technology areas with potential environmental impacts are listed in Table 15.13 . They range from the improvement of existing systems (cell line and bioreactor optimization, process intensifi cation, better purifi cation technolo-gies), and the single - use (disposable) manufacturing concept to alternative produc-tion platforms such as cell - free synthesis and transgenic plants or animals. While a comprehensive environmental assessment of these various approaches is beyond the scope of this chapter, a few brief comments on the signifi cance of these
Table 15.13 Some bioprocessing and production technologies with potential environmental impact.
• Platform technologies: for example – Cell line and bioreactor optimization: increased titers and higher purity – Host cell proteins: characterization and selective removal resulting in simpler
purifi cation process – Process intensifi cation, for example, 10 - ton mAb process [24] – Simulated moving bed: more effi cient usage of chromatography resin (e.g., BioSMB,
Tarpon Biosystems) • Non - chromatography separations:
– Membrane - based purifi cation – Selective extraction – Selective precipitation – Proteins containing self - cleaving/controlled phase separation tags (inteins)
• Single - use manufacture • Other production platforms:
– Cell - free synthesis (Jim Swartz, Stanford) – Green plants (e.g., aquatic plants, transgenic corn, tobacco plants) – Transgenic animals

328 15 Environmental Considerations in Biologics Manufacture
key technologies are appropriate. Platform technologies are those intended for broad applications to optimize or streamline various processing steps in order to increase their effi ciency, resulting in higher overall yield and reduced materials usage. Non - chromatographic systems are intended either to replace chromatogra-phy columns or to make them more effi cient, so that in principle they should reduce water and materials usage. Membrane - based systems, however, may or may not improve water usage because of their inherent water intensive nature, as discussed in Section 15.2.2 .
Some very different methods of producing therapeutic proteins involve neither microbial nor mammalian cells directly. These include cell - free synthesis [28 – 30] , transgenic plants [31 – 34] , and transgenic animals [35 – 37] . In cell - free synthesis, cells are grown primarily to harvest their metabolic and protein production machinery (for example, ribosomes, RNAs, enzymes, reducing and oxidizing factors) for ‘ chemically ’ synthesizing the protein of interest from simple raw materials. It is possible that the cell - free synthesis approach, if properly designed, may reduce water and chemicals usage and achieve a higher production yield than a fermentation - based process.
In the transgenic plant approach, growing aquatic plants such as duckweed in a bioreactor - like environment is closer to the traditional microbial or mammalian cell production methods. Because of their requirement for the presence of light in order to grow and produce, aquatic plants tend to grow near the surface, which is exposed to the light source, and consequently do not utilize the full liquid volume in the reactor as microbial and mammalian cells do. So, unless they offer great advantages in downstream processing, aquatic plants probably will only occupy a small niche in the production of hard - to - make therapeutic proteins [22] . Transgenic crops and transgenic animals could represent game - changing situa-tions with respect to the manufacture of therapeutic proteins. However, the envi-ronmental assessment of these modes of production represents a wholly new and highly complex area because of their potential multidimensional impact, which in principle could involve chemical, biochemical, and genetic effects.
The use of disposable, also called single - use, equipment deserves a separate discussion in the next section, partly because the industry seems to be moving in that direction and partly because it clearly has signifi cant environmental implications.
15.7 Single - Use Biologics Manufacture
The adoption of single - use equipment, fi rst with some specifi c units such as fi lters and membranes for operational convenience, has now spread to practically every single operation and equipment used in the manufacturing process, including tanks, chromatography columns, and fermenters or bioreactors. Plants can now be run using all disposable equipment, called single - use manufacture. Advantages with single - use manufacture include reduced capital infrastructure, increased
15.8 Summary 329
operational fl exibility, signifi cant reduction in water usage and reduced CIP chemicals usage due to less cleaning. However, more plastic wastes will be generated that, if not recycled, have to be disposed of via either landfi ll or incineration.
Manufacturing plants for biologics are quite costly to build and operate, so that reducing processing time will positively impact the cost of manufacture. The drive toward single - use manufacture is therefore economics. Sinclair [38] has carried out a quite detailed analysis of a single - use plant versus a traditional one in terms of economics as well as environmental impact for the case of monoclonal antibody manufacture with 2 × 5000 L bioreactors, at 2 g L − 1 titer, and 51% overall purifi ca-tion yield. His analysis shows that the single - use plant reduces capital requirement by 33% and cost of goods by almost 20%. As expected, total water usage is found to decrease by half, and so is chemicals usage, primarily through less cleaning [38] . However, the waste generated from disposable plastic bags increases by almost 170 kg per kg of protein for the single - use process compared with a tradi-tional stainless steel plant. Additionally, overall environmental assessment needs to take into account additional water and chemicals used by the equipment sup-pliers themselves in generating single - use equipment. Leveen and Cox carried Sinclair ’ s analysis further for the same case taking into account energy consump-tion, including the manufacture and transport of plastic bags [39] . Expressing the overall energy consumption as carbon footprint, they found interestingly that the single - use plant would use 35% less than the traditional steel plant.
15.8 Summary
A systematic environmental assessment of biologics manufacture utilizing the E factor concept was carried out to complement prior work on small - molecule drugs. The analysis shows that manufacture of therapeutic proteins using fermentation processes requires approximately 10 to 100 times more water per kg of product made compared to the manufacture of small molecules, but the usage of solvents is low, especially hazardous ones. Thus, while the E factor for water usage is quite high for therapeutic proteins manufacture, the aqueous wastes generated are mostly innocuous. Solid waste generation seems comparable between the two groups.
The E factor for process water appears to be an appropriate environmental index for the production of therapeutic proteins simply because every processing step is carried out in aqueous solutions, which contain process chemical reagents as well as requiring consumables for handling them. However, much more water is con-sumed for non - process operations at bioprocessing plants, which suggests that an E factor for non - process water should be considered to help to monitor the environmental effi ciency of this part of plant operation. Useful environmental indices for biologics manufacture should also include waste generation and energy consumption. Just as with water, an environmental index for energy should
330 15 Environmental Considerations in Biologics Manufacture
differentiate between energy used in the manufacturing process along with its supporting operations and that used for facility maintenance. Of the many emerg-ing technology areas for therapeutic protein production, which range from the improvement of existing systems and single - use (disposable) manufacture to alter-native production platforms such as cell - free synthesis and transgenic plants or animals, single - use practice is gaining popularity with biologics manufacturers. Advantages for single - use manufacture include reduced capital infrastructure, increased operational fl exibility, and signifi cant reductions in water and chemicals usage. However, more plastic wastes are generated that, if not recycled, have to be disposed of via either landfi ll or incineration.
Acknowledgments
The author would like to thank the following colleagues in Pfi zer Global Biologics for their helpful inputs and discussions: Joseph M. McLaughlin, Andrew C. Espe-nschied, Robert E. Kottmeier, James F. Bouressa, and Ferhana Zaman. He has also much appreciated inputs from Brad Storrs and Greg Gibb of Monsanto, Suzanne S. Farid of University College London, Brian Kelley of Wyeth (now with Genentech), and Lindsay Leveen of Genentech. Peter Dunn, Pfi zer green chem-istry lead, and Berkeley W. Cue, Jr., former co - chair ACS GCIPR have provided strong encouragement and support in conducting this work, and this has been particularly appreciated.
References
1 Anastas , P.T. , and Warner , J.C. ( 1998 ) Green Chemistry, Theory and Practice , Oxford University Press , Oxford .
2 Anastas , P.T. , and Zimmerman , J.B. ( 2003 ) Environ. Sci. Technol. , 37 , 95A – 101A .
3 Sheldon , R.A. ( 1994 ) Chem, 24 , 38 – 47 .
4 Sheldon , R.A. ( 1997 ) J. Chem. Tech. Biotechnol. , 68 , 381 .
5 Sheldon , R.A. ( 2007 ) Green Chem. , 9 , 1263 – 1272 .
6 tech ( 2006 ) American Chemical Society GCIPR Table Meeting, Feb 2, 2006, Philadelphia, PA, USA .
7 Constable , D.J.C. , Dunn , P.J. , Hayler , J.D. , Humphrey , G.R. , Leazer , J.L. , Jr. , Linderman , R.J. , Lorenz , K. , Manley , J. , Pearlman , B.A. , Wells , A. , Zaks , A. , and Zhang , T.Y. ( 2007 ) Green Chem. , 9 , 411 – 420 .
8 Dingermann , T. ( 2008 ) Biotechnol. J. , 3 , 90 – 97 .
9 Reichert , J.M. , and Valge - Archer , V.E. ( 2007 ) Nat. Rev. Drug Discov. , 6 , 349 – 356 .
10 Walsh , G. ( 2006 ) Nat. Biotechnol. , 24 ( 7 ), 769 – 778 .
11 Rothengas , B.E. ( 2007 ) Int. J. Pediatr. Otorhinolaryngol. , 71 ( 4 ), 671 – 672 .
12 Ho , S.V. , McLaughlin , J.M. , Espen-schied , A.C. , Kottmeier , R.E. , and Bouressa , J.F. ( 2007 ) A preliminary green technology assessment of therapeutic protein manufacture . Presented at The Green Chemistry and Engineering Conference, June 29th, 2007 in Washington DC .
13 Swartz , J.R. ( 2001 ) Curr. Opin. Biotechnol. , 12 ( 2 ), 195 – 201 .
14 Andersen , D.C. , and Krummen , L. ( 2002 ) Curr. Opin. Biotechnol. , 13 , 117 – 123 .

References 331
15 Jana , S. , and Deb , J.K. ( 2005 ) Appl. Microbiol. Biotechnol. , 67 ( 3 ), 289 – 298 .
16 Graumann , K. , and Premstaller , A. ( 2006 ) Biotechnol. J. , 1 ( 2 ), 164 – 186 .
17 Chou , C.P. ( 2007 ) Appl. Microbiol. Biotechnol. , 76 ( 3 ), 521 – 532 .
18 Chance , R.E. , Glazer , N.B. , Wishner , K.L. , and Lispro , I. ( 1999 ) Insulin lispro (Humalog) , in Biopharmaceuticals, an Industrial Perspective (eds G. Walsh and B. Murphy ), Kluwer Academic Publishers , The Netherlands , pp. 149 – 171 .
19 Ladisch , M.R. , and Kohlmann , K.L. ( 1992 ) Biotechnol. Prog. , 8 ( 6 ), 469 – 478 .
20 Walsh , G. ( 2005 ) Appl. Microbiol. Biotechnol. , 67 ( 2 ), 151 – 159 .
21 Harrison , R.G. , Todd , P. , Rudge , S.R. , and Petrides , D.P. ( 2003 ) Bioseparations Science and Engineering , Chapter 11, Oxford University Press , Oxford , pp. 349 – 362 .
22 Biolex Therapeutics Company. http://www.biolex.com (accessed 2 May 2007).
23 Shukla , A.A. ( 2007 ) J. Chromatogr. B , 848 ( 1 ), 28 – 39 .
24 Low , D. , O ’ Leary , R. , and Pujar , N.S. ( 2007 ) J. Chromatogr. B , 848 ( 1 ), 48 – 63 .
25 Farid , S.S. ( 2007 ) J. Chromatogr. B , 848 ( 1 ), 8 – 18 .
26 Farid , S.S. ( 2006 ) Adv. Biochem. Eng. Biotechnol. , 101 (Cell Culture Engineering), 1 – 42 .
27 Kelley , B. ( 2007 ) Biotechnol. Prog. , 23 ( 5 ), 995 – 1008 .
28 Spirin , A.S. , and Swartz , J.R. ( 2008 ) Cell - free protein synthesis systems: historical landmarks, classifi cation, and general methods , in Cell - Free Protein Synthesis (eds A.S. Spirin and J. R. Swartz ), Wiley - VCH Verlag GmbH , Weinheim, Germany , pp. 1 – 34 .
29 Voloshin , A.M. , and Swartz , J.R. ( 2008 ) Large - scale batch reactions for cell - free protein synthesis , in Cell - Free Protein
Synthesis (eds A.S. Spirin and J. R. Swartz ), Wiley - VCH Verlag GmbH , Weinheim, Germany ., pp. 207 – 235 .
30 Kigawa , T. , Matsuda , T. , Yabuki , T. , and Yokoyama , S. ( 2008 ) Bacterial cell - free system for highly effi cient protein synthesis , in Cell - Free Protein Synthesis (eds A.S. Spirin and J. R. Swartz ), Wiley - VCH Verlag GmbH , Weinheim, Germany , pp. 83 – 97 .
31 Baez , J. ( 2005 ) Biopharmaceuticals derived from transgenic plants and animals , in Modern Biopharmaceuticals , vol. 3 (ed. J. Kn ä blein ), Wiley - VCH Verlag GmbH , Weinheim, Germany , pp. 833 – 892 .
32 Howard , J.A. , and Hood , E. ( 2005 ) Adv. Agro. , 85 , 91 – 124 .
33 Streatfi eld , S.J. ( 2007 ) Plant Biotechnol. J. , 5 ( 1 ), 2 – 15 .
34 Ramessar , K. , Sabalza , M. , Capell , T. , and Christou , P. ( 2008 ) Plant Sci. , 174 , 409 – 419 .
35 Janne , J. , Hyttinen , J.M. , Peura , T. , Tolvanen , M. , Alhonen , L. , and Halmekyto , M. ( 1992 ) Ann. Med. , 24 ( 4 ), 273 – 280 .
36 Das , R.C. ( 2001 ) Am. Biotechnol. Lab. , 19 ( 2 ), 60 , 62 , 64 .
37 Lee , E.G. , Lee , S.H. , Park , K.M. , Baek , J.E. , Park , J.K. , Chang , W.K. , Jung , J.K. , and Chung , B.H. ( 2008 ) Biotechnol. Bioprocess Eng. , 13 ( 2 ), 189 – 196 .
38 Sinclair , A. ( 2007 ) A universal cost model for single - use systems in biomanufacturing . Presented at Bioproduction 2007, Berlin, Germany, October 29, 2007 .
39 Leveen , L. , and Cox , S. ( 2008 ) Bigfoot or cinderella – single use or traditional facilities . Presented at IBC Conference, Santa Clara, CA, June 2, 2008 .
40 Genentech. http://www.gene.com/gene/about/environmental/commitment/water.jsp (accessed 10 April 2007).

333
16 Future Trends for Green Chemistry in the Pharmaceutical Industry Peter J. Dunn , Andrew S. Wells , and Michael T. Williams
16.1 Introduction
In this chapter, the authors would like to look at the current state of Green Chem-istry, and then look forward to what will happen in this arena over the next 20 years. The pharmaceutical industry has been accused in the past of being ‘ ungreen ’ , but a reasoned observation will show that many of the ideas and much of the drive to push for changes in synthetic methodology, green chemistry, and engineering have come from certain groups and companies within the pharmaceutical industry.
The publication in 1992 [1] of a table comparing the E factors of various industry segments raised awareness of the high levels of waste generation in the pharma-ceutical industry. Initial efforts to explain this state of affairs highlighted:
• Complex products with demanding high quality standards • Complexity of the regulatory process and its requirements (which can slow
down process changes) • Relatively low - volume products compared with other industry segments.
However, there was a realization that the various industry segments were actu-ally in the order that would be expected, that is, the pharmaceutical industry in general should produce more waste per kilo than the fi ne chemical industry, which in turn should produce more waste than the bulk chemical industry because of issues of molecular complexity and synthesis length. The target for each industry segment should be to improve and, ideally, move up to the next level (see Table 16.1 ) [2] .
It is interesting that 12 of the previous 15 chapter authors in this book have mentioned the E factor, which shows how embedded the concept has become in the pharmaceutical industry. Furthermore, in 2007 GlaxoSmithKline ( GSK ) became the fi rst company to set E factor goals (or its equivalent, ‘ mass productiv-ity ’ ) across its phase - three development compounds and to publish those goals on
Green Chemistry in the Pharmaceutical Industry. Edited by Peter J. Dunn, Andrew S. Wells and Michael T. Williams© 2010 WILEY-VCH Verlag GmbH & Co. KGaA, WeinheimISBN: 978-3-527-32418-7

334 16 Future Trends for Green Chemistry in the Pharmaceutical Industry
its corporate website. 1) Eli Lilly [3] and Pfi zer [4] have followed suit, giving public goals for environmental performance. One thing that makes these goals more complicated is that in the decade that followed the publication of the E factor table in 1992, drug candidates became signifi cantly more complex and syntheses became longer with more chemical steps. Some companies have tried to account for this change by setting E factor targets on a per chemical step basis.
It is clear that if these aspirational E factor targets are to be met, then improve-ments are desirable in many areas of chemistry, including waste minimization in medicinal chemistry, greener synthetic methods in primary manufacture, increased use of chemo and biocatalysis, and more collaborative efforts between pharmaceutical companies. These areas are all discussed in the remainder of this chapter. Although Sheldon focused on primary manufacture, it is also important to think about secondary manufacture (formulating tablets, capsules, or other dosage forms), which is also covered in this chapter.
16.2 Waste Minimization in Drug Discovery
Green Chemistry in the pharmaceutical industry fi rst fl ourished in chemical devel-opment or process research departments. However, in the last few years there has been a back integration of Green Chemistry into medicinal chemistry itself. This is not without its challenges, as the modern practice of drug discovery relies heavily on speed of execution, which in turn relies on robust methodologies emphasizing broad applicability and reliability rather than environmental impact [5] . In a large pharmaceutical company only about 5% of the chemical waste is produced in its drug discovery operations, but the advantage of greening these small - scale opera-tions is that this improved chemistry will then be available for the scaling up of the chemistry as the drug moves through the development process.
In 2004 Pfi zer started an infl uential program to reduce its use of chlorinated solvents with initial focus on dichloromethane due to its relatively high volume use in medicinal chemistry. The results of this program can be seen in Figure
Table 16.1 Current and aspirational E factors for industry segments.
Roger Sheldon 1992 Aspiration target
Industry segment E - factor Industry segment E - factor Bulk chemicals 1 – 5 Bulk chemicals Low Fine chemicals 5 – 50 Fine chemicals 1 – 5 Pharmaceuticals a) 25 – > 100 Pharmaceuticals a 5 – > 50
a) Refers to small molecule pharmaceutical drugs not biologics.
1) http://www.gsk.com/responsibility/downloads/GSK-CR-2008-full.pdf (pages 215 and 216).

16.2 Waste Minimization in Drug Discovery 335
16.1 . In 2008 the program was extended to include chloroform usage. Some research chemistry sites had completely eliminated the use of chloroform at this time, 2) but two sites continued to have high usage. An intensive education program was put in place by the Pfi zer Green Chemistry Network leading to a dramatic reduction in chloroform usage during 2008, as shown in Figure 16.2 [6] . One of the benefi ts of this type of change is that once the education program has been put in place and a change in behavior has been made, the company then receives the benefi t of those behavioral changes ever afterwards. In the view of the three editors of this book, dichloromethane is an essential solvent in the drug discovery process but needs to be used responsibly, and its use should be minimized. In contrast, we look forward to the day when chloroform disappears completely from the modern drug discovery laboratory.
0
20
40
60
80
100
120
140
2004 2005 2006 2007 2008
DC
M u
se p
er
year
in t
on
nes
Year
120.4
93.5
58.051.7 51.9
*Note –The total number of chemists
working at these sites increased
between 2004 and 2008
Figure 16.1 Dichloromethane use at Pfi zer small - molecule discovery sites (Groton, CT; La Jolla, CA; Sandwich, UK).
0
200
400
600
800
1000
1200
3Q 07 4Q 07 1Q 08 2Q 08 3Q 08 4Q 08
1150 kg 1150 kg
811 kg
268 kg
63.5 kg 21 kg
Figure 16.2 Chloroform use at Pfi zer small molecule discovery sites (Groton, CT; La Jolla, CA; Sandwich, UK).
2) This does not include the use of deuterated chloroform, which of course is widely used on a small scale for NMR measurement.

336 16 Future Trends for Green Chemistry in the Pharmaceutical Industry
Pfi zer has also had solvent reduction programs for diethyl ether, diisopropyl ether, hexane, and pentane, and these have all undergone either substantial reduc-tions or in some cases total elimination. In the case of diisopropyl ether, which easily forms explosive peroxides, some journal editors will only accept papers using this solvent if a scientifi c justifi cation for its usage is given, and this approach is to be applauded [7] .
A similar picture is emerging from some medicinal chemistry groups in Astra-Zeneca ( AZ ). Opportunities for improving environmental performance are often identifi ed using lean sigma principles. Often highlighted is the use of large amounts of undesirable solvents like n - hexane and dichloromethane in the separa-tion of mixtures and purifi cation rather than in reactions. Initiatives that are under way include replacement of n - hexane with isohexane or heptanes (both of which are signifi cantly less toxic), eliminating the use of solvents such as carbon tetra-chloride and chloroform, and minimizing the use of dichloromethane. Often this has involved moving away from silica as the traditional stationary phase in column chromatography. The goal is to move toward greener solvents without compromis-ing on speed, quality, and delivery of drug development projects. For example, focusing on reducing the use of dichloromethane, two AZ medicinal chemistry groups have reduced usage by 10 – 20% per annum and n - hexane usage by over 75%.
Other examples of greener technology being adopted by medicinal chemistry are the use of supercritical CO 2 chromatography in place of traditional normal and reverse phase chromatography, especially in the analysis and preparative separa-tion of enantiomers. A move towards automation and fl ow chemistry also offers both green and business benefi ts, such as increased speed of materials delivery and safe access to chemistries considered too unsafe to use in traditional batch mode in a standard synthetic organic chemistry laboratory. Another example of good practice widely adopted within AZ medicinal chemistry groups to minimize materials consumption is the use of bar coding and electronic tracking of labora-tory chemicals. This maximizes the use of any chemical ordered, and, if used correctly, minimizes chemical inventory. Another initiative within medicinal (and process) chemistry groups focuses on saving energy by optimizing the use of fume hoods – often the biggest consumers of energy in an R & D establishment.
As well as infl uencing solvent choice and general good laboratory practice, some companies are also looking into infl uencing reagent choice in favor of greener alternatives in the medicinal chemistry environment. One approach taken by Pfi zer is to develop a reagent guide, the aim which is to provide a balanced assess-ment of chemical methodologies, taking into account the many constraints that scientists are working with when selecting a reagent. In the Pfi zer approach the ideal reagent for medicinal chemists has three characteristics:
1) The ability of the reagent to work in good yield in a wide variety of drug - like molecules – this is a characteristic highly valued by medicinal chemists.
2) The ability of a reagent to be used for scale - up to prepare multi - kilogram batches.

16.2 Waste Minimization in Drug Discovery 337
3) To be as ‘ Green ’ or environmentally friendly as possible.
Further detail of the methodology is given in Ref. [5] , but essentially each trans-formation then gets mapped out onto a Venn diagram, as shown in Figure 16.3 . In the Pfi zer version of the tool, reagents that meet two of the three criteria (or all three obviously) are then electronically linked to literature methods or in - house methods so that the chemist has rapid access to a procedure. The tool is highly visual and has proved very popular, and the American Chemical Society ( ACS ) Green Chemistry Institute Pharmaceutical Roundtable (hereafter referred to as the Roundtable) has now started to build its own version of the tool and make it available to its member companies via the ACS website.
Hopefully these approaches pioneered by companies like AZ and Pfi zer will have a rapid take - up in the pharmaceutical industry over the next few years leading to a greener drug discovery process.
DMSO/SO3-py
TEMPO/tcca
NiO2BaMnO4MnO2
Cl2/pyPIPO/NaOClTEMPO/NaOCl
DMSO/TFAADMSO/oxalyl chloride(Swern)
Air/TEMPO/water
PDCPCC
IBX
Dess-MartinPeriodinane
TPAP/NMO
DMSO/DCC(Pfitzner-Moffat)
Me2S/Cl2
Air/Metal(cat)
Air/TEMPO/Metal(cat)
ScalabilityWide Utility
Greenness
Figure 16.3 An example of the reagent guide for the oxidation of a primary alcohol to an aldehyde.
338 16 Future Trends for Green Chemistry in the Pharmaceutical Industry
16.3 Greener Synthetic Methods in Primary Manufacturing
The case histories in this text provide vivid examples of how much has been achieved in the past decade with the ‘ greening ’ of syntheses in the pharmaceutical industry. However, two recent surveys highlighted the fact that great scope for future work remains, and presented fascinating insights into the types of reaction carried out during drug development programs. A Pfi zer survey [8] examined the reactions carried out over a 17 - year period in a single pilot plant, providing a view of the changes over that timescale, while a study from the process chemistry groups of AZ, GSK, and Pfi zer gave a snapshot of the chemistry used to synthesize 128 active pharmaceutical ingredient s ( API s) [9] . Both of these surveys revealed the widespread use of both atom ineffi cient functional group transformations and older stoichiometric synthetic methods such as Friedel - Crafts acylations, halo-genations, and metal hydride reductions.
The principles of Green Chemistry are currently most often applied to the rede-sign of API processes late in the development timeline or even post regulatory approval. Ideally, the principles of Green Chemistry should be incorporated into API manufacturing process design as early as possible in development. As the vast majority of APIs for patent - expired products are manufactured using processes developed without green chemical insights, the development of green processes for drugs manufactured by generic companies represents a great opportunity for innovation (see Chapter 14 ).
16.3.1 Synthesis Design and Execution
The survey of reactions used to prepare APIs [9] found that only 48% of reaction steps effected molecular construction, while the balance were modifying transfor-mations, such as protection/deprotection and functional group additions and interconversions ( FGAs and FGIs ) that did not form bonds present in the target. The design of greener processes will continue to focus on the minimal use of protecting groups and FGIs, as well as the wider use of catalytic rather than stoi-chiometric reactions. The survey also found that resolution methods (most often via classical salt formation) were used for in - house introduction of chirality in 62% of cases. Early - stage resolutions can be a cost - effective approach to chiral mole-cules, but their use in green syntheses would be expected to fall unless accompa-nied by an effi cient process to recycle the undesired enantiomer, preferably in situ as a dynamic process. However, the avoidance of late - stage resolutions (classical, enzymatic, or chromatographic) is one of the key opportunities for the pharma-ceutical industry to reduce waste levels, as already demonstrated by the greener synthetic processes developed for pregabalin (Chapter 8 ) and sertraline [10] .
Given the relative complexity of most APIs, there is a continuing need to develop chemo - , regio - and stereoselective reactions to reduce the levels of waste generated in their syntheses. From the 1980s onwards there was a surge in the use of cryo-

16.3 Greener Synthetic Methods in Primary Manufacturing 339
genic conditions to address selectivity issues, following the increased commercial availability of many organometallic reagents in bulk, the rapid rise in the develop-ment of single enantiomer APIs, and investment in cryogenic capabilities in many pilot plants and production facilities. However, the high energy requirements associated with maintaining very low temperatures detracts from the greenness of this approach, encouraging chemists to seek out and adopt alternative selectivity approaches. One approach has been to seek less aggressive reagents with broad functional group tolerance at more convenient temperature ranges, as exemplifi ed by the development of access to aryl and heteroarylmagnesium compounds as alternatives to the cryogenic use of organolithium reagents [11] . Alternatively, as advocated in Chapter 11 , fast reactions that are controlled by kinetics or the mixing process are often run more effi ciently in continuous reactors than is possible in batch vessels operated at low temperatures.
The survey of reactions used to prepare small - molecule APIs [9] highlighted reactions warranting research to identify greener options for the process chemist, and a subsequent paper by members of the ACS Roundtable substantially expanded this perspective [12] . The following subsections focus on three chemical transfor-mation areas requiring future development, but the reader is referred to the Roundtable reference for a more extended discussion.
16.3.2 Reduction and Oxidation
Catalytic hydrogenations using hydrogen gas are extremely atom effi cient proc-esses, and Green Chemistry would benefi t from the development of this methodol-ogy to a broader range of groups. For example, the direct hydrogenation of amides to amines and acids or esters to alcohols in complex substrates would reduce the current dependence upon metal hydrides or boranes for these transformations.
Although asymmetric hydrogenation using chiral Ru, Ir, and Rh catalysts is a mature research area [13] , only about 10 instances had been implemented at pro-duction scale across the fi ne chemical and pharmaceutical industry by 2001 [14] . The number of applications of this atom - effi cient technology has grown rapidly in recent years [15] , but challenges remain including improvements in the recovery and recycling of catalysts using various immobilization methods [16] .
Oxidations are employed in pharmaceutical syntheses [17] , but are used far less frequently (3 – 4%) than reductions (12 – 14%) according to recent surveys [8, 9] , and this is borne out by the paucity of examples in this text ’ s case histories. Increas-ingly, atom - effi cient and environmentally acceptable methods have become avail-able using oxygen, hydrogen peroxide, or bleach as the oxidant without the need for toxic heavy metals [18] . However, oxidation reactions are frequently designed out of pharmaceutical syntheses, and more chemoselective, preferably catalytic, methods need to be developed to enable their wider use. Many oxidizing agents are high - energy species with potential thermal hazards, so an increased use of continuous or biocatalytic oxidation processes is therefore to be expected.

340 16 Future Trends for Green Chemistry in the Pharmaceutical Industry
16.3.3 C – C Bond Formation
Precious metal - catalyzed C – C bond - forming processes have now reached a level of effi ciency that has assured their importance in pharmaceutical manufacturing, with Suzuki and Heck reactions the most prevalent [9] . Advances in two particular areas could enhance the greenness of these cross - coupling reactions. The fi rst area concerns the coupling partners themselves, as they are frequently prepared via separate FGA reactions. Where aryl organometallics are required, such as the boronic acids used in Suzuki couplings, extension of the recent advances in direct arylation methodology [19] could eliminate the need to prepare many boron rea-gents and their halide precursors. In further instances, emerging in - situ C – H borylation methodology (see Table 16.2 ) would remove the need for the halide precursor. For the halide coupling partners themselves, the trend towards methods that use the chloride, rather than the bromide or iodide, needs to be accelerated. The second area concerns catalyst development, with an eye on sustainability and toxicity issues. The extremely high cost of precious metals is related to both their rarity and their diminishing fi nite reserves [20] , and is encouraging research into the use of catalysts based on more sustainable metals such as iron [21] . Precious
Table 16.2 Roundtable grants and Inter - pharma prizes for process research.
Astra Zeneca/GSK/Pfi zer process chemistry prizes
ACS GCI pharmaceutical roundtable research grants
2005 J.M.J Williams (dynamic kinetic resolution of alcohols and catalytic alkylations using alcohols)
Grant scheme started in 2007
2006 B. Lygo (development and understanding of novel phase - transfer catalysts)
Grant scheme started in 2007
2007 N.J Turner (work on the ‘ biocatalytic toolbox ’ to increase effi ciency and sustainability)
J. Xiao (amide reductions without hydride reagents) R.E Maleczka and M.R. Smith (Suzuki reaction via in situ borylation without the need for halogens)
2008 J. Xiao (studies on the effect of reaction media on catalytic cycles, including asymmetric catalytic transfer hydrogenation of ketones in water)
M. Krische (chiral amines via C – C Bond - Forming Transfer Hydrogenation and Hydrogen Auto - Transfer) and C.J. Li (amine synthesis by asymmetric multi - component reactions)
2009 V. Aggarwal (recent contributions to sulfonium salts and chiral carbenoids as applied to asymmetric synthesis)
R. Crabtree (catalytic alkylations using alcohols with cheaper more abundant metals)
16.3 Greener Synthetic Methods in Primary Manufacturing 341
metals such as palladium are also relatively toxic (both to humans and environ-mentally), so that their emergence as homogeneous catalysts in pharmaceutical processes has been necessarily attended by the parallel development of specialized techniques to reduce residual metal levels in API below 10 ppm [22] . The use of far less toxic metals such as iron for cross - coupling reactions has also permitted the use of nitrogen ligands that are also less toxic than the phosphine ligands that are generally required with precious metal catalysts [23] . However, work with more sustainable and less toxic iron - [24] and copper - based catalysts is still at a relatively early stage, and much remains to be done before the effi ciency associated with Pd - based catalysts is approached.
16.3.4 Heteroatom Alkylation and Acylation
Most APIs contain oxygen and nitrogen, and in recent surveys O - and N - alkylation and acylation reactions together were found to account for > 30% of the reactions used to synthesize them [9] , whereas C – C bond - forming reactions accounted for < 15% [8, 9] . Although cheap amide formation processes are available (notably the acid chloride and mixed carbonic anhydride methods), they are neither particularly green nor atom effi cient. There is thus still an important need for the development of catalytic, environmentally friendly acylation processes. The boron - based cata-lysts reviewed in Section 14.3.4 show early promise, and a recent publication highlights the use of activated silica to catalyze amide formation [25] , but signifi -cant further work is needed to identify catalysts that are suffi ciently effective at suitable temperatures, while also being readily synthesized and separated from reaction products.
There is still a heavy reliance for heteroatom alkylation on the use of alkylating agents, which are usually produced from alcohols in a separate FGI. An increasing focus on the need to stringently control the levels of genotoxins in APIs has made the use of alkylating agents late in syntheses more problematic. Processes for effecting alkylations with alcohols directly, thus avoiding a wasteful FGI and the intermediacy of genotoxic agents, are now emerging [26] , and their further devel-opment and deployment for N - substitution in particular will be of great potential benefi t.
16.3.5 Biocatalysis Now and Into the Future
In the 1970s and 1980s, the pioneers of biocatalysis for synthetic chemistry were the pharmaceutical companies with large fermentation groups and interests in natural products and semi - synthetics. Such groups had the skills base and critical mass to develop bioprocesses mainly in house (Glaxo, Beecham, Schering - Plough, Pfi zer, BMS). Generally, across the ‘ inventor companies ’ , such groups have declined as fermentation products have gone off patent, and many companies have decided to reduce their investigations into natural products and semi - synthetics.
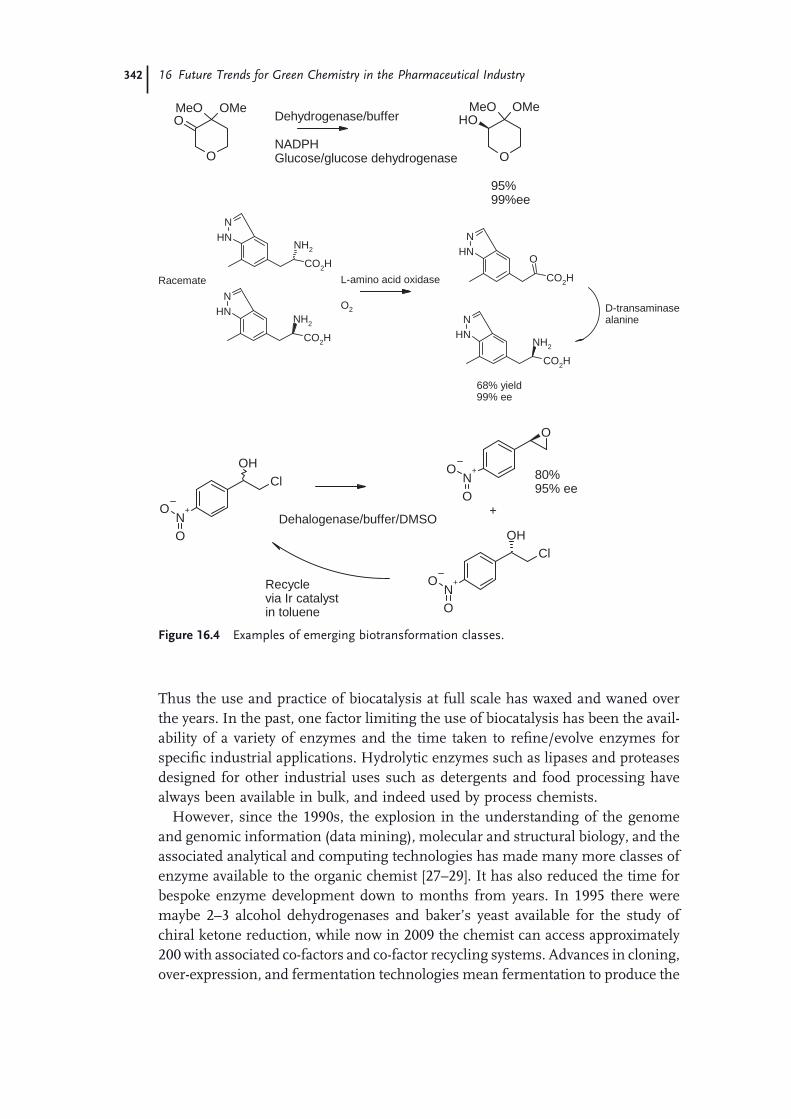
342 16 Future Trends for Green Chemistry in the Pharmaceutical Industry
Thus the use and practice of biocatalysis at full scale has waxed and waned over the years. In the past, one factor limiting the use of biocatalysis has been the avail-ability of a variety of enzymes and the time taken to refi ne/evolve enzymes for specifi c industrial applications. Hydrolytic enzymes such as lipases and proteases designed for other industrial uses such as detergents and food processing have always been available in bulk, and indeed used by process chemists.
However, since the 1990s, the explosion in the understanding of the genome and genomic information (data mining), molecular and structural biology, and the associated analytical and computing technologies has made many more classes of enzyme available to the organic chemist [27 – 29] . It has also reduced the time for bespoke enzyme development down to months from years. In 1995 there were maybe 2 – 3 alcohol dehydrogenases and baker ’ s yeast available for the study of chiral ketone reduction, while now in 2009 the chemist can access approximately 200 with associated co - factors and co - factor recycling systems. Advances in cloning, over - expression, and fermentation technologies mean fermentation to produce the
NNH
NH2
CO2H
NNH
NH2
CO2H
NNH
CO2H
O
NNH
NH2
CO2H
Racemate L-amino acid oxidase
O2 D-transaminasealanine
68% yield99% ee
OHCl
N+O
O
N+O
O
O
OHCl
N+O
O
+
80%95% ee
Dehalogenase/buffer/DMSO
Recyclevia Ir catalyst in toluene
O
OOMeMeO
O
OHOMeMeO
Dehydrogenase/buffer
NADPHGlucose/glucose dehydrogenase
95%99%ee
Figure 16.4 Examples of emerging biotransformation classes.

16.3 Greener Synthetic Methods in Primary Manufacturing 343
biocatalyst is a lot more effi cient, and an enzyme produced from a single gene has much less variability that crude enzyme preparations from natural organisms.
Some examples of emerging enzyme classes that are rapidly making an impact in synthetic organic chemistry are shown in Figure 16.4 : alcohol dehydrogenase for the reduction of ketones [30] , transaminase [31] , and haloalkane dehalogenase [32] .
Another aspect undoubtedly contributing to the increased knowledge and uptake of biocatalysis has been the strong industrial/academic consortia that have devel-oped in Europe and the United States. These are exemplifi ed by the Center of Excellence in Biocatalysis, Biotransformations and Biocatalytic Manufacture at Manchester, UK, 3) the Applied Biocatalysis Research Center at Graz, Austria, 4) and the Center for Biocatalysis and Bioprocessing, Iowa, USA.
It is clear from the examples in this book that the use of biocatalysis can produce some very cost - effective and environmentally acceptable processes, and the authors anticipate that the use of this technology will increase as synthetic organic chem-ists realize its value and begin to look for strategic disconnections in the synthetic sequence of new target molecules where a biocatalytic step can be applied to utmost benefi t. Thus, biocatalysis should be seen as a routine part of the synthetic toolbox and, in some cases, the reagent of choice for transformations such as the reduction of ketones to chiral alcohols, and not as a technology of last resort when all else has failed.
16.3.6 Application of Technology
As discussed in Chapter 11 , continuous processing has the potential to make many reaction steps greener, for example, by decreasing energy consumption and solvent use, lowering by - product levels and hence waste production, and enabling the use of more atom - effi cient process routes involving energetic intermediates. An analysis based on reaction kinetics suggests that up to 50% of manufacturing reaction steps in the fi ne chemical and pharmaceutical industries could benefi t from being run continuously rather than in batch mode in a stirred tank reactor [33] . This is likely to be an over - estimate, because of issues such as the handling of suspended solids, though reactors which cope better with solids and operate over wider temperature ranges continue to be developed [34] . Although currently available reactors can handle a broad range of gas, liquid, or gas - liquid reactions, multi - purpose pharmaceutical use is likely to be focused for some years on homo-geneous liquid - phase reactions, and some gas - liquid reactions. However, the con-tinued development and adoption of fl exible, readily reconfi gured continuous reactors that enable the optimum reaction mixing profi le and residence time to be readily obtained will be important. While much of the early focus has been on converting chemical reactions from batch to continuous operation, the range of
3) http://www.coebio3.org/default.asp 4) http://www.a-b.tugraz.at/index_en.htm

344 16 Future Trends for Green Chemistry in the Pharmaceutical Industry
unit operations converted must be extended to include, among others, extraction, distillation, crystallization, fi ltration, and drying to enable continuous approaches to become more integrated.
One of the barriers to wider adoption of continuous processing in the pharma-ceutical industry is the need for capital investment in new equipment, but equally important is the cultural change required by chemists and managers. The applica-tion of process analytical technology ( PAT ) to the understanding and control of manufacturing processes is well suited to continuous processing and ties in with Green Principle 11 (real - time analysis for pollution prevention). The potential impacts of Quality by Design ( QbD ) and PAT on waste reduction and the creation of more benign processes have been well articulated [35] . The views of the Food and Drug Administration ( FDA ) in this area are particularly instructive:
‘ The agency is fully supportive of the industry moving in the direction of continuous processing … The principles of QbD and the implementation and use of PAT are inherent in the design and development of a continuous process. ’ [36] .
The current emphasis is on speed to market, and therefore investment decisions have to take into account the high levels of compound attrition in the industry. When there are exciting results from clinical trials, programs get accelerated, and there is then a danger of being ‘ locked into ’ chemical routes and processes that are sub - optimal from an environmental point of view. Measures that can be taken to counter this pressure include:
• Earlier involvement of chemical engineers in chemical route and process selection decisions, and wider and earlier application of the Green Engineering Principles [37] .
• Earlier access to, and application of, kinetic data on reactions in the selected route. Some of these data can be mined from experiments run by process safety groups, and on - line analytics for process measurement will also assist greatly in this objective.
• Implementation of high - throughput screening ( HTS ) techniques to enable green chemical options to be assessed both quickly and early. This approach has been successfully applied in the asymmetric hydrogenation area [38] , including its impact on the sitagliptin synthesis (Chapter 5 ).
16.4 Alternative Solvents in the Pharmaceutical Industry
Previous chapters have admirably demonstrated that solvents represent the biggest contributor to the life cycle impact of pharmaceutical agents and the potential for

16.4 Alternative Solvents in the Pharmaceutical Industry 345
harm to the environment during the manufacturing process. Data from the Swedish regulator, KEMI, suggest that global solvent demand is growing by ∼ 2% per year, but the use of chlorinated and hydrocarbon solvents is dropping – in the case of certain chlorinated materials, very rapidly. 5) This is partly due to legislation and partly due to green chemistry initiatives (voluntary restraint). Most pharma-ceutical companies now have solvent reduction initiatives that are focused on developing more effi cient processes (synthetic sequences) that involve less solvent use, more solvent recovery, and a rational choice of solvents to minimize any environmental impact. Over the past 30 years or so, a number of ‘ greener ’ alterna-tives to volatile solvents have been proposed, and the pros and cons of a number of these are discussed below [39] .
16.4.1 Water
Water is cheap, relatively abundant in many part of the world, safe, and, when pure , environmentally benign [40] . It is also true that some reactions show unusual selectivity and/or rate enhancements when run in, or more accurately, on water [41] . However, a closer examination of many reactions ‘ in ’ water reveals that in fact one or more liquid reagents have been used in large excess, so they are in fact biphasic reactions. There is also a misguided perception that water, after use as a reaction medium, can be ‘ poured down the drain ’ [42] . On an industrial scale, there can be a considerable cost and environmental burden associated with reme-diation of waste water streams contaminated with solvents and organic and metal residues – see Chapters 2 and 3 .
One not obvious advantage of water is the use of water/detergent mixtures to clean chemical reactors/plant. Preparation of chemicals to GMP standard requires extensive and rigorous cleaning protocols. In a production plant, up to 30% of total solvent inventory is utilized in cleaning. If water/detergent cleaning can be used, this can save up to 90% of the solvent used for cleaning [43] . Enzyme - catalyzed reactions are a special case of catalysis in water and were discussed further in Section 16.3.5 with examples in Chapters 6 and 8 .
16.4.2 Ionic Liquid s ( IL s )
Over the past ten years, ILs have moved out of the realm of academic study and are being used in a diverse range of industrial processes [44] . It is true to say that the application of ILs in the synthesis of pharmaceuticals and fi ne chemicals has been hampered by much ‘ green wash ’ and focus on single - issue sustainability claims such as that ILs are better than all other solvents because they have essen-tially no vapor pressure and are not classifi ed as volatile organic compound s ( VOC s). Other factors limiting take - up have been the lack of ecotoxicity and life
5) http://www.kemi.se/default____550.aspx

346 16 Future Trends for Green Chemistry in the Pharmaceutical Industry
cycle impact data (although this is now being addressed [45, 46]) , cost, and recycle or disposal procedures at end of life. For scientists engaged in route design and manufacture of pharmaceuticals it has been clear for a long time that a process that ran effi ciently in ethanol or ethyl acetate would never be improved in an environmental or commercial sense by replacing such solvents with an IL. This has somewhat detracted from the search for areas in which the application of ILs could impart real benefi ts to the chemistry and process. Areas like catalysis and replacement of potentially reprotoxic (potential human reprotoxins that carry the risk phrases R60/R61) dipolar aprotic solvents such as dimethylformamide and N - methylpyrrolidinone could prove fruitful. It should also be borne in mind that the application of ILs as neat reaction media may not be the optimum route to maximize any benefi ts of ILs in organic synthesis. The use of mixtures with con-ventional solvents or water may, for certain reaction classes, give better perform-ance than neat ILs or pure solvents alone [47, 48] . Some of the current generation of ILs show potential to be much less ecotoxic than the fi rst - generation imidazo-lium and high - molecular - weight quaternary ammonium/phosphonium - based materials. Indeed, one supplier now provides some ecotoxicity data (daphnia and algae), biodegradability data, mutagenicity (Ames test), and an indication of sus-tainability for their bulk IL products. 6) This is to be commended and hopefully will set a standard for other solvent suppliers. In the EU, REACH may go some way to ensure that the eco and safety data needed to make rational choices on the environmental performance of new solvents and reagents are more readily avail-able than in the past (see Chapter 4 ).
16.4.3 Fluorous Solvents
High - molecular - weight polyfl uorinated materials used in ‘ fl uorous phase ’ tech-niques [49] have poor life cycle impacts, and the high environmental impact of heavily fl uorinated materials is now becoming apparent [50] , so it is unlikely that this technology will have much impact on greening pharmaceutical manufacture. Of course fl uorous technologies may, however, be of interest and use to the medicinal chemist working on a small scale to facilitate the rapid separation of catalysts from products.
16.4.4 Supercritical CO 2 (SC - CO 2 ) and Gas - Expanded Liquids ( GXL )
While a number of supercritical fl uid s ( SC ) are known and have been studied as reaction media, probably only SC - CO 2 and water are of practical use in the syn-thesis of pharmaceutical intermediates. The application of SC - CO 2 as a greener eluent for chromatography has been discussed in Chapter 12 . This medium is also used as an extraction solvent and in API isolation, although its use at any scale
6) www.bioniqs.com

16.4 Alternative Solvents in the Pharmaceutical Industry 347
for this application is limited at present, and the driver for its use is more particle engineering than Green Chemistry. An interesting use of SC - CO 2 to remove sol-vents from waste water streams has recently been published by Merck [51] . Metal - catalyzed Heck, Suzuki, and diaryl ether formation reactions [52] and hydrogenation in SC - CO 2 [53] are probably the most studied applications in the synthesis of pharmaceutical intermediates (Figure 16.5 ), but are still a long way from being adopted at large scale.
Undoubtedly, a big barrier to the introduction of SC technologies in pharma-ceutical plants is the high capital and operating costs of such equipment, especially if they are used for the production of a limited number of materials in a complex portfolio. As pharmaceutical companies outsource more and concentrate on ‘ in house ’ manufacture for the later stages of the synthetic route, the lack of SC reactor facilities at contractors and fi ne chemical suppliers limits the development of reac-tions in SC fl uids.
GXLs, in which a gas such as CO 2 is used to tune the solubility of reagents, products, and catalysts in common organic solvents, may be a more readily adopted technology in standard chemical plants because of the lower pressures involved ( ∼ 5 – 10 vs. 73 atmospheres for SC - CO 2 ). A number of excellent reviews have been published on the use and application of GXLs [54, 55] .
16.4.5 Molecular Solvents from Renewable Sources
A number of solvent - like materials can be derived from renewable bio resources, but these tend to be more highly oxygenated than conventional solvents, and this has several ramifi cations. They are not suitable for wide ranges of chemical reac-tions because of their higher reactivity and viscosity, and higher boiling points can add an energy penalty in their use and recovery. Nevertheless, some are displacing solvents commonly used in synthesis. 2 - Methyltetrahydrofuran has many favora-ble properties that make it a good solvent for organic synthesis [56] , and, being derived from agricultural waste products (C - 5 sugars), it has a much better life cycle impact than tetrahydrofuran, which is derived from oil [57, 58] .
Of course, a number of solvents in common use in the chemical industry, such as ethanol, acetic acid, and ethyl acetate, can be derived from either bio or oil raw materials. The debate rages over the life cycle impact of bio versus fossil fuel
N
ClCl
N
ClCl
H
175 Bar 40oCH2 / Pd / CaCO3
0.2 M THF / CO295% Yield97% cis selectivity0.2% dechlorinated by-products.
Figure 16.5 Synthesis of Zoloft intermediates by hydrogenation in SC - CO 2 .

348 16 Future Trends for Green Chemistry in the Pharmaceutical Industry
ethanol. A further complication in this area is the societal question of corn versus lignocellulosic ethanol, and indeed the use of any food crop, arable land, or fertiliz-ers to provide solvents or other bio renewable consumer products in place of food products.
16.4.6 Solid - Phase Reactions
A range of reactions have been reported which take place between two solids under the infl uence of mechanical agitation such as ball milling. A reasonably large range of reaction types has been reported [59] . Concerns over homogeneity and reproduc-ibility at scale plus process safety aspects of the control of exothermic reactions may mean that this technology could only be of interest in a very limited number of cases.
16.4.7 The Work - Up
The skill of chemists to come up with new synthetic methodology and molecular design sequences is staggering. It is clear that synthesis is not a dead or mature science, but in many aspects a journey on which we have only just started. However, while many chemists take pride in designing effi cient, high - yielding reactions, often little consideration is given to work - up and isolation. Volumes of solvent used here often greatly exceed those used in the reaction, a typical example from an industrial process being shown in Figure 16.6 .
Although the number and diversity of reactions in the synthetic toolbox con-stantly changes and increases, the techniques used to isolate reaction products have changed little over the past 200 years. In order to get greener reactions, chem-ists and engineers need to focus on work - up as well as reaction effi ciency. The
Figure 16.6 Liters of solvent used per kg input reagent in reaction and work - up sequence (data from a Roundtable member company) .
16.5 Green Chemistry in Secondary Pharmaceutical Operations 349
time is now ripe for the development of greener purifi cation and isolation methods as well as reaction technologies.
16.4.8 Obstacles to Change
We all want to become more sustainable and ‘ green ’ , so why has there not been a great rush into these ‘ greener ’ alternatives? For a number of scientifi c and busi-ness reasons, progress and change in this area will be cautious and measured. Some have been touched on in earlier chapters but are worth recapping here.
1) Lack of both environmental and mammalian toxicity data on new solvent systems. This becomes much more of a problem when solvents are used toward the end of a synthetic route and may contaminate the API. Inevitably there will be no regulatory guidance from the International Conference on Harmonization ( ICH ) on permissible levels in API. 7) , 8) This represents a big regulatory barrier to making any change to existing registered processes or being the fi rst to use a novel solvent in a fi nal stage or API crystallization. Mammalian toxicity data is prohibitively expensive for most solvent manufacturers to obtain for new solvents.
2) Unknown life cycle impact of new solvents.
3) Cost. Governments, healthcare providers, and generic competition are putting pressure on ethical pharmaceutical suppliers to reduce the cost of medicines. Solvents that are produced on a small scale for niche markets will probably be expensive. While the production of pharmaceuticals is currently solvent intensive, the pharmaceutical industry is some way off being the biggest user of solvents. Historically, new solvents being adopted by the pharmaceutical industry that are available in bulk at reasonable cost have not been designed for organic synthesis, but have been developed for much bigger markets where economies of scale reduce manufacturing costs. An excellent example is provided by petroleum octane enhancers such as t - butyl methyl ether and 2 - methyltetrahydrofuran.
4) Security of supply. Sourcing a novel solvent from a single supplier represents a high degree of risk for a launched product.
16.5 Green Chemistry in Secondary Pharmaceutical Operations
Apart from the application of green chemistry and engineering advances to primary manufacturing (synthesis of API) described in this book, there are many
7) http://www.astrazeneca.com/responsibility/sustainable-production/?itemId=4915798 8) http://www.idealcures.co.in/solvents.htm

350 16 Future Trends for Green Chemistry in the Pharmaceutical Industry
other business initiatives in progress in all multi - national pharmaceutical corpora-tions to make their operations more sustainable. While a detailed analysis of these is beyond the scope of this book, it is worth touching on some of the developments in secondary manufacturing (drug formulation, packaging, and distribution).
1) PAT/real time analysis Directed toward reduced inventories, lower numbers of batch failures, and effi cient batch release (QA/QC).
2) Packaging Looking at using recycled materials for secondary and tertiary packaging.
Replacement of polyvinyl chloride ( PVC ) and other chlorinated polymers such as polyvinylidine chloride ( PVdC ) with polypropylene.
More effi cient packaging – such as smaller pack sizes to reduce use of packaging material and reduce transport and distribution costs per dose [58] .
3) Tablet coating A drive to move from organic solvent - based to aqueous - based technologies [59] .
4) Pressurized metered - dose inhaler ( pMDI ) propellants Hydrochlorofl uorocarbon s ( HCFC s) are being phased out under the Montreal Protocol since they destroy the ozone layer as well as contributing to global warming. Several of these have, in the past, been used extensively as propellants in medical drug delivery devices. A great deal of work has been undertaken to replace HCFCs with hydrofl uorocarbon s ( HFC s), which do not react with ozone, or else to move toward dry powder inhalers. 9) , 10) Although HFCs do not interact with the ozone layer, they are potent greenhouse gases. Society has to balance this negative environmental impact against that of the HCFCs they replaced, keeping in mind the 300 000 000 patients worldwide who rely on pMDI technology to deliver drugs to relieve debilitating and life - threatening conditions like asthma and chronic obstructive pulmonary disease ( COPD ). 11)
5) Drug solubility Moving toward more effective drug delivery systems, especially for poorly soluble compounds, maximizes exposure and lowers the dose of API needed [60] .
9) http://www.epa.gov/ozone/title6/exemptions/inhalers.html 10) http://www.astrazeneca.com/responsibility/climate-change/ 11) http://www.ipcc.ch/pdf/special-reports/sroc/sroc08.pdf
16.6 Global Cooperation in Green Chemistry 351
16.6 Global Cooperation in Green Chemistry
16.6.1 The Pharmaceutical Roundtable
Over a number of years, bodies have been formed to collectively support the inter-ests of pharmaceutical companies, such as the Pharmaceutical Research and Manufacturers of America ( PhRMA ) and the European Federation of Pharmaceu-tical Industries and Associations ( EFPIA ). 12) In 2005, a group was started under the auspices of the ACS Green Chemistry Institute to foster Green Chemistry and cooperation in the pharmaceutical industry. This group, the Roundtable, has a high technical rather than political focus, with companies working together on pre - competitive projects to benefi t and promote Green Chemistry across the indus-try as a whole. 13)
As of April 2009, the membership has consisted of ten multinational pharma-ceutical corporations (AZ, Boehringer Mannheim, GSK, Johnson & Johnson, Lilly, Merck, Novartis, Pfi zer, Schering - Plough, and Wyeth), and two technology/suppler organizations (Codexis and DSM).
The Roundtable has 4 major goals, which, along with some of the activities undertaken by the group, are described below.
1) Global collaboration. The Roundtable has undertaken two rounds of benchmarking the routes of manufacture used by its members to prepare APIs. This exercise shows areas where improvements can be made and provides metrics for tracking improvement in the future. In 2009 a Roundtable sub - group started a project to infl uence solvent manufacturers to produce greener solvents.
2) Infl uencing the research agenda. Roundtable members published a common industry view on key areas of green chemistry research [12] . Each year the Roundtable awards a research grant to an academic to work on one of the priority research areas identifi ed by its members. These grants are open to any academic and are awarded by a research panel comprising selected members of the Roundtable. A list of research areas funded so far is presented in Table 16.2 . It should be noted that any results of these Roundtable projects are to be published, for all to adopt, free from any IP license.
3) Education. The Roundtable runs Green Chemistry workshops for undergraduates in the UK and plans to extend these into mainland Europe.
12) http://www.phrma.org/ , http://www.efpia.org/Content/Default.asp? 13) www.acs.org/gcipharmaroundtable

352 16 Future Trends for Green Chemistry in the Pharmaceutical Industry
4) Tools for innovation. Members of the Roundtable are currently working on a common solvent selection guide for members to use and are developing reagent selection tools. An example of a reagent grid is given in Figure 16.3 . Articles of interest (current alert bulletins) are produced for members and are now being made available to all by publication in the journal Organic Process Research and Development [61] .
Since its conception, the Roundtable has grown rapidly, and it will hopefully be sustainable and continue to grow in scope and infl uence. Currently, there are plans to expand the number of intermediates suppliers who are members, to expand into Asia, and to start a biopharmaceutical section to mirror what has been done for small molecules. It is clear that pharmaceuticals can move forward faster together as an industry than as individual voices in the green arena.
16.6.2 Recognition
The Roundtable seeks to infl uence the research agenda, and also has adopted a policy of supporting fundamental research into areas of chemistry defi ned as ripe for improvement as directed by its members. At the time of writing, the grants given are as shown in Table 16.2 .
AstraZeneca, GlaxoSmith Kline, and Pfi zer also sponsor a prize in the UK for academic research leading to the development of new, more effi cient process chem-istry/technologies. A number of recipients, up to 2009, are also listed in Table 16.2 .
The prestigious Presidential Green Chemistry and Engineering awards, 14) insti-gated by President Clinton and administered by the United States Environmental Protection Agency ( EPA ), are a very important driver for greener technology. It is admirable that fundamental research and scientifi c progress in green chemistry and engineering are being applied and adopted in the production of pharmaceu-ticals. Since their inception in 1996, approximately 65 Presidential Green Chem-istry awards have been made across all chemistry - using industrial sectors and academia. The editors are proud that two chapters of this book feature the story of the development of chemical technologies that achieved this high honor (Chap-ters 5 and 7 ). In addition, work described in three other chapters has received the AstraZeneca prize for Excellence in Green Chemistry and Engineering (Chapters 5 , 8 , and 10 ).
16.6.3 The Global Impact
Of course, in 2009, we must not forget that many intermediates, APIs, and for-mulated products are now manufactured by third parties. The ‘ inventor ’ pharma-
14) http://www.epa.gov/greenchemistry/pubs/pgcc/presgcc.html
References 353
ceutical companies invest a very large effort to ensure that their products are made with appropriate respect for the environment, especially those companies involved in the Pharmaceutical Supply Chain Initiative. 15) It is important that Green Chem-istry should be advanced on a global basis so that third - party manufacturers can realize the benefi ts of greener manufacturing processes in their respective locations.
16.7 Conclusions
The pharmaceutical industry has made a major contribution to both the life expect-ancy and the quality of life of the human population, but it is clear that these contributions must be made without major detriment to the environment. In this book we have tried to capture some of the major achievements in moving to a greener pharmaceutical industry, and in general the performance to date has been good. However, there are many challenges and opportunities that remain out-standing. In our view the scope for innovation and improvement remains as wide as ever.
15) http://www.pharmaceuticalsupplychain.org
References
1 Sheldon , R.A. ( 1992 ) Chem. Ind. , 903 – 906 .
2 Dunn , P.J. ( 2005 ) Presentation at The 9th Green Chemistry and Engineering Meeting, Washington, 2005 .
3 Kopach , M.E. , Zhang , T. , Coffey , S. , Borghese , A. , Korbeirski , M. , and Tranke , W. ( 2008 ) A practical and Green Chemistry approach for the Manufacture of NK1 Antagonist LY686017 . Presented at The 12th Annual Green Chemistry and Engineering Conference, Washing-ton, 25th June 2008 (Abstract No 219) .
4 Boswell , C. ( 2008 ) ICIS Chem. Bus. Mag. , 16 – 17 .
5 Alfonsi , K. , Colberg , J. , Dunn , P.J. , Fevig , T. , Jennings , S. , Johnson , T.A. , Peter Kleine , H. , Knight , C. , Nagy , M.A. , Perry , D.A. , and Stefaniak , M. ( 2008 ) Green Chem. , 10 , 31 – 36 .
6 Presented by Dunn , P.J. ( 2009 ) 13th Annual Green Chemistry and Engineering Conference, Maryland, USA, 22nd June 2009 .
7 Laird , T. ( 2004 ) Org. Process Res. Dev. , 8 , 815 .
8 Dugger , R.W. , Ragan , J.A. , and Brown Ripin , D.H. ( 2005 ) Org. Process Res. Dev. , 9 , 253 – 258 .
9 Carey , J.S. , Laffan , D. , Thomson , C. , and Williams , M.T. ( 2006 ) Org. Biomol. Chem. , 4 , 2337 – 2347 .
10 Quallich , G.J. ( 2005 ) Chirality , 7 , S120 – S126 .
11 Ila , H. , Oliver , B. , Wagner , A.J. , and Knochel , P. ( 2006 ) Chem. Comm. , 583 – 593 . Krasovskiy , A. , and Knochel , P. ( 2004 ) Ang. Chem. Int. Ed. , 43 , 3333 – 3336 .
12 Constable , D.J.C. , Dunn , P.J. , Hayler , J.D. , Humphrey , G.R. , Leazer , J.L. , Jr. , Linderman , R.J. , Lorenz , K. , Manley , J. , Pearlman , B.A. , Wells , A. , Zaks , A. , and Zhang , T.Y. ( 2007 ) Green Chem. , 9 , 411 – 420 .
13 De Vries , J.G. , and Elsevier , C.J. (eds) ( 2007 ) The Handbook of Homogeneous Hydrogenations , vol. 1 – 3 , Wiley - VCH Verlag GmbH , Weinheim .

354 16 Future Trends for Green Chemistry in the Pharmaceutical Industry
14 Blaser , H. - U. , Spindler , F. , and Studer , M. ( 2001 ) Appl. Catal. A: Gen. , 221 , 119 – 143 .
15 Farina , V. , Reeves , J.T. , Senanayake , C.H. , and Song , J.J. ( 2006 ) Chem. Rev. , 106 , 2734 – 2793 .
16 Cui , X. and Burgess , K. ( 2005 ) Chem. Rev. , 105 , 3272 – 3296 . Sheldon , R.A. , Arends , I. , and Hanefeld , U. ( 2007 ) Green Chemistry and Catalysis , Chapter 9.4, Wiley - VCH Verlag GmbH , Weinheim .
17 Caron , S. , Dugger , R.W. , Gut Ruggeri , S. , Ragan , J.A. , and Brown Ripin , D.H. ( 2006 ) Chem. Rev. , 106 , 2943 – 2989 .
18 Sheldon , R.A. , Arends , I. , and Hanefeld , U. ( 2007 ) Green Chemistry and Catalysis , Wiley - VCH Verlag GmbH , Weinheim .
19 Alberico , D. , Scott , M.E. , and Lautens , M. ( 2007 ) Chem. Rev. , 107 , 174 – 238 .
20 Rhodes , C. ( 2008 ) Chem. Ind. , 21 – 23 . 21 Ritter , S.K. ( 2008 ) Chem. Eng. News , 86 ,
53 – 57 . 22 Flahive , E.J. , Ewanicki , B.L. , Sach , N.W. ,
O ’ Neill - Slawecki , S.A. , Stankovic , N.S. , Yu , S. , Guiness , S.M. , and Dunn , J. ( 2008 ) Org. Process Res. Dev. , 12 , 637 – 645 and references therein.
23 Carril , M. , Correa , A. , and Bolm , C. ( 2008 ) Angew. Chem. Int. Ed. , 47 , 4862 – 4865 .
24 Beller , M. ( 2008 ) From Palladium to Iron - Catalysed Reactions for the Synthesis of Pharmaceuticals and Fine Chemicals, 26th SCI Process Develop-ment Symposium, 10 – 12 December 2008, Cambridge .
25 Comerford , J.W. , Clark , J.H. , Macquar-rie , D.J. , and Breeden , S.W. ( 2009 ) Chem. Commun. , 2562 – 2564 .
26 Hamid , M.H.S.A. , and Williams , J.M.J. ( 2007 ) Chem. Commun. , 725 – 727 .
27 Jager , K. - E. , and Eggert , T. ( 2004 ) Curr. Opin. Biotechnol. , 15 , 305 – 313 .
28 Williams , G.J. , Nelson , A.S. , and Berry , A. ( 2004 ) Cell. Mol. Life Sci. , 61 , 3034 – 3046 .
29 Sylvestre , J. , Chautard , H. , Cedrone , F. , and Delcourt , M. ( 2006 ) Org. Process Res. Dev. , 10 , 562 – 571 .
30 Kosjek , B. , Nti - Gyabaah , J. , Telari , K. , Dunne , L. , and Moore , J.C. ( 2008 ) Org. Process Res. Dev. , 12 , 584 – 588 .
31 Hanson , R.L. , Davis , B.L. , Goldberg , S.L. , Johnston , R.M. , Parker , W.L. , Tully , T.P. , Montana , M.A. , and Patel , R.N. ( 2008 ) Org. Process Res. Dev. , 12 , 1119 – 1129 .
32 Haak , R.M. , Berthiol , F. , Jerphagnon , T. , Gayet , A.J.A. , Tarabiono , C. , Postema , C.P. , Ritleng , V. , Pfeffer , M. , Janssen , D.B. , Minnaard , A.J. , Feringa , B.L. , and de Vries , J.G. ( 2008 ) J. Am. Chem. Soc. , 130 , 13508 – 13509 .
33 Roberge , D.M. , Ducry , L. , Bieler , N. , Cretton , P. , and Zimmermann , B. ( 2005 ) Chem. Eng. Technol. , 28 , 318 – 323 .
34 See for example de Panthou , F. ( 2007 ) Scale - up Conference, 31 Aug. 2007, Scientifi c Update, Boston .
35 Cue , B.W. , Berridge , J. , and Manley , J.B. ( 2009 ) Pharm. Eng. , 29 ( 2 ), 8 – 20 .
36 Watts , C. ( 2006 ) ISPE conference ‘ Continuous Processing in the Real World ’ , Vienna, 21 Sept. 2006 .
37 Winterton , N. ( 2001 ) Green Chem. , 3 , G73 – G75 . Tang , S. , Bourne , R.A. , and Poliakoff , M. ( 2008 ) Green Chem. , 10 , 268 – 269 .
38 Shultz , S. , and Krska , S.W. ( 2007 ) Acc. Chem. Res. , 40 , 1320 – 1326 .
39 Kerton , F.M. ( 2009 ) Alternative Solvents for Green Chemistry , RSC Publishing , Cambridge UK .
40 Herrerias , I. , Yao , X. , Li , Z. , and Li , C. - J. ( 2007 ) Chem. Rev. , 107 , 2546 – 2562 .
41 Jung , Y. , and Marcus , R.A. ( 2007 ) J. Am. Chem. Soc. , 129 , 5492 – 5050 .
42 Blackmond , D. , Armstrong , A. , Coombe , V. , and Wells , A. ( 2007 ) Angew. Chem. Int. Ed. , 46 , 3798 – 3800 .
43 Verghese , G. ( 2003 ) Pharm. Technol. Eur. , 27 , 116 – 130 .
44 Plechkova , N.V. and Seddon , K.R. ( 2008 ) Chem. Soc. Rev. , 37 , 123 – 150 .
45 Coombe , V. and Wells , A. ( 2006 ) Org. Process Res. Dev. , 10 , 794 – 798 .
46 Reinhardt , D. , Ilgen , F. , Kralisch , D. , K ö nig , B. , and Kreisel , G. ( 2008 ) Green Chem. , 10 , 1170 – 1181 .
47 Hussain , W. , Pollard , D.J. , Truppo , M. , and Lye , G.J. ( 2008 ) J. Mol. Catal. B , 55 , 19 – 29 .
48 Wong , C.J. , Pink , F.C. , Ferreira , A.G. , and Livingston , A.J. ( 2006 ) Green Chem. , 8 , 373 – 379 .
References 355
49 Zang , W. , and Curran , D. ( 2006 ) Tetrahedron , 62 , 11837 – 11865 .
50 Key , B.D. , Howell , R.D. , and Criddle , C.S. ( 1997 ) Environ. Sci. Technol. , 31 , 2445 – 2454 .
51 Leazer , J.L. , Gant , S. , Houck , A. , Leonard , W. , and Welch , C.J. ( 2009 ) Environ. Sci. Technol. , 43 , 2018 – 2021 .
52 Lee , J. - K. , Fuchter , M.J. , Williamson , R.M. , Leeke , G.A. , Bush , E.J. , McCo-nvey , I.F. , Saubern , S. , Simon , R. , Ryan , J.H. , and Holmes , A.B. ( 2008 ) Chem. Commun. , 39 , 4780 – 4782 .
53 Clark , P. , Poliakoff , M. , and Wells , A. ( 2007 ) Adv. Syn. Catal. , 439 , 2655 – 2659 .
54 Jessop , P.G. , and Subramaniam , B. ( 2007 ) Chem. Rev. , 107 , 2666 – 2694 .
55 Atkin , G. and Poliakoff , M. ( 2009 ) Green Chem. , 11 , 1083 – 1100 , ASAP article.
56 Aycock , D.F. ( 2007 ) Org. Process Res. Dev. , 11 , 156 – 159 .
57 Jim é nez - Gonz á lez , C. , Curzons , A.D. , Constable , D.J.C. , and Cunningham , V.L. ( 2004 ) Clean Technol. Environ. Policy , 7 , 42 – 50 .
58 Capello , C. , Fischer , U. , and Hungerbuhler , K. ( 2007 ) Green Chem. , 9 , 927 – 934 .
59 Mack , J. , Fulmer , D. , Stofel , S. , and Santos , N. ( 2007 ) Green Chem. , 9 , 1041 – 1043 .
60 Rainbow , B.E. ( 2004 ) Nat. Rev. Drug Discov. , 3 , 785 – 796 .
61 Challenger , S. , Dudin , L. , DaSilva , J. , Dunn , P. , Govaerts , T. , Hayler , J. , Hinkley , B. , Houpis , Y. , Hunter , T. , Jellet , L. , Leazer , J.L. , Lorenz , K. , Mathew , S. , Rammeloo , T. , Sudini , R. , Wan , Z. , Welch , C. , Wells , A. , Vance , J. , Xie , C. , and Zhang , F. ( 2008 ) Org. Process Res. Dev. , 12 , 807 – 816 . Andrews , I. , Cui , J. , DaSilva , J. , Dudin , L. , Dunn , P. , Hayler , J. , Hinkley , B. , Hughes , D. , Kaptein , B. , Kolis , S. , Lorenz , K. , Mathew , S. , Rammeloo , T. , Wang , L. , Wells , A. , White , T. , Xie , C. , and Zhang , F. ( 2009 ) Org. Process Res. Dev. , 13 , 397 – 408 .


357
Index
Green Chemistry in the Pharmaceutical Industry. Edited by Peter J. Dunn, Andrew S. Wells and Michael T. Williams© 2010 WILEY-VCH Verlag GmbH & Co. KGaA, WeinheimISBN: 978-3-527-32418-7
aabacavir 238acetals 134, 136acetonitrile– comparative tables 42, 56, 62– paclitaxel synthesis 151, 155, 157– radafaxine synthesis 200–202, 208–210,
213– SFC co-solvent 252– sitagliptin synthesis 110acetophenone 244, 245– 4-methyl- 228, 230, 231– p-isobutyl- 11acylation 7, 11, 270, 271, 341AIDS, see HIValcohol dehydrogenase 342, 343alcohols, see also ethanol; methanol– oxidation to aldehydes 232–234, 337aldehydes– amidation reactions 294–297– enzyme inactivation by 134–139– oxidation of alcohols 232–234, 337aldol reactions 130, 133, 134, 140aldolases, see deoxyribose phosphateAmerican Chemical Society (ACS) GCI, see
Green Chemistry Instituteamidation reactions 293–297, 341amidine intermediates 110–112amine oxidases 277amine removal, chromatographic 185α-amino acids, unnatural 187–192β-amino acids 102, 105–108, 1167-aminocephalosporic acid (7-ACA)
manufacture 293-aminopyrrolidines 281, 2822-aminotetralin 280, 281ammonium chloride 119analytical techniques– detection of pharmaceutical residues 85,
90
– preparative chromatography 244, 262
anti-depressants 197, 198, 271– sertraline 13, 58, 75, 273, 347anti-histamines, see levetiracetamanti-infl ammatories 228, 239antibiotics 2, 15, 29, 234anticancer drugs, see paclitaxelantiviral drugs, see HIVaprepitant 188, 189aquatic environment 83, 95, 99, see also
pharmaceuticals in the environmentAstraZeneca 32, 128, see also Green
Chemistry Institute; Process Chemistry Prizes
asymmetric hydrogenation– pregabalin synthesis 163–165– scope 339– sitagliptin synthesis 116–121, 123, 344– unnatural amino acids 187asymmetric transformations 269, 270, 277,
279–282atmospheric release 95, 96atmospheric synthesis 198atom economy or atom utilization 6, 10, 11– drive to improve 181, 292, 293, 298– green chemistry principles 23, 27, 34,
35– process effi ciency and 34, 35, 50atom effi ciency 9–11, 339atom selectivity 6atorvastatin– chemical synthesis 128, 131, 133– intermediates 17, 223–228automatic monitoring 363-azabicyclo[3.1.0]hexane 234azeotropic mixtures 76, 78azide chemistry 162azlactone hydrolysis 271azoisobutyronitrile (AIBN) 304, 305

358 Index
bbacterial fermentation 314, 317–321, 324batch operations– continuous processing contrasted 74,
221–223, 226– effi ciency 37–39– middle-vessel batch distillation 78, 79– preparative chromatography 247–249,
255, 259–263– solvent utilization 26, 49, 52–54, 74–77Batch Plus software 173, 175, 176Baylis-Hillman reaction 163‘benign by design’ concept 10, 11Best Available Treatment Techniques (BAT)
options 95, 96β-antagonists 279bioaccumulation 44, 86, 87, 89biocatalysis 15–17, 74, 75, 127, 339– pregabalin 165–171– scope for 341–343– statin side chains 129–131bioconcentration factors (BCF) 87biodegradation 83, 86biomass waste 154biopharmaceuticals/biotherapeutics, see
therapeutic biologicsbiowaste 325Bischler-Napieralski synthesis 298bleach-based (hypochlorite) oxidations 9,
232–234, 307, 339Boots-Hoechst-Celanese (BHC) 11, 12, 14boric acid derivatives 297, 298, 340, 341bovine somatotropin (BST) 320Bristol-Myers Squibb (BMS) 58, 59– fl ow process use 239, 240– paclitaxel and 145, 148–150, 152–154,
158– pervaporation use 77– Process Greenness Scorecard 65brivanib 240bromination reactions 235, 304–306bromonitromethane production 234, 235bupropion 197, 198, 203by-products 224, 292, 293
ccapacity management 38capillary reactors 224carbamazepine 97carbenes, N-heterocyclic (NHC) 296, 297carbodiimides 104, 293, 294carbon-carbon bond formation 292, 340, 341carbon dioxide recycling 253, 258, 261carbon emissions 51, 60, 175
N,N′-carbonyldiimidazole (CDI) 113, 294carbovir 238carboxylic acids– 3,5-dihydroxy 128– pregabalin precursors 165, 166, 170carcinogenic, mutagenic, reprotoxic (CMR)
tests 90catalysis, see also biocatalysis; enzymes;
individual metals– alternative to stoichiometric reagent use
7–10, 338– amide synthesis 294–297– amine racemization 374– BHC ibuprofen process 11– hydrogenation 107, 117, 118, 163, 187,
339, 340catalysts– iso-propylamine in CIDT 190– N-heterocyclic carbenes 296, 297– product inhibition 120– recovery and reuse 14, 16– SCRAMTM catalysis 275, 278–286– sustainability and choice of 340cation-exchange chromatography (CEC)
183–185cations, divalent 168, 169ceftobiprole 281celecoxib (Celebrex®) 78, 228–232cell culture 313, 314, 321, 324cell division and paclitaxel 147cell-free synthesis 327, 328cephalosporins 2, 15chase-demand models 38chemical development, see process
developmentchemoenzymatic processes, see biocatalysischiral amines– integration of resolution and racemization
276–279– racemization of homochiral amines
272–276– resolution case studies 279–286– resolution processes for 269–272chiral auxiliaries 187, 198– pregabalin synthesis 161, 162– sitagliptin synthesis 103, 106–108, 115,
116chiral epoxides 236chiral pool synthesis 264, 269, 276chiral stationary phases (CSP) 208, 209,
211–214, 259chirality, see also diastereomers; enantiomers– CIDT requirements 188– control of 181, 188, 189

Index 359
– early-stage resolutions 338– introduction of 105, 106, 130, 131, 134– paclitaxel chiral centers 145, 146chloroacetaldehyde (ClAA) 130, 133–142chloroform 335m-chloroperbenzoic acid (mCPBA) 306chloropyrazine route to sitagliptin
102–105, 112cholesterol 128chromatography, see also multicolumn;
preparative chromatography– basic principles 244–246– cation exchange 183– column distribution design and column
packing 245, 246– gradient chromatography 248, 249, 257,
258– hydrophobic interactions chromatography
321– optimization of injected amount 247– paclitaxel purifi cation 155, 156– peptide-mimetics 181– recent advances 183, 245, 246, 264, 265– reversed-phase chromatography 183, 319– selecting a technique 264–266chromium (VI) 9, 232chronic toxicity 88Claisen condensations 127, 128, 222, 228Clean Drinking Water Act (US) 98Clean Technology Guidance framework
(GSK) 65cleaning and maintenance 30, 212, 324,
325, 329, 345clofi bric acid 84clopidogrel 273co-solvents (modifi ers) 252–255, 259,
261–263coatings 53, 350Codexis 17, 130, 351column distribution design/packing 245,
246conglomerate separation 271, 272, 278constant volume distillation (CVD) 77, 78continuous centrifugation 223continuous countercurrent chromatography
206, see also multicolumncontinuous processing– atorvastatin intermediate 223–228– bromonitromethane production 234, 235– celecoxib preparation 228–232– diazomethane production and use
235–238– dynamic resolution processes 278, 279– exothermic reactions 239
– laboratory-scale 223–225, 228, 229– naproxcinod production 239– oxidation of alcohols to aldehydes
232–234– preparative chromatography 249–252,
255– scope for 241, 336, 339, 342–344– sustainability and 221– Vince lactam 238, 239continuous reactors– capillary reactors 224– plug fl ow reactors 230, 231– solvent use 74– spinning tube in tube 233, 234continuous stirred tank reactors (CSTR)
230, 231controllability of processes 37convergent strategies 108, 109, 124, 154copper catalysts 294, 341cortisone 2cost containment 289cost indices (CIs) 64cost-of-goods comparisons 158, 212counter – current centrifugal extraction
226cradle-to-gate assessment 31, 32, 70cradle-to-grave assessment 31, 32, 214,
215, 305Crestor® (rosuvastatin) 128, 129, 132, 133critical temperatures, see supercritical fl uid
chromatographycryogenic conditions 127, 149, 154, 157,
338, 339, see also temperaturescrystal DTR process 279–283Crystal Faraday Award 58crystallization– chiral amine resolution 271–273, 279,
284– coupling with chromatography 209– diastereomeric salt formation 162, 191,
192, 269, 271–273, 282, 283– peptide-mimetics 181, 182, 186, 192– ripening procedures 203crystallization-induced diastereomer
transformation (CIDT) 188–191, 278crystallization-induced enantiomer
transformation (CIET) 278cumene (hydro)peroxide rearrangements
240cumulative energy demand (CED) 68cyanation reactions 223, 224, 226, 227cycle time reductions 247–249, 262cyclization reactions 104, 110, 111, 133,
170, 200

360 Index
dDangerous Substances Directive 9510-deacetylbaccatin III (10-DAB) 148–150,
154decarboxylation 170, 171, 174degradation, environmental 83, 86, 98,
see also persistencedegradation potential 43–45dehalogenases 342, 343dehydrating agents 110dehydrogenation, selective 277, 278dehydrogenation-rehydrogenation 274,
283, 2862-deoxy-D-ribose 5-phosphate aldolase
(DERA) 130–142design for environment (DfE) program 68design of experiment (DoE) studies 223design option ranking tool (DORT) 65Dess-Martin Periodinane (DMP) 9, 337desymmetrization 129, 166development stages, see pilot plant; process
developmentdextromethorphan 276di-p-toluoyl-L-tartaric acid (DTTA) 200–205diabetes drugs, see also sitagliptin– peptide-mimetic drug candidates 181,
189, 190diastereomers– recycling of unwanted 170, 172– salt formation 162, 191, 192, 269,
271–273, 282, 283diastereoselectivity 6, 131, 166, 189– reductions 105–108, 236, 282, 284diazo ketones 235–237diazomethane 235–238dibromodimethylhydantoin (DBDMH)
304, 305dichloromethane (DCM)– alternatives 61, 233, 234– continuous cyanation 226– costs 60– decreased use of 55–58, 334, 335– process greenness index and 73– radafaxine synthesis 200–202diclofenac 97diethyl ether 58, 68, 238, 336diisopropyl ether, reduced usage 336diltiazem 273dimethylformamide 346directed evolution strategies 139–142disposable equipment 328, 329distillation 76–78Distributed Control Systems (DCS) 36distribution coeffi cients 87
DNA 16, 313double effect evaporators 257, 258, 264Dow Exposure Index 41Dow Fire and Explosion Index 45downstream processing (DSP) 314, 315,
317, 319drinking water, residues 85, 96, 97Drinking Water Quality Directive 98drug discovery waste 334–337drug formulation 53, 122, 350drug residues, see pharmaceuticals in the
environmentdrying 58, 155–157, 175, 201, 202, 344– pervaporation 77DSM 239dyestuffs 1–2, 8dynamic axial compression (DAC) 246dynamic kinetic resolution (DKR)– chiral amines 270, 271, 274–278, 281– route to radafaxine 202–206, 212, 217dynamic resolution processes– case studies 279–286– chiral amines 276–279dynamic thermodynamic resolution (DTR)
276, 278– crystal DTR process 279–283
eE (environmental) factors 4–7, 179– atorvastatin manufacture 13– ‘benign by design’ concept 10– contribution of solvents 11–13– pharmaceuticals typically 5, 213, 221,
311, 333, 334– pregabalin manufacture 16, 163, 171,
172– radafaxine manufacture 212– resource usage and 24– sildenafi l manufacture 13– sitagliptin synthesis 111, 112– therapeutic proteins 325–327– total waste and 50– water usage and 25, 324E-Green system 66economic evaluations 22, 27, 60ecotoxicology 87–90, 345, 346effective mass yield 50electrons– scavenging 305– as waste 292Eli Lilly, environmental performance goals
334eluents, see solventsemissions, and process effi ciency 35
Index 361
enamides 187enamines 106, 108, 115–117, 123enantiomerically pure compounds 18enantiomers– drugs as single 197, 198– racemization of unwanted 204, 272– recycling of unwanted 170, 172, 274enantioselectivity– amino acid synthesis 187– asymmetric hydrogenation 117, 118, 120– azlactone hydrolysis 271– diastereoselectivity and 166– hydrolases 165, 166– reduction of prochiral ketones 130energy use 29, 79, 80– biocatalysis 74, 75– cumulative energy demand (CED) 68– distillation 76, 80– fume hoods 36– metrics 39, 40, 175, 216, 327– paclitaxel processes 157, 158– pregabalin processes 173–175– radafaxine processes 215, 216– savings 336, 345– single-use manufacture 329– solvent contribution to 52, 59, 60entrainers, see co-solventsentrainments 272Environment Agency (UK) 88environmental benefi ts 27environmental disasters 22environmental fate, see pharmaceuticals in
the environmentenvironmental fate and risk assessment tool
(EFRAT) 65Environmental Health & Safety (EHS) 154environmental impacts– alternative routes to paclitaxel 154–156– alternative routes to radafaxine 201, 207,
212–217– Life Cycle Assessment (LCA) 30–34, 43– preparative chromatography 246,
264–266– suppliers and 308, 352– therapeutic biologics 317–323, 325–329– zafi rlucast syntheses 305environmental indices (EIs) 64, 323–327Environmental Protection Agency (US EPA),
see also Presidential Green Chemistry Challenge Awards
– Best Available Treatment options 95– derogations 88– design for environment program 68– PARIS II program 68
– SAGE program 68– Toxic Release Inventory 54–56, 60, 62,
63Environmental Quality Standard (EQS) 88environmental quotient (EQ) 6, 7environmentally conscious process design
(ECD) 65enzyme-based resolution 269–271, 277enzyme-catalyzed racemization 274enzyme inactivation 134–139, 167enzyme kinetics 136enzymes 15, 16, see also biocatalysis– availability 342– directed evolution 139–142– screening 166–170ephedrine 276epimerization 171, 188, 191, 210, 283–285,
see also racemizationequipment performance 39erythromycin 97erythropoietin 812escitalopram 271estrogens 84, 85, 97ethambutol 273ethanol 14, 70, 95, 347, 348ethyl lactate 14European chemical Substances Information
System (ESIS) 40European Medicines Evaluation Agency
(EMEA) 88, 92European Union (EU)– Directives 94–99– KNAPPE study 43– REACH regulations 40, 93, 94, 346evaporators 78, 226, 256–258, 264excipients 53, 93exothermic reactions 175, 222, 235, 239,
294, 348explosion risk 45, 157, 235, 236, 238, 336extraction purifi cation 182, 184, 186extractive distillation 76
ffermentation– mammalian cell cultures 313, 314, 321,
324– microbial 2, 314, 317–321, 324fi nasteride 291, 292, 301–304fi sh 84, 87fi xed residence time (FRT) reactors 225FLASCTM system 31, 33, 34, 214, 215Florida State University 149, 150fl ow processes, see continuous processingfl uorous solvents 346
362 Index
Food and Drug Administration, US (FDA) 53, 54, 344, see also regulatory authorities
formulation, see drug formulationFT-IR spectroscopy 36, 120, 121, 236, 237,
239fume hoods 36function oriented synthesis (FOS) 5functional group interconversions (FGI)
338furfural 29
ggabapentin 161galanthamine 291, 298γ-aminobutyric acid (GABA) analogs 161gas expanded liquids (GXL) 346, 347gate-to-gate domain 66, 70, 72gate-to-grave assessment 31gel permeation chromatography 183gene shuffl ing 17generic pharmaceuticals 289–291, 307,
308, 338, 349genotoxins 341GlaxoSmithKline (GSK), see also FLASCTM
system; Process Chemistry Prizes– Clean Technology Guidance framework
65– E factor goal setting 333– Green Technology Methodology 215– mass intensity defi nition 25– renewability index 29– solvent selection guide 28, 59, 68–70, 72– solvent use investigations 12, 13, 26, 27,
32, 55–57, 77global cooperation 33, 308, 351–353global solvent demand 345Good Clinical Practice (GCP) 90Good Laboratory Practice (GLP) 90, 336Good Manufacturing Practice (GMP) 91,
101, 239, 345gradient chromatography 248, 249, 257,
258Green Chemistry Institute (GCI)
Pharmaceutical Roundtable 290, 311, 312– benchmarking 6, 12, 326, 341– goals and activities 351, 352– reagent guide 337– research grants 340, 351Green Chemistry Principles, see Principles
of Green Chemistry‘green drying’ 77Green Technology Methodology (GSK) 215greenhouse gas emissions 52, 59, 76, 78,
252
greenness, see environmental impacts; Process Greenness
hhalf-lives, environmental 86halohydrin dehalogenase (HHDH) 130hazard banding/rankings 41, 42hazardous chemicals, see also explosion risk;
toxicity– azides 162– chromium (VI) 9, 232– diazomethane 235–238– hydrazine 103, 109–111– nitromethane 166– regulations 93hazardous solvents, see also dichloromethane– decreased use of 55, 58, 60, 61, 334–336– diethyl ether 336– diisopropyl ether 336– n-hexane 336– therapeutic protein manufacture 319Heck reactions 340Henry reaction 165heteroatom alkylation and acylation 341heterogeneous catalysts 14n-hexane 336high-throughput screening (HTS) 344high shear mixer, see spinning tube in tube
reactorsHIV enzyme inhibitors 180, 181, 236, 238,
271homogeneous catalysts 14Hünig’s base 113, 123, 124hydantoins 187, 304hydrazine use 103, 109–111, 228hydride reductions 338hydrogen peroxide 10, 225, 294, 305, 339hydrogenation, catalytic 107, 117, 118, 163,
187, 339, 340, see also asymmetric hydrogenation
hydrogenolysis 107, 116, 280hydrolases 165, 166hydroperoxides 239, 240, 295hydrophobic interactions chromatography
3216-hydroxybuspirone 2393-hydroxyglutaronitrile (3-HGN) 129hypochlorite (bleach-based) oxidations 9,
232–234, 307, 339
iibuprofen 11, 12, 14, 97imide enolates 239, 240immunoglobulin G 313, 321

Index 363
inactivation, see catalysts; enzyme inactivation
incineration– aqueous wastes 26, 213– inputs to FLASCTM 215, 216– solid wastes 327, 329, 330– solvent classifi cation and 27, 69– solvent wastes 40, 60–63, 80, 154, 175indinavir 180inhaler propellants 350inherent safety 23, 45insulin 317, 318, 325, 326integrated pollution control 95Integrated Pollution Prevention and Control
(IPPC) Directive (2008/1/EC) 95–97interferon 312intermediates 52, 59, 95– for brivanib 240– bromonitromethane 234, 235– diazo ketones as 235, 236– for sertraline 347– sitagliptin synthesis 106, 111, 114– statins 131, 223–228International Conference on Harmonization
(ICH) of Technical Requirements for registration of Pharmaceuticals for Human Use 99, 349
ion-exchange chromatography 183–185, 321
ionic liquids (ILs) 345, 346IR spectrometry 113, 114– FT-IR spectroscopy 36, 120, 121, 236,
237, 239iridium complexes 275iron catalysts 341iso-propylamine 190isocratic chromatography 247, 248, 256, 257isopropanol (IPA)– as co-solvent 155, 209, 259– as solvent 103, 122, 157, 162
jJanuvia® and Janumet®, see sitagliptinJohnson & Johnson (J&J) 68Jones reagent 9
kKeppra®, see levetiracetamβ-keto amides 112–116β-keto esters 127, 128kinetic resolutions 269–271, see also
dynamic resolutionkinetic studies 114, 136–138KNAPPE study 43
llaboratory-scale continuous processing
223–225, 228, 229lactam intermediates– levetiracetam synthesis 300– pregabalin synthesis 171– sitagliptin synthesis 104, 105, 124– Vince lactam 238, 239lactic acid derivatives 191lactol intermediates 131, 132, 134, 141,
142lactone intermediates 132, 133Läkemedelsindustriforeningen (LIF) 88legislation 49, 50, 92, 93, 98, see also
regulatory authoritiesleuprorelin 179–181, 183level-capacity models 38levetiracetam 264, 271, 291, 300, 301Life Cycle Assessment (LCA) 29, 30–34,
305, see also cradle-to-; FLASCTM; gate-to-– GSK SSG and 69– MIPS and 65– Rowan index and 72– solvents 51, 52, 59Life Cycle Impact Assessment (LCIA) 31,
32life cycle impacts– degradation potential and 43– solvents 347–349– streamlined assessment 32–34– wastewater treatment 25Life Cycle Inventory (LCI) 31, 51life-expired medicines 92lipases 271, 276–278, 342– Lipolase 16, 166–169Lipitor®, see atorvastatinlipophilicity 87long-term effects 88Lonza 238, 239Lyrica®, see pregabalin
mmagnesium compounds 339maintenance 30, 325, 327, 330mammalian cell culture 321mandelic acid 13, 162, 163, 173, 280, 283,
284manufacturing, see pharmaceutical industryMasamune reaction 104, 106, 109mass balance analysis 212, 285mass effi ciency 216mass intensity 24, 25, 50, 206, 215, 298mass loss indices (MLIs) 64mass productivity 24, 25, 50, 333

364 Index
material intensity per service unit (MIPS) 65
materials use, see processing materials; reagent use
mauveine (aniline purple) 1Maximum Acceptable Concentration (MAC)
88measurement, see metricsmedicines, see pharmaceuticalsMeldrum’s acid 112–114, 123membrane-based processes 77, 78, 80membrane-based systems 327, 328metabolism and pharmaceutical residues 85metal alkoxide process 150metformin 102methanesulfonyl cyanide 239methanol– costs 60– decreased use 55, 58– SFC co-solvent 252– sitagliptin synthesis and 111, 118(S)-7-methoxy-1,2,3,4-tetrahydronaphthalene-
2-amine 279–2812-methyltetrahydrofuran 347, 349metoprolol 97metrics– chemistry and process effi ciency 34, 35,
50, 51, 176– degradation potential 43–45– energy use 39, 40, 175, 176– ‘greenness’ scoring 64–73– holistic approach to 21–24, 45, 46– inherent safety 45– life cycle assessment 30–34, 214–216– occupational exposure 40–43– operational effi ciency 38, 39– real-time analysis 36–38– resource usage 24–30– substrate toxicity 40–43– technology evaluation 66– therapeutic protein manufacture 325–327– water use 25, 26β-MeTrp 189, 190Michaelis-Menten plot 137microbial fermentation 2, 314, 317–321,
324middle-vessel batch distillation 78, 79Mitsunobu reaction 106modifi ers, see co-solventsmonoclonal antibodies 311, 313, 321–323,
329morpholinols, aryl 197, 202, 203, see also
radafaxinemulticolumn chromatography (MCC)
– preparative use 250–252, 255, 264–266– radafaxine 206–212, 214, 217mutagenesis 139, 142
nN-heterocyclic carbenes (NHC) 296, 297naphthalene-2-amine, (S)-7-methoxy-1,2,3,4-
tetrahydro 279–281naproxcinod 239National Cancer Institute (NCI) 146, 147nelfi navir 236neurological disorders 161, 239nitration 239nitromethane 166NMR investigations 111, 120, 134–136non-chromatographic systems 327, 328nucleotides as therapeutic biologics 312,
313
ooccupational exposure 40–43off-site disposal of waste 62, 63olefi n cleavage 302–304oligonucleotides 312, 313on-site release of waste 54, 63one-pot procedures 171, 274, 280– sitagliptin synthesis 110, 113–115, 117operational effi ciency 38, 39optical isomers, see chirality; resolution
processesorganic solvents, see solventsorganic synthesis, history 1–4, 6, 8organic wastewater contaminants (OWCs )
83over-bromination 235over-oxidation 233overall equipment effectiveness (OEE) 38,
39overall solvent index (OSI) 71, 73oxadiazoles 109, 110, 112oxidations, see also redox approach– of alcohols to aldehydes 232–234, 337– bleach-based 9, 232–234, 307, 339– catalytic olefi n cleavage 302–304– continuous, of imide enolates 239, 240– green oxidants 9, 10– sulfi des to sulfoxides 306, 307oxidative amidation 294–296oxygen as an oxidizing agent 10, 339
ppackaging 92, 350paclitaxel (Taxol®) 3, 58, 75– chemical structure 145, 146

Index 365
– extraction 147, 148– mechanism of therapeutic action 147– plant cell fermentation 150–154, 155, 156– process comparison 154–158– purifi cation 155, 156– semi-synthetic production from 10-DAB
148–150, 154, 155– side chain production 150, 151palladium catalysis– oxidative amidation 294, 295– racemization 274–278paroxetine 276partition coeffi cients 86, 87, 89penicillin antibiotics 2, 15peptide-coupling reactions 181, 183peptide-mimetic drugs 179, 180peptides as therapeutic biologics 179, 180,
312periodate oxidation 302, 303Perkin, William Henry 1, 8Permissible Exposure Limits (PEL) 40persistence 44, 84, 86persistent, bioaccumulative and toxic (PBT)
89, 94pervaporation (PV) 77pesticides 98petrochemicals industry 8, 36–38, 206, 221Pfi zer Inc., see also atorvastatin; celecoxib;
Green Chemistry Institute; pregabalin; Process Chemistry Prizes; sertraline; sildenafi l; pregabalin
– environmental performance goals 334– enzyme screening 166– hydrogenation catalysts 163– reagent guide and route survey 336–338– scalability metrics 37– solvent use and reduction 67, 325,
334–336pH in extraction purifi cation 186pharmaceutical industry– dyestuffs and 2– GCI Roundtable participation 311, 351– generic pharmaceuticals 289–291– greener primary manufacturing 338–344– published environmental goals 333, 334– scope for continuous processing 241– solvents used 54–57– typical E factors 5, 213, 221, 311, 333,
334– USA, waste disposal 61, 62Pharmaceutical Supply Chain Initiative
353pharmaceuticals, see also therapeutic
biologics
– biologics and small molecules 314, 315, 325, 326
– chiral 269– drug candidate molecules 222– product volumes and techniques 265,
273pharmaceuticals in the environment– bioaccumulation 86, 87– collection systems 92– current knowledge 90– ecotoxicology 87–90– history of concerns 83, 84, 91– persistence 84, 86– presence and detection 84, 85– regulations 90–98– survey of synthetic routes 338phase diagram, radafaxine enantiomers
209phase splitting 168, 169(S)-phenylglycinamide (PGA) 106–108,
115, 116phloroglucinol 4, 5, 7Phoenix Technologies 233, 235, 236, 238Phyton Biotech GmbH 150pilot plant 230–232, 261–264, 338plant cell fermentation (PCF) 150–156plant sources 29, see also yew treesplatform technologies 327, 328plug fl ow reactors (PFR) 230, 231polycyclic compounds, see paclitaxel;
sitagliptin; trovafl oxacinpolymers, non-chlorinated 350Portable Appliance Testing (PAT) 239potable water, residues 85, 96, 97Predicted Environmental Concentration
(PEC) 87– PEC/PNEC ratio 87, 89Predicted No Effect Concentration (PNEC)
87pregabalin 161– asymmetric hydrogenation route
163–165– biocatalytic process for 16, 165–171– classical resolution route 162, 163– initial synthesis 161, 162– non-Pfi zer/Parke-Davis routes 164, 165– process comparison 171–175– structure and enantiomers 161, 162preparative chromatography– batch operations 247–249, 255, 259–263– chiral amines 271– continuous processing 249–252, 255– example applications 259–264– MCC 250–252, 255, 264–266

366 Index
– principles 244–246– process optimization 246–252, 262, 264– solvent recycling 255–259– status 243, 264–266– supercritical carbon dioxide 252–255Presidential Green Chemistry Challenge
Awards 290, 352– 1996 Awards 11– 2002 Awards 13– 2004 Awards 58, 145– 2005 Awards 189– 2006 Awards 17pressure– reaction rates and 119– SFC retention times 254, 260, 261pressurized metered-dose inhalers (pMDI)
350prevention principle 28Principles of Green Chemistry 10, 21–24,
212, 290, 338– paclitaxel process comparison 156–158– Principle #1 28– Principle #2 34– Principle #3 40– Principle #4 40– Principle #7 28– Principle #8 34– Principle #10 43– Principle #11 36, 344– Principle #12 45Principles of Green Engineering 10, 344Process Analytical Technology (PAT) 222,
239, 344, 350Process Chemistry Prizes 340, 352Process Control Systems (PCS) 222process development– application of technology 343–345– available plant infl uencing 222– chromatographic techniques 265, 266– deliverables 199– regulatory authorities and 54, 79, 91,
290, 333– solvent use 57–59– survey of changes 338process effi ciency metrics 34, 35, 50, 51process energy 215process evaluation– economic, technical and social 22– ‘greenness’ scoring 64–66– importance of early selection 344process fl ow diagrams 227, 303, 304,
323Process Greenness Index 72Process Greenness Scorecard (BMS) 65
Process Mass Intensity (PMI) 6, 24, 25process regulations 93–97process robustness 38process safety 45process scalability 37, 38processing materials use 315, 316,
320–322, 324, see also reagent useproduct inhibition 120, 167, 168product regulations 91, 92, see also
regulatory authoritiesproduction systems– environmental and 30– GMP and 91– simulation 208, 209– single-use equipment 328, 329Program for Assisting the Replacement of
Industrial Solvents (PARIS II) 68protection-deprotection– amine DTR studies 280– 10-DAB conversion to paclitaxel 149,
150, 152, 157– levetiracetam synthesis 300– minimizing use 338– peptide-mimetics 181, 183– sitagliptin synthesis 103, 117– statin side chains 131, 134proteins as pharmaceuticals 312, 313,
see also enzymes– manufacture 314–316– microbially produced 317–321, 324– monoclonal antibodies 311, 313,
321–323, 329– reviewed 311, 312psuedoephedrine 273purifi cation– chromatographic 183, 244–246– continuous processing 226– extraction purifi cation 182– paclitaxel 155, 156– peptide-mimetics 181– sitagliptin 122– solvent consumption in work-up 348,
349– therapeutic biologics 314–318, 321, 322pyrazines, chloro- 102–105, 112pyrazole condensations 228pyridinium chlorochromate/dichromate
(PCC/PDC) 9pyrrolidin-2-ones 170, 346pyrrolidine, (R)-1-tert-butyloxycarbonyl-3-
amino- 281, 282
qQuality by Design (QbD) 344
Index 367
rR-indices 67rabeprazole 291, 292, 306, 307racemization, see also epimerization– homochiral amines 272–276– integration with resolution 187,
276–279– morpholinols 202, 203– pregabalin 170, 175– thermal 210, 273radafaxine– bupropion relationship 197, 198– classical resolution routes 199–206,
214– DKR of 202–206, 212, 217– environmental impacts 212–217– isomers 199– MCC route 206–212, 214, 217radical initiators 304reactants defi ned 35reaction mass effi ciency (RME) 35, 50, 51,
215reaction media, see also solvents– alternative 11–15– solid-phase 348reaction-solvent (RS) indices 67reaction steps, see telescopingreaction surveys 338reagent guides 336, 337, 352reagent use– electronic tracking 336– paclitaxel processes 156– pregabalin processes 172, 173real-time analysis– controllability 37– metrics 36–38– robustness 38– scalability 37, 38recrystallizations 52, 162, 163, 208, 271,
272recycling– carbon dioxide 253, 258, 261– solvents 63, 76–80, 255–259, 264, 265– unwanted isomers 170, 172, 276, 280,
284– water and urea 321redox approach– amine racemization 273, 274– scope for development 339reductive cyclizations 170refl ux energy use 175Registration, Evaluation, Authorization and
restriction of Chemical substances (REACH) regulations 40, 93, 94, 346
regulatory authorities, see also Food and Drug Administration
– derogations 88– environmental quality regulations 97,
98– process changes and 54, 79, 91, 290,
333– process regulations 93–97– product regulations 91, 92regulatory lists 41, 42renewable molecular solvents 347, 348renewables 28–30residence times 225, 230, 233resolution processes, see also dynamic
resolution– case studies 279–286– for chiral amines 269, 270– chromatographic, of sertraline 206, 271,
282–286– diastereomeric salt formation 162, 191,
192, 269, 271, 272– early-stage resolution 338– enzymatic 166, 269, 270– integration with racemization 276–279– kinetic 166resolving agents 191, 200resource usage– cleaning and maintenance 30– metrics for 24–30– renewables 28–30– solvents 26–28retention times 254, 259–261, see also cycle
time; residence timesretro-aldol reaction 140reverse azeotropic distillation 282reversed-phase (RP) chromatography 183,
319rhodium catalysts 163, 165– [Rh(COD)Cl]2-(tBu-Josiphos) 117, 118,
121, 123ring opening of morpholinols 205ripening procedures 203–205risk assessment 41ritonavir 180robustness 38, 229, 230rosuvastatin 128, 129, 132, 133Roundtable, GCI, see Green Chemistry
InstituteRowan Solvent Greenness Index Method
70–73ruthenium catalysis– olefi n cleavage 302–304– oxidative amidation 295, 296– racemization 275, 277
368 Index
sSafe Drinking Water Act (US) 98saquanavir 180scalability 37, 38, 57, 102, 161, see also pilot
plant– crystal DTR of sertraline 285– laboratory continuous processes 225, 229– preparative chromatography 244, 245,
261–266scale-up 225Schiff bases 134, 272, 274, 278Schlenk equilibria 111SCRAMTM catalysis 275, 278–286secondary manufacture 334, 349, 350,
see also drug formulationSelwyn inactivation test 138semi-synthetic production 148–150, 154,
155, 341sertraline 13, 58, 75, 271, 273, 282–286,
338, 347sewage treatment, see wastewater treatmentShvö catalyst 275, 277, 278, 281side effects 88, 198sildenafi l (Viagra®) manufacture 13, 58silica, activated as catalyst 341simulated DTR 278, 279, 283, 284simulated moving bed (SMB)
chromatography 206, 251, 252, 255, 271simultaneous comparison of environmental
and non-environmental process criteria (SCENE) 65
single-use biologics manufacture 328, 329sitagliptin– asymmetric hydrogenation route
116–121– chemical structure 101, 102– fi nal manufacturing route 123, 124– fi rst generation/chloropyrazine route
102–105– β-keto amide direct synthesis 112–116– PGA enamine-amide route 115, 116– PGA enamine-ester route 105–109– process development 101, 344– purifi cation of 122social evaluations 22solefi nacin 291, 298–300solid-phase reactions 75, 348solvent acceptability scores 215Solvent Alternatives Guide (SAGE) program
68Solvent Emissions Directive 94solvent exchange 155solvent-free condensations 301Solvent Greenness Index 70–73
solvent intensity 26Solvent Measurement, Assessment, and
Revampment Tool (SMART) 67solvent selection guides 28, 59, 66–73, 352solvent switching 25, 105, 116, 122, 282solvent utilization/consumption– alternative solvents 344–349– batch operations 52–54– E-factors and 213, 311– excessive 59–61– extraction purifi cation 186– fi nasteride processes 302–304– paclitaxel processes 156, 157– pregabalin processes 172– preparative chromatography 243,
246–252, 265– process development 57–59– radafaxine processes 201– reduction 67, 73–75, 334–336, 345– therapeutic biologics 315– in work-up 348, 349solvents 11–15, see also hazardous solvents;
water– enantiomer separation with 205– fl uorous solvents 346– ‘greenness’ scoring 66–73– GXLs 346, 347– ionic liquids 345, 346– life cycle assessment 51, 349– market prices 60– mixed solvent systems 209– Principles of Green Chemistry #7 28– recovery 40, 73–80– recycling 63, 76–80, 255–259, 264, 265– reducing numbers of 43– from renewable resources 347, 348– resource usage 26–28, 345– screening 205– supercritical carbon dioxide 252–255,
258, 259, 336, 346, 347– toxicity data 40, 349– waste resulting from 49, 52, 54–57,
61–64spectrophotometry 139, 140SR 58611A 279spinning tube in tube reactors 233, 234stacked injections 247–249, 262, 263statins– atorvastatin intermediate 223–228– DERA-based routes 131–142– importance of 128, 129– side chain biocatalytic synthesis 129–131– side chain chemical synthesis 127, 128steady state conditions 230

Index 369
step economy 5stereoselective reactions– aldol reactions 133, 134– hydrogenation 187– waste minimization 187, 338stoichiometric equations 4, 6stoichiometric reactions 4–11, 22, 34, 35,
338– celecoxib synthesis 228–231– sitagliptin synthesis 110, 111, 116, 124‘substances of very high concern’ 94substrate-feeding 139substrate inhibition 167, 168sulfa drugs 2sulfoxidation 306, 307supercritical carbon dioxide 252–255, 258,
259, 336, 346, 347– co-solvents 261–263supercritical fl uid chromatography (SFC)
252–255, 258–266, 336superphosphoric acid 104suppliers’ environmental impacts 308, 352,
353sustainable development 10, 11, 30, 221,
291, 340– secondary manufacture and 349, 350Suzuki reactions 340Sweden 88, 98Swern reagent 9
ttadalafi l 188, 189tandem aldol reaction 130, 133Taxol®, see paclitaxelTaxus sp., see yew treestechnical evaluations 22technology trends 343–344telescoping 57, 58, 74, 75, 228, 229temperatures, see also cryogenic conditions– SFC retention times 254, 259, 260– thermal racemization 210, 273– ultra-low 133, 162, 198, 339tetrahdrofuran (THF)– 2-methyl 347, 349– manufacture 29– as solvent 51, 77, 157, 347teriparatide 179–181tetralins 280–2832,2,6,6-tetramethylpiperidine-1-oxyl radical
(TEMPO) 9, 232–234, 337therapeutic biologics– classes and general features 312–316– environmental impacts 317–323,
325–329
– overall comparison 324, 325– single-use manufacture 328, 329therapeutic protein manufacture 314thyrotropin releasing hormone (TRH) 182time to market 7toluene 55, 60Total Cost Assessment 26, see also Life
Cycle AssessmentToxic Release Inventory (TRI, US EPA)
54–56, 60, 62, 63Toxic Substance Control Act (US) 93toxicity, see also hazardous chemicals– chronic and acute 88– cyanation reactions 226– diazomethane 235–238– ecotoxicology 87–90, 345, 346– genotoxicity 341– metal catalysts 341– methanesulfonyl cyanide 239– metrics 40–43, 44– n-hexane 336– reprotoxicity 346Toxicity Identifi cation and Evaluation (TIE)
84trans-stilbene oxide (TSO) 259–261transaminases 342, 343transfer hydrogenation 116, 397transgenic plants and animals 327, 328triazole co-catalysts 296[1,2,4]triazolo[4,3-α]piperazines 101, 102,
109, 110[1,2,4]triazolo[4,3]pyrazines 102, 103, 105,
108, see also sitagliptin2,4,6-trideoxyhexapyranoside, 6-chloro-
(3R,5S)- 133–135, 138Triple Bottom Line Benefi ts 291trisulfonated triphenylphosphine (TPPTS)
15trovafl oxacin 234tryptophan, β-methyl 189, 190turnover frequency 284turnover number 137, 168twelve principles, see Principles of Green
Chemistry
uunderground injection disposal 61, 62unit operations 43, see also process
development– continuous processing 344– energy comparisons 174, 175– fi nasteride synthesis 301–304– telescoping 57, 58, 74, 75, 228, 229– therapeutic biologics 316
370 Index
urea 1, 294, 318–321US EPA, see Environmental Protection
AgencyUS Geological Survey National
Reconnaissance Program 84, 85USA– Clean Drinking Water Act 98– Safe Drinking Water Act 98– studies on drug residues 84, 85– waste management practices 61–64
vvaccines, therapeutic 312, 314variable residence time (VRT) reactors 225,
226Varicol® process 251, 252vastatins, see statinsvery persistent, very bioaccumulative (vPvB)
89, 94Viagra®, see sildenafi lVince lactam 238, 239virus inactivation 321, see also HIV enzyme
inhibitorsvolatile organic compounds (VOCs) 94,
345
wwaste, see also enantiomers– defi nition and remedy 292– minimization in drug discovery
334–337– paclitaxel semi-syntheses 154– pregabalin syntheses 163, 164, 171– radafaxine syntheses 212–214– sitagliptin syntheses 106, 124– zafi rlucast syntheses 305waste load index 214waste production– biologics and small molecule drugs
325–327– metrics and 5, 25– minimization through solvent recovery
73–80
– single-use manufacture 329– stoichiometric equations 4– treatment costs 60– TRI and changes in 54–56wastewater treatment 25, 63, 83, 98– effects on drug residues 85, 90– organic contaminants 83, 345water– as an alternative solvent 345– aquatic environment 83, 85, 99– drinking water, residues 85, 96, 97– mass intensity calculations and 25, 26– as a reaction medium 14, 15, 345– therapeutic biologics manufacture 315,
316, 318, 321–325, 329water for injection (WFI) 318, 322,
324–326Water Framework Directive 97–99water usage 316, 318–320, 322–325Wellbutrin® 197wet granulation tableting 53wiped-fi lm evaporators (WFE) 78, 226Wittig olefi nation 131–133work-up 348workforce hazards 40
xXantphos 295
yyew trees– Chinese yew (Taxus chinensis) 151–153– European yew (Taxus baccata) 148–150,
154– Pacifi c yew (Taxus brevifolia) 146–148,
150yield management models 38yields, therapeutic biologics 316
zzafi rlucast 291, 292, 304–306Zoloft®, see sertralineZyban® 197