green digital charter – covenant of mayors · the sustainable energy action plan (seap) is the...
TRANSCRIPT
Page 1
Green Digital Charter – Covenant of Mayors
Comparative analysis on GDC-CoM reports
Page 2
Green Digital Charter – Covenant of Mayors Comparative analysis on GDC-CoM reports Deliverable D3.7 Authors: Nikolaos Kontinakis, EUROCITIES Nathalie Guri, EUROCITIES This publication has been produced within the NiCE – Networking intelligent Cities for Energy Efficiency project. The NiCE project is financed by the 7th Framework Programme for Research and Technological Development, under the Information and Communication Technologies theme. NiCE is led by EUROCITIES in a consortium with Clicks and Links Ltd, the City of Manchester and the Leibniz Institute of Ecological Urban and Regional Development. For more information on the NiCE project and the Green Digital Charter: www.greendigitalcharter.eu. The sole responsibility for the content of this publication lies with the authors. It does not necessarily reflect the opinion of the European Union. The European Commission is not responsible for any use that may be made of the information contained therein.

Page 3
Contents
1 Introduction ......................................................................................... 4 2 Objective of this reporting tool ................................................................. 5 3 Covenant of Mayors – planning and reporting ................................................. 6
3.1 Planning ....................................................................................... 6 3.2 Reporting ..................................................................................... 10 3.3 Impact of ICT in the Emission Inventory ................................................ 20
4 Green Digital Charter and Covenant of Mayors: integration challenges ................. 21 4.1 Scale .......................................................................................... 21 4.2 Timeline ...................................................................................... 21
5 Green Digital Charter-Covenant of Mayors reporting tool .................................. 22 5.1 Activity details .............................................................................. 23 5.2 Additional CoM data ........................................................................ 23
6 Analysis of Green Digital Charter-Covenant of Mayors reports ............................ 28 7 Next steps .......................................................................................... 31

Page 4
1 Introduction The Green Digital Charter and the Covenant of Mayors are two mainstream initiatives both engaging European cities to increase energy efficiency across their territories.
Although differentiating in many aspects such as size and focus, the two initiatives are clearly linked. Focusing on one specific aspect of the broader energy efficiency spectrum, the Green Digital Charter actions in the field of Information and Communication Technologies (ICT) and energy efficiency should therefore be fully compatible with those under the Covenant of Mayors.
This need of compatibility is confirmed by the fact that all Charter signatories have also committed to the Covenant of Mayors. At the moment though, signatories of the Green Digital Charter who are also signatories of the Covenant of Mayors are facing a number of challenges in combining the reporting on progresses under the two initiatives.
The present document explains the development of the Green Digital Charter-Covenant of Mayors reporting tool (hereafter ‘Charter-Covenant reporting tool’) that enables cities, Charter signatories and beyond, to highlight the ICT dimension of their efforts to reach the Covenant of Mayors commitment.
This reporting tool has been developed by the NiCE (Networking intelligent Cities for Energy Efficiency) project consortium as part of a set of Green Digital Charter reporting tools to support the Charter implementation. During the development, feedback received from Charter signatories, the Reference Cities Group and the Expert Advisory Board of the NiCE project was taken into account.
Page 5
2 Objective of this reporting tool To support more streamlined actions in implementing the Green Digital Charter, the NiCE project aims at a better coordination of the reporting procedures under the Charter and the Covenant of Mayors. NiCE has therefore introduced a Charter-Covenant reporting tool which facilitates the integration of an ICT component within the Covenant planning and monitoring without creating additional procedural requirements. As a result, the contribution of ICT related measures in the context of the Covenant of Mayors will be clearly discernible, thus enabling conclusions about future priorities and facilitating clearer benchmarking and monitoring of city ICT activities.
Such a tool has a strong added value:
• First, a vast majority of Green Digital Charter signatories are Covenant of Mayors signatories and would benefit from the integration of the two initiatives. The integration of an ICT component within the Covenant planning and monitoring would prevent duplication of paperwork and double reporting for the two initiatives;
• Second, as shown in studies such as City20201, Smart20202 and recent work of the International Telecommunications Union (ITU3), ICT plays a strategic role in increasing efficiencies and decreasing carbon emissions across a city’s territory. Therefore both Charter signatories and non-signatories will be able to provide the deserved visibility to activities relating to ICT’s positive impact within the Covenant of Mayors initiative.
The tool was developed following a two-step approach: the first version of the tool aimed at drawing a roadmap for the future versions of the tool, presenting recommendations for modifications to the Covenant reporting templates and procedures. These recommendations were discussed with the Covenant of Mayors Office4 and the second version of the tool provided a reporting tool that follows the final decisions of the Covenant of Mayors Office, recommendations from the GDC signatories and the feedback from the Reference Cities Group.
1 ‘City2020 - Support to the development of an ICT driven transition strategy to the Low Carbon City - Green Digital Cities Replicating Inventiveness and Exuberance’, 2010, Clicks and Links Ltd under commission of theInformation Society Directorate of the European Commission. http://www.greenshifteurope.eu/opencms/opencms/city2020/ 2 ‘SMART 2020: Enabling the low carbon economy in the information age’, 2008, the Climate Group on behalf of the Global e-Sustainability Initiative (GeSI). http://www.smart2020.org/publications/3 ITU is currently developing a new Recommendation: ‘Recommendation ‘Methodology to evaluate the GHG Impact of ICT in Cities’ presenting general principles on how to evaluate the environmental impacts of ICT in cities and recommending how ICT may be used to reduce the rate of greenhouse gas (GHG) accumulation in the atmosphere by optimising the use of energy. http://www.itu.int 4 The Covenant of Mayors Office, established and funded by the European Commission, is responsible for the coordination and daily management of the Covenant of Mayors. It is managed by a consortium of European networks representing local and regional authorities, led by Energy-Cities and composed of CEMR, Climate Alliance, EUROCITIES and FEDARENE. http://www.eumayors.eu/about/contact_en.html

Page 6
3 Covenant of Mayors – planning and reporting
3.1 Planning The Sustainable Energy Action Plan (SEAP) is the key document which the Covenant of Mayors signatories are required to develop to show how they will reach their commitments by 2020. SEAPs should be considered as tools that allow to:
• Outline how the city will look like in the future, in terms of energy, climate policy and mobility (the vision);
• Communicate and share the plan with the stakeholders;
• Translate this vision into practical actions assigning deadlines and a budget for each of them;
• Serve as a reference during the implementation and monitoring process5.
The Covenant of Mayors Office (CoMO) has structured the process for elaborating and implementing a successful SEAP into different key steps which can be grouped into four phases: initiation, planning, implementation, monitoring and reporting. See Figure 1 page 7 for a more detailed overview of the SEAP process.
After the signature, Covenant signatories are required to undertake two important steps:
1. Submit the Sustainable Energy Action Plan: Covenant signatories commit to submitting - within one year following the CoM signature - their SEAP where the Covenant objectives and measures to reach them will be justified. SEAP must be approved by the municipal council and uploaded using the on-line submission system and the provided SEAP template.
2. Submit regular “Implementation Reports”: Every two years after having submitted the SEAP, Covenant signatories have to report on their SEAP implementation. These implementation reports aim to check the compliance of the interim results with the foreseen objectives in terms of measures implemented and CO2 emission reductions.
5 ‘How to develop a Sustainable Energy Action Plan - Guidebook’, Covenant of Mayors, 2010, Part I, Chapter 1. http://www.eumayors.eu/IMG/pdf/seap_guidelines_en-2.pdf

Page 7
Figure 1 - The SEAP process
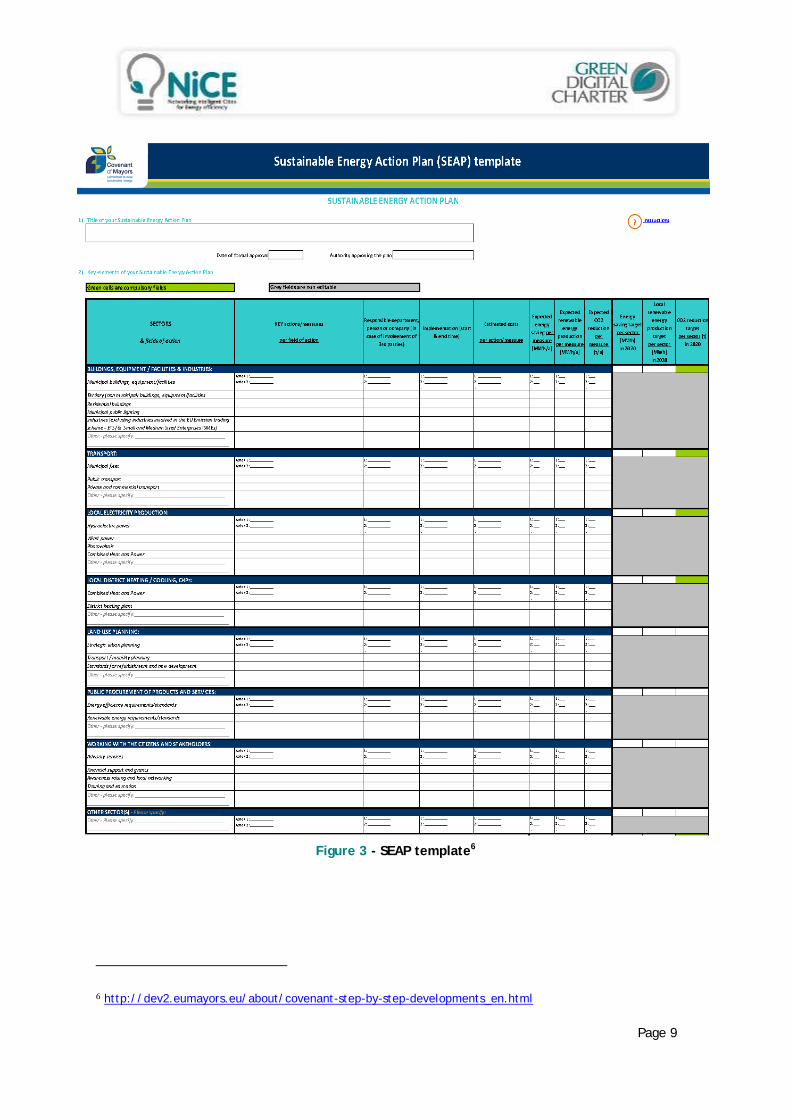
The Covenant of Mayors Office, in close collaboration with the Joint Research Centre (JRC), has developed a SEAP template which complements and summarises in English the commitments inserted in the Sustainable Energy Action Plan which cities have to produce in their own (national) language.
The template includes three main parts dedicated to:
• Long term vision and overall strategy - specifying the overall CO2 emission target foreseen, the priority areas of action, the attribution of staff and financial capacities;
• Key results of the Baseline Emission Inventory (BEI) - indicating the current level of energy consumption and identifying the principal sources of CO2 emissions (Figure 2);
• Key elements of the Sustainable Energy Action Plan - defining the short and long term measures set up to put the overall strategy into action, together with time frames, assigned responsibilities and allocated budgets (Figure 3).

Page 8
Figure 2 – Baseline Emission Inventory
Page 9
Figure 3 - SEAP template6
6 http://dev2.eumayors.eu/about/covenant-step-by-step-developments_en.html
Page 10
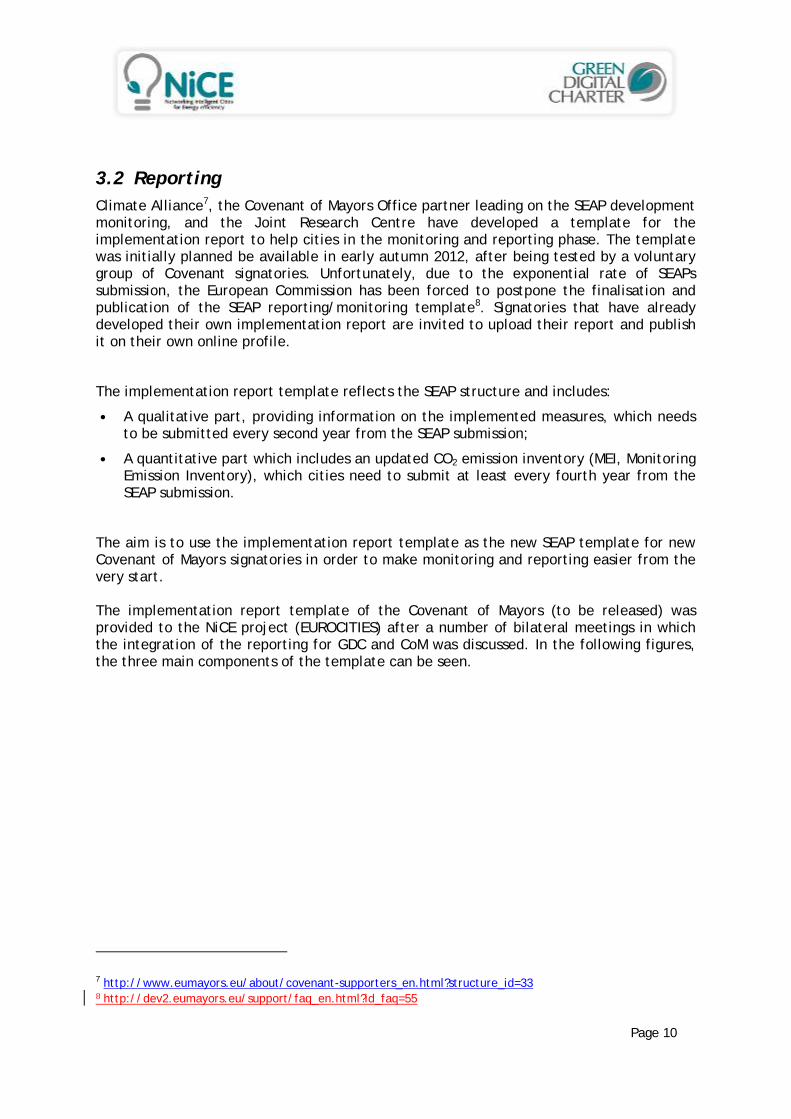
3.2 Reporting Climate Alliance7, the Covenant of Mayors Office partner leading on the SEAP development monitoring, and the Joint Research Centre have developed a template for the implementation report to help cities in the monitoring and reporting phase. The template was initially planned be available in early autumn 2012, after being tested by a voluntary group of Covenant signatories. Unfortunately, due to the exponential rate of SEAPs submission, the European Commission has been forced to postpone the finalisation and publication of the SEAP reporting/monitoring template8. Signatories that have already developed their own implementation report are invited to upload their report and publish it on their own online profile.
The implementation report template reflects the SEAP structure and includes:
• A qualitative part, providing information on the implemented measures, which needs to be submitted every second year from the SEAP submission;
• A quantitative part which includes an updated CO2 emission inventory (MEI, Monitoring Emission Inventory), which cities need to submit at least every fourth year from the SEAP submission.
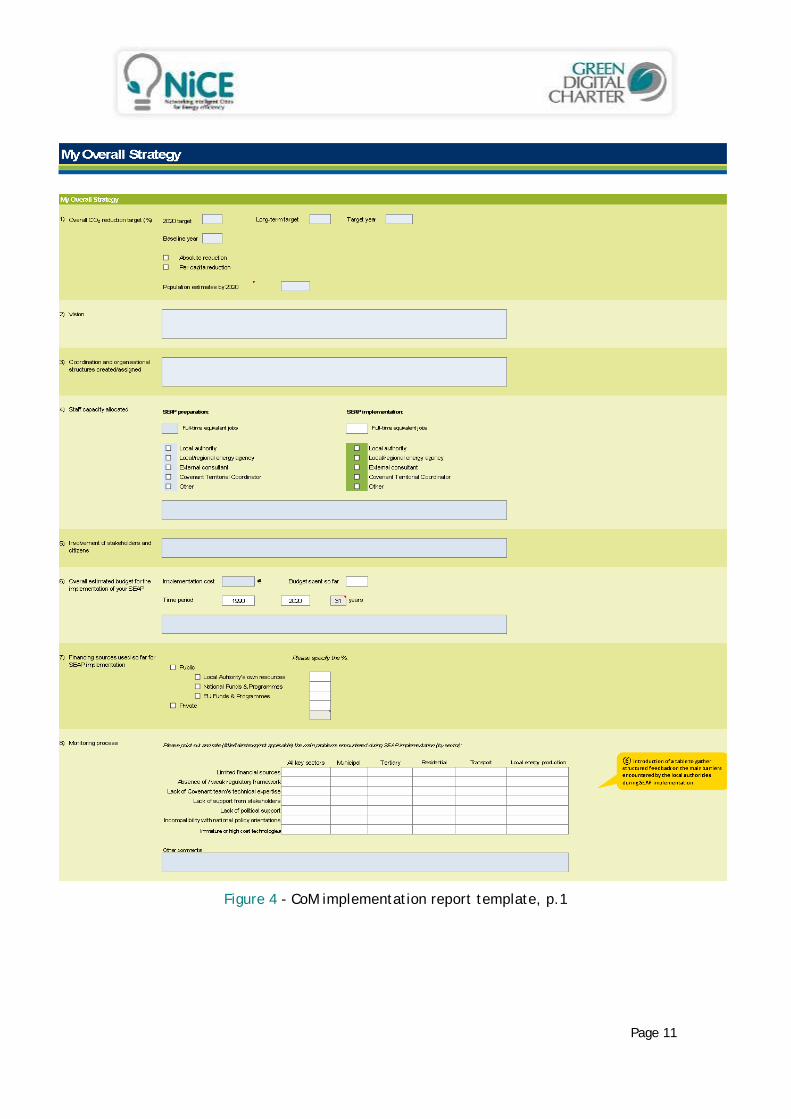
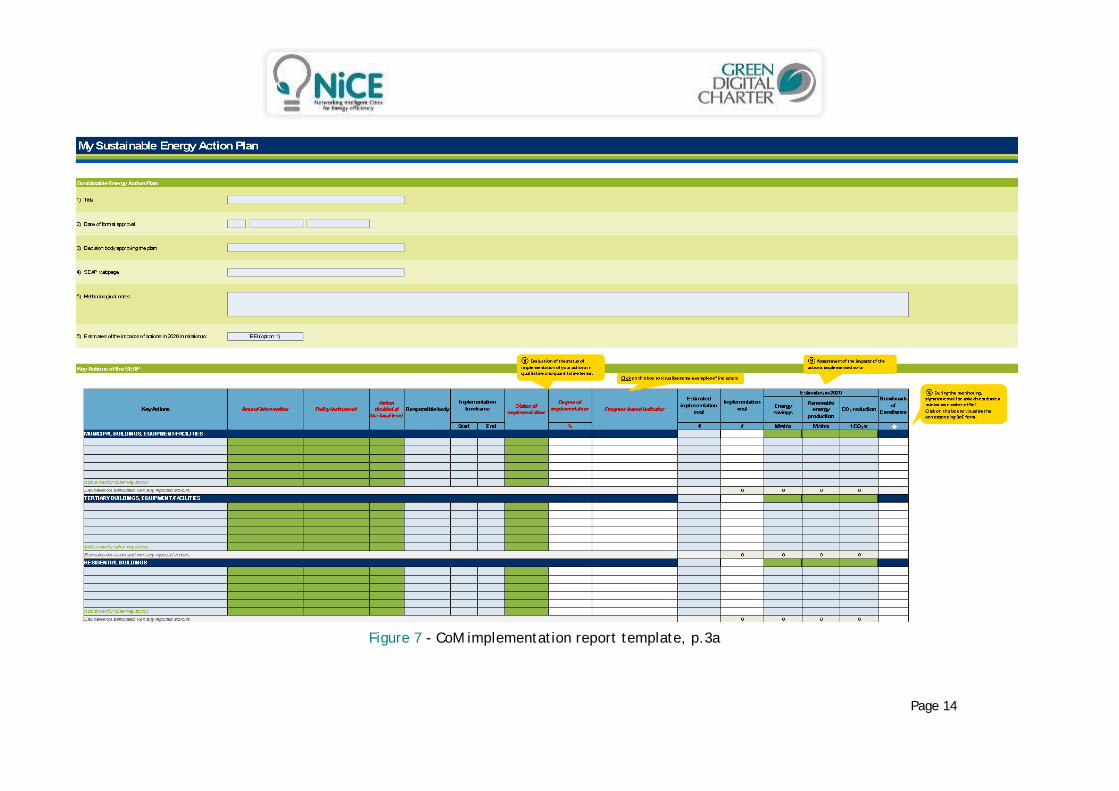
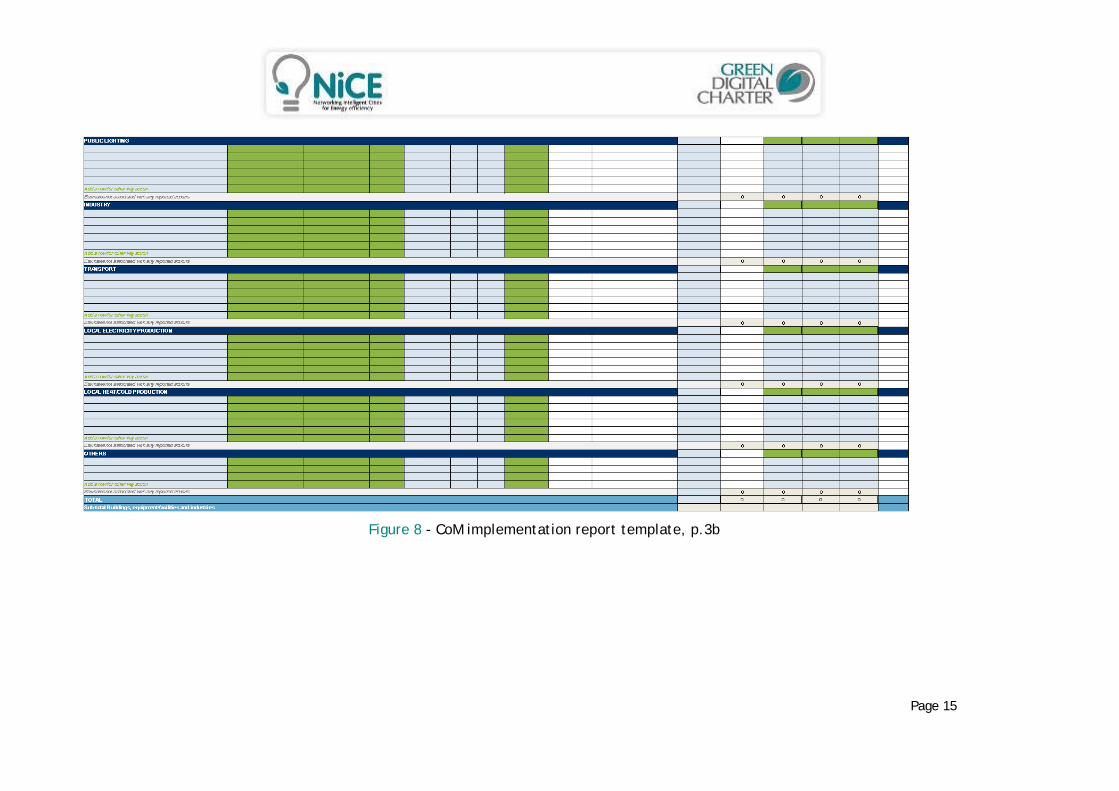
The aim is to use the implementation report template as the new SEAP template for new Covenant of Mayors signatories in order to make monitoring and reporting easier from the very start. The implementation report template of the Covenant of Mayors (to be released) was provided to the NiCE project (EUROCITIES) after a number of bilateral meetings in which the integration of the reporting for GDC and CoM was discussed. In the following figures, the three main components of the template can be seen.
7 http://www.eumayors.eu/about/covenant-supporters_en.html?structure_id=338http://dev2.eumayors.eu/support/faq_en.html?id_faq=55
Page 11
Figure 4 - CoM implementation report template, p.1

Page 12
Figure 5 - CoM implementation report template, p.2a

Page 13
Figure 6 - CoM implementation report template, p.2b
Page 14
Figure 7 - CoM implementation report template, p.3a
Page 15
Figure 8 - CoM implementation report template, p.3b
Page 16
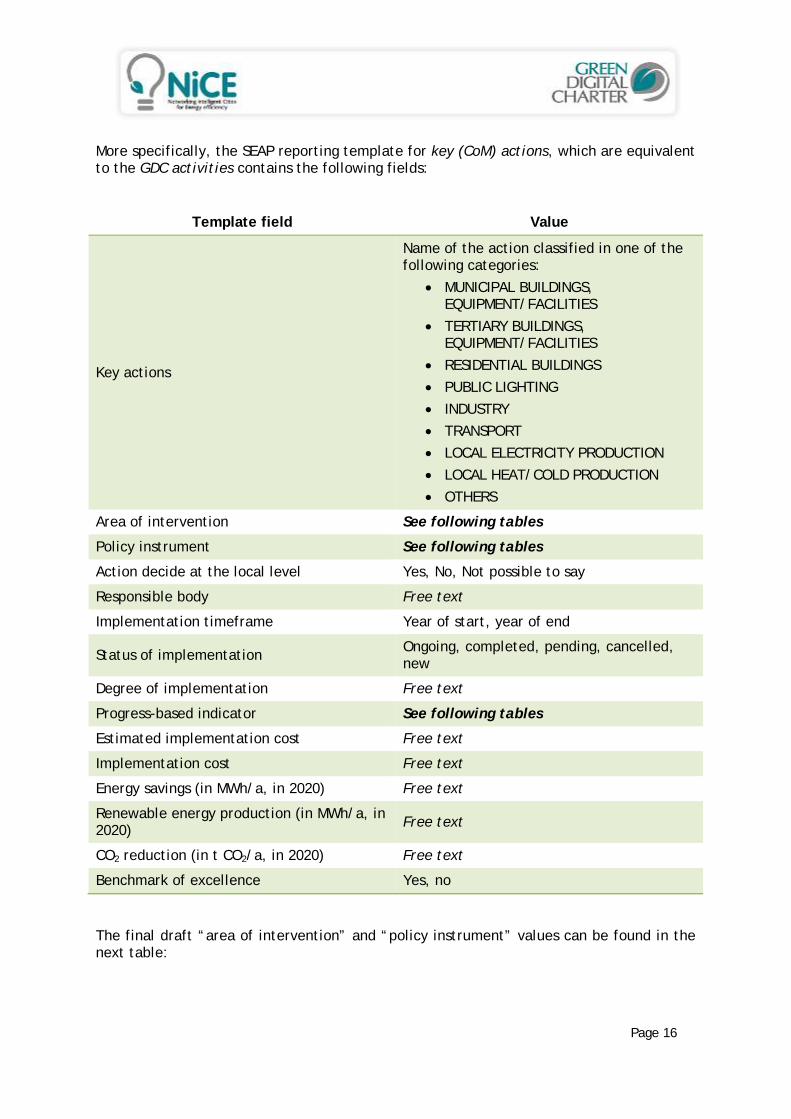
More specifically, the SEAP reporting template for key (CoM) actions, which are equivalent to the GDC activities contains the following fields:
Template field Value
Key actions
Name of the action classified in one of the following categories:
MUNICIPAL BUILDINGS, EQUIPMENT/FACILITIES
TERTIARY BUILDINGS, EQUIPMENT/FACILITIES
RESIDENTIAL BUILDINGS
PUBLIC LIGHTING
INDUSTRY
TRANSPORT
LOCAL ELECTRICITY PRODUCTION
LOCAL HEAT/COLD PRODUCTION
OTHERS
Area of intervention See following tables
Policy instrument See following tables
Action decide at the local level Yes, No, Not possible to say
Responsible body Free text
Implementation timeframe Year of start, year of end
Status of implementation Ongoing, completed, pending, cancelled, new
Degree of implementation Free text
Progress-based indicator See following tables
Estimated implementation cost Free text
Implementation cost Free text
Energy savings (in MWh/a, in 2020) Free text
Renewable energy production (in MWh/a, in 2020) Free text
CO2 reduction (in t CO2/a, in 2020) Free text
Benchmark of excellence Yes, no
The final draft “area of intervention” and “policy instrument” values can be found in the next table:

Page 17
Figure 9 – Area of intervention
A AREA OF INTERVENTION B POLICY INSTRUMENT
A1 Municipal - Residential - Tertiary Buildings B1 BuildingsA11 Building envelope B11 Awareness raising / training
A12 Renewable energy for space heating and hot water B12 Energy assessment and energy management
A13 Energy efficiency in space heating and hot water B13 Energy certification / labelling
A14 Energy efficient lighting systems B14 Energy suppliers obligations - (i.e.: White certificate mechanisms)
A15 Energy efficient electrical appliances B15 Financial mechanisms - Energy or carbon tax to be applied on other sectorsA16 ICT B16 Financial mechanisms - Grants and subsidies (incl. tax reductions)
A17 Behavioural changes B17 Financial mechanisms - Third party financing (incl. EPC and ESCOs), PPPA18 Integrated action B18 Public procurement
A19 Other B19 Standards for refurbishment and new development (incl. Building code)B110 Land use planning
B111 Voluntary agreement with stakeholders
B112 No policy instrument
B113 Other
A2 Public Lighting B2 Public LightingA21 Energy efficiency B21 Energy assessment and energy management
A23 Integrated renewable power B22 Energy suppliers obligations - (i.e.: White certificate mechanisms)
A24 ICT B23 Financial mechanisms - Third party financing (incl. EPC and ESCOs) - PPP A25 Other B24 Public procurement
B25 No policy instrument
B26 Other
A3 Industry B3 IndustryA31 Energy efficiency in industrial processes B31 Awareness raising / trainingA32 Energy efficiency in buildings B32 Energy assessment and energy managementA33 Renewable energy B33 Energy certification / labelling A34 ICT B34 Minimum energy performance standardsA35 Other B35 Financial mechanisms - Energy or carbon tax to be applied on other sectors
B36 Financial mechanisms - Grants and subsidies (incl. tax reductions)B37 Financial mechanisms - Third party financing (incl. EPC and ESCOs), PPPB38 No policy instrumentB39 Other
A4 Municipal - Public - Private Transport B4 TransportA41 Cleaner/efficient vehicles > municipal fleet B41 Awareness raising and provision of information to the general public
A42 Cleaner/efficient vehicles > public transport B42 Integrated ticketing and charging
A43 Cleaner/efficient vehicles > private and commercial fleet B43 Financial mechanisms - Grants and subsidies (incl. tax reductions)A44 Smarter vehicle use > Eco-driving - Municipal fleet B44 Financial mechanisms - Road pricing
A45 Smarter vehicle use > Eco-driving - Public transport B45 Mobility management
A46 Smarter vehicle use > Eco-driving - Private and commercial transport B46 Mobility planning regulations
A47 Smarter vehicle use > Car sharing and car pooling B47 Land use planning regulationsA48 Improvement of logistics and urban freight transport B38 Public procurement
A49 Modal shift > Public transport B39 Voluntary agreements with stakeholders
A410 Modal shift > Walking & cycling B40 No policy instrument
A411 Electric vehicles infrastructure B41 Other
A412 Road network optimisationA413 Mixed use development and sprawl containmentA414 ICTA415 Other
A5 Local Electricity Production B5 Local Electricity ProductionA51 Hydroelectric power B51 Awareness raising / training
A52 Wind power B52 Energy suppliers obligations
A53 Photovoltaics B53 Financial mechanisms - Grants and subsidies
A54 Biomass power plant (incl. co-combustion) B54 Financial mechanisms - Third party financing (incl. EPC and ESCOs) - PPPA55 Combined Heat and Power B55 Public procurement (including GEP)
A56 Other B56 Standards for refurbishment and new development (incl. Building code)B57 Regulation for land use planning
B58 No policy instrumentB59 Other
A6 Local heat/cold Production B6 Local heat/cold ProductionA61 Combined Heat and Power B61 Awareness raising / training
A62 District heating/cooling plant B62 Energy suppliers obligations
A63 District heating/cooling network (new, expansion, refurbishment) B63 Financial mechanisms - Grants and subsidies
A64 Other B64 Financial mechanisms - Third party financing (incl. EPC and ESCOs) - PPPB65 Standards for refurbishment and new development (incl. Building code)B66 Regulation for land use planningB67 No policy instrumentB68 Other
A7 Other B7 OtherA71 Urban regeneration B71 Awareness raising / trainingA72 Waste & wastewater management B72 Regulation for land use planningA73 Tree planting in urban areas B73 No policy instrumentA74 Agriculture and forestry related B74 OtherA75 Other
Page 18
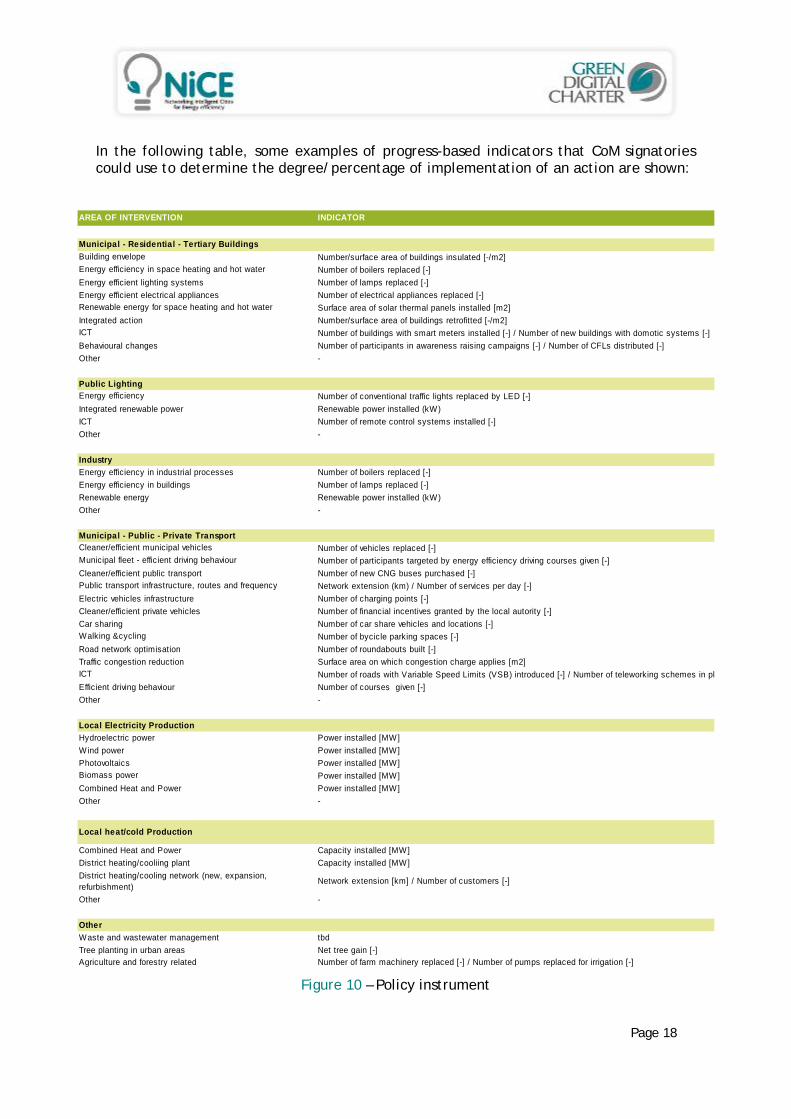
In the following table, some examples of progress-based indicators that CoM signatories could use to determine the degree/percentage of implementation of an action are shown:
Figure 10 – Policy instrument
AREA OF INTERVENTION INDICATOR
Number/surface area of buildings insulated [-/m2]
Number of boilers replaced [-]
Energy efficient lighting systems Number of lamps replaced [-]
Energy efficient electrical appliances Number of electrical appliances replaced [-]
Surface area of solar thermal panels installed [m2]
Integrated action Number/surface area of buildings retrofitted [-/m2]
Number of buildings with smart meters installed [-] / Number of new buildings with domotic systems [-]
Behavioural changes Number of participants in awareness raising campaigns [-] / Number of CFLs distributed [-]
Other -
Public Lighting
Number of conventional traffic lights replaced by LED [-]
Integrated renewable power Renewable power installed (kW)
ICT Number of remote control systems installed [-]
Other -
Industry
Energy efficiency in industrial processes Number of boilers replaced [-]
Energy efficiency in buildings Number of lamps replaced [-]
Renewable energy Renewable power installed (kW)
Other -
Municipal - Public - Private Transport
Number of vehicles replaced [-]
Number of participants targeted by energy efficiency driving courses given [-]
Cleaner/efficient public transport Number of new CNG buses purchased [-]
Network extension (km) / Number of services per day [-]
Electric vehicles infrastructure Number of charging points [-]
Cleaner/efficient private vehicles Number of financial incentives granted by the local autority [-]
Car sharing Number of car share vehicles and locations [-]
Number of bycicle parking spaces [-]
Road network optimisation Number of roundabouts built [-]
Traffic congestion reduction Surface area on which congestion charge applies [m2]
Number of roads with Variable Speed Limits (VSB) introduced [-] / Number of teleworking schemes in pl
Efficient driving behaviour Number of courses given [-]
Other -
Local Electricity Production
Hydroelectric power Power installed [MW]
Wind power Power installed [MW]
Photovoltaics Power installed [MW]
Power installed [MW]
Combined Heat and Power Power installed [MW]
Other -
Local heat/cold Production
Combined Heat and Power Capacity installed [MW]
District heating/cooliing plant Capacity installed [MW]
District heating/cooling network (new, expansion, refurbishment)
Network extension [km] / Number of customers [-]
Other -
Other
Waste and wastewater management tbd
Tree planting in urban areas Net tree gain [-]Agriculture and forestry related Number of farm machinery replaced [-] / Number of pumps replaced for irrigation [-]
Walking &cycling
ICT
Biomass power
ICT
Energy efficiency
Cleaner/efficient municipal vehicles
Municipal fleet - efficient driving behaviour
Public transport infrastructure, routes and frequency
Municipal - Residential - Tertiary Buildings
Building envelope
Renewable energy for space heating and hot water
Energy efficiency in space heating and hot water
Page 19
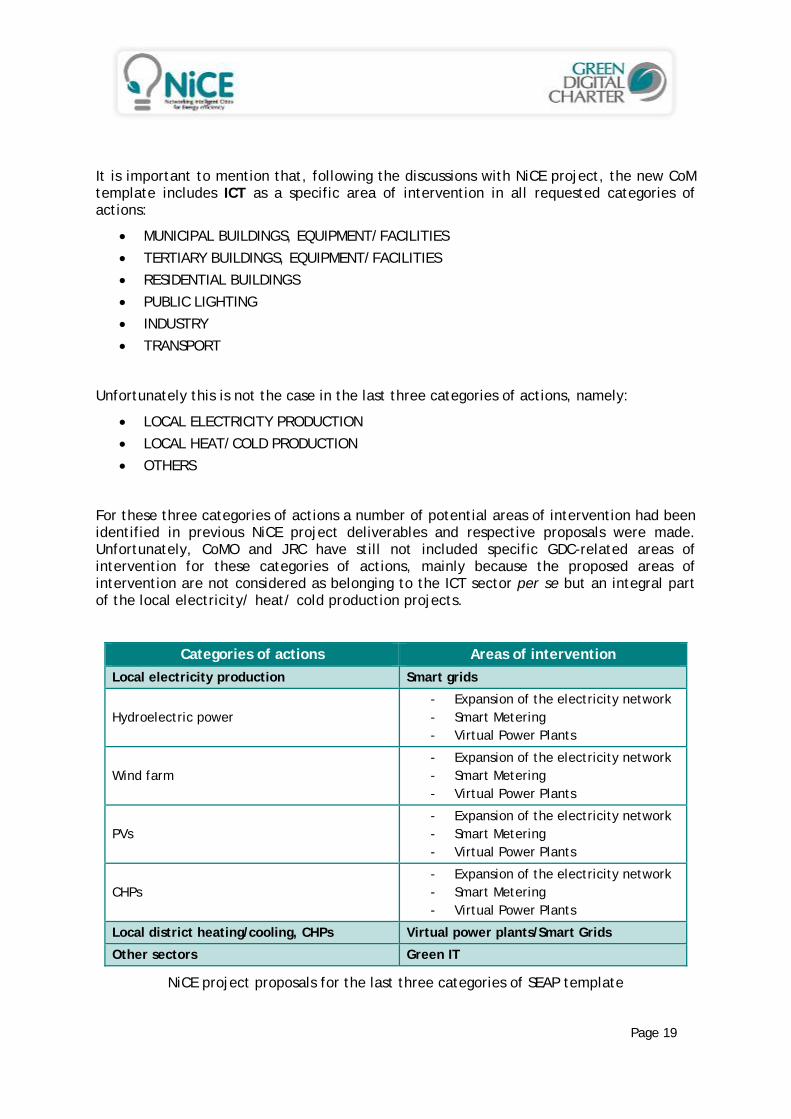
It is important to mention that, following the discussions with NiCE project, the new CoM template includes ICT as a specific area of intervention in all requested categories of actions:
MUNICIPAL BUILDINGS, EQUIPMENT/FACILITIES
TERTIARY BUILDINGS, EQUIPMENT/FACILITIES
RESIDENTIAL BUILDINGS
PUBLIC LIGHTING
INDUSTRY
TRANSPORT
Unfortunately this is not the case in the last three categories of actions, namely:
LOCAL ELECTRICITY PRODUCTION
LOCAL HEAT/COLD PRODUCTION
OTHERS
For these three categories of actions a number of potential areas of intervention had been identified in previous NiCE project deliverables and respective proposals were made. Unfortunately, CoMO and JRC have still not included specific GDC-related areas of intervention for these categories of actions, mainly because the proposed areas of intervention are not considered as belonging to the ICT sector per se but an integral part of the local electricity/ heat/ cold production projects.
Categories of actions Areas of intervention
Local electricity production Smart grids
Hydroelectric power - Expansion of the electricity network - Smart Metering - Virtual Power Plants
Wind farm - Expansion of the electricity network - Smart Metering - Virtual Power Plants
PVs - Expansion of the electricity network - Smart Metering - Virtual Power Plants
CHPs - Expansion of the electricity network - Smart Metering - Virtual Power Plants
Local district heating/cooling, CHPs Virtual power plants/Smart Grids
Other sectors Green IT
NiCE project proposals for the last three categories of SEAP template

Page 20
In any case, CoMO and JRC have stated during the meetings with EUROCITIES that they may change some of the fields/values/indicators or add additional ones in the previous tables depending on the input they will receive along with the first reporting documents from cities.
It has to be mentioned that, following the delay of the template’s release or difficulties that cities may experience in reporting, until now (end of May 2014), CoMO hasn’t received any report from signatory cities9.
3.3 Impact of ICT in the Emission Inventory Still, Covenant of Mayors signatories can neither highlight the negative impact nor the positive contribution of ICT in their initial emission calculation (Baseline Emission Inventory) and in their following review (Monitoring Emission Inventory). Instead, the energy consumption of ICT is included in the reporting on the overall electricity use of a city.
Furthermore, developing an option for cities to report on ICT-generated emissions is not favoured by CoMO and JRC since it would change the structure and meaning of the BEI and MEI tables.
9http://dev2.eumayors.eu/about/signatories_en.html?q=Search+for+a+Signatory...&country_search=&population=&date_of_adhesion=&status=3

Page 21
4 Green Digital Charter and Covenant of Mayors: integration challenges
Given the different focus of the two initiatives (all activities related to energy efficiency for the Covenant and only ICT-related ones for the Charter), cities committed to both initiatives face some integration challenges mainly due to their different scale and timelines.
4.1 Scale The Covenant of Mayors concerns actions at local level within the competence of the local authority and the commitments cover the whole geographical area of the local authority (town, city). The emission inventory, that has to be submitted as part of the SEAP, should assess the energy consumption and CO2 emissions of all the different sectors and actors present in the territory of the local authorities.
The Green Digital Charter instead has a different approach. The primary focus of the Charter is the signatories’ public administration and this is reflected on the quantitative commitments of deploying ICT pilots and decreasing the direct carbon footprint of the city’s ICT. By city’s ICT we mean the ICT equipment and infrastructure owned or operated solely by the city administration and not the ICT equipment of the residential or the tertiary sectors of the city.
4.2 Timeline The Covenant of Mayors requires the signatories to define their goals and actions towards a specific time-horizon: 2020. Their vision and consequently their SEAP need to be compatible with the Covenant of Mayors’ commitments and should therefore imply a CO2 emission reduction of more than 20% by the 2020 target. The Covenant signatories though, are free to be more ambitious than this by establishing a SEAP, which covers a longer period, still providing intermediate values and objectives for the year 2020.
The Green Digital Charter, originally committing cities to reduce by 30% their ICT footprint by 2020, has been revised in 2011 to allow a more flexible approach for cities that joined the initiative at a later stage. The Charter signatories now commit to work with other signatories, deploy five large scale pilot projects within 5 years from the signature, and decrease the carbon footprint of their ICT by 30% within 10 years from the signature. This commitment no longer refers to 2020 as the reference year and does not engage cities to consider this year as an intermediary target.

Page 22
5 Green Digital Charter-Covenant of Mayors reporting tool In light of the Covenant of Mayors implementation reporting template, the need to integrate the CoM and GDC reporting, the main challenges for this integration mentioned in the previous paragraph and the specific needs (following the GDC commitments) from reporting under the GDC, NiCE finalised its GDC-CoM reporting template that cities can access through the online toolkit.
The main drivers for the development of the final GDC-CoM reporting tool can be codified as follows:
It was recognised that CoM is a far wider initiative with more than 5000 signatory cities, thus, its reporting template should serve as a guide;
GDC signatories (through RCG meetings and meetings of NiCE partners with other cities) have clearly expressed their reluctance to get involved in additional and not compatible reporting procedures;
GDC signatories (through RCG meetings and meetings of NiCE partners with other cities) have expressed their reluctance to use, specifically for GDC, performance indicators that do not have a “wider” value, meaning, being recognised and used also by other initiatives;
There is a set of additional GDC data that need to be reported by the cities (e.g. Action Framework dimensions of projects and activities).
The GDC/CoM reporting tool cannot be seen as separate from the “Add GDC activities” facility of the online toolkit. That’s because the latter acts as the interface between the CoM reporting (SEAP or implementation reporting) and the GDC activities database. Thus, the format and contents of the GDC-CoM reporting tool are reflected in the interface for reporting the GDC pilot projects. Apart from following the recommendations coming from RCG meetings and meetings of NiCE partners with other cities, a number of design decisions were taken:
1. GDC-CoM reporting tool should be as much as possible compatible with the CoM SEAP and implementation template;
2. Then, additional GDC reporting data can be added in a complementary way;
3. Nevertheless, when reporting to GDC, GDC data should have a greater priority;
4. The “timeline” challenge of the previous paragraph needs to be taken into account;
5. For the time being, use of indicators should be avoided.
Following these considerations, the “Add GDC activities” facility of the online toolkit is separated in two parts: the first one is called “Activity details” and the second one “Additional CoM data”.

Page 23
5.1 Activity details Shaded rows denote a mandatory field
Field Instruction to the reporting city
Title Enter the name of your city’s activity/project
Description Describe your city’s activity/ project (You could use an existing summary, text from a project’s brochure, etc.) – max. 100 words
Website A URL that someone can use to find more material about the activity/project
Application area10 According to the GDC system, this can be one or more of the: Buildings, Energy, Green ICT, Public lighting, Transport, Other domains, Cross-domain
Activity type According to the GDC system, this can be one or more of the: Governance, Policy, Operational, Exchange, Monitoring
Role of ICT According to the GDC system, this can be one or more of the: Efficiency, Analysis/Decision Making, Perception/Behaviour, Innovation/Substitution
Is this one of the 5 "large scale pilot projects" required in the Charter commitments?
Press Yes if you want to include this activity/project in the 5 pilot projects required by the Charter
5.2 Additional CoM data Shaded rows denote a mandatory field
Field Instruction to the reporting city
CoM category
Select which CoM category the activity/project falls in: Industry, Local electricity production, Local heat/cold production, Municipal buildings/facilities/equipment, Public lighting, Residential buildings, Tertiary buildings/facilities/equipment, Other
10For more information about the Application area, Activity type and Role of ICT http://www.greendigitalcharter.eu/wp-content/uploads/2012/03/NiCE_D2.2_ActionFramework_v2.0_-12.07.31.pdf
Page 24
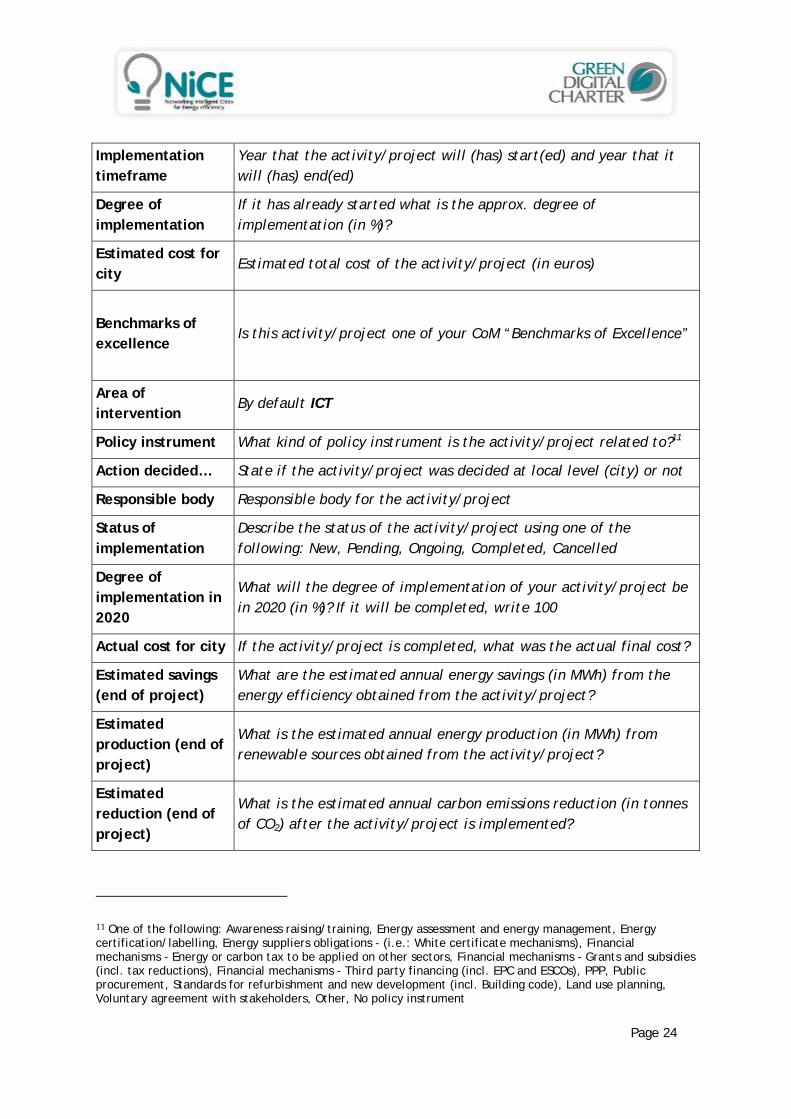
Implementation timeframe
Year that the activity/project will (has) start(ed) and year that it will (has) end(ed)
Degree of implementation
If it has already started what is the approx. degree of implementation (in %)?
Estimated cost for city
Estimated total cost of the activity/project (in euros)
Benchmarks of excellence
Is this activity/project one of your CoM “Benchmarks of Excellence”
Area of intervention
By default ICT
Policy instrument What kind of policy instrument is the activity/project related to?11
Action decided… State if the activity/project was decided at local level (city) or not
Responsible body Responsible body for the activity/project
Status of implementation
Describe the status of the activity/project using one of the following: New, Pending, Ongoing, Completed, Cancelled
Degree of implementation in 2020
What will the degree of implementation of your activity/project be in 2020 (in %)? If it will be completed, write 100
Actual cost for city If the activity/project is completed, what was the actual final cost?
Estimated savings (end of project)
What are the estimated annual energy savings (in MWh) from the energy efficiency obtained from the activity/project?
Estimated production (end of project)
What is the estimated annual energy production (in MWh) from renewable sources obtained from the activity/project?
Estimated reduction (end of project)
What is the estimated annual carbon emissions reduction (in tonnes of CO2) after the activity/project is implemented?
11One of the following: Awareness raising/training, Energy assessment and energy management, Energy certification/labelling, Energy suppliers obligations - (i.e.: White certificate mechanisms), Financial mechanisms - Energy or carbon tax to be applied on other sectors, Financial mechanisms - Grants and subsidies (incl. tax reductions), Financial mechanisms - Third party financing (incl. EPC and ESCOs), PPP, Public procurement, Standards for refurbishment and new development (incl. Building code), Land use planning, Voluntary agreement with stakeholders, Other, No policy instrument

Page 25
After using the “Add GDC activities” facility of the online toolkit, a signatory city can check all the GDC activities’ reporting in an online (and downloadable) table in a format compatible with the SEAP template – ready to be used in the CoM reporting process.
On the other hand, if a city has already submitted a SEAP, the template can be used to report GDC activities and help other GDC cities identify new projects and opportunities – a city has just to open the "Add an activity" box and just copy the SEAP template fields in the corresponding GDC ones. After submitting the data, the activity will be uploaded for all cities to see.
The important function that hides beneath this facility is the reordering of data so that all submitted data can be easily separated in two parts:
The 100% compatible with the CoM reporting in the first part;
The additional GDC data in the second part
This function can be seen in the breakdown of the final reporting table – the user can see or download the data in this exact form.

Page 26
Start End
MUNICIPAL BUILDINGS, EQUIPMENT/FACILITIES
RESIDENTIAL BUILDINGS
PUBLIC LIGHTING
INDUSTRY
TRANSPORT
LOCAL ELECTRICITY PRODUCTION
LOCAL HEAT/COLD PRODUCTION
OTHERS
This part of the table can now be directly copied and pasted in the CoM template - 1
TERTIARY BUILDINGS, EQUIPMENT/FACILITIES
Area of intervention
Policy instrumentAction decided at
the local levelResponsible body
Implementation timeframe
Status of implementationKey actions/GDC Activities
Energy savingsRenewable
energy CO2 reduction
€ MWh/a MWh/a t CO2/a
This part of the table can now be directly copied and pasted in the CoM template - 2
Estimates in 2020
Benchmarks of excellence
Degree of implementation
%
Progress-based indicators
Estimated implementation
cost
Implementation cost
€
Page 27
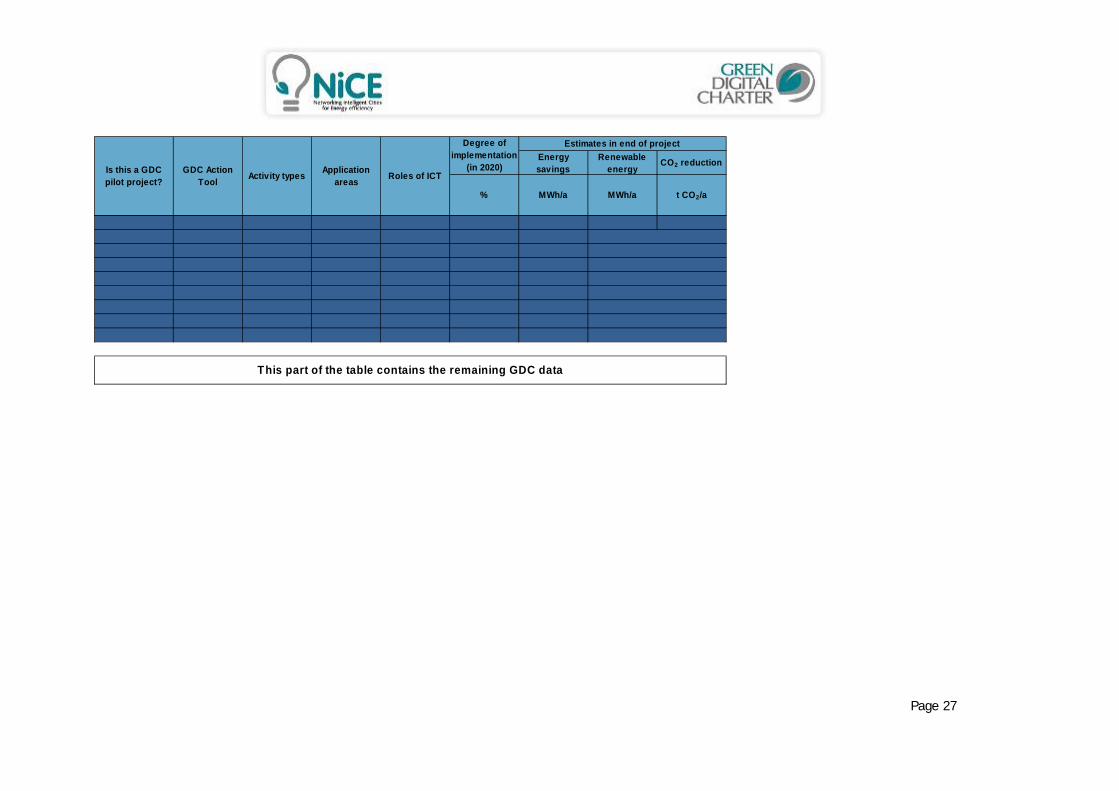
Energy savings
Renewable energy
CO2 reduction
% MWh/a MWh/a t CO2/a
This part of the table contains the remaining GDC data
Roles of ICT
Degree of implementation
(in 2020)
Estimates in end of project
Is this a GDC pilot project?
GDC Action Tool
Activity typesApplication
areas

Page 28
6 Analysis of Green Digital Charter-Covenant of Mayors reports
As it was mentioned before, following the delay of the template’s release or difficulties that cities may experience in reporting, until now (end of May 2014), CoMO hasn’t received any report from signatory cities12. Nevertheless, most of the GDC signatories have submitted their SEAP, thus, have publicised their strategy to meet their CoM commitments.
After analysing the SEAP submitted by the GDC signatories, the following ICT- or GDC-related reporting activities were found:
Amsterdam13: The city mentions the need to make the ICT sector greener, especially since almost 6% of all the CO2 emissions of Amsterdam are estimated to be caused by data centres and the number of ICT businesses in the city is increasing annually. The local authority and the Amsterdam ICT sector have jointly set up the ‘Green IT initiative’. In addition to making the ICT sector more efficient, ICT plays an important role in changing the city’s mobility patterns, integrating sustainable energy sources and making houses and offices more efficient. In cooperation with the ICT sector, existing data centres will be made more energy efficient and new sustainable centres will be designed.
Barcelona14: The city recognises how the use of ICT can be a problem, if not properly tackled, as the analysis of the energy consumption evolution shows a rise of intensity in electricity consumption in the domestic sector as well as in the tertiary sector which seems to go along, among others, with the evolution and rise of the ICT in houses and offices.
Bari15: The City of Bari has identified 78 initiatives that can help in the reduction of its CO2 emissions. Eight of them are classified as ICT/TLC16:
o Municipal area wireless coverage o Development of a web portal that collects data of consumption of resources
used in the municipal area o "MEMS" - Municipal Energy Management System o “Infomobility” – Use of ICT for clever transport o Creation of a system of remote monitoring and collection of meters’ data o Green ICT o Dematerialisation process of the public administration o Streamlining and strengthening of ICT systems
12http://dev2.eumayors.eu/about/signatories_en.html?q=Search+for+a+Signatory...&country_search=&population=&date_of_adhesion=&status=313 http://dev2.eumayors.eu/about/signatories_en.html?city_id=28014 http://dev2.eumayors.eu/about/signatories_en.html?city_id=38115http://dev2.eumayors.eu/about/signatories_en.html?city_id=197116TLC stands for Telecommunications

Page 29
Bologna17: The city recognises that ICT represent an area relevant to the SEAP for two reasons. On the one hand, ICT is a source of growing direct electricity consumption (e.g. servers and data centres), and on the other hand it is the basis of innovative solutions for the measurement and optimisation of energy consumption (e.g. smart meters, remote control systems, etc.). Bologna describes a “Green Computing” strategy in order to decrease the electricity consumption of the municipal ICT equipment by 141 MWh/a by 2016.
Bristol18: Bristol describes the development of “Green Digital Economy” as one of its “Climate Change & Energy Security Framework” axes. Two actions are described in more details:
o Deliver innovative ICT solutions (incl. smart metering) in social housing to save energy, shift consumption to off-peak and reduce carbon
o Deliver Bristol’s Green ICT Strategy and share best practice with other organisations through Bristol Green Addict
Helsinki19: Helsinki mentions the Green Digital Charter as one of the plans that the city is compiling/ following in order to meet its sustainable development targets. Nevertheless, more concrete analysis is still to be reported.
Venice20: Venice has included the Green Digital Charter in its SEAP as one of the measures the city will take in order to meet its 2020 commitments. More specifically, Venice has assessed that by implementing (between 2012 and 2020) the decrease of 30% in its ICT equipment a reduction of 425 tCO2/a will have been achieved.
Similarly to CoM, GDC hasn’t received any GDC-CoM reports from signatory cities (the way it is described in Task 3.3 of the NiCE project DoW), mainly due to the fact that cities are not yet reporting for the Covenant or not fully using the NiCE project ICT carbon footprint tool. Nevertheless, and after the continuous support and help provided by EUROCITIES to all signatories, cities have begun using the online toolkit and have started reporting their activities21.
City Number of
reported activities
Amsterdam 1
Belfast 5
Birmingham 4
Bologna 3
17http://dev2.eumayors.eu/about/signatories_en.html?city_id=39718http://dev2.eumayors.eu/about/signatories_en.html?city_id=37819http://dev2.eumayors.eu/about/signatories_en.html?city_id=18920http://dev2.eumayors.eu/about/signatories_en.html?city_id=300521http://www.greendigitalcharter.eu/nice_toolkit/snapshots.php

Page 30
City Number of
reported activities
Bristol 2
Eindhoven 2
Ghent 5
Lisbon 1
Manchester 4
Murcia 5
Rijeka 1
Tallinn 3
Vienna 1
Zagreb 6
Warsaw 3
Linkoping 6
Venice 1
As a conclusion, it is evident from the small number of direct references to “ICT” that cities, whether signatories of CoM or GDC:
either haven’t yet compiled coherent digital or smart city strategies that explicitly explore the relationship and combine digital development strategies with energy efficiency and climate commitments;
or, and this is the most frequent case, see ICT projects as cross-cutting projects that contribute to other sectors (e.g. transport, buildings, etc.) and, thus, are not able to identify and isolate the ICT components and contribution to energy and climate targets
To this end, a necessary task of a NiCE project follow-up needs to be the creation of awareness among cities so that they can efficiently:
Identify and assess the problems that the increased use of ICT can pose;
Report specific measures for energy efficiency in ICT use, ICT for energy efficiency and decrease of ICT’s carbon footprint;
Promote these measures to their citizens and the European stakeholders (other cities, institutions, etc.).

Page 31
7 Next steps The Charter-Covenant reporting tool was finalised following the finalisation of the reporting template by CoMO and JRC. Nevertheless, monitoring and reporting in both initiatives have not yet advanced. The next steps (to be implemented during a NiCE follow-up project) towards future developments of the reporting for GDC-CoM will mainly consist of:
Analysis of Covenant of Mayors useful ICT activities
Based on the Green Digital Charter reporting, a list of exemplary ICT measures that contribute to the CoM commitments will be compiled.
This list will be promoted and recommended to the Covenant of Mayors members through the Covenant Benchmarks of Excellences22 and by developing together with the Covenant of Mayors Office a Thematic Leaflet focusing on ICT.
Inclusion of ICT in the Covenant of Mayors reporting
NiCE will continue to work in synergy with Climate Alliance, the other partners of the Covenant of Mayors Office and the Joint Research Centre to facilitate the better inclusion of ICT in the Covenant planning and reporting.
Although, during the last 12 months there hasn’t been any significant progress in the CoM reporting (closing of CoMO2 contract and inception of the CoMO3 contract), EUROCITIES, being a partner in both initiatives, is promoting GDC and its toolkit in order for the latter to be included in the CoMO3 strategy documents.
At a later stage, NiCE will promote the ICT footprint calculation and reporting tool that is being developed by NiCE, aiming to include it in the Covenant of Mayors reference material as an option for cities to introduce quantitative reporting on ICT in their Covenant activities.
Incorporate new developments and project results in GDC reporting
A problem currently experienced by all sustainable development initiatives is the different reporting processes and methods that they need to impose to monitoring & reporting cities and organisations. Following a Horizon 2020 call for project by DG CONNECT23, it is expected that after the respective project has finished, all major initiatives like Covenant of Mayors, Green Digital Charter, CIVITAS, etc. will be provided with:
a common set of performance indicators;
a common framework to assess the economic, social and environmental value of different project and activities;
22 http://www.eumayors.eu/actions/benchmarks-of-excellence_en.html23SCC2 - 2014 Developing a framework for common, transparent data collection and performance measurement to allow comparability and replication between solutions and best practice identification
Page 32
common methodologies for the impact assessment of project and activities;
a framework for best practices exchange.
The Green Digital Charter will need to keep track of these or similar developments and adapt its reporting facility accordingly (keep compatibility with existing or become compatible with the new framework that will emerge).
Support cities to coherently report their energy efficiency strategies for ICT equipment
Although cities tend to know about and follow recent ICT innovations, they tend to combine these developments only with increased functionality or better services to the citizens.
In the meantime, many ICT innovations promise, as well, reduced energy consumption and better environmental performance; two improvements that can result in the faster pay-off of the necessary initial investments in equipment and software.
Green Digital Charter needs to support cities, and especially ICT departments, in identifying these benefits and including them in all relevant reporting processes.