green prescription patient survey 2016 report · web viewweather/darkness 1 1 1 0 other...
TRANSCRIPT

Green Prescription Patient Survey2016 Report
June 2016

Green Prescription Patient Survey2016 Report
PREPARED FOR Diana O’NeillMinistry of Health
PREPARED BY Annita WoodMark Johnson
CONTACT DETAILS Mark JohnsonResearch New ZealandPhone 04 499 3088www.researchnz.com
PROJECT NUMBER #4838-00
ContentsIndex of figures
Index of tables
1.0 Executive Summary
2.0 Introduction2.1 Background2.2 Objectives2.3 Methodology
3.0 Getting the Green Prescription3.1 Green Prescription Referral Source3.2 Main reasons for Green Prescription3.3 Advice received on healthy eating
4.0 Current status of Green Prescription4.1 Current status of Green Prescription4.2 Return visits to referrer since Green
Prescription
5.0 Changes resulting from the GRx5.1 Positive changes in health5.2 Changes in activity levels5.3 Encouraging others to be active
6.0 Contact with GRx support person6.1 Initial contact with the GRx support person6.2 Activities suggested by GRx support person6.3 Referrals to activity providers6.4 Companions when doing physical activity6.5 Follow-up support
7.0 Opinions about GRx support7.1 Overall satisfaction with GRx service7.2 Opinions about GRx support
8.0 Profile of respondents
Appendix A: Cover letter, reminder letter and questionnaire
Appendix B: Supplementary tabulations
Appendix C: Tables by contract holder

Index of figuresFigure 1: Green Prescription Referral Source...............................................................18Figure 2: Time since first Green Prescription...............................................................19Figure 3: Main reasons for GP issuing Green Prescription............................................21Figure 4: Advice received on healthy eating (n=2843)................................................33Figure 5: Current status of Green Prescription............................................................36Figure 6: Return visits to referrer since GRx was issued..............................................40Figure 7: Whether the GRx discussed at the return visits by the referrer....................41Figure 8: Outcome of discussions with the referrer.....................................................41Figure 9: How advice to continue or change GRx was given.......................................42Figure 10: Whether positive changes in health have been noticed since first GRx......45Figure 11: Health changes noticed..............................................................................46Figure 12: Changes in activity levels since GRx was issued........................................49Figure 13: Changes to diet since Green Prescription...................................................55Figure 14: Types of changes to diet since Green Prescription.....................................56Figure 15: Encouraging others to be active.................................................................59Figure 16: First contact with the GRx support person..................................................62Figure 17: Activities suggested by the GRx support person........................................64Figure 18 and 19: Referrals to activity provider and percent who considered the
provider was appropriate......................................................................................67Figure 20: Type of activity provider referred to...........................................................67Figure 21: Companions when doing physical activity..................................................69Figure 22: How follow-up support was provided..........................................................72Figure 23: Extension for Longer Support.....................................................................73Figure 24: Overall satisfaction with GRx support.........................................................78Figure 25: Opinions about GRx support (n=2672)*.....................................................86Figure 26: Opinions about GRx support – Comparison with previous years.................87Figure 27: Gender.......................................................................................................90Figure 28: Age group distribution................................................................................91Figure 29: Employment status.....................................................................................92Figure 30: Whether have a disability...........................................................................93Figure 31: Highest educational qualification................................................................94Figure 32: Deprivation index distribution (1 = least deprived, 10 = most deprived)...95
Research New Zealand | June 2016

Index of tablesTable 1: KPI summary table...........................................................................................7Table 2: KPI 1 Indicator: Minimum of 50% of GRx participants are more active after 6-8
months of receiving their GRx.................................................................................8Table 3: KPI 2 Indicator: Minimum of 55% of GRx participants have made changes to
their diet since receiving their GRx.........................................................................8Table 4: KPI 3 Indicator: Minimum of 70% of GRx participants feel more confident
about doing physical activity..................................................................................9Table 5: KPI 4 Indicator: Minimum of 85% of GRx participants felt the physical activity
suggested was appropriate for them......................................................................9Table 6: KPI 5 Indicator: Minimum of 75% of GRx participants are motivated to
get/stay physically active......................................................................................10Table 7: KPI 6 Indicator: Minimum of 80% of GRx participants are aware of and
understand the benefits of physical activity..........................................................10Table 8: KPI 7 Indicator: Minimum of 70% of GRx participants have noticed positive
health changes......................................................................................................11Table 9: KPI 8 Indicator: Minimum of 75% of GRx participants are encouraged to
continue physical activity by their referrer............................................................11Table 10: KPI 9 Indicator: Minimum of 80% of GRx participants are satisfied with the
overall service and support provided....................................................................12Table 11: Population, sample, and participation rate for each GRx contract holder....16Table 12: Main reasons for GP issuing Green Prescription 2013-2015.........................22Table 13: Reasons for being off GRx............................................................................38Table 14: Changes in activity levels by time since GRx was issued.............................50Table 15: Reasons for spending about the same amount of time being active...........51Table 16: Reasons for spending less time being active...............................................53Table 17: Other changes made to diet........................................................................57Table 18: Positive changes noticed by whether patients have been given an extension
for longer support.................................................................................................74Table 19: Reasons for being satisfied overall..............................................................81Table 20: Reasons for being partially satisfied overall.................................................82Table 21: Reasons for being less than satisfied overall...............................................85Table 22: Ethnicity......................................................................................................95Table 23: Ethnicity (summary groups).........................................................................96Table 24: Age..............................................................................................................96Table 25: Age (summary groups)................................................................................97
Research New Zealand | June 2016
1.0 Executive SummaryThis report presents the findings from the 2016 Green Prescription (GRx) initiative patient survey, conducted for the Ministry of Health (the Ministry) in April and May 2016.
IntroductionThe GRx patient survey allows the Ministry to monitor the performance of the GRx initiative each year. The ongoing success of the programme is measured against nine key performance indicators (KPIs), developed by the Ministry. This measurement is also used to provide feedback to the 17 contract holders around the country.
The survey was conducted as a mixed-method online, telephone and paper-based survey during the months of March, April and May 2016. A total of 10,000 participants were selected to take part in the survey from the N=18,849 programme participants put forward by contract holders. By the survey close-off date n=2,843 completed surveys had been received, representing a participation rate of 28.4 percent compared with 27.1 percent in 2015, 28.6 percent in 2014 and 29.1 percent in 2013.
The results presented in this report are weighted to be representative of the distribution of patients across the contract holders. Results based on the total sample have a maximum margin of error of plus or minus 1.8 percent (at the 95 percent confidence level).
Key findingsTable 1 (overleaf) summarises the KPI results for 2016. At the national level, the average result for nine out of nine of the KPIs is at or above the prescribed minimum level set by the Ministry.
Eight out of 19 contract holders met or exceeded all nine KPIs; these were Sport Northland, Sport Auckland – Auckland, Sport Whanganui, Sport Otago, Sport Taranaki, Sport Waikato, Marlborough PHO and Sport Bay of Plenty.
The indicator results and tables for each KPI are provided on the following pages. Note that the KPI scores are calculated excluding non-response. For the rest of the report, the percentages in all charts and tables include non-response.
Research New Zealand | June 2016

Table 1: KPI summary table1
Goal Indicator
Average
result
Number of providers
that achieved
KPI* Participants… %
1…Are more active since receiving their GRx.
Minimum of 50% of GRx participants are more active after 6-8 months of receiving their GRx
64 19 out of 19
2…Adopt better nutritional habits.
Minimum of 55% of GRx participants have made changes to their diet since receiving their GRx.
71 18 out of 19
3…Receive effective support to maintain activity.
Minimum of 70% of GRx participants feel more confident about doing physical activity.
77 19 out of 19
4…Have a choice of activities that are relevant and appropriate for them.
Minimum of 85% of GRx participants felt the physical activity suggested was appropriate for them. 86 13 out of
19
5…Are motivated to participate in and follow their GRx.
Minimum of 75% of GRx participants are motivated to get/stay physically active. 81 17 out of
19
6…Are aware of and understand the benefits of physical activity.
Minimum of 80% of GRx participants are aware of and understand the benefits of physical activity. 81 13 out of
19
7...Have noticed positive health changes since being more active.
Minimum of 70% of GRx participants have noticed positive health changes. 73 17 out of
19
8…Are supported to sustain behaviour changes.
Minimum of 75% of GRx participants are encouraged to continue physical activity by their referrer.
80 14 out of 19
9…Receive consistent high quality services and support.
Minimum of 80% of GRx participants are satisfied with the overall service and support provided.
85 18 out of 19
*Results for Sport Auckland (Auckland and Counties Manukau), and CWCST (Canterbury and West Coast) have been counted individually for this table. *’Non-responses’ have been removed from these results.
1 Note: The KPIs as detailed in the Executive Summary exclude those respondents who did not answer a particular question for some reason. However, in the body of the report non-responses are included. While this has been done to maintain consistency with how the survey has historically been reported, it does result in some discrepancies between figures in the Executive Summary and those reported in the chapters that follow.Research New Zealand | June 2016
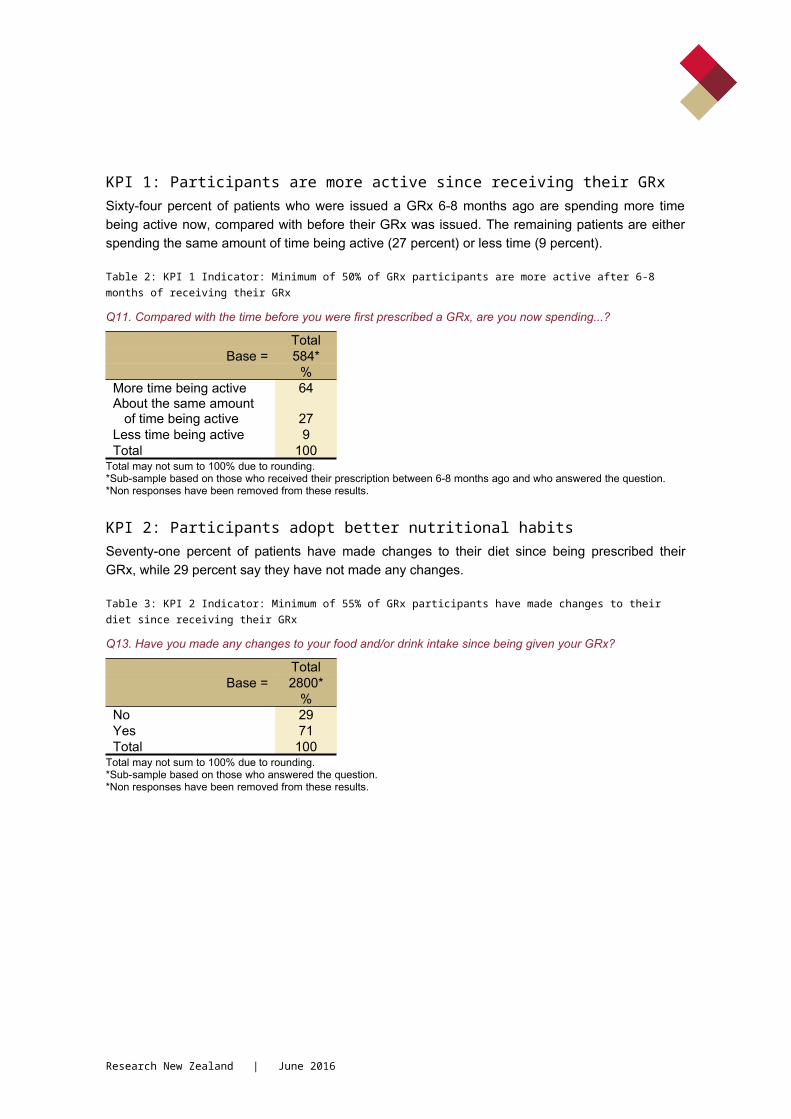
KPI 1: Participants are more active since receiving their GRxSixty-four percent of patients who were issued a GRx 6-8 months ago are spending more time being active now, compared with before their GRx was issued. The remaining patients are either spending the same amount of time being active (27 percent) or less time (9 percent).
Table 2: KPI 1 Indicator: Minimum of 50% of GRx participants are more active after 6-8 months of receiving their GRx
Q11. Compared with the time before you were first prescribed a GRx, are you now spending...?
TotalBase = 584*
%More time being active 64About the same
amount of time being active 27
Less time being active 9Total 100
Total may not sum to 100% due to rounding.*Sub-sample based on those who received their prescription between 6-8 months ago and who answered the question.*Non responses have been removed from these results.
KPI 2: Participants adopt better nutritional habitsSeventy-one percent of patients have made changes to their diet since being prescribed their GRx, while 29 percent say they have not made any changes.
Table 3: KPI 2 Indicator: Minimum of 55% of GRx participants have made changes to their diet since receiving their GRx
Q13. Have you made any changes to your food and/or drink intake since being given your GRx?
TotalBase = 2800*
%No 29Yes 71Total 100
Total may not sum to 100% due to rounding.*Sub-sample based on those who answered the question.*Non responses have been removed from these results.
Research New Zealand | June 2016

KPI 3: Participants receive effective support to maintain activitySeventy-seven percent of patients feel more confident about doing physical activity as a result of the support they received from their GRx support person. Just seven percent feel this is not the case.
Table 4: KPI 3 Indicator: Minimum of 70% of GRx participants feel more confident about doing physical activity
Q22g. Now thinking about the service and support you received, please indicate how strongly you agree or disagree with each of these statements… As a result of the support I got, I now feel more confident about doing physical activity regularly
TotalBase = 2632*
%Strongly agree 39Agree 38Neither agree nor
disagree 16Disagree 4Strongly disagree 3Total 100
Total may not sum to 100% due to rounding.*Sub-sample based on those who had contact with a GRx support person and who gave a rating.*Non responses have been removed from these results.
KPI 4: Participants have a choice of activities that are relevant and appropriate for themEighty-six percent of patients feel that they have adequate choices in terms of the physical activities available to them. Just five percent feel that the options suggested by the support person were not appropriate for them.
Table 5: KPI 4 Indicator: Minimum of 85% of GRx participants felt the physical activity suggested was appropriate for them
Q22b. Now thinking about the service and support you received, please indicate how strongly you agree or disagree with each of these statements… The physical activity options suggested were appropriate for me
TotalBase = 2644*
%Strongly agree 39Agree 47Neither agree nor
disagree 10Disagree 3Strongly disagree 2Total 100
Total may not sum to 100% due to rounding.*Sub-sample based on those who had contact with a GRx support person and who gave a rating.*Non responses have been removed from these results.
Research New Zealand | June 2016

KPI 5: Participants are motivated to participate in and follow their GRxEighty-one percent of patients feel their support person motivated them to get or stay physically active. Just seven percent say they were not motivated.
Table 6: KPI 5 Indicator: Minimum of 75% of GRx participants are motivated to get/stay physically active
Q22d. Now thinking about the service and support you received, please indicate how strongly you agree or disagree with each of these statements… The person I spoke to motivated me to get/stay physically active
TotalBase = 2641*
%Strongly agree 44Agree 37Neither agree nor
disagree 12Disagree 4Strongly disagree 3Total 100
Total may not sum to 100% due to rounding.*Sub-sample based on those who had contact with a GRx support person and who gave a rating.*Non responses have been removed from these results.
KPI 6: Participants are aware of and understand the benefits of physical activityEighty-one percent of patients feel that as a result of their GRx, they now understand the benefits of physical activity. Just five percent feel this is not the case.
Table 7: KPI 6 Indicator: Minimum of 80% of GRx participants are aware of and understand the benefits of physical activity
Q22f. Now thinking about the service and support you received, please indicate how strongly you agree or disagree with each of these statements… As a result of receiving a GRx, I now understand the benefits of physical activity
TotalBase = 2632*
%Strongly agree 43Agree 38Neither agree nor
disagree 13Disagree 3Strongly disagree 2Total 100
Total may not sum to 100% due to rounding.*Sub-sample based on those who had contact with a GRx support person and who gave a rating.*Non responses have been removed from these results.
Research New Zealand | June 2016

KPI 7: Participants have noticed positive health changes since being more activeSeventy-three percent of participants have noticed positive health changes since taking part in the GRx initiative.
Table 8: KPI 7 Indicator: Minimum of 70% of GRx participants have noticed positive health changes
Q5. Have you noticed any positive changes in your health since you were first issued a GRx?
TotalBase = 2795*
%Yes 73No 15Don’t
know/unsure 12Total 100
Total may not sum to 100% due to rounding.*Sub-sample based on those respondents who answered this question.*Non response have been removed from these results.
KPI 8: Participants are supported to sustain behaviour changesWhen patients return to their GP or practice nurse, 80 percent say they are being encouraged to continue their GRx activities unchanged.
Table 9: KPI 8 Indicator: Minimum of 75% of GRx participants are encouraged to continue physical activity by their referrer
Q9. When the doctor/practice nurse discussed your GRx with you, did he/she...
TotalBase = 925*
%Stop your GRx activities 1Encourage you to change your
GRx activities 18Encourage you to continue your
GRx activities unchanged 80Total 100
Total may not sum to 100% due to rounding.*Sub-sample based on those whom doctor/practice nurse has discussed their GRx with.*Non response have been removed from these results.
Research New Zealand | June 2016
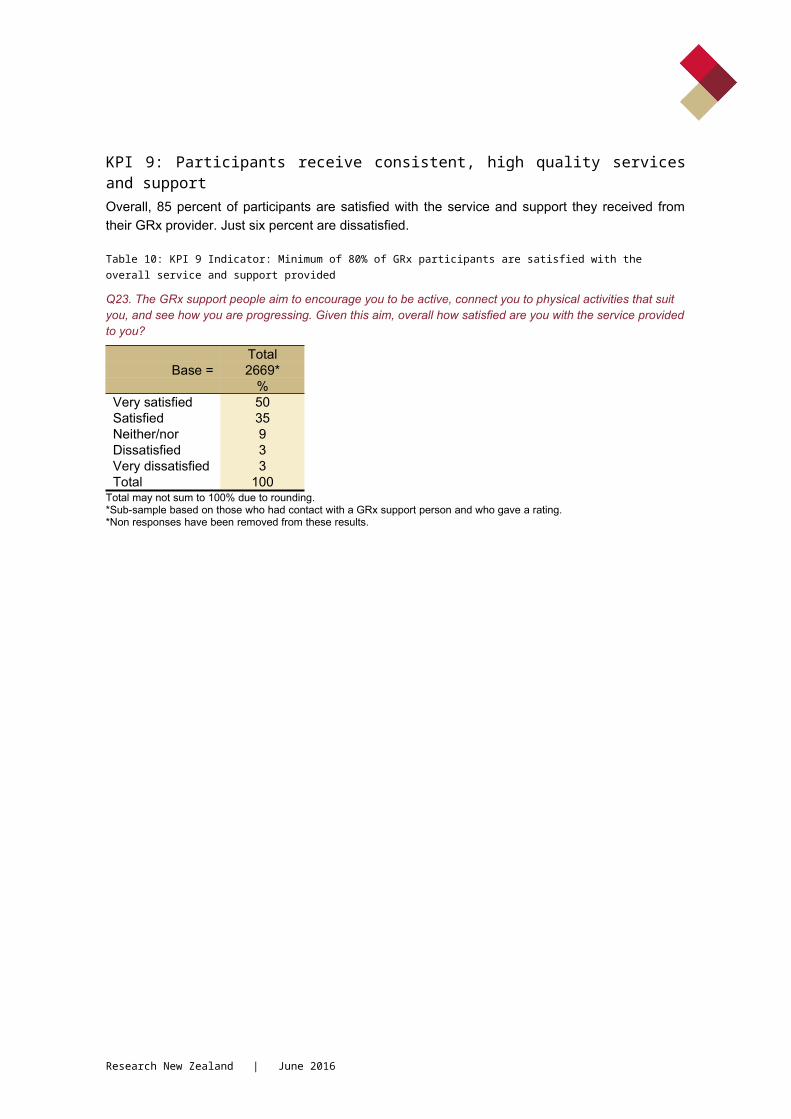
KPI 9: Participants receive consistent, high quality services and supportOverall, 85 percent of participants are satisfied with the service and support they received from their GRx provider. Just six percent are dissatisfied.
Table 10: KPI 9 Indicator: Minimum of 80% of GRx participants are satisfied with the overall service and support provided
Q23. The GRx support people aim to encourage you to be active, connect you to physical activities that suit you, and see how you are progressing. Given this aim, overall how satisfied are you with the service provided to you?
TotalBase = 2669*
%Very satisfied 50Satisfied 35Neither/nor 9Dissatisfied 3Very
dissatisfied 3Total 100
Total may not sum to 100% due to rounding.*Sub-sample based on those who had contact with a GRx support person and who gave a rating.*Non responses have been removed from these results.
Research New Zealand | June 2016

2.0 Introduction
2.1 BackgroundThis report presents the findings from the 17th annual monitor of the Green Prescription (GRx) initiative. The Ministry commissioned Research New Zealand to undertake the research in March, April and May 2016.
Responsibility for the GRx initiative, including GRx Active Families, was transferred from SPARC to the Ministry in July 2009. Funding and management of the initiative was subsequently devolved to district health boards (DHBs) in July 2012.
2.2 ObjectivesThe main objectives of the Green Prescription monitoring research are to allow the Ministry to:
1. Report against performance targets in respect of the GRx initiative.
2. Monitor the level of satisfaction with the GRx patient support service.
3. Monitor the impact of GRx in relation to any changes in physical activity of GRx patients.
4. Report on changes to patients’ health and dietary habits since their GRx was issued.
5. Provide feedback to DHBs, the GRx contract holders, GPs and nurses who are prescribing GRx.
6. Provide the Ministry with supporting information for liaison with other Government and non-Government agencies.
Research New Zealand | June 2016
2.3 MethodologyThe research was conducted as a hybrid self-completion paper-based, telephone and online survey in March, April and May 2016. The population of interest for this survey is GRx patients who had contact with a contract holder over the six months from July-December 2015.
Each GRx contract holder forwarded its patient list to Research New Zealand, identifying a total population of N=18,849 eligible GRx patients. Sampling for the survey was undertaken in three stages. Initially larger contract holders with greater than 700 patients were separated from smaller contract holders. A sample of n=2,440 Māori and Pacific patients was randomly selected from the combined lists of the larger contract holders, proportional to the total number of Māori and Pacific patients on these lists. All patients with known contact details on the lists of smaller contractor holders (n=4,560) were then selected. The third stage of sampling involved selecting a random sample of n=3,000 non-Māori and Pacific patients from the remaining lists of the larger contract holders, proportional to the total number of non-Māori and Pacific patients put forward on each provider’s list.
On 7 March 2016, each selected patient was sent a letter on Ministry letterhead inviting them to participate, along with a paper copy of the survey (see Appendix A), and a reply-paid envelope. The letter introduced the survey and its purpose, and also gave instructions for completing the survey on paper or online.
On 30 March 2016, 4,657 patients who had not yet responded were sent a reminder letter and 1,052 were sent a reminder email from Research New Zealand. Commencing 30 April 2015, all Māori and Pacific patients, who had not yet responded, received a reminder call from Research New Zealand. This applied to n=1,973 Māori and Pacific patients and a randomly selected sample of n=960 non-Māori and Pacific patients. Of these, 1,478 were able to be contacted during the reminder call period (each was called a maximum of five times). The main surveying period ended on 15 May 2016.
Changes to the questionnaireThe Ministry, with the input of Research New Zealand, reviewed the 2015 questionnaire. For the 2016 survey, one additional question was added (Q1), surgery was added to the injury recovery category in Question 3 (injury/surgery recovery), pregnancy was added to Question 3, all references to doctor/practice nurse were replaced with referrer and family members was split between adults and children in Q22.
Research New Zealand | June 2016

2.3.1 Participation rateA total of n=2,843 valid, completed responses were received during the survey period (n=2,045 on paper, n=496 online, and n=302 by telephone). This represents a participation rate of 28.4 percent, compared to 27.1 last year, 28.6 percent in 2014 and 29.1 percent in 2013. Table 11, on page 16, shows the achieved sample and participation rate for each of the contract holders.
Attempts to increase participation in the survey included four activities:
1. The reminder letter and email.
2. The reminder phone calls targeted at all Māori and Pacific patients, as well as a randomly selected sample of non-responding non-Māori and Pacific patients.
3. The booster telephone interviews with randomly selected non-respondents from each providers list.
4. The use of a prize draw incentive - three prizes of $250 gift vouchers of the winners’ choice. This was publicised in the invitation letter, questionnaire and the reminder letter.
2.3.2 Weighting and analysisThis year’s results were weighted to be representative of the proportion of patients from each contract holder. This is to account for the different sampling criteria applied to large and small contract holders and for the differing participation rates across contract holders. The weighted results for the total sample in the 2016 survey have a maximum margin of error of plus or minus 1.8 percent, at the 95 percent confidence level.
Results for 2016 were tested for significant differences against the results from the 2015 survey. Results were also tested for significant differences against the demographic variables in the survey, and against the Deprivation Index rating. Wherever year-on-year percentages of 10 percent or greater are statistically significant, they have been commented on and can also be found highlighted in the Supplementary Tabulations in Appendix B. Where meaningful, statistically significant differences for results of greater than 10 percent for particular subgroups of GRx patients have also been commented on.
Research New Zealand | June 2016

Table 11: Population, sample, and participation rate for each GRx contract holder
Research New Zealand | June 2016

2016 2015 2014 2013
GRx contract holder
Eligible populati
onNumber Selected
Achieved
SampleParticipati
on rate
Maximum Margin of
ErrorParticipatio
n rateParticipatio
n rateParticipatio
n rate
Sport Northland 1624 639 162 25.4% 7.3 24.1% 24.6 29.9%
Sport Auckland - Auckland 2123 885 218 24.6% 6.3 21.5% 21.9 26.4%
Sport Auckland - Counties 2432 892 186 20.9% 6.9 28.1% 19.7 20.0%
Harbour Sport 1201 513 107 20.9% 9.1 24.3% 28.6 27.3%
HealthWest 564 530 140 26.4% 7.2 28.6% 31.9 20.9%
Sport Waikato 2495 750 192 25.6% 6.8 21.2% 29.3 30.6%
Sport Gisborne 449 442 128 29.0% 7.4 23.6% 27.0 31.7%
Sport Bay of Plenty 1495 678 195 29.0% 6.6 26.8% 28.3 34.9%
Sport Hawke's Bay 660 623 167 26.8% 6.6 21.9% 24.5 26.0%
Sport Taranaki 601 598 193 32.3% 5.8 28.7% 34.3 36.5%
Sport Whanganui 300 295 156 52.9% 5.5 43.8% 47.6 32.2%
Sport Manawatu 649 641 227 35.4% 5.3 43.9% 50.6 50.9%
Sport Wellington 925 603 168 27.9% 6.9 25.7% 24.4 24.1%
Nelson Bays PHO 370 342 120 35.1% 7.4 25.1% 26.5 31.3%
CWCST - Canterbury 1519 250 61 24.4% 12.4 31.8% 35.5 36.5%
CWCST - West Coast 293 230 72 31.3% 10.1 30.0% 30.6 31.5%
Sport Otago 426 422 114 27.0% 7.9 33.7% 24.9 28.7%
Sport Southland 499 448 158 35.3% 6.5 29.8% 27.1 27.2%Kimi Hauora Marlborough 224 219 79 36.1% 8.9 30.6% 35.4 22.9%
Research New Zealand | June 2016 17

PHO
Total 18,849 10,000 2,843 28.4% 1.8% 27.1% 28.6% 29.1%Note: Maximum margins of error have been adjusted to account for the eligible population size of respondents from each contract holder.
Research New Zealand | June 2016 18
3.0 Getting the Green PrescriptionIn this section, we examine when and why patients received a GRx, who referred them, and what, if any, advice they received on healthy eating.
Key findingsSixty-nine percent of patients were first referred to GRx by their GP/Doctor.
One third of this year’s patients were issued their first GRx more than eight months ago (33 percent). Just 15 percent had their first GRx issued in the last four months.
The main reasons for being issued a GRx continue to be: weight problems, high blood pressure or risk of stroke, arthritis, back pain or problems and stress.
Over two thirds reported they have received information on healthy eating
(68 percent).
Research New Zealand | June 2016

3.1 Green Prescription Referral SourceMore than two thirds of all patients (69 percent) were first referred to GRx by their GP/Doctor, while 15 percent were first referred by a Practice Nurse and three percent by a Specialist Doctor (Figure 1). There were no referrals from Lead Maternity Carers.
Figure 1: Green Prescription Referral Source
Q1. Who first referred you to Green Prescription (GRx) for support?
69%
3%
15%
0%
6%
7%
1%
0% 10% 20% 30% 40% 50% 60% 70% 80%
GP/Doctor
Specialist Doctor
Practice Nurse
Maternity Carer/Midwife
Someone else
Other
No Response
% of respondents
2016 (n=2843)
Research New Zealand | June 2016

One third (33 percent) of this year’s patients reported they were issued their first GRx more than eight months ago. Fifteen percent had their first GRx issued in the last four months, while the remaining patients were issued their first GRx between 4-6 months ago (30 percent) or 6-8 months ago (21 percent).
Figure 2: Time since first Green Prescription
Q2. When did your referrer first prescribe a Green Prescription (GRx) for you?
15%
30%
21%
33%
1%
11%
28%
23%
36%
2%
12%
27%25%
34%
2%
13%
31%
22%
32%
2%0%
10%
20%
30%
40%
50%
Less than 4 months ago 4-6 months ago 6-8 months ago Over 8 months ago Did not say
% o
f res
pond
ents
2016 (n=2843) 2015 (n=2709) 2014 (n=2858) 2013 (n=2907)
Total may not sum to 100% due to rounding.
Significant differences The following significant differences were observed for the 2016 results (see Appendix B for supplementary tabulations):
Age:
Patients aged 65 plus were more likely to report their referrer first prescribed a GRx for them more than eight months ago (38 percent compared to 33 percent overall).
Employment Status:
Patients working full-time were more likely to report their referrer first prescribed a GRx for them four to six months ago (35 percent compared to 30 percent overall), while they were less likely to report it was more than eight months ago (27 percent compared to 33 percent overall).
Research New Zealand | June 2016

Contract holder:
Patients from HealthWest and Sport Whanganui were more likely to report their referrer first prescribed a GRx for them more than eight months ago (69 percent and 65 percent, respectively, compared with 33 percent overall).
Patients from Nelson Bays Primary Health and Sport Otago were more likely to report their referrer first prescribed a GRx for them less than four months ago (25 percent respectively, compared with 15 percent overall).
Research New Zealand | June 2016

3.2 Main reasons for Green PrescriptionWhen patients were asked to identify the main reasons they were issued a GRx, 53 percent reported it was because of weight problems (Figure 3). Other common reasons included: high blood pressure or risk of stroke (25 percent), arthritis (22 percent), back pain or problems (22 percent) and stress (20 percent).
Figure 3: Main reasons for GP issuing Green Prescription
Q3. What were the main reasons you required a GRx for support to be more active?
53%
25%
18%
22%
22%
13%
17%
20%
17%
14%
16%
11%
5%
4%
5%
4%
56%
26%
21%
23%
22%
23%
14%
20%
17%
15%
17%
17%
14%
13%
11%
7%
5%
2%
6%
54%
28%
22%
25%
23%
11%
17%
20%
18%
15%
16%
13%
10%
6%
5%
3%
5%
53%
29%
23%
23%
23%
22%
19%
16%
15%
14%
10%
6%
5%
5%
5%
0% 10% 20% 30% 40% 50% 60%
Weight problems
High blood pressure/risk of stroke
High cholesterol
Arthritis
Back pain or problems
Diabetes*
Pre-diabetes/risk of diabetes**
Diagnosed type 2 diabetes**
Stress
To relieve depression/anxiety
Asthma/breathing problems
Sleep problems
Heart problems
Injury/surgery recovery⁺Injury recovery⁺⁺
Fall prevention
Osteoporosis
Stop smoking
Other
% of respondents noticing changes
2016 (n=2843) 2015 (n=2709) 2014 (n=2858) 2013 (n=2907)
Total may exceed 100% because of multiple response. *Category “diabetes” as stand alone was deleted in 2014**Categories pre-diabetes and diagnosed type 2 diabetes was added in 2014.⁺Category “injury/surgery recovery” was added in 2016.⁺⁺Category “injury recovery” was deleted in 2016.
Research New Zealand | June 2016

Table 12: Main reasons for GP issuing Green Prescription 2013-2015
Q2. What were the main reasons you required a GRx for support to be more active?
2016 2015 2014 2013Base= 2843 2709 2858 2907
% % % %Weight problems 53 56 54 53High blood pressure/risk of stroke 25 26 28 29Arthritis 22 23 25 23Back pain or problems 22 22 23 23To relieve stress 20 17 20 22High cholesterol 18 21 22 23Diagnosed type 2 diabetes** 17 20 17 -To relieve depression/anxiety 17 15 18 19Sleep problems 16 17 16 15Asthma/breathing problems 14 17 15 16Pre-diabetes/risk of diabetes** 13 14 11 -Injury/surgery recovery^ 13 - - -Injury recovery⁺⁺⁺ - 11 10 10Heart problems 11 14 13 14Stop smoking 5 5 4 5Fall prevention 5 7 6 6Osteoporosis 4 5 5 5General fitness 3 1 2 2Pregnancy^^ 1 - - -Cancer⁺⁺ - 3 3 2Surgery recovery⁺⁺⁺ - 2 2 2Diabetes⁺ - - - 23Fibromyalgia*** - 1 - -Other 4 6 5 5Did not say/No response 7 3 8 3Total may exceed 100% because of multiple response. ⁺Category “diabetes” deleted in 2014. ⁺⁺Category “cancer” deleted in 2016.⁺⁺⁺Category “surgery recovery” and “injury recovery” deleted in 2016.**Categories pre-diabetes/risk of diabetes and diagnosed type 2 diabetes added in 2014.***Coded from other specify response^Category “injury/surgery recovery” added in 2016.^^Category “pregnancy” added in 2016.
Research New Zealand | June 2016

Significant differences The following significant differences were observed for the 2016 survey results:
Research New Zealand | June 2016

Age:
Patients aged under 25 years were more likely to report they were issued a GRx because of weight problems (72 percent compared with 53 percent overall) and/or depression and anxiety (42 percent compared with 17 percent overall).
Patients aged 25–34 years old were more likely to report they were issued a GRx because of weight problems (68 percent compared with 53 percent overall) and/or depression (27 percent compared with 17 percent overall).
Patients aged 35-49 years old were more likely to report they were issued a GRx because of weight problems (66 percent compared with 53 percent overall), stress (25 percent compared with 20 percent overall) and/or depression (22 percent compared to 17 percent overall).
Patients aged 65 plus were more likely to report they were issued a GRx because of arthritis (35 percent compared with 22 percent overall), high blood pressure/risk of stroke (30 percent compared with 25 percent overall), and/or diagnosed with type 2 diabetes (21 percent compared with 17 percent overall).
In contrast, patients aged 65 plus were less likely to report they were prescribed a GRx because of weight problems (36 percent compared with 53 percent overall), stress (12 percent compared to 20 percent overall) and/or sleep problems (12 percent compared with 16 percent overall).
Gender:
Males were more likely to report they were issued a GRx because they had been diagnosed as having type 2 diabetes (22 percent compared with 17 percent overall).
Ethnicity:
Māori were more likely to report they were issued a GRx because of weight problems (65 percent compared with 53 percent overall), stress (25 percent compared to 20 percent overall), sleep problems (21 percent compared to 16 percent overall) and/or asthma/breathing problems (19 percent compared to 14 percent overall).
Pacific patients were more likely to report they were issued a GRx because of weight problems (64 percent compared to 53 percent), high blood pressure/risk of stroke (34 percent compared to 25 percent), high cholesterol (25 percent compared to 18 percent overall) and/or diagnosed type 2 diabetes (25 percent compared to 17 percent overall).
Research New Zealand | June 2016

Education:
Patients who had no tertiary qualification were more likely to report they were issued a GRx because of arthritis (26 percent compared to 22 percent), high cholesterol (23 percent compared to 18 percent overall), diagnosed type 2 diabetes (23 percent compared to 17 percent overall), asthma/breathing problems (20 percent compared to 14 percent overall) and/or sleep problems (20 percent compared to 16 percent overall).
NZDep Index:
Patients living in areas classified as being most deprived were more likely to report being issued a GRx for weight problems (61 percent compared to 53 percent), back pain or problems (25 percent compared to 22 percent) and/or sleep problems (19 percent compared to 16 percent overall).
Employment status:
Patients working full time were more likely to say they were issued a GRx because of weight problems (63 percent compared to 53 percent) and/or pre-diabetes/risk of diabetes (18 percent compared to 13 percent overall).
Unemployed patients were more likely to say they were issued a GRx because of weight problems (63 percent compared to 53 percent) and/or depression (27 percent compared to 17 percent overall).
Retired patients were more likely to report they were issued a GRx because of arthritis (34 percent compared with 22 percent overall), asthma/breathing problems (19 percent compared to 14 percent overall), heart problems (17 percent compared with 11 percent overall) or fall prevention (12 percent compared with five percent overall).
Sickness or invalid beneficiaries were more likely to report they were issued a GRx because of back pain or problems (36 percent compared with 22 percent overall), stress (33 percent compared to 20 percent), depression or anxiety (31 percent compared with 17 percent overall), sleep problems (25 percent compared with 16 percent overall), asthma or breathing problems (24 percent compared with 14 percent overall) and/or heart problems (17 percent compared with 11 percent overall).
Community Services Card:
Patients who have Community Services Cards were more likely to report they were issued a GRx because of back pain or problems (28 percent compared to 22 percent overall), stress (26 percent compared to 20 percent overall), arthritis (26 percent compared to 22 percent overall), depression (23 percent
Research New Zealand | June 2016

compared to 17 percent overall), sleep problems (20 percent compared to 16 percent overall) and/or asthma or breathing problems (18 percent compared with 14 percent overall).
Disability:
Patients with a long-term disability or impairment were more likely to report they were issued a GRx because of arthritis (33 percent compared with 22 percent overall), back pain or problems (31 percent compared with 22 percent overall), depression (21 percent compared to 17 percent overall), asthma/breathing problems (20 percent compared to 14 percent overall), injury recovery (18 percent compared with 13 percent overall) and/or heart problems (14 percent compared to 11 percent overall).
Contract holder:
Patients from Sport Auckland - Auckland were more likely to report they were issued a GRx for stress (32 percent compared with 20 percent overall) and/or sleep problems (25 percent compared to 16 percent overall).
Patients from Sport Auckland - Counties were more likely to report they were issued a GRx for weight problems (63 percent compared with 53 percent overall) and/or diagnosed type 2 diabetes (25 percent compared to 17 percent overall).
Patients from HealthWest were more likely to report they were issued a GRx for diagnosed type 2 diabetes (27 percent compared with 17 percent overall).
Patients from Sport Gisborne Tairawhiti were more likely to report they were issued a GRx for heart problems (23 percent compared to 11 percent overall).
Patients from Sport Whanganui were more likely to report they were issued a GRx for arthritis (37 percent compared with 22 percent overall).
Patients from Sport Otago were more likely to report they were issued a GRx for depression (30 percent compared with 17 percent overall).
Patients from Sport Taranaki were more likely to report they were issued a GRx for asthma/breathing problems (24 percent compared with 14 percent overall).
Patients from Sport Bay of Plenty were more likely to report they were issued a GRx for weight problems (62 percent compared with 53 percent overall).
Research New Zealand | June 2016

3.2.2 Profile of selected reasons for GRxThis sub-section profiles different types of GRx patients, according to the reason why their GRx was issued.
Weight Problems:
53 percent of patients were issued a GRx to help with their weight problem.
Many of these patients also had high blood pressure or risk of stroke (32 percent), stress (27 percent), arthritis (23 percent), back pain or problems (23 percent), high cholesterol (23 percent), and/or depression (23 percent).
The main types of activity recommended for these patients were walking (74 percent), swimming (58 percent), water/pool exercises (48 percent) and/or gym exercises (45 percent).
72 percent of these patients have noticed positive changes in their health.
59 percent of these patients are now spending more time being active.
72 percent of these patients have received advice on healthy eating.
78 percent have made changes to their diet since getting their GRx.
75 percent are female.
53 percent have secondary education or no qualifications.
47 percent are aged 45-64 years. Another 32 percent are aged under 45.
42 percent have a long-term disability or impairment.
52 percent are of European descent, 34 percent are Māori and 16 percent are Pacific people.
53 percent have a Community Services Card.
52 percent live in areas with the highest deprivation.
High Blood Pressure/Risk of Stroke:
25 percent of patients were issued a GRx because they had high blood pressure or were at risk of stroke.
Research New Zealand | June 2016
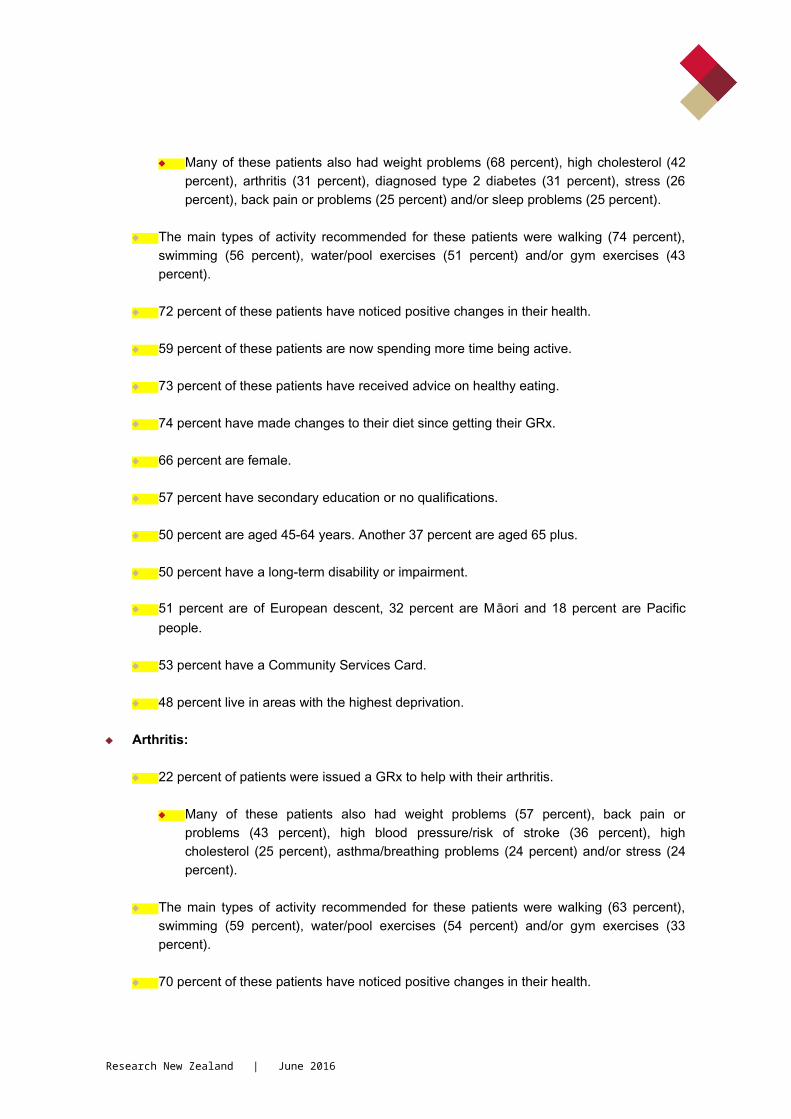
Many of these patients also had weight problems (68 percent), high cholesterol (42 percent), arthritis (31 percent), diagnosed type 2 diabetes (31 percent), stress (26 percent), back pain or problems (25 percent) and/or sleep problems (25 percent).
The main types of activity recommended for these patients were walking (74 percent), swimming (56 percent), water/pool exercises (51 percent) and/or gym exercises (43 percent).
72 percent of these patients have noticed positive changes in their health.
59 percent of these patients are now spending more time being active.
73 percent of these patients have received advice on healthy eating.
74 percent have made changes to their diet since getting their GRx.
66 percent are female.
57 percent have secondary education or no qualifications.
50 percent are aged 45-64 years. Another 37 percent are aged 65 plus.
50 percent have a long-term disability or impairment.
51 percent are of European descent, 32 percent are Māori and 18 percent are Pacific people.
53 percent have a Community Services Card.
48 percent live in areas with the highest deprivation.
Arthritis:
22 percent of patients were issued a GRx to help with their arthritis.
Many of these patients also had weight problems (57 percent), back pain or problems (43 percent), high blood pressure/risk of stroke (36 percent), high cholesterol (25 percent), asthma/breathing problems (24 percent) and/or stress (24 percent).
The main types of activity recommended for these patients were walking (63 percent), swimming (59 percent), water/pool exercises (54 percent) and/or gym exercises (33 percent).
70 percent of these patients have noticed positive changes in their health.
Research New Zealand | June 2016

55 percent of these patients are now spending more time being active.
66 percent of these patients have received advice on healthy eating.
65 percent have made changes to their diet since getting their GRx.
76 percent are female.
58 percent have secondary education or no qualifications.
49 percent are aged 65 plus. Another 44 percent are aged 45-64 years.
66 percent have a long-term disability or impairment.
64 percent are of European descent, 24 percent are Māori and 13 percent are Pacific people.
61 percent have a Community Services Card.
47 percent live in areas with the highest deprivation.
High Cholesterol:
18 percent of patients were issued a GRx because they had high cholesterol.
Many of these patients also had weight problems (69 percent), high blood pressure or risk of stroke (59 percent), stress (32 percent), diagnosed type 2 diabetes (31 percent), arthritis (30 percent), and/or back pain or problems (30 percent).
The main types of activity recommended for these patients were walking (75 percent), swimming (59 percent), water/pool exercises (53 percent) and/or gym exercises (46 percent).
72 percent of these patients have noticed positive changes in their health.
58 percent of these patients are now spending more time being active.
78 percent of these patients have received some advice on healthy eating.
79 percent have made changes to their diet since getting their GRx.
68 percent are female.
56 percent have secondary education or no qualifications.
Research New Zealand | June 2016
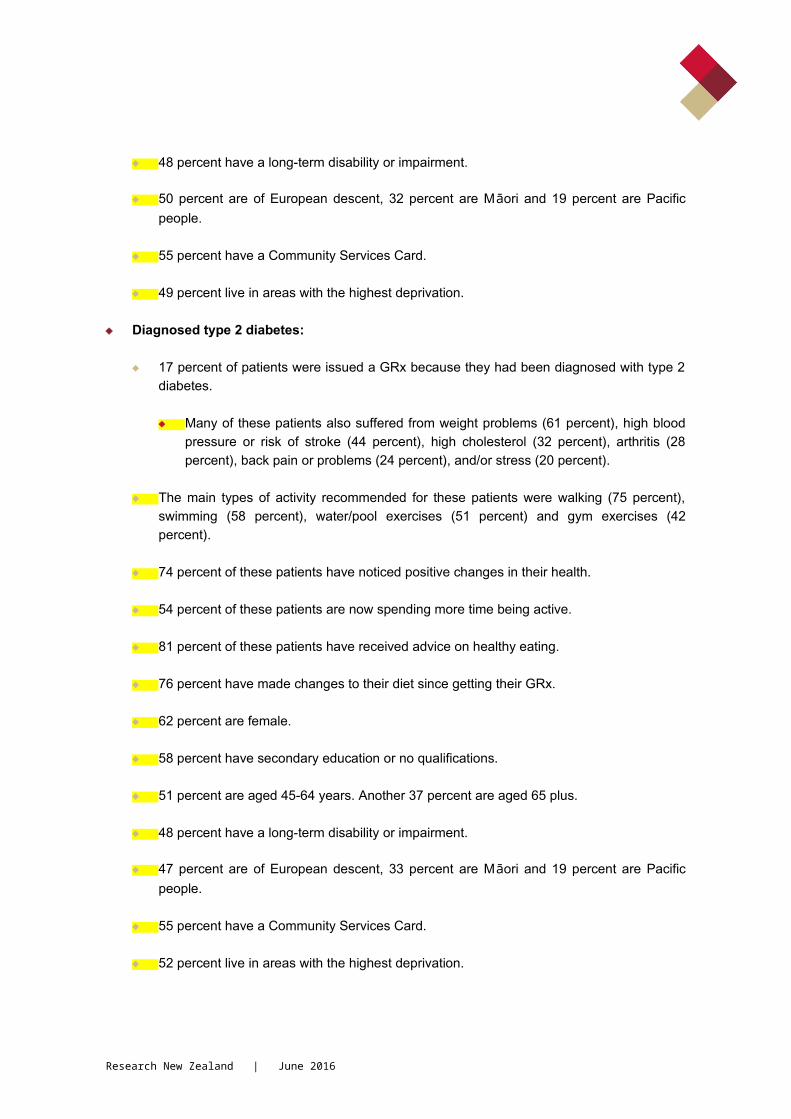
51 percent are aged 45-64 years. Another 33 percent are aged 65 plus.
48 percent have a long-term disability or impairment.
50 percent are of European descent, 32 percent are Māori and 19 percent are Pacific people.
55 percent have a Community Services Card.
49 percent live in areas with the highest deprivation.
Diagnosed type 2 diabetes:
17 percent of patients were issued a GRx because they had been diagnosed with type 2 diabetes.
Many of these patients also suffered from weight problems (61 percent), high blood pressure or risk of stroke (44 percent), high cholesterol (32 percent), arthritis (28 percent), back pain or problems (24 percent), and/or stress (20 percent).
The main types of activity recommended for these patients were walking (75 percent), swimming (58 percent), water/pool exercises (51 percent) and gym exercises (42 percent).
74 percent of these patients have noticed positive changes in their health.
54 percent of these patients are now spending more time being active.
81 percent of these patients have received advice on healthy eating.
76 percent have made changes to their diet since getting their GRx.
62 percent are female.
58 percent have secondary education or no qualifications.
51 percent are aged 45-64 years. Another 37 percent are aged 65 plus.
48 percent have a long-term disability or impairment.
47 percent are of European descent, 33 percent are Māori and 19 percent are Pacific people.
55 percent have a Community Services Card.
Research New Zealand | June 2016

52 percent live in areas with the highest deprivation.
Research New Zealand | June 2016

Pre-diabetes/risk of diabetes:
13 percent of patients were issued a GRx because they had been identified as pre-diabetic or at risk of diabetes.
Many of these patients also had weight problems (71 percent), high blood pressure or risk of stroke (40 percent), high cholesterol (32 percent), sleep problems (25 percent) and/or stress (25 percent).
The main types of activity recommended for these patients were walking (75 percent), swimming (57 percent), water/pool exercises (49 percent) and/or gym exercises (46 percent).
75 percent of these patients have noticed positive changes in their health.
66 percent of these patients are now spending more time being active.
79 percent of these patients have received advice on healthy eating.
81 percent have made changes to their diet since getting their GRx.
73 percent are female.
50 percent have secondary education or no qualifications.
52 percent are aged 45-64 years. Another 27 percent are aged under 45.
35 percent have a long-term disability or impairment.
49 percent are of European descent, 34 percent are Māori and 17 percent are Pacific people.
49 percent have a Community Services Card.
44 percent live in areas with the highest deprivation.
Stress:
20 percent of patients were issued a GRx to help with stress.
Many of these patients also had weight problems (71 percent), depression or anxiety (53 percent), sleep problems (45 percent), back pain or problems (37percent) and/or high blood pressure or risk of stroke (33 percent).
Research New Zealand | June 2016

The main types of activity recommended for these patients were walking (75 percent), swimming (62 percent), gym exercises (52 percent) and water/pool exercises (51 percent).
71 percent of these patients have noticed positive changes in their health.
60 percent of these patients are now spending more time being active.
70 percent of these patients have received advice on healthy eating.
75 percent have made changes to their diet since getting their GRx.
75 percent are female.
54 percent have secondary education or no qualifications.
50 percent are aged 45-64 years. Another 31 percent are aged under 45 years.
48 percent have a long-term disability or impairment.
53 percent are of European descent, 35 percent are Māori, and 17 percent are Pacific people.
65 percent have a Community Services Card.
53 percent live in areas with the highest deprivation.
Depression/Anxiety:
17 percent of patients were issued a GRx to help with depression or anxiety.
Many of these patients also suffer from weight problems (69 percent), stress (62 percent), sleep problems (39 percent), back pain or problems (32 percent) and/or high blood pressure or risk of stroke (26 percent).
The main types of activity recommended for these patients were walking (74 percent), swimming (61 percent), water/pool exercises (51 percent) and gym exercises (49 percent).
71 percent of these patients have noticed positive changes in their health.
59 percent of these patients are now spending more time being active.
68 percent of these patients have received advice on healthy eating.
Research New Zealand | June 2016

71 percent have made changes to their diet since getting their GRx.
74 percent are female.
52 percent have secondary education or no qualifications.
44 percent are aged 45-64 years. Another 39 percent are aged under 45 years.
54 percent have a long-term disability or impairment.
60 percent are of European descent, 33 percent are Māori, and 12 percent are Pacific people.
66 percent have a Community Services Card.
50 percent live in areas with the highest deprivation.
To Stop Smoking:
Five percent of patients were issued a GRx to help stop smoking.
Many of these patients also had weight problems (71 percent), stress (58 percent), depression (46 percent), sleep problems (41 percent) and/or back pain or problems (39 percent).
The main types of activity recommended for these patients were walking (75 percent), swimming (61 percent), gym exercises (50 percent) and/or water/pool exercises (45 percent).
73 percent of these patients have noticed positive changes in their health.
56 percent of these patients are now spending more time being active.
66 percent of these patients have received advice on healthy eating.
72 percent have made changes to their diet since getting their GRx.
61 percent are female.
60 percent have secondary education or no qualifications.
50 percent are aged 45-64 years. 37 percent are aged under 45.
39 percent have a long-term disability or impairment.
Research New Zealand | June 2016

55 percent are Māori, 32 percent are of European descent and 26 percent are Pacific people.
72 percent have a Community Services Card.
55 percent live in areas with the highest deprivation.
Research New Zealand | June 2016

3.3 Advice received on healthy eatingAs detailed in Figure 4, 68 percent of patients reported they had received advice on healthy eating, which is unchanged from last year’s result.
Figure 4: Advice received on healthy eating (n=2843)
Q13. Have you received any specific advice on healthy eating?
eY s , 68%
oN , 28%
on t noD ' k w , 2% o re pon eN s s , 1%
2016 n 2843( = )
Total may not sum to 100% due to rounding.
Significant differences2 The following significant differences were observed for the 2016 survey results:
Ethnicity:
Mäori were more likely to have received specific advice on healthy eating (76 percent compared with 68 percent overall).
NZDep Index:
Patients living in areas classified as being most deprived were more likely to have received specific advice on healthy eating (73 percent compared to 68 percent overall).
2 Note: Where differences by a particular demographic characteristic are not noted (e.g. age or gender), this is due to their not being any statistically significant differences of note when viewed by that variable.
Research New Zealand | June 2016

Employment status:
Patients who mainly stay at home were more likely to have received specific advice on healthy eating (76 percent compared to 68 percent overall).
Patients were sickness/invalid beneficiaries were more likely to have received specific advice on healthy eating (76 percent compared to 68 percent overall).
Overall satisfaction
Satisfied patients were more likely to have received specific advice on health eating (73 percent compared to 68 percent overall), whereas neutral (37 percent) and dissatisfied (52 percent) patients were more likely to have not received such advice (28 percent overall).
Contract holder:
Patients from Sport Wellington (82 percent), Sport Southland (78 percent), Sport Manawatu, Sport Waikato and Sport Bay of Plenty (77 percent respectively) were more likely to report they had received advice on healthy eating (68 percent overall).
Patients from Sport Otago (46 percent), Sport Whanganui (44 percent) and Harbour Sport (43 percent) were more likely to have not received such advice (28 percent overall).
Research New Zealand | June 2016

4.0 Current status of Green PrescriptionThis section examines what has happened to patients in the time since their Green Prescription was issued. Specifically, whether patients are still following their GRx, reasons for not following it, any return visits they have made to the referrer and what happened at these subsequent visits.
Key findingsThirty-nine percent of patients report they are still following their GRx.
The main reasons given by those not following their GRx (either temporarily or permanently) continue to be: injury or health problems, lack of time due to work or family responsibilities and/or a lack of energy. Costs/financial reasons can also be a significant factor for some patients.
Just under half have returned to their referrer since being issued with a GRx (49 percent).
Of those who have returned, under two thirds discussed their GRx with their referrer (64 percent).
Of those who discussed their GRx, the majority say they were encouraged to continue with the current GRx (74 percent). The referrer mostly gave this advice verbally (as opposed to writing a new GRx) (60 percent).
Research New Zealand | June 2016

4.1 Current status of Green PrescriptionFigure 5 shows that 39 percent of patients this year reported they were still following their GRx, which is the same percentage as last year. Another 24 percent were doing physical activities different from their GRx. Sixteen percent said they were temporarily off their GRx and 16 percent were no longer following it.
Figure 5: Current status of Green Prescription
Q4. Are you currently...?
39%
24%
16% 16%
4%
39%
21%
15%18%
7%
39%
23%
17%14%
7%
39%
23%
16% 15%
7%
0%
10%
20%
30%
40%
50%
60%
Still following GRx Doing differentphysical activities
Temporarily off GRx No longer followingGRx
Did not say/Noresponse
% o
f res
pond
ents
2016 (n=2843) 2015 (n=2709) 2014 (n=2858) 2013 (n=2907)
Total may not sum to 100% due to rounding.
Significant differences The following significant differences were observed for the 2016 survey results:
Age:
Patients aged 65 plus were more likely to report they were still following their GRx activities (44 percent compared with 39 percent overall).
Ethnicity:
European patients were more likely to report they were still following their GRx activities (43 percent compared with 39 percent overall).
Research New Zealand | June 2016

Māori were more likely to report they were temporarily off their GRx physical activities (20 percent compared with 16 percent overall).
Employment status:
Patients working full-time were more likely to report they were doing physical activity but not the recommended GRx activities (29 percent compared with 24 percent overall).
Retired patients were more likely to report they were still following their GRx activities (45 percent compared with 39 percent overall).
Disability:
Patients with a long term disability were more likely to report they were temporarily off their GRx physical activities (21 percent compared with 16 percent overall).
Contract holder:
Patients from Marlborough PHO (58 percent), Sport Whanganui (53 percent) and Sport Bay of Plenty (49 percent) were more likely to still be following their GRx activities (39 percent overall).
Patients from Sport Southland were more likely to report they were doing physical activities but not the recommended GRx activities (34 percent compared with 24 percent overall).
Research New Zealand | June 2016
Reasons for being off Green PrescriptionThe main reason for not following their GRx (either temporarily or permanently) continues to be injury or health problems (cited by 30 percent of these patients).
Other impediments were due to lack of time due to work (22 percent), family responsibilities (20 percent), a lack of energy (19 percent) and/or cost/financial reasons (16 percent).
Table 13: Reasons for being off GRx
Q5. If you are temporarily off or no longer following the GRx physical activities, why is this?
2016 2015 2014 2013Base= 1005* 994* 1062* 870*
% % % %Injury/health problems 30 28 33 36Lack of time due to work 22 16 17 20Lack of time due to family responsibilities 20 17 19 21Lack of energy/too tired 19 13 17 20It costs too much/financial reasons^ 16 17 6 7It’s too hard to stick to a routine 11 10 11 12Just didn’t want to^ 7 6 6 7Issues with admin/paperwork (not helpful, no follow
up etc.) 5 3 3 4I’m too old 3 3 2 3I'm doing other physical activities (not GRx) 3 2 5 3Moved elsewhere^ 2 2 2 2The programme ran its course/wasn't renewed GRx 1 2 2 1Other 12 14 11 10Did not say/No response 7 11 10 2Total may exceed 100% because of multiple response. *Sub-sample based on those temporarily off or no longer on a GRx.^Category added to questionnaire in 2015. Previous year’s surveys the response was coded from the “other specify” responses. Therefore, comparisons with previous years’ surveys are indicative only due to this change.
Significant differences The following significant differences were observed for the 2016 survey results:
Age:
Patients aged 35 - 49 years old were more likely to report being temporarily off or no longer following their GRx because of a lack of time due to work commitments (36 percent compared to 22 percent overall) and a lack of time due to family responsibilities (33 percent compared with 20 percent overall).
Patients aged 65 plus were more likely to report being temporarily off or no longer following their GRx because of injury or health problems (40 percent compared with 30 percent overall).
Research New Zealand | June 2016

Research New Zealand | June 2016

Ethnicity:
Pacific patients were more likely to report being temporarily off or no longer following their GRx because of a lack of time due to family responsibilities (33 percent compared with 20 percent overall).
Employment status:
Patients working full-time and part-time were more likely to report being temporarily off or no longer following their GRx because of a lack of time due to work (55 percent and 39 percent respectively, compared with 22 percent overall).
Patients who mainly stay at home were more likely to report being temporarily off or no longer following their GRx because of a lack of time due to family responsibilities (39 percent compared with 20 percent overall).
Retired patients and sickness/invalid beneficiaries are more likely to report being temporarily off or no longer following their GRx because of injury or health problems (45 percent and 43 percent respectively, compared with 30 percent overall).
Disability:
Patients with a long-term disability or impairment were more likely to report being temporarily off or no longer following their GRx because of injury or health problems (42 percent compared with 30 percent overall).
Research New Zealand | June 2016
4.2 Return visits to referrer since Green PrescriptionJust under half of patients said they had returned to their referrer since being issued with a GRx (Figure 6). Which is a significant decrease from last year’s result of 68 percent.
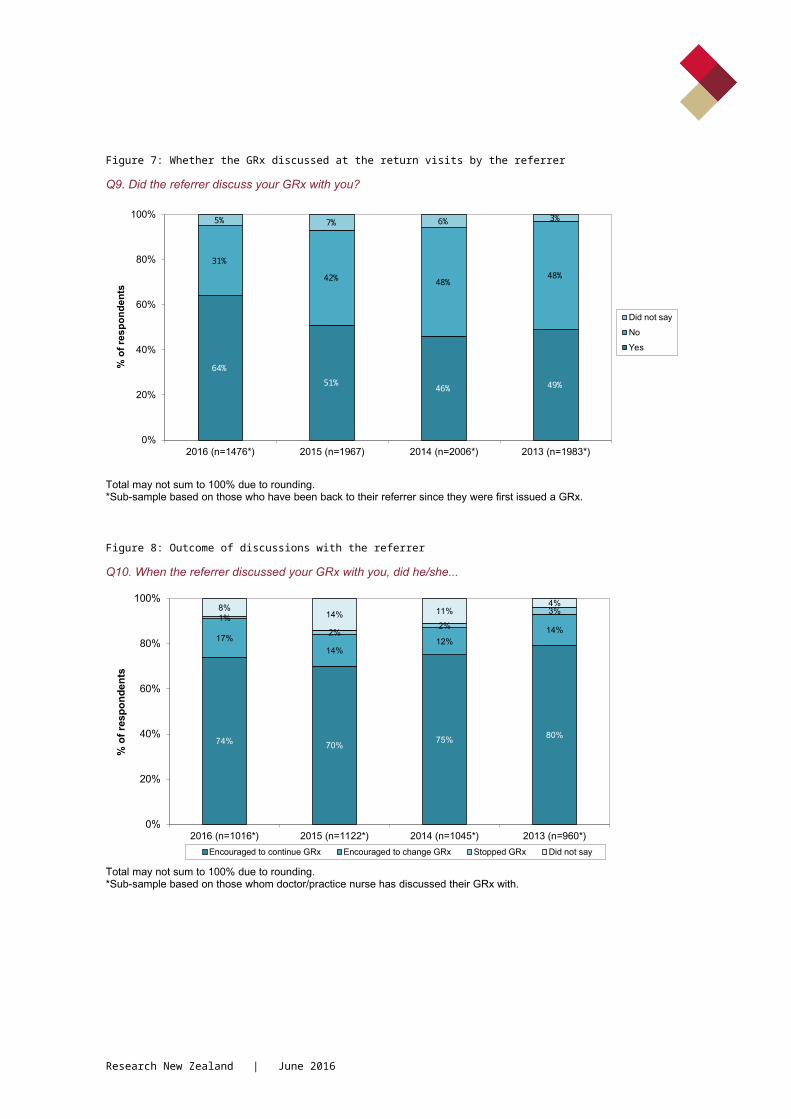
Of those who had returned, under two thirds (64 percent) discussed their GRx with their referrer (Figure 7, overleaf).
Of those who discussed their GRx, 74 percent were encouraged to continue with their current GRx unchanged (Figure 8, overleaf).
If the referrer continued the GRx he/she mostly gave this advice verbally which is unchanged from last year (Figure 9, page 48). One quarter of patients (26 percent) whose referrer continued their GRx said their referrer had written a new GRx or extended their current GRx, which is up significantly from last year’s result of 21 percent.
Figure 6: Return visits to referrer since GRx was issued
Q8. Have you been back to your referrer since you were first issued a GRx?
49%
68% 68% 68%
50%
29% 30% 30%
2% 4% 2% 2%
0%
20%
40%
60%
80%
100%
2016 (n=2843) 2015 (n=2709) 2014 (n=2858) 2013 (n=2907)
% o
f res
pond
ents
Did not say
No
Yes
Total may not sum to 100% due to rounding.
Research New Zealand | June 2016

Figure 7: Whether the GRx discussed at the return visits by the referrer
Q9. Did the referrer discuss your GRx with you?
64%
51%46% 49%
31%
42% 48%48%
5% 7% 6% 3%
0%
20%
40%
60%
80%
100%
2016 (n=1476*) 2015 (n=1967) 2014 (n=2006*) 2013 (n=1983*)
% o
f res
pond
ents
Did not sayNoYes
Total may not sum to 100% due to rounding. *Sub-sample based on those who have been back to their referrer since they were first issued a GRx.
Figure 8: Outcome of discussions with the referrer
Q10. When the referrer discussed your GRx with you, did he/she...
74% 70% 75% 80%
17%14%
12%14%
1%2% 2%
3%8% 14% 11%4%
0%
20%
40%
60%
80%
100%
2016 (n=1016*) 2015 (n=1122*) 2014 (n=1045*) 2013 (n=960*)
% o
f res
pond
ents
Encouraged to continue GRx Encouraged to change GRx Stopped GRx Did not say
Total may not sum to 100% due to rounding. *Sub-sample based on those whom doctor/practice nurse has discussed their GRx with.
Research New Zealand | June 2016

Figure 9: How advice to continue or change GRx was given
Q11. When the referrer continued your GRx (either changed or unchanged), did he/she...
26%21% 23%
19%
60%
60% 59%63%
6%
2% 3% 5%
8%17% 15% 13%
0%
20%
40%
60%
80%
100%
2016 (n=1000*) 2015 (n=1100*) 2014 (n=1024*) 2013 (n=960*)
% o
f res
pond
ents
Wrote new/extend current GRx⁺ Verbal advice only Other Did not say
Total may not sum to 100% due to rounding. *Sub-sample based on those whose referrer had discussed their GRx with them.⁺Wording changed in 2014
Significant differences The following significant differences were observed for the 2016 survey results:
Age:
Patients aged 65 plus were more likely to have been back to their referrer since they were issued their GRx (54 percent compared with 49 percent overall).
Gender:
Male patients were more likely to have been back to their referrer since they were issued their GRx (55 percent compared with 49 percent overall).
Employment status:
Retired patients and sickness/invalid beneficiary patients were more likely to have been back to their referrer since they were issued their GRx (54 percent and 57 percent respectively, compared with 49 percent overall).
Research New Zealand | June 2016

Disability:
Patients with a long-term disability or impairment were more likely to report they had been back to their referrer since they were issued their GRx (57 percent compared with 49 percent overall).
Ethnicity:
Asian patients were more likely to report their referrer had discussed their GRx with them (81 percent compared with 64 percent overall).
Overall satisfaction:
Patients who were satisfied overall were more likely to report their referrer had discussed their GRx with them (69 percent compared with 64 percent overall).
Contract holder:
Patients from Sport Whanganui and HealthWest were more likely to report they have been back to the doctor since they were first issued a GRx (79 percent and 61 percent respectively, compared with 49 percent overall).
Patients from Sport Manawatu were less likely to report they have been back to their referrer since they were first issued a GRx (39 percent compared with 49 percent overall).
Patients from Sport Whanganui were more likely to report their referrer wrote them a new, or extended their current GRx (64 percent compared with 26 percent overall).
Research New Zealand | June 2016

5.0 Changes resulting from the GRxPositive changes in patients’ health, diet and activity levels are key to the success of the GRx initiative. This section examines these changes, as well as whether patients are encouraging others to be more active since being issued with a GRx.
Key findingsSeventy-two percent of patients report they have noticed positive changes in their health since they were first issued with a GRx: 3
The main changes that these patients noticed were feeling fitter or stronger, generally feeling better, weight loss, more energy, breathing easier, and feeling less stressed.
Overall, 61 percent of patients say they were spending more time being active now, compared with before their GRx was issued.
Of those who were issued their GRx 6-8 months ago, 61 percent report they are spending more time being active now. Of those who were issued their GRx more than eight months ago, 59 percent say they are spending more time being active now.
The main reason given for spending less time being active are illness/injury/health problems.
Sixty-five percent of patients say they have also encouraged others to be more active as a result of their Green Prescription.
Seventy percent of patients report they have also made changes to their diet since being prescribed their GRx.
The most common types of changes include: having less sugar, sugary foods and soft-drinks, eating less junk food or generally eating more healthily, drinking more water, eating smaller meals or eating less, and eating more vegetables.
3 Note: The KPIs as detailed in the Executive Summary exclude those respondents who did not answer a particular question for some reason. However, in the body of the report non-responses are included. While this has been done to maintain consistency with how the survey has historically been reported, it does result in some discrepancies between figures in the Executive Summary and those reported in the chapters that follow (for example the percentage of patients noting positive changes in their health since they were first issued with a GRx).
Research New Zealand | June 2016

5.1 Positive changes in healthSeventy-two percent of patients said they had noticed positive changes in their health since they were first issued with a GRx, which is up from 69 percent last year (Figure10).
Of those noticing changes, 55 percent said they felt fitter or stronger (which is up significantly from 51 percent last year), 55 percent felt generally better (up significantly from 47 percent last year), 48 percent had lost weight (up significantly from 43 percent last year), 45 percent had more energy (also up significantly from 40 percent last year) and 34 percent were breathing easier (Figure 11).
Figure 10: Whether positive changes in health have been noticed since first GRx
Q6. Have you noticed any positive changes in your health since you were first issued a GRx?
72% 69% 72% 72%
15%15% 14% 13%
11%11% 11% 12%
2% 5% 3% 3%
0%
20%
40%
60%
80%
100%
2016 (n=2843) 2015 (n=2709) 2014 (n=2858) 2013 (n=2907)
% o
f res
pond
ents
Did not sayDon’t knowNoYes
Total may not sum to 100% due to rounding.
Research New Zealand | June 2016
Figure 11: Health changes noticed
Q7. If yes, what positive changes have you noticed?
55%
55%
48%
45%
34%
34%
30%
26%
29%
19%
20%
21%
14%
17%
14%
12%
11%
n/a
4%
51%
47%
43%
40%
33%
29%
25%
22%
21%
18%
16%
15%
13%
14%
9%
7%
7%
n/a
3%
57%
53%
46%
42%
33%
30%
27%
22%
22%
19%
17%
18%
14%
12%
10%
8%
8%
n/a
4%
0% 10% 20% 30% 40% 50% 60%
Feel stronger/fitter
Generally feel better
Lost weight
More energy
Breathing easier
Less stressed
Sleeping better
Less joint pain/discomfort
Increased mobility
Lower blood pressure
Feel less depressed/anxious
Less back pain^
Lower cholesterol
Improved blood sugar levels
Better balance/fewer falls
Fewer illnesses
Less medication
Smoking less
Other
% of respondents noticing changes
2016 (n=2099*) 2015 (n=2056*) 2014 (n=2151*)
Total may exceed 100% because of multiple response. Note: 2013 results not shown due to insufficient space. *Sub-sample based on those who had noticed changes.
Significant differences The following significant differences were observed for the 2016 results:
Age:
Patients aged under 25 years were more likely to report they were had lost weight (65 percent compared with 48 percent overall), had more energy (61 percent compared with 45 percent overall) and/or were sleeping better (51 percent compared with 30 percent overall).
Patients aged 25-34 years were more likely to report they had more energy (62 percent compared with 45 percent overall), had lost weight (60 percent
Research New Zealand | June 2016

compared with 48 percent overall), were feeling less stressed (48 percent compared with 34 percent overall) and/or sleeping better (43 percent compared with 30 percent overall).
Patients aged 35-49 years were more likely to report they had lost weight (55 percent compared with 48 percent overall) and/or were feeling less stressed (40 percent compared with 34 percent overall).
Patients aged 50-64 years were more likely to report they had less joint pain or discomfort (31 percent compared with 26 percent overall), they had lower blood pressure (24 percent compared with 19 percent overall) and/or had lower cholesterol (19 percent compared with 26 percent overall).
Ethnicity:
Mäori patients were more likely to report they were breathing easier (48 percent compared with 34 percent overall), feeling less stressed (40 percent compared with 34 percent), sleeping better (36 percent compared with 30 percent overall) and/or feeling less depressed or anxious (27 percent compared with 20 percent).
Pacific patients were more likely to report they had lost weight (61 percent compared with 48 percent), had more energy (55 percent compared with 45 percent overall), were breathing easier (45 percent compared with 34 percent), sleeping better (45 percent compared with 30 percent overall) and/or had lower blood pressure (31 percent compared with 19 percent overall).
Employment status:
Unemployed patients were more likely to report they were breathing easier (50 percent compared with 34 percent overall), were less stressed (49 percent compared with 34 percent overall) and/or had lower blood pressure (30 percent compared with 19 percent overall).
NZDep Index:
Patients living in areas classified as being least deprived were more likely to report they were feeling stronger or fitter (63 percent compared with 55 percent overall).
Patients living in areas classified as being most deprived were more likely to report they were breathing easier (40 percent compared with 34 percent overall).
Disability:
Research New Zealand | June 2016

Patients with a long-term disability or impairment were more likely to report they had increased mobility (34 percent compared to 29 percent overall).
Contract holder:
Patients from Sport Auckland - Auckland were more likely to report they were sleeping better (40 percent compared with 30 percent overall) and had less back pain (32 percent compared with 21 percent overall).
Patients from Sport Auckland - Counties were more likely to report having lower blood pressure (31 percent compared to 19 percent overall) and improved blood sugar levels (27 percent compared with 17 percent overall).
Patients from HealthWest were more likely to report they had improved blood sugar levels (27 percent compared to 17 percent overall) and lower cholesterol (26 percent compared with 14 percent overall).
Research New Zealand | June 2016
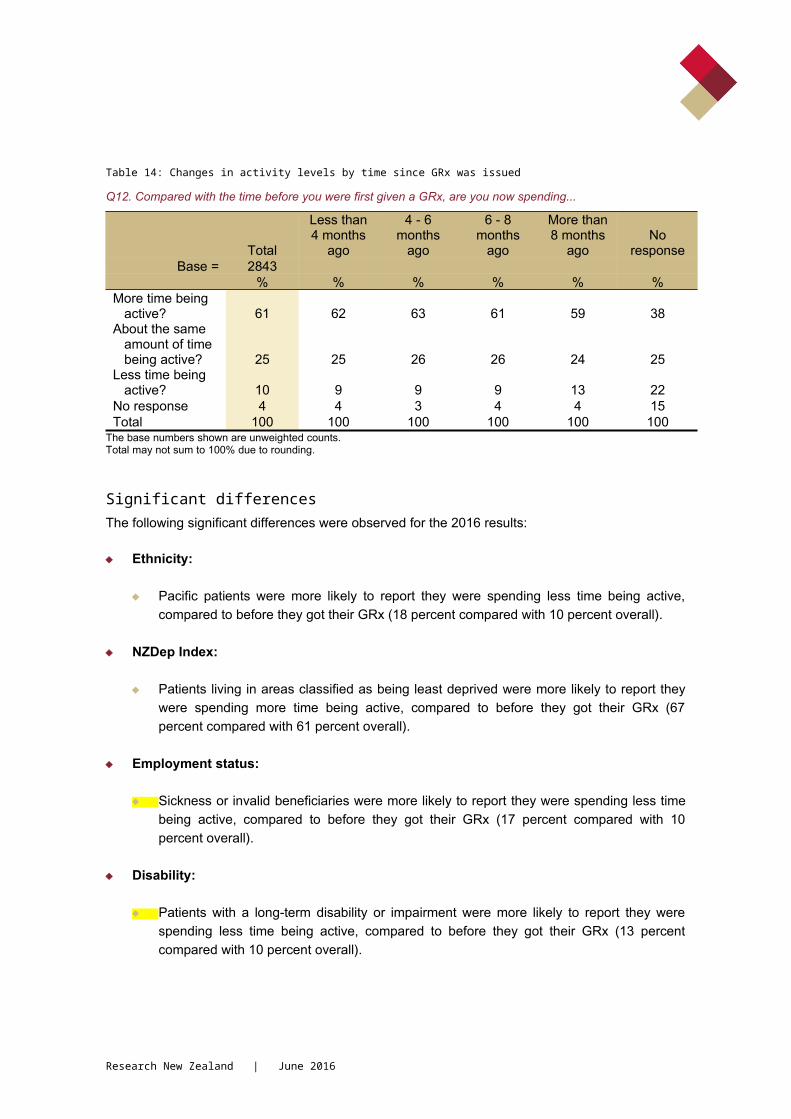
5.2 Changes in activity levelsOverall 61 percent of patients reported they were spending more time being active now, compared with before their GRx was issued. The remaining patients were either spending the same amount of time being active (25 percent) or less time (10 percent).
Table 14 shows the levels of activity broken down by the amount of time since the GRx was issued. For those who had a GRx issued 6-8 months ago, 61 percent reported they were spending more time being active. Fifty-nine percent of patients who had a GRx issued more than 8 months ago were also spending more time being active.
Patients’ reasons for spending the same or less time being active are given in sections and 5.2.2 overleaf.
Figure 12: Changes in activity levels since GRx was issued
Q12. Compared with the time before you were first prescribed a GRx, are you now spending...?
61% 58% 61% 61%
25%24%
24% 24%
10%11%
9% 9%
4% 8% 5% 5%
0%
20%
40%
60%
80%
100%
2016 (n=2843) 2015 (n=2709) 2014 (n=2858) 2013 (n=2907)
% o
f res
pond
ents Did not say
Less time now
About the same
More time now
Total may not sum to 100% due to rounding.
Research New Zealand | June 2016

Table 14: Changes in activity levels by time since GRx was issued
Q12. Compared with the time before you were first given a GRx, are you now spending...
Total
Less than 4 months
ago
4 - 6 months
ago
6 - 8 months
ago
More than 8 months
agoNo
responseBase = 2843
% % % % % %More time
being active? 61 62 63 61 59 38About the same
amount of time being active? 25 25 26 26 24 25
Less time being active? 10 9 9 9 13 22
No response 4 4 3 4 4 15Total 100 100 100 100 100 100
The base numbers shown are unweighted counts.Total may not sum to 100% due to rounding.
Significant differences The following significant differences were observed for the 2016 results:
Ethnicity:
Pacific patients were more likely to report they were spending less time being active, compared to before they got their GRx (18 percent compared with 10 percent overall).
NZDep Index:
Patients living in areas classified as being least deprived were more likely to report they were spending more time being active, compared to before they got their GRx (67 percent compared with 61 percent overall).
Employment status:
Sickness or invalid beneficiaries were more likely to report they were spending less time being active, compared to before they got their GRx (17 percent compared with 10 percent overall).
Disability:
Patients with a long-term disability or impairment were more likely to report they were spending less time being active, compared to before they got their GRx (13 percent compared with 10 percent overall).
Research New Zealand | June 2016

5.2.1 Reasons for spending the same amount of time being active
Patients were asked to identify the reasons why they were spending about the same amount of time being active now, as they were before their GRx.
The most frequently identified reasons included: illness, injury, pain or a medical condition (15 percent), increased workload/long hours/work commitments (11 percent) and already active enough (8 percent).
Table 15, below, shows all the reasons cited by at least one percent of patients.
Table 15: Reasons for spending about the same amount of time being active
Q12a. If spending about the same amount of time being active, why is this?
2016 2015 2014 2013Base= 727* 429* 436* 708*
% % % %Illness/injury/operation/pain/medical
condition preventing, recovering 22 24 28 17Increased workload/long hours/work
commitments 16 12 8 5Already doing enough, already/always
been active/happy with what doing 12 17 13 17Lack of motivation/laziness/depression^ 9 6 7 6Family responsibilities 9 7 10 6Too busy/no time 8 11 9 7Not doing specified type of activity/level
of activity 7 0 6 1Lack energy/tired 6 2 3 3Other commitments, holidays 4 3 6 2Difficulty getting into, or lost,
routine/didn't get into a habit 3 3 2 1Costs/fees of activity too expensive 3 4 3 2GRx has not helped 2 1 0 2Lack of support 1 2 1 1Getting too old/no longer up to it 2 1 1 1Weather/darkness 1 1 1 0Other miscellaneous reasons 15 14 21 6No particular reason 1 0 0 1Don't know 0 1 0 1Total may exceed 100% because of multiple response^Category coded from other responses. *Sub-sample based on those who said why they spent about the same amount of time being active after first prescribed a GRx.
Research New Zealand | June 2016

Significant differences The following significant differences were observed:
Employment status:
Patients who work full-time were more likely to report they were spending about the same amount of time being active because of increased workloads, longer hours or work commitments (46 percent compared with 16 percent overall).
Sickness or invalid beneficiaries were more likely to report they were spending about the same amount of time being active because of illness or injury (42 percent compared with 22 percent overall).
Disability:
Patients with a long-term disability or impairment were more likely to report they were spending about the same amount of time being active because of illness or injury (33 percent compared with 22 percent overall).
Overall satisfaction:
Dissatisfied patients were more likely to report they were spending about the same amount of time being active because their GRx has not helped (15 percent compared with 2 percent overall).
Research New Zealand | June 2016
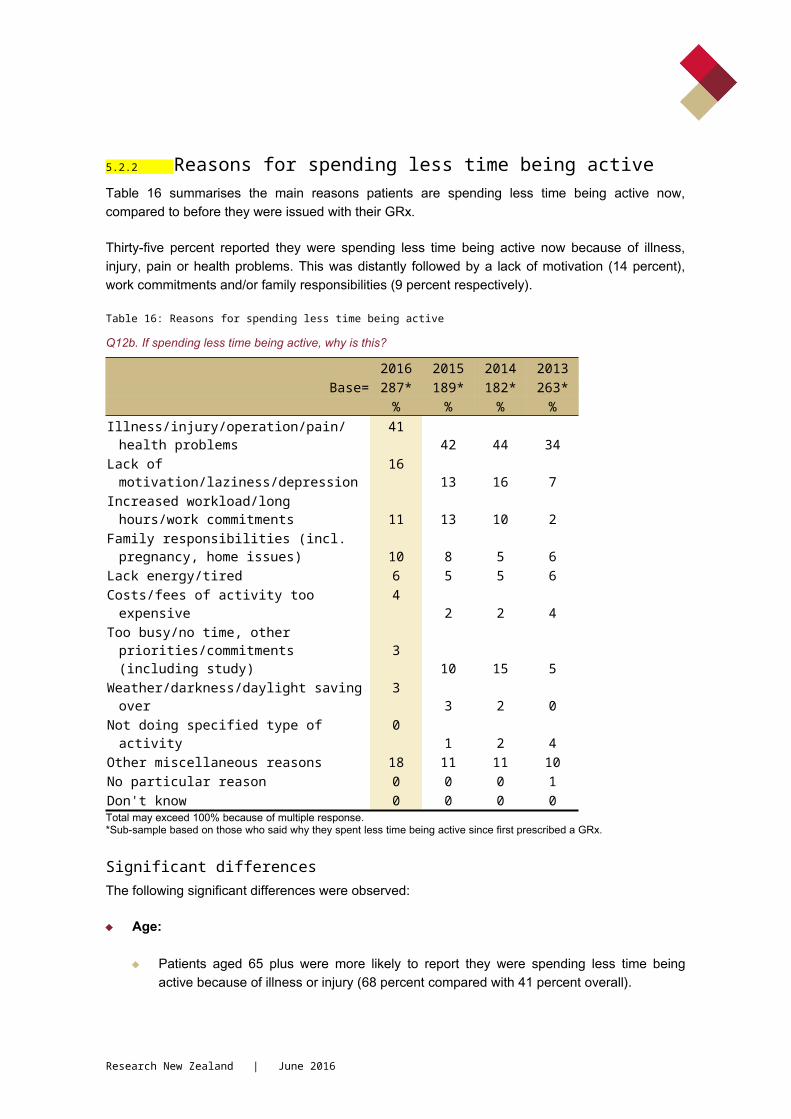
5.2.2 Reasons for spending less time being activeTable 16 summarises the main reasons patients are spending less time being active now, compared to before they were issued with their GRx.
Thirty-five percent reported they were spending less time being active now because of illness, injury, pain or health problems. This was distantly followed by a lack of motivation (14 percent), work commitments and/or family responsibilities (9 percent respectively).
Table 16: Reasons for spending less time being active
Q12b. If spending less time being active, why is this?
2016 2015 2014 2013Base= 287* 189* 182* 263*
% % % %Illness/injury/operation/pain/health problems 41 42 44 34Lack of motivation/laziness/depression 16 13 16 7Increased workload/long hours/work
commitments 11 13 10 2Family responsibilities (incl. pregnancy,
home issues) 10 8 5 6Lack energy/tired 6 5 5 6Costs/fees of activity too expensive 4 2 2 4Too busy/no time, other
priorities/commitments (including study) 3 10 15 5Weather/darkness/daylight saving over 3 3 2 0Not doing specified type of activity 0 1 2 4Other miscellaneous reasons 18 11 11 10No particular reason 0 0 0 1Don't know 0 0 0 0Total may exceed 100% because of multiple response. *Sub-sample based on those who said why they spent less time being active since first prescribed a GRx.
Significant differences The following significant differences were observed:
Age:
Patients aged 65 plus were more likely to report they were spending less time being active because of illness or injury (68 percent compared with 41 percent overall).
Ethnicity:
European patients were more likely to report they were spending less time being active because of illness or injury (59 percent compared with 41 percent overall).
Research New Zealand | June 2016

Employment status:
Patients who work full-time were more likely to report they were spending less time being active because of increased workloads, longer hours or work commitments (31 percent compared with 11 percent overall).
Retired patients were more likely to report they were spending about the same amount of time being active because of illness or injury (75 percent compared with 41 percent overall).
Research New Zealand | June 2016

Changes in dietSeventy percent of patients reported they had made changes to their diet since being prescribed their GRx, which is up from 67 percent last year.
The types of changes made are examined in section 5.2.1, overleaf.
Figure 13: Changes to diet since Green Prescription
Q14. Have you made any changes to your food and/or drink intake since being given your GRx?
70% 67% 63% 65%
28%27% 31% 32%
1%7% 5% 3%
0%
20%
40%
60%
80%
100%
2016 (n=2843) 2015 (n=2709) 2014 (n=2858) 2013 (n=2907)
% o
f res
pond
ents
Did not say
No
Yes
Total may not sum to 100% due to rounding.
Research New Zealand | June 2016

5.2.1 Types of changes made to dietFigure 14 shows the most common changes patients made to their diets were: having less sugar and sugary foods, sweets and soft drinks (26 percent), eating more healthily or less junk food (23 percent), drinking more water (20 percent), eating more vegetables and/or eating less or smaller meals (19 percent respectively).
Compared with 2015, significantly fewer patients reported they were eating more vegetables (19 percent compared with 23 percent in 2015).
Other, less commonly cited reasons are shown in Table 17 on page 63.
Figure 14: Types of changes to diet since Green Prescription
Q14a. What changes?
19%
20%
26%
6%
19%
23%
9%
5%
10%
4%
22%
20%
27%
10%
23%
22%
10%
4%
10%
4%
20%
16%
23%
12%
20%
23%
15%
6%
11%
5%
21%
16%
21%
12%
15%
25%
10%
5%
9%
5%
0% 5% 10% 15% 20% 25% 30% 35%
Eating less/smaller meals
Drink more water
Less/avoid sugar and sugaryfoods, sweets, soft-drinks
Cut down on fats/low fat foods
Eat more vegetables
Eating more healthily/less junkfood
Eat more fruit
Less alcohol
Reduced carbohydrates, inclbreads
Diet plans
% of respondents identifying changes
2016 (n=1967*) 2015 (n=1641*) 2014 (n=1694*) 2013 (n=1884*)
Total may exceed 100% because of multiple response. *Sub-sample based on those who made changes to their diet.
Research New Zealand | June 2016

Table 17: Other changes made to diet
Q14a. What changes (other)?
2016 2015 2014 2013Base= 1967* 1641* 1694* 1884*
% % % %Less takeaways/ fast food 5 4 3 3No snacking/regular meals, breakfasts 4 3 5 5Eat less (red) meat/more fish 4 3 4 4Reading labels on food^ 3 2 3 2Less dairy 2 2 3 3Less coffee/tea 2 1 1 2Cut down on salt use 2 4 3 3More protein 1 1 2 2More grain breads, fibre or similar 1 2 2 2Supplements, dietary 0 1 1 0Other miscellaneous reasons 11 13 12 9No particular changes 0 0 0 0Don't know 0 0 0 0Total may exceed 100% because of multiple response. *Sub-sample based on those who said what changes they have made to their food and/or drink intake.
Significant differences The following significant differences were observed for the 2016 survey results:
Age:
Patients aged 35-49 years and 50-64 years were more likely to report they had made changes to their food and/or drink intake since being given their GRx (79 percent and 75 percent respectively, compared with 70 percent overall).
Ethnicity:
Pacific and Māori patients were more likely to report they had made changes to their food and/or drink intake since being given their GRx (78 percent and 77 percent respectively, compared with 70 percent overall).
NZDep Index:
Patients living in areas classified as being most deprived were more likely to report they had made changes to their food and/or drink intake since being given their GRx (75 percent compared with 70 percent overall).
Research New Zealand | June 2016

Employment status:
Patients working full-time were more likely to report they had made changes to their food and/or drink intake since being given their GRx (78 percent compared with 70 percent overall).
Overall satisfaction:
Satisfied patients were more likely to report they had received specific advice on healthy eating (73 percent compared with 70 percent overall).
Contract holder:
Patients from Sport Waikato and Sport Bay of Plenty were more likely to report they had made changes to their food and/or drink intake since being given their GRx (83 percent and 78 percent respectively, compared with 70 percent overall).
Research New Zealand | June 2016

5.3 Encouraging others to be activeSixty-five percent of patients had encouraged others to be more active as a result of their GRx (Figure 15), which is similar to that reported last year.
Figure 15: Encouraging others to be active
Q21. As a result of your GRx experience, have you encouraged others to become more active?
65% 64% 61% 64%
28% 26% 28% 26%
7% 10% 11% 10%
0%
20%
40%
60%
80%
100%
2016 (n=2720*) 2015 (n=2595*) 2014 (n=2485*) 2013 (n=2785*)
% o
f res
pond
ents
Did not say
No
Yes
Total may not sum to 100% due to rounding.*Sub-sample based on those who had contact with a GRx support person.
Significant differences The following significant difference was observed for the 2016 results:
Ethnicity:
Pacific patients were more likely to report that they had encouraged others to become more active (75 percent compared with 65 percent overall).
Employment status:
Patients working part-time were more likely to report that they had encourage others to become more active (72 percent compared with 65 percent overall).
Overall satisfaction:
Patients who were satisfied overall were more likely to report that they had encouraged others to become more active (72 percent compared with 65 percent overall).
Research New Zealand | June 2016

Contract holders:
Patients from Sport Whanganui were more likely to report that they had encouraged others to become more active (74 percent compared with 65 percent overall).
Research New Zealand | June 2016

6.0 Contact with GRx support personOnce prescribed a GRx, patients are supposed to make contact with or be contacted by their assigned support person. This section examines:
The nature of the initial contact with the support person and the activities the support person suggested.
The types of providers they were referred to, if any and what follow-up support they have received.
Who they do physical activity with.
Key findingsIn most cases (68 percent), the support person contacted patients first. Twenty-three percent of patients visited the support person, while relatively few patients called the phone number provided (three percent) or had not yet had any contact with their GRx support person (five percent).
The main activities recommended by the GRx support people continue to be walking, swimming, water/pool exercises and gym exercises.
In cases where there has been contact, 74 percent of patients report their GRx support person referred them to an activity provider. The main activity providers recommended to patients are swimming pools and gyms.
Eighty percent of those referred thought the activity provider was appropriate for them.
After their first contact, just four percent of patients said they have not received any follow-up contact or support from their GRx support person. Where follow-up has occurred, it was mostly by phone (59 percent) or through face-to-face contact (42 percent).
About one third of patients report their GRx support person has given them an extension for longer support (34 percent).
In terms of who patients do physical activity with, 72 percent say they are active on their own, while 32 percent are active with adult family members and 26 percent with friends.
Research New Zealand | June 2016

6.1 Initial contact with the GRx support personOver two-thirds of patients reported that their GRx support person contacted them first (68 percent), while 23 percent visited them in person, and three percent called the number provided. Five percent said they had not had any contact with the GRx support person.
Figure 16: First contact with the GRx support person
Q15. How was contact first made with the GRx support person?
5%
68%
3%
23%
1%
7%
64%
4%
21%
4%
3%
66%
5%
24%
2%
5%
68%
5%
20%
2%
0% 10% 20% 30% 40% 50% 60% 70% 80%
No contact with GRx support
Was contacted by GRx support
Called phone number provided
Visited them in person
Did not say
% of respondents
2016 (n=2843) 2015 (n=2709) 2014 (n=2858) 2013 (n=2907)
Total may exceed 100% because of multiple response.
Research New Zealand | June 2016

Significant differences The following significant differences were observed for the 2015 survey results:
Age:
Patients aged 35-49 years were more likely to report their GRx support person contacted them first (74 percent compared with 68 percent overall).
Patients aged 65 years plus were more likely to report they went to see their support person in person (29 percent compared with 23 percent overall).
Employment:
Patients working part-time and full-time were more likely to report their GRx support person contacted them first (75 percent and 73 percent respectively, compared with 68 percent overall).
Retired patients aged 65 years plus were more likely to report they went to see their support person in person (29 percent compared with 23 percent overall).
Overall satisfaction:
Patients that reported being satisfied overall were more likely to report their GRx support person contacted them first (71 percent compared with 68 percent overall).
Contract holder:
Patients from Harbour Sport (83 percent), Sport Wellington (82 percent), Sport Taranaki (81 percent), Sport Southland (79 percent) and Sport Hawkes Bay (78 percent) were more likely to report that their support person contacted them first (compared with 68 percent overall).
Patients from Sport Whanganui (42 percent), Sport Northland (34 percent) and Sport Bay of Plenty (33 percent) were more likely to report they went to see their support person in person (compared with 23 percent overall).
Research New Zealand | June 2016

6.2 Activities suggested by GRx support personThe main activities recommended by GRx support people continue to be walking (69 percent), swimming (54 percent) and water/pool exercises (45 percent).
In 2016 more patients reported that their GRx support person recommended gym activities (43 percent compared with 38 percent in 2015).
Figure 17: Activities suggested by the GRx support person
Q18. What, if any, physical activities did the GRx support person suggest to you?
3%
69%
54%
43%
45%
19%
17%
22%
15%
10%
8%
3%
5%
3%
70%
51%
38%
42%
17%
16%
18%
12%
9%
7%
3%
5%
3%
68%
51%
44%
44%
20%
16%
16%
13%
10%
7%
3%
3%
4%
68%
52%
45%
44%
18%
16%
14%
13%
12%
9%
3%
5%
0% 10% 20% 30% 40% 50% 60% 70% 80%
None
Walking
Swimming
Gym exercises
Water/pool exercises
GRx communityprogramme/group
Gardening
Home based activities
Cycling
Tai Chi
Yoga/Pilates
Fall prevention programme
Other
% of respondents
2016 (n=2720*) 2015 (n=2595*) 2014 (n=2767*) 2013 (n=2785*)
Total may exceed 100% because of multiple response. *Sub-sample based on those who had contact with a GRx support person.
Research New Zealand | June 2016
Significant differences The following significant differences were observed for the 2016 results:
Age:
Patients aged under 25 years were more likely to report that their GRx support person suggested they take up gym exercises (63 percent compared with 43 percent overall).
Patients aged 35-49 years were more likely to report that their GRx support person suggested they take up walking (75 percent compared with 69 percent overall), gym exercises (49 percent compared with 43 percent overall) and/or a GRx community programme or group (25 percent compared with 19 percent overall).
Patients aged 65 years plus were more likely to report that their GRx support person suggested they take up gardening (25 percent compared with 17 percent overall) and/or Tai Chi (13 percent compared with 10 percent overall)
Gender:
Males were more likely to report their GRx support person suggested they take up gym exercises (49 percent compared with 42 percent overall) and/or cycling (20 percent compared with 15 percent overall).
Females were more likely to report their GRx support person suggested they take up yoga/pilates/zumba (11 percent compared with eight percent overall).
Ethnicity:
Mäori patients were more likely to report their GRx support person suggested they take up walking (75 percent compared with 69 percent overall), water/pool exercises (52 percent compared to 45 percent overall), gym exercises (50 percent compared with 43 percent overall) and/or other home based activities (26 percent compared with 22 percent overall).
Pacific patients were more likely to report their GRx support person suggested they take up swimming (63 percent compared with 54 percent overall), and/or other home based activities (30 percent compared with 22 percent overall).
Employment status:
Unemployed patients were more likely to report their GRx support person suggested they take up swimming (65 percent compared with 54 percent overall) and/or a GRx community programme or group (28 percent compared with 19 percent overall).
Research New Zealand | June 2016

Retired patients were more likely to report their GRx support person suggested they take up gardening (25 percent compared with 17 percent overall).
Students were more likely to report their GRx support person suggested they take up gym exercises (57 percent compared with 43 percent overall).
Overall satisfaction:
Dissatisfied patients were more likely to report their GRx support person did not make any suggestions (16 percent compared with three percent overall).
In contrast, satisfied patients were more likely to report their GRx support person suggested they take up walking (73 percent compared with 69 percent overall).
Contract holder:
Patients from HealthWest (60 percent), Sport Northland (57 percent) and Sport Auckland – Auckland (52 percent) were more likely to report their GRx support person suggested they take up gym exercises (compared with 43 percent overall).
Patients from Nelson Bays Primary Health (65 percent), Sport Whanganui (59 percent), Sport Manawatu, (58 percent) and Sport Bay of Plenty (57 percent) were more likely to report their GRx support person suggested they take up water or pool exercises (compared with 45 percent overall).
Patients from Sport Wellington were more likely to report their GRx support person suggested they take up swimming (70 percent compared with 54 percent overall).
Patients from Sport Southland were more likely to report their GRx support person suggested they take up walking (82 percent compared with 69 percent overall), and/or gardening (31 percent compared with 17 percent overall).
Research New Zealand | June 2016
6.3 Referrals to activity providersSeventy-four percent of patients reported that their support person referred them to an activity provider. The main activity providers patients were referred to were swimming pools (66 percent) and gyms (58 percent). Eighty percent of those who were referred to a provider felt it was appropriate for them.
Figure 18 and 19: Referrals to activity provider and percent who considered the provider was appropriate
Q19. Were you referred to any of the following activity providers?
Q20. Was the activity provider right for you?
74% 73%76% 77%
0%
20%
40%
60%
80%
100%
Percent refered to activity provider
2016 (n=2720*) 2015 (n=2595*) 2014 (n=2767*) 2013 (n=2785*)
80%77% 77% 77%
0%
20%
40%
60%
80%
100%
Percent considering activity provider appropriate
2016 (n=2158^) 2015 (n=2072^) 2014 (n=2256^) 2013 (n=2264^)
*Sub-sample based on those who had contact with a GRx support person. ^Sub-sample based on those who were referred to an activity provider.
Figure 20: Type of activity provider referred to
Q19. Were you referred to any of the following activity providers?
45%
52%
5% 6%
42%
52%
4%7%
56%
63%
5%10%
55%
64%
6% 8%
0%
10%
20%
30%
40%
50%
60%
70%
Gym Swimming pool Sports club Other
% o
f res
pond
ents
2016 (n=2720 )̂ 2015 (n=2595 )̂ 2014 (n=2256 )̂ 2013 (n=2269 )̂
^Sub-sample based on those who were referred to an activity provider.
Research New Zealand | June 2016
Significant differences The following significant differences were observed:
Age:
Patients aged under 25 years were more likely to be referred to a gym (61 percent compared with 45 percent overall).
Patients aged 50-64 years were more likely to be referred to a swimming pool (57 percent compared with 52 percent overall).
Gender:
Male patients were more likely to be referred to a gym (51 percent compared with 45 percent overall).
Ethnicity:
Māori patients were more likely to be referred to a swimming pool (59 percent compared with 52 percent overall) and/or a gym (53 percent compared with 45 percent overall).
Employment status:
Students were more likely to be referred to a gym (64 percent compared with 45 percent overall).
Disability:
Patients with a long-term disability or impairment were more likely to be referred to a swimming pool (58 percent compared with 52 percent overall).
Contract holder:
Patients from HealthWest (87 percent), Sport Northland and Sport Auckland – Auckland (73 percent respectively) are more likely to be referred to a gym (compared with 58 percent overall).
Patients from Sport Whanganui Sport Otago (85 percent), (83 percent), Sport Wellington and Marlborough PHO (80 percent respectively), and Sport Manawatu (76 percent) were more likely to report being referred to a swimming pool (compared with 66 percent overall).
Research New Zealand | June 2016
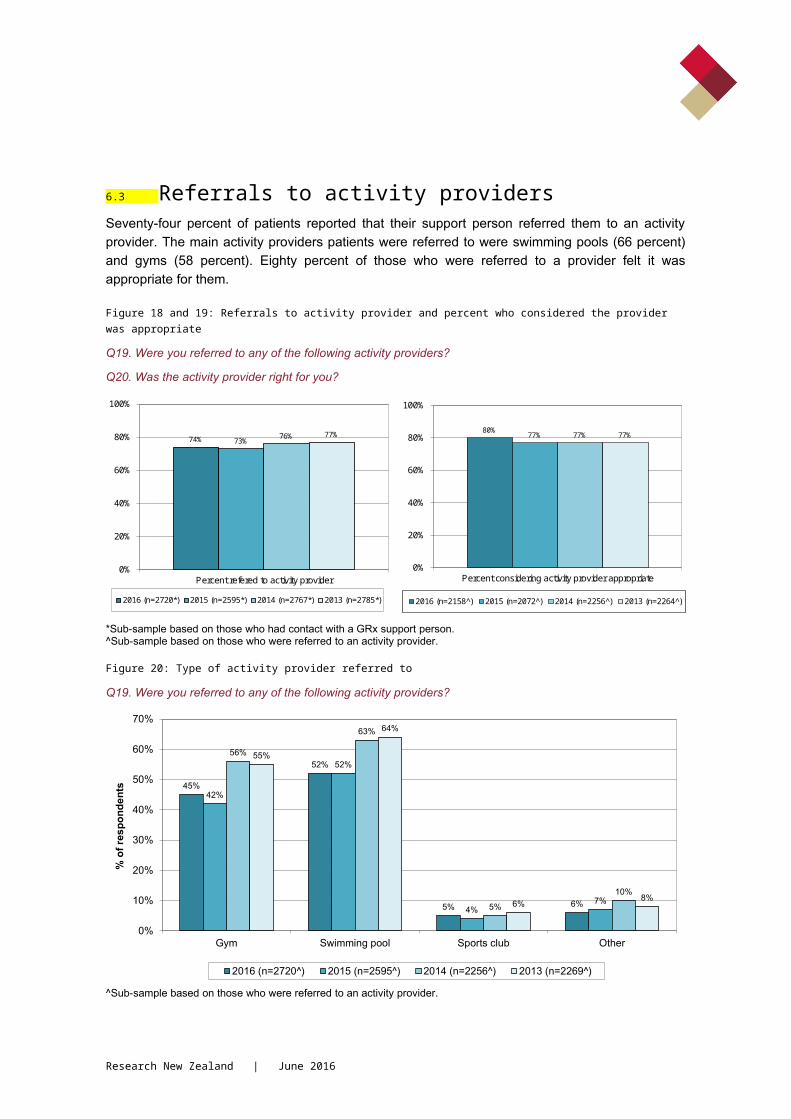
6.4 Companions when doing physical activityWhen patients were asked who they do physical activity with, 72 percent reported that they exercise on their own, while 32 percent said they exercise with adult family members and 26 percent with friends (Figure 21).
Figure 21: Companions when doing physical activity
Q22. When you do physical activity, who is it with?
72%
15%
26%
13%
4%
4%
5%
1%
65%
33%
32%
15%
21%
26%
13%
6%
4%
4%
4%
68%
31%
19%
5%
14%
6%
4%
1%
2%
68%
31%
22%
25%
13%
5%
3%
2%
2%
0% 10% 20% 30% 40% 50% 60% 70% 80%
By self
Family member(s)
Family member(s) - Adults*
Family member(s) -Children*
A GRx communityprogramme/group
Friend(s)
Another organised group
A sports club
People from work
Other
Did not say
% of respondents
2016 (n=2720*) 2015 (n=2595*) 2014 (n=2767*) 2013 (n=2785*)
Total may exceed 100% because of multiple response. ⁺Sub-sample based on those who had contact with a GRx support person. *Categories added in 2016.
Research New Zealand | June 2016

Significant differences The following significant differences were observed:
Age:
Patients aged under 25 years were more likely to undertake physical activity with adult family members (45 percent compared with 32 percent overall) and/or a GRx community programme/or group (39 percent compared with 26 percent overall).
Patients aged 25 to 34 years were more likely to undertake physical activity with adult family members (41 percent compared with 32 percent overall) and/or with child family members (32 percent compared with 15 percent overall).
Patients aged 35 to 49 years were more likely to undertake physical activity with child family members (26 percent compared with 15 percent overall).
Patients aged 65 plus were more likely to undertake physical activity with a GRx community programme/or group (20 percent compared with 15 percent overall) and/or another organised group (18 percent compared with 13 percent overall).
Gender:
Females were more likely to undertake physical activity with friends (29 percent compared with 26 percent overall).
Ethnicity:
Mäori patients were more likely to undertake physical activity with child family members (21 percent compared to 15 percent overall).
Pacific patients were more likely to undertake physical activity with adult family members (44 percent compared with 32 percent overall) and/or child family members (29 percent compared with 15 percent overall).
NZDep Index:
Patients living in areas classified as being most deprived were more likely to undertake physical activity with child family members (18 percent compared with 15 percent overall).
Employment status:
Research New Zealand | June 2016

Patients working full-time were more likely to undertake physical activity by themselves (78 percent compared with 72 percent overall) and/or with adult family members (38 percent compared with 32 percent overall).
Unemployed patients were more likely to undertake physical activity with child family members (23 percent compared to 15 percent overall).
Patients who mainly stay at home were also more likely to undertake physical activity with child family members (23 percent compared to 15 percent overall).
Retired patients were more likely to undertake physical activity with a GRx community programme/or group (19 percent compared with 15 percent overall) and/or another organised group (18 percent compared with 13 percent overall).
Contract holder:
Patients from Sport Canterbury (84 percent), Sport Otago (83 percent) and Sport Wellington (82 percent) were more likely to undertake physical activity by themselves (compared with 72 percent overall).
Patients from Sport Manawatu (29 percent), Nelson Bays Primary Health (27 percent) and Sport Bay of Plenty (24 percent) were more likely to undertake physical activity as part of a GRx Community programme/group (compared with 15 percent overall).
Research New Zealand | June 2016

6.5 Follow-up supportAfter their initial contact, 59 percent of patients reported they were given support to follow their GRx activities over the phone. Smaller (yet still sizable) proportions received support face to face (42 percent), in written form (29 percent), through a programme or group (18 percent) or via text or email (22 percent). Just four percent of patients said they had not received any follow-up support.
In 2016, significantly fewer patients said they received follow-up support face-to-face (42 percent compared with 46 percent in 2015) or as written information (29 percent compared with 33 percent in 2015). However, in 2016 significantly more patients reported receiving follow-up by text or email (22 percent compared with 17 percent in 2015).
Research New Zealand | June 2016

Figure 22: How follow-up support was provided
Q16. After your first contact, how were you given support to follow your GRx activities?
59%
42%
29%
18%
22%
4%
2%
5%
1%
62%
46%
33%
19%
17%
3%
2%
2%
3%
58%
47%
32%
20%
15%
5%
3%
3%
2%
57%
43%
36%
22%
2%
6%
3%
2%
2%
0% 10% 20% 30% 40% 50% 60% 70% 80%
Phone
Face-to-face
Written information
A GRx communityprogramme/group
Text or Email⁺Email**
No follow-up
I did not want any support/followup
Other
Did not say
% of respondents
2016 (n=2720*) 2015 (n=2595*) 2014 (n=2767*) 2013 (n=2785*)
Total may exceed 100% because of multiple response. *Sub-sample based on those who had contact with a GRx support person.⁺Category was added to the questionnaire in 2014.**Category dropped in 2014.
Just under one third of patients report their GRx support person has given them an extension for longer support (34 percent). While a further 37 percent reported their support person had not given them an extension for longer support.
Research New Zealand | June 2016

Figure 23: Extension for Longer Support
Q17. Has your GRx support person given an extension for longer support during the last year?
eY s ,34%
oN ,37%
on t noD ' k w , 23%
o re pon eN s s , 6%
As detailed in Table 18 overleaf, patients who had received an extension for longer support, were more likely to have reported a number of positive changes to their health when compared with patients who had not received an extension:
More energy (50 percent and 43 percent, respectively).
Breathing easier (39 percent and 30 percent, respectively).
Less stressed (37 percent and 30 percent, respectively).
Lower blood pressure (23 percent and 14 percent, respectively).
Feeling less depressed/anxious (22 percent and 17 percent, respectively).
Less back pain (22 percent and 17 percent, respectively).
Lower cholesterol (17 percent and 12 percent, respectively).
Better balance/fewer falls (17 percent and 12 percent, respectively).
Fewer illnesses (14 percent and 10 percent, respectively).
Research New Zealand | June 2016
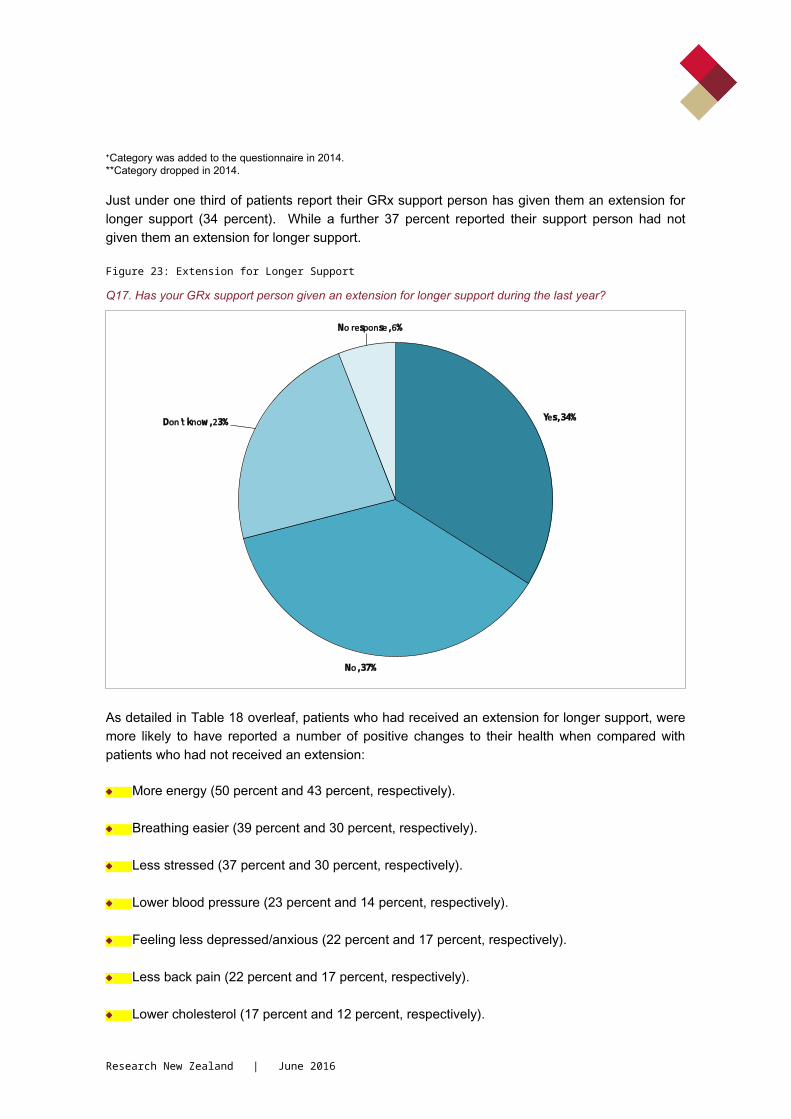
Table 18: Positive changes noticed by whether patients have been given an extension for longer support
Q7. Compared with being given an extension for longer support, what positive changes have you noticed…?
TotalGiven an extension
Not given an
extension Don't knowNo
responseUnweighted
base = 2038* 822 661 428 127Weighted base
= 2023* 793 693 413 124% % % % %
Feel stronger/fitter 55 57 52 55 51
Generally feel better 54 55 55 52 53
Lost weight 48 51 47 45 37More energy 44 50 43 40 35Breathing
easier 34 39 30 33 32Less stressed 33 37 30 32 33Sleeping better 29 30 26 31 24Less joint
pain/discomfort 25 25 28 24 22
Increased mobility 28 31 27 25 24
Lower blood pressure 19 23 14 17 22
Feel less depressed/anxious 20 22 17 20 19
Less back pain 21 22 17 23 21Lower
cholesterol 14 17 12 11 14Improved blood
sugar levels 16 19 15 13 15Better
balance/fewer falls 13 17 12 11 9
Fewer illnesses 11 14 10 9 5Less medication 10 12 9 8 12Smoking less 6 8 5 6 2Other (Specify) 4 5 4 2 2No response 3 3 2 2 10
The base numbers shown are unweighted counts.Total may exceed 100% because of multiple responses.*Sub-sample based on those respondents who have had contact with a GRx support person and who have noticed positive changes in their health since they were first issued a GRx.
Research New Zealand | June 2016

Significant differences The following significant differences were observed for the 2016 survey results:
Age:
Patients aged 35-49 years were more likely to have received follow-up support through a text or email (29 percent compared with 22 percent overall).
Patients aged 65 plus were more likely to have received follow-up support face-to-face/in person (47 percent compared with 42 percent overall) and/or through a GRx community programme/group (22 percent compared with 18 percent overall).
Education:
Patients who have tertiary education were more likely to have received follow-up support through a text or email (32 percent compared with 22 percent overall).
Research New Zealand | June 2016
NZDep Index:
Patients living in the most deprived areas were more likely to have received follow-up support face-to-face/in person (46 percent compared with 42 percent overall).
Employment status:
Patients working full-time were more likely to have received follow-up support through a text or email (33 percent compared with 22 percent overall).
Retired patients were more likely to have received follow-up support through a GRx community programme/group (22 percent compared with 18 percent overall).
Overall satisfaction:
Patients who were satisfied overall were more likely to have received follow-up support face-to-face/in person (46 percent compared with 42 percent overall).
Patients who were dissatisfied overall were more likely to have not received any follow-up support (32 percent compared with four percent overall).
Contract holder:
Patients from Sport Southland (87 percent), Harbour Sport (82 percent), HealthWest (81 percent), Sport Taranaki (79 percent), Sport Wellington (77 percent), Sport Hawkes Bay (74 percent) and Sport Northland (70 percent) were more likely to report receiving support to follow their GRx activities by telephone (compared with 59 percent overall).
Patients from Marlborough PHO (73 percent), West Coast PHO (60 percent), Sport Bay of Plenty (61 percent), Sport Gisborne Tairawhiti, Sport Waikato (56 percent respectively), and Sport Whanganui (54 percent) were more likely to have received follow-up face-to-face (compared with 42 percent overall).
Patients from Sport Manawatu, Nelson Bays Primary Health (44 percent respectively) and Sport Auckland – Auckland (26 percent), were more likely to have received follow-up support through a GRx community programme/group (compared with 18 percent overall).
Research New Zealand | June 2016

7.0 Opinions about GRx supportOverall satisfaction with, and opinions about the GRx support service, are covered in this chapter. The chapter also goes into the details of why patients are satisfied or dissatisfied with the support and service they received.
Key findingsMore than four-in-five patients are either very satisfied (49 percent) or satisfied (35 percent) with the support service provided to them.
The main drivers of satisfaction are the:
encouraging, motivating, supportive, helpful behaviour from support people,
improved health, motivation and confidence experienced by patients,
provision of useful and good advice,
motivation to be active or more active by support people,
service provided by the support people.
The main reasons given by patients who feel less than satisfied are:
a feeling that the programme has insufficient follow-up or communication,
that more suitable ideas are required to meet their needs and circumstances (e.g. time and travel distance constraints),
that they received a lack of support or encouragement,
that they felt they didn’t physically change much and GRx was no benefit to them
Mirroring the results from the last few years, patients are most likely to agree that the advice they received from their support person was helpful, their support person was understanding and supportive, that the suggested activities were appropriate and that the information and advice was relevant.
Research New Zealand | June 2016

7.1 Overall satisfaction with GRx serviceEighty-four percent of patients reported they were either very satisfied (49 percent) or satisfied (35 percent) with the support service provided to them (Figure 24), compared with 88 percent of patients last year.
Figure 24: Overall satisfaction with GRx support
Q24. The GRx support people aim to encourage you to be active, connect you to physical activities that suit you, and see how you are progressing. Given this aim, overall how satisfied are you with the service provided to you?
49%
35%
9%
3% 3%
52%
36%
7%2% 2%
47%
37%
9%4% 2%
46%
36%
11%
4% 3%
0%
10%
20%
30%
40%
50%
60%
Very satisfied Satisfied Neither/nor Dissatisfied Very Dissatisfied
% o
f res
pond
ents
2016 (n=2720*) 2015 (n=2508*) 2014 (n=2665*) 2013 (n=2704*)Total may not sum to 100% due to rounding. *Sub-sample based on those who had contact with a GRx support person.
Significant differences The following significant differences were observed for the 2016 survey results:
Ethnicity:
Mäori patients were more likely to be very satisfied with the service provided to them by their GRx support person (55 percent compared with 49 percent overall).
Contract holder:
Patients from Sport Gisborne Tairawhiti were more likely to be very satisfied with the service provided to them by their GRx support person (62 percent compared with 49 percent overall).
Research New Zealand | June 2016

7.1.1 Reasons for satisfactionTable 19 (page 89) shows the reasons patients provided for being satisfied with the support service they received overall, as well as comments on their experience of participating in the GRx initiative. The most common reasons for being satisfied continue to relate to:
Encouraging, motivating, supportive and helpful behaviour from support people (cited by 38 percent of those who were satisfied).
Wonderful, motivated ladies to teach us.
They are very supportive and ask how I am progressing in all my exercises and are very helpful to give any help if I am confused or wish to understand something. Very encouraging to continue with their programme.
The girls at the GRx were very supportive. They got me exercising [for the first time in] 20 years. I am feeling so much better. They made the activity so much fun.
Improved health, motivation and confidence (16 percent).
I have benefited tremendously from involvement with GRx Programme. While waiting for back surgery, my support team helped to keep me positive, encouraged me to keep active and as strong as possible and to have a diet that kept me healthy and fit. This all contributed to a successful outcome to major back surgery. I am now using knowledge gained to build myself back up again to strength and wellbeing.
At the start when I was first referred to this program, I was scared and didn't want to do anything, but when I met my GRx support person, he fully made me understand why I should make small changes and be healthier within myself and be active. Now I know what it is to be feeling good about my lifestyle changes.
Feel strong and healthier than before [and] sleeping better.
Useful or good information, advice, explanations and suggestions (14 percent).
Any information regarding exercise or diet were things I could fit into my lifestyle as it is and into my budget. They were also very helpful in coming up with alternative ideas for exercise and diet if I found things were not working that well for me with the orginal ideas they gave me.
Plenty of choices on offer, lots of advice and different levels of activity offered.
Research New Zealand | June 2016

Was offered sound advice and have received weekly reminder texts. Advisor encouraging but not pushy.
Research New Zealand | June 2016

Being motivated to be active or more active by support people (14 percent).
Well and a big well. It's got me off the sofa for a start. Getting older, stop to think about myself not getting any younger. Wellbeing, up lifting and meeting other people - amazing. Very, very satisfied, a big thanks to the GRx support (kai pai).
Very happy with information provided and follow-up calls to keep my motivation up - thanks to all GRx staff.
Attending my local GRx support group allowed me to change my routines, even attending the meetings was a goal for me. Trying the various exercises in relaxed, supportive atmosphere was greatly beneficial.
Service provided by support people (14 percent).
The support was absolutely professional. The service/programme is an important aspect for self health.
Would definitely recommend this service to others. Very satisfied with the support and motivation I was given. I loved that no one judged me. 100%.
GRx support person makes contact at gym weekly. They are very friendly, supportive and encouraging.
Reasons for partial satisfaction Despite being satisfied overall, small numbers of these patients also gave a reason why they were not completely satisfied with the service overall.
The most common reasons cited were: barriers such as travel, work or family responsibility (cited by three percent) and/or barriers relating to illness or injury (cited by two percent of satisfied patients) (Table 20).
Research New Zealand | June 2016

Table 19: Reasons for being satisfied overall
Q24a. Please explain your answer (or any other comments you would like to make about your participation in GRx).
2016 2015 2014 2013Base= 2286* 1311* 1304* 2274*
% % % %Encouraging, motivating, supportive,
helpful 38 36 33 18Improved health, motivation,
confidence/feel better, happier/see results 16 8 16 7
Motivated me to be active/more active, am more active as a result 14 6 17 9
Useful/good information/ advice/ explanations/ ideas/ suggestions 14 8 13 6
Service great/good/impressive 14 5 6 3Excellent/great/awesome team, support 13 5 1 3Follow-up contact received/checks on
progress 12 11 10 7Personal contact/attention 9 2 3 1Empathetic, understands needs/situation,
takes genuine interest, caring, listens 7 4 7 3Appropriate activities - suitable for my
lifestyle, abilities, condition 6 5 9 4Friendly, lovely, pleasant, cheerful,
enthusiastic people 4 3 3 2No pressure/non-judgmental 3 1 2 1Greater awareness/understanding of need
to be/benefits of being more active 3 1 5 1Help with activities/exercises 2 0 2 0Great/good communicator -
clear/concise/understandable 2 1 1 0Easy to contact/talk to, accessible,
approachable 1 1 3 1Other - positive comment 8 16 14 5No particular reason 4 3 0 0Total may exceed 100% because of multiple response. *Sub-sample based on those who gave a reason for being satisfied with the service and support provided.Note: 2013 survey results are not directly comparable to those of previous years, due to a change in wording of the survey question. Any observed differences should be viewed with caution.
Research New Zealand | June 2016

Table 20: Reasons for being partially satisfied overall
Q24b. Reasons for being partially satisfied
2016 2015 2014 2013Base= 2286* 1311* 1304* 2274*
% % % %Other barriers: distance to travel, family
responsibilities, work, time, cost 3 4 6 3Illness/injury barriers - can't do
exercises because of, doing what I can 2 2 6 2
More face-to-face/personal contact/support desired 1 1 2 1
Inappropriate activities for condition/age 1 0 1 0
Already active/doing own thing 1 1 3 1A lack of contact or follow-up/more
follow-up required 1 1 0 1Need support/motivation, lack of
motivation 1 1 2 1Longer GRx period/GRx ran out, limited
time only 1 1 3 1More advice/information required 1 0 1 1Self-motivated/up to me/my decisions 0 1 2 1Staff too busy, not available,
inexperienced/lack knowledge, staff issues 0 0 1 0
Other - negative comment 2 3 5 1No particular reason 2 3 0 0Multiple response question.*Sub-sample based on those who gave a reason for being satisfied with the service and support provided.Note: 2013 survey results are not directly comparable to those of 2012, due to a change in wording of the survey question. Any observed differences against the 2012 results should be viewed with caution.
Significant differences There are no significant differences when viewed by the demographic variables or contract holder.
Research New Zealand | June 2016

7.1.2 Reasons for being less than satisfiedTable 21 shows the reasons patients provided for being dissatisfied with the support service they received, as well as comments relating to their experience of participating in the GRx initiative. The most common reasons for being dissatisfied continue to relate to:
Insufficient follow-up or communication (38 percent of dissatisfied patients say this).
Just the fact that there is no follow up. Things were never explained very well and I just felt like I wasn't supported for it.
I am disappointed that after attempting to make contact myself and with help from my referral, I am still waiting.
I was led to believe I would have weekly phone calls, meetings, nutrition advice but had one phone call and one email.
More suitable ideas required (23 percent)
Not all people have a 9 - 5 job or routine jobs that they can have routine exercise. I am more than happy to do exercise and improve my lifestyle but I also have to have a job. When you have someone on the end of the phone telling you that you have to be more active and motivate - before they even know you or have talked to you. They just judge you first - this is not helpful.
The activities prescribed for me were inappropriate for my level of health, and I was left totally to my own devices. I felt extremely unsupported, and suffered severe pain when attempting the exercises.
I was left upset and hurt. Was told I was making excuses when I could not commit to meeting/groups due to location [or] work and family. I felt embarrassed and hid Green Prescription from my family/husband.
Lack of support or encouragement (19 percent).
Just given brochures and was not given any help or advice as to what would've been best or more beneficial for me.
I was really disappointed with the experience. Although I'm sure the GRx person is a good person, they didn't motivate me at all. She looked tired, uninterested and basically just handed me a bunch of photocopied exercises and that was that. I really expected more. I expected someone to be enthusiastic, bubbling with energy and motivated. When I left the first meeting, I wondered why I had even bothered to come. I did ask her lots of
Research New Zealand | June 2016

questions, it was hard to draw information from her. In the end, the GRx person said she just wasn't used to people wanting to do the programme. She usually had people that had many reasons why they couldn't do what she was suggesting. I think that people who use this service shouldn't be pre-judged by the response of other participants. I really wanted to make changes in my life but the exercises aggravated an old knee injury and it put a halt to all my plans. I cannot afford gym fees or swimming club fees. I felt like I had wasted my time.
Because I couldn't attend the series of meetings, I was encouraged to make my own arrangements. When I asked about a discount pass for the pools to go aqua jogging, I was brushed off and told they didn't do that. I needed on-going support in person or some incentive to proceed but that didn't happen so I didn't feel motivated enough to do it on my own.
No change/didn’t help/no benefit (19 percent)
Didn't find it helpful or supportive or encouraging at all. All the information I could of found myself, I found it was complete waste of time and effort.
Two phone calls, six months apart with no effort to get to know me or my situation - useless. No understanding of MS.
I needed to have someone help me get out of my rut of non-exercise. That didn't happen.
Research New Zealand | June 2016

Table 21: Reasons for being less than satisfied overall
Q24b. Reasons for being less than satisfied
2016 2015 2014 2013Base= 210* 242* 283* 430*
% % % %Insufficient follow-up/communication,
contact stopped 38 28 26 28More suitable ideas required (relevant to
time available, travel distance, condition) 23 15 16 2
Lack of support/encouragement, need more support 19 17 17 21
Didn't change much/didn't help/no benefit 19 4 14 6Empathy lacking, disinterested 16 6 5 3A lack of personal contact; phone calls
not sufficient 11 4 5 9Insufficient staff/resources, lack of
knowledge/experience 10 10 12 3Cost barriers 7 11 13 11No advice regarding exercises 3 3 6 2Did it/left to do it myself, already
motivated 2 6 12 9Work/time barriers 1 4 7 3Positive comment 7 7 9 6Other 20 23 17 10Total may exceed 100% because of multiple response. *Sub-sample based on those who gave a reason for feeling less than satisfied with the service provided.Note: 2012 survey results are not directly comparable to those of 2013-2015, due to a change in wording of the survey question. Any observed differences should be viewed with caution.
Significant differences There were no significant differences when viewed by the demographic variables or contract holder.
Research New Zealand | June 2016

7.2 Opinions about GRx supportFigure 25 shows the opinions of patients about the service provided to them in relation to seven key attributes. As was the case last year, patients are most likely to strongly agree or agree that the advice they received from the support person was helpful and/or the support person was understanding and supportive (89 percent respectively).
Figure 25: Opinions about GRx support (n=2672)*
Q23. Now thinking about the service and support you received, please indicate how strongly you agree or disagree with each of these statements…
47
39
51
41
43
44
39
42
47
38
45
38
37
38
7
10
7
9
13
12
16
2
3
2
3
3
4
4
2
2
2
2
2
3
3
0% 10% 20% 30% 40% 50% 60% 70% 80% 90% 100%
Advice was helpful
Activities were appropriate
Person was understanding &supportive
Information & advice was relevant
Understand the benefits of physicalactivity
Was motivated to get/stay active
More confident about doing physicalactivity
% of respondents
Strongly agree Agree Neither/nor Disagree Strongly disagree
Total may not sum to 100% due to rounding. *Sub-sample based on those who had contact with a GRx support person.
Despite these strong results, in 2016 patients were significantly less likely to agree/ strongly agree with each of these statements.
Research New Zealand | June 2016

Figure 26: Opinions about GRx support – Comparison with previous years
Q23. Now thinking about the service and support you received, please indicate how strongly you agree or disagree with each of these statements…
89%
86%
89%
86%
81%
81%
77%
93%
89%
91%
90%
85%
86%
82%
92%
88%
88%
88%
83%
82%
79%
0% 10% 20% 30% 40% 50% 60% 70% 80% 90% 100%
Advice was helpful
Activities were appropriate
Person was understanding &supportive
Information & advice wasrelevant
Understand the benefits ofphysical activity
Was motivated to get/stay active
More confident about doingphysical activity
% of patients AGREEING
2016 (n=2672*) 2015 (n=2490*) 2014 (n=2785*) 2013 (n=2785*)
*Sub-sample based on those who had contact with a GRx support person.
Significant differences The following significant differences were observed in the 2016 survey:
Age:
Patients aged 65 years plus were more likely to agree that the physical activity options suggested were appropriate for them (53 percent compared with 47 percent overall), the information and advice given was relevant to them (52 percent compared to 45 percent overall), the person they spoke to motivated them to get/stay physically active (43 percent compared with 37 percent overall), they now understand the benefits of physical activity (43 percent compared to 38 percent overall), as a result of the support they got,
Research New Zealand | June 2016

they now feel more confident about doing physical activity regularly (43 percent compared with 38 percent overall).
Ethnicity:
Mäori patients were more likely to strongly agree that they now understand the benefits of physical activity (50 percent compared with 43 percent overall), the information and advice given was relevant to them (47 percent compared with 41 percent overall), the physical activity options suggested were appropriate for them (44 percent compared with 39 percent overall).
Pacific patients were more likely to strongly agree that as a result of the support they got, they now feel more confident about doing physical activity regularly (56 percent compared with 39 percent overall), they now understand the benefits of physical activity (54 percent compared with 43 percent overall), the information and advice given was relevant to them (49 percent compared with 41 percent overall),
Asian patients were more likely to agree that the person they spoke to was understanding and supportive (54 percent compared with 38 percent overall), the person they spoke to motivated them to get/stay physically active (52 percent compared with 37 percent overall).
Employment status:
Retired patients were more likely to agree that they now understand the benefits of physical activity (45 percent overall compared with 38 percent overall), the person they spoke to motivated them to get/stay physically active (44 percent compared with 37 percent overall).
Education:
Patients with no qualifications were more likely to agree that as a result of the support they got, they now feel more confident about doing physical activity regularly (46 percent compared with 39 percent overall).
Overall satisfaction:
Patients who were satisfied with the service they received overall were more likely to strongly agree that the person they spoke to was understanding and supportive (58 percent compared to 51 percent overall), the advice given was helpful (54 percent compared with 47 percent overall), the person they spoke to motivated them to get/stay physically active (51 percent compared with 44 percent overall), they now understand the benefits of physical activity (49 percent compared with 43 percent overall), the information and advice given was relevant to them (47 percent compared with 41 percent overall), as a
Research New Zealand | June 2016

result of the support they got, they now feel more confident about doing physical activity regularly (45 percent compared with 39 percent overall), the physical activity options suggested were appropriate for them (44 percent compared to 39 percent overall).
Research New Zealand | June 2016

Contract holders:
Patients from Sport Gisborne Tairawhiti were more likely to strongly agree that their GRx support person was understanding and supportive (61 percent compared with 50 percent overall), the advice given was helpful (61 percent compared to 46 percent overall), they now understand the benefits of physical activity (53 percent compared with 42 percent overall) and they now feel more confident about doing physical activity regularly (50 percent compared to 38 percent overall).
Patients from Sport Waikato were more likely to strongly agree that their GRx support person was understanding and supportive (60 percent compared with 50 percent overall), the advice given was helpful (57 percent compared to 46 percent overall), the information and advice given was relevant to them (51 percent compared to 40 percent).
Patients from Sport Bay of Plenty were more likely to strongly agree that the advice given was helpful (55 percent compared to 46 percent overall).
Patients from Marlborough PHO were more likely to strongly agree that the support person was understanding and supportive (68 percent compared to 50 percent overall), the support person motivated them to get/stay physically active (65 percent compared to 43 percent overall) and the physical activity options suggested were appropriate for them (55 percent compared to 37 percent overall).
Research New Zealand | June 2016
8.0 Profile of respondentsThis section outlines the profile of patients who took part in the 2016 survey, and compares this with profiles of respondents from previous surveys, as well as 2013 Census data, where appropriate.
There were a number of significant differences between this year’s sample of patients, compared with 2015:
Fewer of this year’s patients reported they were primarily at home (nine percent compared with 11 percent in 2015) or on a sickness/invalid’s benefit (13 percent compared with 16 percent in 2015
Fewer patients reported having no school qualifications (23 percent compared with 27 percent in 2015).
Fewer patients live in Decile 10 areas (18 percent compared with 24 percent last year).
In part, reflecting a desire in 2016 to achieve a more representative sample, fewer respondents identified as being Māori (28 percent compared with 39 percent last year) and/or Pacific people (13 percent compared with 19 percent last year); while more identified as being European (59 percent compared with 53 percent in 2015).
Figure 27: Gender
Q25. Are you...?
29% 31% 32% 32%
70% 68% 68% 68%
1% 1%
0%
20%
40%
60%
80%
100%
2016 (n=2843) 2015 (n=2709) 2014 (n=2858) 2013 (n=2907)
% o
f res
pond
ents Did not say
Female
Male
Total may not sum to 100% due to rounding.
Research New Zealand | June 2016

Figure 28: Age group distribution
Q27. To which of these age groups do you belong?
1
4 4 45
8
1011
13
11
13
9
6
43 3
45
7
10
1213
1112
10
5
3
1
32
3
5
7
9
11 1112
13
11
6
43 3
45
89
1312
1312
9
54
0%
5%
10%
15%
20%
Under 18years
18 - 24yrs
25 – 29 yrs
30 – 34 yrs
35 – 39 yrs
40 – 44 yrs
45 – 49 yrs
50 – 54 yrs
55 – 59 yrs
60 – 64 yrs
65 – 69 yrs
70 – 74 yrs
75 – 79 yrs
80 yearsor over
% o
f res
pond
ents
2016 (n=2843) 2015 (n=2709) 2014 (n=2858) 2013 (n=2907)
Total may not sum to 100% due to rounding.Note: 2012 results not shown due to insufficient space.
Research New Zealand | June 2016

Figure 29: Employment status
Q30. Which of the following best describes you?
24%
14%
7%
9%
28%
13%
4%
1%
1%
22%
12%
6%
11%
28%
16%
3%
1%
2%
20%
14%
4%
8%
30%
16%
3%
4%
1%
21%
14%
5%
9%
27%
18%
3%
3%
1%
0% 5% 10% 15% 20% 25% 30% 35% 40%
Full-time employed
Part-time employed
Unemployed/actively seeking a job
Home duties
Retired
Sick/invalid
Student (full-time, incl secondary school)
Other
Did not say
% of respondents
2016 (n=2843) 2015 (n=2709) 2014 (n=2858) 2013 (n=2907)
Total may not sum to 100% due to rounding.
Research New Zealand | June 2016

Figure 30: Whether have a disability
Q28. Do you have a disability or impairment that is long term (lasting 6 months or more) and causes you difficulty with, or stops you doing physical activity that people your age can usually do?
44%
52%
4%
45%
50%
4%
46%48%
5%
46%49%
5%
0%
10%
20%
30%
40%
50%
60%
Yes No Did not say
% o
f res
pond
ents
2016 (n=2843) 2015 (n=2709) 2014 (n=2858) 2013 (n=2907)
Total may not sum to 100% due to rounding.
Research New Zealand | June 2016

Figure 31: Highest educational qualification
Q26. Which of these best describes your highest level of educational qualification?
23%
31%
21%
22%
2%
27%
29%
20%
20%
1%
4%
26%
32%
20%
19%
1%
2%
25%
28%
19%
24%
1%
3%
0% 5% 10% 15% 20% 25% 30% 35% 40%
None
Secondary school
Tertiary
Other post-secondaryqualification
Other
Did not say
% of respondents
2016 (n=2843) 2015 (n=2709) 2014 (n=2858) 2013 (n=2907)
Total may not sum to 100% due to rounding.
Research New Zealand | June 2016

Figure 32: Deprivation index distribution (1 = least deprived, 10 = most deprived)
5
76
7
910
1112
16
18
4
7
5
78 8
10
12
15
24
67 7
8 8
1011
1314
17
5
8 8 89
1011
12
15
13
0%
5%
10%
15%
20%
25%
30%
1 2 3 4 5 6 7 8 9 10
% o
f res
pond
ents
2016 (n=2843) 2015 (n=2709) 2014 (n=2858) 2013 (n=2907)
Total may not sum to 100% due to rounding.
Table 22: Ethnicity
Q29. Which ethnic group do you mainly identify with?
2016 2015 2014NZ 2013 Census 2013
Base= 2843 2709 2858 2907% % % % %
NZ European 54 49 61 68 61Māori 28 32 23 12 21Samoan 4 8 4 3 4Cook Island Māori 3 4 2 1 2Tongan 3 4 1 1 1Niuean 1 2 1 0 0Chinese 1 0 1 4 1Indian 2 1 3 4 4Other Asian 1 1 1 4 2Other Pacific 2 2 1 1 1British/European 5 4 6 8 6Other 2 1 2 3 4Did not say 1 1 0 - 0Total may not sum to 100% due to rounding.
Research New Zealand | June 2016
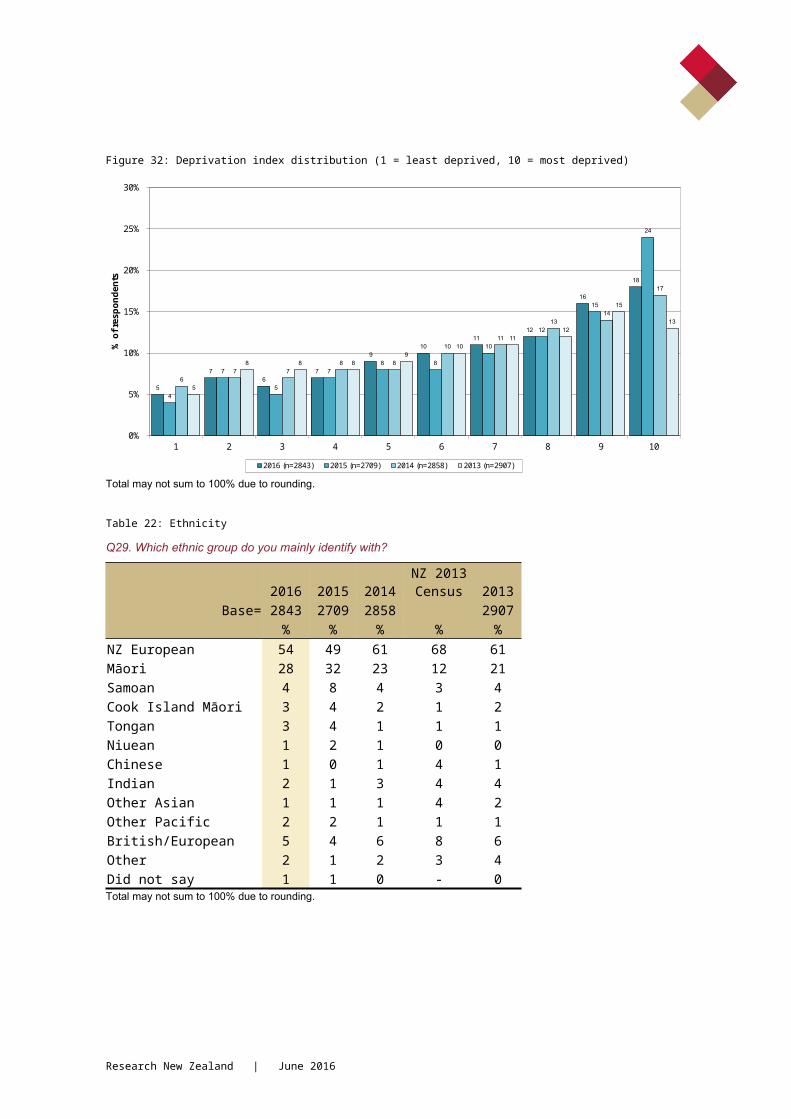
Table 23: Ethnicity (summary groups)
Q29. Which ethnic group do you mainly identify with?
2016 2015 2014NZ 2013 Census 2013
Base= 2843 2709 2858 2907% % % % %
European 59 53 67 75 66Māori 28 32 23 12 21Pacific 13 19 9 6 8Asian 4 3 5 12 6Other 2 1 2 3 4Did not say 1 1 0 - 0Total may not sum to 100% due to rounding.
Table 24: Age
Q27. To which of these age groups do you belong?
2016 2015 2014NZ 2013 Census 2013
Base= 2843 2709 2858 2907% % % % %
Under 18 years 1 0 1 5 018 - 24 yrs 4 3 3 12 325 – 29 yrs 4 3 2 8 330 – 34 yrs 4 4 3 8 435 – 39 yrs 5 5 5 8 540 – 44 yrs 8 7 7 9 845 – 49 yrs 10 10 9 9 950 – 54 yrs 11 12 11 9 1355 – 59 yrs 13 13 11 8 1260 – 64 yrs 11 11 12 7 1365 – 69 yrs 13 12 13 6 1270 – 74 yrs 9 10 11 4 975 – 79 yrs 6 5 6 3 580 years or over 4 3 4 5 4Did not say 1 1 0 - 0Total may not sum to 100% due to rounding.
Research New Zealand | June 2016

Table 25: Age (summary groups)
Q27. To which of these age groups do you belong?
2016 2015 2014NZ 2013 Census 2013
Base= 2843 2709 2907 2907% % % % %
Under 25 yrs 4 3 3 17 325 – 34 yrs 8 8 6 15 735 – 49 yrs 23 22 21 26 2250 – 64 yrs 34 36 35 23 3865+ yrs 31 31 35 18 30Did not say 1 1 0 - 0Total may not sum to 100% due to rounding.
Research New Zealand | June 2016

Appendix A: Cover letter, reminder letter and questionnaire
Research New Zealand | June 2016

Research New Zealand | June 2016

Research New Zealand | June 2016

Research New Zealand | June 2016

Research New Zealand | June 2016

Research New Zealand | June 2016

Research New Zealand | June 2016

Research New Zealand | June 2016

Research New Zealand | June 2016

Appendix B: Supplementary tabulations
Maroon/dark shading indicates result is significantly higher when compared against all patients.
Grey/light shading indicates result is significantly lower when compared against all patients.
Research New Zealand | June 2016

Appendix C: Tables by contract holder
Maroon/dark shading indicates result is significantly higher when compared against all patients.
Grey/light shading indicates result is significantly lower when compared against all patients.
Research New Zealand | June 2016 183