green roof water monitoring report - american … · water analysis handbook, 1989) was followed...
TRANSCRIPT

Green Roof Water Quality and Quantity Monitoring
Dr. Charles C. Glass
Associate Professor
Department of Civil Engineering
Howard University
and
ETEC L.L.C.
6509 41st Avenue
University Park, MD 20782
July 26, 2007

2
INTRODUCTION
This project was designed to address the needs of the Chesapeake Bay Foundation (CBF), the American Society of Landscape Architect’s (ASLA), and the District of Columbia's Water and Sewer Authority by monitoring the performance of the ASLA green roof for water runoff reduction and water quality improvement. Under the National Pollutant Discharge Elimination System (NPDES), Municipal Separate Storm Sewer System (MS4), the government is tasked to utilize best management practice (BMP) methods to substantially minimize pollution transport from storm water runoff. Green roofs are being promoted as an optional BMP throughout the Washington D.C. Metropolitan area. The 3,000 sq ft ASLA green roof was installed in May of 2006 at its headquarters building on 636 Eye Street NW, Washington DC. It is one of seven green roof demonstration projects in the Anacostia River Watershed of DC that the Chesapeake Bay Foundation has partially funded with an incentive grant. ETEC monitored water quality and quantity on this roof for 5 rain events in the fall of 2006 and the spring of 2007. The sampling and monitoring of the green roof was performed in accordance with the standard operations for collection and measurement promulgated by the USEPA.
In this study pH, temperature, total suspended solids (TSS), total dissolved solids
(TDS), dissolved oxygen (DO), chemical oxygen demand (COD), and nutrients (ammonia, nitrite, nitrate, phosphate, and total phosphorus) were measured on rain water collected on the roof and runoff collected from the downspout from the green roof. Heavy metals (e.g. Cadmium (Cd), chromium (Cr), copper (Cu), lead (Pb), mercury (Hg), arsenic (As)) were measured for two rain events to check for their presence. All of the samples were measured in triplicate to confirm the reproducibility of the results and the accuracy of both the equipment and the sampling methodology.
The two primary goals of this project were to determine the reduction in runoff
and to determine the concentrations of contaminants of concern leaving this green roof. Two flow meters were already installed on the roof of the ASLA building giving flow data for the water leaving the roof. ASLA collected the water in two clean collection jars provided by ETEC. ASLA staff and ETEC coordinated the collection and proper methodology to avoid human error in sample collection. A quantitative measure of the total flow or rainfall load on the roof was calculated by the known area of the roof and the acquired depth of rainfall.
The duration of the sampling and monitoring effort for ASLA green roof was not
to exceed 8 rain events or eight months from the notice-to proceed date. ETEC coordinated with CBF and ASLA to determine a schedule for sample collection and monitoring. In the end, since about 75% of the estimated rainfall did not pass through the green roof, 5 sample events were collected over 10 months. Sampling followed the same protocols as in earlier studies performed by Dr. Glass, with the only adjustment necessary being the collection of rain water, which is quite a different input source from normal stormwater runoff from streets or parking lots. MATERIALS AND METHODS

3
The field methodology of this project consisted simply of collection of rainwater directly into a glass sample vessel placed on the ASLA roof and collection of the effluent water flowing from the roof through a sample port in the ceiling under the roof. Once a sample was obtained by ASLA, ETEC was contacted and collected the sample from ASLA within the day. The sample was then prepared for storage or analyzed that same day. The following Table 1 lists the parameters evaluated in this project and the methods used to determine their values.
Table 1. Parameters Measured and the Technique Utilized for Measurement
Constituent
Name Analytical Method
Collection
method Containers
Volume
Required * Preservative
Maximum
holding
time
Cadmium AAS- Furnace Composite Plastic, Glass
60 μL Filter on site
HNO3 to PH<2 6 mths
Chromium AAS- Furnace Composite Plastic, Glass
60 μL Filter on site
HNO3 to PH<2 6 mths
Copper AAS- Furnace Composite Plastic, Glass
60 μL Filter on site
HNO3 to PH<2 6 mths
Iron AAS- Furnace Composite Plastic, Glass
60 μL Filter on site
HNO3 to PH<2 6 mths
Lead AAS- Furnace Composite Plastic, Glass
60 μL Filter on site
HNO3 to PH<2 6 mths
Arsenic AAS- Furnace Composite Plastic,
Glass 60 μL
Filter on site
HNO3 to PH<2 6 mths
Zinc AAS- Furnace Composite Plastic,
Glass 60 μL
Filter on site
HNO3 to PH<2 6 mths
Mercury Cold Vapor
Technique Composite
Plastic,
Glass 300 mL
Filter on site
HNO3 to PH<2
Glass: 38 days/
Plastic:13 days
TS-Total Solids Total Solids
Dried at 103-105°C Composite
Plastic,
Glass
< 200 mg
residue Cool, 4°C 24 hrs
TDS- Total Dissolved Solids
Total Dissolved Solids Dried at 180°C
Composite Plastic, Glass
< 200 mg residue Cool, 4°C 24 hrs
TSS-Total Suspended
Solids
Total Suspended Solids Dried at 103-105°C
Composite Plastic, Glass
< 200 mg residue Cool, 4°C 24 hrs
COD Closed reflux, Colorimetric
Method Composite Glass 500 mL
Filter on site H2 SO4 to PH<2
No holding (better)
Nitrogen Ammonia
Ammonia selective electrode
Composite Plastic, Glass
150 mL Cool, 4°C
H2SO4 to PH<2 24 hrs
Nitrogen-Nitrite Ion Chromatography Composite Plastic, Glass
100 mL Cool, 4°C No holding
(better)
Nitrogen-Nitrate Ion Chromatography Composite Plastic,
Glass 100 mL
Cool, 4°C
H2SO4 to PH<2 24 hrs
Soluble (dissolved)
Phosphorus Ion Chromatography Composite
Plastic,
Glass 100 mL
Filter on site
Cool, 4°C 48 hrs
Total Phosphorus Ion Chromatography Composite Plastic,
Glass 100 mL
Filter on site
Cool, 4°C 48 hrs
Temperature Thermocouple Measurement
on site
Plastic,
Glass N/A Determine on site
No
holding
pH pH-probe Measurement
on site Plastic, Glass
N/A Cool, 4°C
Determine on site 6 hrs
Specific parameters such as pH, dissolved oxygen (DO) and temperature were
determined immediately after sample collection. HACH sension1 portable pH meter with resolution up to 0.01 was used to measure the pH and temperature of the samples. DO

4
measurements were taken using an Oakton DO 100 portable meter. In the laboratory the pH, DO and temperature were measured. Approximately 200 mL of rain and outlet samples were put into 250 mL beakers for the necessary measurements and all the measurements were performed in triplicate.
Organic content of samples was determined from chemical oxygen demand (COD). COD levels were analyzed by using HACH COD Reactor with HACH DR/2010 Portable Datalogging Spectrophotometer and the COD Reactor Digestion Method for low range sample concentration (Hach water analysis handbook, 1989) was followed throughout the analysis. COD is a surrogate parameter that measures the total organic soluble organic content in water. COD is thought of as a more conservative measure of organic content than Biochemical Oxygen Demand (BOD). To determine the solid content of the samples, total suspended solids (TSS) and total dissolved solids (TDS) measurements were conducted using method 2540 D and 2540 E (APHA, 1998).
Nutrients analyzed in the laboratory included; total phosphorus (TP), nitrite (NO2
- -N), nitrate (NO3
- -N), phosphate (PO4-3-P) and ammonia (NH3-N). The organic and acid
Hydrolyzable/Acid Persulfate Digestion Method (Hach, 1989) was used to measure the total phosphorus content. NO2
--N, NO3- -N, PO4
-3-P and ammonia were analyzed with the Dionex IC DX- 120 instrument and an attached AS40 Automated sampler unit. The guard column for analyzing the anions and cations were AS14A and CS12 respectively. The eluent used in analyzing the anions were 8 mM sodium carbonate (Na2CO3) and 1 mM sodium bicarbonate (NaHCO3) whereas 20 mM methyl sulfonic acid (MSA) was the eluent used in analyzing the cation. In both cases, the eluent flowrates were 1.0mL/min and the column pressure was monitored such that it never exceeded 2700 psi.
Heavy metals present in two of the samples were analyzed using atomic
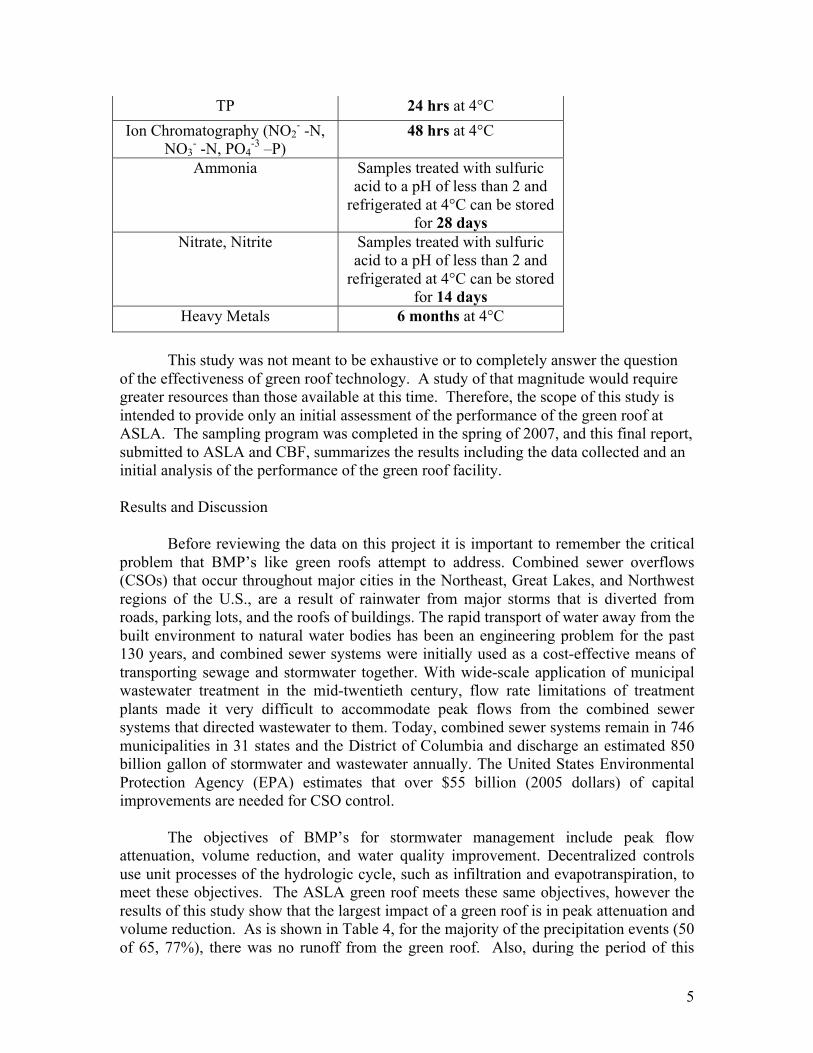
absorption spectroscopy (AAS). The furnace module of the AAS was used for all the heavy metals analysis. The AAS system comprised of AAnalyst 800 with WinLab 32 software and AS 800 Autosampler. For accuracy in heavy metal analysis, required matrix modifiers for each of the specific heavy metals of interest were included in the analysis. Both rain and outlet discharge samples were filtered prior to IC and AAS analysis. Accuracy in test results were maintained by performing all laboratory analysis on fresh samples or within 24 hours upon sample collection however samples that could not be analyzed within this time frame were preserved on a short term basis (1 to 2 days) or long periods (6 months) for future analysis (APHA, 1998). All of the samples were analyzed well within the time restrictions listed in Table 2.
Table 2 Storage Times for Standard Methods Tests
Standard test Holding time
TSS 6 months
COD Samples treated with sulfuric acid to a pH of less than 2 and
refrigerated at 4°C can be stored for 28 days
5
TP 24 hrs at 4°C
Ion Chromatography (NO2- -N,
NO3- -N, PO4
-3 –P) 48 hrs at 4°C
Ammonia Samples treated with sulfuric acid to a pH of less than 2 and
refrigerated at 4°C can be stored for 28 days
Nitrate, Nitrite Samples treated with sulfuric acid to a pH of less than 2 and
refrigerated at 4°C can be stored for 14 days
Heavy Metals 6 months at 4°C
This study was not meant to be exhaustive or to completely answer the question
of the effectiveness of green roof technology. A study of that magnitude would require greater resources than those available at this time. Therefore, the scope of this study is intended to provide only an initial assessment of the performance of the green roof at ASLA. The sampling program was completed in the spring of 2007, and this final report, submitted to ASLA and CBF, summarizes the results including the data collected and an initial analysis of the performance of the green roof facility. Results and Discussion
Before reviewing the data on this project it is important to remember the critical problem that BMP’s like green roofs attempt to address. Combined sewer overflows (CSOs) that occur throughout major cities in the Northeast, Great Lakes, and Northwest regions of the U.S., are a result of rainwater from major storms that is diverted from roads, parking lots, and the roofs of buildings. The rapid transport of water away from the built environment to natural water bodies has been an engineering problem for the past 130 years, and combined sewer systems were initially used as a cost-effective means of transporting sewage and stormwater together. With wide-scale application of municipal wastewater treatment in the mid-twentieth century, flow rate limitations of treatment plants made it very difficult to accommodate peak flows from the combined sewer systems that directed wastewater to them. Today, combined sewer systems remain in 746 municipalities in 31 states and the District of Columbia and discharge an estimated 850 billion gallon of stormwater and wastewater annually. The United States Environmental Protection Agency (EPA) estimates that over $55 billion (2005 dollars) of capital improvements are needed for CSO control.
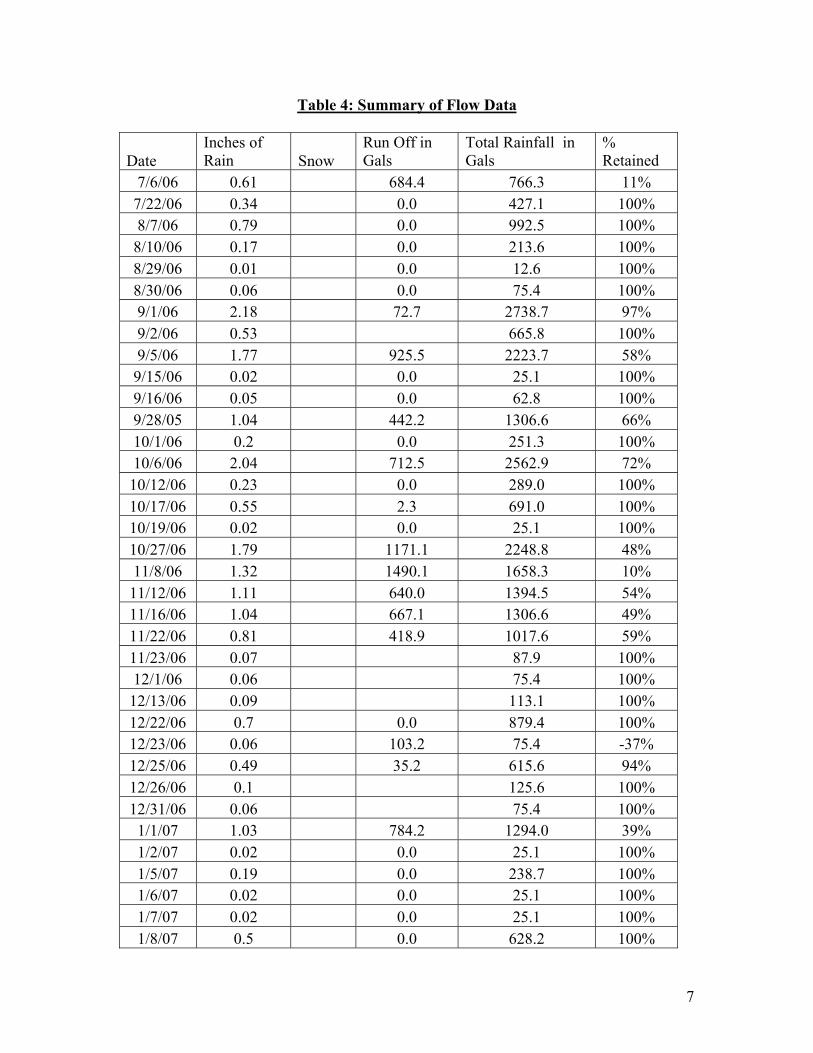
The objectives of BMP’s for stormwater management include peak flow
attenuation, volume reduction, and water quality improvement. Decentralized controls use unit processes of the hydrologic cycle, such as infiltration and evapotranspiration, to meet these objectives. The ASLA green roof meets these same objectives, however the results of this study show that the largest impact of a green roof is in peak attenuation and volume reduction. As is shown in Table 4, for the majority of the precipitation events (50 of 65, 77%), there was no runoff from the green roof. Also, during the period of this

6
monitoring, the total volume of runoff leaving the roof was reduced by 74% (9,725 of 37,237 gallons), thus resulting in a significant reduction in the volume of water entering the combined sewer system from the roof over the ASLA building. Although no definitive peak attenuation is presented here, anecdotal evidence showed a significant delay between rainfall and water leaving the roof as runoff through the piping system.
7
Table 4: Summary of Flow Data
Date Inches of Rain Snow
Run Off in Gals
Total Rainfall in Gals
% Retained
7/6/06 0.61 684.4 766.3 11%
7/22/06 0.34 0.0 427.1 100%
8/7/06 0.79 0.0 992.5 100%
8/10/06 0.17 0.0 213.6 100%
8/29/06 0.01 0.0 12.6 100%
8/30/06 0.06 0.0 75.4 100%
9/1/06 2.18 72.7 2738.7 97%
9/2/06 0.53 665.8 100%
9/5/06 1.77 925.5 2223.7 58%
9/15/06 0.02 0.0 25.1 100%
9/16/06 0.05 0.0 62.8 100%
9/28/05 1.04 442.2 1306.6 66%
10/1/06 0.2 0.0 251.3 100%
10/6/06 2.04 712.5 2562.9 72%
10/12/06 0.23 0.0 289.0 100%
10/17/06 0.55 2.3 691.0 100%
10/19/06 0.02 0.0 25.1 100%
10/27/06 1.79 1171.1 2248.8 48%
11/8/06 1.32 1490.1 1658.3 10%
11/12/06 1.11 640.0 1394.5 54%
11/16/06 1.04 667.1 1306.6 49%
11/22/06 0.81 418.9 1017.6 59%
11/23/06 0.07 87.9 100%
12/1/06 0.06 75.4 100%
12/13/06 0.09 113.1 100%
12/22/06 0.7 0.0 879.4 100%
12/23/06 0.06 103.2 75.4 -37%
12/25/06 0.49 35.2 615.6 94%
12/26/06 0.1 125.6 100%
12/31/06 0.06 75.4 100%
1/1/07 1.03 784.2 1294.0 39%
1/2/07 0.02 0.0 25.1 100%
1/5/07 0.19 0.0 238.7 100%
1/6/07 0.02 0.0 25.1 100%
1/7/07 0.02 0.0 25.1 100%
1/8/07 0.5 0.0 628.2 100%

8
1/12/07 0.02 0.0 25.1 100%
1/13/07 0.01 0.0 12.6 100%
1/14/07 0.06 0.0 75.4 100%
1/21/07 0.33 1.2" snow 0.0 414.6 100%
1/22/07 0.02 0.0 25.1 100%
1/28/07 0.05 0.0 62.8 100%
2/1/07 0.01 0.0 12.6 100%
2/2/07 0.08 0.0 100.5 100%
2/6/07 0.02 .2"
snow 0.0 25.1 100%
2/7/07 0.04 .5"
snow 0.0 50.3 100%
2/13/07 0.17 .4"
snow 0.0 213.6 100%
2/14/07 0.89 1.8" snow 0.0 1118.1 100%
2/20/07 0.25 0.0 314.1 100%
2/22/07 0.01 0.0 12.6 100%
2/25/07 0.75 2.9" snow 0.0 942.2 100%
3/1/07 0.19 0.0 238.7 100%
3/2/07 0.57 0.0 716.1 100%
3/7/07 0.15 1.8" snow 0.0 188.4 100%
3/16/07 2.48 1526.7 3115.6 51%
3/24/07 0.06 75.4 100%
4/4/07 0.46 577.9 100%
4/7/07 0.09 113.1 100%
4/11/07 0.27 339.2 100%
4/12/07 0.74 48.1 929.7 95%
4/26/07 0.04 50.3 100%
4/27/07 0.17 213.6 100%
5/12/07 1.05 0.4 1319.1 100%
5/16/07 0.18 226.1 100%
5/27/07 0.39 490.0 100%
Total 29.64 9724.5 37236.9 74%

9
Figure 1: Rainfall Load versus Roof Runoff
Figure 1 clearly depicts the difference between the volume of rainfall that falls on the area of the green roof and the amount of runoff that is produced. This difference between the peaks represents the vast amount of rainfall that never reaches the CSO. From event 31 through event 55 no rainfall reached the effluent down pipe leading from the roof. While this demonstrates the benefits of the green roof, it also prevents the collection of many runoff samples since only significant rain events produce runoff.
10
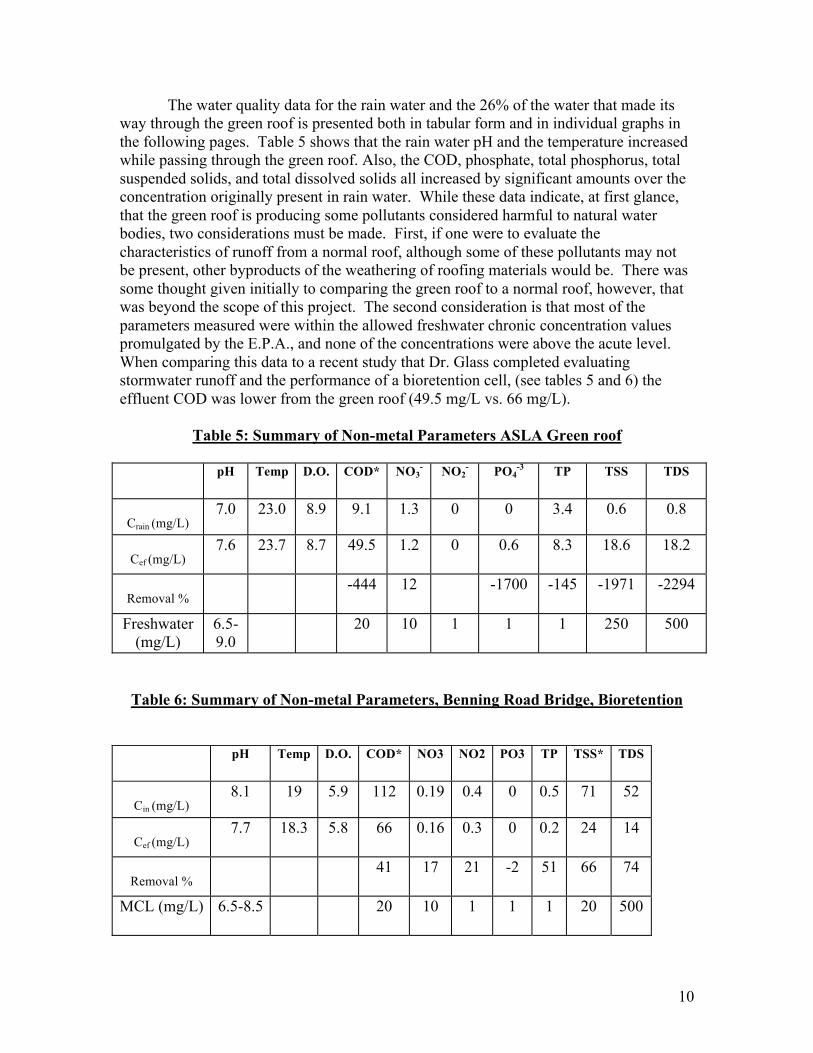
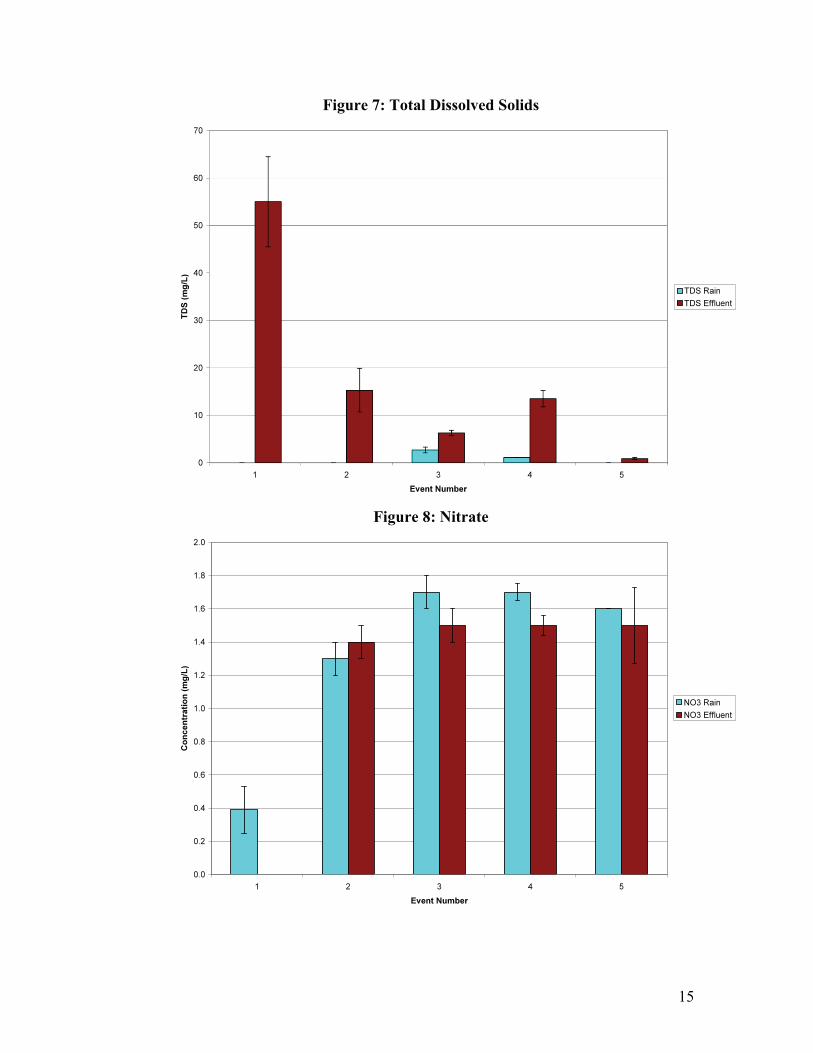
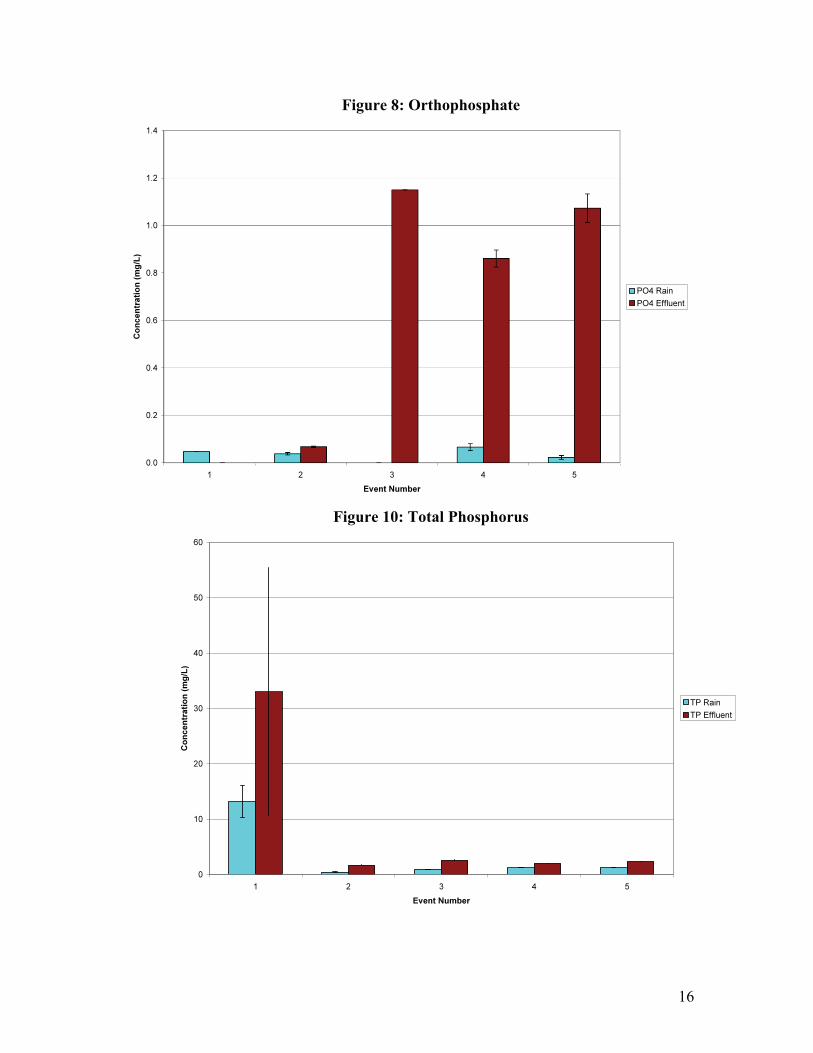
The water quality data for the rain water and the 26% of the water that made its way through the green roof is presented both in tabular form and in individual graphs in the following pages. Table 5 shows that the rain water pH and the temperature increased while passing through the green roof. Also, the COD, phosphate, total phosphorus, total suspended solids, and total dissolved solids all increased by significant amounts over the concentration originally present in rain water. While these data indicate, at first glance, that the green roof is producing some pollutants considered harmful to natural water bodies, two considerations must be made. First, if one were to evaluate the characteristics of runoff from a normal roof, although some of these pollutants may not be present, other byproducts of the weathering of roofing materials would be. There was some thought given initially to comparing the green roof to a normal roof, however, that was beyond the scope of this project. The second consideration is that most of the parameters measured were within the allowed freshwater chronic concentration values promulgated by the E.P.A., and none of the concentrations were above the acute level. When comparing this data to a recent study that Dr. Glass completed evaluating stormwater runoff and the performance of a bioretention cell, (see tables 5 and 6) the effluent COD was lower from the green roof (49.5 mg/L vs. 66 mg/L).
Table 5: Summary of Non-metal Parameters ASLA Green roof
pH Temp D.O. COD* NO3- NO2
- PO4
-3 TP TSS TDS
Crain (mg/L) 7.0 23.0 8.9 9.1 1.3 0 0 3.4 0.6 0.8
Cef (mg/L) 7.6 23.7 8.7 49.5 1.2 0 0.6 8.3 18.6 18.2
Removal % -444 12 -1700 -145 -1971 -2294
Freshwater (mg/L)
6.5-9.0
20 10 1 1 1 250 500
Table 6: Summary of Non-metal Parameters, Benning Road Bridge, Bioretention
pH Temp D.O. COD* NO3 NO2 PO3 TP TSS* TDS
Cin (mg/L) 8.1 19 5.9 112 0.19 0.4 0 0.5 71 52
Cef (mg/L) 7.7 18.3 5.8 66 0.16 0.3 0 0.2 24 14
Removal % 41 17 21 -2 51 66 74
MCL (mg/L) 6.5-8.5 20 10 1 1 1 20 500
11
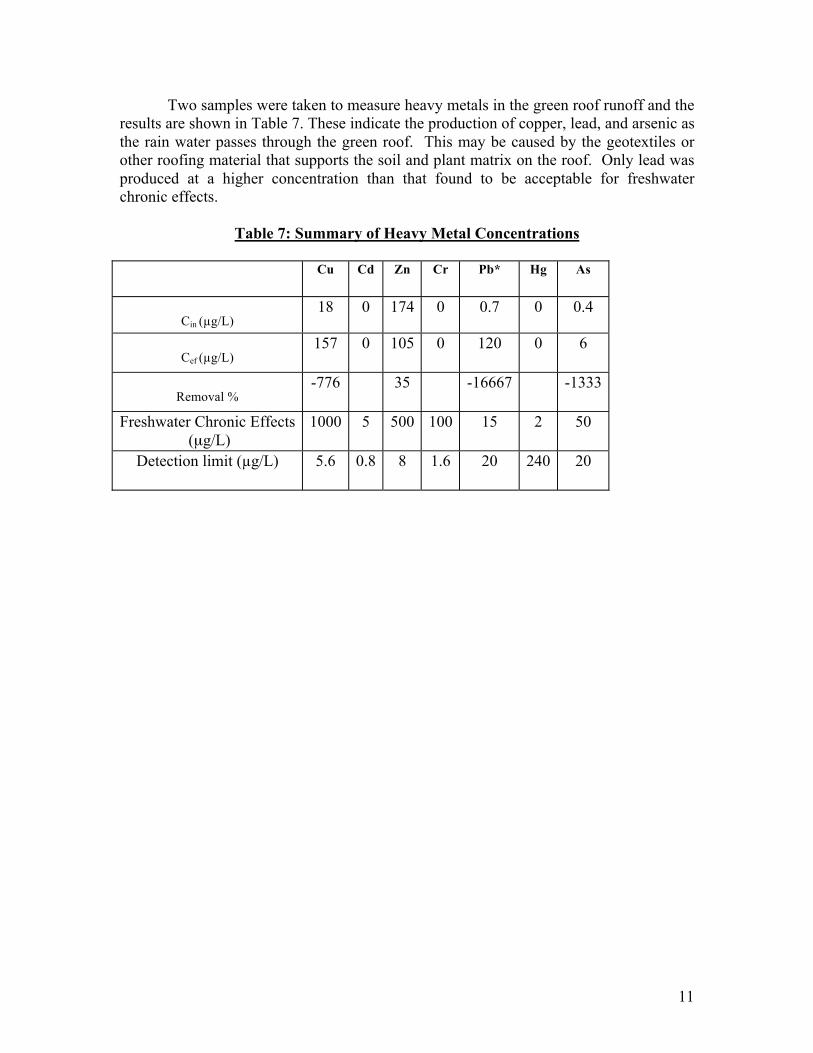
Two samples were taken to measure heavy metals in the green roof runoff and the results are shown in Table 7. These indicate the production of copper, lead, and arsenic as the rain water passes through the green roof. This may be caused by the geotextiles or other roofing material that supports the soil and plant matrix on the roof. Only lead was produced at a higher concentration than that found to be acceptable for freshwater chronic effects.
Table 7: Summary of Heavy Metal Concentrations
Cu Cd Zn Cr Pb* Hg As
Cin ( g/L) 18 0 174 0 0.7 0 0.4
Cef ( g/L) 157 0 105 0 120 0 6
Removal % -776 35 -16667 -1333
Freshwater Chronic Effects (μg/L)
1000 5 500 100 15 2 50
Detection limit ( g/L) 5.6 0.8 8 1.6 20
240 20

12
Figure 2: Chemical Oxygen Demand

13
Figure 3: pH
Figure 4: Dissolved Oxygen

14
Figure 5: Temperature
Figure 6: Total Suspended Solids
15
Figure 7: Total Dissolved Solids
Figure 8: Nitrate
16
Figure 8: Orthophosphate
Figure 10: Total Phosphorus
17
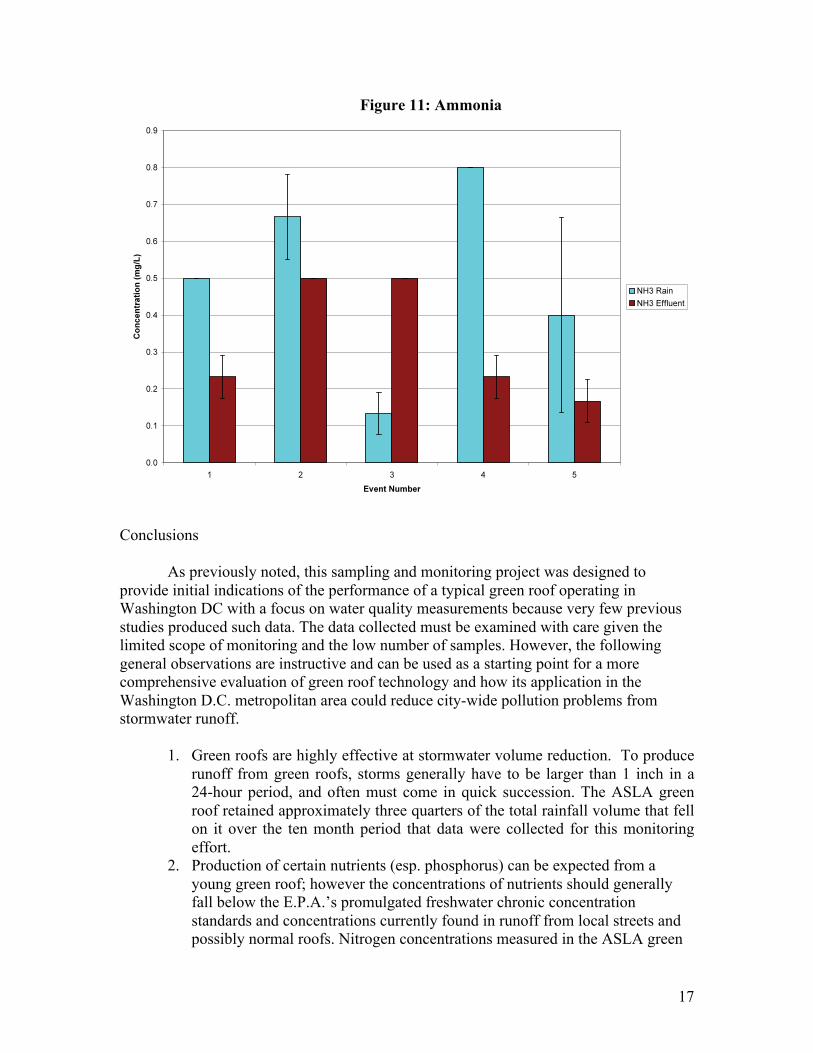
Figure 11: Ammonia
Conclusions As previously noted, this sampling and monitoring project was designed to provide initial indications of the performance of a typical green roof operating in Washington DC with a focus on water quality measurements because very few previous studies produced such data. The data collected must be examined with care given the limited scope of monitoring and the low number of samples. However, the following general observations are instructive and can be used as a starting point for a more comprehensive evaluation of green roof technology and how its application in the Washington D.C. metropolitan area could reduce city-wide pollution problems from stormwater runoff.
1. Green roofs are highly effective at stormwater volume reduction. To produce runoff from green roofs, storms generally have to be larger than 1 inch in a 24-hour period, and often must come in quick succession. The ASLA green roof retained approximately three quarters of the total rainfall volume that fell on it over the ten month period that data were collected for this monitoring effort.
2. Production of certain nutrients (esp. phosphorus) can be expected from a young green roof; however the concentrations of nutrients should generally fall below the E.P.A.’s promulgated freshwater chronic concentration standards and concentrations currently found in runoff from local streets and possibly normal roofs. Nitrogen concentrations measured in the ASLA green

18
roof runoff were similar to the values measured in the rainwater indicating that, when combined with the measured volume reduction, a significant overall reduction of nitrogen in stormwater runoff from a green roof can be expected.
3. Heavy metals can also be produced by green roofs however they too should largely fall below the allowable limits and below street concentrations.
This report should be viewed as providing useful initial data for beginning to evaluate green roof performance in the Washington D.C. metropolitan area. The ASLA green roof seems to perform well with water retention and evapotranspiration and reducing the nitrogen load in runoff. In time, as the green roof continues to mature, there will probably be lower concentrations of phosphorus in the water that does pass through the roof. Green roofs have significant potential for reducing stormwater carried pollutants in major metropolitan areas such as Washington DC. However, more comprehensive and extensive monitoring studies are needed to evaluate specific performance measures of specific designs and develop accurate predictive tools.