green supply chain management practice of rmg sector in
TRANSCRIPT

IOSR Journal of Business and Management (IOSR-JBM)
e-ISSN: 2278-487X, p-ISSN: 2319-7668. Volume 23, Issue 4. Ser. II (April 2021), PP 51-63 www.iosrjournals.org
DOI: 10.9790/487X-2304025163 www.iosrjournals.org 51 | Page
Green Supply Chain Management practice of RMG sector in
Bangladesh
Mohammad RajibUddin Assistant Professor, Department of Business Administration (General), Faculty of Business Studies, Bangladesh
University of Professionals (BUP)
Maria Ahmed Kuntu Lecturer, Exim Bank Agricultural University Bangladesh
Mohammad Habibur Rahman Research Assistant, University of Northern British Columbia, Prince George, British Colombia
Abstract The core material of RMG firms has implemented green supply chain management to overcome the difficulties
of integrating green supply chain management in the RMG sector of Bangladesh, according to this research. We
looked at supply chain management and green supply chain management in the RMG sector in Bangladesh in
this article. To determine the extent to which GSCM is used in Bangladesh's RMG industry and to assess the
current level of acceptance of green supply chain operation in the RMG market. I chose these three companies
for this article. Since they ensure growth, expansion, and income, ViyellaTex, Fakir Industry, and Sinha Group
are socially and environmentally responsible. The dominant variables of supply chain efficiency, such as
economic, environmental, and social, were identified using a system dynamics approach in the RMG field. For
this analysis, we used SPSS, ANOVA, and co-relation of co-efficient. According to our results, Bangladesh has refused to raise the fine for environmental incidents. We discovered that a decrease in the frequency of
environmental accidents has a negative relationship with green marketing mix using co-efficient of correlation
analysis. So for maintaining green marketing mix we need to improve the decrease in consumption for
hazardous/toxic materials. Finally, we can see that increased capacity utilization has a negative relationship
with increased customer satisfaction, based on the assumptions. In the RMG market, sharing obligations with
suppliers and motivating them to implement more environmentally friendly behaviors is extremely important in
improving product quality and ensuring that it is properly preserved.
Keywords: Green supply chain, RMG industry, supply chain adoption and performance, environmentally
friendly ---------------------------------------------------------------------------------------------------------------------------------------
Date of Submission: 25-03-2021 Date of Acceptance: 09-04-2021
---------------------------------------------------------------------------------------------------------------------------------------
I. Introduction In terms of foreign currency earnings RMG is the major field in Bangladesh. Next to china, Bangladesh
is the second largest exporter of garments. It accounts for 80% of global export earnings. Global emissions and
increased awareness are leading consumers to look for more eco friendly alternatives. Target customers are
more health-conscious and consciously support greener lifestyles. Green supply chain management is often viewed as ecological supply chain management or the operation of the environmental supply chain.
Environmental terms and conditions are applicable to regulations, products and services, rules and policies that
inflict minimal environmental harm. Green supply chain management presents undeniably a new platform for
Bangladesh Textile industry. In reality, green supply chain management’s goal is to enhance the manufacturing
system to make it more carbon efficient and avoid damaging environment where possible. Another successful
trend was the effort of buyer codes of conduct (CoCs), which culminated in the voluntary introduction of
cleaner production (CP) initiatives by selected RMG factories that benefit from an integrated strategy to increase
profitability by allowing more productive use of inputs (such as electricity, water or chemicals) while sustaining
or increasing output and reducing waste. So development of the RMG industry is to be maintained by
strengthened green supply chain management (GSCM).

Green Supply Chain Management practice of RMG sector in Bangladesh
DOI: 10.9790/487X-2304025163 www.iosrjournals.org 52 | Page
II. Literature Review The RMG industry depends heavily on the imported raw materials. Green supply chain management
(GSCM) seeks to reduce environmental harm caused by manufacturing operations, while converting
environmental problems into supply chain management. In addition to poor use of information and
communication technology (ICT) and inadequate port management, it restricts its ability to adapt rapidly to
demand shifts, which are very significant in the fashion industry (Abdullah, 2008).
According to Lam and Postle (2006), we addressed the benefits and challenges of supply chains for
fashion clothing in Bangladesh. They argued that the Bangladesh clothing industry is largely ignorant of the idea
of supply chain management and industrial benchmark in Bangladesh for both the manufacturing and wholesale
industries.
Saiful and Noorul (2013) analyzed the approach is in the global supply chain, spanning local
boundaries provides intercontinental industry with a multiplicity of general obstructions: barriers, non-tariff obstructions, switching prices and commodity demand disparities, market discounts and company
insights.Various steps of the supply chain have competing priorities and targets.
According to Flammer (2019), the eco-friendly behavior of businesses is closely tied to large rises in
stock prices, whereas firms with an eco-harmful behavior risk declines in stock prices.
According to Ninlawan et al. [11] and Thooet al.[24], Green sourcing, green production, green delivery
and green logistics are essential aspects of the GSCM activities needed by industrial industries in order to
achieve improved sustainability.
Lee et al. [33] noted, That GSCM activities consist of organizational and operating approaches aimed
at enhancing environmental protection, such as internal environmental management, renewable sourcing,
consumer collaboration and ecodesign.
Environmental management system help comply with optional and compulsory environmental requirements and meet waste management goals by improved environmental preparation from raw material
procurement through to finished pro-duct delivery (Darnall, 2006; Darnall and Edwards, 2006).
ED, also known as 'environmental architecture,' refers to the degree to which businesses manufacture
goods and/or production processes with limited effects on the natural environment (Zhu et al., 2008).It is a long-
term plan for emissions reduction that takes into account product construction for quick disassembly, re-
manufacture or recycling and includes multiple sustainability practices over the product life cycle, including
environmentally sustainable disposal (Tukker et al., 2001) initiatives such as EMSs, ED, SR, and EEM can
benefit as environmental impact changes are identified as reducing emission rates 2000).
Previous reports say organizational sustainable policies including staff engagement, top management
cooperation and systematic implementation (Theyel, 2000).
Several researchers performed studies to establish Green Energy assessment scales (Green et al.2012;
Zhu et al. 2008a; Wee and Quazi 2005). Environmentally relevant policy laws and policies have been described as engines of environmentally
sustainable activities being enforced. The effect of green regulations on the productivity of companies is not
well defined partnership (Preuss 2002).
They addressed the benefits and challenges of supply chains for fashion clothing in Bangladesh. They
argued that the Bangladeshi apparel industry is generally unaware of the SCM principle and the technological
benchmark in Bangladesh for both the manufacturing and retail industries according to Lam and Postle (2006).
III. Research Design & Hypothesis This research is designed as descriptive type which focuses on Green Supply Chain Management practice on RMG Sector of the selected companies.
At first we want to different garments company and collect information from the personnel, in preparing this report, we approach according to following procedure Sources and collection of data
Viyellatex, Sinha group, Fakir Industries, Expert’s opinion and comments observations of the officials,
Face to face conversation with the employees of Garments. And there are some secondary sources like Relevant
books, Newspaper, journals, Websites, Office circular and other published papers.In the sampling process we
will interview selected companies. Like, employee interview, we can collect information from their existing
database so that we are able to aware previous situation and lastly interview from Top tier, mid tier and entry level employees.
We are directly collect information form top level and mid level managers from ViyellaTex group, Sinha Group
and Fakir Industry.
From probability sampling we will pick 52 employees from entry level through

Green Supply Chain Management practice of RMG sector in Bangladesh
DOI: 10.9790/487X-2304025163 www.iosrjournals.org 53 | Page
Sample size= ---------------------------------------------------
1+ (
)
Here, Z=1.44 P=.5e= .1 N=4560 n= 52 (sample size)
Data gathering taken place after preparing the structure for in-depth interview that will need for supportive
information. Interview will take with two or three highly ranked respective officials off all division and others
are from various departments, from different ranked. Their age limit was from 22 to 62. Our sample size will be
52
Data analysis
Before processing the data collected, the completed questionnaires were edited for completeness and
consistency. Collected data was then captured and analyzed using SPSS. The data was analyzed using
descriptive statistics where percentages, means and standard deviation were used. For easy understanding and
interpretation hence drawing conclusion on findings, tables, graphs, and charts were used to determine GSCM
practice adopted by Garment Industry in Bangladesh
IV. Analysis: 1. Decrease in consumption for toxic materials. Ho (Null): Decrease in consumption for toxic materials in RMG sector of Bangladesh is satisfactory (μ<3)
H1 (Alternative): Decrease in consumption for toxic materials in RMG sector of Bangladesh is not satisfactory
(μ≥3)
Globalisationresultsin both pressure and driversfor all countries and enter-prisesin the world that are trying to
improve their environmental performances.
Global pollution and increased awareness are prompting consumers to seek healthier living choices.
Globalisationresultsin both pressure and driversfor all countries and enter-prisesin the world that are trying to
improve their environmental performances.
Global pollution and increased awareness are prompting consumers to seek healthier living choices.
“Life cycle assessment (LCA) is used to forecast the impacts of different production alternatives of a product to able to choose the most environmentally friendly one. Today designers must compare several different products
according to several categories, such as energy use, toxicity, acidification, CO2 emissions, ozone depletion,
resource depletion and many others. By comparing different products, designers can make decisions about
which environmental hazard to focus on in order to make the product more environmentally
friendly [26]. This causes the minimization of waste and hazardous by-products, air pollution, energy
expenditure and other factors.” (Eyuruk, 2018)
Interpretation:
We can consider mean value 3.1250 which is higher than the test value. So according to the procedure of
hypothesis testing by one sample t-test null hypothesis is rejected.
Rejection Region:
Rejection HO if t> ±1.44 P value> .15
Findings from the One sample t-test:
Test statistics .680<1.44
P value .0482< .15
It is a single one tailed test and the null hypothesis is accepted because t value is less than 1.44 and P value is
smaller than .15
2. Green Purchasing: Eco Labeling Product
Ho (Null): In Bangladesh the RMG sector is maintaining eco labeling products (μ<3)
H1 (Alternative): In Bangladesh the RMG sector is not maintaining eco labeling products (μ≥3)
“Eco-labels are normally issued either by Government supported or private enterprises once it has been proved
that the product of the applicant has met the criteria set by them for the label. The criteria for the use of eco-
labels are mostly based on the cradle-to-grave approach, i.e. the life-cycle analysis of the product. The cradle-to-

Green Supply Chain Management practice of RMG sector in Bangladesh
DOI: 10.9790/487X-2304025163 www.iosrjournals.org 54 | Page
grave approach for textiles and clothing is making the assessment of the impact on the environment of the
product during its life-cycle: processing of raw materials, production, distribution, consumption (maintenance,
i.e. washing, ironing, dry-cleaning) and finally disposal of the product. Admittedly there are big differences between various eco-labelling schemes, some of which are based on detailed analysis of the environmental
impacts as again some other systems may analyze only certain stages of the life-cycle” (Ganesan, November
2007)
Interpretation:
We can consider mean value 3.2500 which is higher than the test value. So according to the procedure of
hypothesis testing by one sample t-test null hypothesis is rejected.
Rejection Region:
Rejection HO if t> ±1.44
P value> .15
Findings from the One sample t-test: Test statistics 1.856>1.44
P value .273> .15
It is a single one tailed test and the null hypothesis is rejected because t value is greater than 1.44 and P value is
greater than .15
3. Green Purchasing: Cooperation with suppliers for environmental objectives.
Ho (Null): In RMG sector of Bangladesh the cooperation with suppliers for environmental objectives is
satisfactory (μ<3)
H1 (Alternative): In RMG sector of Bangladesh the cooperation with suppliers for environmental objectives is
not satisfactory (μ≥3)
“Green supply chain management (GSCM) enhances a firm’s competitiveness for sustainable growth. GSCM is especially important in the construction industry, a project-based business that often results in heavy
environmental pollution. For the successful implementation of GSCM in the construction industry to occur,
contractors should make the best use of suppliers’ environmental capabilities based on shared understanding of
the capabilities.” (Eryuruk, 27 November, 2018)
Interpretation:
We can consider mean value 2.6562 which is lower than the test value. So according to the procedure of
hypothesis testing by one sample t-test null hypothesis is accepted.
Rejection Region:
Rejection HO if t> ±1.44
P value> .15
Findings from the One sample t-test:
Test statistics -1.384<1.44
P value .0176< .15
It is a single one tailed test and the null hypothesis is accepted because t value is less than 1.44 and P value is
smaller than .15
4. Green Marketing: Green image of Branding.
Ho (Null): Green image of branding for RMG sector in Bangladesh is moderate (μ<3)
H1 (Alternative): Green image of branding for RMG sector in Bangladesh is not moderate (μ≥3)
“Eco friendly clothing is created from resources that are environmentally friendly and sustainable.
Consideration is given to the product’s total life span as well as its impact on the planet, in other words, the carbon footprint [1]. Eco friendly clothing is created from resources that are environmentally friendly and
sustainable, and efficient management of obtaining green clothing requires to consider all stages, starting from
designing for the environment, obtaining raw materials, producing garments, distributing them to the channels,
stores and also considering their reverse logistics and waste.” (Eryuruk, Greeninf of the Textile and Clothing
Industry, November, 2018)
Interpretation:
Here the table illustrate that the mean value is higher than the test value. In the one sample T test table, we can
consider mean value of 3.7812 which is higher than the test value. So according to the procedure of hypothesis
testing by one sample test, the null hypothesis is rejected.

Green Supply Chain Management practice of RMG sector in Bangladesh
DOI: 10.9790/487X-2304025163 www.iosrjournals.org 55 | Page
Rejection Region:
Rejection HO if t> ±1.44
P value> .15
Findings from the One sample t-test:
Test statistics 10.522>1.44
P value .1589> .15
It is a single one tailed test and the null hypothesis is rejected because t value is greater than 1.44 and P value is
greater than .15
5.Supplier relationship: Sharing responsibilities with supplier encouraging them to adopt more
environmental friendly behaviors.
Ho (Null): The authorities of RMG sector in Bangladesh are sharing responsibilities with supplier encouraging
them to adopt more environmental friendly behaviors (μ<4) H1 (Alternative): The authorities of RMG sector in Bangladesh are not sharing responsibilities with supplier
encouraging them to adopt more environmental friendly behaviors (μ≥4)
“Not too long ago, companies were reluctant to cave any work an outside supplier before there was a valid
contract establishing terms of their working relationship. This has since changed with the recent emergence of
value managed relationships and long term sourcing strategies. In the early 1980s with increasing international
competitiveness, profit margins declined sharply.” (Biren Prasad, 2014)
Interpretation:
Here the table illustrate that the mean value is lower than the test value. In the one sample T test table, we can
consider mean value of 3.7812 which is lower than the test value. So according to the procedure of hypothesis
testing by one sample test, the null hypothesis is accepted.
Rejection Region:
Rejection HO if t> ±1.44
P value> .15
Findings from the One sample t-test:
Test statistics -1.269<1.44
P value .0214< .15
It is a single one tailed test and the null hypothesis is accepted because t value is less than 1.44 and P value is
smaller than .15
5.Economic performance: Increase in fee for waste discharge
Ho (Null): The Bangladesh Government need to increase in fee for waste discharge in RMG sector (μ<3)
H1 (Alternative): The Bangladesh Government need not to increase in fee for waste discharge in RMG sector
(μ≥3)
“For the first time in more than a decade, waste discharge fees and annual fees paid for by industry and local
government will be increased to fund improved environmental protection in B.C., as well as to provide better
service. Effective April 1, 2018, the following fees under the Environmental Management Act (EMA) will
increase, for the first time since 2006: Waste discharge permit application and amendment fees, and annual fees
for air, effluent, refuse and storage permits.” (Environmental Management Act: Waste discharge fee increases
will strengthen environmental protection, March 28, 2018)
Interpretation: Here the table illustrate that the mean value is higher than the test value. In the one sample T test table, we can
consider mean value of 4.1250 which is higher than the test value. So according to the procedure of hypothesis
testing by one sample test, the null hypothesis is rejected.
Rejection Region:
Rejection HO if t> ±1.44
P value> .15
Findings from the One sample t-test:
Test statistics 6.313>1.44
P value .5010> .15

Green Supply Chain Management practice of RMG sector in Bangladesh
DOI: 10.9790/487X-2304025163 www.iosrjournals.org 56 | Page
It is a single one tailed test and the null hypothesis is rejected because t value is greater than 1.44 and P value is
greater than .15
7. Economic performance: Increase in fine for environmental accidents
Ho (Null): The Bangladesh Government need to increase in fee for environmental accidents in RMG sector
(μ<4)
H1 (Alternative): The Bangladesh Government need not to increase in fee for environmental accidents in RMG
sector (μ≥4)
Environmental managers and committees should continue to monitor, evaluate and look for ways to improve
operations so as to reduce the risk of incurring an environmental fine or penalty. In particular, companies should
focus capital expenditures in areas that minimize releases to air or water. Areas of continuous improvement
should include: developing tools and processes to ensure timely reporting of environmental incidents, tracking
air and water emissions, and waste management (including management of designated substances). Where possible, insurance brokers and risk managers should examine the use of environmental insurance as a backstop
to a company’s environmental management system.” (Environmental Fines & Penalties, March, 2019)
Interpretation:
Here the table illustrate that the mean value is lower than the test value. In the one sample T test table, we can
consider mean value of 3.9375 which is lower than the test value. So according to the procedure of hypothesis
testing by one sample test, the null hypothesis is accepted
Rejection Region:
Rejection HO if t> ±1.44
P value> .15
Findings from the One sample t-test:
Test statistics -.442<1.44 P value .0439< .15
It is a single one tailed test and the null hypothesis is accepted because t value is less than 1.44 and P value is
smaller than .15
8. Design product for environmentally friendly objectives
Ho (Null): In Bangladesh there is a practice to design for environmentally friendly objectives (μ<4)
H1 (Alternative): In Bangladesh there is no practice to design for environmentally friendly objectives ( ≥4)
“One of the largest polluters in the world is the textile industry. At least 8,000 chemicals are used to
manufacture raw materials into our clothing and linens. Seven of the top fifteen pesticides used in non-organic cotton growing methods are considered ascarcinogens. According to the World Health Organization, 20,000
deaths occur annually in developing countries from the poisons in pesticides that are used in crops. Growing
cotton alone uses about one-quarter of the world’s insecticides” (Eryuruk S. H., 2018)
Interpretation:
Here the table illustrate that the mean value is lower than the test value. In the one sample T test table, we can
consider mean value of 2.6562 which is lower than the test value. So according to the procedure of hypothesis
testing by one sample test, the null hypothesis is accepted
Rejection Region:
Rejection HO if t> ±1.44
P value> .15
Findings from the One sample t-test: Test statistics -6.294>1.44
P value .224> .15
It is a single one tailed test and the null hypothesis is rejected because t value is greater than 1.44 and P value is
greater than .15.
9. Decrease in Scrap rate
Ho (Null): There is an impact in RMG sector in Bangladesh to decrease in Scrap rate is adequate (μ<3)
H1 (Alternative): There is an impact in RMG sector in Bangladesh to decrease in Scrap rate is not adequate
(μ≥3)

Green Supply Chain Management practice of RMG sector in Bangladesh
DOI: 10.9790/487X-2304025163 www.iosrjournals.org 57 | Page
”The quantity of leftovers per annum is immense. Even according to our optimistic scenario, the world would
create 40 billion square meters of leftover textile per year, almost enough to cover the entire republic of Estonia
with waste. According to the mean prediction, the leftovers would amount to 80 billion square meters, and according the pessimist scenario the waste would cover North Korea and its 120 billion square meters.” (HOW
MUCH DOES GARMENT INDUSTRY ACTUALLY WASTE, 2016)
Interpretation: We can consider mean value 3.9688 which is higher than the test value. So according to the procedure of
hypothesis testing by one sample t-test null hypothesis is rejected.
Rejection Region:
Rejection HO if t> ±1.44
P value> .15
Findings from the One sample t-test:
Test statistics 31>1.44 P value .1622> .15
It is a single one tailed test and the null hypothesis is rejected because t value is greater than 1.44 and P value is
greater than .15
10. Increase in product quality
Ho (Null): In RMG sector of Bangladesh need to increase in product quality (μ<3)
H1 (Alternative): RMG sector of Bangladesh need not to increase in product quality (μ≥3)
“Environmental issues have been considered to be a natural extension of quality problems because poor product
and process quality inevitably lead to environmental problems (Lai, Wu & Wong, 2013). Customer quality
integration improves quality capabilities by collaborating with customers on product design and quality
improvement, and learning from customers (Kuei, Madu & Lin, 2008; Huo, Zhao & Lai, 2014). Customer quality integration can help a manufacturer to use less hazardous materials and optimize production processes,
facilitating the implementation of green purchasing (Klassen & Vachon, 2003; Vachon & Klassen, 2007).”
(Zhang, 2017)
Interpretation:
From the above table, the mean value is higher than the test value. In the One sample T test table, we can
consider mean value of 3.8438 which is higher than the test value. So according to the procedure of hypothesis
testing by one sample test, the null hypothesis is rejected.
Rejection Region:
Rejection HO if t> ±1.44
P value> .15
Findings from the One sample t-test:
Test statistics 12.938>1.44
P value .3175> .15
It is a single one tailed test and the null hypothesis is rejected because t value is greater than 1.44 and P value is
greater than .15.
6.2 Regression and Co-relation co-efficient:
1. Increase in fee for waste for waste treatment,
Increase in fee for waste discharge
Increase in fine for environmental accidents
Decrease in scrap rate
Establishment of a transport system for the recycling of used and defective end-of life products.
Model Summary
Model R R Square Adjusted R Square Std. Error of the Estimate
1 .695a .484 .407 .79411
a. Predictors: (Constant), Decrease in scrap rate, increase in fine for environmental accidents, increase in fee for waste treatment,
increase in fee for waste discharge
Green Supply Chain Management practice of RMG sector in Bangladesh
DOI: 10.9790/487X-2304025163 www.iosrjournals.org 58 | Page
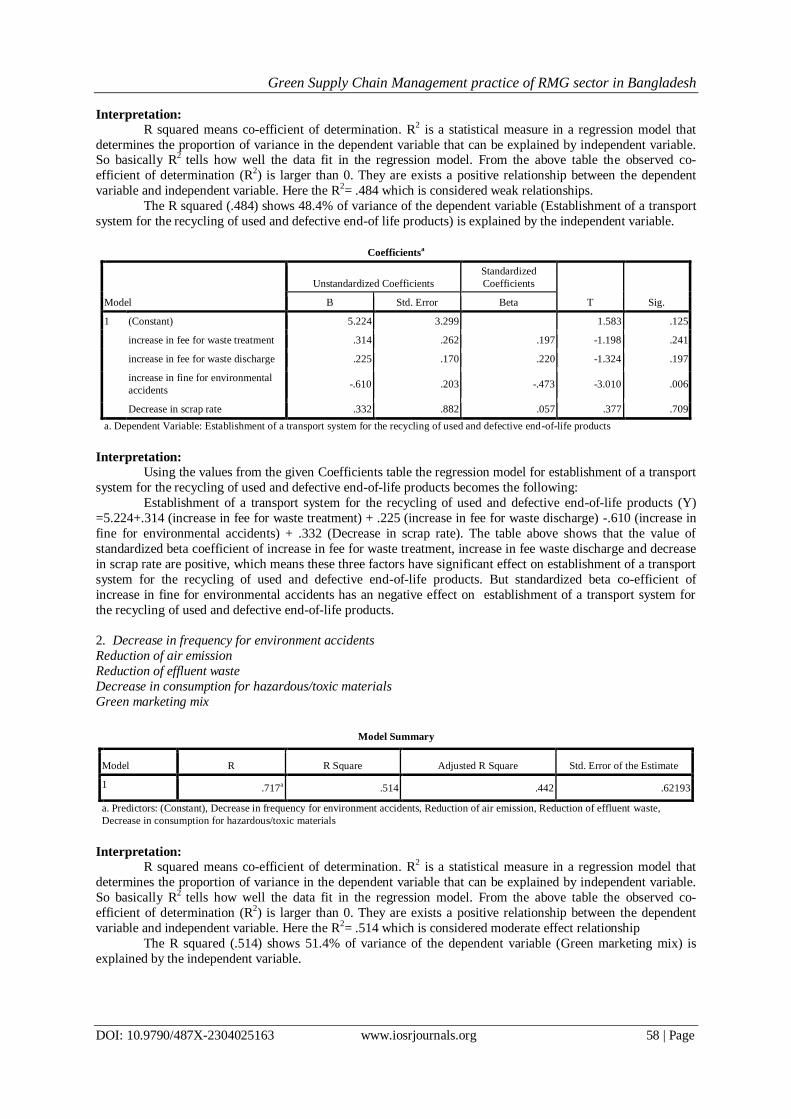
Interpretation:
R squared means co-efficient of determination. R2 is a statistical measure in a regression model that
determines the proportion of variance in the dependent variable that can be explained by independent variable. So basically R2 tells how well the data fit in the regression model. From the above table the observed co-
efficient of determination (R2) is larger than 0. They are exists a positive relationship between the dependent
variable and independent variable. Here the R2= .484 which is considered weak relationships.
The R squared (.484) shows 48.4% of variance of the dependent variable (Establishment of a transport
system for the recycling of used and defective end-of life products) is explained by the independent variable.
Coefficientsa
Model
Unstandardized Coefficients
Standardized
Coefficients
T Sig. B Std. Error Beta
1 (Constant) 5.224 3.299 1.583 .125
increase in fee for waste treatment .314 .262 .197 -1.198 .241
increase in fee for waste discharge .225 .170 .220 -1.324 .197
increase in fine for environmental
accidents -.610 .203 -.473 -3.010 .006
Decrease in scrap rate .332 .882 .057 .377 .709
a. Dependent Variable: Establishment of a transport system for the recycling of used and defective end-of-life products
Interpretation:
Using the values from the given Coefficients table the regression model for establishment of a transport
system for the recycling of used and defective end-of-life products becomes the following:
Establishment of a transport system for the recycling of used and defective end-of-life products (Y)
=5.224+.314 (increase in fee for waste treatment) + .225 (increase in fee for waste discharge) -.610 (increase in
fine for environmental accidents) + .332 (Decrease in scrap rate). The table above shows that the value of
standardized beta coefficient of increase in fee for waste treatment, increase in fee waste discharge and decrease
in scrap rate are positive, which means these three factors have significant effect on establishment of a transport
system for the recycling of used and defective end-of-life products. But standardized beta co-efficient of
increase in fine for environmental accidents has an negative effect on establishment of a transport system for
the recycling of used and defective end-of-life products.
2. Decrease in frequency for environment accidents
Reduction of air emission
Reduction of effluent waste
Decrease in consumption for hazardous/toxic materials
Green marketing mix
Model Summary
Model R R Square Adjusted R Square Std. Error of the Estimate
1 .717a .514 .442 .62193
a. Predictors: (Constant), Decrease in frequency for environment accidents, Reduction of air emission, Reduction of effluent waste,
Decrease in consumption for hazardous/toxic materials
Interpretation:
R squared means co-efficient of determination. R2 is a statistical measure in a regression model that
determines the proportion of variance in the dependent variable that can be explained by independent variable.
So basically R2 tells how well the data fit in the regression model. From the above table the observed co-
efficient of determination (R2) is larger than 0. They are exists a positive relationship between the dependent
variable and independent variable. Here the R2= .514 which is considered moderate effect relationship
The R squared (.514) shows 51.4% of variance of the dependent variable (Green marketing mix) is
explained by the independent variable.

Green Supply Chain Management practice of RMG sector in Bangladesh
DOI: 10.9790/487X-2304025163 www.iosrjournals.org 59 | Page
Coefficients
Model
Unstandardized Coefficients
Standardized
Coefficients
T Sig. B Std. Error Beta
1 (Constant) .486 .624 .779 .443
Reduction of air emission .187 .189 .158 .990 .331
Reduction of effluent waste 1.444 .511 .865 2.829 .009
Decrease in consumption for
hazardous/toxic materials .540 .245 .674 -2.202 .036
Decrease in frequency for
environment accidents -.152 .079 -.304 -1.924 .065
a. Dependent Variable: Green marketing mix
Interpretation:
Using the values from the given Coefficients table the regression model for establishment of a transport
system for the recycling of used and defective end-of-life products becomes the following:
Green marketing mix (Y) = .486 + .187 (Reduction of air emission) +1.444 (Reduction of effluent
waste) + .540 (Decrease in consumption for hazardous/toxic materials)-.152 (Decrease in frequency for
environment accidents). The table above shows that the value of standardized beta co-efficient of Reduction of
air emission, Reduction of effluent waste, decrease in consumption for hazardous/toxic materials are positive,
which means these factors have significant effect on green marketing mix. But standardized beta co-efficient of
decrease in frequency for environment accidents negative which means decrease in frequency for environment
accidents has an negative effect on green marketing mix.
3. Cooperating with suppliers to address consumer environmental issues at the end of the product life cycle
Establishment of a transport system for the recycling of used and defective end-of-life products
Community campaigns related to the environment
Providing project specification for vendors that include environmental requirements for items “purchased”
Collaborate with suppliers to manage reverse flows of materials and packaging.
Decrease in consumption for hazardous/toxic materials
Model Summary
Model R R Square Adjusted R Square Std. Error of the Estimate
1 .947a .897 .877 .36417
a. Predictors: (Constant), Cooperating with suppliers to address consumer environmental issues at the end of the product life cycle.,
Establishment of a transport system for the recycling of used and defective end-of-life products, Community campaigns related to the
environment, Providing project specification for vendors that include environmental requirements for items “purchased”, Collaborate with
suppliers to manage reverse flows of materials and packaging
Interpretation:
R squared means co-efficient of determination. R2 is a statistical measure in a regression model that
determines the proportion of variance in the dependent variable that can be explained by independent variable.
So basically R2 tells how well the data fit in the regression model. From the above table the observed co-
efficient of determination (R2) is larger than 0. They are exists a positive relationship between the dependent
variable and independent variable. Here the R2= .897 which is considered strong relationship.
The R squared (.897) shows 89.7% of variance of the dependent variable (Decrease in consumption for
hazardous/toxic materials) is explained by the independent variable.
Coefficients
Model
Unstandardized Coefficients
Standardized
Coefficients
T Sig. B Std. Error Beta
1 (Constant) 2.333 .916 -2.546 .017
Green Supply Chain Management practice of RMG sector in Bangladesh
DOI: 10.9790/487X-2304025163 www.iosrjournals.org 60 | Page
Community campaigns related to
the environment .847 .216 .342 3.915 .001
Collaborate with suppliers to
manage reverse flows of materials
and packaging
-1.918 .237 -1.385 -8.088 .000
Providing project specification for
vendors that include environmental
requirements for items “purchased”
1.389 .113 1.347 12.296 .000
Establishment of a transport system
for the recycling of used and
defective end-of-life products
-.095 .127 -.094 -.749 .461
Cooperating with suppliers to
address consumer environmental
issues at the end of the product life
cycle.
1.334 .135 1.592 9.858 .000
a. Dependent Variable: Decrease in consumption for hazardous/toxic materials
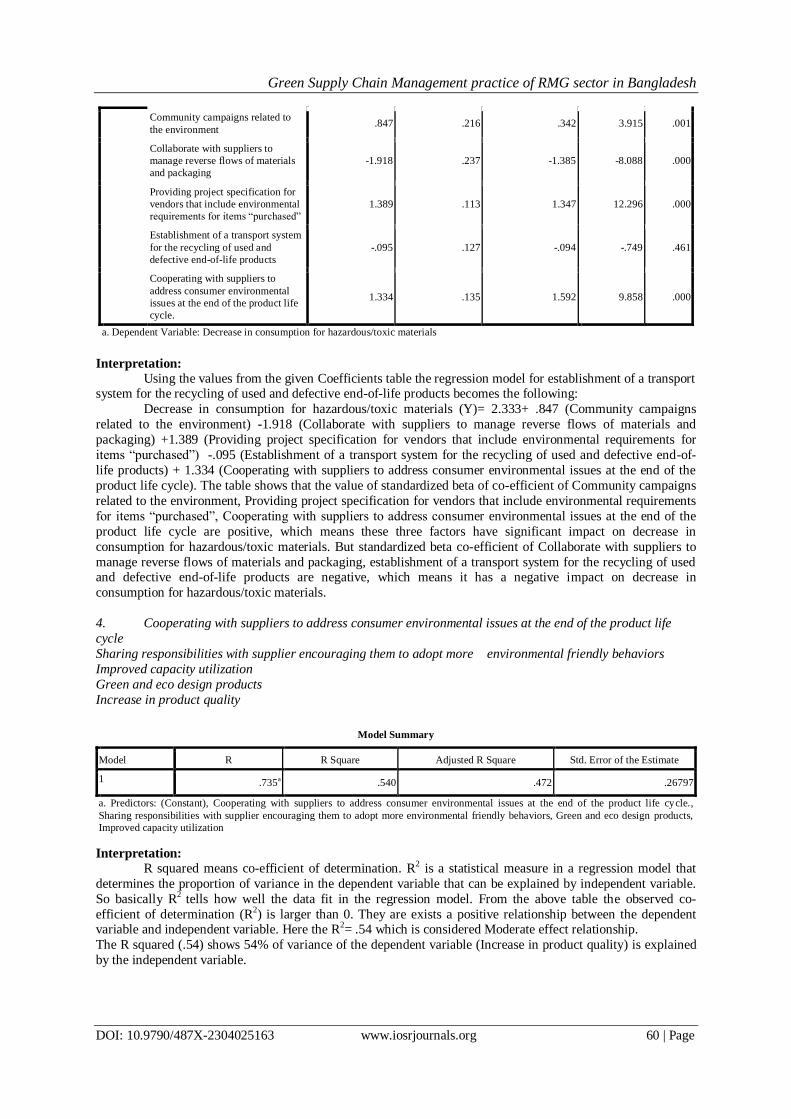
Interpretation:
Using the values from the given Coefficients table the regression model for establishment of a transport system for the recycling of used and defective end-of-life products becomes the following:
Decrease in consumption for hazardous/toxic materials (Y)= 2.333+ .847 (Community campaigns
related to the environment) -1.918 (Collaborate with suppliers to manage reverse flows of materials and
packaging) +1.389 (Providing project specification for vendors that include environmental requirements for
items “purchased”) -.095 (Establishment of a transport system for the recycling of used and defective end-of-
life products) + 1.334 (Cooperating with suppliers to address consumer environmental issues at the end of the
product life cycle). The table shows that the value of standardized beta of co-efficient of Community campaigns
related to the environment, Providing project specification for vendors that include environmental requirements
for items “purchased”, Cooperating with suppliers to address consumer environmental issues at the end of the
product life cycle are positive, which means these three factors have significant impact on decrease in
consumption for hazardous/toxic materials. But standardized beta co-efficient of Collaborate with suppliers to
manage reverse flows of materials and packaging, establishment of a transport system for the recycling of used and defective end-of-life products are negative, which means it has a negative impact on decrease in
consumption for hazardous/toxic materials.
4. Cooperating with suppliers to address consumer environmental issues at the end of the product life
cycle
Sharing responsibilities with supplier encouraging them to adopt more environmental friendly behaviors
Improved capacity utilization
Green and eco design products
Increase in product quality
Model Summary
Model R R Square Adjusted R Square Std. Error of the Estimate
1 .735a .540 .472 .26797
a. Predictors: (Constant), Cooperating with suppliers to address consumer environmental issues at the end of the product life cycle.,
Sharing responsibilities with supplier encouraging them to adopt more environmental friendly behaviors, Green and eco design products,
Improved capacity utilization
Interpretation:
R squared means co-efficient of determination. R2 is a statistical measure in a regression model that
determines the proportion of variance in the dependent variable that can be explained by independent variable.
So basically R2 tells how well the data fit in the regression model. From the above table the observed co-
efficient of determination (R2) is larger than 0. They are exists a positive relationship between the dependent variable and independent variable. Here the R2= .54 which is considered Moderate effect relationship.
The R squared (.54) shows 54% of variance of the dependent variable (Increase in product quality) is explained
by the independent variable.
Green Supply Chain Management practice of RMG sector in Bangladesh
DOI: 10.9790/487X-2304025163 www.iosrjournals.org 61 | Page
Coefficientsa
Model
Unstandardized Coefficients
Standardized
Coefficients
T Sig. B Std. Error Beta
1 (Constant) 3.515 .283 12.433 .000
Green and eco design products 1.74689 .082 .001 -.005 .996
Improved capacity utilization -.276 .120 -.570 -2.292 .030
Sharing responsibilities with
supplier encouraging them to adopt
more environmental friendly
behaviors
.283 .053 .749 5.303 .000
Cooperating with suppliers to
address consumer environmental
issues at the end of the product life
cycle.
.093 .072 .313 1.289 .208
a. Dependent Variable: Increase in product quality
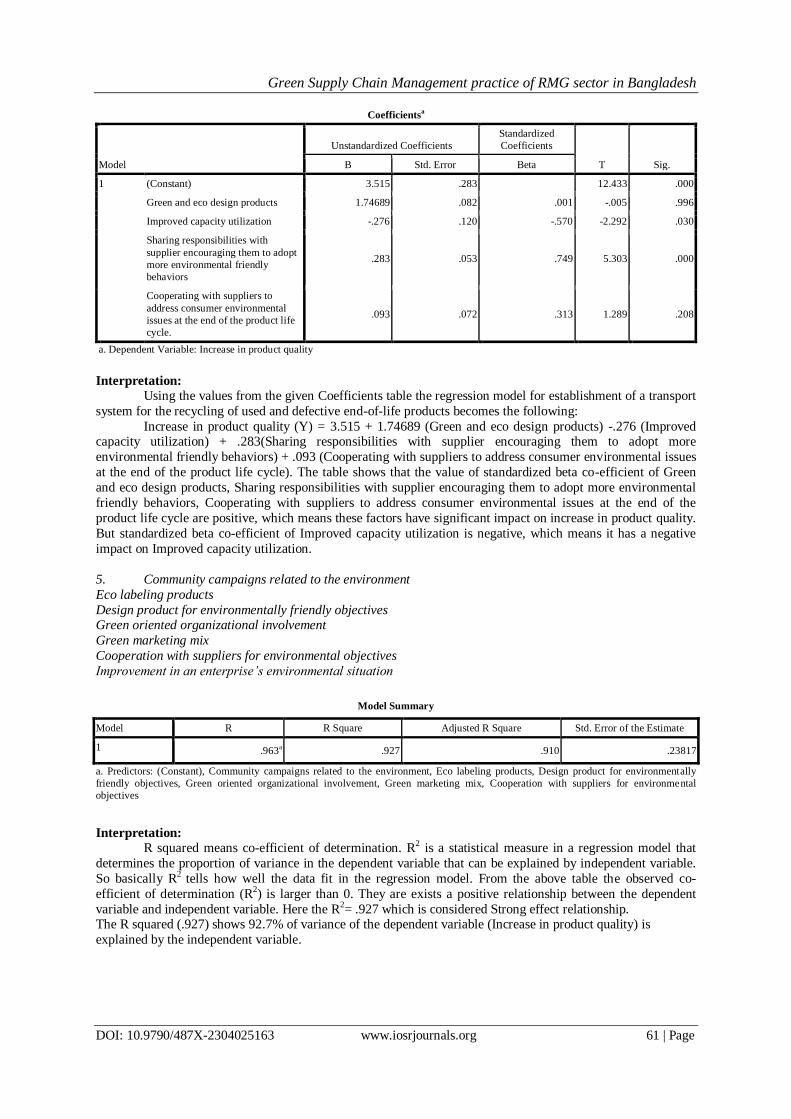
Interpretation:
Using the values from the given Coefficients table the regression model for establishment of a transport
system for the recycling of used and defective end-of-life products becomes the following:
Increase in product quality (Y) = 3.515 + 1.74689 (Green and eco design products) -.276 (Improved capacity utilization) + .283(Sharing responsibilities with supplier encouraging them to adopt more
environmental friendly behaviors) + .093 (Cooperating with suppliers to address consumer environmental issues
at the end of the product life cycle). The table shows that the value of standardized beta co-efficient of Green
and eco design products, Sharing responsibilities with supplier encouraging them to adopt more environmental
friendly behaviors, Cooperating with suppliers to address consumer environmental issues at the end of the
product life cycle are positive, which means these factors have significant impact on increase in product quality.
But standardized beta co-efficient of Improved capacity utilization is negative, which means it has a negative
impact on Improved capacity utilization.
5. Community campaigns related to the environment
Eco labeling products
Design product for environmentally friendly objectives Green oriented organizational involvement
Green marketing mix
Cooperation with suppliers for environmental objectives
Improvement in an enterprise’s environmental situation
Model Summary
Model R R Square Adjusted R Square Std. Error of the Estimate
1 .963a .927 .910 .23817
a. Predictors: (Constant), Community campaigns related to the environment, Eco labeling products, Design product for environmentally
friendly objectives, Green oriented organizational involvement, Green marketing mix, Cooperation with suppliers for environmental
objectives
Interpretation:
R squared means co-efficient of determination. R2 is a statistical measure in a regression model that
determines the proportion of variance in the dependent variable that can be explained by independent variable.
So basically R2 tells how well the data fit in the regression model. From the above table the observed co-
efficient of determination (R2) is larger than 0. They are exists a positive relationship between the dependent
variable and independent variable. Here the R2= .927 which is considered Strong effect relationship. The R squared (.927) shows 92.7% of variance of the dependent variable (Increase in product quality) is
explained by the independent variable.

Green Supply Chain Management practice of RMG sector in Bangladesh
DOI: 10.9790/487X-2304025163 www.iosrjournals.org 62 | Page
Coefficientsa
Model
Unstandardized Coefficients
Standardized
Coefficients
T Sig. B Std. Error Beta
1 (Constant) 29.809 2.076 14.357 .000
Green marketing mix -.007 .203 -.057 -4.964 .000
Cooperation with suppliers for
environmental objectives 1.292 .149 2.289 8.698 .000
Green oriented organizational
involvement -.006 .185 -.003 -.032 .974
Eco labeling products .630 .085 .606 -7.415 .000
Design product for environmentally
friendly objectives .025 .114 .038 .219 .829
Community campaigns related to
the environment 6.216 .396 3.292 -15.697 .000
a. Dependent Variable: Improvement in an enterprise’s environmental situation
Interpretation:
Using the values from the given Coefficients table the regression model for establishment of a transport
system for the recycling of used and defective end-of-life products becomes the following:
Improvement in an enterprise’s environmental situation (Y) = 29.809-.007 (Green marketing mix) +
1.292 (Cooperation with suppliers for environmental objectives) -.006(Green oriented organizational
involvement) +.630(Eco labeling products) + .025 (Design product for environmentally friendly objectives) +
6.216 (Community campaigns related to the environment). The table shows that the value of standardized beta
co-efficient of cooperation with suppliers for environmental objectives, eco labeling products, design product
forenvironmentally friendly objectives, community campaigns related to the environment are positive, which
means these factors have significant impact on Improvement in an enterprise’s environmental situation.But
standardized beta co-efficient of Green marketing mix, green oriented organizational involvement are negative,
which means these factors has an negative impact on Improvement in an enterprise’s environmental situation.
V. Findings: In RMG sector of Bangladesh only Establishment of a transport system for the recycling of used and
defective end-of life products is not satisfied the four factors: increase in fee for waste treatment, increase in fee
for waste discharge, increase in fine for environmental accidents, decrease in scrap rate. But the significance of
relationship is very important to maintain the Green Supply Chain in the RMG sector of Bangladesh. If we can
make more analysis we found that RMG sector of Bangladesh is not agree with increase in fine for
environmental accidents.
Our result shows that green marketing mix has a moderate relationship with Decrease in frequency for
environment accidents, reduction of air emission, reduction of effluent waste, and decrease in consumption for
hazardous/toxic materials. To maintain the green marketing mix the main threat factor is decrease in
consumption for hazardous/toxic materials. In Bangladesh the RMG sector is moderately following Decrease in
frequency for environment accidents, reduction of air emission, reduction of effluent waste. But they are not
following decrease in consumption for hazardous/toxic materials. And lastly from co-efficient of correlation
analysis we found that decrease in frequency for environment accidents has a negative relationship with green
marketing mix. So for maintaining green marketing mix we need to improve the decrease in consumption for
hazardous/toxic materials.
The RMG sector in Bangladesh is trying to decrease in consumption for hazardous/toxic materials by following the factors cooperating with suppliers to address consumer environmental issues at the end of the
product life cycle, Establishment of a transport system for the recycling of used and defective end-of-life
products, community campaigns related to the environment, providing project specification for vendors that
include environmental requirements for items “purchased”, collaborate with suppliers to manage reverse flows
of materials and packaging. And all these factors have a strong relationship with decrease in consumption for
hazardous/toxic materials. From the multiple comparisons analysis, we have found that for decrease in
consumption for hazardous/toxic materials is not maintaining the following two factors collaborate with
suppliers to manage reverse flows of materials and packaging and providing project specification for vendors
that include environmental requirements for items “purchased”. From the ANOVAs, for decreasing in

Green Supply Chain Management practice of RMG sector in Bangladesh
DOI: 10.9790/487X-2304025163 www.iosrjournals.org 63 | Page
consumption for hazardous/toxic materials, establishment of a transport system for the recycling of used and
defective end-of-life products and collaborate with suppliers to manage reverse flows of materials and
packaging are not significantly followed. From the co-efficient of correlation analysis, we found that collaborate with suppliers to manage reverse flows of materials and packaging, establishment of a transport system for the
recycling of used and defective end-of-life products have a negative relationship with decrease in consumption
for hazardous/toxic materials. So finally we need to improve collaborate with suppliers to manage reverse flows
of materials and packaging and establishment of a transport system for the recycling of used and defective end-
of-life products.
To increase product quality the factors cooperating with suppliers to address consumer environmental
issues at the end of the product life cycle, sharing responsibilities with supplier encouraging them to adopt more
environmental friendly behaviors, improved capacity utilization and green and eco design products have a
moderate relationship. From multiple comparisons analysis, we can say that co-operating with suppliers to
address consumer environmental issues at the end of the product life cycle is not properly maintained to increase in product quality. From ANOVA, we can say that co-operating with suppliers to address consumer
environmental issues at the end of the product life cycle, improved capacity utilization and green and eco design
products these three factors are not significantly maintained in our country. From co-efficient of correlation
analysis, we can found that among the above three negative factors improved capacity utilization has a negative
relationship with increase in product quality.
Firstly, we need to improve the capacity utilization and then we need to think green and eco design
products, co-operating with suppliers to address consumer environmental issues at the end of the product life
cycle. Sharing responsibilities with supplier encouraging them to adopt more environmental friendly behaviors
is very highly significant in RMG sector In increase in product quality and it is properly maintained
References: [1]. B.L.Lakshmi Meera *Dr.P.Chitramani (2014). Environmental Sustainability through Green Supply chain management practices
among Indian Manufacturing Firms with special reference to Tamilnadu. Tamilnadu: International Journal of Scientific and
Research Publications.
[2]. Shakil Ahmed S, Ma Y, (26 September 2018). Green Supply Chain Management (GSCM) Performance Implemented by the Textile
Industry of Gazipur District. Dhaka. MDPI.
[3]. Shahriar, M., F., Pathik, B., B., & Habib, M., M., (2014). A Research Framework of Supply Chain Management in Ready Made
Garments Industry of Bangladesh. International Journal of Business and Economics Research. 3, (6), 38-44.
doi:10.11648/j.ijber.s.2014030601.16.\
[4]. Islam, M., S., (2012). Supply Chain Management on Apparel Order Process: A Case Study in Bangladesh Garment Industry. Asian
Journal of Business and Management Sciences, 2(8), 62-72.
[5]. Nuruzzaman, A. H. & Azad, R., (2010). Is Bangladeshi RMG Sector Fit in the Global Apparel Business? Analyses the Supply
Chain Management. The South East Asian Journal of Management, 4(1),
[6]. Chopra,S., Meindl, P., & D.V. Kalra, D.V. (2003). Supply Chain Management-Strategy, Planning and Operation, Pearson, India,
4th Edition, pp-7-8. ISBN: 978-81-317-3071-3
[7]. Nuruzzaman, A.H. (2009). Lead time management in the garment sector of Bangladesh: An avenue for survival and growth.
European Journal of Scientific Research, 33, 617
[8]. Basher, M.A. (2010). Compliance in the RMG sector: What has been done so far, and what more needs to be done? Dhaka.
Bangladesh
[9]. Mohammad Ali, Dr. MdMamun Habib, The material requirements planning system for readymadegarments and inventory control,
Journal of Applied Management and Investments, Volume 1, Number 2, 2012.
[10]. Habib, Md. Mamun, ―Supply Chain Management (SCM): Theory and Evolution‖ Dr. Md. Mamun Habib (Editor), ―Supply Chain
Management – Applications and Simulations‖, InTech Open Access, Croatia, September 2011, ISBN 978-953-307-250-0
[11]. Agi, M.A.; Nishant, R. Understanding influential factors on implementing green supply chain management practices: An
interpretive structural modelling analysis. J. Environ. Manag. 2017, 188, 351–363. [Google Scholar] [CrossRef] [PubMed]
[12]. Masoumik, S.M.; Abdul-Rashid, S.H.; Olugu, E.U. The Development of a Strategic Prioritisation Method for Green Supply Chain
Initiatives. PLoS ONE 2015, 10, e0143115. [Google Scholar] [CrossRef] [PubMed]
[13]. Walsh, M. The Green Supply Chain Choosing and setting up an eco-friendly workflow. LOGOS J. World Book
Community 2013, 24, 16–23. [Google Scholar]
[14]. Hasan M, (2017, September). Supply Chain Managemnet in Readymade Garment Industry. Dhaka. Asian Business Review.Vol7,
Num 3
[15]. Vachon, S. Green supply chain practices and the selection of environmental technologies. Int. J. Prod. Res. 2007, 45, 4357–4379.
[Google Scholar] [CrossRef]
[16]. Zhu, Q.; Sarkis, J.; Lai, K.-H. Initiatives and outcomes of green supply chain management implementation by Chinese
manufacturers. J. Environ. Manag. 2007, 85, 179–189. [Google Scholar] [CrossRef] [PubMed]
[17]. Ninlawan, C.; Seksan, P.; Tossapol, K.; Pilada, W. The implementation of green supply chain management practices in electronics
industry. In Proceedings of the International Multiconference of Engineers and Computer Scientists, Hong Kong, 17–19 March
2010. [Google Scholar]
[18]. Wu, G.-C.; Cheng, Y.-H.; Huang, S.-Y. The study of knowledge transfer and green management performance in green supply chain
management. Afr. J. Bus. Manag. 2010, 4, 44–48. [Google Scholar]
[19]. Choudhary, M.; Seth, N. Integration of green practices in supply chain environment the practices of inbound, operational, outbound
and reverse logistics. Int. J. Eng. Sci. Technol. 2011, 3, 4985–4993.