greenhouse gas (ghg) status on land use change and...
TRANSCRIPT

CHO CHO WINASSISTANT RESEARCH OFFICERFOREST RESEARCH INSTITUTE
YEZIN, MYANMAR
Greenhouse Gas (GHG) Status on Land Use Change and Forestry
Sector in Myanmar
International Workshop on “ Air Quality in Asia-Impacts of Land Cover/Land Use Change on Greenhouse Gases/ SLCP Emissions and Aerosols”
August 4-7 th, 2015, Bogor, Indonesia

Sino-Himalayan region in the north
Malayan peninsular in the south
Indochinese region in the east
This significant geo-position together with high variations in Rainfall Temperature Topography and
create Several diverse forest types in Myanmar, from sub-alpine forest in the north to tropical rain forest in the south.
Source: Remote Sensing & GIS Section, Forest Department
Location Map of Myanmar

TABLE 1 FOREST TYPES AND AREAS IN MYANMAR FOR THE YEAR 2000
Forest type (Myanmar)
Forest Type (IPCC) Area (ha) % of
total
Tropical ever green forest Tropical rain forest 5528640 16
Mixed deciduous forest
Tropical moist deciduous forest 13476060 39
Dry forest Tropical dry forest 3455400 10
Dipterocarpsforest Tropical dry forest 1727700 5
Hill and temperate evergreen forest
Subtropical mountain system 8984040 26
Beach and dune forest Tropical rain forest 1382160 4
TOTAL 34554000 100
(Source: FRA, 2005) 52% of the country’s total area – 676,577 sq km

INTRODUCTION
The Land use change and forestry sector (forestry and forest industry, including the use of forest land) - important role in global climate change debate
influences the global carbon cycle, is influenced by possible global climate change caused by increased
concentrations of greenhouse gases.Forests are, if properly managed, the main carbon sinks. The estimated total carbon in the forests (i.e. living biomass, dead wood,
litter and soil) was 633 Gt, which is equivalent to 160 tons of carbon per hectare in 2005.
On the other hand, the forests may become the source of carbon emissions: due to deforestation and forest degradation processes, the forests globally will become a significant net source of CO2 emissions by 2050 (IPCC, 2007).
Therefore, the GHG inventory data in the land use change and forestry sector is crucial for future management plans for sustainable carbon sinks.

GHG INVENTORY IN MYANMAR
Myanmar ratified UNFCCC on 25 November, 1994 as a non-Annex I Party.
Article 12.5 - requires non-Annex I Parties to prepare their initial national communications.
the preliminary GHG inventory and mitigation options assessment were undertaken during the ALGAS study in 1997, no other project activities relating to UNFCCC have been undertaken.
A National GHG inventory for CO2, CH4 , N2O for the base year 1990 in Five Categories - Energy, Agriculture, Industrial Process, Land Use Change and Forestry and Waste.

39202.96086.14
2686.43
180.446655.73
Agricgy Sector
Energy Sector
Waste Sector
Industry Sector
Forestry Sector
14.67%
94.47%
Sources and Sinks
Net CO2 Emission
(Gg)
Agriculture 39,202.9
Energy 6,086.14
Waste 2,686.43
Land Use Change and Forestry
6,655.73
Industrial Process 180.44
Total 41,500.20
NET NATIONAL EMISSIONS OF CO2 EQUIVALENT
GHG emission from Agriculture Sector for 2020, 62,733 Gg.

INC PROJECT IN MYANMAR
National Commission for Environmental Affairs NCEA ( nowEnvironmental Conservation Department) of Myanmarlaunched an INC-project since 2008 with the financialassistance from GEF/UNEP.Six Expert GroupsGHG Inventory and Mitigation Options AnalysisVulnerability and Adaptation AssessmentDevelopment and transfer of Environmentally SoundTechnologies (ESTs)Research and Systematic ObservationEducation, Training and Public AwarenessCompilation of National Communication

GHG STUDY TEAM
1) Energy: Fuel combustion, Fugitive emissions from fuels, CO2transport and storage
2) Industrial Processes and Product Use: Mineral, chemical & metal industries, Non-energy products from fuels and solvent use, Electronics industry, Product uses as substitutes for O3 depleting substances, Other product manufacture and use, Other
3) Agriculture: Agriculture and Livestock, Aggregate sources and non-CO2 emissions sources in land
4) LUCF: CO2 emissions/absorption by land, Identify the activities of emission sources in different land use categories
5) Waste: Solid waste disposal, Biological treatment of solid waste, Incineration and open burning waste, Waste water treatment and discharge

SUMMARY OF EMISSIONS IN MYANMAR FOR THE YEAR 2000
Source/ SinkCO2
EmissionCO
EmissionCH4
EmissionN2O
EmissionNO x
Emission
CO2
Equivalent Total
Emission
CO2 Removal
CO2
Equivalent Total Net Emission
(Gg) (Gg) (Gg) (Gg) (Gg) (Gg) (Gg) (Gg)
Energy (Traditional Biomass burned)
7,658.65 (27,833.09)
--
5.62 (7.4553)
0.28(0.9941)
--
7,863.47(28,297.82)
--
7,863.47(28,297.82)
Industrial Processes
248.59 - - - 463.29 * - 463.29
AgricultureA. Agri. B.Livestock
--
0.810.81
-
963.58507.23456.35
8.27068.2706
-
0.0220.022
-
22,800.4613,217.119,583.35
--
22,800.4613,217.11
9,583.35Forestry 33,656.51 2,215.37 144.85 4.26 34.08 40,404.86 142,221.19 101,816.33
Waste - - 134.57 - - 2,825.97 - 2,825.97
TOTAL 41,563.75 2,216.18 1,248.62 12.8106 34.102 74,358.05 142,221.19 - 67,863.14

GHG INVENTORY IN FORESTRY SECTOR
Land Use Categories
Forest land: all land with woody vegetation (according to forest definition)
Cropland: cropped land, rice fields, agro-forestry systems
Grassland: rangelands and pasture land
Wetland: areas of peat extraction and peat-lands; includes reservoirs, natural rivers and lakes
Settlements: all developed land, transportation infrastructure and human settlement
Other land: bare soil, rock, ice, all land that do not fall into any of the other 5 categories

LAND USE CONVERSIONS
The length of time that land remains in a conversion category after a change in a land use is by default 20 years.

5 CARBON POOLSAbove-ground biomass: living vegetation, woody and herbaceous above the soil (stems, stumps, branches, bark, seed and foliage)Below-ground biomass: all biomass of live roots >2mm in diameterDead wood: all non-living woody biomass, standing or lying or in the soil (d≥10cm)Litter: all non-living biomass (10 cm≤ d≥ 2mm)Soil organic matter: organic carbon at 30 cm depth
Above‐ground biomass + Below‐ground biomass = BiomassDead wood + Litter = Dead organic matterSoil organic matter = Soil

METHODOLOGY FOR GHG INVENTORY IN THE FORESTRY SECTOR
Annual change in carbon stocks in biomass for a land use category was calculated by using Gain-loss Method (Equation 2.7 in IPCC guidelines, 2006):
CB = CG - CL
CB = sum of aboveground biomass and belowground biomass
CG = biomass growth for each land subcategory CL = biomass loss for each land subcategory

METHODOLOGY FOR GHG INVENTORY IN THE FORESTRY SECTOR
Annual increase in biomass carbon stocks due to biomass increment was calculated as follows: (Equation 2.9 in IPCC guidelines. 2006)
CG = (A ij - GTOTAL ij - CF ij)ij
A= area of land remaining in the same land use category GTOTAL = mean annual biomass growth CF = carbon fraction of dry matter
CL = Lwood removais + Lfuelwood+ Ldisturbance
Lwood removais = annual carbon loss due to wood removalsLfuelwood = annual carbon loss due to fuelwood removalsLdisturbance = annual carbon losses due to disturbances

ANNUAL INCREASE IN BIOMASS CARBON STOCKS
The annual increases in biomass carbon stocks in the land use change and forestry sector were calculated for the following categories:
Natural forests Forest plantations Home garden trees Roadside trees

TABLE 2. ANNUAL INCREASE IN CARBON STOCKS AND CARBON DIOXIDE REMOVALS FOR THE YEAR 2000
Activity Annual increase in carbon stocks (Carbon, Gg)
Annual carbon dioxide removal
(Carbon dioxide Gg)
Percentage to total CO2 removal
(%)Natural forests 35410.53 129838.59 91.30Forest Plantations 3204.56 11750.04 8.26Home Garden Trees 128.20 470.07 0.33Roadside Trees 44.32 162.49 0.11TOTAL 38 787.61 142 221.19 100.00
Natural forests , 129838.59, 91%
Forest Plantations , 11750.04, 8%
Home Garden Trees , 470.07, 1%
Roadside Trees , 162.49, 0%
Natural forests
Forest Plantations
Home Garden Trees
Roadside Trees
Annual carbon dioxide removal
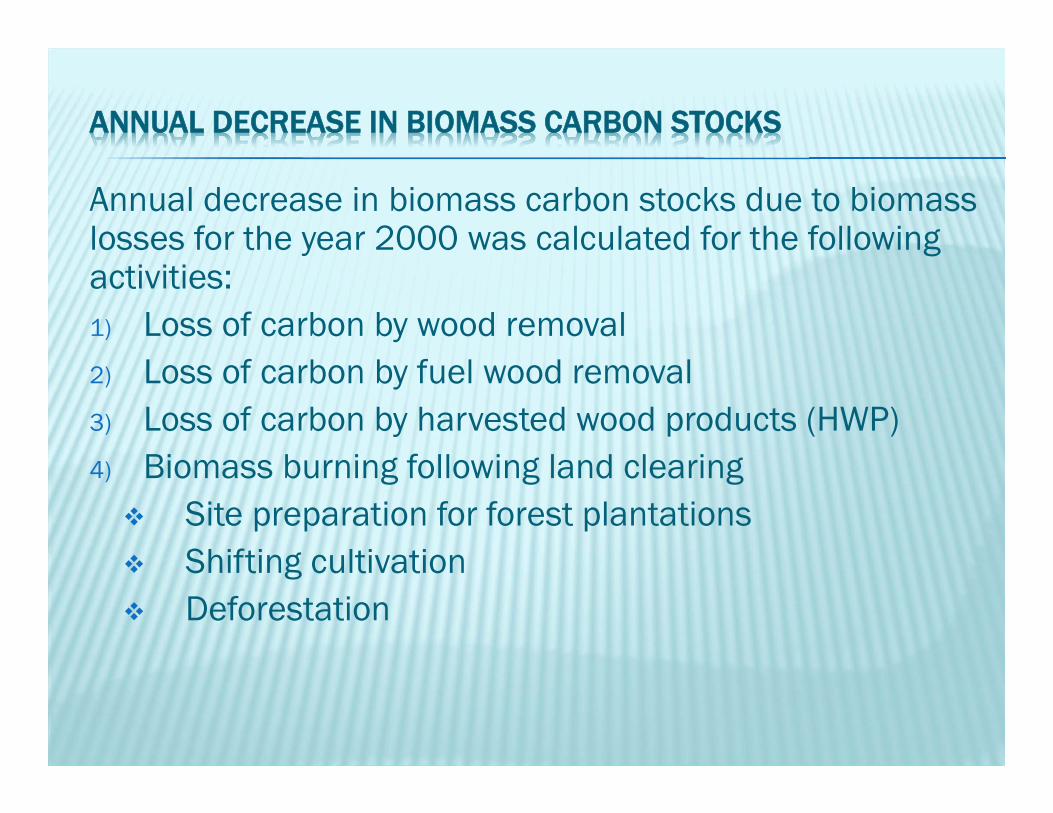
ANNUAL DECREASE IN BIOMASS CARBON STOCKS
Annual decrease in biomass carbon stocks due to biomass losses for the year 2000 was calculated for the following activities: 1) Loss of carbon by wood removal2) Loss of carbon by fuel wood removal 3) Loss of carbon by harvested wood products (HWP)4) Biomass burning following land clearing Site preparation for forest plantations Shifting cultivation Deforestation
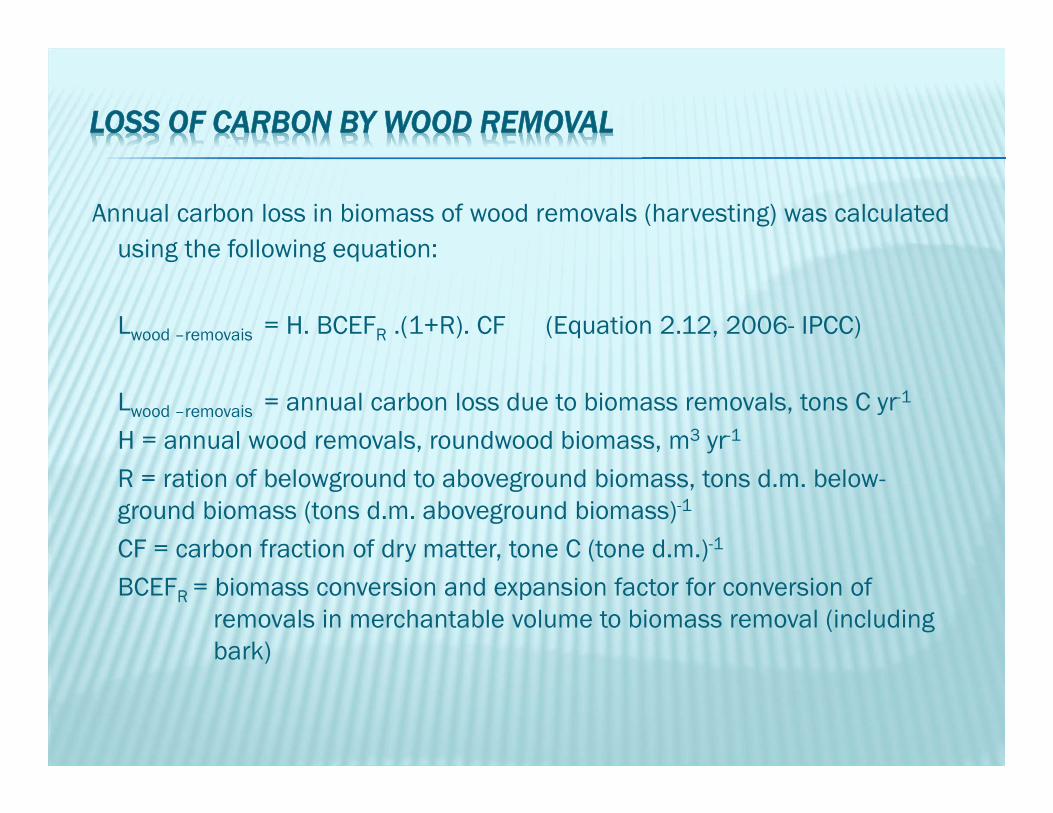
LOSS OF CARBON BY WOOD REMOVAL
Annual carbon loss in biomass of wood removals (harvesting) was calculated using the following equation:
Lwood –removais = H. BCEFR .(1+R). CF (Equation 2.12, 2006- IPCC)
Lwood –removais = annual carbon loss due to biomass removals, tons C yr-1
H = annual wood removals, roundwood biomass, m3 yr-1
R = ration of belowground to aboveground biomass, tons d.m. below-ground biomass (tons d.m. aboveground biomass)-1
CF = carbon fraction of dry matter, tone C (tone d.m.)-1
BCEFR = biomass conversion and expansion factor for conversion of removals in merchantable volume to biomass removal (including bark)

SITE PREPARATION FOR FOREST PLANTATIONS
The total forest plantation area established in 2000 was 30731 ha. Forest plantations in Myanmar are established for different purposes viz. Commercial, local supply (Fuel-wood). Industrial, Watershed conservation, etc. During land preparation, not all the selected areas are burnt (eg. Watershed conservation plantations). The actual burnt area for site preparation in the year 2000 was 23 277 ha.Greenhouse gas emission from biomass burning for site preparation of the forest plantation for the year 2000 is estimated to be 1 863 207 tons of CO2 equivalent.

DEFORESTATION
GHG emissions from deforestation share the largest portion of the GHG emission in land use change and forestry sector of Myanmar. Deforestation in the year 2000 was 466 500 ha (FRA 2005). All the deforested areas are not burnt. However the reliable data on the land use change pattern (from forest land to grassland. Cropland, settlement, water body, etc) is not available. Therefore, all the deforested lands are assumed to be burnt in this study for conservative estimation.

SHIFTING CULTIVATION
GHG emission from biomass burning by shifting cultivation for the year 2000 is estimated to be 37 340 974 tons of CO2 equivalent.

GHG EMISSIONS IN THE FORESTRY SECTOR FOR THE YEAR 2000
The activities responsible for annual decrease in biomass carbon stocks in land use change and forestry sector can be divided into two groups. One is the activity which causes the annual decrease in carbon stocks but cannot be accounted for direct GHG emission (eg. Wood removal); Another is the activity which can be accounted for direct GHG emission (eg. Biomass burning). The greenhouse gas emission in the forestry sector for the year 2000 can be estimated to be 40 404.855 Gg CO2e. The activities and their GHG emissions are shown in the Table.

TABLE 3. ANNUAL DECREASE IN CARBON STOCKS AND GHG EMISSIONS BY DIFFERENT ACTIVITIES
Activity Loss of Carbon GHG emission RemarkWood removal 2 176 888 tC Not accounted All the wood products are not
burntFuelwood removal 26 936 418 tC Accounted GHG emissions are further
estimated in Energy sectorHarvested WoodProducts
Not estimated Not accounted Not needed to calculate in Tier1 level
Site preparation forforest plantations
- 1863207 tCO2e
Shifting cultivation - 1 200 674 tCO2eDeforestation - 37 340 974 tCO2e
1200674, 3%
37340974, 92%
1863207, 5%
Shifting cultivation Deforestation Site preparation for forest plantation

TABLE 4. GREENHOUSE GAS EMISSIONS BY DIFFERENT ACTIVITIES FOR THE YEAR 2000
ActivityEmissions Total (CO2
equivalent
Gg)CO2 (Gg) CO (Gg) CH4(Gg) N2O (Gg) NOx (Gg)
Forest
plantations
1552.017 102.158 6.680 0.196 1.572 1863.207
Shifting
cultivation
1000.140 65.832 4.304 0.127 1.013 1200.674
Deforestation 31104.354 2047.375 133.867 3.937 310498 37340.974
Total 33656.511 2215.365 144.851 4.260 34.083 40404.855

TABLE 5. GHG EMISSIONS/ REMOVALS FROM LAND USE CHANGE AND FORESTRY SECTOR FOR THE YEAR 2000
Activity CO2 emissions (Gg) CO2 removals (Gg) Net CO2emissions/removals (Gg)
Natural forests - 129 838.59 (-) 129 838. 59
Forest plantations 1 863.207 11 750.04 (-) 9 886. 833
Home garden trees - 470.07 (-) 470.07
Roadside trees - 162.49 (-) 162.49
Wood removal - - -
Fuelwood removal (Energy sector) - -
Harvested wood products
(HWP)
- - -
Shifting cultivation 1200.674 - (+) 1200.674
Deforestation 37340.974 - (+) 37340.974
TOTAL 40404.855 142221.19 (-) 101816.38

TABLE 6. SUMMARY FOR NET CO2 EMISSIONS/ REMOVALS DATABASE FOR THE FORESTRY SECTOR IN MYANMAR
Year Total annual CO2emissions (Gg)
Total annual CO2removals (Gg)
Total net annual CO2emissions/ removals (Gg)
1990 40855.26 154034.90 (-) 113179.641995 40784.58 147906.36 (-) 107121.782000 40404.85 142221.23 (-) 101816.382001 40445.35 141015.22 (-) 100569.872002 40425.18 139825.50 (-) 99400.322003 40384.44 138674.57 (-) 98290.132004 40447.27 137473.85 (-) 97026.582005 40484.01 136258.74 (-) 95774.73
020000400006000080000
100000120000140000160000180000
1985 1990 1995 2000 2005 2010
CO
2 E
mis
sion
s/ R
emov
als
Year
CO2 Emissions and Removals in the land use change and forestry sector
Total annualCO2emissions(Gg)Total annualCO2 removals(Gg)

PREDICTION OF NET GHG REMOVAL BY LAND USE CHANGE AND FORESTRY SECTOR DURING 2000-2030
Year Net GHG removal(Gg CO2 e)
2000 101816
2005 95774
2010 90093
2015 84341
2020 78589
2025 72837
2030 67085
0
20000
40000
60000
80000
100000
120000
1995 2000 2005 2010 2015 2020 2025 2030 2035
Net
GH
G re
mov
alYear
Net GHG removal (Gg CO2 e)
Net GHG removal (Gg CO2 e)
The projection of net GHG removal in 2030 pointed our constant decline because of decrease in natural forest area. Net CO2 removal in 2000 was estimated to be 101816.38 Gg which will be reduced to 78589.07 Gg in 2020 and 67085.05 Gg in 2030.

MYANMAR GREENHOUSE GAS MITIGATION OPTIONS ASSESSMENT AND STRATEGIES
With vast and diverse natural forests, Myanmar is still green in terms of forest cover as well as low carbon emission. Natural forests of Myanmar can sequester substantial amount of carbon in the form of biomass. The mitigation strategies could be aimed at reducing carbon emission and increasing carbon sequestrations in forestry sector of Myanmar. Short-term (10 years) and long term (30 years) considerations could be taken into account to determine the effective mitigation strategies to achieve the sustainable carbon sequestration and socioeconomic responses.Forest mitigation practices that can restrain the rate of increase in atmospheric CO2 can be grouped into three categories:
(i) management for carbon conservation; (ii) management for carbon sequestration and storage; and(iii) management for carbon substitution.

MYANMAR GREENHOUSE GAS MITIGATION OPTIONS ASSESSMENT AND STRATEGIES
Conservation practices include options such as controlling deforestation, protecting forests in reserves, changing harvesting regimes, and controlling other anthropogenic disturbances, such as fire and pest outbreak.
Sequestration and storage practices include expanding forest ecosystems by increasing the area and/or biomass and soil carbon density of natural and plantation forests, and increasing storage in durable wood products. Substitution practices aim at increasing the transfer of forest biomass carbon into products rather than using fossil fuel-based energy and products, cement-based products and other non-wood building materials.

REFERENCES
1) U Sein Thet: End of Project Review Workshop2) U Sein Thet: Climate Change Information, Forestry Journal February 2011,
pp 47-493) U Sein Thet (2014): Climate Change in Myanmar
