greenhouse gas reporting program
TRANSCRIPT

Jackson DouganGreenhouse Gas Reporting SpecialistOregon Department of Environmental [email protected]
Course 7: Process Emissions – Subparts H, N, Q, and VVerification Training 2021
Greenhouse Gas Reporting Program

Disclaimer
This presentation is intended for verification service providers interested in providingservices to sources that process emissions from cement manufacturing (subpart H),glass manufacturing (subpart N), iron and steel production (subpart Q), and nitricacid production (subpart V) in Oregon. Verification trainings for process emissionsspecific to Oregon from other processes will be covered in a separate training.
2

AgendaReview verification strategies for the following subparts from 40 C.F.R. Part 98:
• Subpart H, Cement Manufacturing
• Subpart N, Glass Manufacturing
• Subpart Q, Iron and Steel Production
• Subpart V, Nitric Acid Production
3

Subpart H: Cement Production
4

Subpart H: Cement Manufacturing General Applicability• §98.80 Definition of the source category.• “The cement production source category consists of each
kiln and each in-line kiln/raw mill at any portland cement manufacturing facility including alkali bypasses, andincludes kilns and in-line kiln/raw mills that burn hazardous waste.”
• One facility in Oregon:– Ash Grove Cement Company
5

Material Flow at a Cement Plant
6
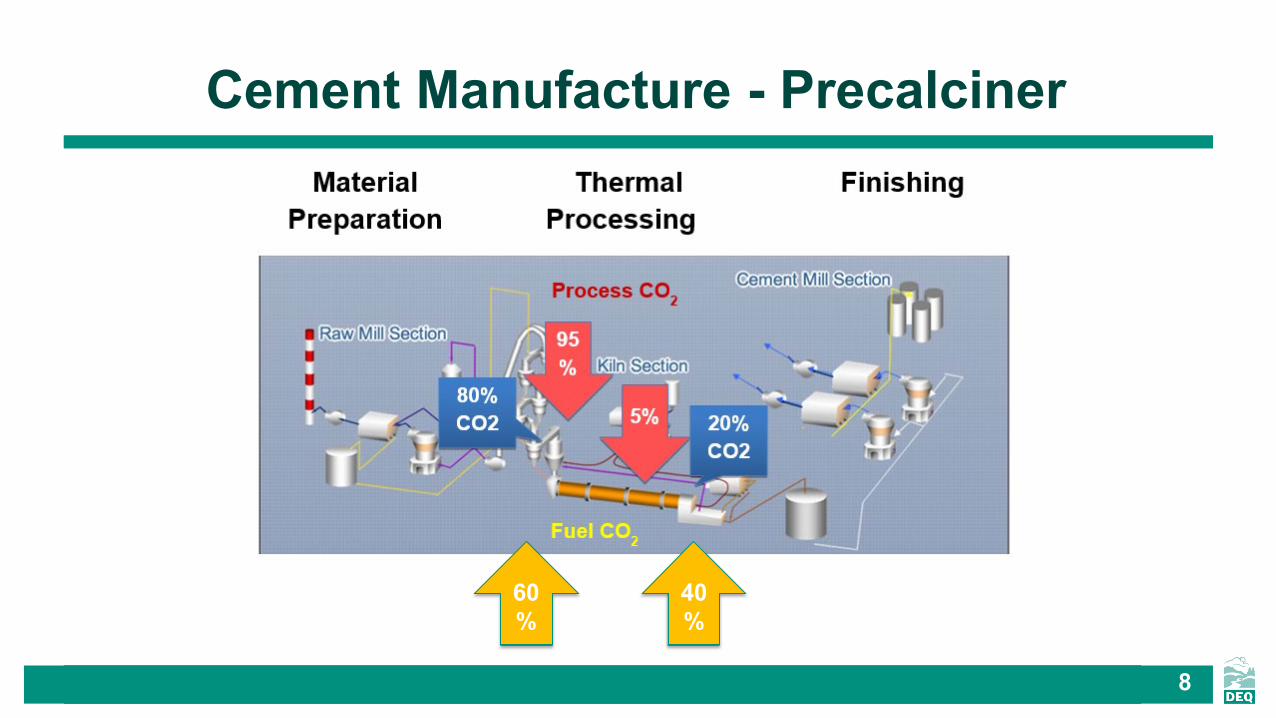
Cement Manufacture - Precalciner
8
60%
40%

Rules to Remember
Production Ratios (Approximate)• 1.55 tons of dry raw material per ton of clinker• 1.1 tons of cement per ton of clinker• 1 ton of fuel per 10 tons of clinker produced• 0.75 tons of CO2 per ton of clinker produced
9

Emissions Data Reported ForCement Production Facilities (1 of 2)
These emissions must be reported:• CO2 process emissions from cement kilns and in-
line kiln/raw mills• CO2, CH4, and N2O emissions from stationary
combustion of fuels in cement kilns and in-line kiln/raw mills
• CO2, CH4, and N2O emissions from all other stationary combustion sources (e.g., dryers, process heaters, electricity generation, cogeneration supplemental firing)
10

• All process emissions assumed to occur in precalciner and kiln
• No process emissions are assumed for the following:– Quarrying, material extraction and transport– Raw material handling and grinding– Clinker coolers and associated equipment– Product blending/grinding– Load out and transportation of finished goods
11
Emissions Data Reported ForCement Production Facilities (2 of 2)

Calculation Methods for CO2 Process EmissionsFrom Cement Kilns
Reporters must use one of the two methods specified in Subpart H for estimating emissions:– CEMS
• Report CO2 from both combustion and process combined– Mass balance calculation based on production data and
composition analysis of clinker, CKD, and raw materials• Report CO2 from combustion and process separately
12

Common Issues With CEMS Reporting• Gas flow meter accuracy• CEMS CO2 concentration - % accuracy• H2O corrections• CEMS software focused on generating quarterly
compliance reports, but may not be transparent for verification
13
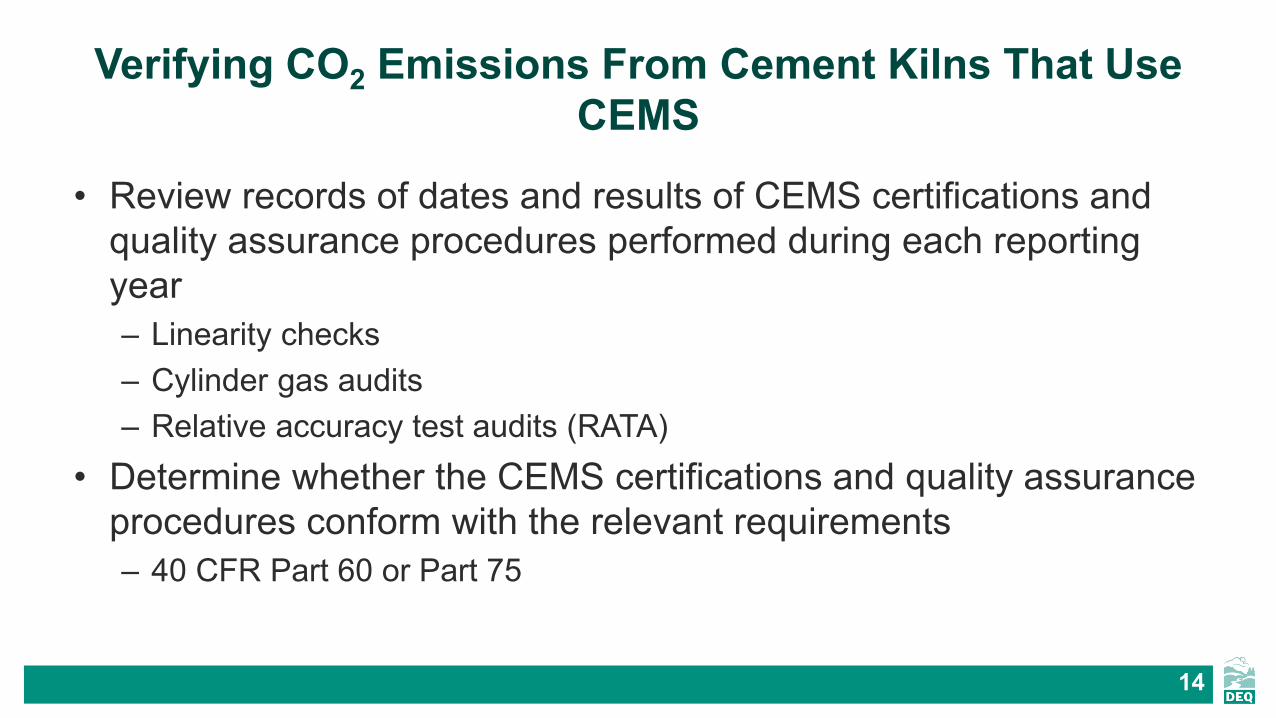
Verifying CO2 Emissions From Cement Kilns That Use CEMS
• Review records of dates and results of CEMS certifications and quality assurance procedures performed during each reporting year– Linearity checks– Cylinder gas audits– Relative accuracy test audits (RATA)
• Determine whether the CEMS certifications and quality assurance procedures conform with the relevant requirements– 40 CFR Part 60 or Part 75
14

Verifying Missing Data Substitution for CO2 Emissions Measured with CEMS (1 of 2)
Evidence to request– Operator of a unit monitoring and reporting emissions and heat
input data using Tier 4 (40 CFR 98.33(a)(4)) must follow the missing data procedures in 40 CFR 75.31 to 75.37)
– CEMS certified under 40 CFR Part 60 uses quality-assured data defined according to QA/QC procedures in Part 60
15

Verifying Missing Data Substitution for CO2 Emissions Measured with CEMS (2 of 2)
How to evaluate the evidence– Verify that missing data substitution procedures conform with
the applicable procedures in 40 CFR Part 75
– If there was a CEMS breakdown, verify that • The reporter followed applicable procedures during the breakdown
period
16
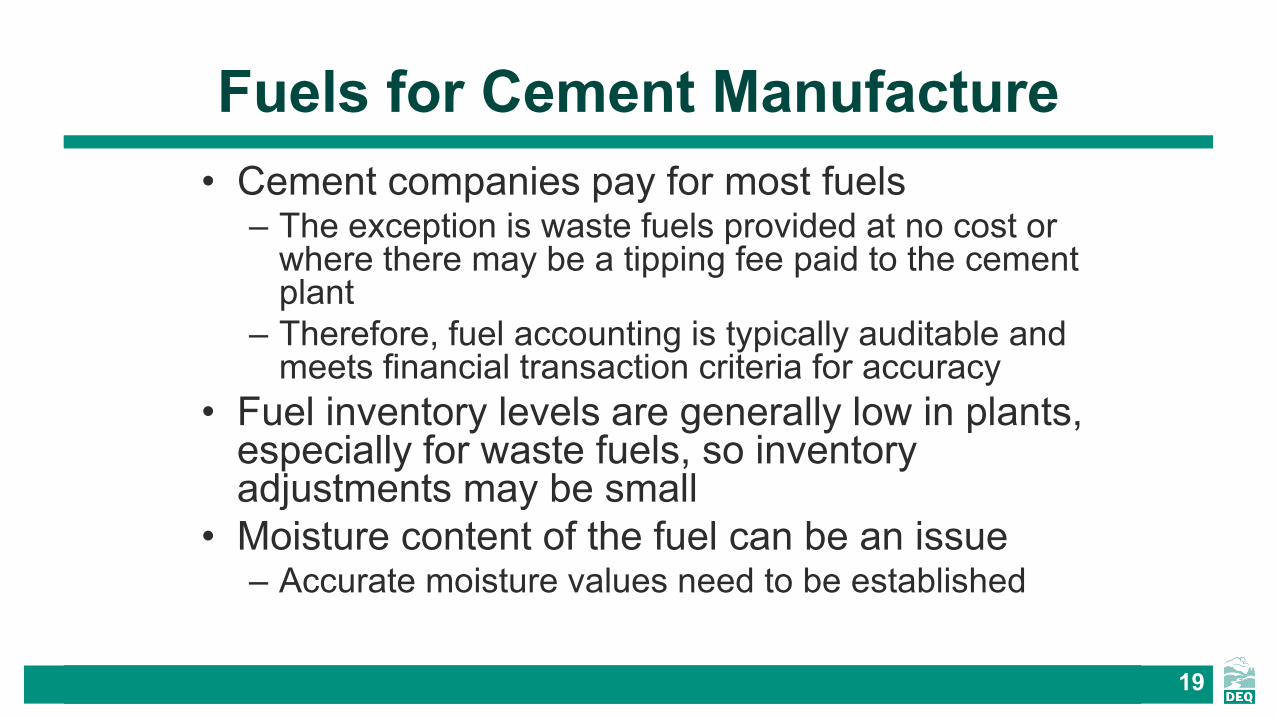
Fuels for Cement Manufacture• Cement companies pay for most fuels
– The exception is waste fuels provided at no cost or where there may be a tipping fee paid to the cement plant
– Therefore, fuel accounting is typically auditable and meets financial transaction criteria for accuracy
• Fuel inventory levels are generally low in plants, especially for waste fuels, so inventory adjustments may be small
• Moisture content of the fuel can be an issue– Accurate moisture values need to be established
19

Emissions from Tires• Waste tires are burned at Oregon’s only cement plants
– Very high energy, low-cost fuel• Similar reporting requirements to other fuels
– Regulation allows a default of 20% biogenic– Monthly fuel sampling is allowed if a default
is not used, but sampling is difficult and maynot be representative
– Tire purchases might not match amount of tires combusted, unless transaction occurs at the point of delivering fuel into kiln
20
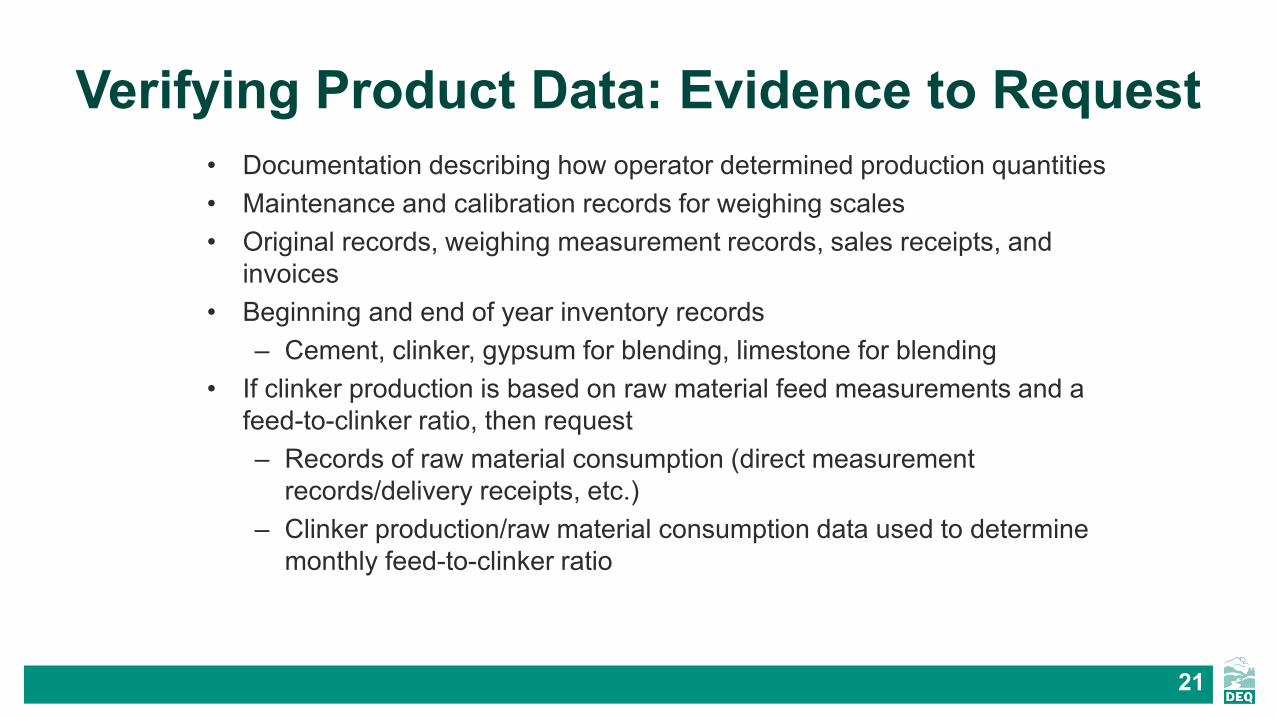
Verifying Product Data: Evidence to Request• Documentation describing how operator determined production quantities • Maintenance and calibration records for weighing scales• Original records, weighing measurement records, sales receipts, and
invoices• Beginning and end of year inventory records
– Cement, clinker, gypsum for blending, limestone for blending• If clinker production is based on raw material feed measurements and a
feed-to-clinker ratio, then request– Records of raw material consumption (direct measurement
records/delivery receipts, etc.) – Clinker production/raw material consumption data used to determine
monthly feed-to-clinker ratio
21

Subpart N: Glass Production
22

Subpart N: Glass ProductionGeneral Applicability
• §98.140 Definition of the source category.• “(a) A glass manufacturing facility manufactures flat glass,
container glass, pressed and blown glass, or wool fiberglass by melting a mixture of raw materials to produce molten glass and form the molten glass into sheets, containers, fibers, or other shapes. A glass manufacturing facility uses one or more continuous glass melting furnaces to produce glass.
• “(b) A glass melting furnace that is an experimental furnace or a research and development process unit is not subject to this subpart.”
• 2 Facilities in Oregon– Hollingsworth & Vose Fiber Company– Owens-Brockway Glass Container Inc.
23

Process Flow for a Glass Manufacturing Facility
24
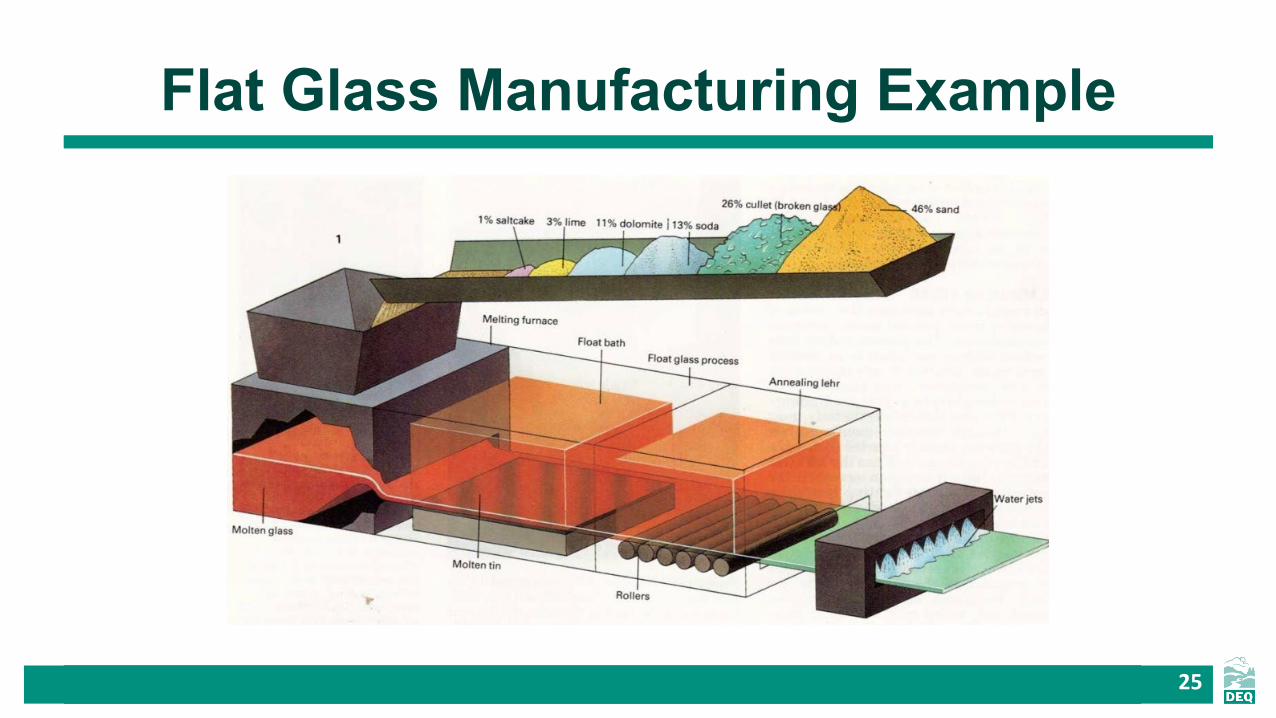
Flat Glass Manufacturing Example
25

Glass Manufacturing Facilities:Reported Emissions Data
• Total emissions MUST include:– CO2 process emissions from glass kiln(s)/furnace(s)– Stationary combustion emissions from all fuels
• Includes kiln plus other ovens and heaters
• All process emissions assumed to occur in furnace– Process emissions should be calculated for each furnace and
aggregated for total– Process emissions are NOT separately reported for
• Raw material handling - receiving, crushing, weighing, mixing• Glass forming - annealing, curing, molding, glass fiber forming
26

Verifying CO2 Process Emissions (1 of 3)Evidence to request
– Documentation describing how facility derived its carbonate-based raw material rates and mineral-based fractions
– Monthly measurements of raw material charged to each furnace
• Calibration records for batch scales or weigh hoppers• Records of raw material purchases
27

Verifying CO2 Process Emissions (2 of 3)How to evaluate evidence
– Compare mass of raw material charged to each furnace with purchases 40 CFR 98.144(a)
• Review inventory adjustment (Dec/Jan) if needed to validate reported raw material usage
• If total quantities are accurate, a reasonable allocation of materials/emissions is acceptable between furnaces
– Reproduce CO2 emission calculations using Eq. N-1• Verify equation inputs used in EPA e-GGRT• Request un-redacted versions of EPA reports from reporter and all
supporting documentation
28

Verifying CO2 Process Emissions (3 of 3)
• A default of 1 may be used for carbonate-based mineral mass fraction (40 CFR 98.144(c))– Otherwise, must use documentation from suppliers and at least
annual sampling/chemical analysis to verify supplier data
• A default of 1 may be used for calcination fraction (40 CFR 98.144(d)) – Otherwise, use records of annual sampling and chemical analysis of
the calcination fraction for each carbonate consumed
∑1=
iiiiCO2 F•EF•)22052000
•M(•MF = En
i
Carbonate-based mineral mass fraction
Calcination fraction
(Equation N-1)
29

Verifying Missing Emissions Data• §98.154: “(a) For missing data on the monthly
amounts of carbonate-based raw materials charged to any continuous glass melting furnace use the best available estimate(s) of the parameter(s), based on all available process data or data used for accounting purposes, such as purchase records.
• “(b) For missing data on the mass fractions of carbonate-based minerals in the carbonate-based raw materials assume that the mass fraction of each carbonate based mineral is 1.0.”
30

Subpart Q: Iron and Steel Production
35

Subpart Q: Iron and Steel ProductionGeneral Applicability
• §98.170 Definition of the source category.• “The iron and steel production source category includes facilities with any of
the following processes: taconite iron ore processing, integrated iron and steel manufacturing, cokemaking not collocated with an integrated iron and steel manufacturing process, direct reduction furnaces not collocated with an integrated iron and steel manufacturing process, and electric arc furnace (EAF) steelmaking not collocated with an integrated iron and steel manufacturing process. Integrated iron and steel manufacturing means the production of steel from iron ore or iron ore pellets. At a minimum, an integrated iron and steel manufacturing process has a basic oxygen furnace for refining molten iron into steel. Each cokemaking process and EAF process located at a facility with an integrated iron and steel manufacturing process is part of the integrated iron and steel manufacturing facility.”
• One facility in Oregon:– Cascade Steel Rolling Mills, Inc.
36

Emissions Data Reported for Iron and Steel Production Facilities
• CO2 process emissions from the following sources are reported under Subpart Q– Taconite indurating furnace– Basic oxygen furnace (BOF)– Non-recovery coke oven battery combustion stack– Coke pushing process– Sinter process– Electric arc furnace (EAF)– Argon-oxygen decarburization vessel– Direct reduction furnace
• Stationary combustion emissions reported under Subpart C
37
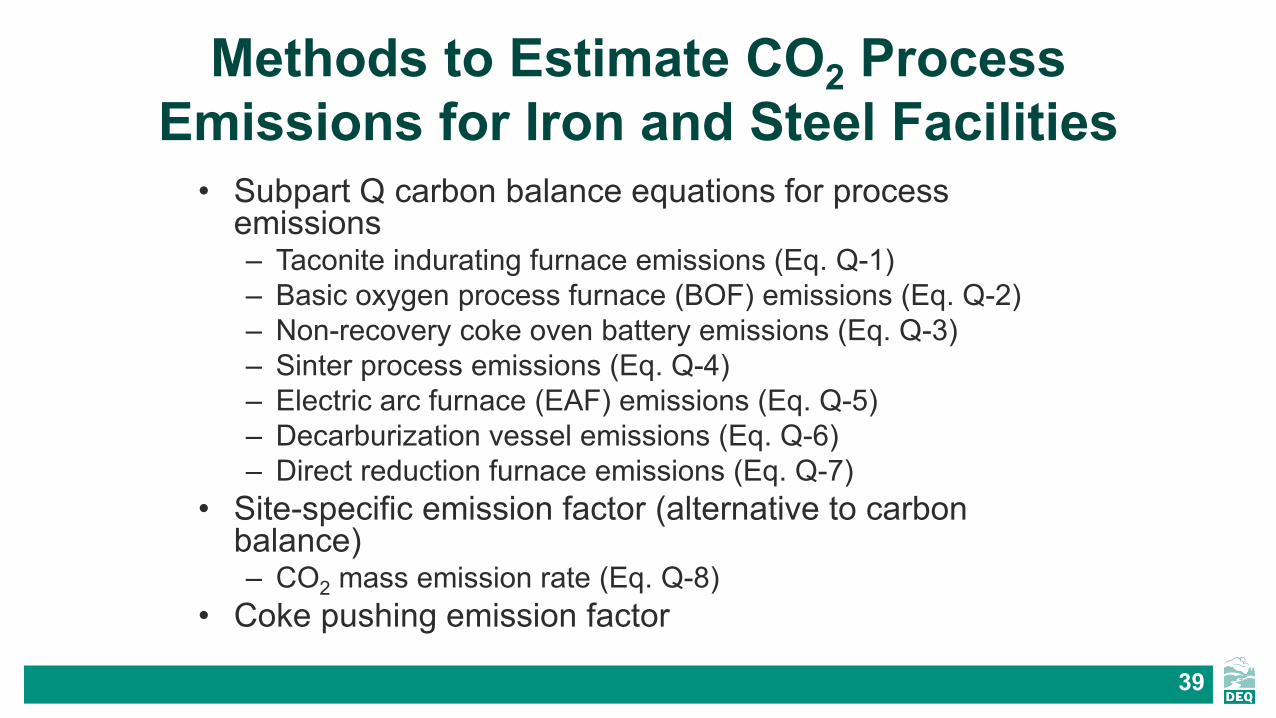
Methods to Estimate CO2 Process Emissions for Iron and Steel Facilities
• Subpart Q carbon balance equations for process emissions– Taconite indurating furnace emissions (Eq. Q-1)– Basic oxygen process furnace (BOF) emissions (Eq. Q-2)– Non-recovery coke oven battery emissions (Eq. Q-3)– Sinter process emissions (Eq. Q-4)– Electric arc furnace (EAF) emissions (Eq. Q-5)– Decarburization vessel emissions (Eq. Q-6)– Direct reduction furnace emissions (Eq. Q-7)
• Site-specific emission factor (alternative to carbon balance)– CO2 mass emission rate (Eq. Q-8)
• Coke pushing emission factor
39
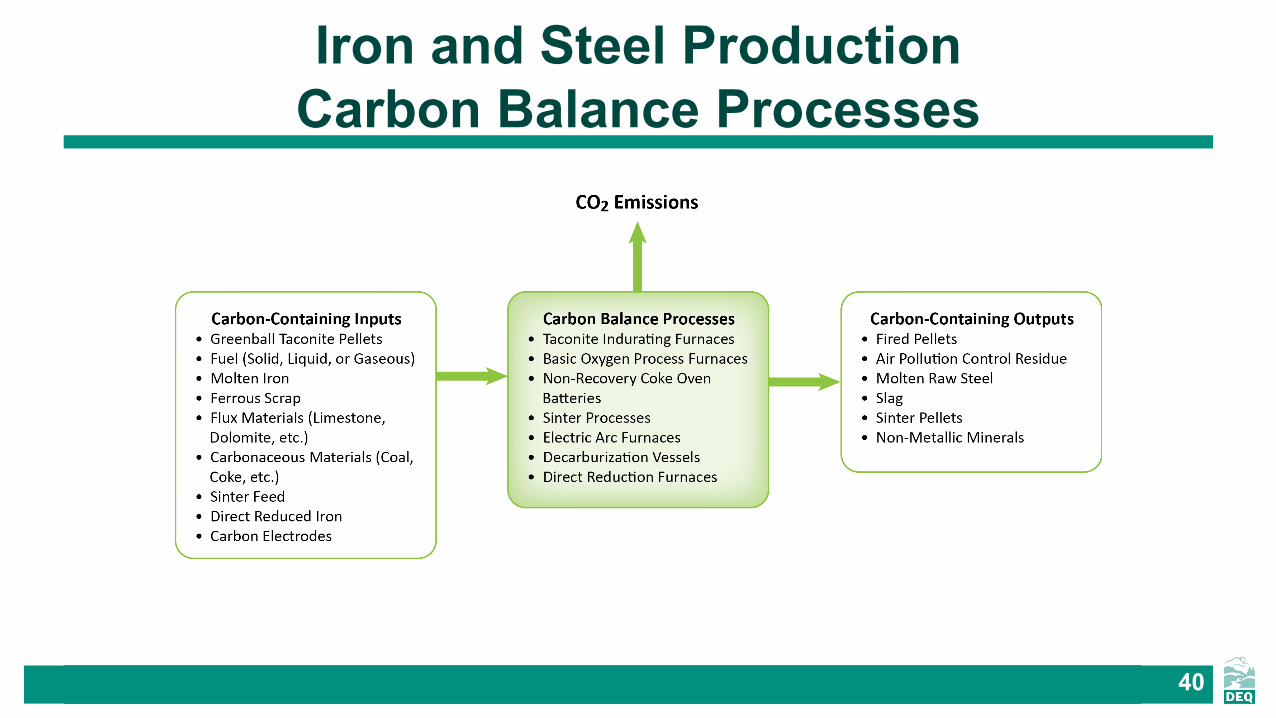
Iron and Steel Production Carbon Balance Processes
40

Verifying CO2 Process Emissions (1 of 2)Evidence to request
– Annual mass quantities of all carbon-containing inputs and outputs
• If any process input and output category (i.e. “Flux”) contributes less than 1% of the total carbon mass, it can be excluded (§98.174(b)(4))
– Carbon content of each carbon-containing input and output
• Analysis provided by supplier, or collecting and analyzing at least three samples per year, used as inputs into Cal e-GGRT
– Any other data that can validate reported data • Hours of operation, average outputs, financial data, and any other
monitored/measured data
41
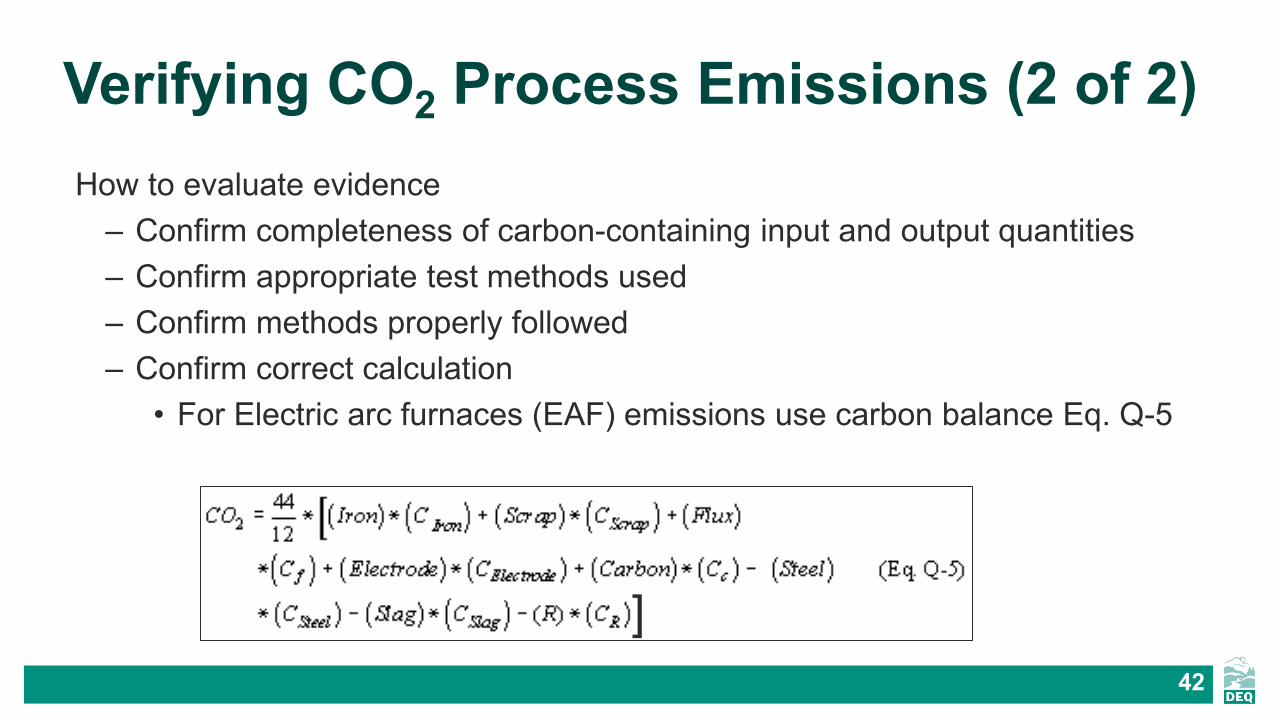
Verifying CO2 Process Emissions (2 of 2)How to evaluate evidence
– Confirm completeness of carbon-containing input and output quantities– Confirm appropriate test methods used– Confirm methods properly followed– Confirm correct calculation
• For Electric arc furnaces (EAF) emissions use carbon balance Eq. Q-5
]42

Verifying Missing Emissions Data Substitution
• For carbon content confirm missing emissions data procedures were followed– Estimation of missing carbon content test data is not permitted– New test is required
• For mass of carbon-containing inputs and outputs, confirm missing emissions data procedures were followed
• Follow methods in §98.175
43

Verifying Product Data• Evidence to request
– Monthly production data of primary iron and steel products– Direct measurement of production (e.g., weigh hoppers, belt
weigh feeders, weighed purchased quantities in shipments or containers, combination of bulk density and volume measurements, etc.)
– Existing plant procedures used for accounting purposes• How to evaluate evidence
– Confirm record completeness– Confirm that monthly data are summed correctly– Compare summed monthly data with reported production data– Missing data procedures not permitted for covered product
data
44
Verifying Other Data for an Iron and Steel Production Plant
• Other “non-emissions” data– Subpart Q requires other production-related data
to be reported to U.S. EPA: e.g., annual production quantity (in metric tons) for taconite pellets, coke, sinter, iron, and raw steel
• 40 CFR 98 production-related data elements must be verified.
45

Subpart V – Nitric Acid Production
49
Subpart V: Nitric Acid Production General Applicability
• §98.220 Definition of source category.• “This source category includes a nitric acid production facility using one
or more trains to produce weak nitric acid (30 to 70 percent in strength). Starting with reporting year 2018, this source category includes all nitric acid production facilities using one or more trains to produce nitric acid (any strength). A nitric acid train produces nitric acid through the catalytic oxidation of ammonia.”
• One facility in Oregon:– Dyno Nobel, Inc.
50

Emissions Data Reported• Process emissions: N2O process emissions from
individual production trains – refer to Subpart V• Stationary combustion: CO2, CH4, and N2O emissions
from stationary fuel combustion
51

Calculation of N2O Process EmissionsSubpart V equations
– Calculation of train-specific emission factor (Eq. V-1)– Calculation of abatement utilization factor (Eq. V-2)– Calculation of train-level emissions
• 1 technology after test point (Eq. V-3a)• 2+ technologies (in series) after test point (Eq. V-3b)• 2+ technologies (in parallel) after test point (Eq. V-3c)• 0 technologies after test point (Eq. V-3d)
– Calculation of facility-level emissions (Eq. V-4)
52

Verifying N2O Process EmissionsEvidence to request
– GHG Monitoring Plan– Detailed facility description and schematic – individual
trains, abatement technologies, performance test locations– Performance test results – N2O concentration, volumetric
flow rate of effluent gas, production rate during test run• Is annual test data representative of “normal” operations
– Abatement technology information - destruction efficiencies, utilization factors, fraction control factors
– Nitric acid production (total amount produced)– Missing emissions data procedures and records used
53

Verifying Equation V-1Train-Specific Emission Factor
• Evidence to request– Equation inputs (data from performance test runs -
N2O concentration, volumetric flow rate of effluent gas, production rate during test run)
• How to evaluate evidence– Confirm appropriate test methods used– Confirm methods properly followed– Confirm missing emissions data procedures were
followed• Estimation of missing test data is not permitted; new performance
test is required– Confirm correct calculation
54

Verifying Equation V-2 Abatement Utilization Factor (1 of 2)
Evidence to request– Equation inputs
(nitric acid production - total and with abatement)– Direct measurement records
(flow meters, weigh scales, etc.)– Abatement records (operation log books)
55

Verifying Equation V-2Abatement Utilization Factor (2 of 2)
How to evaluate evidence– Confirm production record completeness– Identify if operation periods are indicated as
“abated” or “not abated” with respect to air pollution control device
– Confirm missing emissions data procedures were followed, §98.225
– Confirm correct calculation
56
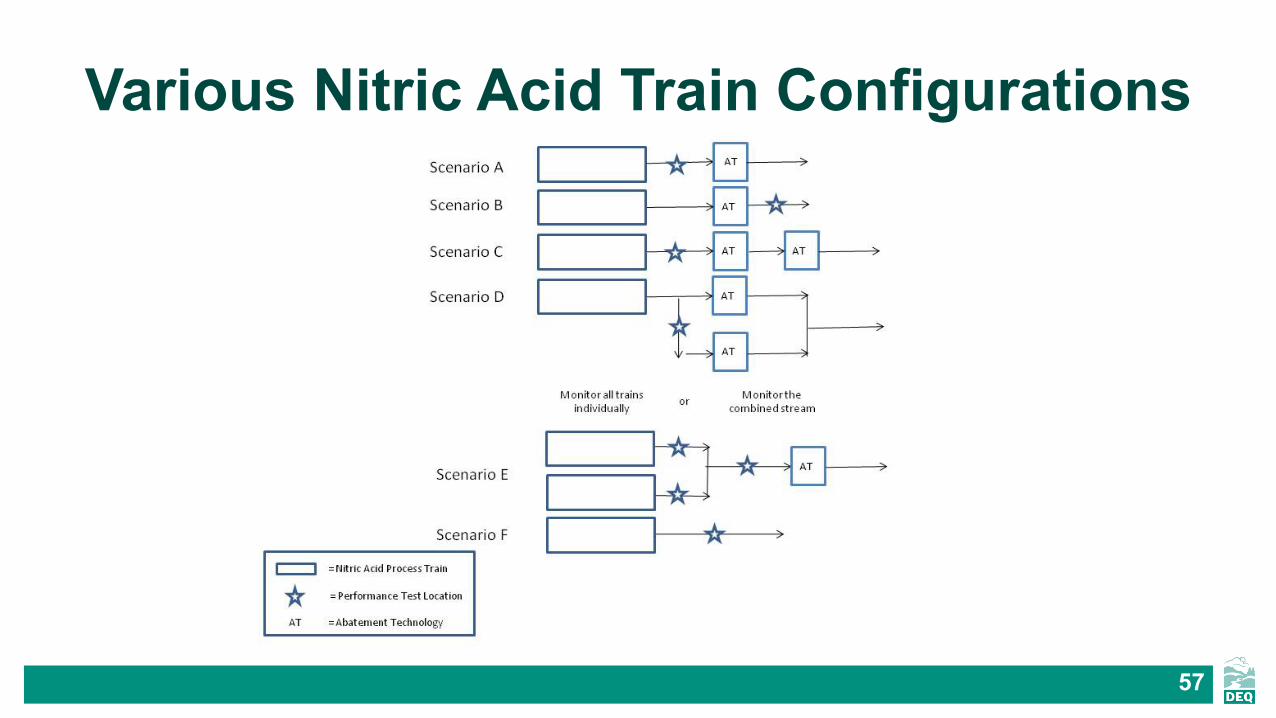
Various Nitric Acid Train Configurations
57

Process Emissions Equations (V-3a,b,c,d)
58

Differences Between Equations V-3a, V-3b, V-3c, and V-3d
Equation # of Technologiesa DFb Needed? AFc Needed? FCd
Needed?
Configuratione
(“Scenario” in Slide #3)
V-3a 1 Yes Yes No A, E
V-3b 2+ (in series) Yes Yes No C
V-3c 2+ (in parallel) Yes Yes Yes D
V-3d 0 No No No B, FaNumber of abatement technologies after test pointbDestruction efficiencycAbatement utilization factordFraction control factoreConfiguration identified in Checklist Table 1
59

Verifying Equations V-3a, V-3b, V-3c, and V-3d (1 of 2)
Specific evidence needed– Equation inputs
(nitric acid production, destruction efficiency, abatement utilization factor, fraction control factor)
– Basis for destruction efficiency– Basis for fraction control factor– Direct measurement records
(flow meters, weigh scales, etc.)
60

Verifying Equations V-3a, V-3b, V-3c, and V-3d (2 of 2)
How to evaluate evidence– Confirm production record completeness– Confirm reasonableness of destruction efficiency– Confirm missing emissions data procedures were followed,
§98.225– Confirm correct calculation
61
Verifying Equation V-4: Facility-level emissions
• Evidence to request– Equation inputs (train level emissions)
• How to evaluate evidence– Confirm inclusion of all trains– Confirm correct calculation
62

Verifying Product Data for Nitric Acid Production
• Evidence to request– Monthly nitric acid production data– Monthly calcium ammonium nitrate (CAN-17) solution production data– Direct measurement of production and concentration (e.g., flow
meters, weigh scales, etc.)– Existing plant procedures used for accounting purposes (e.g.,
dedicated tank-level and acid concentration measurements, etc.)• How to evaluate evidence
– Confirm record completeness– Confirm that monthly data are summed correctly– Compare summed monthly data with reported production data– Missing data procedures only permitted for calculation of emissions or
emission factors; not permitted for product data reporting
63

This concludes this presentation
For questions, please contact us:
Thank you for attending!
66