greening america’s schools: costs and benefits author: greg kats capital e report, 2006
TRANSCRIPT

Greening America’s Schools: Costs and Benefits
Author: Greg Kats
Capital E Report, 2006

Sponsoring Organizations:• American Federation of Teachers• American Institute of Architects• American Lung Association• Federation of American Scientists• US Green Building Council
“This carefully documented study conclusively demonstrates the financial, environmental, and other benefits of using green technologies in schools. In fact, failure to invest in green technologies is not financially responsible for school systems; the study uses conservative accounting practices to show that investments in green technologies significantly reduce the life-cycle cost of operating school buildings. And the public benefits of green schools are even larger than those that work directly to the financial advantage of schools. These include reductions in water pollution, improved environmental quality, and increased productivity of learning in an improved school environment.”
- Henry Kelly, President, Federation of American Scientists

Green Building ElementsGreen Building Elements
Water
Efficiency
8%Energy &
Atmosphere
27%
Materials &
Resources
20%
Sustainable
Sites
22%
Indoor
Environmental
Quality
23%

Importance of School Design
• 55 million students are in school everyday
• Schools typically designed just to meet codes
• Studies show that many schools are unhealthy – poor ventilation, poor lighting
• School conditions impact both student health and ability to learn
• School budgets are often constrained – struggle to maintain facilities and improve educational standards
• $35 billion projected to be spent on school construction in 2007

From: “2005 Survey of Green Building,” Turner construction/
Greening America’s Schools, Capital E, 2006. Survey of 665 senior executives.
Available at: http://www.turnerconstruction.com/greensurvey05.pdf
Study objective
How much more do green schools cost?
Is greening schools cost effective?
Methodology
To evaluate the costs and benefits of green schools, we calculated net present value (NPV) which represents the present value of an investment’s discounted future financial benefits minus any initial investment.

Assumptions• Typical School
– Term: 20 years NC, 15 years retrofit– Inflation: 2%– Discount rate: 5% real
– 2006 base year
• Energy Prices:– Electricity: $0.09 kWh– Natural gas: $11.50/ thousand CF– Annual Increase: 5% per year
• Green Building Standards:– LEED– MA CHPS (Collaborative for High Performance Schools) – WSS (Washington Sustainable School (WSS) Protocol for High
Performance Facilities)

Green Schools used in analysis
Name
State
Year Complete
d
2005 MA-
CHPS
LEED Score
LEED Level
(or LEED equivalent)
Cost Premium
Energy Savings
Water Savings
Ash Creek Intermediate School OR 2002 0.00% 30% 20%
Ashland High School* MA 2005 19 1.91% 29%
Berkshire Hills* MA 2004 27 3.99% 34% 0%
Blackstone Valley Tech* MA 2005 27 0.91% 32% 12%
Capuano MA 2003 26 CERTIFIED 3.60% 41%
Canby Middle School OR 2006 40 GOLD 0.00% 47% 30%
Clackamas OR 2002 33 SILVER 0.30% 38% 20%
Clearview Elementary PA 2002 49 42 GOLD 1.30% 59% 39%
Crocker Farm School MA 2001 37 1.07% 32% 62%
C-TEC OH 2006 35 38 SILVER 0.53% 23% 45%
The Dalles Middle School OR 2002 SILVER 0.50% 50% 20%
Danvers* MA 2005 25 3.79% 23% 7%
Dedham* MA 2006 32 2.89% 29% 78%
Lincoln Heights Elementary School WA 2006 SILVER 30% 20%
Newton South High School MA 2006 32 CERTIFIED 1.36% 20% 20%
Melrose Middle School MA 2007 36 2.02% 29% 35%
Model Green School IL 2004 34 SILVER 0.99% 30% 20%
Prairie Crossing Charter School IL 2004 34 SILVER 3.00% 48% 16%
Punahou School HI 2004 43 GOLD 6.27% 43% 50%

Green Schools (cont.)
Name
StateYear
Completed
2005 MA-
CHPS
LEED Score
LEED Level
(or LEED equivalent)
Cost Premium
Energy Savings
Water Savings
Third Creek Elementary NC 2002 39 GOLD 1.52% 26% 63%
Twin Valley Elementary PA 2004 41 35 SILVER 1.50% 49% 42%
Summerfield Elementary School NJ 2006 42 44 GOLD 0.78% 32% 35%
Washington Middle School WA 2006 40 GOLD 3.03% 25% 40%
Whitman-Hanson* MA 2005 35 1.50% 35% 38%
Williamstown Elementary School MA 2002 37 0.00% 31%
Willow School Phase 1 NJ 2003 39 GOLD 25% 34%
Woburn High School* MA 2006 32 3.07% 30% 50%
Woodword Academy Classroom GA 2002 34 SILVER 0.00% 31% 23%
Woodword Academy Dining GA 2003 27 CERTIFIED 0.10% 23% 25%
Wrightsville Elementary School PA 2003 38 SILVER 0.40% 30% 23%
AVERAGE 1.65% 33.4% 32.1%

Energy and water benefits• Direct Energy Cost Savings (~33%)• Indirect Energy Savings (price impact)
– Equal to 50% of Direct Energy Cost Savings
• Emissions Reduction NOx, SO2, CO2, PM10, Hg
• Water/Wastewater Efficiency– Indoor Low-flow Plumbing, Landscaping, Rainwater
Catchment– Reduced water/sewer expenditures (~32%)– Avoided societal costs of increasing capacity and of water
and wastewater treatment

Annual Green School Energy Savings
$0
$50,000
$100,000
$150,000
$200,000
$250,000
$300,000
$350,000
1 2 3 4 5 6 7 8 9 10 11 12 13 14 15 16 17 18 19 20
Year
$
5%
10%
2%
Assumed Annual Energy Price Increase:
Report value

Source: Carnegie Mellon University Center for Building Performance, 2005/ Greening America’s Schools, Capital E, 2006
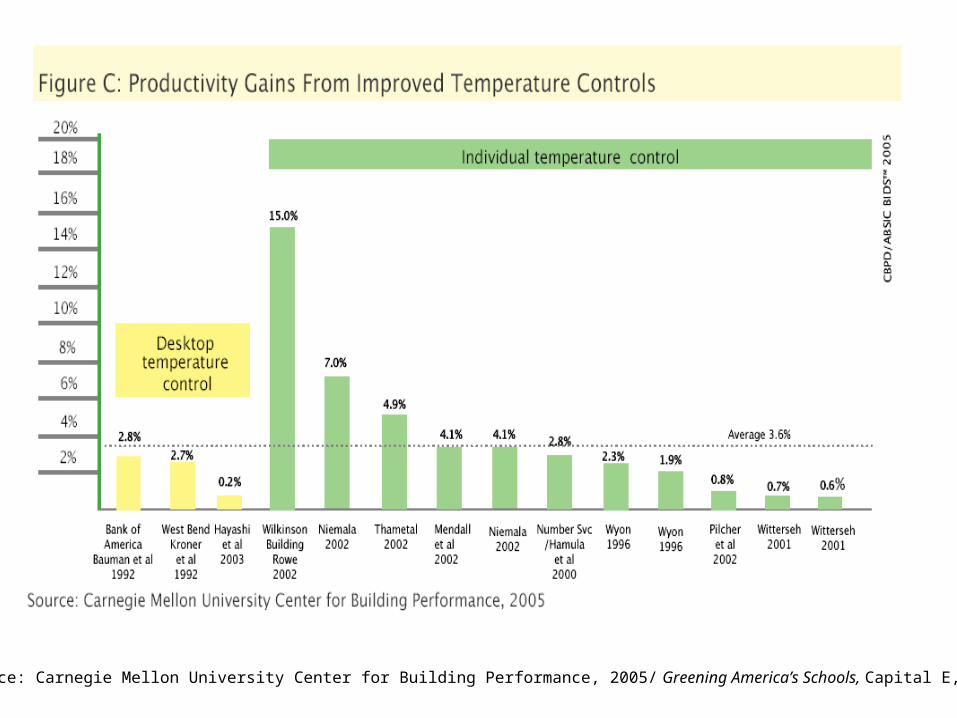
Source: Carnegie Mellon University Center for Building Performance, 2005/ Greening America’s Schools, Capital E, 2006

Source: Carnegie Mellon University Center for Building Performance, 2005/ Greening America’s Schools, Capital E, 2006

Health & Learning Benefits of Green Schools
Increased Learning, Productivity & Performance (3%)
Increased Future Earnings of Students (1.4%)
Reduced Asthma (25%)
Reduced Colds and Flu (15%)
Reduced Teacher Turnover (3%)

Employment Benefits of Green Schools
• Energy Efficiency– 3 short term jobs, ½ of a long term job per
school
• Renewable Energy– More labor intensive, less polluting (not
quantified)
• Waste Diversion– Recycling creates nearly 2x more jobs than
waste disposal (not quantified)

Financial Benefits of Green Schools
Benefits to school•Energy savings
•Water savings
•Teacher retention
•In-school health care cost savings
Benefits to broader community•Emissions reductions
•Increased earnings
•Employment impact
•Health care cost savings

The Financial Benefits of Green School Design ($/ft2)
Source: Greening America’s Schools, Capital E, 2006

Additional Benefits not Quantified
• Reduced Teacher Sick Days (probably ~$2/ft2)• Insurance and risk related benefits • Lower Operations and Maintenance (O&M) Costs• Enhancement of generating system reliability and
improved power quality • Stormwater reduction and reduced infrastructure costs• Improving equity and addressing spiritual values • Educational enrichment as an aspect of greener, healthier
facilities• Slowing global warming

Insurance Impact of Green DesignEnergy & Atmosphere Professional
LiabilityGeneralLiability
BusinessInterruption
Property
LiabilityHealth
InsuranceLife
Insurance
Prereq 1Fundamental Building Systems
Commissioning (Required) + + + +
Prereq 2Minimum Energy Performance
(Required) +/- + + +/- +
Prereq 3CFC Reduction in HVAC&R
Equipment (Required) +
Credit 1.1
Optimize Energy Performance, 20% New / 10% Existing (2 points) +/- + + +/- + +
Credit 1.2
Optimize Energy Performance, 30% New / 20% Existing (2 points) +/- + + +/- + +
Credit 1.3
Optimize Energy Performance, 40% New / 30% Existing (2 points) +/- + + +/- + +
Credit 1.4
Optimize Energy Performance, 50% New / 40% Existing (2 points) +/- + + +/- + +
Credit 1.5
Optimize Energy Performance, 60% New / 50% Existing (2 points) +/- + + +/- + +
Credit 2.1
Renewable Energy, 5% (1 point) - + +

Third Creek Elementary School (NC)
800 students moved from 2 older schools in 2002Same students and teachers
3 years prior to move 60% of students on grade level in math and reading2 years post-move 80% on grade
levelNo other changes
Third Creek Elementary School designed by Moseley Architects. Photo: Spark Productions

Clearview Elementary School

New Haven Public Schools
• Adopted a combination of LEED and energy star guidelines for some of their school construction and renovation plans
• 8 new schools constructed that are expected to consume 30% less energy
• Lower utility cost by $400,000 per year which will yield over a $10,000,000 lifetime savings over the next 20 years.

Lincoln Hall Berea College1st LEED certified (silver) building in KY
• Reuse of 75% of the building’s structure and shell in the renovation, including flooring and woodwork;
• 50% of construction and demolition waste diversion;
• 35% reduction in energy costs
• 30% reduction in potable water consumption by occupant.
• Recycled content carpet, acoustic ceiling panels and artificial slate roof tiles ;
• Low VOC paints and carpets
• Indigenous, drought tolerant landscaping to reduce the need for watering
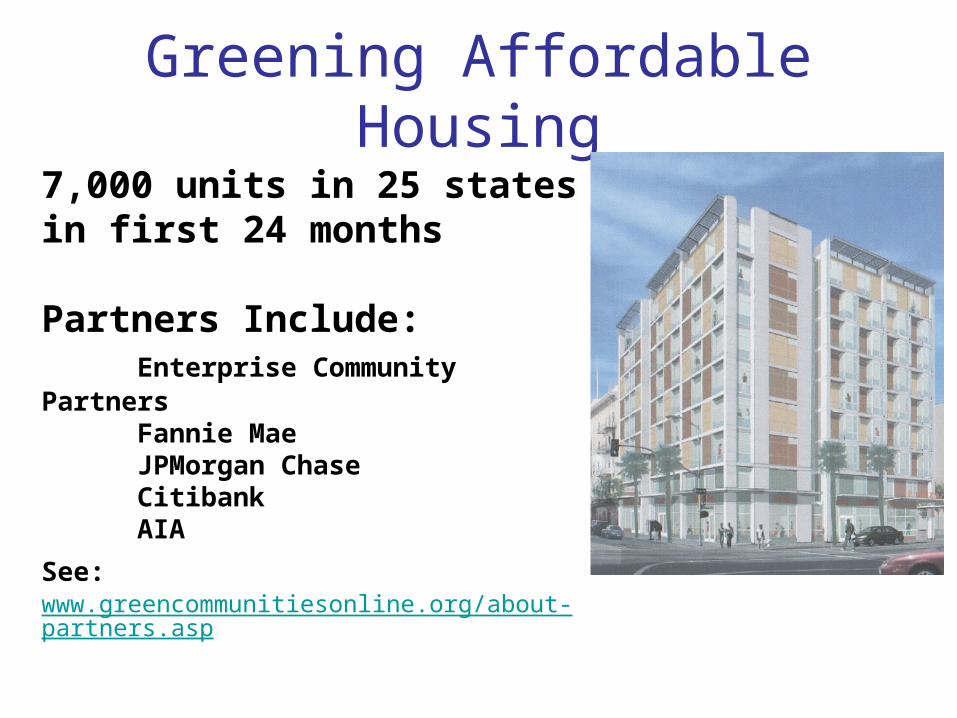
Greening Affordable Housing
7,000 units in 25 states in first 24 months
Partners Include:Enterprise Community Partners Fannie MaeJPMorgan ChaseCitibankAIA
See: www.greencommunitiesonline.org/about-partners.asp

Impact of Experience on Green Building
From: “2005 Survey of Green Building,” Turner construction/ Greening America’s Schools, Capital E, 2006. Available at: http://www.turnerconstruction.com/greensurvey05.pdf

Potential National Savings from Greening all School Construction
First year direct energy savings per school
$47,880
First year total direct savings per school
$95,760
Jobs created annually from energy efficiency
2000
Total national energy savings over 10 years
$20 billion
Direct savings for an average green school

Global Warming is Now

“Warming of the climate system is unequivocal, as is now evidentfrom observations of increases in global average air and ocean temperatures, widespread melting of snow and ice, and risingglobal average sea level.”
-Intergovernmental Panel on Climate Change, February 2007 report
“FIGURE SPM-6. Projected surface temperature changes for the early and late 21st century relative to the period 1980–1999. The central and right panels show the Atmosphere-Ocean General Circulation multi-Model average projections forthe B1 (top), A1B (middle) and A2 (bottom) SRES scenarios averaged over decades 2020–2029 (center) and 2090–2099(right).”

42 members representing $2.4 trillion
in market capitalization:
“1. We accept the views of most scientists that enough is known about the science and environmental impacts of climate change for us to take actions to address its consequences.
2. Businesses can and should take concrete steps now in the U.S. and abroad to assess opportunities for emission reductions, establish and meet emission reduction objectives, and invest in new, more efficient products, practices and technologies.”
Pew Center on Global Climate Change, Business Environmental Leadership Council

11 LEED certified buildings in Kentucky
State/Provincial GovernmentBritish Columbia Buildings Corporation-Green Buildings BC
California Integrated Waste Management Board - Green Building Program
California High Performance Schools (CHPS)
Florida Sustainable Communities and e-design
Maryland Green Building Program
Minnesota Sustainable Design Guide
New Jersey Clean Energy Program - design support incentive
New York State Energy Research & Development Authority (NYSERDA)
New York State Green Building Tax Incentive Initiative
Oregon Office of Energy
Oregon Housing and Community Services
Pennsylvania Buildings –
Governor's Green Government Council
Local GovernmentAlameda County, CA, Waste Authority - Green Building programs
Arlington County, VA - Green Building IncentiveAustin, TX, Green Building Program
Battery Park City Authority, NYC - High-Rise Residential Green Guidelines
Boulder, Colorado - Green Points ProgramCambridge Sustainable City
Coconino County, Arizona - Sustainable Economic Development Initiative
Hennepin County, MN - Sustainable Design Guide and Rating SystemICMA - Green Building Goes Local (article)
Issaquah, WA - Sustainable BuildingKing County, WA - Green Building Program
Kitsap County, WA - Build a Better KitsapLos Angeles, CA - Green Building Guidelines
Miami-Dade County, FL - Green CoalitionNew York City High Performance Building Guidelines
Oakland, CA - Green Building Resource CenterPhiladelphia, PA – Schools: Save Energy Campaign
Portland, OR - Green RatedPortland, OR - Office of Sustainable Development
San Francisco, CA - Green Building ProgramSan Jose, CA - Green Building Program
Santa Barbara, CA - Innovative Building Design initiativeSanta Monica Green Building Guidelines & Ordinances
Scottsdale, AZ, Green Building ProgramSeattle City Light - Built Smart program
Seattle Sustainable BuildingTriangle J Council of Governments –
High Performance Building GuidelinesWashington, DC - Metropolitan DC Council of Governments
40+ state and local green building initiatives and ordinances
LEED certified buildings by state as of 7/06

Estimated net financial impact* of greening all US school construction
-10
0
10
20
30
40
50
0 5 10 15
years from implementation
$/per year(billions)
Annual energy savings minus annual cost of greening
Total annual financial benefits (not including earnings benefit) minus annual cost of greening
Cumulative total benefits (not including earnings benefit) minus cumulative cost of greening
*Does not include many additional benefits not quantified in report.

New StudyGreening America’s Buildings and Communities: Costs and Benefits• Expanded data set: 100-200 buildings• All building types• Community projects: mixed use-high density, traditional
neighborhood developments, transit-oriented developments
• Broad set of benefits including physical activity/health benefit, public infrastructure, etc.
• Sponsors to include USGBC, American Public Health Association and others…
Send us your data!

Jon Braman
Research Associate, Capital E
1666 Connecticut Ave. NW, Suite 310
Washington, DC 20009
Phone: (202) 463-1550
www.cap-e.com
Jon BramanResearch Associate and Assistant to Greg Kats,
Capital E1666 Connecticut Ave. NW,
Suite 310Washington DC 20009Phone: (202) [email protected]
www.cap-e.com