greenland turbot reinhardtius hippoglossoides of the ... · noaa technical report nmfs 71 greenland...
TRANSCRIPT

NOAA Technical Report NMFS 71
Greenland TurbotReinhardtius hippoglossoidesof the Eastern Bering Seaand Aleutian Islands Region
Miles S. AltonRichard G. BakkalaGary E. WaltersPeter T. Munro
December 1988
U.S. Department of Commerce

NOAA TECHNICAL REPORT NMFS
Guidelines for Contributors
FORM OF MANUSCRIPT
Authors are encouraged to retain manuscripts on word processing storagemedia, such as diskettes, floppy disks, cassette or magnetic tapes, and submit a hard copy run from the storage media. Hardcopy should be typeddouble-spaced on white bond paper in the following sequence:
Title pageContentsAbstractTextAcknowledgmentsCitationsText footnotesAppendixTablesFigure LegendsFigures
CONTENTS OF MANUSCRIPT
Contents. Contains all text headings with page numbers omitted.
Abstract. Not to exceed one double-spaced typed page. Should includea sentence or two explaining to the general reader why the research wasundertaken and why the results should be viewed as important. Abstractshould convey the main point of the paper and outline the results or conclusions. Footnotes and references do not belong in the abstract.
Text. A brief introduction should portray the broad significance of thepaper. The entire text should be intelligible to readers from differentdisciplines. All technical terms should be defined. Follow the U. S. Government Printing Office Style Manual, 1984 edition.
Fishery nomenclature follows the American Fisheries Society SpecialPublication No. 12, A List ofCommon and Scientific Names ofFishes fromthe United States and Canada, 4th edition, 1980.
Abbreviations and symbols. Define all symbols, abbreviations, andacronyms. Define all symbols in equations and formulas. Abbreviate unitsof measure only when used with numerals or in tables and figures wherethere is lack of space. Periods are rarely used except for et aI., vs., e.g.,i.e., etc.
Measurements should be expressed in metric units. Other equivalent unitsmay be given in parentheses.
Text footnotes. Type on a separate sheet from the text. Footnotes are notused for reference material or personal communications, but rather to explain or define terms in the text and for contribution numbers.
Personal communications are noted in parentheses in the text (name,affiliation, brief address including zip code, month and year).
Citations. All written sources should be listed in the Citations section,including unpublished and processed material. In text, cite as Smith andJones (1977) or (Smith and Jones 1977); if more than one citation, listchronologically (Smith 1936; Jones 1975; Doe 1977). All sources cited inthe text should be listed alphabetically by the senior authors' surname underthe heading CITATIONS. Abbreviations of periodicals and serials shouldconform to the Biosis Data Base™ The author is responsible for the accuracy of all citations.
Acknowledgments. Gather all acknowledgments into a brief statementat the end of the text. Give credit only for exceptional contributions andnot to those whose contributions are part of their normal duties.
Tables. Tables should supplement, not duplicate, the text. Each table shouldappear on a separate page, and be numbered consecutively. Headings shouldbe short but amply descriptive so that the reader need not refer to the text.For values less than I, zeros should precede all decimal points. Give eachcolumn a heading with units of measure indicated in parentheses. Do notchange the unit of measure within a column. Table footnotes should benumbered consecutively in Arabic numerals across the page from left toright and down; to avoid confusion with exponents, place them to the leftof numerals, e.g., 310. All tables should be cited consecutively in the textand their placement, where first mentioned, indicated in the left-hand marginof the manuscript page. Lengthy tables that are typed in the proper formatand are clean and legible can be used camera-ready.
Figures. Photographs and line drawings should be of professional qualityclear and concise-and reducible to 42 picas for full-page width or to 20picas for a single-column width, and a maximum of 57 picas high. All il·lustrations must be proportioned so that they are legible when reduced tofit the page format. Line weight and lettering should be sharp and even.Lettering on graphs should be upper and lower case, and vertical letteringshould be avoided as much as possible (except for vertical, y, axis). Forvalues less than I, zeros should precede all decimal points. Reproductionsof line art work are accepted in the form of photographic prints from negativesor photomechanical transfer. Halftones should be sharply focused with good·contrast. Micron rules should be inserted on electron micrographs, evenwhen magnification is included in the figure legend. There should be gooddistinction between identifying letters (preferably press-on) and backgroundof photograph. All figures should be cited consecutively in the text and theirplacement, where first mentioned, indicated in the left-hand margin of themanuscript page. Each figure should be labeled in pencil on the back. DONaT SEND original or photographic prints of figures to the Scientific Editor;they will be requested when the manuscript is accepted for publication.
Copyright. Government publications are in the public domain, i.e., theyare not protected by copyright.
SUBMISSION OF MANUSCRIPTSSend original hardcopy and two duplicated copies of the manuscript to:
Dr. Andrew E. Dizon, Scientific EditorNOAA Technical Reports NMFSSouthwest Fisheries CenterNational Marine Fisheries Service, NOAAP.O. Box 271La Jolla, CA 92038-0271
Indicate whether word processing storage media are available, but do notforward disks until requested by Scientific Editor or Scientific Publicationsoffice.
Copies of published reports. For single monographs, the senior authorwill be provided with 50 copies free of charge and 50 to his or her organization. For collections of papers, each senior author will receive 50 separatesand one cover, and his or her organization will receive the same. Additionalcopies may be purchased in lots of 100.
ADDITIONAL INFORMATIONQuestions regarding editorial policy and procedures may be forwarded 10:
Nancy Peacock, Managing EditorNOAA Technical Reports NMFSNational Marine Fisheries Service, NOAAScientific Publications OfficeBin C15700Seattle, WA 98115

NOAA Technical Report NMFS 71
Greenland TurbotReinhardtius hippoglossoidesof the Eastern Bering Seaand Aleutian Islands Region
Miles S. AltonRichard G. BakkalaGary E. WaltersPeter T. Munro
December 1988
u.s. DEPARTMENT OF COMMERCEC. William Verity, Jr., Secretary
National Oceanic and Atmospheric AdministrationWilliam E. Evans, Under Secretary for Oceans and Atmosphere
National Marine Fisheries ServiceJames Brennan, Assistant Administrator for Fisheries

The National Marine Fisheries Service (NMFS) does not approve, recommendor endorse any proprietary product or proprietary material mentioned in thispublication. No reference shall be made to NMFS, or to this publication furnishedby NMFS, in any advertising or sales promotion which would indicate or implythat NMFS approves, recommends or endorses any proprietary product or proprietary material mentioned herein, or which has as its purpose an intent to causedirectly or indirectly the advertised product to be used or purchased because ofthis NMFS publication.
ii

CONTENTSPurpose 1
Background 1Distribution of species 1General life history features 2North Atlantic and North Pacific Greenland turbot fisheries 4Management of eastern Bering Sea-Aleutian stock 4
Fisheries and research surveys 5Data sources and analysis 5
Fisheries 5Research survey data 7
Results 8Analysis of Japanese fisheries information 8Research vessel survey findings 20
Discussion 27Distribution and migrations 27Recruitment hypothesis 27Current condition of eastern Bering Sea-Aleutians stock 28Causes of recruitment failure 28
Acknowledgments 29
Citations 30
iii


Greenland TurbotReinhardtius hippoglossoidesof the Eastern Bering Seaand Aleutian Islands Region
MILES S. ALlONRICHARD G. BAKKALAGARY E. WALTERSPETER T. MUNRONorthwest and Alaska Fisheries CenterNational Marine Fisheries Service, NOAA7600 Sand Point Way N.E.Bin C15700Seattle, WA 98115
ABSTRACT
Greenland turbot (Reinhardtius hippoglossoides) is a commercially importantflounder in both the North Atlantic and North Pacific Oceans. In the latter, itscenter of abundance is in the eastern Bering Sea and along the Aleutian Islandschain where its population is managed as a single stock. Harvest levels in thisregion of the North Pacific during the period 1970-81 were comparable with thosein the northwest and northeast Atlantic, with annual average catches of 53,000metric tons (t). However, the catch in 1984 dropped sharply to 23,100 t, in partbecause of reduced quotas arising from concern over continued poor recruitmentand declining catch-per-unit-effort.
Recruitment failure was manifested in 1) the sharp decline in the catch rateof young flsh in annual research trawl surveys on the continental shelf of theeastern Bering Sea and 2) an increasing proportion of older and larger fish inthe commercial catch from the continental slope of both the eastern Bering Seaand Aleutian Islands. The cause ofthe decline in recruitment could not be clearly identifled.
Greenland turbot of the Bering Sea-Aleutian Islands share certain distributional features with the North Atlantic form. There is an apparent bathymetricchange in the size and age of fish, with younger animals occupying continentalshelf depths and the older individuals residing at depths of the continental slope.At shallow depths the young are exposed to temperature fluctuations, whereasolder animals along the slope are exposed to relatively stable temperatures.
A hypothesis is proposed for describing the temporal and spatial paths bywhich young animals reach the mature or spawning portion of the population.
Purpose _
This report provides a comprehensive treatment of our knowledgeof the Greenland turbot,l Reinhardtius hippoglossoides, stock ofthe eastern Bering Sea and Aleutian Islands region (hereafter referredto as the Aleutians). It covers the history of harvest and management of this stock and describes the characteristics of the fisheries,such as nations and vessel types involved and the temporal andspatial patterns of harvest and of catch-per-unit-effort. The reportalso traces changes that have occurred in the abundance and composition of the stock as inferred from both fisheries and researchvessel survey data. A hypothesis is proposed for the eastern Bering Sea-Aleutian stock which describes the possible temporal andspatial pathways by which young fish recruit to the adult population.
Background _
Distribution of species
Greenland turbot has an amphiboreal distribution, occurring in theNorth Atlantic and North Pacific, but not in the intervening ArcticOcean (Fig. 1). Hubbs and Wilimovsky (1964) have suggested thattheir range was probably continuous through the Arctic Ocean during the last interglacial period and possibly even during thepostglacial hypsithermal period when the Arctic Ocean waters werewarm. They found no significant morphological differences betweenrepresentative specimens from the two oceans. Fairbairn (1981),however, using biochemical genetic techniques on muscle, heart,and liver tissues, found genetic divergence approaching the subspecies level between samples from the northwest Atlantic Oceanand the Bering Sea.
In the North Pacific, species abundance is centered in the easternBering Sea and, secondly, in the Aleutians. On the Asian side, thesefish occur in the Gulf of Anadyr (about lat. 65°N) along the Bering Sea coast of the U.S.S.R., in the Okhotsk Sea, around the KurileIslands, and along the east coast of Japan to northern Honshu Island(about lat. 38°N) (Hubbs and Wilimovsky 1964, Mikawa 1963,Shuntov 1965). Isolated occurrences have been recorded for theSea of Japan (Mikawa 1963).
Isolated occurrences have also been recorded along the NorthAmerican continent outside the distribution described above. In thefar north, Greenland turbot has been taken irregularly in NortonSound of the Bering Sea and in the southwest Chuckchi Sea (aboutlat. 66°N). Species distribution is light and intermittent in the Gulfof Alaska and southward to about lat. 45 ON. Isolated captures havebeen recorded off British Columbia (Westrheim and Pletcher 1966),Oregon (Niska and Magill 1967), northern and central California,and as far south as northern Baja California in Mexico (about lat.32°N) (Hubbs and Wilimovsky 1964).
Greenland turbot are distributed across the north Atlantic Ocean(Fig. 1) and are most prevalent from Baffin Island and westGreenland south to the northern Grand Bank (Bowering 1983), offIceland (Sigurdsson 1981), around Jan Mayen Island (Torheim1979), and from Spitsbergen Island to the north coast of Norway(Hognestad 1969). They are found as far north as Smith Sound(about lat. 78°N) and as far south as Georges Bank (about lat. 40 0 N)in the northwest Atlantic (Templeman 1973). In the northeast Atlan-
lThe common market name is used in this report rather than the scientifically acceptedcommon name, Greenland halibut.
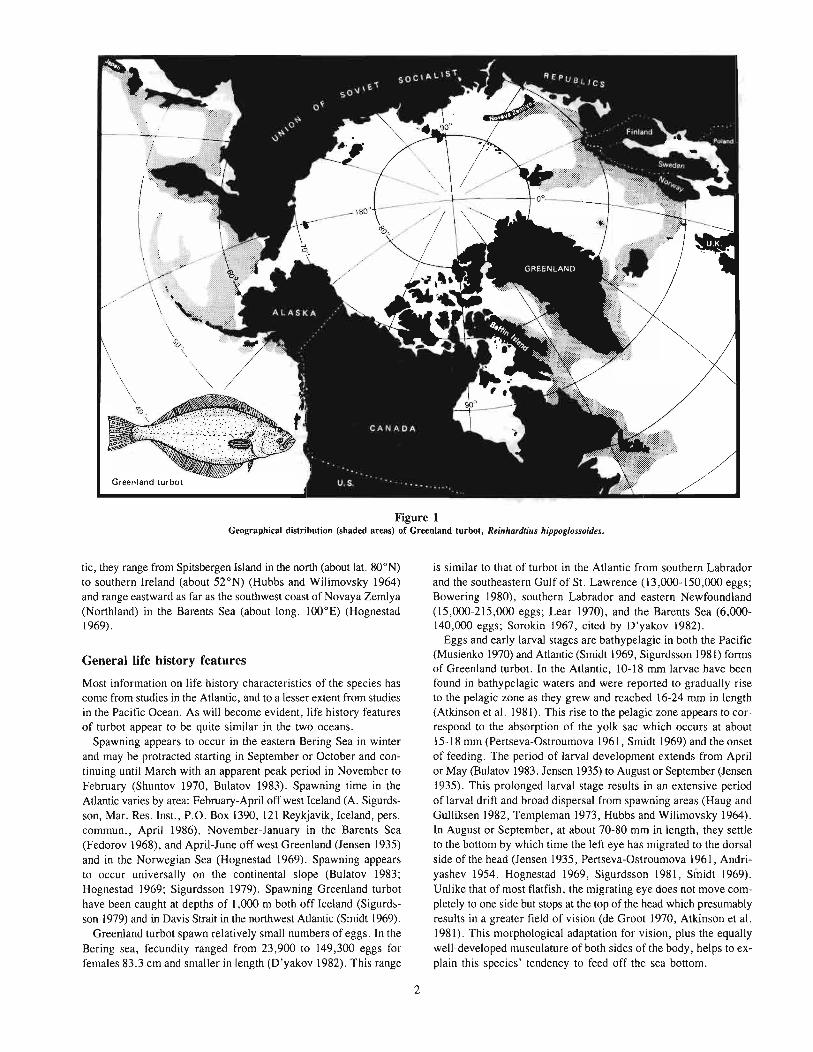
Figure 1Geographical distribution (shaded areas) of Greenland turbot, Reinhardtius hippoglossoides.
tic, they range from Spitsbergen Island in the north (about lat. 80 0 N)to southern Ireland (about 52°N) (Hubbs and Wilimovsky 1964)and range eastward as far as the southwest coast of Novaya Zemlya(Northland) in the Barents Sea (about long. 100 0 E) (Hognestad1969).
General life history features
Most information on life history characteristics of the species hascome from studies in the Atlantic, and to a lesser extent from studiesin the Pacific Ocean. As will become evident, life history featuresof turbot appear to be quite similar in the two oceans.
Spawning appears to occur in the eastern Bering Sea in winterand may be protracted starting in September or October and continuing until March with an apparent peak period in November toFebruary (Shuntov 1970, Bulatov 1983). Spawning time in theAtlantic varies by area: February-April off west Iceland (A. Sigurdsson, Mar. Res. Inst., P.O. Box 1390,121 Reykjavik, Iceland, pers.cornmun., April 1986), November-January in the Barents Sea(Fedorov 1968), and April-June off west Greenland (Jensen 1935)and in the Norwegian Sea (Hognestad 1969). Spawning appearsto occur universally on the continental slope (Bulatov 1983;Hognestad 1969; Sigurdsson 1979). Spawning Greenland turbothave been caught at depths of 1,000 m both off Iceland (Sigurdsson 1979) and in Davis Strait in the northwest Atlantic (Smidt 1969).
Greenland turbot spawn relatively small numbers of eggs. In theBering sea, fecundity ranged from 23,900 to 149,300 eggs forfemales 83.3 cm and smaller in length (D'yakov 1982). This range
2
is similar to that of turbot in the Atlantic from southern Labradorand the southeastern Gulf of St. Lawrence (13,000-150,000 eggs;Bowering 1980), southern Labrador and eastern Newfoundland(l5,000-215,OOO eggs; Lear 1970), and the Barents Sea (6,000140,000 eggs; Sorokin 1967, cited by D'yakov 1982).
Eggs and early larval stages are bathypelagic in both the Pacific(Musienko 1970) and Atlantic (Smidt 1969, Sigurdsson 1981) formsof Greenland turbot. In the Atlantic, 10-18 rnm larvae have beenfound in bathypelagic waters and were reported to gradually riseto the pelagic zone as they grew and reached 16-24 rnm in length(Atkinson et al. 1981). This rise to the pelagic zone appears to correspond to the absorption of the yolk sac which occurs at about15-18 rnm (Pertseva-Ostroumova 1961, Smidt 1969) and the onsetof feeding. The period of larval development extends from Aprilor May (Bulatov 1983, Jensen 1935) to August or September (Jensen1935). This prolonged larval stage results in an extensive periodof larval drift and broad dispersal from spawning areas (Haug andGulliksen 1982, Templeman 1973, Hubbs and Wilimovsky 1964).In August or September, at about 70-80 mm in length, they settleto the bottom by which time the left eye has migrated to the dorsalside ofthe head (Jensen 1935, Pertseva-Ostroumova 1961, Andriyashev 1954, Hognestad 1969, Sigurdsson 1981, Sinidt 1969).Unlike that of most flatfish, the migrating eye does not move completely to one side but stops at the top of the head which presumablyresults in a greater field of vision (de Groot 1970, Atkinson et al.1981). This morphological adaptation for vision, plus the equallywell-developed musculature of both sides of the body, helps to explain this species' tendency to feed off the sea bottom.

During their first few years as immature fish, Greenland turbotinhabit relatively shallow water. In the eastern Bering Sea, theyinhabit continental shelf waters «200 m) until about age 4 or 5years, and continental slope waters at older ages. In the AtlanticOcean, the young immatures tend to occupy deeper water than inthe eastern Bering Sea, mainly between 200 and 400 m (Atkinsonet al. 1981, Hognestad 1969, Templeman 1973), but even to depthsof 700 m (Bowering 1984). The immatures are quite tolerant ofcold temperatures, being frequently found in temperatures less thanO°C (Hognestad 1969, Shuntov 1965).
Adults occupy mainly continental slope waters from about 200to 1,000 m or more. Off Newfoundland, turbot have been foundto depths of at least 1,400-1,600 m (Templeman 1973). Theyappear to undergo seasonal shifts in depth distribution, moving deeperin winter and shallower in summer (Chumakov 1970, Shuntov1970). Adults also frequently occupy water temperatures below O°C(Chumakov 1970, Ernst 1974 cited by Haug and Gulliksen 1982,Fedorov 1971, Sigurdsson 1981, Templeman 1973), but at timesare found at temperatures well over O°C (Fedorov 1971); in someregions, such as the Labrador-eastern Newfoundland area (Bowering1984) and the eastern Bering Sea, adults are most abundant in 3-5°Cwater.
From spawning areas, the drift of eggs and larvae appears to bemainly northward. In the Norwegian Sea, larvae are believed tobe carried from spawning areas between northern Norway and BearIsland to off the western coast of Spitsbergen, which appears tobe a nursery area for young Greenland turbot (Haug and Gulliksen1982). Immature and maturing fish must then migrate southwardto reach the spawning area (God¢ and Haug 1987). Tagging andother studies have shown that spawning grounds exist off the westcoast of Iceland and that migrations take place between this areaand the feeding grounds off the northwest, north, and east coastsof Iceland (Sigurdsson 1979). The drift of larvae is mainly westwardtowards the east coast of Greenland, but to a minor extent to thenorth coast of Iceland. Shallower areas off the north and east coastsof Iceland are frequented by immature fish. Tagging has also confirmed migration of Greenland turbot from Iceland to the coast ofNorway, thus indicating some mixing between the Iceland-FaroeIslands and Norwegian-Barents Sea stocks (Sigurdsson 1981). Anorthward drift of larvae takes place in the West Greenland Current of the northwest Atlantic, but some larvae are carried southwardby the Arctic Current (Bowering 1984). From this drift the youngbecome distributed along the west coast of Greenland and alongthe coast of Baffin Island, Labrador, and eastern Newfoundland(Atkinson et al. 1981, Bowering 1984). As will be discussed later,the migratory cycle for eastern Bering Sea turbot may be mostsimilar to that of the Norwegian Sea stock, with a drift of larvaefrom spawning grounds in the southern slope area of the easternBering Sea northward to the northern shelf area, and with a gradualshifting of immature and maturing fish to deeper and more southernwaters.
Greenland turbot may live more than 20 years and reach sizesas great as 120 cm and 16-17 kg (Moiseev 1953, Vernidub andPanin 1937, Smidt 1969). In the western Pacific, Mikawa (1963)found the maximum life span of turbot to be 15 years for malesand 20 years for females. Off Greenland, maximum ages were foundto be 13 years for males and 19 years for females (Atkinson et al.1981). Similar maximum ages (14 years for males and 18 yearsfor females) were derived for turbot off Baffin Island (Bowering1983). Otoliths have been the structure most frequently used forageing, although some investigations have had success with vertebrae and scales.
3
Maturity is reached at 5-10 years in the eastern Bering Sea(D'yakov 1982). In the northwest Atlantic, 50% maturity in femaleswas found to vary from 7.8 years (58 cm) in the Gulf of St.Lawrence to 12 years (81 cm) in more northern areas (Bowering1983); for males, 50% maturity was reached at 5 years (40 cm)in more southern regions and 7.9 years (56 cm) in the north. Smidt(1969) reported for the west Greenland area that the smallest maturemale was 55 cm (about age 7) and the smallest maturing female66-70 cm (8-10 years), while most males matured at about 60 cmand most females at 70-80 cm. In the Norwegian-Barents Sea, heavyexploitation of Greenland turbot in the 1970's reduced abundanceof the stock to such an extent that growth rates increased and maturity was reached at smaller lengths and earlier ages (Kovtsova andNizovtsev 1985). In the later 1970's and 1980's, large numbersof males matured at 41-55 cm (ages 5-9 years) and large numbersoffemales at 61-70 cm (ages 10-12 years), while in the 1960's andearly 1970's maturity was reached by males at ages 9-10 and byfemales at ages 12-13 years.
Food consumed by Greenland turbot corresponds to the moresemipelagic life of the species and often consists ofplankton, nekton,and nektoplankton, while true benthos are of negligible importance(Smidt 1969, de Groot 1970, Livingston et al. 1986, Bowering andLilly 1985). Off Newfoundland and west Greenland, evidence indicates that turbot ascend 100m or more off the bottom to feedon capelin, Mallotus villosus, and other species (Templeman 1973).Feeding habits vary with water depth and fish length. In continental shelf waters, shrimp are often relatively important prey, alongwith pelagic or semipelagic species of fish such as capelin in theAtlantic and walleye pollock, Theragra chalcogramma, in thePacific. Squid and bathypelagic or demersal fish become more important in continental slope waters (Smidt 1969, Livingston et al.1986, Bowering and Lilly 1985). In the eastern Bering Sea the importance of walleye pollock in the diet increased from 3% by totalweight of stomach contents in turbot less than 50 cm in length, to57% in turbot greater than 70 cm, while squid showed a corresponding decrease (Livingston et al. 1986). In samples from off southernLabrador and northeastern Newfoundland, small turbot «20 cm)preyed mainly on small crustaceans and squids, intermediate sizefish (20-69 cm) on capelin, and large size fish (>70 cm) on a varietyof demersal fishes, particularly redfish (Sebastes spp.) and otherGreenland turbot (Bowering and Lilly 1985). Feeding appears tobe more intense in summer than winter (Shuntov 1970, Mikawa1963).
Pelagic and bathypelagic fishes are the main prey of Greenlandturbot in the North Pacific, with walleye pollock often a majorspecies in the diet (Mikawa 1963, Shuntov 1970, Livingston et al.1986). This may result from the availability of pollock in manyregions of the North Pacific. Mikawa (1963) found a variety ofspecies (mainly fish) predominating in the diet of Greenland turbotalong the Asian coast and suggested that these geographical differences were due to the distribution of prey animals. Squid arealso an important component, with euphausiids and shrimp of lesserimportance.
In the Atlantic Ocean, primary prey items are capelin (Mallotusvillosus), Arctic cod (Boreogadus saida), rockfishes (Sebastes spp.),grenadiers (Macrouridae), shrimp, euphausiids, and squid (Andriyashev 1954, Chumakov 1970, de Groot 1970, Smidt 1969, Haugand Gulliksen 1982, Bowering 1982, Bowering and Lilly 1985).Turbot are also cannibalistic to some extent (Bowering and Lilly1985).
Observed predators of Greenland turbot are northern fur seals(Callorhinus ursinus) in the Pacific (Kajimura 1984) and Greenland

Table 1Commercial catches (t) of Greenland turbot from the northeast and northwest Atlantic Ocean and from the eastern Bering Sea and Aleutian Islands region of the
Pacific Ocean. (Catch statistics from Int. Counc. Explor. Sea (ICES) 1972-83; Northwest Atl. Fish. Organ. 1983; Bakkala et aI. 1985).
AccumulativeArea 1970 1971 1972 1973 1974 1975 1976 1977 1978 1979 1980 1981 total
Northeast AtlanticBarents Sea 4,011 5,399 8,548 5,667 5,251 6,495 2,479 2,273 1,591 945 602 1,230 44,491Norwegian Sea 12,819 10,504 14,564 8,190 7,852 3,166 3,985 10,396 12,892 10,287 5,473 5,284 105,412Spitzbergen-Bear Island 53,925 60,182 18,310 16,081 24,660 28,511 29,610 16,221 10,134 6,080 7,209 8,504 279,427North Sea and
English Channel 5 30 49 34 17 21 12 33 21 216 7 445Iceland 15,043 11,732 10,507 7,386 7,866 3,308 5,448 15,679 11,588 16,976 27,927 15,780 149,240Faroes, NW Scotland,
N. Ireland, andN. of Azores 11 498 403 334 586 333 661 731 566 1,342 580 6,045
East Greenland 841 10,422 8,061 12,719 28,089 19,627 273 241 2,166 6,231 2,148 2,893 93,711
Total 86,644 98,250 60,518 50,495 74,086 61,710 42,149 45,483 39,135 41,106 44,917 34,278 678,771
Northwest AtlanticWest Greenland 2,000 3,000 4,000 7,000 13,000 23,000 11,000 9,000 11,000 18,000 7,000 6,000 114,000Baffin Island + 1,000 10,000 2,000 1,000 2,000 5,000 4,000 1,000 1,000 2,000 + 29,000Labrador 11,000 11,000 13,000 15,000 16,000 12,000 9,000 11,000 7,000 6,000 2,000 5,000 118,000Newfoundland 26,000 14,000 17,000 15,000 12,000 17,000 16,000 21,000 32,000 29,000 31,000 26,000 256,000Gulf of SI. Lawrence and
Nova Scotian shelf 1,000 1,000 1,000 1,000 1,000 2,000 2,000 4,000 7,000 9,000 7,000 3,000 39,000
Total 40,000 30,000 45,000 40,000 43,000 56,000 43,000 49,000 58,000 63,000 49,000 40,000 556,000
Eastern Bering Sea & Aleutian Islands area19,976 42,214 77,384 63,946 78,442 67,789 62,590 30,161 42,189 41,409 52,552 57,321 635,973
shark (Somniosus microcephalus), white whale (Delphinapterusleucas), narwhal (Monodon monoceros), and Atlantic cod (Gadusmorhua) in the Atlantic (Smidt 1969). There are undoubtedly otherpredators, particularly on early life history stages.
Smidt (1969) noted a decline in turbot abundance in west Greenland waters at the same time cod stocks were increasing. Heattributed this to predation on larval and early bottom stages ofGreenland turbot. Conversely, W.R. Bowering (1984; pers. commun., March 1986, Can. Dep. Fish. Oceans, Fish. Res. Branch,P.O. Box 5667, St. John's, Newfoundland, AIC 5X1, Canada) hasobserved exceptionally good year-classes of Greenland turbot inthe Labrador-eastern Newfoundland area coincident with a dramaticdecline in abundance of cod off west Greenland. Recently, a substantial decline in recruitment of Greenland turbot in the eastern Bering Sea has coincided with a period of high abundance of Pacificcod (Gadus macrocephalus).
North Atlantic and North PacificGreenland turbot fisheries
The stimulus for development of intensive directed fisheries forGreenland turbot in both the Atlantic and Pacific Oceans appearsto have been their substantial presence during the 1960's in bycatchesof fisheries targeting on redfishes and rockfishes (Sebastes spp.)and other deepwater species. Target fisheries for Greenland turbotexisted as early as the 1850's off Newfoundland and later in thefjords of west Greenland, but these were always small scale effortswith catches usually less than 1,000 metric tons (t) (Templeman1973). Following the development of target fishing, catches in thenortheast and northwest Atlantic and eastern Bering Sea-Aleutiansarea (the only known target fishing in the North Pacific) have beenof a similar magnitude (Table 1). Cumulative catches in the period1970-81 were 679,000 t in the northeast Atlantic, 556,000 t in thenorthwest Atlantic, and 636,000 t in the eastern Bering Sea-
4
Aleutians. Peak annual catches occurred in the northeast Atlantic(98,000 t) and Bering Sea (78,000 t) in the early 1970's and in thenorthwest Atlantic (63,000 t) in the late 1970's.
As the target fisheries developed, Greenland turbot became important commercially in regions of the Atlantic Ocean such as theNorwegian Sea and Spitsbergen area, off Iceland, and in the Canadian northwest Atlantic (Haug and Gulliksen 1982, Bowering 1983,Sigurdsson 1979, Templeman 1973). In the northeast Atlantic,largest cumulative catches in 1970-81 came from the SpitsbergenBear Island grounds (279,400 t), off Iceland (149,200 t), and fromthe Norwegian Sea (105,000 t). In the northwest Atlantic, largestcumulative catches in this period came from Newfoundland (256,000t), Labrador (118,000 t), and west Greenland (114,000 t).
Depths of target fisheries for Greenland turbot in both the Atlanticand Pacific Ocean are usually greater than 300 m (Bakkala 1985,Haug and Gulliksen 1982, Hognestad 1969, Templemen 1973).Fishing gear used in the Atlantic has included trawls, longlines,and gillnets. For many years catches were salted, but now freshand frozen fillets are produced. Trawls have been the primary fishinggear used in the eastern Bering Sea, but longlines have also beenused occasionally; the fish are headed, gutted, and frozen.
Management of eastern Bering Sea-Aleutians stock
Meaningful regulation of the Greenland turbot fishery was notestablished in the eastern Bering Sea until after implementation in1977 of the Magnuson Fisheries Conservation and Management Act(MFCMA) of 1976 which established the 200-mile fisheries conservation zone (FCZ) off the United States. Some time-area restrictions and catch quotas were established prior to 1977 throughbilateral agreements and the International North Pacific FisheriesCommission (INPFC), involving the United States and nationsharvesting groundfish in the eastern Bering Sea and Aleutians.However, catch quotas which applied to broad groups of species,

such as all flatfish or all species other than walleye pollock, probably had little influence on any target fisheries for Greenland turbot.
Following implementation of the MFCMA and establishment ofthe fishery conservation zone (FCZ), Greenland turbot of the easternBering Sea and Aleutians were managed as part of a group of speciesfor which an annual allowable catch or optimum yield (OY)2 wasset. Greenland turbot was included in a group designated as "otherflounders" for the years 1977-79. Other members of this groupwere arrowtooth flounder (Atheresthes stomias), rock sole(Lepidopsetta bilineata), flathead sole (Hippoglossoides elassodon),and other miscellaneous flatfish species. The OY for this "otherflounder" group was 100,000 t in 1977 and 159,000 t for the years1978 and 1979. Because of similarities in their life histories anddistribution, Greenland turbot and arrowtooth flounder were placed in a separate management unit called "turbot" beginning in 1980.The OY of the "turbot" group was 90,000 t for the years 1980-83,then reduced to 59,610 t in 1984, and further reduced to 42,000t in 1985 because of indications of population decline in Greenlandturbot. Since this decline was accompanied by increases in abundance of arrowtooth flounder, each species began to be managedas a separate unit in 1986.
In establishing OY for Greenland turbot, the condition of the stockhas been determined from trends in catch-per-unit-effort (CPUE)and young fish abundance and from recent estimates of adult abundance. Stock abundance is estimated to have been reduced fromabout one million t in the 1960's to about 400-500 thousand t in1984-85 (Bakkala et al. 1986).
Fisheries andresearch surveys _
Data sources and analysis
Fisheries
Catch and effon-Fisheries from Japan and the U.S.S.R. were thefirst to harvest substantial amounts of bottomfish from the easternBering Sea and Aleutians. Japanese trawl fisheries operated in theeastern Bering Sea as early as the 1930's, but these fisheries wereinterrupted because of World War II and postwar restrictions. WhenJapan's fisheries resumed operations in the eastern Bering Sea during1954, they expanded rapidly in geographic and species coverageas well as in level of harvest, diversifying into a number of distinctfisheries. By 1960 the total catch ofbottomfish by Japanese fisheriesreached some 449,000 t, of which 36,800 t were identified as"turbot" (Greenland turbot and arrowtooth flounder). This wasthe first year that Japan had reported turbot as a separate category.As a member of the INPFC, Japan began in 1964 to provide catchand-effort data for its fisheries operating in U.S. contiguous waters.Such data are given in a manner prescribed by the INPFC (i.e.,by species or higher taxa for statistical blocks of 10 longitude by0.5 0 latitude, by month, fishery, and vessel class). The catch ofturbot was not reported by species until 1977. However, Wakabayashi and Bakkala (1978) using knowledge of how Greenland turbot were classified in catch statistics from the various fisheries,estimated the Japanese turbot catch by species for the years 1970-76.
'Optimum yield refers to the annual catch which will provide the greatest overallbenefit to the U.S., and which is prescribed on the basis of sustainable yield as modifiedby any relevant economic, social, or ecological factors. For Greenland turbot, OYis set by the North Pacific Fishery Management Council.
5
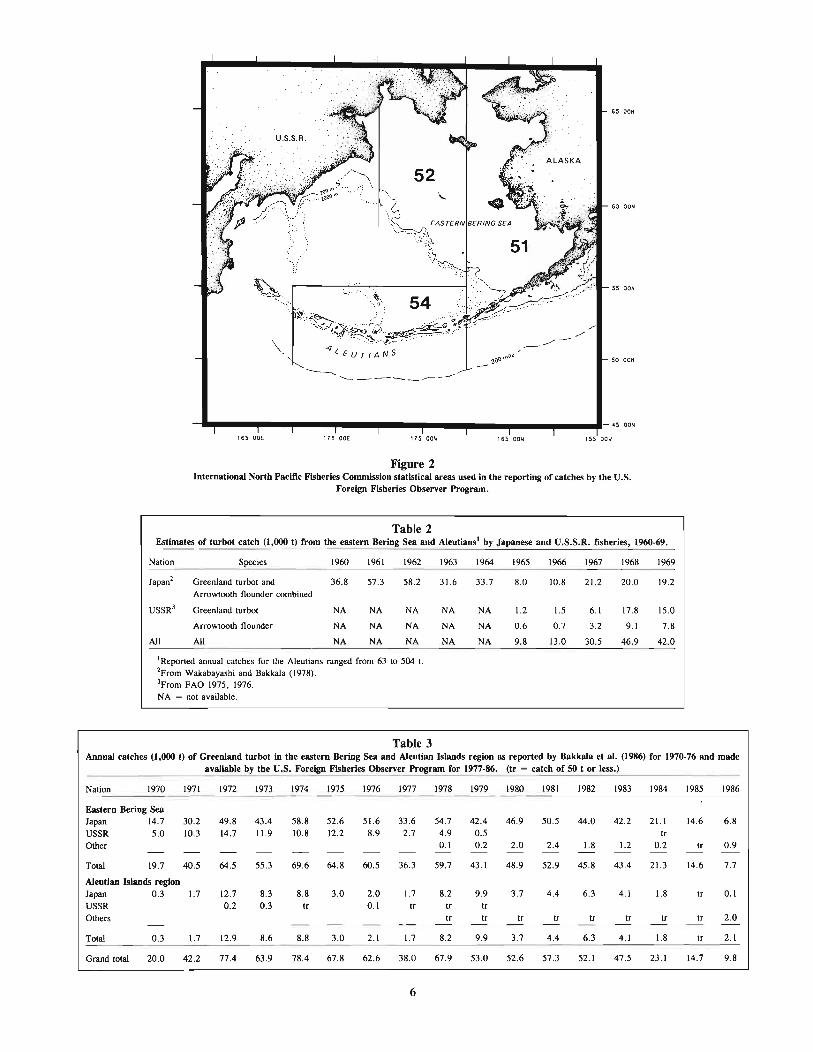
U.S.S.R. fishing fleets entered the eastern Bering Sea in 1959and, like the Japanese fisheries, subsequently grew in scope. Reportsof the Food and Agricultural Organization of the United Nationsbegan to include Soviet catch statistics in 1965. The Soviet catchwas given by a very broad geographical area that encompassed theeastern Aleutian Islands, eastern Bering Sea, and the Gulfof Anadyr.Beginning in 1972, the U.S.S.R. provided statistics on their fisheriesin U.S. offshore waters under terms of bilateral agreements. Thesestatistics were reported by species (including turbot) and by broadINPFC statistical areas (Fig. 2). The 1970 and 1971 U.S.S.R.catches of Greenland turbot were estimated by Wakabayashi andBakkala (1978) by prorating the Soviet statistics reported to FAObased on Japanese catch data.
With implementation of the MFCMA, all nations were requiredannually to report catch and effort of their fisheries operating inthe FCZ of the United States according to INPFC standards. Nationswhose catch of turbot was less than 15 % of their total groimdfishcatch were not required to report that catch by species.
In 1977, the U. S. Foreign Fisheries Observer Program institutedprocedures for obtaining an independent estimate of the foreigncatch in the FCZ. It is called "best blend," since the estimatingprocedure uses both observer estimates of catch and data reportedby the foreign fishing vessels themselves (Nelson et al. 1981).Best blend catch of Greenland turbot is given by INPFC statisticalareas.
Fisheries statistics for Greenland turbot can thus be placed intothree reporting periods: The first, years 1960-69 (Table 2), givesan incomplete picture of the actual removals and does not providecatches by individual species consistently; the second, 1970-76(Table 3), is one in which the catch estimate for Greenland turbotis given but by statistical areas that differ among nations; and thethird, beginning in 1977 (Table 3), is one in which all nations followthe same reporting format and the U.S. Observer Program providesbest blend catch estimates.
In this report, major emphasis is placed on the catch-and-effortdata from those fisheries (namely Japanese) which have targetedGreenland turbot or have taken large amounts of Greenland turbotas bycatch. Targeted fisheries include the landbased dragnet fishery,the North Pacific trawl fishery (hereafter, called North Pacific smalltrawlers), and vessels using longline gear. The nontargeted fisheryis comprised of mothership operations where catcher vessels landtheir catches aboard the processing or mothership vessel.
The landbased dragnet fishery has only operated west of long.1700 W in the Bering Sea and Aleutians region because of licensing restrictions imposed in Japan. Vessels in this fishery cannottransship their catch to Japan, but must offload their processed catchin Japan themselves. Neither the North Pacific small trawlers norlongline vessels have these restrictions.
The fisheries targeting on Greenland turbot operate mainly onthe continental slope, whereas the mothership fishery operates mainlyon the continental shelf targeting on pollock for the productionof surimi.
U.S. Foreign Fisheries Observer Program data have been usedalmost exclusively to calculate CPUE of targeted fisheries and theincidence rate in the mothership fishery. The exception is the useof Japanese reported statistics for CPUE estimates of their landbased dragnet fishery.
CPUE was not calculated for U.S.S.R. vessels because of thedifficulty of identifying targeted effort and the corresponding catchof Greenland turbot, and because of the limited time series of significant annual catches of Greenland turbot (Table 3). Catches ofGreenland turbot by fisheries other than those of Japan and the
~....:.
\
------.. --- -----------./
",-.-/"-
65 OON
60 OON
55 OON
50 OON
-1~~--"--"---"'---"'---"--"--- ...---.---"'-.:5 OON165 OOE '75 OOE 175 OOW 165 OOW 155 OOW
Figure 2International North Pacific Fisheries Commission statistical areas used in the reporting of catches by the U.S.
Foreign Fisheries Observer Program.
Table 2Estimates of turbot catch (1,000 t) from the eastern Bering Sea and Aleutians' by Japanese and U.S.S.R. fisheries, 1960-69.
Nalion Species 1960 1961 1962 1963 1964 1965 1966 1967 1968 1969
Japan2 Greenland turbol and 36.8 57.3 58.2 31.6 33.7 8.0 10.8 21.2 20.0 19.2Arrowlooth flounder combined
USSR3 Greenland turbot NA NA NA NA NA 1.2 1.5 6.1 17.8 15.0
Arrowlooth flounder NA NA NA NA NA 0.6 0.7 3.2 9.1 7.8
All All NA NA NA NA NA 9.8 13.0 30.5 46.9 42.0
IReported annual calches for the A1eulians ranged from 63 10 504 t.
2From Wakabayashi and Bakkala (1978).3From FAO 1975, 1976.NA = not available.
Table 3Annual catches (1,000 t) of Greenland turbot in the eastern Bering Sea and Aleutian Islands region as reported by Bakkala et at. (1986) for 1970-76 and made
available by the U.S. Foreign Fisheries Observer Program for 1977-86. (tr = catch of SO t or less.)
Nation 1970 1971 1972 1973 1974 1975 1976 1977 1978 1979 1980 1981 1982 1983 1984 1985 1986
Eastern Bering SeaJapan 14.7 30.2 49.8 43.4 58.8 52.6 51.6 33.6 54.7 42.4 46.9 50.5 44.0 42.2 21.1 14.6 6.8USSR 5.0 10.3 14.7 11.9 10.8 12.2 8.9 2.7 4.9 0.5 IrOther 0.1 0.2 2.0 2.4 1.8 1.2 0.2 tr 0.9
Total 19.7 40.5 64.5 55.3 69.6 64.8 60.5 36.3 59.7 43.1 48.9 52.9 45.8 43.4 21.3 14.6 7.7
Aleutian Islands regionJapan 0.3 1.7 12.7 8.3 8.8 3.0 2.0 1.7 8.2 9.9 3.7 4.4 6.3 4.1 1.8 Ir 0.1USSR 0.2 0.3 Ir 0.1 Ir Ir IrOthers Ir Ir If Ir If Ir If tr 2.0
Total 0.3 1.7 12.9 8.6 8.8 3.0 2.1 1.7 8.2 9.9 3.7 4.4 6.3 4.1 1.8 If 2.1
Grand total 20.0 42.2 77.4 63.9 78.4 67.8 62.6 38.0 67.9 53.0 52.6 57.3 52.1 47.5 23.1 14.7 9.8
6
,./200 m,_
,./ ('--'; \.,')•••••" •••: 'Ot _', «
(." ,.....• '-.
NORTHERNSLOPE i
'. \
". "...... ----.,-'\.............,. \
2000 m ; ,
60 0 N
550
1750 E 1800 1750 W 1700 1650 159'
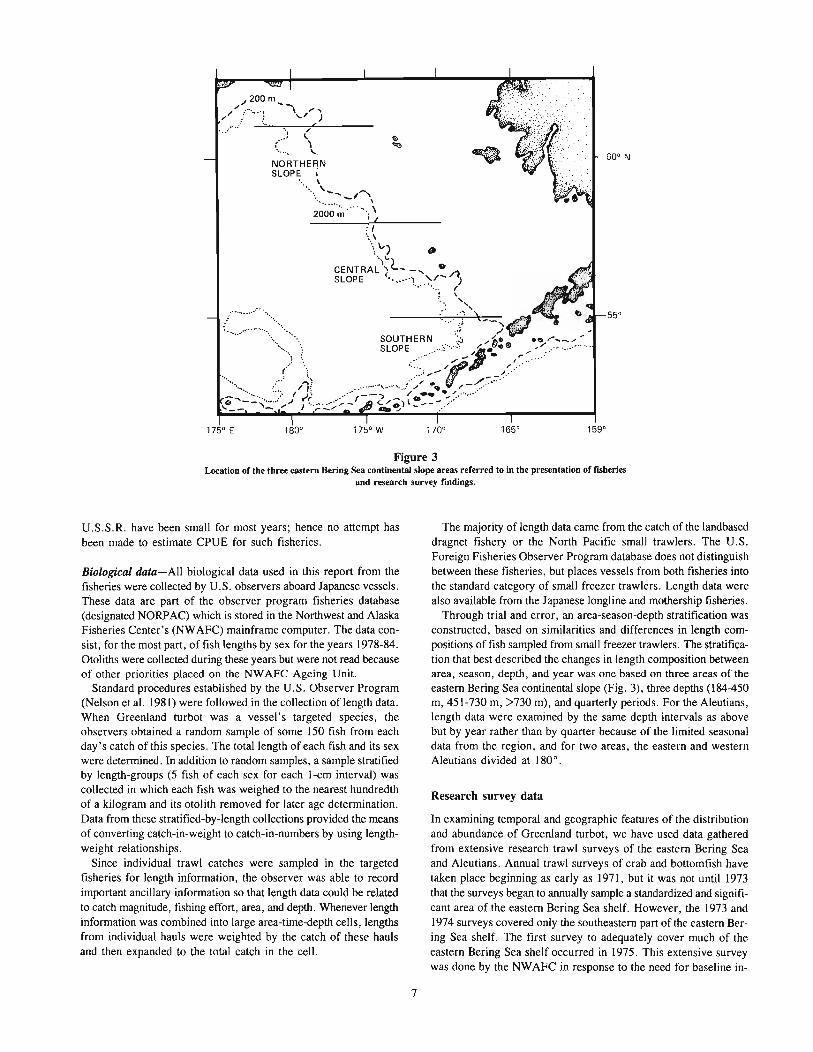
Figure 3Location of the three eastern Bering Sea continental slope areas referred to in the presentation of fISheries
and research survey fmdings.
U.S.S.R. have been small for most years; hence no attempt hasbeen made to estimate CPUE for such fisheries.
Biological data-All biological data used in this report from thefisheries were collected by U. S. observers aboard Japanese vessels.These data are part of the observer program fisheries database(designated NORPAC) which is stored in the Northwest and AlaskaFisheries Center's (NWAFC) mainframe computer. The data consist, for the most part, of fish lengths by sex for the years 1978-84.Otoliths were collected during these years but were not read becauseof other priorities placed on the NWAFC Ageing Unit.
Standard procedures established by the U.S. Observer Program(Nelson et al. 1981) were followed in the collection oflength data.When Greenland turbot was a vessel's targeted species, theobservers obtained a random sample of some 150 fish from eachday's catch of this species. The total length of each fish and its sexwere determined. In addition to random samples, a sample stratifiedby length-groups (5 fish of each sex for each I-cm interval) wascollected in which each fish was weighed to the nearest hundredthof a kilogram and its otolith removed for later age determination.Data from these stratified-by-length collections provided the meansof converting catch-in-weight to catch-in-numbers by using lengthweight relationships.
Since individual trawl catches were sampled in the targetedfisheries for length information, the observer was able to recordimportant ancillary information so that length data could be relatedto catch magnitude, fishing effort, area, and depth. Whenever lengthinformation was combined into large area-time-depth cells, lengthsfrom individual hauls were weighted by the catch of these haulsand then expanded to the total catch in the cell.
7
The majority of length data came from the catch of the landbaseddragnet fishery or the North Pacific small trawlers. The U.S.Foreign Fisheries Observer Program database does not distinguishbetween these fisheries, but places vessels from both fisheries intothe standard category of small freezer trawlers. Length data werealso available from the Japanese longline and mothership fisheries.
Through trial and error, an area-season-depth stratification wasconstructed, based on similarities and differences in length compositions of fish sampled from small freezer trawlers. The stratification that best described the changes in length composition betweenarea, season, depth, and year was one based on three areas of theeastern Bering Sea continental slope (Fig. 3), three depths (184-450m, 451-730 m, >730 m), and quarterly periods. For the Aleutians,length data were examined by the same depth intervals as abovebut by year rather than by quarter because of the limited seasonaldata from the region, and for two areas, the eastern and westernAleutians divided at 180 0
•
Research survey data
In examining temporal and geographic features of the distributionand abundance of Greenland turbot, we have used data gatheredfrom extensive research trawl surveys of the eastern Bering Seaand Aleutians. Annual trawl surveys of crab and bottomfish havetaken place beginning as early as 1971, but it was not until 1973that the surveys began to annually sample a standardized and significant area of the eastern Bering Sea shelf. However, the 1973 and1974 surveys covered only the southeastern part of the eastern Bering Sea shelf. The first survey to adequately cover much of theeastern Bering Sea shelf occurred in 1975. This extensive surveywas done by the NWAFC in response to the need for baseline in-

Table 4Annual catch (1,000 t) by the Japanese fISheries of the eastern Bering Sea and Aleutian Islands region. Statistics
provided by the U.S. Foreign Fisheries Observer Program. (tr = catch of SO t or less.)
Fishery or vessel class 1978 1979 1980 1981 1982 1983 1984 1985
Eastern Bering SeaSmall freezer Irawlers I 38.4 30.1 33.3 41.2 38.1 38.2 19.9 14.2Mothership 11.9 9.8 9.8 5.4 2.8 1.7 0.7 0.3Other Irawler types 3.1 0.7 0.3 0.5 0.2 0.1 0.1 IrLongline 1.3 1.8 3.3 3.4 2.9 2.2 0.4 0.1
Total 54.7 42.4 46.7 50.5 44.0 42.2 21.1 14.6
Aleutian Islands regionSmall freezer trawler' 6.7 8.9 3.2 4.1 6.0 3.9 1.6Other Irawler types 0.4 0.1 tr Ir tr Ir IrLongline 1.1 0.9 0.5 0.3 0.3 0.2 0.2 Ir
Total 8.2 9.9 3.7 4.4 6.3 4.1 1.8 Ir
'Combined calches of Iwo major Japanese fisheries: the North Pacific Irawl fishery and the landbased dragnel fishery.
formation to evaluate the potential effects of oil exploration anddevelopment on the fishery resources of the region (Pereyra et al.1976). Surveys of much lesser area coverage occurred in 1976,1977, and 1978. Another extensive shelf survey took place in 1979and, for the first time, continental slope waters were comprehensively sampled through a joint effort by the NWAFC and the FisheryAgency of Japan (Bakkala et al. 1985). Following a triennialschedule, Japanese and U.S researchers conducted similar surveysof the shelf and slope in 1982 and 1985. In intermediate years (1980,1981,1983, 1984), extensive areas of the shelf were sampled, butthe slope was not sampled by the Japanese except in 1981. Thuswe have 4 years of slope survey data (1979, 1981, 1982, and 1985),8 years of extensive shelf coverage (1975, 1979-85), and 13 years(1973-85) of coverage that included the southeastern part of theshelf. We have treated the results of the Japanese survey of the slopeseparate from that of the shelf area and have not attempted tointerrelate data from the two regions. As discussed earlier, trawlsand trawl rigging used in the two regions differed, and comparative fishing experiments have not been adequate to measure therelative efficiencies of these trawls. There are the additionalproblems of marked changes in species composition and bottomtopography in the two regions which further complicates interrelating these data.
There have also been changes in trawls and trawl rigging duringthe NWAFC shelf survey which may have created some bias inthe time series of survey results. For example, the standard surveytrawl was changed in 1982, and evidence suggests that the newertrawl was more affective in capturing small flatfish than the trawlsused prior to 1982. Therefore, the catch efficiency for youngGreenland turbot on the shelf has possibly been higher since 1982.
Extensive trawl surveys of the Aleutians, which covered the areasboth north and south of the Aleutian chain, began in 1980 andfollowed a triennial schedule so that a second survey was conductedin the Aleutians in 1983. These surveys have also been a joint effort by the United States and Japan. Because of the relatively smallshelf area in the Aleutians, most of the survey effort took placeat depths greater than 183 m (Wilderbuer et al. 1985).
Trawling locations were preselected for the eastern Bering Seaand Aleutian surveys so as to cover both depth and area. Locationsare given for the eastern Bering Sea by Pereyra et a1. (1976),Wakabayashi et al. (1985), Umeda and Bakkala (1983), Sampleet al. (1985), Bakkala and Wakabayashi (1985), Hirschberger(1985), and Halliday and Umeda (1986); and for the Aleutians by
8
Wilderbuer et al. (1985). Haul duration was 0.5 hours for U.S.vessels and 1.0 hours for Japanese vessels.
Commercial-type fishing trawls were used. Those fished fromU.S. vessels had a small mesh web (32-mm stretched mesh) liningthe codend so that small animals such as juvenile fish could be retained. Japanese trawls had no liners but had triple layers of 90-100mm stretched mesh in the codend. All trawls used in the Aleutiansand in the slope area of the eastern Bering Sea were equipped withroller gear to reduce damage and hangups on the sea bottom. Rollergear was not used during shelf surveys in the eastern Bering Sea.
Survey sampling methods are described by Wakabayashi et al.(1985). In general, total catches of less than about 1,150 kg weresorted by species and then weighed and counted. Catches over 1,150kg were subsampled before sorting. Random samples of Greenlandturbot were separated by sex and measured to the nearest centimeter.Otoliths were removed for ageing from at least five fish of eachsex per centimeter length-interval during the survey. U.S. agesamples through 1982 were read by NWAFC age readers. Due toreservations about methodology and results from these readings,we did not use these data. Samples collected since 1982 have notbeen read due to higher priorities for other species. However, ageand related length data provided by the Fisheries Agency of Japanwere used 1) as an age-length key to convert length data collectedduring the NWAFC 1979 survey to age, and 2) to approximate theage of young fish during NWAFC surveys of the eastern BeringSea shelf in 1975 and 1980-85. Japanese age data were based onotoliths collected by a Japanese research vessel operating mthe shelfand slope region of the eastern Bering Sea in 1979. Approximation of the age of young fish was possible because of the high growthrate ofjuvenile Greenland turbot, which results in very little overlapin the length ranges of successive ages of young fish.
Results
Analysis of Japanese fisheries information
As mentioned earlier, actual removals of Greenland turbot byforeign fisheries prior to 1970 cannot be adequately estimated.Although estimates of the annual catch of this species becameavailable in 1970, it was not until 1977 that catch of Greenlandturbot could be related to specific fisheries and to depth. Infonnation on the length and sex of fish also began to be collected in 1977.However, because of limited observer coverage in 1977, these data

Table 5Annual Japanese catcbes (1,000 t)1 of Greenland turbot by tbe Iandbased dragnet flSbery and small trawlers of tbe Nortb Pacific trawl flSbery in tbe eastern Bering
Sea and Aleutian Islands region, 1970-84.
Fishery orvessel class 1970 1971 1972 1973 1974 1975 1976 1977 1978 1979 1980 1981 1982 1983 1984
Eastern Bering SeaLandbased 9.6 7.1 25.1 14.2 21.2 20,6 17.6 13.3 19.2 13.7 13.1 16.2 \7.9 17.2 14.9N. Pacific
trawl fishery2 3.0 3.8 6.7 8.1 10.0 10.0 11.5 8.2
Total 16.3 23.0 20.4 21.2 26.2 27.9 28.7 23.\
Aleutian Islands regionLandbased 0.3 0.5 12.0 7.3 7.8 2.2 1.I 2.0 4.1 5.6 4.8 2.5 3.3 2.6 1.6N. Pacific
traw1 fishery2 0.4 0.2 0.2 0.1 0.2 0.1 0.1 0.0
Total 2.4 4.3 5.8 4.9 2.7 3.4 2.7 1.6
lAs reported by Japan through INPFC.2Fonnat of reported statistics prevents identification of catch by this fishery for the years 1970-76.
Table 6Catcb in numbers of animals and average weigbt of Greenland turbot by tbe Japanese motbersbip fisberies, 1977-84.
1977 1978 1979 1980 1981 1982 1983 1984
Catch (millions of fish) 36.6 49.6 40.5 38.9 9.1 2.0 1.8 0.7Average individual
weight (kg) 0.235 0.240 0.242 0.252 0.593 1.421 0.921 0.937
were not considered in some of the analyses concerned with changesin availability and length of fish by area and depth. This section,therefore, emphasizes findings from the Japanese fisheries for theyears 1978-84. Other nations' catches of Greenland turbot have beeninconsequential compared with those taken by the Japanese fisheries(Table 3), and very little biological information was collected forother fisheries.
600--.---------------__...,
400
Figure 4Annual catcb and incidence (percent by weight of tbe annual catches of all species)of Greenland turbot by the Japanese surimi mothership fIShery in the easternBering Sea, 1978-84. (Information from U.S. Foreign Fisheries Observer Pro-
gram database.)
200
15+------------------4
1984
GREENLANDTURBOTCATCH
1982Year
19801978
2
5
TOTAL CATCHOF ALL SPECIES
c~Q)c..
aaa
_ 10
aaa
Annual catch by region and fishery- The all-nation annual catchof Greenland turbot in the combined regions of the eastern BeringSea and Aleutians has ranged from 9,800 t to 78,400 t during theperiod 1970-84 (Table 3). Most of the catch has come from theeastern Bering Sea, where annual catch reached levels of 60 to 70thousand t from 1972 through 1978. This was followed by a generaldecline, so that in 1986 only 7,700 t were taken. Annual catch inthe Aleutians has fluctuated between less than 50 t to as much as13,000 t (Table 3).
Japanese fisheries have accounted for the majority of theGreenland turbot catch from both the eastern Bering Sea and Aleutians. Among these fisheries, the landbased dragnet trawlers, NorthPacific small trawlers, the surimi mothership fishery, and thelongline fishery have been the most important in terms of harvestmagnitude or targeting on Greenland turbot (Table 4). Estimatesof catch for the landbased dragnet fishery and that of the NorthPacific small trawlers are not distinguished, but have been combined under the designation Japanese "small freezer trawlers"(Table 4).
The small freezer trawlers' annual catch does not correspond veryclosely with the Japanese reported combined catch of landbaseddragnet and North Pacific small trawlers (Table 5) for either theeastern Bering Sea or Aleutians. The U.S. observer best blendestimate of catches by small freezer trawlers almost consistentlyexceeds that reported by the Japanese. For the eastern Bering Sea,the correspondence between best blend and Japanese reported catch
9

EASTERN BERING SEA (west of 170· W longitude)
Species and Group 0-183 m 184-450 m% 25 50 75 % 25 50 75
451-730 m% 25 50 75
> 730 m% 25 50 75 100
Soles
Pollock
CodArrowtooth flounder
Rockfish
SablefishGreenland turbotRattails
Total catch sampled
EASTERN BERING SEA (east of 170· W longitude)'I I I I, I I I I I I I I I
oles
~t t
ollock
~t t
od Srrowtooth flounder t t
ockfish t t
ablefish t t
Greenland turbot t
Rattails t t PTotal catch sampled 44 x 103t tJ 8 x 10
3t tJ 9x 10³
t P7 x 103t
SP
CA
R
S
ALEUTIAN ISLANDS
Soles
Pollock
CodArrowtooth flounder t
Rockfish
SablefishGreenland turbotRattails
Total catch sampled
Figure 5Importance of Greenland turbot relative to other species in the catch by Japanese small trawlers in the eastern Bering Sea andAleutians, 1980-84. Total catch refers to that taken by trawlers with U.S. observers aboard. (Information from U.S. Foreign Fisheries
Observers Program database.)
improves with time, so that by 1984 the best blend catch approximates that of the Japanese reported catch:
Ratio (Best blend/Reponed catch)78 79 80 81 82 83 841.7 1.5 1.6 1.6 1.4 1.3 p.9
Annual catch of the landbased fishery, as reported by Japan forthe eastern Bering Sea, rose sharply in 1972 to 25,100 t and thenfluctuated between 13 and 21 thousand t in subsequent years. Inthe Aleutians, the 1972-74 period was particularly productive forthese fisheries, with annual catch ranging from 7.3 to 12.0 thousand t. However, since then there has been a downward trend inthe level of catch, so that by 1984 the catch was only 1,600 t(Table 5).
Prior to 1977, we could not determine the Greenland turbot catchfor the North Pacific small trawlers, the surimi mothership fishery,
and the longline fishery. Since 1977 the catch of this species byNorth Pacific small trawlers in the Aleutians has been insignificant, but in the eastern Bering Sea such catches have risen, peaking at 11,500 tin 1983 and then dropping to 8,200 t in 1984 (Table5). The mothership fishery operates only in the eastern B~ring Seaand mainly on the continental shelf. Although there is no knowntargeting of Greenland turbot by this fishery, the incidental catchof this species was as high as 11,900 t in 1978 (Table 4). The catchdropped to 9,800 t in 1979 and 1980 and then rapidly declined insubsequent years, so that by 1984 less than 1,000 t were taken.The number of turbot estimated to have been caught by the mothership fisheries during the years of high catches (1978-80) rangedfrom 36.6 to 49.6 million (Table 6). In contrast to the mothershipfishery, the Japanese longline fishery mainly operates in the sloperegion and does target Greenland turbot in both the eastern BeringSea and the Aleutians. Its catch in the eastern Bering Sea has consistently been higher than that in the Aleutians. In the former region,
10

BOTTOM DEPTH
Percent of total catch
Pacific cod
Sablefish
Greenland turbot
Rattails
Pacific halibut
Arrowtooth flounder
TOTAL CATCH
25
184-450m
50
34 x 10 t
75 25
451-730m
50 75
Trace
25
> 730m
50 75
Figure 6Importance of Greenland turbot relative to other species in the catch by Japanese longline vessels in the eastern Bering Sea. Total catchrefers to the amount landed on vessels with U.S. observers aboard. (Information from U.S. Foreign Fisheries Observer Program database.)
the catch reached high levels (2,900 to 3,400 t) in the 1980-82 periodand then declined to as low as 100 t in 1985. For the Aleutians,the catch by the longline fishery has steadily declined since 1978,so that less than 100 t were taken in 1985 (Table 4).
Re1lJtive imporlance of Greenland turbot in the Japanese fisheries-The importance of Greenland turbot relative to other speciesin the fisheries of the eastern Bering Sea and Aleutians increaseswith increasing bottom depth. On the shelf, the proportion ofGreenland turbot in the catch is insignificant in comparison withthat of targeted species such as pollock, cod, and the various speciesof sole. In the Japanese mothership fishery, the incidence ofGreenland turbot was slightly more than 2 % in 1978, but since thenthe incidence has declined to less than 0.3% in 1984 (Fig. 4).Catches by the Japanese small freezer trawlers and longline vesselsare inconsequential at depths less than 183 m in both the easternBering Sea and Aleutians. In the slope region of the eastern BeringSea, however, the importance of this species in the catch of thesefisheries increases with depth, so that at the deepest depths (>450m) it is the predominant species caught (Figs. 5 and 6). This is notthe situation in the slope region of the Aleutians, where pollockpredominates in the catch of small freezer trawlers from upper slopedepths (183-450 m), and where rattails comprise most of the catchfrom lower slope depths (>450 m).
Since 1980 the importance of Greenland turbot relative to sablefishin the longline fishery has been declining, so that by 1984 it wasno longer the dominant species in the annual catch.
28.0
20.0
12.0
4.0
12.0
4.0
-'= 12.0;;:
0 4.0
20.0~.
0 12.000::: 4.0
~u 20.0
12.0
4.0
20.0
12.0
4.0
12.0
4.0
N
WEIGHT
c
1978
S N
Slope area
NUMBERS
c s
Catch patterns ofGreenland turbot by area, season, and depth-Inthis section we rely considerably on information provided by theu.s. Observer Program best blend estimate ofcatch. We place mostof our emphasis on findings for the eastern Bering Sea because ofthe greater sampling coverage by time, depth, and area. For theAleutians, the desultory nature of the fishing by time and area andthe paucity of observer coverage prevent an adequate identification of area-time-depth catch patterns for this region.
In the eastern Bering Sea, Japanese small freezer trawlers haveconsistently taken a greater tonnage of Greenland turbot from thenorthern slope area than from either the central or southern slopearea (Fig. 7). In turn, removals from the central slope area havebeen greater than from the southern slope area except in 1984 when
II
Figure 7Annual Greenland turbot catch by Japanese small trawlers in the continental sloperegion of the eastern Bering Sea, 1978-84 (N = northern slope area, C =central
slope area, and S = southern slope area).
the reverse occurred. By 1984 the catch was more evenly distributedamong the three areas.
When the catch of Greenland turbot by the small freezer trawlersis examined in terms of numbers of fish, the importance of the northern slope area becomes even more pronounced because of thesmaller weight of individual Greenland turbot in the northern sloperelative to the other slope areas (Fig. 8). In 1978, the estimated

1984
0--0451-730 m
......... 183-450m
6.--6.> 730 m
1980 1982Year
1978
NORTHERNSLOPE
CENTRAL
SLOPE /\
0_°
~O20
20
40
60IT------------;:========:;--,
c~ O--t---r---¥==-=-=-~'-==>f_ll:..=.=="rk-=-=-~Il:..=.-=-=>Tl_-____1.,a-
1984
LEGEND
0--0 Northern slope
l:r -6 Central slope
"'-'Southern slope
1982Year
19801978
300
~
~~ 200w:::Ja-U
100
0
6.0
en~~
.r:: 4.0C>'Q;i:.,C>~.,> 2.0<l:
Figure 8Annual changes in CPUE and average weight of Greenland turbot by Japanese
small trawlers in the slope areas of the eastern Bering Sea, 1978-84.
.0 -+-,----,---r---.----,--r---...-----.
number of fish taken by these trawlers from the northern slope wasin excess of 20 million, and average annual removals for the years1978-82 were about 17 million fish. In contrast, the average annual removals for the same period for the central slope were about5 million fish and for the southern slope about 2 million fish.
In the northern and central slope areas most of the catch has comefrom shallow (184-450 m) and intermediate (451-730 m) bottomdepths, with intermediate depths having the highest catch (Fig. 9).
Figure 9Distribution of annual Greenland turbot catch by Japanese small trawlers by depth
and area in the continental slope area of the eastern Bering Sea, 1978-84.
NORTHERN
I I I i I I I I I I I2 4 2 4 2 4 2 4 2 4 2 4
1979 1980 1981 1982 1983 1984Year and quarter
12
2 41978
: ~ SOUTHERN
~;:=A ~
8
6
4
2
~
aa
8 CENTRALa
.r::6B
U4
2
Figure 10Quarterly catch of Greenland turbot by Japanesesmall trawlers in the continental slope region of
the eastern Bering Sea, 1978-84.

1981
1984
L:J"...6451-999m
(). oQl84-450m
1982
Year
1980
LEGEND
4.0,---------------------,
3.0
~00
.s;;;
0006
2.0~0.
-.s;;;
~u
1.0
Figure 12Catch-per-unit-effort of Greenland turbot by Japanese longline vessels operating
in the eastern Bering Sea, 1978-84.
1982
tr
tr
tr
1978
5.0
1979
5.0
tr
1980
5.0
e500 5.0:::.<:B'"u
5.0
1983
5.015
tr
1984tr = trace
50
N CShelf area
S
10Japanese Mothership Fishery<184 m1,350 len9thsMean = 27.0 emContinental Shelf, 1980
5
Figure 11Annual catch (1978-84) of Greenland turbot by the Japanesesurimi mothership fIShery by area of the eastern Bering Sea shelf(N = north of 58°, C=55°-58°N lat., and S=south of 55°N lat.).
~ 0'"uW0-
Figure 13Length composition of Greenland turbot taken by various Japanese fISheries in
the eastern Bering Sea, 1980.
10080
Japanese Small Freezer Trawlers184-999 m23,015 lengthsMean.: 50.3 em
Cenlral Slope Area, 1980
60Length (em)
4020
Japanese longline Fishery184-999 m4,398 lengthsMean = 78.4 emCenlral Slope Area, 1980
5
5
However, in 1984 the proportion of catch from intermediate depthssharply declined, and, for the fIrst time, the proportion from shallowdepths exceeded that of intermediate depths in the northern slopearea. For the southern slope, the distribution of catch has tendedto be more evenly distributed among the three depth zones.
A seasonal catch pattern was apparent for the small freezertrawlers in both the central and southern slope areas which wasmost pronounced after 1980 (Fig. 10). In the central slope area thecatch for most years was lowest in the first quarter and then increased, usually reaching its highest level in the fourth quarter. Inthe southern slope area no catch was recorded for the first quarter;fishing began in the second quarter, with the catch increasing inthe third quarter, and then either leveling off or declining in thefourth quarter. For the northern slope area the highest catch tendedto be taken in the second quarter.
The Japanese surimi mothership fishery is active mainly duringthe summer and early fall months and operates for the most part onthe continental shelf. Since 1980 there has been a inarked decline inmagnitude of the catch from the northern shelf (Fig. 11). By 1984very few Greenland turbot were taken anywhere on the shelf.
13

NORTHERN SLOPE CENTRAL SLOPE SOUTHERN SLOPE
10 1978 lOJ 1978 10 1978
5 5 5
0 0 0
10 1979 10 1979 10 1979
5 5 5
0 0~.,;...........
0
10 1980 10 1980 10 1980
5 5 5
.~ ...~,..' ........
0 0 0
10 1981 10 1981 10 1981
5 5 5
~.'\0
,/~." _..... ' \~""
0OJ I~i ,'-.,10 1982 10 1982 10 1982
5 5 5
0 0 0
1983 1983 198310 10 10
5 5 ",
"":' \,0 0 " 0
1984 1984 1984 l\10 10 10 I', .
: \..f \
5 5 5 . '
,I \0 0
20 40 60 80 100 20 40 60 80 100 20 40 60 80 100Length (em)
Figure 14Length composition by sex of Greenland turbot taken by Japanese small trawlers in the continental slope region of the eastern
Bering Sea, 1978-84.
The Japanese longline fishery has operated mainly in the centraland southern slope region. Its main harvest of Greenland turbotand highest catch rates have come from depths greater than 450m (Fig. 12).
In the Aleutians, Greenland turbot is also taken mainly at depthsgreater than 450 m by both the small freezer trawlers and longliners.Since the catch of Greenland turbot in this region has not been ofmuch significance, we have not given any breakdown of the annual catch by area.
Length and sex composition-There are marked differences amongthe Japanese fisheries in terms of the length of fish captured (Fig.13). On the continental shelf of the eastern Bering sea where themotherships operate, the catcher vessels take only small, immaturefish. The larger juveniles and older fish tend to occur in the slope
region, where they are subject to harvest by the Japanese smallfreezer trawlers and longline vessels. The small freezer trawlerscapture a broader size range of fish than the longline vessels in thesame region of the slope. The latter vessel type takes only the largefish, which are predominantly females. This difference in gear selectivity also occurs in the Aleutians.
Information from the small freezer trawlers provides the best indication of patterns in the length composition of Greenland turbotcatches by area, depth, and season. Length data from the longlineand mothership fisheries are incomplete. For the eastern BeringSea slope there were consistent differences by area in the lengthof fish captured by small freezer trawlers (Fig. 14). The length offish increased from north to south and exhibited distinctive modaldistributions by sex. Annual changes in length composition werealso evident. Obvious changes over time were 1) decline in the pro-
14

CENTRAL SLOPE30
20 1978
10
0
60 1979
50
40
30
20
10
0
50 1980
40
30~
c 20
~ 10
'05 1981l! 50~
c0 40
~ 30~
D 20E~c 10c
"' 0u~ 40 1982u
30
20
10
0
301983
20
10
0
30 1984
20
10
025 35 45 55 65 75 85 95 105
Length (five em intervals)
40
30
20
10
0
50 1980
40~ 30c
~ 20£'0 10~ 00
"' 1981~
c 500
~
400.
~ 30.0E~ 20c.£
10"'u~ 0u
401982
30
20
10
0
30 1983
20
10
0
30 1984
20
10
30 1978
20
10
o+r--'-~'+-""-9f-.lL4.-"+IhP"tx'P-f'""-t--'--r'--r"""'-T""""l60 1979
50
NORTHERN SLOPE
25 35 45 55 65 75 85 95 105
Length (five em intervals)
Figure 15Catch rate by Japanese small trawlers or Greenland turbot bysex and S-cm length intervals in the northern slope area or the
eastern Bering Sea, t978-84.
Figure 16Catch rate by Japanese small trawlers or Greenland turbot by sexand S-em length intervals in the central slope area or the eastern
Bering Sea, t978-84.
portion of small fish in the length range of 30-50 cm in all areas,but which was most pronounced in the northern slope, and 2)emergence of sharply defined modal groups by sex in the centraland southern slope areas.
Not only had there been a decline in the proportion of small fishin all areas of the slope, but the availability of fish of most lengthgroups, as indicated by annual catch rates of freezer trawlers, alsodeclined (Figs. 15-17). A decline in the proportion of smaller fish(in this instance, less than 60 cm) was also observed in the Aleutians in 1983 and 1984 (Fig. 18).
To examine seasonal patterns in the catch by length, we partitionedboth the males and females into two length groups, with the dividingline at 55 cm and 70 cm, respectively. This grouping simplifiedthe presentation and was based on the annual length distributions(Fig. 14) and the suggestion from length-at-maturity information(D'yakov 1982, Smidt 1969) that the larger groups are mostlymature fish and the smaller length groups are mostly immatures.
The availability of fish in the smaller length groups was examinedfor both the northern and central slopes, though not for the southernarea because of the small number of animals of these lengths takenthere. The CPUE of these small length groups was consistently muchhigher in the northern than in the central area, particularly in theshallowest depth interval (Fig. 19). The importance of smaller lengthgroups in both the northern and central areas and at all depthsdeclined markedly in 1983 and 1984.
In both the northern and central slope areas the availability ofthe smaller length groups showed a pattern of high catch rates inthe first two quarters. with the lowest catch rates usually occurringin the fourth quarter of the year. Females showed a tendency tobe more available than males, particularly on the northern slope.
Some general tendencies were observed in the availability of fishin the larger length groups. In all slope areas at the shallowest depthinterval (184450 m), the availability of both sexes tended to declinein the fourth quarter, whereas in the deepest depth interval (>730
IS

10080
1983ss = 12.676L =13.6 em
6080 100 20 40
Length (em)
198455 =6.252L = 65.8 em
604020
0-'----"1'--
5
5
1700 _1760 west longitude west of 1760 longitude
1978 19785 55 =8.280 No data
I =61.8 em
01979 1979~ = 5.891 55 = 2.604
5 L =58.2 em 1: =69.0 em
0
1980No data
5
0
1981c: 55 = 294Ol
5 L = 75.9 emuQ;
<l.
01982 1982No data 55 = 28.022
I = 68.5 em
SOUTHERN SLOPE30 197820
10
60 1979
50
40
30
20
10
a50 1980
'"c 40~g 30'0 20~
~ 10~
c a0
~ 19810. 50~., 40
~ 30.S.c 20u
8 10
a40 1982
30
20
10
a30
1983
20
10
a30 1984
20
10
25 35 45 55 65 75 85 95 105
Length (five em intervals)
Figure 17Catch rate by Japanese small trawlers of Greenland turbot by sexand S-cm length intervals in the southern slope area of the eastern
Bering Sea, 1978-84.
Figure 18Length composition of Greenland turbot taken by Japanese small trawlers in the
Aleutians, 1978-84.
16

NORTHERN SLOPE
600
1400
300
184-450 men 200.S~
~~
1000~
:J0
.<::
'"c 00
Ii;0.
400-£i;;:::
'0Ii;
300.0E:JZ
200
100
CENTRAL SLOPE
LEGEND
0- 0 Females__ Males
184-450 m
2 4 2 4 2 4
1981 1982 1983
2 4 2
1984 1981Year and quarter
4 2 4
1982
2 4
1983
2 4
1984
Figure 19Catch-per-unit-effort of Greenland turbot by Japanese smaU trawlers by sex, depth, quarter, and area of the con
tinental slope region of the eastern Bering Sea, 1981-84 (length groups: males <55 em, females <70 em).
m) their availabilities tended to increase in the fourth quarter (Fig.20). Another tendency was the decrease in the availability of malesfrom the northern to southern slope area, with the converse occurring among females.
Changes in CPUE and incidence rate-Bakkala et al. (1986)showed that the annual Greenland turbot CPUE of the landbaseddragnet fishery has generally declined in the eastern Bering Seasince the early 1970's (Fig. 21). They assumed that CPUE is arelative measure of biomass and viewed these annual CPUE changesas reflecting a decline in Greenland turbot biomass in the easternBering Sea.
The CPUE of small freezer trawlers having U.S. observers aboardshowed a trend similar to that of the landbased fishery from 1978to 1984 (Fig. 21). However, CPUE of the small freezer trawlerswas much higher than that of the landbased dragnet vessels duringthe earlier years of that period (1978-81). The match in CPUEbetween the small freezer trawlers and landbased vessels becamequite good in the years 1982-84.
Regression analysis using dummy variables was performed todetermine effects due to differences in area, season, and depth inCPUE (tons per hour trawled). A regression model with no interaction terms was used as a basis for the analysis (Table 7). Thoughinteractions may well exist, they were not included in the modelsince there were enough empty cells to cause the hat matrix to ap-
17
pear nonsingular due to rounding error; tolerances for interactionterms were too low to allow their inclusion in the model (Draperand Smith 1981, Weisberg 1985). Results of the regression analysissuggest that all effects were both meaningful and significant (Table8). Statistical significance of a factor depends on the significanceof its representative dummy variables as a group, not the significanceof individual coefficients representing separate levels of a factor.For the regression model results in Table 8, all factors werestatistically significant at ex: = 0.05; the p-value for each group effect was always less than 0.025. By area, the highest regressioncoefficient was found for the southern slope area (Fig. 22), whereCPUE for most years was greater than that of other areas for comparable years. By quarter, the greatest deviation of the regressioncoefficient from the standard (third quarter) was estimated for thefirst quarter when the CPUE tended to be consistently higher annually than in the other quarters. By depth the greatest deviationof the regression coefficient was estimated for the shallowest interval fished (184-450 m), where the CPUE was almost invariablyless than at the greater depths for each of the slope areas. Whetherwe look at CPUE by area, quarter, or depth, it is obvious that CPUEtended to peak in 1980 and then reach a low point in 1982 or 1983(Fig. 23). The regression coefficient for annual effect reflects thistendency by bt:ing the highest in 1980 and lowest in 1982 and 1983.
When the CPUE in weight was converted to CPUE in numbers,a somewhat different annual trend was found. For the northern and

NORTHERN SLOPE CENTRAL SLOPE SOUTHERN SLOPE100
184--450 m 184--450 m 184--450 m
75
'".!:
tj
50 \ X..::
t-o \- A:; 25 /0
o,o~ /~o \.s:;/0-0 0
"0
<: 0 00
a;Co~
.8 451-730 m 451-730m 451-730 mE 75
"
~~Y\0,<:
//.!: -l0,
.s:; 500
s J.. 0 ...0 0u / /
,,025 00
cI ............ J ~
2 4 2 4 2 4 2 4
1981 1982 1983 1984 0
75
I> 730 m >730m0
50
.j)\LEGEND
7o-oFemales25
-Males V \2 4 2 4 2 4 2 4 2 4 2 4 2 4 2 4
1981 1982 1983 1984 1981 1982 1983 1984
Year and Quarter
Figure 20Catch-per-unit-effort of Greenland turbot by Japanese small trawlers by sex, depth, quarter, and area of the continental slope region of the
eastern Bering Sea, 1981-84 (length groups: males ~55 cm, females ~70 cm).
s
o
C
Area
o---0---- ---
N
o184 451 < 730
Depth
o--0--- ---
o
4
o
Year
2 3Quarter
o
o
o
o
0.30.,.------------,
0.24
018
0.12
0.06
0.12
0.06
o-0.06
-0.12 -"--,--.,.---,---,----'
o0------- - -0---
5 -006.;;;
~ -0.12 -'-.,.--,-.,.--,,-,--,-,..-1~ 1978 1980 1982 1984'0
~'u;;::
] 0.18.,.-------------,u
Figure 22Results of regression analysis of Greenland turbot catch-per-unit-effort, 1978-84, showingregression coefficients by main effects (year, area,
quarter, and depth).
:0- 60
"l 40.s:;00
~ 20w::JCl.U
01970 1972 1974 1976 1978 1980 1982 1984
Year
Figure 21Annual catch-per-unit-effort of Greenland turbot by the Japanese landbaseddragnet fIShery and that of Japanese small trawlers operating in the eastern Bering
Sea, 1970-84.
18

Table 7Regression model (no interactions) applied to Greenland turbot catch-per
unit-effort of the eastern Bering Sea.
Model Effeets
Table 8Results of analysis of variance and regression analysis of Greenland turbotcatch-per-unit-effort by Japanese small freezer trawlers operating in theeastern Bering Sea, 1978-84. (Data from U.S. Foreign Fisheries Observer
Program.)
'Zero by definition, because the cell represents the standard.
**Significant at a = 0.05
Range Estimate SE of estimate
0.195
184-450 m 0.103 0.022451-730 m Cf
>730 0.058 0.026
1978 0.096 0.0341979 0.121 0.0351980 0.254 0.0381981 0.214 0.0361982 0.040 0.0331983 0'1984 0.140 0.036
Jan.-March 0.130 0.032April-Jan. 0.014 0.026July-Sept. 0'Oct.-Dee. 0.011 0.026
Northern Cf
Central 0.045 0.023Southern 0.134 0.029
CPUE = Bo*+ BIOI + B,D2+ B3Yl + B4Y2 + BsY3 + B6Y4 + B7Y5 + BsY6+B9QI + B lOQ2 + BII Q3+ Bl2AI + B13A2
Definitions of dummy variables
Depth 01 D2
451-730 0 0184-450 I 0
>730 0 1
Year YI Y2 Y3 Y4 Y5 Y6
83 0 0 0 0 0 078 I 0 0 0 0 079 0 1 0 0 0 080 0 0 I 0 0 081 0 0 0 1 0 082 0 0 0 0 1 084 0 0 0 0 0 I
Quaner Ql Q2 Q3
july-Sept. 0 0 0Jan.-March I 0 0Apr.-June 0 I 0Oct.-Dee. 0 0 I
Area Al A2
Nonhern 0 0Central I 0Southern 0 I
DepthYearQuanerArea
Source
DepthYearQuanerArea
Error
Parameter
Intercept
Depth
Year
Quaner
Area
df
2632
437
Partial sum of squares
1.78242.94860.87930.9534
18.8572
Panial F-value
20.63**11.38**6.78**11.03**
bb
b~1977 79 81 83 1977 79 81 83
*Bo is the intercept or standard, and b; (not included in the model) is the deparlure from the standard because of a specific main effect.
Figure 23Annual changes in Greenland turbot catch-perunit-effort by Japanese small trawlers given bydepth and area of the continental slope of the
eastern Bering Sea, 1978-84.
19
NORTHERN
1.4°
b1.20 184 m - 450 m
.c. 1.000.80
~ 0.60~ 0.40 ~_
0.20 -, ~o
1'40~~ , .20 451 m - 730 m
-;, 1.00:;; 080
;i'0.60~u 0.40
0.20o
1.4°
li:E 1.20 > 730 m-;, 1.00
:;;0.80 ~~ 0.60u 0.40 ....-
0.20o
1.401.20 All depths
~1.00 combined
0.80w 0.60;i' 0.40~u
0.2001977 79 81 83
Years
CENTRAL
Years
SOUTHERN
Years

20r------------------------,
300NUMBERS OF FISH PER HECTARE
6 r----------.----------------,
19851983 1984
NORTHERNo
CENTRAL-1981 1982
SOUTHERN-19"19 1980
15
Mature adults ".........-.- .-.
.....:Jo
..c~
--..c(Il
;;::::.....o 100.....Q)
.0E:JZ
ClC
~
'".........'0 200
•O............------..l-_......._.l.-_............. MEAN WEIGHT (kg)
Figure 24Annual changes in catch-per-unit-i!tTort of mature and immature Greenland turoot
by Japanese small trawlers in the eastern Bering Sea, 1978-84.
Research vessel survey finding!>
Continental slope region of the eastern Bering Sea-Findingspresented here are based on data provided by the Fisheries Agencyof Japan on their research trawling surveys for the summers of 1979,1981, 1982, and 1985. They are given by the three areas (northern,
1985198419831982198119801979
central, and southern slope) similar to those used in presenting thefindings from the fisheries.
Relative density in numbers of fish per hectare declined sharplybetween the 1979 and 1981 surveys in all slope areas, while meanweight of the fish increased (Fig. 25). Density continued to declinein both the northern and central slope areas from 1981 to 1985,but for the southern slope area no marked change in density couldbe discerned between 1981 to 1985. As for mean weight of the fish,no well-defined trend is apparent from 1981 to 1985.
The above changes in density and mean weight can be accountedfor in part by the decline in small fish less than 55 cm in lengthin all slope areas (Fig. 26). By 1985 length samples showed twodistinct modal groups in both the central and southern areas, withthe lesser length modal group (55-69 cm) being comprised mainlyof mature males and the large length modal group (75 cm andgreater) ofmain1y mature females. For the northern slope area onlyone distinct modal group was found in 1985 that corresponded tothe lesser length modal groups observed from samples of fish fromthe other two slope areas in 1985. These survey findings for 1985correspond with the length compositions obtained from samplingof the fisheries in 1984 (Fig. 14).
Age data were available for only 1979. Individuals 4-7 years inage were dominant and comprised a considerable proportion of fishcaught in the northern slope at depths of 184-450 m and in the cen-
Figure 25Catch rates and average weight of Greenland turbot taken by Japanese researchtrawlers in the continental slope region of the eastern Bering Sea in 1979, 1981,
1982, and 1985.
8480
central slope areas CPUE in numbers peaked in 1979, but for thesouthern slope areas CPUE in numbers peaked in 1980 (Fig. 8).Following these peaks, the CPUE in numbers fell to low levels in1983 and 1984.
Corresponding to this general decline in CPUE by weight andnumber since 1979 or 1980, there has been an increase in the averageweight of the fish caught (Fig. 8). These corresponding but opposite trends in CPUE and average fish weight may reflect an agingand declining population, since the CPUE of smaller size fish hasbeen decreasing, whereas that of larger fish shows little change since1978 (Fig. 24).
The CPUE (by weight) of Japanese longline vessels also showsa decline in recent years. At depths greater than 450 m where mostof the Greenland turbot catch is taken by these vessels and whereCPUE is the highest, CPUE peaked in 1981 and then sharplydeclined in subsequent years (Fig. 12). At shallower depths of theupper slope, CPUE peaked in 1982 and then declined.
Since the Japanese mothership fishery does not target Greenlandturbot, we did not examine CPUE trends but instead looked at theincidence of this fish in the fishery by year. The declining trendin incidence (Fig. 4) cannot be attributed entirely to the decreasingnumber of animals on the shelf as inferred from the results otresearch trawl surveys. The Japanese modified the trawls used intheir mothership fisheries in 1980 to reduce the catch of crab andhalibut. This gear change, which raised the footrope of the net offthe sea bottom, may have contributed to the catch reduction ofGreenland turbot.
20

...cCIl
~CIl
c..
NORTHERN25,--------------,
1979
15
5oL.--'--'--'--'--'--'--'--'-.LL.LL--.J
25,-------------,1981
15
5olL.-LLJUJ--'--L-'--.l..-LLJLo-J
25,--------------,1982
15
5OL.--'--'--'--'--'--'--'--'--'--'--'--'----..J
CENTRAL
1979
1982
SOUTHERN
1979
1981
1982
250-------.-------,
15
5
100 25
1985
50
Length (em)
25
1985
100
Figure 26Length composition of Greenland turbot by 5-i:m length groups from sampling by Japanese research trawlers in the continen
tal slope region of the eastern Bering Sea in 1979, 1981, 1982, and 1985.
tral and southern slope at intermediate depths (451-730 m). In thedeepest zone, females of age 10 and older were most frequentlycaptured.
Temperatures near the sea bottom along the slope generally were3-5°C, with a slight tendency to decrease from the shallowest tothe deepest depth zone (Fig. 27). The widest temperature rangestended to occur in the shallowest depth zone because of the occasional influence of warm or cold water near the interface of shelfand slope. Mean water temperatures in the two deepest zones almostalways fell within a very narrow range of 1°C (3-4°C).
Continental shelfregion ofthe eastern Bering Sea-Results givenhere are from two sets of survey data: the longer time series(1973-85) that consistently covered the southeastern part of the shelf,and the time series (1975, 1979-86) of survey data which covereda major part of the shelf.
The availability distribution of Greenland turbot by survey yearshows some obvious patterns by time and area. For those surveysthat covered much of the eastern Bering Sea shelf, the highest concentration of animals was found in the northwestern part of the shelfwest and south of SI. Matthew Island (Fig. 28). In the early yearsof the shelf surveys Greenland turbot were caught throughout theregion, though mainly at intermediate (50-100 m) and outer shelfdepths (101-200 m) (Table 9). However, with time the geographicalcatch distribution shrank so that by 1985 and 1986 only the areawest and south of SI. Matthew Island was yielding any amount of
21
fish (Fig. 28), but the magnitude of catches within this area hasdecreased over time. Survey fmdings from the 1973-86 southeasternportion of the shelf suggest that young fish were abundant as earlyas 1973 and that their decline began noticeably in 1980 (Fig. 29and Table 10).
With the decline in number of fish on the shelf, the average ageand size ofthe fish increased. This can readily be seen when tracking changes in abundance by age (Table 10) and size groups (Fig.30). In 1979, when the greatest number of fish was found on theshelf during the surveys, fish of ages 1 through 4 were abundant,but by 1981 their numbers had greatly declined. The decline continued in subsequent years so that by 1985 mainly age-5 and olderanimals were dominant on the shelf, though present only in lownumbers. By size, there has been a noticeable shift to large sizegroups over the period of the surveys, so that in recent years(1984-85) fish greater than 30 cm have become the most importantcomponent of survey catches.
In contrast to the findings from research surveys and samplingsof the fisheries catch in the slope region, where most of the animalswere greater than 35 cm and of ages 4 and older, the shelf surveysencountered relatively small, young fish. Fish on the shelf are notsubstantially recruited to the survey gear at sizes below 10 cm orat age-O. Age-O fish have never been prominent in survey catchesbecause of their small size which allows them to pass through themesh of the net and because many of them have probably yet tosettle to the sea bottom from their pelagic stage. The sharp decline
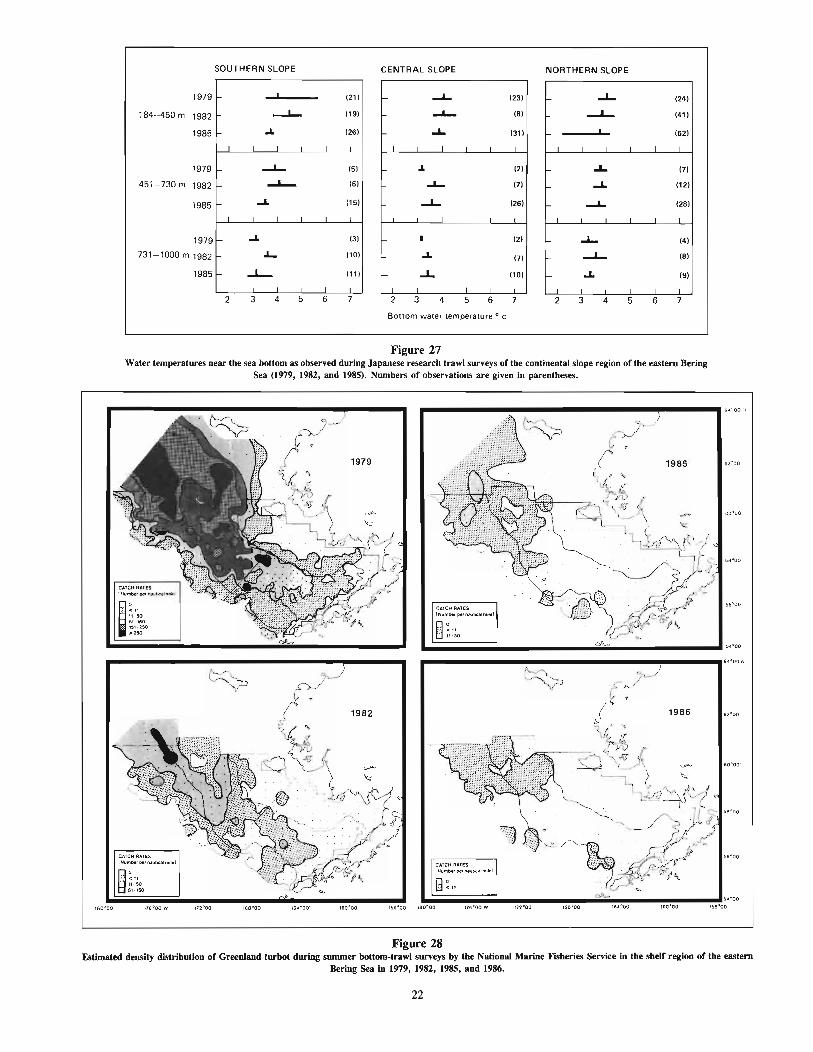
SOUTHERN SLOPE CENTRAL SLOPE NORTHERN SLOPE
,1211
~ 1191
..L (261
I I
--L.. 151
f- ......L..- 161
r- .... 1151
I I
f- ..L 13)
.I- 110)
f- ....L- IllI
r- ~ 123)
-'- (81
.... (31)
1 I
.I 12)
...L. (71
..J... (26)
I (2)
f- .L (7)
f- ..L (10)
I
...L. (24)
......J.... (41)
I 1621
..L (71
.... (12)
--L (28)
r- ...L.. 14)
r- --L.. (81
f- ..L (9)
1979
184--450 m 1982
1985
1979
451-730 m 1982
1985
1979
731-1000 m 1982
1985
2 3 4 5 6 7 2 3 4 5 6 7 2 3 4 5 6 7
Bottom water temperature 0 c
Figure 27Water temperatures near the sea bottom as observed during Japanese research trawl surveys of the continental slope region of the eastern Bering
Sea (1979, 1982, and 1985). Numbers of observations are given in parentheses.
56°00
'<;.-
1986
1985 "-00
, ~r< -,CATCH RATESINlJmberpefnaulocalmileJ
L~;;;;;;;;;;;;;;;;;;;;;;;;;;;., ~ 154000
r • .64°00N
~
• • .6
4
"00N
58°00
~o
~ < 11, 11-50
51-150
CATCH RATESINurnberpelnaulic;allf\llel
116"00 W180·00
Figure 28Estimated density distribution of Greenland turbot during summer bottom-trawl surveys by the National Marine Fisheries Service in the shelf region of the eastern
Bering Sea in 1979, 1982, 1985, and 1986.
22

Table 9Catch rate of Greenland turbot in weight (kg) and numbers (parentheses) per hectare trawled by area and depth in the shelf region
of the eastern Bering Sea during annual bollom trawl surveys by the Northwest and Alaska Fisheries Center, 1979 and 1981-85.
Area Depth(m) 1979 1981 1982 1983 1984 1985
Northern shelf I-50 0.8 (40.5) 0.0 (0.2) 0.0(0.1)
(>61 ° N. lat.) 51-100 8.9(131.0) 1.1 (6.4) 0.2(0.7)
101-200 13.9(137.3) 4.1(26.5) 6.7(19.4)
Central shelf 1-50 0.3 (5.0) 0.2 (0.6) 0.0 (0.1) 0.0(0.0) 0 (0) 0.0(0.0)
(58°-61 ° N. lat.) 51-100 7.2 (52.3) 2.2 (9.0) 0.8 (3.9) 0.5(1.4) 0.1(0.2) 0.0(0.2)
101-200 6.5 (44.2) 7.2(26.2) 2.7 (5.6) 2.4(4.5) 2.0(2.6) 0.8(1.3)
Southern shelf I-50 0.0 (0.4) 0.0 (0.0)«58° N. lat.) 51-100 1.6 (9.7) 0.3 (0.8) 0.3 (0.4) 0.4(0.9) 0.0(0.0) 0.0(0.0)
101-200 1.4 (14.7) 0.6 (0.4) 0.3 (0.2) 0.5(0.4) 0.2(0.1) 0.2(0.4)
Millions300,------------------------,
250 ,- ----------------.--.-.-...-.----
Table 10Number of Greenland turbot (million rtsh) by age groups (estimated fromboltom trawl surveys) in two areas of the eastern Bering Sea shelf with consistently good survey coverage and relatively high abundance. Area N liesbetween lat. 58°N and 61°N; area S is south of 58°N. Both areas are within
bollom depths of SO to 184 m.
Ages
Year Area o 2 3 4 5+ AU200 -_. -----------------.-----.
73 74 75 76 77 78 79 80 81 82 83 84 85
YEAR
Figure 29Annual estimates of the relative population numbers of Greenland turbot in anarea of the southeastern Bering Sea shelf which has been consistently surveyed
since 1973.
150 -
100 r----
50
o
1----------------
---
1975
1979
1980
1981
1982
1983
1984
1985
NS
Both
NS
Both
NS
Both
NS
Both
NS
Both
NS
Both
NS
Both
NS
Both
0.05 34.54o 19.46
0.05 54.00
0.52 257.27o 33.01
0.13 290.28
o 70.57o 4.74o 75.31
0.04 16.40o 0.67
0.04 17.07
o 8.59o 0.67o 9.26
0.09 4.70o 0
0.09 4.70
o 0.34
0.15 2.17o 0.84
0.15 3.01
275.5814.03
289.61
173.1429.38
202.52
229.01
18.58247.59
35.900.61
36.51
9.000.679.67
1.910.132.04
0.68
0.861.702.56
210.1550.74
260.89
205.0341.97
247.00
183.758.76
192.5l
99.411.69
101.10
11.901.12
13.02
8.491.75
10.24
1.21
1.340.852.19
44.1314.0558.18
114.0223.67
137.69
183.60
11.45195.05
101.902.67
104.57
29.050.93
29.98
17.230.59
17.82
7.12
1.54o
1.54
2.722.054.77
18.619.34
27.95
12.56
2.6715.23
17.903.14
21.04
16.063.12
19.18
13.150.83
13.98
11.96
5.180.956.13
567.12100.33667.45
768.59137.37905.57
679.4946.20
725.69
271.558.78
280.33
74.606.51
81.11
45.573.30
48.87
21.310.67
21.98
11.244.34
15.58
23
'No length data available for conversion to age.

4
3
2
~.2 1979
in numbers of fish older than age-4 on the shelf may be accountedfor by movements of these animals into the slope region.
Using the estimated abundance of age-I fish as a measure ofyearclass strength (Table 10), we can conclude that there has been acontinuing decline in year-class abundance since the strong showing of the 1978 year-class as age-1 fish in 1979. The 1979 through1984 year-classes are therefore considered weak relative to the 1978year-class.
In the shelf region, trawl catches of Greenland turbot wereassociated with a wide range of bottom water temperatures, but therewas generally a low incidence of turbot where water temperatureswere below DoC.
1984
1983
Aleutian Islands-In both 1980 and 1983 the highest catch ratesof Greenland turbot occurred in the northeast area of the Aleutians,whereas the lowest rates were observed in the southeast andsouthwest areas (Fig. 31). There was a definite declining trend inmagnitude of the catch rates from east to west along the AleutianIsland chain. The most pronounced difference between the twosurveys in terms of catch rates was observed in the northeast area,where the 1983 average catch of 17.0 kg/ha was twice that of 1980(8.4 kg/ha).
Relative biomass was greater in 1983 than in 1980, but relativepopulation numbers were greater in 1980 (Fig. 31). Although thenumber of animals declined, their average weight increased (Fig .31) so that biomass actually increased as well. The increase inaverage weight of fish occurred in all but the northwest area. Theincrease in average weight of fish in 1983 corresponds to an increase in the average length of fish (Fig. 32).
Highest catch rates or apparent densities occurred in the sloperegion at depths greater than 300 m (Fig. 33).
Bottom water temperatures recorded during the Aleutian surveystended to decrease by depth zone and to exhibit the widest rangesin the shallowest depth zones «200 m and 201-300 m) (Fig. 34).Where Greenland turbot was most available by depth (>300 m),mean temperatures of the bottom waters fell within the range of3 to 4°C.
4
3
2
m~
---'"0..sQJ...E 2~
<..>...'"u
1982
1985
1986
o L-..L.....Ilrza::ll~_...L.----'-_.L..-.....J....----l----tU{4..
5 10 15 20 25 30 35 40 >40
Length (5 cm intervals)
Figure 30Catch rate of Greenland turbot by 5-an length groups during annual swnmer bottom-trawl surveys by the National Marine Fisheries Service in
the shelf region of the eastern Bering Sea, 1979-86.
24

BOW~1»<1"
%Attu
(;)IT'
G;;:> ... NW 900m NE
«f I .0I A~ P
.,f .. 0 I Adak 0... I 0 ?J>p!)f>:P""'- I .
I O'SW Amchitka SEiIII
I172°E 1740
11760
I1780 1800
I I178°W 176 0
I1740
I1720 1700
Abundance
Aleutians
+5Kg
+5Kg
o
NE
SE
BowersRidge
Average weight of fish
NW
SW
Numbers
(1.106 fishl
14
1133
Biomass
(1000'1
48
01980
~1983
LEGEND
NE
15
'" 10J::--OJ~
5
0
SW5
Figure 31Relative density, abundance, and average weight of Greenland turbot as found during the 1980 and 1983 U.S.-Japan cooperative trawl surveys
in the Aleutian Islands region.
25

Females Males16 16
1980 198014 14
12 Average length =69.0 em 12 Average length = 53.6 em
10 10
8 8
6
I-ZW(,) 0 10 20 30 40 50 60 70 80 90 100 0 10 20 30 40 50 60 70 80 90 100a::W 16 16l:l. 1983 1983
14 14
12Average length =81.5 em
12 Average length =64.1 em
10 10
8 8
6 6
o 10 20 30 40 50 60 70 80 90 100 o 10 20 30 40 50 60 70 80 90 100
LENGTH (em)
Figure 32Length composition of Greenland turbot taken during U.S.-Japan cooperative bottom-trawl surveys in the Aleutian Islands region in 1980
and 1983.
LEGEND
0---01983• .1980
10
5
~.~
'"o 6
4
2
1-200 201-300 301-500 501-900
Depth (meters)
Figure 33Catch rate of Greenland turbot by depth during U.S.-Japan trawl surveys
in the Aleutian Islands region in 1980 and 1983.
26
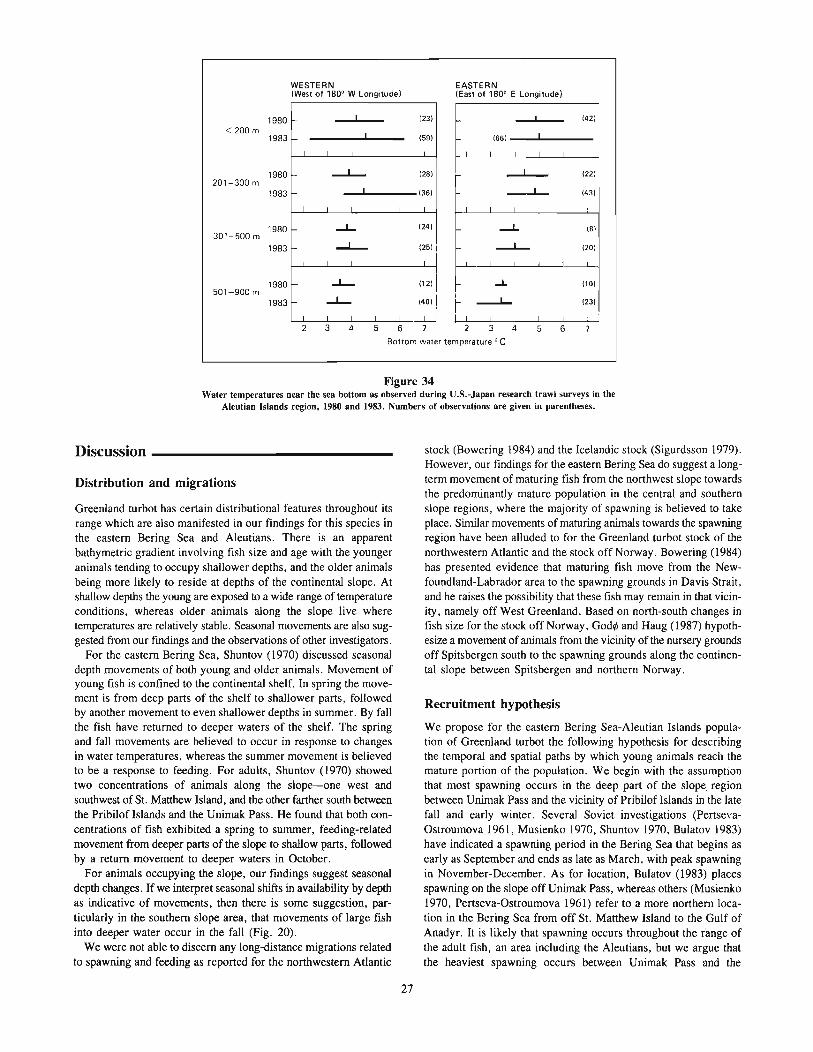
WESTERN(West of 180· W Longitude)
EASTERN(East of 180· E Longitude)
1980301-500 m
12311
I I65
, (42)
1661,
,(221
I (431
I I I I
-L. lSI
---1...- (201
I I I 1
..L (101
I
~ --J...I I I I
5 6 7 2 3 4
Bottom water temperature· C
432
- , (231
,(591
I
......L.- 12S)
I (361
...J... 1241
.....L..... (25) i
II
- ....L- (121 I..I- 1401 I
r I I .~
1980
1983
1980
1983
1983
1980
1983<200 m
501-900 m
201-300 m
Figure 34Water temperatures near the sea bottom as observed during U.S.-Japan research trawl surveys in the
Aleutian Islands region, 1980 and 1983. Numbers of observations are given ill parentheses.
Discussion _
Distribution and migrations
Greenland turbot has certain distributional features throughout itsrange which are also manifested in our findings for this species inthe eastern Bering Sea and Aleutians. There is an apparentbathymetric gradient involving fish size and age with the youngeranimals tending to occupy shallower depths, and the older animalsbeing more likely to reside at depths of the continental slope. Atshallow depths the young are exposed to a wide range of temperatureconditions, whereas older animals along the slope live wheretemperatures are relatively stable. Seasonal movements are also suggested from our fmdings and the observations of other investigators.
For the eastern Bering Sea, Shuntov (1970) discussed seasonaldepth movements of both young and older animals. Movement ofyoung fish is confined to the continental shelf. In spring the movement is from deep parts of the shelf to shallower parts, followedby another movement to even shallower depths in summer. By fallthe fish have returned to deeper waters of the shelf. The springand fall movements are believed to occur in response to changesin water temperatures, whereas the summer movement is believedto be a response to feeding. For adults, Shuntov (1970) showedtwo concentrations of animals along the slope-one west andsouthwest of St. Matthew Island, and the other farther south betweenthe Pribilof Islands and the Unimak Pass. He found that both concentrations of fish exhibited a spring to summer, feeding-relatedmovement from deeper parts of the slope to shallow parts, followedby a return movement to deeper waters in October.
For animals occupying the slope, our findings suggest seasonaldepth changes. Ifwe interpret seasonal shifts in availability by depthas indicative of movements, then there is some suggestion, particularly in the southern slope area, that movements of large fishinto deeper water occur in the fall (Fig. 20).
We were not able to discern any long-distance migrations relatedto spawning and feeding as reported for the northwestern Atlantic
stock (Bowering 1984) and the Icelandic stock (Sigurdsson 1979).However, our findings for the eastern Bering Sea do suggest a longterm movement of maturing fish from the northwest slope towardsthe predominantly mature population in the central and southernslope regions, where the majority of spawning is believed to takeplace. Similar movements of maturing animals towards the spawningregion have been alluded to for the Greenland turbot stock of thenorthwestern Atlantic and the stock off Norway. Bowering (1984)has presented evidence that maturing fish move from the Newfoundland-Labrador area to the spawning grounds in Davis Strait,and he raises the possibility that these fish may remain in that vicinity, namely off West Greenland. Based on north-south changes infish size for the stock off Norway, God~ and Haug (1987) hypothesize a movement of animals from the vicinity of the nursery groundsoff Spitsbergen south to the spawning grounds along the continental slope between Spitsbergen and northern Norway.
Recruitment hypothesis
We propose for the eastern Bering Sea-Aleutian Islands population of Greenland turbot the following hypothesis for describingthe temporal and spatial paths by which young animals reach themature portion of the population. We begin with the assumptionthat most spawning occurs in the deep part of the slope. regionbetween Unimak Pass and the vicinity of Pribilof Islands in the latefall and early winter. Several Soviet investigations (PertseyaOstroumova 1961, Musienko 1970, Shuntov 1970, Bulatov 1983)have indicated a spawning period in the Bering Sea that begins asearly as September and ends as late as March, with peak spawningin November-December. As for location, Bulatov (1983) placesspawning on the slope off Unimak Pass, whereas others (Musienko1970, Pertseva-Ostroumova 1961) refer to a more northern location in the Bering Sea from off St. Matthew Island to the Gulf ofAnadyr. It is likely that spawning occurs throughout the range ofthe adult fish, an area inclUding the Aleutians, but we argue thatthe heaviest spawning occurs between Unimak Pass and the
27

Pribilofs. This is based on 1) Waldron (1981), who shows the highestoccurrences of larvae in this region, and 2) our findings, whichindicate that most adult fish were found in the central and southernslope regions.
Eggs and early larvae are bathypelagic, but with growth the larvae become epipelagic (Musienko 1970, Jensen 1935 cited by Atkinson et al. 1981). Larvae are in rnidwater from early winter to earlyfall before they settle to the sea bottom. Waldron (1981) showshighest catches of larvae in plankton surveys during the springsummer period in the vicinity of the shelf's edge and slope, withsmall catches scattered in the shelf region and a few occurrencesover deep water; larvae were found as far north as the vicinity ofSt. Matthew Island. A fall settling of the larvae is suggested fromthe reports of Hognestad (1969), Smidt (1969), and Atkinson etal. (1981) for the North Atlantic form of the species. However,in the eastern Bering Sea, a few O-age fish were found during Julyand August surveys of the shelf, implying that some larvae apparently settle earlier than the fall in this region.
Young-of-the-year were found mainly in the central and northernareas of the shelf, occurring most densely in the northern area. Theyapparently spend their early years at shelf depths, but by age 4 andparticularly by age 5, many of them have moved into the sloperegion. The fish on the shelf were consistently found at highest densities in an area west and southwest of St. Matthew Island. Webelieve that this high-density area is an important pathway by whichyoung animals move from the shelf into the slope region. The arealies adjacent to the northern and central slope regions where wefind the highest catch rates as well as the highest proportions ofolder immatures. We assume these fish move south as they age,toward the southern slope region where mature fish are predominant.
For the Aleutian Islands region, we hypothesize that spawningtakes place there because of the presence of large, adult fish yearround. However, due to the lack of any extensive shelf, and perhapsbecause of currents, there is little settling of the larvae in this regionas suggested from the infrequent encounters of small fish «35 or40 cm in length) in this region by research surveys and fisheries.The eastward current on the northern side of the Aleutians (Kitani1983) could be a means by which eggs and larvae are transportedtowards the broad shelf area of the southern part of the eastern Bering Sea. We, therefore, assume that most adult fish in the Aleutians spend their juvenile stages in the shelf region of the easternBering Sea.
In summary, we believe that the main spawning area lies in theslope region between Unimak Pass and the Pribilof Islands. Larvae produced from spawning in this area tend to be transportedtowards the central and northern portions of the continental shelfwhere they settle on the sea bottom in the summer and fall. Theyoung begin to move from the shelf to the deeper water of the slopeby ages 4 and 5. As they mature they move towards the spawningarea. Most fish in the Aleutians are believed to have spent theirearly years on the eastern Bering Sea shelf. We propose this recruitment hypothesis as a framework for future investigations. In 1986a tagging program was begun to test this hypothesis.
Current condition of eastern Bering Sea-Aleutians stock
Our fmdings suggest that since 1981 the population has been declining and ageing. The number of small fish «40 cm) on the shelfand intermediate-size fish (40-55 cm) on the slope has decreased.This is evident from the changes in catch rates by size on the shelf(Fig. 30) and in CPUE by size in the slope region of the easternBering Sea (Figs. 15-17). Fish in the intermediate size range of
28
40-55 cm were much more available to the Japanese small freezertrawlers in 1979 and 1980 than in subsequent years. By 1982 theiravailability declined; these fish were either dying (natural and fishingmortality) or growing into the next size category with insufficientyounger fish to replace their numbers. This decline in intermediatesize fish was also evident in the Aleutians by their decreasingproportion in the total size composition of animals taken in the commercial (Fig. 18) and research (Fig. 32) catches. Our findings suggest that this decline was brought about by a succession of weakyear-classes spawned between 1979 and 1984.
Causes of recruitment failure
We assume that recruitment failure is real based on research surveyand fisheries findings. Our reservations to this assumption arisebecause of the absence of 1) research trawl surveys in the northernpart of the eastern Bering Sea shelf and 2) data on recruitment priorto 1973 because of no sampling. The decline in young fish abundance may in actuality be the result of a distributional shift of theyoung fish towards the north and beyond the research trawl surveyarea. We raise this as a possibility, although the decline of intermediate-length fish (30 to 55 cm) on the slope would argue againstthis. We have been assuming that the abundance of young fish onthe shelf during the years 1973-79 was typical, when, in fact, itmay be the result of some unusual conditions bringing about strongyear-classes. What we perceive as a decline in recruitment may infact be a retreat to normal recruitment levels.
Assuming that recruitment failure is real, several possibilities mayaccount for it. Recruitment failure may be the result of an insufficient number of spawners. The spawning stock has been declining, but we have no understanding as to the relationship of spawnersto the number of recruits to give us any guidelines for consideringthis possibility.
An obvious potential source of mortality of the young would bethe trawl fisheries on the shelf. In the years 1977-79 the Japanesemothership fishery took a considerable number of Greenland turbot as a bycatch in their pollock fisheries. This bycatch amountedto an average of some 41 million animals a year. Yet these removals(Table 6) were only a small fraction «5%) of the animals estimatedto be in the shelf area by National Marine Fisheries Service surveysin 1979 and 1980 (Table 10) and should have had no serious impact on the abundance of young fish in those years.
One source of mortality that could potentially account for thedecline of young fish would be increases in predator populationsor a predator shift toward Greenland turbot. Here we are faced witha wide choice of potential predators from carnivorous zooplankters,to fish, to marine mammals. Unfortunately, we can say nothingabout zooplankters except that they could do damage at the egg andearly larval stages.
Observations of Greenland turbot in stomachs of fish are rare.The Trophic Interactions Program at the NWAFC has examinedover 15,000 stomachs offish from the eastern Bering Sea, includingPacific cod, walleye pollock, Greenland turbot, arrowtooth flounder,and others. Yet the only instances of predation on Greenland turbot were by adult yellowfin sole (limanda aspera) and flathead soleon young-of-the-year fish. In the five occurrences of turbot inyellowfin sole stomachs, the prey ranged in length from 22 to 33mm, a size which suggest that the turbot had not yet settled to thesea bottom. The single occurrence of turbot predation by a flatheadsole was on a young fish whose length was not recorded. Potentially, yellowfin sole could have an impact on young-of-the-yearGreenland turbot, since yellowfin sole is one of the most abundant

flatfish of the eastern Bering Sea and is distributed at shelf depths.The biomass of yellowfin sole as estimated from NMFS trawlsurveys almost doubled between 1975 and 1979 (from 1.0 to 1.9million t), and peaked at over 2.0 million t in 1983 (Bakkala et al.1985).
There has not only been an increase in the abundance ofyellowfmsole, but Pacific cod and other fish populations have also increasedduring the period of Greenland turbot year-class decline.
Atlantic cod is known to prey on young Greenland turbot in thenorthwest Atlantic (Jensen 1935, Hansen 1949, Dunbar andGrainger 1952, Lear and Pitt 1975). Smidt (1969) has even suggested that the decline of the Greenland stock of turbot in the 1930'smay have been due to cod, which were abundant in those years.Although we have no evidence that Pacific cod is an importantpredator of turbot, we know that cod biomass in the eastern BeringSea increased four- to fivefold between 1976 and 1979 and thencontinued to increase, reaching 1.13 million t in 1986 (Thompsonand Shimada 1986). In regions of the shelf where Greenland turbot has historically been abundant, cod abundance, as assessed bythe NWAFC's annual surveys, increased dramatically between 1975and 1979, and exceeded Greenland turbot abundance after 1981.Pacific cod is therefore suggested as possibly being an importantpredator of Greenland turbot based on overlapping distributions,an inverse relational change in abundance, and the inference thatif Atlantic cod preys on young turbot its congener may also havethe potential to feed on them. However, fmdings by Shimada et al.(1986) based on the examination of over 1,850 cod stomachs collected in 1981 from the eastern Bering Sea, suggest that Greenlandturbot is of little consequence in the cod's diet. This may be a reflection of the narrow time and area window of their sampling. Therewere no samples collected from the fall period when most settlingof young turbot is believed to occur.
Arrowtooth flounder and sablefish (Anoplopomafimbria) are otherspecies in the eastern Bering Sea whose abundance increased during the period of turbot decline. As arrowtooth flounder abundanceon the shelf rose beginning in 1980, Greenland turbot abundancedeclined so that by 1983-85 arrowtooth flounder abundance exceeded that of Greenland turbot (Bakkala et al. 1986). High-densityareas of arrowtooth flounder lie at outer shelf depths (100-200 m)and on the continental slope. In 1978 sablefish were encounteredin unusual numbers during an NWAFC survey on the shelf (Umedaet al. 1983). These fish, belonging to the 1977 year-class, shiftedfrom the shelf to the slope region in 1979, and by 1981 their abundance on the slope was exceptionally high compared with earliersurveys. Both arrowtooth flounder and sab1efish are potentialpredators of young Greenland turbot in its pelagic stage or afterit settles on the sea bottom.
Among marine mammals, Kajimura (1984) has found that juvenileGreenland turbot was the fourth-ranking finfish (in volume of food)in stomachs of fur seals captured near the Pribilof Islands. Oneanimal had as many as 500 Greenland turbots in its stomach.Samples of these juveniles were 45-60 mm in length and of a sizewhich suggested that they had either settled to the sea bottom orwere approaching that stage. Presumably, the fur seal had capturedthem off the sea bottom, since fur seals tend to feed on nektonicfishes and invertebrates. In the 3 years (1964, 1973, 1974) for whichdetailed information on the feeding of fur seals in the eastern Bering Sea is available, Greenland turbot comprised from 1.1 to 2.1 %of the total volume of fur seal stomach contents (Fiscus and Kajimura1965, Kajimura et al. 1974, Kajimura and Sanger 1975). This couldtranslate to a substantial number of turbot, considering the energyneeds of the fur seals and assuming that fur seals consume mainly
29
juvenile turbot. The population of female seals alone has beenestimated at 570 x 103, (Briggs and Fowler 1984). They forageand feed their young during the period when the turbot larvae arein the water colunm or settling to the sea bottom (June toNovember).
Fur seals have been in the Bering Sea in large numbers for a longtime, but why should they suddenly begin to seriously reduce theabundance of young Greenland turbot? Perhaps predation by furseals, along with that of increased predation by other species, couldbe accounting for the year-class decline.
As in many attempts to explain changes in the year-class strengthof a species, there is no concrete evidence here for a particularcausative factor or factors. Several possibilities have been discussedfor the purpose of evaluating either their plausibility or their promiseas avenues for further study. We have emphasized predation byfish and fur seals in our discussion, but that is because most of ourdata on abundance changes, and predation of eastern Bering Seabiota deal with these animals. Ifwe knew more about the predatoryhabits of zooplankon, squid, or bottom invertebrates along with theirtemporal-spatial changes in abundance, our discussion would havebeen more extensive. The same could be said about parasitism,disease, and changes in the physical environment. Therefore, weare left with a considerable degree of uncertainty as to the causesof the continuing decline in year-class abundance of Greenland turbot. There is also the possibility alluded to earlier that the declinemay be a return to more normal levels of recruitment from highlevels during the 1970's and not the result of a recruitment failure.
Acknowledgments _
The authors thank the following individuals for their review of certain parts of the manuscript and their valuable comments: WilliamR. Bowering of the Northwest Atlantic Fisheries Center in St.John's, Newfoundland; Olav R. God~, Institute of Marine Researchin Bergen, Norway; Hiroshi Kajimura of the National Marine Mammal Laboratory in Seattle, Washington; Adalsteinn Sigurdsson,Marine Research Institute in Reykjavik, Iceland; and HirotsuneYamaguchi, Tohoku Regional Fisheries Research Laboratory inHachinohe, Japan. Thanks is also expressed to Hiroshi Kajimurafor providing unpublished data on Greenland turbot found in thestomachs of fur seals, and to the Fisheries Agency of Japan forage data.

Citations
Andriyashev, A.P.1954. Ryby severnykh morsei SSSR. Opred Faune SSSR. 53: 1-556. [Engl.
transl.; Fishes of the northern seas of the U.S.S.R. Israel Prog. Sci. Transl.Jerusalem, 1964, 617 p.]
Atkinson, D.B., W.R. Bowering, Sv. Aa. Horsted, J.P. Minet, and D.G.Parsons.
1981. A review of biology and fisheries of roundnose grenadier (Macrourusrupes/ris), Greenland halibut (Reinhardlius hippog/ossoides) , and shrimp (Panda/us borealis) in Davis Strait (NAFO Subareas 0 and 1). Northwest Atl. Fish.Organ. SCR Doc. 81/VI/22, Ser. N290:7-27.
BakkaIa, R.G.1985. Greenland turbot and arrowtooth flounder. In BakkaIa, R.G., and L.L.
Low (eds.), Condition of groundfish resources of the eastern Bering Sea andAleutian Islands region in 1984, p. 67-81. NOAA Tech. Memo. NMFSF/NWC-83. Northwest Alaska Fish. Cent., Natl. Mar. Fish. Serv., Seattle,WA 98115.
BakkaIa, R.G., and L.L. Low (editors), and D.H. Ito, R.E. Narita, V.G.Wespestad, D. Kimura, L.L. Ronholt, and J.J. Traynor.
1985. Condition of groundfish resources of the eastern Bering Sea and AleutianIslands region in 1984. NOAA Tech. Memo. NMFS F/NWC-83. NorthwestAlaska Fish. Cent., Natl. Mar. Fish. Serv., Seattle, WA 98115, 196 p.
Bakkala, R.G., and K. Wakabayashi (editors).1985. Results of cooperative U.S.-Japan groundfish investigations in the Ber
ing Sea during May-August 1979. Int. North Pac. Fish. Comm., Bull. 44, 252 p.BakkaIa, R.G., M.S. Alton, and D.K. Kimura.
1986. Greenland turbot and arrowtooth flounder. In Bakkala, R.G., and L.L.Low (eds.), Condition of groundfish resources of the eastern Bering Sea andAleutian Islands region in 1985, p. 63-76. NOAA Tech. Memo. NMFSF/NWC-I04. Northwest Alaska Fish. Cent., Natl. Mar. Fish. Serv., Seattle,WA98115.
Bowering, W.R.1980. Fecundity of Greenland halibut, Reinhardlius hippog/ossoides (Walbaum),
from southern Labrador and southeastern Gulf of St. Lawrence. J. NorthwestAtl. Fish. Sci. 1:39-43.
1982. Population dynamics of Greenland halibut in the Gulf of St. Lawrence.J. Northwest Atl. Fish. Sci. 3:141-147.
1983. Age, growth, and se.xual maturity of Greenland halibut, Reinhard/ius hippog/ossoides (Walbaum), in the Canadian Northwest Atlantic. Fish. Bull., U.S.81 :599-611.
1984. Migrations of Greenland halibut, Reinhard/ius hippog/ossoides, in thenorthwest Atlantic from tagging in the Labrador-Newfoundland region. J. Northwest Atl. Fish. Sci. 5:85-91.
Bowering, W.R., and G.R. Lilly.1985. Diet of Greenland halibut off southern Labrador and northeastern New
foundland (Div. 2J + 3K) in autumn of 1981-82, emphasiting predation oncapel in. Northwest Atl. Fish. Organ. SCR Doc. 851109, Ser. N1085, 16 p.
Briggs, L., and C.W. Fowler.1984. Tables and figures of the basic population data for the northern fur seals
of the Pribilof Islands. Background paper submitted to 27th Meeting, StandingScientific Committee, North Pacific Fur Seal Commission, Moscow, March29-April 9, 1984. Natl. Mar. Mammal Lab., Northwest Alaska Fish. Cent.,Natl. Mar. Fish. Serv., Seattle, WA 98115.
Bulatov, O.A.1983. Distribution of eggs and larvae of Greenland halibut, Reinhardtius hip
pog/ossides [sic] (Pleuronectidae) in the eastern Bering Sea. J. Ichthyol. [Engl.transl. Vopr. Ikhtiol.] 23(1):157-159.
Chumakov, A.K.1970. The Greenland halibut, Reinhard/ius hippog/ossoides in the Iceland area
- The halibut fisheries and tagging. Tr. Polyarn. Nauchno-Issled. Proel<tn. Inst.Morsk. Rybn. Khoz. 1970:909-912.
de Groot, S.J.1970. Some notes on the ambivalent behaviour of the Greenland halibut,
Reinhardlius hippog/ossoides (Walb.) Pisces: Pleuronectiforrnes. J. Fish. BioI.2:275-279.
Draper, N.R., and E.H. Smith.1981. Applied regression analysis. John Wiley & Sons Inc., NY, 709 p.
Dunbar, M.J., and E.H. Grainger.1952. Station list of the "Calanus" expeditions, 1947-1950. J. Fish. Res. Board
Can. 9(2):65-82.D'yakov, Yu. P.
1982. The fecundity of the Greenland halibut, Reinhard/ius hippog/ossoides(Pleuronectidae), from the Bering Sea. J. Ichthyol. [Engl. Transl. Vopr. Ikhtiol.]22(5):59-64.
30
Ernst, P.1974. Die Abhangigkeit des Schwarzen Heilbutt (Reinhard/ius hippog/ossoides
(Walb.)) von den Wassertemperaturver haltnissen im Seegebiet Island. FishereiForschung, Wisserschaftliche Schriftenreihe 12(1 ):35-40.
Fairbairn, D.J.1981. Biochemical genetic analysis of population differentiation in Greenland
halibut, Reinhard/ius hippog/ossoides, from the Northwest Atlantic, Gulf ofSt. Lawrence, and Bering Sea. Can. J. Fish. Aquat. Sci. 38:669-677.
Fedorov, K.E.1968. Oogenesis and the sexual cycle of the Greenland halibut. Tr. Polyarn.
Nauchno-Issled. Proektn. Inst. Morsk. Rybn. Khoz. Okeanogr. 23:425-450.1971. Zoogeographic characteristics of the Greenland halibut, Reinhardlius hip
pog/ossoides (Walb.). J. Ichthyol. (Engl. Trans. Vopr. Ikhtiol.) 11(6):971-975.Fiscus, C.H., and H. Kajimura.
1%5. Pelagic fur seal investigations, 1964. U.S. Fish. Wildl. Serv., Spec. Sci.Rep. Fish. 522, 47 p.
(FAO) Food and Agriculture Organization of the United Nations.1975. Yearbook of fisheries statistics, catches and landings, 1974, vol. 38, FAO,
Rome. 1976. Yearbook of fisheries statistics, catches and landings, 1975, vol.40, FAO, Rome.
God" O.R., and T. Haug.1987. Migration and recruitment to the commercial stock of Greenland halibut,
Reinhard/ius hippog/ossoides (Walbaum) in the Svalbard area. Fiskeridir. Skr.Ser. Havunders. 18:311-328.
Halliday, K., and Y. Umeda.1986. Data report: 1984 bottom trawl survey of the eastern Bering Sea con
tinental shelf. NOAA Tech. Memo. NMFS F/NWC-108. Northwest AlaskaFish. Cent., Natl. Mar. Fish. Serv., Seattle, WA 98115, 203 p.
Hansen, P.M.1949. Studies on the biology of end in Greenland waters. Rapp. P-V. Reun.
Cons. Int. Explor. Mer 123, 77 p.Haug, T., and B. Gulliksen.
1982. Size, age, occurrence, growth, and food of Greenland halibut, Reinhard/ius hippog/ossoides (Walbaum) in coastal waters of western Spitzbergen. Sarsia 68:293-297.
Hirschberger, W.A.1985. Data report: 1983 bottom trawl survey of the eastern Bering Sea con
tinental shelf. NOAA Tech. Memo. NMFS F/NWC-94. Northwest Alaska Fish.Cent., Natl. Mar. Fish. Serv., Seattle, WA 98115, 225 p.
Hognestad, P.T.1%9. Notes on Greenland halibut, Reinhard/ius hippog/ossoides, in the eastern
Norwegian Sea. Fiskeridir. Skr. Ser. Havunders. 15(3):139-144.Hubbs, C.L., and N.J. Wilimovsky.
1%4. Distribution and synonymy in the Pacific Ocean and variation of theGreenland halibut, Reinhard/ius hippog/ossoides (Walbaum). J. Fish. Res.Board Can. 21:1129-1154.
International Council for the Exploration of the Sea (ICES).1972-1983. Bull. Statistique des Peches Maritimes, vols. 55-66, various
pagination.Jensen, A.S.
1935. (Reinhardtius hippog/ossoides) its development and migrations. K. dan.vidensk. Selsk. Skr. 9 Rk., 6: 1-32.
Kajimura, H.1984. Opportunistic feeding of the northern fur sea, Callorhinus ursinus, in the
eastern North Pacific Ocean and eastern Bering Sea. NOAA Tech. Rep. NMFSSSRF-779. Natl. Oceanic Atmos. Adm., Natl. Mar. Fish. Serv., Seattle, WA98115,49 p.
Kajimura, H., G.A. Sanger, and C.H. Fiscus.1974. Pelagic - Bering Sea. In Fur seal investigations, 1973, p. 31-47, 71-95.
Northwest Alaska Fish. Cent., Natl. Mar. Fish. Serv., Seattle, WA 98115.Kajimura, H., and G.A. Sanger.
1975 Pelagic - Bering Sea. In Marine mammals division, fur seal investigations,1974, p. 38-54. Northwest Alaska Fish. Cent., Natl. Mar. Fish. Serv., Seattle, WA98115.
Kilani, Kozo.1983. Water movement in the Aleutian Basin in winter, 1983. Document sub
mitted to Int. N. Pac. Fish. Comm. by Fisheries Agency of Japan, Tokyo, 8 p.KOvlsova, M.V., and G.P. Nizovtsev.
1985. Peculiarities of growth and maturation of Greenland halibut of theNorwegian-Barents Sea stock in 1971-1984. Int. Counc. Explor. Sea Meet.Rep. G:7, 17 p.
Lear, W.H.1970. Fecundity of Greenland halibut (Reinhard/ius hippog/ossoides) in the
Newfoundland-Labrador area. J. Fish. Res. Board Can. 27(10): 1880-1882.

Lear, W.H., and T.K. Pitt.1975. Otolith age validation of Greenland halibut (Reinhard/ius hippoglossoides).
J. Fish. Res. Board Can. 32(2):289-292.Livingston, P.A., D.A. Dwyer, D.L. Wencker, M.S. Yang, and G.M. Lang.
1986. Trophic interactions of key fish species in the eastern Bering Sea. In Symposium on biological interactions in the North Pacific region and on factorsaffecting recruitment, distribution, and abundance of non-anadromous species.Int. N. Pac. Fish. Comm., Bull. 47:49-65.
Mikawa, M.1963. Ecology of the lesser halibut, Reinhard/ius hippoglossoides nuusuurae Jor
dan and Snyder. Bull. Tohoku Reg. Fish. Res. Lab. 29: 1-41.Moiseev, P.A.
1953. Cod and flounders of far eastern seas. Izv. Tikhookean. Nauchno-issled.Inst. Morsk. Rybn. Khoz. Okeanogr. 40,287 p. [Fish. Res. Board Can., Trans!.Ser. 119, 596 p.]
Musienko, L.N.1970. Reproduction and development of Bering Sea fishes. Tr. Vses. Nauchno
issled. Inst. Morsk. Rybn. Khoz. Okeanogr. 70 (Izv. Tikhookean. Nauchnoissled. Inst. Rybn. Khoz. Okeanogr. 72): 166-224. [Trans!. in Soviet FisheriesInvestigations in the Northeastern Pacific, Part V, p. 161-224, by Israel Prog.Sci. Trans!., 1972; avail. Natl. Tech. Inf. Serv., Springfield, VA, as7771-50127.]
Nelson, R. Jr., R. French, and J. Wall.1981. Sampling by U.S. observers on foreign fishing vessels in the eastern Bering
Sea and Aleutian Islands region, 1977-78. Mar. Fish. Rev. 43(5): 1-19.Niska, E.L., and A.R. Magill.
1967. Occurrence of Greenland halibut and Asiatic flounder off Oregon. OregonFish. Comm. Res. Briefs 13(1):123-124.
Northwest Atlantic Fisheries Organization.1983. Fisheries statistics for 1981. Northwest At!. Fish. Organ. Stat. Bull. 31,
284 p.Pereyra, W.T., J.E. Reeves, and R.G. Bakkala.
1976. Demersal fish and shellfish resources of the eastern Bering Sea in thebaseline year 1975. Proc. rep., Northwest Alaska Fish. Cent., Natl. Mar. Fish.Serv., NOAA, Seattle, WA 98115,619 p.
Pertseva-<>Stroumova, T.A.
1961. The reproduction and development of far eastern flounders. Izdatel'stvoAkad. Nauk. SSSR, 483 p. [Trans!. by Fish. Res. Board Can., 1967, Trans!.Ser. 856, 1003 p.]
Sample, T.M., K. Wakabayashi, R.G. Bakkala, and H. Yamaguchi.1985. Report of the 1981 cooperative U.S.-Japan bottom trawl survey of the
eastern Bering Sea Continental shelf and slope. NOAA Tech. Memo. NMFSF/NWC-88. Northwest Alaska Fish. Cent., Natl. Mar. Fish. Serv., Seattle,WA 98115, 332 p.
Shimada, A.M., P.A. Livingston, and J.A. June.1986. Summer feeding of Pacific cod. Gadus macrocephalus, on the eastern
Bering Sea Shelf. Unpub!. manuscr., Northwest Alaska Fish. Cent., Natl. Mar.Fish. Serv., NOAA, Seartle, WA 98115,53 p.
Shuntov, V.P.1965. Distribution of the Greenland halibut and arrowtooth halibuts in the North
Pacific. Tr. Vses. Nauchno-issled. Inst. Morsk. Rybn. Khoz. Okeanogr. 58(Izv. Tikhookean. Nauchno-issled. Inst. Morsk. Rybn. Khoz. Okeanogr.53): 155-163. [Trans!. in Soviet Fisheries Investigation in the NortheasternPacific. Part IV, p. 147-156, by Israel Prog. Sci. Trans!., 1968; avail. Nat!.Tech. Inf. Serv., Springfield, VA, as TT67-51206.]
1970. Seasonal distribution of black and arrowtoothed halibuts in the BeringSea. Tr. Vses. Nauchno-issled. Inst. Morsk. Rybn. Khoz. Okeanogr. 70 (Izv.Tikhookean. Nauchno-issled. Inst. Morsk. Rybn. Khoz. Okeanogr.72):391-401. [Trans!. in Soviet Fisheries Investigations in the NortheasternPacific, Part V, p. 397-408, by Israel Prog. Sci. Trans!., 1972; avail. Natl.Tech. Inf. Serv., Springfield, VA, as TT71-50127.]
Sigurdsson, A.
1979. The Greenland halibut Reinhard/ius hippoglossoides (Walb.) at Iceland.Hafrannsoknir 16:23-29.
1981. Migrations of Greenland halibut Reinhard/ius hippoglossoides (Walb.)from Iceland to Norway. Rit Fiskideildar 6(1):3-6.
Smidt, E.
1969, The Greenland halibut (Reinhard/ius hippoglossoides, Walbaum), biologyand exploitation in Greenland waters. Medd. Dan. Fisk. Havunders 6:79-118.
Templeman, W.
1973. Distribution and abundance of the Greenland halibut, Reinhard/ius hippoglossoides (Walbaum), in the Northwest Atlantic. Int. Comm. Northwest At!.Fish. Res. Bull. 10:82-98.
31
Thompson, G.G., and A.M. Shimada.1986. Pacific cod. In Bakka1a, R.G., and L.L. Low (eds.), Condition ofground
fish resources of the eastern Bering Sea and Aleutian Islands region in 1985,p. 31-52. NOAA Tech. Memo. NMFS F/NWC-I04. Northwest Alaska FishCent., Nat!. Mar. Fish. Serv., Seattle. WA 98115.
Torheim, S.1979. Shrimp (Panda/us borealis) investigations off Jan Mayen in October 1979.
Fisken Havet 1980(3):1-9 (in Norwegian).Umeda, Y., and R.G. Bakkala.
1983. Data report: 1980 demersal trawl survey of the eastern Bering Sea continental shelf. NOAA Tech. Memo. NMFS F/NWC-49. Northwest Alaska Fish.Cent., Nat!. Mar. Fish. Serv., Seattle, WA 98115,175 p.
Umeda, Y., T.M. Sample, and R.G. Bakkala.1983. Recruitment processes of sablefish in the eastern Bering Sea. In Pro
ceedings, International Sablefish Symposium, p. 291-303. Alaska Sea GrantRep. 83-8, Lowell Wakefield Fish. Symp. Ser., Univ. Alaska, Fairbanks.
Vernidub, M.F., and K.I. Panin.1937. Some data on the systematic position and biology of a Pacific member
of the genus Reinhard/ius Gil!. Sci. J. Leningrad State Univ. 15:250-272.Wakabayashi, K., and R. Bakkala.
1978. Estimated catches of flounders by species in the Bering Sea updatedthrough 1976. Unpub!. manuscr., Northwest Alaska Fish. Cent., Nat!. Mar.Fish. Serv., Seattle, WA 98115, 14 p.
Wakabayashi, K., R.G. BakkaIa, and M.S. Alton.1985. Methods of the U.S.-Japan demersal trawl surveys. In Bakkala, R.G.,
and K. Wakabayashi (eds.), Results of cooperative U.S.-Japan groundfish investigations in the Bering Sea during May-August 1979. Int. North Pac. Fish.Comm., Bul!. 44:7-29.
Waldron, K,D.1981. Ichthyoplankton. In Hood, D., and J. Calder (eds.), The eastern Bering
Sea shelf: oceanography and resources. vo!. I, p. 471-493. Univ. Wash. Press,Seattle.
Weisberg, Sanford.1985. Applied Linear Regression, 2d edition. John Wiley & Sons, NY, 283 p.
Westrheim, S.J., and F.T. Pletcher.1966. First records of the twoline eelpout, Bo/hrocara brunneum, Greenland
halibut, Reinhard/ius hippoglossoides, and shortbelly rockfish, Sebas/odes jordoni, in British Columbia waters. J. Fish. Res. Board Can. 23(2):309-312.
Wilderbuer, T.K., K. Wakabayashi, L,L. Ronholt, and H. Yamaguchi.1985. Survey report: cooperative U.S.-Japan Aleutian Islands groundfish trawl
survey - 1980. NOAA Tech. Memo. NMFS F/NWC-93. Northwest AlaskaFish. Cent., Nall. Mar. Fish. Serv., Seartle, WA 98115,356 p.
