greenwich public schools facility utilization and racial ... · greenwich public schools facility...
TRANSCRIPT
Greenwich Public Schools Facility Utilization and Racial Balance
Frequently Asked Questions
1 | P a g e
The following questions were posed by members of the community, parents, town leaders, Board of Education members and school staff via email or at various meetings and public forums. The questions were answered by District administrators assisted by the District consultant, Milone and MacBroom. As such, this FAQ represents a running community dialogue on the challenges of addressing facility utilization and racial balance issues in Greenwich Public Schools. As additional questions are posed, they will be answered and added to this FAQ.
Process
What came first? Facility Utilization or Racial Balance issues? What is the driving factor?
The Greenwich Board of Education received a letter from the Connecticut Commissioner of Education on June 11, 2012 citing the District for continuing racial imbalance at Hamilton Avenue and New Lebanon elementary schools and requesting that the District file an amended plan to address racial imbalance. A follow up report to racial balance letter prepared by District administration was presented to the BOE in October 2012. At that time is was very clear to the BOE that there were two issues that need to be addressed.
Why were these issues (Facility Utilization and Racial Balance) not addressed as a concern in the last BOE election?
At the point the last Board of Education election was held, the District had a plan to address racial imbalance in place that was acceptable to the State Board of Education and facility utilization was not an issue with the exception of declining enrollment at Parkway School.
How involved in the process are the individual school principals?
The school principals have been briefed as a group and individually on the process outlined by the Board of Education for addressing facility utilization and racial balance issues, the enrollment data which defines the issues, and the possible approaches to resolving these issues. Their questions and insights have been solicited on both the process and the data that has been presented to the Board and the public. At this point, the primary role of the school principals is to ensure good communication within their school community and ensure that the focus in the schools remains on teaching and learning.

Greenwich Public Schools Facility Utilization and Racial Balance
Frequently Asked Questions
2 | P a g e
Why were parents not included in Milone and MacBroom’s (District consultant) research and analysis?
Milone and MacBroom’s role has been to develop a data set that defines the issue and to evaluate the efficacy of possible approaches to addressing the issue. Once their initial work was completed, it was presented to the public with the intent of refining both the data analysis and option development through stakeholder input and questions. The process will continue through the fall of 2014 and may include parent focus groups and surveys depending on the approach selected by the Board of Education.
What are the next steps? Is 3 weeks sufficient or will the BOE need more time?
After multiple opportunities for stakeholder input, the Board of Education will assess progress and provide the administration with a sense of direction at the June 20th Board meeting.
Can Greenwich citizens sue the BOE to force the BOE to pursue other options?
It is hoped that the process for addressing the issues of facility utilization and racial balance is flexible enough to consider alternative options suggested by Greenwich citizens without them resorting to litigation. In the “Approaches” section of this FAQ are a number of suggestions made by community members. Further suggestions are welcomed. This is a community issue that requires a community solution.
What is the target date to select one item to present to the State?
The target date to select an option is fall 2013 for implementation in the fall of 2014. The Greenwich plan will be presented to the Connecticut State Board of Education after an option is determined by a vote of the Greenwich Board of Education. On June 20th, the Greenwich Board of Education will provide a sense of direction to the District administration on further option development.
Racial Balance Mandate
Has M&M addressed constitutionality issues? Has the BOE made the decision NOT to challenge the State? Why has the BOE / District been advised not to challenge the law? Would it be helpful if TOG citizens assisted the BOE in fighting the CSDE?

Greenwich Public Schools Facility Utilization and Racial Balance
Frequently Asked Questions
3 | P a g e
The statute and regulations regarding racial balance are currently the law in the State of Connecticut. After the Supreme Court decision in Parents Involved in Community Schools versus Seattle School District No. 1 (2007), the chairperson of the Connecticut State Board of Education requested clarification from the Connecticut Attorney General as to whether the CSBE should continue to enforce the Connecticut statute regarding racial imbalance. The Attorney General concluded “the Connecticut State Board of Education must continue to enforce the law to requiring local plans to address racial imbalance, but assure that each plan complies with the Supreme Court mandates set forth in Parents Involved.” An independent opinion solicited from the Greenwich Board of Education’s attorney concurred with the Attorney General. Given the number of questions raised by stakeholders over the constitutionality of the state statute, the Board of Education is seeking additional legal counsel on this issue.
What can Hartford (CSDE) do to Greenwich Public Schools if Greenwich does not comply with Racial Balance mandate?
The State can withhold funding (approximately $10 million)
Put the withholding of state funds for education $10 million) into context of the total BOE budget. What would be the effect on local property taxes?
o The Board of Education operating budget (excluding benefits) is $139,357,220 for 2012-2013. The total Town of Greenwich budget is $333,712,313 for 2012-2013. The impact of losing $10,000,000 on local property taxes would depend on the extent to which funds are added to the budget to make up the shortfall.
The State can withhold teacher and administrator certification. Greenwich will lose the ability to operate public schools.
Is Hartford (CSDE) enforcing the racial balance statute because of racial imbalance in Greenwich or because the magnet schools have failed to raise test scores?
The CSDE has consistently enforced the racial balance statute with regards to Greenwich since Hamilton Avenue School was first cited in 2000. The request to amend the existing plan by the CSDE is the result of the failure of the District’s plan to address racial imbalance
If HAS and NL were in compliance with the racial balance statute would the BOE still need to redistrict?

Greenwich Public Schools Facility Utilization and Racial Balance
Frequently Asked Questions
4 | P a g e
Even all elementary schools were racially balanced as defined by the state statute and regulations, New Lebanon would be overcrowded and a number of other schools (Glenville and Cos Cob) are on the way to being overcrowded. Redistricting is but one of many approaches to redistributing students among elementary schools.
What are the racial balances now of all schools?
See slide 32 http://www.greenwichschools.org/uploaded/district/Board_of_Education/meeting_materials/2012-13_meetings/5-23-13_meeting/BOE_Exisiting_Conditions_5-23-13_Public_Copy.pdf
Do you project any other schools are threatened with being out of compliance?
Western Middle School, Parkway and Old Greenwich were cited in June 2013 as having impending racial imbalances (+/- 15% from the District minority average). Julian Curtiss was cited in 2012 for an impending racial imbalance but moved below the threshold based on minority enrollment in 2013.
Facility Utilization
What is the number of students in each class?
The average number of students in each class is 19.5. This average results from applying the Board of Education class size guidelines school by school and grade by grade. For more information, see:
http://gsdpublicdash.com/Procedures/E040_21_ClassSizeRev_0612.pdf
What are the capacity figures versus enrollment figures at New Lebanon and Hamilton Avenue?
See slide 41 (enrollment) and slide 46 (capacity):
http://www.greenwichschools.org/uploaded/district/Board_of_Education/meeting_materials/2012-13_meetings/5-23-13_meeting/BOE_Exisiting_Conditions_5-23-13_Public_Copy.pdf
Historical Enrollment Data and Enrollment Projections
Additional issues and requests for information raised by the Board of Education at the June 6th meeting.
Greenwich Public Schools Facility Utilization and Racial Balance
Frequently Asked Questions
5 | P a g e
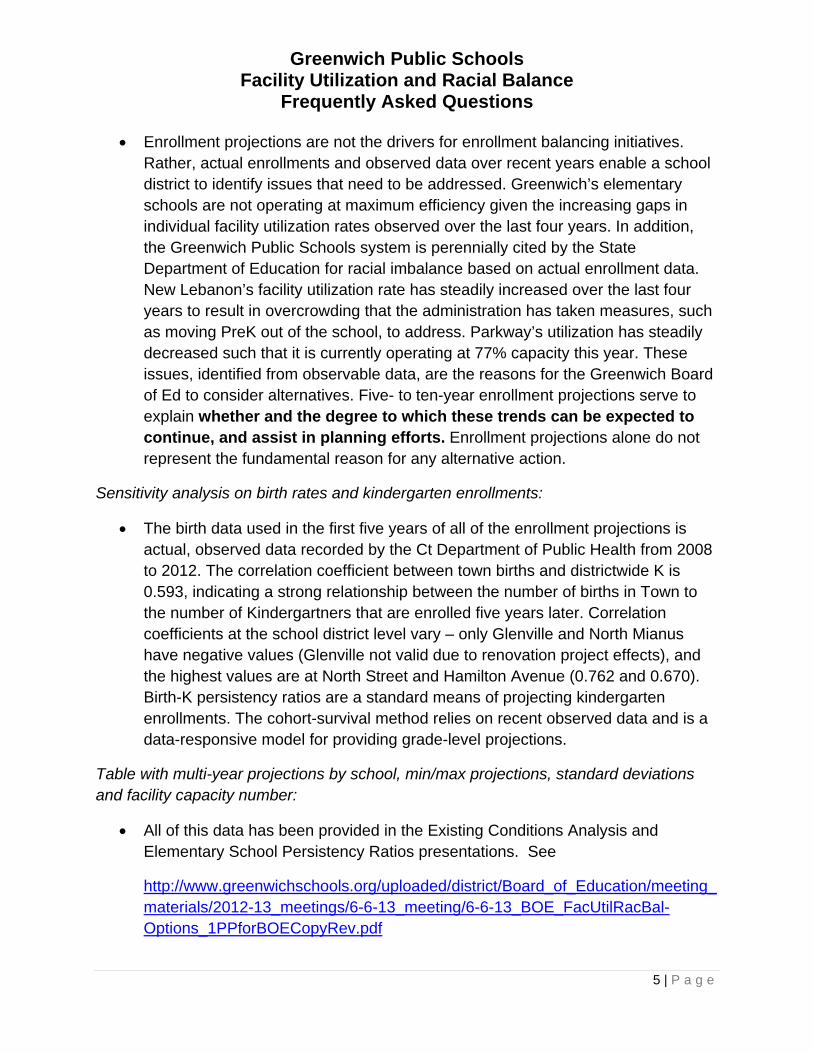
Enrollment projections are not the drivers for enrollment balancing initiatives. Rather, actual enrollments and observed data over recent years enable a school district to identify issues that need to be addressed. Greenwich’s elementary schools are not operating at maximum efficiency given the increasing gaps in individual facility utilization rates observed over the last four years. In addition, the Greenwich Public Schools system is perennially cited by the State Department of Education for racial imbalance based on actual enrollment data. New Lebanon’s facility utilization rate has steadily increased over the last four years to result in overcrowding that the administration has taken measures, such as moving PreK out of the school, to address. Parkway’s utilization has steadily decreased such that it is currently operating at 77% capacity this year. These issues, identified from observable data, are the reasons for the Greenwich Board of Ed to consider alternatives. Five- to ten-year enrollment projections serve to explain whether and the degree to which these trends can be expected to continue, and assist in planning efforts. Enrollment projections alone do not represent the fundamental reason for any alternative action.
Sensitivity analysis on birth rates and kindergarten enrollments:
The birth data used in the first five years of all of the enrollment projections is actual, observed data recorded by the Ct Department of Public Health from 2008 to 2012. The correlation coefficient between town births and districtwide K is 0.593, indicating a strong relationship between the number of births in Town to the number of Kindergartners that are enrolled five years later. Correlation coefficients at the school district level vary – only Glenville and North Mianus have negative values (Glenville not valid due to renovation project effects), and the highest values are at North Street and Hamilton Avenue (0.762 and 0.670). Birth-K persistency ratios are a standard means of projecting kindergarten enrollments. The cohort-survival method relies on recent observed data and is a data-responsive model for providing grade-level projections.
Table with multi-year projections by school, min/max projections, standard deviations and facility capacity number:
All of this data has been provided in the Existing Conditions Analysis and Elementary School Persistency Ratios presentations. See
http://www.greenwichschools.org/uploaded/district/Board_of_Education/meeting_materials/2012-13_meetings/6-6-13_meeting/6-6-13_BOE_FacUtilRacBal-Options_1PPforBOECopyRev.pdf

Greenwich Public Schools Facility Utilization and Racial Balance
Frequently Asked Questions
6 | P a g e
How can projection model normalize anomalies?
The greater the numbers of observed data points, the greater confidence one can have in enrollment projections; therefore, the districtwide, grade-by-grade enrollment projections are the most reliable. Normalizing individual school projections to the districtwide projections reduces the effects of anomalies in persistency ratios at individual schools by ensuring that the grade cohorts across all schools equal the projected size of the cohort at the district level. In other words, an anomaly cannot send an individual school’s projections so high or so low that it results in a great disparity between the more reliable districtwide projections and the sum of individual school projections.
How can an anomaly or a trend be determined?
An anomaly in persistency ratios can be classified as an unusually high or low number that is substantially different from previous and subsequent years. A trend in persistency ratios is seen through a linear relationship between years of data - whether steady, increasing or decreasing. Since unusual numbers appear in the most recent Greenwich enrollment data, only additional years of data can determine whether these are anomalies or the beginnings of new trends.
What is the impact on middle schools for various options?
The impacts on feeder systems add a level of complexity to alternatives analyses, and will be explored as part of the deeper analysis to be done on the mechanism(s) the Board identifies as potential alternatives.
Option with cross-neighborhood grouping of PreK and K students for racial balance?
The absolute imbalance (difference between school’s percent minority and district’s percent minority for like grades) is >30% for Hamilton Avenue and New Lebanon. The District has 150 PreK students (46% minority) and 696 Kindergarten students (34% minority). The imbalance is so significant that it cannot be numerically overcome by shifting early grades.
What are the current registration numbers for incoming K students by school?
As of June 10th, Kindergarten enrollment was: CC-77, ISD-53, GL-56, HA-42, JC-45, NL-38, NM-54, NS-64, OG-65, PK-36 and RV-80.
What would be the time, cost and logistical challenges to verify the residence of all K-5 students on an annual basis?

Greenwich Public Schools Facility Utilization and Racial Balance
Frequently Asked Questions
7 | P a g e
The residency office currently processes document verification of all students new to the district, students enrolling in Kindergarten, and students moving from eighth to ninth grade, approximately 2,000 students per year. Gr 1 – Gr 5 document verification would add another 3,200 students annually. Assuming that document verification remains a centralized function in order to ensure consistent enforcement, this would require increasing the number of residency clerks and providing additional space for the residency office. Given our experience requiring document verification of students already enrolled in the system (grade eight), follow up is very labor intensive.
In addition to document verification, District uses a computer database developed by Pitney Bowes for Homeland Security to verify the address of every student enrolled in the Greenwich Public Schools and student’s parent or guardian on a monthly basis. This process results in many more investigations and resulting removal of students from the system than the grade eight document verification.
Did the enrollment projections take into account the burgeoning economy in Greenwich and the growing expatriate community?
The two major factors impacting enrollment are the persistence ratio from grade to grade and the birthrate of town residents. The persistence ratio captures the impact of students moving into town, resident students enrolling in private school or leaving the public schools for private school, resident private school students moving to public school, and increases or decreases in housing stock.
The projection methodology employed by Milone and MacBroom starts with the extension of historical trends into the future using grade to grade persistence ratios including a persistence ratio based on the increase or decrease of the birth to Kindergarten cohort. The projection models are then adjusted according to a series of assumptions that could impact the persistence ratios in the future. The assumptions used by Milone and MacBroom based on an analysis of conditions in Greenwich include:
o A constant rate of resident enrollment in private schools of 27%.
o No substantial increases or decreases in housing stock that would impact school enrollment.
o Housing sales continuing below historical averages for the near future
o Variable birthrate depending on the section of town

Greenwich Public Schools Facility Utilization and Racial Balance
Frequently Asked Questions
8 | P a g e
Changes in any of these variables would impact the accuracy of the projections.
For more details regarding projection methodology, see: http://www.greenwichschools.org/uploaded/district/Board_of_Education/meeting_materials/2012-13_meetings/6-6-13_meeting/6-6-13_BOE_FacUtilRacBal-Options_1PPforBOECopyRev.pdf
And
http://www.greenwichschools.org/uploaded/district/Board_of_Education/meeting_materials/2012-13_meetings/5-23-13_meeting/BOE_Exisiting_Conditions_5-23-13_Public_Copy.pdf
Do tuition students substantively impact the persistency ratios and enrollment projection model?
Tuition students are placed in a school only if there is room in a grade without adding another teacher (see class size guidelines question). Once placed, the tuition student becomes part of the persistency ratio for that grade. The enrollment projection assumes that the number and placement of tuition students will continue at historical levels.
What would be the impact if there is a change of the birthday for the start date of incoming Kindergarten class?
The current Kindergarten cohort is comprised of students with fifth birthdays between January 1st and December 31st. If Kindergarteners were required to turn five by September 1st (one of the proposals currently being entertained by the state legislature), enrollment in Kindergarten would dip by one third (or approximately 225 students) in the first year of implementation. In subsequent years, the size of the Kindergarten would return to normal.
How are preschoolers that moved into Greenwich included in the analysis? Birthrates do not capture preschoolers moving into the area.
MM relies on the development of persistency ratios and reported birth data at the address level to generate enrollment projections for each individual school. The birth to Kindergarten cohort persistency ratio does capture in migration and out migration of students enrolled in preschool. For example, if 400 students are born in town in a given year and enrollment five years later in Kindergarten is 500 students, the persistency ratio is 1.25. The net in migration and out migration of students age one to five in this cohort is +100.

Greenwich Public Schools Facility Utilization and Racial Balance
Frequently Asked Questions
9 | P a g e
For the purposes of verifying short term projections, the District collects each fall the number of students enrolled in public and private prekindergarten in town. This information is used to verify the Kindergarten enrollment projection for the following fall. The Connecticut Department of Education also collects enrollment data by town from each of the licensed prekindergarten programs in the state. This data is made available on the CSDE website and is used by the District to monitor trends in prekindergarten enrollment by Greenwich resident students.
Has M&M done any back testing with their forecasting model? If so, what are the results and how do they compare to the actual enrollment figures for the years tested?
Milone & MacBroom has run a correlation analysis on the various models as well as gauging performance by projecting backwards for the last five years. As was evident from the individual school persistency ratios, there was variation from year-to-year and school-by-school. However, the model that exhibited the greatest overall accuracy was the one presented to the BOE in May (3-yr average).
What does the M&M model assume in terms of loss of in-district live births to private schools? Is it the 25% historic rate that you referred to in your comments on 5/30/13 or is it the 32% figure presented on page 27 of the 5/23/13 M&M deck?
This is accounted for in the persistency ratios as part of the in-migration/out-migration.
How many “non-school zone” born students are projected to join each class cohort and what is the timing assumption on when they join the cohort?
Persistency ratios account for in-/out-migration. Vacant residential land is referenced as a model variable on page 25 of the 5/23/13 M&M deck. The 2000-2010 data shows that the school age population in Riverside grew 29% while total number of housing units only increased by 1% during the same time frame.
Is there a difference in the number of children per bedroom in owned versus rented or leased homes?
M&M looked proportionally at owned and rented/leased properties. That is, the analysis reflects the proportion of who own versus rent/lease their residences. We will ask them about the question of size of rental homes (number of rooms), but that question would apply equally to owned homes and is highly subjective (one person's plan for a bedroom could be another person's plan for an office,

Greenwich Public Schools Facility Utilization and Racial Balance
Frequently Asked Questions
10 | P a g e
study or exercise space). The actual number of children born and in residence is a much better predictor of enrollment than number of bedrooms.
How is it possible that there has been a 5% decline in Greenwich students attending our public schools and the relatively flat 1% variance in public school enrollment from year to year?
From 2000 to 2010, enrollment in GPS declined from 8,701 students to 8,609 students (-1.1%). The total number of resident students in Greenwich increased from 11,471 to 11,765 during the same period of time (+2.6%). The percentage of resident students attending the Greenwich Public Schools decreased from 75.9% in 2000 to 73.2% in 2010. The discrepancy in the variance between enrollment decline and decline in the percentage of residents attending GPS is attributable to the overall increase in the number of resident students.
Why does the school district not pursue information regarding Greenwich resident students attending school outside of Connecticut? Inaccuracies in the data on Greenwich resident students can have many intended and unintended consequences: importantly, the composition of those students alone could precipitate the need for "racial balancing", and hence redistricting, that otherwise might not be necessary.
Students enrolled in private schools, whether in Connecticut or out of state, are not included in the calculation of racial balance under the state statute and regulations. Knowing the number and racial/ethnic composition of students enrolled in out of state private schools would not in and of itself change the calculation. Those students would have to leave their private school and enroll in the public school system to be included in the calculation.
What changes to redistricting maps in all of Greenwich have occurred between 1997 and today?
Attendance areas in Greenwich are maintained through a street address list not a map. With the exception of the movement of addresses from the northern section of Old Greenwich and Riverside to create the International School at Dundee attendance area in 2000, there have been no changes that would constitute redistricting. With the advent of the town GIS system in the early 2000’s, the school district did embark on a joint project with Planning and Zoning to verify every residential address on the borders of Greenwich that was entitled under state law to school accommodations. This verification resulted in the addition and deletion of a handful of residential addresses.

Greenwich Public Schools Facility Utilization and Racial Balance
Frequently Asked Questions
11 | P a g e
On what basis are exemptions granted for families to send their children to a school outside of their neighborhood attendance area?
Under Board of Education policy, exemptions are granted by the Superintendent at the request of the parent if the Superintendent deems that “it is the best interests of the child” and there is space available in the requested schools. The Superintendent generally does not grant exemptions to students initially enrolling in the school system. Exemptions are automatic for students moving from fourth to fifth grade or seventh to eighth grade as long as their parents continue to reside in Greenwich. All exemptions are granted for one year and must be renewed annually. Parents are responsible for transporting their children to and from school. In any given year, thirty to forty students are granted one year exemptions.
How much weighting or explanatory power is assigned to vacant land/housing unit increases in the M&M model? In the case of their projections for Riverside School, do the assumptions with regard to these two factors result in a negative impact on the number of students projected? If so, how many fewer students are projected based solely on these two factors?
Riverside, like all individual school projections are driven by the reported births within the attendance zone as well as the persistency ratios (growth factors) which account for externalities such as housing characteristics, residential development, student transfers in and out of system, and student mobility. Milone & MacBroom’s discussion with the Town Planning Department revealed that there are no significant residential developments approved and with so few permitted units for new construction (~60) town-wide, there was no need for localized adjustments.
How might 2013-2014 Kindergarten registrations to date impact the enrollment projection prepared by Milone and MacBroom?
Enrollment projections are an iterative process performed annually at a set point in time. The projections are based in part on actual enrollment reported to the Connecticut State Department of Education on October 1st of each school year. 2013-2014 Kindergarten registrations through June 5th are attached at the end of this FAQ. It is important to note that these numbers may change significantly between now and October 1st, particularly at the Title 1 schools. The attached table (see Appendix: Table 1) also details the number of students whose entry into Kindergarten was delayed for a year. Adding these students to the previous

Greenwich Public Schools Facility Utilization and Racial Balance
Frequently Asked Questions
12 | P a g e
years on time Kindergarten enrollment gives you the size of the Kindergarten cohort for that school year (Riverside 91 students in 2009, 78 students in 2010, 73 students in 2011 and 74 students in 2012).
Question accuracy regarding minority data at Riverside School?
Minority data for students at Riverside School is compiled from the Public School Information System maintained by the Connecticut State Department of Education. Districts are responsible for reporting to the CSDE demographic data collected from a form completed by the parent for each student who registers or withdraws from a school.
When was the last time Riverside School’s enrollment was 350 students?
Since 1962, low enrollment at Riverside School was 368 students in 1990. In 2000, the northern section of the Riverside attendance was redistricted to International School at Dundee. In addition, some students residing in the Riverside attendance area currently attend ISD as magnet students.
When was the last time in 130 years that Riverside School enrollment dropped by 134 students in 4 years?
Riverside enrollment dropped by 143 students from 1977 to 1981.
Explain (a) Why is the projection for Riverside Kindergarten 44 children, when there are already 81 registrations for September of 2013? What does the 81 indicate about the actual enrollment in the fall? (b)Why would you believe these projections when in 2007 New Lebanon enrollment was projected to be 190, for 2013, and is actually 279?
(a) The projection was modelled prior to the availability of complete registration data from the schools for the 2013-2014 school year. As of June 10th, Kindergarten enrollment at Riverside School was 80 students relative to a projection of 63 students for 2013-2014 school year. 22 of those students were eligible to attend Kindergarten during the 2012-2013 school year and were held out by their parents. This is a historically high number and accounts for part of the variance from projection to actual. Based on the registrations to date, it is likely that Kindergarten actual enrollment at Riverside will exceed the projected enrollment in the fall of 2014. It is important to note that the consultant’s model anticipates greater variation from the projection at Riverside than at the other elementary schools (see slide 28 in the Elementary School Persistence Ratio presentation):

Greenwich Public Schools Facility Utilization and Racial Balance
Frequently Asked Questions
13 | P a g e
http://www.greenwichschools.org/uploaded/district/Board_of_Education/meeting_materials/2012-13_meetings/6-6-13_meeting/6-6-13_BOE_FacUtilRacBal-Options_1PPforBOECopyRev.pdf
(b) The five year enrollment projection for New Lebanon School, completed in 2007, was done by the District administrative staff using a model based solely on historical persistency ratios. In 2007, enrollment at New Lebanon had been declining for seven years and the 2013 enrollment was projected by extending this trend in to the future. The enrollment projections prepared by M&M are more sophisticated and anticipate changes in enrollment patterns by considering birthrates, construction of new housing, and housing sales as well as persistency ratios (in and out migration) and historical trends.
It is very important that Riverside children can walk to school. Is there any other community with so many bike riders?
Other elementary schools with substantial numbers of students living within walking (or riding) distance include New Lebanon, Hamilton Avenue, Julian Curtiss, Old Greenwich, Cos Cob and North Mianus. New Lebanon is the only elementary school in the District where all students walk to school (no students are provided with bus transportation).
Why is New Lebanon enrollment increasing even though there is no new housing being built?
Given the lack of new housing and the decline of housing sales in the attendance area, the increase is tied to a large increase in the birthrate and the turnover in rental units where a family without children is replaced by a family with children. The rental market has been more volatile in recent years than house or condo sales.
Approaches to Resolving Facility Utilization and Racial Balance Issues
How have other communities addressed this issue? What did they decide to do? What have been the long term repercussions?
The approaches prepared by Milone and MacBroom which were presented on June 6th are a comprehensive list of the ways other communities address the issues of racial imbalance and facility utilization. Each approach has been used successfully in another district. Note that the approaches are examples of how

Greenwich Public Schools Facility Utilization and Racial Balance
Frequently Asked Questions
14 | P a g e
an option would be developed within the context of enrollment trends specific in Greenwich and not a final plan. How an approach is developed into a plan is dependent upon stakeholder input and the unique demography and topography of the community.
How have other Connecticut communities addressed racial balance?
Other communities have used a combination of redistricting, choice programs, relocating prekindergarten, closing schools and building new schools (see Appendix: Table 2).
Is it possible to address the facility utilization issue by raising class size?
See attached analysis (Appendix: Table 3a) that applies the current elementary class size guidelines to projected enrollment to determine the number of sections required at each school. It is assumed that optimal facility utilization would include one classroom in each building as a contingency against variations in actual enrollment from the projected enrollment. The second table (Appendix: Table 3b) increases the current maximum class size guidelines by three students per class. Note that this increase does not address the facility utilization issue at New Lebanon.
Do any of these options address the goal of academic achievement? How did the options that were employed by other districts impact student achievement? Do you have data available that shows busing children for the purpose of racial balance closes the achievement gap? Does attending a racially imbalanced school negatively impact the achievement of African American students, Hispanic students and/or students qualifying for free or reduced price lunch?
There is a considerable body of education research concluding that isolation of African American students, Hispanic students or students qualifying for free or reduced price lunch correlates with lower academic achievement. One such research study is described by economist Richard Rothstein: “Officials in Montgomery County, Maryland, recently sponsored a sophisticated experiment to test the effects of integration. The county purchased apartments in suburban Washington, DC, and designated them for families eligible for public housing. Those who attended neighborhood schools in which fewer than 20 percent of the students came from low-income families significantly outperformed similar children who attended schools with greater proportions of low-income students. As the share of children from low-income families increased, the advantage diminished, disappearing when 35 percent or more of students came from low-

Greenwich Public Schools Facility Utilization and Racial Balance
Frequently Asked Questions
15 | P a g e
income families. The benefits of integration alone were greater than the benefits of attending a school that was not integrated but that received substantial additional resources to compensate for children’s poverty.” (2013-03-13). Closing the Opportunity Gap: What America Must Do to Give Every Child an Even Chance (Kindle Locations 1423-1431). Oxford University Press, USA. Kindle Edition.
It is important to note that conditions in Greenwich differ from those on the national or state levels. The academic achievement of Hispanic students and students qualifying for free or reduced price lunch exceeds the state average and is comparable with District Reference Group B (districts with a socio-economic profile similar to Greenwich). The percentage of Hispanic students in Greenwich qualifying for free or reduced price lunch is significantly below the state average. Greenwich has among the highest per pupil expenditures in Connecticut and spends even more for additional support staffing (reading specialists, ESOL teachers) in elementary schools with high concentrations of low performing students. In addition, teachers in Greenwich are among the most highly compensated and qualified in Connecticut. However, there is still a considerable gap in academic achievement in Greenwich by both race/ethnicity and free or reduced price lunch status.
Appendix: Tables 4a, 4b and 4c describe differences in performance of Greenwich students in racially balanced schools and racially imbalanced schools disaggregated by race and free or reduced price lunch status. Racially imbalanced schools include Hamilton Avenue and New Lebanon; the remaining nine elementary schools are group together as racially balanced. Observations from the data:
o Students attending racially balanced schools are more likely to score at the advanced, mastery and proficient levels in reading, writing and mathematics than students attending racially imbalanced schools.
o African American and Hispanic students attending racially imbalanced schools are more likely to score at the advanced level and less likely to score at the mastery or proficient levels in reading, writing and mathematics than students attending racially balanced schools.
o Students qualifying for free or reduced price lunch attending racially imbalanced schools are more likely to score at the advanced level and equally likely to score at the mastery or proficient levels in reading, writing and mathematics than students attending racially balanced schools.

Greenwich Public Schools Facility Utilization and Racial Balance
Frequently Asked Questions
16 | P a g e
o Over the last six years, the academic performance of students qualifying for free or reduced price lunch has improved at a greater rate in racially balance schools as compared to racially imbalanced schools.
These discrepancies in student performance require further study and analysis regardless of the District plan to address racial imbalance.
In Milone & MacBroom’s experience have they ever done anything but help implement redistricting? What anecdotal information can you offer that Milone & MacBroom’s work has led to a success in other school systems?
Redistricting is only one approach to addressing racial balance and facility utilization issues. Other approaches were outlined at the June 6th Board of Education meeting. Milone and MacBroom have partnered with many Connecticut districts around issues of racial balance, planning for growing or declining enrollment and balancing facility utilization across schools. A partial list of districts Milone and MacBroom have worked with is on slide 2 of the following presentation:
http://www.greenwichschools.org/uploaded/district/Board_of_Education/meeting_materials/2012-13_meetings/6-6-13_meeting/6-6-13_BOE_FacUtilRacBal-Options_1PPforBOECopyRev.pdf
At the May 23 meeting it was stated that busing is one of the least desirable approaches. If you believe that, what are our other options?
Every district sets attendance areas and busing regulations stipulating the distance a student must live from a school to qualify for transportation. The issue before the community is not bussing, but how to resolve imbalances in the use of facilities and the minority enrollment by school that have developed over a period of time as the demographics of Greenwich have changed. There are two basic approaches: involuntary movement of students from school to school as a result of redistricting or voluntary movement based on choice programs such as magnet schools. It is important to note that even choice programs may require some redistricting of students in order to create a sufficient number of seats in choice schools.
Apparently Magnet Schools worked for a few years to address capacity as well as racial balance. What is or has been done to determine why they worked, when they did, and what has caused them to no longer to work?

Greenwich Public Schools Facility Utilization and Racial Balance
Frequently Asked Questions
17 | P a g e
The magnet program worked successfully to address facility utilization issues in the eastern end of town (ISD) and racial balance issues at Julian Curtiss (aided by changing demographics within the attendance area).
The magnet program has been less successful at achieving racial balance at New Lebanon or Hamilton Avenue. When New Lebanon and Hamilton Avenue were reconstituted as magnet schools, enrollment was declining within their attendance areas, and there were a sufficient number of magnet seats to potentially achieve racial balance within the definition of the state statute. A number of factors combined to limit the success of the Hamilton Avenue and New Lebanon magnets: 1) enrollment began to grow within the school attendance areas limiting the number of magnet seats and 2) minority enrollment growth within the HA and NL attendance areas was higher than the district average making it impossible to achieve racial balance given the reduction in magnet seats. In addition, the magnet theme at Hamilton Avenue was designed around the needs of students in the local attendance area (reduced class size in K and Gr 1, Suzuki music program, prekindergarten) rather than to attract parents and students from outside of the attendance area. Finally, the lack of transportation for magnet students probably limited the viability of the magnet program for families who could not transport their children to and from school.
Riverside School does not have a facility utilization or racial balance issue. Why will changes be made to neighborhood schools that are not FU or RB challenged?
Riverside is part of a network of elementary schools within a larger school district. Facility utilization or racial balance issues in other schools may require changes at Riverside as part of a community solution.
Will only the elementary schools be impacted by these decisions? Has the BOE considered the impact of any decision on the middle schools? What is the impact on middle schools for the various options?
The middle schools will be directly impacted by changes in facility utilization or the minority composition of their feeder schools. Each of the approaches presented on June 6th will serve to better balance both facility utilization and racial balance at the three middle schools.
Has anyone considered zip codes/areas of town as a means of redistricting? A street by street approach would divide neighborhoods.

Greenwich Public Schools Facility Utilization and Racial Balance
Frequently Asked Questions
18 | P a g e
If redistricting is selected as a viable approach to resolving facility utilization and racial balance issues in Greenwich, it will be done with a sensitivity to the topography and demography of the community by clustering groups of homes into “natural neighborhoods.” It is important to note that redistricting option A and option B presented on June 6th were for the purpose of describing the potential impact of redistricting and are not a final redistricting plan that would incorporate the “natural neighborhood” approach.
Given that prek-5 elementary schools are distinguished from K-5 elementary schools, couldn't one alternative solution be to place all sections of Pre-K at New Lebanon and Hamilton and convert all other elementary schools to K-5? Then, NL and Hamilton Avenue are only compared against one another and everyone is in compliance.
This proposal will not meet the standard of the State Law and Regulation. For the purposes of determining racial balance, each school's racial mix is compared to the district average for like grades; the comparison is not school to school. PreK-5 schools are compared to the district PreK-5 average; K-5 schools are compared to the district K-5 average. NL and HA would still be compared to the district racial average for Pre-K-5, they could not be compared only to each other. We know from our current enrollment records that NL and HA would be well outside the compliance band (e.g. no more than 25 percentage point variation from the district average) with PreK-5 or K-5 comparisons to district average. Even if just the NL and HA PreK (one grade) averages matched the district PreK average, the other six grades in the calculation (K-5) would result in NL and HA being in a markedly imbalanced situation.
What about a possible PreK – K pairing? (Option 4)?
A district wide PreK-K pairing would require space for forty seven sections in two buildings with oversize classrooms all on the ground floor as required by the fire code. No two elementary buildings in Greenwich meet this specification (North Street and Parkway come close).
Is there an option that would address our objectives using a dedicated Pre-K center as part of the model?
There are currently eleven sections of Pre-Kindergarten spread across five schools. New Lebanon would be the most appropriate building for a Pre-K center given its small size (14 available classrooms) and the location of all classrooms on the ground floor. The disadvantages to a New Lebanon Pre-K center include transporting the special needs students enrolled in Pre-K

Greenwich Public Schools Facility Utilization and Racial Balance
Frequently Asked Questions
19 | P a g e
significantly longer distances, eliminating New Lebanon as a neighborhood K-5 school, and redistricting the student population of New Lebanon to other elementary schools. If this were done as part of a racial balance plan, it is possible that the plan would not be accepted as it would disproportionately impact minority students (Regulations of Connecticut State Agencies, Sec. 10-226e-5-c-1)
Why wasn't a model with Intermediate (4 & 5th grades) considered and proposed? Converting 3 of our current elementary schools to 3 Intermediate Schools would limit the effect on neighborhood schools and provide better curriculum alignment across the district as well as cost efficiencies. Parents would be more willing to bus an older child to a school within their "cluster,” especially if there were advantages like improved curriculum delivery since there would be less variation per school. Is there a possible option that would address our objectives using only grade reorganization?
Option 4 combines grade reorganization with the pairing of schools. The assumption behind this option is to pair the schools according to two parameters, facility utilization and minority enrollment, within the constraints of facility size and location. An option that created three Gr 4 – Gr 5 intermediate schools would require the conversion of three K – 5 schools and the relocation of students attending those schools to the remaining eight reconfigured K – Gr 3 schools. This would entail a considerable amount of redistricting to ensure both optimal facility utilization and racial balance. This variation on option 4 could be pursued further over the summer depending on the outcome of the June 20th Board meeting.
Options that would address enrollment issues only?
One of the guiding principles driving this effort is to “operate the school system as efficiently as possible,” which entails striving for more equal utilization rates across the District’s elementary schools. The Board and District presented the consultant with a targeted utilization rate of 95% for the District and its schools. When the current utilization rates vary from 77% (Parkway with PreK classes) to 104% (ISD and North Mianus), a significant shifting of students must occur in order to even approach the targeted 95% utilization rate across all schools. This target underpins all of the alternative options presented to the Board.
Both of the full redistricting scenarios improve facility utilization rates to increase system efficiency by better balancing enrollments. Given the criteria that schools districts maintain contiguous boundaries, the number of students moved to achieve enrollment balancing is compounded. In order to shift 70+ students into Parkway, one can only pull from Glenville or North Street. Glenville is currently

Greenwich Public Schools Facility Utilization and Racial Balance
Frequently Asked Questions
20 | P a g e
operating at 95% capacity, while North Street is operating at 86%; therefore, any student pulled out of those two districts must be replaced from other districts, which in turn effects those districts’ utilization rates. Scenario A did not achieve racial balance, but did result in utilization rates ranging from 88% to 102%, with eight out of the eleven elementary schools operating at 90-100% capacity for the 2012-13 year. Scenario B improved facility utilization rates to range from 89% to 104%.
Enrollment balancing was also a primary consideration in all other options presented. Due to the location of the District’s smallest facilities, the location of facilities with the greatest excess capacity and demographic patterns, enrollment balancing to a targeted 95% utilization rate, regardless of racial balancing, would require a significant movement of students.
How confident can we be that an option relying only on choice (i.e., magnets) will address the overcrowding issues at New Lebanon and other schools?
The chances that a choice option will improve facility utilization or racial balance are dependent upon the constraints placed on that choice, the attractiveness of the magnet theme to parents and students residing outside of the school attendance area, the ancillary programs (prekindergarten, extended day, etc.) provided by the school, the number of magnet seats available and the provision of transportation for magnet students. It is important to note that since this approach depends on voluntary movement of students from their home attendance area to a magnet school, there is no guarantee that facility utilization or racial balance issues will be addressed.
Option #3 include a significant amount of students who would not be able to attend their neighborhood school. What are ways to eliminate this impact? Can you show what this option looks like with shrinking the attendance zone of the magnet school so that the magnet have enough room to accept other students but each house is assigned to a school?
Shrinking the attendance zone of magnet schools would entail reassigning students in each of the magnet schools to a new home school (redistricting). The impact would essentially be the same as that presented in option 3. Magnet schools will not work unless there are a sufficient number of magnet seats available to redistribute students voluntarily (see the experience at Hamilton Avenue and New Lebanon described above).
Provide a list of the other issues the Board would need to consider in establishing a successful magnet. Some of these are transportation, theme, rules regarding

Greenwich Public Schools Facility Utilization and Racial Balance
Frequently Asked Questions
21 | P a g e
acceptance criteria (e.g., priority neighborhoods, schools, FRL, grades, etc.), "sick bus", other services, staff training, etc.
Description o Redistribute students across attendance areas through a voluntary
application process where parents are provided with an opportunity to send their child to either a neighborhood school or a theme-based magnet school (e.g. I.B., S.T.E.M., Arts, and Foreign Language Immersion).
o Full magnets do not have attendance areas and draw all of their students through the application/lottery process (would require extensive redistricting in Greenwich)
o Partial magnets fill the available seats in a “neighborhood school” after all of the students living in the attendance area have been accommodated (current model)
Related Costs o Demographic, enrollment and facility consulting o theme exploration and development o theme based staffing o theme based equipment and/or instructional materials o accreditation fees o professional learning o management of marketing and application process o extended school day o transportation
Impact on Racial Balance o since movement to a magnet school is voluntary and selection is not based
on race, possibilities range from improving racial balance to increasing racial imbalance
o current magnet plan “weights” the chances of students by the demographics of their home attendance area and the “probability” that an applicant from that attendance area will improve the racial balance of the magnet school
Impact on Student Learning o dependent on the focus of the magnet theme and its implementation o many magnet themes seek to engage students in interdisciplinary, higher
order critical thinking that is aligned with Common Core standards or the District Vision of the Graduate but will not necessarily be measured by current mandated assessments
Pros o movement is voluntary

Greenwich Public Schools Facility Utilization and Racial Balance
Frequently Asked Questions
22 | P a g e
o provides parents with choice (neighborhood versus magnet) o entails minimal or no redistricting o depending on how magnet schools are implemented, protects the concept of
traditional neighborhood schools o potential to create “schools of innovation” where instructional approaches and
frameworks can be piloted and evaluated before being implemented across the entire district
Cons o no guarantee that a magnet program will improve racial balance o in partial magnet schools, increased enrollment within the neighborhood
attendance area decreases available magnet seats o depending on the magnet theme, the costs can be significant compared to the
other options o extended period of time is required to develop and implement a new magnet
school o could create the perception of inequality between magnet and non-magnet
schools (per pupil expenditure, special programs or additional educational opportunities)
o If magnet program is superior, why is it not being implemented across the entire district?
o Full magnets potentially undermine community agency support and partnerships with schools (may eliminate schools as neighborhood centers and partners)
Glenville is a neighborhood school. Why is Glenville a magnet school in Option4?
Glenville is designated as a magnet school in option 4 for the purpose of illustrating how paired schools would work. This option depends on the pairing of dissimilar schools (high utilization / low utilization, high minority / low minority) and a magnet school in each cluster to work. Given the high facility utilization and minority enrollment at Hamilton Avenue and New Lebanon, these schools need to be paired with schools with lower facility utilization and minority enrollment. Glenville becomes the best option for the cluster magnet school. This would help control growing enrollment within the Glenville attendance area but would necessitate the reassignment of Glenville students to other schools (with the possibility of returning as magnet students).
If HAS lost magnet status, would it lose funding?

Greenwich Public Schools Facility Utilization and Racial Balance
Frequently Asked Questions
23 | P a g e
If and when any magnet school loses its magnet status, the Board of Education would consider whether or not to continue funding theme features at that school.
Is there a possibility of a phase-in in the case of redistricting? Will grandfathering be considered?
The final plan for any of the approaches could include “grandfathering” or phasing in changes over time. Phasing in a plan by exempting students currently enrolled in a school (“grandfathering”) slows its impact which might mean that a facility utilization issue is not addressed in time to prevent overcrowding. It could also result in the children from the same family attending different elementary schools.

Greenwich Public SchoolsKindergarten Entry Age
School Delay Policy % Delay Delay Policy % Delay Delay Policy % Delay Delay Policy % Delay Delay Policy % Delay
CC 9 45 16.7% 6 64 8.6% 5 57 8.1% 12 82 12.8% 6 71 7.8%
GL 1 56 1.8% 5 76 6.2% 1 64 1.5% 10 76 11.6% 8 48 14.3%
HA 1 78 1.3% 1 64 1.5% 6 56 9.7% 1 54 1.8% 1 40 2.4%
ISD 5 54 8.5% 2 51 3.8% 9 52 14.8% 10 51 16.4% 3 51 5.6%
JC 6 55 9.8% 6 48 11.1% 10 55 15.4% 8 46 14.8% 3 41 6.8%
NL 4 31 11.4% 3 36 7.7% 0 42 0.0% 1 42 2.3% 1 36 2.7%
NM 9 71 11.3% 6 61 9.0% 15 56 21.1% 16 68 19.0% 5 48 9.4%
NS 9 63 12.5% 13 60 17.8% 15 57 20.8% 8 42 16.0% 15 48 23.8%
OG 8 64 11.1% 7 59 10.6% 15 43 25.9% 9 54 14.3% 7 58 10.8%
PK 3 42 6.7% 7 34 17.1% 4 24 14.3% 12 30 28.6% 6 30 16.7%
RV 13 69 15.9% 22 64 25.6% 14 61 18.7% 12 52 18.8% 22 59 27.2%
District 68 628 9.8% 78 617 11.2% 94 567 14.2% 99 597 14.2% 77 530 12.7%
2009-2010 2010-2011 2011-2012 2012-2013 2013-2014 (To Date)
6/5/2013 Appendix: Table 1

Plans to Address Racially Imbalanced Schools in Connecticut(Based on March 2012 Enrollment)
District SchoolDistrict % Minority
School % Minority
Absolute Imbalance
Plan to Address Imbalance
Charter Oak Intn'l Acad. 38.12% 76.47% 38.35%
Smith School 38.12% 69.89% 31.77%
New Lebanon 34.14% 71.26% 37.13% To be determined
Hamilton Ave 34.59% 66.99% 32.41% To be determined
Groton Catherine Kolnaski 42.44% 73.53% 31.09%Board of Ed. adopted a redistricting plan early this year to be implemented in 2013-14. The plan shifted boundaries at six of seven elementary schools, and redistricts 370 K-4 students. Allows for expansion of slots for magnet students.
Middletown MacDonough 47.83% 74.05% 26.22%Implemented Bd. of Ed. developed redistricting plan in 2010-11. MacDonough School has become overcrowded since then, and the Board recently approved small redistricting of MacDonough's district to alleviate overcrowding, but it may not address current racial imbalance.
Hamden Church Street School 57.19% 83.29% 26.09%Board of Ed. adopted a "pocket" redistricting plan to move about 40 students from Church Street to Helen Street Schools beginning in 2013-14.
Fairfield* McKinley School 19.00% 43.41% 24.41%Board of Ed. moved preschool at McKinley to Fairfield Warde High School in 2011-12. A plan was adopted this year to open other preschool slots to students from McKinley at Burr and Dwight elementary schools.
Robertson 61.45% 85.07% 23.62%
Verplanck 61.45% 84.55% 23.10%
Bristol** O'Connell 31.80% 59.50% 27.70%As part of a Long Range Facility Plan, consolidated four elementary and one middle school, constructed two new K-8 facilities and underwent system-wide redistricting at elementary and middle school levels. Implemented in 2012-13.
*Fairfield's McKinley not currently imbalanced, but recently was.
** Bristol's O'Connell School is closed, statistics for 2011-12 year.
Source of Balance Data: CT State Department of Education, “2012 Public School Enrollment by Racial Imbalance Categories,” April 4, 2013.
Closed a racially imbalanced elementary school and redistricted in 2012,as well as proactively pocket redistricting small areas to address future imbalances.
Currently in the design process to expand school, which is currently 25% magnet students, to 50% magnet students through a construction project. Fifty of the additional magnet seats will be reserved for Smith School students, in order to free more magnet slots at Smith. Both Charter Oak and Smith have strong IB and STEM magnet programs in place already. PreK classrooms (for 80 PreK slots) will also be added to Charter Oak to increase attractiveness of magnet program.
West Hartford
Manchester
Greenwich
Prepared by Milone and MacBroom June 17, 2013
Appendix: Table 2

Greenwich Public SchoolsRoom Utilization and Average Class Size Based on Current Class Size Guidelines
School Rooms School 2013-14 2014-15 2015-16 2016-17 2017-18 2018-19 2019-20 2020-21 2021-22 2022-23
Cos Cob 23 Cos Cob 0 -1 -2 -1 -1 -1 -1 -1 -1 -1
Glenville 22 Glenville 0 0 -1 0 -1 0 0 0 0 -2
Hamilton Ave 20 Hamilton Ave 0 0 -2 0 2 1 -1 0 0 0
ISD 18 ISD -1 0 0 1 1 1 2 2 1 0
Julian Curtiss 18 Julian Curtiss 0 0 0 -1 -1 -1 0 1 0 0
New Lebanon 14 New Lebanon -1 -3 -4 -4 -4 -3 -4 -4 -4 -4
North Mianus 23 North Mianus 0 -2 -1 0 -1 0 0 0 0 -1
North Street 23 North Street 5 5 6 5 6 7 6 5 5 5
Old Greenwich 23 Old Greenwich 2 5 5 6 6 7 7 6 6 6
Parkway 16 Parkway 5 5 5 6 7 7 7 6 6 6
Riverside 24 Riverside 1 3 5 6 6 6 7 7 7 6
District 224 District 11 12 11 18 20 24 23 22 20 15
Above Contingency 0 1 0 7 9 13 12 11 9 4
Grade Max Size
Kindergarten 21
Grade 1 21
Grade 2 24 School 2013-14 2014-15 2015-16 2016-17 2017-18 2018-19 2019-20 2020-21 2021-22 2022-23
Grade 3 24 Cos Cob 20.2 19.8 19.9 20.9 21.8 21.3 20.7 20.9 21.0 21.0
Grade 4 26 Glenville 19.6 20.4 20.7 20.9 20.3 20.2 20.0 20.3 20.1 18.7
Grade 5 26 Hamilton Ave 17.2 18.1 16.3 18.1 20.1 19.5 18.4 18.8 18.4 18.4
ISD 19.3 19.9 19.0 19.1 18.4 17.6 18.5 18.3 17.2 16.8
Julian Curtiss 19.8 19.9 19.3 19.3 19.1 19.4 20.6 21.9 21.3 20.5
Grade Max Size New Lebanon 18.2 17.6 17.9 17.9 18.1 19.6 18.5 18.0 17.6 17.8
Kindergarten 17 North Mianus 20.9 19.7 20.5 21.0 20.6 21.3 20.9 20.5 20.3 19.9
Grade 1 17 North Street 20.1 19.3 19.3 18.1 19.0 20.8 19.9 18.9 19.4 18.9
Grade 2 24 Old Greenwich 19.0 20.2 20.1 19.8 19.9 20.8 20.1 19.8 19.1 19.6
Grade 3 24 Parkway 19.2 17.1 16.0 15.3 17.5 16.4 16.2 15.1 15.0 15.7
Grade 4 26 Riverside 19.8 19.8 20.5 19.6 19.1 18.8 19.7 20.2 20.3 19.7
Grade 5 26 District 19.4 19.4 19.2 19.4 19.7 19.8 19.6 19.6 19.3 19.0
Average Class Size
Guidelines HA
Available Rooms Available Rooms Relative to Projected Enrollment
Guidelines
Appendix: Table 3a

Greenwich Public SchoolsRoom Utilization and Average Class Size Based on Raising Current Class Size Guidelines by 3 Students per Class
School Rooms School 2013-14 2014-15 2015-16 2016-17 2017-18 2018-19 2019-20 2020-21 2021-22 2022-23
Cos Cob 23 Cos Cob 2 2 1 0 -1 0 1 1 1 1
Glenville 22 Glenville 2 2 2 3 3 4 4 4 4 4
Hamilton Ave 20 Hamilton Ave 4 3 3 2 2 1 0 1 1 1
ISD 18 ISD 0 0 2 2 3 5 5 4 5 5
Julian Curtiss 18 Julian Curtiss 1 1 1 0 1 1 2 1 0 0
New Lebanon 14 New Lebanon 2 0 0 0 -1 -2 -1 -1 0 -1
North Mianus 23 North Mianus 3 2 1 1 1 0 2 3 2 3
North Street 23 North Street 5 6 8 7 8 8 7 7 7 7
Old Greenwich 23 Old Greenwich 6 6 7 7 7 7 7 6 8 7
Parkway 16 Parkway 5 6 6 7 7 7 8 8 8 8
Riverside 24 Riverside 5 6 6 7 7 8 9 8 7 7
District 224 District 35 34 37 36 37 39 44 42 43 42
Above Contingency 24 23 26 25 26 28 33 31 32 31
Grade Max Size
Kindergarten 24
Grade 1 24
Grade 2 27 School 2013-14 2014-15 2015-16 2016-17 2017-18 2018-19 2019-20 2020-21 2021-22 2022-23
Grade 3 27 Cos Cob 22.1 22.7 22.6 21.8 21.8 22.2 22.6 22.8 22.9 22.9
Grade 4 29 Glenville 21.6 22.5 23.8 24.2 24.5 24.7 24.5 24.8 24.6 24.9
Grade 5 29 Hamilton Ave 21.5 21.2 21.1 20.1 20.1 19.5 19.3 19.8 19.4 19.4
ISD 20.3 19.9 21.4 20.3 20.9 23.0 22.8 20.9 22.5 23.2
Julian Curtiss 20.9 21.1 20.4 20.3 21.4 21.7 23.1 21.9 21.3 20.5
Grade Max Size New Lebanon 22.7 21.4 23.0 23.1 21.7 20.8 22.2 21.6 22.6 21.4
Kindergarten 20 North Mianus 24.0 23.5 22.4 22.0 22.5 21.3 22.9 23.5 22.3 23.9
Grade 1 20 North Street 20.1 20.5 21.8 20.4 21.5 22.2 21.1 21.2 21.9 21.3
Grade 2 27 Old Greenwich 23.5 21.4 22.6 21.1 21.2 20.8 20.1 19.8 21.7 20.8
Grade 3 27 Parkway 19.2 18.8 17.6 17.1 17.5 16.4 18.2 18.9 18.8 19.6
Grade 4 29 Riverside 23.9 23.1 21.6 20.7 20.3 21.2 22.3 21.4 20.3 20.8
Grade 5 29 District 21.9 21.6 21.9 21.2 21.4 21.5 21.9 21.7 21.8 21.8
Guidelines HA
Average Class Size
Available Rooms Available Rooms Relative to Projected Enrollment
Guidelines
Appendix: Table 3b

Greenwich Public SchoolsConnecticut Mastery Test Reading
Disaggregated by Racial Balance Status of Elementary School
All Students
2006-2007 2007-2008 2008-2009 2009-2010 2010-2011 2011-2012
Balanced 1755 1745 1700 1739 1694 1706
Advanced 32.1% 36.8% 36.8% 34.7% 34.4% 39.0%
Mastery 80.8% 80.2% 80.4% 80.7% 80.4% 83.0%
Proficent 89.0% 89.3% 90.4% 90.2% 90.3% 92.0%
Imbalanced 249 242 206 216 258 258
Advanced 14.5% 14.0% 15.0% 12.0% 18.6% 20.2%
Mastery 57.4% 56.2% 58.7% 54.6% 55.4% 62.0%
Proficent 79.1% 74.0% 78.6% 70.8% 70.9% 79.1%
African American and Hispanic Students
2006-2007 2007-2008 2008-2009 2009-2010 2010-2011 2011-2012
Balanced 175 170 177 195 223 218
Advanced 1.4% 1.6% 1.8% 2.0% 2.7% 3.0%
Mastery 56.0% 58.2% 59.3% 58.5% 64.6% 68.3%
Proficent 69.1% 76.5% 76.3% 76.9% 78.0% 83.0%
Imbalanced 117 119 105 116 144 151
Advanced 6.8% 5.9% 6.7% 1.7% 6.9% 11.9%
Mastery 44.4% 42.9% 46.7% 43.1% 43.8% 52.3%
Proficent 71.8% 63.9% 70.5% 61.2% 62.5% 71.5%
Students Qualifying for Free or Reduced Price Lunch
2006-2007 2007-2008 2008-2009 2009-2010 2010-2011 2011-2012
Balanced 85 76 70 94 120 121
Advanced 0.3% 0.3% 0.2% 0.5% 0.6% 1.1%
Mastery 42.4% 38.2% 34.3% 47.9% 48.3% 63.6%
Proficent 51.8% 61.8% 60.0% 68.1% 62.5% 77.7%
Imbalanced 97 99 88 112 135 136
Advanced 7.2% 4.0% 5.7% 3.6% 7.4% 11.0%
Mastery 51.5% 41.4% 46.6% 36.6% 43.7% 49.3%
Proficent 74.2% 68.7% 69.3% 57.1% 62.2% 69.1%
Appendix: Table 4a

Greenwich Public SchoolsConnecticut Mastery Test Writing
Disaggregated by Racial Balance Status of Elementary School
All Students
2006-2007 2007-2008 2008-2009 2009-2010 2010-2011 2011-2012
Balanced 1751 1741 1732 1769 1717 1735
Advanced 43.8% 38.8% 46.0% 42.2% 38.6% 44.1%
Mastery 83.6% 81.0% 85.4% 83.5% 82.1% 84.9%
Proficent 95.1% 94.9% 94.9% 95.5% 94.7% 96.0%
Imbalanced 252 234 234 242 275 286
Advanced 15.5% 12.8% 16.2% 18.6% 17.8% 18.5%
Mastery 65.5% 54.7% 60.3% 61.6% 61.8% 63.3%
Proficent 89.3% 83.3% 82.5% 83.1% 83.3% 85.7%
African American and Hispanic Students
2006-2007 2007-2008 2008-2009 2009-2010 2010-2011 2011-2012
Balanced 174 168 185 206 234 229
Advanced 2.6% 2.3% 3.1% 2.5% 3.1% 3.8%
Mastery 69.5% 63.1% 69.7% 66.0% 64.5% 71.6%
Proficent 89.7% 89.3% 90.3% 87.9% 86.8% 92.1%
Imbalanced 118 115 125 137 156 167
Advanced 5.1% 7.8% 9.6% 11.7% 11.5% 16.8%
Mastery 55.9% 46.1% 53.6% 54.0% 57.1% 58.1%
Proficent 87.3% 79.1% 78.4% 76.6% 80.1% 84.4%
Students Qualifying for Free or Reduced Price Lunch
2006-2007 2007-2008 2008-2009 2009-2010 2010-2011 2011-2012
Balanced 83 75 78 104 130 128
Advanced 0.5% 0.5% 0.4% 0.7% 0.6% 1.8%
Mastery 54.2% 44.0% 47.4% 50.0% 44.6% 63.3%
Proficent 79.5% 81.3% 79.5% 78.8% 75.4% 87.5%
Imbalanced 98 95 106 132 150 156
Advanced 9.2% 5.3% 7.5% 15.2% 10.7% 15.4%
Mastery 59.2% 45.3% 52.8% 52.3% 52.0% 58.3%
Proficent 86.7% 80.0% 77.4% 77.3% 77.3% 80.8%
Appendix: Table 4b

Greenwich Public SchoolsConnecticut Mastery Test Mathematics
Disaggregated by Racial Balance Status of Elementary School
All Students
2006-2007 2007-2008 2008-2009 2009-2010 2010-2011 2011-2012
Balanced 1786 1785 1743 1770 1710 1744
Advanced 45.5% 46.6% 49.1% 47.1% 47.9% 52.6%
Mastery 82.9% 81.8% 83.3% 83.4% 83.4% 86.5%
Proficent 92.6% 93.4% 94.4% 94.6% 95.3% 95.1%
Imbalanced 256 244 215 221 265 271
Advanced 21.5% 14.8% 18.6% 24.4% 25.7% 24.7%
Mastery 67.6% 49.6% 51.2% 59.7% 60.8% 62.7%
Proficent 85.5% 77.5% 76.7% 83.3% 81.9% 84.9%
African American and Hispanic Students
2006-2007 2007-2008 2008-2009 2009-2010 2010-2011 2011-2012
Balanced 178 177 187 208 226 231
Advanced 2.4% 2.5% 2.7% 3.0% 3.6% 4.6%
Mastery 61.8% 62.7% 61.0% 64.9% 65.9% 71.9%
Proficent 80.3% 83.1% 82.9% 84.1% 86.3% 86.6%
Imbalanced 123 122 109 122 150 158
Advanced 12.2% 9.0% 11.9% 12.3% 14.7% 18.4%
Mastery 53.7% 37.7% 43.1% 45.9% 48.0% 53.2%
Proficent 80.5% 68.0% 72.5% 73.0% 73.3% 80.4%
Students Qualifying for Free or Reduced Price Lunch
2006-2007 2007-2008 2008-2009 2009-2010 2010-2011 2011-2012
Balanced 84 79 78 98 122 124
Advanced 0.6% 0.3% 0.5% 0.5% 1.1% 1.8%
Mastery 48.8% 44.3% 43.6% 55.1% 48.4% 61.3%
Proficent 63.1% 73.4% 70.5% 79.6% 81.1% 81.5%
Imbalanced 100 101 92 115 141 144
Advanced 11.0% 7.9% 5.4% 15.7% 13.5% 17.4%
Mastery 60.0% 35.6% 39.1% 49.6% 49.6% 53.5%
Proficent 82.0% 68.3% 68.5% 80.0% 75.9% 81.3%
Appendix: Table 4c