greg oliver queensland department of environment and resource management aneurin hughes cardno a new...
TRANSCRIPT

Greg OliverQueensland Department of Environment and Resource Management
Aneurin HughesCardno
A New Era of Assessment and Engagement:
Achieving Safe Drinking Water in Queensland
Water Safety Conference 2010

A New Era of Assessment and Engagement: Achieving Safe Drinking Water in Queensland
Water Safety ConferenceNovember 2-4 2010, Kuching, Malaysia
• Background - Queensland• Regulatory Framework for Drinking Water Quality• Factors Contributing to Drinking Water Quality• Assessment Process• Findings• Strategies to Address the Challenges

Water Safety ConferenceNovember 2-4 2010, Kuching, Malaysia
Background - Queensland
Pop – 4.4 millionGrowth – 2.6% pa (varies across State – (minus 4% to +5% pa)Large land area67% of population in south east Queensland< 2% of population in western regions

Water Safety ConferenceNovember 2-4 2010, Kuching, Malaysia
Water Safety ConferenceNovember 2-4 2010, Kuching, Malaysia
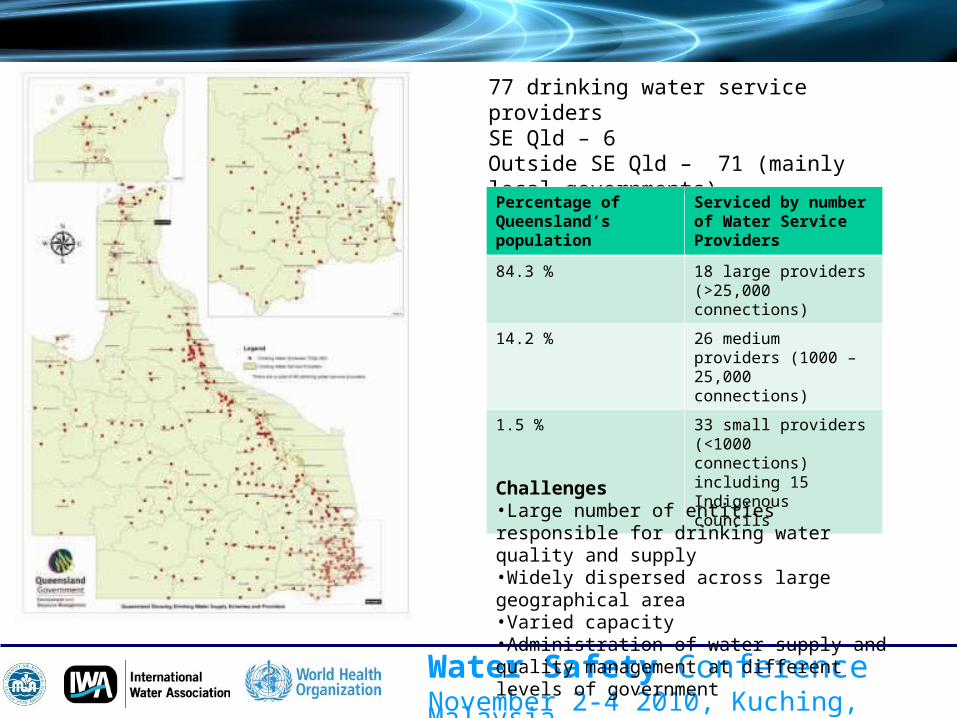
77 drinking water service providersSE Qld – 6Outside SE Qld – 71 (mainly local governments)353 schemesPercentage of Queensland’s population
Serviced by number of Water Service Providers
84.3 % 18 large providers (>25,000 connections)
14.2 % 26 medium providers (1000 – 25,000 connections)
1.5 % 33 small providers (<1000 connections) including 15 Indigenous councils
Challenges•Large number of entities responsible for drinking water quality and supply•Widely dispersed across large geographical area•Varied capacity•Administration of water supply and quality management at different levels of government

Water Safety ConferenceNovember 2-4 2010, Kuching, Malaysia

Water Safety ConferenceNovember 2-4 2010, Kuching, Malaysia
Toowoomba region's water supply at critical level
E. coli found in Longreach water supply
Water is a hot topic…
Water Safety ConferenceNovember 2-4 2010, Kuching, Malaysia
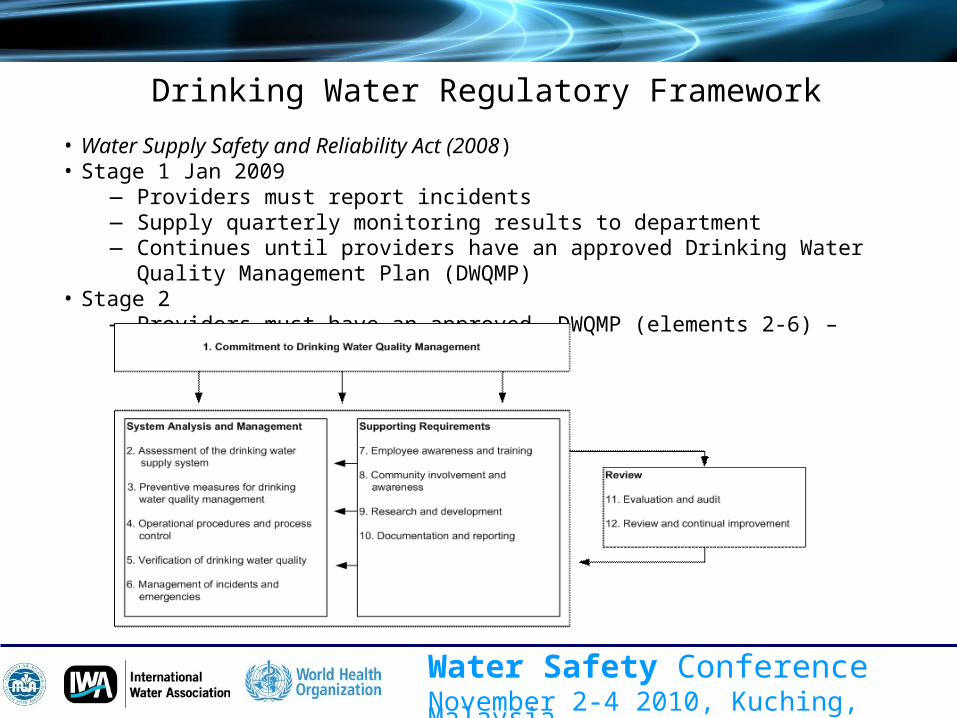
Drinking Water Regulatory Framework
• Water Supply Safety and Reliability Act (2008)• Stage 1 Jan 2009
― Providers must report incidents― Supply quarterly monitoring results to department― Continues until providers have an approved Drinking Water Quality
Management Plan (DWQMP)• Stage 2
― Providers must have an approved DWQMP (elements 2-6) – 1July for large, later for others
Water Safety ConferenceNovember 2-4 2010, Kuching, Malaysia
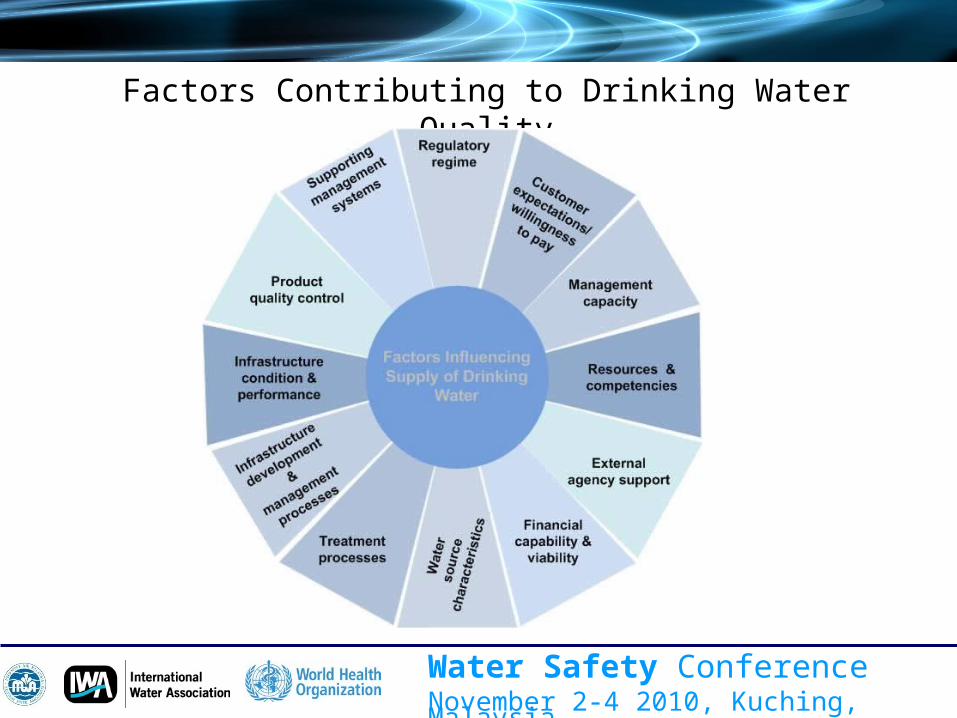
Factors Contributing to Drinking Water Quality
Water Safety ConferenceNovember 2-4 2010, Kuching, Malaysia
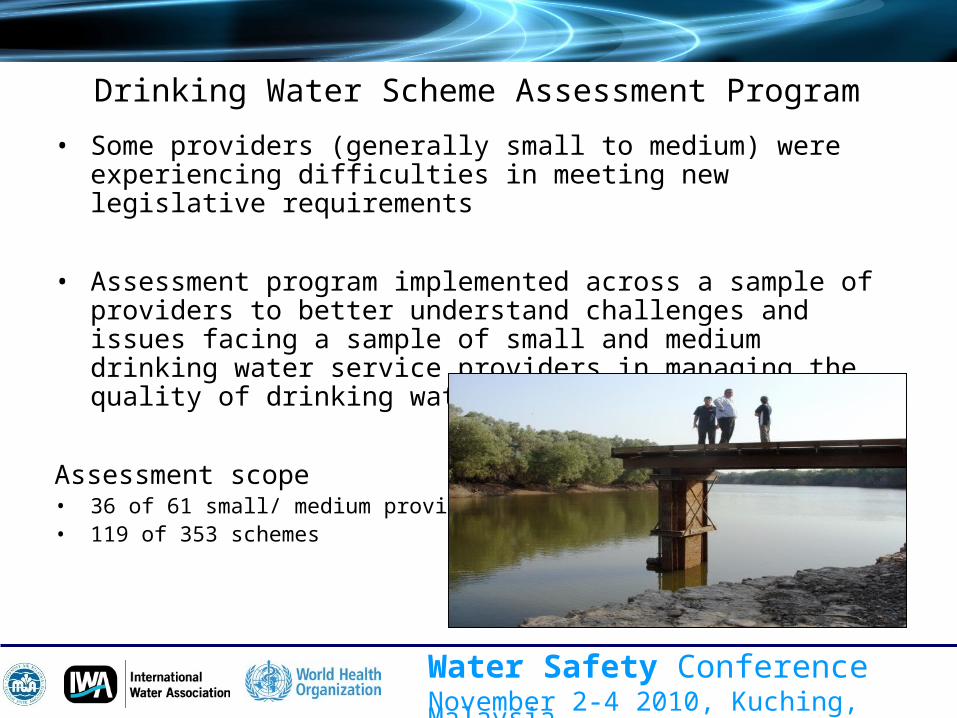
Drinking Water Scheme Assessment Program
• Some providers (generally small to medium) were experiencing difficulties in meeting new legislative requirements
• Assessment program implemented across a sample of providers to better understand challenges and issues facing a sample of small and medium drinking water service providers in managing the quality of drinking water
Assessment scope • 36 of 61 small/ medium providers• 119 of 353 schemes

Water Safety ConferenceNovember 2-4 2010, Kuching, Malaysia
Drinking Water Scheme Assessment Program
• Planning• Survey sheets
– Provider level
– Scheme level• Comprehensive assessment manual developed• All assessors undertook a 2 day training program• Assessment included
― Meeting with providers― Short visit to a sample of schemes and facilities
• Focussed on― Provider management practices― Infrastructure condition― Scheme performance, operation and associated water quality risks― Constraints that limit performance
• Analysis of assessment results and other data• Compile into report• Feedback to providers
Water Safety ConferenceNovember 2-4 2010, Kuching, Malaysia
Findings
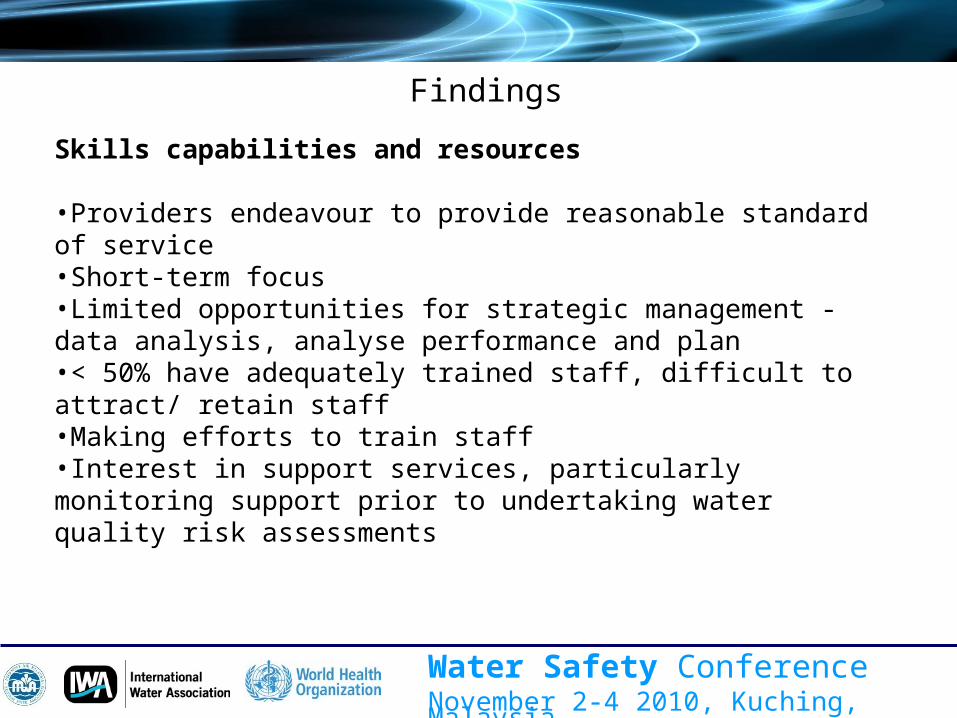
Skills capabilities and resources
•Providers endeavour to provide reasonable standard of service•Short-term focus•Limited opportunities for strategic management - data analysis, analyse performance and plan•< 50% have adequately trained staff, difficult to attract/ retain staff•Making efforts to train staff•Interest in support services, particularly monitoring support prior to undertaking water quality risk assessments
Water Safety ConferenceNovember 2-4 2010, Kuching, Malaysia
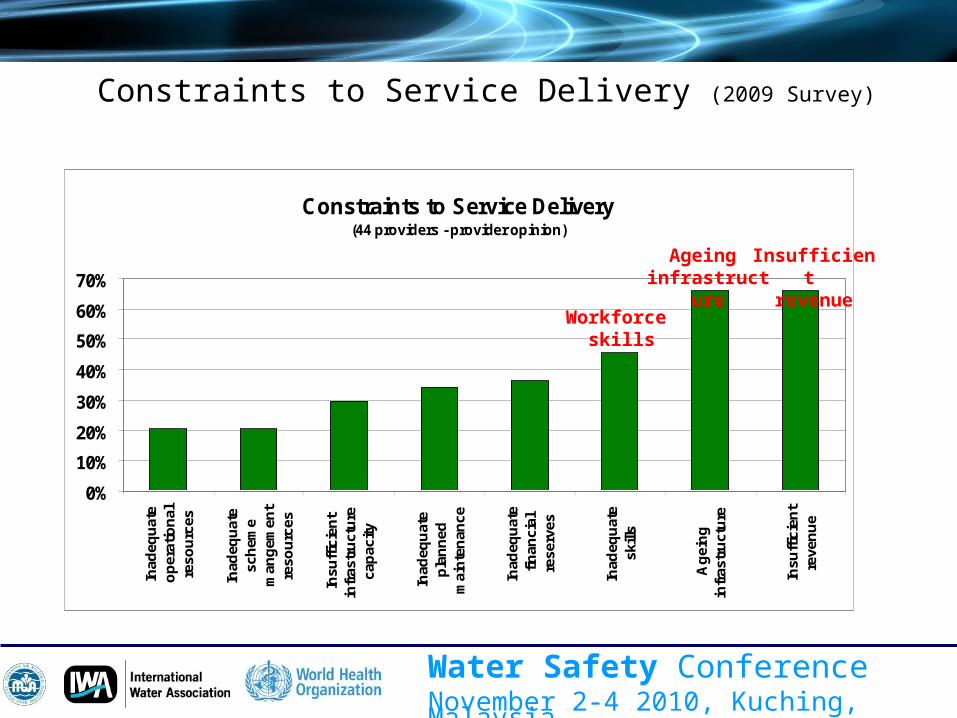
Constraints to Service Delivery (2009 Survey)
Constraints to Service Delivery(44 providers - provider opinion)
0%
10%
20%
30%
40%
50%
60%
70%
Inad
equ
ate
op
erat
ion
alre
sou
rces
Inad
equ
ate
sch
eme
man
gem
ent
reso
urc
es
Insu
ffic
ien
tin
fras
tru
ctu
reca
pac
ity
Inad
equ
ate
pla
nn
edm
ain
ten
ance
Inad
equ
ate
finan
cial
rese
rves
Inad
equ
ate
skill
s
Ag
ein
gin
fras
tru
ctu
re
Insu
ffic
ien
tre
ven
ue
Ageing infrastructure
Insufficient
revenue
Workforce skills

Water Safety ConferenceNovember 2-4 2010, Kuching, Malaysia
Water Sources and Treatment
• Quality - challenges need robust downstream barriers
• Treatment generally adequate – some inappropriate for source
Source water quality problems
0%
5%
10%
15%
20%
25%
30%
35%
40%
45%
Tur
bidi
ty
Iron
/Man
gane
se
Tas
te/o
dour
TD
S
Oth
er
Blu
e-gr
een
alga
e
Bac
teria
l/ pa
thog
enco
ntam
inat
ion
Col
our
Har
dnes
s
Pes
ticid
es/H
erbi
cide
s
Tem
pera
ture
Alg
ae
Wat
erA
ggre
ssiv
enes
s
Flu
orid
e
Low
alk
alin
ity
Hea
vy M
etal
s
Ars
enic
Nitr
ates
Sof
tnes
s
Per
cen
tag
e o
f sc
hem
es

Water Safety ConferenceNovember 2-4 2010, Kuching, Malaysia
Systems and Processes
• Operational practices and supporting systems– Generally informal– Over-reliance on tacit knowledge– Documented operational practices – unavailable or
not used
Water Safety ConferenceNovember 2-4 2010, Kuching, Malaysia
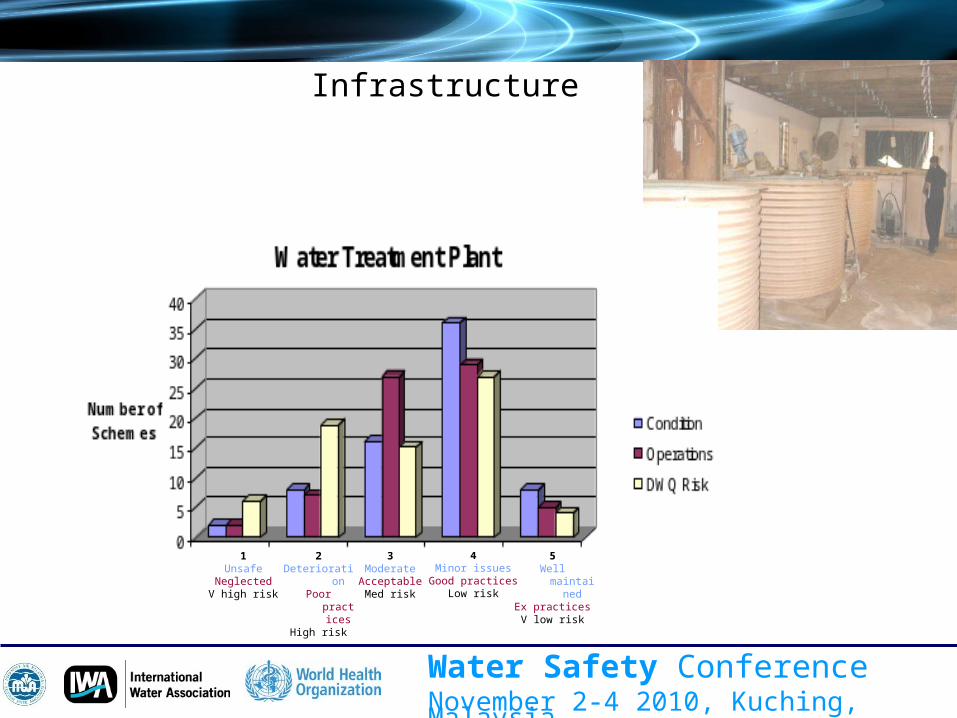
Infrastructure
1Unsafe
NeglectedV high risk
4Minor issues
Good practicesLow risk
5Well maintained
Ex practicesV low risk
3Moderate
AcceptableMed risk
2DeteriorationPoor practices
High risk

Water Safety ConferenceNovember 2-4 2010, Kuching, Malaysia
Facility Evaluation – Reservoirs (1 - poor/high risk to 5 – good/low risk)
Facility evaluation - reservoirs
0
10
20
30
40
50
60
70
1 2 3 4 5
Rating
Nu
mb
er
of
sch
em
es
Condition
Operations
DWQ Risk

Water Safety ConferenceNovember 2-4 2010, Kuching, Malaysia
Main breaks per 100km (average 2002-2007)
R2 = 0.1498
1
10
100
1000
100 1000 10000 100000 1000000
Number of connections
Bre
ak
s p
er
10
0k
m (
log
sc
ale
)
Small WSPs
Medium WSPsLarge WSPs

Water Safety ConferenceNovember 2-4 2010, Kuching, Malaysia
Drinking Water Quality
• Provider perception – high to very high standard 88 % indicated few complaints
• Customer priorities – quantity, reliability, quality – unwilling to pay
• Monitoring programs improve with size• Analysis of data submitted – general compliance with
ADWG – compliance with parameters not monitored?• Increased likelihood of E.Coli with smaller providers• Incident reporting improves with size• Very early stages of developing water quality
management processes

Water Safety ConferenceNovember 2-4 2010, Kuching, Malaysia
Management of Drinking Water Quality
• Surveyed providers - average compliance with elements 2 -6 of ADWG DWQ Framework addressed in DWQMP
Implementation progress average of the overall ratings elements 2 - 6
0%
10%
20%
30%
40%
50%
1 2 3 4 5
Rating
Perc
enta
ge o
f pro
vide
rs
1. Very limited knowledge, understanding of documentation
2. Need for process understood, limited documentation
3. Process development has commenced
4. Process development and documentation substantially completed
5. Process and documentation fully developed and verified

Water Safety ConferenceNovember 2-4 2010, Kuching, Malaysia
Drinking Water Quality – microbiological
Provider Size
Number of providers
reported on E. coli)
Number of schemes
reported on E. coli
Total number of samples
taken
Number of samples
detected E. coli
Percentage of samples
detected E. coli Large 18 101 7,407 9 0.12% Medium 29 176 3,298 33 1.00% Small 26 44 695 23 3.31% Total 73 321 11,400 65 0.57%
Water Safety ConferenceNovember 2-4 2010, Kuching, Malaysia
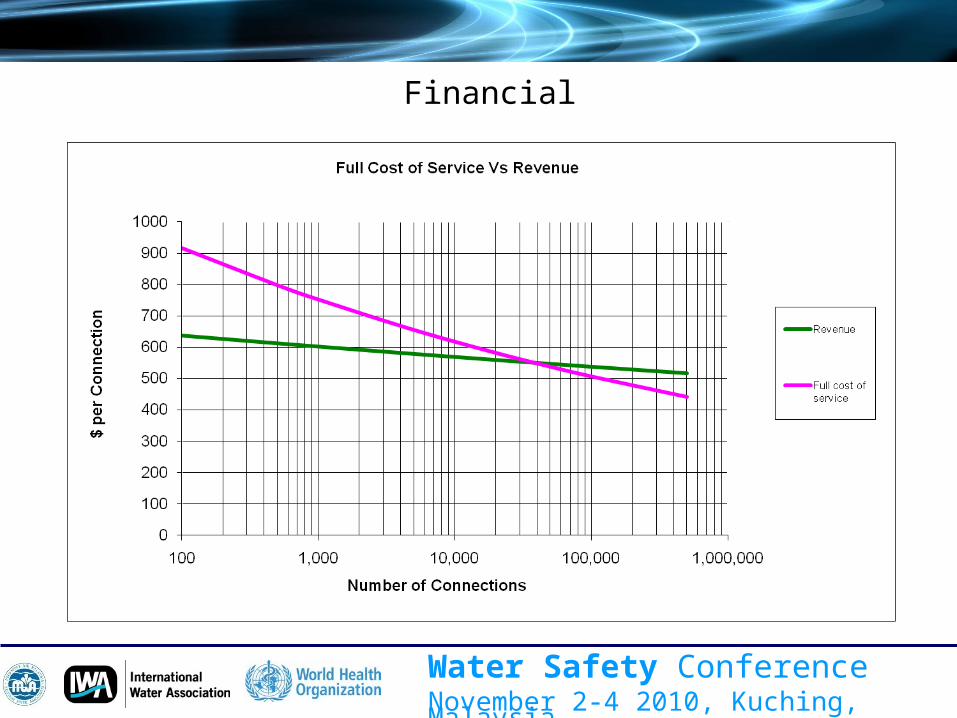
Financial

Water Safety ConferenceNovember 2-4 2010, Kuching, Malaysia
Partnership Approach
Local Governments and Water Service Providers
Water Safety ConferenceNovember 2-4 2010, Kuching, Malaysia
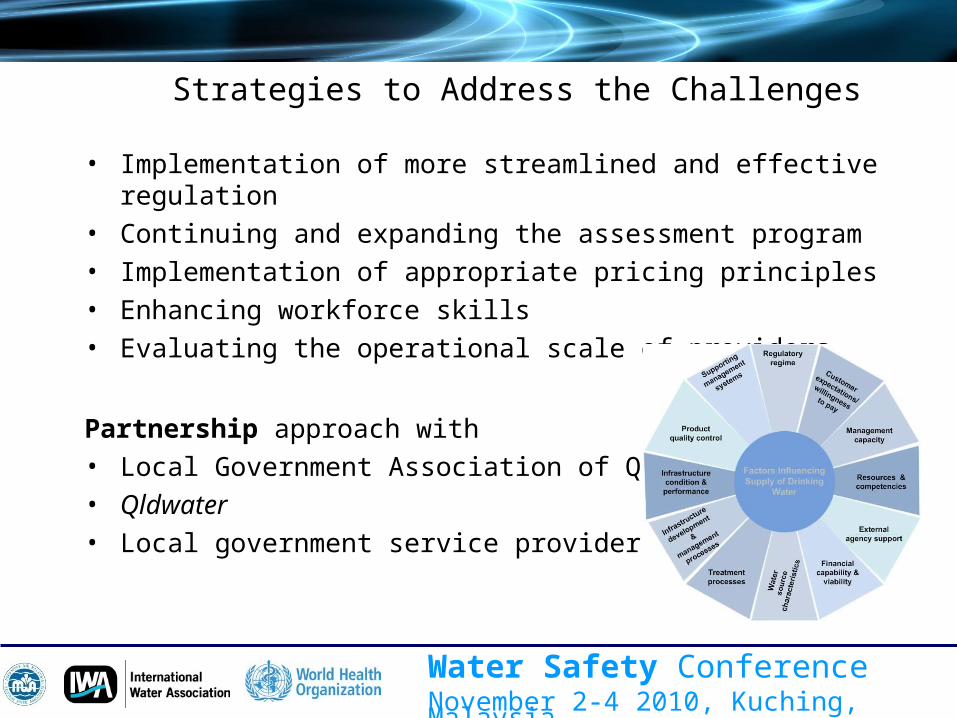
Strategies to Address the Challenges
• Implementation of more streamlined and effective regulation
• Continuing and expanding the assessment program• Implementation of appropriate pricing principles• Enhancing workforce skills• Evaluating the operational scale of providers
Partnership approach with• Local Government Association of Queensland• Qldwater• Local government service providers

Water Safety ConferenceNovember 2-4 2010, Kuching, Malaysia
Strategies to Address the Challenges
Implementation of more streamlined and effective regulation
• Rationalise the regulatory burden on service providers and DERM
• Clear performance objectives and reporting• Roles
– Accountability remains with service providers– State: audits and reports (transparency)
• Three options– Regulated business plan– Regulated performance standards– Combination of above

Water Safety ConferenceNovember 2-4 2010, Kuching, Malaysia
Strategies to Address the Challenges
Continuing and expanding the assessment program
• High level risk assessment of all schemes outside SE Qld• Identify and prioritise risks
– Water source reliability– Drinking water quality– Water & wastewater infrastructure performance, capacity &
reliability
• Will work in partnership with providers to address high risk schemes through a development of Priority Action Plans
Water Safety ConferenceNovember 2-4 2010, Kuching, Malaysia
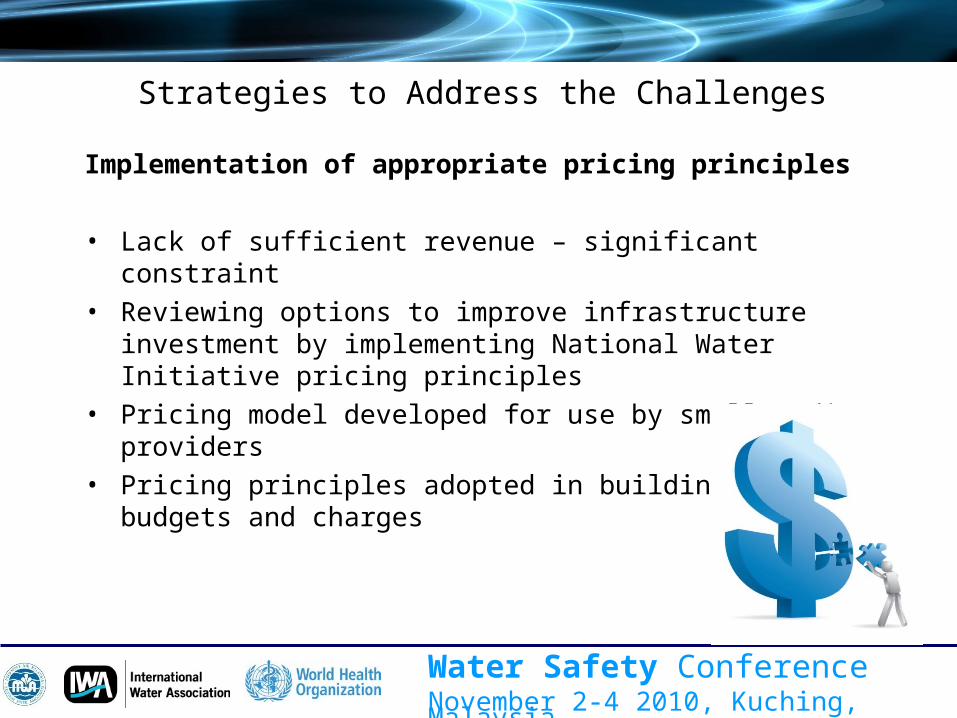
Strategies to Address the Challenges
Implementation of appropriate pricing principles
• Lack of sufficient revenue – significant constraint• Reviewing options to improve infrastructure investment
by implementing National Water Initiative pricing principles
• Pricing model developed for use by small/medium providers
• Pricing principles adopted in building 10 year budgets and charges

Water Safety ConferenceNovember 2-4 2010, Kuching, Malaysia
Strategies to Address the Challenges
Enhancing workforce skills• National Water Skills Strategy• qldwater (with LGAQ) are coordinating and leading the
development of a state-wide water industry Skills Formation Strategy – supported by DERM
• DERM collaborating to provide technical support for training institutions to reflect the needs of water service providers e.g.– water quality and monitoring– asset maintenance– long-term water supply planning
• Investigating the development of minimum mandatory certification requirements for operators

Water Safety ConferenceNovember 2-4 2010, Kuching, Malaysia
Strategies to Address the Challenges
Evaluating the operational scale of providers• Only 2 States in Australia where urban water provided
through local governments• Opportunities for gaining economies of scale• LGs encouraged to seek alternative water service
management arrangements• Some options
– Voluntary binding alliances– LG owned water corporations– Commercialised water businesses within local governments– Staff & skill sharing– Regional groupings of local governments contracting to third
parties
Water Safety ConferenceNovember 2-4 2010, Kuching, Malaysia
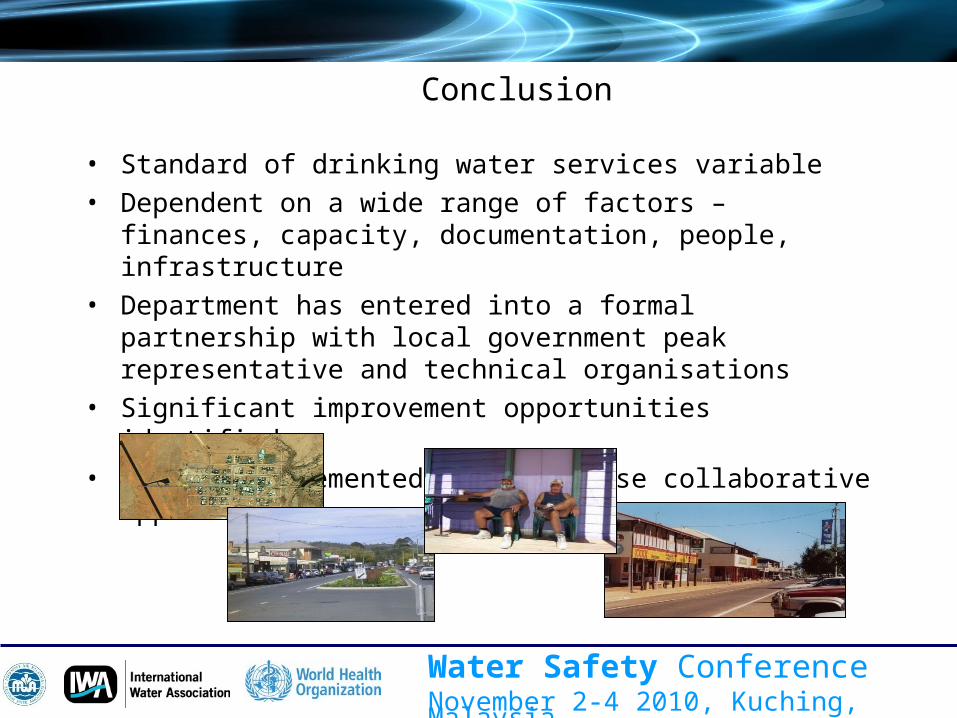
Conclusion
• Standard of drinking water services variable• Dependent on a wide range of factors – finances,
capacity, documentation, people, infrastructure• Department has entered into a formal partnership with
local government peak representative and technical organisations
• Significant improvement opportunities identified• Will be implemented through close collaborative
approach