gregg county - sabine isd - 2002 texas school survey of drug and alcohol use
TRANSCRIPT

8/14/2019 GREGG COUNTY - Sabine ISD - 2002 Texas School Survey of Drug and Alcohol Use
http://slidepdf.com/reader/full/gregg-county-sabine-isd-2002-texas-school-survey-of-drug-and-alcohol-use 1/83

8/14/2019 GREGG COUNTY - Sabine ISD - 2002 Texas School Survey of Drug and Alcohol Use
http://slidepdf.com/reader/full/gregg-county-sabine-isd-2002-texas-school-survey-of-drug-and-alcohol-use 2/83
SabineSpring 2002
________________________________________________________________________________
Table T-1: How recently, if ever, have you used ..
Past School Ever NeverMonth Year Used Used
________________________________________________________________________________Any tobacco product All 18.5% 24.0% 44.3% 55.7%________________________________________________________________________________Cigarettes All 17.8% 22.4% 42.9% 57.1%________________________________________________________________________________Smokeless tobacco All 6.2% 10.5% 17.3% 82.7%
________________________________________________________________________________
Table T-2: How often do you normally use ..
Any tobacco product?
Several Several About About Less Than
Never Every Times Times Once a Once a Once aUsed Day a Week a Month Month Year Year
All 55.8% 5.2% 3.4% 10.9% 6.7% 5.4% 12.6%
Cigarettes?
Several Several About About Less ThanNever Every Times Times Once a Once a Once aUsed Day a Week a Month Month Year Year
All 56.9% 4.8% 3.0% 11.0% 5.9% 5.5% 12.8%
Smokeless tobacco?
Several Several About About Less ThanNever Every Times Times Once a Once a Once a
Used Day a Week a Month Month Year Year
All 81.1% 0.5% 1.4% 4.2% 3.2% 3.6% 6.1%
________________________________________________________________________________
Table T-3: In the past 30 days, how many cigarettes have you smoked?
>1 But >10 But >1 Pack<1 Per <10 Per <1 Pack But <2 >2 Packs
None Day Day Per Day Packs/Day Per Day
All 79.2% 9.2% 8.2% 2.8% * % 0.5%

8/14/2019 GREGG COUNTY - Sabine ISD - 2002 Texas School Survey of Drug and Alcohol Use
http://slidepdf.com/reader/full/gregg-county-sabine-isd-2002-texas-school-survey-of-drug-and-alcohol-use 3/83
SabineSpring 2002
________________________________________________________________________________
Table T-4: Average age of first use of:
All
Tobacco 10.8
________________________________________________________________________________
Table T-5: If you wanted some, how difficult would it be to get...
Cigarettes?
Never Very Somewhat Somewhat VeryHeard Of Impossible Difficult Difficult Easy Easy
All 4.3% 16.1% 8.2% 12.7% 20.6% 38.2%
Smokeless Tobacco?
Never Very Somewhat Somewhat VeryHeard Of Impossible Difficult Difficult Easy Easy
All 18.0% 23.7% 13.0% 6.7% 18.7% 20.0%
________________________________________________________________________________
Table T-6: About how many of your close friends...
Use any tobacco product?
Never heardNone A Few Some Most All
All 34.9% 35.0 % 16.1% 12.5% 1.6%
Smoke cigarettes?
Never heardNone A Few Some Most All
All 36.2% 36.2 % 14.3% 11.7% 1.6%
Use a smokeless tobacco product?
Never heardNone A Few Some Most All
All 64.6% 24.2 % 8.0% 3.2% * %

8/14/2019 GREGG COUNTY - Sabine ISD - 2002 Texas School Survey of Drug and Alcohol Use
http://slidepdf.com/reader/full/gregg-county-sabine-isd-2002-texas-school-survey-of-drug-and-alcohol-use 4/83
SabineSpring 2002
________________________________________________________________________________
Table T-7: How do your parents feel about kids your age smoking cigarettes?
Strongly Mildly Mildly Strongly Don'tDisapprove Disapprove Neither Approve Approve Know
All 71.0% 12.7% 5.9% 1.7% 0.8% 7.9%
________________________________________________________________________________
Table T-8: How dangerous do you think it is for kids your age to use tobacco?
Very Somewhat Not Very Not at All Do NotDangerous Dangerous Dangerous Dangerous Know
All 44.2% 33.4% 13.6% 2.9% 5.9%

8/14/2019 GREGG COUNTY - Sabine ISD - 2002 Texas School Survey of Drug and Alcohol Use
http://slidepdf.com/reader/full/gregg-county-sabine-isd-2002-texas-school-survey-of-drug-and-alcohol-use 5/83
8/14/2019 GREGG COUNTY - Sabine ISD - 2002 Texas School Survey of Drug and Alcohol Use
http://slidepdf.com/reader/full/gregg-county-sabine-isd-2002-texas-school-survey-of-drug-and-alcohol-use 6/83
SabineSpring 2002
________________________________________________________________________________
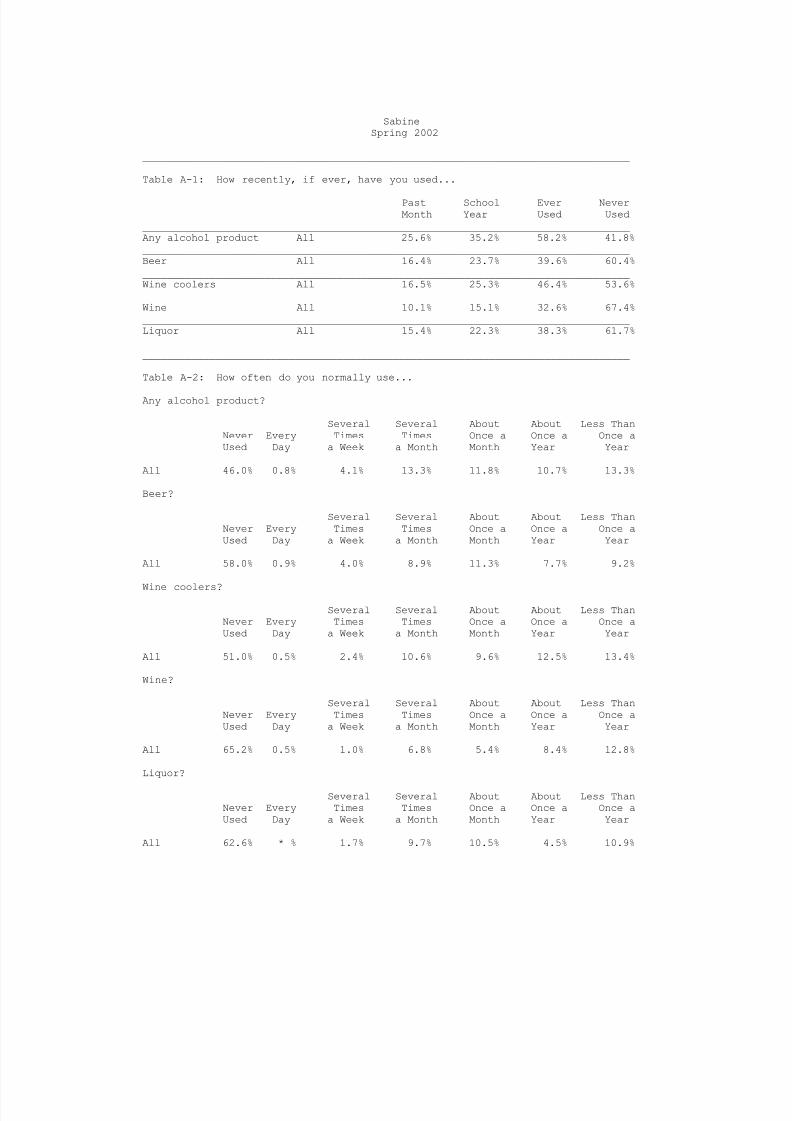
Table A-1: How recently, if ever, have you used...
Past School Ever NeverMonth Year Used Used
________________________________________________________________________________Any alcohol product All 25.6% 35.2% 58.2% 41.8%________________________________________________________________________________Beer All 16.4% 23.7% 39.6% 60.4%________________________________________________________________________________Wine coolers All 16.5% 25.3% 46.4% 53.6%________________________________________________________________________________Wine All 10.1% 15.1% 32.6% 67.4%________________________________________________________________________________Liquor All 15.4% 22.3% 38.3% 61.7%
________________________________________________________________________________
Table A-2: How often do you normally use...
Any alcohol product?
Several Several About About Less ThanNever Every Times Times Once a Once a Once aUsed Day a Week a Month Month Year Year
All 46.0% 0.8% 4.1% 13.3% 11.8% 10.7% 13.3%
Beer?
Several Several About About Less ThanNever Every Times Times Once a Once a Once aUsed Day a Week a Month Month Year Year
All 58.0% 0.9% 4.0% 8.9% 11.3% 7.7% 9.2%
Wine coolers?
Several Several About About Less ThanNever Every Times Times Once a Once a Once aUsed Day a Week a Month Month Year Year
All 51.0% 0.5% 2.4% 10.6% 9.6% 12.5% 13.4%
Wine?
Several Several About About Less ThanNever Every Times Times Once a Once a Once aUsed Day a Week a Month Month Year Year
All 65.2% 0.5% 1.0% 6.8% 5.4% 8.4% 12.8%
Liquor?
Several Several About About Less ThanNever Every Times Times Once a Once a Once aUsed Day a Week a Month Month Year Year
All 62.6% * % 1.7% 9.7% 10.5% 4.5% 10.9%

8/14/2019 GREGG COUNTY - Sabine ISD - 2002 Texas School Survey of Drug and Alcohol Use
http://slidepdf.com/reader/full/gregg-county-sabine-isd-2002-texas-school-survey-of-drug-and-alcohol-use 7/83

8/14/2019 GREGG COUNTY - Sabine ISD - 2002 Texas School Survey of Drug and Alcohol Use
http://slidepdf.com/reader/full/gregg-county-sabine-isd-2002-texas-school-survey-of-drug-and-alcohol-use 8/83
SabineSpring 2002
________________________________________________________________________________
Table A-5: Average age of first use of:
All
Alcohol 11.1Beer 11.3Wine Coolers 11.3Wine 11.8Liquor 11.8
________________________________________________________________________________
Table A-6: If you wanted some, how difficult would it be to get...
Beer?
Never Very Somewhat Somewhat VeryHeard Of Impossible Difficult Difficult Easy Easy
All 5.5% 15.3% 13.1% 11.6% 20.7% 33.8%
Wine coolers?
Never Very Somewhat Somewhat VeryHeard Of Impossible Difficult Difficult Easy Easy
All 6.5% 18.5% 12.0% 15.2% 21.5% 26.3%
Wine?
Never Very Somewhat Somewhat VeryHeard Of Impossible Difficult Difficult Easy Easy
All 6.6% 20.3% 16.7% 14.0% 17.3% 25.1%
Liquor?
Never Very Somewhat Somewhat VeryHeard Of Impossible Difficult Difficult Easy Easy
All 7.0% 24.1% 15.8% 10.8% 18.7% 23.5%
________________________________________________________________________________
Table A-7: Since school began in the fall, on how many days (if any) have you...
Attended class while drunk on alcohol?
None 1-3 Days 4-9 Days 10+ Days
All 91% 6.3% 1.2% 1.3%

8/14/2019 GREGG COUNTY - Sabine ISD - 2002 Texas School Survey of Drug and Alcohol Use
http://slidepdf.com/reader/full/gregg-county-sabine-isd-2002-texas-school-survey-of-drug-and-alcohol-use 9/83
SabineSpring 2002
________________________________________________________________________________
Gotten into trouble with teachers because of your drinking?
None 1-3 Days 4-9 Days 10+ Days
All 100% * % 0.4% * %
________________________________________________________________________________
Table A-8: School year use of alcohol by absences and conduct problems:
Average days absent due to illness or other reasons:
Alcohol Users: 5.2 days per studentAlcohol Non-users: 5.0 days per student
Average days conduct problems reported:
Alcohol Users: 4.3 days per student
Alcohol Non-users: 1.3 days per student
________________________________________________________________________________
Table A-9: During the past twelve months, how many times have you...
Driven a car when you've had a good bit to drink?
None 1-3 Times 4-9 Times 10+ Times
All 93.5% 5.2% * % 1.3%
Gotten into trouble with the police because of drinking?
None 1-3 Times 4-9 Times 10+ Times
All 98.3% 0.8% 0.4% 0.4%
________________________________________________________________________________
Table A-10: About how many of your close friends use...
Any alcohol product?
Never heardNone A Few Some Most All
All 35.2% 26.4 % 17.0% 14.8% 6.6%
Beer?
Never heardNone A Few Some Most All
All 40.8% 24.0 % 18.1% 13.3% 3.8%

8/14/2019 GREGG COUNTY - Sabine ISD - 2002 Texas School Survey of Drug and Alcohol Use
http://slidepdf.com/reader/full/gregg-county-sabine-isd-2002-texas-school-survey-of-drug-and-alcohol-use 10/83

8/14/2019 GREGG COUNTY - Sabine ISD - 2002 Texas School Survey of Drug and Alcohol Use
http://slidepdf.com/reader/full/gregg-county-sabine-isd-2002-texas-school-survey-of-drug-and-alcohol-use 11/83
SabineSpring 2002
________________________________________________________________________________
Table A-13: How often, if ever, do you get alcoholic beverages from..
At home
Do Not Most ofDrink Never Seldom the time Always
All 46.3% 25.9% 16.9% 6.4% 4.4%
From friends
Do Not Most ofDrink Never Seldom the time Always
All 42.9% 17.5% 14.6% 16.7% 8.2%
From a store
Do Not Most ofDrink Never Seldom the time Always
All 44.0% 44.0% 7.5% 3.2% 1.3%
At parties
Do Not Most ofDrink Never Seldom the time Always
All 43.2% 20.2% 14.1% 10.9% 11.6%
Other source
Do Not Most ofDrink Never Seldom the time Always
All 46.0% 19.9% 17.7% 8.8% 7.6%
________________________________________________________________________________
Table A-14: How do your parents feel about kids your age drinking beer?
Strongly Mildly Mildly Strongly Don'tDisapprove Disapprove Neither Approve Approve Know
All 66.3% 14.2% 5.6% 2.2% 1.3% 10.4%
________________________________________________________________________________
Table A-15: How dangerous do you think it is for kids your age to use alcohol?
Very Somewhat Not Very Not at All Do NotDangerous Dangerous Dangerous Dangerous Know
All 46.7% 32.6% 12.9% 2.6% 5.2%

8/14/2019 GREGG COUNTY - Sabine ISD - 2002 Texas School Survey of Drug and Alcohol Use
http://slidepdf.com/reader/full/gregg-county-sabine-isd-2002-texas-school-survey-of-drug-and-alcohol-use 12/83
SabineSpring 2002
________________________________________________________________________________
Table D-1: How recently, if ever, have you used...
Past School Ever NeverMonth Year Used Used
________________________________________________________________________________Marijuana? All 8.1% 13.4% 19.8% 80.2%________________________________________________________________________________Cocaine? All 1.2% 2.0% 3.6% 96.4%________________________________________________________________________________Crack? All 0.5% 1.2% 2.9% 97.1%________________________________________________________________________________Hallucinogens? All 0.4% 1.3% 1.8% 98.2%________________________________________________________________________________Uppers? All 0.8% 2.2% 3.4% 96.6%________________________________________________________________________________Downers? All 1.7% 2.5% 3.3% 96.7%________________________________________________________________________________Rohypnol? All 0.8% 2.0% 4.1% 95.9%
________________________________________________________________________________Steroids? All 0.4% 0.4% 2.1% 97.9%________________________________________________________________________________Ecstasy? All 1.7% 1.7% 2.9% 97.1%________________________________________________________________________________Heroin? All 1.2% 1.6% 2.8% 97.2%
________________________________________________________________________________
Table D-2: How often do you normally use...
Marijuana?
Several Several About About Less ThanNever Every Times Times Once a Once a Once aUsed Day a Week a Month Month Year Year
All 79.3% 1.9% 1.9% 2.9% 3.5% 5.3% 5.1%
Cocaine?
Several Several About About Less ThanNever Every Times Times Once a Once a Once aUsed Day a Week a Month Month Year Year
All 97.5% * % 0.5% 1.0% 0.5% * % 0.5%
Crack?
Several Several About About Less ThanNever Every Times Times Once a Once a Once aUsed Day a Week a Month Month Year Year
All 95.7% * % * % 0.5% 1.4% 0.9% 1.4%

8/14/2019 GREGG COUNTY - Sabine ISD - 2002 Texas School Survey of Drug and Alcohol Use
http://slidepdf.com/reader/full/gregg-county-sabine-isd-2002-texas-school-survey-of-drug-and-alcohol-use 13/83

8/14/2019 GREGG COUNTY - Sabine ISD - 2002 Texas School Survey of Drug and Alcohol Use
http://slidepdf.com/reader/full/gregg-county-sabine-isd-2002-texas-school-survey-of-drug-and-alcohol-use 14/83
SabineSpring 2002
________________________________________________________________________________
Table D-3: Average age of first use of:
All
Marijuana 11.8Cocaine *Crack *Hallucinogens *Uppers *Downers *Rohypnol *Steroids *Ecstasy *Heroin *
________________________________________________________________________________
Table D-4: Age of first use of marijuana by family situation:
Two parent family
Never 9/Under 10-11 12-13 14-15 16-17 18/Over
All 83.6% 0.8% 5.5% 7.0% 3.2% * % * %
Other family situation
Never 9/Under 10-11 12-13 14-15 16-17 18/Over
All 71.8% 7.2% 3.7% 13.6% 3.7% * % * %
________________________________________________________________________________
Table D-5: If you wanted some, how difficult would it be to get..
Marijuana?
Never Very Somewhat Somewhat VeryHeard Of Impossible Difficult Difficult Easy Easy
All 12.0% 38.5% 11.3% 11.3% 13.1% 13.8%
Cocaine?
Never Very Somewhat Somewhat VeryHeard Of Impossible Difficult Difficult Easy Easy
All 14.5% 53.4% 15.9% 6.7% 3.2% 6.4%
Crack?
Never Very Somewhat Somewhat VeryHeard Of Impossible Difficult Difficult Easy Easy
All 15.1% 52.9% 14.8% 7.5% 3.6% 6.1%

8/14/2019 GREGG COUNTY - Sabine ISD - 2002 Texas School Survey of Drug and Alcohol Use
http://slidepdf.com/reader/full/gregg-county-sabine-isd-2002-texas-school-survey-of-drug-and-alcohol-use 15/83
SabineSpring 2002
________________________________________________________________________________
Hallucinogens?
Never Very Somewhat Somewhat VeryHeard Of Impossible Difficult Difficult Easy Easy
All 34.8% 37.7% 15.0% 7.5% 2.1% 2.9%
Uppers?
Never Very Somewhat Somewhat VeryHeard Of Impossible Difficult Difficult Easy Easy
All 47.8% 28.6% 10.2% 5.2% 3.8% 4.4%
Downers?
Never Very Somewhat Somewhat VeryHeard Of Impossible Difficult Difficult Easy Easy
All 44.5% 32.1% 9.8% 5.4% 4.5% 3.7%
Rohypnol?
Never Very Somewhat Somewhat VeryHeard Of Impossible Difficult Difficult Easy Easy
All 43.7% 30.9% 10.2% 5.6% 5.0% 4.4%
Steroids?
Never Very Somewhat Somewhat VeryHeard Of Impossible Difficult Difficult Easy Easy
All 20.0% 46.0% 10.9% 12.4% 5.9% 4.7%
Ecstasy?
Never Very Somewhat Somewhat VeryHeard Of Impossible Difficult Difficult Easy Easy
All 29.0% 44.0% 9.2% 7.5% 4.9% 5.3%
Heroin?
Never Very Somewhat Somewhat VeryHeard Of Impossible Difficult Difficult Easy Easy
All 21.9% 55.0% 9.6% 6.8% 3.9% 2.8%

8/14/2019 GREGG COUNTY - Sabine ISD - 2002 Texas School Survey of Drug and Alcohol Use
http://slidepdf.com/reader/full/gregg-county-sabine-isd-2002-texas-school-survey-of-drug-and-alcohol-use 16/83
SabineSpring 2002
________________________________________________________________________________
Table D-6: Since school began in the fall, on how many days (if any) have you..
Attended class while high from marijuana use?
None 1-3 Days 4-9 Days 10+ Days
All 92% 5.8% 0.8% 1.3%
Attended class while high from use of some other drug?
None 1-3 Days 4-9 Days 10+ Days
All 94% 4.0% * % 1.6%
Gotten into trouble with teachers because of your drug use?
None 1-3 Days 4-9 Days 10+ Days
All 100% * % 0.4% * %
________________________________________________________________________________
Table D-7: School year use of marijuana by absences and conduct problems:
Average days absent due to illness or other reasons:
Marijuana Users: 6.1 days per studentMarijuana Non-users: 4.9 days per student
Average days conduct problems reported:
Marijuana Users: 5.9 days per studentMarijuana Non-users: 1.8 days per student
________________________________________________________________________________
Table D-8: During the past twelve months, how many times have you..
Driven a car when you've felt high from drugs?
None 1-3 Times 4-9 Times 10+ Times
All 93.5% 5.2% * % 1.3%
Gotten into trouble with the police because of drug use?
None 1-3 Times 4-9 Times 10+ Times
All 98.7% 0.8% * % 0.4%

8/14/2019 GREGG COUNTY - Sabine ISD - 2002 Texas School Survey of Drug and Alcohol Use
http://slidepdf.com/reader/full/gregg-county-sabine-isd-2002-texas-school-survey-of-drug-and-alcohol-use 17/83

8/14/2019 GREGG COUNTY - Sabine ISD - 2002 Texas School Survey of Drug and Alcohol Use
http://slidepdf.com/reader/full/gregg-county-sabine-isd-2002-texas-school-survey-of-drug-and-alcohol-use 18/83
SabineSpring 2002
________________________________________________________________________________
Bongs or water pipes?
Half the Most of Don'tNever Seldom Time the Time Always Know
All 85.0% 9.4% 1.3% 2.5% 0.7% 1.2%
Pipes?
Half the Most of Don'tNever Seldom Time the Time Always Know
All 85.7% 7.2% 4.6% 0.6% 0.7% 1.2%
Some other way?
Half the Most of Don'tNever Seldom Time the Time Always Know
All 86.4% 9.2% 1.2% 0.6% 0.6% 1.9%
________________________________________________________________________________
Table D-13: How do your parents feel about kids your age using marijuana?
Strongly Mildly Mildly Strongly Don'tDisapprove Disapprove Neither Approve Approve Know
All 84.9% 3.6% 2.2% * % 0.8% 8.5%
________________________________________________________________________________
Table D-14: How dangerous do you think it is for kids your age to use...
Marijuana?
Very Somewhat Not Very Not at All Do NotDangerous Dangerous Dangerous Dangerous Know
All 69.7% 15.2% 7.5% 4.9% 2.7%
Cocaine?
Very Somewhat Not Very Not at All Do NotDangerous Dangerous Dangerous Dangerous Know
All 89.2% 4.8% 1.0% 1.3% 3.8%
Crack?
Very Somewhat Not Very Not at All Do NotDangerous Dangerous Dangerous Dangerous Know
All 87.0% 6.3% 1.0% 0.9% 4.8%

8/14/2019 GREGG COUNTY - Sabine ISD - 2002 Texas School Survey of Drug and Alcohol Use
http://slidepdf.com/reader/full/gregg-county-sabine-isd-2002-texas-school-survey-of-drug-and-alcohol-use 19/83

8/14/2019 GREGG COUNTY - Sabine ISD - 2002 Texas School Survey of Drug and Alcohol Use
http://slidepdf.com/reader/full/gregg-county-sabine-isd-2002-texas-school-survey-of-drug-and-alcohol-use 20/83
SabineSpring 2002
________________________________________________________________________________
Table I-1: How recently, if ever, have you used...
Past School Ever NeverMonth Year Used Used
________________________________________________________________________________Any inhalant? All 13.8% 15.4% 26.1% 73.9%________________________________________________________________________________Liquid or spray paint? All 2.9% 5.0% 11.4% 88.6%________________________________________________________________________________Whiteout, correction fld?All 7.7% 8.5% 15.8% 84.2%________________________________________________________________________________Gasoline? All 4.1% 4.5% 9.8% 90.2%________________________________________________________________________________Freon? All 0.4% 1.7% 3.7% 96.3%________________________________________________________________________________Poppers, Locker Room? All 2.5% 2.5% 3.7% 96.3%________________________________________________________________________________Glue? All 3.0% 3.9% 8.2% 91.8%
________________________________________________________________________________Paint,lacquer,thinner? All 1.6% 2.6% 5.1% 94.9%________________________________________________________________________________Nitrous oxide? All 2.1% 2.6% 10.1% 89.9%________________________________________________________________________________Octane booster? All 0.4% 0.8% 2.9% 97.1%________________________________________________________________________________Other sprays? All 2.0% 2.8% 4.5% 95.5%________________________________________________________________________________Other inhalants? All 4.0% 5.6% 12.7% 87.3%
________________________________________________________________________________
Table I-2: How often do you normally use inhalants?
Several Several About About Less ThanNever Every Times Times Once a Once a Once a
Used Day a Week a Month Month Year Year
All 87.3% 1.5% * % 3.8% 1.0% 1.5% 4.9%
________________________________________________________________________________
Table I-3: Number of different kinds of inhalants used:
0 1 2-3 4+
All 76.4% 11.4% 5.4% 6.9%

8/14/2019 GREGG COUNTY - Sabine ISD - 2002 Texas School Survey of Drug and Alcohol Use
http://slidepdf.com/reader/full/gregg-county-sabine-isd-2002-texas-school-survey-of-drug-and-alcohol-use 21/83
SabineSpring 2002
________________________________________________________________________________
Table I-4: Average age of first use of:
All
Inhalants 10.9
________________________________________________________________________________
Table I-5: Since school began in the fall, on how many days (if any) have youattended class while high from inhalant use?
None 1-3 Days 4-9 Days 10+ Days
All 96% 2.5% 0.5% 0.8%
________________________________________________________________________________
Table I-6: School year use of inhalants by absences and conduct problems:
Average days absent due to illness or other reasons:
Inhalants Users: 5.1 days per studentInhalants Non-users: 5.0 days per student
Average days conduct problems reported:
Inhalants Users: 5.5 days per studentInhalants Non-users: 1.8 days per student
________________________________________________________________________________
Table I-7: About how many of your close friends use inhalants?
Never heardNone A Few Some Most All
All 76.7% 16.2 % 4.9% 1.7% 0.4%
________________________________________________________________________________
Table I-8: How dangerous do you think it is for kids your age to use inhalants?
Very Somewhat Not Very Not at All Do NotDangerous Dangerous Dangerous Dangerous Know
All 75.8% 15.1% 3.5% 1.8% 3.8%

8/14/2019 GREGG COUNTY - Sabine ISD - 2002 Texas School Survey of Drug and Alcohol Use
http://slidepdf.com/reader/full/gregg-county-sabine-isd-2002-texas-school-survey-of-drug-and-alcohol-use 22/83
SabineSpring 2002
________________________________________________________________________________
Table X-1: Since school began in the fall, have you gotten any information
on drugs or alcohol from the following sources?
Health class
No Yes
All 56.1% 43.9%
An assembly program
No Yes
All 52.1% 47.9%
Guidance counselor
No Yes
All 73.7% 26.3%
Science class
No Yes
All 59.3% 40.7%
Social studies class
No Yes
All 74.1% 25.9%
Student group session
No Yes
All 87.6% 12.4%
An invited school guest
No Yes
All 66.9% 33.1%
Some other school source
No Yes
All 61.6% 38.4%
Any school source
No Yes
All 38.8% 61.2%

8/14/2019 GREGG COUNTY - Sabine ISD - 2002 Texas School Survey of Drug and Alcohol Use
http://slidepdf.com/reader/full/gregg-county-sabine-isd-2002-texas-school-survey-of-drug-and-alcohol-use 23/83
SabineSpring 2002
________________________________________________________________________________
Table X-2: If you had a drug or alcohol problem and needed help, who would you
go to?
A counselor or program in school
No Yes
All 67.9% 32.1%
Another adult in school (such as a nurse or teacher)
No Yes
All 64.0% 36.0%
A counselor or program outside of school
No Yes
All 65.9% 34.1%
Your parents
No Yes
All 46.5% 53.5%
A medical doctor
No Yes
All 70.1% 29.9%
Your friends
No Yes
All 22.9% 77.1%
Another adult (a relative, clergyman, or other family friend)
No Yes
All 40.9% 59.1%
________________________________________________________________________________
Table X-3: Since school began in the fall, have you sought help, other thanfrom family or friends, for problems in any way connected with your use ofalcohol, marijuana, or other drugs?
No Yes
All 93.4% 6.6%

8/14/2019 GREGG COUNTY - Sabine ISD - 2002 Texas School Survey of Drug and Alcohol Use
http://slidepdf.com/reader/full/gregg-county-sabine-isd-2002-texas-school-survey-of-drug-and-alcohol-use 24/83
SabineSpring 2002
________________________________________________________________________________
Table X-4: About how many of your friends:
Feel close to their parents?
None A Few Some Most All
All 3.5% 31.5% 19.7% 35.4% 9.9%
Sometimes carry weapons?
None A Few Some Most All
All 51.3% 26.3% 15.0% 5.4% 2.0%
Care about making good grades?
None A Few Some Most All
All 3.1% 15.4% 24.0% 42.4% 15.1%
Belong/want to belong to a gang?
None A Few Some Most All
All 79.4% 12.7% 4.7% 2.4% 0.8%
Wish they could drop out of school?
None A Few Some Most All
All 55.6% 29.5% 6.2% 5.0% 3.8%

8/14/2019 GREGG COUNTY - Sabine ISD - 2002 Texas School Survey of Drug and Alcohol Use
http://slidepdf.com/reader/full/gregg-county-sabine-isd-2002-texas-school-survey-of-drug-and-alcohol-use 25/83

8/14/2019 GREGG COUNTY - Sabine ISD - 2002 Texas School Survey of Drug and Alcohol Use
http://slidepdf.com/reader/full/gregg-county-sabine-isd-2002-texas-school-survey-of-drug-and-alcohol-use 26/83
SabineSpring 2002
Table B1: Prevalence and recency of use of selected substances by grade--> All students
Past School Ever NeverMonth Year Used Used
________________________________________________________________________________
Tobacco All 18.5% 24.0% 44.3% 55.7%________________________________________________________________________________Alcohol All 25.6% 35.2% 58.2% 41.8%________________________________________________________________________________Inhalants All 13.8% 15.4% 26.1% 73.9%________________________________________________________________________________Any Illicit Drug All 9.4% 14.2% 22.8% 77.2%________________________________________________________________________________Marijuana All 8.1% 13.4% 19.8% 80.2%________________________________________________________________________________Marijuana Only All 4.4% 7.6% 12.4% 87.6%________________________________________________________________________________Cocaine or Crack All 1.6% 2.0% 4.8% 95.2%________________________________________________________________________________Cocaine All 1.2% 2.0% 3.6% 96.4%________________________________________________________________________________Crack All 0.5% 1.2% 2.9% 97.1%
________________________________________________________________________________Hallucinogens All 0.4% 1.3% 1.8% 98.2%________________________________________________________________________________Uppers All 0.8% 2.2% 3.4% 96.6%________________________________________________________________________________Downers All 1.7% 2.5% 3.3% 96.7%________________________________________________________________________________Rohypnol All 0.8% 2.0% 4.1% 95.9%________________________________________________________________________________Steroids All 0.4% 0.4% 2.1% 97.9%________________________________________________________________________________Ecstasy All 1.7% 1.7% 2.9% 97.1%________________________________________________________________________________Heroin All 1.2% 1.6% 2.8% 97.2%
Table B2: Prevalence and recency of use of selected substances by grade
--> Male studentsPast School Ever NeverMonth Year Used Used
________________________________________________________________________________Tobacco All 19.5% 23.7% 48.8% 51.2%________________________________________________________________________________Alcohol All 24.5% 31.3% 55.9% 44.1%________________________________________________________________________________Inhalants All 11.8% 13.3% 24.6% 75.4%________________________________________________________________________________Any Illicit Drug All 10.8% 15.4% 21.7% 78.3%________________________________________________________________________________Marijuana All 9.7% 15.2% 20.2% 79.8%________________________________________________________________________________Marijuana Only All 5.6% 9.3% 14.0% 86.0%________________________________________________________________________________Cocaine or Crack All 0.7% 1.4% 2.9% 97.1%
________________________________________________________________________________Cocaine All 0.7% 1.5% 3.0% 97.0%________________________________________________________________________________Crack All * % 1.5% 1.5% 98.5%________________________________________________________________________________Hallucinogens All 0.8% 0.8% 1.6% 98.4%________________________________________________________________________________Uppers All 0.8% 1.5% 1.5% 98.5%________________________________________________________________________________Downers All 0.8% 1.5% 1.5% 98.5%________________________________________________________________________________Rohypnol All 0.7% 2.3% 3.9% 96.1%
8/14/2019 GREGG COUNTY - Sabine ISD - 2002 Texas School Survey of Drug and Alcohol Use
http://slidepdf.com/reader/full/gregg-county-sabine-isd-2002-texas-school-survey-of-drug-and-alcohol-use 27/83
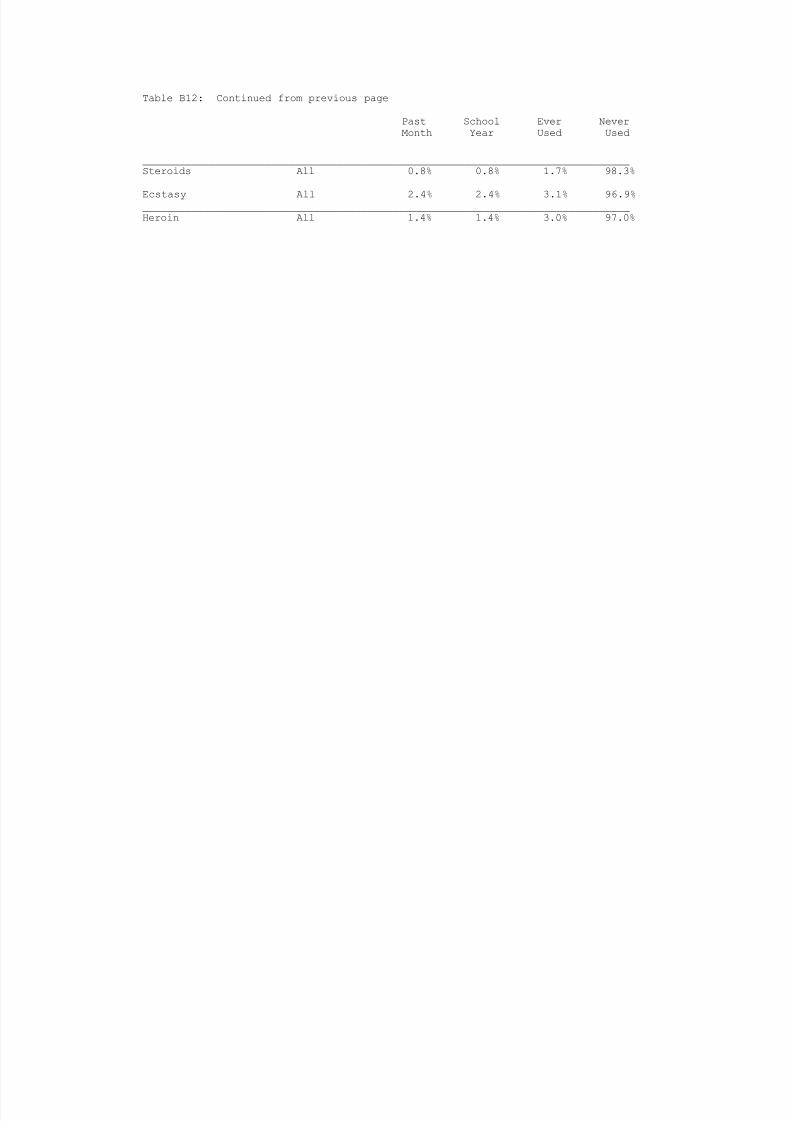
Table B12: Continued from previous page
Past School Ever NeverMonth Year Used Used
________________________________________________________________________________Steroids All 0.8% 0.8% 1.7% 98.3%________________________________________________________________________________
Ecstasy All 2.4% 2.4% 3.1% 96.9%________________________________________________________________________________Heroin All 1.4% 1.4% 3.0% 97.0%

8/14/2019 GREGG COUNTY - Sabine ISD - 2002 Texas School Survey of Drug and Alcohol Use
http://slidepdf.com/reader/full/gregg-county-sabine-isd-2002-texas-school-survey-of-drug-and-alcohol-use 28/83
SabineSpring 2002
Table B3: Prevalence and recency of use of selected substances by grade--> Female students
Past School Ever NeverMonth Year Used Used
________________________________________________________________________________
Tobacco All 17.7% 24.4% 40.0% 60.0%________________________________________________________________________________Alcohol All 27.1% 39.6% 61.2% 38.8%________________________________________________________________________________Inhalants All 16.1% 17.8% 27.9% 72.1%________________________________________________________________________________Any Illicit Drug All 8.0% 13.2% 24.2% 75.8%________________________________________________________________________________Marijuana All 6.5% 11.6% 19.4% 80.6%________________________________________________________________________________Marijuana Only All 3.1% 5.7% 10.9% 89.1%________________________________________________________________________________Cocaine or Crack All 2.6% 2.6% 6.8% 93.2%________________________________________________________________________________Cocaine All 1.7% 2.7% 4.3% 95.7%________________________________________________________________________________Crack All 1.0% 1.0% 4.4% 95.6%
________________________________________________________________________________Hallucinogens All * % 1.9% 1.9% 98.1%________________________________________________________________________________Uppers All 0.9% 2.9% 5.5% 94.5%________________________________________________________________________________Downers All 2.8% 3.7% 5.4% 94.6%________________________________________________________________________________Rohypnol All 0.8% 1.6% 4.4% 95.6%________________________________________________________________________________Steroids All * % * % 2.6% 97.4%________________________________________________________________________________Ecstasy All 1.0% 1.0% 2.7% 97.3%________________________________________________________________________________Heroin All 1.0% 1.8% 2.6% 97.4%
Table B4: Prevalence and recency of use of selected substances by grade
--> White studentsPast School Ever NeverMonth Year Used Used
________________________________________________________________________________Tobacco All 19.7% 25.9% 45.0% 55.0%________________________________________________________________________________Alcohol All 24.7% 33.7% 56.0% 44.0%________________________________________________________________________________Inhalants All 12.9% 14.4% 25.2% 74.8%________________________________________________________________________________Any Illicit Drug All 8.9% 14.4% 23.6% 76.4%________________________________________________________________________________Marijuana All 8.6% 13.2% 19.6% 80.4%________________________________________________________________________________Marijuana Only All 4.5% 8.0% 13.1% 86.9%________________________________________________________________________________Cocaine or Crack All 1.5% 2.0% 4.5% 95.5%
________________________________________________________________________________Cocaine All 1.0% 2.1% 3.1% 96.9%________________________________________________________________________________Crack All 0.6% 1.1% 2.6% 97.4%________________________________________________________________________________Hallucinogens All * % 1.1% 1.6% 98.4%________________________________________________________________________________Uppers All 0.5% 2.2% 3.2% 96.8%________________________________________________________________________________Downers All 1.6% 2.6% 3.1% 96.9%________________________________________________________________________________Rohypnol All 1.0% 1.4% 4.1% 95.9%

8/14/2019 GREGG COUNTY - Sabine ISD - 2002 Texas School Survey of Drug and Alcohol Use
http://slidepdf.com/reader/full/gregg-county-sabine-isd-2002-texas-school-survey-of-drug-and-alcohol-use 29/83
Table B4: Continued from previous page
Past School Ever NeverMonth Year Used Used
________________________________________________________________________________Steroids All 0.5% 0.5% 2.1% 97.9%________________________________________________________________________________
Ecstasy All 1.1% 1.1% 2.1% 97.9%________________________________________________________________________________Heroin All 0.6% 1.0% 2.5% 97.5%

8/14/2019 GREGG COUNTY - Sabine ISD - 2002 Texas School Survey of Drug and Alcohol Use
http://slidepdf.com/reader/full/gregg-county-sabine-isd-2002-texas-school-survey-of-drug-and-alcohol-use 30/83
SabineSpring 2002
Table B5: Prevalence and recency of use of selected substances by grade--> Black students
Past School Ever NeverMonth Year Used Used
________________________________________________________________________________
Tobacco All 4.5% 4.5% 22.7% 77.3%________________________________________________________________________________Alcohol All 29.1% 33.5% 57.6% 42.4%________________________________________________________________________________Inhalants All 23.3% 23.3% 28.1% 71.9%________________________________________________________________________________Any Illicit Drug All 4.5% 4.5% 9.3% 90.7%________________________________________________________________________________Marijuana All * % 4.5% 9.3% 90.7%________________________________________________________________________________Marijuana Only All * % * % 4.8% 95.2%________________________________________________________________________________Cocaine or Crack All * % * % 4.5% 95.5%________________________________________________________________________________Cocaine All * % * % 4.5% 95.5%________________________________________________________________________________Crack All * % * % * % 100.0%
________________________________________________________________________________Hallucinogens All * % * % * % 100.0%________________________________________________________________________________Uppers All * % * % * % 100.0%________________________________________________________________________________Downers All * % * % * % 100.0%________________________________________________________________________________Rohypnol All * % * % * % 100.0%________________________________________________________________________________Steroids All * % * % * % 100.0%________________________________________________________________________________Ecstasy All * % * % * % 100.0%________________________________________________________________________________Heroin All 4.5% 4.5% 4.5% 95.5%
Table B6: Prevalence and recency of use of selected substances by grade
--> Mexican/American studentsPast School Ever NeverMonth Year Used Used
________________________________________________________________________________Tobacco All 18.0% 24.2% 46.9% 53.1%________________________________________________________________________________Alcohol All 39.5% 61.4% 72.2% 27.8%________________________________________________________________________________Inhalants All 16.6% 22.0% 43.9% 56.1%________________________________________________________________________________Any Illicit Drug All 17.1% 17.1% 28.3% 71.7%________________________________________________________________________________Marijuana All 12.6% 19.2% 31.8% 68.2%________________________________________________________________________________Marijuana Only All 11.2% 11.2% 17.1% 82.9%________________________________________________________________________________Cocaine or Crack All * % * % 5.7% 94.3%
________________________________________________________________________________Cocaine All * % * % 5.7% 94.3%________________________________________________________________________________Crack All * % * % 5.7% 94.3%________________________________________________________________________________Hallucinogens All 6.2% 6.2% 6.2% 93.8%________________________________________________________________________________Uppers All * % * % 6.0% 94.0%________________________________________________________________________________Downers All * % * % 5.7% 94.3%________________________________________________________________________________Rohypnol All * % 6.2% 6.2% 93.8%

8/14/2019 GREGG COUNTY - Sabine ISD - 2002 Texas School Survey of Drug and Alcohol Use
http://slidepdf.com/reader/full/gregg-county-sabine-isd-2002-texas-school-survey-of-drug-and-alcohol-use 31/83
Table B6: Continued from previous page
Past School Ever NeverMonth Year Used Used
________________________________________________________________________________Steroids All * % * % 5.7% 94.3%________________________________________________________________________________
Ecstasy All 5.8% 5.8% 11.2% 88.8%________________________________________________________________________________Heroin All * % * % * % 100.0%

8/14/2019 GREGG COUNTY - Sabine ISD - 2002 Texas School Survey of Drug and Alcohol Use
http://slidepdf.com/reader/full/gregg-county-sabine-isd-2002-texas-school-survey-of-drug-and-alcohol-use 32/83
SabineSpring 2002
Table B7: Prevalence and recency of use of selected substances by grade--> Students reporting A and B grades
Past School Ever NeverMonth Year Used Used
________________________________________________________________________________
Tobacco All 15.0% 19.9% 41.2% 58.8%________________________________________________________________________________Alcohol All 21.6% 31.1% 54.7% 45.3%________________________________________________________________________________Inhalants All 12.1% 13.4% 22.8% 77.2%________________________________________________________________________________Any Illicit Drug All 7.5% 10.5% 18.7% 81.3%________________________________________________________________________________Marijuana All 5.9% 9.3% 15.3% 84.7%________________________________________________________________________________Marijuana Only All 3.9% 5.4% 9.8% 90.2%________________________________________________________________________________Cocaine or Crack All 0.9% 1.4% 4.1% 95.9%________________________________________________________________________________Cocaine All 0.9% 1.4% 3.3% 96.7%________________________________________________________________________________Crack All * % 0.5% 1.9% 98.1%
________________________________________________________________________________Hallucinogens All 0.5% 1.0% 1.5% 98.5%________________________________________________________________________________Uppers All * % 0.6% 2.0% 98.0%________________________________________________________________________________Downers All 0.5% 1.0% 2.0% 98.0%________________________________________________________________________________Rohypnol All 0.5% 1.0% 2.9% 97.1%________________________________________________________________________________Steroids All 0.5% 0.5% 2.4% 97.6%________________________________________________________________________________Ecstasy All 1.0% 1.0% 1.9% 98.1%________________________________________________________________________________Heroin All 0.4% 0.4% 1.4% 98.6%
Table B8: Prevalence and recency of use of selected substances by grade
--> Students reporting C, D, and F gradesPast School Ever NeverMonth Year Used Used
________________________________________________________________________________Tobacco All 39.7% 47.7% 63.3% 36.7%________________________________________________________________________________Alcohol All 46.0% 56.2% 76.8% 23.2%________________________________________________________________________________Inhalants All 21.3% 24.1% 42.7% 57.3%________________________________________________________________________________Any Illicit Drug All 20.8% 36.6% 47.5% 52.5%________________________________________________________________________________Marijuana All 21.9% 38.6% 47.2% 52.8%________________________________________________________________________________Marijuana Only All 7.3% 20.2% 28.1% 71.9%________________________________________________________________________________Cocaine or Crack All 5.9% 5.9% 8.7% 91.3%
________________________________________________________________________________Cocaine All 2.6% 5.9% 5.9% 94.1%________________________________________________________________________________Crack All 3.3% 6.0% 9.0% 91.0%________________________________________________________________________________Hallucinogens All * % 3.3% 3.3% 96.7%________________________________________________________________________________Uppers All 5.5% 11.3% 11.3% 88.7%________________________________________________________________________________Downers All 9.0% 11.7% 11.7% 88.3%________________________________________________________________________________Rohypnol All 2.6% 7.9% 11.1% 88.9%

8/14/2019 GREGG COUNTY - Sabine ISD - 2002 Texas School Survey of Drug and Alcohol Use
http://slidepdf.com/reader/full/gregg-county-sabine-isd-2002-texas-school-survey-of-drug-and-alcohol-use 33/83
Table B8: Continued from previous page
Past School Ever NeverMonth Year Used Used
________________________________________________________________________________Steroids All * % * % * % 100.0%________________________________________________________________________________
Ecstasy All 5.7% 5.7% 8.3% 91.7%________________________________________________________________________________Heroin All 5.7% 8.3% 11.1% 88.9%

8/14/2019 GREGG COUNTY - Sabine ISD - 2002 Texas School Survey of Drug and Alcohol Use
http://slidepdf.com/reader/full/gregg-county-sabine-isd-2002-texas-school-survey-of-drug-and-alcohol-use 34/83
SabineSpring 2002
Table B9: Prevalence and recency of use of selected substances by grade--> Students living with two parents
Past School Ever NeverMonth Year Used Used
________________________________________________________________________________
Tobacco All 15.1% 19.2% 37.4% 62.6%________________________________________________________________________________Alcohol All 20.8% 30.4% 52.2% 47.8%________________________________________________________________________________Inhalants All 10.8% 12.6% 22.1% 77.9%________________________________________________________________________________Any Illicit Drug All 8.4% 11.0% 18.8% 81.2%________________________________________________________________________________Marijuana All 7.3% 10.6% 15.4% 84.6%________________________________________________________________________________Marijuana Only All 4.5% 5.8% 10.3% 89.7%________________________________________________________________________________Cocaine or Crack All 1.3% 1.3% 3.9% 96.1%________________________________________________________________________________Cocaine All 0.6% 1.4% 2.6% 97.4%________________________________________________________________________________Crack All 0.7% 0.7% 2.1% 97.9%
________________________________________________________________________________Hallucinogens All * % 0.8% 1.5% 98.5%________________________________________________________________________________Uppers All 0.7% 1.5% 2.1% 97.9%________________________________________________________________________________Downers All 2.1% 2.8% 3.5% 96.5%________________________________________________________________________________Rohypnol All 0.6% 1.3% 2.6% 97.4%________________________________________________________________________________Steroids All 0.7% 0.7% 0.7% 99.3%________________________________________________________________________________Ecstasy All 1.4% 1.4% 2.1% 97.9%________________________________________________________________________________Heroin All 0.7% 1.3% 2.6% 97.4%
Table B10: Prevalence and recency of use of selected substances by grade
--> Students not living with two parentsPast School Ever NeverMonth Year Used Used
________________________________________________________________________________Tobacco All 24.1% 31.6% 55.3% 44.7%________________________________________________________________________________Alcohol All 33.5% 42.9% 68.1% 31.9%________________________________________________________________________________Inhalants All 18.9% 19.9% 32.5% 67.5%________________________________________________________________________________Any Illicit Drug All 11.2% 19.6% 29.3% 70.7%________________________________________________________________________________Marijuana All 9.5% 18.0% 27.0% 73.0%________________________________________________________________________________Marijuana Only All 4.2% 10.5% 15.9% 84.1%________________________________________________________________________________Cocaine or Crack All 2.1% 3.1% 6.2% 93.8%
________________________________________________________________________________Cocaine All 2.2% 3.2% 5.3% 94.7%________________________________________________________________________________Crack All * % 2.1% 4.2% 95.8%________________________________________________________________________________Hallucinogens All 1.1% 2.2% 2.2% 97.8%________________________________________________________________________________Uppers All 1.0% 3.3% 5.5% 94.5%________________________________________________________________________________Downers All 1.0% 2.1% 3.1% 96.9%________________________________________________________________________________Rohypnol All 1.0% 3.1% 6.5% 93.5%

8/14/2019 GREGG COUNTY - Sabine ISD - 2002 Texas School Survey of Drug and Alcohol Use
http://slidepdf.com/reader/full/gregg-county-sabine-isd-2002-texas-school-survey-of-drug-and-alcohol-use 35/83
Table B10: Continued from previous page
Past School Ever NeverMonth Year Used Used
________________________________________________________________________________Steroids All * % * % 4.3% 95.7%________________________________________________________________________________
Ecstasy All 2.1% 2.1% 4.1% 95.9%________________________________________________________________________________Heroin All 2.0% 2.0% 3.1% 96.9%

8/14/2019 GREGG COUNTY - Sabine ISD - 2002 Texas School Survey of Drug and Alcohol Use
http://slidepdf.com/reader/full/gregg-county-sabine-isd-2002-texas-school-survey-of-drug-and-alcohol-use 36/83
SabineSpring 2002
Table B11: Prevalence and recency of use of selected substances by grade--> Students who would seek help from adults for substance abuse problems
Past School Ever NeverMonth Year Used Used
________________________________________________________________________________
Tobacco All 15.6% 21.0% 40.9% 59.1%________________________________________________________________________________Alcohol All 21.5% 30.8% 55.5% 44.5%________________________________________________________________________________Inhalants All 12.3% 13.3% 22.9% 77.1%________________________________________________________________________________Any Illicit Drug All 8.0% 12.7% 19.5% 80.5%________________________________________________________________________________Marijuana All 6.3% 11.5% 16.5% 83.5%________________________________________________________________________________Marijuana Only All 3.7% 6.7% 10.5% 89.5%________________________________________________________________________________Cocaine or Crack All 1.0% 1.5% 3.4% 96.6%________________________________________________________________________________Cocaine All 1.0% 1.5% 2.5% 97.5%________________________________________________________________________________Crack All * % 0.5% 1.5% 98.5%
________________________________________________________________________________Hallucinogens All 0.5% 1.1% 1.1% 98.9%________________________________________________________________________________Uppers All 0.5% 1.1% 2.2% 97.8%________________________________________________________________________________Downers All 1.6% 2.1% 2.6% 97.4%________________________________________________________________________________Rohypnol All 1.0% 1.5% 3.7% 96.3%________________________________________________________________________________Steroids All * % * % 1.6% 98.4%________________________________________________________________________________Ecstasy All 0.5% 0.5% 1.6% 98.4%________________________________________________________________________________Heroin All 0.5% 0.5% 1.0% 99.0%
Table B12: Prevalence and recency of use of selected substances by grade
--> Students who wouldn't seek help from adults for substance abuse problemsPast School Ever NeverMonth Year Used Used
________________________________________________________________________________Tobacco All 29.5% 35.2% 56.8% 43.2%________________________________________________________________________________Alcohol All 41.3% 51.0% 66.3% 33.7%________________________________________________________________________________Inhalants All 20.8% 24.6% 38.7% 61.3%________________________________________________________________________________Any Illicit Drug All 13.9% 19.9% 35.9% 64.1%________________________________________________________________________________Marijuana All 13.9% 19.9% 31.8% 68.2%________________________________________________________________________________Marijuana Only All 5.7% 9.7% 19.2% 80.8%________________________________________________________________________________Cocaine or Crack All 4.1% 4.1% 10.3% 89.7%
________________________________________________________________________________Cocaine All 1.9% 4.1% 8.0% 92.0%________________________________________________________________________________Crack All 2.3% 4.2% 8.4% 91.6%________________________________________________________________________________Hallucinogens All * % 2.5% 4.8% 95.2%________________________________________________________________________________Uppers All 2.0% 6.4% 8.4% 91.6%________________________________________________________________________________Downers All 2.5% 4.5% 6.5% 93.5%________________________________________________________________________________Rohypnol All * % 3.9% 6.3% 93.7%

8/14/2019 GREGG COUNTY - Sabine ISD - 2002 Texas School Survey of Drug and Alcohol Use
http://slidepdf.com/reader/full/gregg-county-sabine-isd-2002-texas-school-survey-of-drug-and-alcohol-use 37/83
Table B12: Continued from previous page
Past School Ever NeverMonth Year Used Used
________________________________________________________________________________Steroids All 2.1% 2.1% 4.1% 95.9%________________________________________________________________________________
Ecstasy All 6.3% 6.3% 8.2% 91.8%________________________________________________________________________________Heroin All 4.3% 6.3% 10.3% 89.7%

8/14/2019 GREGG COUNTY - Sabine ISD - 2002 Texas School Survey of Drug and Alcohol Use
http://slidepdf.com/reader/full/gregg-county-sabine-isd-2002-texas-school-survey-of-drug-and-alcohol-use 38/83
SabineSpring 2002
Table B13: Prevalence and recency of use of selected substances by grade--> Students living in town three years or less
Past School Ever NeverMonth Year Used Used
________________________________________________________________________________
Tobacco All 21.2% 26.1% 45.4% 54.6%________________________________________________________________________________Alcohol All 34.1% 41.7% 62.7% 37.3%________________________________________________________________________________Inhalants All 18.1% 18.1% 27.4% 72.6%________________________________________________________________________________Any Illicit Drug All 15.3% 19.6% 27.5% 72.5%________________________________________________________________________________Marijuana All 14.4% 20.5% 23.9% 76.1%________________________________________________________________________________Marijuana Only All 7.6% 11.9% 13.6% 86.4%________________________________________________________________________________Cocaine or Crack All 1.6% 1.6% 4.9% 95.1%________________________________________________________________________________Cocaine All 1.6% 1.6% 3.3% 96.7%________________________________________________________________________________Crack All * % * % 1.8% 98.2%
________________________________________________________________________________Hallucinogens All 1.6% 3.3% 4.9% 95.1%________________________________________________________________________________Uppers All 1.7% 1.7% 5.0% 95.0%________________________________________________________________________________Downers All 3.2% 3.2% 4.8% 95.2%________________________________________________________________________________Rohypnol All 1.5% 3.2% 4.8% 95.2%________________________________________________________________________________Steroids All 1.6% 1.6% 4.7% 95.3%________________________________________________________________________________Ecstasy All 3.3% 3.3% 4.8% 95.2%________________________________________________________________________________Heroin All * % * % 3.1% 96.9%
Table B14: Prevalence and recency of use of selected substances by grade
--> Students living in town more than three yearsPast School Ever NeverMonth Year Used Used
________________________________________________________________________________Tobacco All 17.3% 22.9% 43.3% 56.7%________________________________________________________________________________Alcohol All 22.9% 33.2% 56.7% 43.3%________________________________________________________________________________Inhalants All 12.5% 14.6% 25.9% 74.1%________________________________________________________________________________Any Illicit Drug All 7.5% 12.0% 20.8% 79.2%________________________________________________________________________________Marijuana All 6.1% 10.6% 18.1% 81.9%________________________________________________________________________________Marijuana Only All 3.3% 5.6% 11.7% 88.3%________________________________________________________________________________Cocaine or Crack All 1.7% 2.2% 4.8% 95.2%
________________________________________________________________________________Cocaine All 1.0% 2.2% 3.8% 96.2%________________________________________________________________________________Crack All 0.6% 1.7% 3.3% 96.7%________________________________________________________________________________Hallucinogens All * % 0.7% 0.7% 99.3%________________________________________________________________________________Uppers All 0.5% 2.4% 2.9% 97.1%________________________________________________________________________________Downers All 1.2% 2.3% 2.9% 97.1%________________________________________________________________________________Rohypnol All 0.5% 1.6% 3.9% 96.1%

8/14/2019 GREGG COUNTY - Sabine ISD - 2002 Texas School Survey of Drug and Alcohol Use
http://slidepdf.com/reader/full/gregg-county-sabine-isd-2002-texas-school-survey-of-drug-and-alcohol-use 39/83
Table B14: Continued from previous page
Past School Ever NeverMonth Year Used Used
________________________________________________________________________________Steroids All * % * % 1.1% 98.9%________________________________________________________________________________
Ecstasy All 1.2% 1.2% 2.3% 97.7%________________________________________________________________________________Heroin All 1.7% 2.2% 2.7% 97.3%

8/14/2019 GREGG COUNTY - Sabine ISD - 2002 Texas School Survey of Drug and Alcohol Use
http://slidepdf.com/reader/full/gregg-county-sabine-isd-2002-texas-school-survey-of-drug-and-alcohol-use 40/83
SabineSpring 2002
The FREQ Procedure
GENDER
q1 Frequency Percent
_______________________________Female 122.2416 47.94Male 132.7572 52.06
Frequency Missing = 1.0012269939
GRADE
q2 Frequency Percent____________________________________Grade 7 100.5153 39.26Grade 8 75.3865 29.45Grade 9 80.09816 31.29
LIVE WITH BOTH PARENTS
q3 Frequency Percent___________________________________No 96.69377 37.77Yes 159.3062 62.23
AGE
q4 Frequency Percent______________________________________12 24.89829 9.8413 82.55388 32.6414 81.43041 32.1915 59.06272 23.3516 4.004908 1.5817 1.001227 0.40
Frequency Missing = 3.0485577404
ETHNICITY
q5 Frequency Percent_________________________________________African/American 20.69668 8.18Mexican/American 17.15234 6.78Native/American 2.047331 0.81Other 7.535408 2.98White 205.5197 81.25
Frequency Missing = 3.0485577404
The frequencies have been weighted so that theanalysis reflects the distribution of students by grade
level in the district

8/14/2019 GREGG COUNTY - Sabine ISD - 2002 Texas School Survey of Drug and Alcohol Use
http://slidepdf.com/reader/full/gregg-county-sabine-isd-2002-texas-school-survey-of-drug-and-alcohol-use 41/83
SabineSpring 2002
The FREQ Procedure
ON AVERAGE WHAT GRADES DO YOU GET
q6 Frequency Percent
___________________________________Mostly A's 84.4685 33.26Mostly B's 131.5219 51.79Mostly C's 30.3478 11.95Mostly D's 6.613249 2.60Mostly F's 1.001227 0.39
Frequency Missing = 2.0473307465
LENGTH OF TIME IN THIS DISTRICT
q7 Frequency Percent__________________________________<1 year 31.87899 12.592-3 years 34.95859 13.81>4 years 186.3169 73.60
Frequency Missing = 2.8455451117
DO YOU HAVE A JOB
q8 Frequency Percent___________________________________No 197.6852 79.44Yes 51.17157 20.56
Frequency Missing = 7.1432192334
DO YOU GET AN ALLOWANCE
q9 Frequency Percent
___________________________________No 152.0871 60.62Yes 98.81702 39.38
Frequency Missing = 5.0958884869
EITHER PARENT COLLEGE GRADUATE
q10 Frequency Percent___________________________________Don't Know 54.58881 21.56No 70.27496 27.76Yes 128.2907 50.68
Frequency Missing = 2.8455451117
The frequencies have been weighted so that theanalysis reflects the distribution of students by grade
level in the district

8/14/2019 GREGG COUNTY - Sabine ISD - 2002 Texas School Survey of Drug and Alcohol Use
http://slidepdf.com/reader/full/gregg-county-sabine-isd-2002-texas-school-survey-of-drug-and-alcohol-use 42/83
SabineSpring 2002
The FREQ Procedure
QUALIFY FOR FREE/REDUCED PRICE LUNCH
q11 Frequency Percent
___________________________________Don't Know 41.55149 16.53No 156.9458 62.45Yes 52.81287 21.02
Frequency Missing = 4.6898632296
PARTICIPATE IN ATHLETICS
q12a Frequency Percent___________________________________No 52.60232 21.74Yes 189.3591 78.26
Frequency Missing = 14.038549079
PARTICIPATE IN BAND/ORCHESTRA
q12b Frequency Percent___________________________________No 126.0777 60.40Yes 82.67659 39.60
Frequency Missing = 47.245726901
PARTICIPATE IN CHOIR
q12c Frequency Percent___________________________________No 141.6164 76.32Yes 43.94613 23.68
Frequency Missing = 70.437484217
PARTICIPATE IN DRAMA/SPEECH
q12d Frequency Percent___________________________________No 162.3441 94.34Yes 9.740875 5.66
Frequency Missing = 83.915022736
PARTICIPATE IN DRILL TEAM/CHEERLEADING
q12e Frequency Percent
___________________________________No 150.6318 80.57Yes 36.3348 19.43
Frequency Missing = 69.033382533
The frequencies have been weighted so that theanalysis reflects the distribution of students by grade
level in the district

8/14/2019 GREGG COUNTY - Sabine ISD - 2002 Texas School Survey of Drug and Alcohol Use
http://slidepdf.com/reader/full/gregg-county-sabine-isd-2002-texas-school-survey-of-drug-and-alcohol-use 43/83
SabineSpring 2002
The FREQ Procedure
PARTICIPATE IN STUDENT GOVERNMENT
q12f Frequency Percent
___________________________________No 176.6509 96.75Yes 5.93898 3.25
Frequency Missing = 73.41012459
PARTICIPATE IN SCHOOL NEWSPAPER/YEARBOOK
q12g Frequency Percent___________________________________No 165.6471 90.20Yes 17.98891 9.80
Frequency Missing = 72.364020837
PARTICIPATE IN ACADEMIC CLUBS/SOCIETIES q12h Frequency Percent___________________________________No 149.6231 80.35Yes 36.57954 19.65
Frequency Missing = 69.797405722
PARTICIPATE IN SERVICE CLUBS
q12i Frequency Percent___________________________________No 172.2635 89.64Yes 19.9123 10.36
Frequency Missing = 63.824234935
PARTICIPATE IN VOE/DE/WORK-STUDY
q12j Frequency Percent___________________________________No 191.7355 97.91Yes 4.094661 2.09
Frequency Missing = 60.169789875
PARTICIPATE IN OTHER CLUBS
q12k Frequency Percent___________________________________
No 155.187 76.26Yes 48.31635 23.74
Frequency Missing = 52.496600691
The frequencies have been weighted so that theanalysis reflects the distribution of students by grade
level in the district

8/14/2019 GREGG COUNTY - Sabine ISD - 2002 Texas School Survey of Drug and Alcohol Use
http://slidepdf.com/reader/full/gregg-county-sabine-isd-2002-texas-school-survey-of-drug-and-alcohol-use 44/83
SabineSpring 2002
The FREQ Procedure
DO YOU FEEL SAFE IN YOUR HOME
q13a Frequency Percent
________________________________________Very Safe 176.8304 71.32Somewhat Safe 61.2394 24.70Not Very Safe 7.941434 3.20Don't Know 1.923386 0.78
Frequency Missing = 8.0653782923
DO YOU FEEL SAFE IN YOUR NEIGHBORHOOD
q13b Frequency Percent________________________________________Very Safe 103.682 42.11Somewhat Safe 108.7192 44.16Not Very Safe 21.02363 8.54Not Safe At All 6.737194 2.74
Don't Know 6.052239 2.46
Frequency Missing = 9.7857517165
DO YOU FEEL SAFE AT SCHOOL
q13c Frequency Percent________________________________________Very Safe 86.99777 35.23Somewhat Safe 114.8505 46.51Not Very Safe 25.79256 10.45Not Safe At All 10.39479 4.21Don't Know 8.897784 3.60
Frequency Missing = 9.0666052862
FRIENDS FEELING CLOSE TO THEIR PARENTS
q14a Frequency Percent______________________________None 8.818716 3.50A Few 79.34809 31.48Some 49.71944 19.73Most 89.10382 35.35All 25.03923 9.94
Frequency Missing = 3.9707167993
The frequencies have been weighted so that theanalysis reflects the distribution of students by grade
level in the district

8/14/2019 GREGG COUNTY - Sabine ISD - 2002 Texas School Survey of Drug and Alcohol Use
http://slidepdf.com/reader/full/gregg-county-sabine-isd-2002-texas-school-survey-of-drug-and-alcohol-use 45/83
SabineSpring 2002
The FREQ Procedure
HOW MANY FRIENDS CARRY WEAPONS
q14b Frequency Percent
______________________________None 128.1294 51.26A Few 65.66102 26.27Some 37.53904 15.02Most 13.60148 5.44All 5.051012 2.02
Frequency Missing = 6.0180475458
HOW MANY FRIENDS CARE ABOUT GOOD GRADES
q14c Frequency Percent______________________________None 7.614476 3.10A Few 37.72822 15.37Some 58.99974 24.03
Most 104.1222 42.41All 37.03044 15.08
Frequency Missing = 10.504898147
HOW MANY FRIENDS BELONG TO A GANG
q14d Frequency Percent______________________________None 196.6284 79.37A Few 31.57656 12.75Some 11.70914 4.73Most 5.894103 2.38All 1.923386 0.78
Frequency Missing = 8.268390921
FRIENDS WISHING TO DROP OUT OF SCHOOL
q14e Frequency Percent______________________________None 139.1022 55.62A Few 73.67083 29.46Some 15.43197 6.17Most 12.44212 4.97All 9.458794 3.78
Frequency Missing = 5.8941028521
PARENTS ATTEND PTA/SCHOOL OPEN HOUSES
q15 Frequency Percent___________________________________No 124.5123 52.04Yes 114.7276 47.96
Frequency Missing = 16.760149497
The frequencies have been weighted so that theanalysis reflects the distribution of students by grade
level in the district
8/14/2019 GREGG COUNTY - Sabine ISD - 2002 Texas School Survey of Drug and Alcohol Use
http://slidepdf.com/reader/full/gregg-county-sabine-isd-2002-texas-school-survey-of-drug-and-alcohol-use 46/83
SabineSpring 2002
The FREQ Procedure
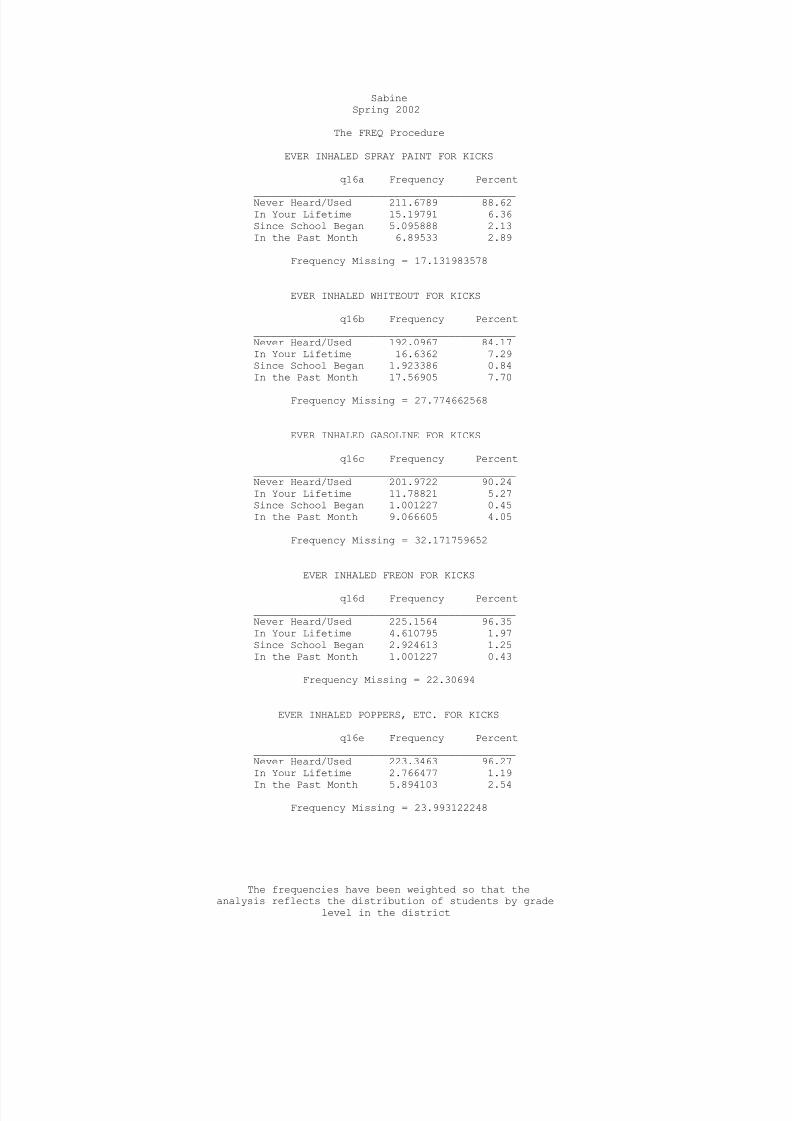
EVER INHALED SPRAY PAINT FOR KICKS
q16a Frequency Percent
___________________________________________Never Heard/Used 211.6789 88.62In Your Lifetime 15.19791 6.36Since School Began 5.095888 2.13In the Past Month 6.89533 2.89
Frequency Missing = 17.131983578
EVER INHALED WHITEOUT FOR KICKS
q16b Frequency Percent___________________________________________Never Heard/Used 192.0967 84.17In Your Lifetime 16.6362 7.29Since School Began 1.923386 0.84In the Past Month 17.56905 7.70
Frequency Missing = 27.774662568
EVER INHALED GASOLINE FOR KICKS
q16c Frequency Percent___________________________________________Never Heard/Used 201.9722 90.24In Your Lifetime 11.78821 5.27Since School Began 1.001227 0.45In the Past Month 9.066605 4.05
Frequency Missing = 32.171759652
EVER INHALED FREON FOR KICKS
q16d Frequency Percent
___________________________________________Never Heard/Used 225.1564 96.35In Your Lifetime 4.610795 1.97Since School Began 2.924613 1.25In the Past Month 1.001227 0.43
Frequency Missing = 22.30694
EVER INHALED POPPERS, ETC. FOR KICKS
q16e Frequency Percent___________________________________________Never Heard/Used 223.3463 96.27In Your Lifetime 2.766477 1.19
In the Past Month 5.894103 2.54
Frequency Missing = 23.993122248
The frequencies have been weighted so that theanalysis reflects the distribution of students by grade
level in the district

8/14/2019 GREGG COUNTY - Sabine ISD - 2002 Texas School Survey of Drug and Alcohol Use
http://slidepdf.com/reader/full/gregg-county-sabine-isd-2002-texas-school-survey-of-drug-and-alcohol-use 47/83
SabineSpring 2002
The FREQ Procedure
EVER INHALED GLUE FOR KICKS
q16f Frequency Percent
___________________________________________Never Heard/Used 205.2922 91.81In Your Lifetime 9.661807 4.32Since School Began 1.844318 0.82In the Past Month 6.816262 3.05
Frequency Missing = 32.385457863
EVER INHALED PAINT THINNERS FOR KICKS
q16g Frequency Percent___________________________________________Never Heard/Used 218.8114 94.92In Your Lifetime 5.815035 2.52Since School Began 2.126399 0.92In the Past Month 3.767704 1.63
Frequency Missing = 25.479442434
EVER INHALED NITROUS OXIDE FOR KICKS
q16h Frequency Percent___________________________________________Never Heard/Used 202.4915 89.94In Your Lifetime 16.83922 7.48Since School Began 1.001227 0.44In the Past Month 4.813808 2.14
Frequency Missing = 30.854260918
EVER INHALED OCTANE BOOSTER FOR KICKS
q16i Frequency Percent
___________________________________________Never Heard/Used 226.2025 97.07In Your Lifetime 4.971944 2.13Since School Began 0.922159 0.40In the Past Month 0.922159 0.40
Frequency Missing = 22.981209672
EVER INHALED OTHER SPRAYS FOR KICKS
q16j Frequency Percent___________________________________________Never Heard/Used 226.708 95.49In Your Lifetime 3.970717 1.67
Since School Began 2.047331 0.86In the Past Month 4.689863 1.98
Frequency Missing = 18.584112588
The frequencies have been weighted so that theanalysis reflects the distribution of students by grade
level in the district

8/14/2019 GREGG COUNTY - Sabine ISD - 2002 Texas School Survey of Drug and Alcohol Use
http://slidepdf.com/reader/full/gregg-county-sabine-isd-2002-texas-school-survey-of-drug-and-alcohol-use 48/83
SabineSpring 2002
The FREQ Procedure
EVER INHALED OTHER INHALANTS FOR KICKS
q16k Frequency Percent
___________________________________________Never Heard/Used 208.3514 87.30In Your Lifetime 16.88409 7.07Since School Began 3.767704 1.58In the Past Month 9.661807 4.05
Frequency Missing = 17.334996207
RECENT CIGARETTE USE
q17a Frequency Percent___________________________________________Never Heard/Used 138.741 57.10In Your Lifetime 49.68525 20.45Since School Began 11.2272 4.62In the Past Month 43.3092 17.83
Frequency Missing = 13.037322085
RECENT SMOKELESS TOBACCO USE
q17b Frequency Percent___________________________________________Never Heard/Used 198.8553 82.72In Your Lifetime 16.24402 6.76Since School Began 10.34991 4.31In the Past Month 14.95002 6.22
Frequency Missing = 15.600786634
RECENT BEER USE
q17c Frequency Percent
___________________________________________Never Heard/Used 144.3872 60.36In Your Lifetime 38.224 15.98Since School Began 17.44826 7.29In the Past Month 39.13547 16.36
Frequency Missing = 16.805026256
RECENT WINE COOLER USE
q17d Frequency Percent___________________________________________Never Heard/Used 132.4858 53.61In Your Lifetime 52.17279 21.11
Since School Began 21.70105 8.78In the Past Month 40.77678 16.50
Frequency Missing = 8.8635926575
The frequencies have been weighted so that theanalysis reflects the distribution of students by grade
level in the district

8/14/2019 GREGG COUNTY - Sabine ISD - 2002 Texas School Survey of Drug and Alcohol Use
http://slidepdf.com/reader/full/gregg-county-sabine-isd-2002-texas-school-survey-of-drug-and-alcohol-use 49/83
SabineSpring 2002
The FREQ Procedure
RECENT WINE USE
q17e Frequency Percent
___________________________________________Never Heard/Used 162.8923 67.36In Your Lifetime 42.34217 17.51Since School Began 12.07029 4.99In the Past Month 24.53276 10.14
Frequency Missing = 14.162493773
RECENT LIQUOR USE
q17f Frequency Percent___________________________________________Never Heard/Used 153.5885 61.70In Your Lifetime 39.82043 16.00Since School Began 17.27943 6.94In the Past Month 38.2475 15.36
Frequency Missing = 7.0641512984
RECENT MARIJUANA USE
q18a Frequency Percent___________________________________________Never Heard/Used 196.6049 80.22In Your Lifetime 15.55906 6.35Since School Began 12.99245 5.30In the Past Month 19.93265 8.13
Frequency Missing = 10.910923404
RECENT COCAINE USE
q18b Frequency Percent
___________________________________________Never Heard/Used 230.5686 96.38In Your Lifetime 3.767704 1.57Since School Began 2.047331 0.86In the Past Month 2.845545 1.19
Frequency Missing = 16.77083508
RECENT CRACK USE
q18c Frequency Percent___________________________________________Never Heard/Used 233.053 97.11In Your Lifetime 3.970717 1.65
Since School Began 1.844318 0.77In the Past Month 1.125172 0.47
Frequency Missing = 16.006811891
The frequencies have been weighted so that theanalysis reflects the distribution of students by grade
level in the district

8/14/2019 GREGG COUNTY - Sabine ISD - 2002 Texas School Survey of Drug and Alcohol Use
http://slidepdf.com/reader/full/gregg-county-sabine-isd-2002-texas-school-survey-of-drug-and-alcohol-use 50/83
SabineSpring 2002
The FREQ Procedure
RECENT HALLUCINOGEN USE
q18e Frequency Percent
___________________________________________Never Heard/Used 231.5667 98.25In Your Lifetime 1.001227 0.42Since School Began 2.126399 0.90In the Past Month 1.001227 0.42
Frequency Missing = 20.304486013
RECENT UPPER USE
q18f Frequency Percent___________________________________________Never Heard/Used 226.8319 96.58In Your Lifetime 2.924613 1.25Since School Began 3.172502 1.35In the Past Month 1.923386 0.82
Frequency Missing = 21.147577137
RECENT DOWNER USE
q18g Frequency Percent___________________________________________Never Heard/Used 228.002 96.65In Your Lifetime 1.923386 0.82Since School Began 1.923386 0.82In the Past Month 4.049785 1.72
Frequency Missing = 20.101473384
RECENT ROHYPNOL USE
q18h Frequency Percent
___________________________________________Never Heard/Used 228.1152 95.89In Your Lifetime 5.095888 2.14Since School Began 2.845545 1.20In the Past Month 1.844318 0.78
Frequency Missing = 18.099019396
RECENT STEROID USE
q18i Frequency Percent___________________________________________Never Heard/Used 227.6408 97.91In Your Lifetime 3.846772 1.65
In the Past Month 1.001227 0.43
Frequency Missing = 23.511179623
The frequencies have been weighted so that theanalysis reflects the distribution of students by grade
level in the district

8/14/2019 GREGG COUNTY - Sabine ISD - 2002 Texas School Survey of Drug and Alcohol Use
http://slidepdf.com/reader/full/gregg-county-sabine-isd-2002-texas-school-survey-of-drug-and-alcohol-use 51/83
SabineSpring 2002
The FREQ Procedure
RECENT ECSTASY USE
q18j Frequency Percent
___________________________________________Never Heard/Used 231.7697 97.11In Your Lifetime 2.845545 1.19In the Past Month 4.049785 1.70
Frequency Missing = 17.334996207
RECENT HEROIN USE
q18k Frequency Percent___________________________________________Never Heard/Used 236.8656 97.20In Your Lifetime 2.924613 1.20Since School Began 0.922159 0.38In the Past Month 2.96949 1.22
Frequency Missing = 12.318175655
TOBACCO USE IN PAST MONTH
q19a Frequency Percent_________________________________________Never Heard/Used 184.8274 75.411-2 times 30.02399 12.253-10 times 12.11516 4.9411+ times 18.12252 7.39
Frequency Missing = 10.910923404
ALCOHOL USE IN PAST MONTH
q19b Frequency Percent_________________________________________Never Heard/Used 162.7235 66.431-2 times 54.17525 22.123-10 times 17.32431 7.0711+ times 10.7421 4.39
Frequency Missing = 11.034868098
INHALANT USE IN PAST MONTH
q19c Frequency Percent_________________________________________Never Heard/Used 220.1738 92.631-2 times 7.862366 3.313-10 times 8.739648 3.68
11+ times 0.922159 0.39
Frequency Missing = 18.302032025
The frequencies have been weighted so that theanalysis reflects the distribution of students by grade
level in the district
8/14/2019 GREGG COUNTY - Sabine ISD - 2002 Texas School Survey of Drug and Alcohol Use
http://slidepdf.com/reader/full/gregg-county-sabine-isd-2002-texas-school-survey-of-drug-and-alcohol-use 52/83
SabineSpring 2002
The FREQ Procedure
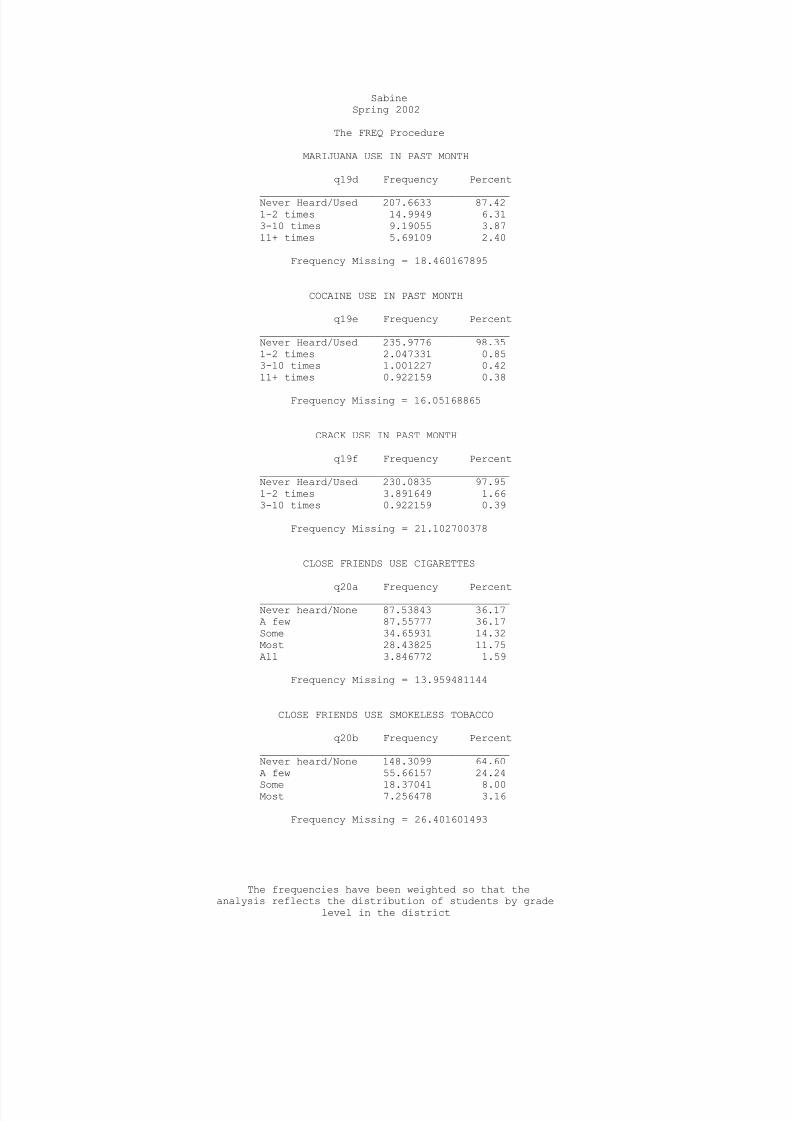
MARIJUANA USE IN PAST MONTH
q19d Frequency Percent
_________________________________________Never Heard/Used 207.6633 87.421-2 times 14.9949 6.313-10 times 9.19055 3.8711+ times 5.69109 2.40
Frequency Missing = 18.460167895
COCAINE USE IN PAST MONTH
q19e Frequency Percent_________________________________________Never Heard/Used 235.9776 98.351-2 times 2.047331 0.853-10 times 1.001227 0.4211+ times 0.922159 0.38
Frequency Missing = 16.05168865
CRACK USE IN PAST MONTH
q19f Frequency Percent_________________________________________Never Heard/Used 230.0835 97.951-2 times 3.891649 1.663-10 times 0.922159 0.39
Frequency Missing = 21.102700378
CLOSE FRIENDS USE CIGARETTES
q20a Frequency Percent_________________________________________Never heard/None 87.53843 36.17A few 87.55777 36.17Some 34.65931 14.32Most 28.43825 11.75All 3.846772 1.59
Frequency Missing = 13.959481144
CLOSE FRIENDS USE SMOKELESS TOBACCO
q20b Frequency Percent_________________________________________Never heard/None 148.3099 64.60A few 55.66157 24.24
Some 18.37041 8.00Most 7.256478 3.16
Frequency Missing = 26.401601493
The frequencies have been weighted so that theanalysis reflects the distribution of students by grade
level in the district

8/14/2019 GREGG COUNTY - Sabine ISD - 2002 Texas School Survey of Drug and Alcohol Use
http://slidepdf.com/reader/full/gregg-county-sabine-isd-2002-texas-school-survey-of-drug-and-alcohol-use 53/83
SabineSpring 2002
The FREQ Procedure
CLOSE FRIENDS USE BEER
q20c Frequency Percent
_________________________________________Never heard/None 95.43183 40.82A few 56.17455 24.03Some 42.19787 18.05Most 31.07009 13.29All 8.897784 3.81
Frequency Missing = 22.227872065
CLOSE FRIENDS USE WINE COOLERS
q20d Frequency Percent_________________________________________Never heard/None 110.1788 48.32A few 53.01589 23.25Some 31.76888 13.93
Most 24.0957 10.57All 8.942661 3.92
Frequency Missing = 27.998030224
CLOSE FRIENDS USE WINE
q20e Frequency Percent_________________________________________Never heard/None 144.804 61.86A few 48.54939 20.74Some 20.54169 8.77Most 15.02909 6.42All 5.174956 2.21
Frequency Missing = 21.900914743
CLOSE FRIENDS USE LIQUOR
q20f Frequency Percent_________________________________________Never heard/None 122.8657 53.67A few 48.19139 21.05Some 24.79449 10.83Most 25.01785 10.93All 8.054693 3.52
Frequency Missing = 27.075871165
The frequencies have been weighted so that theanalysis reflects the distribution of students by grade
level in the district

8/14/2019 GREGG COUNTY - Sabine ISD - 2002 Texas School Survey of Drug and Alcohol Use
http://slidepdf.com/reader/full/gregg-county-sabine-isd-2002-texas-school-survey-of-drug-and-alcohol-use 54/83
SabineSpring 2002
The FREQ Procedure
CLOSE FRIENDS USE INHALANTS
q20g Frequency Percent
_________________________________________Never heard/None 177.4629 76.72A few 37.54658 16.23Some 11.39602 4.93Most 3.970717 1.72All 0.922159 0.40
Frequency Missing = 24.701583096
CLOSE FRIENDS USE MARIJUANA
q20h Frequency Percent_________________________________________Never heard/None 153.3748 63.71A few 34.16353 14.19Some 24.70473 10.26
Most 24.71542 10.27All 3.767704 1.57
Frequency Missing = 15.273829311
DIFFICULT TO GET CIGARETTES
q21a Frequency Percent_______________________________________Never heard of 9.830628 4.26Impossible 37.17474 16.10Very difficult 18.85236 8.17Somewhat diff 29.24715 12.67Somewhat easy 47.51397 20.58Very easy 88.22867 38.22
Frequency Missing = 25.152485112
DIFFICULT TO GET SMOKELESS TOBACCO
q21b Frequency Percent_______________________________________Never heard of 39.97541 17.96Impossible 52.77553 23.72Very difficult 28.92019 13.00Somewhat diff 14.83676 6.67Somewhat easy 41.54395 18.67Very easy 44.4824 19.99
Frequency Missing = 33.465752792
The frequencies have been weighted so that theanalysis reflects the distribution of students by grade
level in the district

8/14/2019 GREGG COUNTY - Sabine ISD - 2002 Texas School Survey of Drug and Alcohol Use
http://slidepdf.com/reader/full/gregg-county-sabine-isd-2002-texas-school-survey-of-drug-and-alcohol-use 55/83
SabineSpring 2002
The FREQ Procedure
DIFFICULT TO GET BEER
q21c Frequency Percent
_______________________________________Never heard of 12.1462 5.50Impossible 33.81307 15.32Very difficult 28.84112 13.07Somewhat diff 25.62374 11.61Somewhat easy 45.58305 20.65Very easy 74.68275 33.84
Frequency Missing = 35.31007091
DIFFICULT TO GET WINE COOLERS
q21d Frequency Percent_______________________________________Never heard of 13.99052 6.52Impossible 39.59391 18.46
Very difficult 25.76152 12.01Somewhat diff 32.59814 15.20Somewhat easy 46.0308 21.46Very easy 56.49397 26.34
Frequency Missing = 41.531131084
DIFFICULT TO GET WINE
q21e Frequency Percent_______________________________________Never heard of 14.39655 6.57Impossible 44.56585 20.35Very difficult 36.5485 16.69Somewhat diff 30.70895 14.02Somewhat easy 37.866 17.29
Very easy 54.92859 25.08
Frequency Missing = 36.985567575
DIFFICULT TO GET LIQUOR
q21f Frequency Percent_______________________________________Never heard of 15.8038 7.02Impossible 54.27254 24.12Very difficult 35.62634 15.83Somewhat diff 24.37463 10.83Somewhat easy 42.0494 18.69Very easy 52.8609 23.50
Frequency Missing = 31.012396788
The frequencies have been weighted so that theanalysis reflects the distribution of students by grade
level in the district

8/14/2019 GREGG COUNTY - Sabine ISD - 2002 Texas School Survey of Drug and Alcohol Use
http://slidepdf.com/reader/full/gregg-county-sabine-isd-2002-texas-school-survey-of-drug-and-alcohol-use 56/83
SabineSpring 2002
The FREQ Procedure
DIFFICULT TO GET INHALANTS
q21g Frequency Percent
_______________________________________Never heard of 25.65793 11.35Impossible 48.04079 21.26Very difficult 14.07274 6.23Somewhat diff 13.39847 5.93Somewhat easy 21.01295 9.30Very easy 103.8059 45.93
Frequency Missing = 30.011169794
DIFFICULT TO GET MARIJUANA
q21h Frequency Percent_______________________________________Never heard of 27.02784 11.97Impossible 86.83649 38.47
Very difficult 25.54782 11.32Somewhat diff 25.45807 11.28Somewhat easy 29.61796 13.12Very easy 31.21856 13.83
Frequency Missing = 30.293250358
DIFFICULT TO GET COCAINE
q21i Frequency Percent_______________________________________Never heard of 30.75382 14.47Impossible 113.4166 53.36Very difficult 33.8846 15.94Somewhat diff 14.15181 6.66Somewhat easy 6.816262 3.21
Very easy 13.52242 6.36
Frequency Missing = 43.454517137
DIFFICULT TO GET CRACK
q21j Frequency Percent_______________________________________Never heard of 32.72208 15.12Impossible 114.5311 52.92Very difficult 31.9719 14.77Somewhat diff 16.15426 7.46Somewhat easy 7.817489 3.61Very easy 13.24033 6.12
Frequency Missing = 39.562868272
The frequencies have been weighted so that theanalysis reflects the distribution of students by grade
level in the district
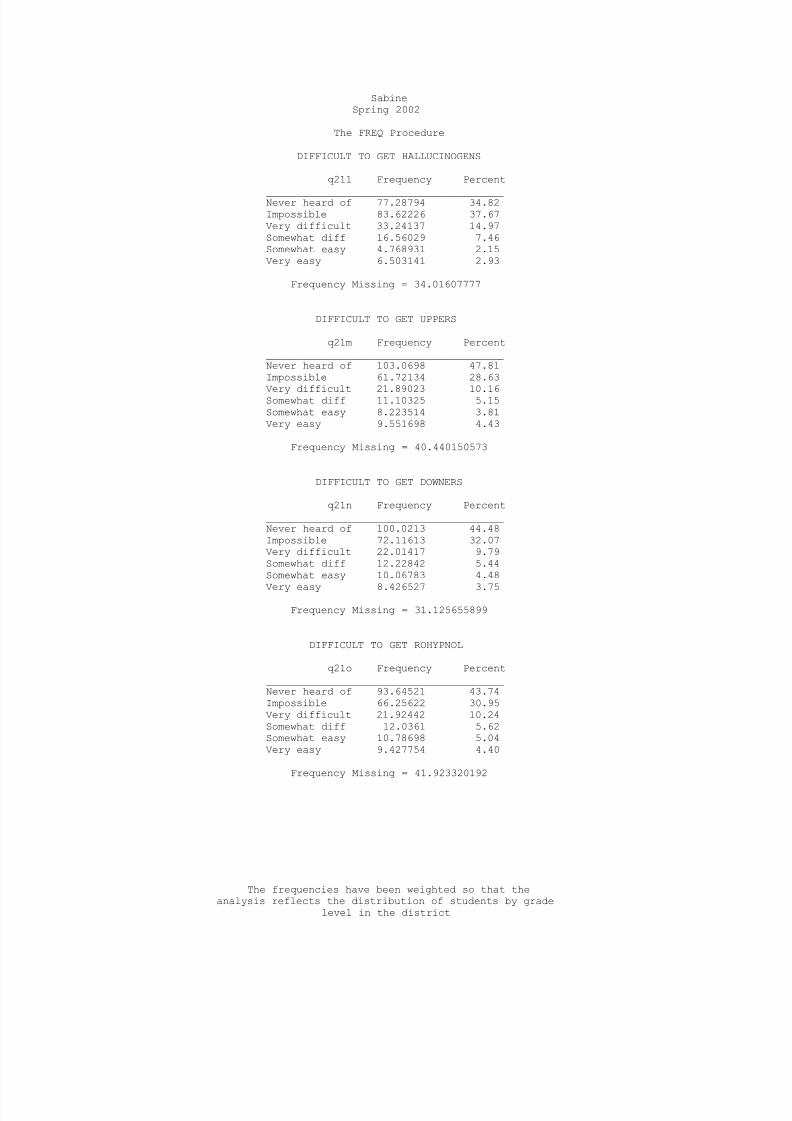
8/14/2019 GREGG COUNTY - Sabine ISD - 2002 Texas School Survey of Drug and Alcohol Use
http://slidepdf.com/reader/full/gregg-county-sabine-isd-2002-texas-school-survey-of-drug-and-alcohol-use 57/83
SabineSpring 2002
The FREQ Procedure
DIFFICULT TO GET HALLUCINOGENS
q21l Frequency Percent
_______________________________________Never heard of 77.28794 34.82Impossible 83.62226 37.67Very difficult 33.24137 14.97Somewhat diff 16.56029 7.46Somewhat easy 4.768931 2.15Very easy 6.503141 2.93
Frequency Missing = 34.01607777
DIFFICULT TO GET UPPERS
q21m Frequency Percent_______________________________________Never heard of 103.0698 47.81Impossible 61.72134 28.63
Very difficult 21.89023 10.16Somewhat diff 11.10325 5.15Somewhat easy 8.223514 3.81Very easy 9.551698 4.43
Frequency Missing = 40.440150573
DIFFICULT TO GET DOWNERS
q21n Frequency Percent_______________________________________Never heard of 100.0213 44.48Impossible 72.11613 32.07Very difficult 22.01417 9.79Somewhat diff 12.22842 5.44Somewhat easy 10.06783 4.48
Very easy 8.426527 3.75
Frequency Missing = 31.125655899
DIFFICULT TO GET ROHYPNOL
q21o Frequency Percent_______________________________________Never heard of 93.64521 43.74Impossible 66.25622 30.95Very difficult 21.92442 10.24Somewhat diff 12.0361 5.62Somewhat easy 10.78698 5.04Very easy 9.427754 4.40
Frequency Missing = 41.923320192
The frequencies have been weighted so that theanalysis reflects the distribution of students by grade
level in the district

8/14/2019 GREGG COUNTY - Sabine ISD - 2002 Texas School Survey of Drug and Alcohol Use
http://slidepdf.com/reader/full/gregg-county-sabine-isd-2002-texas-school-survey-of-drug-and-alcohol-use 58/83
SabineSpring 2002
The FREQ Procedure
DIFFICULT TO GET STEROIDS
q21p Frequency Percent
_______________________________________Never heard of 44.51029 20.02Impossible 102.3165 46.02Very difficult 24.30939 10.93Somewhat diff 27.5054 12.37Somewhat easy 13.15058 5.91Very easy 10.55293 4.75
Frequency Missing = 33.654929271
DIFFICULT TO GET ECSTASY
q21q Frequency Percent_______________________________________Never heard of 67.18591 29.03Impossible 101.9136 44.04
Very difficult 21.3741 9.24Somewhat diff 17.3585 7.50Somewhat easy 11.2272 4.85Very easy 12.35237 5.34
Frequency Missing = 24.588323985
DIFFICULT TO GET HEROIN
q21r Frequency Percent_______________________________________Never heard of 50.88634 21.93Impossible 127.6164 54.99Very difficult 22.29625 9.61Somewhat diff 15.68301 6.76Somewhat easy 9.066605 3.91
Very easy 6.503141 2.80
Frequency Missing = 23.948245489
AGE WHEN FIRST USED CIGARETTES
q22a Frequency Percent______________________________________9 or younger 33.84726 30.0510 years old 25.58955 22.7211 years old 14.52364 12.8912 years old 18.44948 16.3813 years old 11.10325 9.8614 years old 6.131307 5.4415 years old 2.002454 1.7818 or older 1.001227 0.89
Frequency Missing = 143.35183003
The frequencies have been weighted so that theanalysis reflects the distribution of students by grade
level in the district

8/14/2019 GREGG COUNTY - Sabine ISD - 2002 Texas School Survey of Drug and Alcohol Use
http://slidepdf.com/reader/full/gregg-county-sabine-isd-2002-texas-school-survey-of-drug-and-alcohol-use 59/83
SabineSpring 2002
The FREQ Procedure
AGE WHEN FIRST USED SMOKELESS TOBACCO
q22b Frequency Percent
______________________________________9 or younger 11.91215 28.0210 years old 5.219833 12.2811 years old 7.019275 16.5112 years old 6.052239 14.2413 years old 7.053466 16.5914 years old 4.252797 10.0015 years old 1.001227 2.36
Frequency Missing = 213.48901309
AGE WHEN FIRST USED BEER
q22c Frequency Percent______________________________________9 or younger 26.74891 27.36
10 years old 11.99122 12.2711 years old 13.63252 13.9412 years old 15.68301 16.0413 years old 17.32431 17.7214 years old 9.382877 9.6015 years old 3.003681 3.07
Frequency Missing = 158.23347024
AGE WHEN FIRST USED WINE COOLERS
q22d Frequency Percent______________________________________9 or younger 24.93879 22.1210 years old 18.44633 16.3611 years old 11.91215 10.56
12 years old 29.43947 26.1113 years old 12.5105 11.0914 years old 11.50928 10.2115 years old 4.004908 3.55
Frequency Missing = 143.23857092
AGE WHEN FIRST USED WINE
q22e Frequency Percent______________________________________9 or younger 9.988764 12.7410 years old 11.99122 15.2911 years old 11.193 14.2712 years old 15.71405 20.0413 years old 17.27943 22.03
14 years old 8.257705 10.5315 years old 4.004908 5.11
Frequency Missing = 177.57092043
The frequencies have been weighted so that theanalysis reflects the distribution of students by grade
level in the district

8/14/2019 GREGG COUNTY - Sabine ISD - 2002 Texas School Survey of Drug and Alcohol Use
http://slidepdf.com/reader/full/gregg-county-sabine-isd-2002-texas-school-survey-of-drug-and-alcohol-use 60/83
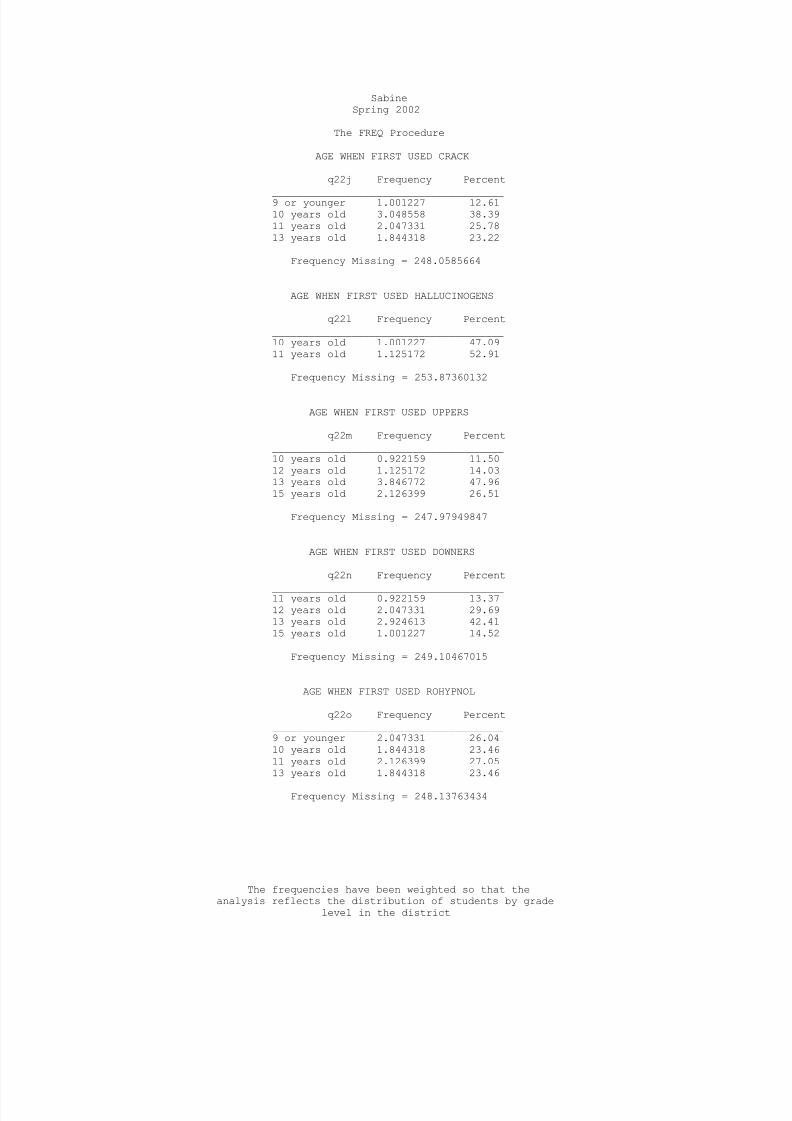
8/14/2019 GREGG COUNTY - Sabine ISD - 2002 Texas School Survey of Drug and Alcohol Use
http://slidepdf.com/reader/full/gregg-county-sabine-isd-2002-texas-school-survey-of-drug-and-alcohol-use 61/83
SabineSpring 2002
The FREQ Procedure
AGE WHEN FIRST USED CRACK
q22j Frequency Percent
______________________________________9 or younger 1.001227 12.6110 years old 3.048558 38.3911 years old 2.047331 25.7813 years old 1.844318 23.22
Frequency Missing = 248.0585664
AGE WHEN FIRST USED HALLUCINOGENS
q22l Frequency Percent______________________________________10 years old 1.001227 47.0911 years old 1.125172 52.91
Frequency Missing = 253.87360132
AGE WHEN FIRST USED UPPERS
q22m Frequency Percent______________________________________10 years old 0.922159 11.5012 years old 1.125172 14.0313 years old 3.846772 47.9615 years old 2.126399 26.51
Frequency Missing = 247.97949847
AGE WHEN FIRST USED DOWNERS
q22n Frequency Percent
______________________________________11 years old 0.922159 13.3712 years old 2.047331 29.6913 years old 2.924613 42.4115 years old 1.001227 14.52
Frequency Missing = 249.10467015
AGE WHEN FIRST USED ROHYPNOL
q22o Frequency Percent______________________________________9 or younger 2.047331 26.0410 years old 1.844318 23.4611 years old 2.126399 27.0513 years old 1.844318 23.46
Frequency Missing = 248.13763434
The frequencies have been weighted so that theanalysis reflects the distribution of students by grade
level in the district

8/14/2019 GREGG COUNTY - Sabine ISD - 2002 Texas School Survey of Drug and Alcohol Use
http://slidepdf.com/reader/full/gregg-county-sabine-isd-2002-texas-school-survey-of-drug-and-alcohol-use 62/83
SabineSpring 2002
The FREQ Procedure
AGE WHEN FIRST USED STEROIDS
q22p Frequency Percent
______________________________________10 years old 0.922159 31.5313 years old 1.001227 34.2314 years old 1.001227 34.23
Frequency Missing = 253.07538695
AGE WHEN FIRST USED ECSTASY
q22q Frequency Percent______________________________________10 years old 1.125172 16.3212 years old 2.845545 41.2713 years old 1.923386 27.8914 years old 1.001227 14.52
Frequency Missing = 249.10467015
AGE WHEN FIRST USED HEROIN
q22r Frequency Percent______________________________________10 years old 2.924613 58.8212 years old 2.047331 41.18
Frequency Missing = 251.02805621
HOW OFTEN NORMALLY USE CIGARETTES
q23a Frequency Percent_________________________________________
Every day 11.14813 4.82Several times/wk 7.019275 3.03Several times/mo 25.38969 10.98About once/month 13.66671 5.91About once/year 12.82362 5.54< once/year 29.52923 12.77Never used 131.7111 56.95
Frequency Missing = 24.712268679
The frequencies have been weighted so that theanalysis reflects the distribution of students by grade
level in the district

8/14/2019 GREGG COUNTY - Sabine ISD - 2002 Texas School Survey of Drug and Alcohol Use
http://slidepdf.com/reader/full/gregg-county-sabine-isd-2002-texas-school-survey-of-drug-and-alcohol-use 63/83
SabineSpring 2002
The FREQ Procedure
HOW OFTEN NORMALLY USE SMOKELESS TOBACCO
q23b Frequency Percent
_________________________________________Every day 1.001227 0.45Several times/wk 3.127626 1.42Several times/mo 9.19055 4.17About once/month 7.132534 3.24About once/year 7.896557 3.59< once/year 13.36428 6.07Never used 178.5059 81.06
Frequency Missing = 35.781327952
HOW OFTEN NORMALLY USE BEER
q23c Frequency Percent_________________________________________Every day 2.002454 0.92
Several times/wk 8.818716 4.03Several times/mo 19.49559 8.91About once/month 24.62567 11.26About once/year 16.91829 7.74< once/year 20.01172 9.15Never used 126.815 57.99
Frequency Missing = 37.312524897
HOW OFTEN NORMALLY USE WINE COOLERS
q23d Frequency Percent_________________________________________Every day 1.001227 0.48Several times/wk 5.095888 2.43Several times/mo 22.21719 10.61
About once/month 20.04591 9.57About once/year 26.14303 12.48< once/year 28.11129 13.42Never used 106.8824 51.02
Frequency Missing = 46.503074877
HOW OFTEN NORMALLY USE WINE
q23e Frequency Percent_________________________________________Every day 1.001227 0.45Several times/wk 2.126399 0.96Several times/mo 15.07397 6.79About once/month 11.94634 5.38About once/year 18.55959 8.36
< once/year 28.42756 12.81Never used 144.7591 65.24
Frequency Missing = 34.105831287
The frequencies have been weighted so that theanalysis reflects the distribution of students by grade
level in the district

8/14/2019 GREGG COUNTY - Sabine ISD - 2002 Texas School Survey of Drug and Alcohol Use
http://slidepdf.com/reader/full/gregg-county-sabine-isd-2002-texas-school-survey-of-drug-and-alcohol-use 64/83
SabineSpring 2002
The FREQ Procedure
HOW OFTEN NORMALLY USE LIQUOR
q23f Frequency Percent
_________________________________________Several times/wk 3.846772 1.74Several times/mo 21.49804 9.72About once/month 23.17354 10.48About once/year 10.02296 4.53< once/year 24.14057 10.92Never used 138.3799 62.60
Frequency Missing = 34.938236828
HOW OFTEN NORMALLY USE INHALANTS
q23g Frequency Percent_________________________________________Every day 3.048558 1.52Several times/mo 7.580285 3.77
About once/month 2.047331 1.02About once/year 3.003681 1.50< once/year 9.86482 4.91Never used 175.2917 87.28
Frequency Missing = 55.163654906
HOW OFTEN NORMALLY USE MARIJUANA
q23h Frequency Percent_________________________________________Every day 3.970717 1.92Several times/wk 3.891649 1.88Several times/mo 6.018048 2.91About once/month 7.301355 3.53About once/year 11.02418 5.33
< once/year 10.55293 5.10Never used 164.0848 79.33
Frequency Missing = 49.156292943
HOW OFTEN NORMALLY USE COCAINE
q23i Frequency Percent_________________________________________Several times/wk 1.001227 0.50Several times/mo 2.047331 1.02About once/month 0.922159 0.46< once/year 1.001227 0.50Never used 195.1453 97.52
Frequency Missing = 55.882801336
The frequencies have been weighted so that theanalysis reflects the distribution of students by grade
level in the district

8/14/2019 GREGG COUNTY - Sabine ISD - 2002 Texas School Survey of Drug and Alcohol Use
http://slidepdf.com/reader/full/gregg-county-sabine-isd-2002-texas-school-survey-of-drug-and-alcohol-use 65/83
SabineSpring 2002
The FREQ Procedure
HOW OFTEN NORMALLY USE CRACK
q23j Frequency Percent
_________________________________________Several times/mo 1.125172 0.55About once/month 2.96949 1.45About once/year 1.923386 0.94< once/year 2.845545 1.39Never used 196.1465 95.68
Frequency Missing = 50.989925478
HOW OFTEN NORMALLY USE HALLUCINOGENS
q23l Frequency Percent_________________________________________Several times/mo 1.125172 0.56About once/year 1.001227 0.50Never used 199.3842 98.94
Frequency Missing = 54.489385235
HOW OFTEN NORMALLY USE UPPERS
q23m Frequency Percent_________________________________________About once/month 3.970717 1.94About once/year 0.922159 0.45< once/year 1.001227 0.49Never used 198.6651 97.12
Frequency Missing = 51.440827494
HOW OFTEN NORMALLY USE DOWNERS
q23n Frequency Percent
_________________________________________Several times/wk 0.922159 0.44Several times/mo 1.125172 0.54About once/month 1.923386 0.92About once/year 1.923386 0.92< once/year 2.002454 0.95Never used 202.2543 96.24
Frequency Missing = 45.849160232
HOW OFTEN NORMALLY USE ROHYPNOL
q23o Frequency Percent_________________________________________
Several times/wk 2.845545 1.43Several times/mo 2.047331 1.03< once/year 2.96949 1.49Never used 191.4224 96.05
Frequency Missing = 56.715206878
The frequencies have been weighted so that theanalysis reflects the distribution of students by grade
level in the district

8/14/2019 GREGG COUNTY - Sabine ISD - 2002 Texas School Survey of Drug and Alcohol Use
http://slidepdf.com/reader/full/gregg-county-sabine-isd-2002-texas-school-survey-of-drug-and-alcohol-use 66/83
SabineSpring 2002
The FREQ Procedure
HOW OFTEN NORMALLY USE STEROIDS
q23p Frequency Percent
_________________________________________Every day 1.001227 0.51About once/year 0.922159 0.47Never used 192.6577 99.01
Frequency Missing = 61.418906257
HOW OFTEN NORMALLY USE ECSTASY
q23q Frequency Percent_________________________________________Several times/mo 0.922159 0.46About once/month 2.126399 1.06< once/year 2.845545 1.41Never used 195.4722 97.07
Frequency Missing = 54.633684955
HOW OFTEN NORMALLY USE HEROIN
q23r Frequency Percent_________________________________________Every day 0.922159 0.45Several times/mo 1.125172 0.55About once/month 0.922159 0.45< once/year 2.002454 0.97Never used 201.2734 97.59
Frequency Missing = 49.754645246
HOW MANY CIGARETTES IN PAST 30 DAYS
q24 Frequency Percent
_________________________________________None 197.448 79.24Less than 1 23.0154 9.24> 1 and < 10 20.49681 8.23> 10 and < 1pk 7.098342 2.85More than 2pks 1.125172 0.45
Frequency Missing = 6.816261911
The frequencies have been weighted so that theanalysis reflects the distribution of students by grade
level in the district

8/14/2019 GREGG COUNTY - Sabine ISD - 2002 Texas School Survey of Drug and Alcohol Use
http://slidepdf.com/reader/full/gregg-county-sabine-isd-2002-texas-school-survey-of-drug-and-alcohol-use 67/83
SabineSpring 2002
The FREQ Procedure
AMOUNT OF BEER AT ONE TIME
q25a Frequency Percent
_________________________________________Never drink this 141.2254 57.9512+ drinks 10.82117 4.449-11 drinks 8.257705 3.395-8 drinks 13.66671 5.613-4 drinks 9.303809 3.822 drinks 12.76908 5.241 drink 25.94001 10.65< 1 drink 21.6979 8.90
Frequency Missing = 12.318175655
AMOUNT OF WINE COOLERS AT ONE TIME
q25b Frequency Percent_________________________________________
Never drink this 119.4143 49.7312+ drinks 12.2733 5.119-11 drinks 4.927067 2.055-8 drinks 13.38463 5.573-4 drinks 16.96316 7.062 drinks 15.52487 6.471 drink 28.64126 11.93< 1 drink 28.98857 12.07
Frequency Missing = 15.882867197
AMOUNT OF WINE AT ONE TIME
q25c Frequency Percent_________________________________________Never drink this 153.8706 64.38
12+ drinks 2.845545 1.199-11 drinks 3.846772 1.615-8 drinks 1.923386 0.803-4 drinks 8.852907 3.702 drinks 11.59903 4.851 drink 31.11497 13.02< 1 drink 24.93879 10.43
Frequency Missing = 17.008038885
The frequencies have been weighted so that theanalysis reflects the distribution of students by grade
level in the district

8/14/2019 GREGG COUNTY - Sabine ISD - 2002 Texas School Survey of Drug and Alcohol Use
http://slidepdf.com/reader/full/gregg-county-sabine-isd-2002-texas-school-survey-of-drug-and-alcohol-use 68/83
SabineSpring 2002
The FREQ Procedure
AMOUNT OF LIQUOR AT ONE TIME
q25d Frequency Percent
_________________________________________Never drink this 152.6663 63.3512+ drinks 9.775066 4.069-11 drinks 7.132534 2.965-8 drinks 15.11884 6.273-4 drinks 12.02541 4.992 drinks 16.12007 6.691 drink 16.24402 6.74< 1 drink 11.91215 4.94
Frequency Missing = 15.005584897
BEERS, FIVE OR MORE AT ONE TIME
q26a Frequency Percent_________________________________________
Never drink this 152.3736 62.44Never 5+ at time 30.36163 12.44Several times/wk 7.975625 3.27Several times/mo 10.90024 4.47About once/month 13.02664 5.34< once/month 15.56975 6.38< once/year 13.83554 5.67
Frequency Missing = 11.957027157
WINE COOLERS, FIVE OR MORE AT ONE TIME
q26b Frequency Percent_________________________________________Never drink this 133.2049 56.32Never 5+ at time 34.28747 14.50
Several times/wk 8.020502 3.39Several times/mo 9.775066 4.13About once/month 17.7165 7.49< once/month 14.52364 6.14< once/year 18.96562 8.02
Frequency Missing = 19.506271647
WINE, FIVE OR MORE AT ONE TIME
q26c Frequency Percent_________________________________________Never drink this 167.393 69.79Never 5+ at time 24.14057 10.06Several times/wk 3.846772 1.60Several times/mo 3.92584 1.64
About once/month 9.819943 4.09< once/month 11.14813 4.65< once/year 19.59501 8.17
Frequency Missing = 16.130756585
The frequencies have been weighted so that theanalysis reflects the distribution of students by grade
level in the district

8/14/2019 GREGG COUNTY - Sabine ISD - 2002 Texas School Survey of Drug and Alcohol Use
http://slidepdf.com/reader/full/gregg-county-sabine-isd-2002-texas-school-survey-of-drug-and-alcohol-use 69/83
SabineSpring 2002
The FREQ Procedure
LIQUOR, FIVE OR MORE AT ONE TIME
q26d Frequency Percent
_________________________________________Never drink this 153.1825 63.58Never 5+ at time 20.09079 8.34Every day 1.001227 0.42Several times/wk 5.849226 2.43Several times/mo 11.02418 4.58About once/month 19.92197 8.27< once/month 13.27453 5.51< once/year 16.57097 6.88
Frequency Missing = 15.084652832
GET ALCOHOLIC BEVERAGES FROM HOME
q27a Frequency Percent_________________________________________
Do not Drink 108.5033 46.30Never 60.70943 25.91Seldom 39.69648 16.94Most of the Time 15.07397 6.43Always 10.34991 4.42
Frequency Missing = 21.666861505
GET ALCOHOLIC BEVERAGES FROM FRIENDS
q27b Frequency Percent_________________________________________Do not Drink 100.8098 42.93Never 41.13478 17.52Seldom 34.33235 14.62Most of the Time 39.29361 16.73
Always 19.2477 8.20
Frequency Missing = 21.181768313
GET ALCOHOLIC BEVERAGES FROM A STORE
q27c Frequency Percent_________________________________________Do not Drink 101.7662 43.99Never 101.8891 44.04Seldom 17.32431 7.49Most of the Time 7.380423 3.19Always 3.003681 1.30
Frequency Missing = 24.63635131
The frequencies have been weighted so that theanalysis reflects the distribution of students by grade
level in the district

8/14/2019 GREGG COUNTY - Sabine ISD - 2002 Texas School Survey of Drug and Alcohol Use
http://slidepdf.com/reader/full/gregg-county-sabine-isd-2002-texas-school-survey-of-drug-and-alcohol-use 70/83
SabineSpring 2002
The FREQ Procedure
GET ALCOHOLIC BEVERAGES AT PARTIES
q27d Frequency Percent
_________________________________________Do not Drink 97.79544 43.24Never 45.74557 20.22Seldom 31.87899 14.09Most of the Time 24.58079 10.87Always 26.1879 11.58
Frequency Missing = 29.811307732
GET ALCOHOLIC BEVERAGES FROM OTHER
q27e Frequency Percent_________________________________________Do not Drink 104.5326 45.96Never 45.15037 19.85Seldom 40.3504 17.74
Most of the Time 20.04591 8.81Always 17.3585 7.63
Frequency Missing = 28.562191351
DANGEROUS FOR KIDS TO USE TOBACCO
q28a Frequency Percent___________________________________Very 106.5009 44.16Somewhat 80.64208 33.43Not very 32.71455 13.56Not at all 7.098342 2.94Don't know 14.24156 5.90
Frequency Missing = 14.802572268
DANGEROUS FOR KIDS TO USE ALCOHOL
q28b Frequency Percent___________________________________Very 109.776 46.69Somewhat 76.63717 32.59Not very 30.30607 12.89Not at all 6.097115 2.59Don't know 12.31818 5.24
Frequency Missing = 20.865496573
The frequencies have been weighted so that theanalysis reflects the distribution of students by grade
level in the district

8/14/2019 GREGG COUNTY - Sabine ISD - 2002 Texas School Survey of Drug and Alcohol Use
http://slidepdf.com/reader/full/gregg-county-sabine-isd-2002-texas-school-survey-of-drug-and-alcohol-use 71/83
SabineSpring 2002
The FREQ Procedure
DANGEROUS FOR KIDS TO USE INHALANTS
q28c Frequency Percent
___________________________________Very 169.2705 75.75Somewhat 33.84726 15.15Not very 7.817489 3.50Not at all 4.049785 1.81Don't know 8.471404 3.79
Frequency Missing = 32.543593733
DANGEROUS FOR KIDS TO USE MARIJUANA
q28d Frequency Percent___________________________________Very 153.1162 69.67Somewhat 33.36531 15.18Not very 16.5261 7.52
Not at all 10.7421 4.89Don't know 6.018048 2.74
Frequency Missing = 36.232229969
DANGEROUS FOR KIDS TO USE COCAINE
q28e Frequency Percent___________________________________Very 199.6321 89.23Somewhat 10.66303 4.77Not very 2.126399 0.95Not at all 2.845545 1.27Don't know 8.471404 3.79
Frequency Missing = 32.261513169
DANGEROUS FOR KIDS TO USE CRACK
q28f Frequency Percent___________________________________Very 188.1121 86.98Somewhat 13.71159 6.34Not very 2.126399 0.98Not at all 1.923386 0.89Don't know 10.39479 4.81
Frequency Missing = 39.731689725
The frequencies have been weighted so that theanalysis reflects the distribution of students by grade
level in the district
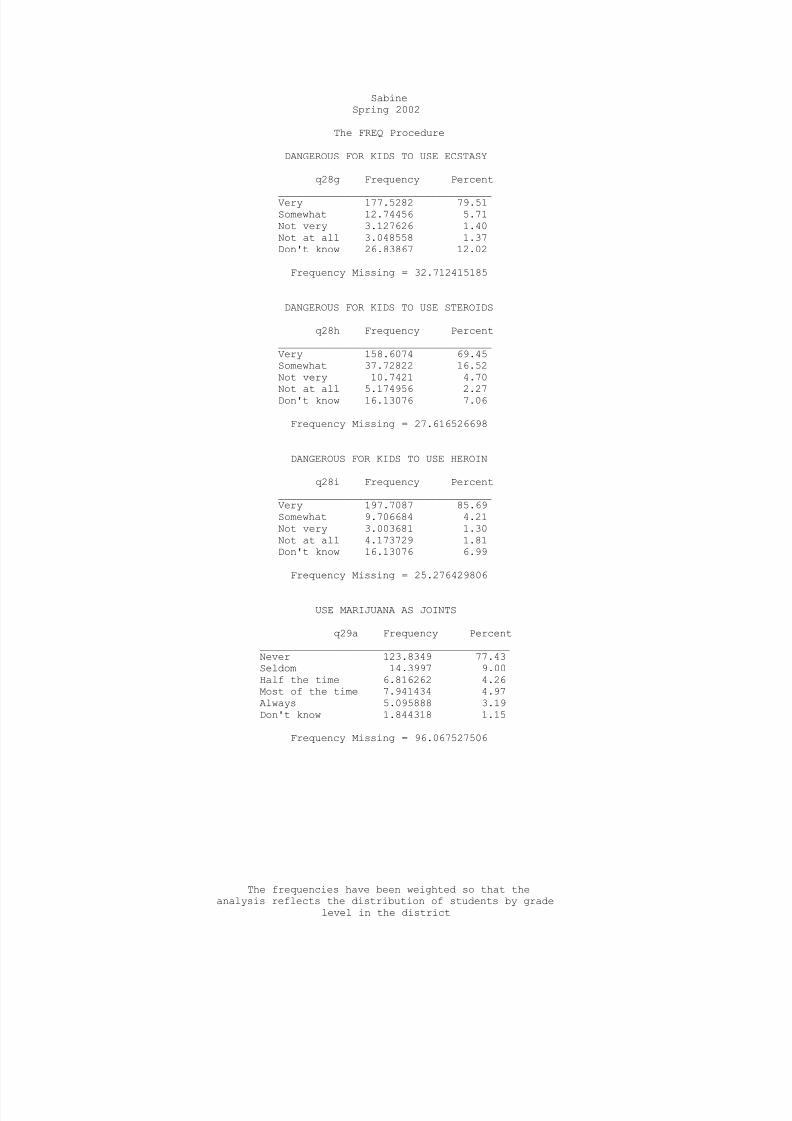
8/14/2019 GREGG COUNTY - Sabine ISD - 2002 Texas School Survey of Drug and Alcohol Use
http://slidepdf.com/reader/full/gregg-county-sabine-isd-2002-texas-school-survey-of-drug-and-alcohol-use 72/83
SabineSpring 2002
The FREQ Procedure
DANGEROUS FOR KIDS TO USE ECSTASY
q28g Frequency Percent
___________________________________Very 177.5282 79.51Somewhat 12.74456 5.71Not very 3.127626 1.40Not at all 3.048558 1.37Don't know 26.83867 12.02
Frequency Missing = 32.712415185
DANGEROUS FOR KIDS TO USE STEROIDS
q28h Frequency Percent___________________________________Very 158.6074 69.45Somewhat 37.72822 16.52Not very 10.7421 4.70
Not at all 5.174956 2.27Don't know 16.13076 7.06
Frequency Missing = 27.616526698
DANGEROUS FOR KIDS TO USE HEROIN
q28i Frequency Percent___________________________________Very 197.7087 85.69Somewhat 9.706684 4.21Not very 3.003681 1.30Not at all 4.173729 1.81Don't know 16.13076 6.99
Frequency Missing = 25.276429806
USE MARIJUANA AS JOINTS
q29a Frequency Percent_________________________________________Never 123.8349 77.43Seldom 14.3997 9.00Half the time 6.816262 4.26Most of the time 7.941434 4.97Always 5.095888 3.19Don't know 1.844318 1.15
Frequency Missing = 96.067527506
The frequencies have been weighted so that theanalysis reflects the distribution of students by grade
level in the district

8/14/2019 GREGG COUNTY - Sabine ISD - 2002 Texas School Survey of Drug and Alcohol Use
http://slidepdf.com/reader/full/gregg-county-sabine-isd-2002-texas-school-survey-of-drug-and-alcohol-use 73/83
SabineSpring 2002
The FREQ Procedure
USE MARIJUANA AS BLUNTS
q29b Frequency Percent
_________________________________________Never 122.9918 80.35Seldom 9.269618 6.06Half the time 9.145673 5.97Most of the time 3.767704 2.46Always 6.052239 3.95Don't know 1.844318 1.20
Frequency Missing = 102.92866618
USE MARIJUANA IN BONGS OR WATER PIPES
q29c Frequency Percent_________________________________________Never 130.0559 85.01Seldom 14.32063 9.36
Half the time 2.002454 1.31Most of the time 3.767704 2.46Always 1.001227 0.65Don't know 1.844318 1.21
Frequency Missing = 103.00773411
USE MARIJUANA IN PIPES
q29d Frequency Percent_________________________________________Never 131.0572 85.73Seldom 11.02418 7.21Half the time 7.019275 4.59Most of the time 0.922159 0.60Always 1.001227 0.65
Don't know 1.844318 1.21
Frequency Missing = 103.1316788
USE MARIJUANA OTHER WAYS
q29e Frequency Percent_________________________________________Never 134.983 86.39Seldom 14.44457 9.24Half the time 1.923386 1.23Most of the time 0.922159 0.59Always 1.001227 0.64Don't know 2.96949 1.90
Frequency Missing = 99.756163741
The frequencies have been weighted so that theanalysis reflects the distribution of students by grade
level in the district

8/14/2019 GREGG COUNTY - Sabine ISD - 2002 Texas School Survey of Drug and Alcohol Use
http://slidepdf.com/reader/full/gregg-county-sabine-isd-2002-texas-school-survey-of-drug-and-alcohol-use 74/83
SabineSpring 2002
The FREQ Procedure
DAYS SKIPPED SINCE SEPTEMBER
q30a Frequency Percent
_________________________________None 186.9089 75.541-3 days 51.25063 20.714-9 days 8.257705 3.3410+ days 1.001227 0.40
Frequency Missing = 8.5815120939
DAYS ILL SINCE SEPTEMBER
q30b Frequency Percent_________________________________None 47.35584 19.471-3 days 112.1257 46.114-9 days 66.9892 27.5510+ days 16.69492 6.87
Frequency Missing = 12.834309457
OTHER DAYS MISSED SINCE SEPTEMBER
q30c Frequency Percent_________________________________None 79.6377 33.071-3 days 134.0778 55.684-9 days 22.02486 9.1510+ days 5.051012 2.10
Frequency Missing = 15.208597526
SENT TO PRINCIPAL/DEAN SINCE SEPTEMBER
q30d Frequency Percent
_________________________________None 168.3483 69.911-3 days 50.82425 21.114-9 days 11.06906 4.6010+ days 10.54977 4.38
Frequency Missing = 15.208597526
SOMEONE CALLED HOME SINCE SEPTEMBER
q30e Frequency Percent_________________________________None 197.7567 82.021-3 days 31.09146 12.89
4-9 days 11.34799 4.7110+ days 0.922159 0.38
Frequency Missing = 14.881640203
The frequencies have been weighted so that theanalysis reflects the distribution of students by grade
level in the district

8/14/2019 GREGG COUNTY - Sabine ISD - 2002 Texas School Survey of Drug and Alcohol Use
http://slidepdf.com/reader/full/gregg-county-sabine-isd-2002-texas-school-survey-of-drug-and-alcohol-use 75/83
SabineSpring 2002
The FREQ Procedure
IN TROUBLE FOR DRINKING SINCE SEPTEMBER
q30f Frequency Percent
_________________________________None 232.1308 99.574-9 days 1.001227 0.43
Frequency Missing = 22.867950561
IN TROUBLE FOR DRUG USE SINCE SEPTEMBER
q30g Frequency Percent_________________________________None 239.195 99.584-9 days 1.001227 0.42
Frequency Missing = 15.803799262
DAYS SKIPPED IN PAST MONTH q31a Frequency Percent
_________________________________None 217.5184 89.671-3 days 23.04959 9.504-9 days 1.001227 0.4110+ days 1.001227 0.41
Frequency Missing = 13.429511193
DAYS ILL IN PAST MONTH
q31b Frequency Percent_________________________________None 152.0498 63.88
1-3 days 76.95344 32.334-9 days 6.89533 2.9010+ days 2.126399 0.89
Frequency Missing = 17.975074702
OTHER DAYS MISSED IN PAST MONTH
q31c Frequency Percent_________________________________None 174.019 72.211-3 days 61.08126 25.354-9 days 3.970717 1.6510+ days 1.923386 0.80
Frequency Missing = 15.005584897
The frequencies have been weighted so that theanalysis reflects the distribution of students by grade
level in the district

8/14/2019 GREGG COUNTY - Sabine ISD - 2002 Texas School Survey of Drug and Alcohol Use
http://slidepdf.com/reader/full/gregg-county-sabine-isd-2002-texas-school-survey-of-drug-and-alcohol-use 76/83
SabineSpring 2002
The FREQ Procedure
SENT TO PRINCIPAL/DEAN IN PAST MONTH
q31d Frequency Percent
_________________________________None 212.2772 87.011-3 days 21.90091 8.984-9 days 6.940207 2.8410+ days 2.845545 1.17
Frequency Missing = 12.036095092
SOMEONE CALLED HOME IN PAST MONTH
q31e Frequency Percent_________________________________None 220.6247 91.961-3 days 15.31871 6.394-9 days 3.048558 1.2710+ days 0.922159 0.38
Frequency Missing = 16.085879826
TROUBLE WITH FRIENDS BECAUSE OF DRINKING
q32a Frequency Percent__________________________________None 217.6521 93.101-3 times 14.19668 6.074-9 times 0.922159 0.3910+ times 1.001227 0.43
Frequency Missing = 22.227872065
DRIVEN A CAR AFTER A GOOD BIT TO DRINK
q32b Frequency Percent
__________________________________None 219.9366 96.591-3 times 6.771385 2.9710+ times 1.001227 0.44
Frequency Missing = 28.29079637
CRITICIZED BY DATE BECAUSE OF DRINKING
q32c Frequency Percent__________________________________None 221.5437 95.231-3 times 10.18109 4.384-9 times 0.922159 0.40
Frequency Missing = 23.353043753
The frequencies have been weighted so that theanalysis reflects the distribution of students by grade
level in the district

8/14/2019 GREGG COUNTY - Sabine ISD - 2002 Texas School Survey of Drug and Alcohol Use
http://slidepdf.com/reader/full/gregg-county-sabine-isd-2002-texas-school-survey-of-drug-and-alcohol-use 77/83
SabineSpring 2002
The FREQ Procedure
TROUBLE WITH POLICE BECAUSE OF DRINKING
q32d Frequency Percent
__________________________________None 220.6557 98.291-3 times 1.844318 0.824-9 times 1.001227 0.4510+ times 1.001227 0.45
Frequency Missing = 31.49748998
TROUBLE WITH FRIENDS BECAUSE OF DRUG USE
q32e Frequency Percent__________________________________None 213.9634 95.661-3 times 6.771385 3.034-9 times 0.922159 0.4110+ times 2.002454 0.90
Frequency Missing = 32.340581104
DRIVEN A CAR WHILE HIGH FROM DRUGS
q32f Frequency Percent__________________________________None 215.4359 96.431-3 times 6.974398 3.1210+ times 1.001227 0.45
Frequency Missing = 32.588470492
CRITICIZED BY DATE BECAUSE OF DRUG USE
q32g Frequency Percent__________________________________None 219.7336 96.231-3 times 5.69109 2.494-9 times 1.923386 0.8410+ times 1.001227 0.44
Frequency Missing = 27.650717875
TROUBLE WITH POLICE BECAUSE OF DRUG USE
q32h Frequency Percent__________________________________None 226.7187 98.731-3 times 1.923386 0.8410+ times 1.001227 0.44
Frequency Missing = 26.356724735
The frequencies have been weighted so that theanalysis reflects the distribution of students by grade
level in the district

8/14/2019 GREGG COUNTY - Sabine ISD - 2002 Texas School Survey of Drug and Alcohol Use
http://slidepdf.com/reader/full/gregg-county-sabine-isd-2002-texas-school-survey-of-drug-and-alcohol-use 78/83
SabineSpring 2002
The FREQ Procedure
CLASS DAYS DRUNK ON ALCOHOL SINCE SEPT
q33a Frequency Percent
_________________________________None 216.9778 91.191-3 days 14.9949 6.304-9 days 2.96949 1.2510+ days 3.003681 1.26
Frequency Missing = 18.054142637
CLASS DAYS HIGH ON MARIJUANA SINCE SEPT
q33b Frequency Percent_________________________________None 214.5725 92.121-3 days 13.58765 5.834-9 days 1.844318 0.7910+ days 2.924613 1.26
Frequency Missing = 23.070963189
CLASS DAYS HIGH ON INHALANTS SINCE SEPT
q33c Frequency Percent_________________________________None 229.1271 96.211-3 days 5.973171 2.514-9 days 1.125172 0.4710+ days 1.923386 0.81
Frequency Missing = 17.851130009
CLASS DAYS HIGH ON OTHER DRUG(S)
q33d Frequency Percent
_________________________________None 227.2828 94.361-3 days 9.661807 4.0110+ days 3.92584 1.63
Frequency Missing = 15.129529591
ALCOHOL USE AT PARTIES THIS SCHOOL YEAR
q34a Frequency Percent_________________________________________Never 101.2469 41.40Seldom 44.05287 18.01Half the time 16.60201 6.79
Most of the time 32.36409 13.23Always 22.31976 9.13Don't know 6.89533 2.82Didn't attend 21.09201 8.62
Frequency Missing = 11.427057206
The frequencies have been weighted so that theanalysis reflects the distribution of students by grade
level in the district

8/14/2019 GREGG COUNTY - Sabine ISD - 2002 Texas School Survey of Drug and Alcohol Use
http://slidepdf.com/reader/full/gregg-county-sabine-isd-2002-texas-school-survey-of-drug-and-alcohol-use 79/83
SabineSpring 2002
The FREQ Procedure
DRUG USE AT PARTIES THIS SCHOOL YEAR
q34b Frequency Percent
_________________________________________Never 138.6727 56.14Seldom 27.94247 11.31Half the time 17.24524 6.98Most of the time 21.29503 8.62Always 10.02296 4.06Don't know 9.740875 3.94Didn't attend 22.09324 8.94
Frequency Missing = 8.9875373512
SOUGHT HELP FOR DRUG/ALCOHOL PROBLEM
q35 Frequency Percent___________________________________No 215.6528 93.43
Yes 15.16372 6.57
Frequency Missing = 25.183525721
WOULD SEEK HELP FROM SCHOOL COUNSELOR
q36a Frequency Percent___________________________________No 165.162 67.86Yes 78.20673 32.14
Frequency Missing = 12.631296828
WOULD SEEK HELP OUTSIDE OF SCHOOL
q36b Frequency Percent___________________________________No 152.4409 63.98Yes 85.83189 36.02
Frequency Missing = 17.727185315
WOULD SEEK HELP FROM OTHER COUNSELOR
q36c Frequency Percent___________________________________No 154.984 65.87Yes 80.31929 34.13
Frequency Missing = 20.69667512
The frequencies have been weighted so that theanalysis reflects the distribution of students by grade
level in the district

8/14/2019 GREGG COUNTY - Sabine ISD - 2002 Texas School Survey of Drug and Alcohol Use
http://slidepdf.com/reader/full/gregg-county-sabine-isd-2002-texas-school-survey-of-drug-and-alcohol-use 80/83
SabineSpring 2002
The FREQ Procedure
WOULD SEEK HELP FROM PARENTS
q36d Frequency Percent
___________________________________No 110.3636 46.51Yes 126.9421 53.49
Frequency Missing = 18.694221133
WOULD SEEK HELP FROM A MEDICAL DOCTOR
q36e Frequency Percent___________________________________No 165.4237 70.10Yes 70.55389 29.90
Frequency Missing = 20.022405449
WOULD SEEK HELP FROM FRIENDS q36f Frequency Percent___________________________________No 54.91577 22.93Yes 184.5613 77.07
Frequency Missing = 16.522945693
WOULD SEEK HELP FROM ANOTHER ADULT
q36g Frequency Percent___________________________________No 96.19799 40.86Yes 139.2293 59.14
Frequency Missing = 20.572730427
WOULD NOT SEEK HELP
q36h Frequency Percent___________________________________No 209.2501 87.85Yes 28.94369 12.15
Frequency Missing = 17.80625325
DRUG/ALCOHOL INFO--HEALTH CLASS
q37a Frequency Percent___________________________________
No 106.967 56.08Yes 83.76735 43.92
Frequency Missing = 65.265678362
The frequencies have been weighted so that theanalysis reflects the distribution of students by grade
level in the district

8/14/2019 GREGG COUNTY - Sabine ISD - 2002 Texas School Survey of Drug and Alcohol Use
http://slidepdf.com/reader/full/gregg-county-sabine-isd-2002-texas-school-survey-of-drug-and-alcohol-use 81/83
SabineSpring 2002
The FREQ Procedure
DRUG/ALCOHOL INFO--ASSEMBLY PROGRAM
q37b Frequency Percent
___________________________________No 100.4605 52.12Yes 92.27632 47.88
Frequency Missing = 63.263224375
DRUG/ALCOHOL INFO--GUIDANCE COUNSELOR
q37c Frequency Percent___________________________________No 140.6699 73.67Yes 50.26741 26.33
Frequency Missing = 65.062665734
DRUG/ALCOHOL INFO--SCIENCE CLASS q37d Frequency Percent___________________________________No 111.4022 59.33Yes 76.36263 40.67
Frequency Missing = 68.235168168
DRUG/ALCOHOL INFO--SOCIAL STUDIES CLASS
q37e Frequency Percent___________________________________No 139.9367 74.13Yes 48.82934 25.87
Frequency Missing = 67.233941174
DRUG/ALCOHOL INFO--DRUG RAP SESSION
q37f Frequency Percent___________________________________No 165.4237 87.58Yes 23.4663 12.42
Frequency Missing = 67.10999648
DRUG/ALCOHOL INFO--INVITED SCHOOL GUEST
q37g Frequency Percent___________________________________
No 127.5705 66.94Yes 62.99498 33.06
Frequency Missing = 65.434499815
The frequencies have been weighted so that theanalysis reflects the distribution of students by grade
level in the district

8/14/2019 GREGG COUNTY - Sabine ISD - 2002 Texas School Survey of Drug and Alcohol Use
http://slidepdf.com/reader/full/gregg-county-sabine-isd-2002-texas-school-survey-of-drug-and-alcohol-use 82/83
SabineSpring 2002
The FREQ Procedure
DRUG/ALCOHOL INFO--OTHER SCHOOL SOURCE
q37h Frequency Percent
___________________________________No 119.0307 61.58Yes 74.26705 38.42
Frequency Missing = 62.702213814
PARENTS FEEL ABOUT KIDS SMOKING CIGARET
q38a Frequency Percent__________________________________________Strong disapprove 171.0261 71.00Mild disapprove 30.54012 12.68Neither 14.16249 5.88Mildly approve 4.173729 1.73Strongly approve 1.844318 0.77Don't know 19.12375 7.94
Frequency Missing = 15.129529591
PARENTS FEEL ABOUT KIDS DRINKING BEER
q38b Frequency Percent__________________________________________Strong disapprove 156.6264 66.34Mild disapprove 33.50961 14.19Neither 13.19546 5.59Mildly approve 5.298901 2.24Strongly approve 2.96949 1.26Don't know 24.50172 10.38
Frequency Missing = 19.898460755
PARENTS FEEL ABOUT KIDS USING MARIJUANA
q38c Frequency Percent__________________________________________Strong disapprove 203.7823 84.94Mild disapprove 8.739648 3.64Neither 5.219833 2.18Strongly approve 1.844318 0.77Don't know 20.32799 8.47
Frequency Missing = 16.085879826
PURCHASED LOTTERY TICKET IN PAST YEAR
q39 Frequency Percent
___________________________________No 205.1554 82.68Yes 42.98224 17.32
Frequency Missing = 7.8623656637
The frequencies have been weighted so that theanalysis reflects the distribution of students by grade
level in the district

8/14/2019 GREGG COUNTY - Sabine ISD - 2002 Texas School Survey of Drug and Alcohol Use
http://slidepdf.com/reader/full/gregg-county-sabine-isd-2002-texas-school-survey-of-drug-and-alcohol-use 83/83
SabineSpring 2002
The FREQ Procedure
NON-LOTTERY GAMBLING IN PAST YEAR
q40 Frequency Percent
___________________________________No 169.4296 68.03Yes 79.63017 31.97
Frequency Missing = 6.9402066047
MONEY SPENT ON GAMBLING IN PAST YEAR
q41 Frequency Percent___________________________________$0 166.099 67.24$1 - $10 46.90808 18.99$11 - $50 19.08956 7.73$51 - $100 7.143219 2.89$100+ 7.772612 3.15
Frequency Missing = 8.9875373512