gresham mining & infrastructure services quarterly · 1 gresham mining & infrastructure...
TRANSCRIPT

1
Gresham Mining & Infrastructure Services Quarterly
Chris Branston
We are pleased to present Edition 22 of the Gresham Mining and Infrastructure Services Quarterly (GMISQ), asnapshot of the performance, news and trends across the resources (including oil & gas) and infrastructureservices sectors.
The Gresham Mining and Infrastructure Services Index (GMISI) closed out 2018 on a negative note, reflectingbroader equity market volatility as well as some company specific news in the sector which impacted sentiment.The GMISI dropped 19.7% in the December quarter (compared to an All Ordinaries fall of 9.7%) and finisheddown 14.4% for the 2018 calendar year. Equities have rebounded strongly in early 2019, with the GMISIimproving 14.3% through mid-March. Following this recovery, trading multiples are sitting comfortably abovelong term averages.
The recently completed 1H19 reporting season saw good growth reported across the sector, with more than halfof constituents seeing EBITDA increases in excess of 15%. However, the market reaction to results was mixed, asinvestors had already been pricing in substantial earnings improvements. In this Edition’s Quarterly Focus, wereview statements around outlook and market conditions in company results announcements. This highlights anumber of themes that have been emerging over the last 1-2 years, including:
1. Continued strong commodity prices supporting growth in exploration spending, despite some weaknessamongst North American juniors.
2. A visible path towards mining capex growth, with some spending underway and the remainder expected inthe medium term. This is driven by replacement tonne projects in iron ore as well as new developments inother commodities such as lithium.
3. Strong growth in mining production volumes, which is supporting good performance of both contract minersand equipment rental companies.
4. Significant spending in transport infrastructure projects, which is expected to continue for some time.
5. An ongoing focus on the use of data and technology to improve productivity and safety performance.
As a result of these tailwinds, analysts are expecting earnings growth to continue beyond FY19, with medianFY18-20 EBITDA CAGR of 15% across the sector.
M&A in the last quarter of 2018 was highlighted by WorleyParsons’ acquisition of the Jacobs ECR business, aswell as transactions associated with the RCR Tomlinson administration process. Further corporate activity is likelyto be on the cards for 2019, with a many companies citing inorganic growth strategies and a number ofbusinesses also flagged for potential sale.
Editorial Team
Gresham Advisory Partners Ltd is a leading Australian mergers and acquisitions/corporate advisorybusiness and one of Australia’s largest and highest ranking independent corporate advisors.
Edition 22
March 2019
The Gresham Mining and Infrastructure Services Index is a market capitalisation weighted index comprising 50 mining and infrastructure services companies selected by Gresham at the date of this report.
David Burton
Tom Waddell
(1)

2
Ranks
Company
Market Cap (A$m) Share priceΔ %1Mar Dec Sep 15 Mar 19 31 Dec 18 30 Sep 18
1 1 1 CIMIC Group Ltd. (ASX:CIM) 16,054 14,076 16,654 -4%
2 2 3 Orica Ltd. (ASX:ORI) 6,892 6,554 6,458 7%
3 3 4 WorleyParsons Ltd. (ASX:WOR) 6,723 5,262 5,577 -25%
4 4 2 Seven Group Holdings Ltd. (ASX:SVW) 6,237 4,812 7,675 -19%
5 5 5 Downer EDI Ltd. (ASX:DOW) 4,431 4,020 4,692 -6%
6 6 6 ALS Ltd. (ASX:ALQ) 3,802 3,300 4,385 -13%
7 7 7 Mineral Resources Ltd. (ASX:MIN) 2,994 2,908 2,984 0%
8 8 8 Spotless Group Holdings Ltd. (ASX:SPO) 1,742 1,868 1,532 14%
9 9 9 Monadelphous Group Ltd. (ASX:MND) 1,647 1,298 1,513 9%
10 10 11 Ausdrill Ltd. (ASX:ASL) 1,144 813 942 -6%
11 13 12 NRW Holdings Ltd. (ASX:NWH) 940 607 777 20%
12 12 13 Service Stream Ltd. (ASX:SSM) 895 636 650 24%
13 11 10 Emeco Holdings Ltd. (ASX:EHL) 698 656 1,097 -37%
14 15 15 Cardno Ltd. (ASX:CDD) 531 454 537 -0%
15 14 14 Macmahon Holdings Ltd. (ASX:MAH) 474 463 560 -15%
16 16 16 Imdex Ltd. (ASX:IMD) 429 403 440 -4%
17 17 19 Alliance Aviation Services Ltd. (ASX:AQZ) 334 297 307 8%
18 19 22 Pacific Energy Ltd. (ASX:PEA) 269 249 234 15%
19 18 17 MACA Ltd. (ASX:MLD) 255 251 326 -22%
20 24 31 Decmil Group Ltd. (ASX:DCG) 212 164 155 16%
21 22 28 Lycopodium Ltd. (ASX:LYL) 211 191 167 26%
22 21 21 Civmec Ltd. (ASX: CVL) 209 209 261 -20%
23 23 23 Fleetwood Corp. Ltd. (ASX:FWD) 186 187 222 -16%
24 25 24 GR Engineering Services Ltd. (ASX:GNG) 166 164 216 -23%
25 20 18 SRG Global Ltd. (ASX:SRG) 154 220 308 -50%
26 27 26 Engenco Ltd. (ASX:EGN) 139 147 179 -22%
27 29 25 MMA Offshore Ltd. (ASX:MRM) 137 133 210 -35%
28 32 33 Austin Engineering Ltd. (ASX:ANG) 130 110 133 -2%
29 30 27Southern Cross Electrical Engineering Ltd. (ASX:SXE)
126 131 167 -24%
30 31 35 BSA Ltd. (ASX:BSA) 120 111 119 -
31 28 32 RPMGlobal Holdings Ltd. (ASX:RUL) 119 134 147 -19%
32 34 29 Boart Longyear Ltd. (ASX:BLY) 105 105 158 -33%
33 33 30 Mastermyne Group Ltd. (ASX:MYE) 102 110 155 -35%
34 37 37 Mitchell Services Ltd. (ASX:MSV) 99 70 85 16%
35 35 36 Boom Logistics Ltd. (ASX:BOL) 79 73 104 -23%
36 26 20 AJ Lucas Group Ltd. (ASX:AJL) 74 158 278 -73%
37 36 39 Veem Ltd. (ASX:VEE) 73 70 72 2%
38 38 40 Primero Group Ltd. (ASX:PGX) 60 58 63 -5%
39 39 n/a Swick Mining Services Ltd. (ASX:SWK) 44 53 53 -17%
40 44 48 Laserbond Ltd. (ASX:LBL) 39 30 16 134%
41 40 44Matrix Composites & Engineering Ltd. (ASX:MCE)
34 37 42 -25%
42 41 43 Saunders International Ltd. (ASX:SND) 32 37 44 -27%
43 43 38 Veris Ltd. (ASX:VRS) 29 35 76 -62%
44 45 45 Valmec Ltd. (ASX:VMX) 27 29 33 -19%
45 42 42 Tempo Australia Ltd. (ASX:TPP) 22 35 48 -54%
46 46 47 XRF Scientific Ltd. (ASX:XRF) 20 19 23 -12%
47 48 49Resource Development Group Ltd. (ASX:RDG)
17 14 15 17%
48 49 50 LogiCamms Ltd. (ASX:LCM) 15 11 14 3%
49 47 46 Neptune Marine Services Ltd. (ASX:NMS) 13 14 28 -54%
50 51 51 VDM Group Ltd. (ASX:VMG) 13 9 12 -
Share Price Movements
Notes: (1) Performance measured over the period 30-Sep-18 to 15-Mar-19 (inclusive). Source: FactSet, IRESS.
2
Leaders Laggers
GMISI CONSTITUENTS1 LEADERS & LAGGARDS (SHARE PRICE)1
PERFORMANCE RELATIVE TO S&P 200 INDICES1
PERFORMANCE OVER TIME

3Notes: (1) Only companies with consensus earnings forecasts are included in charts; (2) Share prices are as at 15-Mar-19; (3) Earnings multiples are not calendarised; (4) Companies exhibiting negative multiples have been excluded from the above analysis. Source: FactSet.
Valuation Multiples
While there was downward trending in sector valuations over the December 2018 quarter, multiples have sincerecovered. The median GMISI constituent FY19 P/E multiple of c.14x sits materially above the longer term forwardmedian multiple of c.10x, but remains at a discount to the broader market.
3
Large Cap (>$1bn) Mid Cap (between $200m and $1bn) Small Cap (<$200m)
1 YEAR FORWARD PRICE EARNINGS RATIO OVER TIME
DIVIDEND YIELD (FY19F)
PRICE EARNINGS RATIO (FY19F)
1-yr fwd median as at:31 Dec 18: 11.6x (FY19)
0%
2%
4%
6%
8%
10%
12%
14%
SRG
GN
G
MLD
VR
S
LYL
SXE
ASL
MIN
DO
W
MN
D
SSM
AQ
Z
CIM OR
I
ALQ
SVW
EGN
XR
F
BSA CV
L
WO
R
PEA LB
L
VE
E
NW
H
FWD
Median: 2.6%
1-yr fwd median as at:31 Dec 18: 3.0%
-
5x
10x
15x
20x
25x
30x
VEE OR
I
MN
D
WO
R
CD
D
ALQ
GN
G
SPO
CIM
MIN
SWK
SSM
AQ
Z
IMD
NW
H
DO
W
DC
G
SVW
MLD ASL LY
L
BSA
AN
G
PEA
FWD
EHL
SRG
SXE
MYE
MA
H
PG
X
XR
F
VM
X
Median: 13.6x
4
0%
100%
200%
300%
400%
500%
600%
700%
ALQ
SSM
CIM
LCM
OR
I
BSA
SVW
LBL
EHL
RU
L
VE
E
MN
D
CD
D
MIN
NW
H
GN
G
VR
S
IMD
LYL
MSV
VM
G
WO
R
AQ
Z
MYE
PEA SX
E
SOP
EGN
ASL
TPP
SND
DC
G
AN
G
FWD
XR
F
CV
L
MA
H
VM
X
SRG
RD
G
MLD
SWK
AJL
BO
L
NM
S
MR
M
MC
E
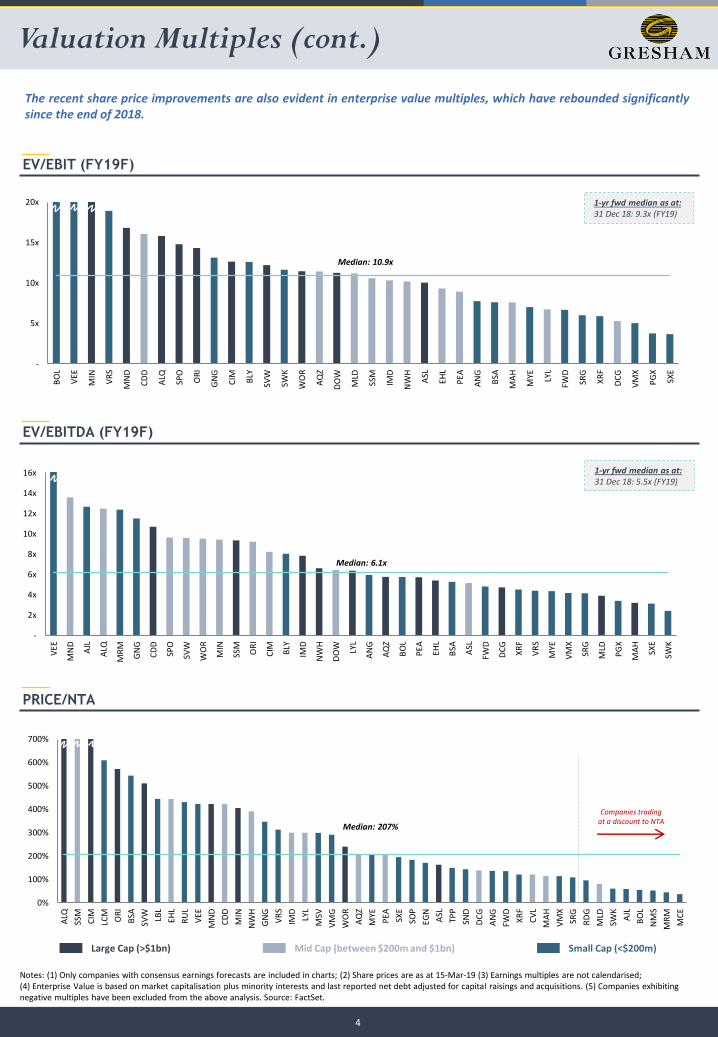
Median: 207%
Notes: (1) Only companies with consensus earnings forecasts are included in charts; (2) Share prices are as at 15-Mar-19 (3) Earnings multiples are not calendarised;(4) Enterprise Value is based on market capitalisation plus minority interests and last reported net debt adjusted for capital raisings and acquisitions. (5) Companies exhibiting negative multiples have been excluded from the above analysis. Source: FactSet.
Valuation Multiples (cont.)
The recent share price improvements are also evident in enterprise value multiples, which have rebounded significantlysince the end of 2018.
4
Large Cap (>$1bn) Mid Cap (between $200m and $1bn) Small Cap (<$200m)
Companies trading at a discount to NTA
EV/EBIT (FY19F)
EV/EBITDA (FY19F)
PRICE/NTA
1-yr fwd median as at:31 Dec 18: 5.5x (FY19)
1-yr fwd median as at:31 Dec 18: 9.3x (FY19)
-
5x
10x
15x
20x
BO
L
VE
E
MIN
VR
S
MN
D
CD
D
ALQ
SPO
OR
I
GN
G
CIM BLY
SVW
SWK
WO
R
AQ
Z
DO
W
MLD
SSM
IMD
NW
H
ASL
EHL
PEA
AN
G
BSA
MA
H
MYE LY
L
FWD
SRG
XR
F
DC
G
VM
X
PG
X
SXE
Median: 10.9x
-
2x
4x
6x
8x
10x
12x
14x
16x
VE
E
MN
D
AJL
ALQ
MR
M
GN
G
CD
D
SPO
SVW
WO
R
MIN
SSM
OR
I
CIM BLY
IMD
NW
H
DO
W LYL
AN
G
AQ
Z
BO
L
PEA EH
L
BSA ASL
FWD
DC
G
XR
F
VR
S
MYE
VM
X
SRG
MLD
PG
X
MA
H
SXE
SWK
Median: 6.1x

5
Forecast Profitability & Gearing
5
Notes: (1) Only companies with consensus earnings forecasts are included in charts.Source: FactSet.
Large Cap (>$1bn) Mid Cap (between $200m and $1bn) Small Cap (<$200m)
NET DEBT / ENTERPRISE VALUE
EBITDA MARGINS (FY19F)
FORECAST EBITDA GROWTH (FY18-20F CAGR)
FORECAST REVENUE GROWTH (FY18-20F CAGR)
Analysts are forecasting strong growth over the next 2 years, driven by both top line growth and some modest marginexpansion. The majority of companies in the sector maintain conservative balance sheets.
-10%
10%
30%
50%
70%
90%
DC
G
BLY
BSA
WO
R
ASL
SPO
MR
M
VE
E
XR
F
MYE
MA
H
NW
H
SWK
EHL
SSM
SVW
IMD
SXE
AN
G
PEA
ALQ
CD
D
VR
S
VM
X
AQ
Z
OR
I
FWD
DO
W
CIM
MIN
MLD
MN
D
LYL
SRG
BO
L
AJL
GN
G
Median: 15%
-20%
-10%
0%
10%
20%
30%
40%
50%
ASL
WO
R
SRG
MC
E
DC
G
NW
H
PG
X
MA
H
SSM
VR
S
MR
M
XR
F
MYE
SVW
PEA EH
L
CIM VE
E
IMD
SXE
VM
X
BLY
AQ
Z
FWD
MLD
CD
D
ALQ
DO
W
MIN
SWK
MN
D
OR
I
AJL
LYL
SPO
AN
G
BSA
GN
G
Median: 13%
0%
10%
20%
30%
PEA EH
L
MIN
AQ
Z
SVW
ALQ
IMD
ASL
SWK
OR
I
MA
H
XR
F
LYL
NW
H
FWD
BLY
MR
M
CIM AJL
MLD
SSM
AN
G
VE
E
MYE
SPO
PG
X
WO
R
VR
S
VM
X
MN
D
SRG
GN
G
DO
W
SXE
CD
D
BSA
DC
G
Median: 11%
-50%
0%
50%
BLY
MR
M AJL
EHL
VR
S
CV
L
ASL
BO
L
SWK
SPO
SVW
PEA
VM
G
OR
I
MIN
LCM
CD
D
DO
W
VM
X
MA
H
AN
G
ALQ VE
E
AQ
Z
XR
F
MSV
MLD
NW
H
LBL
MYE
IMD
BSA
EGN
SSM
FWD
MN
D
CIM
SRG
TPP
GN
G
RU
L
MC
E
LYL
WO
R
RD
G
PG
X
SND
NM
S
DC
G
SXE
Median: 4%

6
Contract Awards
6
Source: Company announcements.
Date Announced
Company Client Project/Facility Location Services Value (A$m)Commodity/
Sector
31-Dec-18 NRW Holdings FMG Eliwana WA Civil works 57 Iron Ore
21-Dec-18 CIMIC Group TasWater Tasmania water infra TAS Construction 600 Infra.
21-Dec-18 CIMIC Group BMABowen Basin Coal
Mines QLD Maintenance 180 Coal
20-Dec-18 CIMIC Group Pembroke Resources Olive Downs QLD Construction 184 Coal
20-Dec-18 Service Stream NBN NBN network AUS Construction 75 Infra.
20-Dec-18 Downer NSW Govt. Parramatta Light Rail NSW Construction 420 Infra
20-Dec-18 CIMIC Group NSW Govt. Parramatta Light Rail NSW Construction 420 Infra
20-Dec-18 Worley Parsons INEOS Styrolution
AmericaASA Facility USA EPCM n/a Infra.
18-Dec-18 CIMIC Group BMA Caval Ridge QLD Mining Services 150 Coal
14-Dec-18 CIMIC Group NSW Govt. WestConnex NSW Construction 1,950 Infra.
12-Dec-18 MACA Adaman Resources Kirkalocka WAInstallation and refurbishment
28 Gold
3-Dec-18 CIMIC Group Royal Australian NavyLanding helicopter
dock support Various Asset management 750 Infra.
21-Nov-18 CIMIC Group NSW Govt. Sydney Metro NSW Construction 1,376 Infra.
16-Nov-18 Worley Parsons Synergy Collie Power Station WA O&M n/a Infra.
16-Nov-18 NRW Holdings Stanmore Coal Isaac PLains QLD Mining Services 500 Coal
15-Nov-18 Monadelphous VestasDundonnell Wind
Farm NSW Civil works 55 Infra.
12-Nov-18 GR Engineering Sheffield Resources Thunderbird WA EPC 336Mineral Sands
8-Nov-18Southern Cross
Electrical
Westconnex JV Westconnex
NSW Electrical installation 80 Infra Build Obayashi Corp Parramatta 4 Square
Multiplex Wynyard PLace
7 Nov-18 Worley Parsons ConocoPhillips North Sea assets UK E&C / EPC n/a Oil and Gas
7 Nov-18 Worley Parsons Lundin NorwayNorwegian
Continental ShelfNorway EPCI n/a Oil and Gas
6-Nov-18 CIMIC Group Mach Energy Mount Pleasant NSW O&M 75 Coal
6-Nov-18 CIMIC Group QCoal Byerwen QLD O&M 25 Coal
2-Nov-18 Worley Parsons TidewaterPipestone Sour Gas
PlantCanada Fabrication and construction n/a Infra.
2-Nov-18 Worley Parsons SABIC Various Europe EPCM n/a Infra.
30-Oct-18 CIMCI Group NSW Govt.Northern Road
UpgradeNSW Construction 170 Infra.
30-Oct-18 Pacific Energy Panoramic Resources Savannah WA Constuction and O&M n/a Nickel
29-Oct-18 CIMIC Group ElectraNet Prominent Hill SA Construct and commission 180Copper and
Gold
27-Oct-18 Ausdrill AngloGold Ashanti Obuasi Ghana Mining Services USD 375 Gold
24-Oct-18 Ausdrill Independence Group Nova WA Mining Services 240 Nickel
15-Oct-18 CIMIC Group BHP Mt Arthur NSW Mining Services 1,200 Coal
15-Oct-18 SRG Global Multiplex 300 George St QLD Construction 30 Infra.
12-Oct-18 NRW Holdings NSW Govt.Pacific Highway
UpgradeNSW Civil works 40 Infra.
8-Oct-18 Decmil Maoneng Sunraysia Solar Farm NSW EPC 277 Infra.
4-Oct-18 CIMIC Group BayaweaverMixed use
development projectIndia Construction 110 Infra.
3-Oct-18 Monadelphous BHPPilbara Iron Ore
MinesWA Maintenance 240 Iron Ore
3-Oct-18 SRG Global WoodsideNorth West Shelf
ProjectWA Access equipment n/a Oil and Gas
MAJOR CONTRACT AWARDS
The first half of FY2019 saw a reasonable amount of contract activity, with Cimic securing a significant pipeline of workacross both resources and infrastructure, and NRW and Ausdrill winning large mining contracts.

7
Corporate Activity
7
Date Announced
Status Target BusinessTarget
HQSeller Acquirer
Value (A$m)
ForumInterest
(%)Cons.
22-Dec-18 CompleteRCR Rail and
Transport BusinessEngineering and
ConstructionNSW n/a John Holland n/a Private 100% Cash
17-Dec-18 Complete Raba KistnerEngineering Consulting
USA n/a Cardno USD 55 Private 100% Cash
6-Dec-18 Complete TGM GroupEngineering Consulting
VIC n/a Cardno 22 Private 100% Cash
3-Dec-18 Complete Comdain E&C VIC n/a Service Stream 162 Private 100%Cash and
scrip
15-Nov-18 Complete KHSA Ltd O&M Kier Group Downer 42 Private 100% Cash
22-Oct-18 Complete Jacobs ECREngineeringConstruction
USA Jacobs WorleyParsons 4,600 Private 100%Cash and
scrip
14-Oct-18 Complete UGM Mining Mining Services QLD n/a Bis Industries n/a Private 100% Cash
Source: Company announcements.
MERGERS & ACQUISITIONS
The major transaction announced during the December 2018 quarter was WorleyParson’s acquisition of Jacobs ECRwhich will create a leading technical services provider across the hydrocarbons, chemicals and metals and miningsectors.
CAPITAL RAISINGS
ACTIVE SHARE BUYBACKS
Date Status Company TypeAmount Raised
(A$m)
(Discount) / Premium to Last
Price (%)Purpose
10-Dec-18 Complete Matrix Composites Placement 3 (10.5%) Working capital
5-Dec-18 Pending VDM Group Placement 6 400 Working capital
22-Oct-18 Complete Worley Parsons ANREO 2,900 (12.8%) Acquisition funding
Date Announced Company Type Size Purpose
14-Dec-18 CIMIC Group On-market Up to 10% Capital management
20-Mar-18 Pacific Energy Limited On-market Up to 1.1% Capital management
14-Feb-18 Service Stream On-market Up to 7.5% Capital management
20-Nov-17 ALS On-market Up to A$175 million Capital management
28-Feb-17 Cardno On-market Up to 10.0%Acquire shares where the Board deems the
share price to be below intrinsic value

8Notes: (1) Excludes alternate appointments; (2) Internal appointment. Source: Company announcements.
Executive Movements
Date Announced Company Name Role Date Effective
10-Dec-18 Tempo Australia David Iverach NED 10-Dec-18
10-Dec-18 Tempo Australia Guido Belgiorno-Nettis AM Chairman 10-Dec-18
3-Dec-18 Tempo Australia Scott Macdonald NED 3-Dec-18
1-Nov-18 Ausdrill Keith Gordon NED 1-Nov-18
10-Oct-18 Fleetwood Corporation Mark Southey NED 10-Oct-18
8
Date Announced Company Name Role Date Effective
10-Dec-18 Tempo Australia Scott Macdonald NED 10-Dec-18
30-Nov-18 Tempo Australia Carmelo Bontempo Non-Executive Chairman 30-Nov-18
19-Nov-18 Tempo Australia Guido Belgiorno-Nettis AM NED 19-Nov-18
6-Nov-18 GR Engineering Terrence Strapp NED 6-Nov-18
15-Oct-18 Spotless Group Dana Nelson CEO 16-Oct-18
10-Oct-18Southern Cross Electrical
EngineeringFrank Tomasi AM NED 30-Oct-18
EXECUTIVE & DIRECTOR APPOINTMENTS1
EXECUTIVE & DIRECTOR RESIGNATIONS / RETIREMENTS

9
Quarterly Focus: 1H19 Results Takeaways
9
Source: Facset ; Company filings.
1H19 results were generally positive, with GMISQ constituents recording median revenue and EBITDA growth of 12%and 18% respectively on a pcp basis. However, share price performances on the day of announcing 1H19 results weremixed, reflecting strong market expectations in the current operating environment.
Large Cap (>$1bn) Mid Cap (between $200m and $1bn) Small Cap (<$200m)
REVENUE GROWTH 1H19 PCP (%)
EBITDA GROWTH 1H19 PCP (%)
SHARE PRICE REACTION
-100%
-50%
0%
50%
100%
RD
G
PEA TP
P
MA
H
DC
G
MSV
PG
X
NW
H
SRG
LBL
SVW
VR
S
AJL
EHL
MR
M
MYE
XR
F
IMD
SSM
AQ
Z
FWD
ASL
ALQ
MLD CV
L
EGN
CD
D
WO
R
CIM
DO
W
OR
I
BLY
SWK
SXE
VE
E
BO
L
BSA
SPO
LCM
VM
X
MN
D
MC
E
RU
L
AN
G
LYL
NM
S
SND
MIN
GN
G
VM
G
Median: 12%
-100%
-50%
0%
50%
100%
RD
G
SPO
DC
G
MSV LB
L
AJL
SWK
MA
H
NW
H
XR
F
SVW
MR
M
PEA EH
L
FWD
MYE LY
L
SRG
IMD
ALQ BLY
SSM
PG
X
EGN
ASL
WO
R
AQ
Z
CIM
DO
W
BO
L
BSA SX
E
OR
I
AN
G
VM
X
CD
D
CV
L
MN
D
VR
S
MLD
VE
E
LCM
MIN
GN
G
SND
RU
L
Median: 18%
-15%
-10%
-5%
0%
5%
10%
15%
XR
F
VE
E
MYE
SVW LB
L
NW
H
OR
I
BSA
MSV
MN
D
RD
G
SXE
CD
D
WO
R
SSM
RU
L
CV
L
AN
G
ASL
GN
G
ALQ
SPO
PEA
MR
M
BLY
BO
L
MC
E
VM
X
NM
S
VM
G
CIM
AQ
Z
DC
G
MLD
FWD
SWK
IMD
LYL
PG
X
DO
W
MIN AJL
SND
MA
H
VR
S
LCM
EGN
SRG
TPP
EHL
Median: 0%

10
Quarterly Focus: 1H19 Results Takeaways
10
Source: Company reports and presentations.
A review of commentary around market conditions and outlook confirms a number of themes that have been developingover the last 1-2 years. There is a generally positive outlook for most elements of the mining value chain, withproduction exposed companies perhaps seeing the greatest near term opportunities. Transport infrastructure spendingalso remains strong.
KEY THEMES
Theme Selected Market Commentary
Exploration and feasibility spending benefiting from strong commodity prices
• Mining companies continue to project increasing exploration and drilling activity over the coming periods however we do see them continue to tightly control their exploration, development and capital expenditures. Boart Longyear
• Global spend on exploration activities continues to rebound across a broad base of commodities. ALS
• Steady increase in exploration budgets and activity globally – albeit at a slower pace. The ability for juniors to raise funds is challenging, particularly in Canada; Major explorers are focusing on brownfield projects; Majors have highlighted opportunities to find new deposits under ground cover and at depth. Imdex
• Study activity remains strong in a supportive commodity price environment. Lycopodium
Mining capex growing
• Capital expenditure by the large mining companies has yet to reach the levels experienced at the commencement of the last major mining cycle. Spending increases are forecast to rise, in contrast to the 4 years to 2016 when large miners sought to extract maximum benefit from the capex of prior years. Austin Engineering
• New upcoming projects emerging in the WA onshore LNG sector will provide opportunities from FY21. Decmil
• New resources related infrastructure projects have appeared on the horizon. Next round of LNG opportunities expected to be smaller brownfields expansions. Downer
• Project development activities increasing, particularly in iron ore and lithium. Monadelphous
• Iron ore sustaining capital expenditure continuing to increase. Southern Cross Electrical Engineering
Infrastructure capex remains strong
• Strong pipeline and opportunities over the next three years in the infrastructure and civil construction sector. Boom Logistics
• Construction and services opportunities boosted by strong PPP and infrastructure pipeline. Cimic
• Significant public sector infrastructure spend by State and Federal Government: Major project opportunities in the Transport sector across Australia and New Zealand. Decmil
• Transport infrastructure and services market continues to exhibit good growth in both Australia and NZ. Downer
• Investment in infrastructure healthy, prospects continuing in water and renewables. Monadelphous
• Growing infrastructure requirements in QLD and NSW (Civil). NRW
• Pipeline of road and rail projects remains strong but market is competitive. Seven Group
• Public infrastructure developments will lead to further wave of commercial development when completed. Southern Cross Electrical Engineering
Increasing mining production creating opportunities for contract miners and rental groups
• Underground mining is presenting significant organic growth opportunities across Australia and Africa. Surface mining is presenting significant organic growth opportunities across a range of commodities in Africa. Demand for equipment rental, parts and services continues to grow. Ausdrill
• Mining continues to strengthen with a positive volume outlook both domestically and globally. Cimic
• Contract mining sector experienced recovery over last 12 months with volume increases at some existing mines and new contracts also coming to market. Downer
• Strong market conditions, particularly with coal customers in the Eastern Region. High levels of bidding activity in the Western Region, with attractive projects coming online during CY19. Emeco
• Clients looking to accelerate production. NRW
• Mining production levels continue at or near record levels…Rare earth metals coming into commodity mix and resurgence in gold production given strong price has provided opportunity. Seven Group
• Seeing additional opportunities at brownfield operating mines, with producers looking to increase output in response to strong gold prices and solid metal prices. Swick
Continued focus on technology
• Importance of drilling productivity technologies and innovation to lower costs, increase productivity and safety. Imdex
• Whilst mining companies are looking for productivity improvements through the use of technology their approval, procurement and contracting (legal) processes remain cautious and often protracted. As a result, suppliers to the mining industry are experiencing longer than usual sales closure cycles. RPM
• Strong customer demand for autonomous technology. Seven Group

11
Quarterly Focus: 1H19 Results Takeaways
11
Source: Company reports and presentations.
The majority of companies provided some form of guidance for FY19, with nearly all predicting solid growth over theprevious year.
SELECTED GUIDANCE STATEMENTS
Company vs FY18
AllianceAviation
Positive outlook for the 2019 financial year based on strong half year result and it is forecast that the second half of the financial year will exceed the first half’s financial performance
↑
ALS FY19 NPAT guidance $170-175m (FY18: $142m) ↑
Ausdrill On target to achieve earnings guidance of underlying net profit after tax of $98 million for FY19 (FY18:$45.2m) ↑
Cardno
Including recent acquisitions, FY19 EBITDA is anticipated to be in the range of $60 to $65 million based on the current momentum and market conditions. The company is operationally and financially in the strongest position it has been in the past three years we believe there is a solid basis for both revenue and EBITDA growth in the medium term
↑
Cimic FY19 NPAT guidance in the range of $790-840m (FY18:$780.6m) subject to market conditions ↑
Decmil Committed FY19 revenue c.$650m (FY18: $342m) ↑
Downer Increased target guidance for FY19 to $352m NPATA (previously $335m). Goal to deliver EPS growth of 19% in FY19 ↑
GR Engineering Revenue for 2H19 expected to be in line with HY19 -
Lycopodium Full year NPAT expected to be generally in line with last year -
MacaFY19 Revenue guidance of $640m (FY18: $562m). Second half financial performance is expected to be stronger than that achieved in the first half as a result of improved margins
↑
MacmahonOn track to deliver FY19 guidance of between $950 million - $1,050 million in revenue (at least 34% growth) and Underlying EBIT of between $70 million - $80 million (at least 69% growth)
↑
Mineral Resources
Not providing updated guidance to that provided at AGM. Guidance for Mining Services Division of at least $240m EBITDA confirmed
↓
MonadelphousProject timing and Ichthys run-off forecast to result in lower construction revenues in FY19. FY19 revenue expected to be around 10% less than pcp
↓
NRW FY19 revenue guidance of $1.1b (FY18: $754m) ↑
OricaImproving operating leverage underpins a stronger FY19 result. Higher revenue and EBIT will be underpinned by increased demand and manufacturing improvements, with earnings skewed to the second half of the year
↑
Pacific EnergySolid start to the second half of the financial year, which, in combination with the first half’s solid performance, prompted it to upgrade full-year guidance on 12 February 2019 from a range of $54 - $55 million to a new range of $60 - $61 million EBITDA
↑
Service Stream
Expect that the second-half of FY19 will generate EBITDA from Operations from the core business at least in-line with the first-half and will incur transaction costs associated with the Comdain Infrastructure acquisition of approximately $1.4 million. Expect Comdain Infrastructure to deliver revenue of $320 million and EBITDA of $22 million for the full-year, with approximately 50% thereof contributing to Service Stream’s earnings in the second-half
↑
Southern Cross Electrical Engineering
Stronger second half expected and expecting FY19 revenues over $400m (FY18: $348m) ↑
Seven Group FY19 EBIT expected to be approximately 25% above FY18 underlying EBIT on a continuing operations basis ↑
SRG GlobalRevised FY19 guidance to underlying EBIT of between $22m and $27m corresponding to underlying EBITDA of between $32m and $37m. (Initial FY19 EBIT guidance of $30m to $35m provided in October 2018)
↑
WorleyParsonsExpect to deliver improved earnings in FY2019 before including the contribution of the Jacobs ECR acquisition…Earnings expected to be weighted to the second half
↑

12
Gresham’s Credentials
LANDMARK MERGERS & ACQUISITIONS
TAKEOVER RESPONSE
MINING AND INFRASTRUCTURE SERVICES
Advised Fosters on its $12.3bn
takeover by SABMiller
Advisor to SCEE in relation to the
acquisition of Heyday5
Advised CHAMP and Frontenac on the sale of
H-E Parts International
Advisor to Coffey International in
relation to acquisition by
Tetra Tech
Advised Clough in relation to its
takeover by Murray & Roberts
Adviser to Barminco on its acquisition by
Ausdrill
AWARDS & ACCOLADES
2011 M&A Deal of the Year
SABMiller’s acquisition of
Foster’s Group
2009 Most Innovative Deal
Babcock & Brown
Infrastructure’s recapitalisation
Secondary Market Equity Raising of
the Year
Wesfarmers’ $2.6bn equity
raising
2007 Best M&A Deal
Wesfarmers’ acquisition of
Coles
Best M&A Deal in Australia
Wesfarmers’ acquisition of
Coles
Advised Boral on the formation of a US$1.6bn joint
venture with USG Corporation
2013
Advised First State Super on
its acquisition of the land titles and registry
functions of Land Use Victoria
2018
2011
2017 2016 2015 20132018
2013
Advised David Jones in relation to acquisition by
Woolworths
2014
Advised Bank of Queensland on
the acquisition of $2.5bn loan
portfolio from Investec
2014
Advised Wesfarmers on the sale of its
underwriting and insurance broking
businesses
2014
Excellence in Corporate
Advisory - 2012
Boutique / Independent
Lead Independent
financial adviser to the Board of BHP Billiton on
the demerger of South32
2015
Advisor to UGL in relation to its takeover by
CIMIC
2017
Advised Asciano on its takeover by a
consortium led by Canada Pension Plan Investment
Board
2016
Advised the Lonsdale
Consortium on the acquisition of
a 50-year lease of Port of
Melbourne
2016
Advised DUET Group in relation
to its $13bn takeover by a
consortium comprising CKP,
CKI and PAH
Advised Little World
Beverages on its acquisition
by Lion
2017
Adviser to Quadrant on the
sale of CQMS Razor
2017

13
Contact Details
Gresham Advisory Partners LimitedABN 88 093 611 413
Level 17, 167 Macquarie Street
Sydney NSW 2000
Telephone: +61 2 9221 5133
Facsimile: +61 2 9221 6814
Level 39, 120 Collins Street
Melbourne VIC 2000
Telephone: +61 3 9664 0300
Facsimile: +61 3 9650 7722
Level 3, 28 The Esplanade
Perth WA 6000
Telephone: +61 8 9486 7077
Facsimile: +61 8 9486 7024
www.gresham.com.au
Chris BranstonExecutive Director, PerthE: [email protected]: +61 8 9213 0290
Terms and Conditions
Information contained in this publicationThe opinions, advice, recommendations and other information contained in this publication, whether express or implied, are published or made by Gresham Advisory Partners Limited (ABN 88 093 611 413),Australian financial services license (247113), and by its officers and employees (collectively “Gresham Advisory Partners”) in good faith in relation to the facts known to it at the time of preparation. GreshamAdvisory Partners has prepared this publication without consideration of the investment objectives, financial situation or particular needs of any individual investor, and you should not rely on the publication forthe purpose of making a financial decision.
To whom this information is providedThis publication is only made available to persons who are wholesale clients within the meaning of section 761G of the Corporations Act 2001. This publication is supplied on the condition that it is not passed on toany person who is a retail client within the meaning of section 761G of the Corporations Act 2001.
Disclaimer and limitation of liabilityTo the maximum extent permitted by law, Gresham Advisory Partners will not be liable in any way for any loss or damage suffered by you through use or reliance on this information. Gresham Advisory Partners’liability for negligence, breach of contract or contravention of any law, which cannot be lawfully excluded, is limited, at Gresham Advisory Partners’ option and to the maximum extent permitted by law, toresupplying this information or any part of it to you, or to paying for the resupply of this information or any part of it to you.
No warranties made as to contentGresham Advisory Partners makes no warranty, express or implied, concerning this publication. The publication provided by us on an “AS IS” basis at your sole risk. Gresham Advisory Partners expressly disclaims,to the maximum extent permitted by law, any implied warranty of merchantability or fitness for a particular purpose, including any warranty for the use or the results of the use of the publication with respect to itscorrectness, quality, accuracy, completeness, or reliability.
CopyrightCopyright in this publication is owned by Gresham Advisory Partners. You may use the information in this publication for your own personal use, but you must not (without Gresham Advisory Partners’ consent)alter, reproduce or distribute any part of this publication, transmit it to any other person or incorporate the information into any other document.
General mattersThese Terms and Conditions are governed by the law in force in the State of Victoria, and the parties irrevocably submit to the non-exclusive jurisdiction of the courts of Victoria and courts of appeal from them fordetermining any disputes concerning the Terms and Conditions. If the whole or any part of a provision of these Terms and Conditions are void, unenforceable or illegal in a jurisdiction it is severed for thatjurisdiction. The remainder of the Terms and Conditions have full force and effect and the validity or enforceability of that provision in any other jurisdiction is not affected. This clause has no effect if the severancealters the basic nature of the Terms and Conditions or is contrary to public policy. If Gresham Advisory Partners do not act in relation to a breach by you of these Terms and Conditions, this does not waiveGresham Advisory Partners’ right to act with respect to subsequent or similar breaches.
Michael SmithExecutive Director, PerthE: [email protected]: +61 8 9213 0286
Matt KeenanManaging Director, MelbourneE: [email protected]: +61 3 9664 0353
Charlie GrahamManaging Director, SydneyE: [email protected]: +61 2 9224 0247
Mark StevensManaging Director, MelbourneE: [email protected]: +61 3 9664 0381
Neville SpryManaging Director, SydneyE: [email protected]: +61 2 9224 0237