greta - green infrastructure: enhancing biodiversity and
TRANSCRIPT

GRETA - “GReen infrastructure:
Enhancing biodiversity and
ecosysTem services for territoriAl
development”
Séminaire ESPON “Renforcer les infrastructures vertes pour le developpement territorial / Namur / 04 Feb 2020
Mirko Gregor, space4environment

Literature review
on GI and ES
benefits and
challenges and
economic
valuation
methods
Spatial distribution of
GI in Europe
• Characterization in
physical terms at
landscape and city
level
• Characterization in
functional terms
at landscape level
Spatial analysis
of ES
synergies and
trade-offs,
accessibility,
supply and
demand for GI
to inform
planning
decisions
Analysis of policy
context, strategies
and planning
instruments in
Europe in support
to GI
implementation and
management
32 NFS
12 Case studies
and 25 good
practice
examples
Policy guidelines
and practice briefings
Applied research results

Green Infrastructure:
the concept and the
socio-ecological system
for implementation
2/4/2020GRETA (ESPON Seminar Wallonie, Namur, 04 Feb 2020)3
1

GRETA adopts the Green
Infrastructure (GI) definition
proposed by the European
Commission (EC) in 2013 as a
“strategically planned network of
natural and semi-natural areas with
other environmental features
designed and managed to deliver a
wide range of ecosystem
services. It incorporates green
spaces (or blue if aquatic
ecosystems are concerned) and
other physical features in terrestrial
(including coastal) and marine
areas”.River and
riparian
vegetation
Wetland Green roofs Urban trees Hedgerow
bordering and
agricultural field
What is Green Infrastructure?
Figure 1. conceptual illustration of strategically planned green infrastructure across spatial
scales. Elaboration by GRETA research team. Icons from https://thenounproject.com/.

Benefits of GI in Europe (and
elsewhere)
The multifunctional character of GI
elements provides a range of benefits by
means of a variety of Ecosystem Services
(ES), which often appear in bundles, and
under certain circumstances, are mutually
reinforcing.
Figure 2. Summary of main benefits provided by Green
Infrastructure at different scales. Elaboration by GRETA
research team. Icons from https://thenounproject.com/.
But, green infrastructure also has potential
side effects that are important to be aware of,
like risk of invasion by alien species, eco-
gentrification or higher start-up costs to
initiate GI.
Attributing monetary values to the
benefits of GI
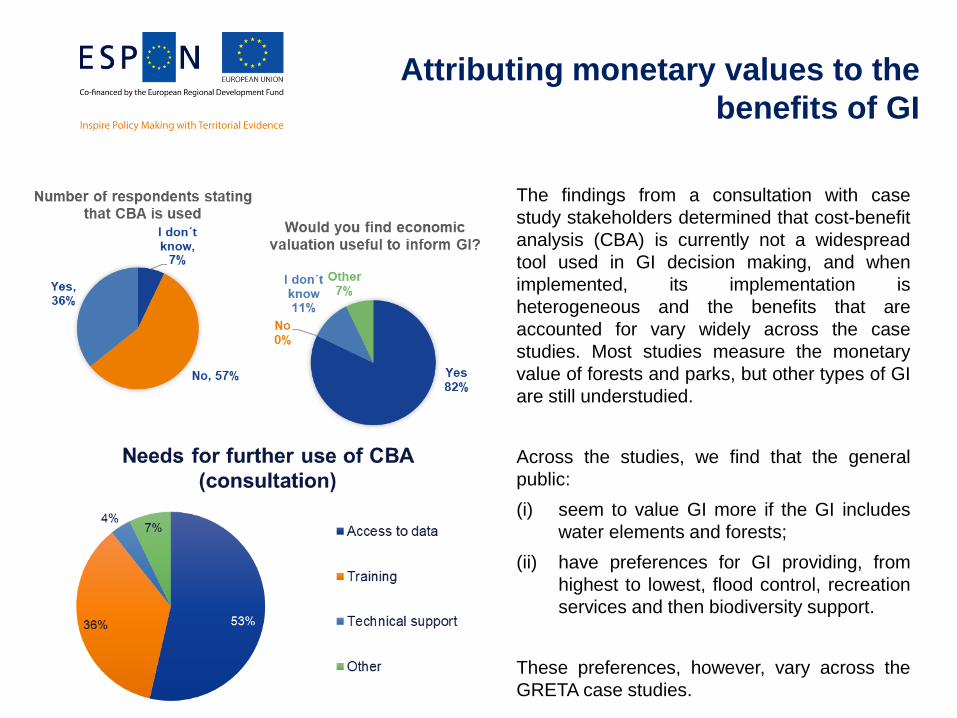
The findings from a consultation with case
study stakeholders determined that cost-benefit
analysis (CBA) is currently not a widespread
tool used in GI decision making, and when
implemented, its implementation is
heterogeneous and the benefits that are
accounted for vary widely across the case
studies. Most studies measure the monetary
value of forests and parks, but other types of GI
are still understudied.
Across the studies, we find that the general
public:
(i) seem to value GI more if the GI includes
water elements and forests;
(ii) have preferences for GI providing, from
highest to lowest, flood control, recreation
services and then biodiversity support.
These preferences, however, vary across the
GRETA case studies.

Geographical distribution
of Green Infrastructures
and Ecosystem Services
2/4/2020GRETA (ESPON Seminar Wallonie, Namur, 04 Feb 2020)7
2

To what extent
can the ES of
each GI
component
support specific
policies?
Multifunctionality
Recreation potential
Food
production
Water retention
Ma
ps o
f e
co
syste
m
se
rvic
es
▪ Standardized
comparison of
“potential” GI
▪ Evaluation of
the ability of GI
to serve
different policy
objectives: i.e.
biodiversity,
climate change
and water
management.
▪ Transferable
methodology
Innovative spatial analysis for physical
and multifunctional mapping of GI in
European regions (NUTS2/3)

Two contrasting patterns:
• Low percentage. north-
western France and
Germany, south-eastern
UK and Ireland, and
Denmark;
• Very high percentage. the
Nordic countries, the
Balkan countries along the
Adriatic Sea and the
eastern Alpine region
The physical characteristics
of potential GI

The functional performance of
potential GI
• GI shows high multifunctional
performance in most Italian
regions, central Germany and
northern France, and a few regions
in Romania, Bulgaria and Greece
• The GI for Alpine, Boreal and
Eastern Continental regions, as
well as most of Iberian Peninsula
is providing bundles of two
ecosystem services that benefit
mainly a single policy
• A few exceptions to this pattern
occur only in the North of Portugal
and Western Poland regions,
where bifunctional bundles serve
the aims of two or more policies.

The geographic distribution of
potential GI in European cities
• Central and north-western Europe
demonstrate relatively stable green/blue
spaces over time. (in particular Belgium,
Germany and the United Kingdom, but
also the Alpine countries)
• Eastern and southern European
countries demonstrate a large
proportion of decreasing green/blue
spaces, likely due to urbanisation
processes resulting from economic
development after the accession of the
countries to the EU (eastern Europe) or
due to tourism development (southern
Europe).
• On the other end of the spectrum, only
three cities show an increase in urban
green spaces: Faro, Portugal; Nice,
France; and Capelle aan den Ijssel,
Netherlands.

How do European regions fare in meeting the
existing demand for regulating, provisioning
and cultural services offered by GI
The map presents a semi-quantitative
balance between supply and demand for
the example of flood protection quantified
by the Water Retention Index:
• Positive balance is found, mainly on
the Northern part of Europe: Some
parts of Finland, Estonia, Northern
Scotland, Northern Ireland, and some
parts of France.
• The other regions that are still green
could be considered areas where the
balance tend to be positive, dominant
in Spain, Southern Ireland, and part of
Scotland. These are areas where
there is a need to reinforce GI with the
objective of water retention.
• Finally, the extreme deficit (low supply
with high demand) is only found in
Hungary.

How do European regions fare in
offering access to GI
• Cities with higher accessibility are
scattered throughout Europe, although
tend to be dominant in Sweden,
Finland, Baltic countries, the Czech
Republic, Austria, Germany and
Portugal.
• On the other hand, cities in Ireland,
Denmark, and UK are on the lower
range of the accessibility scale.
• Differences in accessible GI depend
on several factors such as quantity of
GI, its distribution (concentrated,
patchy, dispersed, etc.), proximity to
roads and trails, to name the most
relevant ones.

Where are the dominant patterns
of interactions between ES
• Strong synergistic relationship amongst
ES in Italy, France, part of Germany, and
Poland which in practical terms means
that the improvement of certain ES has a
multiplier effect on other ES, always
(increasing the provision of ES).
• Neutral relations are shown in dispersed
regions in Spain, England, Finland and
Sweden. In practical terms, it is likely that
improving ES will not have effects.
• Trade-offs with a clear regional pattern,
dominated by Eastern countries.
Management of GI requires a further
understanding of these trade-offs and the
need to identify alternatives to minimise
side effects.
• Trade-offs with low ecosystem provision
are the dominant pattern in Ireland. These
regions would require special attention.

Governance, policy and
planning contexts for
Green Infrastructure
implementation in Europe
2/4/2020GRETA (ESPON Seminar Wallonie, Namur, 04 Feb 2020)15
3

How European countries implement
the European GI strategy
To assess if and how European countries implement the European GI Strategy
(2013), National Policy Factsheets have been created for each country in the
ESPON space based on a desk study and questionnaire. The 32 National
policy factsheets describe the policy and planning contexts for GI.
Strategies and policies for GI in Europe:
▪ 11 of the 32 ESPON countries have GI specific policies on national levels.
▪ GRETA research results indicate that in those countries where the national
level have established GI specific policies and action plans, the
implementation of GI is more in progress.
▪ All countries, however, include GI in one or more policy sectors.

In Europe, some policy sectors
are more clearly including GI
principles.
• Land use and spatial
development planning
• Water management
• Agriculture, Forestry and
Fisheries
• Climate change mitigation and
adaptation
• Environmental protection
• Rural development
This suggests that GI is
perceived as broader than
biodiversity protection, which is
what the European Green
Infrastructure Strategy from
2013 intended.
In other policy sectors principles
of GI are not prominent.
• Finance
• Health
• Social Services
Key messages from the
National Fact Sheets

What do case studies reveal?
2/4/2020GRETA (ESPON Seminar Wallonie, Namur, 04 Feb 2020)18
4

GRETA investigated 12 case studies that
represent different spatial, institutional
and governance settings and that range
from urban centres to rural countryside.
• Generally speaking, the case studies have adopted GI – to
different extent – as an intrinsic part of spatial and urban
planning,
• Although ES are not always formally recognised, it seems
that they are implicitly assessed in the GI approach, with a
special emphasis on ecological connectivity, biodiversity,
recreation, culture and wellbeing.
• Main challenges for GI implementation are transport,
boundary issues, demographic pressure, climate related risk,
agriculture and non-sustainable forest management and
forest drainage.
• Lack of high-level guidelines on zoning and land use
management in the planning instruments alongside political
commitment and financial and economic investment
constitute also key constraints.
• Ecosystem based territorial planning for GI is recognized as a
potential opportunity to utilize cross-border cooperation
Messages from the
case study analysis
There is no one-size-fits-all solution

Zoom in to GRETA spatial analyses
The GRETA methodological approach can be
adapted and downscaled to produce detailed
input information for strategic planning
purposes if local level data is available.
The maps tell us a full narrative on the GI
phenomena and its implications for
planning and management
Good practices, examples
on local and urban level
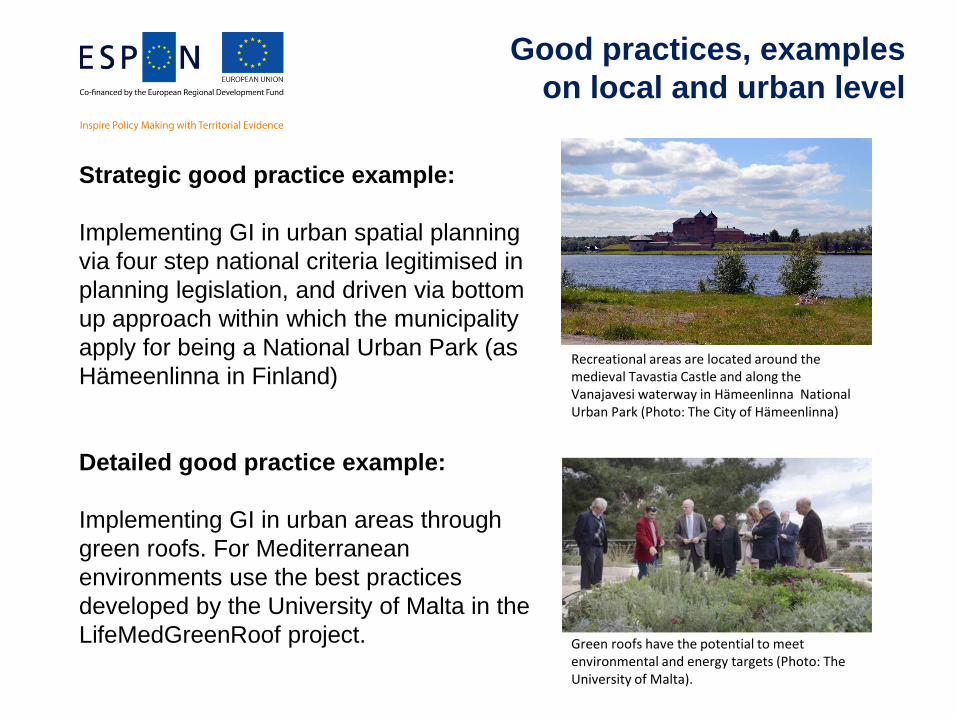
Strategic good practice example:
Implementing GI in urban spatial planning
via four step national criteria legitimised in
planning legislation, and driven via bottom
up approach within which the municipality
apply for being a National Urban Park (as
Hämeenlinna in Finland)
Detailed good practice example:
Implementing GI in urban areas through
green roofs. For Mediterranean
environments use the best practices
developed by the University of Malta in the
LifeMedGreenRoof project.
Recreational areas are located around the medieval Tavastia Castle and along the Vanajavesi waterway in Hämeenlinna National Urban Park (Photo: The City of Hämeenlinna)
Green roofs have the potential to meet environmental and energy targets (Photo: The University of Malta).

Policy
recommendations and
Future Research for
Territorial Development
2/4/2020GRETA (ESPON Seminar Wallonie, Namur, 04 Feb 2020)22
5

General policy
recommendations across levels
❖ Adopt a GI approach in planning.
❖ Integrate GI planning across policy
areas.
❖ Identify your existing assets and
opportunities for GI.
❖ Identify benefits and challenges of GI.
❖ Take the context into account.
❖ Identify GI “hot-spots”.
❖ Combine private and public funding
mechanisms for GI implementation.
❖ Facilitate cross-scale and cross-stage
collaboration.
❖ Monitor progress and adapt to change.
Financing in Practice:
* Cyprus and Slovakia combine national environmental funds
with European structural funds (i.e. ERDF, ESF, CF, EAFRD,
EMFF).
* Belgium used the EAFRD for agro-environmental subsidies
to enhance agricultural lands.
* Denmark improved environmental quality of Natura 2000
areas using EARFD funding mechanism.
* Slovenia used Cohesion Funds for enhancing urban green
* The European Fund for Strategic Investments have strict
targets for climate-smart investments to ensure reaching the
Paris agreement.
Policy Integration in Practice:
In some Swedish regions the health and social
service sector can prescribe ‘green care’ to
rehabilitate people that have been outside job
market for a long time. These jobs are on
appointed farms, in forestry and in park
management.

❖ Integrate GI across policy areas.
❖ Develop national GI policies and action plans.
❖ Increase awareness about GI.
❖ Ensure the availability of data.
❖ Provide training on economic valuation methods and on
spatial analysis methods.
❖ Learn and be inspired from existing good practice.
Policy recommendations at
the national scale

Policy recommendations at
the regional and local scale
The regional scale
❖ Plan strategically.
❖ Take into account the synergies and trade-
offs between ecosystem services.
❖ Plan for GI implementation in adaptive
cycles.
The local scale
❖ Plan strategically.
❖ Facilitate cooperation between actors.
❖ Create a shared vision.Cities in eastern and southern Europe, the
Netherlands and Finland have experienced a strong
loss of green spaces between 2006 and 2012. In the
context of climate change mitigation and adaptation,
these cities must focus on strategic, cross-sector
planning to reverse these critical development trends
and cater for their sustainable development.
• Potential for GI is lower in north-western France and
Germany, south-eastern UK, Ireland, and Denmark. This
makes the maintenance of existing GI, the improvement
of connectivity between protected areas and restoration
of natural and semi-natural areas are particularly
important in these areas.
• The Nordic countries, the Balkan countries along the
Adriatic Sea and the eastern Alpine region display the
highest potential for GI networks but have the lowest
share of protected core areas. This calls for attention to
the unprotected links in those regions.
• In Italy, France, parts of Germany, and Poland, most of
the ecosystem services analysed have strong synergistic
relationships.
• In Eastern countries there are trade-offs between
ecosystem services provided.

Policy Briefings
2/4/2020GRETA (ESPON Seminar Wallonie, Namur, 04 Feb 2020)26
6

This briefing aims to provide a resource for those
interested in understanding and integrating the
benefits and challenges of green infrastructure into
decision making. It is of relevance for individuals
making decisions for the monitoring, planning, and
development of GI at all scales - urban, peri-urban
and rural settings.
• Navigates the concept and different components of
green infrastructure
• Provides an overview of main environmental,
social and economic benefits at different spatial
scales, and
• Reflects on the side effects from green
infrastructure.
Unpackaging Green
infrastructure

Relating Green Infrastructure to
the Strategic Environmental
Assessment
• How to think more strategically about green
infrastructure and ecosystem services to inform spatial
and urban planning.
• How to consider green Infrastructure as an integrated
concept and approach towards knowledge- based
decision making.
• Providing insights on how the GRETA methods on
green infrastructure and ecosystem services mapping
and assessment could be operationalized in the
scheme of the Strategic Environmental Assessment.
Sector policies which can be supported by Strategic Environmental Assessment (SEA).

Assessing the potential for green infrastructure
1) Physical Mapping Method – Assessing and connecting
valuable natural areas
2) Ecosystem Service Base Mapping Method – Assessing
multifunctionality
3) Enabling Factors and Dependencies Method – Causal Loop
Diagram
Moving from potential green infrastructure to real
opportunities– assessing and measuring the potential for
multiple benefits
4) Accessibility Method – Mapping distance
5) Economic Valuation Method- Stated and revealed
preference
6) Economic Valuation Method - Direct use and consumption
valuation
Tools to aggregate information and support decision-
making
7) Economic Valuation Method – Cost benefit analysis
8) Supply and Demand Protocol – Mapping
9) Synergies and Trade-offs Method – Statistical graphical
analysis
Planning for green infrastructure:
methods to support practitioners
and decision-making

For further information and all documents visit:
https://www.espon.eu/green-infrastructure

Icons used: Food Production Made from Noun Project; Air Pollution Amos Kofi
Commey from Noun Project; Carbon sequestration ProSymbols from Noun
Project; Connectivity Populat from Noun Project; Education, Tourism and Flooding
Adrien Coquet from Noun Project; Health and Wellbeing Rediffusion from Noun
Project; Job creation Dan Hetteix from Noun Project; Supporting Identities
myiconfinder from Noun Project; Water Retention Carlos Dias from Noun Project;
Land and Property values Luis Prado from Noun Project; Heat Island Effect
Vectors Market from Noun Project; Recreation Ben Davies from Noun Project;
Tourism
Image credits
https://thenounproject.com/