grid system operation and performance report … filegeneration from gas and hydro, system has been...
TRANSCRIPT

GRID SYSTEM OPERATION AND PERFORMANCE REPORT
PENINSULAR MALAYSIA: JANUARY ‐ JUNE 2010
Installed Capacity: 21,817 MW
Maximum Demand: 15,072 MW (24 May 2010 @ 1600 hours)
Maximum Daily Energy: 311.5 GWh (25 May 2010)
A. OBSERVATIONS:
1. A total of twelve (12) Maximum Demands recorded from February onwards due to combination of impact from El Nino phenomenon and overall demand recovery. As of 30 June, Maximum Demand (MD) stood at 15,072 MW.
2. Likewise, Maximum Daily Energy Demand has also changed eleven (11) times since last recorded in 9 September 2009. Overall, on year‐over‐year basis, energy demand has increased by 13% from 45,122 GWh to 51,149 GWh.
3. While demand has increased, volume of gas allocated to power sector was reduced. As a result, amount of energy generated from gas plants reduced by 10% (y‐o‐y). Hydroelectric share is also reduced by 18%. To compensate with reduced share of generation from gas and hydro, system has been utilising more coals and resulted to increase in coal utilisation of more than 75%. Utilisation of substitute fuels like oil and distillate has also increased by six‐fold and almost double respectively, mainly due to gas curtailment.
4. The system has the ability to cope with the reduced amount of gas. However, in view of limited and uncertainty in actual energy from hydroelectric stations, supply of coal continues to be the major concern going forward.
5. In terms of generation capacity, Peninsular has more than adequate capacity to serve demand. On average, generation capacity available was at 18,777 MW while total capacity unavailable due to deration, unscheduled outage and scheduled outage was at 3,040 MW.

6. For network, the system has slight constraints at the beginning of the year in Ayer Tawar – Batu Gajah 275kV lines and Kapar XGT 500/275kV. There were 2 incidents of load loss of more than 50 MW
B. SUPPLY:
Installed Capacity (Start): 21,817 MW (1 January)
Installed Capacity (End): 21,817 MW (30 June)
Maximum Demand: 15,072 MW (24 May / Monday / 1600 hrs)1
Daily Energy: 311.5 GWh (25 May / Tuesday)2
Minimum Trough: 8,029 MW (15 Feb / Monday / 0800 hrs)
B.1 Installed Capacity
Type Main Fuel MW
Combined Cycle Gas Turbine Gas 9,373
Conventional Thermal Coal 7,170
Conventional Thermal Gas 840
Open Cycle Gas Turbine Gas 2,455
Open Cycle Gas Turbine Distillate 68
Hydroelectric Hydro 1,911
Total 21,817
1 New Maximum Demand, previous record was 15,052 MW on 20th May 2010 2 New Highest Energy, previous record was 309.6 GWh on 18th May 2010

B.2 Average Daily Generation Profile (January‐June 2010)
-
2,000
4,000
6,000
8,000
10,000
12,000
14,000
16,000
Jan-10 Feb-10 Mar-10 Apr-10 May-10 Jun-10
ST-Coal CCGT-Gas OCGT-Gas ST-Gas Cogen Hydro Oil Distillate IC SR
B.3 Average Weekdays Generation Profile (January‐June 2010)
-
2,000
4,000
6,000
8,000
10,000
12,000
14,000
16,000
Jan-10 Feb-10 Mar-10 Apr-10 May-10 Jun-10
ST-Coal CCGT-Gas OCGT-Gas ST-Gas Cogen Hydro Oil Distillate IC SR
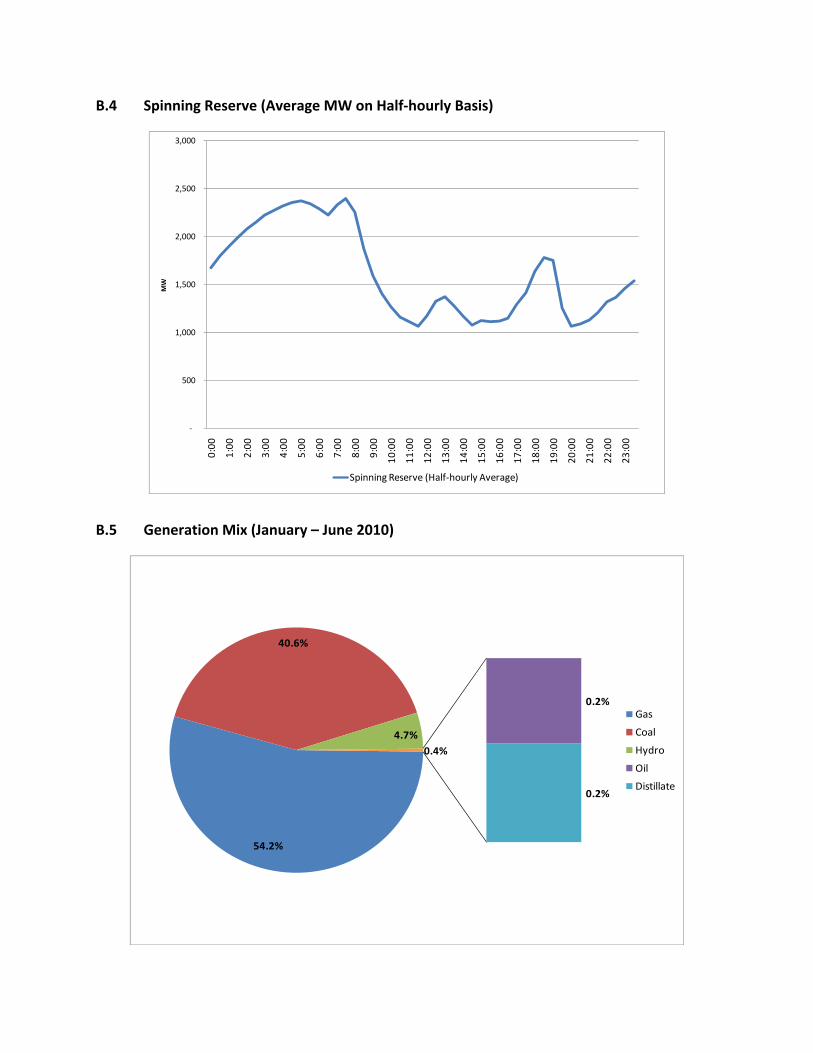
B.4 Spinning Reserve (Average MW on Half‐hourly Basis)
‐
500
1,000
1,500
2,000
2,500
3,000
0:00
1:00
2:00
3:00
4:00
5:00
6:00
7:00
8:00
9:00
10:00
11:00
12:00
13:00
14:00
15:00
16:00
17:00
18:00
19:00
20:00
21:00
22:00
23:00
MW
Spinning Reserve (Half‐hourly Average)
B.5 Generation Mix (January – June 2010)
54.2%
40.6%
4.7%
0.2%
0.2%
0.4%
Gas
Coal
Hydro
Oil
Distillate

C. DEMAND:
C.1 Monthly Maximum Demand from 2008 to 2010
11,500
12,000
12,500
13,000
13,500
14,000
14,500
15,000
15,500
January February March April May June
13,517 13,504 13,593
13,857 14,007
13,925
12,720
13,330
13,111
13,611
13,826
13,529
14,165
14,446
14,890 14,983
15,072
14,597
2008
2009
2010
C.2 Monthly Energy Demand from 2008 to 2010
‐
1,000
2,000
3,000
4,000
5,000
6,000
7,000
8,000
9,000
10,000
January February March April May June
8,015
7,299
7,931 7,968 8,339
7,958 7,059
6,868
7,630 7,781 8,117
7,668
8,429
7,635
8,867 8,706
9,014
8,499
2008
2009
2010
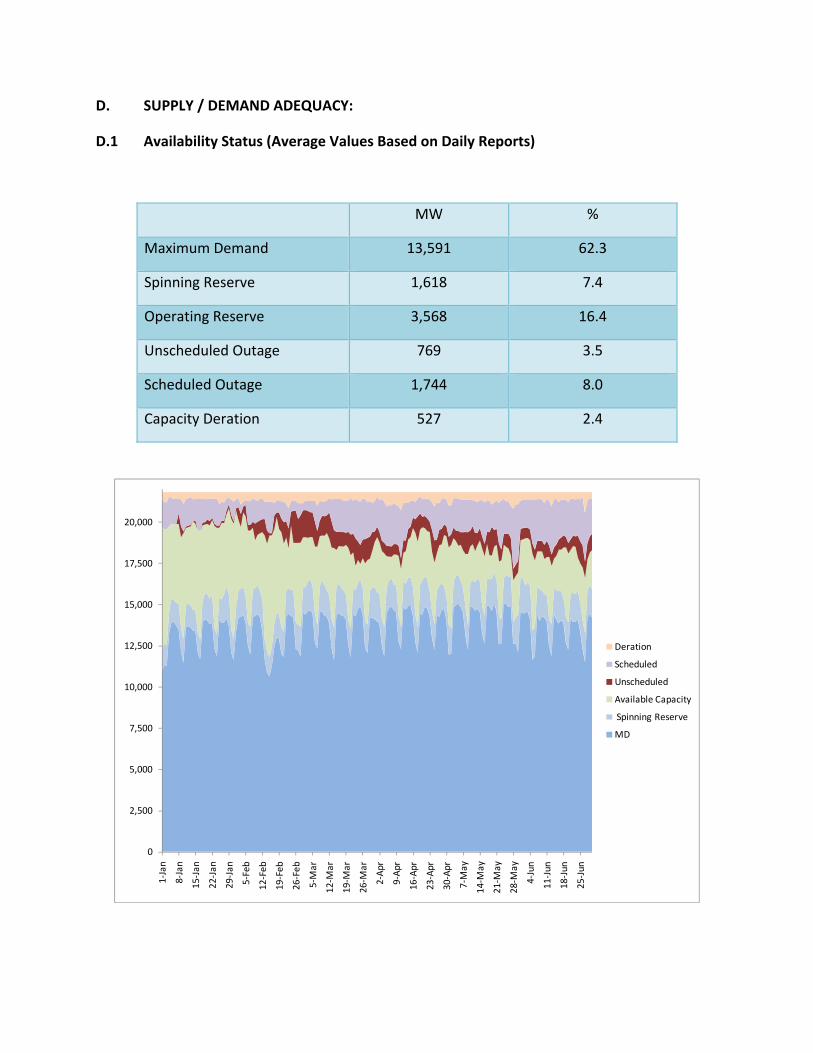
D. SUPPLY / DEMAND ADEQUACY:
D.1 Availability Status (Average Values Based on Daily Reports)
MW %
Maximum Demand 13,591 62.3
Spinning Reserve 1,618 7.4
Operating Reserve 3,568 16.4
Unscheduled Outage 769 3.5
Scheduled Outage 1,744 8.0
Capacity Deration 527 2.4
0
2,500
5,000
7,500
10,000
12,500
15,000
17,500
20,000
1‐Jan
8‐Jan
15‐Jan
22‐Jan
29‐Jan
5‐Feb
12‐Feb
19‐Feb
26‐Feb
5‐Mar
12‐M
ar
19‐M
ar
26‐M
ar
2‐Ap
r
9‐Ap
r
16‐Apr
23‐Apr
30‐Apr
7‐May
14‐M
ay
21‐M
ay
28‐M
ay
4‐Jun
11‐Jun
18‐Jun
25‐Jun
Deration
Scheduled
Unscheduled
Available Capacity
Spinning Reserve
MD
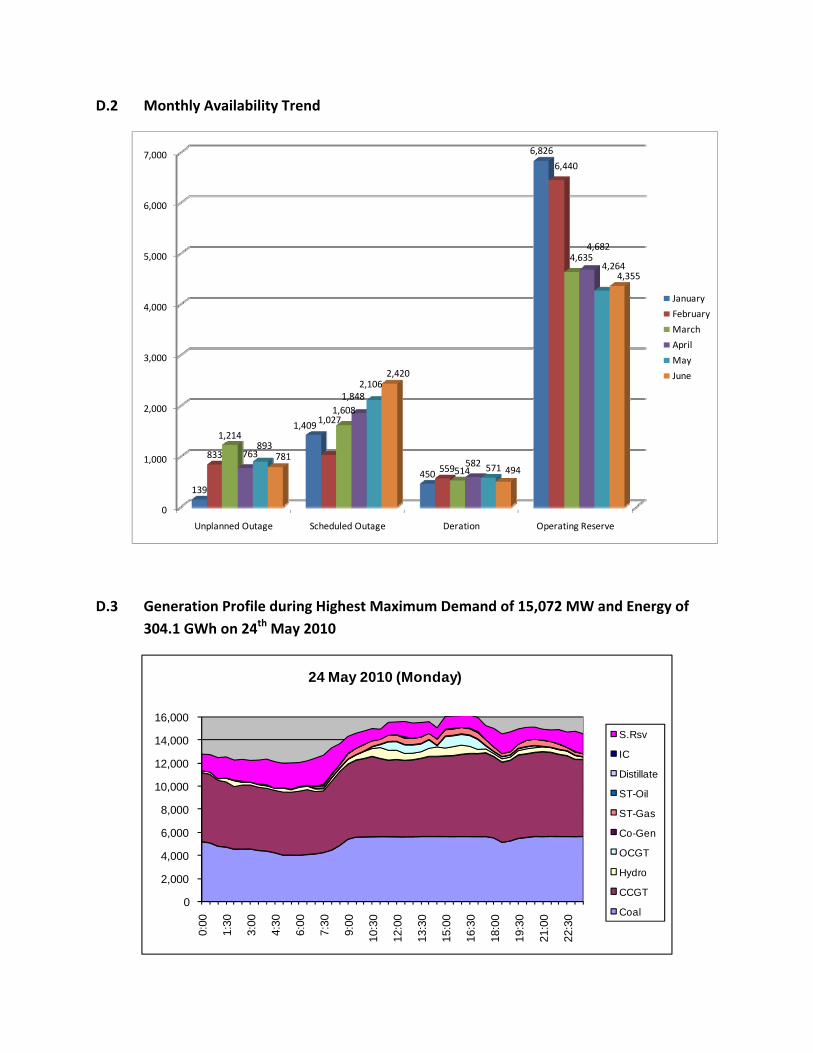
D.2 Monthly Availability Trend
0
1,000
2,000
3,000
4,000
5,000
6,000
7,000
Unplanned Outage Scheduled Outage Deration Operating Reserve
139
1,409
450
6,826
833
1,027
559
6,440
1,214
1,608
514
4,635
763
1,848
582
4,682
893
2,106
571
4,264
781
2,420
494
4,355
January
February
March
April
May
June
D.3 Generation Profile during Highest Maximum Demand of 15,072 MW and Energy of 304.1 GWh on 24th May 2010
0
2,000
4,000
6,000
8,000
10,000
12,000
14,000
16,000
0:00
1:30
3:00
4:30
6:00
7:30
9:00
10:3
0
12:0
0
13:3
0
15:0
0
16:3
0
18:0
0
19:3
0
21:0
0
22:3
0
24 May 2010 (Monday)
S.Rsv
IC
Distillate
ST-Oil
ST-Gas
Co-Gen
OCGT
Hydro
CCGT
Coal

D.4 Generation Profile during Maximum Demand of 15,003 MW and Highest Energy of
311.5 GWh on 25th May 2010
0
2,000
4,000
6,000
8,000
10,000
12,000
14,000
16,000
0:00
1:30
3:00
4:30
6:00
7:30
9:00
10:3
0
12:0
0
13:3
0
15:0
0
16:3
0
18:0
0
19:3
0
21:0
0
22:3
0
25 May 2010 (Tuesday)
S.Rsv
IC
Distillate
ST-Oil
ST-Gas
Co-Gen
OCGT
Hydro
CCGT
Coal
D.5 Generation Profile during Lowest Maximum Demand of 10,633 MW and Energy of
222.2 GWh on 15th February 2009
0
2,000
4,000
6,000
8,000
10,000
12,000
14,000
16,000
0:00
1:30
3:00
4:30
6:00
7:30
9:00
10:3
0
12:0
0
13:3
0
15:0
0
16:3
0
18:0
0
19:3
0
21:0
0
22:3
0
15 February 2010 (Monday)
S.Rsv
IC
Distillate
ST-Oil
ST-Gas
Co-Gen
OCGT
Hydro
CCGT
Coal

E. FUEL AVAILABILITY
.1 Gas
E
Average Gas Volume Nominated 1,252 mmscfd
Average Gas Volume Allocated 1,164 mmscfd
Total Volume Nominated 226,558 mmscf
Total Volume Allocated 210,745 mmscf
Total Production (Kerteh and JDA) 385,670 mmscf
Average Production (JDA) 344 mmscfd
Average Production (Kerteh) 1,787 mmscfd
Total Number of Curtailment (day)3 44
aily Nomination and Allocation to Power Sector (January – June 2010)
D
700
800
900
1,000
1,100
1,200
1,300
1,400
1,500
Jan-10 Feb-10 Mar-10 Apr-10 May-10 Jun-10
Volume Nominated Volume Allocated
3 Weekdays are calculated based on daily maximum of 1,250 mmscfd. Weekends are calculated based on volume nominated by TNB,, which are less than 1,250 mmcfd.
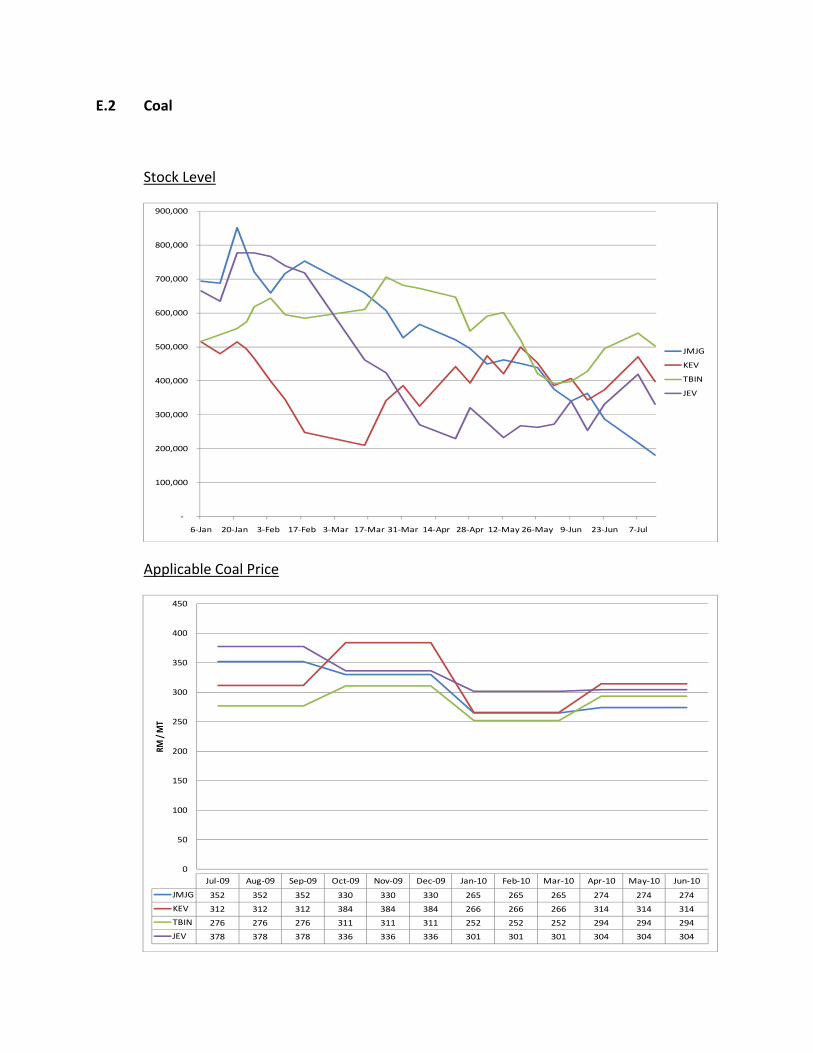
E.2 Coal
Stock Level
‐
6
100,000
200,000
300,000
400,000
500,000
600,000
700,000
800,000
900,000
‐Jan 20‐Jan 3‐Feb 17‐Feb 3‐Mar 17‐Mar 31‐Mar 14‐Apr 28‐Apr 12‐May 26‐May 9‐Jun 23‐Jun 7‐Jul
JMJG
KEV
TBIN
JEV
PriceApplicable Coal
0
50
100
150
200
250
300
350
400
450
RM / MT
Jul‐09 Aug‐09 Sep‐09 Oct‐09 Nov‐09 Dec‐09 Jan‐10 Feb‐10 Mar‐10 Apr‐10 May‐10 Jun‐10
JMJG 352 352 352 330 330 330 265 265 265 274 274 274
KEV 312 312 312 384 384 384 266 266 266 314 314 314
TBIN 276 276 276 311 311 311 252 252 252 294 294 294
JEV 378 378 378 336 336 336 301 301 301 304 304 304

E.3
Temengor
Hydro (Lake Level)
150
170
190
210
230
250
1-Jan 15-Jan 29-Jan 12-Feb 26-Feb 12-Mar 26-Mar 9-Apr 23-Apr 7-May 21-May 4-Jun 18-Jun
Temengor
Spill Level: 248.4 meter
Kenyir
100
110
120
130
140
150
1-Jan 15-Jan 29-Jan 12-Feb 26-Feb 12-Mar 26-Mar 9-Apr 23-Apr 7-May 21-May 4-Jun 18-Jun
Kenyir
Spill Level: 145 meter

F. RK
F.1 Line Constraints
NETWO
Location Impact Contingency Limit Days Last Day
1. 275kV Ayer
Tawar – Batu
Gajah
North ‐
Central
Double cct tripping of
500 kV Ayer Tawar ‐
Bukit Tarek
150% 8 28
January
2. Bukit Tarek
500/275 kV
XGT2
North ‐
Central
Double cct tripping of
500 kV Bukit Tarek –
Kapar
130% 6 14
January
F.2 Load Loss above 50 MW
Date Duration (Start/End)
Component Load Loss (MW)
Energy Not Served (MWh)
Cause(s)
1 Feb 1651/2138 Sungai Pinang 132/33/11 kV Substation
56 112.1 Fire
3 June 1702/1758 Kota Kemuning 132/33 (90
61.5 57.3 Damaged to outgo kV
kV MVA) T4 ing 33 cable
Prepared
Unit Operasi Pasaran Jabatan Kawa embekalan Elektrik Suruhanjaya Tenaga 3 August 2010
by:
lselia P
1