gridlocked a long term look at south africas electricity sector
TRANSCRIPT
GridlockedA long-term look at South Africa’s electricity sectorSteve Hedden
OVER THE PAST year and a half, beginning in mid-2014, South Africans have lived with regular
power cuts (also known as load shedding). Much emphasis during this electricity crisis thus far has
been on how to increase supply and from which sources. In response to the deficit of electricity and
the constraint this has placed on the economy, the South African Department of Energy (DoE) has
been searching for ways to increase generating capacity. New coal-fired power plants are under
construction, the procurement process for a number of new nuclear power plants has begun, and
oil and gas production is being explored as a possible energy source – whether from offshore,
imports or hydraulic fracturing (or ‘fracking’). Independent power producers (IPPs) are contributing
to electricity supply, and embedded generation – largely in the form of residential solar photovoltaics
(PV) – is playing an increasingly important role in decreasing demand on the national grid.
Renewable energy, IPPs and small-scale embedded generation (SSEG) are changing the electricity
sector in South Africa. Electricity generation is becoming more decentralised and intermittent, and
the line between producer and consumer is becoming blurred. At the same time, the electricity
sector is transitioning away from a monopolistic model, with various new actors taking on roles and
responsibilities historically controlled by Eskom, and with the introduction of new market elements,
like IPPs. It is unclear how the government will respond to these challenges. The government
could either ignore these systemic changes, respond to them on an ad hoc basis, or embrace
them through coordinated planning, investment in flexible capacity and clear policies regarding
embedded generation.
SummaryElectricity generation in South Africa is changing, but whether the electricity grid will
be able to adapt to these changes is uncertain. This paper presents an alternative
frame for the current electricity challenges by focusing on the electricity grid. Using
the International Futures forecasting model, the African Futures Project has built
three scenarios to 2050 to inform policymakers of the long-term implications of grid
decisions. With coordinated planning, improved operational strategies and coherent
policies, renewable energy can contribute significantly to the energy mix by 2050, help
increase economic growth and benefit all South Africans. These interventions, however,
will only be successful if there is a clear plan for the structure of the electricity sector.
AFRICAN FUTURES PAPER 15 | SEPTEMBER 2015
2 GRIDLOCKED: A LONG-TERM LOOK AT SOUTH AFRICA’S ELECTRICITY SECTOR
AFRICAN FUTURES PAPER
This paper uses the International Futures (IFs) forecasting model to create three
integrated and cohesive scenarios for South Africa’s future energy system to frame the
uncertainty regarding planning, operations, and policies.
The Current Path scenario is a continuation of current energy planning and policies,
though not necessarily the most likely future scenario. Under this scenario, Eskom
remains in control of the transmission grid and much of the generating capacity,
though IPPs continue to be integrated into the energy mix. The roles of various
government departments become increasingly blurred and a lack of clear roles and
responsibilities among the various actors in the electricity sector, compounded by
a lack of coordination between energy planning and grid planning, slows down the
integration of IPPs. A lack of clear policies and regulations regarding embedded
generation means that its potential to contribute to the grid is not unlocked and the
benefits of private generation accrue only to those who can afford it. Furthermore,
since many municipalities rely heavily on electricity sales for revenue, residential
embedded generation has a negative impact on their finances.
THE ESTIMATED GENERATING CAPACITY
REQUIRED BY 2030 ACCORDING TO
THE INTEGRATED RESOURCE PLAN
Electricity generation is becoming more decentralised and intermittent, and the line between producer and consumer is becoming blurred
In the Efficient Grid scenario, investments in electricity-generating capacity are
accompanied by efforts to ensure the efficiency of the grid’s transmission-and-
distribution infrastructure. Although this scenario sees heavy investments in the
electricity grid, grid planning is still not integrated into energy planning, and grid
investments are made on an ad hoc basis. Like in the Current Path scenario,
government does not take advantage of embedded generation, so SSEG benefits
only the wealthy and municipal revenues are likewise potentially reduced. The overall
result is a more efficient transmission and distribution of electricity but without the full
integration of IPPs or embedded generation. Less generating capacity is required in this
scenario compared to the Current Path because of greater efficiency in transmission
and distribution. This reduces the cost of electricity compared to the Current Path. The
lower relative cost, however, translates into a rebound effect of increased consumption,
and both electricity and overall energy consumption increase. This leads to an overall
increase in primary energy production, energy exports and carbon emissions compared
to the Current Path.
Finally, in the Smarter Grid scenario, investments in generating capacity and the
efficiency of the grid are accompanied by integrated energy and grid planning, more
flexible generating capacity and advances in operational strategies that enable the
integration of decentralised and intermittent electricity, together with policies to
unlock SSEG. Under this scenario, the grid is able to effectively integrate renewable
energy into the South African energy mix. In addition, because of policies and
regulations surrounding embedded generation, the benefits are distributed among all
citizens. Higher penetration of renewable energy benefits the South African economy
and the environment.
In all of these scenarios, renewable energy increases its share of the energy mix over
the time horizon. In the Smarter Grid scenario, however, the South African economy
90 GW
AFRICAN FUTURES PAPER 15 • SEPTEMBER 2015 3
is 0.3% larger by 2030 and 2.3% larger by 2050. This means
that there would be nearly 100 000 fewer South Africans living
in extreme poverty in the Smarter Grid scenario than in the
Current Path scenario. In addition, because of the higher levels
of renewable energy contributing to the energy mix, carbon
emissions are lower in the Smarter Grid scenario than in the
Current Path. Because thermo-electric power generation
consumes a lot of water, water demand is also significantly
lower in Smarter Grid.
These three scenarios are not the only possible future outcomes
for the South African electricity sector. They are merely meant to
show the effects of different policy responses to the changing
nature of the grid. As the South African electricity sector
transitions from a monopolistic model to include market-based
elements, the policy response to the increasing complexity
of the system will determine the level of uptake of renewable
energy and the equitable distribution of its benefits.
Background
South Africa is facing an electricity crisis. South Africans have
experienced load shedding on average every third day during
the first four months of 2015.1 The National Treasury’s 2015
budget review stated that of the structural weaknesses in
the South African economy, ‘the low and unreliable levels of
electricity supply are now the most binding constraint’.2 The
review lowered the economic growth forecast to 2% in 2015
because of, among other factors, the effects of the electricity
constraint on manufacturing, mining, exports, and reduced
investor and consumer confidence.
Current generating capacity is not enough to meet growing
electricity demand – and demand is rising quickly. The
Integrated Resource Plan (IRP), the government’s official
electricity plan, estimates that nearly 90 gigawatts (GW) of
generating capacity will be required by 2030, about twice as
much as current levels.
Eskom has not been and will not be able to keep up with
demand and has been increasingly forced to rely on expensive
gas-fired power plants to meet peak demand. To cover these
costs, in May 2015 Eskom applied to the National Energy
Regulator of South Africa (Nersa) to increase the electricity
tariff by 12.61% (in addition to the 12.69% increase that Nersa
had already granted in 2014) for the 2015/2016 financial
year.3 In June, Nersa rejected Eskom’s revised proposal of a
9.58% increase.4 Electricity has long been subsidised in South
Africa, and this tariff increase would have brought the price of
electricity closer to the actual cost, though the increases may
have negative consequences for the economy as a whole and
they will further incentivise grid defection.5 And even if Eskom
were to achieve the revenues it aims for through tariff increases,
by its own admission, load shedding will continue.6
The lack of a reliable supply of electricity is not due to
unforeseen circumstances. The problem is a lack planning and
strategic foresight. The 1998 White Paper on the Energy Policy
of the Republic of South Africa stated that ‘Eskom’s present
generation capacity surplus will be fully utilized by 2007’.7 In an
attempt to incentivise private-sector participation, in 2001, the
DoE placed a moratorium on Eskom to build new power plants.
When private-sector participation failed to materialise and the
moratorium was lifted in 2004, Eskom had lost four years of
construction time, creating a backlog in generating capacity.8
Electricity planning and the IRP
Due to the long lead times in construction of power plants,
long lifetimes of capital and long-term cross-sectoral effects,
long-term energy planning is essential to ensure demand is
met with reliable supply. Like many other countries, South
Africa has embedded its electricity plan into a larger strategy,
the IRP, which aims to meet forecasted demand in the most
efficient ways while incorporating other developmental and
environmental goals.
South Africa’s first and only IRP, the Integrated Resource Plan for
Electricity 2010–2030 (IRP 2010), was adopted in March 2011.
The IRP is a subset of the Integrated Energy Plan, which looks
at the national energy sector as a whole. The IRP 2010 sets out
electricity demand forecasts and a proposed power generation
fleet to meet this demand. While the IRP 2010 is the official
national long-term energy plan for electricity, it is considered a
‘living plan’ and an update was published in November 2013 for
public comments. The next full IRP will begin only after the next
Integrated Energy Plan is released.
South Africans have experienced load shedding on average every third day during the first four months of 2015
The IRP uses international best practices to plan capacity
to meet growing electricity demand. The plan factors in
environmental considerations, such as carbon emissions and
water use. The 2013 update to the IRP builds on the strengths
of the IRP 2010 and includes updated scenarios using revised
assumptions, decision trees to inform policymakers and risk
assessments of implementing the IRP. Although some issues
are contentious, the IRP provides a good deal of flexibility and
adaptability, necessary attributes of a living IRP.9
4 GRIDLOCKED: A LONG-TERM LOOK AT SOUTH AFRICA’S ELECTRICITY SECTOR
AFRICAN FUTURES PAPER
Despite these strengths, grid planning has not been incorporated into energy planning
in the IRP. The 2010 IRP does not explicitly address the electricity grid. The 2013
update does, however, include an annex on the impact of the IRP on transmission
and the need for new ‘transmission corridors’ to accommodate the changing location
of electricity generation. Grid planning in South Africa has historically taken a back
seat to energy planning. This is because load centres (i.e. areas of high demand) have
overlapped quite well with capacity centres. This overlap will soon disappear, however,
as the location of generation changes. Furthermore, renewable energy, IPPs and
SSEG will challenge some of the assumptions used in the IRP and energy planning
more broadly.
An integrated assessment approach
Energy and electricity are parts of a larger system. Changes in population, economics,
health, education, government spending, infrastructure, agriculture and water will all
have a direct impact on the energy system – and energy will affect everything else.
These relationships are integrated and dynamic, and the IFs model is the tool used
in this paper to explore and understand them. IFs is a global, long-term, highly
integrated model using more than 3 000 data series to forecast over 500 variables for
186 countries to the year 2100. IFs is housed at the Pardee Center for International
Futures, at the University of Denver. The Pardee Center is in partnership with the ISS
on the African Futures Project. The strength of IFs lies in its ability to analyse dynamic
relationships across systems such as population, economics, health, education,
agriculture, environment, infrastructure, governance and energy. IFs contains an
electricity sub-module as part of its infrastructure module, which is integrated with the
energy module.10
Forecasting energy supply and demand
Demand
Demand forecasts are the first steps in long-term energy planning. To ascertain the
electrical-generating capacity needed, energy planners must first estimate current
and future demand levels. There are different ways to forecast energy demand but the
method used in the IRP relies on two direct drivers: the size of the economy and the
energy intensity of the economy. If one knows the size of an economy in terms of gross
domestic product (GDP) and how much energy it requires to produce one unit of GDP
(energy intensity), then one can calculate total energy demand as follows:11
Electricity demand forecasts used in the 2010 IRP and for the 2013 update were done
by both the Council for Scientific and Industrial Research (CSIR) and Eskom’s System
Operator (SO). This paper will not explain the details of the models; it focuses only on
the economic growth and energy-intensity assumptions.12
Economic growth (GDP)
Both the CSIR and the SO have low, moderate and high economic-growth forecasts.
The 2010 IRP used the SO’s moderate forecast for its final ‘policy-adjusted IRP’
scenario. That scenario assumes an average GDP growth rate of 4.51% over the
period to 2030.
The Base Case in the 2013 IRP update uses the Green Shoots scenario developed
by the CSIR. That forecast was based on the National Development Plan (NDP)’s
GRID PLANNING IN SOUTH AFRICA HAS HISTORICALLY
TAKEN A BACK SEAT TO ENERGY PLANNING
GDP * Energy = Total energy demandGDP
AFRICAN FUTURES PAPER 15 • SEPTEMBER 2015 5
average 5.4% GDP growth rate to 2030 but also assumes significant shifts away from
energy-intensive industries.13
Energy intensity
Both the SO and the CSIR models assume that the energy intensity of the South
African economy will decrease over time. The SO electricity-demand model used
for the 2010 IRP uses discrepancies between GDP growth and electricity-demand
growth to forecast declining energy intensity over time. The CSIR model used for
the 2013 update forecasts declining energy intensity indices for various mining and
manufacturing sectors. The underlying logic behind both models used for both the
2010 IRP and the 2013 update is that South Africa is transitioning away from energy-
intense industries, like mining and manufacturing, towards less energy-intense
sectors, like services.
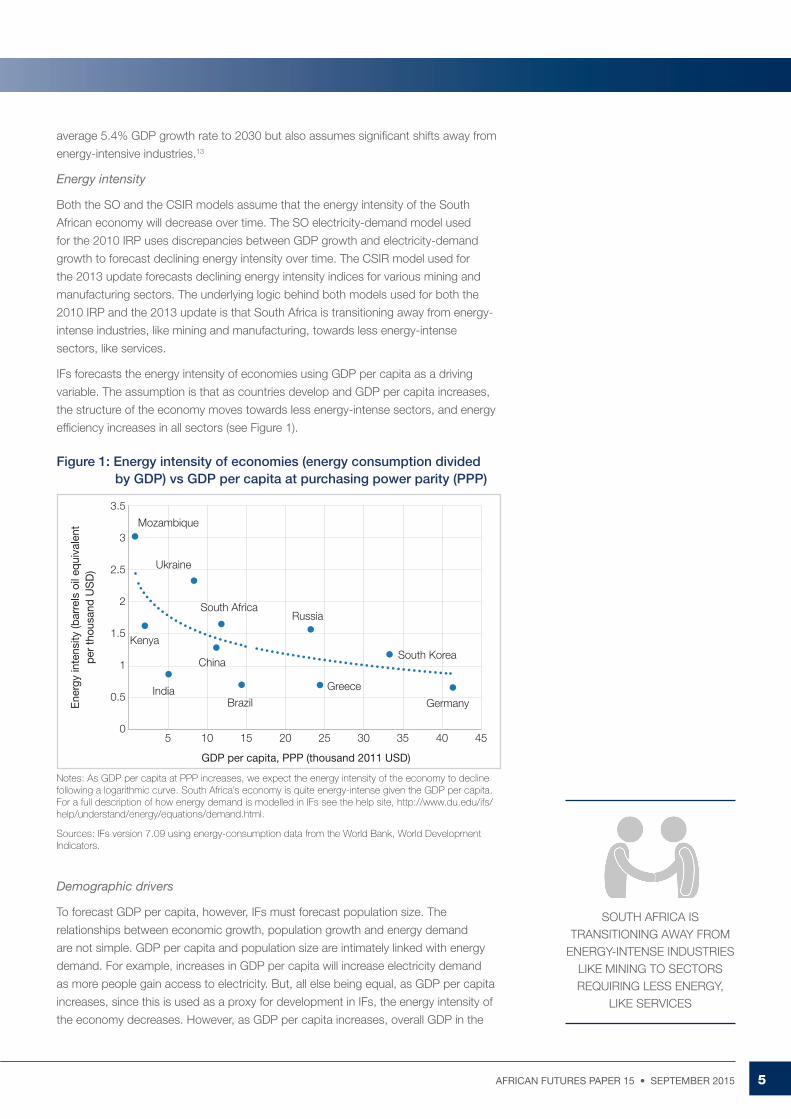
IFs forecasts the energy intensity of economies using GDP per capita as a driving
variable. The assumption is that as countries develop and GDP per capita increases,
the structure of the economy moves towards less energy-intense sectors, and energy
efficiency increases in all sectors (see Figure 1).
Figure 1: Energy intensity of economies (energy consumption divided by GDP) vs GDP per capita at purchasing power parity (PPP)
Demographic drivers
To forecast GDP per capita, however, IFs must forecast population size. The
relationships between economic growth, population growth and energy demand
are not simple. GDP per capita and population size are intimately linked with energy
demand. For example, increases in GDP per capita will increase electricity demand
as more people gain access to electricity. But, all else being equal, as GDP per capita
increases, since this is used as a proxy for development in IFs, the energy intensity of
the economy decreases. However, as GDP per capita increases, overall GDP in the
SOUTH AFRICA IS TRANSITIONING AWAY FROM
ENERGY-INTENSE INDUSTRIES LIKE MINING TO SECTORS REQUIRING LESS ENERGY,
LIKE SERVICES
Notes: As GDP per capita at PPP increases, we expect the energy intensity of the economy to decline following a logarithmic curve. South Africa’s economy is quite energy-intense given the GDP per capita. For a full description of how energy demand is modelled in IFs see the help site, http://www.du.edu/ifs/help/understand/energy/equations/demand.html.
Sources: IFs version 7.09 using energy-consumption data from the World Bank, World Development Indicators.
3.5
3
2.5
2
1.5
1
0.5
05 10 15 20 25 30 35 40 45
GDP per capita, PPP (thousand 2011 USD)
Ene
rgy
inte
nsity
(bar
rels
oil
equi
vale
nt
per
thou
sand
US
D)
Mozambique
Ukraine
South AfricaRussia
Kenya
China
IndiaBrazil
Greece
South Korea
Germany
6 GRIDLOCKED: A LONG-TERM LOOK AT SOUTH AFRICA’S ELECTRICITY SECTOR
AFRICAN FUTURES PAPER
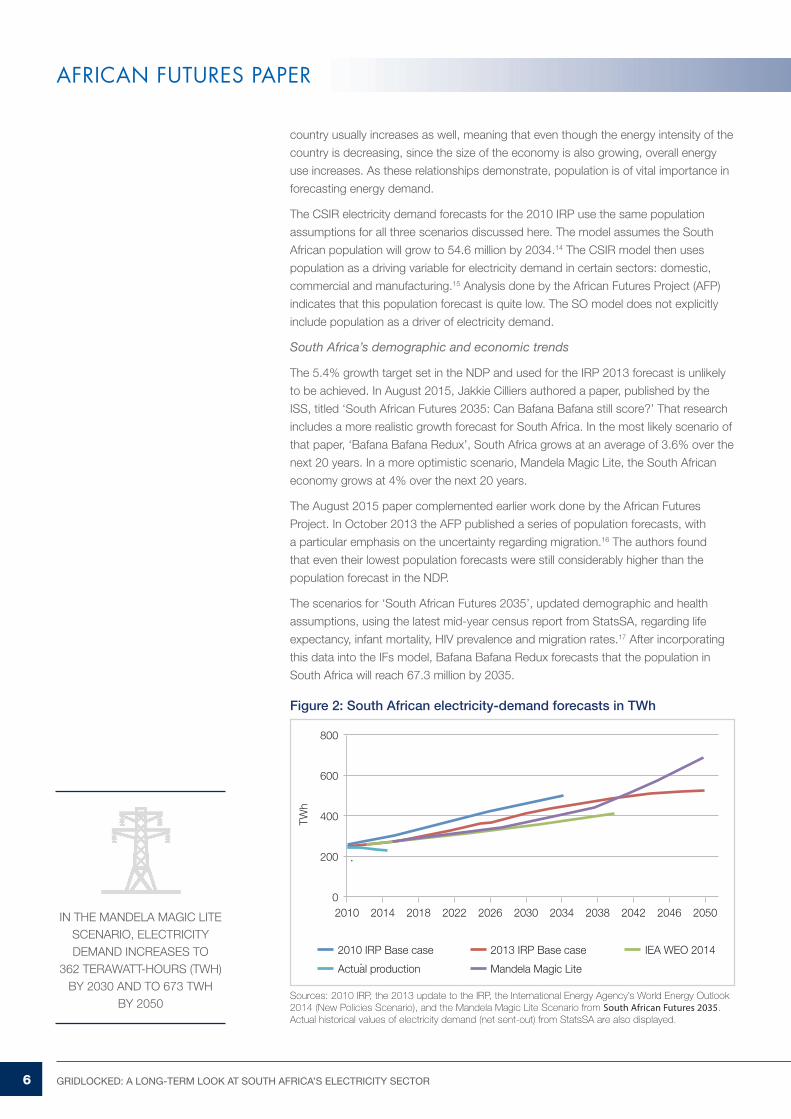
Figure 2: South African electricity-demand forecasts in TWh
Sources: 2010 IRP, the 2013 update to the IRP, the International Energy Agency’s World Energy Outlook 2014 (New Policies Scenario), and the Mandela Magic Lite Scenario from South African Futures 2035. Actual historical values of electricity demand (net sent-out) from StatsSA are also displayed.
country usually increases as well, meaning that even though the energy intensity of the
country is decreasing, since the size of the economy is also growing, overall energy
use increases. As these relationships demonstrate, population is of vital importance in
forecasting energy demand.
The CSIR electricity demand forecasts for the 2010 IRP use the same population
assumptions for all three scenarios discussed here. The model assumes the South
African population will grow to 54.6 million by 2034.14 The CSIR model then uses
population as a driving variable for electricity demand in certain sectors: domestic,
commercial and manufacturing.15 Analysis done by the African Futures Project (AFP)
indicates that this population forecast is quite low. The SO model does not explicitly
include population as a driver of electricity demand.
South Africa’s demographic and economic trends
The 5.4% growth target set in the NDP and used for the IRP 2013 forecast is unlikely
to be achieved. In August 2015, Jakkie Cilliers authored a paper, published by the
ISS, titled ‘South African Futures 2035: Can Bafana Bafana still score?’ That research
includes a more realistic growth forecast for South Africa. In the most likely scenario of
that paper, ‘Bafana Bafana Redux’, South Africa grows at an average of 3.6% over the
next 20 years. In a more optimistic scenario, Mandela Magic Lite, the South African
economy grows at 4% over the next 20 years.
The August 2015 paper complemented earlier work done by the African Futures
Project. In October 2013 the AFP published a series of population forecasts, with
a particular emphasis on the uncertainty regarding migration.16 The authors found
that even their lowest population forecasts were still considerably higher than the
population forecast in the NDP.
The scenarios for ‘South African Futures 2035’, updated demographic and health
assumptions, using the latest mid-year census report from StatsSA, regarding life
expectancy, infant mortality, HIV prevalence and migration rates.17 After incorporating
this data into the IFs model, Bafana Bafana Redux forecasts that the population in
South Africa will reach 67.3 million by 2035.
IN THE MANDELA MAGIC LITE SCENARIO, ELECTRICITY DEMAND INCREASES TO
362 TERAWATT-HOURS (TWH) BY 2030 AND TO 673 TWH
BY 2050
2010 IRP Base case 2013 IRP Base case IEA WEO 2014
Mandela Magic Lite Actual production
2010 2014 2018 2022 2026 2030 2034 2038 2042 2046 2050
TWh
800
600
400
200
0
AFRICAN FUTURES PAPER 15 • SEPTEMBER 2015 7
Figure 2 is a graph comparing electricity demand, as forecast in IFs, with the forecasts
from the CSIR and the SO used in the previous IRPs, as well as a demand forecast
from the International Energy Agency. In the Mandela Magic Lite scenario, electricity
demand increases to 362 terawatt-hours (TWh) by 2030 and to 673 TWh by 2050.18
In this scenario, electricity demand is lower than the forecasts in both the 2010 IRP
and the 2013 update in the short to medium term, though it rises more towards the
end of the time horizon. The rise in the long term is due to the larger population and
optimistic economic growth in the Mandela Magic Lite scenario.
Self-fulfilling prophecy
Since electricity demand currently exceeds supply in South Africa, in some sense, true
electricity demand is unknown. Consumption is constrained by supply; if supply were
to increase, so would consumption. The degree to which consumption could rise if
supply were to be increased is difficult to estimate, however.
TRUE ELECTRICITY DEMAND IN SOUTH AFRICA
IS UNKNOWN BECAUSE POTENTIAL CONSUMPTION
IS CONSTRAINED BY CURRENT SUPPLY
The cost of an oversupply of electricity is usually less than the cost of unserved energy
Because of the effects supply can have on demand, energy planners need to err on
the side of optimism in their growth forecasts. As stated previously, one of the reasons
for less-than-expected economic growth is electricity constraints. It is illogical to
use economic growth forecasts that are constrained by electrical capacity to inform
decisions regarding electrical capacity – if GDP is constrained by supply, then one
cannot use GDP to forecast supply. Although an overly optimistic economic growth
forecast could lead to an overinvestment in generating capacity, the cost of an
oversupply of electricity is usually less than the cost of unserved energy (up to a point)
– in other words, it is less costly to have too much energy than too little.19
Supply
Energy planners use demand forecasts to inform decisions on investment in capacity.
For the 2010 IRP, demand profiles were forecast until 2030, using a time step of one
hour. This type of granularity is necessary in energy planning, as demand can change
drastically throughout the day, the week and the season. Once these demand profiles
are created, energy planners can plan to build resources based on the cost, capacity
factor, reliability and dispatchability of each capacity type.
Once electricity demand is forecast in gigawatt hours (GWh), energy planners need
to translate this into required capacity measured in gigawatts. Since GWh is a unit of
energy and GW is a unit of power, the translation from electricity demand to supply
decisions is not trivial.
Making informed energy-planning decisions requires assumptions of:
• The cost of each type of capacity (dependent on run time, fuel costs,
maintenance, etc.)
• The lifetime of each type of capacity
• Capacity factors of each type of capacity
• The reliability and dispatchability of each capacity type
• The efficiency of the transmission and distribution of electricity through the grid
• Demand profiles
• The potential for demand-side management
8 GRIDLOCKED: A LONG-TERM LOOK AT SOUTH AFRICA’S ELECTRICITY SECTOR
AFRICAN FUTURES PAPER
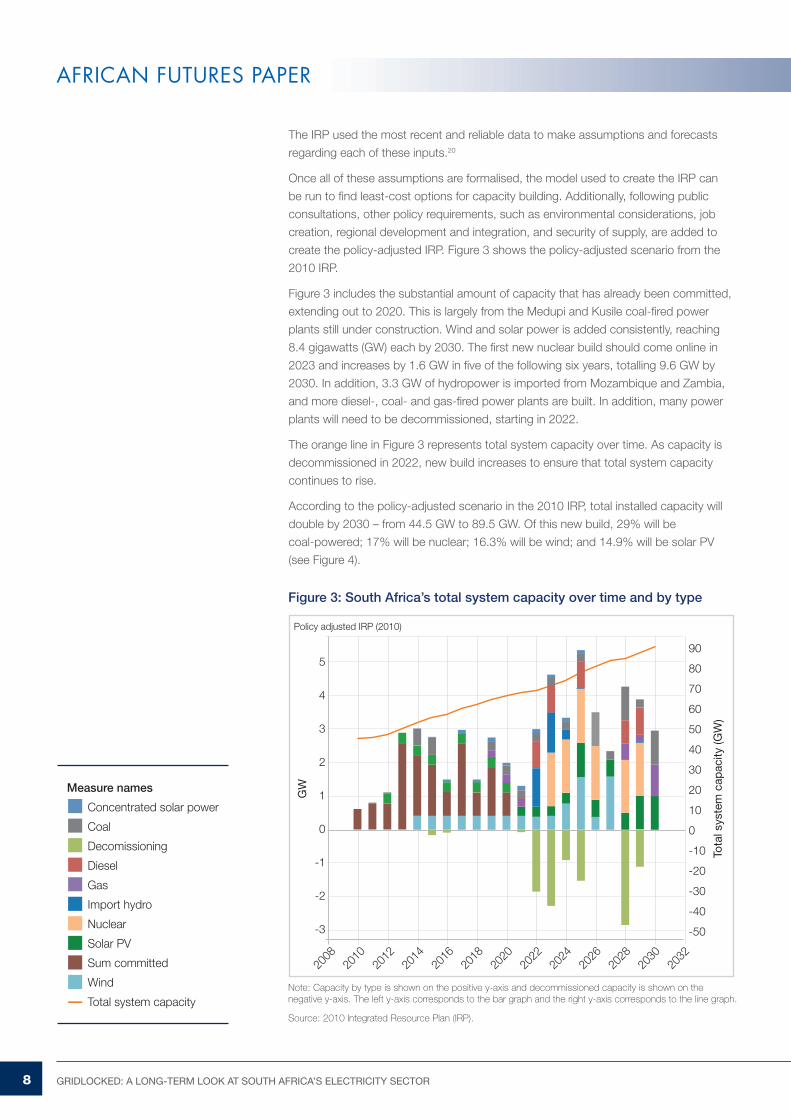
Figure 3: South Africa’s total system capacity over time and by type
Note: Capacity by type is shown on the positive y-axis and decommissioned capacity is shown on the negative y-axis. The left y-axis corresponds to the bar graph and the right y-axis corresponds to the line graph.
Source: 2010 Integrated Resource Plan (IRP).
The IRP used the most recent and reliable data to make assumptions and forecasts
regarding each of these inputs.20
Once all of these assumptions are formalised, the model used to create the IRP can
be run to find least-cost options for capacity building. Additionally, following public
consultations, other policy requirements, such as environmental considerations, job
creation, regional development and integration, and security of supply, are added to
create the policy-adjusted IRP. Figure 3 shows the policy-adjusted scenario from the
2010 IRP.
Figure 3 includes the substantial amount of capacity that has already been committed,
extending out to 2020. This is largely from the Medupi and Kusile coal-fired power
plants still under construction. Wind and solar power is added consistently, reaching
8.4 gigawatts (GW) each by 2030. The first new nuclear build should come online in
2023 and increases by 1.6 GW in five of the following six years, totalling 9.6 GW by
2030. In addition, 3.3 GW of hydropower is imported from Mozambique and Zambia,
and more diesel-, coal- and gas-fired power plants are built. In addition, many power
plants will need to be decommissioned, starting in 2022.
The orange line in Figure 3 represents total system capacity over time. As capacity is
decommissioned in 2022, new build increases to ensure that total system capacity
continues to rise.
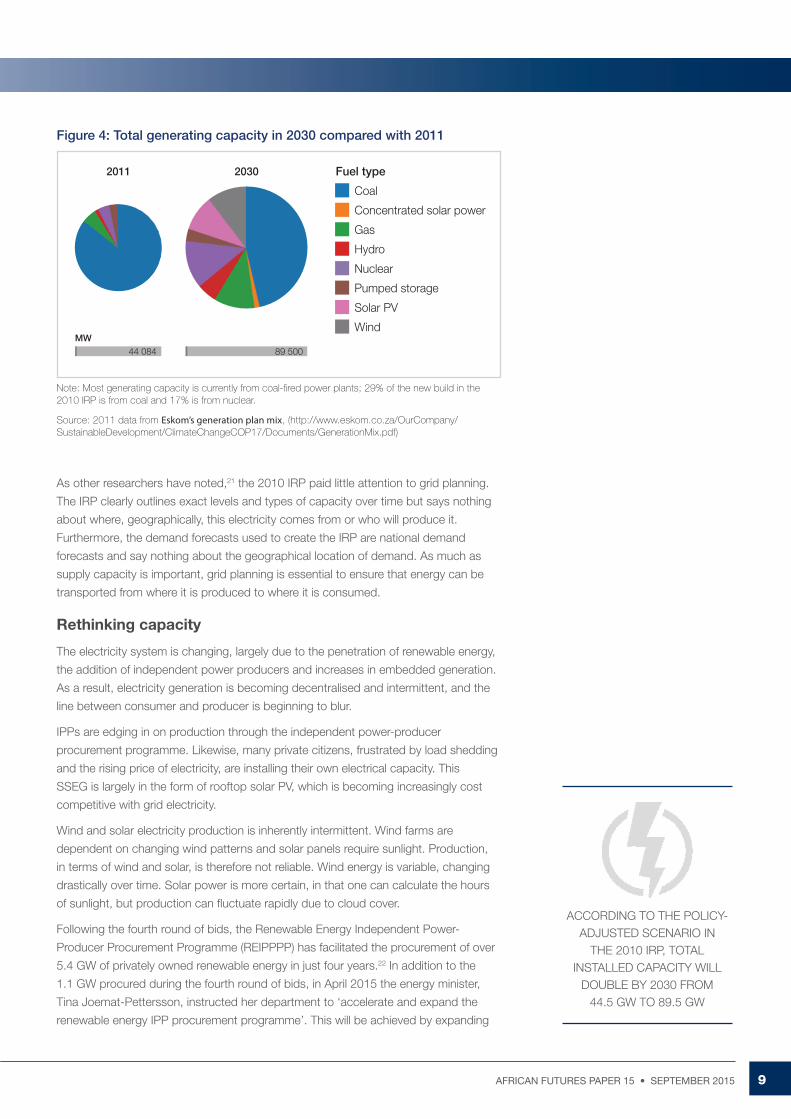
According to the policy-adjusted scenario in the 2010 IRP, total installed capacity will
double by 2030 – from 44.5 GW to 89.5 GW. Of this new build, 29% will be
coal-powered; 17% will be nuclear; 16.3% will be wind; and 14.9% will be solar PV
(see Figure 4).
Measure names
Concentrated solar power
Coal
Decomissioning
Diesel
Gas
Import hydro
Nuclear
Solar PV
Sum committed
Wind
Total system capacity
Policy adjusted IRP (2010)
5
4
3
2
1
0
-1
-2
-3
90
80
70
60
50
40
30
20
10
0
-10
-20
-30
-40
-50
2008
2010
2012
2014
2016
2018
2020
2022
2024
2026
2028
2030
2032
GW
Tota
l sys
tem
cap
acity
(GW
)
AFRICAN FUTURES PAPER 15 • SEPTEMBER 2015 9
Figure 4: Total generating capacity in 2030 compared with 2011
Note: Most generating capacity is currently from coal-fired power plants; 29% of the new build in the 2010 IRP is from coal and 17% is from nuclear.
Source: 2011 data from Eskom’s generation plan mix, (http://www.eskom.co.za/OurCompany/SustainableDevelopment/ClimateChangeCOP17/Documents/GenerationMix.pdf)
As other researchers have noted,21 the 2010 IRP paid little attention to grid planning.
The IRP clearly outlines exact levels and types of capacity over time but says nothing
about where, geographically, this electricity comes from or who will produce it.
Furthermore, the demand forecasts used to create the IRP are national demand
forecasts and say nothing about the geographical location of demand. As much as
supply capacity is important, grid planning is essential to ensure that energy can be
transported from where it is produced to where it is consumed.
Rethinking capacity
The electricity system is changing, largely due to the penetration of renewable energy,
the addition of independent power producers and increases in embedded generation.
As a result, electricity generation is becoming decentralised and intermittent, and the
line between consumer and producer is beginning to blur.
IPPs are edging in on production through the independent power-producer
procurement programme. Likewise, many private citizens, frustrated by load shedding
and the rising price of electricity, are installing their own electrical capacity. This
SSEG is largely in the form of rooftop solar PV, which is becoming increasingly cost
competitive with grid electricity.
Wind and solar electricity production is inherently intermittent. Wind farms are
dependent on changing wind patterns and solar panels require sunlight. Production,
in terms of wind and solar, is therefore not reliable. Wind energy is variable, changing
drastically over time. Solar power is more certain, in that one can calculate the hours
of sunlight, but production can fluctuate rapidly due to cloud cover.
Following the fourth round of bids, the Renewable Energy Independent Power-
Producer Procurement Programme (REIPPPP) has facilitated the procurement of over
5.4 GW of privately owned renewable energy in just four years.22 In addition to the
1.1 GW procured during the fourth round of bids, in April 2015 the energy minister,
Tina Joemat-Pettersson, instructed her department to ‘accelerate and expand the
renewable energy IPP procurement programme’. This will be achieved by expanding
ACCORDING TO THE POLICY-ADJUSTED SCENARIO IN
THE 2010 IRP, TOTAL INSTALLED CAPACITY WILL
DOUBLE BY 2030 FROM 44.5 GW TO 89.5 GW
Fuel type
Coal
Concentrated solar power
Gas
Hydro
Nuclear
Pumped storage
Solar PV
Wind
2011 2030
MW44 084 89 500
10 GRIDLOCKED: A LONG-TERM LOOK AT SOUTH AFRICA’S ELECTRICITY SECTOR
AFRICAN FUTURES PAPER
the fourth round of bids, expediting another 1.8 GW of capacity
and requesting that the REIPPPP be expanded to procure
another 6.3 GW. In addition, the DoE will procure 3.1 GW from
gas-fired IPPs; 2.5 GW from coal-fired IPPs; and 0.8 GW from
co-generation IPPs. The minister went on to announce that the
Small Projects Programme, which seeks to procure renewable
energy from small-scale IPPs is under way.
Together, all of these IPPs could contribute 20 GW 23 of
capacity. To put that in perspective, all power-generating
capacity from all sources in South Africa in 2013 was equivalent
to 45.7 GW.24 Although, when combined, this is a lot of
capacity, the
average size of each project from the first four rounds of the
IPPPP is just 69 MW. Compare this with the six units, each with
800 MW capacity, being built as part of the Kusile coal-fired
power station.25
2013 update to the IRP includes a forecast for SSEG using
rooftop PV as a proxy. Based on assumptions regarding
income, it forecasts that small-scale PV could account for 30
GW of electricity-generating capacity in South Africa by 2050.
If this seems unlikely, one need only look at Germany, where
48% (86 GW) of the country’s total installed capacity is
distributed. Not all of this is residential PV: Germany strongly
encourages industry to produce its own electricity. Installed PV
capacity in Germany grew from 1 GW to 32 GW between 2004
and 2012. Therefore, South Africa’s forecast of 30 GW by 2050
is not unrealistic.28
The average capacity of rooftop PV is much smaller than
even the Small Projects Programme of the IPPPP, however.
The forecast in the 2013 IRP assumes an average installation
capacity of 5 kilowatts (kW). This means the 30 GW of energy in
2050 would come from six million citizens.
As a way to curb peak demand, Eskom and some municipalities
are beginning to implement time-of-use (ToU) tariffs.29 ToU
tariffs, or ‘differential pricing’, allow the electricity supplier to
change the price of electricity throughout the day, depending
on demand patterns. Feed-in tariffs (FITs), or ‘standard offers’,
are policy options under which electricity producers (including
private citizens) are compensated for the electricity they supply
to the grid. Although ToU and FITs can and have been used
globally to effectively integrate private production into the
grid and manage demand curves, they also contribute to the
increasing complexity of the system.
As a result of the changing locations of generating capacity and
the decoupling of load centres from capacity centres, the flows
of electricity are also changing. Electricity no longer flows in
one direction from producer to consumer. FITs could turn every
consumer with private generation into part-time producers, or
‘prosumers’. A safe and reliable supply of electricity requires a
system operator to coordinate supply and demand in real time,
while avoiding fluctuations in the frequency of electricity.
Driven by the increasing cost of grid electricity and the prevalence of load shedding, many South Africans are beginning to ‘defect’
As evidenced by the minister’s plans to expand the programme,
the IPPPP has been successful in many ways. Not only have
private power producers been willing to continually bid lower
in each successive round of bids, but the renewable energy
that has been built as a result of the programme has also
significantly contributed to the South African economy. An
independent study by the CSIR found that renewable energy in
2014 contributed a net R0.8 billion to the economy.26 But there
are a number of hurdles standing in the way of IPP integration.
Eskom has already expressed concern over the ability to
integrate IPPs into the grid.27 Eskom has connected 32 projects
totalling 1.6 GW, but the general manager of grid planning,
Mbulelo Kibido, said in October 2014 that it was becoming
increasingly difficult and expensive to integrate IPPs,
renewable or otherwise. Since the easiest projects to connect
to the grid have already been selected during the first IPPPP
bidding rounds, it is now likely to become more difficult to
incorporate IPPs.
In addition to IPPs, private citizens are beginning to produce
their own electricity. Driven by the increasing cost of grid
electricity, the prevalence of load shedding and the decreasing
cost of PV, many South Africans are beginning to ‘defect’. The
The changing locations of generating capacity and the decoupling of load centres from capacity centres are changing the flows of energy
What’s more, since embedded generation occurs ‘behind
the meter’, it cannot be directly controlled or billed by the
municipality. Because much municipal revenue comes from
AFRICAN FUTURES PAPER 15 • SEPTEMBER 2015 11
electricity sales, if policies and regulations are not put in place, SSEG could lead to
revenue losses for some municipalities.
Instead of a limited number of power stations owned and operated by one utility,
South Africa may have millions of producers, each with their own unique production
and consumption patterns, buying and selling electricity at changing prices throughout
the day. Adapting to the increasing complexity of this kind of system would require
the integration of grid planning (and all energy planning) into the IRP, clear roles
and responsibilities for all electricity-sector actors, flexible generating capacity, and
coherent regulations and policies regarding SSEG.
Grid response
The electricity grid was created in the image of the Industrial Revolution, modelled
for centralised mass production to leverage economies of scale. Whereas
telecommunications networks have evolved to accommodate modern technologies
(e.g. cellphones, GPS, satellite TV and the Internet), electricity infrastructure has not
changed significantly over time.
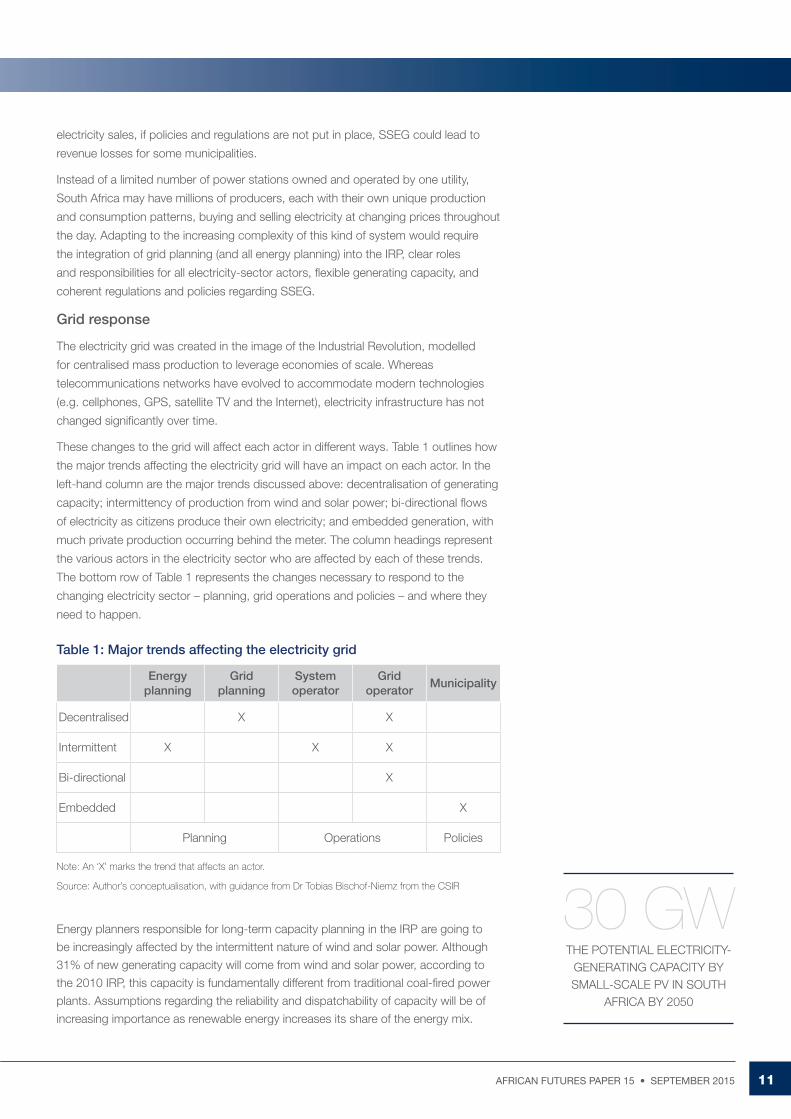
These changes to the grid will affect each actor in different ways. Table 1 outlines how
the major trends affecting the electricity grid will have an impact on each actor. In the
left-hand column are the major trends discussed above: decentralisation of generating
capacity; intermittency of production from wind and solar power; bi-directional flows
of electricity as citizens produce their own electricity; and embedded generation, with
much private production occurring behind the meter. The column headings represent
the various actors in the electricity sector who are affected by each of these trends.
The bottom row of Table 1 represents the changes necessary to respond to the
changing electricity sector – planning, grid operations and policies – and where they
need to happen.
Table 1: Major trends affecting the electricity grid
THE POTENTIAL ELECTRICITY-GENERATING CAPACITY BY SMALL-SCALE PV IN SOUTH
AFRICA BY 2050
Energy planning
Grid planning
System operator
Grid operator
Municipality
Decentralised X X
Intermittent X X X
Bi-directional X
Embedded X
Planning Operations Policies
Note: An ‘X’ marks the trend that affects an actor.
Source: Author’s conceptualisation, with guidance from Dr Tobias Bischof-Niemz from the CSIR
Energy planners responsible for long-term capacity planning in the IRP are going to
be increasingly affected by the intermittent nature of wind and solar power. Although
31% of new generating capacity will come from wind and solar power, according to
the 2010 IRP, this capacity is fundamentally different from traditional coal-fired power
plants. Assumptions regarding the reliability and dispatchability of capacity will be of
increasing importance as renewable energy increases its share of the energy mix.
30 GW
12 GRIDLOCKED: A LONG-TERM LOOK AT SOUTH AFRICA’S ELECTRICITY SECTOR
AFRICAN FUTURES PAPER
Grid planners, who are responsible for planning the transmission grid, are going to be
increasingly affected by the changing location of generating capacity. New solar and
wind plants are likely to be located far from traditional centres of electricity production,
meaning that new transmission lines will need to be built. Not only are locations of
capacity changing, but, since much of this new capacity is coming from IPPs, grid
planners also have limited information about the proposed locations of new build.
SOs are responsible for maintaining a balance of supply and demand over the grid in
real time. Intermittent electricity production increases the complexity of the system that
the SO must manage. Balancing supply and demand to maintain a stable frequency is
more complicated when production is no longer under the operator’s control.
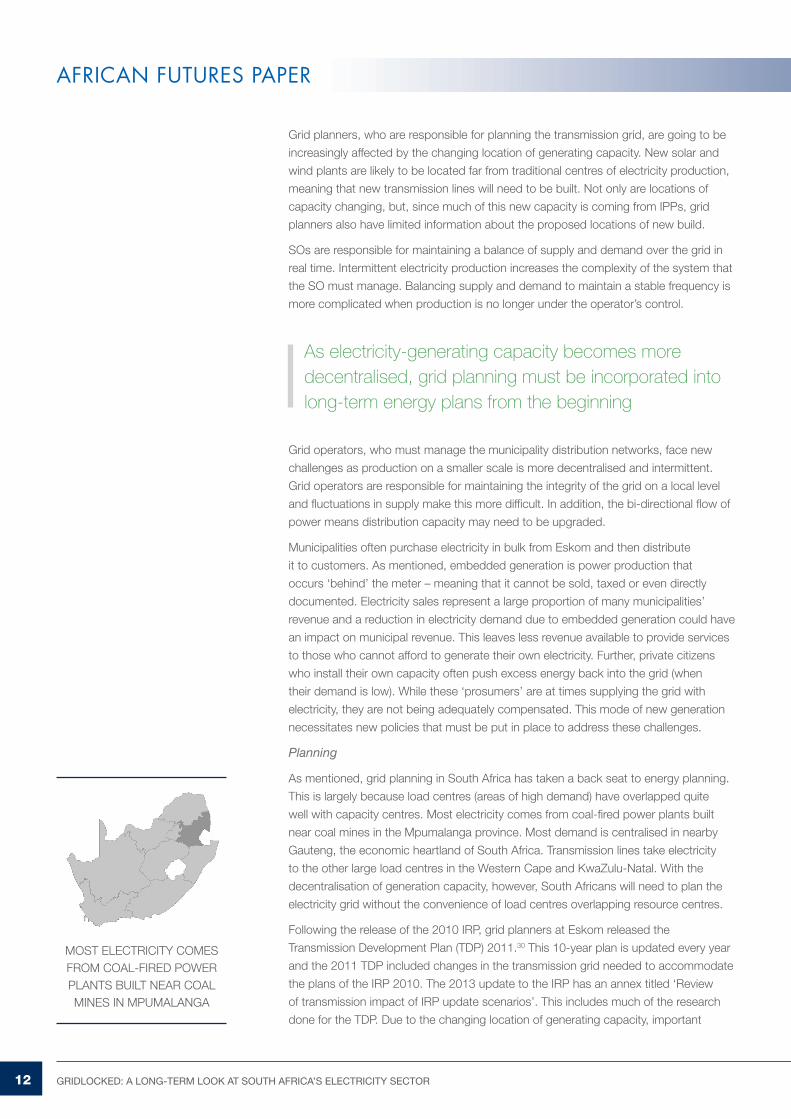
MOST ELECTRICITY COMES FROM COAL-FIRED POWER PLANTS BUILT NEAR COAL MINES IN MPUMALANGA
As electricity-generating capacity becomes more decentralised, grid planning must be incorporated into long-term energy plans from the beginning
Grid operators, who must manage the municipality distribution networks, face new
challenges as production on a smaller scale is more decentralised and intermittent.
Grid operators are responsible for maintaining the integrity of the grid on a local level
and fluctuations in supply make this more difficult. In addition, the bi-directional flow of
power means distribution capacity may need to be upgraded.
Municipalities often purchase electricity in bulk from Eskom and then distribute
it to customers. As mentioned, embedded generation is power production that
occurs ‘behind’ the meter – meaning that it cannot be sold, taxed or even directly
documented. Electricity sales represent a large proportion of many municipalities’
revenue and a reduction in electricity demand due to embedded generation could have
an impact on municipal revenue. This leaves less revenue available to provide services
to those who cannot afford to generate their own electricity. Further, private citizens
who install their own capacity often push excess energy back into the grid (when
their demand is low). While these ‘prosumers’ are at times supplying the grid with
electricity, they are not being adequately compensated. This mode of new generation
necessitates new policies that must be put in place to address these challenges.
Planning
As mentioned, grid planning in South Africa has taken a back seat to energy planning.
This is largely because load centres (areas of high demand) have overlapped quite
well with capacity centres. Most electricity comes from coal-fired power plants built
near coal mines in the Mpumalanga province. Most demand is centralised in nearby
Gauteng, the economic heartland of South Africa. Transmission lines take electricity
to the other large load centres in the Western Cape and KwaZulu-Natal. With the
decentralisation of generation capacity, however, South Africans will need to plan the
electricity grid without the convenience of load centres overlapping resource centres.
Following the release of the 2010 IRP, grid planners at Eskom released the
Transmission Development Plan (TDP) 2011.30 This 10-year plan is updated every year
and the 2011 TDP included changes in the transmission grid needed to accommodate
the plans of the IRP 2010. The 2013 update to the IRP has an annex titled ‘Review
of transmission impact of IRP update scenarios’. This includes much of the research
done for the TDP. Due to the changing location of generating capacity, important
AFRICAN FUTURES PAPER 15 • SEPTEMBER 2015 13
LIMPOPO BECOMES THE LARGEST NET ENERGY
SUPPLIER DUE TO PLANNED EXPANSION OF COAL-FIRED
POWER PLANTS
2040
changes to the transmission grid are now required. The 2013 update to the IRP
identified five main ‘transmission power corridors’ that need to be developed.
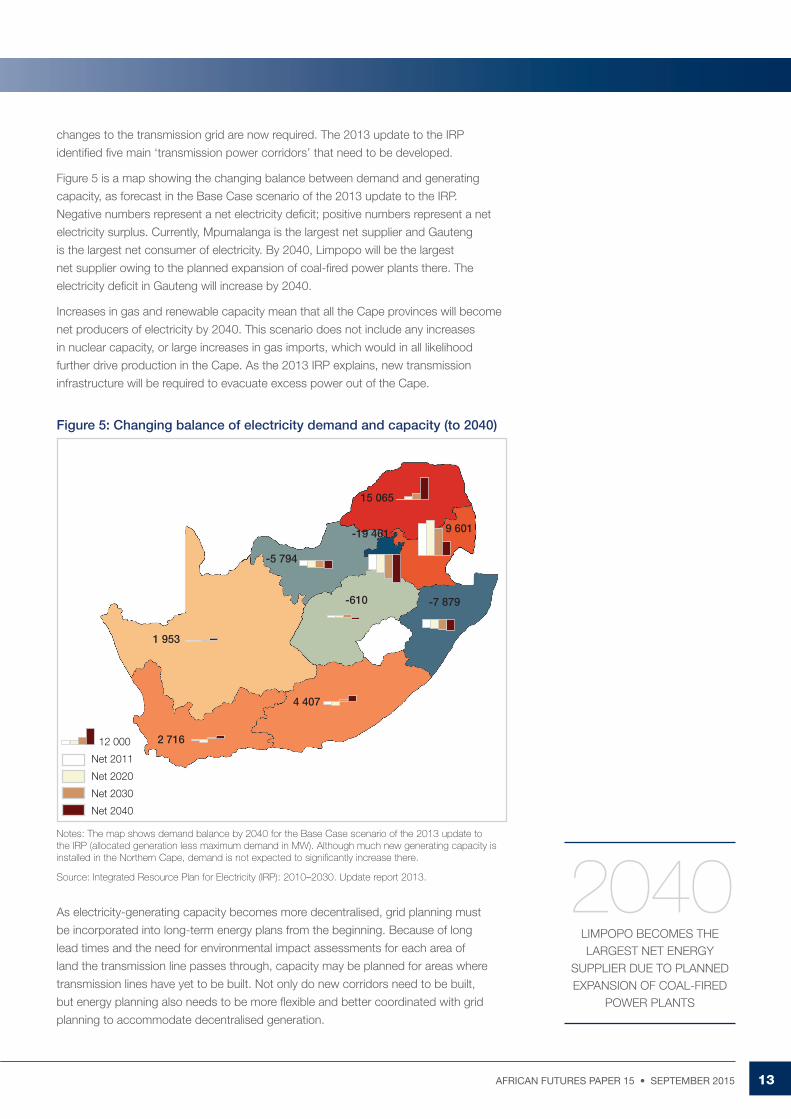
Figure 5 is a map showing the changing balance between demand and generating
capacity, as forecast in the Base Case scenario of the 2013 update to the IRP.
Negative numbers represent a net electricity deficit; positive numbers represent a net
electricity surplus. Currently, Mpumalanga is the largest net supplier and Gauteng
is the largest net consumer of electricity. By 2040, Limpopo will be the largest
net supplier owing to the planned expansion of coal-fired power plants there. The
electricity deficit in Gauteng will increase by 2040.
Increases in gas and renewable capacity mean that all the Cape provinces will become
net producers of electricity by 2040. This scenario does not include any increases
in nuclear capacity, or large increases in gas imports, which would in all likelihood
further drive production in the Cape. As the 2013 IRP explains, new transmission
infrastructure will be required to evacuate excess power out of the Cape.
Figure 5: Changing balance of electricity demand and capacity (to 2040)
Notes: The map shows demand balance by 2040 for the Base Case scenario of the 2013 update to the IRP (allocated generation less maximum demand in MW). Although much new generating capacity is installed in the Northern Cape, demand is not expected to significantly increase there.
Source: Integrated Resource Plan for Electricity (IRP): 2010–2030. Update report 2013.
As electricity-generating capacity becomes more decentralised, grid planning must
be incorporated into long-term energy plans from the beginning. Because of long
lead times and the need for environmental impact assessments for each area of
land the transmission line passes through, capacity may be planned for areas where
transmission lines have yet to be built. Not only do new corridors need to be built,
but energy planning also needs to be more flexible and better coordinated with grid
planning to accommodate decentralised generation.
12 000
Net 2011
Net 2020
Net 2030
Net 2040
1 953
2 716
4 407
-7 879
15 065
9 601-19 461
-5 794
-610
14 GRIDLOCKED: A LONG-TERM LOOK AT SOUTH AFRICA’S ELECTRICITY SECTOR
AFRICAN FUTURES PAPER
Operations
Integrating decentralised and intermittent energy is not just an energy-planning
problem – grid operations are changing as well. To ensure a safe and reliable supply
of electricity, the frequency of the grid must be kept at exactly 50 hertz at all times.
The job of the SO, an Eskom entity, is to balance electricity supply and demand in real
time to maintain this frequency. To give an idea of the sensitivity of this balance, a one
degree drop in temperature in Gauteng requires an additional 400 MW of supply.31
An inability to maintain this balance would result in a grid collapse, or a national
blackout. Since South Africa does not have any neighbours with enough power
to restart the system, it could take more than a week to fully restore power.32
Load shedding is the SO’s last resort to balance the system by manually
decreasing demand.33
As wind and solar continue to increase their share of the energy mix, the difficulty in
maintaining this balance will increase. The SO must be able to anticipate and react to
changes in supply from intermittent power sources in real time. This requires greater
flexibility in terms of power generation – power stations that are cheaper to ramp up
or down will be more valuable. The growing complexity of supply will also require more
flexibility on the part of the SO itself – new operational strategies, such as long-term
wind forecasts, may be useful to ensure a safe and reliable supply of electricity.
Policies
Besides the technical advancements required to unlock SSEG potential, policies and
regulations must be put in place so that municipalities are able to reap the benefits and
redistribute the rewards effectively. If municipalities are not able to effectively regulate
embedded generation, much of the potential benefits of this capacity will go to waste.
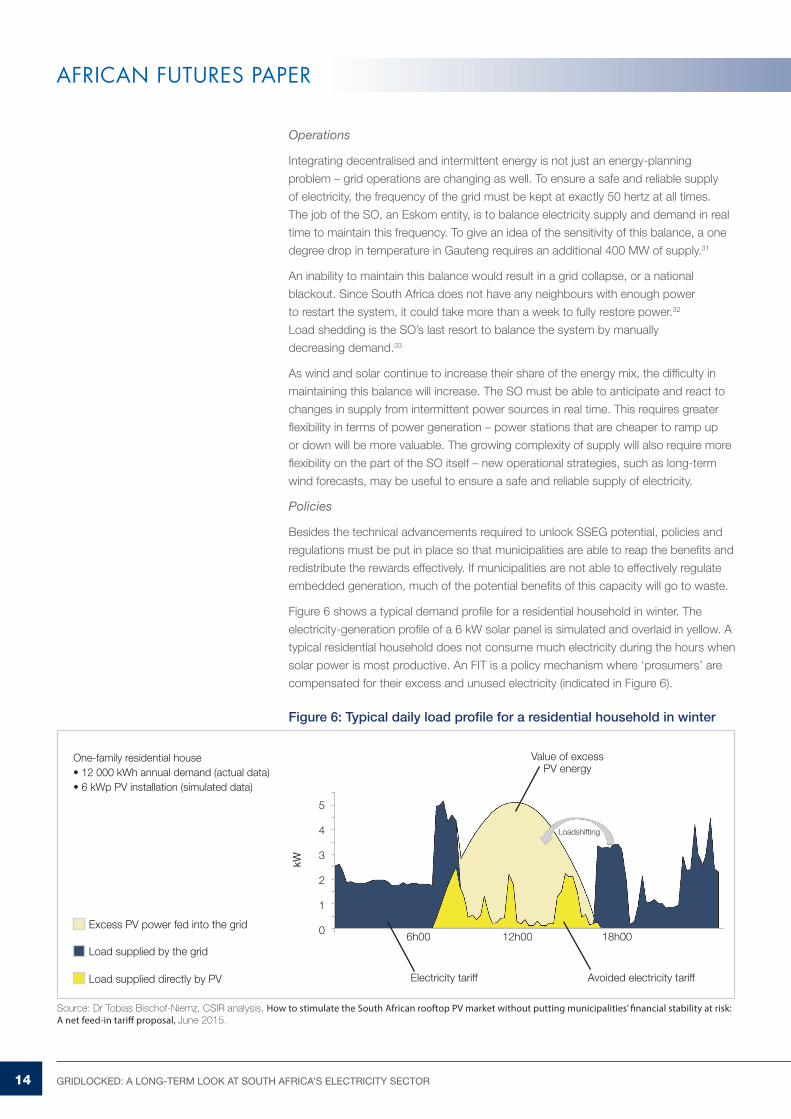
Figure 6 shows a typical demand profile for a residential household in winter. The
electricity-generation profile of a 6 kW solar panel is simulated and overlaid in yellow. A
typical residential household does not consume much electricity during the hours when
solar power is most productive. An FIT is a policy mechanism where ‘prosumers’ are
compensated for their excess and unused electricity (indicated in Figure 6).
Figure 6: Typical daily load profile for a residential household in winter
kW
5
4
3
2
1
0 6h00 12h00 18h00
Loadshifting
Value of excessPV energy
Electricity tariff Avoided electricity tariff
Excess PV power fed into the grid
Load supplied by the grid
Load supplied directly by PV
One-family residential house• 12 000 kWh annual demand (actual data)• 6 kWp PV installation (simulated data)
Source: Dr Tobias Bischof-Niemz, CSIR analysis, How to stimulate the South African rooftop PV market without putting municipalities’ financial stability at risk: A net feed-in tariff proposal, June 2015.
AFRICAN FUTURES PAPER 15 • SEPTEMBER 2015 15
Instead of harnessing the clean energy that the private sector is
willing to install, without clear policies, only those who can afford
it themselves may benefit. As energy analyst Dirk de Vos wrote
in the Daily Maverick, ‘Electricity could well go the way of health
and education, where the top end of the market privatises and
secures its own quality supply while the bottom end has to
make do with what the state can provide.’34
Coal has been the main source of electricity and energy
in South Africa for decades. It is likely to remain the main
source of electricity in the future, even as power plants are
decommissioned and a carbon tax is possibly introduced. The
Current Path scenario has coal production peaking in the early
2030s as renewable energy begins to take off. South Africa
has vast coal resources and reserves that will never be fully
exploited owing to the economic viability of renewable energy.
The IRP includes plans to build a fleet of six nuclear power
stations by 2029, together expected to contribute 9 600 MW to
South Africa’s generating capacity. This nuclear expansion has
been taken into account in the three scenarios.
Current Path scenario
The resource profile in the Current Path roughly follows the
2010 IRP until 2030, and then the energy module and electricity
sub-module of IFs complete the forecast to 2050.38
In the Current Path, energy planning continues along the
same lines of the 2010 IRP and the 2013 update, without the
integration of grid planning. Renewable energy is included
in energy planning but the impact of the decentralised and
intermittent nature of wind and solar on the grid occurs after
the fact. Likewise, IPPs are implicitly included in the next IRP
but the location of these private producers is not. This means
grid planners struggle to connect IPPs to the grid, as it often
takes less time to build capacity than to construct transmission
cables. (As mentioned, constructing transmission cables
requires long lead times to carry out environmental impact
assessments.) Embedded generation continues to be implicitly
included in the IRP – the IRP does not determine where and
what size of capacity should be installed.
Instead of harnessing the clean energy that the private sector is willing to install, without clear policies, only those who can afford it themselves may benefit
However, electricity is different from health and education.
Few private citizens truly defect, or go ‘off-grid’. Most people
who install their own PV systems become ‘prosumers’ – a
combination of consumers and producers. Through clear and
coherent policies, prosumers can be compensated for their
excess energy when they are producers.
Scenarios
What follows in this section is a description of each of the three
scenarios, as constructed in IFs; the implications of each scenario
are also discussed. All scenarios in this paper use the Mandela
Magic Lite scenario from “South African Futures 2035” as a
foundation.35 While this is not necessarily the most likely future
for South Africa, as explained above, it is better to err on the side
of economic optimism in energy planning. The scenarios in this
paper also build on previous work done by the African Futures
Project for the Western Cape provincial government, primarily the
paper titled, “Green Cape 2040: Towards a Smarter Grid.”36
The Current Path envisages a future situation that has no
substantial changes in long-term energy planning or investments
in the electricity grid. Efficient Grid is one where investments are
made to upgrade the efficiency of the electricity grid substantially
over the next 35 years, but the investments and improvements
come on an ad hoc basis. Smarter Grid is a scenario where
investments are made not just in the efficiency of the grid, but
also in the ‘smartness’ of electricity planning, operations and
policies. In Smarter Grid, the government and all electricity-sector
actors anticipate and adapt to changes to the grid rather than
reacting to changes. A smarter grid allows renewable energy to
be integrated into the energy mix more effectively.
Due to the great uncertainty and long lead times associated with
oil and gas production, increases in oil or gas production in South
Africa are not included in any of these scenarios.37
Coal has been the main source of electricity and energy in South Africa, and is likely to remain the main source in future
The system operator struggles to keep up with the increasing
complexity of uncertain and unreliable generation from an
increasing number of IPPs in an increasing diversity of locations.
Large-scale installed capacity makes it expensive to ramp
production up and down to accommodate wind and solar.
Grid defection occurs at increasing rates as citizens become
frustrated by load shedding and rising electricity prices. While
grid defection lowers demand from the central producer,
municipalities lose significant amounts of revenue.
16 GRIDLOCKED: A LONG-TERM LOOK AT SOUTH AFRICA’S ELECTRICITY SECTOR
AFRICAN FUTURES PAPER
In the Current Path, there is no significant overhaul of the grid, making it difficult to
incorporate renewable energy into the mix. IPPs are not integrated to the degree
that the government desires and embedded generation benefits only those who can
afford to install it themselves. Those who can install their own generation are not
compensated for the energy they supply to the grid however. Municipalities continue to
lose revenue as residential PV uptake increases and it becomes increasingly difficult to
provide electricity to those in need.
Efficient Grid scenario
Under the Efficient Grid scenario, large investments are made in electricity infrastructure
in South Africa, leading to more efficient transmission and distribution of electricity.
Energy efficiency can be a path to a less costly and a more environmentally-friendly
energy sector. Increases in efficiency, however, do not always have direct impacts on
demand reduction, lower capacity requirements or lower greenhouse-gas emissions.
To explore the effects of increasing the efficiency of the electricity sector, Efficient Grid
is a scenario where transmission and distribution loss is reduced by 50% by 2050.39
Reduction in loss means that less investment is required in electricity-generating
capacity. Generating capacity increases from current levels of about 45 GW to over
139 GW by 2050 in the Current Path. In Efficient Grid this is reduced to 134.6 GW –
a 3.2% reduction.
ENERGY EFFICIENCY CAN BE A PATH TO A LESS COSTLY AND A MORE
ENVIRONMENTALLY FRIENDLY ENERGY SECTOR
The price of electricity may still increase in Efficient Grid, but not by as much as in a scenario where more electricity is lost through inefficient transmission and distribution
The relationship between efficiency gains and reduced capacity requirements is not
linear – reducing transmission loss by 1 kWh does not translate to a 1 kWh reduction
in required generation. Improvements in efficiency in transmission and distribution
lead to increased electricity consumption: since electricity demand exceeds available
supply in South Africa, then as more electricity becomes available, more electricity
is consumed.
Furthermore, as electricity is delivered more efficiently, the cost of electricity decreases
relative to the Current Path, which drives up demand. All else being equal, an increase
in transmission and distribution efficiency should lead to lower electricity prices relative
to the Current Path. The price of electricity may still increase in Efficient Grid, but not by
as much as in a scenario where more electricity is lost through inefficient transmission
and distribution. A lower electricity price will increase electricity consumption.
In the South African context, this rebound effect could happen in one of two pathways.
The price of electricity that Eskom sells is determined by Nersa, through its multi-
year price determination. According to the Electricity Regulation Act 2006 (Act 4 of
2006), Eskom is entitled ‘to recover the full cost of its licensed activities, including a
reasonable margin of return’.40 As the cost of electricity transmission decreases, the
price of electricity that Eskom sells will decrease, as determined by Nersa.
AFRICAN FUTURES PAPER 15 • SEPTEMBER 2015 17
The second way in which this rebound effect could occur in South Africa is in the
municipalities. If the distribution of electricity within municipalities is more efficient,
the cost of distribution will decrease. Should this cost reduction be translated into
price reductions for private citizens, electricity demand will increase relative to the
Current Path.
In Efficient Grid, electricity consumption increases by 0.8% by 2050. Therefore, Efficient
Grid sees an overall reduction in required generating capacity while consumption
increases slightly relative to the Current Path.
ONE OF THE LARGEST DRIVERS OF INDUSTRIAL
WATER DEMAND IS THERMO-ELECTRIC
POWER GENERATION
Coal-fired power plants require large amounts of water for cooling, and increasing electricity demand will drive industrial water demand in South Africa
Although required generation capacity decreases over the time horizon, overall primary
coal production increases. A more efficient electricity sector does not necessarily mean
less coal is produced. Although less energy is required by the electricity sector, more
energy is exported or used in other sectors, largely owing to the cheaper price of
electricity. This leads to an overall increase in carbon emissions over this time horizon,
relative to the Current Path.
Higher electricity demand increases economic growth slightly. The 0.8% increase in
electricity consumption translates into a 1% increase in GDP by 2050. This slight increase
means that 44 000 fewer South Africans will be living in extreme poverty by 2050.
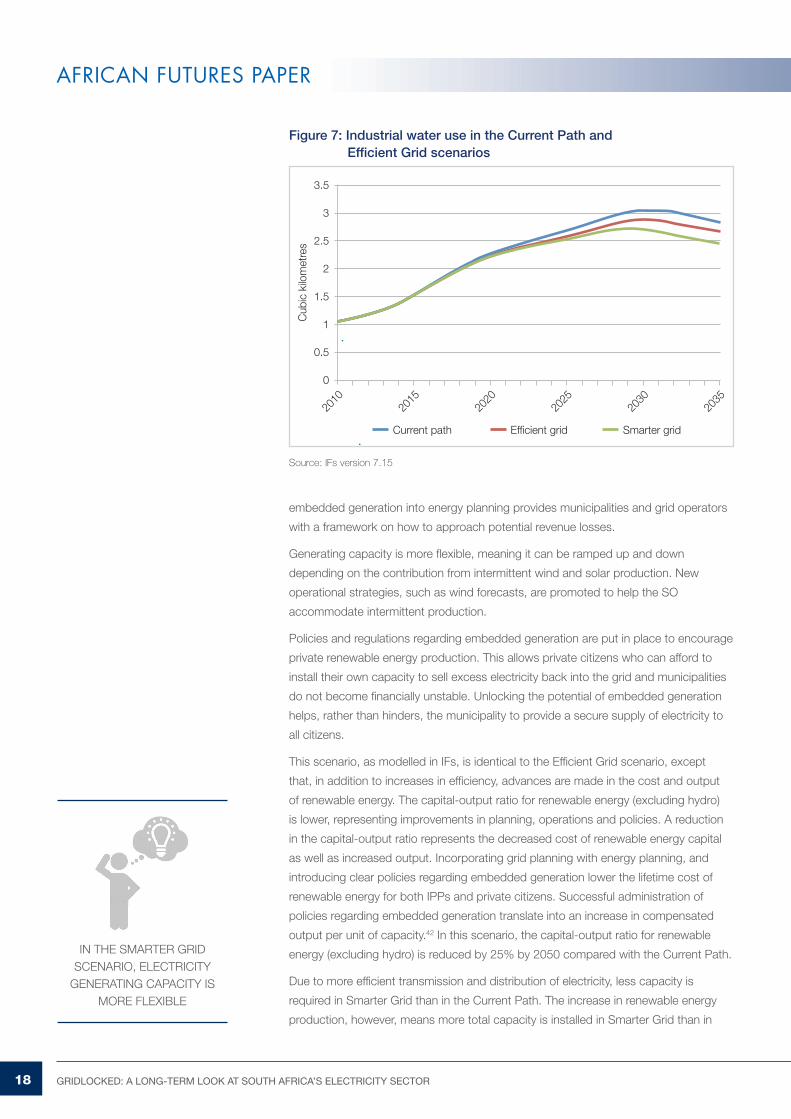
One of the largest drivers of industrial water demand is thermo-electric power generation.
In South Africa, coal-fired power plants require large amounts of water for cooling.
Increasing electricity demand will drive industrial water demand in South Africa. In
Efficient Grid, the reduction in required generating capacity reduces industrial water
demand compared with the Current Path by a cumulative 2.2 cubic kilometres by 2035
(see Figure 7).41
Although improvements in the efficiency of the grid lead to a reduction in required
capacity, and therefore reduced industrial water demand, the rebound effects of
increased energy demand offset the emissions benefits.
Smarter Grid scenario
A smarter grid is not simply a more efficient grid. As the nature of generation is
changing – from centralised industrial distribution to decentralised and intermittent
production – grid planning, operations and policies must become smarter to
incorporate these new sources.
Smarter Grid scenario is a future where energy planning includes assumptions regarding
the changing nature of capacity, systems operators are equipped with flexible physical
capacity and adapt to the changing complexity of intermittent electricity using innovative
operational strategies, and clear policies are put in place to unlock the potential of
embedded generation.
Incorporating grid planning into energy planning allows IPPs to be integrated more
rapidly. There are no delays between capacity construction and transmission
construction, as the IRP and the TDP are coordinated. Likewise, incorporating
18 GRIDLOCKED: A LONG-TERM LOOK AT SOUTH AFRICA’S ELECTRICITY SECTOR
AFRICAN FUTURES PAPER
Figure 7: Industrial water use in the Current Path and Efficient Grid scenarios
Source: IFs version 7.15
embedded generation into energy planning provides municipalities and grid operators
with a framework on how to approach potential revenue losses.
Generating capacity is more flexible, meaning it can be ramped up and down
depending on the contribution from intermittent wind and solar production. New
operational strategies, such as wind forecasts, are promoted to help the SO
accommodate intermittent production.
Policies and regulations regarding embedded generation are put in place to encourage
private renewable energy production. This allows private citizens who can afford to
install their own capacity to sell excess electricity back into the grid and municipalities
do not become financially unstable. Unlocking the potential of embedded generation
helps, rather than hinders, the municipality to provide a secure supply of electricity to
all citizens.
This scenario, as modelled in IFs, is identical to the Efficient Grid scenario, except
that, in addition to increases in efficiency, advances are made in the cost and output
of renewable energy. The capital-output ratio for renewable energy (excluding hydro)
is lower, representing improvements in planning, operations and policies. A reduction
in the capital-output ratio represents the decreased cost of renewable energy capital
as well as increased output. Incorporating grid planning with energy planning, and
introducing clear policies regarding embedded generation lower the lifetime cost of
renewable energy for both IPPs and private citizens. Successful administration of
policies regarding embedded generation translate into an increase in compensated
output per unit of capacity.42 In this scenario, the capital-output ratio for renewable
energy (excluding hydro) is reduced by 25% by 2050 compared with the Current Path.
Due to more efficient transmission and distribution of electricity, less capacity is
required in Smarter Grid than in the Current Path. The increase in renewable energy
production, however, means more total capacity is installed in Smarter Grid than in
IN THE SMARTER GRID SCENARIO, ELECTRICITY
GENERATING CAPACITY IS MORE FLEXIBLE
Cub
ic k
ilom
etre
s
Current path Efficient grid Smarter grid
2010
2015
2020
2025
2030
2035
3.5
3
2.5
2
1.5
1
0.5
0
AFRICAN FUTURES PAPER 15 • SEPTEMBER 2015 19
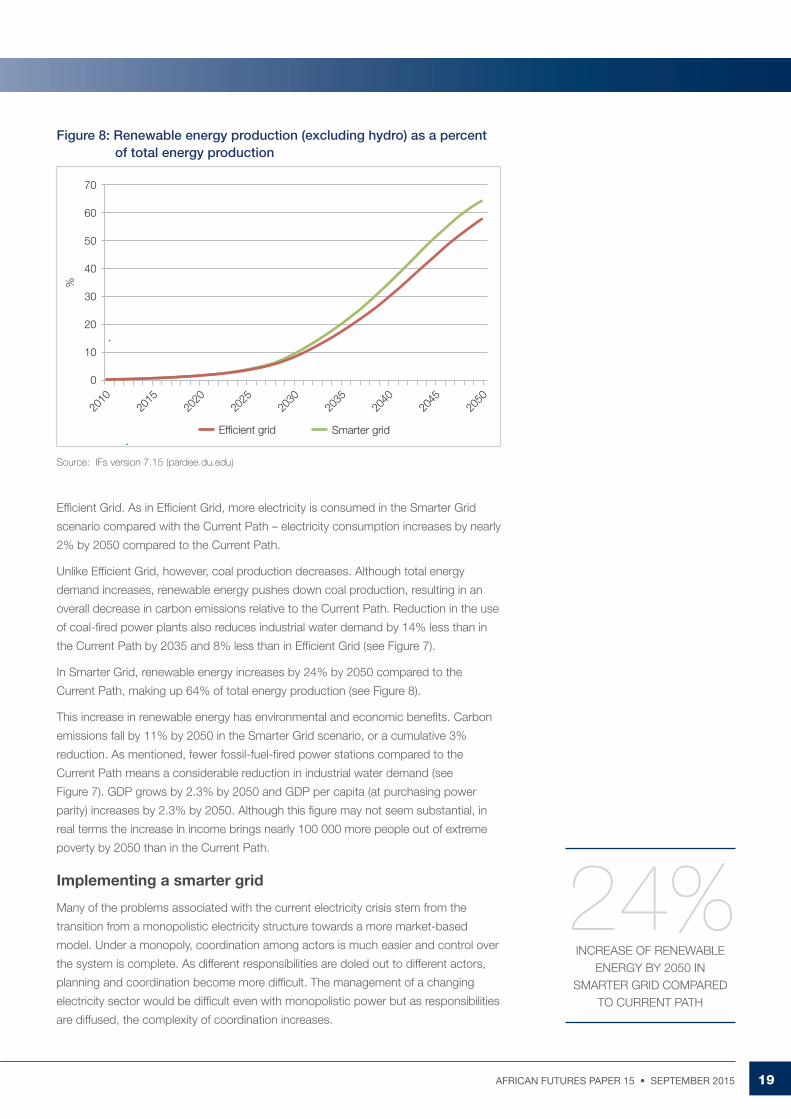
Figure 8: Renewable energy production (excluding hydro) as a percent of total energy production
Source: IFs version 7.15 (pardee.du.edu)
Efficient Grid. As in Efficient Grid, more electricity is consumed in the Smarter Grid
scenario compared with the Current Path – electricity consumption increases by nearly
2% by 2050 compared to the Current Path.
Unlike Efficient Grid, however, coal production decreases. Although total energy
demand increases, renewable energy pushes down coal production, resulting in an
overall decrease in carbon emissions relative to the Current Path. Reduction in the use
of coal-fired power plants also reduces industrial water demand by 14% less than in
the Current Path by 2035 and 8% less than in Efficient Grid (see Figure 7).
In Smarter Grid, renewable energy increases by 24% by 2050 compared to the
Current Path, making up 64% of total energy production (see Figure 8).
This increase in renewable energy has environmental and economic benefits. Carbon
emissions fall by 11% by 2050 in the Smarter Grid scenario, or a cumulative 3%
reduction. As mentioned, fewer fossil-fuel-fired power stations compared to the
Current Path means a considerable reduction in industrial water demand (see
Figure 7). GDP grows by 2.3% by 2050 and GDP per capita (at purchasing power
parity) increases by 2.3% by 2050. Although this figure may not seem substantial, in
real terms the increase in income brings nearly 100 000 more people out of extreme
poverty by 2050 than in the Current Path.
Implementing a smarter grid
Many of the problems associated with the current electricity crisis stem from the
transition from a monopolistic electricity structure towards a more market-based
model. Under a monopoly, coordination among actors is much easier and control over
the system is complete. As different responsibilities are doled out to different actors,
planning and coordination become more difficult. The management of a changing
electricity sector would be difficult even with monopolistic power but as responsibilities
are diffused, the complexity of coordination increases.
%
Efficient grid Smarter grid
70
60
50
40
30
20
10
0
2010
2020
2015
2025
2030
2035
2040
2045
2050
24%INCREASE OF RENEWABLE
ENERGY BY 2050 IN SMARTER GRID COMPARED
TO CURRENT PATH
20 GRIDLOCKED: A LONG-TERM LOOK AT SOUTH AFRICA’S ELECTRICITY SECTOR
AFRICAN FUTURES PAPER
Before 1999, Eskom was responsible for all generation (except for a few IPPs), all
transmission and all distribution (except for within large municipalities). Eskom created
the energy and grid plans, and operated the transmission and distribution systems. As
a public entity, it fell under the jurisdiction of the Department of Public Enterprises. The
Department of Minerals and Energy was responsible for energy planning, allocation
and procurement (in consultation with Nersa) for the country, though Eskom could
control its own assets and planning.
After the NewGen regulations were put in place in 2009, the roles of the different
actors in the electricity sector became more ambiguous.43 Energy planning and the
IRP, as discussed, are now the responsibility of the DoE. The Minister of Energy is
responsible for awarding IPPs, in consultation with the Minister of Finance. As Eskom
operates the transmission grid, however, it also acts as the buyer of all electricity from
all producers. As Eskom owns much of the generating capacity, there is potential for
conflicts of interest.
Because of this potential conflict of interest, there are now discussions over the
role of the system operator and the ownership of the transmission grid. In his 2010
State of the Nation Address, President Jacob Zuma announced the establishment
of an independent system and market operator, separate from Eskom. However, the
proposed bill44 was voted down in 2015.45 This bill would have removed the SO, which
procures supply to balance demand, from Eskom control.
Although there is the potential for a conflict of interest as long as the SO and the
associated authorities remain in Eskom control, restructuring the electricity sector must
be part of a long-term, coherent plan. If the government should decide to continue to
move towards a market-based model with more private-sector participation, then an
independent system and market operator, or at least an independent market operator,
will be necessary to avoid conflicts of interest. Should the DoE instead decide to revert
to an Eskom monopoly, then IPPs should be discontinued.46 Either way, the direction
of the electricity sector must be communicated through long-term planning, so that
roles and responsibilities can be clear and actors can be held responsible.
SOUTH AFRICA HAS ALREADY TAKEN STEPS
TO BUILD A GRID CAPABLE OF ACCOMMODATING RENEWABLE ENERGY
South Africa is not the only country undergoing this sort of electricity-sector transition.
Electricity grids worldwide are in the process of getting smarter and many are moving
from a state-owned utility to include market elements. Incorporating renewable
energy from private producers into the energy mix is part of this process and many
of the steps taken towards achieving a grid that is capable of accommodating this
capacity are already being implemented in South Africa. As stated previously, the
IPP programme has been successful in many ways and embedded generation is
increasingly being viewed as an opportunity rather than an inconvenience.
The ‘Greencape 2040’ paper, cited above, found that without standardised regulations
and policies in place, and data-informed decisions regarding the grid, a feed-in tariff
(FIT) could lead to even more gross-margin losses than in the Current Path. This is
because the implementation of an FIT could incentivise further PV uptake. In February
2015, Nersa released a consultation paper asking for stakeholders to comment on
Restructuring the electricity sector must be part of a long-term, coherent plan
AFRICAN FUTURES PAPER 15 • SEPTEMBER 2015 21
the regulations governing SSEG.47 Clarity on these regulations
are necessary to unlock the potential of SSEG, distribute its
benefits and ensure that residential PV uptake does not leave
municipalities financially unstable.
In addition, there have been studies conducted by the CSIR on
the costs, benefits and implications of various grid interventions,
including the implementation of an FIT.48 The CSIR has
found that medium- and small-scale embedded generation
can significantly contribute to the energy mix through the
implementation of an FIT. The mechanism through which the
FIT is administered in the CSIR research is that of a Central
Power Purchasing Agency. This is an entity responsible for both
compensating distributors (municipalities or Eskom distribution)
for gross-margin losses, and for purchasing excess electricity
from embedded generation. The research found that through
this mechanism, between 2.0 and 2.5 GW of additional low-
cost renewable energy could be implemented within the next
few years.
Conclusion and recommendations
Due to the increasing prevalence of renewable energy, IPPs and
SSEG, electricity production is becoming more decentralised
and intermittent. Since embedded generation occurs behind
meters, this adds another level of complexity for managing
electricity sales. These trends are adding to the complexity of
planning and operating the electricity sector. Each actor in the
electricity sector will be affected in different ways. How they
respond will determine the level of renewable-energy uptake in
South Africa and the equitable distribution of its benefits.
Long-term energy planning is vital to the prosperity of South
Africa. Aligning the IRP with the NDP and with long-term
planning in other sectors is necessary to create cohesive
and realistic scenarios for the future. Because energy is so
closely tied to the water sector, the IRP and the National Water
Resource Strategy should complement one another and contain
integrated solutions. Likewise, grid planning can no longer
take a back seat to energy planning – the strength of the grid
is essential for South African growth. All stakeholders must
be involved in the planning process, so that grid planners, the
system operator, grid operators and municipalities do not have
to respond on an ad hoc basis. Furthermore, the IRP must
take into account the increase in SSEG ‘behind meters’. The
nature of capacity is fundamentally changing and the IRP model
assumptions must reflect that.
The government must also stick to deadlines set for releases
in energy plans and then adhere to the results of those plans.
Important energy decisions with serious implications are being
delayed in anticipation of energy plans that are consistently
released months after their expected delivery. According to
the 2010 IRP, ‘At the very least, it is expected that the IRP
should be revised by the Department of Energy (DoE) every two
years, resulting in a revision in 2012.’49 Three years later, the
2013 IRP update stated that the next IRP should be released
only after the next Integrated Energy Plan is released. The
latest Integrated Energy Plan was expected to be submitted
to the Cabinet in the last quarter of 2014, but the status of the
Integrated Energy Plan, and therefore of the IRP, still remains
unknown to the general public.
Electricity grids worldwide are getting smarter and many are moving from a state-owned utility to include market elements
Although the 2010 IRP remains the official government plan
for new generating capacity, the 2013 update was intended to
provide additional insight into ‘critical changes for consideration
on key decisions’.50 One of the key factors about which the
2013 IRP provided critical insight was nuclear capacity. The
2013 IRP update provided a decision point regarding nuclear
build based on 2014 electricity demand. As electricity demand
was lower than 265 TWh in 2014, according to the 2013 IRP,
nuclear procurement should not proceed.51 The government
continues to pursue nuclear power and continues to reference
the 2010 IRP rather than the update.52 The government must
adhere to the results and recommendations of energy plans,
otherwise they are of no use.
Maintaining a safe and reliable supply of electricity across the
grid will become more complicated as renewable energy
increases its share of the energy mix. The SO will be able to
adapt better to the intermittency of wind and solar power
with more flexibility in generating capacity. Capacity that can
more easily be ramped up and down, depending on wind
and solar levels, will become increasingly valuable. System
and grid operations will become more difficult and operators
will also require more advanced strategies to deal with these
changes. Whether the SO remains an Eskom entity or
becomes independent, the SO and the generating capacity
will nevertheless need to be more flexible to integrate
renewable energy.
The uptake in embedded generation could be to the significant
detriment of municipal revenues. Ignoring the changing nature
of capacity could lead to a future where wealthy citizens turn to
private electricity alternatives while the rest are left with what the
22 GRIDLOCKED: A LONG-TERM LOOK AT SOUTH AFRICA’S ELECTRICITY SECTOR
AFRICAN FUTURES PAPER
state can provide. Regulations and policies must be put in place
to unlock the potential of embedded generation.
Investments in the efficiency of the grid could lead to a
reduction in required generating capacity, as illustrated in the
Efficient Grid scenario, but could also bring down the cost of
electricity, leading to more overall energy production and higher
carbon emissions. By moving not only towards a more efficient
grid but also a smarter grid, renewable energy can be integrated
into the energy mix and contribute to the benefit of all.
Implementing the Smarter Grid scenario is not necessarily
about increasing the efficiency of the grid or its technological
sophistication. It is about improving the planning process, the
flexibility in operations and the policies regarding embedded
generation. These interventions will be successful only with a
clear plan regarding the future structure of the electricity sector.
The government must make roles and responsibilities clear, and
outline a strategic path for the future of the utility. Whether or
not it chooses to continue to transition towards a more market-
based electricity model, roles and responsibilities need to be
made transparent so that actors can be held accountable.
Notes
The author extends special thanks to the following: Michael
Barry, Tobias Bischof-Niemz, Amelia Broodryk, Jakkie Cilliers,
Kurt Dedekind, Barry Hughes, Ronald Marais, Crescent
Mushwana, Gaylor Montmasson-Clair, Jonathan Moyer, Mark
Ronan, Julia Schünemann and Teresa Smit.
1 Mike Cohen, The great waste: SA’s debt-funded R1trn infrastructure programme, BizNews.com, 12 May 2015, www.biznews.com/undictated/2015/05/12/the-great-waste-debt-funded-infrastructure-prog.
2 National Treasury, Republic of South Africa, Budget Review 2015, 25 February 2015, www.treasury.gov.za/documents/national%20budget/2015/review/FullReview.pdf.
3 Eskom’s greed will lead to bankruptcy, Businesstech, http://businesstech.co.za/news/general/87024/eskoms-greed-will-lead-to-bankruptcy.
4 Sikonathi Mantshantsha, Nersa declines Eskom tariff increase, BDlive, 29 June 2015, www.bdlive.co.za/business/energy/2015/06/29/nersa-declines-eskom-tariff-increase.
5 Explained in more detail below.
6 Sikonathi Mantshantsha, Learn to live with load shedding, says Eskom, BDLive, www.bdlive.co.za/business/energy/2015/01/16/learn-to-live-with-load-shedding-says-eskom; see also Expect 3 more years of load shedding, My Broadband, http://mybroadband.co.za/news/energy/126460-expect-3-more-years-of-load-shedding.html.
7 Department of Minerals and Energy, White Paper on the Energy Policy of South Africa, December 1998, http://www.energy.gov.za/files/policies/whitepaper_energypolicy_1998.pdf, 53.
8 Gaylor Montmasson-Clair and Georgina Ryan, Repositioning electricity planning at the core: An evaluation of South Africa’s Integrated Resource Plan, Trade & Industrial Policy Strategies, November 2014, 15.
9 For a full, detailed evaluation of the IRP, see Gaylor Montmasson-Clair and Georgina Ryan, Repositioning electricity planning at the core: An
evaluation of South Africa’s Integrated Resource Plan, Trade & Industrial Policy Strategies, November 2014.
10 For more information on IFs, visit the Pardee Center website, pardee.du.edu, and see the help site at du.edu/ifs/help.
11 These are only the direct drivers. There are obviously many distal drivers used to estimate and forecast the size and energy intensity of economies.
12 For a full description of the CSIR demand model, see Forecasts for electricity demand in South Africa (2010–2035) using the CSIR sectoral regression model, June 2010, http://www.doe-irp.co.za/IRPPrm/CSIR_model_IRP%20forecasts%202010_final_v2.pdf. For a full description of the System Operator demand forecast, see IRP 2010 energy forecast revision 2 Report. Report prepared for IRP 2010 revision 2. Systems Operations and Planning, July 2010, www.energy.gov.za/IRP/irp%20files/SO_IRP%202010%20Energy%20Forecast%20Final%20Report.pdf.
13 Integrated Resource Plan for Electricity (IRP): 2010–2030. Update report 2013, 21 November 2013, 22.
14 Forecasts for electricity demand in South Africa (2010–2035) using the CSIR sectoral regression model, June 2010.
15 Ibid., 11.
16 A Go, JD Moyer, M Rafa and J Schuenemann, Population futures: Revisiting South Africa’s National Development Plan 2030, Institute for Security Studies, http://www.issafrica.org/futures/papers/population-futures-revisiting-south-africas-national-development-plan-2030.
17 StatsSA, Mid year population estimates, 2014, www.statssa.gov.za/publications/P0302/P03022014.pdf>
18 The figures represent net sent-out electricity production; they does not include transmission and distribution losses.
19 IN Kessides, Z Bogetic and L Maurer, Current and forthcoming issues in the South African electricity sector. World Bank policy research working paper 4197, April 2007. (This model is heavily dependent on the type of energy and fuel source.)
20 See Electricity Power Research Institute, Power generation technology data for Integrated Resource Plan of South Africa, July 2010, www.energy.gov.za/IRP/irp%20files/Tech_Data_for_Integ_Plan_of_South_Africa_July_08_2010_Final.pdf.
21 Gaylor Montmasson-Clair and Georgina Ryan, Repositioning electricity planning at the core: An evaluation of South Africa’s Integrated Resource Plan, Trade & Industrial Policy Strategies, November 2014.
22 Minister’s speech in respect of Expansion and Acceleration of the Independent Power Producer Procurement Programme, http://www.ipprenewables.co.za/#page/2179.
23 The minister did not give explicit timelines in reference to this procurement.
24 Integrated Resource Plan for Electricity (IRP): 2010–2030. Update report 2013, 21 November 2013, 33.
25 Eskom, Kusile power station project, http://www.eskom.co.za/Whatweredoing/NewBuild/Pages/Kusile_Power_Station.aspx. The Medupi coal-fired power station, currently under construction, has similar capacity.
26 CSIR, 2014 sees financial benefits from renewable energy exceed costs in 2014, 21 January 2015, http://ntww1.csir.co.za/plsql/ptl0002/PTL0002_PGE157_MEDIA_REL?MEDIA_RELEASE_NO=7526622.
27 Terence Creamer, Eskom warns on IPP connections as it defers some transmission capex, Engineering News, 10 October 2014, www.engineeringnews.co.za/article/eskom-warns-on-ipp-connections-as-it-defers-some-transmission-capex-2014-10-10.
28 See Distributed generation hits the big numbers, www.ey.com/GL/en/Industries/Power---Utilities/Utilities-Unbundled--15--Distributed-generation-hits-the-big-numbers; see also Recent facts about photovoltaics in Germany, www.ise.fraunhofer.de/en/publications/
AFRICAN FUTURES PAPER 15 • SEPTEMBER 2015 23
veroeffentlichungen-pdf-dateien-en/studien-und-konzeptpapiere/recent-facts-about-photovoltaics-in-germany.pdf.
29 Eskom, latest news on the 2015/2016 tariff submission, www.eskom.co.za/CustomerCare/TariffsAndCharges/WhatsNew/Pages/2015-16-Tariff-submission.aspx.
30 Eskom, Transmission ten-year development plan 2011–2020, www.eskom.co.za/Whatweredoing/TransmissionDevelopmentPlan/Documents/TDP_v6_lowres2.pdf. For all Eskom transmission development plans, see www.eskom.co.za/Whatweredoing/TransmissionDevelopmentPlan/Pages/Transmission_Development_Plans.aspx.
31 Inside Eskom’s National Control Centre, Bizcommunity, 29 July 2013, www.bizcommunity.com/Article/196/597/97457.html.
32 Eskom grid collapse warning ‘misinterpreted’, Times Live, 25 January 2015, www.timeslive.co.za/businesstimes/2015/01/25/eskom-grid-collapse-warning-misinterpreted; see also What is loadshedding?, Eskom, http://loadshedding.eskom.co.za/loadshedding/description.
33 Ibid.
34 Analysis: How Telkom is the analogue of Eskom, Daily Maverick, www.dailymaverick.co.za/article/2014-11-27-analysis-how-telkom-is-the-analogue-of-eskom/#.VaPAr5OeDGc.
35 Jakkie Cilliers, South African Futures 2035: Can Bafana Bafana still score? ISS, 11 August 2015, www.issafrica.org/publications/papers/south-african-futures-2035-can-bafana-bafana-still-score.
36 In a study done for the Western Cape provincial government, released earlier this year, the AFP found that since electricity sales form a large share of municipal revenue, residential PV uptake could lead to losses for some municipalities in the province. The paper forecast residential PV uptake and the associated municipal gross margin loss in the Western Cape up to 2040. The paper created scenarios based on the effects of implementing smart meters and advanced metering infrastructure in the Western Cape, and instituting feed-in tariffs (FITs) as a way to reclaim this loss. Although all scenarios include gross margin losses, the implementation of smart meters and an FIT – along with standardised policies and regulations, and data-informed decisions regarding grid efficiency – could lead to a significant reduction in the forecast for this loss. The authors of Greencape 2040 recognise that gross margin is a more accurate description of the type of losses forecast in the paper than revenue. See Greencape 2040: Towards a smarter grid, www.issafrica.org/futures/publications/policy-brief/green-cape-2040-towards-a-smarter-grid.
37 Gas and oil production in South Africa are not included in any of the scenarios, though they are implicitly included in imports. IFs does not disaggregate energy trade by fuel type. For more analysis on the implications of a ‘fracking boom’ in South Africa, see Fracking for shale gas in South Africa: Blessing or curse? ISS, 6 December 2013, https://www.issafrica.org/publications/papers/fracking-for-shale-gas-in-south-africa-blessing-or-curse.
38 For a full description of the energy module and electricity sub-module of IFs, visit the help system at du.edu/ifs/help.
39 Transmission and distribution losses fall from 9.5% to 4.1% by 2050.
40 Electricity Regulation Act 2006 (Act 4 of 2006). Government gazette, 6 July 2006, http://www.energy.gov.za/files/policies/ELECTRICITY%20REGULATION%20ACT%204%20OF%202006.pdf.
41 See Parched prospects: The emerging water crisis in South Africa, ISS, 15 September 2014, www.issafrica.org/parched-prospects-the-emerging-water-crisis-in-south-africa.
42 As feed-in tariffs allow excess energy to be fed back into the grid, this increases the compensated consumption of electricity per kW of capacity.
43 See Electricity regulation act , 2006. Electricity regulations of new generation capacity. August 5th, 2009. http://www.nersa.org.za/Admin/Document/Editor/file/Electricity/Legislation/Regulations/Electricity%20Regulations%20on%20new%20generation%20capacity.pdf.
44 Independent System and Market Operator Bill, http://www.gov.za/documents/independent-system-and-market-operator-bill-0.
45 President Jacob Zuma, 2010 State of the Nation Address, http://www.thepresidency.gov.za/pebble.asp?relid=211.
46 See Mark Pickering, for an argument in favour of an independent system and market operator, http://www.doe-irp.co.za/hearing1/MARK_PICKERING.pdf, and a Business Day editorial for an argument against adopting the independent system and market operator under the current crisis circumstances: http://www.bdlive.co.za/opinion/editorials/2015/02/05/editorial-anc-is-right-on-scrapping-independent-system-and-market-operator-bill. The Democratic Alliance, the leading opposition party, has released a position paper on the electricity crisis that supports the ISMO bill, as well as the removal of grid assets from Eskom control – see Solving South Africa’s electricity crisis, www.da.org.za/2015/03/urgent-reforms-needed-to-solve-sas-electricity-crisis.
47 Nersa, Small-scale embedded generation: Regulatory rules, 25 February 2015, www.sapvia.co.za/wp-content/uploads/2015/02/Consultation-Paper-on-Small-Scale-Embedded-Generation.pdf. Presentations from the public hearings can be found on the Nersa website at nersa.org.za under ‘public hearings’.
48 See Dr Tobias Bischof-Niemz, CSIR Energy Centre, How to stimulate the South African renewables market outside the large-scale REIPPPP: A working document on a ‘3-tier approach’ to renewables, 2 February 2015; see also Dr Tobias Bischof-Niemz, CSIR Energy Centre, How to stimulate the South African rooftop PV market without putting municipalities’ financial stability at risk: A net feed-in tariff proposal, June 2015.
49 Integrated Resource Plan for Electricity: 2010 – 2030. Revision 2, Final Report. March, 2011. 7. http://www.energy.gov.za/IRP/irp%20files/IRP2010_2030_Final_Report_20110325.pdf
50 Integrated Resource Plan for Electricity (IRP): 2010–2030. Update report 2013, 21 November 2013, 10.
51 See 2013 update to IRP, 43. Net sent-out electricity in 2014 was 253 TWh, according to StatsSA, www.statssa.gov.za/?p=4045.
52 The president’s 2015 State of the Nation Address made reference to 2 600 MW of imported hydro and 9 600 MW of nuclear, referencing the 2010 IRP, see www.gov.za/president-jacob-zuma-state-nation-address-2015.
AFRICAN FUTURES PAPER
© 2015, Institute for Security Studies
Copyright in the volume as a whole is vested in the Institute for Security Studies, and no part may be reproduced in whole or in part without the express permission, in writing, of both the author and the publishers.
The opinions expressed do not necessarily reflect those of the ISS, its trustees, members of the Advisory Council or donors. Authors contribute to ISS publications in their personal capacity.
ISS PretoriaBlock C, Brooklyn Court,
361 Veale Street
New Muckleneuk,
Pretoria, South Africa
Tel: +27 12 346 9500
Fax: +27 12 460 0998
The Frederick S. Pardee Center for International FuturesJosef Korbel School of
International Studies
University of Denver
2201 South Gaylord Street
Denver, CO 80208-0500
Tel: 303-871-4320
www.issafrica.org/futures
http://pardee.du.edu
@AfricanFutures
www/facebook.com/
AfricaFuturesProject
About the author
Steve Hedden is a researcher at the Institute for Security Studies (ISS) in
the African Futures and Innovation section and a research fellow for the
Pardee Center for International Futures at the University of Denver.
Acknowledgements
This paper was made possible with support from the Hanns Seidel Foundation.
The ISS is also grateful for support from the following members of the ISS
Partnership Forum: the governments of Australia, Canada, Denmark, Finland,
Japan, Netherlands, Norway, Sweden and the USA.
About the African Futures ProjectThe African Futures Project is a collaboration between the Institute
for Security Studies (ISS) and the Frederick S. Pardee Center for
International Futures at the Josef Korbel School of International Studies,
University of Denver. The African Futures Project uses the International
Futures (IFs) model to produce forward-looking, policy-relevant analysis
based on exploration of possible trajectories for human development,
economic growth and socio-political change in Africa under varying
policy environments over the next four decades.
About the ISSThe Institute for Security Studies is an African organisation that aims
to enhance human security on the continent. It does independent and
authoritative research, provides expert policy analysis and advice, and
delivers practical training and technical assistance.
African Futures Paper 15