grimes 9950 eval
TRANSCRIPT
ASD-TR-77-33/
ASD STROBE LIGHT EVALUATION
DEPUTY FOR ENGINEERINGWRIGHT-PA TTEA'SON A FE, OH 45433
JUNE 1977
TECHNICAL. REPORT ASD-TR-77-3 3Final Report for Period 3 June 1975 -- 22 October 1976
Approved for public relleas; distribution unlimritedZ]
GENERAL OFFICER PANEL. FOR SAFETY MAIfTERSLI.USAF DEPUTY INSPECTOR GENERAL
C2WASHINGTON, DC 2O3ýO
AVIONICS AND AIRCRAFT ACCESSORIES SPO O 'CT 36 1977DEPUTY FOR AEkONAUTICAL EQUIPMENTWRIGHT-PATTERSON AFB, Oki 45433
~P SO
MOTXCE
when Government drawings, specifIc~ition5, or other 4dta ar.e ued for ali pxryxje
other than In connection with a definlte.!y related GoveTm .'-t procuremert .-ýperdtion,
the United States Government thereby incitra no reaponsih.litjj nor any obligation
whatsoever; and the fact tnat the government may have formulated, furrished, oi in
any way supplied the said drawitige, specificatione, or other data, is not to be
regarded by implication or otherwile as In any manner licensing the holder or any
other person or corporation, or conveying any rJ ghts or permission to manufacture,
use, or sell any petentad invention that way in any way be related thereto.
This report has been reviewed by the Informatiou Office (01) and is zeleaiable to theNational Technical Information Service (NTIS). At WrIS, i- will be available to thegeneral public, including foreign nations.
This technical report has been reviewed and is approved for publication.
FOR THE COMMANDER
PALT. E. BECKTechnical Director, Equipment EngrgDirectorate of Equipment Engineering
. acOf th!redfoPtt should "o- I* retur,,d ufless return le zweulrd bV secutrity
AIR I'ORCM,0117 O*Gbgv %;1 '- no
SECURITY CLAS3IFICATION Or THIS PAGE (When Data Entermd)
REPORT DOCUMENTATION PAGE READ INSTRUCTIONSBEF ORE COMPLETING FORM
2. GOVT ACCESSION No. 3. RECIPIENT' E R
1. T RIQrOVFýEDFinal -../3 Jun.E W75
ASD,§TROB~eýIGHT,;VALUATIONI j 22 Octahs 1765E
S.CONTRACT OR GRANT NUMBER(a)
9. PERFORMING ORGANIZATION NAME AND ADDRESS I0. PROGRAM ELEMENT. PROJECT, TASKAREA & WORK UNIT NUMBERS
Deputy for Engineering (ASD/ENEGE) PROG ELEMENT: 64212FWright-Patterson AFB, OH 45433
11. CONTROLLING OFFICt. NAME AND ADDRLSS 1t..REISRT DATE
Avionics and Aircraft Accessories SPO (ASD/AEA un 07-7Deputy for Aeronautical Equipment 7 PAGESWright-Patterson AFB, OH 45433 2209_ 9
"I'l MONI DDRESS(It dilleoenl from Controlling Office) IS. SECURITY CLASS. (of this taport)
Unclassified
# n~ii~I IS. DECLASSIFICATION/DOWNGRAOING
SCHEDULE
6. OISTRISU"ON STATEMENT [6 this Report)
Approved for public release; distribution unlimited D D C____ U OCT 26 1977
7.DISTRIBUTION STATEMENT (of the obsfroct oitered In Block 20o, It different fromt Report)
BISII. SUPPLEMENTARY NOTES
V.
f 1I. KEY WORDS (C:ntinue on reverse side It nceeesary and identify by block number)
Anticollision lightsMid-air collisionsStrobe anticollision lightsVisibilityCollision avoidance
20. ABSTRACT (Continue on reverse side If neueaeery and Identity by block number)
P This report presents a synopsis of the literature search and testingconducted by ASD from 3 June 1975 to 22 October 1976 in an attempt to determinethe cp~cification requirements for strobe anticollision lights. The literaturesearch resulted in a draft military specification for aircraft a.iticol!isionatrobe lights which was circulated to the using commands and industry torcomments 27 February 1976. Since the literature search had not provided quanta-tive data relative to required intensity, further investigation was deemednecessary. Testing was designed to generate data which could be extranolated to
DD I 1473 EDITION ',)F I NC 45 IS ONSOLETE Unclassified5ECURITY CLASSIFICATION OF THIS PAGE (*hen Date Entered)
-- ",A0 4?a
UnclassifiedSECURITY CLASSIFICATION OF THIS PAGE('W1hn Date Antered)
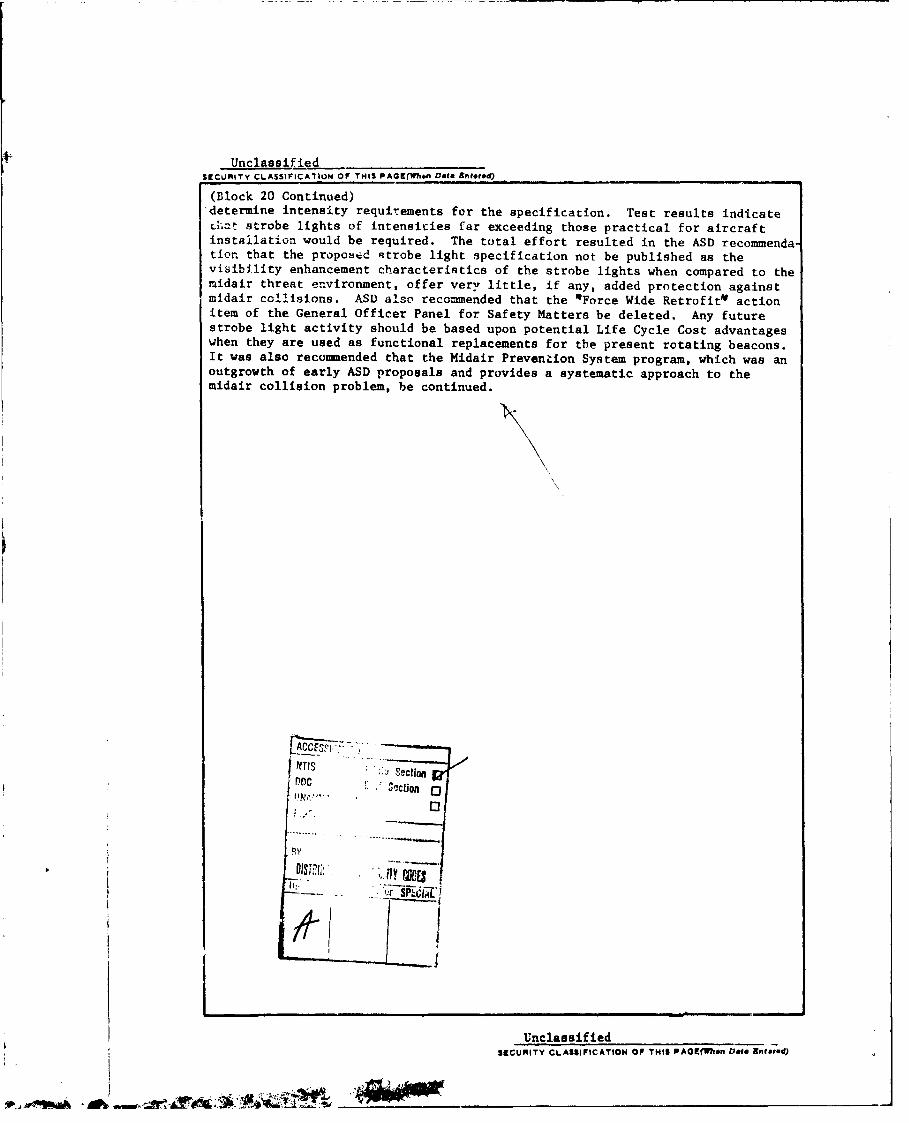
(Block 20 Continued)'determine intensity requirements for the specification. Test results indicateI hat strobe lights of intensities far exceeding those practical for aircraftinstallation would be required. The total effort resulted in the ASD recommenda-tion that the proposed strobe light specification not be published as thevisibility enhancement characteristics of the strobe lights when compared to themidair threat environment, offer very little, if any, added protection againstmidair collisions. ASD also recommended that the *Force Wide Retrofit" actionitem of the General Officer Panel for Safety Matters be deleted. Any futurestrobe light activity should be based upon potential Life Cycle Cost advantageswhen they are used as functional replacements for the present rotating beacons.It was also recommended that the Midair Prevention System program, which was anoutgrowth of early ASD proposals and provides a systematic approach to themidair collision problem, be continued.
NTIS Section
PDC VACtuon j
100
UnclassifiedSECURITY CLASSIFICATION OF THIS PA0Z~lh~n Data Entere~d)
Aft\

"SUKMARY
This Technical Report describes the work effort conducted in pursuanceof improved aircraft anticollision protection through the usp of HighIntensity Xenon lighting (commonly referred to as Strobe Lights). Thestudy upon which this report is based was initiated by the Air ForceSystems Command (AFSC) upon receipt of a letter dated 3 June 1975,from the Air Force Logistics Command (AFLC), entitled "Specificationfor Strobe Lights on USAF Aircraft." An evaluation [1] conducted bythe Deputy Inspector General for Inspection and Safety (IGD) recommendedthat high intensity strobe lights be procured for present and futureUSAF aircraft. Acting on this recommendation, AFLC then requested AFSCdevelop an Air Force specification for standardization and procurementpurposes. The Avionics and Aircraft Accessories SPO under the Deputyfor Aeronautical Equipment, Aeronautical Systems Division, Wright-Patterson AFB, Ohio, directed the work effort with technical supportfrom the Deputy for Engineering (ASD/EN), Aeronautical Systems Division,Wright-Patterson AFB, Ohio. Major Donald Drinnon served as the projectmanager. A draft specification (see Appendix 1) was prepared and thencirculated to all Air Force Major Commands and industry for comments.This "strawman" specification had several undetermined parameter3. Atesting program was initiated to identify and quantify these unknownparameters. ASD/EN was not able to substantiate the IGD findings and,therefore, recommended strobe lights not be procured on the basis ofimproving conspicuity. The work described herein was performed duringthe period 3 June 1975 to 22 October 1976. It consisted of the following.
a. A literature search
b. Preparation of initial draft Strobe Light Specification
c. A testing program attempting to quantify unknown parametersin the draft specification
d. Presentation of recommendations
e. Preparation of this report.
iii
PREFACE
This study has resulted in the birth of a new program called MAPS
(Mid-Air Prevention Systems) which will hcpefully be able to do
what strobe lights are unable to do, significantly reduce the
potential for midair collisions. Special thanks is in order for
MSgt Lloyd F. Woodhouse for his work in the follow-up measurements
of the T-43 system and his able-bodied assistance during the ASD
tower test. Also to Dr. C. Thomas Goldsmith of Decijog Inc., whose
technical report on the ASD tower test was only slightly edited and
appears herein as section 3.5. Finally, the pilots who served as
subjects for the ASD tower test and who performed diligently under
adverse circumstances.
Siv21 .. • tj "' •••
.. _ _=•-.
CONTENTS
Page
Paragraph 1.0 ANTICOLLISION LIGHTING HISTORY .. ............... 11.1 Navigation lighting .. ....................... 11.2 Rotating beacons .. ......................... 11.3 Why strobes. .. .............................32.0 THE MIDAIR COLLISION POTENTIAL .. ............... 42.1 USAF statistics. .. ......................... 42.1.1 VFR vs IFR .. ............................ 62.1.2 Day vs night .. .............................62.1.3 Otiier factors .. ................ .. ......... 72.1.4 Conclusions from Air Force data.........72.2 Federal Aviation Administration (AA) Sta-
0 ~~tistics . .. .. .. .. .. .... .. 82.2.1 Airport collisions. ......................... 82.2.1.1 Where airport midairs occur . .. .. .. .. 102.2.1.2 Closing velocities in airport midairs . 10
JE2.2.1.3 Airport collisions by time of day .. . 102.2.2 Enroute & tarminal area collisions . 132.2.2.1 Where terminal area and enroute collisions
occur .. .................... ............. 132.2.2.2 Closing velocities in terminal area and en-
route collisions .. ....................... 132.2.3 Conclusions from FAA collision data . . 132.3 Near midair collision report of 1968 . 152.3.1 Study objectives . . .. .. .. .. .. . 162.3.2 Near midair collision classificatioa . 162.3.3 Findings . . .. .. .. .. .. .. .. ... 172.4 A comparison of FAA midair collision and
near midair collision study findings . 192.5 ~ Aircraft visibility .. .. .. .. .. .. i
2.5.1 Brightness contrast . . . . . . . . . . . . 292.5.2 Target size andashape. .. ................... 302.5.3 Effects of the atmosphere . .. .. . .. . 312.5.4 Complex situation data . . . .. .. .. .. 342.5.4.1 "Large" (DC-3) aircraft visibility .. 342.5.4.2 "Small" aircraft visibility. .. ............. 402.6 Midair collision geometries . . . . . . . . 452.6.1 The recognition of and response to intruder
aircraft . . . . . . . ........................... 45
2.6.2 Use of geometries in visibility prediction 522.6.3 Basic rel~atnships . * * e * * . . * * 522.7 Midair Lollision models . . . . . . . . . . 532.7.1 The near midair collision traffic model . 532.7.2 The civil aviation taidair collision
analysis model .. .. .. . ... . .. 54
v

2.7.3 Comparison of the two models . ....... . 552.8 The midair collision problem and the Air
Force ............... ................. 563.0 STROBE LIGHTS ........ ... .......... 58
3.The "see and avoid" concept .. ............... 583.2 Theoretical performance .............. . 581.2.1 Seeing lights - basic principals ....... 583.2.2 Flnshing lights ...... .............. ... 653.2.3 1i,.=retical performance of strobe lights . 713.3 Early test ........... . . ... 713.3.1 B-52 Tests ........... ............... 713.3-2 Air training command tests o 1958 . . . .. 723.3.3 WPAFB tests of 1958 ......... 74'1.3.4 SAC testing - 1971 and 1972 .. ........ .. 753.3.5 US Army helicopter test - 1970 ......... ... 753.3.5.1 Ground-to-air observation sequence ..... 753.3.5.2 Ground-to-air res,,lts ............ 772.3.5.3 Air-to-air observail on nequerce ....... 833.3.5.4 Air-to-air zesults ..... ............ ... 843.3.5.5 Night lighting and Army helicopters . . .. 843.3.6 F-iil strobe test of 1971 ........ . . .. 863.3;7 T-38 aircraft beacon/strobe light visibility
test of 1972 . . . . . . . .. . . . . 873.3.7.1 Data evaluation and analysis ........ 893.3.8 USAF-IG strobe evaluation If 1973 . . . .. 893.4 ASD's "quick look flight test" . . . . . . 953.4.1 Test conclusions .... ........ . . . . . 963.4.2 Disuuision of testing * . . . . . . . 963.4.3 Follow-up testing . . ............ 1033.4.4 Contractor response ................ . . 1033.5 ASD's tower test ....... ............. .. 1073.5.1 Introduction . . . . . . . . . . . . . . . . 1073.5.2 Factors investigated .... ........... . . 1083.5.3 Limitations of test . . .......... 1093.5.3.1 Knowledge of location of strobe .. . .. . 109
3.5.3.2 No multiple light sources . ........ 1093.5.3.3 Atmospheric scintillation. . ........ 1093.5.3.4 Flash rate . . . . . . . .......... . l1C3.5.3.5 Summary of limitations . . . . . . . . ... 1103.5.4 Experimental design . . . . . . . . * 0 1103.5.4.1 Factors. . . . . . . . . . . . . . . . . 1103.5.5 Test sites . . . . . . . . . . . . . . . . . 1123.5.6 Physical arrangement . . . . . . . . . . . . 1123.5.7 Fixation lights . . . . . . . . . . . . . . 1163.5.8 Experimental procedure . . . . . . . . . . . 1163.5.9 Random assignment of subjects ..... 119
V i
Y-.
'A,.
Ž1- _ _:
3.5.10 Subject s 1193.5.11 Data conditioning. ................ ....... 1203.5.11.1 Data analysis procedure .. .. .. .. . .122
3.5.12 The analysis of data . . . ....................... 1233.5.12.1 The model ................ 1233.5.12.2 Results primary analyses. . . . . . . 1243.6 Problem areas . .. .. .. ... . . . . 1373.6.1 Electrical efficiency . . . .. .. .. .. 1373.6.2 Environment . . . . . . .. .. .. .. .. 1384.0 FUTURE ANTICOLLISION LIGHTING POSSIBILITIES 1394.1 Requirements development . . .. .. .. .. 1394.2 Electronic aids in detection .. ............ 1404.3 Non-strobe high intensity anticollisior
5.0 FINDJING~S, CONCLUSIONS AND RECOMMENDATIONS . 1425.1 Findin gs . .. .. .. .. ............ ..... 1425.2 Conclusions . .. .. .. .. .. .. . .143I5.3 Recoimmendations. .................. ....... 143
List of References .. ................ ..... 144
WAPPENDIX 1 Proposed Military Specification forAircraft Anti-Collision Strobe Lig1~ts . 147
vii
FIGURES
Page
FIGURE 1. USAF midair statistics . . . . ... 52. FAA midair statistics ...... 93. Horizontal convergence angles of air-
pert midairs, Jan 64-Dec 71 . . . 114. Time of day of uncontrolled airport
collisions, Jan 64-Dec 71 . . .. 123. Horizontal convergence angles of
terminal area and airport midairsJa-ý 64-Dec 71 . . ........ 14
6. Involvement by altitude distribution(terminal) .... ............ ... 21
7. Involvement by altitude distribution(enroute) .......... 22
8. Involvement vs distance from airport 239. Operator involvement vs local time
(terminal) .... ............ ... 2410. Operator involvement vs local time
(enroute) .............. . . 2511. Comparison of critical near midair
collision data and midair collisiondata by user class. .. A..r.. . .... 28
12. Collision case I (Large Aircraft) 3513. Collision case II (Large Aircraft) . 3514. Collision Case III (Large Aircraft). 3615. Collision Case IV (Large Aircraft) 3616. Conspicuity of present day aircraft
(DC-3) ..... ............. ... 3817. Look distribution chart - uninformed
phase ........ ............. .. 3918. Look distribution chart - informed
phase . ............. . 3919. Departure and approach corridors
used by pilots (small aircrafttest) . . . . . . . . . . . . . . 41
20. Subject pilot reference map 4121. Collision course A ... ......... ... 4222. Collision course B ... ......... ... 4223. Collision course C . . . ...... 4224. Collision geometries ... ..... . 4625. Collision geometries .......... ... 4726. Collision geometries .......... ... 48
t .•.,. ..•: }, ..I_.__,. __ __________viii
t;;1._!•• ,: :. .._ .. ..

27. Collision geometries ........ 4928. Collision geometries .......... ... 5029. Relative spectral luminous efficiency
vs wavelength as seen by an averageobserver ............... 60
10. Dawn dusk conditions, Eo 5 milecandela ......... .*. . . 66
31. Daylight conditions, Eo - 25 milecandela ............. 67
32. Daylight conditions, Eo - 250 milecandela . . . ........... 68
33. Daylight conditions, Eo 2500 milecandela . . ............ 69
34. Ground-to-air observation sequence 7635. Data, 22 Sep 70 by viewing angle . 8136. Data, 23 Sep 70 by viewing angle . 8237. Attempted intercept lines . . . .. 9938. Horizontal distribution of T-43
strobe light assembly .. ...... . 10139. Vertical distribution of T-43 strobe
light assembly .......... 10240a. Compilation of measurements . . .. 10440b. Comments ...... .............. . i.. 105
41. Boeing data . . ............ 10642. Arrangement of subjects . . . ... 11343. Location of tower and site . . ... 11344. Test fixture on avionics tower . . . 11445. Test fixtures ........... 11546. 4.68 mile site . . . . . . . . ... 11747. Scheditle for single session . ... 11848. Data output . . . . . ...... 12149. Probability of detection by back-
ground luminance . . . . . . 12950. Probability of detection by rrtinal
location .... ........... .I51. Probability of detection 1000 Ft.L
background ........... 136
i.
r __
TABLE:3
Table 1. Reported atmospheric and cloudconditions - hazardous incidents . 20
2. Representative aircraft involvement 263. Type of mission conducted .... ...... 274. Expected sighting range for targets of
various sizes and contrasts, seen invarious atmospheres .. ........ ... 33
5. Distance at which air%..raft on collisioncourse was detected (large aircraft) 34
6. Parameters and results in small air-craft visibility test ........ 43
7. Radiometric concepts ......... 598. Photometric concepts ........... . 599. 22 Sep 70 data (dark background) . . . 7810. 23 Sep 70 data (dark background) . . . 7911. 23 Sep 70 data (sky background) . . . 8012. In flight preference study ........ ... 8513. T-38A/F-106 beacon/strobe test data . 8814. Main effects F statistics - all
sessions ....... ............... 12615. Results of scheffe test fo: lights -
all sessions ............ 12616. Probability of detection against
various backgrounds ......... 12817. Results of scheffe test for back-
grounds - all sessions ...... . 12818. Results of scheffe test for retinal
locations ............. 13019. Main effects F statistics - daylight
sessions 13220. Main effects F statistics - night
sessions . . . . . . . ....... 13421. Results of scheffe test for lights -
night sessions. . . . . . . . . . . 134
Xt
_,.ý4
1.0 ANTICOLLISION LIGHTING HISTORY
1.1 NAVIGATION LIGHTING
The first lighting system used as a collision avoidance device wasnavigation lights. These lights had been in use on vessels travelingon the surface of the sea and were copied (as was the name "navigationlights") to aid air navigation. The simple three color system seemeda logical extension from the water to the air. A red light on the leftwing tip shows forward and to the left side. A green light on the rightwing tip does the same thing for that side. The White light on tba tailcan be seen from the rear and from either rear quadrant. Just as is thecase with ships, if red and green are seen simultaneously, the otheraircraft is approaching head-on. A red and white or green and whitecombination indicates the other aircraft to be about broadside. Whiteonly means that the other aircraft is headed away from the observer.
Very little thought was given to the special problems of air navi-gation that might call '.-7 d-ifferent system of lights. The lookoutduty on board ship i. ,,:Ly much easier than the pilot's airborneproblem. Most obvtoui, of course, is that ships on the surface of thewater are all at the same elevation. Shipboard lookouts do not have
Ir to scan both above and below their ow%i altitude. Nor are shipboardlookouts tasked with the other duties levied on a pilot related to air-craft control and navigation. A major part of the problem is to see andrecognize another aircraft as soon as possible.
In an attempt to improve the conspicuity of the navigation lightsflashers were added. Aircraft of the 1930s began to flash wing tiplights and some adC!ýd a yellow light to the tail alternating with thewhite. While it ha& been shown that a flashing light will attractattention and be seen before a steady light, the flashing of the positionlights increar..s the time required by the observer to interpret what isseen.
1.2 ROTATING BEACONS
The next major improvement in collision avoidance lighting was theuse of rotating beacons. These beacons are known as "anticollisionlights" and to-'t over the function of calling attention to the aircraft.After anticol1 'sion lights were adopted, the requirement for flashingposition lights was discontinued. The first Federal Aviation Regulationscovering anticollision light intensities and flash rates were issued in1957. The minimum flash rate was 40 per minute and the maximum was 100flashes per minute dith a minimum intensity in the horizontal plane of
I
: "." "[. #5 "1

100 effective candela (E.Cd.), The first anticollision lights testedwere white but were changed to red after flight evaluation, primarilybecause of backscatter problems when operating in any perceptible hazeor clouds (not as is popularly believed that red indicates danger).From the time anticollision lights were f 4 rst used, the choice of colorhas been the subject of much discussion. xroponents of the use of redhave contended that it provides easier recogiition against an urbanbackground, that it is less distracting to the pilot in hazy and cloudyatmospheric conditions, and that it has less effect on -,he pilot'sdark adaption. Proponents of white cite the loss of light In the redfilter (upwards of 80% absorption), and contend that the brighterwhite light is visible against urban backgrounds. They also note thatthe eye is more sensitive to white light in the periphery. The problemwas summed up by one expert who noted that if he were a pilot he wouldwant a red light on his aircraft and white lights on all other aircraft.
In order to demonstrate the increased intensity of white lightsas compared with red lights of the same wattage, Grimes ManufacturingCompany (a major manufacturing company of aircraft lighting systemslocated in Urbana, Ohio) arranged a demonstration at the old CivilAviation Administration's Technical Development Center in Indianapolis.
R Indiana. Two Bonanza aircraft were equipped with identical snticollisionlights on the top and bottom of the fuselage, except that one aircraftwas fitted with clear covers and the other with red covers. These anti-
collision lights were developed by Grimes to reduce the size of theoriginal light to allow installation on single engine aircraft. This designwas b3sed on two small reflectorized 40 watt lamps rotating back-to-backabout a common axis and provided 6000 candela on the lamp central axis.Both aircraft were viewed from other aircraft against the city lights ofdowntown Indianapolis, dark country side, and starlit sky. Viewing distancesranges from one-half mile to ten miles. From this evaluation by airline,military, and general aviation pilots, it was determined that the redcover was preferred by both the observing pilots and the pilots of theBonanza aircraft. Tests on the lights used in this evaluation showedthat the photometric intensity of the white lights was approximatelyfour times that of the red lights. However, the observing pilots werein agreement that there was no significant difference in the apparentintensities of the red and white lights.
Other configurations of anticollision lights have been developedproviding essentially the same capability as described above. Forexample, improving the aerodynamic characteristics resulted in the sametwo 40 watt reflectorized lamps used above movnted one in front of theother, each pivoted on its own axis and was known as the tandem oscillatinglight. In other Eomior rotating or oscillating beam type anticollisionlights single lamps are mounted stationary at the center of rotation of a
2
f ý
I"oving reflector or lens. Rotating the reflector or lens rather thanthe bulb has the obvious advantage of dispensing with the need forslip rings to carry lamp power.
Wa, 1.3 WHY STROBES?
It is important to note that the development of lighting systemsfor collision avoidance purposes has historically ex.amined a nighttimeproblem. The development of high intensity lighting as exemplifiedby strobe anticollision lights is an attempt to expand the useful rangeof the lighting aided "see-and-avoid" concept into dawn-dusk andeven the daytime problem.
- PR 31k_
2.0 THE MIDAIR COLLISION POTENTIAL
The task of publishing a specification for strobe lights resultedprimarily from high level concern that the development of aircraftpainting schemes to reduce aircraft visibility (a tactical consideration)could result in an increase in the midair collision potential duringpeactime. Analyses were iri'.>:ted which would hopefully identi'fythose cornitions which influence the potential for midaf.r ýblalsions.These data would then be used to determine parameterr suxcn as requiredintensity and distribution pattern for the strobe light specification.
2.1 USAF STATISTICS [2]
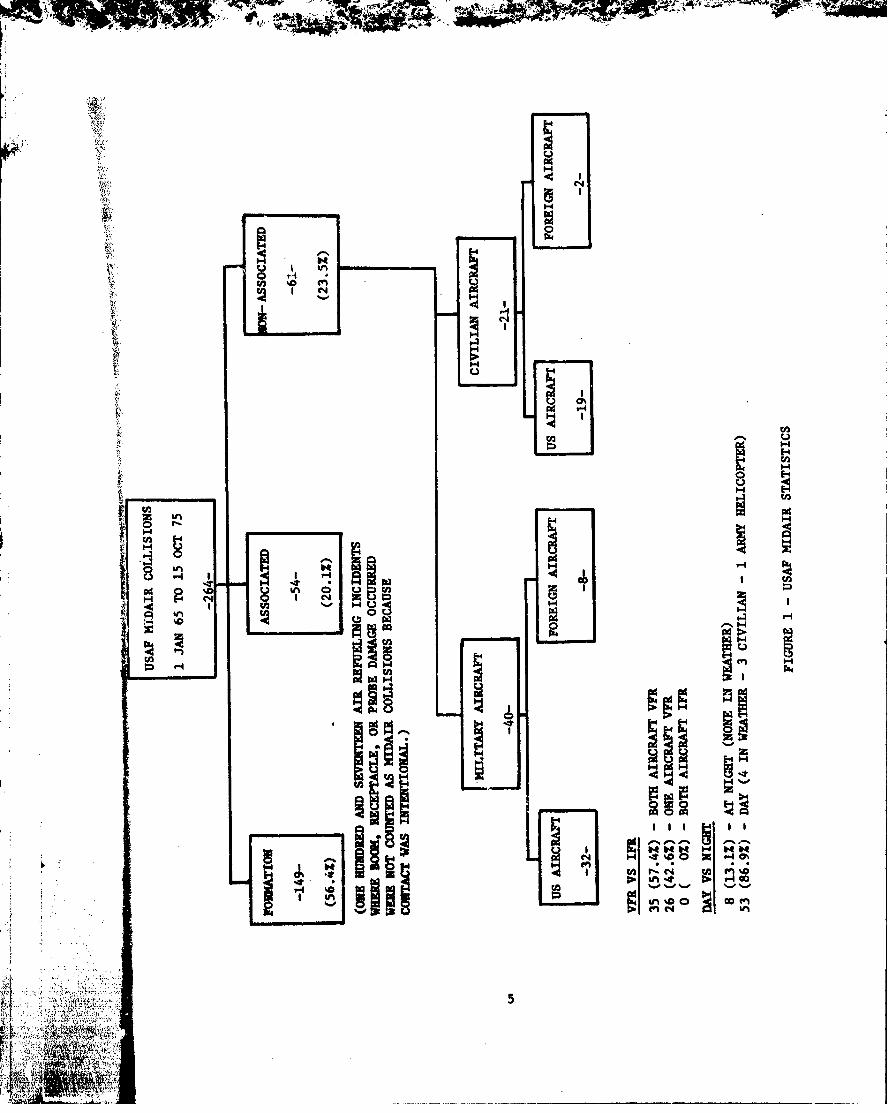
The Air Force Inspection and Safety Center provided an analysis ofAir Force midair collisions occurring in the period 1 January 1965 to15 October 1975. During this period the Air Force experienced 264midair collisions involving 530 aircraft (213 of which were destroyed)i and 222 military and 111 civilian fatalities. Unlike civiliar aircraftthe Air Force purposely flies aircraft in close -proximity (fighterformation) and comes in contact intentionally during refueling operations.The midair collisions were categorized as follows; formation, associated,and non-associated. For this analysis: (a) Formation was d;.fined as flightin which flight members are attempting to maintain or attain a fixedposition relative to a leader with whom they have visual contact. (b)Associated flying involving two or morc. aircraft operating in a limitedairspace where each is aware of the presence of, but not necessarily theexact location of, the other aircraft. (c) Non-associated collisionsare those in which the airc:raft involved are not both aware of eachother's presence. Figure 1 consolidates the numerical data from theanalysis.
Since the task was to examine those li'idair collisiotus which wouldidentify the conditions influencing strobe light specification para-meters, formation and associnted midair collisions were eliminated fromthe data base. Whil' these two flying relationships accounted for 76.5%of the midair collisions over the study period, strobe anticollisionlights would not affect these types of midairs. (While some associatedflying may belong in the group where anticollision lights would be an aidthe majority of the associated collisions in this data could not beprevented by any visual means. Associated collision data must be carefullyconsidered analysis by analysis.) Formation flying pilots do not normallyuse their rotating beacons during formation flights due to the spatialdisorienting and distracting effects. There is no reason to suspect thatincreasing the intensity of these light" 20 to 50 times (as with high"intensity strobes) would reduce these eficcts. Associated collisions
,l4l .- • -1
U33
1-4.
8~
I-H .........
1-4I
0.4.
Nil~2HNH 1-4H
-t4oP4 a%
.INI~r INII~
F..
were eliminated as virtually all resulted during some form of militaryoperation where one does not wish to be seen by the enemy (i.e., FACoperations, air combat maneuvering, intercept, etc.). The breakdownof the non-associated midair collisions can also be seen in Figure 1.It is interesting to note that over the 11 year period the Air Forceexperienced an average of one midair collision every 245,208 flyinghours. This is a rate of 0.41 per 100,000 hours.
As can be seen in Figure 1, non-associated flying accounted for23.5% (61) of the total Air Force midair collisions. Using these asour data base we find 34.4% (21) involved civilian aircraft, two ofwhich were foreign while 65.6% (40) involved other military aircraft,eight of which were foreign.
2.1.1 VFR vs IFR
Examining the non-associated collisions relative to flight planwe find 57.4% occurred when both aircraft were flying Vi.sual FlightRules (VFR) and 42.6% occurred when one aircraft was VFR and the otherflying Instrument Flight Rules (IFR). The Air Force was not involved"in any midair collisions over this 11 year period when both aircraftwere flying IFR.
It is not the type flight plan filed which increases the midairpotential but the metrological conditions which exist (requiring thefiling of an IFR or VFR plan) that affect the midair potential. Theconditions at the time of collision are found to be far more significantthan the flight plan filed. For example, an aircraft flying underpositive radar control, in weather, reduces the probability of a midaircollision significantly, even if it took off on a VFR flight plan in VKC.
Flying in weather reduces the probability of a midair collision ifall aircraft doing so are under radar control. All four non-associatedcollisions that occurred in weather involved a VFR aircraft violatingvisual flight rules.
2.1.2 DAY vs NIGHT
Thirteen and one-tenth percent (8) of the non-associated collisionsoccurred at 1iight, none of which were in wearher. Seven and one-halfpercent (4) of the 53 daytime non-associated collisions involved aircraftflying VFR in IFR conditions. 11'e reduced number of this type collisionat night is lrgely due to the reduced flying activity, rather than thelack of sunlight. However, increased conspicuity due to aircraft lighting,the probable higher experience level of civilian pilots flying at night,
6
and reduced light aircraft traffic are significant in reducing thecollision potential.
"'" !}Of the total number of midair collisions,in the eleven yearperiod, eighty-three and eight-tenths percent (221) occurred duringday flight, two and six-tenths percent (7) occurred during dawn-duskconditions and thirteen and six-tenths percent (36) occurred at night.From this data it appears that expanding the anticollision lightingsystem into the dawn-dusk area from a nighttime only systemwill not significantly reduce the Air Force midair statistics, especiallywhen one considers that only eight of the night collisions were thenon-associated type possibly preventable by strobe lights.
2.1.3 OTHER FACTORS
Type of Aircraft. Although fighter aircraft were involved in 60%of all collisions, this is attributable to the fact that they flySclose together more often, not sli ply because they are fighters.Actually fighter aircraft were only involved in 33% of the non-associatedcollisions. Better visibility and maneuverability make a fighter moreable to avoid the collision once an impending collision is recognized.Type of aircraft was found to have little influence on midair collisionprobability.
Geographical Location. Midair collisions occur wherever flying
activity is concentrated. No particular geographical area wasidentified as being inherently conducive to midair collisions. Flyingactivity tends to concentrate in the vicinity of airfields and dependson both size and number of airfields in a given area. Traffic funnelpoints, pattern entry points and departure routes for multiple airfieldsin a given area further increase the probability of a collision.
Phase of Flight. Takeoffs and landings have higher potential formidair collisions. The major influence during these phases is the closeproximity to concentrated flying activity. Contributing elements arethe degraded aircraft response at slower airspeeds during takeoffs andlandings and the increased cockpit workload during visual conditions.
Altitud.. Fifty-eight percent (12) of the 21 midairs involvingcivilian aircraft occurred below 5000 feet. Decreasing altitude increasesthe probability of a collision with a light aircraft due to increasedtraffic density and the reduced likelihood of being under positive control.
2.1.4 CONCLUSIONS FROM AIR FORCE DATA
. ! . - :" .. .7
*,. -• f, :: : , :
Non-associated flying accounted f or approximately one-fourth ofthe total number of midair collisions. Non-associated collisions arethe only type of the three defined categories which might be reducedthrough the use of high intensity anticollision lights (strobes beingone type),
Half of all midair collisions occurred at or below 3000 feet aboveground level (ACL). Two-thirds of Lhe non-associated midair collisionsoccurred with other military aircraft during takeoff, initial climb,descent, or landing.
Eighty-seven percent of the non-associated midair collisionsoccurred during the day.
All Air Force midair collisions occurred with at least one aircraftflying under VFR.
2.2 FEDERAL AVIATION ADMINISTRAT~ION (FAA) STATISTICS [3]
The FAA published a report in 1973 entitled "Civil Aviation MidairCollision An~alysis January 1964 to December 1971." Supplement 1 tothis report added 1972 statistics but did not result in any change tothe statistics other than an increase in the data base. This study wasexamined in hopes of gaining further insight into the non-associatedtype midair collisions. Almost all civil midair collisions are of thenon-associated type except for a small number (primarily crop dusters).
During the nine year period of the report, civil aviation experienced296 midair collisions. These collisions were divided into two majorcategories; "Airport Collisions" and "Enroute and Terminal Area Collisions."Airport Collisions were defined as those collisions which occurred localto a specific airpo-t (those within a radius of five statute miles of theairport and at or below 2000 feet AGL). Airport collisions were dividedinto two sub sets; "Uncontrolled Airports," an airport without an activeFAA manned control tower at the time of the collisions, and "ControlledAirports," an airport with an active FAA manned control tower at the timeof the collision. Erirout.i and Terminal Area Collisions were defined asthose collisions which occurred away from the airport, either whileenroute or Voiile crossing the terminal area which services one or moreairports. The basic numerical statistics are presented in Figure 2.
2.2.1 AIRPORT COLLISIONS'
Airport collision. accounted for 66% (195) of the total civilcollisions. Eighty-two percent (160) of these were at airports withoutan active FAA manned control tower while 18% (35) occurred at FAA
K ~ 8

1 _N
zz
E-4 r.) C-.
E-4 I
a en
H c-iE- C4
04) r- bu CC4.) -
u~ U)
ý-4 H
rA~ F4I~1-4r-
~ I I en
-FRI
_______~W-9
manned facilities. It is significant to note that almost one inthree (30%) of the collisions at uncontrolled airports were "runway"collisions (i.e., they occurred with one aircraft on the grou.nd),but only one runway collision occurred at controlled airports. Theone exereptional case was a runway collision at Chicago O'Hare Airportin December 1972. This collision was attributed to the failure of aground controller to establish where the taxiing aircraft was positionedand to provide the crew with an unambiguous taxiing clearance from thatposition.
The FAA study takes special note in the fact that generalaviation involvement In airport collisions predominates; 99.5% (194)of the collisions at both controlled and uncontrolled airportsinvolved at least one general aviation aircraft. The O'Hare runwaycollision described aboe is the only collision between two commercialaircraft.
2.2.1.1 WHERE AIRPORT MIDAIRS OCCUR
At uncontrolled airports 68% of the midair collisions r. nurredwhile both aircraft were in the final phases of landing (57% finalapproach, 11% touching down). At controlled airports on the otherhand 61% occurred when both aircraft were beyond or attempting to jointhe VFR traffic pattern but before final approach. As a function ofaltitude, the distinction between collisions for uncontrolled andccntrolled airports is quite pronounced. Taking the nominal altitude of400 fe':. AGL a: which base leg t.affic turns on the final approachcenterline, 80% oi the midairs at uncontrolled airports occur below thisal~itude, while 80% at controlled airports occur above this altitude.
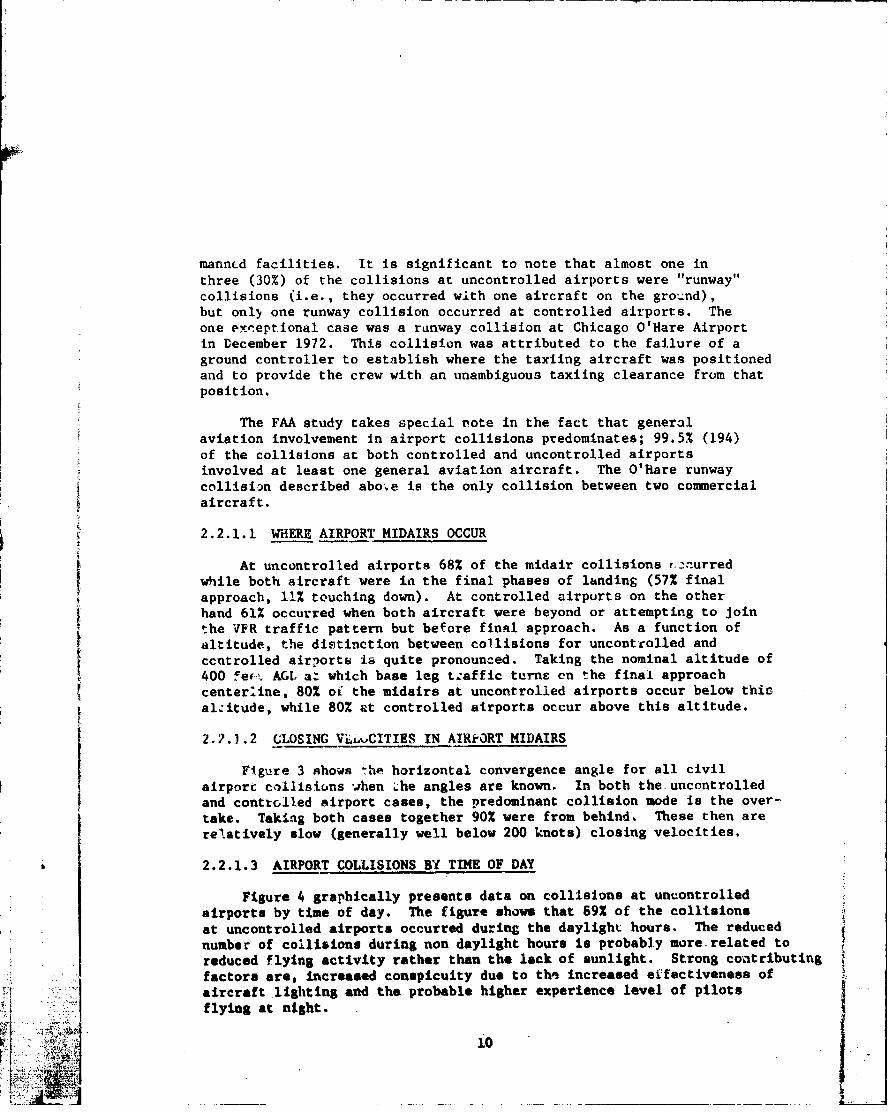
2.?.1.2 CLOSING VLLCITIES IN AIRIORT MIDAIRS
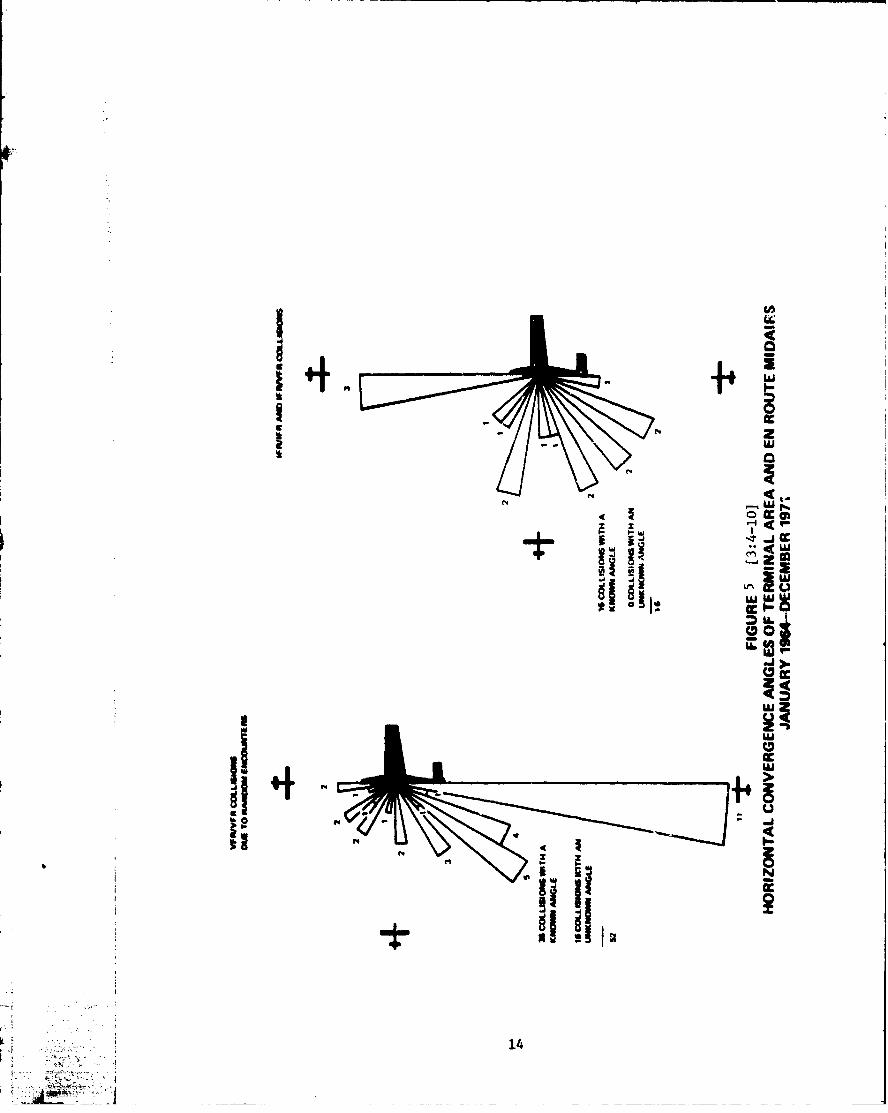
Figure 3 shows -he horizontal convergence angle for all civilairport collisions when ýhe angles are known, In both the uncontrolledand controlled airport cases, the predominant collision mode is the over-take. Taking both cases together 90% were from behind. These then arerelatively slow (generally well below 200 knots) closing velocities.
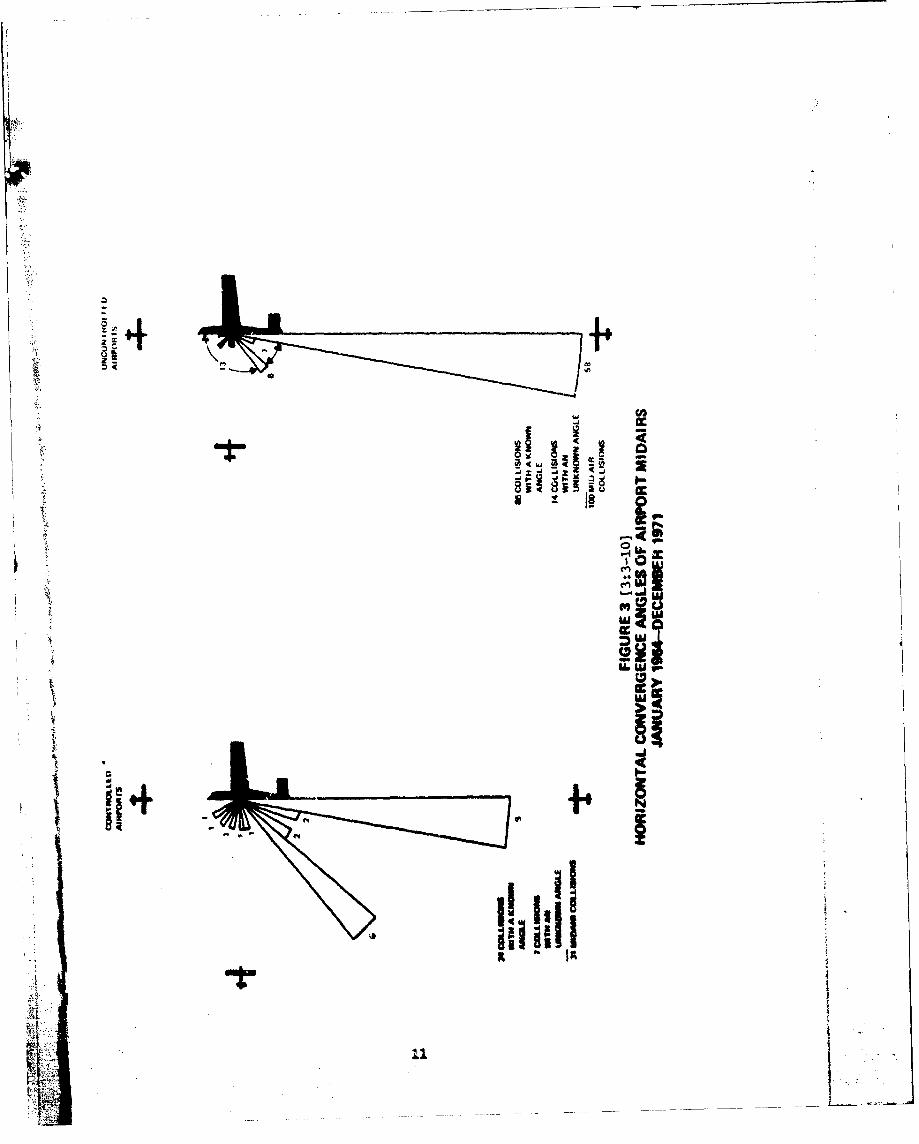
2.2.1.3 AIRPORT COLLISIONS BY TIME OF DAY
Figure 4 graphically presents data on collisions at unuontrolledairports by time of day. The figure shows that 69% of the collisionsat uncontrolled airports occurred during the daylight hours. The reducednumber of collisions during non daylight hours is probably more.related toreduced flying activity rather than the lack of sunlight. Strong contributingfactors are, increased conspicuity due to thn increased effectiveness ofaircraft lighting and the probable higher experience level of pilotsflying at night.
10
____.7__.___I.
." • ji.
livoX't4
CC
U
S12
cc CC-z0
CC
w>
02
12
2.2.2 ENROUTE & TERMINAL AREA COLLISIONS
Enroute and terminal area collisions accounted for 34% (101)of the total civil collisions. Of these 98% (99) occurred witn oneof the involved aircraft flying on a VFR clearance. The two percent(2) that occurred when both aircraft were flying IFR clearance involvedone of the aircraft knowingly violating an IFR clearance. Militaryaircraft were involved in 18% of the enroute and terminal area collisions.
2.2.2.1 WHERE TERMINAL AREA AND ENROUTE COLLISIONS OCCUR
Most terminal area and enroute collisions were within 30 statutemiles of a primary airport and above 2000 feet. The FAA points outin this report that the majority of these collisions occurred withinexisting or planned radar/beacon coverage and that no collisions haveoccurred in positively controlled airspace.
2.2.2.2 CLOSING VELOCITIES IN TERMINAL AREA AND ENROUTE COLLISIONS
Closing velocities are determined by the angle between the pathsof two converging aircraft and the individual velocities. Figure 5shows the horizontal convergence angles for all collisions involvingIFR aircraft and all random VFR - VFR collisiuns foi which the anglesare known. As in the airport case (paragraph 2.2.1.2) VFR - VFRcollisions are predominantly overtakes. Except for the eight collisionsinvolving military aircraft, these collisions were between piston aircraftoperating at 250 knots or below. In the collisions where IFR aircraftwere in-olved, the distribution is more uniform. Three of these collisionsinvolved high performance military fighters (one head-on collisioninvolving an F-101, and two collisions crossing courses involving an F-4and an F-102). In all but two of the collisions shown in Figure 5, theIFR aircraft was a turbojet and the other a piston aircraft.
2.2.3 CONCLUSIONS FROM FAA COLLISION DATA
No midair collisions occurred over the nine year period when bothaircraft were:
a. identified and under radar/beacon surveillance,
b. under positive contrA, and
c. both pilots conformed to their ATC clearance.
Thus, the IFR system worked effectively to prevent collisions.
13
J.
I Ii'a
14$ 44jCCa
N 4,-
4 4z
IL
4.,CUC iH ýUj2 L
14
Most collisions occurred within five miles of an airport (66%).Of these, most occurred at uncontrolled airports (83%). At uncontrolledairports, most midair collisions occurred while the aircraft were below400 feet (68%). Most runway collisions involved at least one landingaircraft (89%1. One runway collision occurred over the nine year periodat controlled airports while one out of three collisior.j at uncontrolledairports were runway collisions.
Airport collisions as a function of annual aircraft operations wererelated as follows:
a. Midair collisions at uncontrolled airports were nearlylinearly related to operations. That is, when operations doubled,then the number of collisions doubled.
b. Midair collisions at all controlled airports were non-linearly related to operations. That is, when operations doubled, thenthe number of collisions more than doubled.
The annual risk of midair collision per aircraft operation or flight- hour did not change significantly, despite constantly increasing annual
levels of aviation activity which effectively doubled between Januery 1964and December 1971.
Eighty-nine percent of the collisions wete between two generalaviation aircraft. General aviation aircraft were involved in 99.5%of all collisions.
2.3 NEAR MIDAIR COLLISION REPORT OF 1968 [41
The Near Midair Collision Report of 1968 is the result of a yearlong ' "y conducted by the FAA. This study was svpported by a majorsegm. of the aviation commuaity because of the potential of the "nearmiss" becoming an actual midair collision. It was an attempt todetermine the true nature and extent of the "near miss" danger and todevelop further insight in the midair collision problem.
An FAA Advisory Circular AC 00-23 issued effective I January 1968pro' ided information on the study, including a reporting form, and out-lined the procedures to be followed for reporting near midair co]Ji''ions.The circular was mailed to about 523,000 pilots who had current redicalcertificates on file and to military distribution points.
In the past, pilots have contended that "near misses" were notreported because the FAA enforcement program discouraged such reportsby L ,bWecting the reporting pilot to possible sanctions for his own
15
actions. Pilots believed that an objective analysis of the sirinationwould be possible only when immunity against enforcement action wasgiven to pilots who were involved in near midair collisions. TheFAA therefore granted anonymity, confidentiality, and immunity fromFAA enforcement or other adverse action to any pilot of a aircraft,an air traffic controller, or any other persons involved in a nearmidair collision where the facts, conditioas, and circumstances ofsuch a near midair collision were reported to the FAA.
2.3.1 STUDY OBJECTIVES
The objectives of this study were set forth as follows:
a. To describe the near midair collision probiexn areasexisting in the National Airspace System and to identify specificcausal factors which separately or in combination lead to a nearmidair collision.
b,. To clearly identify the circumstances surrounding nearmidair collision incidents in order to dev~elop procedures, regulations,and techniques for increasing aviation safety in connection with thenear midair collision hazard.
2.3.2 NEAR MIDAIR COLLISION CLASSIFICATION
In this study all occurrences reported as near midair collisionswere considered for data collection. The severity or danger of acollision in flight was determined aind eac>,, occurrence was thenclassified at; "Hazardous (Critical or Potential)" or "No Hazard"based on the following guidelines:
HAZARDOUS
Critical - A situation where collision avoidance was due to
chance rather than an act on the part of the pilot.
Potential - An incident which might have resulted in a collision
.;.f no action had been taken by either pilot.
NO HAZARD
An occurrence which does not meet the hazardous classification.
The technical and stat~istical analyses were performed on thehazardous group since the characteristics of this group were considered
similar to those of the midair collision.z that actually occur. Manythings can affect how a nesr midair collision is viewed. For example,
16
the "frame of mind" of the reporting pilot (i.e., the degree of hisbeing startled by the sudden appearance of the other aircraft) andvarious other subjective factors may have resulted in the submission ofa near midair collision report, whether or not the encounter actuallywarranted a report.
Some significant factors which contribute to the identification
of a near miss are:
a. distance at first sighting
b. distance a1t closest proximity
C. closure rate
d. relittive position
e. evasive action involved
It should be recognized that in busy airspaces such as controlzones, aircraft often do pass in close proximity to each other wherea near miss situation does not actually exist. While one pilot mightbelieve he had a 'near miss" the other pilot was at all times fullyaware of the presence of the other aircraft and was acting accordingly.It must be noted that without each being aware of the other's intentionsthere is a potential danger to flight safety and a valid near midaircollision situation does exist.
2.3.3 FINDINGS
While near midair collision reports are received from geographicallocations throughout the nation, it was found that certain locationsgenerated more reports than others. The alkalysis of the near midaircollisions resulted in a clustering around large air transportationhubs and the remainder along the published airways with very few "off"airways.
Thirty general area locations were selected from different sectionsof the country including large, mndium, and low activity hub areas to
b obtain a representative nationwide sampling of both enroute and terminal
airspace. A circular boundary with a 50 nautical mile radius wasestablished around each of the 30 selected hubs and all near midaircollisions within that radius were recorded. Fifty-two percent (594)of the 1,12q hazardous incidents occurred in the 30 areas identified.Terminal kicidents ac-ýounted for 70% (417) of these. The study of these
17
30 areas resulted in the identification of factors which can beshown to affect significantly the near midair collision statistics.These factors were the terrain effect, airport proximity, publishedinformation showing patterns of traffic, certain air traffic controlservices, and type of aircraft and operations involved. These factorsaffect near midair collisions to different degrees at the differenthubs depending on the magnitude of each of these factors.
As might be expected, the large metropolitan areas reflected theheavy concentration of reported near midair collisions. Just as inthe midair collision data, increased traffic density results inincreased near midair collisions. At locations where the main airporthas surrounding airports generating different kinds of traffic, reportednear midair collisions were numerous. The flow of traffic to and fromthese different airports conflicted because of the proximity of trafficpacterns, random arrival/departure routings, instrument approachcourse locations, and aircraft flying over or near airport trafficareas. Conflicts between arriving and departing aircraft occurredmuch more at locations having airports in close proximity than at otherlocations.
Military involvement in the terminal airspace was found tooccur primarily around military terminals and particularly at militaryairports conducting trainingi Near midair collisions reported by themilitary most often involved "light aircraft" (12,500 pounds or under).These aircraft were usually opereting in or in close proximity to themilitary terminal traffic areas, in level flight, while :he militaryaircraft were in descent arriving or in climb departing modes. The
descent arriving mode is particularly dangerous as Air Force fighteraircraft have very rEstricted visibilitv down and to the front. Thealtitudes ranges from 2000 ft to 1000 ft AOL and closure rates from300 tc 400 kuots.
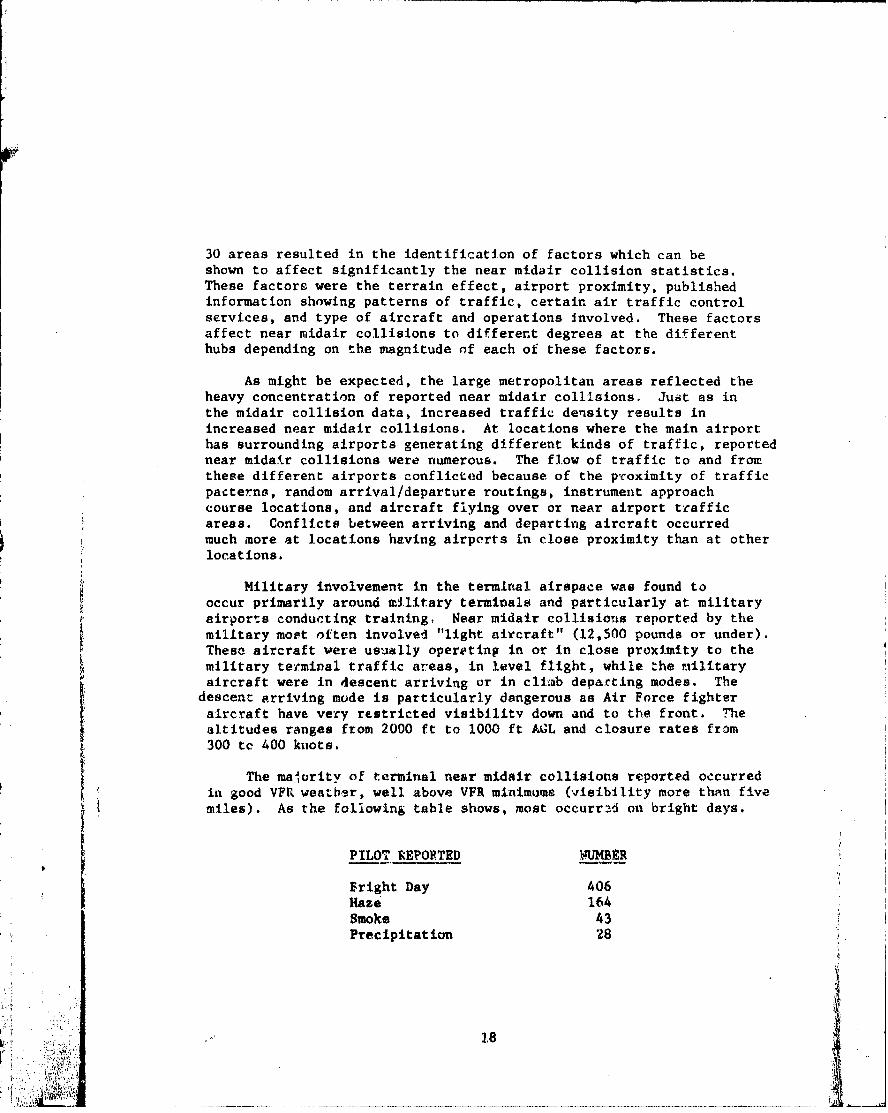
The majority of terminal near midair collisions reported occurredin good VFR weather, well above VFR minimums (visibility more than fivemiles). As the foliowing table shows, most occurr:4 on bright days.
PILOT REPORTED UMBER
Bright Day 406Haze 164Smoke 43Precipitation 28
,.!
b1
The principal problems identified in the terminal airspace are:
a. The uncontrolled mixture of VFR and IFR traffic (i.e.,exposure of known IFR and VFR traffic to unknown VFR traffic).
b. The difficulty experienced by the pilots to "see andavoid" soon enough to prevent a near midair.
Ninety-tlree percent of the 1,128 hazardous incidents tookplace during the day. Eighty-six percent occurred during good VF1,conditions (flight visibility better than five miles). Table 1 showsthe visibility limitations encountered.
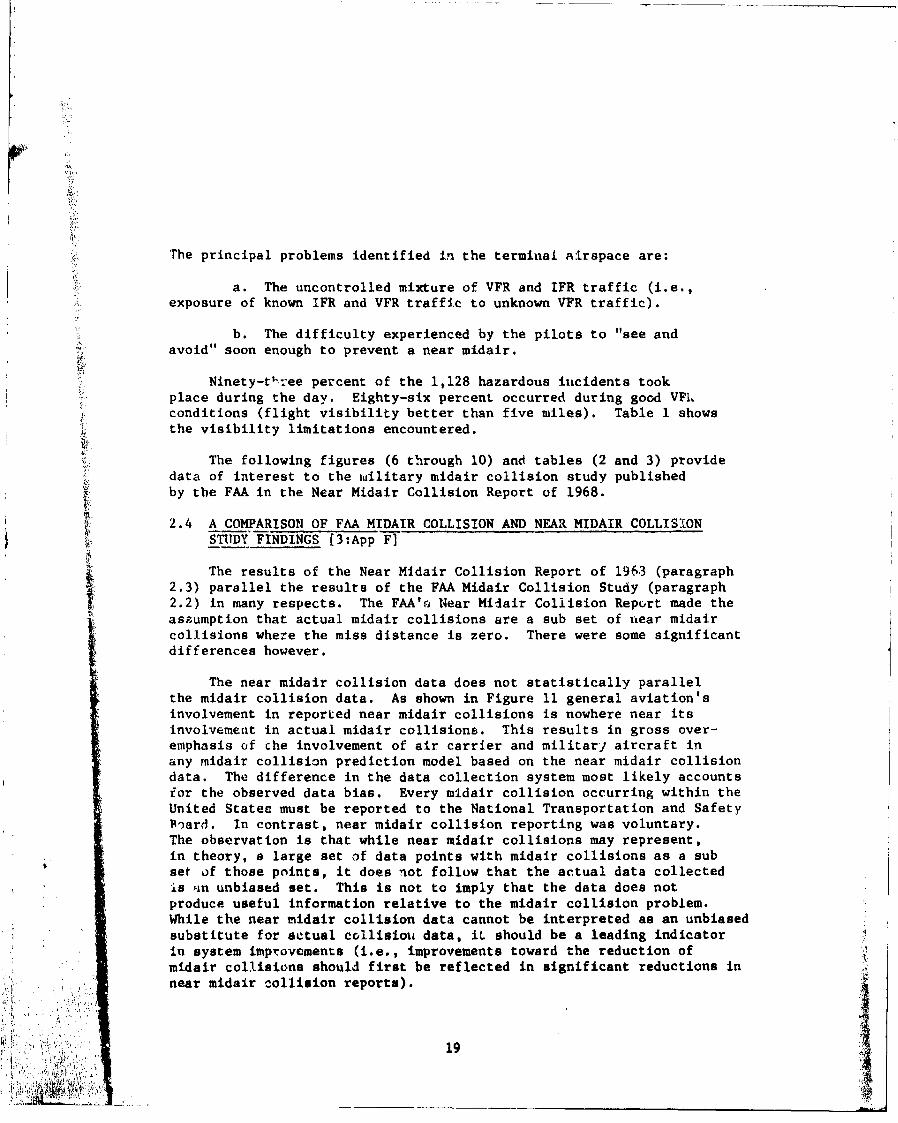
The following figures (6 through 10) and tables (2 and 3) providedata of interest to the wuilitary midair collision study publishedby the FAA in the Near Midair Collision Report of 1968.
2.4 A COMPARISON OF FAA MIDAIR COLLISION AND NEAR MIDAIR COLLISIONSTUDY FINDINGS [3:App F]
The results of the Near Midair Collision Report of 196.3 (paragraph2.3) parallel the results of the FAA Midair Collision Study (paragraph2.2) in many respects. The FAA'o Near Midair Collision Rep..rt made theassumption that actual midair collisions are a sub set of near midaircollisions where the miss distance is zero. There were some significantdifferences however.
The near midair collision data does not statistically parallelthe midair collision data. As shown in Figure 11 general aviation'sinvolvement in reported near midair collisions is nowhere near itsinvolvement in actual midair collisions. This results in gross over-emphasis of che involvement of air carrier and military aircraft inany midair collision prediction model based on the near midair collisiondata. The difference in the data collection system most likely accountsfor the observed data bias. Every midair collision occurring within theUnited States must be reported to the National Transportation and SafetyPoard. In contrast, near midair collision reporting was voluntary.The observation is that while near midair collisions may represent,in theory, a large set of data points with midair collisions as a subset of those points, it does not follow that the actual data collectedis nn unbiased set. This is not to imply that the data does notproduce useful information relative to the midair collision problem.While the near midair collision data cannot be interpreted as an unbiased
* substitute for actual collisiota data, it should be a leading indicatorin system improvements (i.e., improvements toward the reduction ofmidair collisions should first be reflected in significant reductions innear midair collision reports).
19• t,•.••, :. . • •o• . •. :..

TABLE 1. [4.55] REPORTED ATMOSPHERIC AND CLOUD CONDITIONS
HAZARDOUS INCIDENTS
ENROUTE TERMINAL TOTAL
BRIGHT DAY 288 406 794GLARING SUN 10 29 39BRIGHT NIGHT 16 33 49DUSK 23 61 84DAWN 0 3 3THUNDERSTORMS 3 6 9PRECIPITATION 13 28 41TURBULENCE 5 7 12HAZE 60 164 224ICING 2 0 2SMOKE 12 43 55
SNOW 0 1 1
OVERCAST 13% 15% 14%BROKEN 10% 14% 12%SCATTERED 14% 14% 14%CLEAR 63% 57% 60%
20
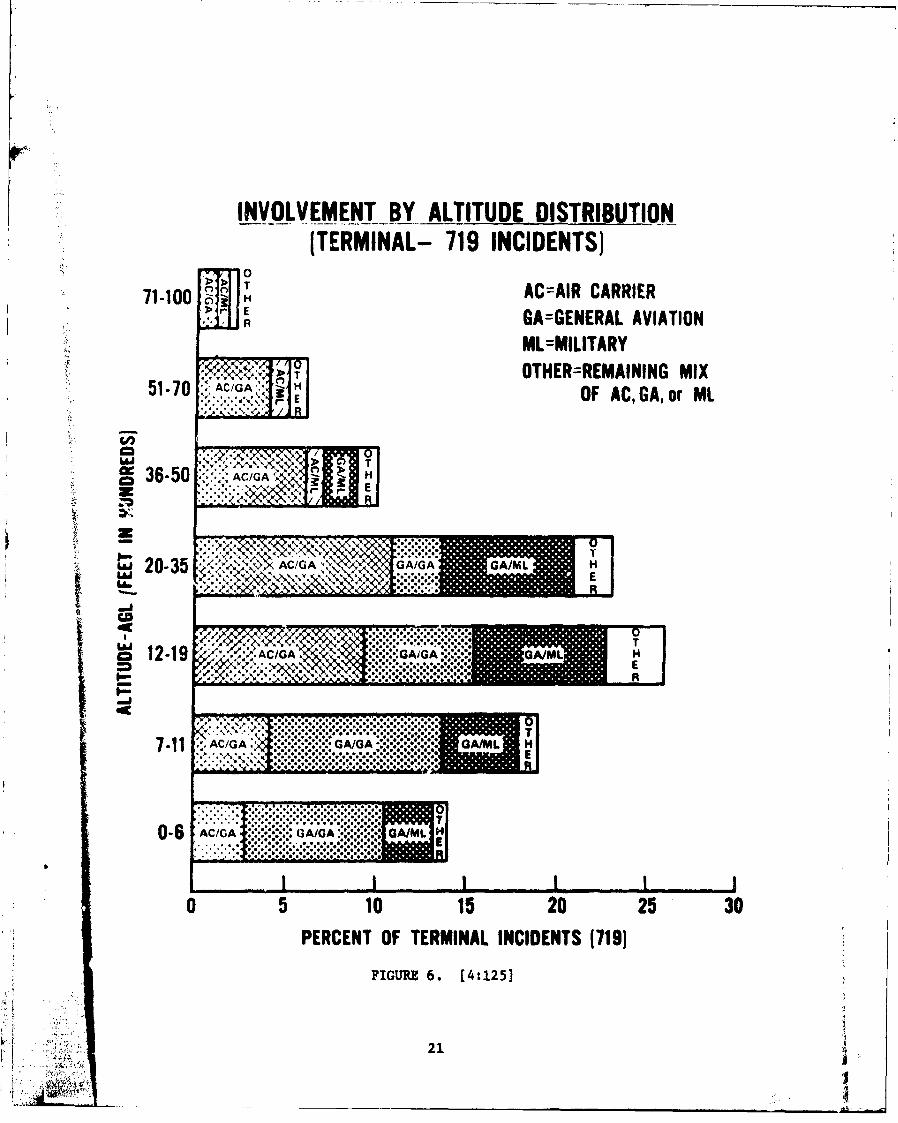
INVOLVEMENT BY ALTITUDE DISTRIBUTION-(TERMINAL- 719 INCIDENTS)
0
AC=AIR CARRIER) >r E GA=GENERAL AVIATION
R
ML =MILITARYOTHER=REMAINING MIX
51-70 *:CG*-HOF AC, GA, or ML
a~36-50 AC!G
w 20-35 ~ AC;GA .\V4$ G GA/ML
TT12-11 MCIG AC/GA H:::::::::G/A;
7-51 AC/G A;:.~l
0 5 10 15 20 25 30PERCENT OF TERMINAL INCIDENTS (7191
FIGURE 6. [4:125]
H ~21
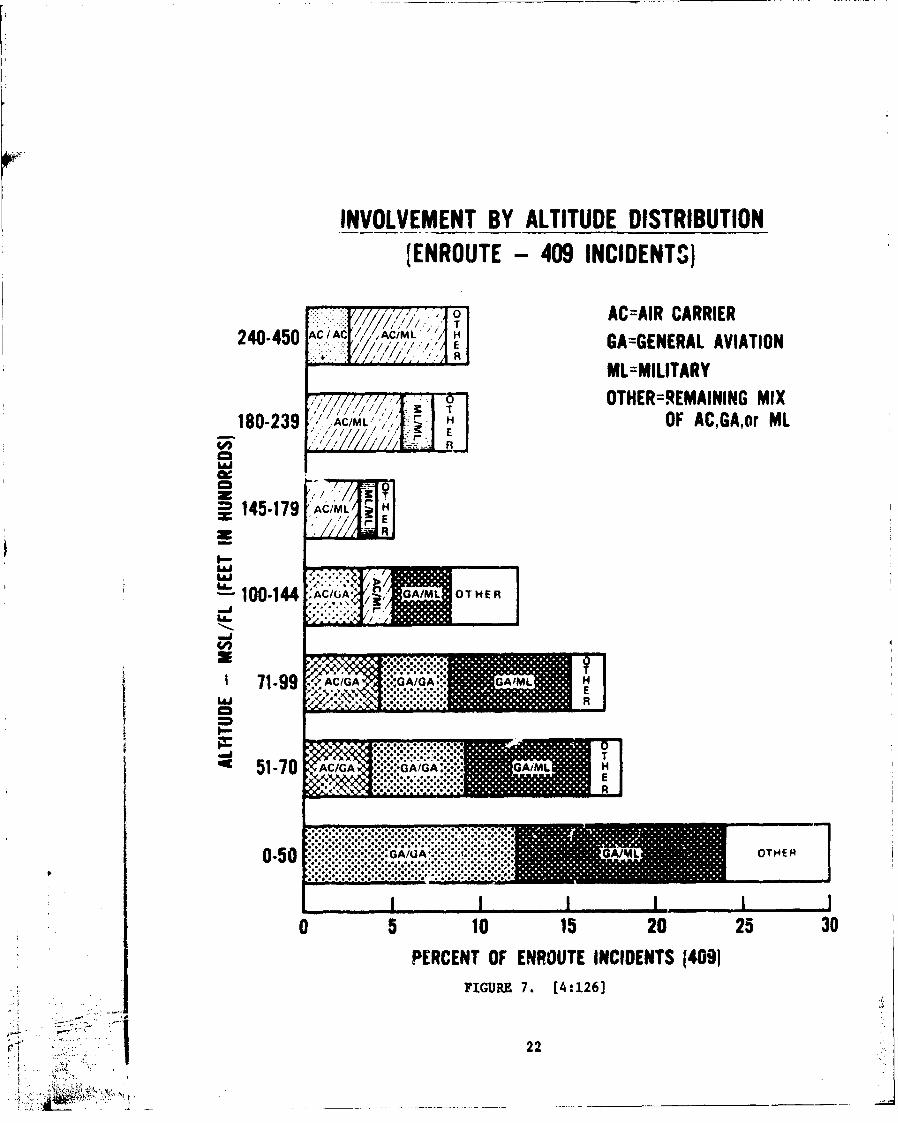
INVOLVEMENT BY ALTITUDE DISTRIBUTION(ENROUTE -409 INCIDENTS)
/ / /1AC=AIR CARRIERT
240-450 ACA A/L EGA=GENERAL AVIATIONML=MILITARY
0 OTHER=REMAINING MIX
r T185-279 OF/M ACGHrM
1' ~- .Ez ' oC2
10-uw/A~~ AM TE
=2 151-79 AC/A G G
0-50 ~...
0 510 5 0 2 3
PECNWFERUE NIET 49100-14F4UR 7.C/; [4:126]HE
Ld22

•-.-4
A z
.1 4 H 0CL
a--
4V:
* v-4
PER r OF, TEMIA INIET (719
* 0
FU 8
I23
I--'
-ECE F ERINL 'C 5TS(79)4
• FIURE . [4127]:•H

OPERATOR INVOLVEMENT VS LOCAL TIME(TERMINAL)
loomosoo 0%
......................................................................................... ib............................................... ........................................
............. . . . . . . . ..
... AC
..... ..........
....... .........
............ ....... . . ........................ ............
................*11,1111*111,1111*1 *1111*1 " *111*111, 11................................................ ..................
AC..........
............... ............................... ....................... .......................................
.... 14 1#1i i H H I H , ....... 4 .................................. .......................................................................................
......................
41),too NOUFfS 58% -
TOTAL - 719 INCIDENT$
FIGURE 9. (4:1311
24
41t

OPERATOR INVOLVEMENT VS LOCAL TIME(ENROUTE)
ooftcmo' 0
.. .. . .. .. ..
FIGUR 10. 4:132
25....
.. .. .. .
REPRESENTATIVE AIRCRAFT INVOLVEMENT
REPORTING AIRCRAFT OTHERA1F..-.AIRCRAFT MODEL
EN TE TOTAL EN
S ingl.,-Engi.ne
C-150 32 69 101 5 6 67C-172 17 36 53 13 5; 68C- 182 8 11 19 11 -11 32PA -28 18 40 58 14 66 80BE-35 1I Ii 22 9 4i. 53
Light Twin
C-310 2 2 4 2 - 6BE-'55 4 3 7 1 5 6BE-18 6 5 11 5 7 It
2 & 3-Engine Transport
B-727 23 61 84 19 17 3bB-737 0 8 8 1DC-9 16 56 72 11 9
-..- - - - -- J4-Engi ne Transport
B-707 10 18 28 14 11 25DC-8 i1 18 29 3 7 7DC-6 2 13 15 2 4 6
Military
B-52 6 1 7 3 I
F-4 7 12 19 24 9 33A-4 11 5 16 6 12
T- 33 3 7 10 3 1 isT-38 4 22 26 2 1 3
NOTE: Number of times each model involved in 1,128 Hazardous Incidents
•~i! TABLE 2. (4:1?0]
26

TYPE OF MISSION CONDUCTED*
AIR CARRIER GLN. AVIATION \11ILITARN*MISSION I -M Ir,!AL
EN TE EN TE EN TES- -
SCHEDULED 153 308 461
TRAINING 3 11 37 135 75 133 394
CROSS-COUNTRY 2 0 35 27 32 12 108
TlýST 2 0 2 10 4 4 22
AIR TAXI 15 29 44
BUSINESS 57 51 108
PRIVATE 65 135 200
ACRICULTURAL 3 1 4
PATROL 0 4 4
FORMATION 3 2 27 [5 47
MILITARY 0 2 45 ", 88
TACTICAL 8 6 14
UNKNOWN Ij 13 163 430 74 69 762
Incr.udes tmission riported for both reporting and other aircratttor 1,128 Hazardous Incidents.
TAJLE 3.
27
U.1%
TERMINAL
X.8%•
24.6%
65% 4.0%AC/AC AC/0A ACUIL 0A/BA OA/MIL
IN ROUTE
t
LIACAC AC/BA ACIMIL BA/GA BA/NML
ji CRITICAL NEAR UDAfh (UJI
M .jACTUAL MIGAIRS t1U1171)
AC - Air Carrier
GA - General AviationMIL - Military
COMPAR)*ON OF CRITICAL NMAC DATA AND MAC DATA BY ULER CLASS
FGURE 11. [3:F-2]
11 28
_AL._
2.5 AIRCRAFT VISIBILITY
Every aircraft pilot has the responsibility to maintain a vigilantlookout so as to maintain a safe separation distance from other aircraftregardless of the type aircraft being flown or whether operating on anIFR flight plan or under VFR. The inability of a pilot to see otheraircraft on a collision course can be caused by:
a. preoccupation (in which the pilot attends to other flight
relevant tasks such as radio calls, navigation, etc.)
b. fatigue (retarding muscular action of the eyes)
c. glare (causing a loss of visual sensitivity)
d. visual deterioration (e.g., myopia - nearsightedness;hypoxia - resulting in a constriction of visual field)
e. lack of sufficient contrast between an intruding aircraftj and its background
f. fixation (gazing into space without vertical or horizontalscanning)
g. poor illumination
h. visual field blockage (due to canopy bows, visors, etc.)
i. backscatter (in the surrounding atmosphere)
just to mention a few.
Detectability of an aircraft depends on many factors, butthe more important appear to be its size, its shape and aspect, itsdistance from the observer, Its contrast with its background and onthe atmosphere.
While many experiments have examined the visibility of simpletargets (uniformly bright circles, squares, or rectangles) viewedagainst homogeneous background [5:624, 6:237, 7:500, 8:531] very littledata has been obtained on visibility of complex targets seen againstcomplex background. Fxamining the simple target-and-backgroundsituations will give an idea of how complex situations affect aircraftvisibility and will be done here before some actual complex situationdata is examined.
2.5.1 BRIGHTNESS CONTRAST
29
4I., , •_ _ __ _
The contrast between target and background is the primarydeterminant of target visibility in the simple target-and-backgroundsituation when the target is seen large (those subtending visualangles of one degree or more) in the field of view. Brightnesscontrast is defined by the equation
C - Bt - BbBb
where C - the Brightness ContrastBtu the Target Brightness
B b the Background Brightness
When the target appears brighter than the background the contrastis positive (Bt > Bb), and when the target appears darker than thebackgtound (Bb> Bt) the contrast is negative. If Bt - 0, a perfectlyblack target, then the contrast C = -1. This is the maximum negativecontrast possible. Positive contrast, on the other hand, is mathematicallylimitless, but values higher than two to five are unusual unless theaircraft should happen to reflect the sunlight specularly. Thresholdcontrast (the contrast when the target becomes detectable) under fieldconditions is generally accepted to be 0.05 [9:94] for large targets.This contrast is obtained when the target brightness is approximatelyfive percent greater (or smaller) than the background.
When the target is small (those cubtending visual angles of lessthan one degree), the required threshold contrast for visibility ishigher [5]. As an example, when the target subtends only four minutesof visual arc, the contrast threshold is about ten times as high asthe threshold for a large target (i.e., C - 0.5). For a contrast of0.5, the target brightness must be at least one and one-half timesas bright as the background if the contrast is positive or no more thanone-half as bright as the background if the contrast is negative.
Thus it becomes apparent that at the same visual range smallaircraft must present a much higher brightness contrast than do largeaircraft for equal detectability.
2.5.2 TARGET SIZE AND SHAPE
Compact targets like squares or rectangles with low aspect ratiosdo not differ appreciably from circles of the same area in thresholdcontrast (as described above). However, when the target is notcompact (a long linear target ouch as an aircraft in certain aspect;)
. . . , . , -t
much higher contrasts are required for threshold visibility compared tocompact targets of equal area.
The shape and size of an aircraft affect the sighting range in twomajor respects. First, the target's actual shape and size, togetherwith the aspect seen, determine its apparent shape and size. Second,these same elements, together with the lighLing conditions and 6urfacetreatment, result in a usually quite complex distribution of brightness.Most often, however, the intruder aircraft at the limit of detectabilityis very small in the field of view, so that itri visibility is determinedby some kind of overall effect of the brightness distribution.
It has been proposed that the top half of aircraft, includingupper wing surfaces, be painted white and the lower half, includinglower wing surfaces, be painted black. Thus the maximum contrast isobtained when the aircraft is viewed from below against the sky (inmost cases the dark aircraft will appear against a light sky) and fromabove against the ground (in most cases a light aircraft will be seenagainst a dark background). But what happens when this same aircraftis viewed broadside?
Suppose the above aircraft is seen broadside. In this instanceit is hoped that at least one-half of the aircraft will contract withthe background. If the brightness distribution is broken up into areassmaller than that required to be detected individually, the overalleffect on visibility is sometimes determined by averaging the bright-ncss over the whole cross section and contrasting this average bright-ness with the background. This averaging effect can cause problemswith our half-and-half aircraft. If the top half (white half) is brighterthan the background and the bottom half darker (black half), then theoverall appearance would be that of two rectangles, one on top of theother, the upper having a positive contrast and the lower a negativecontrast. If these contrasts are of approximately the same magnitudeand the aircraft is at a distance where it would normally be Justbecoming visible, the two rectangles might not be resolvable and ablending would occur. The net effect would be nearly perfect camouflageand a resulting reduction in detection range.
The above discussion is intended to illustrate that improvementsin visual detection can result in a worsening of the problem underthe widely variuble condition to be found.
2.5.3 EFPECTS OF THE ATMOSPHERE
The Atmosphere works in two ways to change the appearance ofobjects seen through it. One is atmospheric attenuation. The other isthe addition of light from the atmosphere, ao that distant objects seeme
13
lighter. Atmospheric attenuation is the loss of light by absorptionand 3cattering, so that it does not reach the observer's eye.Addition of light from the atmosphere most commonly changes the appearanceof objects during the day and it is most important for objects thatreflect light rather than transmit it. It comes about when light fromanother source, such as the sun, is reflected or refracted by theatmosphere so that it follows the same path to the eye as the light fromthe objec.t. Since light from the object is being lost at the same timethrough atmospheric attenuation, the net result is that a dark objectboth appears lighter and stands out less clearly from surroundingobjects (loss of contrast). This effect is most commonly seen in theappearance of distant mountain ranges, whose dark forests appearprogressively lighter with increasing distance.
In the simple case of a light seen at night, atmospheric attenua-tion reduces the amount of light reaching the observer from the signal(see paragraph 3.21.). Affects of the atmosphere on daytime visibilityof targets is far more complex, due principally to the scattering oflight by atmospheric particles. As pointed out earlier, as distanceto the target increases the target takes on more and more of theappearance of the sky or air background itself, until finally it dis-appears completely (even though its size may be well above threshold).The effect is visible generally as a reduction of both color andbrightness contrast. Reduction of color contrast is g-ýnerally morepronounced such that color becomes impetceptible before the brightnesscontrast threshold is reached and the target finally disappears [9:174].
Table 4 provides some examples of the interrelationship of targetsize, contrast, atmosphere, and sighting4.r.ae--te d--orýd-a-ta forsimple target , s-Tl]. (For the reader interested in
----- d•-ailed analysis of the manner in which the atmosphere affects the- visibility of targets Reference 9 is highly recommended but is too
complex for treatment here.) From Table 4 it can be concluded that (1)actual sightings are likely to be at closer ranges than the reportedvisual range and (2) when high contrast is provided in a given flightsituation, it can result in a significantly longer sighting range.
of The table is based on circular targets and on considerationsof brightness contrast only. At the limit of detectability, color
* contrast generally has no affect on sighting range. As noted previouslycolor contrast is reduced by the atmosphere and at the limit ofdetectaaility, the observer cannot tell whether the target has color.This conforms to theory [9:1741 and has bfen demonstrated in flightobservation (103. Thus the detectability of aircraft for safe collisionavoidance purposes can be treated as a brightness contrast problem alone(without reference to color).
32K 1

TABLE 4
EXPECTED SIGHTING RANGE FOR TARGETS OF VARIOUS SIZES AND CONTRASTS,I SEEN IN VARIOUS ATMOSPHERES
DIAMETER OF CIRCULAR REPORTED BRIGHTNESS CONTRASTTARGET VIEWED AGAINST VISUALB -B
SKY BACKGROUND 2 RANGE 3 t b
Bb
2.0 1.0 0.5 0.1
36 ft 20SN 14.2SM l1.9SM 9.95M 6.2SM10511 9.OSM 7.9SM 6.8SM 4.5SMSSM 5.7SM 5.OSM 4.4SM 2.9SM
6 ft 20SM 6.7SM 5.3SM 4.1SM 2.2SM10514 4.8514 4.0514 3.2SM 1.85M5514 M.AM 2.8514 2.4514 1.4514
1. This is the 95% detection probability as obtained in ideal observingconditions; operational sightings would be generally shorter.
2. These values approximnate visual area of a large aircraft (36 ft) anda small aircraft (6 ft).
3. International Visibility Scale categories are:
5 statute miles - light haze10 statute miles - clear20 Siataite miles - very clear
33

2.5.4 COMPLEX SITUATION DATA
As pointed out earlier, predicting target visibility under a widevariety of atmospheric and target conditions is an extremely complexproblem. The techniques for prediction of target visibility that havebeen developed are of uncertain value, for few field tests have beenconducted to try them out. Two flight tests conducted by the FAA shedsome light on the matter.
2.5.4.1 "LARGE" (DC-3) AIRCRAFT VISIBILITY
The first flight test [111 we will examine, condu~cted in 1957,studies the visibility of transport aircraft. The conspicuityof the then-present-day transport aircraft was determined by measuring,in daytime flight, the distances at which pilots of one aircraftbecaime aware of another DC-3 aircraft, normally painted and normallyequipped, as it approached from various angles on courses which wouldresult 'in midair collisions. Two subject groups were used. One groupwas deliberately misinformed. This group was told that the study wasconcerned with the eye movements made with two types of instrumentdisplays. These pilots were also told that if they should seeanother aircraft in the vicinity they should report it to the safetypilot. During their flights another aircraft was put on one of fourdifferent collision courses with their aircraft as shown in Figure 12through 15. The second group of pilots, the informed group, was toldI that they were on a collision course with another aircraft, but theywere not told from what direction it was approaching. An engineer whoknew where to look also recorded where the collision aircraft was firstdetected. The results are shown in Table 5.
DISTANCE AT WHICH AIRCRAFT ON CO3LLISION COURSE WAS DETECTED
Detection Distance
Relative Bearing Engineer Knew Where Pilots Informed Pilots Mis-
To Zollision A/C To Look ifre
00 (head-or,) 11 Miles 5.00 Miles 3.50 Miles300 left 14 4.50 50
060~ left 12 4.50 4.50100left 10.5 4.75 35
TABLE 5
34
_J_ __
Collision point
v/II• 4300 Heading diff.
Line of sight / f•'}i / 1000
•- Target aircraft /.±. Subject pilots aircraftT e acruising speed 120 mphcruising speed
150 mph Closing speed 60 mph
Figure 12 Collision Case I [11:3]
Collision point
60 Heading diff.Target aircraft . 6cruising speed / 4
140 mph /4 Ine of sight- 60&
SClosing speed 't Subject pilots aircraftClosi40 shpee cruising speed 140 mph
Figure 13 Collision Case II [1:3]
35
.. .'..
V
Tarqet aircraftcruising speed 140 mph
YN
Collision pointLine of - o
s ight 120 Head1ng diff.Closing speed I
260 mph
Subject pilots aircraftS- cruising speed 140 mph
Figure 14 Collision Case III [11:4]
Target aircraftcruising speed 140 mph
Closing speed y280 mph Collision point
*I
Subject pilots aircraft
cruising speed 140 mph
Figure 15 Collision Case IV [11:4]
36

The cotrditions for these tests were not described completely inthe report, only that ceiling and visibility unlimited (CAVU) weatherconditions existed. This lack of more exact data describing theatmospheric conditions makes comparison of predicted data and testdata almost impossible. However, the range of detection reported bythe engineer is of the same order of magnitude as would be obtainedfrom appropriate visibility nomographs.
Two interesting points are seen in Table 3. First, both theinformed and the misinformed pilots failed to pick up the targetaircraft until it was three to five miles away even though thetarget was visible ten to twelve miles away. This discrepancy isprobably due to the time required to scan large areas of the sky;the aircraft in one sector while the pilot searched others. Second,an anticollision device which would inform the pilot of the relativeposition of an approaching aircraft at visual threshold distanceshould extend threefold the average detection range of the pilot inthese tests.
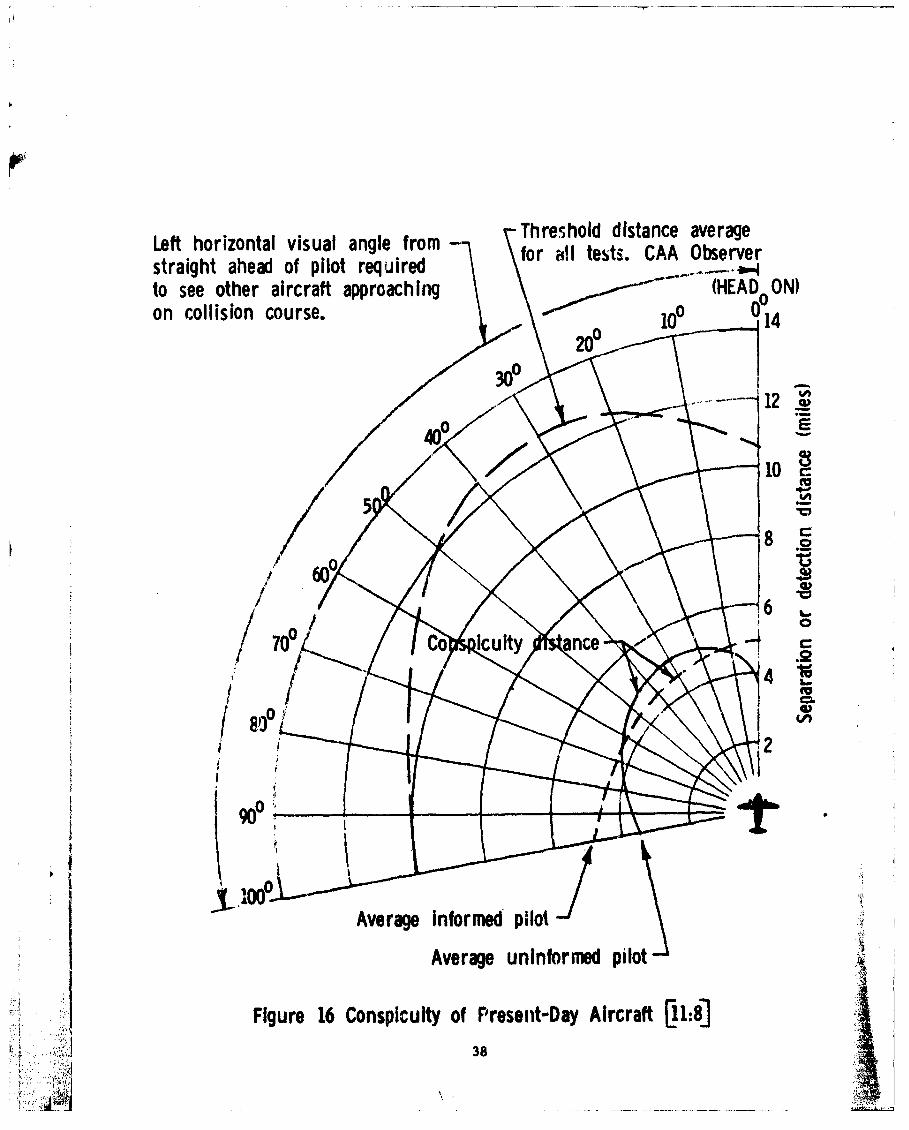
Figure 16 presents the daytime ranges of the DC-3 aircraftU.ýund in this study as well as presenting curves extrapolating thisdata to the left 1000 horizontal visual angle. The long dashed lineshows a maximum threshold distance of 12.4 miles at 300 visual angle,decreasing to 10.8 miles at 00 visual angle and to ten miles at 1000visual angle. The small aircraft cross sectional area presented at 0visual angle was probably the major contributing factor lowering thethreshold range in the head-on collision case. It should be noted thatthe cross sectional area at 00 visual angle is approximately one-halfof the 300 visual angle cross sectional area.
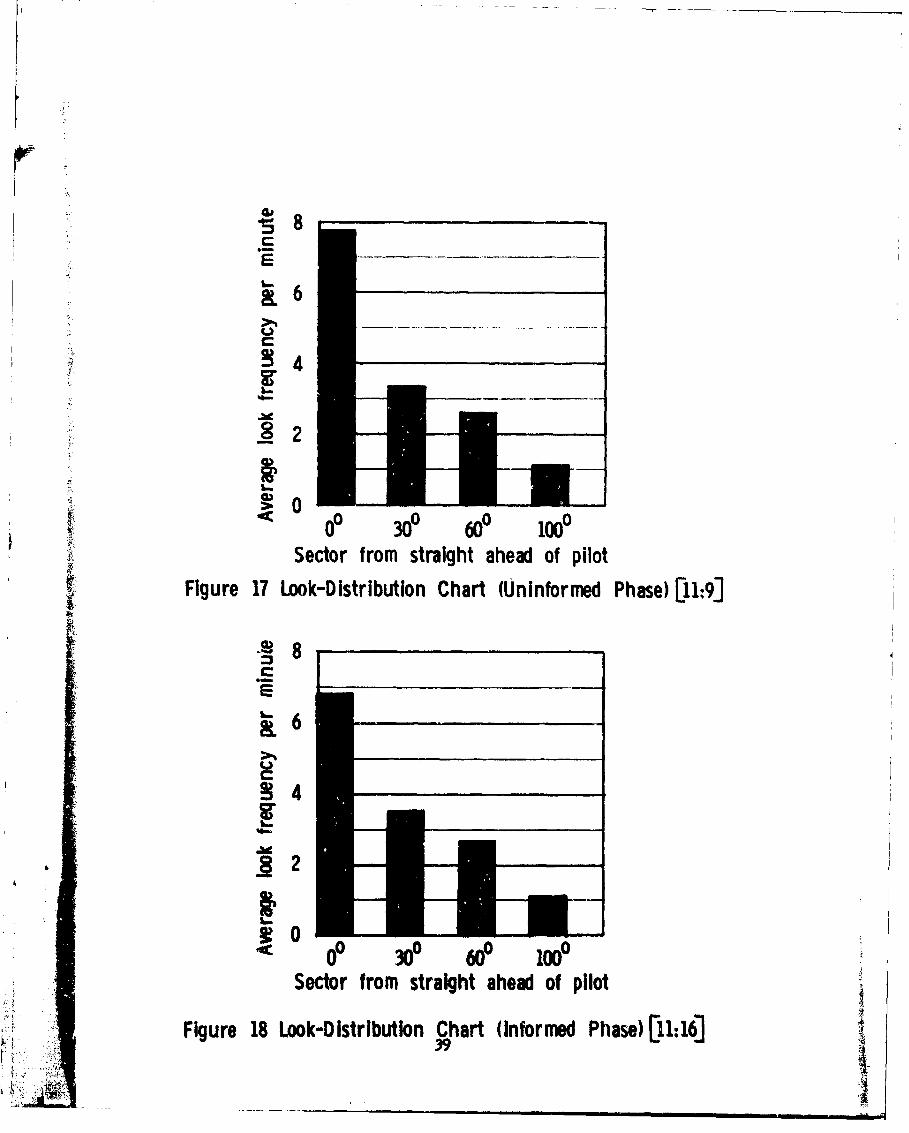
The average uninformed pilot's detection curve, presented as thesolid line, shows the average detection distance at 00 visual angleto be three and four-tenths miles, at 300 visual angle to be five andfour-tenths miles 6at 600 visual angle to be four and three-tenthsmiles, and at 100t visual angle to be three and five-tenths miles. Justas in the threshold case we see a decrease in the detection at 00 visualangle compared to the 300 visual angle due to the decreased crosssectional araa. The gradual reduction in the detection distance foundin the 300 co 1000 sector is most likely due to the test subjects searchhabits which reveal a low look frequency in this sector (see Figure 17).
The average informed pilot's detection curve, presented as the shortdashed line of Figure 16 shows the average detection distance at 00visua.1 angle to be five miles, at 300 visual angle to be four and five-tenths miles, at 600 visual angle to be four and two-tenths miles, andat 1000 visual angle to be four and eight-tenths miles. Comparing these
37
-Threshold distance averageLeft horizontal visual angle from - fhesor ld testanc CaA vbervgerstraight ahead of pilot required . .........
to see other aircraft approaching (HEAD ON)on collision course. lo 14
20P~30012
10 C.4-0t"0• 1
8 CI6
, .
Average Informed pilot
Average uninformed pilot
' Figure 16 Conspicuity of Present-Day Aircraft [11:8]
S38<,7*. ,,
S8
•. 4
S• 000 ~ 0 00
Sector from straight ahead of pilot
Figure 17 Look-Distribution Chart (Uninformed Phase)[11:9]
U
C
S 482
9! 0O0 30o 600 100
Sector from straight ahead of pilot
Figure 18 Look-Distribution Chart (Informed Phase) [11:16]
results with the uninformed phase we find an increase from three andfour-tenths to five miles at 01, a decrease from five and four-tenthsto four and five-tenths miles at 300, no change at 600, and an increasefrom three and five-tenths miles to four and eight-tenths miles at 1000.When the look frequency for the informed pilot is reviewed (see Figure18) we find that tne informed pilot tended to distribute his looksmore evenly over his visual area.
* 2.5.4.2 "SMALL" AIRCRAFT VISIBILITY
The second flight test [12] we will examine, conducted in 1958,studies the visibility of small aircraft in the terminal area. Theaverage detection distance for a Beechcraft four-place Bonanza (asmall single engine aircraft) was determined in a terminal area duringdaytime VFR conditions. These distances were determined in no~rmallypainted and normally equipped aircraft as they approached on variouscollision courses. Twenty-five pilots each flew three zollisionsituations for a total of 75 test flights. Each collision coursei consisted of a different terminal area maneuver. The three maneuversstudied were (1) departure and climb-out, (2) straight-in approach,
* ~and (3) a right turn-in approach. During each manieuver, the intruder* ~aircraft was on a 900 converging course with the subject pilot's
aircraft, requiring a 450 left visual angle for the subject to detectthe approaching target. The test subjects were unaware that they wereflying collision courses and the true purpose of the flight test.
Figures 19 and 20 present the diagram of the corridors that eachsubject was instructed to fly and the VFR reference map used by thesubjects respectiveL~. Figures 21, 22, and 23 show the threecollision courses described above. Table 6 provides the parametersand results of the tert flights.
Examining collision course A (departure and climb-out) it isfound that the average detection separation distance for the observers(who were aware of the intruder aircraft position) was 2.82 miles,six times greater than the average for all pilots. As in the firstteat (paragraph 2.5.4.1) knowing where to look moved the detection rangetoward threshold. On course A, the subject aircraft was climbing tothe altitude at which the intruder aircraft was flying. The fact that14 of the 25 pilots made no attempt to avoid a collision after detectionand that eight of the eleven who did initiate action waited until theaircraft were within six seconds or less of the collision point is alarm-Ing and reflects an inability to make a quick decision for self-preserva-tion or an inability to recognize a hazardous condition, or both.
Examining collision course B (straight-in approach) an averageý.O detection distance approximately twice the distance for course A is
2 found. It must be noted that both aircraft were at the same altitude
40
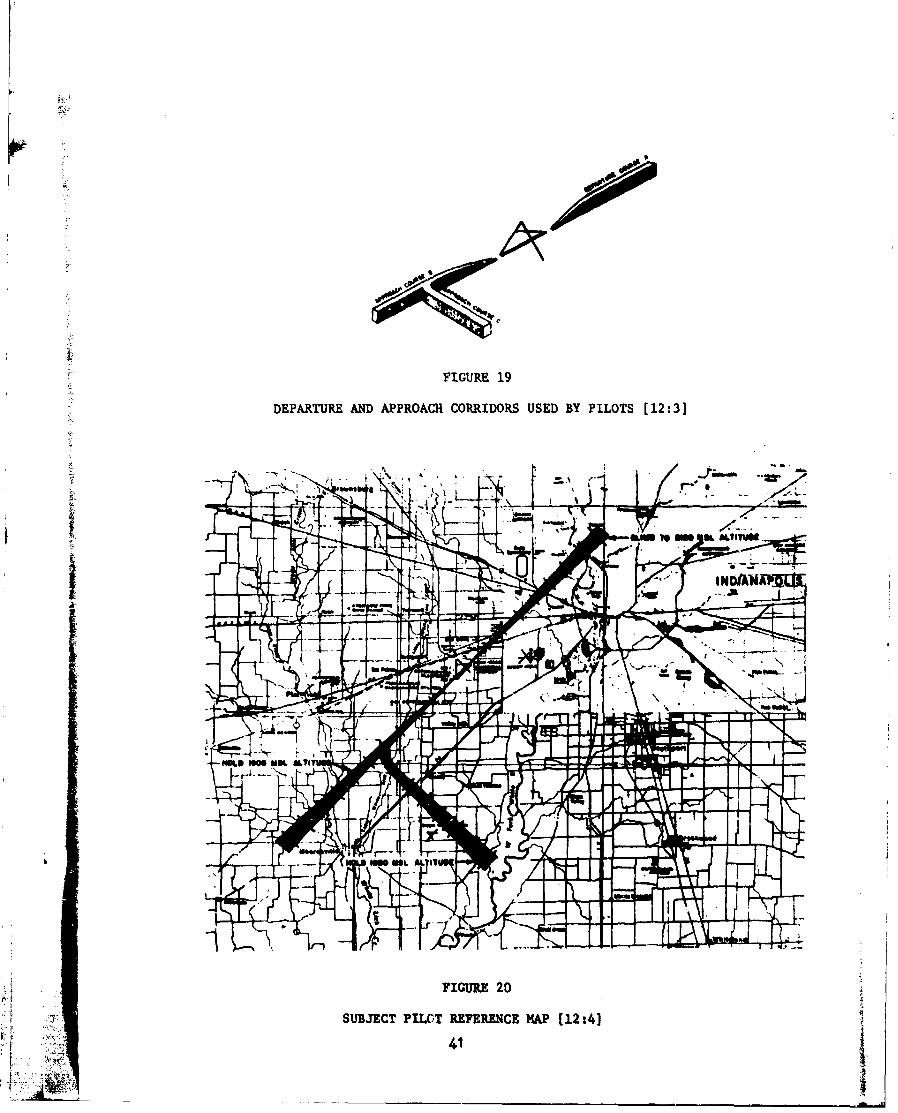
FIGURE 19
DEPARTURE AND APPROACH CORRIDORS USED BY PILOTS [12:3]
41 iir g
1. PTFIGUR~E 21
q- IPONTCOLLISION COURSE A [12:5]
FIGURE 22
COLLISION COURSE B 112:5]
0 FIGURE 23
ICOLLISFION COURSE C (12:6]
JOI
'low-
-A _ _ _.II

TABLE 6
PARAMETERS AND RESULTS IN SMALL AIRCRAFT VISIBILITY TEST
• COLLISION COURSE
P A R A M E T E R / R E S U L T - .. ...... .. ..
A B C
AVERAGE RATE OF 186.5 mph 197 mph 197 mphCLOSURE
TOTAL NUMBER OF 25 25 24PASSES
AVERAGE DETECTION 2.82 SM 4.0 SM 4.3 SMSEPARATION DISTANCEOF THE OBSERVERS(KNOWN POSITION OFINTRUDER)
NUMBER OF DETECTIONS 14 15 19
NUMBER OP MISSED it 10 5DETECTIONS
AVERAGE DETECTION 0.47 SM 0.78 SM 0.84 SMSEPARATION DISTANCEFOR ALL PILOTS
TIME PRIOR TO COLLISION 9.5 sec 14.6 sec 15.3 sec
AVERAGE DETECTION 0.85 SM 1.30 SM 1.05 SMSEPARATION DISTANCEFOR PILOTS DETECTINGTARGET
TIME PRIOR TO COLLISION 16.8 sec 24.5 bec 19.3 sec
',. 43I
f.•i i i• i
in course B which was not the case in course A. Again improvedperformance of the informed observer is found just as in course Awith the informed observer's detection distance more than five timesgreater than the uninformed observer. Of the 13 pilots whoinitiated an avoidance maneuver on course B, nine waited until sixseconds or less remained to avoid the collision. When this iscompared with the eight late recognitions on course A, there isfurther indication that a hazardous collision situation cannot berecogntized nor a decision reached readily even when both aircraftare at the same altitude.
Examining collision course C (right turn-in approach) we finddetection distances approximately the same as in course B. Therewere only five missed detections on this course, which may indicatemore alertness by reason of the two previous experiences, or anawareness that radio communication increased for the copilot priorto a previous near collision experience. It is also possible thatearly pilot training, to alwr'-s scan an area before making a turn,was influential in the increase in number of detections for thiscourse, since a turn was necessary and since the majority of thedetections were at close range. There was however, no decrease inthe number of pilots who failed to initiate action until six secondsor less prior to the point of collision. This may be explained bythe changing aspect of the subject aircraft as it turned relativeto the target, adding a factor of difficulty to decision time.
In general it was found that:
a. In daytime VFR conditions wvith a minimum ten miles
visibility aircraft of this size could be detected in the terminal
area at distances up to four miles.
b. When not forewarned of an impending collision situationpilots could not be expected to detect an aircraft of this size at
distances greater than two and eight-tenths miles.
c. Aircraft or hazardous conditions were not recognizedas readily during takeoff and c~imb as they were du.ring straightand level flight,
d. For every three hazardous sit~uations, two subject pilotsdetected and avoided the impending collision.
e. The pilots did not recognize a hazardous cellision situationin flight by the aspects of the approaching aircraft above, untilboth aircraft were in dangerous proximity to each other.
____ ___44

2.6 MIDAIR COLLISION GEOMETRIES
Investigations of midair collisions generally center aroundreconstruction of the two flight paths. It seems logical thatanalysis of midair collision geometries ,'culd allow the investigatorto determine which aircraft was flying "blind" due to structuralblockage, relative paths and velocities, etc., and would aid in the
it analysis of corrective measures. Many lists have been compiled byinvestigators trying to define the information "needed" by the pilotto accomplish the sensing, comparing, and decision procedure result-ing in the solution of midair collision problems and their subsequentavoidance. These lists are generally not alike with some of theitems being expressed in differer, ways. If the lists are compared,consolidated, and reduced to essentials, the remaining parameters are
Xi those necessary to allow the solution of a four-dimentional spacetime vector problem involving two aircraft. These parameters are:heading, airspeed, altitude, and maneuver for both aircraft, distanceto the intruder at the time of detection, and bearing to the intruderat the time of detection.
2.6.1 THE RECOGNITION OF AND RESPONSE TO INTRUDER AIRCRAFT
As Calvert points out [13] the mental processes involved inrecognizing a collision threat and responding to it are quitedifferent on the ground than in the air. The driver of a groundvehicle has L fixed frame of reference on which he and all otherg.ound vehiclfs move. He can see at a glance where he will be inthis frame of reference during the next few seconds and can estimatewhere other vehicles will be in this frame of reference at the sametime. Since he is seeing the two movements relative to the samefixed framework, he can arrange that the points in the frameworktoward which the vehicles are moving, shall not be the same at thesame instant. Since each vehicle is generally restricted to achannel (the road) each driver can predict where the other will mostlikely go using the rules of the road.
In the air there is usualiy no external frame of reference, otherthan the structural framework of ones own aircraft, close enough tobe used as described above. One can also see the aspect (to someextent) of the other aircraft by day ot a light (see paragraph 1,1)by aight.
Figures 24 to 28 were prepared by Calvert showing 17 differentsItuatlors, seven in the vertical plane. In these diagrams VA and VB arethe velocities of A and B relative to the air and are constan. duringpilot A's observation of B. Each diagram includes a triangle of
45
KN
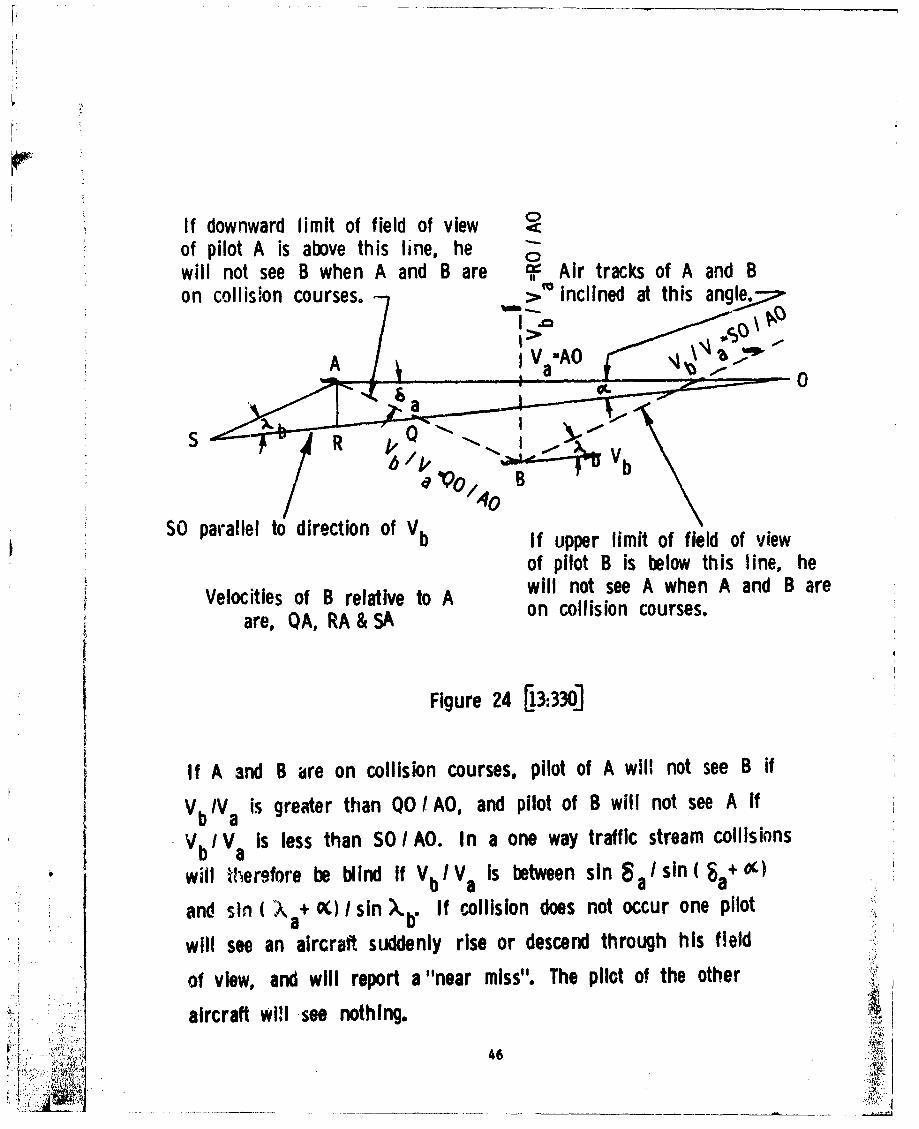
F.:
If downward limit of field of viewof pilot A is above this line, he
will not see B when A and B are ,• Air tracks of A and Bon collision courses. Inclined at this angl•
0
SRQVo%
SO parallel to direction of Vb If upper limit of field of view
of pilot B is below this line, heVelocities of B relative to A will not see A when A and B are
Vel ies of B r e tA on collision courses.are,, QA, RA &SA
Figure 24 [13:330]
If A and B are on collision courses, pilot of A will not see B if
V /V is greater than QO I AO, and pilot of B will not see A Ifb a
V b I Va Is less than SO IAO. In a one way traffic stream collisions
will therefore be blind If Vb I V is between sin 8a sin( a+O)
and sin (X a+ 0.11 sin X. If collision does not occur one pilota I
will see an aircraft suddenly rise or descend through his field
of view, and will report a "near miss". The pilot of the other
aircraft will -see nothing,
Y'A`0.461- . .i. •, ,.
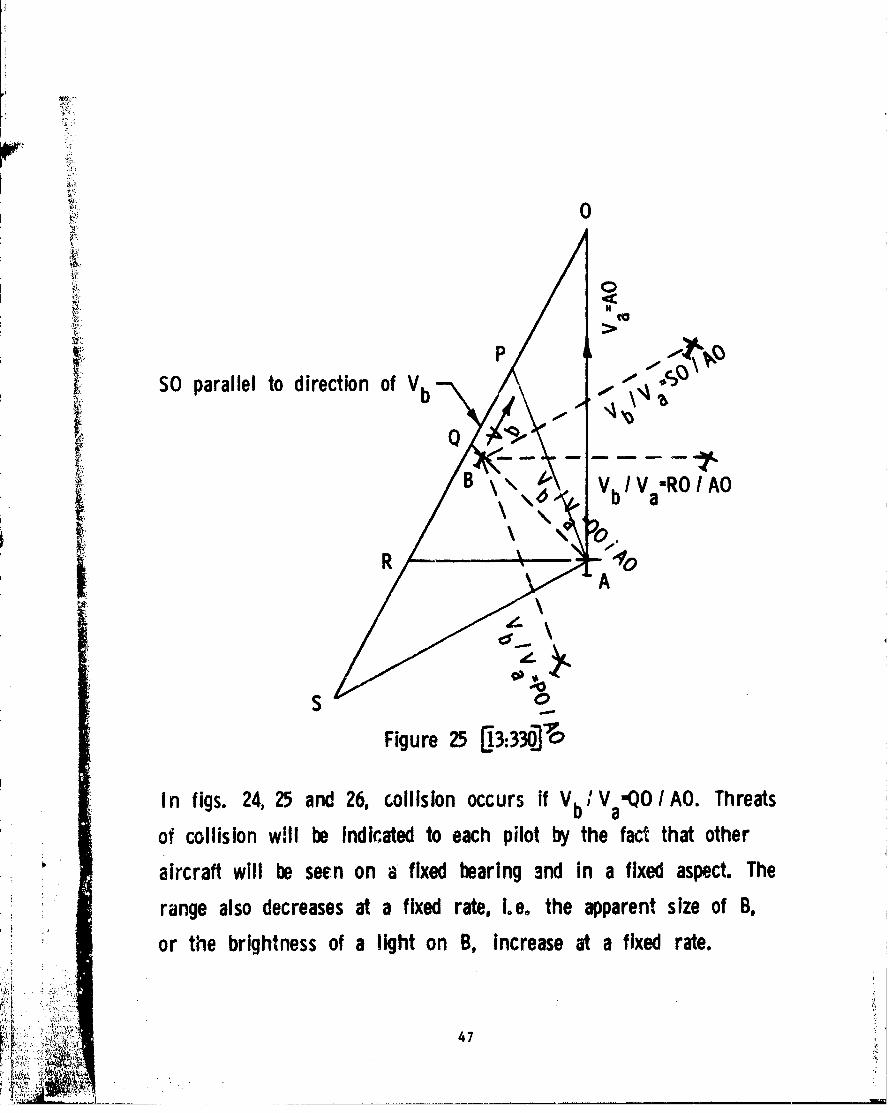
0
>
.•?.
SO parallel to direction of Vb " ,
B\\ Vb /VRO AO
a\ \ ,.
R - --- 10A
S 0
Figure 25 [13:330]'0
In figs. 24, 25 and 26, collision occurs if Vb( Va-QO I AO. Threats
of collision will be Indicated to each pilot by the fact that other
aircraft will be seen on a fixed bearing and in a fixed aspect. The
range also decreases at a fixed rate, I.e. the apparent size of B,
or the brightness of a light on B, Increase at a fixed rate.
47
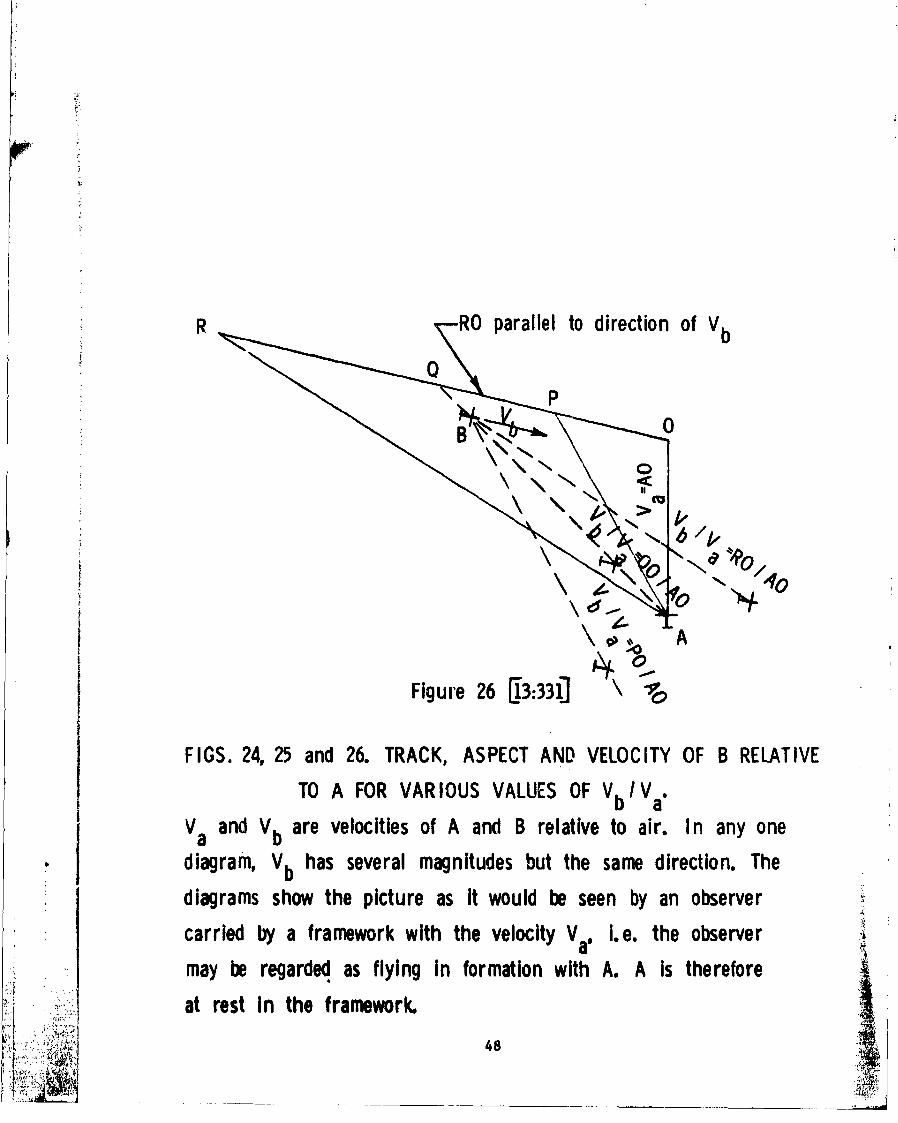
R RO parallel to direction of Vb0b
S~A
Figure 26 [13:331] '•' 'b
FIGS. 24v 25 and 26. TRACK, ASPECT AND VELOCITY OF B RELATIVE
TO A FOR VARIOUS VALUES OF V bVa-
Va and Vb are velocities of A and B relative to air. In any onediagram, Vb has several magnitudes but the same direction. The
diagrams show the picture as It would be seen by an observer
carried by a framework with the velocity V i.e. the observer
may be regarded as flying In formation with A. A is therefore
at rest In the framework.
48
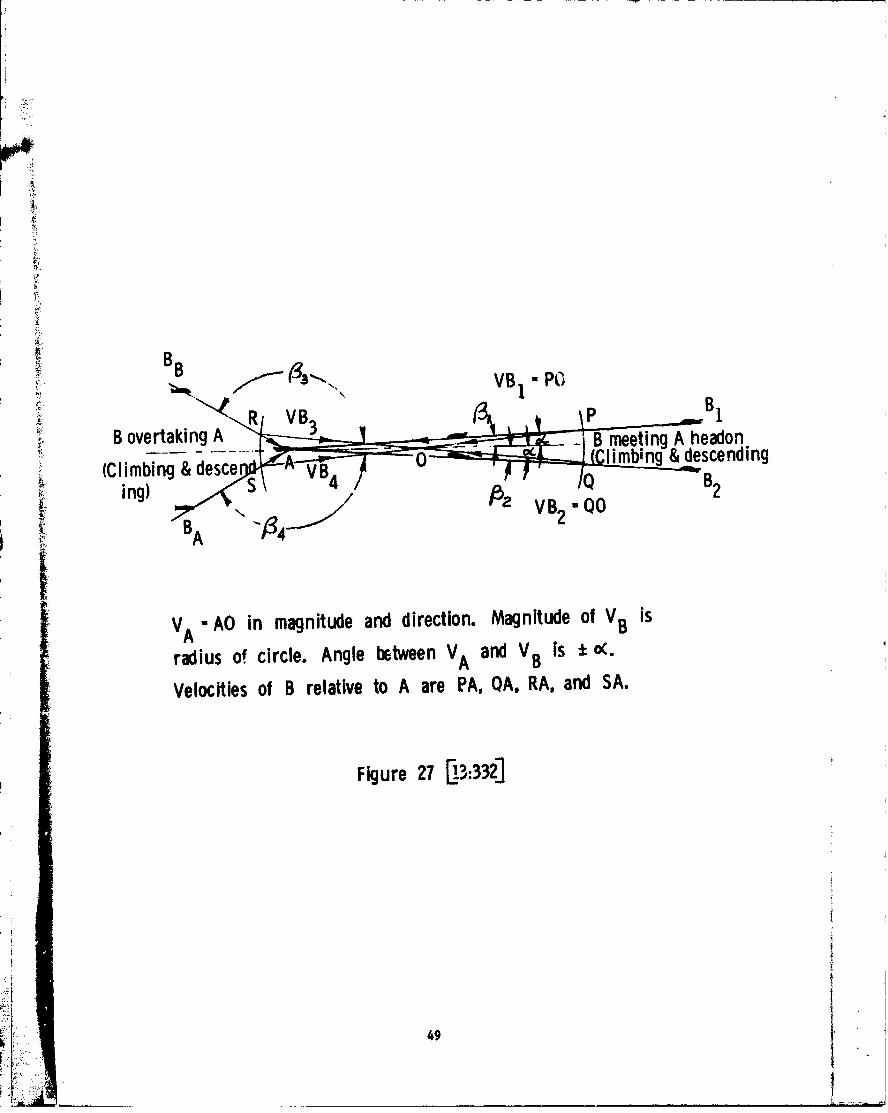
4B
BB
Be i B meeting A hedon
(Climbing & desce AB 0- 1 mbi•g• & desc ' . "gSing) S4QB 2•-i! "•A "',4V " B V2 O°
V A -AO in magnitude and direction. Magnitude of VB is
radius o! circle. Angle tltween VA and VB is ± 0.
Velocities of B relative to A are PA, QA, RA, and SA.
Figure 27 [13:332]
49
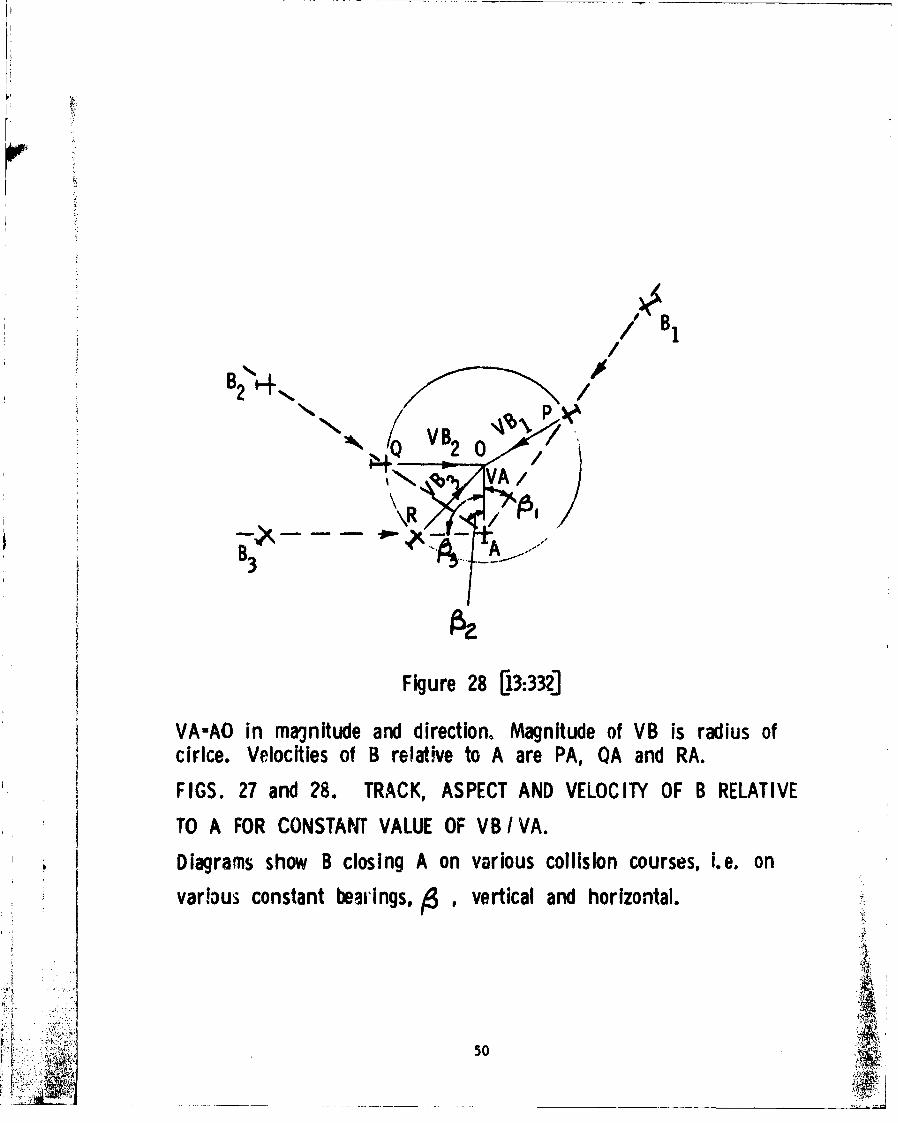
/BB24,'
BB23
TOAFRCNTATVLEO BVA
varicus Vlcnistn ofrigs B reatvertoicarePlQ and hoiznAl.
FIGS 27and 8. RAC, ASECTAND ELOITYOF BRELTIV
r -,
velocities VA being represented by AO in each case. As observerswe see the situations develop as if we were flying in close formationwith A. A is always fixed on the figure as the frame of reference istaken around It and B moves relative to it. In Figures 24 to 26 wesuddenly see B on the bearing and aspect shown (remember as observerswe are m-oing next to A but not in A and are not forced to view fromthe cockpit with its associated visual blockage). The broken linesand the small pictures of B show how the situation would appear todevelop if VB had various values. In Figures 27 and 28 we see B onvarious collision courses with A.
The most important point to see from these diagrams is thatif B is on a collision course with A, the bearing and aspect of Band the rate-of-change of range appear to the pilot of A to beconstant. If A observes B as an unmoving target relative to hisaircraft, then A knows he is on a collision course with B. It isnot, however, a simple task for A to make this determination becausehis observation platform is unstable. This instability will causeall distant objects to have a small periodic motion relative to A'sframe of reference, the amplitude depending on the speed and type ofA's aircraft, and if it is being flown by a human pilot or an autopilot.
Calvert points out, "If the pilot does maneuver, the otheraircraft will immediately appear to move with a large angular velocity,and he will become 'blind' in the sense that he will have no furtherinformation un:il he is again flying on a straight course at aconstant velocity. He, therefore, does not know how long to hold themaneuver, Lut he probably realizes that if, while the other aircraftis at a long range, he begins the maneuver after a short period ofobservation, say less than ten seconds, he will have to hold it fora long time, say 40 seconds, in order to eliminate the risk. If, onthe other hand, he had used a :onger observation time, he mighthave detected angular motion, and not had to maneuver at all. Thesethvee factorN, i.e., confusing indications, bad information, anduncertainty in the time of observation and maneuver, mean that thepilot finds himself in a dilemma which he may not be able to resolvein the saort time available. It is, therefore, no wonder that: he tendsuo hold his course, with the intention of maneuvering only if and whenthe situation appears to be really serious, in which case the maneuverwill be violent. This may be calleO 'the technique of #he bull-fightersjump,' and in cases where a high acceleration can be appl!ed withlittle delay, it is probably the most effective technique." (13:331-332]The "technique of the bull-fighters jump" was apparently being usedby the subject pilots in the "small" aircraft visibility flight test(paragraph 2.5.4.2) described earlier.
V 51

2.6.2 USE OF GEOMETRIES IN VISIBILITY PREDICTION
Figures 24 and 27 both show examples of a situation in whichaircraft are climbing and decending in a traffic stream. One or bothof theae aircraft may be completely blind to the other. It is a mostdisturbing situation to~ pilots to have another aircraft s~uddenly ariseor descend through their field of view, and nearly all have experiencedit. Here we find another situation in which proximity warning devicesmight be useful, especially if they were to give P' relative bearing toaid in the visual search.
At night the pilot is faced with another problem. Using theunmoving target criteria in determining if he is on a collision course,the pilot finds he is on a collision course with every star. If hemistakes a star for a light on an aircraft (a more common occurrencethan non-flyers would expect) and maneuvers, he will find that thislight is still on a collision course when he resumes straight andlevrel flight. Exactly the same thing iappens if the light is onanother aircraft and the pilot maneuvers too soon for too short a time.
2.6.3 BASIC RELATIONiSHIPS
An interesting paper written by Howell, et al [1414, presentsgeometric relationships relative to collision flight paths in thefollowing four categories:
a. Straight and Level Flight
b. Straight Climb and Decent
c. One Aircraft Turning and Ore Flying Straight and Level
d. Two Aircraft Turning in Savte Direction
The authors found it possible to limit the coverage of thecharts for straight and level, climbing'and descending flight by theassumption of logical limits for the data. However, it was muchmore difficult to establish practical parameters for the turningconditions of flight. The limits for turning flight were establishedfrom recording 250 flight paths of aircraft in the vicinity of airports.The collision cases presented in this report were designed around theassumption that the aircraft were flying at -3nstant speeds, constantrates of climb or decent, and constant angles of bank during level turns,as these conditions were appl~cable. The authors point out that bynecessity, the collision conditions covered by their report constitute
only a small part of the total number of possible collision cases.
52
The report by Calvert [131 and Howell [141 arle highly recommen't-dfor the reader who wishes to study further the geometric relationshipsof midair collisions. Tt is important to note that problem8 inrelative motion are seldom amenable to coimmon sense since human responsehas been learned relative to the fixed framework of the Earth. If thereis no framework, then habits which have been formed through theeveryday experience of moving about on land must be put aside in favorof the geometric aspects. This is what many people find extremelydifficult because they "know" so many things which are not so. Thisis also why the geometric aspects of midair collision must be studiedso as to mAke clear to all pilots what is actually occurring and todevelop systems which will aid the pilot in making those determinations.
2.7 MIDAIR COLLISION MODELS
Midair collision models have been discussed as a means for predictingthe number of collisions to be expected and as a simulation techniquefor the prediction of the effectiveness of midair prevention systems.The two models which follow were developed by the experimenters studyingthe Near Midair Collision Report Data of 1968 and from the CivilAviation Midair Collision Analysis Data (paragraph 2.3 and 2.2 respectively).The intent here is to show how two data sets were modeled. The followingdiscussion will examine the findings of theme two models and compare them-
2.7.1 ITIE NEAR MIDAIR COLLISION TRAFFIC MODEL (3:App E'-10]
This model resulted in an algebraic expression which relates theexpected number of reported near midair collisions to the air trafficdensity in the terminal area. The derivation was based on theassumption that the near midair collision riskc per aircraft operationis directly proportional to the nimber of aircraft using a fi-.xed volumeof airspace. The expression derived is:
Expected NHAC -K N M where.,0 0
N- Number of annual aircraft operations for group I.0 aircraft (e.g., General Aviation)
M 0- Number of annual aircraft operations for group 20 aircraft (e.g., Air Carrier)
K A proportionality factor which is independent of
Nand M.
The result is an expression of the "square law" wh~ere c - abn an2
can be easily shovu. If we assume that only the two groups use theterminal air space volume, then:
53
n - N + M - total aircraft operations
and since b - 2
c - a (N + M) 2 aN 2 + 2 a N M + a M 2
whore: a N 2 is the term associated with near midairs between twogeneral aviation aircraft (GA-GA).
2 a No No is the term associated with near midairs between ageneral aviation aircraft and an air carrier (GA-AC). This is theterm of interest in the model.
2a Mo is the term associated with near midairs between two air
catriers (AC-AC).
To establish the validity of the model, it was correlated to theactually reported near midair collisions at the 21 large hubs forwhich the study had data. The correlation coefficient was calculatedto be 0.8998. The authors then concluded "...it is possible topredict with some confidence the expected rate of reported 'nearmidairs' by extrapolating the straight line (relationship to higherpredicted densities).. I" "For example, if these operations eachincrease by a like factor, then the expected number of reported nearmidair collisions will "'ncrease by the square of that factor."
2.7.2 THE CIVIL AVIATION MIDAIR COLLISION ANALYSIS MODEL (4:App C]
Inspection of the data from this report also suggested that midaircollision risk increases with airport activity level. Three separateanalyses were performed. (1) A graphical analysis which developed aquasi-continuous curve for the average collision per airport over theeight years as a function of average aircraft operations per airportin CY 1971 (4:App C, Section 3]. (2) A regression analysis whichdevelops an explicit analytical expression for the average collisionsper airport over the eight years an a function of average aircraftoperations per airport in CY 1971 [4:App C, Section 4]. (3) Astatistical analysis which established confidence limits on theexpected number of collisions as a function of aircrart operations,given the observed data, and which tests for statistically significantdeviations between the observed estimate of the expected number ocollisions and the actual number of collinions for specific s8r setsof that data [4:App C, Section 5].
54
The benefit of having the three analyses was that each servedas an independent check on the results of the other two and eachpoint of view yielded useful interpretations of the data and itsimplications.
This model also assumed the square law relationship betweencollisions and operations diacussed in paragraph 2.7.1 above.
2.7.3 COMPARISON OF THE TWO MODELS
Reference 3 13:F-7] Aide these points in comparing the twomodels:
I a. High correlation is not a sufficient test of modelvalidity. The a priori expression assumed f or the near midaircollision traffic model produced a 90Z correlation with theobserved data. It should be noted that high correlation betweena articul~ar theoretical model and the observed data does not
necessarily imply that the "best" model has been found. In fact,with "noisy" data It is possible to get equally good fits with aI wide range of models. Picking a model a priori and declaring itthe "best" without having examined other fits can lead to anerroneous conclusion.
The results of the model developed in Reference 3 were obtainedby deriving the exponent b in the assumed relation c - abfo hdata. The value ranges from "linear" to "square law," depending uponthe particuslar airport category examined.
b. The square law relationship may only reflect the propertiesof an insufficient data set. Both studies identify a "square law"relationship for extremely rare events, based on a limited number ofevents. The relationship of Rteference 3 may be "square law" only inthe sense that it is the best single explanation for zero collisionsat the unbusy airports and non-zero collisions at the busier airports.Doubling the sampling period to 16 years might well produce a different(more nearly linear) result.
c. The "square law" relationships identified In both studiesapply t~o significantly different situations. The results of Reference3 apply to all aircraft within five~ miles and below 2000 feet AGL ofan airport, where that airport. is a member of some subiset of allairports. The model of Referance 4 addresses a definite sub set of allaircraft within 30 miles and below 10,000 feet Qean sea level (MSL) of
- - the larger metropolitan terminal areas.
55
The "square law" explanations developed by both studies torelate (near) collisions to aircraft operations levels should beinterpreted and used with care and with due regard for theassumptions and the data limitations imposed on both studies.
2.8 THE MIDAIR COLLISION PROBLEM AND THE AIR FORCE
As was stated in the preface to this report, the work effortbeing reported was conducted in pursuance of improving aircraftanticollision protection through the use of high Intensity xenonlighting (commonly referred to as Strobe Lights). This section (Section2.0) has tried to highlight the literature search and data analysisperformed in an attempt to "scope" the midair collision problem and todetermine the characteristics required of strobe lights to reducethe midair collision potential.
Examination of USAF Statistics (paragraph 2.1) resulted in thefollowing conclusions:
a. Seventy-six and five-tenths percent of USAF midairs were ofa type which would not be affected by strobe lights (formation andassociated flying).
b. All of the collisions which may have been prevented, hadstrobe lights been in use, occurred when one or both of the aircraft4involve~d was flying VFR. This indicates that human operators cannotperform to the level required by VFR.
c. Eighty-six and nine-tenths percent of all collisions whichray have been prevented had strobe lights been in use occurred duringdaylight flight.
fligd. Midair collisions are concentrated around airfields wherefligactivity' in concentrated. Takeoffs and landing were found to
be significant areas of occurrence as one would expect (in the heartof concentrated operations when aircraft are operating at reducedspeeds, and therefore have less ability to maneuver).
a. Half of all midair collisions occurred belcew 3000 feet AGLas would be expected from d above.
Examination of civil aviation statistics (paragraph 2.2) supportsthe conclusions found above. Tha greatest non-military mide.Lrcollision threat to the USAF appears to be from general aviationaircraft as they were involved in 99.52 of all civil aviation collisions.
56
F'
Large air carriers appear to be the lease likeiy to be involved in an
encounter with USAF aircraft as they generally fly IFR, along wellpublished airways, and conform to published schedules.
The near midair collision data (paragraph 2.3) over emphasizesthe involvemenrt of military and commercial aircraft involved in near
midair colliaiors. This is primarily due to the incident reporting
methods.
Aircraft visibility is primarily deperdernt on the contrast between
the aircraft and its background. Aircraft which are detectable to 14
mlies by an observer could not be found by uninformed scanning pilots
until they were within three to five mIles oi each other. This finding
provides a strong argument for direction indicating proximity warning
indicators. While smaller aircraft could not be del.ected at similar
v. ranges, the ratio between the informed and uninformed pilot remained
approximately the same (i.e., the informed pilot sighting the intruder
4t approximately three times the range of the uninformed).
The study of midair collivirn geometries and midair modeling
techniqULýi hclaO prptaic ,in areas relatad to aLkalysis, simulation,
""id maneuvering soilitions. Development of accurate dynamic models
will allow testing to detarmine which parameter modification will
effect a reduction in midair collisions before large sums are spent
on expensive flight testing.
io
57
Z4

3.0 STROBE LIGHTS
3.1 THE "SEE AND AVOID" CONCEPT
Federal Aviation regulations set forth the concept of "see andavoid" or "see and be seen"as it is sometimes called. This conceptrequires all pilots to maintain a vigilant lookout for other air,ý.raftthereby avoiding midair collisions and applies to all aircraft flyingvisual flight rules as well as those flying instrument flight ruleswhenever weather conditions permit.
Aircraft lighting has been provided to allow implementation ofthe "see and avoid" concept during hours of darkness (when the aircraftsilhouette is not visible). As pointed out in Section 1.3 lightingsystems have historically been designed to address the collisionavoidance problem relative to nighttime uee. The development of highintensity lighting as exemplified by strobe anticollision lights isan attempt Lo expand the useful range of the lighting aided "see andavoid" concept into the dawn-dusk and even the daytime problem.
In the sections that follow we will examine the theoreticalperformance of strobe lights, some actual strobe light testing, andproblem areas associated with strobe art.icollision lights.
3.2 THEORETICAL PERFORMANCE
3.2.1 SEEING LIGHTS - BASIC PRINCIPALS
Light is radiant energy that san be senaed by the human eye.Radiant energy, like any other form of energy, is measured in ergs
in the c.g.s. system and jouleb in the m.k.s. system. These unitshave a corresponding series of radiometric concepts listed in Table 7.Unfortunately, the quantities listed in Table 7 are not a measure oflight. This is because the sensation of brightness is not a linearfunction of the amount of radiant energy received by the eye. Figure29 shows the relative spectral luminous efficiencv vs wavelength asseen by an average observer. The fact that visual response is beingevaluated has led to the divelopment cf photometry. In photometry,the eye itself is used A3 the sensor with the observer Lomparingthe brightness of the light source being meaoured to a known standardlight source. Photometric concepts are psychophysical in nature andare listed in Table 8.
Photometric units are arbitrarily based an the internationalcandle, originally an actual sperm caadle weighing one-sixth poundand burning at the rate of 120 grains of wax an hour. The new candleor candela was adopted in Graat Britain and in the United States on
S .,58
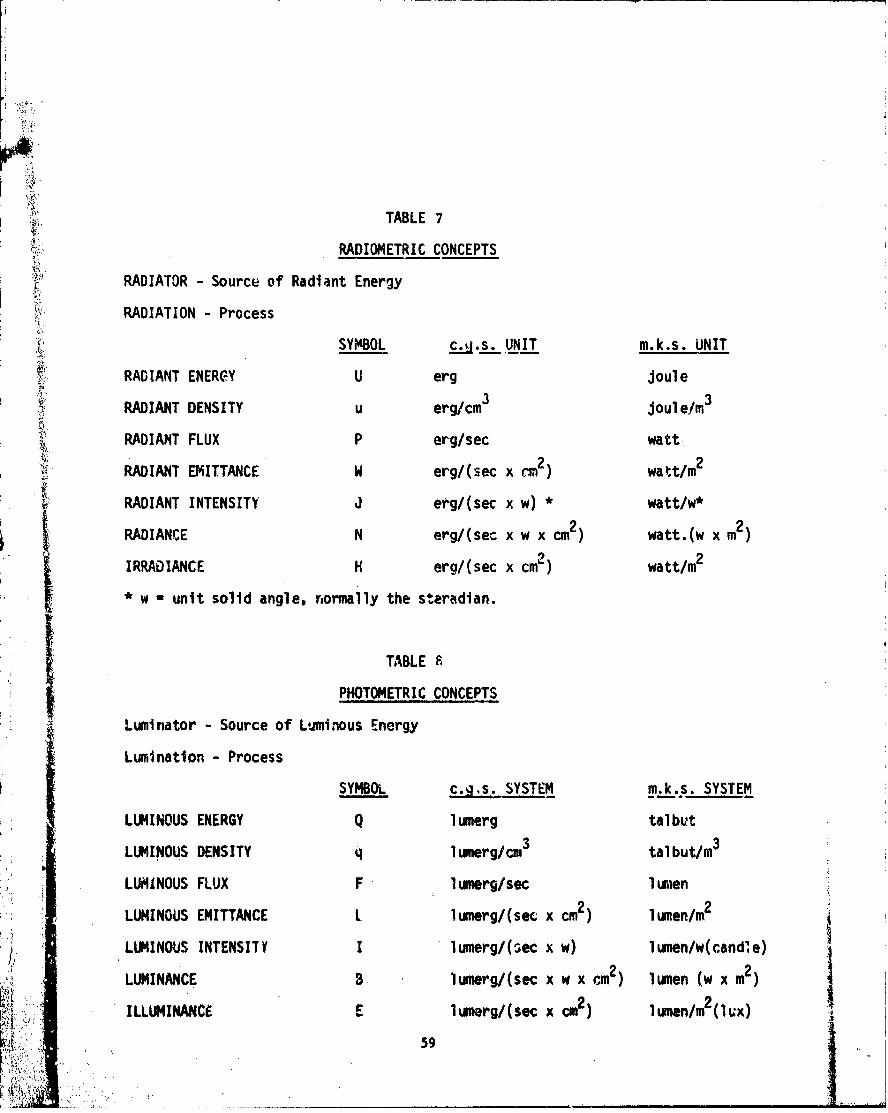
TABLE 7
RADIOMETRIC CONCEPTS
RADIATOR - Source of Radiant Energy
RADIATION - Process
SYMBOL c..j.s. UNIT m.k.s. UNIT
RADIANT ENER-Y U erg joule
RADIANT DENSITY u erg/cm3 joule/rm3
RADIANT FLUX P erg/sec watt
RADIANT EMITTANCE W erg/(sec x ri2) watt/m2
RADIANT INTENSITY J erg/(sec x w) * watt/w*
RADIANCE N erg/(sec x w x cm2) watt.(w x m2 )
IRRADIANCE H erg/(sec x cm') watt/mr2
• w * unit solid angle, normally the steradian.
TABLE R
PHOTOMETRIC CONCEPTS
Luminator - Source of Luminous Energy
Luminatlon - Process
SYMBOL c.g~s. SYSTEM m.k.s. SYSTEM
LUMINOUS ENERGY Q lumerg talbut
LUMINOUS DENSITY q lumerg/cm3 talbut/m3
LUMINOUS FLUX F lumerg/sec luimen
LUMINOUS EMITTANCE L lumerg/(sec x cm2 ) lumen/mr2
LUMINOUS INTENSITY I lumerg/(sec x w) lumen/w(candl e)
2 2LUMINANCE B. lumerg/(sec x w x cm) lumen (w x m)ILLUMINANCE E lmrg/(sec x cm2) 1uman/m 2 (l ux)
59
V I2
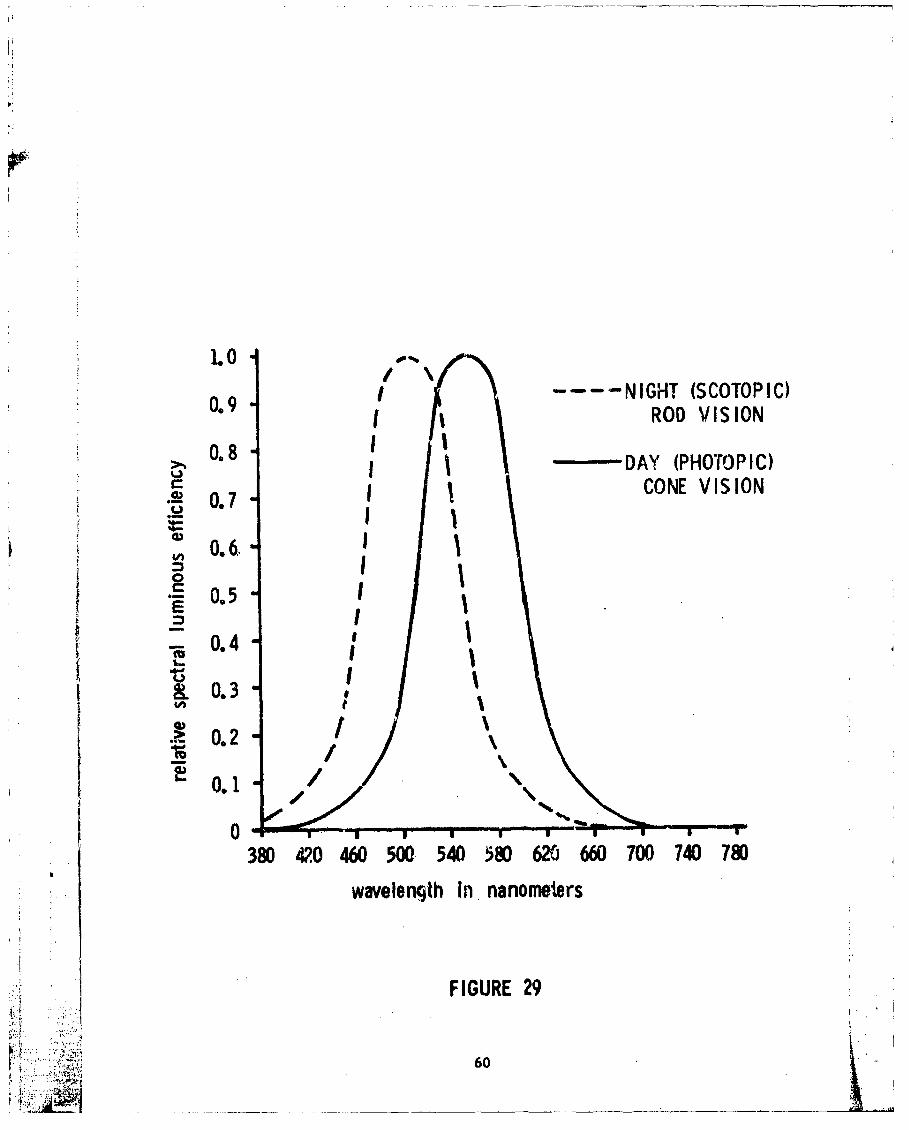
1.0
0.9 /- "----NIGHT (SCOTOPIC)0.9 ROD VISION
S . j - ....DAY (PHOTOPIC).• 0.7- I CONE VISION
0.6.
*[ 0.5 -_ 4
- 0.4-
.~0.21
. /
0.1 N
380 42.0 460 500 540 580 620 660 700 740 780
wavelencjth In nanometers
- • FIGURE 29
60
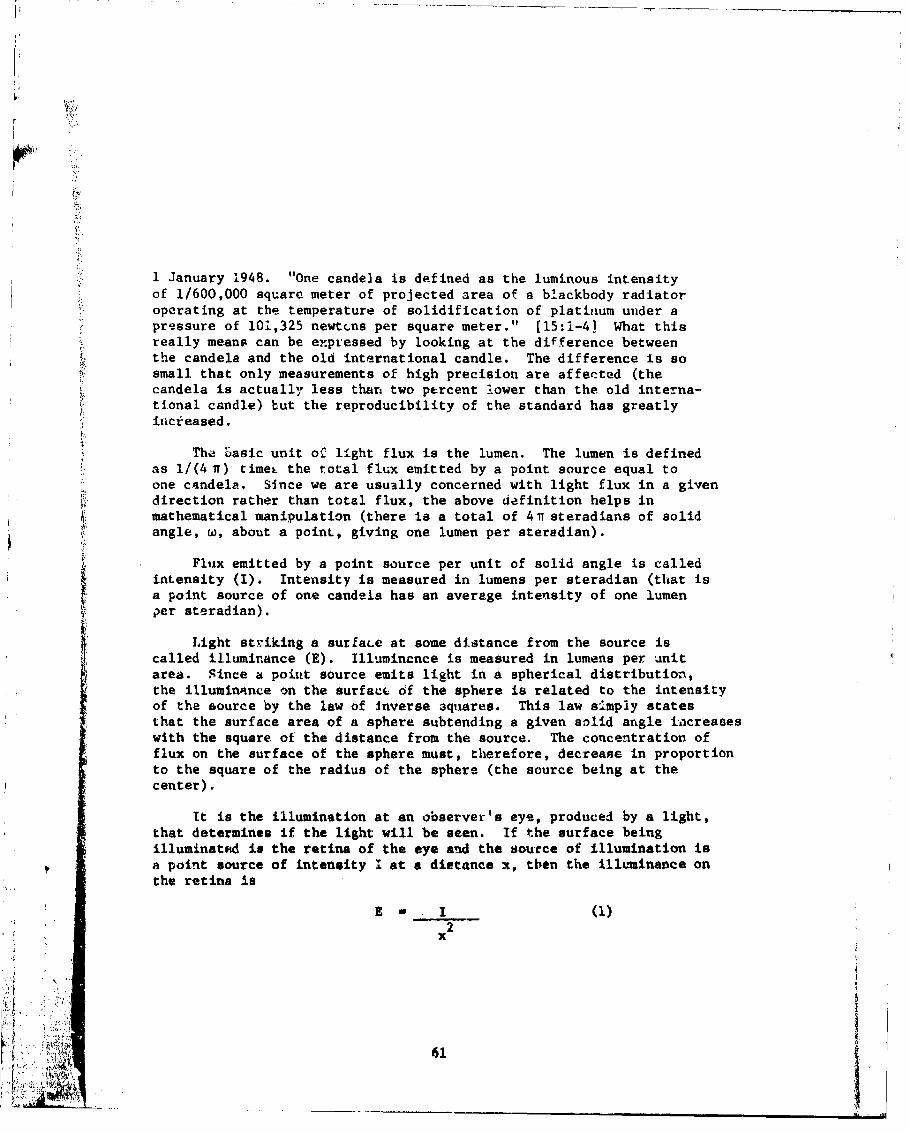
1 January 1948. "One candela is defined as the luminous intensityof 1/600,000 square meter of projected area of a blackbody radiatoroperating at the temperature of solidification of platinum under apressure of 101,325 newtcns per square meter." (15:1-4] What thisreally means can be expressed by looking at the difference betweenthe candela and the old international candle. The difference is sosmall that only measurements of high precision are affected (thecandela is actually less than two percent lower than the old interna-tional candle) but the reproducibility of the standard has greatlyincteased.
The basic unit of light flux is the lumen. The lumen is definedas 1/(4 T) timeL the total flux emitted by a point source equal toone candela. Since we are usually concerned with light flux in a givendirection rather than total flux, the above definition helps inmathematical manipulation (there is a total of 4T steradians of solidangle, w, about a point, giving one lumen per steredian).
Flux emitted by a point source per unit of solid angle is calledintensity (I). Intensity is measured in lumens per steradian (that isa point source of one candela has an average intensity of one lumen
S~per steradian).
Light striking a surfate at some distance from the source iscalled illuminance (E). Illuminence is measured in lumens per unitarea. Since a point source emits light in a spherical distribution,the illuminance on the surfacc of the sphere is related to the intensityof the source by the law of Inverse squares. This law simply statesthat the surface area of a sphere subtending a given solid angle increaseswith the square of the distance from the source. The concentration offlux on the surface of the sphere must, therefore, decrease in proportionto the square of the radius of the sphere (the source being at thecenter).
It is the illumination at an observer's eye, produced by a light,that determines if the light will be seen. If the surface beingilluminated is the retina of the eye and the source of illumination isa point source of intensity I at a dietance x, then the illuminance onthe retina is
:Em I (1) ;••
i'"1 '
" .7-41
S. .-,
Light source visibility can be conveniently defined in termsof the threshold illumination produced at the observer's eye undera given set of conditions. Threshold is defined as "the value of aphysical stimulus that permits an object to be seen a specificpercentage of the time or at a specific accuracy level. In manypsychophysical exneriments the thresholds are presented in terms of50% accuracy of ac'curately 50% of the time. However, the thresholdalso is expressed as the value of the physical variable that permitsthe object to be just barely seen." [15:1-20] Threshold forlighI sources is determined by many physical and psychological factorssuch as:
a. The source intensity, size and shape, color, movement,and distance from the observer.
b. Luminance of the background.
c. The atmosphere.
d. Backscatter.
e. Other sources in the field of view.
f. Optical quality and location of intermittent mediums (glass,plastics, etc).
g. The portion of the observer's retina on which the sourceimage impinges.
h. The observer's adaptive state, physiological environment,
individual visual capability, alertness, and search habits.
i. Diotractions diverting the observer's attention.
Threshold illumination, Eo, has been the subject of many investi-gations with results that vary over an extraordinarily wide range.This variance is due in part to the considerable variability amongindividual observers in any experiment as well as in any observerfrom one experimental session to the next. Another source of variationis the uncertainty of the criteria used to determine threshold. Thresholdjudgements by observers are largely subjective and are affected significantlyby the instructions they receive as well as by the design of the experiment.
Threshold illumination for point-source lights observed againstdark backgrounds with a high probability of being seen under favorableconditions was found to be 0.01 mile-candela. [16:480] (The illumination
62
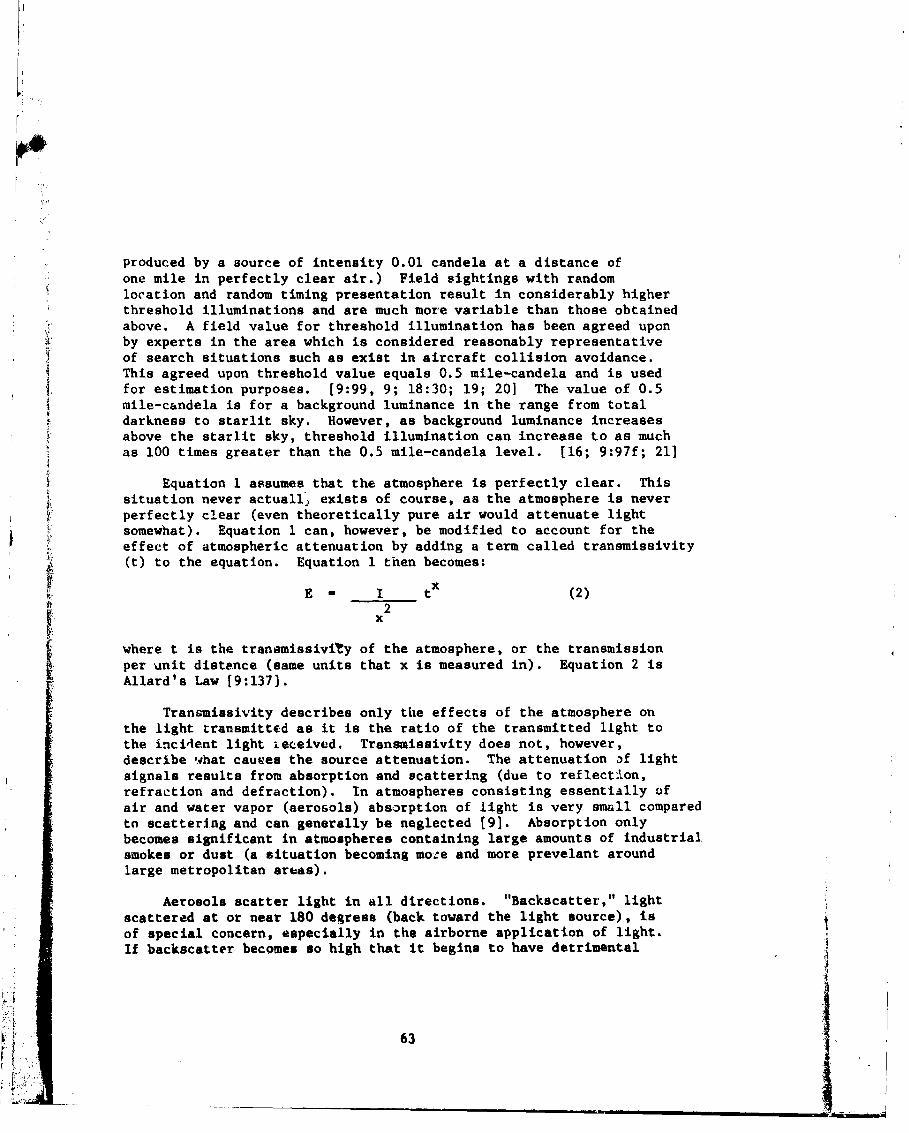
produced by a source of intensity 0.01 candela at a distance ofone mile in perfectly clear air.) Field sightings with randomlocation and random timing presentation result in considerably higherthreshold illuminations and are much more variable than those obtainedabove. A field value for threshold illumination has been agreed uponby experts in the area which is considered reasonably representativeof search situations such as exist in aircraft collision avoidance.This agreed upon threshold value equals 0.5 mile-candela and is usedfor estimation purposes. [9:99, 9; 18:30; 19; 20] The value of 0.5mile-candela is for a background luminance in the range from totaldarkness to starlit sky. However, as background luminance increasesabove the starlit sky, threshold illumination can increase to as muchas 100 times greater than the 0.5 mile-candela level. [16; 9:97f; 21]
Equation I assumes that the atmosphere is perfectly clear. This4 situation never actuall) exists of course, as the atmosphere is never
perfectly clear (even theoretically pure air would attenuate lightsomewhat). Equation 1 can, however, be modified to account for theeffect of atmospheric attenuation by adding a term called transmissivityWt) to the equation. Equation 1 then becomes:
E- I t (2)2
x
where t is the transmissivity of the atmosphere, or the transmissionper unit distance (same units that x is measured in). Equation 2 isAllard's Law [9:137].
Transmissivity describes only the effects of the atmosphere onthe light transmitted as it is the ratio of the transmitted light tothe inci4ent light ieceived. Transmissivity does not, however,describe what cauves the source attenuation. The attenuation af lightsignals results from absorption and scattering (due to reflection,refraction and defraction). In atmospheres consisting essentially ofair and water vapor (aerosols) absorption of light is very small comparedto scattering and can generally be neglected [9]. Absorption onlybecomes significant in atmospheres containing large amounts of industrialsmokes or dust (a situation becoming mo:e and more prevelant aroundlarge metropolitan areas).
Aerosols scatter light in all directions. "Backscatter," lightscattered at or near 180 degress (back toward the light source), isof special concern, especially in the airborne application of light.If backscatter becomes so high that it begins to have detrimental
63
effects on the pilot, he will be forced to turn off his anticollisionlight leaving his aircraft without anticollision protection in apoor visibility situation, wheni it is most needed. The detrimentaleffects of backscatter include:
a. Reduction of light signal visibility on other aircraftdue to an increase in the background luminance against which theyare viewed.
b. Loss of dark adaptation at night resulting in reducedability to detect other sources in the field of view.
c. Disorienting effects caused by flashing lights. It shouldbe noted that this problem creates differing effects depending on howthe flashing is created. Rotating beacons can have different effectsthan electronically flashed (on-off) lights.
Bickscatter intensity is proportional to the intensity of thesource that causes it. Obviously, as the intensity of an anticollisionlight is increased a proportional increase in backscatter can beexpected. As higher intensity lights are proposed for design into anairframe backscatter minimization becomes a more important designfactor. Backscatter can be minimized in a number of ways:
a. Maximum lateral separation of the pilot from the light source.Wing tips then are the most favorable location for forward projectinglights.
b. Maximum longitudinal separation of the pilot from thelight source. This will not result in a great reduction in backscatteras will lateral separation, but distance from the source does result ina reduction in the luminous flux density (inverse square law). Fuselagelights should therefore be mounted as far back from the cockpit aspossible.
c. Sharp cut off of the intensity distribution inboard coupledwith lateral separation. This will result in low backscatter bright-ness in the area directly forward of the cockpit, while allowing highintensity forward for intruder aircraft.
Using Equation 2 then, it should be possible to generate curveswhich will pr dict the distance (D) that a light of intensity (I) maybe observed vb the transmissivity (t). The threshold illuminationrequired at the eye for varying background brightness has been determined
64
0-1

in the laboratory and has been published [15:3-351. Threshold
illumination E0 can then be used to rewrite Equation 2:
0 tD (3)D 2
The following four sets of curves were generated with the laboratorydetermined threshold illumination value multiplied by a factor of
five. This assumes that the observer is always alert and carefully"searching for the target [22:177). If the light is viewed against anon-uniform background or the observer is not alert, the thresholdvalues should be multiplied by factors of 100 to 1000 (23:785]. Thebackground against which an aircraft anticollision light may be viewedcan vary from 10-5 to 104 footlamberts (15:3-36 Fig. 3-50].
As an example, with a background luminance of one footlambertthreshold illumination is one mile candela. As above, this factoris multiplied by a factor of five. Eo then equals five mile candela.Figure 30 is a plot of these conditions. Using Figure 30 to continuethe example we find that a light source of 3500 candela with anatmospheric transmissivity of 0.7 should be detected up to seven miles.
With an atmospheric transmissivity of 0.07 the same source would bevisible up to 1.59 miles
Figures 31 through 33 are plots for lights of the same intensityas Figure 30 with the background luminance equal to 10, 100, and 1000footlamberts respectively. Obviously as E. increases a constantintensity curve shifts left (toward decreasing D) as D is the onlyvariable to adjust the right side of the equation. Since t is alwaysless than one, both terms containing D (D' and tD) drive the rightside of the equation down with increasing distance.
3.2.2 FLASHING LIGHTS
Flashing lights are used extensively as signals and warningsbecause this characteristic is supposed to make them superior inattracting attention. Because of this characteristic, flashingbeacons were established as the required lighting for anticollisionlights. Beacons can be made to flash several ways. These includerotation (reflectors or source), flashing incandescent, and gasdischarge (strcbe for example).
When a light signal consists of separate flashes, the maximumintensity during the flash must be greater than the intensity of astudy light to have the same apparent intensity. Flashing lights
65

E 5 Mile CandelaC)DAWN-DUSK CONDITIONS
Background Luminance 1 ft.-L (Approximate)1.0. ;JL:
VERY CLEAR L,.:ill; ll;:!I,;l .:I: :J ! ll 1;:iJ14: :11 iýg H I Ifit: I I10 MILES CLEAJt 1ý'Iljilj I
I l4itilA7 144 411 -1 1,::! "Tit i it 1: t j t i:1
:A I I ;, ll I lw :;ý; I ;.: :it I --5 MI ES LIGHT HAZE iffiV I Itill 11HU-i -i I i I ;.J tL,:t::ii H:!!ý- A1 111-13 J-4 1. 1., UUý14ý 11
0.5L ý111 ý ýiiw l ;t 1!!11!.ý I;illli'. IFL
1W-4 T ttll-il H it I I I i 11 13 1 i HE! i 11, t! i
ý :it 11tj j!1
tdIII t 4!I hl ITI r ýi :I-
tT-J!II lit M.
a;till! !l;I!H !;P l 14:
HAZE2 MILES
it
t.i
I 'JiliIii: i t
JJ
: 1! t LtVt tr0 1. -.til lit j. 1,
t
fi iTr 77 11ý7
4ý. . -. Q .ý1 MT - -. Cj-U Pit,
1111 ti : tý C? 0 -T
T; H ;1i"I"11 Itfit f- ij
4 lip Q
70.0. MILE THIN F --
is
.7' !1;, t`
46 .
I..
N, 4-
-1 4.1
H ýfT-1
R, WN,
Meterologi alOptical Range
tillH ill0.01o.1
0.5 5.0 3.0
D - DISTANCH(MILES)
FIGURE 30. 66
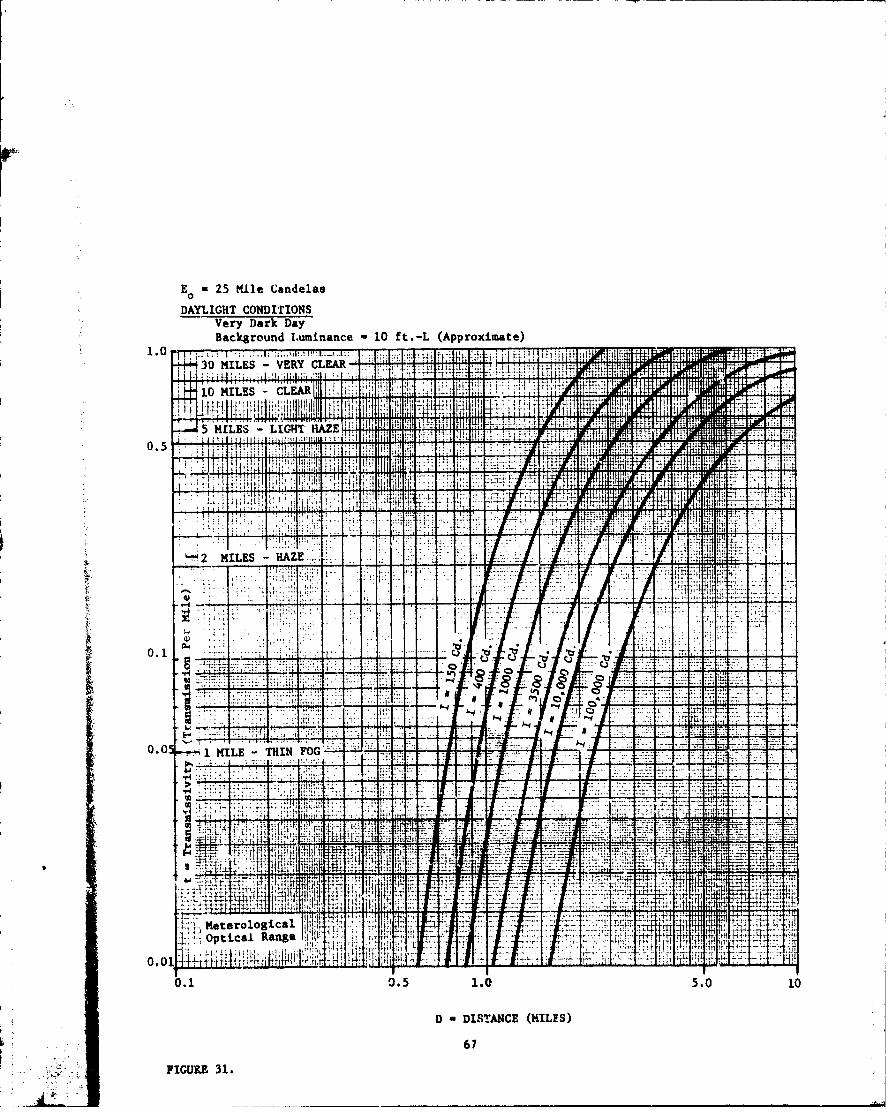
E0 25 Mile Candelas
DAYLIGHT CONDITIONSVery Dark DayBackground Luminance 10 ft.-L (Approximate)
1.0 off_i6'mILES - VERY CLEAR
fl:
3,: 44-q; Ifit i I 1.ý f
1111 ILI 1 tL i.MILES LIGRT E . --1 Ili
o. i 04 ME, IMt. TH!
Al if ... ...t4l' H4 j
it
v E4.L -
-P1,
-:2 MILES - HAZE:,.,+':
n
0.1 _f, 7Cj
rvý, ý a , - ,_+4.- - nORO
0 05 1 MILE IN FOG
44 -4 _7>41 T- ::1-,
1, th
1-J Pit C
zzzz
Tt44;":
.4; 7;i- T
I; j _J- if
Meterological I.il" .7 7ýt r
optical Range J!i4jji! PIT
J;;
0.01
0.1 0.5 1.0 5.0 10
D DISTANCE (MILES)
67
FIGURE 31.
E 250 Mile Candielas
DAYLIGHT CONDITIONSBackground Luminance =100 ft.L. (Approximate)
1.0 Overcast Day or Dull Fog
30 MILES -VERY CLEARh ......
-10 MILES -CLEAR 1
5 IES -LIGHT HAZ
-2 MILES -HAZE4
L¾ 177 ".1.. -4
0.01 1 MILE THIN FOG
o116 IN Pj1 IUI{
D4 14
DITAjC ( IL S
i4(UR 32 6811
E 2500 Mile Candelas
DAYLIGHT CONDITIONS:Background Ltuminance -1000 ft.-L (Approximate)
Clear Sk) or L4ght Fog
V__ -P- 0 MILES
- - - - RYCLEAR
J:0MILESS
- CLEAR
-.. .. H ILES -LIGHT HAZE
0.5,
2 MILES -HAZE.
02
j1 -9
O¶w w~i-;A 1 ~~
I L~1 I {;4~ ~ l'~U01 44501
12-- MIL DITNE HL0. G C -!T-IN FO
FIUR 7rt
are usually evaluated in terms of Effective Intensity, IE, theintensity of a steady light which appears equally bright whenviewed at threshold and is expressed in Effective Candelas.
The current Air Force specification for anticollision lights(as well as FAA Airworthiness requirements) uses the followingequation, known as the Blondel-Rey equation (24] tor the computationof the effective intensity of flashing lights:
t 2IE I(t) dt
t_ _ _(4)
0.2 + (t 2 - t
where IE - effective intensity
1(t) - instantaneous intensity as a function of time
t 2 -t 1 - flash duration (seconds)
The maximum computed value of 1E results when t 2 and tl are chosensuch that 1(t) - IE at t1 and t2 (25], For flashes with a significantlyshort duration compared to 0.2 seconds, t2 - tj becomes insignificant(strobe light for one) and the total flash is integrated. Equation (4)then becomes
t2- 5 2 I(t) dt (5)E Ll
It should be noted that while Blondel and Rey use a constantof 0.2 in their equation for IE (equation (4) above), otherexperimenters have supported their findings but with varying valuesof the constant. One experimenter [26] in a review found valuesranging from 0.055 to 0.35 second. The specific value of this constantvaries with such things as background luminance, pulse length, pulseshape, time between flashes, just to name a few. While the debate overthe most appropriate value for the constant rages on, the need forcontinuing engineering development of flashtng, light systems also exists.The engineer's approach may seem heresy to scientists but it seems moreimportant for us all to adapt a consistent, almost empirical, relationthat is "near enough" than to find the most accurate relation for eachtype of signal. A value of 0.2 has been adopted as the conventionalvalue for the constant in the Blondel and Rey relationship (equation (4)).
70
This value has the merits of simplicity, wide acceptability, and for
nearly every application, the prime advantage of "near-enough-ness."
3.2.3 THEORETICAL PERFORMANCE Ot' STROBE LIGHTS
Strobe light performance can be predicted using Equation (3)with I - IE as found in equation (5). The flash duration of strobelights is sufficiently short so that the t 2 - tI term in equation(4) ray be ignored and equation (5) may be used for calculation of1E. Performance of strobe lights is then found by:
- = "JLtD (6)
Figures 30 through 33 then, provid,' actual values for the expectedpetformance since the only change to Equation (3) is the method offinding one of the terms and not that of terms numerical value ine quat-.on (6).
3.3 EARLY TESTS
3.3.1 B-52 TESTS
The first dr..imented Air Force tests were conducted on a B-52ai'craft in 1957. Tht -e anticollision light systems were tested.The three test lighiting eystems were:
a. Grimes Rotating Beacon. Three Crines Rotating Beaconswere installed on the aircraft body, two beacons 16 Irches on eitherside of the aircraft centerline on the upper surface at body station1324 and one beacon installed on the aircraft centerline on the lowersurface at body station 1230. The upper lights were installed off thec,enterline so that ýne or both woul.d be visible frcm directly behindthe Pircraft. Each beacon contained two 40 watt bulbs which rotatedat approximately 60 RPM inside a red colored glass ,'ame. Thus theGrimes b3acon had a flash rate of 120 per minute.
b. Atkins Strobes. lhw Atkins strobe lights were installedon the aircraft centerlive, the uppar unit at body station 500 and thelower uait -* '-tcoy wtation 1300, Each unit containe4 four dischargetubes ilium. Ing four sectors paral3el tLu the lor.gitudinal andlattral axes ut %he aircraft. Each tube 'roduced a sufficiently wide
'A.• ,71.

cone of light to overlap adjacent sectors and to be seen above andbelow the aircraft horizontal plane. The flash rate was 160 perminute for the forward light, 80 for the tide light, and 40 for theaft light.
c. WADC Exhibit WCLEE 5-70 Anticollision Lights. This lightsystem consisted of a total of 19 individual 40 watt incandescent lampsinstalled in groups on the aircraft. These groups were located asfollows:
(1) Two groups consisting of four bulbs each werelocated in the ieadirg edges of the wings near the wing tips. Theselights flashed at 150 flashes per minute. The lamps were coveredwith a transparent fairing flush to the leading edge of the wings.
(2) A group of three lamps was installed in the trailingedge of the left wing tip. The lamps were covered by a streamlineplexiglis fairing which protruded above the wing surface at the trailingedge. These lights were directed behind the aircraft.
(3) A group of eight lamps was installed in the fin forwardof the spar. Four lamps were directed to the left and four to theright of the fin. These lamps covered the side areas and were flashedat 50 flashes per minute.
A RC-97E was used as an observation aircraft on a flight fromBoeing Field south to Portland, Oregon and back to Boeing Field.Various courses were taken to avoid cloud formations and to iet updifferent positions relative to th- B-52. Test pasbes wer( inductedat altitudes varyiag from 3,000 fect to 12,000 feet. Head-un approach,overtaking from the rear, and various side approaches were examinedwith each type of anticollision light.
Grimes rotating beacons were selected by the evaluation team asthe best system presented. The Atkins strobe lights were rejectedbecause their reflections caused visual interference in the cockpitand like the WADC system, the flash characteristics were not consideredof value in providing direction of flight information.
3.3.2 AIR rRAINING COMMAND TESTS OF 1958
The Air Training Command (ATC) conducted flight tests to comparestrobe anticollision lights with incandescent anticollision lights in1958. The, tests were conducted on T-33A aircraft. Four variations
72
of two basic anticollision lighting systems were made available for
this test. They were as followti:
a. Beacon Types.
S(1) Grimes white light consisting of two counterrotating '-eacons, one located on the top and one located on thebottom of the fuselage.
(2) Grimes red light consisting of two counterrotating beacons, one located on the top and one located on thebottom of the fuselage.
b. Strobe Types.
(1) Madsen lights consisting of three strobe typelights on each side of the aircraft firing in rapid sequence fromaft to forward thus giving the appearance of a moving streak oflight in the direction of the aircraft motion.
(2) Atkins lights consisting of four strobe lamps
flashing at different rates in different zones around the aircraft.
The ATC tests resulted in the following conclusions:
a. None of the anticollision light systems were effective asa daylight anticollision system.
b. All of the systems tested were superior to the standardnight navigation lighting (see paragraph 1.1).
c. For fighter type aircraft a tip tank inntallation ofanticollision lights ippears to be superior to a fuselage installationdue to backscatter.
d. Strobe type lamps are superior to rotating beacons orstandard flashing lamps.
e. The order of effectiveness of the anticollision lightsystems available for this service test was as follows:
(1) Atkins Relative Danger Light
(2) Madsen Aeronautical Direction Light System
(3) Grimes Rotating White Beacon
73
"11

(4) Grimes Rotating Red Beacon
(5) Standard Navigation Lighting
f. All of the anticollision light systems were found tobe mechanically reliable, although the number of hours each of thesystems operated was insu~ficient for the degree of mechanicalreliability to be determined.
As a result of the tests ATC proposed that condenser dischargeanticollision lights be installed on all trainer aircraft as a ClassV modification. This program was turned down by HQ USAF since it didnot meet the requirements for a Class V modification as outlined inAFR 57-4. Houever, HQ USAF stated the lighLs could be installed if aClass IVA modification requirement could be established. In view of thisinformation HQ AMC (now AFLC) verbally stated that approval would notbe given for installation of the condenser discharge lights on alltraining aircraft. This decision was primarily due to the limitedtesting that could be accomplished on the one aircraft equipped withthe requested light. Therefore, an activity at Wright Air DevelopmentCenter (WADC) proposed that a number of aircraft at one training basebe equipped with the referenced lights for tests. The proposal wasaccepted. As a result a project was established to procure 16 lights.Fifteen of these lights were to be installed in aircraft for flighttest. The sixteenth was to be used for laboratory tests. Funds wereallocated, specifications prepared and arrangements made for startingthe project. HQ USAF then directed that AFSC obtain permission fromthe FAA for conducting the tests. That organization refused to grantpermission.
3.3.3 WPAFB TESTS OF 1958
Flight tests were conducted at Wright-Patterson APB in the summerof 1958 on a T-33 aircraft equipped with a condenser discharge light.This was one of the aircraft used by Training Command in the testsreferenced in paragraph 3.3.2 above. Results of the test showed thatthe light tested, though visible for a slightly greater distance indaylight than an incandescent anticollision light, had no significantvalue as a daylight anticollision light. Furthermore, the capacitordischarge light was found to be undesirable in btaze and during landings.
The report recommended that the development of strobe lights asan anticollision measure in daylight and at night with a frequencyindication of direction be discontinued.
74
i .j),i__________ ____
3.3.4 SAC TESTING - 1971 and 1972
SAC began testing of two prototype 800 candela strobe units fromGrimes Manufacturing Co. installed in the upper and lower positions ofan FB-111 in April of 1971. These tests concentrated on using strobesfor collision avoidance and improved visibility for visual airrefueling rendezvous. The test showed general enthusiasm by flightcrews and a preference for the strobes when compared to presentrotating beacons. Tests on B-52 and KC-135 aircraft resulted insimilar general comments.
3.3.5 US ARMY HELICOPTER TEST - 1970 (27]
The UJS Army Medical Research and Development Command publisheda report in January 1971 entitled "The Use of High Intensity XenonLighting to Enhance US Army Aircraft Day/Night Conspicuity." Thisreport presents the in-flight studies performed at Fort Walters TXto compare the effectiveness of aircraft-mounted, high-intensityxenon flash tube lights for increasing the conspicuity of smalltrainer helicopters (TH-55) during both daytime and nighttime flights.
3.3.5.1 GROUND-TO-AIR OBSERVATION SEQUENCE
In the ground-to-sir observation sequence test subjects werelocated on a pinnacle approximately 250 feet high and overlookinga valley (see Figure 34). A three-fourths inch white square on ablack background was used as a fixation target in the center of apartiai circle, the subjects seated approximately ten feet fromthe target and 15 degrees apart. Two subjects (one in front of theother) were seated at each position. The positions of the subjectswere designated at 150 left, 300 left, 450 left, 600 left, 150 right,300 right, 450 right, and 600 right. Right or left referring to thedirection the aircraft appeared to approach the subject. A xenonlight equipped TH-55 and a standard TH-55 aircraft (with the standardrotating red anticollision light operating) approached the pinnaclefrom the east, approximately four miles away, at 50 knots airspeedand 30 feet below the pinnacle. The subjects were instructed to lookonly at the fixation target.
The intensity level on the strobe-equipped TH-55 was changed toone of three different values (1800, 2300 or 3300 E.Cd.) on each pass.The standard lighted TH-55 followed on the same flight path about threemiuutes behind the strobe equipped aircraft. This procedure was usedon the morning of 22 September 1970 and afternoon of 23 September 1970.
K 75V • i j.
Flightpath
AIRCRFT of
SUBJECT Aircraf tFIXj¶ATION TARGET E
B..',LUFFI
\ Side V iew Ns
wClocko Fixation Target
I.I
Left R6Eight
10 ft.
Operator of Fixation Target ElevationFigure 34
Ground-to-Air Observation' Sequence
Al 76
On the last four passes in the aftern~oon session, both aircraft flew50 feet above the pinnacle in order to obtain data on aircraft viewedagainst a sky background.
When each subject could first detect the approaching aircraft,he noted the time on a 12 inch electric clock positioned below thefixation target (to the nearest second) and recorded this on a form.When the aircraft passed directly overhead, one designated individualannounced the time for each subject to record.
Twenty-eight volunteer subjects were utilized as observersduring the conduct- of the experiment. Fifteen of the subjects wererated aviators and the remaining thirteen subjects were WarrantOfficer Candidates who had been selected but had not yet begun theArmy flight program.
On 22 September 1970 the weather conditions at the test siteconsisted of winds 15-18 mph and gusting with scattered clouds. On23 September 1970, because of the effects of a cold front, half ofthe sky was light gray and the other half was clear and cloudless,winds calm.
3.3.5.2 GROUND-TO-AIR RESULTS
Tables 9 and 10 give the results of the experiment where all angle!;and all subjects were considered together. The tables present thefollowing:
a. n -the number of observations.
b. X - the mean value of the time it took from the momentof recognition of the aircraft until it passeddirectly overhead.
c. s - the standard deviation.
d. D - the average increase in distance the aircraft could
be detected by equipping it with a high intensity light.
The result shown., in Table 10 was considered more valid Chan thoseof Table 9 by the Army experimenters. The weather conditions duringthe collection of the data in Tablc 9 consisted of a fairly strongcrosswind that kept the pilots from flying the precise assigned coursewith the result that some erratic responses were obtained.
77
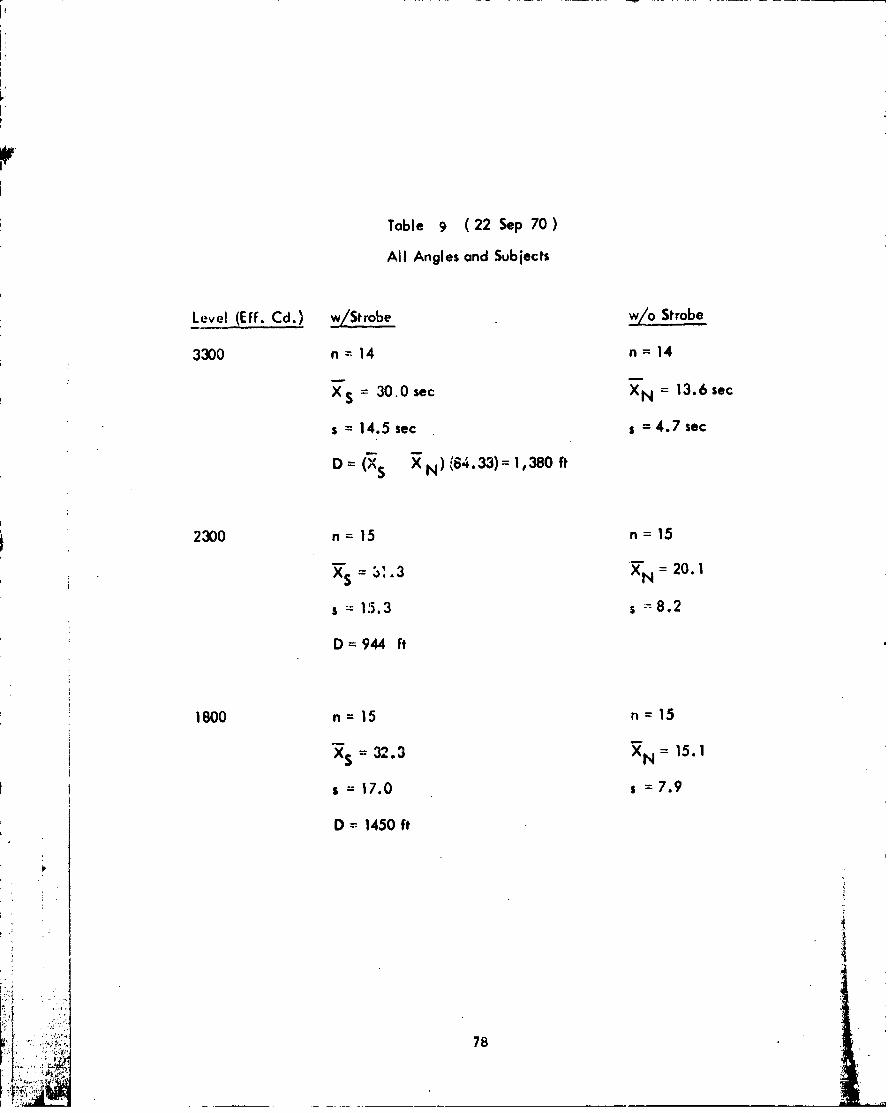
Table 9 (22 Sep 70)
All Angles and Subjects
Level (Eff. Cd.) w/Strobe w/o Strobe
3300 n 14 n= 14
XS = 30.0 sec XN = 13.6 sec
s = 14.5 sec s =4.7 sec
D = (X N XN)84. 3 3 )= 1, 38 0 ft
2300 n= 15 n 15
xs = •'.3 -N = 20.1
s = 15.3 s - 8.2
D=944 ft
1800 n 15 n =15
X = 32.3 XN = 15.1
s =17.0 s 7.9
D = 1450 ft
78
I(

Table lo (23 Sep 7 0
All Angles and Sub i~cts
Level %Eff. Cd.) w/Strobe w/ Strobe
3300 n 48 n = 48
xs 38.69 N = 12.50
s 16.90 =6.02
D =2210 ft.
2300 n 4 8 n 48
XS 29.23 3(=14. 19
s 14.26 s 4.98
D =1270 ft.
180 - 48 n 48
28. 10 X N 1=4.42
s 15.62 ,6.04
D =1150 ft.
79

The results shown in Tables 9 and 10 are independent of thevarious angles. When. the data is considered according to angle,Figures 35 and 36 result. As the experimenter points out, Figure35 presents results that were not expected. He further notes thateach point on the graph is represented by only two or three responses.The large standard deviation now becomes much more important. Itwould be very difficult to draw any conclusions from this data as thesample is much too small.
Figure 36 presents the data of Table 10 graphically by angle.The Army experimenter felt that this data is much more valid as theweather conditions were better and the observers more experienced.Although the experimenter claims to have two to three times as manydata points (four to nine) per point on the graph, the amount is stillfar from sufficient as is indicated by the large standard deviation(about half of X). The experimenter points out that the only unexpectedoccurrence takes place at the 60 0 position of Figure 36. According totheory; the graph of time (X) as a function of angle should show auniform decrease as the angle increases. The experimenter assumes thatsomeone at the 60 0 position is not keeping his eyes on the fixation
0target and hense performing as an observer would at 0 .This sameassumption can be made about one of the observers at the 150 rightlocation. Right and left datR should match, but the data indicatesthat the right 1.50 performs twice as well as the left 15 0 location.
Questions of whether or not the observers were looking at thefixation target and the lack of a large enough sample bring this dataunder serious question.
The above results (Figures 35 and 36) represent data where thehelicopter and light are viewed against relatively dark background,the ground. It must be remembered that for almost every aircraft
i viewed against the ground, there is an aircraft above to he seenagainst the sky. The results of using the strobe at the 3300 E.Cd.level against daytime sky can be seen in Table 11. Very littledifference is apparent in the strobe equipped and nor.-strobe equippedcases. However, there is a large improvement in the visibility ofthe aircraft compared to when viewed against the ground. This is tobe expected since the contrast between the day sky and the strobe ismuch less than that between the strobe and the ground.
TABLE 11ALL ANGLES AND SUBJECTS
(23 SEP 70)3300 E.Cd. LEVEL W/SKY BACKGROUND
W/STROBE W/O STROBEn - 32 n -A31
Xe - 33.5 sec 9. ea -15.4 sec 3. e
K 80
is

ALL SUBJECTS-22 SEPT., 1970
70 ******* 3300
60 - --- 2300
-. - -'1800
~ 5010 STROBE
~30-
20-
10-
0 t A"0 15 30 45 60
Angle Right -Degrees
70-... *000*000960 3300
60- 2300CA e me 1 800
2 50- -.a..muW/O STROBE
40-#
20
10
00 15 30 45 60
Angle Left -Degrees
Figure 35
I 81

ALL SUBJECTS -23 SEPT., 1970
70 *- *... 30
60 a -2300
50 -w..t STROBE
LAO N
20-
10
0I0 15 30 45 60Angle light -Degrees
70-eg.....30
,60 ---- 2300
150 i~~10-W/O STROBM.140-
20
10-
W1530 45 60Angle Left - Segrets
Figure 36
82
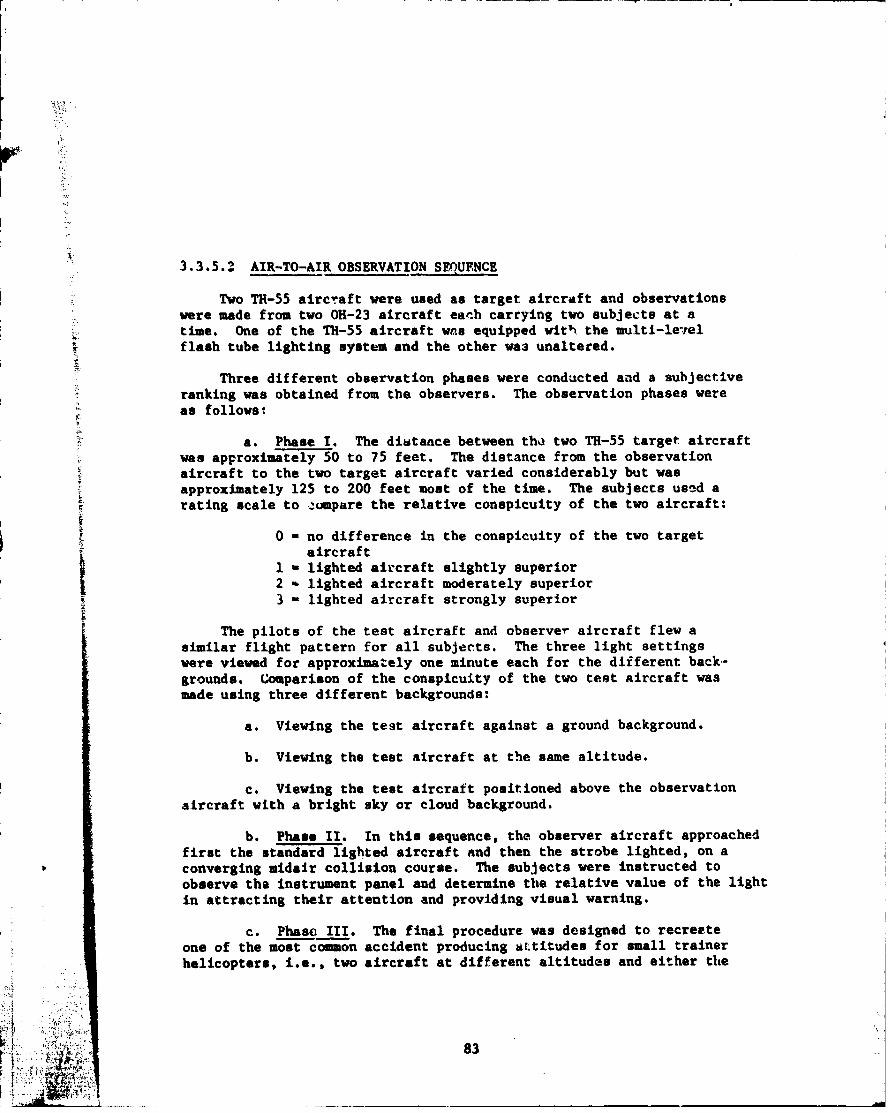
3.3.5.Z AIR-TO-AIR OBSERVATION SEQUENCE
Two TH-55 aircraft were used as target aircraft and observationswere made from two 0R-23 aircraft earh carrying two subjects at atime. One of the TH-55 aircraft was equipped wit'h the multi-le-elflash tube lighting system and the other w&3 unaltered.
Three different observation phases were conducted and a subjectiveranking was obtained from the observers. The observation phases wereas follows:
"a. Phase I. The distance between th• two TH-55 target aircraftwas approximately 50 to 75 feet. The distance from the observationaircraft to the two target aircraft varied considerably but wasapproximately 125 to 200 feet most of the time. The subjects used arating scale to .-umpare the relative conspicuity of the two aircraft:
0 - no difference in the conspicuity of the two targetaircraft
1 - lighted aircraft slightly superior2 - lighted aircraft moderately superior3 - lighted aircraft strongly superior
The pilots of the test aircraft and observer aircraft flew asimilar flight pattern for all subjects. The three light settingswere viewed for approximately one minute each for the different back-grounds. Comparison of the conspicuity of the two test aircraft wasmade using three different backgrounds:
a. Viewing the test aircraft against a ground background.
b. Viewing the test aircraft at the same altitude.
c. Viewing the test aircraft positioned above the observationaircraft with a bright sky or cloud background.
b. Phase II. In this sequence, the observer aircraft approachedfirst the standard lighted aircraft and then the strobe lighted, on aconverging midair collision course. The subjects were instructed toobserve the instrument panel and determine the relative value of the lightin attracting their attention and providing visual warning.
c. Phase III. The final procedure was designed to recreateone of the most common accident producing attitudes for small trainerhelicopters, i.e., two aircraft at different altitudes and either the
aY. r.83r ýt 4
upper descending upon the lower, or the lower ascending into the upper.This was accomplished by having the TH-55 target aircraft fly side byside with a sufficient rotor separation to allow the observer aircraftto fly from behind and below up between them. The object was for thesubjects to maintain fixation on the instrument panel and judge therelative concpicuitv of the lighted and non-lighted target helicoptersas they moved up between them.
3.3.5.4 AIR-TO-AIR RESULTS
The results of the air-to-air observations are outlined in Table12. Phase I results for the rated (R) and nonrated (N) personnelare shown with the target aircraft viewed against a ground background,same level, and the target aircraft above (sky background). Theseobservations were made at all three intensity levels.
Tests for Phase II and Phase III were conducted using the 3300E.Cd. intensity level. The value of this subjective data is question-able but is presented here as collected.
3.3.5.5 NIGHT LIGHTING AND ARMY HELICOPTERS
Two vff-the-shelf white Xenon strobes, each having an output of300 to 400 E.Cd. were tested on a TH-55 helicopter at Fort Walters,Texas by four pilots during all phases of normal night operations.All four pilots agreed that the problem of backscatter was too severe.Light reflecting into the cockpit, particularly during the hover mode,was very annoying.
Two lamps were later obtained each having a red light output of100 to 20C E.Cd. Three pilots at Fort Walters tested this system ona TH-55 and found that the backscatter problem had been solved. Theexperimenters state (without any apparent data) that the visibilitycharacteristics of the red strobe were considerably better than thestandard rotating beacon (of tho same intensity) for three reasons.
a. The light distribution above and below the horizontal-plane was 600 instead of 300, and the loss in light output at theseextremities was 25% versus 90% for the rotating beacons.
b. The rapid flash characteristics of the strobe were moreconspicuous.
c. The strobe lamp radiates a full 3600 with each flash, ratherthan the sweeping motion of the beacon. It must be noted that thesecomments are the subjective opinion of the experimenter as no test was
84
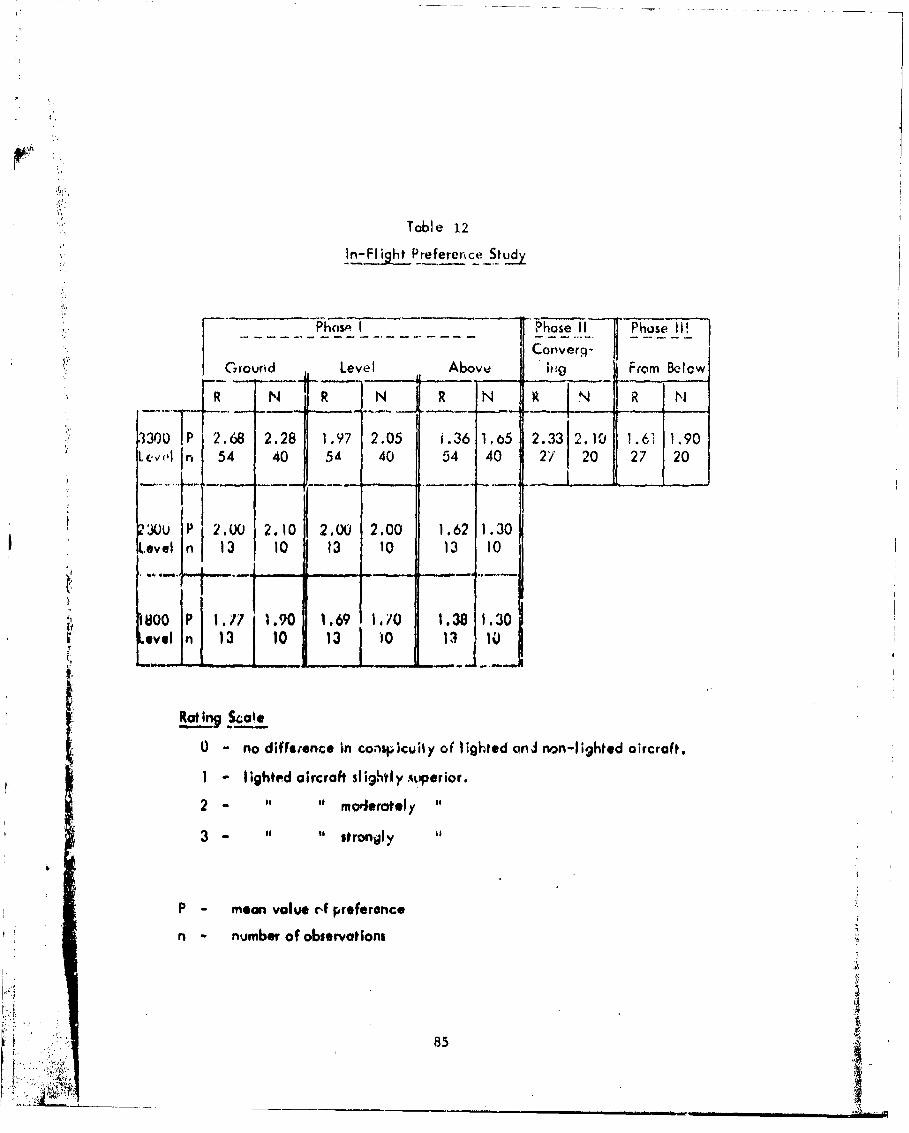
"Toble 12
In-FlIght IPreference Study
Phos'. I Phose II Phase t!
SCortverq-.SGround Level Above iw From Below
R N R N R N R IN R N
13-300 P 2.68 2.28 1.97 2.05 i.36 1,0 2.33 2.10 1.61 1.90L L.1 54 40 54 40 54 40 2/ 20 27 20
•u ~2. 1o
UV P 2W 2.0 0 2.00 2.00 1.62 1.30LLevel 13 10 13 10 13 10
B0oo P 1.1 1.90 1.69 1./0 1.38 1.30
evel n 113 10 13 '10 13 1()
0 - no diffetence In conspicuily of lighted annJ non-lighted aircraft.
I - lighted aircraft slightly.ioperior.
2 - " moderately
3- " strongly
P - mean value rf preference
n - number of observations
V 85___
run to demonstrate that tie strobe had a higher probability of detectiontitan the rotating beacon.
3.3.6 F-ill STROBE TEST OF 1971 [28]
Two tebt article strobe lights were furnished at no cost tothe Government by Grimes Manufacturing Co., Urbana, Ohio. These lightswere installed on an FB-i1L aircraft on 15 MaiTh 1971. The testarticle strobe lights were direct replacements for the existingrotacing beacons. The strobe light power supply was designed to replace theretracting mechanism of the rotating beacon. The strobe light was notretractable. The strobe lights were rated at 800 E.Cd. and had a flasirate of 60 per minute. The cylindrical Pyrex housing of the strobeextended 2.5 tnches above the fuselage and had a diameter of 2.75 inches.
Flight crevs were briefed and post flight evaluaticn formi 'reused to aid in analysis of the affectivtness and limitatiois oi .an,lights, Data from 16 flights were collected, six were at night, sevenwore under 1FR conditions and eight involved air refueling. Commenitswere collected from th. toet ,•ircraft crew, tanker operators, tnd groundobservers,
"The teat report indicates that pilot reaction was very enthusiastic,and tower permsnneol repurted that visual acqoisition of the tnst &ircraftin the ttrffic pattern was groatly facilitated. Tanketr sightingsoccurred at tniwty ailAs it some instances, wth att r'ersge visualacquisition range of 20 miles at night and ten mitleu In the daytime.
Some crews experienced cockpit distractionu luring the I: !lightsand resulted in pilots turning the lighte off. There were alsodistractions reported in cell formation.
After the sixteen flights at Carswell, the test lights were shipped
to Edwards AYB CA for supersonic flight testing. There were three
flight, at up to mach 2.2 and 50,000 feet altitude. Testingterminated when the chase plane reported the lower light out arter asuperwonic run on the third flight.
Three failures were experienced during the testing:
a. The strobe lights were reported to be intermittent during
the first flights. It was discovered that as the xenon in the flash
tube beated during operation, the trigger voltage (15KV) applieA wasnut sufficient to ionize the gae. Installation of grids, surr,, ing
the tube, to increasm the field strength corrected this problem.Although not indica'ed in the teat report, i'astallation of this gridwill most likely reduce the light output as will heating of the xenongas. The report does not indicate that this was tested.
86"IC
S,•o "':-'v ,?. •. ,_,"_-_ _"_ " _,

b. The secon failure occurred at the end of the Carswelltesting when the upper light failed. Contractor analysis found achafed wire caused by a construction peculiar to the test units.The contractor gave assurance that design of production units wouldeliminate the possibility of this failure.
c. On the third supersonic flight at Edwards AFB the lowerlight failed. Vendor analysis found a cold solder point on theprinted circuit board of the power sipply. Bettez quiality controland proper wire support should prevent a recurrence.
It is important to note that a daytime visibility of ten milesis extramely optimistic when considering an 800 E.Cd. source. Mostof the test data from other tests have indicated that the theoretical"data (paragraph 3.2.1 and Yigures 30-33) is a good and accurateindication of expected performance. The theoretical data indicatesthat an 800 E.Cd. light should be visible (at threshold) approximately0.5 miles on a stanidard day with ten mile (metrological visibility(1000 ft.L, background and transmigsivity approximately .7). For aten mile visibility background luminance would have to be at or near
%T,1 ft.!,. (early dawn ox late dusk conditions) and a transmissivitygreat4r tha•A 0.9 (greater than 30 miles metrological visibility).
L33.7 T-38 ATRCRAFT B•CON/STROBE LIGHT VISIBILITY TEST OF 1972 [291
'Standald T-38A aircraft anticollisicn lights consist of two red{ rotating beacons. One beacon is located near the top of the vertical
stabilizer *nd is visible from either side, with the uther beacon beintlocated underneath the fuselage (approximately under the front cockpit).An Air Training Coumand T-38A wan modified by replacing the rotatingbeaconp wiLh two strobe lights rated at 2000 E.Cd. in the horizontalplane. This specially modified T-38A and a T-38A with the standardrotating beacons were usad as target aircraft, An F-lObB was used ,sa chase aircraft.
The test flights were performed aL two difterent altitudes. Highaltitude passes were made at 37,000 feet, 0.90 mech for the interceptorand 39,000 feet, 0.75-0,80 wach for the target a1rcraft. Low altitudetesta were performed at 5,000 feet, 0.55-u.60 mach for the interceptorand 7,000 feet, 0.55-0.60 mach for the targetis.
Radar lock-on was achieved with visual sightings occurring at therespective ranges noted in Table 13. The head-on and stern passes wereperformed with the target airccaft in line abreast furmation (approximatelytwo ships separation) and the other passes were flown with target aircraft
87, .
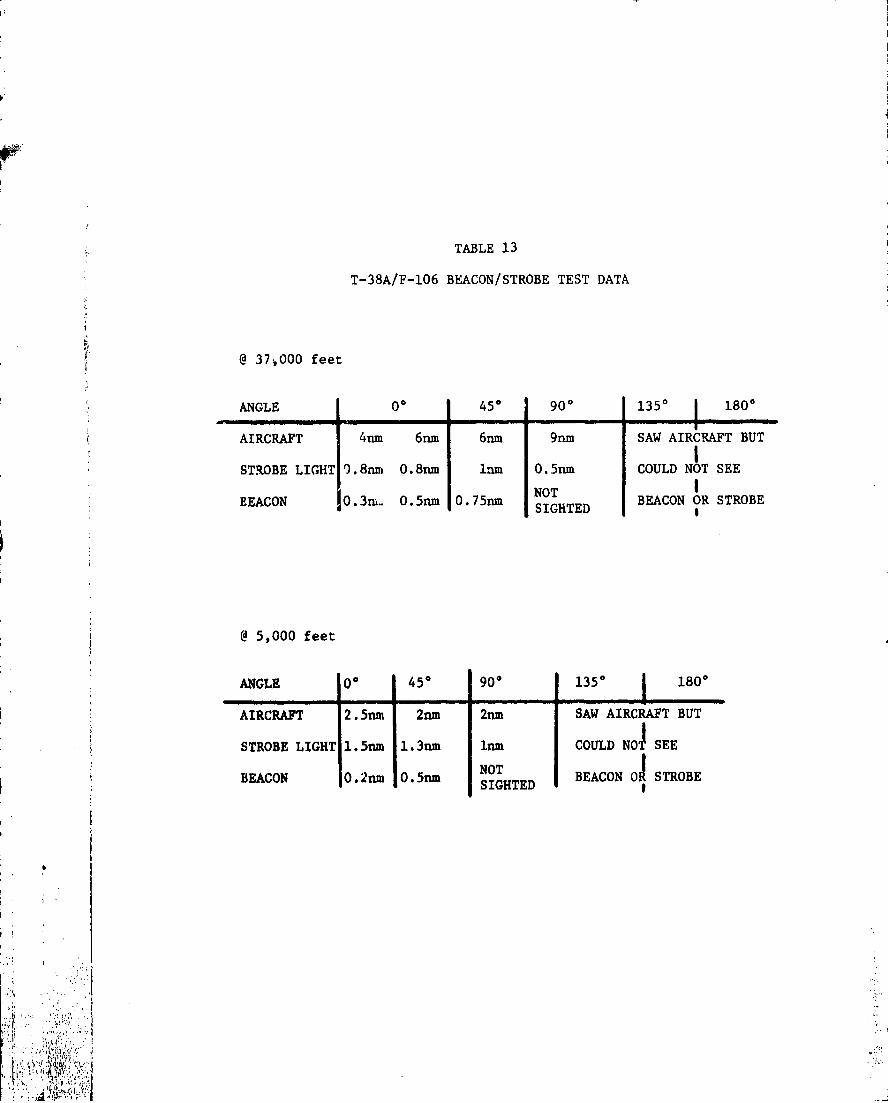
TABLE 13
T-38A/F-106 BEACON/STROBE TEST DATA
V @ 37,000 feet
ANGLE 00 450 900 1350 1800
AIRCRAFT 4nm 6nm 6nm 9nm SAW AIRCRAFT BUTISTROBE LIGHT 0.8rm 0.8nm inm 0.5nmn COULD NOT SEE
NOT IBEACON O.3•.. O.5nnm 0.75nm BEACON OR STROBE
SIGHTED
@ 5,000 feet
ANGLE 00 450 900 1350 1800
AIRCRAFT 2.5 m 2nm 2nm SAW AIRCRAFT BUT
STROBE LIGHT 1.5nm 1.3nm I= COULD NOI SEE
BEACON 0.2nm O.nm NOT IBEACON 0 STROBESIGHTED B
.I,- ,!
flying loose trail formation (approximately three or four shiplengths separation). Sightings were made at uspect angles of 0'and 450 stern, 90° Beam, 1350 and 1800 Front. On all passes thetarget aircraft was initially 2,000 feet higher than the chaseaircraft, with separation of between 1,000-2,000 feet maintainedafter radar lock-on. In the stern passes the chase aircraft startedwith 2,000 feet separation and then climbed to co-altituoe in anattempt to find an optimum sighting position.
3.3.7.1 DATA EVALUATION AND ANALYSIS
At the lower altitudes tested (5KFT) pilots reported definitehaze conditions. The ranges at which aircraft sightings were madeare significantly lower than those reported for high altitudes(37KFT). In the majority of the cases the strobe lights were sightedat slightly greater ranges in the haze conditions; however, theinterceptor was at much lower speeds (.9 mach @ 37KFT, .55-.6 rmach5KFT). In all cases the aircraft was sighted first followed by thestrobe light and slightly later the beacon. The beacon couldnot be seen in the 90* beam pass and none of the lights could bedefinitely seen in the 1350 and 180' fronts because of the highclosing rates (900FT/SEC. at 900 BEAM to 1600 FT/SEC. at 1800 Front).Pilots' comments were that one system was not significantly better
than the other as anticollision lighting in the test environment forthis flight.
3.3.8 USAF-IG STROBE EVALUATION OF 1973 [1]
The USAF-IG strobe evaluation of 1973 was developed as a result
of the Air Force Systems Command conference of April 1973 which washeld to determine the status of high intensity strobe light researchand development and to determine the applicability of such lights toUSAF use. From this conference the following conclusions were presentedby the USAF members who participated in the conference.
a. The USAF does not have a formal program to evaluate strobesfor midair collision avoidance.
b. Several major comands have tested strobes and stronglysupported immediate installation. However, operational evaluation isrequired to determine the optimum configuration and intensity forinstallation on USAF aircraft.
c. The test parameters of the 1973 bird/aircraft strikeLazard (BASH) evaluation at Mountain Home AFB are not adequate tocompletely judge midair collision avoidance characteristics of strobes.
89

d. Engineering developments have reached a point where highintensity strobe lig!,ts could be utilized as a suitable replacementfor the existing anticcllision lights.
e. The US Army haE done extensive research and development inthe area of anticollision devices on rotary wing aircraft. It isproposed that the USAF adopt the basic recommendations of the Army,adding any requirements special to the Air Force mission and implementthem for the Air Force helicopter force.
From this meeting the IG agreed to conduct an evaluation in anattempt to provide definitive information as to the effectivenessaud reliability of strobe light equipped aircraft in reducing themidair collision potential. The specific objectives of the IG strobelight evaluation were to:
a. Determine effectiveness of strobe lights as midaircollision avoidance devices on USAF aircraft in an operational environ-ment.
b. Determine operational suitability, maintainability, andreliabtlity of strobe lights on USAF aircraft.
c. Determine human factor aspects of strobe lights on aircrews.
Prototype strobe lights were procured and installed in the existinganticollision light receptacle on the B-52D, KC-125A, C-141, T-39, FB-111,and T-38 aircraft. Specifically, MAC installed 3,000 E.Cd. white lightson both the C-141 and the T-39, for daytime operations, while duringnighttime operations red lenses reduced this intensity to 400-600 E.Cd.SAC configured the B-52D with a 3,000 E.Cd. white strobe light, theFB-lll with a 1400 E.Cd. white strobe light which was subsequentlypartially shielded to reduce backscatter effects. The KC-135 wasconfigured with a dual red/white light with 300 E.Cd. in the red modeand 2,700 E.Cd. in the white mode. ATC configured the T-38 with a dualred/white light also with 300 E.Cd. in the red mode and 2,700 E.Cd. inthe white mode. All lights were designed to provide omnidirectionalcoverage with the optimum intensity established in the horizontal plane.The strobe equipment available for Air Force testing wag limited by therequirement (Air Force imposed) that the lights be "secew driver retrofits"so test aircraft could be easily be returned to their original configuration.
The test data was collected in conjunction with normal trainingmissions. 573 sorties were flown from which pilot/ground controllerquestionnaires were received and evaluated. The following test resultswere presaentc in the report And comments relstive to these resultsare also p-.ýeented.
90
a. "Commonality: A common strobe light for all aircraft ,'snEither feasible nor desirable. Proper consideration of the require-ments for individual aircraft type and operation will dictate a widevariance in strobe light design and performance factors. Aircraftdifferences will. impact such factors as strobe light intensity, loca-tion and number of units. The geometry of the aircraft must beconsidered so that strobe lights can provide maximum coverage withoutunacceptable backscatter or excessive blockage from the aircraftitself."
Commer~ts. The experimenter seems to be implying thatstrobe light requirements are determined by the type aircraft and/oraircraft operational requirements. It must be remembered that theperformance requirements of an anticollislon light system must bedetermined from the standpoint of the observer. Light intensity,distribution around the aircraft, and flash rate requirements aredetermined by the eyes ability to see and not the size or configurationof the aircraft. As indicated by the midair collision and near midaircollision data, incidents occur under very similar circumstances (withrespect to closing speed and location) restricting the variation inrequired anticollision light performance. The type aircraft, willaffect strobe light performance on an individual light basis only asa tailoring aspect toward achieving the total system requirements.While one common strobe for all aircraft would not be feasible, threeto four standardized types may be feasible based on grouping aircraftby performance characteristics.
b. "Location: Anticolllsion lights are most commonly locatedon the top ana bottom of the fusplage or cn the top of the verticalfin. Other acceptable locations are in the wing tips and tail or inthe wing root and tailcone. This latter location may be desirablewith variable geometry wing aircraft or with aircraft having very thinwing tips. However, everything considered, the wing tips and taillocation can be considered ideal. Locating high intensity strobe lightsin the extremities of the aircraft will create fewer backscatter, EMIand reflection problems. Care must be taken in locating strobe lightsto insure that they do not interfere with other aircraft systems orthat the other systems do not prevent the strobes from functioningproperly. In the event of a strobe light retrofit program the locationof existing anticollision light receptacles may be considered ideal tokeep engineering and installation costs to a minimum; however,consideration must be given to backscatter/reflection problems."
Comments. There is general agreement with the material
91

presented. However, the material is purely speculative on the part ofthe experimenter as none of the comments can be drawn from the datacollected. The only lights tested during this evaluation were fuselagemounted.
c. "Intensity: Strobe light effectiveness during day VMCimproves as the intensity increases. The optimum intensity for aparticular type aircraft depends on aircraft size, power available,space, operational requirements, reflecting surfaces, lightingreceptacles and locations of crew stations. It is neither feasiblenor desirable to set a minimum intensity standard for USAF aircraftdue to differences in present and future aircraft. However, everyeffort must be made to optimize the intensity for individual air-craft based on current state-of-the-art zquipment available."
Comments. While the effectiveness of strobe lightsprobably increases during day VMC with increasing intensity (as canbe seen'in the theoretical data of Figures 30-33) data collectedduring this evaluation could not be used to verify this fact. Asnoted earlier, the aircraft with the higher intensity lights werethe larger (B-52, KC-135, etc.) and aircraft with lower intensitylights were smaller (Fl-ill, T-37, etc.). The data is not the typethat would allow separation of the effects of aircraft size from lightintensity. Under most daylight VI4C conditions all of these aircraft
I will be visible at ranges two to three times that of a 3000 E.Cd. strobeat threshold. It must be again emphasized that aircraft size, poweravailable, space etc., do not define the optimum intensity requiredof a strobe light. These factors may indeed result in designcompromises but do not change the requirement.
d. "Conspicuity: High intensity strobe lights, regardlessof color, increased aircraft conspicuity during hours of darkness,twilight or reduced visibility. SAC was unable to support the conclu-sion that during bright daylight hours strobe lights substantiallyincreased aircraft conspicuity, although both MAC and TAC could stronglysupport this conclusion. It appears the differences of opinion couldbe attributed to some basic cause factors:
(1) Aircraft Size
(2) Location of Lights
(3) Light Intensities
"(4) Flash Rates J.92
. _..:• 92

(SAC was the only command which established a flash rate of 60/minute)."
Comments. Any comparisons involving two lights willalways find the brighter light visible at a greater distance (see Figures30-33). But conspicuity is not based solely on visual rnage. A in thecase of the T-38 evaluation (paragraph 3.3.7), the beacon was visiblein one case at 0.5 nm, the strobe at 1.3 nm and the aircraft at 2.0 nr.which indicates an almost 3X improvement in anticollision lightdetectability from beacon to strobe. But it must also be noted thataircraft conspicuity was not improved as it was visible 0.3 nm beforethe strobe. The idea is to detect the air'raft not the light.
e. "Reliability: An increase in anticollision lightreliability could be realized if high intensity strobe lightsi wereprocured to replace the present rotating beacon. Presently tlean TimeBetween Failure 'MTBF) on the rotating beacon averages 200 hours whileminimum MTBF for the US Army Strobe Light Specification was etablishedat 800 hours. It is well within the state-of-the-art to provide strobelights with MTBF in excess of 2,000 hours."
Comments. The data presented here is again speculativeas this type information is not obtainable from the IG analysis. Atthe wtiting of this report the MTBF for the Army light is only aspecification value. No strobe light equipment has demonstrated an800 hour MTBF and that meets the other requirements of the Army speci-fication, let alone 2,000 hour estimate provided.
f. "Suitability: Light reflections and backscatter fromthe white strobe light caused an operational annoyance to some air-crews during night IMC operations, day IMC operations and some nightVMC operations. U-ider these conditions the white strobe lights wereturned off. Under those conditions where the crew had the capabilityto either select a lower Intensity red strobe light or to have a redlens installed prior to flight, the operational annoyance was reducedto a minimum level."
Co,,_ent_ . Reduccion of the operational annoyance byselecting a lower intensity red light reduces light intensity by atleast 60Z with an associated reduction in anticollision lighteffectiveness. How the lvwer intensity light was determined to provide"minimum annoyance" is unknown since lights of slIghtly lower or higherintensity were not tested.
g. "' ntainability: The strobe lights were operated andmaintained by military personnel in the field throughout this e a uarion
93
without difficulty. All lights evaluated were prototype lights thatwere designed to operate in the existing anticollision light receptacle.If a faiiure occurred during the course of this evaluation the unitwas returned co the contractor for repair/evaluation. However, qualifiedmaintenance personnel estimated that in-shop repair of strobe lightswould require 0.5 hours compared with 5.0 hours for the presentrotating beacon."
Comments. The estimate of 0.5 hours in-shop repair ofstrobe lights is the subjective opinion of maintenance personnelwithout sufficient data. The repair time for a strobe system willdepend on the maintenance concept chosen and cannot be based solely onthe remove-and-replace repair used during the IG evaluation.
h. "Electromagnetic Interference (EMI): The strobe lightsused in these tests did not meet certain specifications in HIL-I-6181Dfor transmitted radio frequency interference (RFI). However, nosignificant EMI during the test period was attributable to the strobelights. Minor interference in the interphone system of the T-37 wasresolved by the incoi-poration of filters. A reduction in transmittedRFI can be achieved, if necessary by using a special RFI coated lens.The reduction in transmitted RFI will result in a cost to effectivecandela of approximately ten percent."
Comments. It should be noted that EMI levels in militaryspecificatinns have not been chosen arbitrarily. This test did notcollect data relative to EMI and specific aircraft systems other thanto ask the flight crews if they had noticed any. Unfortunately thesquelch circuit on most aircraft radio equipment Is such that strobcnoise would be blanked. While the aircrew may not be aware of the EMI,it couid nevertheless result in desensitization of the receiver frontend and a reduction in performance unknown to the flight crew.
".. "Backscatter/Reflection: These phenomena as factors underconditions of haze, rain or clouds. Although crew members who experiencedheadaches or nausea were rare the psychological/physiolopical effects areless pronounced under conditions of red strobe lighting. Properly designedstrobe ights, i.e., those lights which provide the option of selectinga reduced. cnde.a when using red strobe lights, will produce a psychol-Sogical/phyoiological effect no more hazardous than the existing redrotating beacon."
Commenta. This major problem area needs more study. Itmust he remembered that conditions of reduced visibility are preciselythose where anticollision systems are needed. Reducing the intensity,
94
installing coloted filters, or masking of the fixture all reduce theadverse flight crew effects but reduce much more the effectiveness ofthe anticollision system.
j. "Flash Rates: Adverse psychological effects vary with flashrate and intensity, but are expected to be tolerable at rates which areeffective in gaining the attention of aircrew members of another air-craft. Flash rates of 60 and 120 flashes per minute were evaluated.The faster rate was more effective in increasing aircraft conspicuity.Flicker vertigo can occur as rates exceed 180 flashes per minute; suchrates must be avoided."
Coments. As pointed out by the writer, the only flashrates tested were 60 and 120 flashes per minute. The faster rate wasidentified as increasing aircraft conspicuity. This is again subjectiveopinion as no data was collected that could show an objective increase.An interesting question here would be "what are the units of conspicuityand how large of an increase was there?"
k. "Formation: High intensity white strobe lights arenormally too distracting for day or night formation flying. Under dayVMC it would be feasible for the wing man to continue to emit whitestrobe lighting; however, under conditions of reduced visibility(day or night) or night VMC the option of selecting the red strobej light would be mandatory."
Commnts. The requirement for red lights at night onlyindicates a preference for reduced intensity. No white lights weretested at an intensity equal to the red lights.
1. "Refueling: The high intensity strobe light (red orwhite) markedly increased visual sighting of both strobe equippedreceivers and strobe equipped tankers during the rendezvous phase.This condition was especially true at night or under reduced visibilityconditions."
Comments. This finding is expected, since the redstrobe is four to five times the intensity of the present KC-135rotating beacon and the white light is at least 30 times as bright.Data from other testing would indicate that neither of these lightswould provide a daytime increase in conspicuity.
3.4 ASD 'S "QUICK LOOK FLIGHT TEST"
The T-43 Undergraduate Navigation Trainer is a modified Boeing
95
737 and as such was delivered to the Air Force with the wing tip-tailstrobe system found in most commercial 737s. A "quick look" flighttest was arranged with Air Training Command (ATC) and the Air DefenseCommand (ADC) to investi~gate if the strobe significantly increasesthe range at which the T-43 can be seen. ADC F-106s, under radarcontrol, made training intercepts on the ATC T-43. During the inter-cepts, the P-106 pilots recordied the ranges at which strobe and T-43were sighted using their forward looking radar. The overall objectiveof this quick look flight test was to determine whether a 4000 2ffectivecandela strob*t Is sufficient (as h'as been suggested by manufacturersand several of the Air Force commands) for daylight anticollisionpurposes. The "quick look" test also provided experience withstrobe flight testing which would be invaluable should more testingbecome necessary.
3.4.1 TEST CONCLUSIONS
In all cases, the test aircraft was sighted before the strobelight. Aircraft sightings averaged 11.2 nautical miles for the 30passes where data was recorded while siglhtings of the strobe lightaveraged 1.5 nautical miles. It should be noted that half of theaircraft sightings were made between 12 and 18 nautical miles. TheF-106 pilots were required to have positive radar contact before
R proceeding with the intercept. The pilots stated that many timesupon finishing the intercept set up, they would look outside the cock-pit and immediately see the T-43. They estimated that, under theI conditions present at the test site, the T-43 aircraft was visibleat approximately 15 miles, but that they many times did not getto look for the target until they were well inside this range. Nosignificant difference in detection range was noted between the twoaltitudes (3,000 ft and 15,000 ft).
3.4.2 DISCUSSION OF TESTING
a. Test Objectives:
"IThe "1quick look" flight test was an attempt to gathersubjective data concerning the effectiveness of aircraft high intensitystrobe lights as a means of reducing the daytime midair collisionpotential. The test used an existing system (T-43) in the evaluation.The teat program objectives were defined as follows:
(1) To determine the effectiveness of a 4,000 effectivecandela. (E.Cd.) strobe light in the daylight air-to-air environment.
96
(2) To determine the visual acquisition range of the
T-43 aircraft.
(3) To determine the visual acquisition range of the 4000E.Cd. strobe light on the T-43 aircraft.
(4) To provide experience with strobe flight testing should
more testing become necessary.
b. Program Authority:
The program was assigned to ASD/AEA by AFSC/SDA letter,dated I March 1976, subject, Aircraft Visibility. AFSC requestedthat ATC and ADC support the test program in AFSC/SDA letter, dated3 March 1976, subject, Aircraft Visibility Testing.
c. Background Information:
The Avionics and Aircraft Accessories System Program Office(ASD/.AEA) was tasked in Novemnber 1975 to develop a specification foraircraft strobe light systecs to be installed on all Air Force aircraft.In attempting to determine Lhe parameters of the specification, the trueeffectiveness of strobe lights to reduce the daytime midair potentialbecame suspect. Most of the data that supported the installation ofstrobe light. was subjective. The little objective data that wasavailable indicated that strobes would not be very effective duringdaylight hours.
The T-43 is the only Air Force production aircraft that hasa 4000 candela strobe light (this intensity is near the present limitfor off-the-shelf aircraft strobe systems). The flight evaluationof this syst- i provided objective data concerning the visual acquisi-tion range Jf the light and the aircraft. An evaluation of thisdata, coup±':i with other data, will enable an evaluation of theeffectiven'?ss of strobe lights under daylight conditions. Ultimately,the intersity parameters for the specification will be determined.This was not an L•aborate test, but the information obtained is usefulbecause it will give specific data on the4000 candela/T-43 inseallation,and verification in the flight anvironment of the data cbtained inthe ground testing.
d. Test Conditions arnd Procedures:
(1) Test Conditins:
97
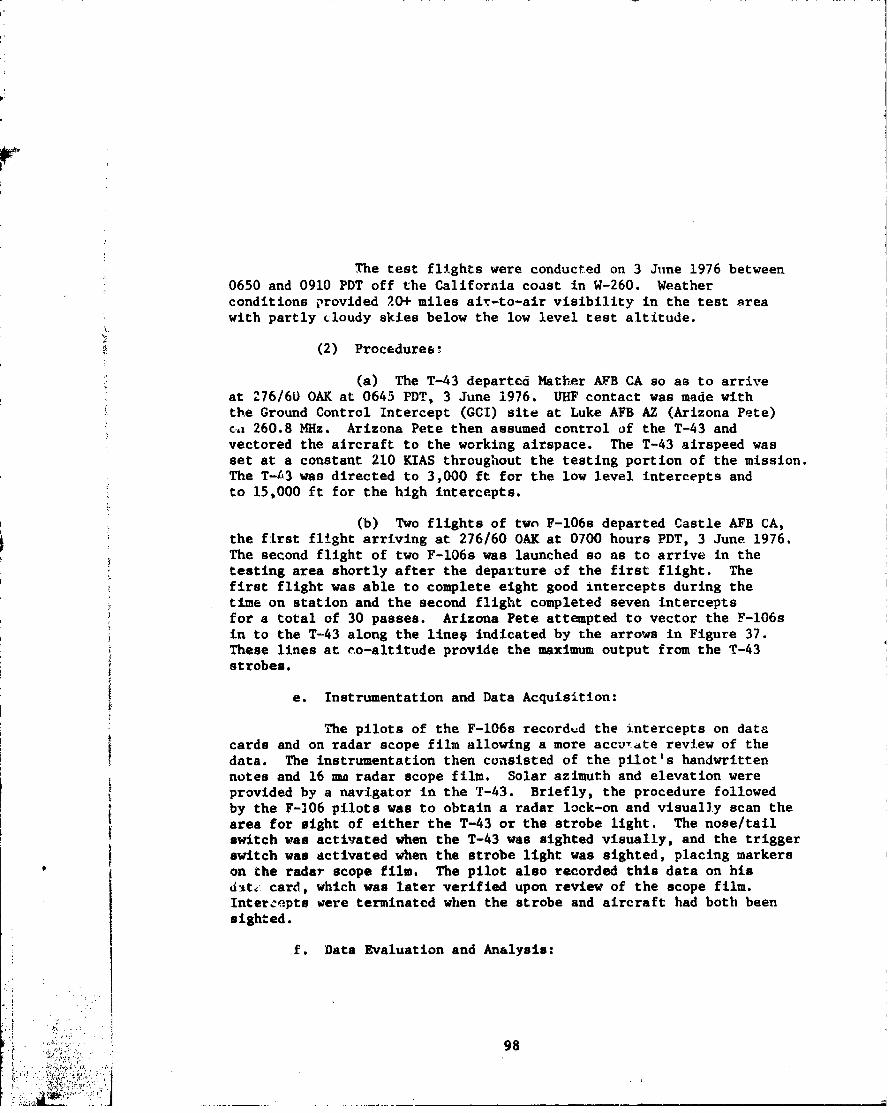
The test flights were conducted on 3 June 1976 between0650 and 0910 PDT off the California coast in W-260. Weatherconditions provided 20+ miles air-to-air visibility in the test areawith partly cloudy skies below the low level test altitude.
(2) Procedures:
(a) The T-43 departed Mather AFB CA so as to arriveat 276/6U~ OAK at 0645 PDT, 3 June 1976. UHF contact was made withthe Ground Control Intercept (GCI) site at Luke AFB AZ (Arizona Pete)cox 260.8 MHz. Arizona Pete then assumed control uf the T-43 andvectored the aircraft to the working airspace. The T-43 airspeed wasset at a constant 210 KIAS throughout the testing portion of the mission.The T-0~ was directed to 3,000 ft for the low level intercepts andto 15,000 ft for the high intercepts.
(b) Two flights of two F-106s departed Castle AFB CA,the first flight arriving at 276/60 OAK at 0700 hours PDT, 3 June 1976.The second flight of two F-106s was launched so as to arrive in thetesting area shortly after the departure of the first flight. Thefirst flight was able to complete eight good intercepts during thetime on station and the second flight completed seven interceptsfor a total of 30 passes. Arizona Pete attempted to vector the F-106sin to the T-43 along the lineq indicated by the arrows in Figure 37.
£ These lines at co-altitude provide the maximum output from the T-43strobes.
e. Instrumentation and Data Acquisition:
The pilots of the F-106s record%;d the intercepts on datacards and on radar scope film allowing a more accu-rate review of thedata. The instrumentation then consisted of the pilot's handwrittennotes and 16 mw radar scope film. Solar azimuth and elevation wereprovided by a navigator in the T-43. Briefly, the procedure followedby the F-106 pilots was to obtain a radar lock-on and visually scan thearea for eight of either the T-43 or the strobe light. The nose/tailswitch was activated when the T-43 was sighted visually, and the triggerswitch was activated when the strobe light was sighted, placing markerson the radar scope film. The pilot also recorded this data on hisdat.~ card, which was later verified upon review of the scope film.Intercepts were terminated when the strobe and aircraft had both beensighted.
f. Data Evaluation and Analysis:
.98
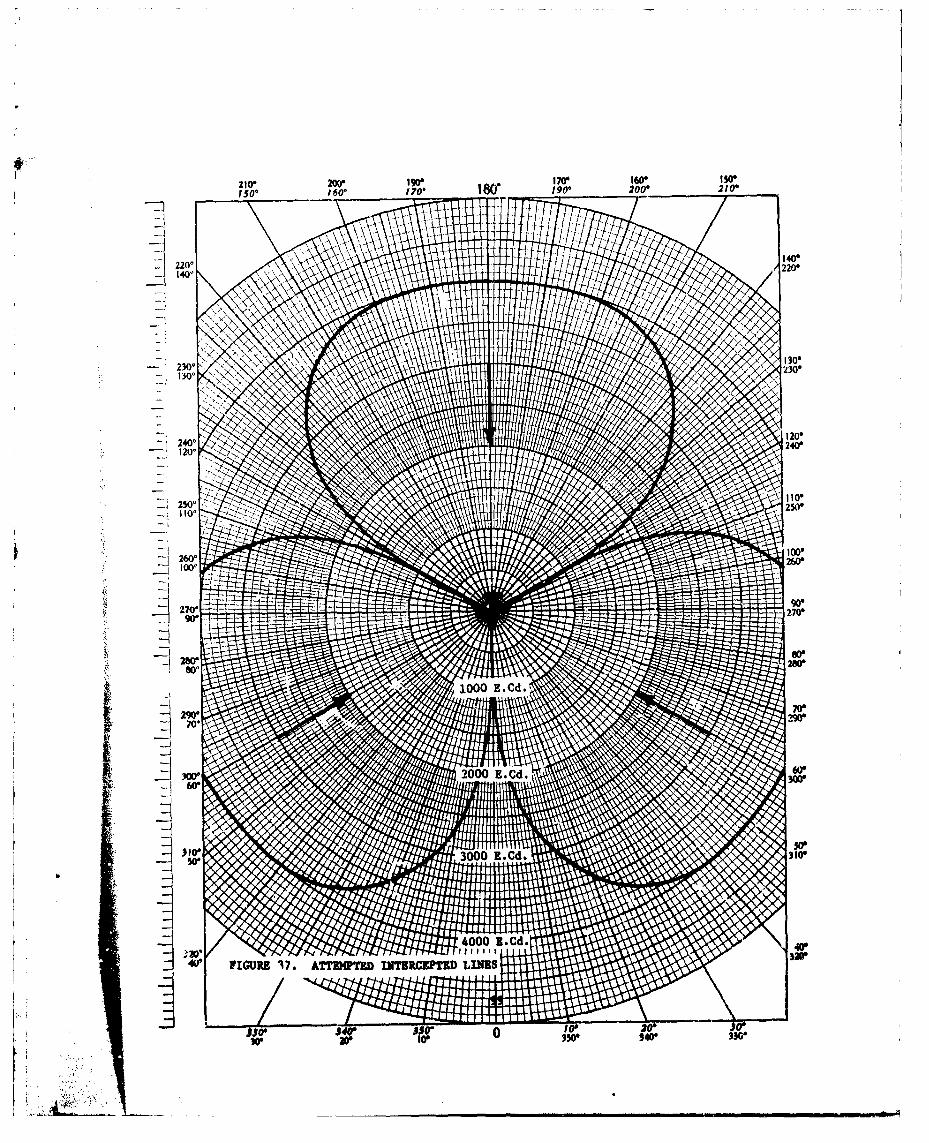
21020' tDDI All 1W 0SO160* f 70, 18(i 190, 200' 210'
~~140*
2300. 230>\*0
B04
6-J
Ko,20j24Q'FIUEi THPDITUCfDLNS
3i270
tOSW 4 3O
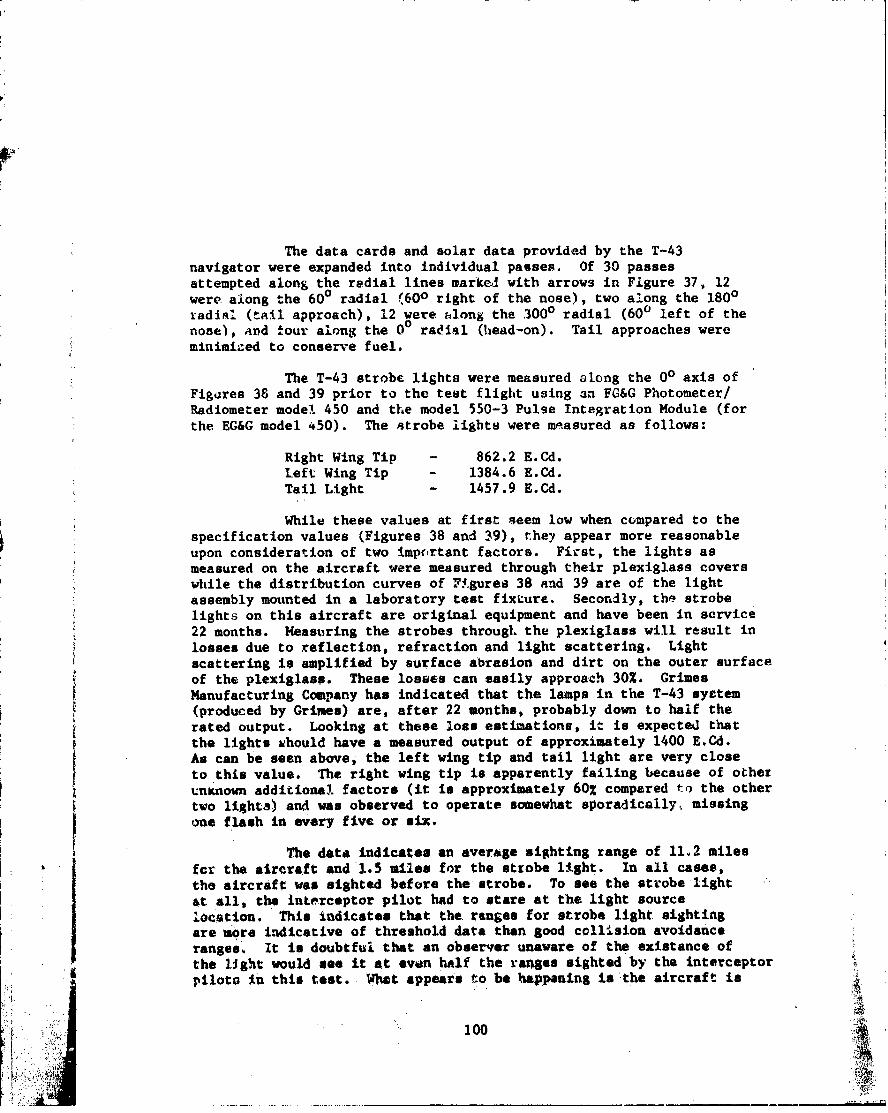
The data cards and solar data provided by the T-43navigator were expanded into individual passes. Of 30 passesattempted along the radial lines marfko with arrows in Figure 37, 12were along the 600 radial (600 right of the nose), two along the 1800radl&. (tAll approach), 12 were along the 3000 radial (600 left of thenose), and "our along the 00 radial (head-on). Tail approaches wereminimized to conserve fuel.
The T-43 strobe lights were measured along the 00 axis ofFigures 38 and 39 prior to the test flight using an FG&G Photometer/Radiometer model 450 and the model 550-3 Pulse Integration Module (forthe EG&G model 450). The strobe lights were measured as follows:
Right Wing Tip - 862.2 E.Cd.Left Wing Tip - 1384.6 E.Cd.Tail Light - 1457.9 E.Cd.
While these values at first seem low when compared to thespecification values (Figures 38 and 39), they appear more reasonableupon consideration of two impcrtant factors. First, the lights asmeasured on the aircraft were measured through their plexiglass coverswhile the distribution curves of F.gures 38 and 39 are of the lightassembly mounted in a laboratory test fixture. Secondly, the strobelights on this aircraft are original equipment and have been in service22 months. Measuring the strobes through the plexiglass will result inlosses due to reflection, refraction and light scattering. Lightscattering is amplified by surface abrasion and dirt on the outer surfaceof the plexiglass. These losses can easily approach 30%. GrimesManufacturing Company has indicated that the lamps in the T-43 syttem(produced by Grijoes) are, after 22 months, probably down to half therated output. Looking at these loss estimations, it is expected thatthe lights should have a measured output of approximately 1400 E.Cd.
As can be seen above, the left wing tip and tail light are very closeto this value. The right wing tip is apparently failing because of otherunxnowfn additional factors (it is approximately 60% compared to the other
two lights) and was observed to operate somewhat sporadically, missingone flash in every five or six.
The data indicates an average sighting range of 11.2 miles
fcr the aircraft and*1.5 miles for the strobe light. In all cases,the aircraft was sighted before the strobe. To see the strobe light4t. all, the interceptor pilot had to stare at the light sourcelocation. This indicates that the ranges for strobe light sightingare more indicative of threshold data than good cc1lsion avoidanceranges. It is doubtful that an observer unaware of the existance ofthe light would see it at even half the ranges sighted by the interceptorpiloto ft this test. Vhat appears to be happening is the aircraft is
100Si!:i :V.,i
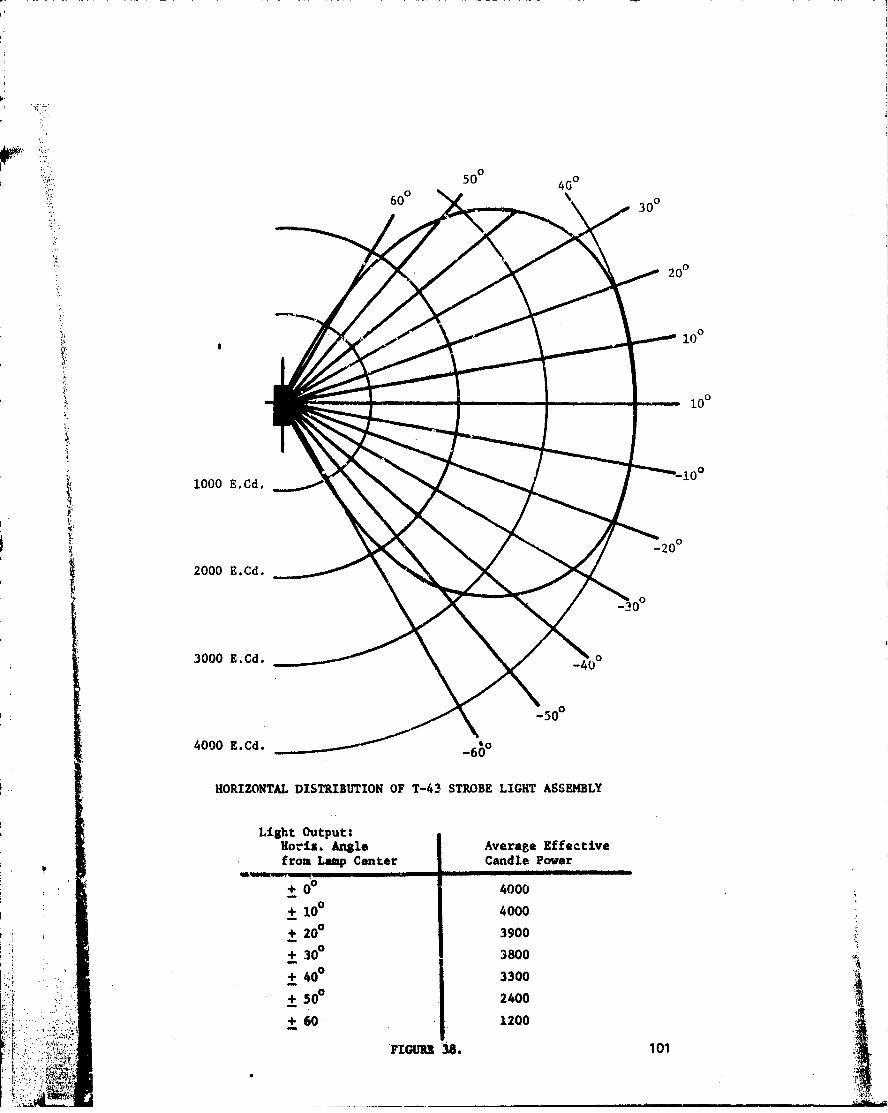
50
50100S4
00
60 0
2000 E.Cd
3000 E1C0
4000 E.Cd.-6
+ 00 4000
300 100d 4000
+200 3900
±000 I.d 6
+60* 2000
+IU S 101 00
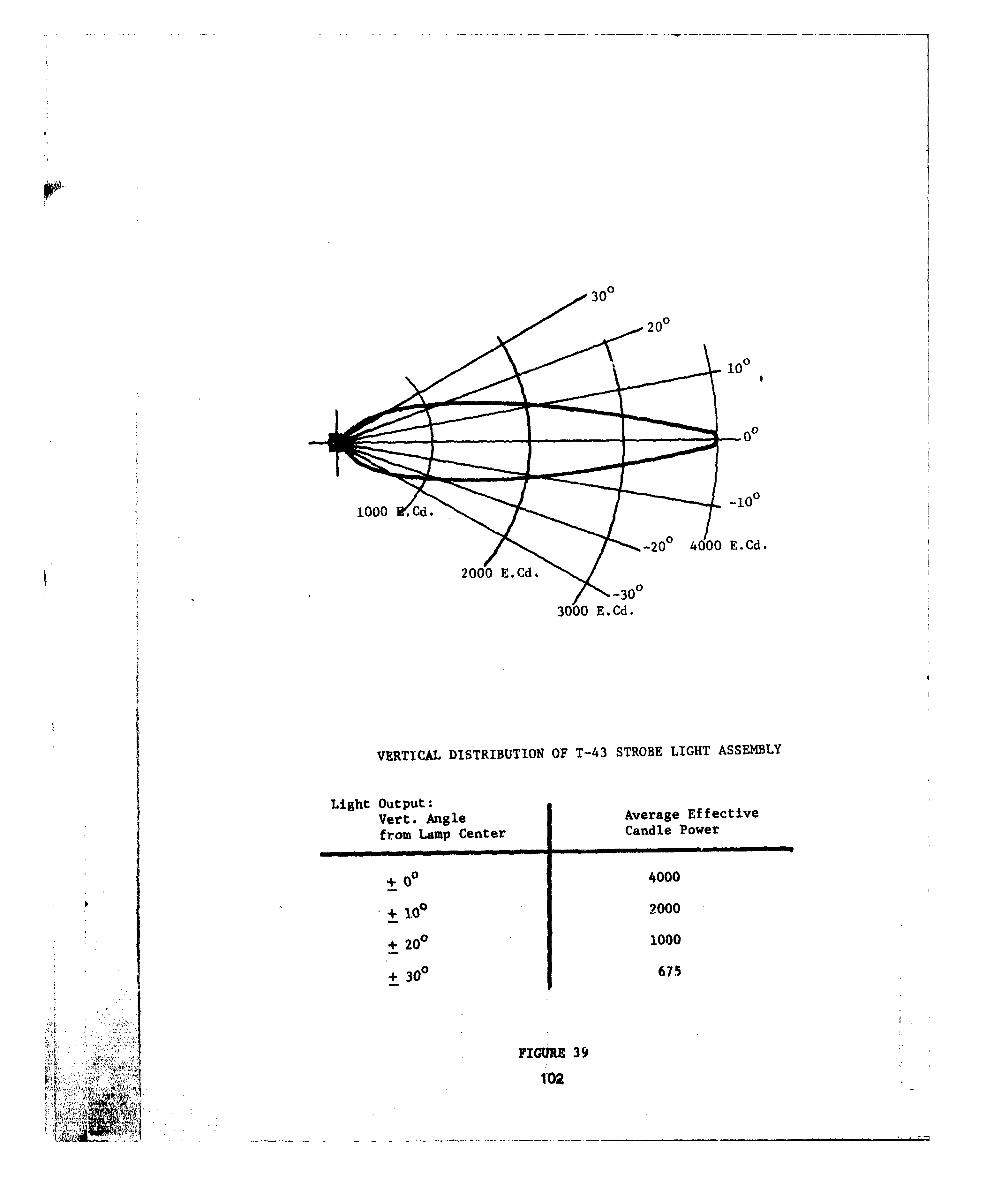
10 0
~00
-20 4000 E.Cd.
VERTICAL DISTRIBUTION OF T-43 STROBE LIGHT ASSEMBLY
Light Outp le Average Effective
from Lamp Center Candle Power
+ 0 0 4000
+ 20 0 1000
+ 30 0 675
FIGURE 39
102
becoming the background against which tne light is being observed.This means the contrast ratio between the light and the backgroundis increasing significantly compared to a sky background making thelight more visible. if this increase in contrast is required tomake the light visible, then the light is not an effective collisionavoidance device under these conditions as the aircraft must be aeenfirst.
3.4.3 FOLLOW-UP TESTING
Due to the extremely poor performance of the T-43 strobe light..and the observation by test personnel that maay of the strobes on otherT-43s were operating sporadically, ASD personnel returned to MatherAFB on 1 September 1976 and measured eighteen (18) of the nineteen(19) strobe equipped T-43s. Figure 40 is a compilation of themeasurements taken.
4The first four aircraft of Figure 40 were the only aircraftmeasured with the plexiglass cover removed as well as covers in place.The covers are extremely hard to remove because of the large numberof fasteners used. The tail light has no removeable cover.
Figure 41 is test data generated at Boeing showing life datafor 1500 hours. The test sheet indicates that the tests wereperformed in June 1975. Note that the test sheet shows a degra-4dation to .88 of the original output. This means that after 1500hours of operation of the 4000 E.Cd. light should be 3520 E.Cd.Aircraft 73-1155 and 73-1156 are near the 1500 hour operating timeif it is assumed that indicated hours and operational hours of thelight are equal. The average intensity of the six lights on thesetwo aircraft is 1455 E.Cd. This is 36% of the rated 4000 E.Cd.and 41% of the value of the test light after 1500 hours of operation,a long way from the 88% figure found by Boeing. It is interestingto note, however, that we have no way of determining if in fact thelight tested by Boeing was initially 4000 E.Cd. Thus, the 1455 E.Cd.level may indeed be 882 of the initial intensity level of the lightson the two aircraft being discussed.
The data points out that maintenance of strobe systems is muchmore difficult than is many times supposed and also results inserious questions regarding MTBF estimates being published hycontractors.
3.4.4 CONTRACTOR RESPONSE
The test data was provided to Grimes Manufacturing Co. who had
:1 ~originally provided the strobe light system to Boeing for the T-43I
1.03
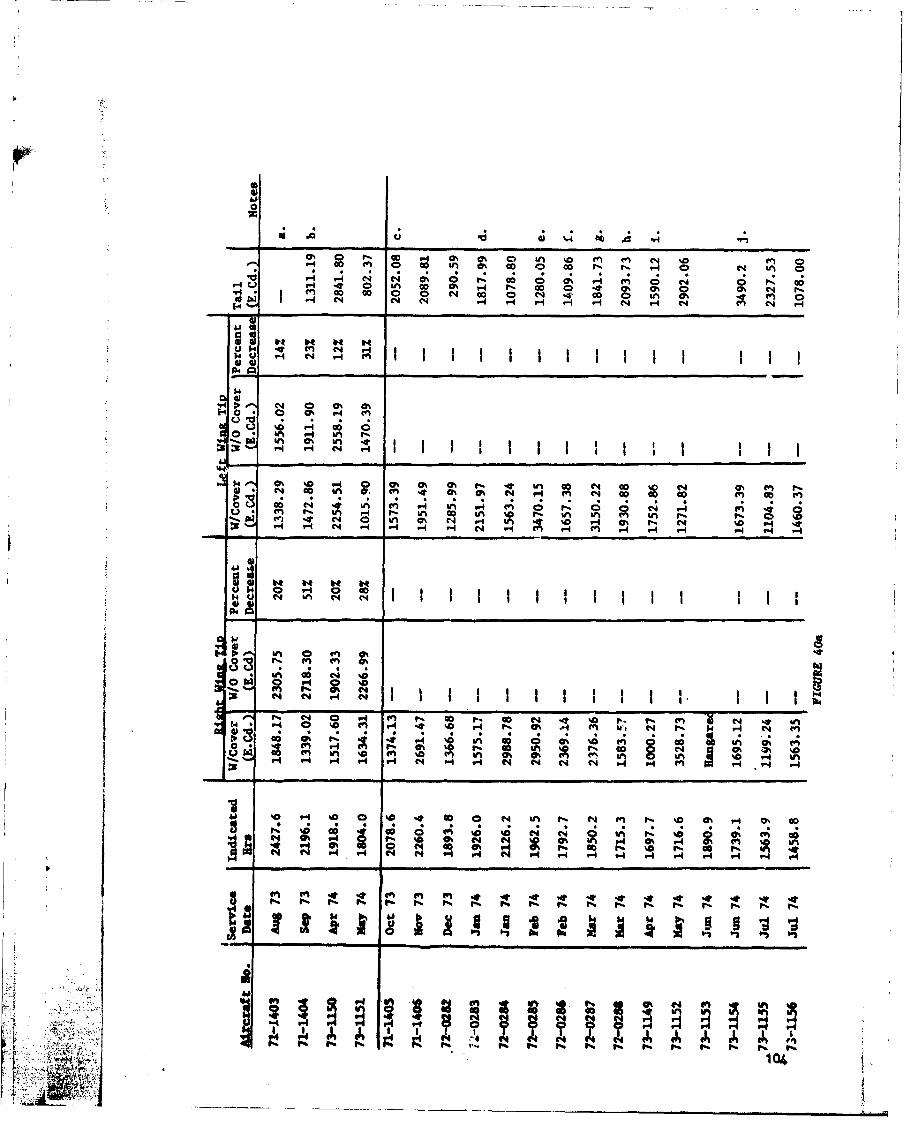
& 0 LI c '01 Go 0 ~ M .0 % N
w-4 c 00 V 0 00 IN co a0 C4 00 9m P 0% m 0to - . N 0 s 0 0- -4 r- r40N0 . 0
Wy U 04 04 4 0 0 n
1- 0-
P44VJ4
.q P N ,-I I I I
%D0 -- ý O % r 0 L o ( cC
m %0 e4 0 0 in0 q LI % . V
r- V"4 N ' -4 r4 V-4 r4 I I I I I
N0 u C4 In V . I . S P 4,
o- -4 -)4%
~~% In C S %
r4 N 1 % 1h ýN.0 N- V 0 V4 V-4 r4 P 0 . 0 N r- .4 '0C e P. P V S N4 In
'.4 *ý 9- 0" n0 I! C?. Cý '0ý T- s 0 - 5 ia . k vIm ýo ýo C C4 % NO 0 4% m '0
r~~~~. 0%M v- %M S%-O" -I 'I '4 - 4 904' N -N -N 4 N 4 9-4 r4 pq H- 4
0 N0
.1
ff5 v~ 4 q~ ff5 ff5 . 4 4. . 4 4. 4. 4 104 4a.l . P . P . . P . P . . . P . P . P
RVS'S
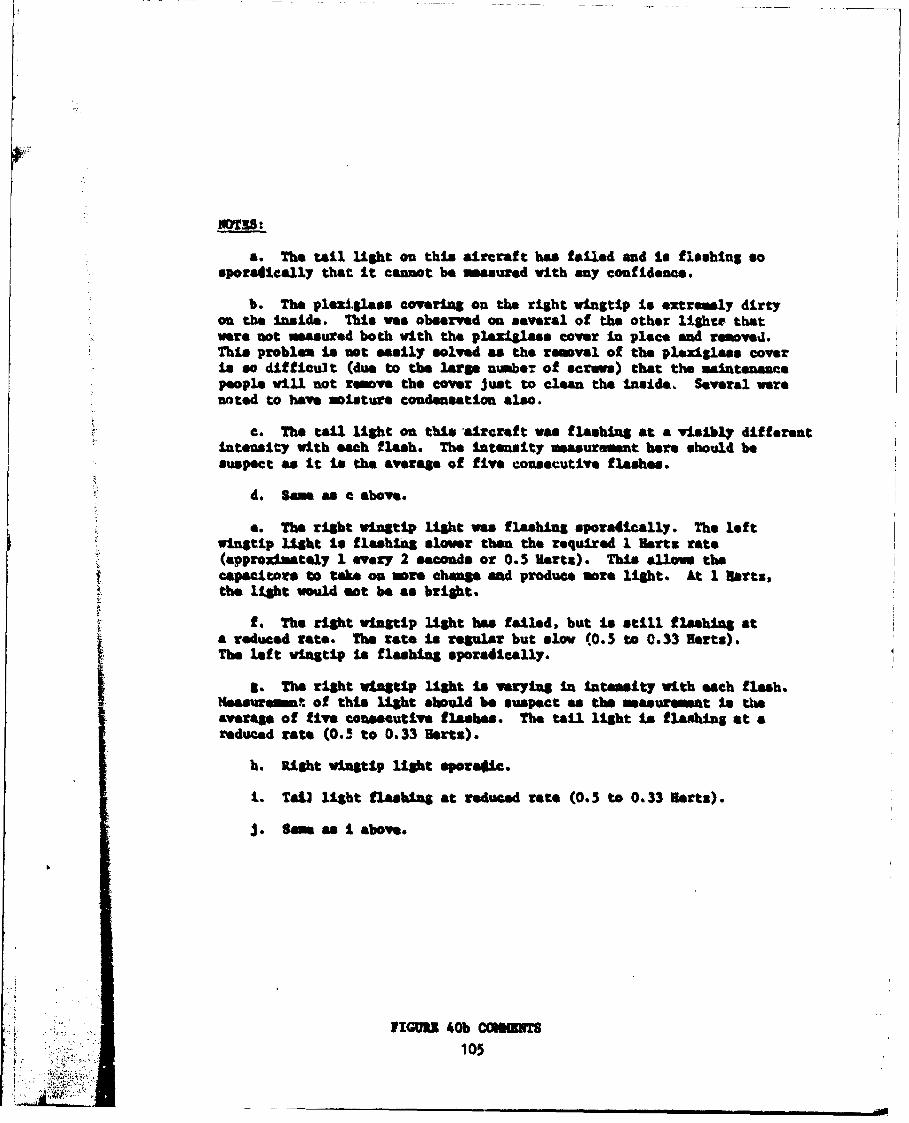
14OT38:
a. The tail light an this aircraft has failed and to fleshing sosporadically that It ceannot be measured with sany confidence.
b.* The plexiglass covering on the right wingtip is extremely dirtyon the Inside.* This was observed an several of the other lighte thatwere not measured both with the plexiglass cover In piace and roooved.This problem is not easily solved as the removal of the plexglass coveris so difficult (due to the large numbe? of screws ) that the maintenancepeople will not remove the cover just to clesn the Inside. Several werenoted to have sisture condensation aleo.
c. The tail light on this -aircraft was flashing at a visibly differentIntensity with each flash. The Intensity masurement here should besuspect as It is the average of five consecutive flashes.
4. Sane as a above.
a. The right wingtip light wee flashing sporadically. The leftwingtip light Is fleshing slower than the required I Hartz rate(approximately I every 2 seconds or 0.5 Hartz). This allow* thecapacitors to take on uor. change and produce mere light. At 1 Hartz,the light would eot be as bright.
f.* The right wingtip light has failed, but is still flashing ata reduced rate. The rate is regular but slow (0.3 to 0.33 Hertz).
The left wingtip Is flashing sporadically.
a . The right wingtip light is varying In Intensity with each flash.I4.asurem' of this light should be suspect as the usauremat in theaverage of five consecutive fleshes. The tail light ts flashing at areduced rate (0.5 to 0.33 Hertz).
h. Right wingtip light sporatic.
1. Tail light flashing at reduced rate (0.5 to 0.33 Hertz).
j. m a I above.
IPIGUR 40b CORMTS
105
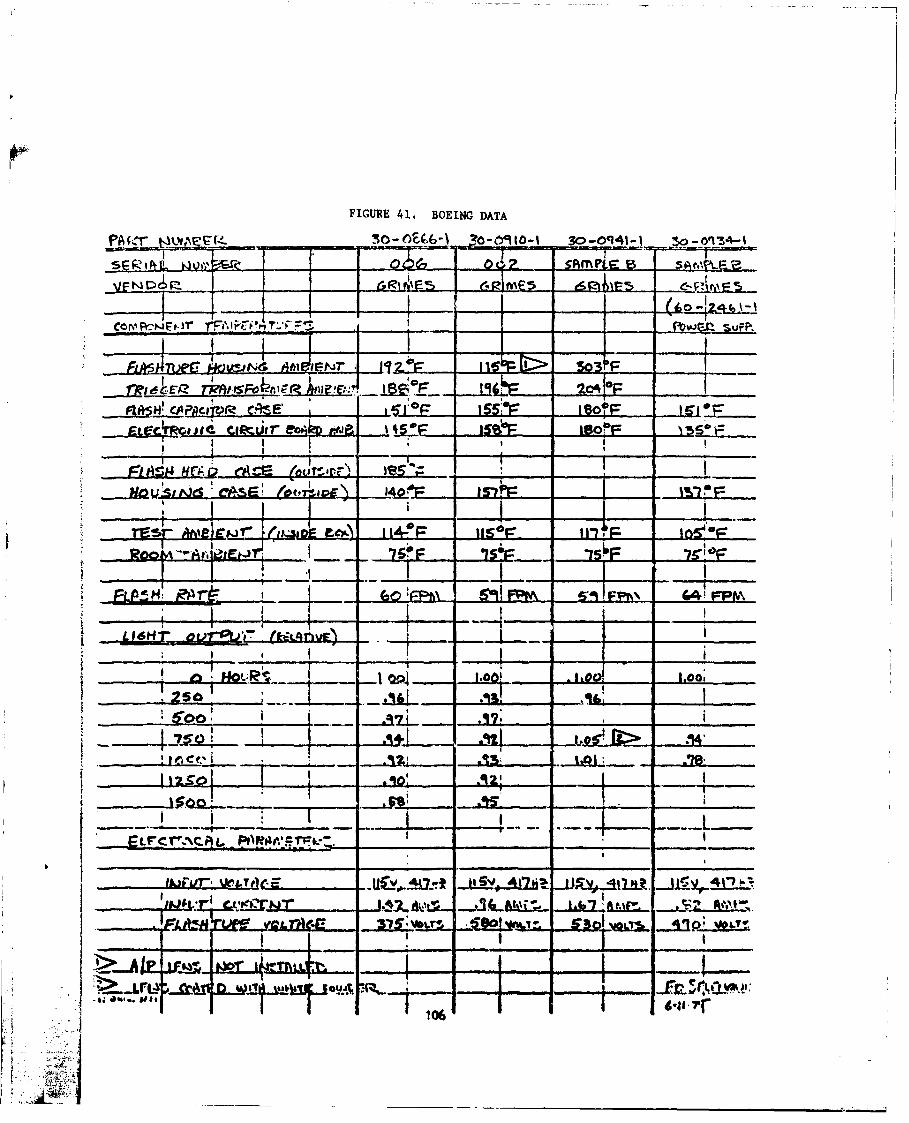
FIGURE 41. BOEING DATA
I - ~SAMPLE
77'Mt CAP$CDV( 16.E 1 m Lý I 8oi L6i ELO
it etI I§ P Ins* kI
HQV~~lfo{LujOc-OE 1.42:!r
____ L1E JlE f~-- 76 F~ l2~e JL
I ZS2 o
.. 0i1_____mir-grfrL. %k&iKCE 17!26
Ie I I 1LS 41.1A
- - ... r.................L.......
'F~. 4 -~ -1- -.10--
aircraft. They too indicated concern for the poor performance ofthe tested equipment.
Grimes requested that one of the aircraft systems be returned tothem for tent and analysis. Their evaluation found that the flash tubeprovided to them through a subcontractor was not meeting designed lifecharacteristics. As a result of their analysis, Grimes has offered,at no cost to the Government, to roplace all of the flash tubes in theT-43 fleet to correct the problem.
3.5 ASD'S TOWER TEST [30)
3.5.1 INTRODUCTION
The primary purpose of the experiment described in this sectionwas to determine the intensity of a strobe aaticolllsion light whichwould provide improved conspicuity of Air Force aircraft under day-light flight conditions. Although most pilot opinion favors the useof strobe lighting to enhance the "see and avoid" doctrine, analyticalstudies have shown that practical strobe lights would be of little
* or no value tmder most daylight flight conditions. Previous experi-f ments with strobe lights are not generalizable to the flight regime
of most Air Force aircraft. This study represeuts the most compre-hensive field evaluation of strobe anticollision lights ever reported.
Secondary objectives included a determination of the intensityand color of strobes for reliable detection under dawn and dusk condi-ticns, and an evaluation of the effect of visibility, range andlocation of the light signal source on the viewer's eye.
Altaough carried out In the field, rather than in a laboratoryall aspects of the experiment were carefuliy controlled and thescientific method and contemporary data analysis techniques wereused. The results of this study are sufficient to resolve differencesof opinion regarding the capability of strobe anticollision lightsto increase the daylight conspicuity of Air Force aircraft.
As many as tventy-six Air Force subject pilots were seated ina semicircle of 20 foot diameter, fixating on a light fixture at thecenter of the semicircle. Seven strobe lights of varying luminousoutput and color were mounted on a tower 210 feet above ground leveland viewed at ranges of 2.88 and 4.68 statute miles from the observers.Subjects were asked to indicate when they observed the appearance of astrobe light source. The delay in each observar's response was measured.Visibility and background luminance were also measured. During twenty-two data collection periods, 20,555 threshold data points were obtained.
107' .. ; .. . ......... :. •I • , ,

Reaction time, probability of detection and probability offalse alarms were used as criteria to evaluate the effocts of strobecolor and intensity, location of strobe in visual field, visibilitybackground luminance and range. A general linear multivariate modelwas employed for the statistical analysis of the data.
The following conclusions were drawn as a result of thisexperiment:
a. When viewed against background luminances which mostfrequently occur during daylight flight, a strobe of even 36,000effective candela (E.Cd.) results in an unacceptably low probabilityof detection (0.15). It is beyond the state-of-the-art to designa strobe source of this luminance output for practical installationon aircraft. Strobes of 10,000 and 3500 R.Cd. resulted in proba-bilities of detection of 0.09 and 0.04 respectively under the saneconditions.
b. As predicted by Allard's Law, background luminance ismore significant thau light signal source luminous output indetermining detectability of sources. Therefore, under daylightconditions, large increases in luminous output result in relativelysmall increases in detectability.
c. Under dawn/dusk conditions, when a significant numberof detections occurred, the probability of detection is higherwithin + 300 of the center of the retina. The very short durationof the strobe source did not result in increased peripheral detection.
d. Due to the good weather which prevailed during datacollection, most of the data was collected at meteorologicalvisibilities of greater than five miles. No significant differencewas observed with visibilities between five to ten miles and visibilitiesgreater than ten miles.
e. Due to the rapid changes in background luminance whichoccur at dawn and dusk, insufficient data were collected to determineprecisely the intensity of strobe anticollision lights for dawn/dusk operations.
f. Contrary to some published literature, red strobes werenot superior to white of the same luminous Lntensity. In fact,white was slightly, but significantly, superior to red under thedarker conditions, when a reasonable number of detections occurred.
3.. F ~ ACTORS JETIGNT.fl
There are may factors which influence the detectability oflight signal sources. The following factors were studied in thisevaluation.
10
a. Strobe luminous flux (intensity).
b. Strobe color (red vs white).
c. Atmospheric transmissivity (visibility).
d. Background luminance.
e. Retinal location of strobe signal.
3.5.3 LIMITATIONS OF TEST
While the tower test described herein was far less expensivethan a flight test, it imposes certain limitations. rhe implica-tions of these are discussed in the following paragraphs.
3.5.3.1 •NOWLEDGE OF LOCATION OF STROBE
Since the strobe was mounted on a fixed tower, all subjectsknew the location of the source, In the real world, anotheraircraft could appear anywhere within the pilot's area of visualscan. The effect of this limitation would be to lower the thresholddata, i.e., to indicate better performance of the light sourcesthan coald be expected in flight conditions.
3.5.3.2 NO MULTIPLE LIGRT SOURCES
Multiple light sources installed in a single aircraft couldincrease the probability of detection while single sources onseveral aircraft in proximity (in a pattern, for example) mightincrease the probability of confusion. This is an area which mightrequire Investigation. but it in beyond the scope of obtainingthreshold data.
3.5.3.3 ATKOSPHUIC SCIMTILLATION
Atmospheric scintillation at ground level is greater than ataltitude. Due to the short duration of the strobe source, and therelatively narrow angular beam of the strobes used in the towertest, there was an increased probability of the light being refractedaway from the subjects' eyes. However, the strobes were turned onfor ten seconds per trial, with the subjects knowing where thesource was located. It is most unlikely, therefore, that the increasedscintillation at ground level had a significant Impact on the result-,
i109
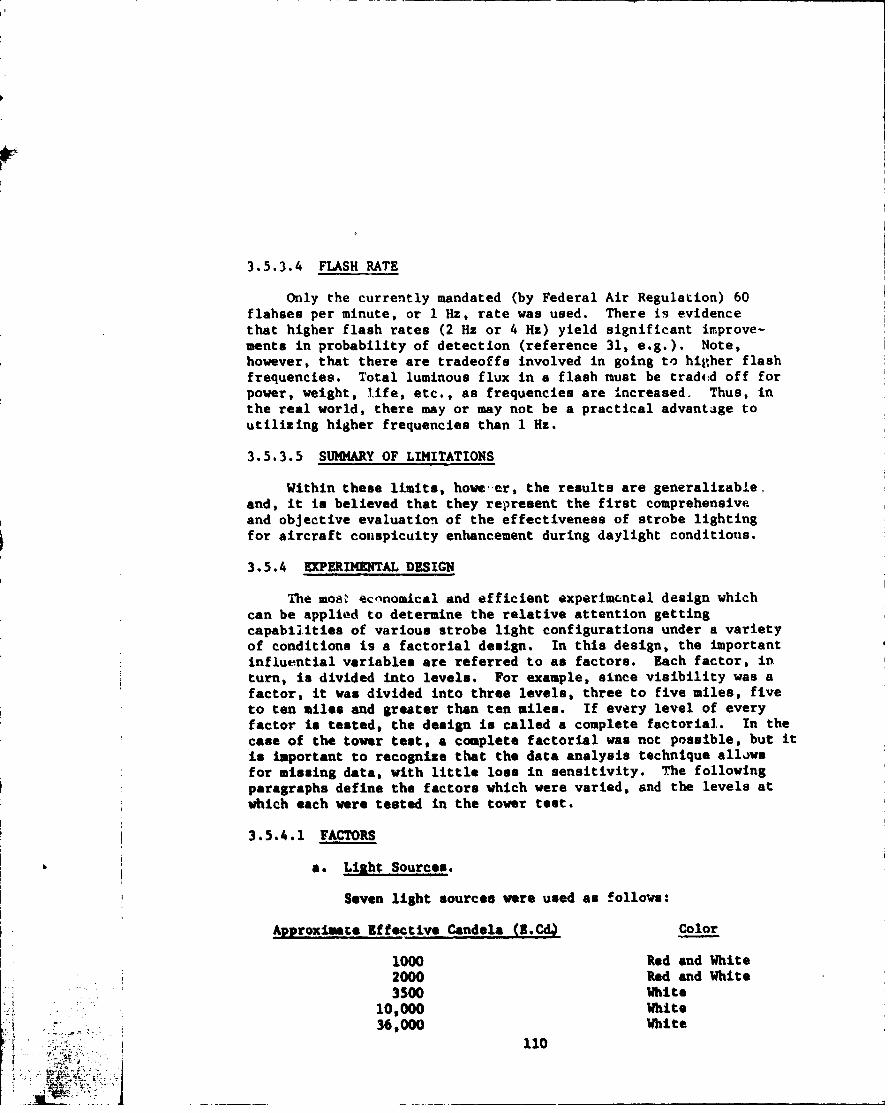
3.5.3.4 FLASH RATE
Only the currently mandated (by Federal Air Regulation) 60flahses per minute, or 1 Hz, rate was used. There is evidencethat higher flash rates (2 Hz or 4 Hz) yield significant improve-ments in probability of detection (reference 31, e.g.). Note,however, that there are tradeoffs involved in going to higher flashfrequencies. Total luminous flux in a flash rnust be tradcd off forpower, weight, life, etc., as frequencies are increased, Thus, inthe real world, there may or may not be a practical advantage toutilizing higher frequencies than 1 Hz.
3.5.3.5 SUMMARY OF LIMITATIONS
Within these limits, howe-er, the results are generalizable,and, it is believed that they represent the first comprehensiveand objective evaluation of the effectiveness of strobe lightingfor aircraft conspicuity enhancement during daylight conditions.
3.5.4 EXPERIMENTAL DESIGN
The mosa. economical and efficient experimcntal design whichcan be applied to determine the relative attention gettingcapabilities of various strobe light configurations under a varietyof conditions is a factorial design. In this design, the importantinfluential variables are referred to as factors. Each factor, inturn, is divided into levels. For example, since visibility was afactor, it was divided into three levels, three to five miles, fiveto ten miles and greater than ten miles. If every level of everyfactor is tested, the design is called a complete factorial. In thecase of the tower test, a complete factorial was not possible, but itis important to recognize that the data analysis technique allowsfor missing data, with little loss in sensitivity. The followingparagraphs define the factors which were varied, and the levels atwhich each were tested in the tower test.
3.5.4.1 FACTORS
a. Light Sources.
Seven light sources were used as follows:
Approximate Effective Candela (3.Cd) Color
1000 Red and White2000 Red and White3500 White
10,000 White36, 000 White
.10
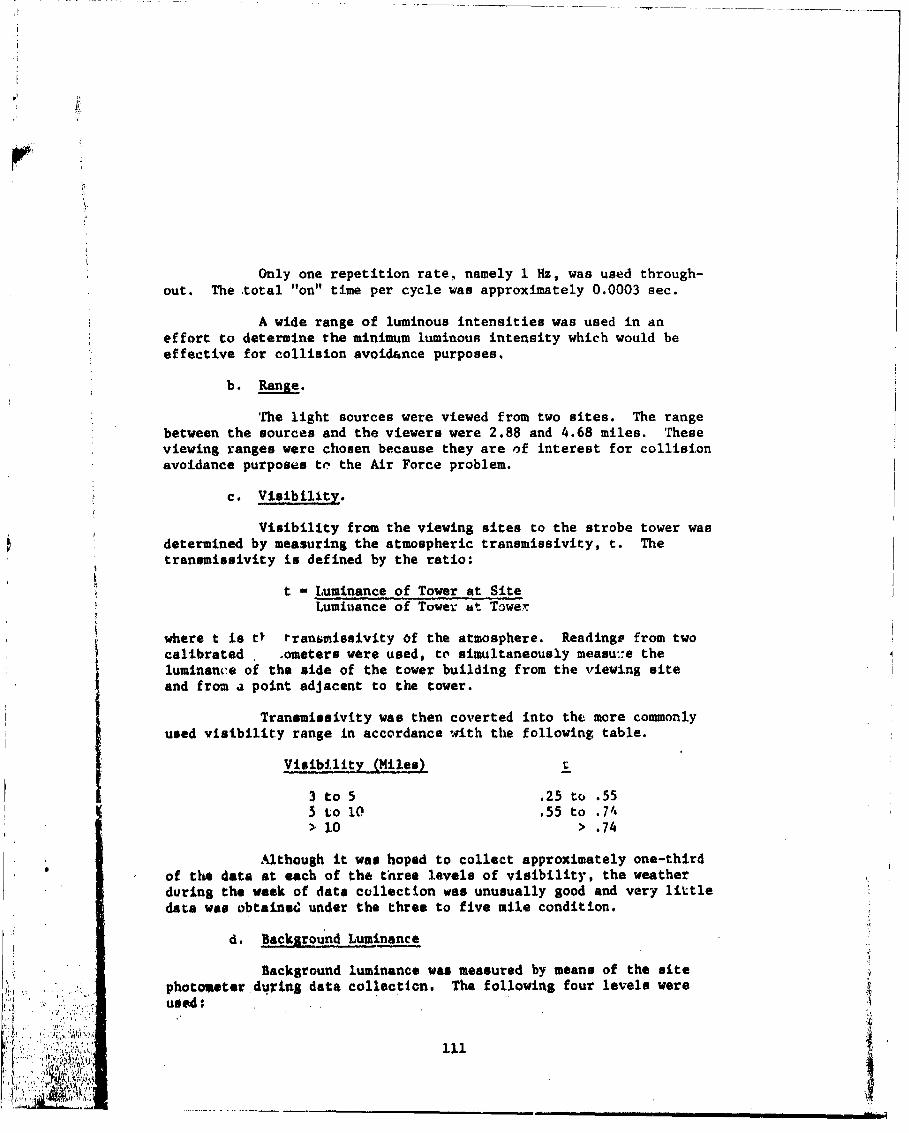
Only one repetition rate, namely 1 Hz, was used through-out. The total "on" time per cycle was approximately 0.0003 sec.
A wide range of luminous intensities was used in aneffort to determine the minimum luminous intensity which would beeffective for collision avoidance purposes.
b. Range.
The light sources were viewed from two sites. The rangebetween the sources and the viewers were 2.88 and 4.68 miles. Theseviewing ranges were chosen because they are of interest for collisionavoidance purposes to the Air Force problem.
c. Visibility.
Visibility from the viewing sites to the strobe tower wasdetermined by measuring the atmospheric tranemissivity, t. Thetransmiusivity in defined by the ratio:
t -Luminance of Tower at SiteLumiuance of Tower at Towe'-
where t is tf trans.misuivity of the atmosphere. Readinge from twocalibrated ometers wnre used, to simultaneously measuse thergluminance of the side of the tower building from the viewing siteand from a point adjacent to the tower.
Tranwmid sivity was then coverted into the more commonlyused visibility range in accordance with the following table.
Visibility (Miles)
3 to 5 .25 to .55s to 10 .55 to .74> >10 > .74
Although it was hoped to collect approximately one-thirdof the data at each of the three levels of visibility, the weather
* during the week of data collection was unusually good and very littledata was obtained under the three to five mile condition.
d. Background Luminance
Background luminance was measured by means of the site
photometerndun-ng data collection. The following four levels wereusedv
A 13.1:,At ( e )
3 o5.5t 5

Luminance (Ft.L.) Descriptor
< 10 Twilight to Night Sky10-100 Dark Day, Horizon Sky
J00-1000 Dark Earth or Medium HorizonSky
> 1000 Bright Sky or Snow on SunnyDay
e. Retinal Location
In flight, a pilot is required to search throughout hiscomplete visual field for other aircraft. One of the potentialadvantages of the brief strobe flash is that it will increase theprobability of detection of an intruder because it will be detectedperipherally, i.e., "out of the corner of your eye." To determinethe probability of detection over a full 100 horizontal field ofview, subjects were seated in a semicircle, fixating on a nearbydisplay. (See Section 3.5.6 below) Thirteen levels of retinallocation, varying from 00 (foveal) to +900 in the periphery weretested.
Figure 42 is a schematic of the arrangement of the
subjects.
3.5.5 TEST SITES
As stated above, observer sites with a .468 mile and 2.88 mileviewing range were used. The source tower had a south westerlyhearing with respect to the observer site at 4.68 miles and a southerlybearing with respect to the site at 2.88 miles. The sites wereselected so as to have an unobstructed view of a large pirtion ofthe tower on which the light signal sources were mounted (see Figure 44).Secondary considerations included the availability of power, telephonelines, subject conveniences, etc. Figure 43 is a map showing the loca-tion of the tower and the viewing sites.
The top of the tower building is 190 feet above ground level.The strobe lihts were mounted on top of a 20 foot antenna tower, toput the strobes at 210 feet above ground level (see Figure 45). Whenviewing from both mites, the strobes were definitely viewed againstthe horizon sky background.
3.5.6 PHYSIqAL ARRANGEMENT
initially, twenty-six subjects were seated in a complete semi-circle. After completion of at least one day at both the three and
112
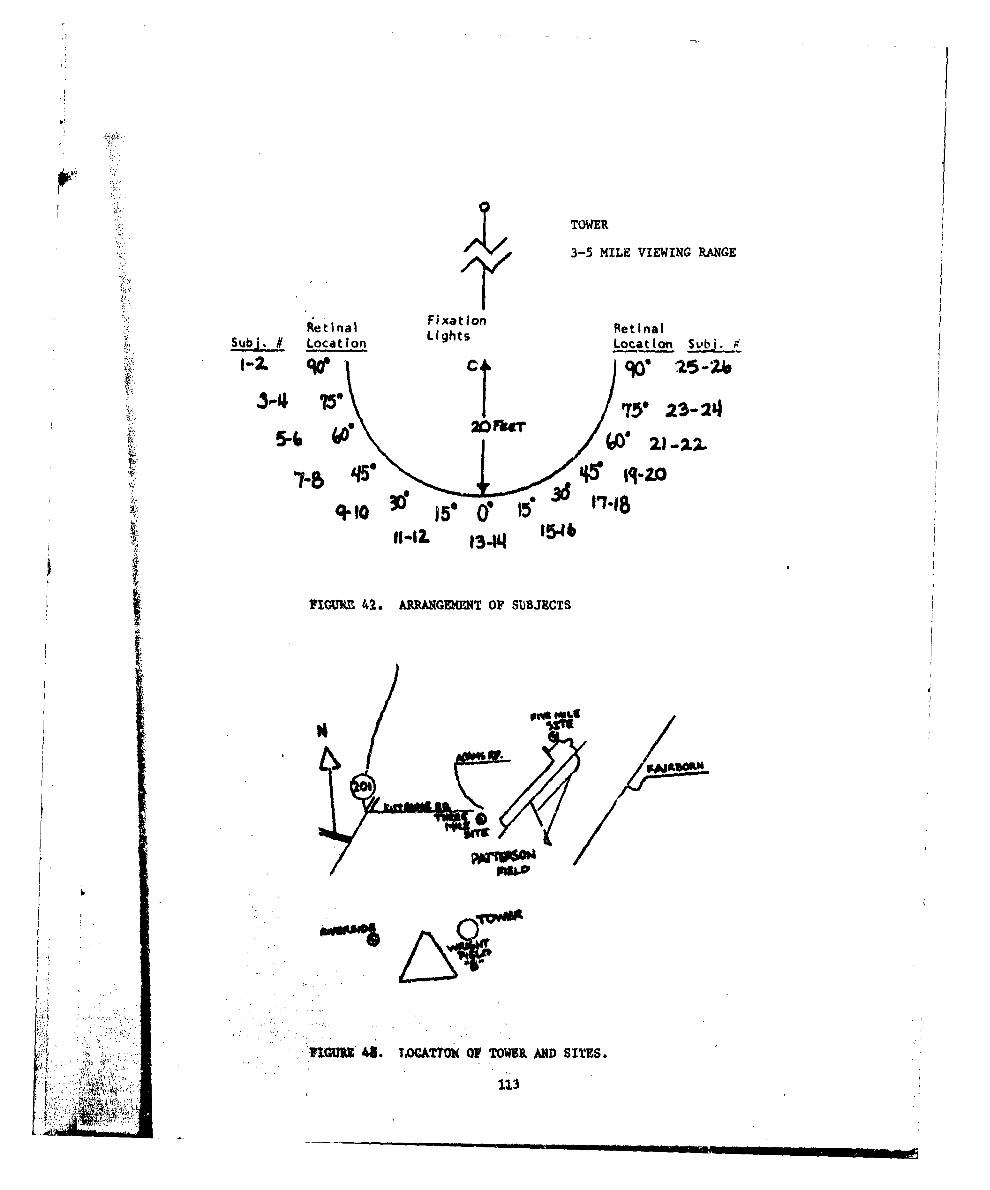
TOWER
3-5 MILE VIEWING RANGE
2 ~~FixationRtia
Suj eLctiona Lights Location S'bj.
75 23-2'4
o7_ q5*
q- t ~o 15 5
TIMM~ 42.* ARRANM4GEN1T OF SUBJECTS
113A
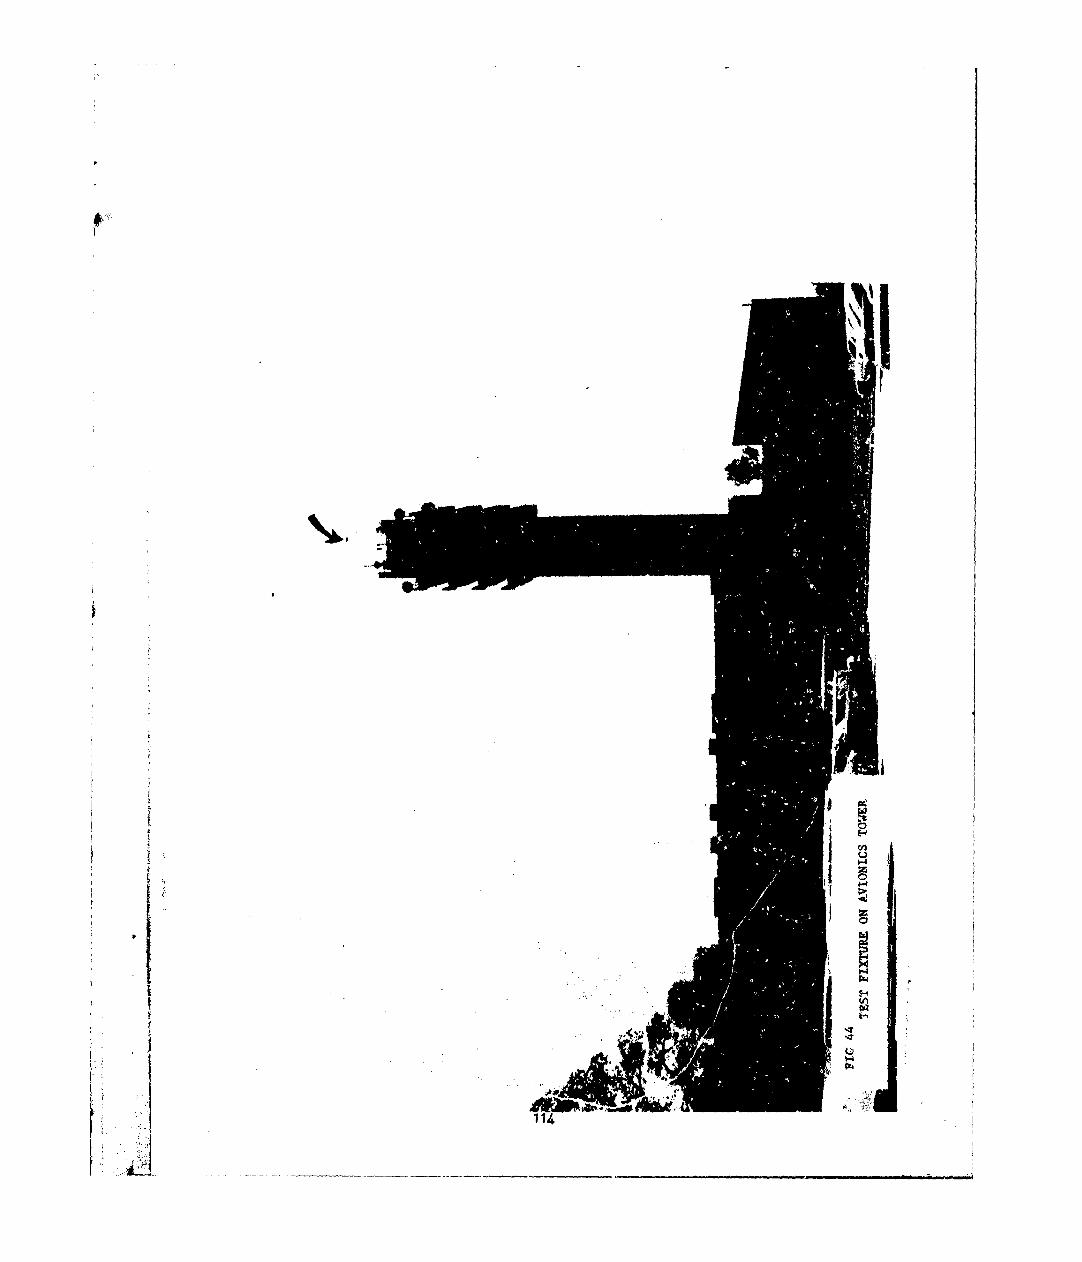
ii
Pt4 114 1144
"F 'ai: T
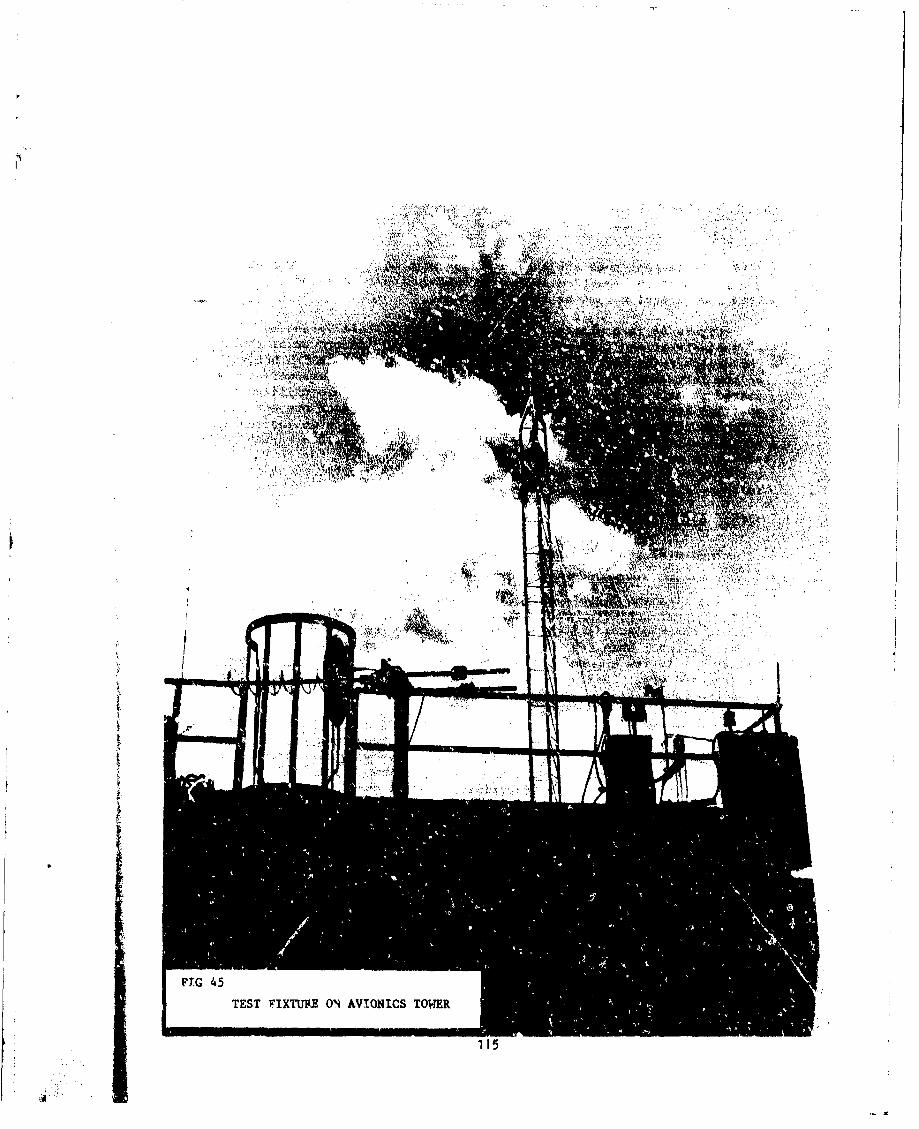
~Alm
FYI,
MIN
&LJtwo'4h ~
mo
FI 4
TETFXUE0 AINC OE
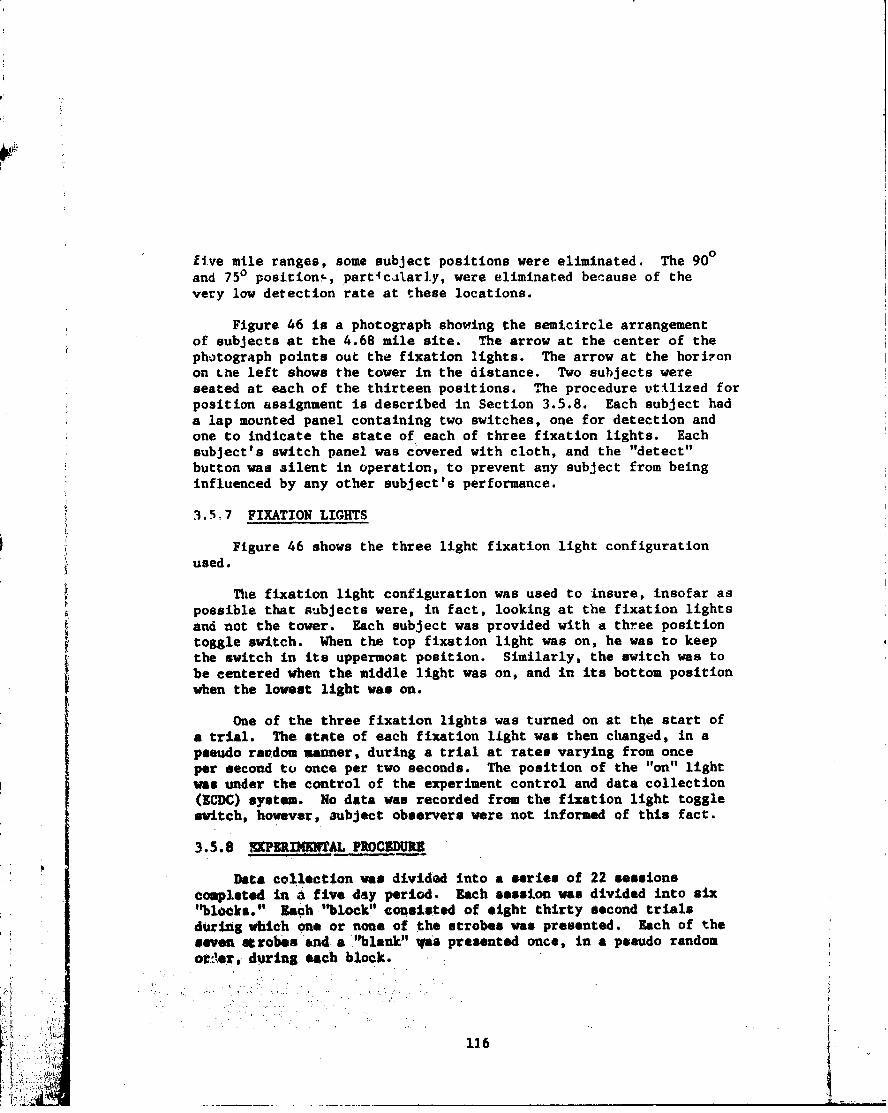
five mile ranges, some subject positions were eliminated. The 900and 750 position!, part 4calarly, were eliminated because of thevery low detection rate at these locations.
Figure 46 is a photograph showing the semicircle arrangementof subjects at the 4.68 mile site. The arrow at the center of thephotograph points out the fixation lights. The arrow at the horiponon the left shows the tower in the distance. Two subjects wereseated at each of the thirteen positions. The procedure utilized forposition assignment is described in Section 3.5.8. Each subject hada lap mounted panel containing two switches, one for detection andone to indicate the state of each of three fixation lights. Eachsubject's switch panel was covered with cloth, and the "detect"button was silent in operation, to prevent any subject from beinginfluenced by any other subject's performance.
3.5.7 FIXATION LIGHTS
Figure 46 shows the three light fixation light configurationused.
The fixation light configuration was used to insure, insofar aspossible that subjects were, in fact, looking at the fixation lightsand not the tower. Each subject was provided with a three positiontoggle switch. When the top fixation light was on, he was to keepthe switch in its uppermost position. Similarly, the switch was tobe centered when the middle light was on, and in its bottom positionwhen the lowest light was on.
One of the three fixation lights was turned on at the start ofa trial. The state of each fixation light was then changed, in apseudo rardom manner, during a trial at rates varying from onceper second to once per two seconds. The position of the "on" lightwas under the control of the experiment control and data collection(ECDC) system. No data was recorded from the fixation light toggleswitch, however, 3ubject observers were not informed of this fact.
..5.8 UPZR PROCEDURZ
Data collection was divided into a series of 22 sessionscompleted in a five day period. Each session was divided into six"`bloCks." Each "block" consisted of eight thirty second trialsdaring which one or none of the strobes was presented. Each of theseven u robos'and a "blsnk-" Vis presented once, in a pseudo randomorder,, during each block.
• |116
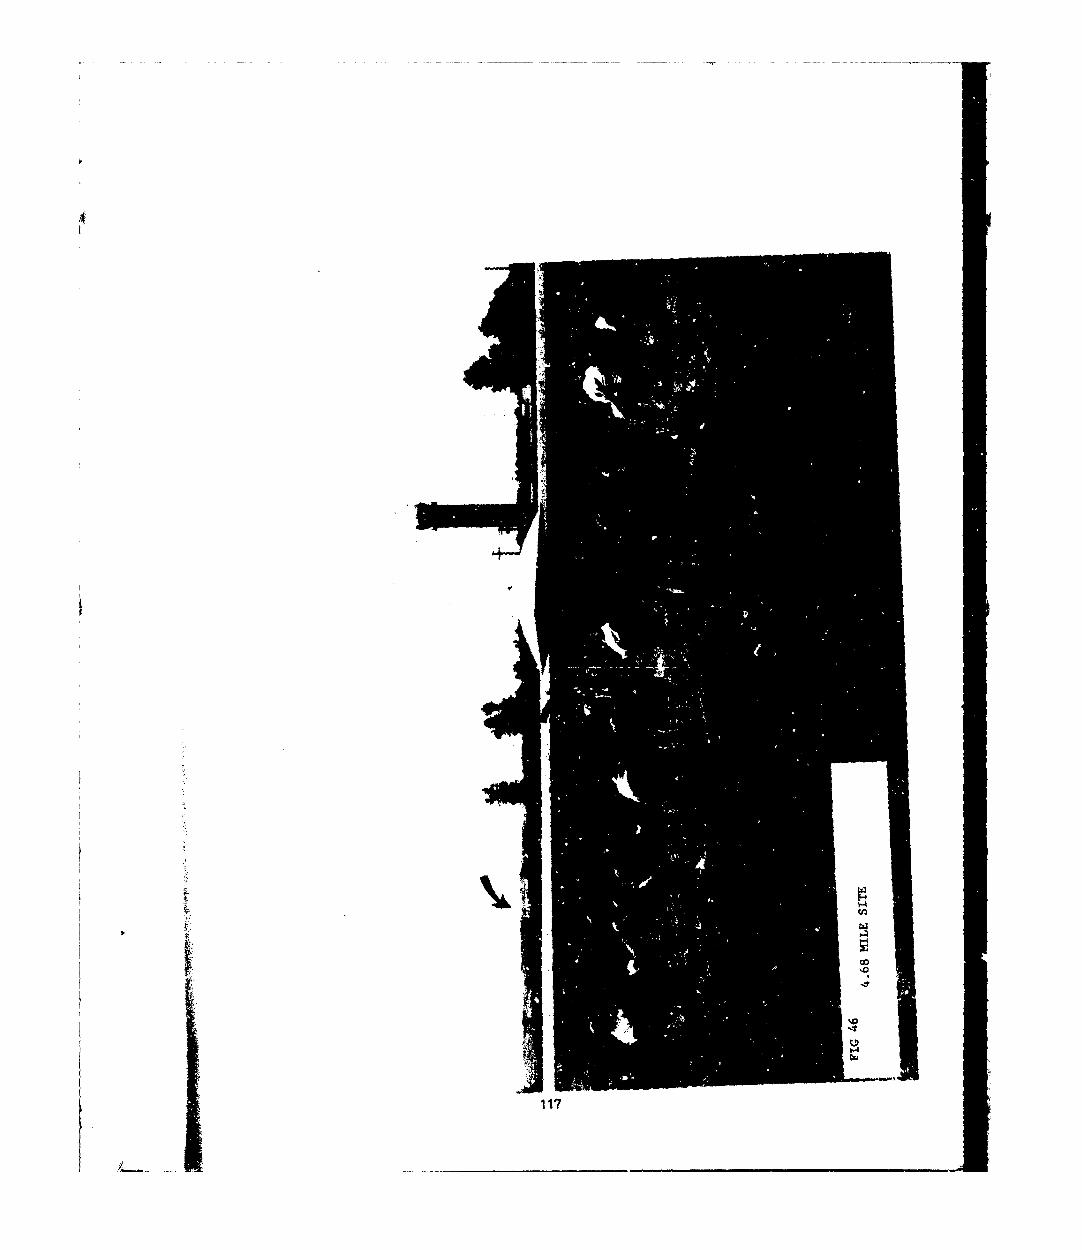
117
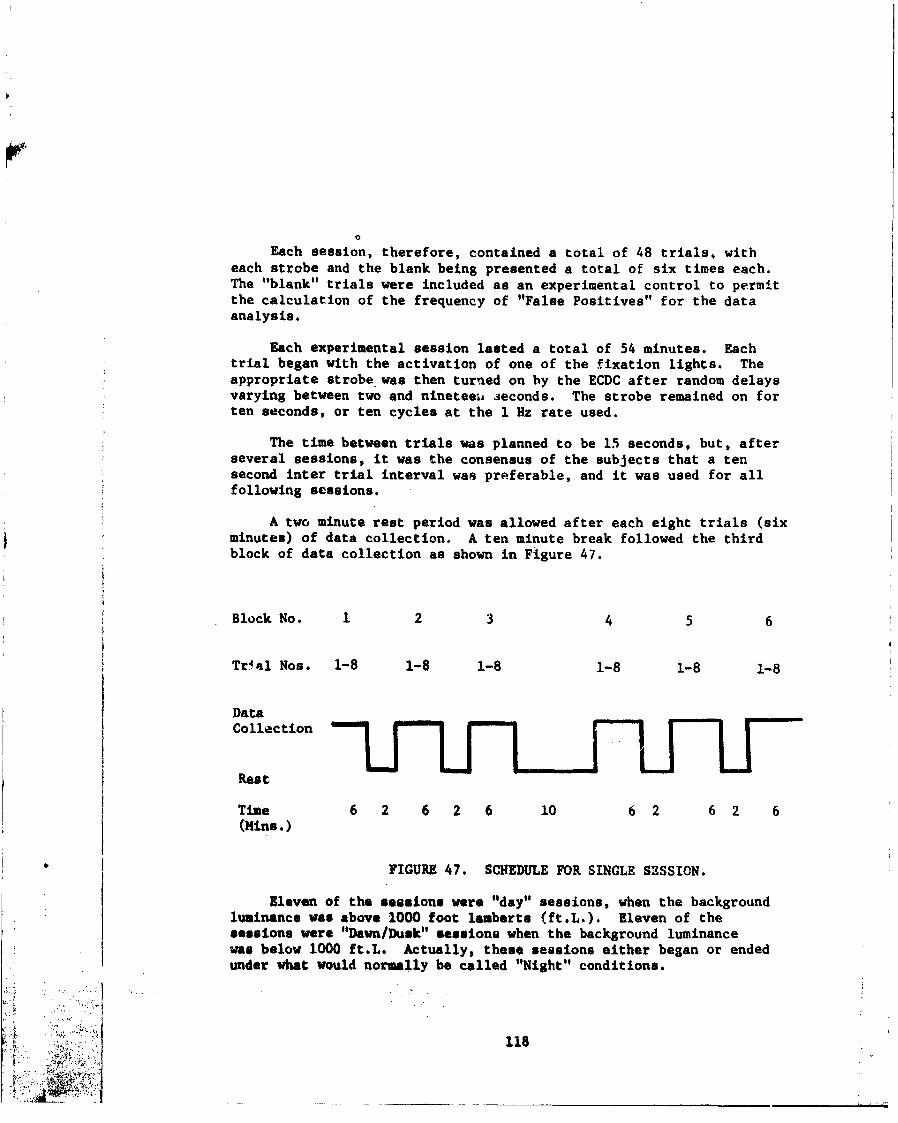
Each session, therefore, contained a total of 48 trials, witheach strobe and the blank being presented a total of six times each.The "blank" trials were included as an experimental control to permitthe calculation of the frequency of "False Positives" for the dataanalysis.
Each experimental session lasted a total of 54 minutes. Eachtrial began with the activation of one of the fixation lights. Theappropriate strobe was then turned on by the ECDC after random delaysvarying between two and nineteeit seconds. The strobe remained on forten seconds, or ten cycles at the 1 Hz rate used.
The time between trials was planned to be 15 seconds, but, afterseveral sessions, it was the consensus of the subjects that a tensecond inter trial interval was preferable, and it was used for allfollowing sessions.
A two minute rest period was allowed after each eight trials (sixminute.) of data collection. A ten minute break followed the thirdblock of data collection as shown in Figure 47.
Block No. 1 2 3 4 5 6
Trial Nos. 1-8 1-8 1-8 1-8 1-8 1-8
DataCollection
Rest
Time 6 2 6 2 6 10 6 2 6 2 6
(Mine.)
* I FIGURE 47. SCHEDULE FOR SINGLE SESSION.
* IEleven of the sessions were "a" sessions, when the backgroundluminance was above 1000 foot lamberts (ft.L.). Eleven of thesessions were "Dawn/Dusk" sessions when the background luminancewas below 1000 ft.L. Actually, these sessions either began or endedunder what would normally be called "Night" conditions.
118

3.5.9 RANDOM ASSIGNMENT OF SUBJECTS
To assure the randor assignment of subjects to retinal locations,each of the subjects was issued a tablet having a letter, from A to Z.A was assigned seat 1, B seat 2, through Z seat 26. The subjectsretained the letter until after switching seats at mid-session,when the letters were collected. This procedure was repeated foreach session. At the end of the third block, the subjects changedlocations.
3.5.10 SUBJECTS
All subjects used in the study were Air Force pilots rangingfrom 23 to 54 years of age, with a mean of 31.6 years. It wasexpected that the older pilots, who tend to have more administrativepositions, would have fewer recent flight hours than the younger ones.This was, in fact, the case. The mean age of pilots with no flighthours In the six months prior to the test was 38.0 years.
Performance by all pilots over all retinal locations was soconsistent, however, that it can be assumed that the relationbetween age and flight hours had no significant effect on the
w sample used.
Twenty-three of the subject pilots were on a temporary dutystatus at WPAFB for the purpose of taking part in this experiment.The following is a list of the commands and the number of pilotsrepresenting each.
Tactical Air Command 4Strategic Air Command 3Air Defense Coimnd 2Military Airlift Command 3AF Logistics Command 2Air Training Command 3AF Systems Command 2Air National Guard 2Air Force Reserve 2
Due to the fact that data were collected over as much as eighteenhours per day, additional subjects were required. Approytmately 80pilots from Aeronautical Systems Division at Wright-Patterson APB alsoserved am subjects.
119
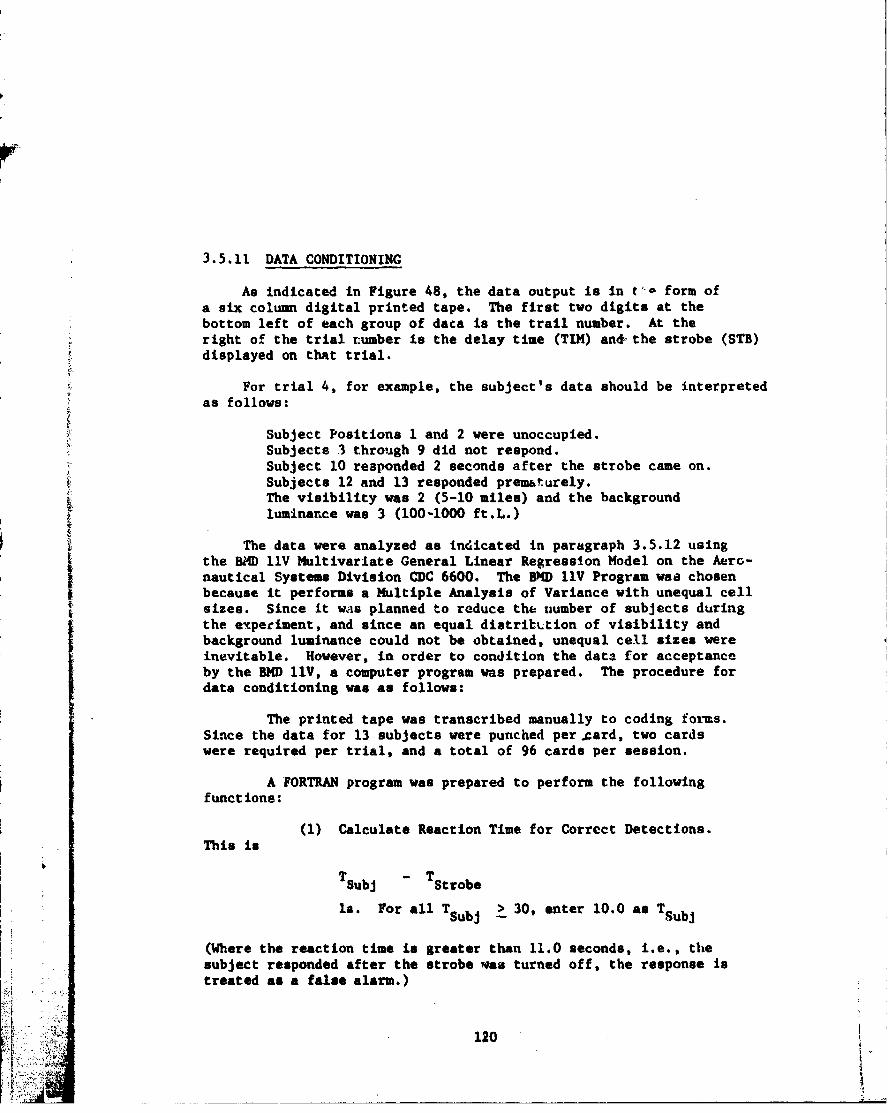
3.5.11 DATA CONDITIONING
As indicated in Figure 48, the data output is in t'- form ofa six column digital printed tape. The first two digits at thebottom left of each group of data is the trail number. At theright of the trial number is the delay time (TIM) and& the strobe (STB)displayed on that trial.
For trial 4, for example, the subject's data should be interpretedas follows:
Subject Positions 1 and 2 were unoccupied.Subjects 3 through 9 did not respond.Subject 10 responded 2 seconds after the strobe came on.Subjects 12 and 13 responded prematurely.The visibility was 2 (5-10 miles) and the backgroundluminance was 3 (100-1000 ft.L.)
The data were analyzed as indicated in paragraph 3.5.12 usingthe BMD llV Multivariate General Linear Regression Model on the Aero-
j nautical Systems Division CDC 6600. The BND llV Program was chosenbecause it performs a Multiple Analysis of Variance with unequal cellsizes. Since it was planned to reduce the number of subjects duringthe experiment, and since an equal distribLtion of visibility andbackground luminance could not be obtained, unequal cell sizes wereinevitable. However, in order to condition the data for acceptanceby the BMD lV, a computer program was prepared. The procedure fordata conditioning was as follows:
The printed tape was transcribed manually to coding forms.Since the data for 13 subjects were punched per card, two cardswere required per trial, and a total of 96 cards per session.
A FORTRAN program was prepared to perform the followingfunctions:
(1) Calculate Reaction Time for Correct Detections.This is
TSubj S Strobe
Ia. For all TSubJ > 30, enter 10.0 as TSubj
(Where the reaction time is greater than 11.0 seconds, i.e., thesubject responded after the strobe was turned off, the response istreated as a false alarm.)
r~ 120
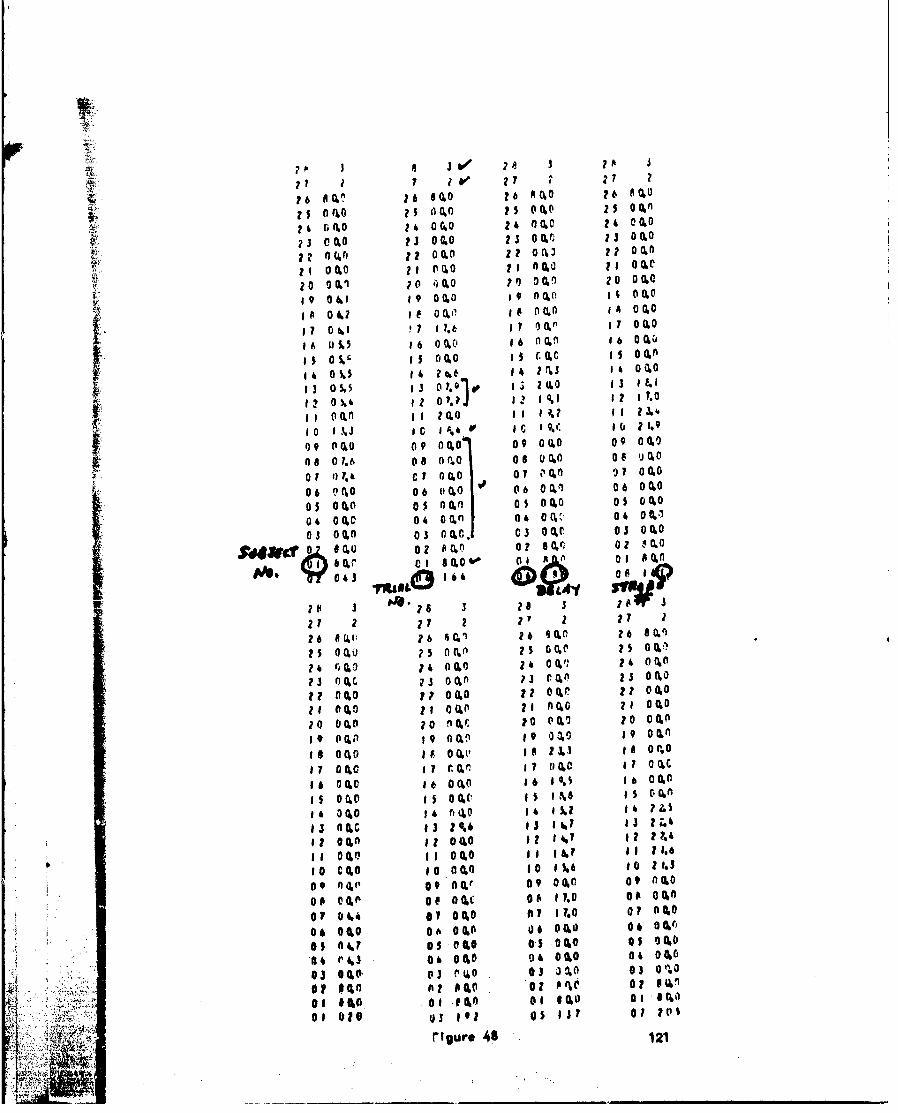
a6 N00 2 6 80.0 16 A0, 26 0
n5 (00 25 00, 250, 2 0G r4 0 ?4 00.0 2 4 00, 24 00,0
7 3 0 0.0 13 00.0 2 3 0Q,0 r-3 00.0
2? f(4 r 22 00.0 z 7 32 2? 00,0
2 1 00,0 2 1 P00.0 1 1 0 IXO ~ I1
20 00.1 ? 0 i)0,0 70 00.1 20 0%0,
99 049 99 00.0 19 9, 9 00600
A~ 04.2 e. a0 DO I ofl A 00,0
?7 09 '.1 ? ~ I? ?It ~ I17 00,0iIA 115Ls 1 6 00.0 n6 0.11 196 0 0,
95 05. V 00.0 Gs r.0C Is ICOO
9405 %S4 4o66 1 2~L V 00.0
3 05.5 93 0 7. 10 1 5 2 (0 3 u E
920 %942 03J 92 909 92i.0
9900f V 20.0 I .7 973'L.
190 93-%3 .6 a~, I c0 9J r910 27109
Do0.0 o 000.0 090,
Of 1) C 0 C60, 0? 8l0, n 071 0.0
IF 06 260310
26 9 (to 28 (10.0 26 0,10768,
25 00.1J 05 $ cy 256 ) 0040 2 5 00.0
24 0 0,0 04 00, %n 060,' 4-14 00,0
a 3 00,0 03 J 0f a7L 1 3 0 V 0 3 00.0
790 a1, 7. o. 29 "0, 29 00,
20 O, 20 1 40, 20 1 . 20 00,
98 0 1 0 -6 2 0L 8 23. 3 0.
269 41 0006 0P.0 96 95 ab 00,)
1s 00.0 9 5 00, MI95 946 00 2s a01,
2 00, 14 t0%0 294 95. '! 7.5
1 3 n1. 93c 2*. j3 94, On 010 13
f2 100 toI2 00.0 2 94r 92 240.0
Z 1 00f ILI 00,0 99P 9A. II 29.4 G
20 C0,0 90 00,0 t 900 to, 90O29.
09 0 CL P09 nOMP 09 00, 09 00,0n
0a 00.k0 09 Olt,~ 8 08 P009
01 0 o6c 06 0-0 I? 9polo0 07 N0,
0& 0n0c06 00, (A 0, 04 00,60
05 04,? 05 s , 0a 00 05 t.0. A
64'W30 000 ,0 04Q 0.0 04 00Z,5
03 00,0- 913 24*0 @ 3 1 60 03 00Z.6
0 . eo0 0~ 02 100i n 4,1 09 0 On 09 060, 09 8040~
OF 0. kk 93704 0? 00.0
09 a020 l00 4 a
otg . 40 0121
lb. Eliminate all T SubJ > 30 from further analysis
(2) Count the number of T > 30 Strobes I-7 by StrobeNumber (missed detections).
(3) Count the number of TSubj < 30 for Strobe 8 - nostrobe (false alarms).
(4) Count the number of T - T > 1.0 second forStrobes 1-7 by strobe (early alarms). strobe Subj 1
j (5) The sum of 3 and 4, by strobe (total false alarms).
3.5.11.1 DATA ANALYSIS PROCEDURE
All of the above data were segregated by all of the main effects(factors), and formatted ior input to the BMD llV Multivariate GeneralLinear. Hypothesis Model Program.
The BMD 11V Multivariate General Linear Hypothesis Model Programwas used to analyze the data. Several analyses were performed, allresulting in regression coefficients and the analyses of varianceand covariance. F statistics were separately tested by means of theScheffe test. The following paragraphs describe these analyses.
a. Reaction TimeTwo separate analyses were conducted for reaction time.
The reason for this is that, because there were non-detections, reactiontime and detection measures were not independent.
The first analysis assigned a value of ten seconds to allnon-detections, thus truncating the reaction time distributicn, butincludirng all trials. The General Linear Model makes no assumptionsregarding the distribution of the data.
The second reaction time analysis was performed, eliminatingall non-detections. This analsis, although it utilized only a portion0o- the data was sensitive to differences between signal sources whichwere detected.
The first analysis will therefore include reaction times on alldata points, whether detects or non-detects. The second analysiswill not have reaction times entered for non-detects, and will, therefore,not lsklude all data points for the dependent variable, reaction time.
I ~ 122
b. Detections
The number of detections for the trials during which a,trote was present were analyzed. This provide' the measure of"hits" or correct aetections.
c. False Positives
The number of reported detections for the trials duringwhich no strobe was turned on was subjected to a separate analysis.Similarly, the number of times a detection was recorded prior tothe start of the strobe presentation, by more than one second, wasanalyzed. Finally, the sum of these two types of false positiveswas analyzed. This is the total false alarms.
d. False Positives
The false positives were used to correct for variationfin the criteria employed by the subjects. This correction was appliedin the classical psychophysical manner:
PC as Po -f
1 - Pf
where PC is the Corrected Probability of Detection. *
P0 is the Empirically Obtained Probability of Detection(subjec.. to the limitations that Po 1 is set equal to 0,9999 and P0
0.)0 is set equal to 0.0001) Pf is the (obtained) probability of afalse alarm.
3.5.12 THE ANALYSIS OF DATA
3.5.12.1' THE MODEL
The model used to statistically test the results of the test isa Multivariate General Linear Hypothesis. Denoting the Main Effects(or factors) as:
* IL - Lights
V - Visibility
* .I - Background Luminance
R - Range
E (Eye) Retinal LocationAF 123
The model is then:
y u + L + Vj + Bk + R + E + LVj + LBlk + LR4 + LEn + Ei m lk m in ijkmn
where Eijku is the residual error after fitting all the main and inter-
action effects, and u is the estimate of the population mean.
The Li through L~tn are partial regression coefficients which areused to develop parameý:ers for a Multiple An&lysia of Variance. ThreeDependent Variables, namely:
RT - RXaction Time
cP - Corrected Probability of Detection
fP - Probability of a False Alarm
were used.
i The raw data from the printer were key punched to be conditionedfor further analysis. The BMD llV Multivariate General LinearHypothesis was used to test the fit of the data to the model, bygenerating approximate F statistics for the Analysis of Variance.
Since this model is susceptible to differing results, dependingon the order in which the variance due to Main affects is partitionedfrom the model, five separate analyses were performed in the following
LVBRE
RLVBE
VLRBE
ULRVE
ELBRV
3.5.12.2 RESULTS - PRDLARY ANALYSES
The data conditioning program sorted the data in two passes.On pass one, all non detections were assigned a Reaction Time (R.T.)of ten seconds. On pass two, the non crtects were eliminated frcm
124Iq

the Reaction Time Analysis. Separate Analysis of Variance wereperformed for each pass. Although all three dependent variables(R T., Pp and PC) are entered into both analyses, R.T. contributes moreto fitting the model on pass one, while PF and PC contribute more onpass two. This is due to the fact that, while all data points are
* present for the dependent variable, R.T. on pass one, only the detectR.T.s are present on pass two.
As stated above, half of the data collection sessions were underdaylight conditions and half under dawn/dusk conditions. The datawere, therefore, analyzed In the following ways:
1 a. All Data - Pass one and two
Sb. Daylight Data - Pass one and two
c. Dawn!Dusk Data - Pass cne and two
Also as stated above, the F statistics which result from theanalyses differ as a function of the order in which the variancesdue to main effects are partitioned. For this reason the aboveanalyses were repeated five times each. It was found that, althoughthere were some relatively small differences (the magnitude of theshift of V was, occasionally, fairly large, due to the small number oftrials at three to five miles visibility) due to order, the significanceof the F statistics was not affected, hence the LVBRE order will beused throughout this report. Because all Daylight Sessions were atbackgrounds above 1000 ft.L., B is not a main effect for daylightsessions, and the order for daylight is LVRE. To be conservative,the a priori level chosen was 0.01. No significant interactioneffects were observed, hence, all of the following results arebased on pooling all interactions with the error term.
ALL SESSIONS
Table 14 shows the obtained F statistics and degrees of freedomfor the main effects for all sessions combined.
1~ 1.25
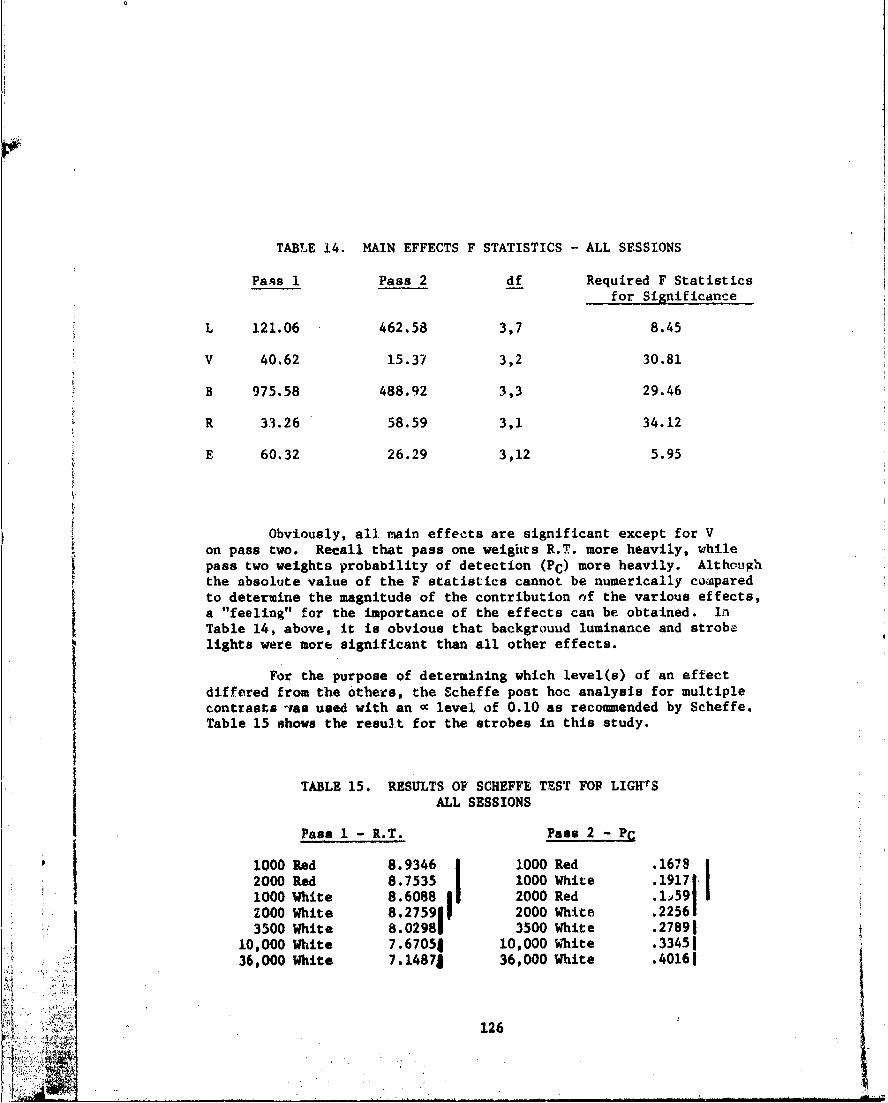
TABLE 14. MAIN EFFECTS F STATISTICS - ALL SESSIONS
Pass I Pass 2 df Required F Statisticsfor Significance
L 121.06 462.58 3,7 8.45
V 40.62 15.37 3,2 30.81
B 975.58 488.92 3,3 29.46
R 33.26 58.59 3,1 34.12
E 60.32 26.29 3,12 5.95
Obviously, all main effects are significant except for Von pass two. Recall that pass one weights R.T. more heavily, whilepass two weights probability of detection (PC) more heavily. Althoughthe absolute value of the F statistics cannot be numerically comparedto determine the magnitude of the contribution of the various effects,a "feeling" for the importance of the effects can be obtained. In
Table 14, above, it is obvious that backgrouud luminance and strobelights were more significant than all other effects.
For the purpose of determining which level(s) of an effectdiffered from the others, the Scheffe post hoc analysis for multiplecontrasts -ias used with an - level of 0.10 as reco mended by Scheffe.Table 15 shows the result for the strobes in this study.
TABLE 15. RESULTS OF SCHEFFE TEST FOP LIGHTVSALL SESSIONS
Pass 1 -R.T. Pass 2 - PC
2000 Red 8.7535 1000 White .19171.
1000 White 8.6088 2000 Red .159|2000 White 8.275911 2000 White .2256,
3500 White 8.02981 3500 White .2789110,000 White 7.67051 10,000 White .3345136,000 White 7.1487S 36,000 White .40161
126
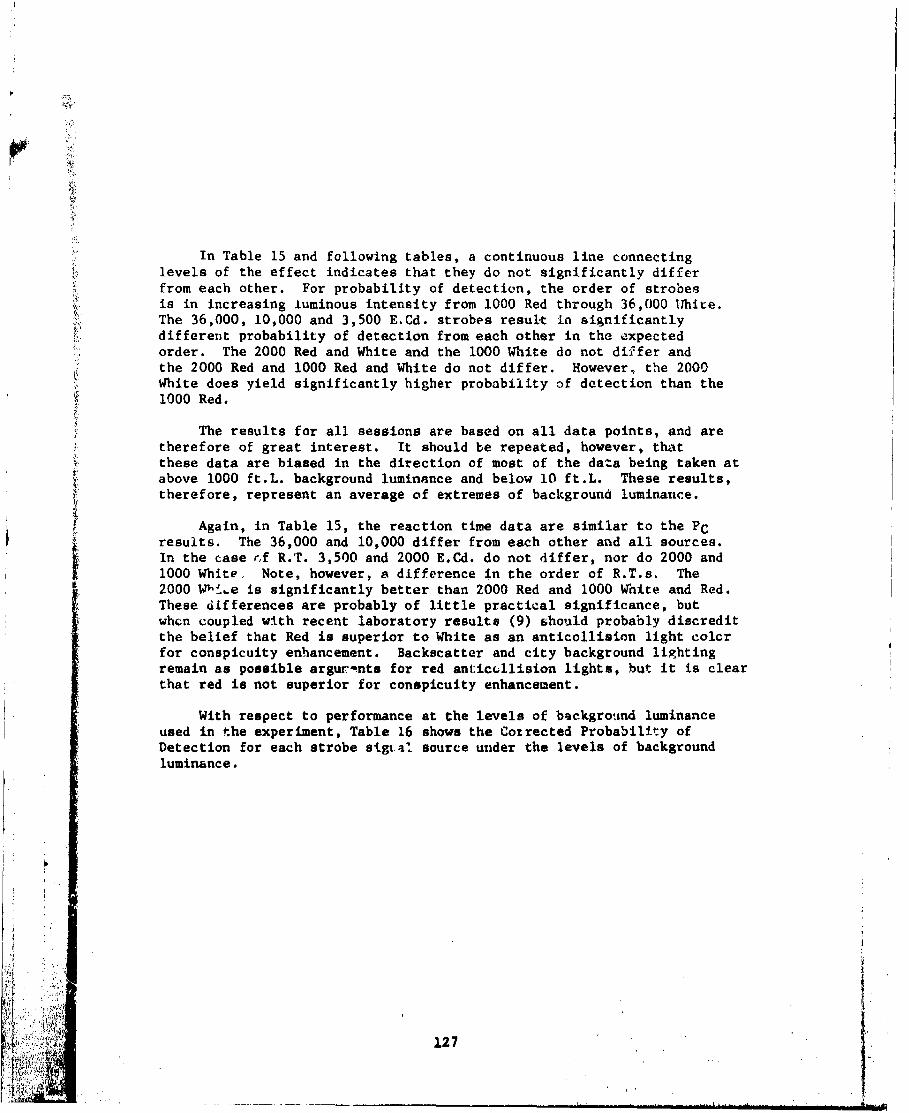
In Table 15 and following tables, a continuous line connectinglevels of the effect indicates that they do not significantly differfrom each other. For probability of detection, the order of strobesis in increasing luminous intensity from 1000 Red through 36,000 WhIte.The 36,000, 10,000 and 3,500 E.Cd. strobes resul~t in significantlydifferent probability of detection from each other in the expectedorder. The 2000 Red and White and the 1000 White do not differ andthe 2000 Red and 1000 Red and White do not differ. However, the 2000White does yield significantly higher probability of detection than the1000 Red.
The results for all sessions are based on all data points, and aretherefore of great interest. It should be repeated, however, thatthese data are biased in the direction of most of the data being taken atabove 1000 ft.L. background luminance and below 10 ft.L. These results,therefore, represent an average of extremes of background luminance.
Again, in Table 15, the reaction time data are similar to the PCresults. The 36,000 and 10,000 differ from each other and all sources.In the case r~f R.T. 3,500 and 2000 E.Cd. do not differ, nor do 2000 and1000 White. Note, however, a difference in the order of R.T.s. The2000 Wlnthe is significantly better than 2000 Red and 1000 White and Red.These differences are probably of little practical significance, butwhen coupled with recent laboratory results (9) should probably discreditthe belief that Red is superior to White as an anticollision light colorfor conspicuity enhancement. Backscatter and city background lightingremain as possible argur-nts for red anticcllision lights, but it is clearthat red is not superior for conspicuity enhancement.
With respect to performance at the levels of background luminanceused in the experiment, Table 16 shows the Corrected Probability ofDetection for each strobe slgi'a. source under the levels of backgroundluminance.
vtw+'+•, ___.....127
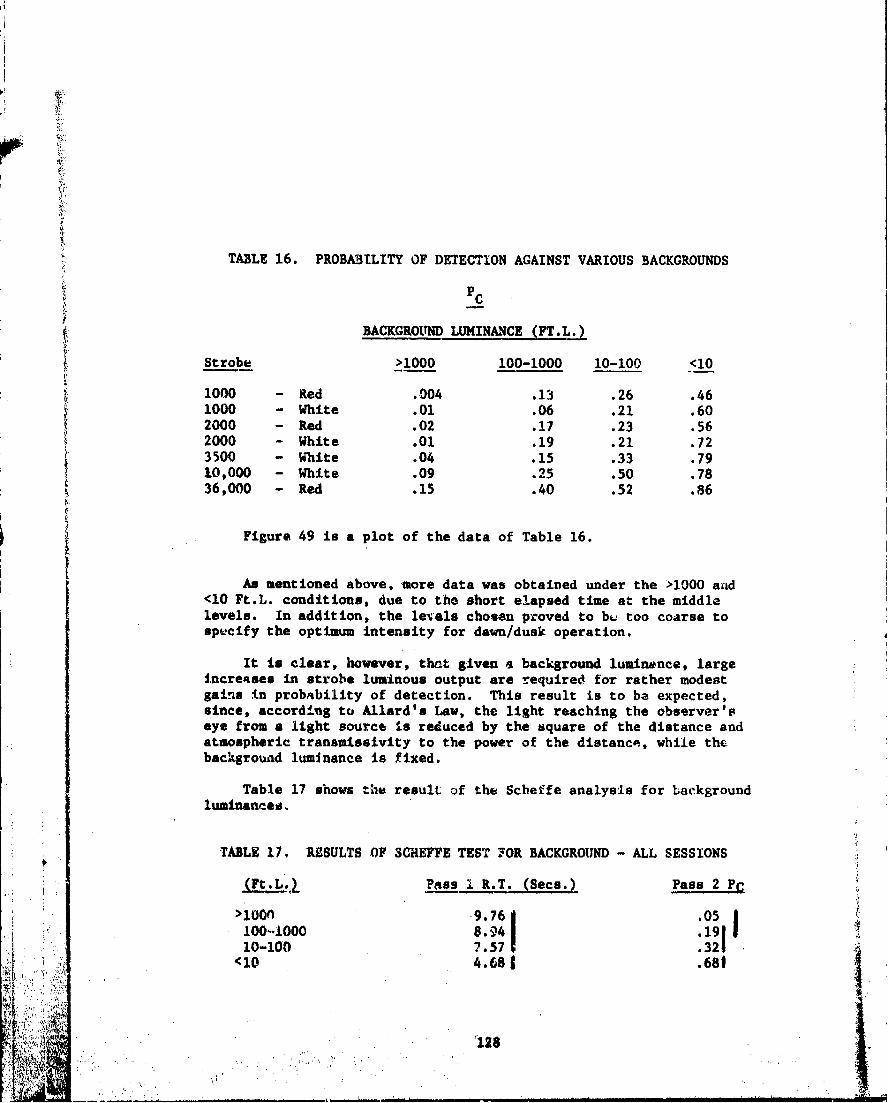
TABLE 16. PROBABILITY OF DETECTION AGAINST VARIOUS BACKGROUNDS
Pc
BACKGROUND LUMINANCE (FT.L.)
Strobe >1000 100-1000 10-100 <10
1000 - Red .004 .13 .26 .461000 - White .01 .06 .21 .602000 - Red .02 .17 .23 .562000 - White .01 .19 .21 .723500 White .04 .15 .33 .7910,000 - White .09 .25 .50 .7836,000 - Red .15 .40 .52 .86
Figure 49 is a plot of the data of Table 16.
As mentioned above, more data was obtained under the >1000 and<10 Ft.L. conditions, due to the short elapsed time at the middlelevels. In addition, the levals chosen proved to bu too coarse tospecify the optimum intensity for dawn/dusk operation.
It is clear, however, that given a background lumine.nce, largeincreases in strobe luminous output are required for rather modestgains in probability of detection. This result is to be expected,
since, according to Allard's Law, the light reaching the observer'seye from a light source is reduced by the square of the distance andatmospheric transmissivity to the power of the distance, while thebackground luminance is fixed.
Table 17 shows the result of the Scheffe analysis for backgroundluminanceo.
TABLE 17. RESULTS OF SGHEFFE TEST FOR BACKGROUND - ALL SESSIONS
(Ft.L_,4 Pass I R.T. (Seca.) Pass 2 PC
>luof .9.761 .05100-0i•0oo 8.,4 .19I10-100 7.57 .321
<10 4.681 .681
t 128

00 0
\ 0
Q4 0
% o .-
0 00
0.--
C
129n
-----00 O0
L L L.-
.- , .+. . .. I~!• l'-•;i + + S; " : +.•".! ..J
• .•, .• . • . .o. I.-
+•"•++ ++ + •+I oo Q1., 1 a. N :-2+
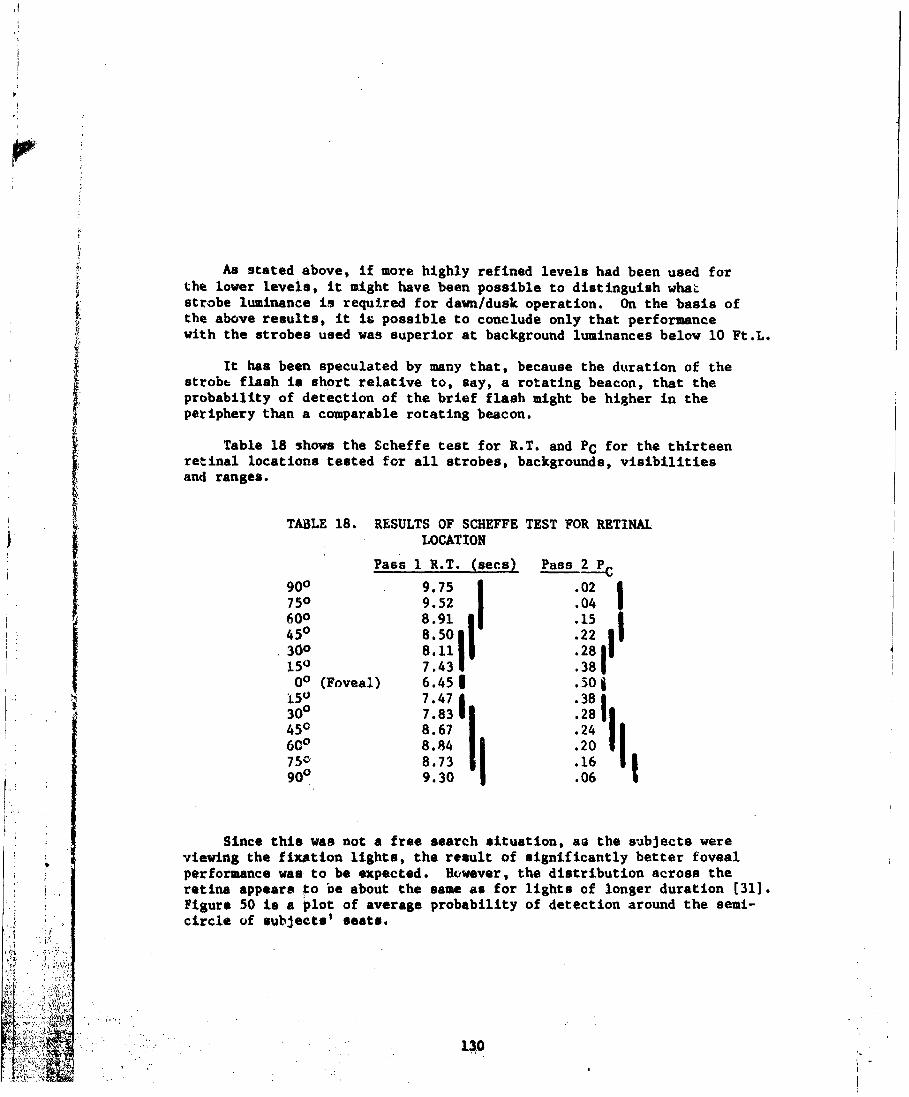
r
As stated above, if more highly refined levels had been used forthe lower levels, it might have been possible to distinguish whalstrobe luminance is required for dawn/dusk operation. On the basis ofthe above results, it is possible to conclude only that performancewith the strobes used was superior at background luminances below 10 Ft.L.
* It has been speculated by marny that, because the duration of thestrobt flash is short relative to, say, a rotating beacon, that theprobability of detection of the brief flash might be higher in theperiphery than a comparable rotating beacon.
Table 18 shows the Scheffe test for R.T. and PC for the thirteenretinal locations tested for all strobes, backgrounds, visibilitiesand ranges.
TABLE 18. RESULTS OF SCHEFFE TEST FOR RETINALi LOCATION
Pass 1 R.T.-(secs) Pass 2 P
900 97 .02750 9.52 .04600 8.91 15450 8.50 22300 8.11 .28150 7.43 .3800 (Foveal) 6.453 .30O15U 7.47 .38300 7.83 .28450 8.67 .24
600 8.84 .20750 8.73 .16 |900 9.30 .06
Since this was not a free search situation, as the subjects wereviewing the fixation lights, the result of significantly better fovealperformance was to be expected. However, the distribution across theretina appears go be about the same as for lights of longer duration [31].Figure 50 is a plot of average probability of detection around the semi-circle of subjects' seats.
13,0
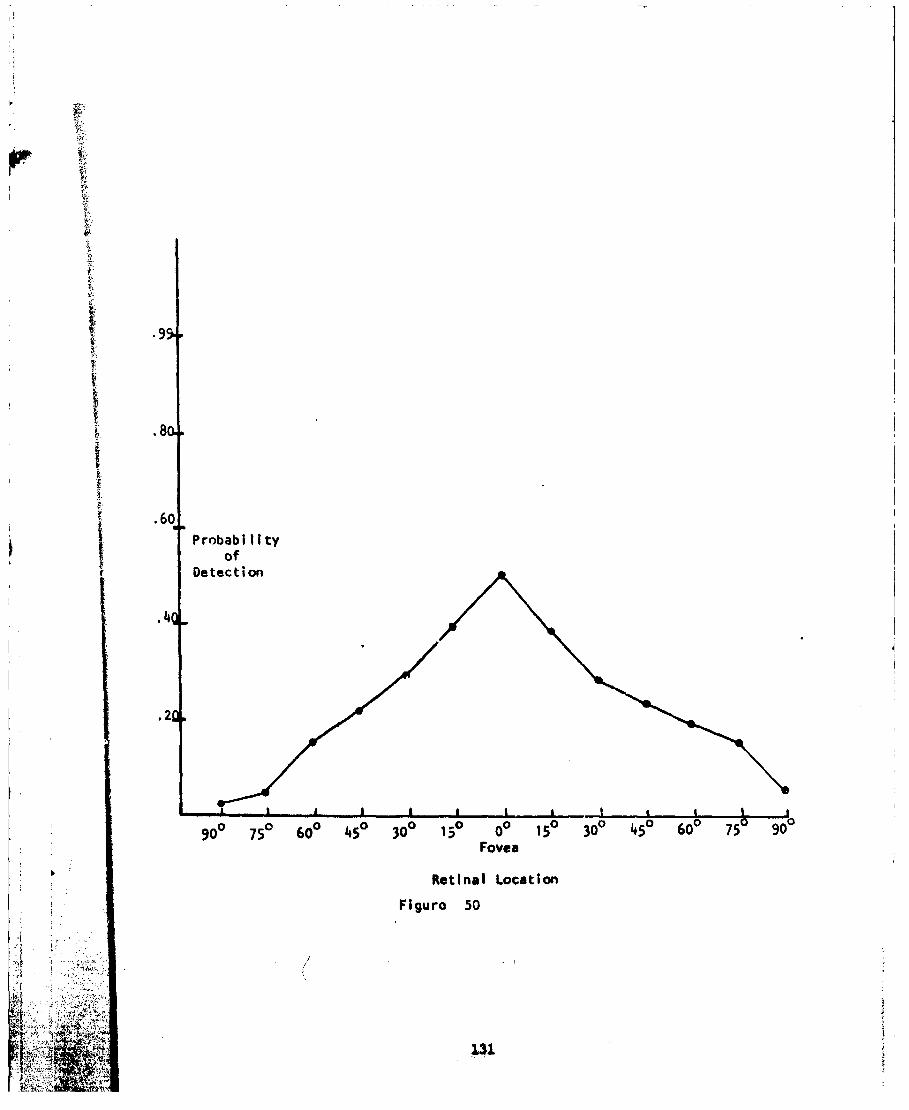
.99.
.8 -
.6o
j I Probabilityof
r Detection
A.2
900 750 600 450 300 150 00 150 30o 450 600 750 900
Fovea
Retinal Location
Flgura 50
Al131
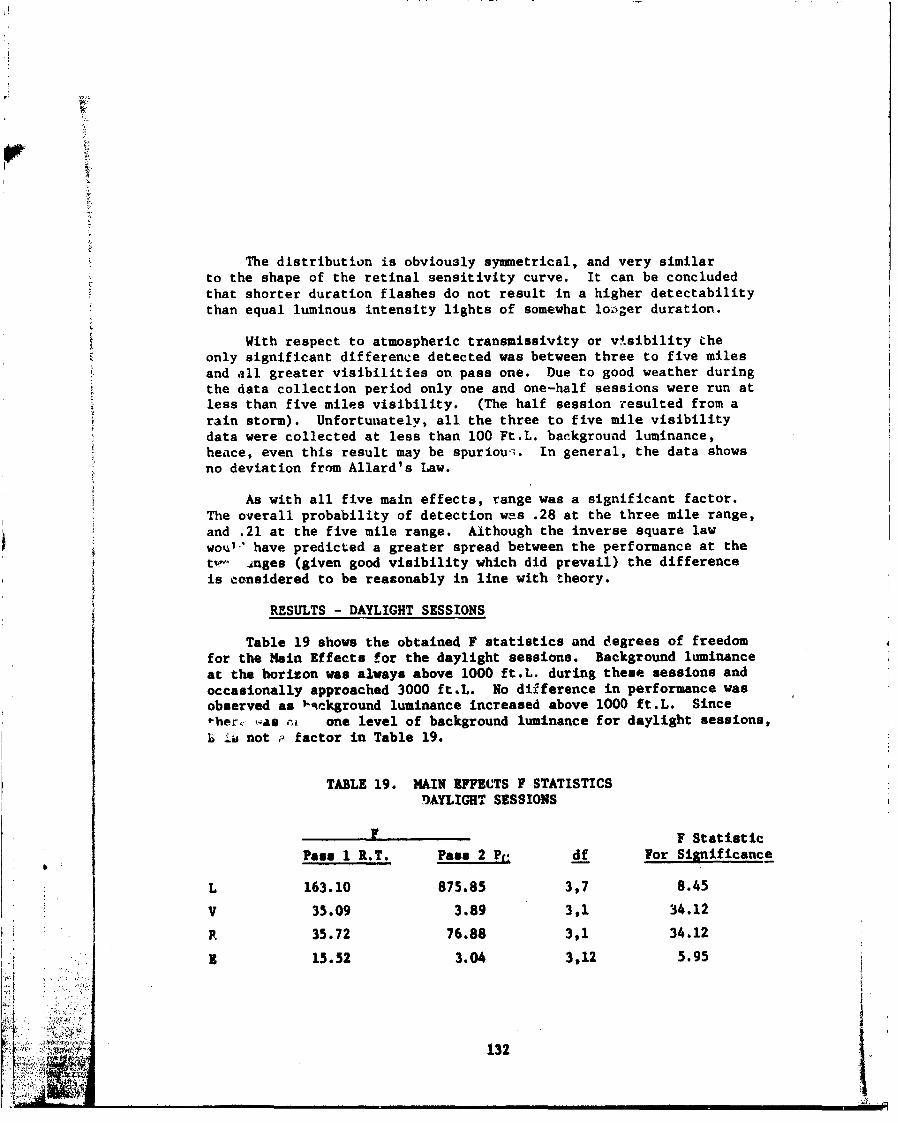
The distribution is obviously symmetrical, and very similarto the shape of the retinal sensitivity curve. It can be concludedthat shorter duration flashes do not result in a higher detectabilitythan equal luminous intensity lights of somewhat loL.er duration.
With respect to atmospheric transmissivity or visibility theonly significant difference detected was between three to five milesand all greater visibilities on pass one. Due to good weather duringthe data collection period only one and one-half sessions were run atless than five miles visibility. (The half session resulted from arain storm). Unfortunately, all the three to five mile visibilitydata were collected at less than 100 Ft.L. background luminance,hence, even this result may be spuriou. In general, the data showsno deviation from Allard's Law.
As with all five main effects, range was a significant factor.The overall probability of detection was .28 at the three mile range,and .21 at the five mile range. Although the inverse square lawwonl-" have predicted a greater spread between the performance at thet%-" inges (given good visibility which did prevail) the differenceis considered to be reasonably in line with theory.
RESULTS - DAYLIGHT SESSIONS
Table 19 shows the obtained F statistics and degrees of freedomfor the Main Effects for the daylight sessions. Background luminanceat the horizon was always above 1000 ft.L. during these sessions andoccasionally approached 3000 ft.L. No difference in performance wasobserved as 1 ickground luminance increased above 1000 ft.L. Since•her. -as .-,l one level of background luminance for daylight sessions,
ia not P factor in Table 19.
TABLE 19. MAIN RFFECTS F STATISTICS
DAYLIGHT SESSIONS
F F Statistic
Pass 1 R.T. Pass 2 Pr df For Sianificance
L 163.10 875.85 3,7 8.45
V 35.09 3.89 3,1 34.12
R 35.72 76.88 3,1 34.12
1 15.52 3.04 3,12 5.95
132
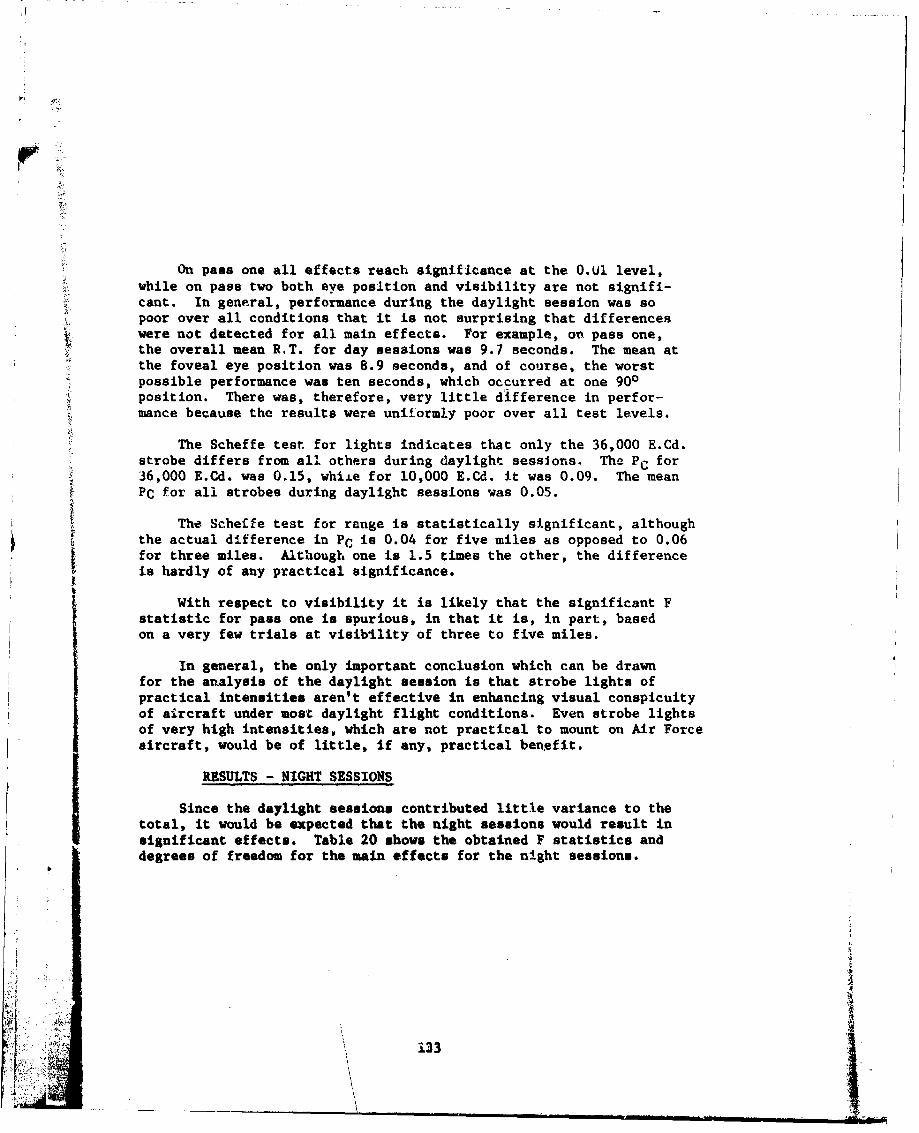
On pass one all effects reach significance at the 0.Ul level,while on pass two both eye position and visibility are not signifi-cant. In general, performance during the daylight session was sopoor over all conditions that it is not surprising that differenceswere not detected for all main effects. For example, ork pass one,the overall mean R.,T. for day sessions was 9.7 seconds. The mean atthe foveal eye position was 8.9 seconds, and of course, the worstpossible performance was ten seconds, which occurred at one 900position. There was, therefore, very little difference in perf or-mance because the results were uniformly poor over all test levels.
The Scheffe test for lights indicates that only the 36,000 E.Cd.strobe differs from all others during daylight sessions. The PC for36,000 E.Cd. was 0.15, whiie for 10,000 E.Cd. it was 0.09. The meanPC for all strobes during daylight sessions was 0.05.
The Scheffe test for range is statistically significant, althoughthe actual difference in PC is 0.04 for five miles as opposed to 0.06for three miles. Although one is 1.5 times the other, the differenceis hardly of any practical significance.
With respect to visibility it is likely that the significant Fstatistic for pass one is spurious, in that it is, in part, basedon a very few trials at visibility of three to five miles.
In general, the only important conclusion which can be drawnf or the analysis of the daylight session is that strobe lights ofpractical intensities aren't effective in enhancing visual conspicuityof aircraft under most daylight flight conditions. Even strobe lightsof very high intensities, which are not practical to mount on Air Forceaircraft, would be of little, if any, practical bene~fit.
RESULTS - NIGHT SESSIONS
Since the daylight sessions contributed little variance to thetotal, it would be expected that the night sessions would result insignificant effects. Table 20 shows the obtained F statistics anddegrees of freedom for the main effects for the night sessions.
033
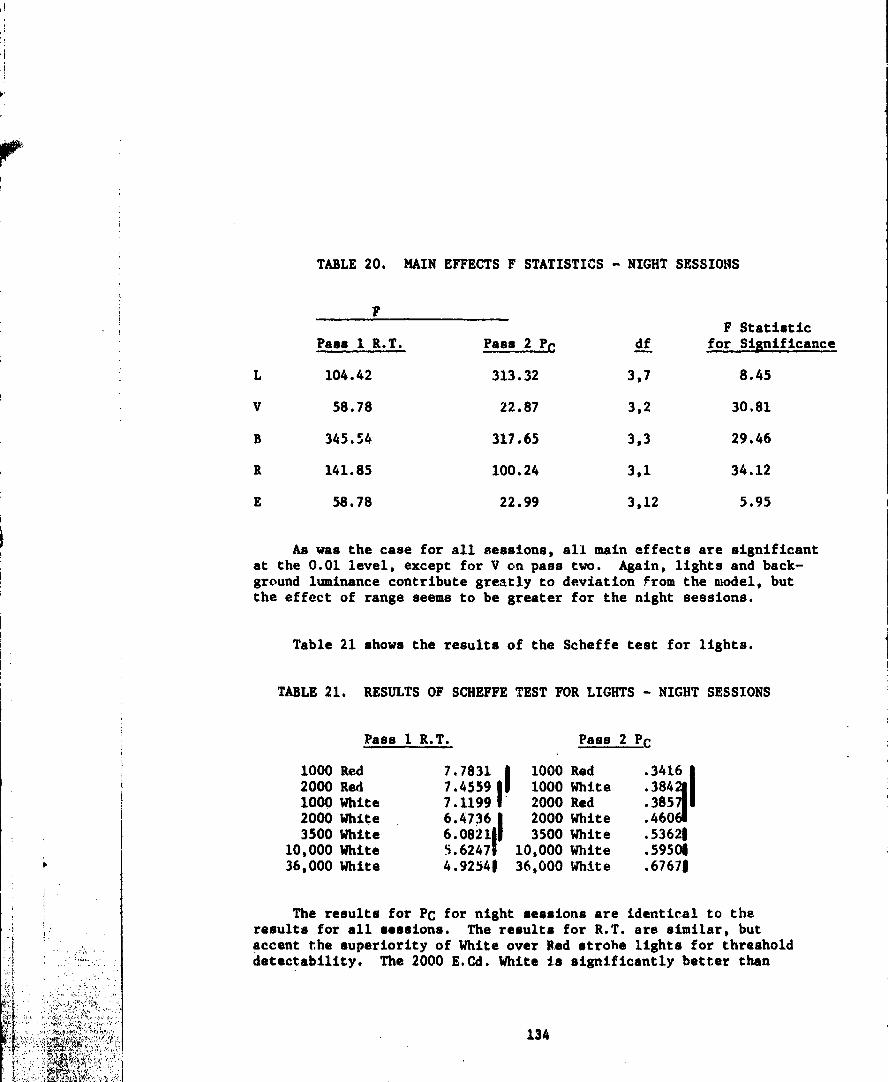
TABLE 20. MAIN EFFECTS F STATISTICS - NIGHT SESSIONS
FF Statistic
Pass 1 R.T. Pass 2 PC df for Significance
L 104.42 313.32 3,7 8.45
V 58.78 22.87 3,2 30.81
B 345.54 317.65 3,3 29.46
R 141.85 100.24 3,1 34.12
E 58.78 22.99 3,12 5.95
As was the case for all sessions, all main effects are significantat the 0.01 level, except for V on pass two. Again, lights and back-ground luminance contribute greatly to deviation from the model, butthe effect of range seems to be greater for the night sessions.
Table 21 shows the results of the Scheffe test for lights.
TABLE 21. RESULTS OF SCHEFFE TEST FOR LIGHTS - NIGHT SESSIONS
Pass 1 R.T. Pass 2 PC
1000 Red 7.7831 I 1000 Red .3416 32000 Red 7.45591 1000 White .384•|1000 White 7.1199 2000 Red .385712000 White 6.4736 | 2000 White .4603500 White 6.082111 3500 White .53621
10,000 White S..6247I 10,000 White .5950636,000 White 4.92541 36,000 White .67673
The results for Pc for night sessions are identical to theresults for all sessions. The results for R.T. are similar, butaccent the superiority of White over Red strobe lights for thresholddetectability. The 2000 E.Cd. White is significantly better than
134
li
2000 E.Cd. Red and the 1000 E.Cd. White is significantly better than2 the 1000 E.Cd. Red as shown in pass one. The 1000 E.Cd. white is
almost identical to 2000 E.Cd. Red in PC"
Although significantly different on the PC criterion, the 10,000E.Cd. strobe did not result in significantly shorter R.T.s than the3500 E.Cd. strobe in the night sessions. The significant differencein R.T. between 2000 and 1000 E.Cd. white strobe may give a "hint"of breakpoint in performance, but is not reflected on the PC criterion.
As statted above, these data are biased toward background luminance
below 10 ft.L., because there are more trials under this condition.Although it •as hoped that the experiment would have produced resultsfor the specification of strobe lights for dawn/dusk operations, this
is not possible due to the bias toward dark backgrounds, the fact thatthe background levels were too coarse, and the possibility that the lightlevels were too coarse.
Despite these limitations, further analysis of the effect of back-ground luminance is in order. There were approximately 2000 data pointsunder the 100-1000 ft.L. background condition, approximately 2000 at10-100 ft.L. and approximately 7000 data points below 10 ft.L. The PCplot fot lights for these backgrounds appears as Figure 51. "The Scheffetest shown in Table 17 showed that the V10 ft.L level was significantlydifferent than. the other two background luminances, which did notdiffer significantly. This is reasonably evident from Figure 51, which,incidentally, also reveals the lack of interaction between L and B.
To the extent that it is possible to draw any conclusion fromthis finding, it may be that strobe lights of the luminous intensitiesused in this study are of less value in dawn/dusk operations and againstdark clouds than has been suspected. (Recall that these are thresholddata and all subjects knew the location of the light.)
A more refined investigation of the region of one to 300 ft.L.background luminance would be required with more levels of whitestrobe luminous intensity in order to specify the characteristicsrequired for effective dawn/dusk protection.
With respect to the other, main effects the results are similarto those for all sessions. The three to five mile visibility Ismarkedly inferior to both five to ten mile and 10 miles, which donot differ. Most of the three to five mile visibility data wereobtained in night sessions, which accounts for the difference beinggreater than for all sessions.
133

0%
cc0
_ . 0
LA.-~I
4.D~j *8IL .- J ~N
Ic . I
Cu 4.,
-C a
st 0
Range contributes more to the rejection of the model for nightsessions than for either all sessions or day sessions, although thedifference in PC betwaen three and five miles was only .59 vs .38,less than would be predicted by the inverse square law for pointsources.
Eye position (retinal location of strobe) is almost identical withall sessions because, as mentioned above, the majority of the detectionsoccurred during night sessions, hence the night sessions account for thesymmetry of eye position for all sessions.
Again, it is concluded that the short duration flash of the strobeoffers no advantage in peripheral detection.
3.6 PROdLEM AREAS
3.6.1 ELECTRICAL EFFICIENCY
In terms of power conversion, the incandescent lamp is the mostefficient and straightforwArd method. It is possible to operate aten to 28 volt filament from the 115 volt 400 Hz1 bus through a step-down transformer with a typical efficiency of 90Z.
Strobe lights require much more complicated power supply and controlcircuits. Several typical types are discussed here relative to theirelectrical efficiency.
a. Voltage Multiplier Circuit - The voltage multipliercircuit is one of the most efficient power supplies used in strobelight systems as efficiencies of 65 to 70 are achieved, A limiting factorto this approach is that the capacitors are charged to multiples ofthe input voltage (two times, four times, etc.). With each increasein multiplication the circuitry and charging network becomes morecomplex and efficiency decreases.
b. R-C Charging - This type is not too prevelant and shouldonly be considered in low power applications as the power dissipatedin the lamp head is equivalent to that dissipated in the resistor.Efficiencies of 45% can be achieved.
c. D.C. "Fl1back" Transforner Method - The "flyback" transformermethod uses a single transformer operating in conjunction with atransformer with multiple windings for both output and feedback.(This is the same type circuit used in most battery operated photo-graphic strobes.) This type conversion will give efficiencies
137
approaching 50% and is used in many low power applications whereinput currents remain small.
d. Transistor DC to DC Converter - This type circuit is atwo transistor DC to DC converter with a saturable core type transformer.Most power supplies of this type have efficiencies of no more than35 to 45%.
3. C.2 ENVIRONMM
"a. Temperature. Temperature can greatly affect theoperation of strobe light systems. The energy storage capacitoris probably the most temperature sensitive component in the strobesystem. As discussed in the previous paragraph strobe power suppliesare lower in efficiency than incandescent systems. Inefficient useof the energy results in heating of the power supply. If the capacitorsare overworked or there temperature environment becomes excessive,their leakage current begins to increase. The capacitor leakagecurrent represents power that is being dissipated inside the capacitorin the form of heat, resulting in a further increase in temperature,more leakage, etc. If this cycle Boer unCitecked or if thermalequilibrium cannot be attained, the capacitors will be destroyed.
Temperature can also adversly affect the gas discharge tube.Heating of the flash tube will increase the required field to initiateionization of the gas in the tube. Since the tube adds heat to thefixture every time it flashes, achievement of thermal equalibrium isimportant.
b. Vibration. Due to its construction, (no filament) the
flash tube is far better in high vibration environments than theincandescent lamp when properly mounted. Due to the mass involvedand storage capacitor construction, the power su'pply is more susceptibleto vibration than the flash tube.
c. EI/EMC. EMI/ZMC requirements are well specified inMIL--STD-461/462 and MIL-E-6051. Strobe light systems meeting theserequirerants should not interfere with other aircraft avionic systemsdesigned to these same requirements. There is no known strobe lightsystem that can meet the EII/DIC requirements and produce the 3500 E.Cd.or greater intensity level. MI/ZIHC experts at ASD continue to insistthat complete compliance with NIL-STD-461/462 is required.
.I:-, . I' 138IJ
4.0 FUTURE ANTICOLLISION LIGHTING POSSIBILITIES
4.1 REQUIREMENTS DEVELOPMENT
To enhance the conspicuity of an aircraft by the use of a lightsource requires system compromises to remain within a reasonable powerand size ranp. These compromises must be handled in an inform -d mannerso that the nxicepts and design are directed so as to provide thebest solutic.,- within present technology and offer a viable anticollisiondevice.
The problem is not simply determination oa reql ired intensity fromthe r.ource to provide sufficient detectability, but i•,ist also address theability of manufacturing a system which is compatib .e with size, weight,power, maintainability, and cost considerations.
The required intensity problem is much more complex than one wouldinitially suspect. The theoretical performance of point source lights(see pars 3.2) has typically been examined at threshold. But, lightsources well abov't threshold will be required for effective detection.As an example, tests using a telescope in the daytime to find stars[32:886], it was shown that when the illumination from a star was fiveto ten times the threshold value for the existing conditions, it was easyto find; when two and one-half to five times threshold, it was moderatelyhar'd to find; for two times threshold it could be found with difficulty(usually several minutes of search were necessary even though the starwas in the field of the telescope); and at threshold it was necessary toknow exactly where to look and even then to spend some time in searching.
The shortcomings of the literature in matching the conditions ofthis problem would be of little consequence if providing higher andhigher intensity sources were not a technical problem. A multiplicationfactor of 1000 could be used for assurance. This is not the case, how-ever, and as a result, a data base is needed which can provi€de informedguidance in the various areas of expertise required to make the bestcompromises in providing a system to solve the problev.
A data base is needed to establish the intensity of a point sourcevs probability of detection vs off axis angle with the observer*s eye.The tests should be ronducted in ambient brightness levels consistentwith aircraft tlight environments. The tests should also address thequestion of flash duration and spacing. Once the required levels areknown for visual performance, the trade offs in a light system desiga.can be made in a knowledgeable manner. Field tests, though valuable inevaluating a final system configuration, are cumbersome and contain toomany uncontrolled variables for this type of te0ting, Much of this workcould be done with vinual simulators. It nay very well be that onceneeded i.teusity levels are determined anticollision light development
139
can stop. It may be that required levels are many times greaterthan those that can be produced.
4.2 ELECTRONIC AIDS IN DETECTION
As was pointed out in several of the tests of aircraft and strobelight detectability (see paras 2.5.4 and 3.4) a pilot knowing where tolook can detect aircraft at much greater range than an uninformed pilot.
An eleccronic system to a~i in visual detection of aircraft shouldat least meet the following ba ic requirements.
a. It must inform the pilot of the presence of another aircraft.Relative bearing and relative elevation will give the pilot the sameadvantage as the "informed" observers in paragraph 2.5.4.
b. The system must be able to operate in an automatic mode,thereby providing continuous protection without increasing pilot work-load.
Pilot Warning Indicator (PWI) systems have been proposed 4sing strobelights as an infrared emitter. One such system used a lamp head with twoflash tubes. The dual lamp strobe system is a cooperative PWI in whichthe strobe carried by the intruder would be encoded with the altitude ofthat aircraft. The method of encoding simply operated the strobe systemso that it would emit two closely spaced flashes rather than a singleflash each second. The spacing of the flashes would be a function ofthe aircraft's altitude, (pulse position modulation) and would be spacedso that the pair of flashes had the same visual appearance as a singleflash (i.e., a maximum separation of 12 milliseconds between pulses in aflash pair). Relative bearing is determined by the detector array.
The altitude of the threat aircraft in compared with the altitude ofthe aircraft being protected and a visual display presents the pilot witha direction and relative altitude (higher than, the same as, or below hisown) to be searched. Such a system may greatly improve the detectabilityof aircraft in bright daylight conditions when strobe lights are notvisible.
Systems such as those described above wore examined in the late1960.. Major problems encountered were caused by false alarms frominfrared sources other than the strobe lights. It is proposed that"•eex~ ination of these systems is warranted. Development of singlechip microprocesIsrs has given the designer much more advanced logic•Oan thr"t re~oni• •u i riteria (false alarm rejection) at less cost
wha as pR evlosXi.Ul, i~ailible.
¶ 140
;2N

1 0
4.3 NON-STROBE HIGH INTENSITY ANTICOLLISION LIGHTS
One of the major problems facing the anticollision light designeris lamp efficiency. Typical aircraft s-robe lamps are operated so as
X to obtain approximately 15 lumens per watt (lum/w). Strobe lamps
can give much better luminous efficienc" •s when operated at higherpower loading but then they must be forced air or even water cooled
V to operate at 60 flashes per minute.
One type lamp which can provide increased efficiencies is therelatively new "short-arc" lamp being used by some movie projectormanufacturers. Since it is desirable to make anticollision lights assmall as possible (to minimize aerodynamic problems) we find anotherargument for short-arc lamps.
In order to collect effectively the output of a source into arelatively small beam with a small reflector, the source size must
Z be small. This is where the continuous wave (CW) short-arc type lampsshow an advantage. The source size for these sources is typically a
j sphere on the order of one to two millimeters in diameter. There area number of reasons why short arc lamps can provide better conversionefficiencies from electrical to luminous light energy. The plasma arcin flash lamps is wall stabilized. This means that the plasma is incontact with the flash lamp envelope. In the interest of long life, theI energy per unit area of the envelope is kept low, which in turn resultsin a poor conversion of the energy input to luminous light output by theplasma. For a short arc lamp, however, the plasma arc does not come incontact with the envelope and as a result the temperature of the plasmacan be run at higher temperatures thus giving better luminots convernion.Since short-arc lamps are a CW, higher temperature plasma device, variousmetals and halides can be added which vaporize and enhance the luminousefficiency of these sources. This technique is not available to a pulsedflash lamp (strobes). As an example, mercury added to xenon in a shcrt-arc lamp gives a luminous efficiency of 40 lum/w. A thallium iodidexenon short-arc lamp can give up to 75 lum/w. This is considerablybetter than the 15 lum/w sighted above for xenon flash lamps.
This short discussion is intended to indicate that there way bealternates to strobe anticollition lighting which should be examinedbeforeofinal decisions are made.
iIi ,"?-. "'• •'•'• 41
p 5.0 FINDINGS, CONCLUSIONS AND RECOMMENDATIONS
As-,pointed out early in this report, the literature review, studyeffort, and testing described in this document were conducted todetermine parameters for a specification on strobe anticollision lights.The following findings consolidate the findings of the separate sectionsof this report. The conclusions and recommendations reflect the decisionby the Air Force not to initiate a fleet vide retrofit of strobe lightsfor daytime midair eollision avoidance and hence not to publish theproposed specification.
5.1 FINDINGS
a. USAF midair collisions were found to occur during the followingphases of flight:
(1) Formation flying (56.41)
(2) Associated flying (20.11)
(3) Non-associated flying (23.51)
Of these, strobe lights may only be expected to affect significantly thepotential for non-associated flying midair collisions.
b. Almost all midair collisions involve at least one aircraftflying VFR.
c. 86.9% of the non-assotiated flying Air Force midair collisionsoccurred during daylight flying.
d. Two-thirds of the non-associated Air Force midair collisionsoccurred with other military aircraft during takeoff, initial climb,descent, or lending.
6. General aviation aircraft comprise the largest non-militarycollision threat to the Air Force while collisions with large commrcialaircraft are the least threat.
f. Aircraft can be detected at ranges three times greater when thepilot knovs the approximate location of the intruding aircraft.
g. Strobe lights will not significantly reduce the potential formidair collisions involving Air Porce aircraft. The visibility enhance-ment character.tittics of the strobe light when compared to the midairthreat environment, offer very little, if any, added protectioh against"midair collisions.
ih. Of the previous tests reviewed, only two (the Army helicoptertest parcgraph 3.3.5, and the IG evaluation - paragraph 3.3.8)"concluded that strobe lights could be effective daylight anticollisiondeviqro~s. ASD s Qdick Look Flight Test and Tower Test (paragraph 3.4 and
col3.5) od not support the Army Lr IG data and in fact are in directconflict.
.142
X
"5.2 CONCLUSIONS
a. Analysis fails to support high intensity strobes for theI reduction of the daytime midair collision potential with present
day technology.
b. Further action to develop a strobe light specification fordaytime midair collision avoidance is not warranted at this time.
c. Some strobes, optimized for night visual intensity levels utaybe appropriate if they can be shown to be life-cycle-cost effective.
d. Strobe lights ured in conjunction with electronically aideddetection devices may provide a viable collision avoidance system andt should be iuvestigated as a future task.
5.3 RECOMKOMATIONS
a. Continue selective installation of strobe lights optimizedfor night visual intensity when a life-cycle-cost savings can berealized.
b. Future work should address the midair collision problem froma systems point of view. This approach will allow consideration ofhigh intensity lighting coupled with electronically aided detection aspart of the overall solution to the Air Force's midair collision problem.
, • ~ ~. - .. . .....-.•- . .,
•,• ,. :, . : • ?, '• , •. , -
LIST OF REFERENCES
1. Problem Sumnary Report on USAF Strobe Light Evaluation. DeputyInspector General for Inspection and Safety, USAF, Norton Air ForceBase, California. (AFISC/SEFB)
2., USAF Midair Collisions 1965-1975 Final Report. Deputy InspectorGeneral for Inspection and Safety, USAF, Norton Air Force Base,California. (AFSIC/SEY)
3. Murray, J.P., Rucker, R.A., Simpson, T.R., Civil AviationMidair Collision Analysis January 1964 - December 1971. May 1973,FAA-EM-73-8, Office of Systems Engineering Management, Departmentof Transportation, Federal Aviation Administration, Washington, DC(The Mitre Corporation).
4. Boyd, P.R., Curtis, B.R., Orr, R.H., Tiblu, A.M., Near MidairCollision Report of 1968. 15 July 1969, Department of TransportationFederal Aviation Administration, Washington, DC.
5. Blackwell, H.R., Contrast Thresholds of the Human Eye. J. Opt.Soc. Amer., 1946, Vol. 36.
6. Duntley, S.Q., The Visibility of Distant Objects. J. Opt. Soc.Amer., 1948, Vol. 38.
7. Hecht, S., Ross, S. & Mueller, C.G., Visibility of Lines andSquares at High Brightness. J. Opt. Soc. Amer., 1947, Vol. 37.
8. Lamar, E.S., Hecht, S., Shlaer, S. & Hendley, C.D., Size, Shapeand Contrast in Detection of Targets by Daylight Vision. I. Data andAatical Description. J. Opt. Soc. Amer., 1947, Vol 37.
9. Xtiddleton, W.E.K., V.'sion Through the Atmosphere. Toronto:U of Tornoto Press, 1958.
10. Applied Psychology Corporation. Field Study of Threshold RangesforAircraft Detection and Color Identification. Tech. Rept. No. 4,under Federal Aviation Administration contract FAA/BRD-127, 1961.
11. Huoell, W.D., Determination of Day-time Conspicuity of TransportAircraft. Tech. Dev. Rept. No. 304, Civil Aeronautics Administration,Technical Development Canter, Indianapolis, Indiana, May 1957.
I . . .. 144 [
qt
12. Fisher, R.B., Marshall, P.R., Determination of the DaytimeConspicuity if a Small Airplane in a Terminal Area.. Tach. Dev.Rept. No. 382, Federal Aviation Agency, Technical DevelopmentCenter, Indianapolis, Indiana, January 1959.
13. Calvert, E.S., The Use of Aircrew-interpreted Devices forPreventing Collisions in the Air. J. Inst. of Navigation, Vol XI,No. 4, Oct 1958.
14. Howell, W.D., Edwards, T.M., Determination of Some GeometricRelationships Pertaining to Collision Flight Paths. :Tech. Dev. Rept.No. 259, Civil Aeronautics Administration, Technical Developmentand Education Center, Indianapolis, Indiana, June 1955.
15. IES Lighting Handbook - Fifth Edition.
16. Knoll, H.A., Tousey, R., & Hullburt, E.O. Visual Thresholds ofSteady Point Sources of Light in Fields of Brightness from Dark toDaylight. J. Opt. Soc. Amer., 1946, Vol 36, No. 8.
17. C.I.E. Technical Committee 3.3.2.1. Aviation Ground Lighting,C.I.E. Proceedings, Vol. II, Committee Report, 1955.
18. Stiles, W.S., Bennett, M.G., & Green, H.N. Visibility of LightSignals with Special Reference to Aviation Lights. AeronauticalResearch Committee Reports and Memoranda No. 1793, Brittish AirMinistry, May 1937.
19. Gilbert, M.S., & Pearson, H.J.C. A Study of the Visibility andGlare Ranges of Slope-line Approach Lights. Civil Aero. Admin., Tech.Dev. Center, Tech. Dev. Report No. 150, Nov. 1951.
20. Adrian, W., & Jainshi, P. Experimental Studies on the Reliabilityof the Visual Threshold Internationally Agreed Upon for the Calculationof Luminous Intensities of Light Signals. Report No. 5-4-4, SixthInternational Technical Conference on Lighthouses and Other Aids toNavigation, U.S. Coast Guard, 1960.
* 21. de Boer, J.B. Visibility of Approach and Runway Lights, PhillipsResearch Reports, 6 June 1951.
22. Tousey, R. and Kooman, M.J.: The Visibility of Stars and Planetsduring Twilight, J. Opt. Soc, Amer., Vol 43, March 1953.
23. Breckenridge, F.C. and Douglas, C.A.: Development of Approach andContact -Liaht Syst sis Illum, Eng., Vol XL, Nov. 1945.
14
ytg
24. Blondel, A. and Rey, J.: The Perception of Lights of ShortDuration at Their Range Limits. Trans. of Illum. Eng. SocietyVol VII, No. 8, Nov 1912, pp 625-662.
25. Douglas, C.A.: Computation of the Effective Intensity ofFlashin• Lights. National Bureau of Standards Report 4554, March1956.
26. Projector, T.H.: Effective Intensity and Efficiency of FlashingLights. Sixth Int. Tech. Conf. on Lighthouses and Other Aids toNavigation. USCG, 1960.
27. Crosley, .K., McLean, W.E., Tabak, R.G., Bailey, R.W., TheUse of High Intensity Xenon Lighting to Enhance US Army AircraftDay/Night Conspicuity. U.S. Army Aeromedical Research Laboratory,Fort Rucker, Alabama, January 1971.
28. Specific Item Report No. P-117 FB-111 Strobe Light Evaluation.Headquarters Strategic Air Commaad, Aircraft Engineering Division,Carswell AFB, Texas. 30 September 1971.
29. Letter of 11 May 1972 antiti-ed T-38 Aircraft Beacon/Strobe LightVisibility Test Results to ATC/DOTF from Headquarters San AntonioAir Material Area (AFLc) /IOIEN-8.
30. Goldsmith, Dp.C.T. Final Report - Strobe Light Tower Test.Decilog, Inc. Technical Report 146-2, 10 September 1976, Decilog,Inc., Melville, New York, 11746
31. Connors, M. Conspicuity of Target Lights: The Influence ofColor. NASA TN D-7960, NOV. 1975
32. Tousey, R. and Hulbert, E.O. The Visibility of Stars i. theDaylight Sky. J. Opt. Soc. Am. Vol 31, No, 10, Oct 1948.
146
II
APP IX 1
I PROPOSED MILITARY PECIFICATION FORL ~AIRCRAFT ANTI-COLLI ION STROBE LIGHTS
-. 147

DEPARTMENT OF THE AIR FORCEHEADQUARTERS AERONAUTICAL SYSTEMS DIVISION (AFSC)
WRIGHT.PATTERSON AIR FORCE MASK. OHIO 45433
AT o ENEG 27 FEB 1976Review of Proposed Military Specification for Aircraft Anti-Collision
Strobe Lights
le' SBE DISTRIBUTION LIST
1. A preliminary draft specification (Atch 2) for Strobe Anti-CollisionAircraft Lights has been prepared. In order for us to prepare a usefuldocument, we request that your organization review our draft. No para-graph of this specification should be considered as an absolute require-ment of the Air Force and is provided only as a preliminary proposal forreview and comment. As such, the proposed specification is subject toextensive modification and may not be ised for procurement purposes.Your review, comments and recommendations are requested on or before1 April 1976.
2. Comnents and recommendations relative to the proposed specification shouldSbe addressed to the project engineer, Phillip Schmidlapp, ASD/ENEGE,
Wright-Patterson AFB OH 45433. Mr. Schmidlapp may be contacted bytelephone commercially at (513) 255-5192/4708 and by Autovon at78-55192/54708. Questions and comments relative to strobe light programbeing conducted by the Air Force should be addressed to the programmanager, Major Donald Drinnon, ASD/AEAI, Wright-Patterson AFB OH 45433.Major Drinnon may be contacted by telephone commercially at (513) 255-6168/6169 and by Autovon at 78-561"68/56169.
3. Each reviewer is requested to provide a telephone uumber(s) wherehe/she may be reached so that questions relative to submitted comments maybe resolved. Current plans are to submit the proposed specification (withappropriate changes from your recommendations and comments) to ourspecification braach for formal comment cycling by 16 April 1976.
4. The specification consists of a main body, i.e., a general requirementspecification and specification sheets covering specific systems. Systemcategories (para 1.2.1) are defined in terms of aircraft parameters such asallowable weight, size, power consumption, etc. Specification sheets arespecific solutions to the requirements of the general specification. Thismeans that the large aircraft category (KC-135, C-130, etc.) may haveassociated with it several specification sheets (for example, one for awing-tip lighting system and one for a fuselage system). The samplespecification sheet provided is not in its final form. The Army haspurchased the data to the described system and this data will be used tospecify more exactly the helicopter system described. Recommendatious for
149

specification sheets and rystem category descriptions are of primaryinterest to this office.
5. Hopefully, this comment cycle will significantly shorten the formalcomment cycling of our specification branch and result in a timely releaseI of a final specification. Your timely review and comments will enhance
the quality of the specification and help fulfill a critical need at an* early date.
FOR 5 -ONA4ER
MUANK MICKA 2 AtchChief, Ground Support Equipment Division 1. Distribution ListDirectorate of Equipment Engineering 2. Specification
mISO
I+' + .•,,+.,+ '+ +++.+.
DISTRIBUTION LIST
AFSC/DOSO 1Andrews AFB DC 20334
TAC/DOQO 1Langley AFB VA 23665
MAC/DOQST 1Scott AFE IL 62225
CINCSAC/EPHV 1Offutt APB NE 68113
ATC/DO 1Randolph AFB TX 78148
ADC/DOOT 1Ent AFB CO 80912
CINCPACAF/DOOQ 13, APO San Francisco 96553
CINCUSAFE/LGMA 1APO New Yo-rk 09012
N GB/ XO 1Wash DC 20310
AFRES /DOXS 1Robins AFB GA 31098
AAC/DOOA 1APO Seattle 98742
AFCS/ FF0 1Richards-Gebaur AFB MO 64030
AFLC/MMA 65Wright-Patterson AFB OH 45433
Defence General Supply Center 1Richmond VA 23297
U. S. Army Aviation Systems Command 1Attn: AMSAV-ERR (Mr. Garrett)P. 0. Box 209St Louis MO 63166
3. _ j4,.
ji. I i7Atch 1V15
t Naval Air Systems Command
Attn: Mr. ConawayAIR-533S3A - Electrical BranchDept. of NavyWash DC 20360
Federal Aviation AdministrationFAA, AFS-130Attn: Mr. Chuck Jones800 Independence AvenueWash DC 20592
National Bureau of StandardsDiv. 221.12, Room A307Attn: Mr. Tom TwistWash DC 20234
CAI - Bourns, Inc.Attn: Mr. W. E. Nickel550 West Northwest HighwayBarrington IL 60010
Vought CorporationAttn: Mr. R. D. NicolaysenP.O. Box 5907Dallas TX 75222
Kopp Glass, Inc.Attn: Mr. W. A. ProvostP.O. Box 8255Pittsburg PA 15218
Electronic Brazing Co., Inc.P.O. Box 448Harrison StreetDover NJ 07801
Pacer Industries, Inc.Attn: Mr. M. A. Huber1428 Hayden AvenueAltoona WI 54720
Multi Electric Mfg.,Inc.Attn: Mr. M. A. Mongoven4223-43 West Lake StreetChicago IL 60624
Swiss Controls, Inc.Attn: Carol S. WitekP.O. Box 5672603 E. Barker Avenue
v•• ¶Michigan City IN 46360
152
Hughy • Phillips, Inc.Attn: J. H. Ganzenhuber3050 North California StieetBurbank CA 91505
Optical Radiation CorporationAttn: R. Goodwin6352 North Irwindale AvenueAzusa CA 91702
Aero Marine, Inc.Attn: D. Castetter18076 TulsaGranada Hills CA 91344
Grimes Manufacturing CompanyAttn: Mr. Glenn Henson515 North Russell StreetUrbana OH 43078
General Electric CompanyP.O. Box 2143, Kettering BranchDayton OH 45429
R. B. GaleSuite 620, 333 W. First StDayton OH 45402
Bren-Tronics, Inc.104 Bellerose AvenueEast Northport NY 11731
Chromalloy Electronics DivisionAttn: W. E. Williams3901 North 29th AvenueHollywood FL 33020
Soderberg Mfg. Co., Inc.Attn: Lloyd P. Appelman20821 Currier RoadWalnut CA 91789
Sawyer Camera Company6820 Santa Monica Blvd.Hollywood CA 90038
Telectro Systems Corporation96-13 43rd AvenueCorona NY 11368
.... G.T.E. SylvaniaAttn: Mr. D. I. Coggins
- Lighting Products Group60 Boston Street
AT.- Salem MA 01970
t 153
Symbolic Displays, Inc.1762 McGraw AvenueIrvine CA 92714
Julian A. McDermott Corporation1639 Stephicn StreetRidgewood NY 11227
L. L. Rowe Company70 Hichbo-rn StreetBoston~ MA 02135
ML

MIL-L-XXXX (PROPOSED)
MILITARY SPECIFICATION
LIGHT, AIRCRAFT, ANTI-COLLISION, STROBE
This draft prepared by Aeronautical Systems Division, Wright-Patterson AFB,has not been approved and is subject to modification. DO NOT USE FORPROCUREHMN PURPOSES.
INAc2
r INDEX
1.0 SCOPE . . . . . . . . . . . . . . . . . . . . . . . . . 63
1.1 Introd •ction . 1631.2 Classification . . . . . . . . ............. . . . .. ................ 163
1.2.1 Category - Type Designation ........................ . 163
2.0 APPLICABLE DOCUMENIS . . . . . . ............................... ... 1632.1 WoD ........... 163Specifications . . . . . . . . . ... . .. .................... . . . . . . . 164
Military . . . . . . . . . . . . . . . . . . . . . . . . . . . . . . . . . 164
Standards . .................... . . ......................... . . ... 164Federal . .................. . . . . . ...... . ......... 164Military . . . . . . . . . . . .. . a. . . . . . .. . .. 164
2.2 Other Publications . . . . . . ......................... 165
3.0 REQUIREMENTS ................. ............................. . . .1653.1 Item Definition . ......................... . . . ... .. .... 165
3.1.1 Specification Sheets . ....... ..................... . . . . 1653.2 Qualification .... . .... .. . .. ... . . .......................... 1653.3 Materials . . . . .................. ........................ . . 165
3.3,1 Metals ............................... 1663.3.2 Protective Treatment 1663.3.3 Selection of Materials 166
3.3.3.1 Use of Commercial Parts . . . . . . . . . ........... 166
3.4 Design . * . . . .. . ................. . 1663.4.1 System ................... ............. 166
3.4.1.1 Mode Selection ........................... 167
3.4.1.2 Interface Design . . . . . . . 1673.4.2 Safety .. . . . . . . . 167
3.4.2.1 Grounding ... .. . . .. . ... . . 1673.4.3 Shelf Life . .. . . . . . . . . . 167
3.5 Performance . . . . . . . . . 16i3.5.1 Intensity .• 1.673.5.2 Field of Coverage. . . .. .. .. . . 1703.5.3 Orientation. . . . . . . . . . 1703.5.4 Shielding . . . . . . . . . .. . . . . . . . . ... . . . . 1703.5.5 Flash Rate . . . . . . . . . . . . . . . . . . . . . . . . . . . . 1703.5.6 Reliability (Mean Time Between Failure, M )BFS/Service Life * 170
3.5.6.1 Optical Failure of tbe High Mode ................ 1713.5.6.2 Optical Failure of the Low Mode . . .... . .. . . .. . 171
* 3.5.6.3 Optical Failure Day/Night Computational Data Base ..... . 1713.5.7 Environmental . .. .. . . ............... . .... 1713.5.7.1 Altitude ........ 1713.5.7.2 Temperature . . . . . . . . 1713.5.7.3 Atmospheric Degradation . . . . . . . . . . . .1713.5.7.4 Explosive Atmosphere . . . 1713.5.7.5 Vibration. . . .. . . . . . . . . . . . .. . . . . . 1733.5.7.6 Acoustic*. ............ ... 4 . .. . . • l73
I156
•,3 .5 .8 Electrom agne tic Inte rference . . . . . . . . . . . . . . . . .1733.5.9 Electrital Power Interface . . . . . . . . . . . . . . . . . . 173
3.5.9.1 Power Consumption . . . . . . . . . . . . . . . . 1733.5.10 Maintainability . . . . . . . . . . . . ...................... 173
3.6 Construction . . . . . . . . . . . ............................... 1733.6.1 Sealing ................ . . . . 1733.6.2 Electrical Connectors . . . . . . . ......... .................... 1753.6.3 Interchangeability ... ...... .. .. . ... ... 753.6.4 Screw Thr eads . . ... .... .. . . . * 1753.6.5 Thermal Design. ... . . . . . . . . . . . . . . . . . . 175
3.7 Details of Major Asseublies ............ ............... ..... 1753.7.1 Light Source Assemblies . . . . . . . . . ... ................... 175
3.7.1.1 Modules . . .. . . . * * * . . . . . . ... 1753.7.1.2 Interchangeability . . . . . .... ................... .. 1753.7.1.3 Transparent Cover(s) . . . ................................. 1753.7.1.4 Chromaticity ......................................... 1763.7.1.5 Dimensions . . . . .•................. . . . . * .* . 1763.7.1.6 K.iun.ting P . .. . . . . . . . . . ....................... 176
3.7.2 Power Supply Assewbly ........... ............ .... 1763.7.2.1 Modularization ...................... ...... 1763.7.2.2 Mouriting . . . . ....... ................ 1763.7.2.3 Dimensions . . ................ 1763.7.2.4 Finish .... ..... .. .. . .. 176
3.7.2.5 Circuit Overload/Electricai Damage Protection . ... . 1763.7.2.6 Marking .. .................... ... . 176
3.7.2.6.1 Fuse Ho1ders 1763.7.2.6.2 Circuit Breakars .... . . . . . . . . . . . . . 1773.7.2.6.3 Electrical Connectors . . . ................. . . . 177
3.8 Identification Marking ... . . . . . . . . . . . . . . . . . 1773.9 Workmanship . . . . . . 177""3,10 System Categories. . . . . . . . . 177
3.10.1 Category A. Rotary Wing Aircraft .............. 1783.10.1.1 System Description. . . . . . . . . . 1783.10.1.2 Power Consumption . . . . . . . . .................... . 1783.10.1.3 Weight . . . . . . . . . . . . . . . . . . . . . . . . . 1783.10.1.4 Light Source Location . . . . . . . . . . . . . . . . . . 178
3.10.1.4.1 Field of Coverage . ............. . .. 1783.10.1.5 Flash Rate, . . • . . . . . . . . . . . . . . . . . . . . 1783.10.1.6 Dimensions ... . . . . . . . 178
3.10.2 Category B. Large Subsonic Aircraft ...... . . . . . 182S'•" .3*i0.3 Catvgory C. 1833.10.3 Cate.gory C . . ... . . . . . . . . . . . . . . . . . . 1833.10.4 Category . . . . . . . . . . . . . . . ......... 184
3.11 System Types . . . . . . . . . . . . . . . . . . . 185
S3.11.2 Type II . . . . . . . . . . . . . . . . . . . . . . . . . . . 185
4.0 QUALITY ASSURANCE PROVISIONS. . . . . . . . . . . . . . . . . . . . . . 1854.1 !•:J General, 135
4.2 Responsibility for Inspection .................. 1854.3 Facilities . . . . . . . . . . . .. . . . . . . . . . . . . . . . 1851
i157

4.4 Classification of Inspections 6. 164.4.1 Qualification Inspections.. ............................. 186
4.4.1.1 Qualification Examinations. 1o...............84.4.1.2 Qualification Testing 186
4.4.1.2.1 Flash Rate. .... 1864.4.1.2.2 Effective Intensity and Distribution . . ......... 1864.4.1.2.3 Chromaticity. 1864.4.1.2.4 Electrical Tests .. 186
4.4.1.2.4.1 Power Consumption . . . . . . . . . 1874.4.1.2.4.2 Electrical Malf,,nctlons .............. 1874.4.1.2.4.3 BH.gh/Low Voltage Survivability Tests .... ....... 187£4.4.1.2.4.4 Normal Test Input Vcltages ............. 187
4.4.1.2.5 Reliability Testing .................. 1874.4,1.2.5.1 PFliability ........... 1874.4.1.2.5.2 Reliability Test FAilures . ..... ......... ... 188
4.4.1.2.5.2.1 Optical Failure of the High Mode. . . . . . . 188.4.4.1.2.5.2.2 Optical Failure of the Low Mode ......... ... 1884.4.1.2.5.2.3 System Failure Basis. . .. . . . . 188
4.4.1.2.6 Grounding Systems Tests ....... .............. 1884.6.1.2.7 Environmental Tests . . ........ ........... . 188
4.4.1.2.7.1 Temperature - Altitude Test .... ........... ... 1884.4.1.2.7.2 Rain Test:.. .... ............ 1884.4.1.2.7.3 Huaidity Test . . . . . . . . . . . .. ......... 189
4.4.2.. Fungus Test 1894.4.1.2.7.5 Salt Fog Test ................... 1894,4.1.2.7.6 Dust Test .............. 1894.4.1.2.7.7 Sxplotive Atmosphere Test .. ........... 1S94.4.1.2.7.8 Vibration Test. .............. 1894.4.1.2.7.9 Acoustical Noise Test .............. 14.4.1.2.7.10 Shock Test. . . . . . . . .. ....... ..... ...... 189
4.4.1.2.8 Electromagnetic Interference Test 1 . . • 194.4.1.2.9 Extent of Testing and Test Conditions Not Covered Hereinl904.4.1.2.10 Materisl to Accompanw, System ..... . . . . . 190
4.4.2 Acceptance Inspections, . . .. ............. 1904.4..1 lndiv£dual Iuspections ............ . 1904.4.2.2 Sampling Inspections.. . . . 1W...........190
4.5 Dispocition of Test Samples . . . . . . 19i4.6 Demonstrations , .... .. 191
4.6.1 'Aliabiiity Demonstration 1 r1, . • .. .. ... 191• 4.6.2- )Csintriability Nuong-tration : .. . . .191
4.6.3 Enviranitr ual Conpliance Demontration . ..... 1914.6.4 Necessary Test and Demonstration Datt CollectLion. .* .... 191
"'"50PREPARAVION FOR DELiVERY .. 1915.1 General . .O . . . . . . . . . . .. .. .. . . .. . . . . . 191
':6 .0 Nk?,Tr-S ' " 1916.1 Operat.ionalConsiderations . . . . . . . . . . . . .. 191
t '•' 6 I'nleain
S• • • • 6 • • • • • • . . •158
• , • L"' 4!.•" '
6.2 Essential Characteristics ............. 1926.3 International Standardization Agreements . .. .. .. .. .... .. 192
MIL-L-XXKXX/ STROBE ANTICOLLISION HELICOPTER LIGHT. ...... 193MTL-L-XXXX/2

LIST OF FIGURES
FIGURE 1 - ANTI-COLLISION LIGHT SYSTEM DISTRIBUTION .. .. .. ..... 168
FIGURE 2 - CATEGORY A. SYSTEM DISTRIBUTION........... 180
FIGURE 3 -CATEGORY A.* LIGHT ASSEMBLYMAXIMUM DI MEN SIONAL REQUIREMENTS . * . * * . * * . .* 181
160
TABLES
TABLE 1 - INTENSITY REQUIRERIENTS. . . . . . . . . . . 169
TABLE 2 - ALTITUDE AND TEMPERATURE REQUIREMENTS . . . .* 172
TABLE 3 - VIBRATION AND ACOUSTIC NOISE REQUIREMENTS . . . . . 174*TABLE 4 -CATEGORY A DISTRIBUTION REQUIREMENTS . . . . . . .179
1 61
' DRAFTDRAHM3[L--L-XX:X
MILITARY SPECIFICATION
LIGHT, AIRCRAFT, ANTI-COLLISION, STROBEit
This specification is mandatory for use by all Departmentsand Agencies of the Department of Defense.
1.0 SCOPE.
1.1 This specification establishes performance, configuration, testand acceptance requirements for Strobe, Anti-Collision Aircraft LightingSystems. Specific systems are covered in specification sheets to thisspecification.
1.2 Classification. Strobe Anti-Collision Aircraft Lighting shallSbe classified as to Category and Type as follows:
Category A - Rotary wing aircraft (Para 3.10.1).
Category B - Large Subsonic aircraft (Para 3.10.2).
Category C - Small Supersonic Aircraft (Para 3.10.3).
Category D - Small Subsonic Aircraft (Para 3.10.4).
Category I -
Type I - For use with a 28 VDC (Volt Direct Current) aircraftpower source
Type 1I - For use with one phase of a three phase 115 VAC (VoltAlternating Current) 400 Hertz aircraft power source.
1.2.1 Cateaory-Type Designation. Each Category shall be designatedas either a Type I or Type II system per paragraph 1.2.
2.0 APPLICABLE DOCUMENTS.
2.1 The following documents of the issue in effect on date ofinvitation for bids or request for proposal(s) form a part of thisspecification to the extent specified herein:
PRILIMINARY DRAFTNOT TO BE USED MOR PROCU4 PURPOSES
_-.-_.., - .LM.!... . . ,
SPECIFICATIONS
MILITARY
MIL-B-5087 Bonding, Electrical, end LightningProtectior, fcr Aerospace Systems
MIL-W-5088 Wiring, Aircraft Selection andInstallatioa of
MIL-L-6503 Lighting Equipment, Aircraft, GeneralSpecification for Installation of
MIL-L-6723 General Specification for Aircraft LightsQPL-6723 Qualified Products List (QPL) for
SMIL-L-6723
MIL-S-7742 Screw Threads, Standard, OptimumSelected Series, General Specification for
MIL-S-8805
MIL-C-25050 Color, Aeronautical Lights and Lighting
Equipment, General Requirements for
STANDARDS
FEDERAL
FED-STD-595 Color, Requirement@
MILITARY
MIL-STD-100 Engineering Drawing Practices
MIL-STD-L30 Identification Marking of US MilitaryProperty
HIL-STD-143 Specification and Standarde. Order ofPrecedence for the Selection of
MIL-STD-454 Standard General Requirements for Electronic
Equipment
-IL4TD-461 Slootromagotic Isterfeivmce Characteristics,Requirgunt for Equipment
NOT TO IN amD MRB ?1KCUM PUVOW
DRAFT
MIL-STD-462 Electromagnetic Interference CharacteristicsMeasurement of
MIL-STD-704 Electric Power, Aircraft, Characteristics
and Utilization of
MIL-STD-781 Reliability Tests: Exponential Distribution
MIL-STD-410 Environmental Test Methods
MIL-STD-889 Dissimilar Metals
2.2 Other Publications. The following documents form a part of thisspecification to the extent specified herein. Unless otherwise indicated,the issue in effect on date of invitation for bids or request for proposal(s)shall apply:
AFSC Design Handbook No. 1-4
S3.0 E I29
3.1 Item Definition. The Strobe Anti-Collision Aircraft LightingSystem shall provide the ati-collision lightiug required by HIL-L-6503
system shall consist of the l1W heads, power supplies, and control circuitry
required to meet the requirements specified herein.
3.1.1 Specification Sheets. The individual requirements for each aircraftcategory shall be as specified herein and in accordance with the applicabledetail specification sheet.
3.b RAlficalon. The system furnished under this specification shallbe a product which has been inspected and has mat the requirements of Section4.0. "Quality Assurance Provisions" specified herein, and has been listed onor approved for listing on the applicable Qualified Products List, QPL-6723.Compliance with the requirements of Section 4.0 herein shall be sufficient toq•Ulify the eyst•m f•o listiag in QPL-6723 at all requirements of thisspecification equal or emceed those of MIL.-L-6723, "General Specification forAircraft Lights."l Inspection doumsnatatio shall 5be presented as evidenceof copliaUnce v•th MIL-L-6723 to obtain listing on the QPL.
3.3 N i Materials. shal .onform to applicable specifications as"specified erui a on the application otandards. * Htotails which are notdescribed horqia shall be of the beot quality and suitable for the purposeintended.
m -11AT WimD . crprwou
I.
DRAFT3.3.1 Metals. Metals shall be of a corrosion-resistant type or shall
be suitably protected to resist corrosion. Dissimilar metals as definedin MIL-STD-889 shall not be in direct contact with each other unlessappropriately protected against electrolytic corrosion.
3.3.2 Protective Treatment. Materials subject to deterioration whenexposed to climatic or environmental conditions shall be protected againstdeterioration in a manner that will in no way prevent compliance with theperformance requirements specified. Protective coatings that will chip,crack, or scale with age or extremes of climatic or environmental conditionsshall not be used.
3.3.3 Selection of Materials. Specifications and standards for allmaterials, parts, and Government certification and approval of processesand equipment, which are not specifically designated herein and which arenecessary for the execution of this specification, shall be selected inaccordance with MIL-STD-143.
3.3.3.1 Use of Commercial Parts. Standard aircraft industry partsshall be used whenever they are suitable for the purpose and shall beidentified on the drawings by their commercial part numbers. Commercialutility parts, such as screws, bolts, nuts, cotter pins, etc., may be usedprovided they possess suitable aircraft use properties, are replaceable bythe'standard aircraft industry parts without alteration, and provided thecorresponding standard aircraft industry part numbers are referenced in thequalified parts list and, if practicable, on the contractors' drawings.In the event there is no suitable corresponding standard aircraft industrypart in effect on date of solicitation, commercial utility parts may beused provided they conform to all requirements of this specification.
3.4 Design.
3.4.1 Sy ma. Each system shall be capable of operation in accordancewith the raquirements specified herein. The system shall be designed usingsolid state electronics with no moving parts except for the power supplywhich may incorporate an slectro-mechanical device(s) in the power ccltrolcircuit if determined by design criteria to be more suitable. The designshall incorporate a modular concept where subassemblies of the majorassemblies are more easily replaceable as a complete module. The oystemshall provide sufficient light sources, each capable of producing both alow level mode and a high level mode which meets the intensity requirementsof paragraph 3.5.1 and 3.5.2. Either mode shall be selectable utilizing aremotely located (cockpit mounted) switch. Additionally, a squat switchcapability shall be provided which when depreased (aircraft on the ground),the low level mode will operate when either intensity mode is selected.When extended (aircraft in flight), the intensity mode selected willoperate. A squat switch override shall be provided in a location that willfacilitate maintenance and pro-flight check.
PRELIMNARY DPUEATNOT TO BE USED FOR PROCUEDIhN PUEpozsS
1 66
2100 200 190 70 1w ISO1M160r 170 18 190r 200*20
220

* 0 0 * u*Un Un AM
6 S S
88f
iu U5
o0 PC 11 0 0 0 0 0f
i + +
% ~100 o 0 0 O

DRAFTSt2
Ie - 1 5 I(t) dt0. 2+t t2-t1) S tl
where: Ie = effective Intensity is candelas, and is the maximumvalue of the right-hand side of the equation. I(t) =ins.tantaneous intensity as a function of time.St2-t 1 - flash time interval in seconds.
Note: The maximum value of Ie is obtained when t2 and t axe sochosen that the effective intensity is equal to teinstantaneous intensity at t 2 and t 1 .
3.5.2 Field of Coverage. The light emitted by the total system shallhave a vertical field of coverage above and below the "horizontal plane"of the aircraft as specified in Figure 1. The horizontal field of coverageof the system shall be 3M0 degrees. "Horizontal plane" of the aircraftis liefined by the longitudinal and lateral axes of the aircraft. When therejuired coverage cannot be met due to blockage caused by aircraft structure,astores, etc., additional lights shall be installed to provide coverage inthe deficient areas.
3.5.3 Orientation. Each type system shall opera: is Inpecified while
in any attitude.
3.5.4 Shielding. The li-hts sLall be positioned or shielded, or
both, to prevent light beams from being directly ot indirectly projectedinto the cockpit or other tLreas that would interface with operating personnel.When the shielding or positioning is such that the light will not provide therequired coverage, additional lights shall be installed to provide coverage;n the deficient areas.
3.5.5 Flash Rate. The flash rate shall be 100-120 flashes per mivutefor the complete system. The flash rate shall be maintained throughoutthe bands of power iuput specified in paragraph 3.5.9.1. When any of thelight sources are deactivated, the flash rate from any remaining soircesin either uode shall continue to flash at its individually required rate.
.. 5.6 Reliability (Mean Time Between Failure, MTBF)/Service Life.Reliability for each type system ahall be in accordance with Test Plan IIIand Test Level F of MIL-STD-781 except as otherwise specified herein. Each
type system shall have a minimum acceptable MTBF of 1000 hours, a specifiedMTBF of 2000 hours, with Decision Risks of 10X and a Discrimination Ratioof 2/1. Failure of the system is deemed to have oczurred if a system failsoptically, breuks, arcs,, sparks, burns, misfires, crossfires between modesanytime during optrations, performs erratically or otherwise displays
PRELIMINARM DRAFT.NOT TO BE USED FOR PROCUREMENT PURPOSES
~1 170
)Y

DRAFTevidence o4 not conforming to conditions specified in this specification.Specific reliability test requirements are identified by paragraph 4.4.1.2.5.Crossfiring shall be defined as the electrical shorting or arcing ofelectrical current anywhere in the system total operation (start-up, runningand shut down) during which triggering of any non-selected mode occurs.
3.5.6.1 Optical Failure of the High Mode. A failure of the High Modewill be deemed to have occurred when Ie (paragraph 3.5.1) fails below 0.85I j(I defined in Table 1) effective candelas in the horizontal plane, forthe purpose of reliability computations.
3.5.6.2 Optical Failure of the Low Mode. A failure of the Low Modewill be deemed to have occurred when I (paragraph 3.5.1) exceeds 1.15 11or falls below 0.85 k (a. defined in Table 1) effective candelas in thehorizontal plane, for the purpose of reliability computations.
3.5.6.3 Optical Failure Day/Night Mode Computational Data Base. ForSsystem reliability computation, a seventy percent (70) high Wde and
thirty percent (301) low mode usage relationship shall be assumed.
V, 3.5.7 Environmental. Each type system shall operate as specifiedXW, herein over the ranges specified for each system category (see Table 2).
Both high and low modes of each system shall comply with the totalenvironmental requirements ot this specification.
3.5.7.1 Altitude. Performance requirements of this specification shallapply over the altitude ranges specified in Table 2 for each system category.In all cases the minimum altitude range required shall be 0 feet (sea level)to 50,000 feet.
3.5.7.2 Temperature. Performance requirements of this specificationshall apply over the temperature ranges specified in Table 2 for each systemcategory. The system shall be designed to withstand the non-operatingtemperature ranges specified in Table 2 and shall operate as specified whenthe system is returned to the operating temperature range of Table 2.
3.5.7.3 Ltmospheric Daeradation. Each type system shall be designedto withstand the effects of sunshine, rain, humidity, salt fog, dust, andany other atmospheric dogradation which may be encountered during use orstorage of the system. The system shall operate properly, when exposed lothose conditions of atmospheric degradation in which the aircraft using thesystem will operate. Sealing shall be per paragraph 3.6.1.
3.5.7.4 Explosive Atmosphere. The system shall not cause ignitionof an ambient explosive gaseous mixture with air, when thoroughly operatedin such an atmosphere after having been in such an atmosphere for a periodlong enough to be permeated by such an atmosphere.
REMLI4INARY DAWT'NOT TO nl UMED FOR PROCUREMNT PURPOSES
171

Ln LnDRAFT0 0o
0 0
0 0
E-4q-
C, 0
0 00
VA 44 I
- 172
DRAFT
3.5.7.5 Vibration. The equipment shall meet the performancerequirements of this specification when subjected to the vibrationenvironments of Table 3. Table 3 outlines the vibration environmentsexpected to be encountered by each aircraft category and represents thevibration levels each category is expected to withstand.
3.5.7.6 Acoustics. The equipment shall meet the performance require-ments of this specification when subjected to the acoustic environmentslisted in Table 3.
3.5.8 Electromagnetic Interference. The light shall be designedto meet the requirements of MIL-STD-461, test methods CE03, CS01, CS06,REOZ, and RS04. The frequency range of 14K Hertz and 1 M Hertz shallbe used for test method RXOZ, APSC Design Handbook 1-4 shall be usedfor design guidance.
3.5.9 Electrical Power Interface. Each type system shall operate inaccordance with the requirements specified in this specification itilizingthe applicable aircraft power having characteristics as defined in MIL-STD-704i for Category B equipment. Performance requirements of this specification shallbe met over interconnecting wiring from the power supply(s) to the lightsources represented by a maximum of 0.188 ohms resistance for each mode.
3.5.9.1 Power Consumption. Power consumption will be as specifiedper the applicable category.
3.5.10 Maintainabillty. Each type system shall provide for ease of systemmaintenance as specified herein. Major assemblies and their modules shallincorporate a capability for removal and replacemint within fifteen (15)minutes. Removal/installation of major assemblies or modules shall not causesystem/circuit detuning, degradation or instability and shall not require anysubsequent adjustments. There shall be no capability for field adjustmentsof the system to maintain compliance with performance parameters of thisspecification. Operational checkout of the system shall consist of a squatswitch as in MIL-S-8805 for the light sources with "test" mode, and visualinspection of assemblies or modules. System maintenance shall consist onlyof assembly/module, fuse replacements, or resetting circuit breakers whensuch circuit protection is used. When self-locking nuts are used in theassembly where module(s) replacements are anticipated and the nuts cannotbe replaced with the module(s), provisinis must be made for appropriatesafety wiring of the bolt. and/or nut.
3.6 Construction. Construction shall be such as to take full advantageof the design for minin I sie end weight, long life, maximum reliabilityand minimum electromagnetic interference per the applicable cattegory.
3.6.1 S" g.. Environmental seling shall be used in lieu of hermeticsealing in the construction of the system or major "eseblies to provideconformance with the requirements of this specification.
PREIInUARY DEAlT. ,.' TO BE USYM FOR PROCUR0 Ow PURoPOES
"173

DRAFT
IIV II
TABLE 3
VIBRATION AND ACOUSTIC NOISE REQUIR•RNTS
PULMIMNARY DRAlTNOT TO BE USED FOR PROCURUME PURPOSES"* " 174•• !i,
r, ,•., ,
DRAFT3.6.2 Electrical Connectors. The electrical connectors used in con-
junction with system wiring shall be military qualified quick connect/dis-connect type. Electrical connectors shall be selacte,4 and installed sothat contacts on the "live" or "hot" side of the connector are sockettype rather than pin type. Electrical connector-s used for power circuits,control circuits, and light source circuits shall be dissimilar to theextent that electrical connections cannot be made which would electricallydamage any portion of the equipment.
3.6.3 Interchangeability. All parts having the same manufacturer'spart number shall be directly and completely interchangeable with each otherwith respect to installation and performance. Changes in manufacturer'spart numbers shall be governed by the drawing number requirements of MIL-STD-100.
3.6.4 Screw Threads. Screw threads shall be in accordance withNIL-S-7742.
3.6.5 Thermal Design. The system shall be designed to incorporatewithin each assembly any necessary thermal devices required to comply withthe environmental requirements of this specification, provided such devicesare automatically activated/deactivated. The design of each type systemshall not require any externally supplied heating or cooling devices suchas fans, blowers, or ducting, etc.
3.7 Details of Ma.or Assemblies.
3.7.1 Light Source Assemblies.
3.7.1.1 Modules. The light source assembly shall be designed toprovide a light source module(s) incorporating high and low modes, and abase module for aircraft interfacing. The light source module and the basemodule shall be independently replaceable as separate modules requiringno more than fifteen (15) minutes of effort to remove and replace andrequiring no special tools.
3.7.1.2 Interchangeability. The light source assemblies shall bedesigned to allow full interchangeability of modules between light sourcesin any aircraft position. This interchangeability shall require not morethan fifteen (15) minutes of effort and no special tools.
3.7.1.3 Transparent Cover(s). The transparent cover(s) of the lightsource shall be glass which shall not craze, crack, discolor or dimensior.allydistort as a result of operational/environmental temperatures or otherconditions. Further, the transparent cover(s) assemblies shall not deterioratefrom ultra-violet radiation or aircraft cleaning chemicals. The transparentcover(&) shall not in any manner degrade color emission requirements as per3.7.1.4. Plastics shall not be used in any optical portions of the system.
PRELIMINARY DRAFTSWiOT TO BE USED FOR PROCU NT PURPOSES
175 I
Ore
DRAFT
3.7.1.4 Chromaticity. The chromaticity of the light emitted byeach light assembly shall be aviation white light, and/or aviation red,conforming to MIL-C-25050 revised to reflect FAS revisions for strobelight applications, except that the "X" chromaticity coordinate foraviation white light shall not be less ifhan 0.285.
3.7.1.5 Dimensions. Dimensions shall be specified as per applicablecategory.
3.7.1.6 Mounting. Each light source shall be designed to mate witha mounting flange if needed and shall Incorporate any necessary mountingprovisions required to comply with the rquirements specified. The mountingflange shall not be furnished as a component of the system.
3.7.2 Power Supply Assembly.
3.7.2.1 Modularization. The power supply assembly for eatch systemshall be designed to provide rnaximum use of modular construction. Thepower supply assembly and the separate power supply module(s) shall beindependently replaceable requiring not more than fifteen (15) minutes ofeffort to remove and replace. requiring no special tools.
te3.7.2.2 Mounting. The power supply assembly design shall incorporatethe necessary mounting provisions required to comply with the requirementsspecified for any mounting attitude including interior and erterior airframemounting.
3.7.2.3 Dimensions. Dimensions shall be specified as per applicablecategory.
3.7.2.4 Finish. The fire'sh of the power supply assembly shall beLusterless Black, Color No. 37038 in accordance with FED-STD-595.
3.7.2.5 Circuit Overload/Electrical Dmage Protection. The systemdesign shall be such that, in case of either an open or short circuit ofany light source in either the high or low mode, any other l±Zht source shallcontinue to operate and the system provided protection from impending electricaldamage. Where fuses, circuit breakers, or such devices are used, thesedevices shall be locatad in an assesuible service location and replaceableand rerettable within fifteen (15) minutes with no speitai tools wh.le onthe ground.
3.7.2.6 Marking. The marking requirements specified herein apply topower supply assemblies for each system and shall conform to NIL-STD-130.
3.7.2.6.1 Fuse Holders. Where fusew are used, the current rating shAllbe Identified adjacent to the fuse holder.
NOT TO U MUS FOR PfOC~UbIT MuBosES
L ~176*
DRAFT3.7.2.6.2 Circuit Breakers. Where circuit breakers are used, the
current rating shall be identified adjacent to the breaker.
3.7.2.6.3 Electtrical Connectors. Marking adjacent to electricalconnectors shall identify the connected circuit to preclude improperconnections.
3.8 Identification Marking. Equipment, assemblies, and parts shallbe marked for identification in accordance with MIL-STD-130.
3.9 Workmanship. The system shall be constructed and finished toproduce an item free from all defects which would affect proper functioningin service. Particular attention shall be given to neatness and thoroughnessof soldering, wiring, marking of parts and assemblies, finish, alignment ofparts, tightness of screw assemblies, and freedom of parts from burrs andsharp edges.
3.10 System Categories. A System Category consists of a groupingof aircraft which have similar limitations relative to strobe lightinstallation. Categories may be expanded or added by the Governmentto provide for additional and or changing aircraft limitations. It is under-stood that the categories described herein may be applicable to aircraftoutside of the defined category. Specification sheets are a specific
I implementation of category requirements. Each specification sheet for thecategory and type desired should be reviewed prior to the generation ofadditional systems. The categories are as follows:
i •
JAINAI 3A'PRULIMMRY MU"kkIOT TO 1 USED FOR PROCUMDM PURPOSES
177
DRAFT
3.10.1 Category A. Rotary Wing Aircraft.
3.10.1.1 System Description. Each type system shall consist of thefollowing assemblies:
a. Two (2) each light sources, each with high (white) and low (red)modes.
b. One (1) power supply assembly.
3.10.1.2 Power Consumption. The system shall not require more than300 watts of electrical power from an aircraft power source, averaged overeach flash cycle.
3.10.1.3 Weight. Each system shall weigh a maximum of fifteen (15)pounds, exclusive of assembly interconnecting wiring and remote switches.
3.10vl.4 Light Source Location. One soux-ce shall be located to provide"top half hemisphere" coverage and the other source shall be located toprovide "bottom half hemisphere" coverage.
3.10.1.4.1 Field of Coverage. The light emitted by the system shallhave a vertical field of coverage as specified in paragraph 3.561 with IH -3500 e.cg. high mode and 150 e.cd. low mode, excegt that the 20 to 45 0(and -20 to -450) sector shall be 0.25 , and 45 to 800 (and -450 to -80 )sector shall be 0.03 1H. Table 4 lists t e Category A distribution. Thehorizontal field of coverage for each light source shall be 360 degrees.Figure 2 graphically represents this distribution.
3.10.1.5 Flash Rate. Each type system shall emit 100 to 120 flashesper rdnute with each flash alternating between light sources in either thered or white light modes. Light sources in either mode shall be synchronizedto flash 180 degrees out of phase.
3.10.1.6 Dimensions. The light assembly shall conf~rm to the maximumdimensional requirements depicted in Figure 3. The power supply assemblyshall conform to the following dimensional requirements: length, width, andheight including mounting provisions and connectors shall not exceed fourteen(14) inches each and the total volume shall not exceed 1120 cubic inches.
PRELIMINARY MUMFT
NOT To 33 UME FOR PRocuREMEN PURPOSES
178
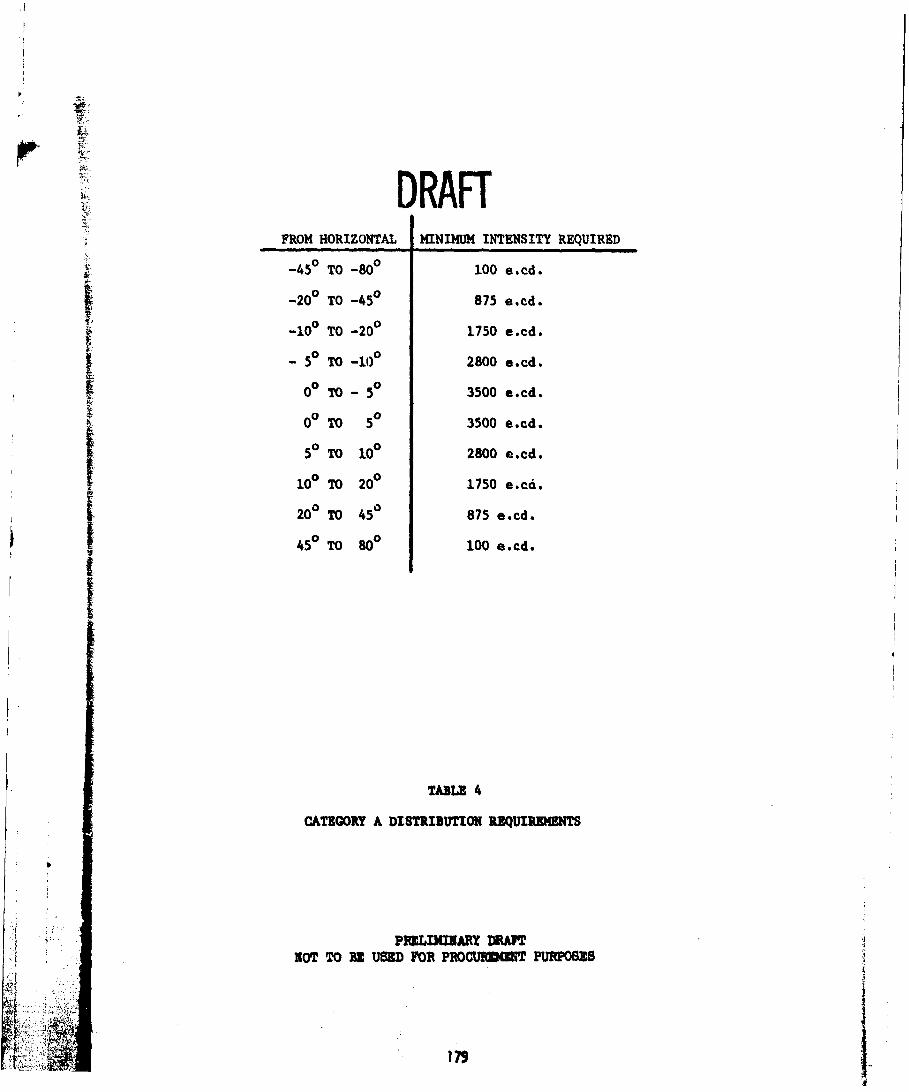
DRAFTFROM HORIZONTAL MINIMUM INTENSITY REQUIRED
4 -450 TO -80° 100 e.cd.
-200 TO -450 875 e.cd.
-10 TO -20° 1750 e.cd.
- 50 TO -100 2800 e.cd.
0 0 TO - 50 3500 e.cd.
S0 TO 5 3500 e.cd.
5 TO 100 2800 e.cd.
100 TO 200 1750 e.cd.
200 TO 450 875 e.cd.
450 TO 800 100 e.cd.
TABLE 4
CATEGORY A DISTRIBIUIT•I REQUIREMENTS
PWIUMAARY DRAFT
NOT TO BE UORD FOR PROCURMT PUPWOSES
• "" : :"•• "4
,.,4 •. , . v
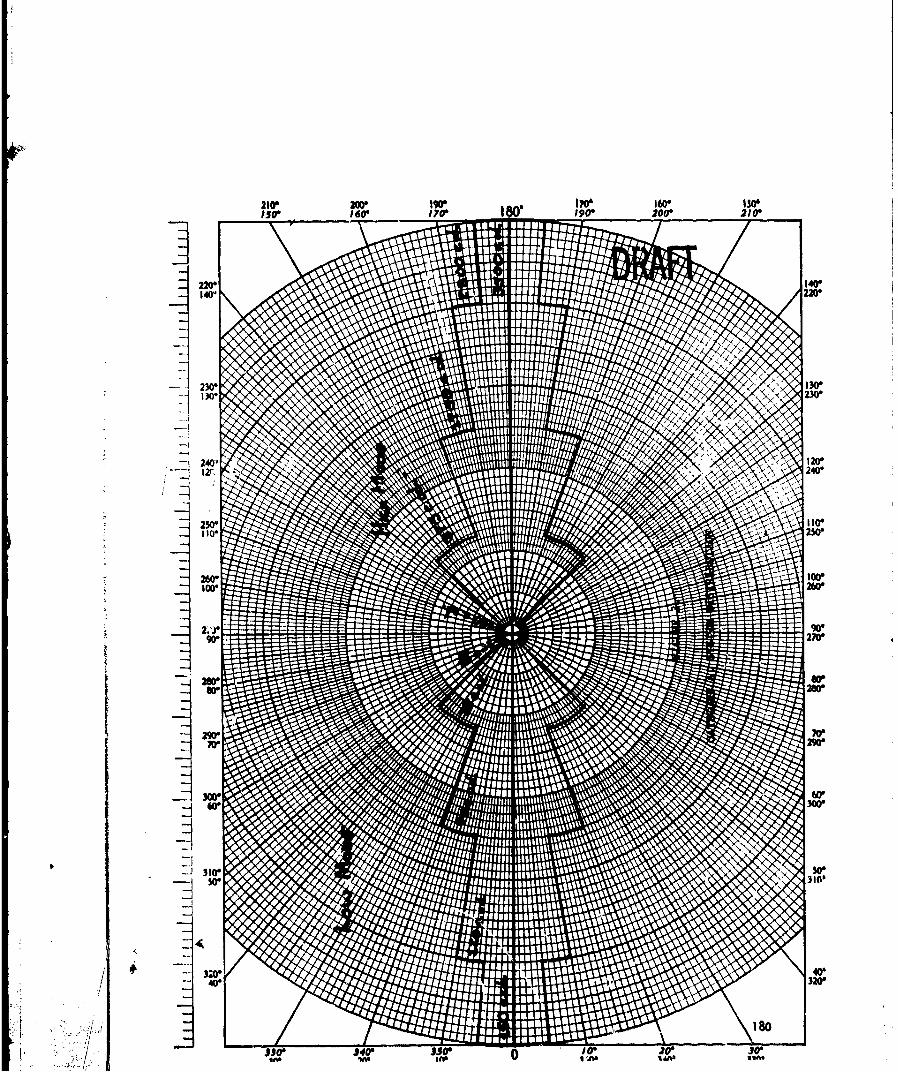
10 w1906 200* 2100
-till
II -
HI
240" 12W SO121. 240lBlA lMll
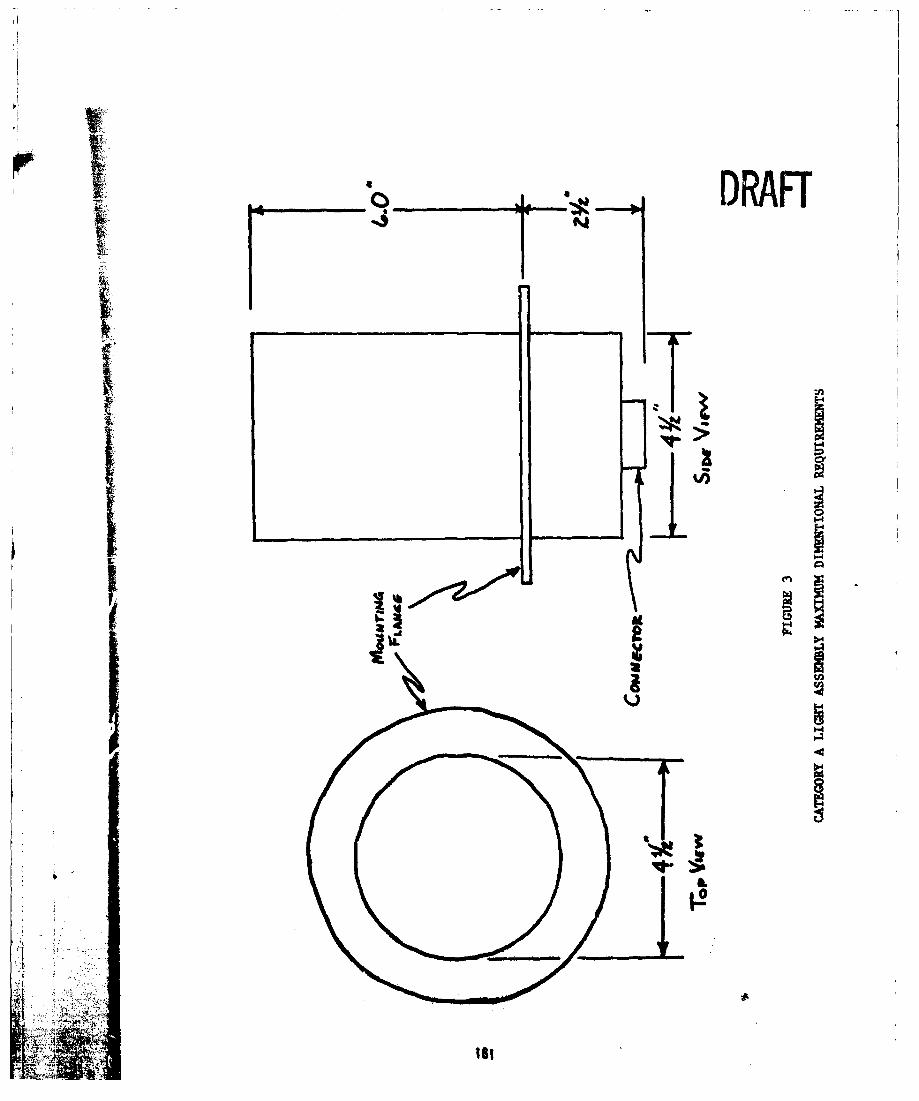
I
__'C) DRAFT
4
TiI ___ _ JIK
H0
II ui�
g
IK V
U
TA
I SI1��>
____LIs'
DRAFT3.10.2 Catestory B.
NOT~P2RILIMaARY DRAFTNOTTOBEUSID POP PROCUR01 rJPUIPO8ES
e~182
DRAFT
3.1.0.3 Category .
PRELIM1NARY DRAFTV
NOT TO BE USED F'OR PROCUREMNET Pu~poBss
183

DRAFT3.10.4 Category D.
PRELIM•H•RY DRAFTNOT TO BE USED FOR PItOC'JREMT PURPOSES
184

DRAFT3.11 System Types.
3.11.1 Type 1. The Type I system shall be a strobe light systemoperated from a 28 VDC (Volt Direct Current) aircraft power source. TheType I system shall operate without damage within the following limits:
Low Limit 16 VDCHigh Limit 28.5 VDC
Performance requirements specified herein apply only to the range 24 VDC
,o 28 VDC.
3.11.2 Type II. The Type II system shall be a strobe light systemoperated from a 115 VAC (Volt Alternating Current), 400 Hertz aircraftpower source. The Type II system shall operate without damage within the
following limits:
Low Limit 102 VAC at 380 HzHigh Limit 124 VAC at 420 Hz
Performance requirements specified herein apply only to the range 115 + 5%VAC at 400 Hz + 5%.
4.0 Quality Assurance Provisions.
4.1 General. This section shall be the basis for determining theextent of compliance with requirements specified herein. The term"inspection(s)" used herein shall be defined aa the eýamination and testingrequired by this specification to demonstrate complianc.e as specified herein.
4.2 Responsibility for Inspection. Unless otherwtse specified in thecontract or purchase order, the contractor is responsible for the performanceof all inspection requirements as specified herein. Except as otherwisespecified in the contract or purchase order, the contractor may use his ownor any other facilities suitable for the performance of the inspection require-ments specified herein. Inspection records shall be kept complete and availableto the Government. All data not delivered to the Government as specified inthe contract or purchase order shall be maintained in an orderly fashion toallow review by the Government upon demand. The Government reserves the rightto rerform any of the inspections set forth in this specification where suchInspections are deemed necessary to assure that supplies and services conformto prescribed requirements.
4.3 Facilities. The contractor shall furnish any facilities, equipment,or personnel that the Government may require tc insure that the system(s)meets the requiremetits of this specification. The facilities must be reviewedand approved by the Government prior to their use for the performance ofthe inspection requirements specified herein. The Government shall reserve
PRELIMINARY DRAFTNOT TO BE USED FOR PROCUREMENT PURPOSES
185
DRAFTthe right to accept or reject an item as a result of such inspectionsif such inspections indicate the requirements of this specification havenot been fulfilled.
4.4 Classification of Inspections. The inspections of the systemshall be classified as follows:
a. Qualification inspections (4.4.1)
b. Acceptance inspections (4.4.2)
(1) Individual inspections (4.4.2.1)
(2) Sampling inspections (4.4.2.2)
4.4.1 Qualification Inspections. Qualification inspections shallbe conducted by the Government or by the vendor, as de "rmined by theGovernment, to insure that candidate equipment fully complies with require-ments herein. Ten (10) candidate systems shall be submitted to qualificationinspections cited herein. Satisfactory compliance with all qualificationinspections shall form a basis for acceptance of candidate systems asqualified. The qualification insrpctions shall consist of the following:
4.4.1.1 Qualification Examinations. Each system shall be examinedto determine conformance to the requirements specified herein with respectto materials, workmanship (a.3sambly, construction, dimensions, tolerances,etc.), painting and marking. Each system shall be examined to determinethat it is correctly assembled as evidenced by visual or other examinationas required.
4.4.1.2 Qualification Testing. The candidate system shall, on thesampling basis described by paragraph 4.4.1, be subjected to the followingoperational tests prior to qualification acceptance. Physical mountingfor these operational tests shall simulate typical aLý.raft installations,i.e., "Top" and "Bottom" of fuselage, "Wingtip," .4l1, etc.
4.4.1.2.1 Flash Rate. The flash rate of the candidate system shallbe measured for compliance with normal operating ranges of 3.5.5.
4.4.1.2.2 Effective Intensity and Distribution. The intensity ofeach light source shall be photometrically measured under a complete andnormal syntem interconnected configuration to insure compliance withintensity and distribution requirements specified by 3.5.1, 3.5.2, 3.5.3.
4.4.1.2.3 Chrotiticiat. The system shall be photometrically measuredto insure that chromaticity of light for the system in all modes is inaccordance with 3.7.1.4.
4.4.1.2.4 Electrical Tests.
PRELIMINARY DRAFT
NOT TO BE USED FOR PROCUREýM PURPOSES
186
DRAFT
4.4.1.2.4.1 Power C,-,sumption. The power consumption shall bemonitored throughout qua-ification testing to insure that power consumptionof the system does not exceed the value specified in 3.5.9.1.
4.4.1.2.4.2 Electrical Malfunctions. The system shall be monitoredthroughout qualification testing for electrical short and open circuits.In the event of such malfunctions in the system, aircraft protection shallhave been incorporated consistent with requirements of 3.7.2.5.
4.4.1.2.4.3 High/Low Voltage Survivability Tests. The candidatesybtem shall be tested to insure it will operate without damage at thefollowing voltaie limits:
Type I System Test Requirements
Low DC Teat Limit 16 VDCHigh DC Tevt Limit 28.5 VDC
Type II System Test Requirements
Low AC Test Limit 102 VAC, Single Phase at 3?0 HzHigh AC Test Limit 124 VAC, Single Phase at 420 Hz
4.4.1.2.4.4 Normal Test Input Voltages. Qualification shall beperformed at nominal input voltages for each type system, except whereotherwise specifically required herein. Nominal voltage for Type I systemshall be 28.0 VDC +0 VDC and nominal voltage for Type II systems shall be
C+ -1.5 VDC115.0 VDC 5%, Single Phase, 400 Hz.
4.4.1.2.5 Reliability Testing.
4.4.1.2.5.1 Reliability. Reliability testing to insure compliancewith 3.5 shall be in accordance with Test Plan III and Test Level F ofMIL-STD-781 except as otherwise specified herein. These system(s) shallhave a minimum acceptable MTBF of 1000 hours, a specified MTBF of 2000 hours,with Decision Risks of 10% and a Discrimination Ratio of 2/1. The ReliabilityDuty Cycle shall have a seven (7) hours operation in the high mode followedby three (3) bours operation in the low mode with the system deactivatedby the mode switch for one minute after each duty cycle. Vibration shallbe applied continuously during the equipment "on" time. Temperaturecycling shall be in accordance with the Alternative Method of TemperatureCycling (para 5.2.3.2 of MIL-STD-781). The time for stabilized equipmentoperation at both the lower temperature a-d higher temperature shall bethe time required for one complete Reliability Duty Cycle. The time requiredfor equipment to stabilize at either the lower temperature or highertemperature si-all be no more than one (1) hour. Input voltage shall be at
PRELIMINARY DPHM
NOT TO BE USED ýPOR PROCUREMENT PURPOSES
187
DRAFT
the applicable nominal voltage. Input voltage cycling shall not be performed.There shall be no adjustments, preventive maintenance or replacement ofassemblies, modules or components during the reliability testing except asspecified in MIL-STD-181. Environmental tests shall be run concurrentlywith and the time included as part of the reliability testing time.Candidate systems shall be tested in complete normal operating configurations.
4.4.1.2.5.2 Reliability Test Failures. For each type system afailure is defined as having occurred when the system breaks, burns, cross-fires, fails optically, fails to meet flash rate requirementm, performserratically or otherwise displays evidence of not conforming to conditionsspecified in this specification which results during its normal operation.Failure of the cockpit control switche(s) shall not be counted as a failureof the system unless the failure is determined to be the result of inherentsystem design deficiencies.
4.4.1.2.5-2.1 Optical Failure of the High Mode. A failure of the highmode shall have occurred in the high mode when the light intensity fallsbelow .85 1H in the horizontal plane.
4.4.1.2.5.2.2 Optical Failure of the Low Mode. A failure of the lowmode shall have occurred iii :he low mode when the light intensity exceeds1.15 TH or falls below .85 IH oi" falls below .85 IH in the horizontal plane.
4.4.1.2.5.2.3 System Failure Basis. All systems' failure criteriais predicatea in normal voltages of 28.0 VDC or 115.0 VDC, respectively,unless specifically otherwise required herein (per paragraph 4.4.1.2.4 ').
4.4.1.2.6 Grounding Systems Tests. Grounding systems tests shallbe performed to determine compliance with comiercial aviation groundingstaTidards. Compliance with paragraph 3.4.2.1 shall be demonstrated.
4 .4.1.2.7 Environmental Tests. The following envirotnm-njia L tLest.6shall be performed to assure durability and reliability ot tne. inaterii fIs jntcomponents under the environmental extremes specified In paragraph 3..7.Tests shall be conduzted with candidate systems in their normal operatingconfiguration.
4.4.1.2.7.1 Temperature-Altitude Test. Each type system shall besubjected to a temperature-altitude test in accordance with MIL-STD-810,method 504, procedure I, and shall demonstrate that the system meets therequirements of paragraphs 3.5.7.1 and 3.5.7.2.
4.4.1.2.7.2 Rain Test. Each type system shall be subjectedto a rain test in accordance with MIL-STD-810, method 506, procedure I.Pretest data is required per MIL-STD-810, paragraph 3.2.1. The systemshall be operated during the test. Data shall be collected before, during,
PRELIMINARY DRAFT
NOT TO BE USED FOR PROCUREMENT PURPOSES
188
DRAFT
and after the test to demonstrate operation as specified in paragraph 3.5.7.3.
4.4.1.2.7.3 Humidity Test. Each type system shall be subjected to ahumidity test in accordance with MIL-STD-810, method 507, procedure I.Pretest data is required per MTL-STD-810, paragraph 3.2.1 The systemshall be operated during t.he test. Data shall be collected before,during, and after the test to demonstrate Nperation as specified inparagraph 3.5.7.3.
4.4.1.2.7.4 Fungus Test. Each type system shall be subjected toa fungus test in accordance with MIL-STD-810, method 508, procedure I.Pretest data is required per MIL-STD-810, paragraph 3.2.1. The systemshall be operated at the end of the incubation period.
4.4.1.2.7.5 Salt Fog Test. Each type system shall be subjected toa salt fog test in accordance with MII.-STD-810, method 509, procedure 1.Pretest data and post test data is required per MIL-STD-810, paragraph 3.2.1and 3.2.4.
4.4.1.2.7.6 Dust Test. Each type system shall be subjected to a dusttest in accordance with MIL-STD-810, method 510, prccedure I. Pretestdata is required per MIL-STD-810 paragraph 3.2.1. The system shall beoperated during the test. Step 3 of the test shall be performed immediatelyafter reaching stabilization of the temperature requirements of Step 2.
4.4.1.2.7. 7 Expiosive Atmosphere Test. Each type system shall besubjected to an explosive atmosphere test in accordance with MIL-STD-810,method 511, procedure I, and shall demonstrate that the system meetstne requirements of paragraph 3.5.7.4.
4.4.1.2.7.8 Vibration Test. Each type ,.yst:eqi shall he subjected tovibration testing in accordance with MIL-STD-•8O, method 514 and tableherein, and shall demonstrate that the systtm meets the. requirements ofparagraphs 3.5.7.5 herein.
4.4.1.2.7.9 Acoustical Noise Test. E,.i'h type system shall besubjected to acoustical noise testing in accordance with MIL-STD-810,method 515 and table herein, and shall demonstrate that the systemmeets the requirements of paragraph 3.5.7.5 herein.
4.4.1.2.7. 10 Shock Test. Each type system shall be subjected to a shockteet in accordance with MIL-STD-810, method 516, procedure I. Pretestdata is required per MIL-STD-810 paragraph 3.2,1. The shock pulse shall beas shown in MIL-STD-810 figure 516.2-1 for flight vehicle equipment.
4.4.1.2.8 Electromagnetic Interference Test. Electromagneticinterference tests shall be conducted in accordance with tests proceduresestablished by MIL-STD-462 to assure conformance to this specification.Minimum Test Requirements are as follows:
PRELIMINARY DRAFTNOT TO BE USED FOR PROCUREMENT PURPOSES
1 8
DRAFT
4.4.1.2.9 Extent of Testing and Test Conditions Not Covered Herein.The extent of testing and test conditions required to determine qualityassurance for an±y component/module or subassembly of the system shall bedetermined by the Government. Joint Government/Contractor agreement shallprevail for cases where such criteria has not been included in thisspecification.
4.4.1.2.10 Material to Accompany Systems. Systems submitted by theContractor for Government qualification inspections shall be accompaniedby preliminary installation and operating instructione. Such instructionaldata shall include interconnection and operational specifications.
4.4.2 Acceptance Inspections. Acceptance inspections shall consistof individual inspections (those inspections performed on each and everysystem) and Sampling inspections (those performed on two (2) iraadomlyselected samples of every one hundred (100) production systems) asfollows:
4.4.2.1 Individual Inspections. Individual inspections shall be con-ducted to insure that each production system conforms to the requirementsand standards established by this specification. Individual inspectionsconsist of:
a. The Qualification Examinations defined in paragraph 4.4.1.1.b. As a confidence test, the light output of at least a single
radial vector will be selected and tested on each light source demonstratingthat the source being tested meets the requirements of paragraphs 4.4.1.2.1and 4.4.1.2.2. This confidence test will be conducted with a power supplyhaving identical characteristics as defined for the light source under test.
t c. Each power supply will be functionally tested to demonstraterequired output.
4.4.2.2 Sau~ling Insnections. Sampling inspections shall be conductedto iasure that production systems conform to requirements and standardsestablished by this specification. Inspections shall ..onsist of thequalification inspections of paragraph 4.4.1. Failure of any sample shallbe grounds for increasing rate of sam'pling and/or cessation of productionuntil failure cause has been determined and corrected. This shall be atthe discretion of the Government.
PRELIMINARY DRAFTNOYT TO BE USED FOR PRO CUREMEvNT PURPOSES
190
iti
DRAFT4.5 Disposition of Test Samples. When the Government has contracted
for candidate systems, the Government shall retain equipment tested. Whencandidate systems have been acquired for required testing at no cost to theGovernment, the equipment will be returned to the vendor at the end ofsebeduled test series. If equipment has performed in a manner at anytime during testing which would disqualify it for further considerationwithin the test series and time frame scheduled, it will also be returnedto the vendor.
4.6 Demonstrations. When specified in this specification or contract,reliability, environmental and maintainability compliance demonstrationsshall be conducted by the Contractor and shall commence following thesatisfactory completion of inspections and testing of the anti-collisionstrobe system at the site agreed to by the Government.
4.6.1 Reliability Demonstration. This demonstration shall be performedin accordance with the Government approved, Contractor prepared, demonstrationplan, Proof of Contractor compliance with the demonstration plan shallinclude the necessary collection of operation ýnd failuie data in order thatthe Government way assess the extent reliability requirements specified hereinhave beer achieved.
4.6.2 Maintainability Demonstration. This demonstration shall beperformed in accordance with the Government approved, Cuatractor prepared,demonstration plan. Proof of compliance with maintainability requirementsspecified in this specification shall include the necessary collection ofmaintainability data in order that the Government may assess the extentthat maintainability requirements have been achieved.
4.6.3 Environmental Compliance Demonstration. This demonstrationshall be performed in accordance with the Government approved, Contractorprepared, demonstration plan. Proof of Contractcr compliance with thedemonstration plan shall Include the necessary collection of operation andfailure data in order that the Government may assess the extent environmentalrequirements specified herein have been achieved.
4.6.4 Necessary Test and Demonstration Data CollecLions. The data shallinclude names and identification of Government witnesses approved by theprocuring activity'.
5.0 PREPARATION FOR DELIVERY.
5.1 Praparation for delivery will be in accordance with theinstructions of the procuring activity.
6.0 NOTES.
6.1 Operational Considerations. The anti-collision system shall bedesigned to replace the existing anti-collision system as a means for
PRELIMINARY DRAPT
NOT TO BE USED FOR PROCUREMENT PURPOSES
191

DRAFT
detecting aircraft to avoid mid-air collisions during visual meterologicalconditions.
6.2 Essential Characteristics. To eliminate risks to the Governmentin procuring a proven capability, no equivalent will be accepted for theparameters forming essential characteristics of the system as describedby this performance specification.
6.3 International Standardization Agree!n•nts. When amendment, revision,or cancellation of this specification is proposed which vill affect or violateany international agreement, the preparing activity will take appropriatereconciliation action through international standardization channelsincluding departmental standardization offices, if required.
PRELI INARY DRAFTNOT TO BE USED FOR PROCUDE4ENT PIRPOSES
192
DRAFT MIL-L-XXXX/l
MILITARY SPECIWICATION
LIGHT, HELICOPTER, ANTI-COLLISION, STROBE
This specification is approved for use by all Departmentsend Agencies of the Department of Defense.
This specification sheet describes a Cateogry A, Type I and Category A,Type II Strobe knti-Collision Aircraft Light. T•.e complete r*quiremwntsfor procuring Strobe Anti-Collision Helicopter Lights described hereinshall consist of this document and the latest issue of MIL-L-XIr I
APPLICABLE DOCUMENTS
The following documents of the issu,;- in effect on date of invitation forbids or request for proposal(s) fora a part of this specification to theextent specified herein:
SPECIFICATIONS
UEQUIRMOMNTS
1. System Design. The system shall provide two (2) light sources, eachconsisting of both a red light mode (low) and a white light mode (high),either red or white mode being selectable utilizing remotely located(cockpit mounted) switches. The squat switch required in paragraph 3.4.1 ofNIL-L-XXXX is not required.
PBLIMJIARY DRAFTNOT TO BE USED FOR PROCUEME PURPO8S
193
A
2. Mode Selection. In addition to the "white," "off," or "red" modeselection pir MIL-L-XXXX paragraph 3.4.1.1 a second MS27408-IA switchshall be use3 for selection of either aircraft topside ("IOP") or aircraftbottom side ("BOTTOM") light source in the high or low moudes with upperposiLtion being "BOTE," center position being "UPPER," and lower positionbeing "LOWER."
3. Field of Coverage. The Field of Coverage shall be per paragraph3.10.1.4.1 of MIL-L-XXXX. Each lig.at shall have the vertical coverageshown in Figure 1.
4. System Desc-iption. The system described herein consists of either aType I (NSN 6220-00-361-0644) or a Type II (NSN 6220-00-361-0614) systemas designed by the U.S. Army Aviation Systems Command (AVSCOM) for useon their helicopters. Figure 2 shows the system assznblies and modulesdescribed herein.
4.1 Light Assembly. (AVSCOM P/N 1680-EG-035-9/NSN 6220-00-433-7175)The light assembly consists of three (3) modules and two (2) retained bands.The modules are as follows:
a. Light Housing AVSCOM P/H 1680-EG-035-17
b. White Module 1680-EG-035-19
c. Red Module 1680-EG-035-21
d. Retainer band (for White Module) 1680-EG-035. 23
e. Retainer band (for Red Module) 1680-EG-03.i-25
NOTE: The 1680-EG-035-9 Light Assembly consists of the 1680-035-17,-19,-21,-23, and -25 modules.
4.1.1 Light Housinj&. The Light Housing forms the base of the lightassembly, contains the two trigger coils used to fire their respective lightmodules, and the MS 3122E14-5P connector to allow connection to the systemsupply.
4.1.2 White Module. The White Module forms the high or daylight mode ofthe light system. The module requires 100 Joules and produces a minimum
IH (see paragraph 3.5.1 of MIL-L-XfX=) of 3500 e.cd.
4.1.3 Red Module. The Red Module forms the low or night more of the lightsystem. The module requires 45 Joules and produces a minimum IH (seeparagraph 3.5.1 of MIL-L-XXXX) of 150 e.cd.
4.1.4 Retainer Band-White Module. The Retainer Band for the White Module isused to secure the White Module to the Base Module and allows for easy
PRELIMINARY DRAFT
NOT TO BE USED FZ 9~R0CUREM1ENT PURPOSES
210' 2001, 1~90,716 '50
220"10140'20
2400
PtP
3JO* 110*5' 0.2
FT I- W'tn
27* aJ4- CO
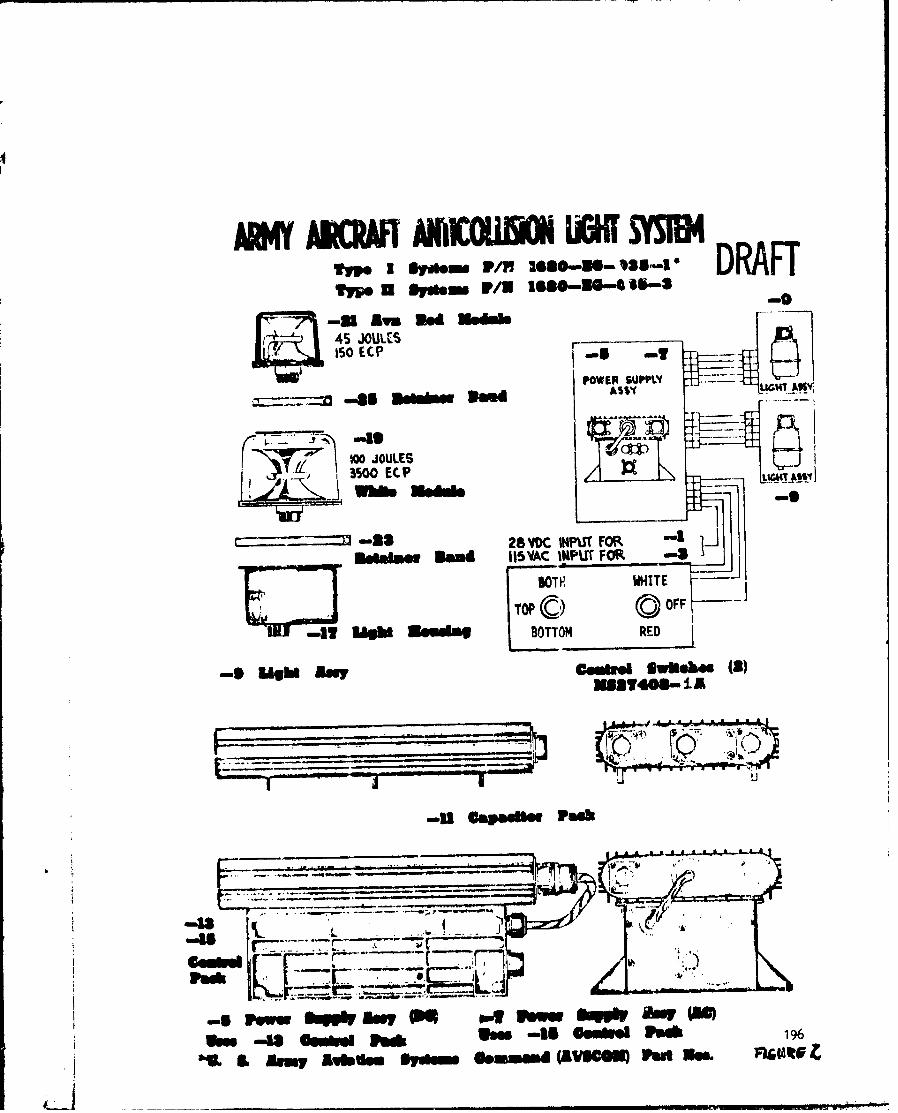
ANAMI AN1EGLmwW to1f mm181EY sp I sw~mU nw/p 2680-ms-1085 DRAFTIV" U Syuhm F/w 1686-w64 &-4 -
45 JOIULES150 EC?
"PWEt surPtli
l00 JOULES cm=jc~-~-~3500 ECP r
~ -23 28 VDC INPUT~ FORUsobdoe 3334 115 VAC INPUT FOR~
My los*BOTTOM RED _
-. tb IAw"1 ComemI Iwitebs (3)3531408- iA
-U sape.Uw P.6k
gem-
gm. -a3 Gm"d3 ~ 3634 196
'VuS&Miy &Vbi.. ftim ftino (&VICUE) Paul Urk& fwSIlU

I
replacement during repair.
4.1.5 Retainer Band-Red Module. The Retainer Band for the Red Module is usedto secure the Red Module to the Wbite Mcdule and allows for essy replacementduring repair.
4.2 Power Suppl7 1ossembly. The Power Supply Assembly consists of two (2)modules a Capacitor Pack and either a Type I or Typc II Control). Thecomplete Pcwer Supply Assembly is either a Type I (28 VDC input) AVSCOMP/N 1680-EG-035-5/NSN 5945-00-475-9125 or Type II (115 VAC input) AVSCOMP/N 1680-EG-035-7/NSN 5945-00-475-9117. The modules are as tollows-
a. Capacitor Pack AVSCOM P/N 1680-EG-035-11
b. Type I Control AVSCOM P/N 1680-EG-035-13
c. Type II Control AVSCOM P/N 1680-EG-035-15
NOTE: The 1680-EG-035-5 Power Supply Assembly consists of the 1680-EG-035-11and -13 modules. The 1680-EG-035-7 Power Supply Assembly consists of the1680-EG-035-11 and -15 modules.
4.2.1 Capacito. Pack.
4.2.2 !.pe I Control.
4.2.3 Tye II Control.
4.3 Related Components. The following components are required fur completesystem's installation but are not included in the procurement of thestrobe light system. The components are as follows:
a. Switches and/or Control Panel
b. Mounting Flange
c. Cable(s)
4.3.1 Switch and/or Control Panel. Two MS 27408-IA switches are required tooperate the system (see paragraph 2 of this specification sheet). Figure 3depicts a typical eontrol panel.
PRELIMINARY DRAFTNOT TO BE USED FOR PROCUEMENT PURPOSES
197
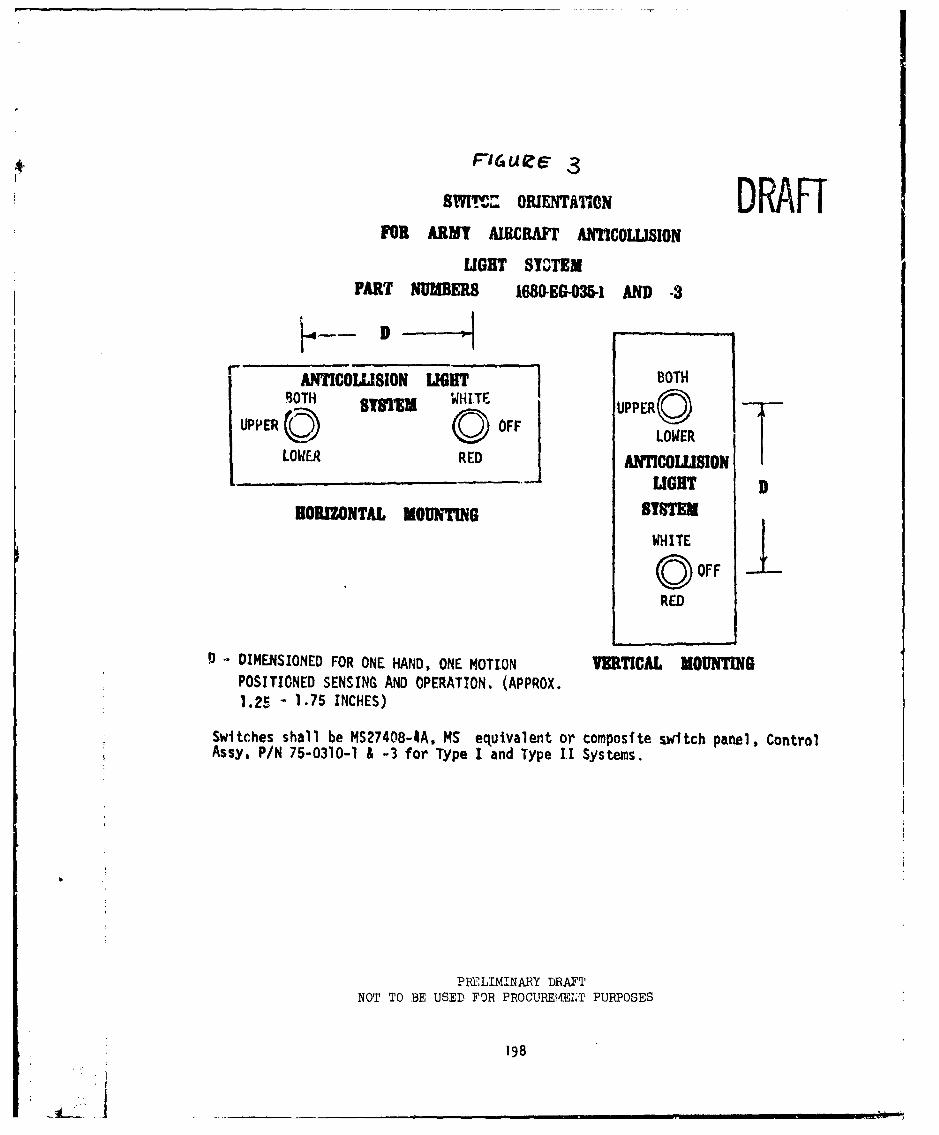
SORIENTATN DRAFTFOR ARMY AILCWRAFI ATICOLLIfION
LIGHT S!3T'M
PART NUMBERS 168WE&03*1 AND -3
f AI TICOLUSION LIGHT BOTHUPP TH RROTisSTm WHITE UPPERO T
UP0ER ( 0 0OF LOWERLOWER RED ANTICOLLMON
LIGHT DHORIZONTAL MOUNTING SYSTEM
W H IT E O
OFF
RED
Q .- DIMENSIONED FOR ONE HAND, ONE MOTION VRI CAL MOUNTINGPOSITIONED SENSING AND OPERATION. (APPROX.1.25 - 1.75 INCHES)
Switches shall be MS27408-AA, MS equivalent or composite switch panel, ControlAssy, P/N 75-0310-1 & -3 for Type I and Type .I1 Systems.
b
PRELIMINA3Y DRAFTNOT TO BE USED FOR PROCUREKENT PURPOSES
198
DRAFT
4.3.2 Mounting Flange. A mounting fiange must be pro'i'ed to attach th,Light Assembly to the aircraft. A typical Mounting Flange is depicted inAVSCOM Drawing No. 1680-EG-035-27.
4.3.3 Cables. Four cables are required for installation of the systemdescribed.
4.3.3.1 Power Supply to Light Assembly. Two cables conforming to HIL-W-81044shall be provided to connect the appropriate power supply output to the lightassembly (top and bottom). The cable shall be five (5) color coded stra:ndedinshielded conductors. Three (3) conducýtors shali be #16 gage and two (2)conductors shall be #20 gage. All conductors shall be bundled in a braidedshield and sheaC-c1. Each cable shall have a MS 3126F14-5P connector onthe power supply cud and a MS 3126F14-5S connector on the light assembly end.
4.3.3.2 Power Supply to Control Switches. One cable conforming toMIL-W-81044 shall be provided to connect the appropriate power supply inputto the cockpit control switches. The cable shall be four (4) color codedstranded unshielded #20 gage conductors. Conductors shall be bundled andoverall sheathed. The power supply end shall have a MS 3126F14-5S Connector.
4.3.3.3 Power Supply to Power Bus. One cable conforming to MIL-W-81044shall be provided to connect the power supply to the power supply bus. Thecable shall be one (1) conductor color coded #16 gage and terminate in theconnector of paragraph 4.3.3.2.
PRELIMINARY TAflNOT TO BE USED FOR PROCURMET PUWgOSES
199*U.S.Govor|'ment PrIntIng Officea 1977 - 757-0011*7