grinding characteristics of wheat in industrial mills -...
TRANSCRIPT
Chapter 15
Grinding Characteristics of Wheat in Industrial Mills
Gheorghe Voicu, Sorin-Stefan Biris,Elena-Madalina Stefan,Gabriel-Alexandru Constantin andNicoleta Ungureanu
Additional information is available at the end of the chapter
http://dx.doi.org/10.5772/53160
1. Introduction
Grinding of cereal seeds is due to the mechanical action of several forces: compression,shearing, crushing, cutting, friction and collision, to which seeds are subjected, dependingon the design if the mill used for grinding (roller mill, hammer mill, stones mill or ball mill).By applying these forces, when the mechanical resistance of the particles is exceeded, theirdivision happens in a number of smaller particles of different sizes, geometric shapes, mass‐es and volumes.
An industrial wheat mill has several technological phases, starting with coarse grinding ofseeds to fine grinding of the resulted milling products, after their sorting in fractions of dif‐ferent sizes. The first technological phase of grinding process, in wheat mills, is gristing orcoarse grinding phase, which also consists of several technological passages.
A technological passage consists of a grinding machine (roller mill), a machine for siftingand sorting of the resulted milling fractions (plansifter compartment) and, eventually, a ma‐chine for the conditioning of semi-final product (semolina machine or bran finisher). In atechnological passage, intermediate fractions are obtained, which, by a new grinding, leadto the obtaining of high-quality flour at milling passages (fine grinding).
Wheat processing requires a long and gradual transformation into flour. This process takesplace after a gradual crushing schedule, from fine to finer, from machine to machine, ofwheat seed, respectively of the crushed particles resulting from it. Each grinding operationis immediately followed by a sorting operation by sifting (fig.1) because during grinding, awide variety of grinded seed particles is obtained.
© 2013 Voicu et al.; licensee InTech. This is an open access article distributed under the terms of the CreativeCommons Attribution License (http://creativecommons.org/licenses/by/3.0), which permits unrestricted use,distribution, and reproduction in any medium, provided the original work is properly cited.
Intermediate
product Intermediate
product Intermediate
product
Intermediate
product
Plansifter compartment, with 12 sifting frames
Intermediate
product
5 Flour
Wheat seeds or other intermediate products
Roller mills
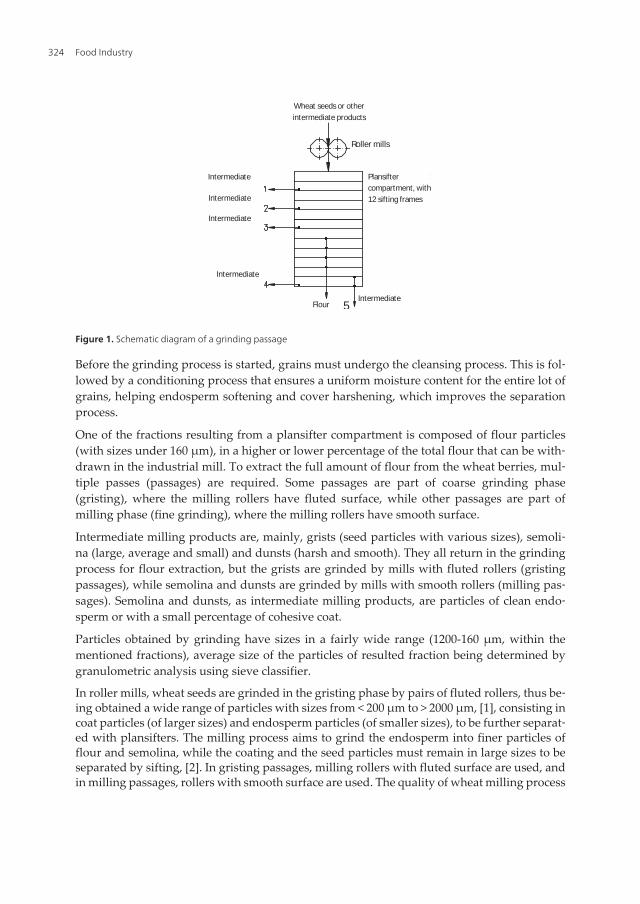
Figure 1. Schematic diagram of a grinding passage
Before the grinding process is started, grains must undergo the cleansing process. This is fol‐lowed by a conditioning process that ensures a uniform moisture content for the entire lot ofgrains, helping endosperm softening and cover harshening, which improves the separationprocess.
One of the fractions resulting from a plansifter compartment is composed of flour particles(with sizes under 160 μm), in a higher or lower percentage of the total flour that can be with‐drawn in the industrial mill. To extract the full amount of flour from the wheat berries, mul‐tiple passes (passages) are required. Some passages are part of coarse grinding phase(gristing), where the milling rollers have fluted surface, while other passages are part ofmilling phase (fine grinding), where the milling rollers have smooth surface.
Intermediate milling products are, mainly, grists (seed particles with various sizes), semoli‐na (large, average and small) and dunsts (harsh and smooth). They all return in the grindingprocess for flour extraction, but the grists are grinded by mills with fluted rollers (gristingpassages), while semolina and dunsts are grinded by mills with smooth rollers (milling pas‐sages). Semolina and dunsts, as intermediate milling products, are particles of clean endo‐sperm or with a small percentage of cohesive coat.
Particles obtained by grinding have sizes in a fairly wide range (1200-160 μm, within thementioned fractions), average size of the particles of resulted fraction being determined bygranulometric analysis using sieve classifier.
In roller mills, wheat seeds are grinded in the gristing phase by pairs of fluted rollers, thus be‐ing obtained a wide range of particles with sizes from < 200 μm to > 2000 μm, [1], consisting incoat particles (of larger sizes) and endosperm particles (of smaller sizes), to be further separat‐ed with plansifters. The milling process aims to grind the endosperm into finer particles offlour and semolina, while the coating and the seed particles must remain in large sizes to beseparated by sifting, [2]. In gristing passages, milling rollers with fluted surface are used, andin milling passages, rollers with smooth surface are used. The quality of wheat milling process
Food Industry324
is influenced by the physical and mechanical properties of seeds and of the intermediate prod‐ucts (size distribution, seeds hardness, moisture content) and by the design and functional pa‐rameters of the roller mill (mutual arrangement of the rollers, differential speed, distancebetween the rollers, flutes profile, mutual position of the flutes), [3,4]. Effects of these factorsare manifested in the size distribution of material particles, compositional distribution of thematerial, wear degree of the rollers, energy consumed for grinding, [4].
Fang, Campbell et al. (2002) showed that if the distance between rollers increases from 0.3mm to 0.7 mm, wheat seeds breakage in the gristing phase has a lower intensity, resulting inmore particles of large sizes and less particles of smaller sizes. Distance between rollers indi‐rectly influences the specific surface and energy consumption per mass unit and directly in‐fluences the specific energy, [5]. Different flutes arrangements on the rollers lead to theobtaining of different size distributions. If the roller flutes are arranged in blade/blade posi‐tion results in a relatively uniform size distribution, and back to back arrangement lead to adeep parabolic distribution, [1].
Differential speed of milling rollers has a significant effect on the grinding of semolina, flourand wheat bran. With the increase of differential speed of rollers, it also increases theamount of semolina and decreases the amount of flour and wheat bran, [6]. This is due tothe difference between shearing and compression forces which are applied on the particles.
It is very important to know the size distribution of the material subjected to grinding, aswell of the grist, so that appropriate adjustments can be made to roller mills, and also tochoose the fabrics for the sieving frames of plansift compartments. Particles size distributionof the granular material can be determined using superposed sieve classifiers (sieve shak‐ers), with different sizes of sieve holes. This can be assessed by various mathematical func‐tions, from which, most used is the Rosin-Rammler function.
Experiments were performed on the material subjected to grinding (before and after grind‐ing) and cumulative distribution curves were drawn for the sieved material, by computeraided regression analysis of the experimental data with Rosin-Rammler function. Based onthe data obtained from particle size distribution were also determined other physical charac‐teristics of the analyzed material: average particle size, grist modulus, specific surface of thegranular material, surface increasement resulted from grinding within a passage (break),bulk density and specific mass.
Within this chapter are presented the flow diagrams for two wheat mills of different capaci‐ties, one of 100 tons / 24 hours and one of 220 tons / 24 hours, from which it can be estimatedthe movement of products within the mill.
There are also presented the experimental results obtained from the particles size distribu‐tion of the material subjected to grinding and of the resulted grist, in both technologicalphases, for the two mills, as well as particles size distribution of the material for variousgrinding machines of the analyzed mills.
Knowing of the mechanical characteristics of wheat seeds and of the grist particles, and alsotheir size characteristics, volume and mass of the wheat seeds, is useful for estimating theenergy required for crushing.
Grinding Characteristics of Wheat in Industrial Millshttp://dx.doi.org/10.5772/53160
325

For this purpose, in this paper are presented the results of some experimental research onthe behaviour of wheat seeds in uniaxial compression tests between parallel plates. Thereare also presented the curves of variation for the crushing force and energy absorbed untilthe crushing point of seeds.
The results presented and the obtained data are of real interest for the designers of rollermills, as well as for the manufacturers and users of such machines.
2. Technological diagrams for wheat grinding
The technological passage consists of one or two pairs of milling rollers, both processing thesame product, combined with one or more plansifter compartments for sieving.
Gristing is the technological phase aiming to fragment the wheat seed in particles of differ‐ent sizes and to remove the endosperm from the coating. Particles resulted from first, sec‐ond and third grinding phase vary in size, from breakages like half seeds to flour particleswith very fine granulometry. As gristing is repeated, particles will get increasingly finer, theamount of white flour decreases, and seeds coating reaches the penultimate and last phaseas fine dust, [7]. Thus, grist is the intermediate product obtained in the milling industry, bygrinding grains by mean of roller mills with fluted surface.
Fig. 2 presents the technological diagram of gristing phase of the wheat in an industrial millwith the capacity of 220 t/24 h.
Milling unit consists of 9 double roller mills, of which the first processes, in both sections,the same material (whole seeds), two plansifters, together amounting 14 compartments,three double semolina machines and five brushes and bran finishers. The three phases of theprocess (gristing, milling, sorting) can be observed in fig.3 – fig.5.
Gristing phase consists of six simple mills with fluted rollers, four full and two half’s ofplansifter compartments and four bran finishers which process the coatings resulted frommultiple grinding operations. The seeds are processed in a mill with double rollers placed inhorizontal plane, noted by B1–B2.
The first grist is processed in passage B3, and the fractions obtained here will follow differ‐ent routes, to the milling passages, or to the semolina machines or bran finishers, passagesB4gr and B5f being responsible for the processing of material particles with high coatingcontent, and passage B4f processes the second refuse from gristing passage B3, with frac‐tions having the same characteristics processed in plansifter compartments. The develop‐ment of gristing phase in directly connected to the type of meal and the degree of flourextraction. Products resulted from gristing are named intermediate products and they con‐sist of: big grist, fine grist, big semolina, middle semolina, fine semolina, big dunst, softdunst, flour and bran, [7].
Food Industry326

Small<$%&
Figure 2. Technological diagram of gristing phase for a Bühler mill with capacity of 220 t / 24 h, [8]
Small semolina
for grinding Flour
Flour Small semolina
Soft dunst
for onsumption
Big semolina
Figure 3. Technological diagram for sorting of big semolina in Bühler mill, [7]
Grinding Characteristics of Wheat in Industrial Millshttp://dx.doi.org/10.5772/53160
327

Particles size of these components, resulted from sieving process, is determined by the sizeof the sieve holes used in sieving compartments. Depending on the particles size, semolinaand dunsts can be classified as: big semolina with average size of 1200-630 μm; middle sem‐olina 630–400 μm; fine semolina 400–310 μm; big dunsts 310–245 μm; soft dunsts 245–160μm. Semolina sorting is dome in sorting phase (fig.2. ) A clear delineation between softdunsts and flour can not be practically achieved, and therefore, are cases when soft dunsts(dm = 220 μm) are considered to be flour (flours granulosity is given by the sieves, withmean equivalent size of the particles below 160 μm).
Particles of intermediate products can be highlited not only by their size, but also by shape,volume, specific mass, aerodynamic properties. Particles with rich coating have irregularshape in the form of foils with rolled or folded edges. Particles of clean endosperm have pol‐yhedral shape with sharp edges and convex lateral surfaces.
Semolina is an intermediate product obtained in percentage of 25…30% in industrial wheatmilling, is found as small granules and after cleaning is further milled to obtain flour or afood product known as ”kitchen semolina”. This is obtained in percentage of 2...3 % atwheat milling and it is cleaned in special semolina machines in order to remove coating par‐ticles by the combined action of sieving and airflows. Dunst is a fine semolina obtained asintermediate product from the grinding of wheat or semolina.
After gristing phase it is important to sort the milling products using a wide range of sizesfor sieve holes (1000...224 μm), followed by the cleaning of semolina and dunsts, the phaseof semolina opening being no longer necessary, since most coating was already removed inthe gristing phase (fig.3).
The unit is fully automated, all mill equipments starting and stopping from the computer,starting with the equipments from the final technological phases (bagging, flour homogeni‐zation, sieving with plansifters, semolina cleaning, bran finishers, etc.) from the circuit offlour or intermediate products, while stopping begins with the first pair of rollers, i.e. re‐verse of start up.
In fig.4 and fig.5 is presented the technological flow for a wheat mill with capacity of 100t/24 h, in grinding phases (fig.4) and in the milling (breakage) phase of semolina (fig.5), [10].
The technological flow of wheat mill is ensured by 12 processing passages, with 12 pairs ofmilling rollers (6 double rollers of Buhler type) from which 5 gristing passages and 7 millingpassages. In addition, the technological flow is fitted with a sorting passage (separate com‐partment of plansifter).
Apart from the 12 technological passages, each consisting in a pair of roller mills and oneplansifter compartment, the mill also has a double machine for semolina, three bran finish‐ers and other auxiliary equipments (detachers, wheat brushes, filters and cleaning cyclones,etc.), as well as the proper elements for the pneumatic transport system from one equipmentto another, according to the technological flow.
Food Industry328

C1 C2 C5
C3 C4 C6
Figure 4. Technological flow of semolina grinding phase in wheat mill, capacity of 100 t/24 h, [11]
In breakage phase the technological diagram of mill contains five pairs of rolls, filled withone compartment of plane sieve, two semolina machines and three wheat bran finishers.The technological breakage phase is completed with one compartment of plane sieve with‐out grinding machine, in which the material is sorted by fractions of different sizes as wellas the other compartments of plane sieve.
The first grist, obtained from seeds processing with the pair of fluted rollers Sr.1, is process‐ed in passage Sr.2, and from here the fractions follow various routes, to grinding passages,to semolina machines to wheat bran finishers. The sifting material from the second and thelast set of gristing passage Sr.1, is send to a plansifter compartment for division in fractions(Div.1), which next reach the MG1 and MG2 semolina machines. The refuse from the last setof frames in the first passage is then sent to the M2 grinding passage.
The circulation of grist intermediate products in the technological diagram is shown in fig.4and fig.5.
In the grinding phase (fig.5), the technological diagram of milling unit consists of seven sim‐ple roller mills, each fitted with one plansifter compartment for sorting in fractions of thegrinded products and the extraction of flour from these products.
Grinding Characteristics of Wheat in Industrial Millshttp://dx.doi.org/10.5772/53160
329
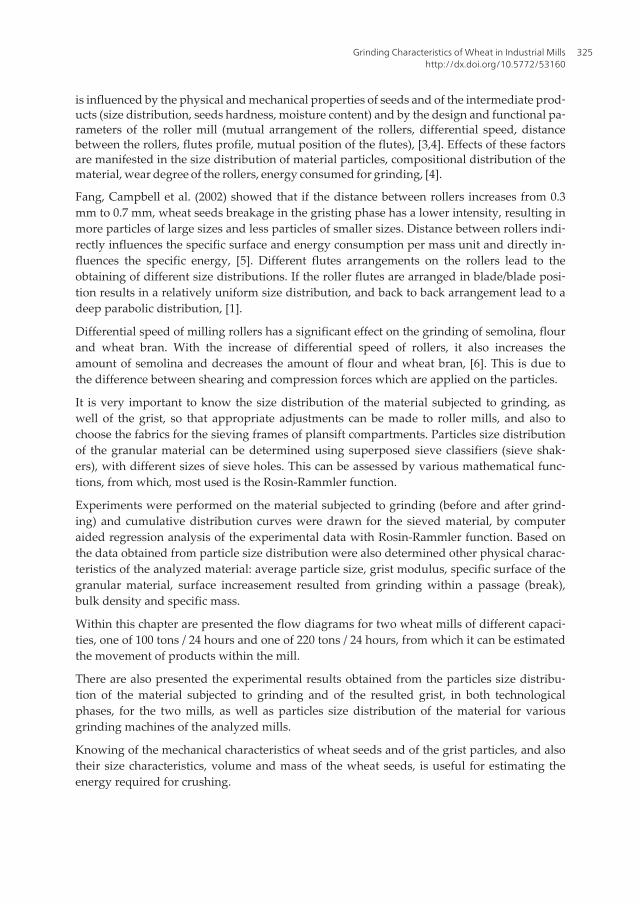
Figure 5. Technological flow of the semolina grinding phase in a wheat mill with 100 t/24 h, [9]
All roller mills of both technological phases have the length of 1000 mm and diameter of 250mm, with fluted surface, in the gristing phase, respectively smooth surface without flutes inthe grinding phase. In the gristing phase, the ratio of the tangential speeds of fluted rollers isk=2.54, and in the grinding phase, for five pairs of rollers, k=2.54, and for two pairs of rollersk=1.5.
As shown in fig.5, the products to be grinded into the grinding phase are products arrivingfrom gristing phase (or breakage phase), inclusive from grists (Sr.1-6) or from semolina ma‐chines and bran finishers. The siftings from MG1 and MG2 semolina machines, which aresemolinas with sizes below 0.8-1.0 mm, are grinded in the first technological passages M1Aand M1B, while the siftings from FT1 and FT3 bran finishers go to the last two grinders M4and M5, which processed products with higher content of bran. In diagram, the first refusalfrom M1A and M1B grinders is led to M3 grinder, working with half compartment of planesieve. It is noted that to grinders which grinded smaller particles of endosperm (about 0.40mm), after the mill rollers in technological flow are placed detached of material, due to ag‐glomerations arising from the compression of smaller particles of endosperm in the actionzone of grinding rolls.
In fig.6 is shown the arrangement of rollers to a mill with 100 t /24 h capacity, where thesamples for our determinations were collected.
Food Industry330

Figure 6. Arrangement of roller mills for the mill with capacity of 100 t /24 h
Plansifters are driven by electric motors of 4 kW, cos φ = 0,81 and speed of 960 rot/min.
Double machine for semolina is driven by two moto-vibrators of 400 W and speed of 960 rpm.
Characteristics of driving motors for mill rollers are given in table 1.
PassageI (A)
P, kWn,
rpmcos φ Passage
I (A)P, kW
n,
rpmcos φ
No-load Load No-load Load
Sr. 1 19 45 30 960 0.83 M1 B 10 15 11 960 0.79
Sr. 2 21 37 22 960 0.83 M2 11,9 16 11 960 0.79
Sr. 3 23 32 18 975 0.82 M3 10,9 18 7,5 960 0.76
Sr. 4 13 30 15 970 0.81 M4 10,9 15 11 960 0.79
Sr. 5 13 17 11 960 0.79 M5 12 16 11 960 0.79
M1 A 10 15 11 960 0.79 M6 12 17 11 960 0.79
Table 1. Characteristics of electric motors for the drive of mill rollers, for wheat mill with capacity of 100 t/24 h [9]
Grinding Characteristics of Wheat in Industrial Millshttp://dx.doi.org/10.5772/53160
331
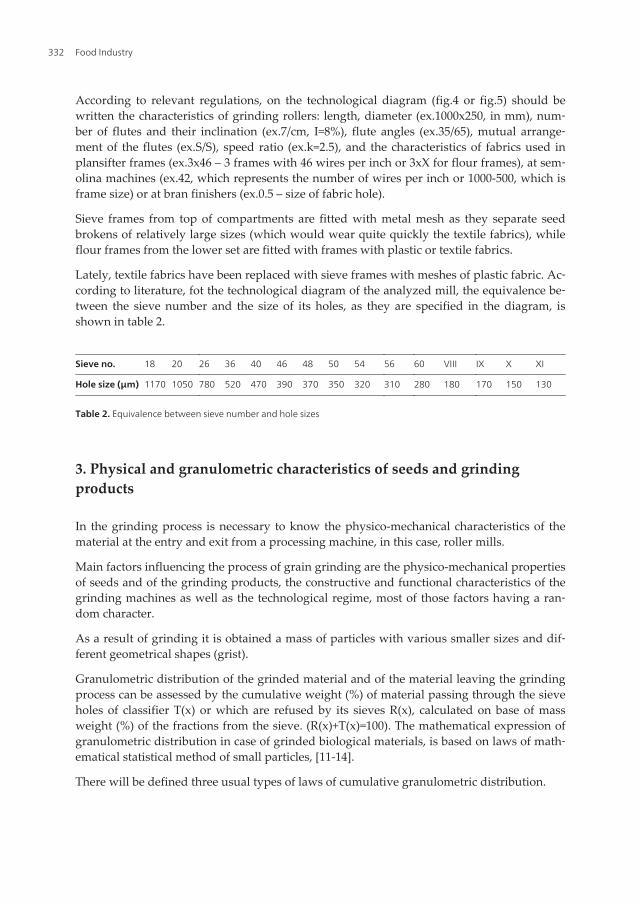
According to relevant regulations, on the technological diagram (fig.4 or fig.5) should bewritten the characteristics of grinding rollers: length, diameter (ex.1000x250, in mm), num‐ber of flutes and their inclination (ex.7/cm, I=8%), flute angles (ex.35/65), mutual arrange‐ment of the flutes (ex.S/S), speed ratio (ex.k=2.5), and the characteristics of fabrics used inplansifter frames (ex.3x46 – 3 frames with 46 wires per inch or 3xX for flour frames), at sem‐olina machines (ex.42, which represents the number of wires per inch or 1000-500, which isframe size) or at bran finishers (ex.0.5 – size of fabric hole).
Sieve frames from top of compartments are fitted with metal mesh as they separate seedbrokens of relatively large sizes (which would wear quite quickly the textile fabrics), whileflour frames from the lower set are fitted with frames with plastic or textile fabrics.
Lately, textile fabrics have been replaced with sieve frames with meshes of plastic fabric. Ac‐cording to literature, fot the technological diagram of the analyzed mill, the equivalence be‐tween the sieve number and the size of its holes, as they are specified in the diagram, isshown in table 2.
Sieve no. 18 20 26 36 40 46 48 50 54 56 60 VIII IX X XI
Hole size (µm) 1170 1050 780 520 470 390 370 350 320 310 280 180 170 150 130
Table 2. Equivalence between sieve number and hole sizes
3. Physical and granulometric characteristics of seeds and grindingproducts
In the grinding process is necessary to know the physico-mechanical characteristics of thematerial at the entry and exit from a processing machine, in this case, roller mills.
Main factors influencing the process of grain grinding are the physico-mechanical propertiesof seeds and of the grinding products, the constructive and functional characteristics of thegrinding machines as well as the technological regime, most of those factors having a ran‐dom character.
As a result of grinding it is obtained a mass of particles with various smaller sizes and dif‐ferent geometrical shapes (grist).
Granulometric distribution of the grinded material and of the material leaving the grindingprocess can be assessed by the cumulative weight (%) of material passing through the sieveholes of classifier T(x) or which are refused by its sieves R(x), calculated on base of massweight (%) of the fractions from the sieve. (R(x)+T(x)=100). The mathematical expression ofgranulometric distribution in case of grinded biological materials, is based on laws of math‐ematical statistical method of small particles, [11-14].
There will be defined three usual types of laws of cumulative granulometric distribution.
Food Industry332

• The Rosin-Rammler distribution, for material particles with larger sizes than sieve holes,is expressed by the relation:
( ) 100nb xR x e-= (1)
where: R(x) is the mass percentage weight of fraction with larger particles than x (which re‐mained on the sieve with meshes with size x); x – is the sieves meshes size by which theparticles rest; b and n are the own coefficients of grinding material.
• The Schuhman distribution is defined by the relation:
( ){ }( ) 100 1 aR x x k= - (2)
where: R(x) and x have the significance from to relationship (1), k - the module product par‐ticles size (the size of sieve mesh through which, theoretical, pass all the sample particles(100%)), a - the distribution module.
• The logistics type distribution with two parameters is defined by the relation:
( ) 1001
x
xeR x
e
a b
a b
+
+=
+(3)
where: R(x) and x have the significance from relationships (1-3) α and β are logistical con‐stants.
Of these characteristics are important: the bulk density, ρv (kg/m3), of the material to beprocessed, the density of the material, ρ (kg/m3); the equivalent sizes of material particle atentry and exit of the grinding machine, dm (mm); angle of internal friction of particles ap‐preciated by natural slope angle, ψ (o); angle of material friction with the surfaces workingcomponents, φ (o); material porosity, ε (%) and others.
Of particular importance is the equivalent size of seeds subjected to grinding in the firsttechnological passage.
The density is the ratio between the sample mass and the volume of the particle in it. To de‐termine the densities of wheat seeds, respectively the grinding products, the pycnometricalmethod was used (xylene 0.8254 kg/cm3).
The porosity is the property of granular materials, respectively of the grains, to not occupythe entire volume of storage, with an intergranular space. Knowing the values of bulk densi‐ty and material density, the porosity was evaluated using the following relation, [15]:
( ) ( )(%) 1 / 100 %ve r r= - (4)
Grinding Characteristics of Wheat in Industrial Millshttp://dx.doi.org/10.5772/53160
333

The static friction coefficient. The most common method for determining the coefficient of stat‐ic friction is inclined plane method which was used in this paper. It was used a device withadjustable incline plane, [15]. Two sets of determinations were realized on three types ofsurfaces: glossy fiberglass, steel sheet and cotton canvas.
Assessing parameters of the grinding process are: grinding degree, grinding finesse and spe‐cific energy consumption at grinding.
Grinding degree and grinding finesse are determined by granulometric analysis, using a sieveoverlay classifier with oscillatory movement.
Grinding degree is defined by the λ index and represents the ratio between equivalent sizes ofparticles before and after grinding, De, respectively dm, or the ratio between the outer surfaceof the particles resulted in the grinding process and the initial surface of the particle subject‐ed to grinding, Sf, respectively Si:
e m f iD d S Sl = = (5)
Absolute value of the increase of particles outer surface in the grinding process ΔS, is givenby:
f i iS = - = ( - 1)S S S lD (6)
The grinding finesse has been appreciated by the geometric mean diameter dm of the grindingparticles which was determined by the size distribution analysis, using the relation ofweighted average:
0(1 / 100) . ,nm i iid p d
== å (7)
where: pi is mass weight of fraction remaining on the sieve i of the classifier, di, is diameter(average value) of fractions particle on the sieve i, considered the arithmetic average of thesieves holes size that contain fraction i.
The surface areaand the surface increase. Knowing the mean diameter of particles of a granularmixture, their specific surface Se.m is determined with the relation, [10,15]:
2. . 6 / ( / ),e m mS d m kgr= (8)
where: ρ is the density of the particles.
There are presented the results of some experimental research on the physical characteristicsof grinding products on the technological flow of gristing phase of wheat from a mill withcapacity of 100 t / 24 h (SC Spicul Rosiori de Vede, Teleorman, Romania).
Food Industry334
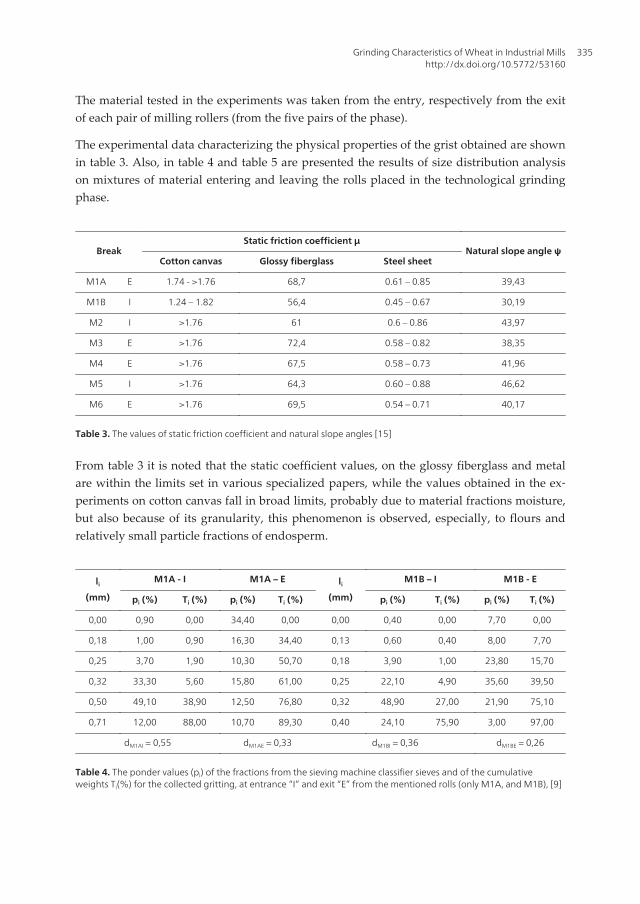
The material tested in the experiments was taken from the entry, respectively from the exitof each pair of milling rollers (from the five pairs of the phase).
The experimental data characterizing the physical properties of the grist obtained are shownin table 3. Also, in table 4 and table 5 are presented the results of size distribution analysison mixtures of material entering and leaving the rolls placed in the technological grindingphase.
BreakStatic friction coefficient µ
Natural slope angle ψCotton canvas Glossy fiberglass Steel sheet
M1A E 1.74 - >1.76 68,7 0.61 – 0.85 39,43
M1B I 1.24 – 1.82 56,4 0.45 – 0.67 30,19
M2 I >1.76 61 0.6 – 0.86 43,97
M3 E >1.76 72,4 0.58 – 0.82 38,35
M4 E >1.76 67,5 0.58 – 0.73 41,96
M5 I >1.76 64,3 0.60 – 0.88 46,62
M6 E >1.76 69,5 0.54 – 0.71 40,17
Table 3. The values of static friction coefficient and natural slope angles [15]
From table 3 it is noted that the static coefficient values, on the glossy fiberglass and metalare within the limits set in various specialized papers, while the values obtained in the ex‐periments on cotton canvas fall in broad limits, probably due to material fractions moisture,but also because of its granularity, this phenomenon is observed, especially, to flours andrelatively small particle fractions of endosperm.
li
(mm)
M1A - I M1A – E li
(mm)
M1B – I M1B - E
pi (%) Ti (%) pi (%) Ti (%) pi (%) Ti (%) pi (%) Ti (%)
0,00 0,90 0,00 34,40 0,00 0,00 0,40 0,00 7,70 0,00
0,18 1,00 0,90 16,30 34,40 0,13 0,60 0,40 8,00 7,70
0,25 3,70 1,90 10,30 50,70 0,18 3,90 1,00 23,80 15,70
0,32 33,30 5,60 15,80 61,00 0,25 22,10 4,90 35,60 39,50
0,50 49,10 38,90 12,50 76,80 0,32 48,90 27,00 21,90 75,10
0,71 12,00 88,00 10,70 89,30 0,40 24,10 75,90 3,00 97,00
dM1AI = 0,55 dM1AE = 0,33 dM1BI = 0,36 dM1BE = 0,26
Table 4. The ponder values (pi) of the fractions from the sieving machine classifier sieves and of the cumulativeweights Ti(%) for the collected gritting, at entrance “I” and exit “E” from the mentioned rolls (only M1A, and M1B), [9]
Grinding Characteristics of Wheat in Industrial Millshttp://dx.doi.org/10.5772/53160
335

Break
Equivalent
size(I/E)
Grinding
degreeBulk density True density Specific surface
Surface
increasePorosity
mm λ g/dm3 g/dm3 x103 m2/kg x103 m2/kg %
M1A 0,55-0,33 1,68 560,0-389,5 1344,9-1247,1 8,13-14,72 6,595 58,3-68,7
M1B 0,36-0,26 1,385 583,5-499,0 1338,7-1372,0 12,34-16,72 4,38 56,4-63,6
M2 0,19-0,17 1,113 480,5-437,5 1233,3-1313,4 26,04-27,55 1,513 61-66,7
M3 0,35-0,45 0,788 363,5-308,5 1252,9-1119,8 13,55-11,95 -1,605* 71-72,4
M4 0,22-0,24 0,940 452,5-419,5 1290,6-1290,6 21,02-19,76 -1,252* 64,9-67,5
M5 0,22-0,24 0,924 430,5-419,5 1205,4-1210,2 22,74-20,89 -1,854* 64,3-65,3
M6 0,24-0,27 0,903 416,0-373,0 1274,4-1224,5 19,40-18,23 -1,164* 67,4-69,5
The sign * in table 3, for negative values of specific surface increases, means that at the passage through milling rollerswith smooth surface, agglomeration of gritting particles occurs.
Table 5. The values of grinding degree, specific surface, surface increase and porosity
Based on the data obtained from the experiments and presented in table 6, were mapped
graphics, using MS Excel version 7.0 program (fig.6), the variations of mean diameter and
bulk density to technological breakage passage of milling unit.
Physical characteristic Sr.1-I Sr.1-E Sr.2-I Sr.2-E Sr.3-I Sr.3-E Sr.4-I Sr.4-E Sr.5-I Sr.5-E
Bulk density, ρv (kg/m3) 713.0 381.5 482.0 346.5 267.8 292.0 255.0 257.0 269.0 266.0
Density, ρ (kg/m3) 1239 1250 1219 1200 1100 1063 1016 1130 1100 1191
Equivalent size, (mm) 3.76 2.13 2.23 1.22 1.51 0.90 1.06 0.84 0.65 0.63
Grinding degree, λ 1.76 1.83 1.67 1.26 1.03
Specific surface, (m2/kg) 1.29 2.25 2.21 4.10 3.61 6.27 5.57 6.32 8.39 8.00*
Surface increase, ΔS (m2/kg) 0.96 1.89 2.66 0.75 –0.39*
Natural slope angle, ψ (gr.) 21.8 37.8 37.1 37.5 44.6 39.0 41.1 39.2 42.6 44.4
Porosity, ε (%) 42.5 69.5 60.5 71.1 75.7 72.5 74.9 77.3 75.5 77.7
Table 6. Physico-mechanical characteristics of grinding products at gristing passages of wheat, from the mill withcapacity of 100 t / 24 h, [10]
Correlation between individual volume of the seeds, calculated with the relation:
V =(1 / 6) π l w t(where: l, w, t represent the measured length, width, and thickness of each
seed, and the seeds are assimilated with ellipsoid geometrical bodies) and their weight is
presented in fig.7.
Food Industry336

0
100
200
300
400
500
600
700
800
Sr. 1 Sr. 2 Sr. 3 Sr. 4 Sr.5 M 1A M1B M2 M3 M4 M5 M6
Break
Bul
k de
nsity
[kg/
c.m
.]
Entry
Exit
0
0.5
1
1.5
2
2.5
3
3.5
4
Sr. 1 Sr. 2 Sr. 3 Sr. 4 Sr.5 M 1A M1B M2 M3 M4 M5 M6
Break
Equ
ival
ent s
ize
[mm
]
Entry
Exit
Figure 7. Variation of mean diameter and bulk density of grinding intermediate products on the grinding technologi‐cal flow with grinding rollers [15]
Sieves used in granulometric analysis with sieve classifier and the results obtained by analy‐
sis are given in table 7, for each of the five technological passages, at the entry end exit from
the respective mill rollers.
li (mm) Sr.1 - E li (mm) Sr.2 - I Sr.2 - E li (mm) Sr.3 - I Sr.3 - E
pi (%) Ri (%) pi (%) Ri (%) pi (%) Ri (%) pi (%) Ri (%) pi (%) Ri (%)
0.00 24.20 0.00 0.00 2.00 0.00 34.70 0.00 0.00 13.40 0.00 43.10 0.00
1.00 8.40 24.20 0.71 6.00 2.00 11.50 34.70 0.71 22.50 13.40 20.60 43.10
1.40 15.10 32.60 1.00 19.20 8.00 22.20 46.20 1.00 22.80 35.90 23.00 63.70
2.00 20.10 47.70 1.40 13.90 27.20 11.50 68.40 1.40 12.00 58.70 5.10 86.70
2.80 27.00 67.80 2.00 29.50 41.10 14.90 79.90 2.00 20.10 70.70 7.20 91.80
4.00 5.20 94.80 2.80 29.40 70.60 5.20 94.80 2.80 9.20 90.80 1.00 99.00
d1E = 2.13 mm d2I = 2.23 mm d2E = 1.22 mm d3I = 1.51 mm d2E = 0.90 mm
li (mm) Sr.4 - I Sr.4 - E li (mm) Sr.5 - I Sr.5 - E
pi (%) Ri (%) pi (%) Ri (%) pi (%) Ri (%) pi (%) Ri (%)
0.00 26.00 0.00 42.60 0.00 0.00 5.20 0.00 5.80 0.00
0.71 25.20 26.00 27.50 42.60 0.25 3.90 5.20 3.90 5.80
1.00 28.30 51.20 20.70 70.10 0.32 21.10 9.10 22.60 9.70
1.40 11.90 79.50 3.60 90.80 0.50 28.20 30.20 29.70 32.30
2.00 7.80 91.40 5.00 94.40 0.71 35.30 58.40 32.70 62.00
2.80 0.80 99.20 0.60 99.40 1.00 6.30 93.70 5.30 94.70
d4I = 1.06 mm d4E = 0.84 mm d5I = 0.65 mm d5E = 0.63 mm
Table 7. Values of weights (%) pi for the fractions on the shaker sieves of the sifter machine and of the cumulativepercentages Ri (%) for the collected grinded products, at entry “I” and exit “E” from pairs of mentioned rollers (Sr.1…Sr.5), [10]
Grinding Characteristics of Wheat in Industrial Millshttp://dx.doi.org/10.5772/53160
337
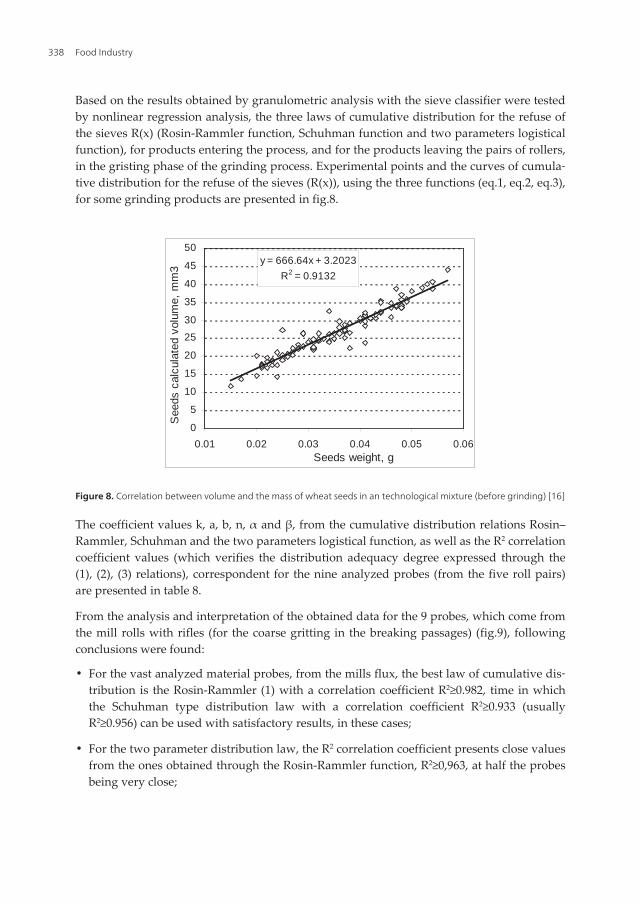
Based on the results obtained by granulometric analysis with the sieve classifier were testedby nonlinear regression analysis, the three laws of cumulative distribution for the refuse ofthe sieves R(x) (Rosin-Rammler function, Schuhman function and two parameters logisticalfunction), for products entering the process, and for the products leaving the pairs of rollers,in the gristing phase of the grinding process. Experimental points and the curves of cumula‐tive distribution for the refuse of the sieves (R(x)), using the three functions (eq.1, eq.2, eq.3),for some grinding products are presented in fig.8.
y = 666.64x + 3.2023
R2 = 0.9132
0
5
10
15
20
25
30
35
40
45
50
0.01 0.02 0.03 0.04 0.05 0.06Seeds weight, g
See
ds c
alcu
late
d vo
lum
e, m
m3
Figure 8. Correlation between volume and the mass of wheat seeds in an technological mixture (before grinding) [16]
The coefficient values k, a, b, n, α and β, from the cumulative distribution relations Rosin–Rammler, Schuhman and the two parameters logistical function, as well as the R2 correlationcoefficient values (which verifies the distribution adequacy degree expressed through the(1), (2), (3) relations), correspondent for the nine analyzed probes (from the five roll pairs)are presented in table 8.
From the analysis and interpretation of the obtained data for the 9 probes, which come fromthe mill rolls with rifles (for the coarse gritting in the breaking passages) (fig.9), followingconclusions were found:
• For the vast analyzed material probes, from the mills flux, the best law of cumulative dis‐tribution is the Rosin-Rammler (1) with a correlation coefficient R2≥0.982, time in whichthe Schuhman type distribution law with a correlation coefficient R2≥0.933 (usuallyR2≥0.956) can be used with satisfactory results, in these cases;
• For the two parameter distribution law, the R2 correlation coefficient presents close valuesfrom the ones obtained through the Rosin-Rammler function, R2≥0,963, at half the probesbeing very close;
Food Industry338
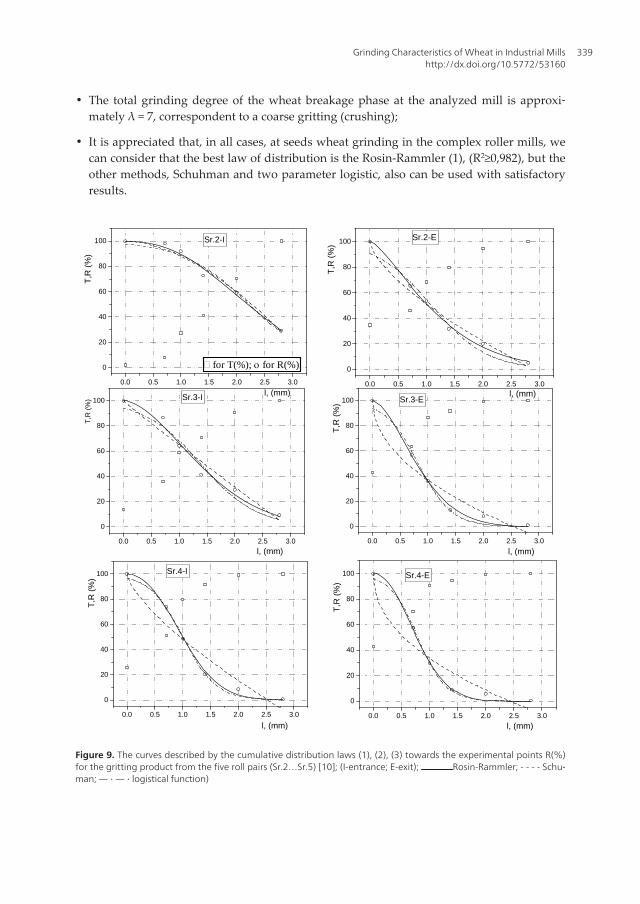
• The total grinding degree of the wheat breakage phase at the analyzed mill is approxi‐mately λ = 7, correspondent to a coarse gritting (crushing);
• It is appreciated that, in all cases, at seeds wheat grinding in the complex roller mills, wecan consider that the best law of distribution is the Rosin-Rammler (1), (R2≥0,982), but theother methods, Schuhman and two parameter logistic, also can be used with satisfactoryresults.
1
Proof Corrections Form – Gheorghe VOICU
Author(s) Name(s): Voicu Gheorghe, Biris Sorin-Stefan, Stefan Elena-Madalina, Constantin Gabriel-Alexandru, Ungureanu Nicoleta
Chapter Title: GRINDING CHARACTERISTICS OF WHEAT IN INDUSTRIAL MILLS
PROOF CORRECTIONS FORM
Page No.
Line No. Delete Replace with
17 Fig.9 Symbols of experimental points were modified from submitted paper.
Will replace with that of the initial work.
Group in the initial paper, Copy and Paste special (Picture) in the final paper
23 Fig.12 Figure 12 should be replaced with that of the paper submitted. In addition there are two overlapping figures.
be replaced
Fig.9
0.0 0.5 1.0 1.5 2.0 2.5 3.0
0
20
40
60
80
100
T,R
(%
)
l, (mm)
Sr.2-E
0.0 0.5 1.0 1.5 2.0 2.5 3.0
0
20
40
60
80
100
T,R
(%
)
l, (mm)
Sr.3-I
0.0 0.5 1.0 1.5 2.0 2.5 3.0
0
20
40
60
80
100
T,R
(%
)
l, (mm)
Sr.3-E
0.0 0.5 1.0 1.5 2.0 2.5 3.0
0
20
40
60
80
100
T,R
(%
)
l, (mm)
Sr.4-I
0.0 0.5 1.0 1.5 2.0 2.5 3.0
0
20
40
60
80
100
T,R
(%
)
l, (mm)
Sr.4-E
0.0 0.5 1.0 1.5 2.0 2.5 3.0
0
20
40
60
80
100 Sr.2-I
T,R
(%
)
l, (mm)
for T(%); for R(%)
Figure 9. The curves described by the cumulative distribution laws (1), (2), (3) towards the experimental points R(%)for the gritting product from the five roll pairs (Sr.2…Sr.5) [10]; (I-entrance; E-exit);
Rosin-Rammler; - - - - Schu‐
man; ― ‧ ― ‧ logistical function)
Grinding Characteristics of Wheat in Industrial Millshttp://dx.doi.org/10.5772/53160
339

Law type Coeff. Sr.1-E Sr.2-I Sr.2-E Sr.3-I Sr.3-E Sr.4-I Sr.4-E Sr.5-I Sr.5-E
Rosin-Rammler (eq.1) b 0.224 0.114 0.665 0.411 1.025 0.701 1.169 2.472 2.652
n 1.659 2.302 1.382 1.747 1.682 2.220 2.093 2.852 2.817
R2 0,988 0,987 0,996 0,982 0,996 0,996 0,996 0,998 0,999
Schuhman (eq.2) k 4.201 3.398 2.893 2.966 2.531 2.532 2.431 1.025 1.016
a 0.996 1723 0.674 0.960 0.495 0.711 0.464 1.710 1.639
R2 0,999 0,981 0,985 0,956 0,958 0,933 0.940 0,991 0.987
Logistic with two
parameters (eq.3)
α 2.573 3.701 2.243 2.744 2.760 3.397 3.216 4.347 4.303
β -1.245 -1.666 -2.053 -1.981 -3.345 -3.380 -4.056 -6.739 -6.878
R2 0.984 0,974 0.972 0.963 0.988 0.995 0.994 0.997 0997
Table 8. The coefficient values a, k, b, n, α and β and of the R2 correlation coefficients, for the three size distributionlaws tested, for the gritted products from the „I” entry to the „E” exit between the mentioned roll pairs (Sr.1...Sr.5),[10]
In plansifter compartments, material fractions are separated and sorted, as any granular ma‐terial is made of particles with sizes between a minimum and a maximum value, in the inte‐rior of the mixture the size distribution being characterised by various distribution laws.
It must be mentioned that material particles, being extracted from various areas of the seed(from exterior to interior) have different mechanical characteristics and composition. This, andthe different sizes of particles gives a different behaviour of the particles during grinding.
Thus is important to study and to know the size distribution of the particles of each fractionobtained in each frame set of the six plansifter compartments.
Size of sieve holes used for the experiments and the amount of material fractions on eachsieve (individual and cumulative) for the separated material are presented in table 9.
In every fraction there is a percentage of material with sizes smaller than the size of the sievehole, which means that sieving is incomplete, even if the number of frames is quite high.However, the average particle size of fraction C1–Break 2 is 2.27 mm, much larger than theopening of sieve holes of the package (1.05 mm). This shows that here are obtained the partsof seed with quite large sizes, which must be reintroduced in the grinding process at thepassage Break 2.
At the second set of sieving frames of plansifter compartment C1, the opening of fabric holesis 470 μm (no. 40), but mean size of particles of fraction C1-DIV1’ is 0.58 mm, slightly largerthan the opening of the holes. It is noticed (Table 9) that there are particles with sizes smallerthan the size of holes which remain unseparated (at least 8.4%). This phenomenon is validfor all sets of sieves in the plansifter with six compartments, as can be seen from the analysisof the results presented in table 9.
Composition of fraction C1-DIV1” of plansifter compartment C1 consists of the refuse ofsieve frames no. 56 (with holes opening 0.31 mm), after the sieved of the second set, consist‐
Food Industry340

ing of particles that passes through sieve no. 40 (with holes opening 0.47 mm) was extractedflour F (mean size of particles 0.08 mm). This fraction with fraction C1-DIV1’ and with thetwo fractions C2-DIV1 of the second plansifter compartment are directed to the sorting-di‐viding compartment DIV1 (compartment C5). Mean particle sizes of fraction DIV1”, fromcompartment C1, are 0.31 mm (equal to the opening of sieve holes which refused them,proving that here also the sieving is incomplete).
li
(mm)
C1 Entrance li
(mm)
C1 Break 2 li
(mm)
C1 DIV1’ li
(mm)
C1 F li
(mm)
C1 DIV1” li
(mm
)
C1 M2
pi
(%)
Ti
(%)
pi
(%)
Ti
(%)
pi
(%)
Ti
(%)
pi
(%)
Ti
(%)
pi
(%)
Ti
(%)
pi
(%)
Ti
(%)
0.000 24.20 0.00 0.000 10.20 0.00 0.000 1.10 0.00 0.000 4.20 0.00 0.000 6.00 0.00 0.0000.60 0.00
1.000 8.20 24.20 1.000 21.30 10.20 0.180 2.30 1.10 0.045 45.10 4.20 0.125 8.00 6.00 0.0901.90 0.60
1.400 15.10 32.40 1.400 14.60 31.50 0.250 5.00 3.40 0.063 24.30 49.30 0.180 12.80 14.000.12541.50 2.50
2.000 20.20 47.50 2.000 21.60 46.10 0.400 51.70 8.40 0.090 18.80 73.60 0.250 24.50 26.800.18015.00 44.00
2.800 27.10 67.70 2.500 20.70 67.70 0.630 28.60 60.10 0.125 6.30 92.40 0.315 32.40 51.300.20030.10 59.00
4.000 5.20 94.80 4.000 11.60 88.40 0.710 11.30 88.70 0.160 1.30 98.70 0.400 16.30 83.700.25010.90 89.10
d1E = 2.13 mm d1Break2 = 2.27 mm d1DIV1’ = 0.58 mm d1F = 0.08 mm d1DIV1” = 0.31 mm d1M2 = 0.19 mm
li
(mm)
C2 Entrance li
(mm)
C2 Break 3 li
(mm)
C2 DIV1’ li
(mm)
C2 F li
(mm)
C2 M2 li
(mm)
C2 DIV1”
pi
(%)
Ti
(%)
pi
(%)
Ti
(%)
pi
(%)
Ti
(%)
pi
(%)
Ti
(%)
pi
(%)
Ti
(%)
pi
(%)
Ti
(%)
0.000 34.40 0.00 0.000 23.50 0.00 0.000 5.60 0.00 0.000 19.10 0.00 0,000 17.70 0.00 0.0000.30 0.00
0.710 11.50 34.40 1.000 30.10 23.50 0.180 4.00 5.60 0.045 34.90 19.10 0,090 9.40 17.70 0.1251.60 0.30
1.000 22.20 45.90 1.400 13.50 53.60 0.250 7.70 9.60 0.063 21.60 54.00 0,125 22.30 27.10 0.1805.60 1.90
1.400 11.60 68.10 2.000 17.60 67.10 0.400 26.10 17.30 0.090 16.10 75.60 0,180 9.60 49.40 0.25019.20 7.50
2.000 15.00 79.70 2.500 12.40 84.70 0.500 49.20 43.70 0.125 6.70 91.70 0,200 25.10 59.00 0.31544.50 26.70
2.800 5.30 94.70 3.150 2.90 97.10 0.710 7.40 92.60 0.160 1.60 98.40 0,250 15.90 84.10 0.40028.80 71.20
d2E = 1.22 mm d2Break3 = 1.56 mm d2DIV1’ = 0.52 mm d2F = 0.07 mm d2M2 = 0.17 mm d2DIV1” = 0.37 mm
Table 9. Values of weights pi(%) of sieved fractions and of the cumulative weights Ti (%) for products collected at theentrance, respectively exit of plansifter compartments, C1 and C2
The last components of plansifter compartments in gristing passage shave higher content ofcoating particles which are found in the upper layers of material on the frames, thus beingrecommended that they do not separate through the holes, even if their sizes are about thesize of endosperm particles, to be further removed in semolina machines (sieving motionleads to the layering of mixture components by density). Flour particles have mean sizes un‐der 0.18 mm in all plansifter compartments, while particles of last refuse from the five pas‐sages fitted with pairs of rollers have mean sizes over 0.37 mm (see Table 9). Values of
Grinding Characteristics of Wheat in Industrial Millshttp://dx.doi.org/10.5772/53160
341
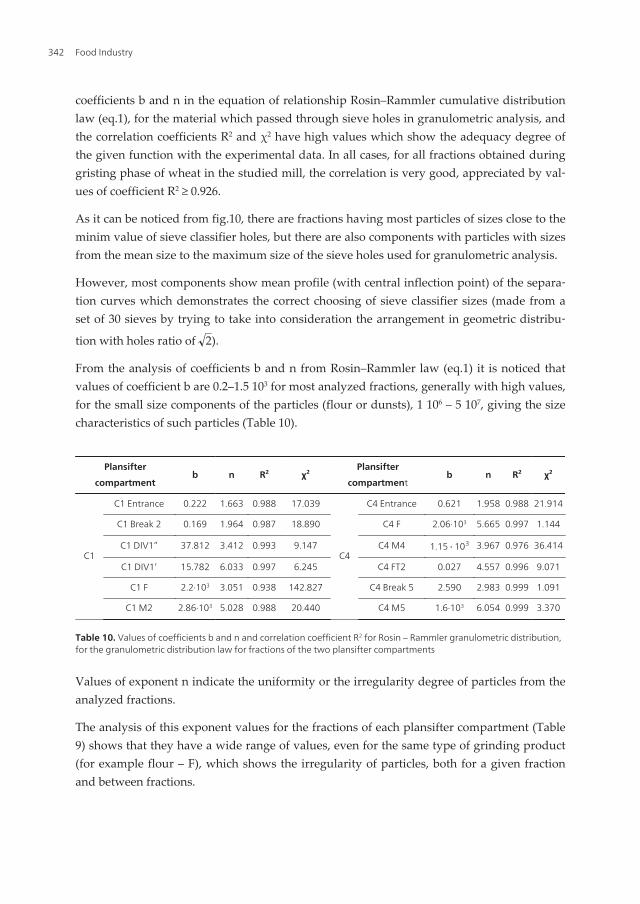
coefficients b and n in the equation of relationship Rosin–Rammler cumulative distributionlaw (eq.1), for the material which passed through sieve holes in granulometric analysis, andthe correlation coefficients R2 and χ2 have high values which show the adequacy degree ofthe given function with the experimental data. In all cases, for all fractions obtained duringgristing phase of wheat in the studied mill, the correlation is very good, appreciated by val‐ues of coefficient R2 ≥ 0.926.
As it can be noticed from fig.10, there are fractions having most particles of sizes close to theminim value of sieve classifier holes, but there are also components with particles with sizesfrom the mean size to the maximum size of the sieve holes used for granulometric analysis.
However, most components show mean profile (with central inflection point) of the separa‐tion curves which demonstrates the correct choosing of sieve classifier sizes (made from aset of 30 sieves by trying to take into consideration the arrangement in geometric distribu‐
tion with holes ratio of 2).
From the analysis of coefficients b and n from Rosin–Rammler law (eq.1) it is noticed thatvalues of coefficient b are 0.2–1.5 103 for most analyzed fractions, generally with high values,for the small size components of the particles (flour or dunsts), 1 106 – 5 107, giving the sizecharacteristics of such particles (Table 10).
Plansifter
compartmentb n R² χ²
Plansifter
compartmentb n R² χ²
C1
C1 Entrance 0.222 1.663 0.988 17.039
C4
C4 Entrance 0.621 1.958 0.988 21.914
C1 Break 2 0.169 1.964 0.987 18.890 C4 F 2.06·103 5.665 0.997 1.144
C1 DIV1” 37.812 3.412 0.993 9.147 C4 M4 1.15⋅103 3.967 0.976 36.414
C1 DIV1’ 15.782 6.033 0.997 6.245 C4 FT2 0.027 4.557 0.996 9.071
C1 F 2.2·103 3.051 0.938 142.827 C4 Break 5 2.590 2.983 0.999 1.091
C1 M2 2.86·103 5.028 0.988 20.440 C4 M5 1.6·103 6.054 0.999 3.370
Table 10. Values of coefficients b and n and correlation coefficient R2 for Rosin – Rammler granulometric distribution,for the granulometric distribution law for fractions of the two plansifter compartments
Values of exponent n indicate the uniformity or the irregularity degree of particles from theanalyzed fractions.
The analysis of this exponent values for the fractions of each plansifter compartment (Table9) shows that they have a wide range of values, even for the same type of grinding product(for example flour – F), which shows the irregularity of particles, both for a given fractionand between fractions.
Food Industry342

-0,5 0,0 0,5 1,0 1,5 2,0 2,5 3,0 3,5
0
20
40
60
80
100
Sift
ed m
ater
ial (
cum
ulat
ive)
, %
Oriffice aperture li, mm
C2 Break 3
T(x)=100(1-e-b*xn )
b=0.327n=1.925R2=0.986
0,0 0,5 1,0 1,5 2,0 2,5 3,0
0
20
40
60
80
100
Sift
ed m
ater
ial (
cum
ulat
ive)
, %
Oriffice aperture li, mm
C3 FT1
T(x)=100(1-e-b*xn )
b=0.206n=2.654R2=0.976
-0,5 0,0 0,5 1,0 1,5 2,0 2,5 3,0 3,5
0
20
40
60
80
100
Sift
ed m
ater
ial (
cum
ulat
ive)
, %
Oriffice aperture li, mm
C4 FT2
T(x)=100(1-e-b*xn )
b=0.026n=4,556R2=0.995
-0,05 0,00 0,05 0,10 0,15 0,20 0,25 0,30 0,35
0
20
40
60
80
100
Sift
ed m
ater
ial (
cum
ulat
ive)
, %
Oriffice aperture li, mm
C6 M5
T(x)=100(1-e-b*xn )
b=188,250n=3,148R2=0.999
Figure 10. Curves of granulometric distribution given by eq. (1) in correlation with experimental data for grindingfractions in plansifter compartments during gristing phase of wheat in a mill with capacity of 100 t /24 h
4. Some mechanical characteristics of wheat seeds in uniaxialcompression tests
Main stress to which seeds are subjected, while passing through mill rollers, is given by thetype of rollers surface, namely smooth or fluted. Regardless the surface type, one of themain stress during grinding is compression (or crushing), especially if the mill rollers havesmooth surface. To estimate the behaviour of seeds while passing through the rollers, exper‐imental research is required on the compression stress of seeds from various wheat varieties,knowing that not all varieties have similar mechanical characteristics. Even seeds from thesame variety have different behaviour, due to the irregular development stage in the ear,and also from one ear to another.
The compression of wheat seeds is performed in three different stages: the first stage is elas‐tically deformation, characterized by the proportionality between the compression force andthe deformation; the second stage is plastic deformation, characterized by large increases ofseed deformation at small increases of compression force; the last stage consists in crackingor rupture, being characterized by seed crushing when reaching a certain value of compres‐sion force, [17-20].
Grinding Characteristics of Wheat in Industrial Millshttp://dx.doi.org/10.5772/53160
343
Compression test is an objective method for determining the mechanical properties of cerealseeds and also one of the best techniques for determining the modulus of elasticity by thestudy of their behaviour at compression stress, using force-deformation curve, [21,22].
By performing uniaxial compression tests on wheat seeds, force-deformation curve is ob‐tained, giving the possibility to determine hardness, apparent modulus of elasticity, crush‐ing resistance, force and deformation and energy consumption in various specific points ofthe curve (i.e. rupture point) and maximum stress in the material, [21,23].
Cereal seeds have a different behaviour under the action of compression forces, dependingon their moisture content, [17,20], variety, development stage, geometric sizes, individualmass, glassiness, (soft cereals and hard cereals) etc.
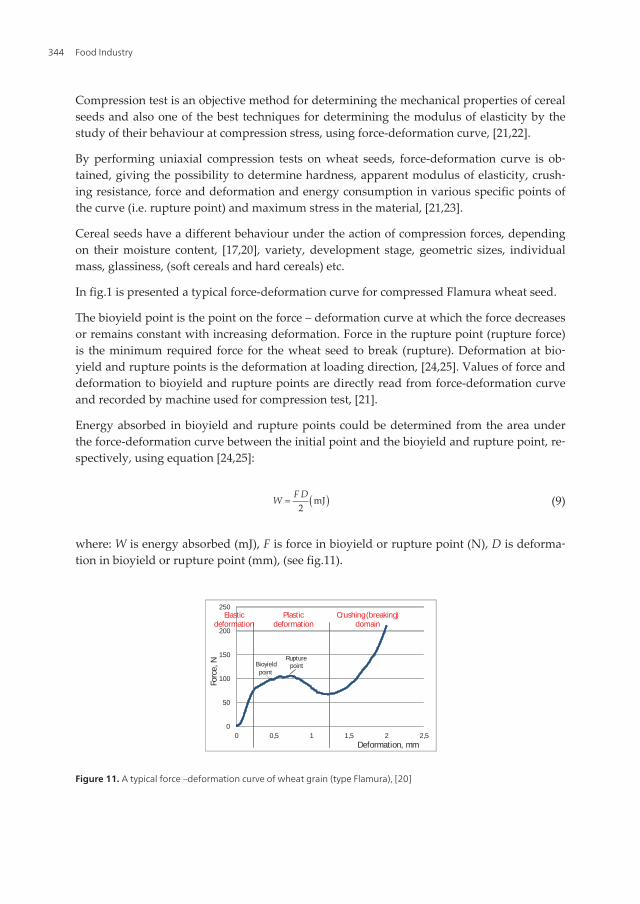
In fig.1 is presented a typical force-deformation curve for compressed Flamura wheat seed.
The bioyield point is the point on the force – deformation curve at which the force decreasesor remains constant with increasing deformation. Force in the rupture point (rupture force)is the minimum required force for the wheat seed to break (rupture). Deformation at bio‐yield and rupture points is the deformation at loading direction, [24,25]. Values of force anddeformation to bioyield and rupture points are directly read from force-deformation curveand recorded by machine used for compression test, [21].
Energy absorbed in bioyield and rupture points could be determined from the area underthe force-deformation curve between the initial point and the bioyield and rupture point, re‐spectively, using equation [24,25]:
( )mJ2
F DW = (9)
where: W is energy absorbed (mJ), F is force in bioyield or rupture point (N), D is deforma‐tion in bioyield or rupture point (mm), (see fig.11).
0
50
100
150
200
250
0 0,5 1 1,5 2 2,5
Forc
e, N
Deformation, mm
Bioyield point
Rupturepoint
Elastic deformation
Plastic deformation
Crushing (breaking) domain
Figure 11. A typical force –deformation curve of wheat grain (type Flamura), [20]
Food Industry344

Based on a standard method (ASAE 2008, [21]), for a seed placed between two parallelplates, the modulus of elasticity could be calculated with following equation, [20,21,21]:
( )3 2 2 1 2
3 21
0.338 1 1 1' '
uk FE
R RD
m- é ù= +ê ú
ë û(10)
where: E – modulus of elasticity for cereal seeds, (MPa); ku – coefficient which depends onthe geometrical properties of wheat seeds (ku = 1,303 - adapted from calculus tables of Koz‐ma and Cunningham, 1962); F – compression force, (N); D – seed deformation (m); μ - Pois‐son ratio, (μ = 0,3 for wheat seeds); R' and R'1 – small and large radius of the curvature ofconvex surface seed in contact with the flat surface, (m), (see fig.12, left).
2
Figure 12. Estimation of curvature radius and force-deformation curve of wheat seed, (adapted from [25,26]) PL –proportional limit; PI – point of inflection; Pc – point of calculation
According to the standard method (ASAE 2008, [21]), also presented by Mohsenin in [25,26],curvature radius of convex surface, R' and R'
1 (fig.12) can be calculated using relations (11)and (12):
'2HR @ (11)
2
14'
2H LR
H+
@ (12)
where: H is seed thickness, (m), and L is seed length, (m), in undistorted state.
Grinding Characteristics of Wheat in Industrial Millshttp://dx.doi.org/10.5772/53160
345

This method was used by many researchers to determine the modulus of elasticity for differ‐ent agricultural products, [27-30].
According to the standard method (ASAE 2008), values of force F and deformation D, fromequation (2) are calculated for the proportionality area of force-deformation curve in thepoint of calculation Pc (fig.12). The position of this point is estimated visually, as the point islocated halfway between curve origin and proportionality limit PL (fig.12, right). It wasfound that the point of calculation Pc is located lower than the point of inflection, also estab‐lished visually, [21].
To determine the variation of mechanical resistance characteristics of wheat seeds from thesame variety, compression tests were performed for sets of 100 seeds of three varieties of Ro‐manian wheat (Flamura, Glosa and Trivale – soft wheat), using Hounsfield mechanical test‐ing machine, at a constant speed of the crushing device of 5 mm min-1, using a force cell of1000 N. Were graphically plotted the force-deformation curves for each seed, and from eachdiagram were collected data about: force, deformation and energy absorbed in the bioyieldpoint (F1, ε1, W1), respectively in the final point (rupture), (F2, ε2, W2).
The analysis of measured data showed that the seeds of Flamura variety were larger thanTrivale variety, for all three main sizes, and for their volume. The same goes for seeds mass.Flamura variety seeds were more uniform as size and mass. Regarding the mechanical char‐acteristics of wheat seeds, it was found that compression forces, for bioyield point and forfinal seeds crushing, were smaller for Trivale variety than Flamura. The same goes for ener‐gy absorbed to the bioyield point, respectively to crushing. Since the sizes of Trivale seedswere smaller than Flamura seeds, the deformations carried to the bioyield point, respective‐ly to crushing, were smaller for Trivale than Flamura, but the standard deviation of the val‐ues was smaller for Flamura for deformations, showing that Flamura seeds were moreregular in terms of deformations (until crushing).
In fig.13 are presented two examples of force-deformation curves for two varieties of wheat,and in fig.14 are presented the histograms of bioyield force and energy absorbed for seedcrushing.
0 .0 0 .5 1 .0 1 .5 2 .0 2 .5 3 .0
D e fo rm a tio n , m m
0
2 0 0
4 0 0
6 0 0
8 0 0
1 0 0 0
1 2 0 0
Fo
rce
, N
w = 1 2 %l = 6 ,1 5 m mb = 3 ,4 1 m mc = 2 ,8 7 m m
Flamura
HR'
R'₁
H
L
HR'
R'₁
H
L
HR'
R'₁
H
L
0 .0 0 .2 0 .4 0 .6 0 .8 1 .0 1 .2 1 .4 1 .6 1 .8 2 .0 2 .2 2 .4
D e fo rm a ti on , m m
0
2 0 0
4 0 0
6 0 0
8 0 0
1 0 0 0
1 2 0 0
Fo
rce
, N
w = 1 2 %l = 6 ,7 8 m mb = 2 ,8 5 m mc = 2 ,7 m m
Triv ale
Figure 13. Examples of force-deformation curves for the two wheat varieties, [23]
Food Industry346

On the histograms were traced the variation curves for the analyzed parameters by regres‐sion analysis of the values given by the histogram, using the normal function presented inequation (13), [23]:
2121100
2
x cb
xp a ebp
æ - ö- ç ÷
è ø= (13)
where: px(%) is the percentage weight of each class interval (number of seeds with values inthe considered class interval); a – class interval for each analyzed parameter; b and c are re‐gression coefficients of the analyzed function (b is the standard deviation, c is the valuesmean).
Values of coefficients for the regression function (eq.13) used in statistical analysis and val‐ues of correlation coefficient R2 for data given by histograms are presented in Table 11.
Measured parameters of wheat
seeds
Flamura wheat variety Trivale wheat variety
a b c R2 a b c R2
Length l, (mm) 0.20 0.404 6.443 0.989 0.20 0.501 6.186 0.971
Width w, (mm) 0.10 0.202 3.429 0.974 0.20 0.284 2.994 0.981
Thickness t, (mm) 0.20 0.248 3.058 0.975 0.20 0.315 2.664 0.983
Mass m, (g) 0.01 0.008 0.051 0.988 0.01 0.009 0.037 0.981
Volume V, (mm3) 5.00 5.870 35.57 0.968 5.00 6.207 26.23 0.985
Bioyield force F1, (N) 20.0 41.36 122.64 0.921 20.0 39.48 104.70 0.888
Bioyield energy W1, (J) 0.01 0.024 0.036 0.923 0.01 0.017 0.026 0.884
Table 11. Values of coefficients for regression equation (eq.13) and its correlation with experimental data [20]
Analysis of histograms and variation curves, as well as of data in table 11, shows that allanalyzed parameters have almost normal distribution, assessed by values of correlation co‐efficient R2.
Using standard method (ASAE 2008, [21]) and equations (10), (11) and (12) were determinedthe values of modululs of elasticity for wheat seeds of Flamura, Trivale and Glosa varieties,in this paper being presented their mean values, (table 12).
Fig.15 shows the machine used for uniaxial compression tests between parallel plates ofweat seeds and their position.
From the sample of 100 determinations for each variety of wheat, were selected the 50 mostrepresentative determinations, being kept the values found for force and absolute deforma‐tion of the seed.
Grinding Characteristics of Wheat in Industrial Millshttp://dx.doi.org/10.5772/53160
347

Figure 14. Histograms and variation curves for the force in bioyeld point and the energy consumption in rupturepoint for wheat seeds [23]
Force-deformation curves, for each of the 50 determinations (of a variety) were processed sothat each has the same origin (same starting point), and the intervals of reading (recorded)to be the same. Values for the parameter on the ordinate (forces in the mentioned points)were averaged (arithmetic average for the 50 determinations was calculated) for the samevalue of deformation (parameter on the abscissa), and these values were used to retrace theforce-deformation curve, which respresents the curve of mean values of compression force(fig.16). Using the approximately normal distribution, were statistically estimated the limitswithin which the mean force-deformation curve is found, for a confidence interval of 95%.For normal distribution, the confidence interval corresponding to 95% confidence levelranges between +/- 1,96, considered standard deviations. Thus, the confidence interval ofmean curve was calculated using the following equation:
1.96mnsm = ± (14)
where: μ is the confidence interval, and m is the mean value of the analyzed parameter (in
this case, the compression force) and σ / n =Sm is the standard error of the mean, σ – stand‐
ard deviation, and n –number of seeds from each variety of wheat (in this paper, n = 50).
Food Industry348

On the curve of mean values (fig.16), were determined the values of mechanical characteris‐tics mentioned before (forces and deformations in the characteristic points) and it was calcu‐lated the value of modulus of elasticity using the standard method (ASAE 2008, [21]), formean curve (for the three varieties of wheat).
Compression table
Compression head
Wheat seed
Loading
Figure 15. Hounsfield - Mechanical testing machine used in compression test [20]
Knowing the forces and deformations in the points of bioyield and rupture, from the areaunder the force-deformation curve between the initial point and the bioyield and rupturepoint, respectively, using equation (1), energy absorbed in bioyield and rupture point wasdetermined.
Measured parameters of wheat seedsMean of parameters values
Values of parameters read from
the mean curve
Flamura Trivale Glosa Flamura Trivale Glosa
Bioyield force Fb, (N) 93.2 83.1 98.0 98.4 81.1 94.0
Bioyield energy Wb, (J) - - - 0.028 0.018 0.016
Rupture force Fr, (N) 107.8 90.5 103.6 104.2 83.2 94.7
Rupture energy Wr, (J) - - - 0.038 0.018 0.016
Bioyield
deformation
Relative deformation, δb 0.138 0.092 0.077 - - -
Absolute deformation,
Db (mm)0.304 0.267 0.260 0.464 0.348 0.292
Rupture
deformation
Relative deformation, δr 0.099 0.109 0.086 - - -
Absolute deformation,
Dr (mm)0.419 0.320 0.290 0.576 0.400 0.360
Modulus of elasticity, (MPa) 313 364 486 298 369 468
Table 12. Values of measured and determined parameters in uniaxial compression test [20]
Grinding Characteristics of Wheat in Industrial Millshttp://dx.doi.org/10.5772/53160
349
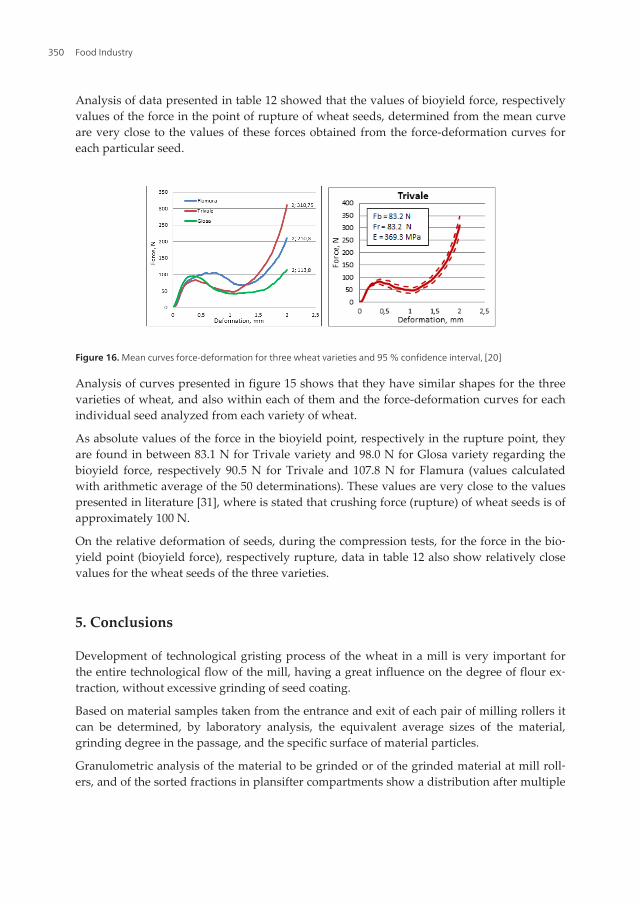
Analysis of data presented in table 12 showed that the values of bioyield force, respectivelyvalues of the force in the point of rupture of wheat seeds, determined from the mean curveare very close to the values of these forces obtained from the force-deformation curves foreach particular seed.
Figure 16. Mean curves force-deformation for three wheat varieties and 95 % confidence interval, [20]
Analysis of curves presented in figure 15 shows that they have similar shapes for the threevarieties of wheat, and also within each of them and the force-deformation curves for eachindividual seed analyzed from each variety of wheat.
As absolute values of the force in the bioyield point, respectively in the rupture point, theyare found in between 83.1 N for Trivale variety and 98.0 N for Glosa variety regarding thebioyield force, respectively 90.5 N for Trivale and 107.8 N for Flamura (values calculatedwith arithmetic average of the 50 determinations). These values are very close to the valuespresented in literature [31], where is stated that crushing force (rupture) of wheat seeds is ofapproximately 100 N.
On the relative deformation of seeds, during the compression tests, for the force in the bio‐yield point (bioyield force), respectively rupture, data in table 12 also show relatively closevalues for the wheat seeds of the three varieties.
5. Conclusions
Development of technological gristing process of the wheat in a mill is very important forthe entire technological flow of the mill, having a great influence on the degree of flour ex‐traction, without excessive grinding of seed coating.
Based on material samples taken from the entrance and exit of each pair of milling rollers itcan be determined, by laboratory analysis, the equivalent average sizes of the material,grinding degree in the passage, and the specific surface of material particles.
Granulometric analysis of the material to be grinded or of the grinded material at mill roll‐ers, and of the sorted fractions in plansifter compartments show a distribution after multiple
Food Industry350

known laws, from which most used is Rosin-Rammler distribution function, with high cor‐relation coefficient R2.
However, it is shown that there can also be used with good results the Schuhman and logis‐tical two parameters distribution laws, the finding suggest that the type of granulometricdistribution law which best describes the size of grinded biological materials depends onmaterial nature and the place and role of roller mill used for grinding in the general techno‐logical flow. Knowledge of adequate mathematical models describing the size distributionof grinded materials is useful in all engineering activities related to the processes on the flowof complex roller mills of last generation.
Values of mechanical characteristics of wheat seeds (regardless the variety) are necessary toestimate the energy consumed for their grinding in grain mills. A great influence on thegrinding energy is given by the crushing force and their relative and absolute deformation,determined by experimental research of uniaxial compression.
For some wheat varieties presented in this chapter, compression force in the rupture point,determined from force-deformation curves has values of 100-110 N, for seed moisture con‐tent of about 12%.
Crushing energy has values of 0.02-0.04 J, for each wheat seed, but it is influenced by themoisture of seeds and by seed arrangement during compression: on width ”sideways” or onthickness ”laying flat”.
Regarding the modulus of elasticity, its values are between 313-487 MPa, being greater asmoisture is lower. It was found that lower moisture content resulted in higher values ofmodulus of elasticity and to lower values of rupture energy, which confirm that wetterseeds have greater plasticity than dry seeds, so they have higher energy consumption.
Author details
Gheorghe Voicu, Sorin-Stefan Biris, Elena-Madalina Stefan,Gabriel-Alexandru Constantin and Nicoleta Ungureanu
“Politehnica” University of Bucharest, Romania
References
[1] Fang Ch., Campbell G.M. Stress-Strain Analysis and Visual Observation of WheatKernel Breakage During Roller Milling Using Fluted Rolls. Cereal Chemistry 2002;79(4) 511–517.
[2] Mazlina S., Kamal M. Evaluation of the potential role recycle within the flour millingbreak system. Universiti Putra Malaysia, TLN 2006; 42.
Grinding Characteristics of Wheat in Industrial Millshttp://dx.doi.org/10.5772/53160
351

[3] Fang Q., Hanna M.A., Haque E., Spillman C.K. Neural Network Modelling of EnergyRequirements for Size Reduction of Wheat, Transaction of the ASAE 2000; 43(4)947-952.
[4] Campbell G.M. Roller Milling of Wheat, Handbook of Powder Technology 2007, 12,383-421.
[5] Pasikatan M.C., Milliken G.A., Steele J.L., Spillman C.K., Haque E. Modelling the SizeProperties of First-Break Ground Wheat. Transaction of the ASAE 2001; 44(6):1727-1735.
[6] Hareland G.A., Effects of Break-Roll Speed Differential on Product Yield and Semoli‐na Granulation in a Durum Pilot Mill System. Cereal Chemistry, 1998; 75(6) 836-840.
[7] Căsăndroiu T., Voicu G., Tutuianu G.D. Cu privire la legile distribuţiei granulome‐trice al produselor mărunţite într-o moară cu valţuri, Sesiunea jubiliară de comun‐icări ştiinţifice ISBTeh-2002, Politenica University of Bucharest 2002; 194-199.
[8] Voicu G., David M., Tudosie E.M., Constantin G. Researches on the grindings charac‐tersitics in technological breakage phase at a fluring mill with capacity of 220 t / 24 h.Romanian Technical Sciences Academy, Alma Mater, Modelling and optimization inthe machines building field MOCM 2009; 15(3) 85-90.
[9] Voicu G., Tudosie E.M., Tarcolea C., Voicu P. Particle Size Distribution and SievingCharacteristics of Semolina in the Grinding Passages of a Wheat Mill, 11th Interna‐tional Congress on Mechanization and Energy in Agriculture TRAKAGENG 2011, Is‐tanbul, Turkey, 457-462;
[10] Voicu G., Căsăndroiu T., Târcolea C., Tudosie E.M., Voicu P. Experimental researchon the physical characteristics of products obtained from wheat milling, Actual Taskson agricultural engineering 2010; Opatija, Croatian, 399- 410.
[11] Headley V., Pfost H. A comminution equation relating energy to surface area by logprobability method, Transactions of the ASAE 1968; 11(3) 331-334 and 338.
[12] Henderson S., Hansen R. Farm grain comminution: Hammer mill and burr mill per‐formance analyzed, Transactions of the ASAE 1968, 11(3) 339-402.
[13] Voicu G., Căsăndroiu T. Utilizarea funcţiei logistice pentru descrierea proceselor deseparare pe sitele sistemelor de curăţire de la combine, Lucrări ştiinţifice “Concepte,tehnologii şi echipamente tehnice moderne pentru agricultură şi industria alimen‐tară” INMATEH- III 2004, Bucharest, 107-112.
[14] Voicu G., Căsăndroiu T., Toma L.M. A multiple logistic regression statistical modelto estimate grain losses on sieve cleaning system from combine, Actual tasks on agri‐cultural engineering 2006; Croatian, 481-491.
[15] Voicu G., Tudosie E.M., Casandroiu T., Biris S.S. Some aspects of physical propertiesof seeds and wheat products obtained from a roller mill. Buletinul Institutului Poli‐
Food Industry352

tehnic din Iasi, Secţia Constructii de masini, Editura Politehnium, LVI (LX), 4B, 2010;477–488.
[16] Voicu G., Tudosie E.M., Paraschiv G., Voicu P., Ipate G. Testing certain distributionlaws regarding some physical characteristics of grinded wheat seed mixture insidemilling units and the connection between them, Actual tasks on agricultural engi‐neering 2011, Opatija, Croatian, 427-436.
[17] Clarke B., Rottger A. Small mills in Africa. Selection, installation and operation ofequipment. Food and Agriculture Organization of the United Nations, Roma 2006.
[18] Nedeff V., Panainte M., Mosnegutu E., Savin C. Echipamente de proces în industriaalimentară. Măruntirea produselor agroalimentare, Editura Meronia, 2005.
[19] Romański L., Stopa R., Niemiec A. Distribution of surface pressure on grains crushedbetween flat plates. Inzynieria Rolnicza 2005; 11(71) 413-421.
[20] Voicu G., Stefan E.M., Ungureanu N. Constantin G. Some mechanical characteristicsof wheat seeds obtained by uniaxial compression tests, Scientific Bulletin of Universi‐ty Politehnica of Bucharest, 2012 (sent for review).
[21] ***ASAE Standards 2000 (R2008), Compression Test of Food Materials of ConvexShape. American Society of Agricultural and Biological Engineers, S368.4.
[22] Khodabakhshian R., Emadi B. Determination of the Modulus of Elasticity in Agricul‐tural Seeds on the Basis of Elasticity Theory. Middle-East Journal of Scientific Re‐search 2011; 7(3) 367-373.
[23] Tudosie E.M., Voicu G., Căsăndroiu T., Târcolea C. Variation of crushing characteris‐tics by compression of Romanian wheat seeds. Research People and Actual Tasks onMultidisciplinary Sciences 2011; vol.2, 95-99.
[24] Karaj S., Muller J. Determination of physical, mechanical and chemical properties ofseeds and kernels of Jatropha curcas L. Industrial Crops and Products 2010; http://www.sciencedirect.com (accessed May 2011).
[25] Mohsenin N.N. Physical properties of plant and animal materials, vol I (Structure,physical characteristics and mechanical properties). Gordon and Breach Science pub‐lishers, N.Y., 1970.
[26] Shelef L. Mohsenin N.N. Evaluation of the Modulus of Elasticity of Wheat Grain.Journal Series of the Pennsylvania Agricultural Experiment Station, no. 3174, 1967;http://www.aaccnet.org/publications/cc/backissues/1967/Documents/Chem44_392.pdf (accessed 20 January 2011).
[27] Afkari Sayyah A.H., S.Minaei S. Behavior of Wheat Kernels under Quasi-Static Load‐ing and its Relation to Grain Hardness, Journal Agricultural Science and Technology2004; 6 11-19.
Grinding Characteristics of Wheat in Industrial Millshttp://dx.doi.org/10.5772/53160
353

[28] Baslar M., Kalkan F., Mazhar Kara M., Ertugay M.F., Correlation between the proteincontent and mechanical properties of wheat, Turkish Journal of Agriculture and For‐estry 2012; 36, http://mistug.tubitak.gov.tr (accessed May 2012).
[29] Moya M., Ayuga F., Guaita M., Aguado P.J. Mechanical properties of granular agri‐cultural materials considered in silos designe. 15th ASCE Engineering MechanicsConference, Columbia University, New York, (2002), http://www.civil.columbia.edu/em2002/ proceedings/papers/271.pdf (accessed January 2010).
[30] Abbaspour-Fard M.H., Khodabakhshian R., Emadi B., Sadrnia H. Evaluation the Ef‐fects of Some Relevant Parameters Elastic Modulus of Pumpkin Seed and its Kernel.International Journal of Biomaterials 2012; ID 271650, http://www.sciencedirect.com(accessed May 2012).
[31] Emadi B., Khodabakhshian R., Abbaspour Fard M.H., Sadrnia H. Experimental com‐parison of applying different theories in elasticity for determination of the elasticitymodulus of agricultural produce. Pumpkin seed as a case study. Journal of Agricul‐tural Technology 2011; 7(6) 1495-1508.
Food Industry354