gross domestic product – national income of romania 1862 ... · 1 gross domestic product –...
TRANSCRIPT
Munich Personal RePEc Archive
Gross Domestic Product – National
Income of Romania 1862 – 2010. Secular
statistical series and methodological
foundations
Axenciuc, Victor and Georgescu, George
Institute of National Economy
16 October 2017
Online at https://mpra.ub.uni-muenchen.de/84614/
MPRA Paper No. 84614, posted 17 Feb 2018 07:12 UTC

1
Gross Domestic Product – National Income of Romania 1862 – 2010.
Secular statistical series and methodological foundations
Victor Axenciuc
George Georgescu
Abstract
Starting from the importance and need to investigate one of the most relevant issues regarding
the structure and dynamics of the economic and social development of all countries in the
world, the book focuses on Romania, from the perspective of certain synthetic indicators,
aggregated at macroeconomic level, i.e. the Gross Domestic Product and the National Income,
on long data series over the past 150 years, also taking into account the comparative
international context, in terms of purchasing power parity. The Part One contains a synthesis,
developed and completed, of GDP data for each year of the period 1862 – 2010 and also
indicators resulting from the GDP, as Net Domestic Product, Net National Product and
National Income. The historical research has adopted and applied, with maximum attention,
criteria that substantiated the calculations, through rigorous techniques and methods of data
aggregation, in order to remove certain errors that would lead to distorted results, focusing on
the accuracy of evaluations, so that they would express, in the most genuine manner, the real
dimension of the statistical indicators, allowing for a correct interpretation of the economic
phenomena. The operations for compiling the indicators are accompanied by comments
regarding the criteria and calculation methods, as well as by methodological explanations, so
that the data would be able to be rebuilt in a better format, by the interested authors, should
they have a more reliable and relevant statistical information about Romania. The Part Two of
the book focuses on the international literature, dedicated to criticisms theoretical and
methodological opinions regarding the GDP, as well as a comparative analysis of the GDP
evolution in Romania, in various hypotheses, compared to other countries.
Key words: System of National Accounts; International Comparison Program; wellbeing; GDP criticism; Romania EU convergence. JEL Classification: B15, B41, C82, E01, N10, O11
Note: The book was published, under the same title, in October 2017 by the Romanian Academy Publishing House.

2
Victor AXENCIUC George GEORGESCU _______________________________________________________________________________________
Gross Domestic Product – National Income of Romania
1862 - 2010
Secular statistical series and methodological foundations
2017

3
S U M M A R Y
Preface...................................................................................................................................
Historical and methodological introduction………………………………………………….
PART ONE
Section A: The Gross Domestic Product during 1862-2010
Overall synthesis of statistical series.......................................................................................
Section B: The Gross Domestic Product during 1862-1947
Historical and methodological introduction………………………………………………….
Synthesis of computing detailed statistical series.....................................................................
Section C: The Gross Domestic Product during 1950-1979
Historical and methodological introduction………………………………………………….
Calculations for converting the National Income to Gross Domestic Product.........................
Section D: The Gross Domestic Product during 1980-2010
Historical and methodological introduction………………………………………………….
Compatibility calculations in comparable prices......................................................................
Section E: External sector indicators
The external debt of Romania during 1864-2010.....................................................................
The BoP current account balance of Romania during 1862-2010.............................................
PART TWO
1. The GDP and national accounts…………………………………………………………
2. The GDP relevance and limitations……………………………………………………..
3. Addressing GDP deficiencies……………………………………………………………
4. International comparisons……………………………………………………………….
5. Eurostat indicators for the EU cross-country comparisons……………………………
References..............................................................................................................................
Addendums
The Foreward of NIS President to the Romanian edition .....................................................
Historical background and acknowledgements for the Romanian edition ............................

4
P R E F A C E
Starting from the importance and need to investigate one of the most relevant issues
regarding the structure and dynamics of the economic and social development of all countries
in the world, the authors elaborated this volume, by focusing their scientific research on
Romania, from the perspective of certain synthetic indicators, aggregated at macroeconomic
level, i.e. the Gross Domestic Product and the National Income, on long data series over the
past 150 years, also taking into account the comparative international context, in terms of
purchasing power parity.
This volume is structured into two scientific parts. Part One represents a synthesis,
developed and completed, of the work of professor Victor Axenciuc published in Romanian
(The Gross Domestic Product of Romania – 1862-2000, Volumes I and II). The present paper
contains secular statistical series and methodological arguments, detailed over more than 1300
pages. It is considered a synthesis because, by rigorous selection of the most significant
statistical worksheets regarding the aggregate indicator – Gross Domestic Product –, a number
of 250 papers were kept, leaving aside numerous calculations and preliminary tables and
addendums of documents; Part One also stands for development, because the current research
extended the analysis period until 2010 and, in addition, indicators resulting from the GDP –
Net Domestic Product, Net National Product – and National Income were calculated for the
entire period.
Part Two of the study, elaborated by George Georgescu, PhD, focuses on the
international literature, dedicated to criticisms theoretical and methodological opinions
regarding the Gross Domestic Product, as well as a comparative analysis, also novel in nature,
of the evolution of this indicator, in various hypotheses, of the Romanian economy compared
to other countries.
Our historical research has adopted and applied, with maximum attention, criteria that
substantiated the calculations and that verified them, through rigorous techniques and
methods of data aggregation, in order to remove certain errors that would lead to distorted
results, focusing on the accuracy of evaluations, so that they would express, in the most
genuine manner, the real dimension of the statistical indicators, allowing for a correct
interpretation of the economic phenomena.
5
As it is the case of any research topic, which requires a complex approach, in time and
space, the quality and utility of these secular statistical series would be validated by the future
activity of scientific knowledge and by further researche astudies in the field. We would like
to point out that the operations for compiling the indicators are accompanied by explanations
and comments regarding the criteria and calculation methods, so that the data would be able
to be rebuilt in a better format, by the interested authors, should they have more reliable and
relevant statistical information available, as well as by methodological improvements.
Such research studies with outstanding results, in which the economic past of several
centuries is expressed in the language of modern statistical representations, have been
developed in several countries by different authors and/or institutions, most often of academic
nature, measuring the evolution of synthetic macroeconomic indicators by groups of
countries, continents and even at a global level.
As regards Romania, it must to be mentioned that, due to the discontinuity of data
series which could be compared for longer periods of time, also caused by territorial and
political regime changes that have occurred over the past 150 years, the analytic studies
focusing on the macroeconomic evolutions at a national and international level are relatively
few, seizing, in a compact manner, only some of the periods from the reference interval.1
In Part One of the paper, depending on the nature of the statistical information and
the calculations performed, the secular interval of the topic, which focuses on the period
1862-2010, was developed on three time segments, 1862-1947, 1950-1979, and 1980-2010
respectively (corresponding to sections B, C, and D), anticipated by the presentation of a
general synthesis, for the entire period (Section A).
The time segment of the period 1862-1947, which represents the backbone of the
paper, was fully developed starting with the collecting and processing of the information for
primary operations, up to the development of synthetic indicators.
The module of the 1950-1979 interval was developed by converting the data regarding
the National Income according to the System of Material Production, presented in the official
statistics, to the Gross Domestic Product.
The time segment of the period 1980-2010 was developed by transposing the data in
current prices published by the National Institute of Statistics and the National Bank of
Romania, to comparable prices.
1Some of them were useful for our historical research, mentioning in this context the National Income of Romania for the period 1926-1938, a study developed by Mitiţă Georgescu for the Romanian Encyclopedia and published in its fourth volume in 1943.

6
At the end of Part One, the aggregate indicators deriving from GDP, e.g. the Gross
National Product, Net Domestic Product and National Incomeare presented by making
calculations and processing some data on the historical series, taking into account the levels of
the external debt, the BoP current account balance and the consumption of fixed capital.
The building of secular retrospective series of economic statistical indicators and
calculating, for the same historical period, the macroeconomic synthetical aggregates,
represented, especially in the second half of the 20th century, one of the main concerns and
focuses of economics and international institutions at global level.
Part Two of the paper, in a theoretical and methodological approach to the Gross
Domestic Product issues, presents a short history of the System ofNational Accounts,
focusing on the methodological changes of the SNA 2008 and ESA 2010, respectively, as
well as their impact on revising the GDP at the level of the European Union.
In the context of the global crisis effects on certain macroeconomic and financial
concepts, and from the perspective of the GDP indicator relevance, despite methodological
improvements, certain limits are highlighted in this regard, as well as its interpretation
distortions, sometimes strained to abusive forms and diverted for political purposes.
The attempts to address the GDP deficiencies, many of them being included in the
recommendations of the Stiglitz-Sen-Fitoussi Commission, focused on establishing certain
GDP complementary indicators, as well as systems of alternative indicators, suggested by
different authors or international institutions, that would reflect, in a more adequate manner,
the individual and social wellbeing, both for analytical and operational purposes.
At the end of Part Two our research focuses on international comparisons regarding
the GDP at the purchasing power parity, highlighting Romania’s position in European and/or
global rankings, its evolution over time, as well as the relative and absolute gaps compared to
advanced countries, adding some considerations regarding the perspectives of the real
convergence with the EU Member States.
Considering that they would add value and interest to the paper, the foreword by
Professor Vergil Voineagu to the Romanian edition, a historical background and
acknowledgements for the same edition, are presented in the addendums.
In the elaboration of this study the authors started from the belief that the historical
data, the secular indicators assessed, as well as our own interpretations, would be useful for
the scientific research studies of historians, economists, sociologists and all who would
develop retrospective or prospective analyses regarding the evolution of the social and
economic life in Romania.

7
An articulated, coherent system of statistical data, implicitly of the aggregate
macroeconomic indicators for long periods of time, can represent benchmarks for
substantiating certain policies aimed at the present and future of our country, focusing on the
characteristics of the cyclical secular evolution, as well as the nature of development gaps and
convergence prospective in the European and global context. The foundation of the current
processes and phenomena based on historical and economic sources, the ascertainment by
synthetic indicators of the secular dynamics and continuity of the economy evolution and
transformation affords a more comprehensive perspective for understanding the present and
future trends of the long-term macroeconomic cycles.
Any research paper, such as the current one, enjoys the information support of certain
institutions and persons. In this regard we would like to thank the National Commission of
Prognosis, the National Institute of Statistics, the Institute of National Economy, and the
National Institute for Economic Research of the Romanian Academy; for technical operations
and type scripting we benefitted from the support of Mrs. Rădoi Alina and Mrs. Mincu
Cristina, who deserve our special thanks.
At the end of this preface we consider that any rigorous scientific endeavor, as we
hope ours has been, should be constantly guided by the everlasting truth expressed by Seneca:
“Much remains to be done and much will remain. No one will be deprived of the chance to
add something.”

8
Historical and methodological introduction
The building of the retrospective series of the economy statistical indicators, and in
particular calculating the macroeconomic aggregates during the same historical time frame
represented, especially since the second half of the 20th century, one of the main interests and
concerns of economics at global level. The substantiation of the current processes and
phenomena based on historic-economic sources, establishing by synthetic indicators the
retrospective dynamics, the secular continuity of the evolution and transformations of the
economy ensure a more comprehensive perspective of the analysis and understanding of the
current and future development trends, of the unfolding the long term macroeconomic cycles.
Such researches with outstanding results, where the economic history of several
centuries became expressed in the language of modern statistical representations, have been
developed in several countries.2 At the same time, such comparisons are performed by groups
of countries, continents, and at a global level.3
2 Studies in this field have been mostly published in prestigious periodicals: The Review of Income and Wealth, Income and Wealth, The Journal of Economic History, The Journal of European Economic History, Bulletin de l’Institut International de Statistique, Weltwirtschaftliches Archiv, etc. as well as papers in different countries: Deane, Ph., Cole, W.A., British Economic Growth, 1688-1959. Trends and Structure, Cambridge, 1964; Hofman, W.G., Műler, J.H., Das Deutsche Volkseincomme 1851-1957, Tübingen, 1959; Johansson, O., The Gross Domestic Product of Sweden and its Composition, 1861-1955, Stockholm, 1957; Firestone, O.J., Canada ‘s Economic Development, 1867-1953, London, 1958; Eckstein, A., National Income and Capital Formation in Hungary, 1900-1950, London, 1953; Bjerke, K., The National Product of Denmark, 1870-1952, London, 1955; Markzewski, J., Some Aspects of the Economic Growth of France, 1660-1958, 1961; etc. More detailed references having the same scientific value can be found in the special section of our study dedicated to the bibliography (resources). 3 Kuznets, S., Economic Growth of Nations, 1977; Maddison, A., Economic Growth in the West. Comparative Experiences, New York, 1964; Bairoch, P., The Economic Development in the Third World since 1900, London, 1975; idem, Europe’s Gross National Product, 1800-1975; Cipola, C.M., Before the Industrial Revolution: European Society and Economy, 1000-1700, New York, 1976; Maddison, A., Growth and Fluctuation in the World Economy, 1870-1964; idem, The World Economy in the Twentieth Century, 1989; idem, Monitoring the World Economy 1820-1992, 1995; idem, The World Economy, vol. I, A Millenniar Perspective, - 2001; vol. II, Historical Statistics, - 2006. In the 20th century, the international institutions and programs, through economics departments calculated and estimated the synthetic indicators of the national income, gross domestic product, gross national product and their components, in different countries and groups of countries, on different continents for medium and long term periods; among these we can find The Society of the Nations in the 20s-40s; after 1945, the United Nations, the Organization for Economic Cooperation and Development, the United Nations Program for Development, the World Bank, the International Monetary Fund, the European Free Trade Association, the European Union, etc. The estimations and calculations of the macroeconomic outcome indicators at international level were developed and are still being developed by different public and private educational and research institutions. All these led to the development of rich literature, statistical data analyses for numerous countries, based on different calculation methodologies and various outcomes of economic development measurement. During the period 1860-1950, there is only one study in the Romanian literature regarding the national income of Romania, and it is for the medium term; the said paper bears the title “National income of Romania” for the period 1926-1938 by Mitiţă Georgescu for the Romanian Encyclopedia and published in its 4th volume in 1943. The data provided by this study, continue to be, seven decades later, the only source of information regarding the national income of our country until de middle of the 20th century, being utilized also by international specialized publications, by different authors that have developed secular long series regarding different groups of countries and the retrospective global economy.
9
In these international studies, the data regarding our country, for long periods of time,
are missing or, in rare situations, they are author estimations.
Until the middle of the 20th century, the official statistics institution in Romania did not
publish data regarding the national income of the country, as it was the case in most of the
European countries. The lack of official data regarding the global indicator - is one of the first
arguments for focusing our research on two time intervals; the first one - 1862-1947 to which
the second volume of the paper in Romanian was dedicated4 and in which the full calculation of
the indicator was performed, and the second interval - 1950-2010, for which the official
statistics published successive series of data regarding the National Income in the system of
material production – SMP for 1950-1990 and regarding the gross domestic product5 as of
1980;
In our research the two indicators underwent different statistical compatibility
operations, which are explained into detail below, in order to obtain full statistical series - 1862-
2010 - comparable with the GDP, in international currency, USD PPP 2000.
4 Victor Axenciuc, Romania’s Gross Domestic Product, 1862-2000, vol. I and II, “Editura Economică” Publishing House, Bucharest, 2012. 5 In the Romanian economic research, both the institutional one as well as the one of different authors, the calculation methodology utilized for the macroeconomic indicators in the Romanian system of national accounts started to be assimilated in the 70s, during the 20th century. Different state institutions operating in the field of synthesis, the Central Directorate for Statistics (CDS), the State Planning Committee, the Ministry of Public Finances etc., directly or by means of the institutes and departments methodology, developed researches and studies regarding the SNA, on the manner in which it is applied in the official statistics in order to compare the Romanian macroeconomic indicators with the indicators of the Western countries. It wass the period during which Romania, after two decades of isolation, was looking for financial, scientific and political opportunities etc.; it becomes a member of the International Monetary Fund, of the International Bank for Reconstruction and Development. In the Western economies the application of the SNA was expanded, becoming the official methodology of many member states of the United Nations and of its bodies. Among the studies developed in the 70s and 80s regarding the SNA, we would like to mention the following: The methodology for calculating the national income, the gross and net domestic product in accordance with the system of national accounting, developed by SPC in 1973; the study regarding the possibilities of using in Romania a national accounts system, developed by the Center for Financial and Monetary Researches of the Ministry of Public Finances, in 1974; several papers of the Central Directorate for Statistics regarding the methodology and calculation of the gross domestic product in Romania, developed in the period 1974-1979; the Institute of National Economy also developed in 1986, with the same purpose, papers on the Problems of determining the macroeconomic summary indicators, Study Paper n. 112; Problems of international comparability of the summarized indicators, Study Paper no. 113 of 1989. SPC, the Ministry of Public Finances, CDS and the Central Institute for Economic Research developed the study having the title Unitary Methodology for Planning and Monitoring the Gross National Product, etc. After 1990 the SNA becomes official in Romania, in the field of statistics and economy; the universities teach classes, perform scientific research in this field. The National Institute of Statistics publishes periodical papers regarding the National Accounts and numerous methodological publications. Among the papers worth mentioning: System of National Accounts and Macroeconomic Aggregates (1994) by I. Capanu, P. Wagner, C. Mitruţ; National Accounting (1995) by I. Ionaşcu; Measuring and Comparing Economic Development (1996) by C.Anghelache; International Comparison of the Gross Domestic Product (1999) by Pavel Wagner, Daniela Elena Ştefănescu; Macroeconomic Indicators – Economic Calculation and Analysis (2003) by C.Anghelache, I.Capanu; National Accounting, (2003), by C. Ivan Ungureanu; National Accounts System (2007), by Constantin Anghelache, Alexandru Isaic-Maniu, Constantin Mitruţ, Vergil Voineagu.

10
This was presented in different sections in Volume I of the Romanian edition and, in a
summarized manner, adequate for this study, in section A in English.
We would like to mention that, as compared to the previous Romanian edition, which
contains the 1962-2000 time series, we have updated the statistical series of the GDP,
expanding it with the decade until 2010, in comparable monetary terms, based on USD PPP
2000. The absolute data regarding the GDP for this interval - 2001 - 2010 - were calculated by
means of dynamic and structure indexes, with the base 100 in the year 2000, as provided by the
National Institute of Statistics.
Our research regarding the calculation on long term, for historical time series,
Romania’s macroeconomic indicators, e.g. the national income, and subsequently the gross
domestic product, dates back in the 20th century; it was developed in the period 1962-1963 as a
retrospective knowledge and synthesis study of the Romanian economy, by means of national
income, and the author was teaching during the period a university class of economic history.
When we are young, our dreams are big and beautiful and they guide our ideals, the purpose of
our activity, and, in my case, the research activity. Due to the fact that the specialized literature
did not contain a calculation of the statistical series of the national income of Romania - 1860 -
1950 - series which is necessary in order to convert it to GDP, I decided to compute the national
income series for this period.
After several years of investigation in the libraries, the documentation activity
underlined the higher complexity of the topic and the insurmountable difficulties regarding the
statistical data. The statistical information available for the period of almost one century was
fragmented, incomplete, lacking in data for decades; others had a higher level of uncertainty
and did not allow the direct setting of the annual series of indicators necessary in order to
determine the national income. Thus, with the same level of determination I decided first of all
to establish and reestablish the statistical series of the national economy for the said period,
1860-1950, and afterwards, based on the said data, to develop the indicators of the national
income.
More than two decades of investigations in libraries and archives, more than I could
have initially imagined, this new activity required and it was finalized within the Institute of
National Economy of the Romanian Academy. The research of the topic has benefitted from the
collaboration of certain researchers, colleagues which were mentioned in the first edition and at
the end of this edition.
Finally, the historical time series, as a basis for calculating the national income, most of
them complete, by sectoral structure of the national economy, comprising more than three
11
thousand indicators for the period 1859-1947, were completed and subsequently published, by
the Romanian Academy’s Publishing House6, in three volumes.
Thus, having most of the basic statistical information established, reestablished and
verified, we were then able to move to the next stage and calculate the components of the
national income. The topic was accepted within the research program of the Institute and it was
implemented; the first draft was finalized, as a manuscript, at the end of the 80s, and it bears the
title National Income of Romania in the period 1862-1938, based on the methodology of the
system for material production. The activity of the fist years had as result the data necessary for
each main branch of material production and services for the indicators of the national income.
Several versions of the paper, based on the initial format, in the thematic structure and
monetary terms were developed, and this represented, in fact, steps towards a more
comprehensive document. The indicators were calculated in successive alternatives, focusing
on the most appropriate format: in current prices, comparable prices of 1938 and in the prices of
1913; each price alternative has pros and cons.
In 1993 we moved to the general rebuilding of the project, from the formula of the
national income to that of the gross domestic product for the period 1862-1938; in the following
years, the different variants of GDP indicators were developed for the time interval 1939-2010.
Depending on the nature of the statistical information and the methodology used, as shown
above, the secular investigation time interval of the topic - 1862-2010 - was investigated and
structured on three time intervals and three sections: the periods 1862-1947, 1950-1979, 1980-
2010. Each time interval having different statistical sources and calculation methods, was made
compatible at a later date. For these there are three corresponding results sections, and they
follow the same order: Section B-1862-1947; Section C-1950-1979 and Section D-1980-
2010;
The first time interval, 1862-1947, focused most on the research activity,
documentation, development of the methodology, calculation of the gross domestic product
starting with the primary operations until the final ones; the final format – the Romanian GDP
1862-1947 - is Volume II, of the previous edition, having 875 pages, based on which the
summarized version was developed which is presented in Section B.
The second interval of the topic comprises the period 1950-1979, for which the
calculations focused on the conversion of the data regarding the national income, presented in
6 Victor Axenciuc, Evoluţia economică a României. Cercetări statistico-istorice 1859-1947, vol. I, Industria şi construcţiile, published in 1992; vol. II, Agricultura, edited in 1996 and vol.III, Monedă-Credit-Comerţ-Finanţe Publice, published in 2000.

12
the official statistics, in accordance with the system of material production - SMP - to the series
of the gross domestic product according to the national accounts system - NAS - they are
presented in Section C.
The third and last time interval focuses on the decades 1980-2010. The NIS provides
data for the entire interval, 1980-2010, regarding the gross domestic product in current prices;
they were translated in comparable prices, in lei, in Section D.
With the view of having a full and unitary, continuous and comparable presentation, the
series of the gross domestic product indicator in the three sections - B, C and D - were
cumulated in the single series of the period 1862-2010, after the data in lei expressed in the
prices of different years were converted, using the presented methods, in international dollars,
at the purchasing power parity – PPP of the year 2000. Thus, the full presentation of the 1862-
2010 series of the gross domestic product, breakdown on resources, expressed in indicators
and indexes, in dynamics and structures is shown in Section A of general synthesis.
In order to make compatible the macroeconomic indicators for the period -1862-2010 -
the calculation data of the three sections, expressed in lei in constant prices for each interval,
that allowed also comparison within the series, were converted, in accordance with the methods
specified in each section, in international currency - dollars at the purchasing power parity of
the year 2000, thus ensuring the compatibility of the entire series.
We decided to convert the national currency in dollars PPP 2000, taking into account the
possible comparisons that the reader might want to perform with similar indicators from other
countries, expressed in USD PPP. Of course, with the available means a single researcher does
not have the possibility to calculate the lei versus dollars purchasing power parity of such a long
period of time.
The method that we used, namely the conversion of the GDP from the national currency
- lei - into the international currency - dollars PPP - was a simplified one; for the period 1862-
1947, during which the indicators are expressed in comparable prices - lei gold 1913, the
conversion was done, as it is explained into detail in the Special Introduction, by transforming
them in dollars gold 1913, close to the purchasing power, and multiplying the obtained data by
depreciation coefficients of the US dollar until 2000; for the periods 1950-1979 and 1980-2010,
the conversion of the gross domestic product indicators from lei comparable prices to dollars
PPP 2000, was done based on the converter of the year 1975, namely of 8.8 lei = 1 dollar PPP,
determined in the 3rd round of the International Comparisons Program7, as follows: the gross
7 The baseline data included: The Economic Memorandum of Romania 1983 and the International Comparisons Program, round III of 1975.

13
domestic product indicators series 1950-1979, expressed in comparable prices in lei 1963, were
transformed based on the price index comparable lei price 1975 and were divided to the 1975
PPP converter, respectively 8.8 lei = 1 dollar PPP; the GDP series in dollars PPP 1975 thus
obtained was multiplied by the depreciation coefficients of the US dollar between 1975 and
2000, thus resulting the 1950-1979 GDP series in dollars PPP 20008.
The series of the gross domestic product indicators for the years 1980-2000, was
converted in dollars PPP 2000, as follows: for the period 1980-2000, the gross domestic
product calculated in comparable lei 1990, as highlighted in the Introduction was updated by
using the price index, to the level of the comparable prices of 1975; the data were divided to the
8.8 converter, building the GDP 1980-2000 series in dollars PPP 1975, which in turn was
multiplied by means of the depreciation coefficients of the GDP USA dollar between 1975-
2000, finally resulting in the 1980-2000 GDP series, in PPP dollars 2000; the GDP series for
the last decade of the period, respectively 2001-2010, due to the lack of official data regarding
the GDP in comparable prices and of the official deflator of the current prices (not published by
the official statistics), in order to obtain the GDP figures for the period 2001-2010, we utilized
the GDP indexes of the period with a fixed base (100% in 2000) which were successively
multiplied with the available data of the GDP by resources for the base year 2000.
The simplified method that we applied in order to be able to compare the GDP indicator
expressed in international comparable currency proved to be efficient. It was also applied by
some of the foreign researchers.
Despite all the differences between the calculation and conversion methods for the GDP
in dollars PPP of the four intervals: 1862-1947, 1950-1979, 1980-2000 and 2001-2010, the
statistic series of the GDP indicator per capita 1862-2010, in dynamics and structure, does not
have, as shown, any discrepancies in the evolution or any disagreements with the temporal
thresholds between them. We consider that this is the essential argument of the plausible nature
of the adopted solutions. For the sake of confirmation, we show that the thresholds between the
periods, that marked the change of the calculation methods and conversion solutions, the years
8After 1975 the International Comparisons Program had some other rounds as well, out of which the one related to the calculation of the lei-dollar PPP converter, the one of 1990 reported 10.678 lei = 1 dollar PPP. This new converter could have been utilized in order to transpose the Romanian GDP from comparable lei 1990 to dollars PPP 1990. The calculations of the conversion method of the International Comparisons Program (ICP) were improved (see OECD, Angus Meddison, The World Economy, vol.1, 2006, pag.190); the data were adjusted, among other, by a coefficient which corrected the lower quality of the goods from Eastern European countries, respectively from Romania as well, what we do not know if it was done in round III of the 1975 ICP. We could not obtain this coefficient. Therefore, even though the 1990 converter was also utilized, the comparisons of the Romanian GDP indicators for the period 1950-2000 “benefited” from an important level of relativity.
14
1947 and 1950, 1979 and 1980, the differences between the size of the GDP per capita and its
structure by resources are plausible. Thus, when in 1950, after the post-war recovery, the
economy achieved the level of 1939, the GDP per capita in dollars PPP 2000 stood at 1342
dollars as compared to 1164 dollars in 1939, a plausible and acceptable difference, especially
after a decade of major structural, economic and social transformations. At the same time, at the
threshold between the two methods of calculation, between 1979 and 1980, the same indicator
is expressed in 1979 as 8974 dollars and in 1980 as 8939 dollars, the difference being also
normal, acceptable.
Once again we would like to underline that all these prove that the statistical methods
and solutions were substantiated in an adequate manner and were used correctly, being
confirmed, with some reserves, by the result expressed in dynamics and structure of the GDP
series for the entire period of 1862-2010.
In conclusion, with these methodological applications we conclude the part I point 1
containing, in a summarized manner, the four sections for calculating the aggregate outcome -
GDP - of Romania for one and a half century.
As compared to the Romanian version, this paper has deepened even further the
research, calculating the aggregates of the GDP, for the same time interval and with the same
value parameters – international dollars PPP 2000 – the Gross Domestic Product and National
Income, respectively the Net National Product, based on the revised version of the National
Accounts System of 1955.
The topic of synthetic macroeconomic indicators, GDP, NNP, GNP, etc. enjoyed a long
theoretical and methodological debate, ever since the first aggregate drafts for measuring the
national economic activities and international comparisons. From the content, the area of
coverage, the efficiency of measurements, the value of results etc., of the synthetic aggregates,
some verified in the historical practice of different countries, the virtues as well as the limits of
these statistical instruments were revealed. To this regard, in order to ensure as added value of
knowledge to the users of data regarding the gross domestic product of Romania, the part II of
this paper envisages a summary of the main theoretical and methodological debates, from the
international specialized literature regarding the global outcome aggregates, as well as a section
with data showing the position Romania within the international comparisons rankings,
according with certain models and values of economic and social indicators.
This analysis of the concepts, criticisms and solutions for improving the synthetic
aggregates, highlighted in the publications of highest scientific level, has not only the value of
updating the current Romanian preoccupations in the field, but it also stimulates the researchers

15
reading it to debate these important topics. Furthermore, by a more comprehensive and
documented insights, the users of the statistical information from the first part of the study will
be able to evaluate, in a more critical manner, the calculations and data value, as well as having
the possibility to improve the methodology; the authors welcome the potential comments9.
As concerns the proceedings of presenting the data series, of classifying the components of the
statistical and methodological matter, solutions with a high level of systematization and clarity
were accepted; the statistical situations are assigned with figures and letters as reference and
identification indicatives.
As concerns the framework of the research methodology, the principles and criteria, the
calculation methods which were utilized, the territorial and temporal framework, the
investigation area, the prices in comparable lei and dollars PPP, etc. - these are mostly
presented in the Introductions of each section; the summary of the tables is presented in pairs,
having a double approach: in the series of years averages (four-six years), being more
concentrated, on one page, and in annual series, in an extended format on three-four pages.
The changes in territory and potential, of the period 1862-1947, in three moments (years
1918, 1940, 1945) led to extra economic modifications in the size of the indicators, which does
not ensure their comparability for the entire period; these historical thresholds are marked in
tables with a horizontal line for the year when the border was moved. In order to overcome this
obstacle, the indicators were divided to the number of inhabitants, solution which allows, with
some reserves, to compare the data for the time interval 1862-2010.
9 Beyond the GDP, June 2016, Debate at National Institute of Statistics, where Andrei Tudorel, Ph. D., President of NIS, and Ilie Dumitrescu, Ph. D., Director of NIS held a presentation.
16
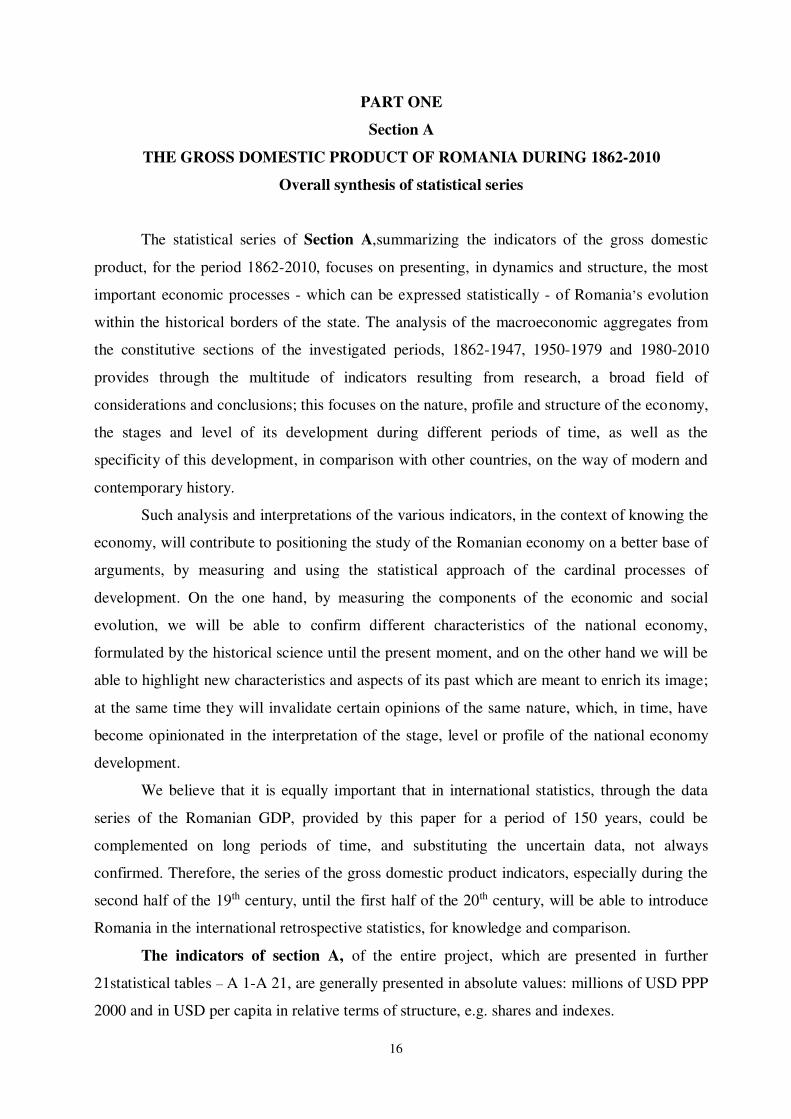
PART ONE
Section A
THE GROSS DOMESTIC PRODUCT OF ROMANIA DURING 1862-2010
Overall synthesis of statistical series
The statistical series of Section A,summarizing the indicators of the gross domestic
product, for the period 1862-2010, focuses on presenting, in dynamics and structure, the most
important economic processes - which can be expressed statistically - of Romania’s evolution
within the historical borders of the state. The analysis of the macroeconomic aggregates from
the constitutive sections of the investigated periods, 1862-1947, 1950-1979 and 1980-2010
provides through the multitude of indicators resulting from research, a broad field of
considerations and conclusions; this focuses on the nature, profile and structure of the economy,
the stages and level of its development during different periods of time, as well as the
specificity of this development, in comparison with other countries, on the way of modern and
contemporary history.
Such analysis and interpretations of the various indicators, in the context of knowing the
economy, will contribute to positioning the study of the Romanian economy on a better base of
arguments, by measuring and using the statistical approach of the cardinal processes of
development. On the one hand, by measuring the components of the economic and social
evolution, we will be able to confirm different characteristics of the national economy,
formulated by the historical science until the present moment, and on the other hand we will be
able to highlight new characteristics and aspects of its past which are meant to enrich its image;
at the same time they will invalidate certain opinions of the same nature, which, in time, have
become opinionated in the interpretation of the stage, level or profile of the national economy
development.
We believe that it is equally important that in international statistics, through the data
series of the Romanian GDP, provided by this paper for a period of 150 years, could be
complemented on long periods of time, and substituting the uncertain data, not always
confirmed. Therefore, the series of the gross domestic product indicators, especially during the
second half of the 19th century, until the first half of the 20th century, will be able to introduce
Romania in the international retrospective statistics, for knowledge and comparison.
The indicators of section A, of the entire project, which are presented in further
21statistical tables – A 1-A 21, are generally presented in absolute values: millions of USD PPP
2000 and in USD per capita in relative terms of structure, e.g. shares and indexes.

17
The groups of indicators which were selected in order to present in the best possible
manner, the trends of the economy’s evolution by means of the global outcome aggregate, are
presented in the beginning through tables A 1 and A 2; the gross domestic product expressed in
million USD, USD per capita and per employed capita, and indexes, on series of averages of
the years and succesive annual series of the period 1862-2010; they represent the most focused
measurement of the evolution of added values produced by the entire social and economic
activity of the country; the global indicator is at the beginning of the statistical tables which
follow: the elements of the basic equation for determining the gross added value are presented:
production, intermediary consumption and the gross added value as the final result of the
economic activities; for more detailed analyses which are necessary for our subsequent
calculations in order to determine the indicators, the gross domestic product, the net domestic
product - respectively the national income, the gross added value indicator was broken down in
consumption of fixed capital and net added value.
It follows tables presenting the statistical series of the gross added value according to
the two sectors - production of goods and production of services, averages of the years and
annual series, as well as the structure of the above mentioned components, as shares in the total
added value by following the same parameters; this group of statistical situations highlights the
contribution of the two fundamental categories of resources in the total gross added value and
the trends which are significant for changing the ratio between them, as a reflection of the
transformations which took place in the Romanian economy and society, during the reference
period; the following groups of statistical tables present, in accordance with the same structure
and purpose, the components of the gross added value of the production of goods by branches:
agriculture, industry and constructions, as well as of the services activities by branches:
transportation and communications; commerce; financial activities and insurances; public
administration, defence; education, culture, health, social assistance; real estate transactions,
others; in accordance with the classification of the national accounts.
Two groups of statistical situations, following the same time and value parameters,
present the series of the gross added value in the two sectors - of production of goods and
production of services in relation to the number of inhabitants and employed inhabitants.
Dividing the gross added value to the number of persons employed in the production of goods
in a sector - agriculture, industry and constructions - on the one hand and services on the other
hand, highlight for the first time in the historical research of global indicators in Romania, the
level of efficiency, the labor productivity, in the main sectors of the economy on long term;
these indicators, by means of analyses and comparisons, can reveal during the research, new

18
aspects, of high scientific value, not only from the quantitative perspective but also from the
qualitative one, of economic and social evaluation.
Dividing the GDP to the number of inhabitants shows the absolute level of created
value, per unit of population and it is easy to represent and understand, including international
comparisons. The GDP per capita or employed person shows the qualitative side of the
aggregate, and the measured outcome of the value producer, namely the productivity and labor
force efficiency per unit. In accordance with this indicator, in a century and a half, as the
national economy moved from manual labor and technique, the assimilation of automation,
modern technique and technology and the industrialization of the economy, in 2010 the GDP
per employed person, expressed in comparable monetary values, was 27 times higher than in
the initial calculation year 1862 (Table A 2, column 6).
In order to have a general view of the gross added value per person employed in the
production of goods and services, we have developed, based on table A 14, a genuine statistical
situation. This shows, in comparable dollars, per capita employed in a sector, the production of
gross added value in six selected years of the period 1862-2010 and the magnitude of the
amounts.
Gross added value per employed person in the branch -
in the production of goods and services, in USD 2000 and coefficients,
selected years in the period 1862-2010
Years Total
average gross
Gross added value in the production of goods Gross
added value per employed person in the branch added value
per
in the production
employed
person total agriculture industry constructions of services
no. of
years USD DC USD DC USD DC USD DC USD DC USD DC
1 2 3 4 5 6 7 8 9 10 11 12 13 14
1862 1 1071 1.0 852 1.0 688 1.0 2910 1.0 3874 1.0 3487 1.0
c.comp
1.0
0.8
0.64
2.72
3.63
3.26
1912 50 2206 2.1 1585 1.9 985 1.4 6398 2.2 11537 3.0 7235 2.1 c.comp
1.0
0.72
0.45
2.90
5.23
3.28
1938 76 1903 1.8 1427 1.7 828 1.2 6413 2.3 16189 4.2 5011 1.4
c.comp
1.0
0.75
0.44
3.37
8.59
2.63
1960 99 4794 4.5 4211 4.9 2233 3.2 11846 4.1 7108 1.8 8247 2.4 c.comp
1.0
0.88
0.47
2.47
1.48
1.73
1990 128 18376 17.2 18225 21.4 14662 21.3 21384 7.3 16176 4.2 18773 5.4
c.comp
1.0
0.99
0.80
1.16
0.88
1.02
2010 149 28891 27.0 24596 28.9 9845 14.3 40494 13.9 38036 9.8 34669 9.9
c.comp
1.0
0.85
0.35
1.48
1.32
1.20
Source: Calculated based on table A 14
Notes: c.comp = comparative coefficients; DC = dynamics coefficients

19
The purpose of our research is not the analysis, for which we will suggest only certain
statistical “surprises” that the researches in the field din not highlight and comment, although
they are very important for the economic science, especially on a secular basis. We would like
to signal the ratio between the gross added value and the gross added value per employed
person in the branches of material production - agriculture, industry and constructions, as well
in the production of services in the selected years; the indicators are unexpectedly varied in size
and proportion. For a better understanding we used coefficients instead of percentages, both for
comparing c.comp horizontally as well as for the dynamic - DC - vertically. Thus, in the first
year, 1862, the gross added value per employed person as compared to the economy’s average,
1071 USD - in the production of goods was of 852 USD, and for services it was of 3874 USD,
3.3 times higher.
The secular examination of the components of social production, for the Romanian
economy, that started the development, initially, from an agrarian structure mainly for self-
consumption, highlights, due to the size, the structure and the modification of the trends of all
mentioned indicators, the radical changes following the modernization and development of the
country.
If the gross production factor, in the context of the calculation of the newly created
value has the meaning of the basic term, in the long term approaches, as total value of
production and services, by comparing its size, the total and per capita evolution, and its
structure, by branches-resources, this indicator can acquire high analytical importance; the
social production size of the country for certain periods of time, in terms of total values and per
capita, as an expression of valorizing the potential of the national economy, as well as different
aspects parallel to those revealing the added value can be followed.

20
Table A 1
Total gross domestic product, per capita and per employed person, in USD PPP 2000 and indexes, averages of the years¹, 1862-2010
Averages of
the years
Gross domestic product
total per capita
per employed
person
million USD indexes USD indexes USD indexes
1 2 3 4 5 6 7
1862-1866 2261 100 554 100 1064 100
1867-1871 2540 112.3 598 107.9 1143 107.4
1872-1876 2926 129.4 667 120.4 1269 119.3
1877-1881 3492 154.4 770 139.0 1458 137.0
1882-1886 4185 185.1 860 155.2 1619 152.2
1887-1890 4775 211.2 915 165.3 1717 161.4
1891-1895 5582 246.9 1015 183.2 1896 178.2
1896-1900 5599 247.6 954 172.2 1774 166.7
1901-1905 6298 278.5 998 180.1 1850 173.9
1906-1910 7411 327.8 1094 197.5 2014 189.3
1911-1914 8829 390.5 1202 217.0 2206 207.3
…………………...................................................................................................................
1920-1924 14351 100 896 100 1534 100
1925-1929 18365 128.0 1070 119.4 1831 119.4
1930-1934 19424 135.3 1054 117.6 1807 117.8
1935-1939 22338 155.7 1144 127.7 1958 127.6
1940-1944 14873 103.6 1103 123.1 1878 122.4
1945-1947³ 10621 37.4 672 39.5 1080 70.4
..………………….................................................................................................................
1950-1954 28375 100 1700 100 3233 100
1955-1959 39869 140.5 2241 131.8 4220 130.5
1960-1964 55653 196.1 2977 175.1 5808 179.6
1965-1969 84700 298.5 4350 255.9 8620 266.6
1970-1974 129653 456.9 6270 368.8 12976 401.4
1975-1979 179123 631.3 8214 486.1 17465 540.2
1980-1984 211036 744.0 9401 553.0 20242 626.1
1985-1989 234305 826.0 10216 601.0 21811 674.6
1990-1994 182433 643.0 7950 467.6 17474 540.5
1995-2000 183595 647.0 8145 479.0 20496 634.0
2001-2005 211147 744.1 9685 569.1 25263 781.4
2006-2010 273438 963.7 12716 747.9 32027 990.6
Source: Autor’s calculations based on the data in table A2
Notes: 1 Calculated based on the data in table A2
2 The horizontal lines are continuous during the period which marks the territory changes, respectively Romania’s changes in potential; the non-continuous lines show the
of data for certain years.
3 Base 100 the average of the years 1950-1954
21
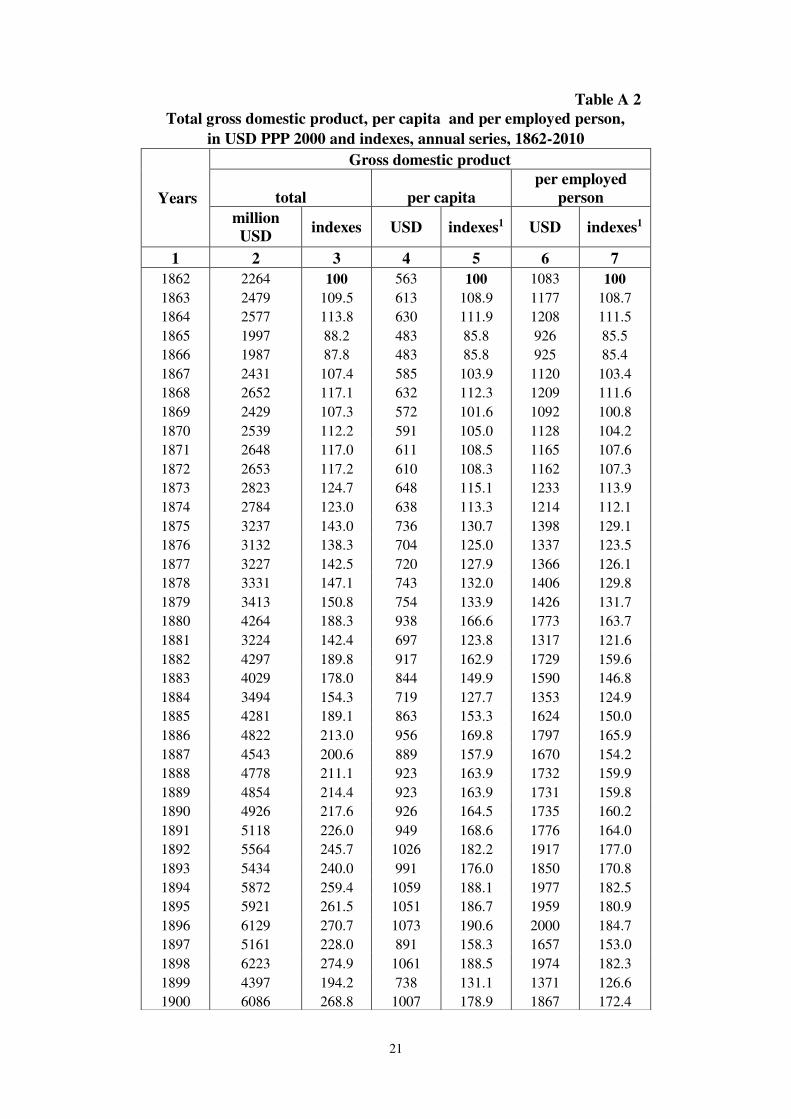
Table A 2
Total gross domestic product, per capita and per employed person,
in USD PPP 2000 and indexes, annual series, 1862-2010
Years
Gross domestic product
total per capita
per employed
person
million USD
indexes USD indexes1 USD indexes1
1 2 3 4 5 6 7
1862 2264 100 563 100 1083 100
1863 2479 109.5 613 108.9 1177 108.7
1864 2577 113.8 630 111.9 1208 111.5
1865 1997 88.2 483 85.8 926 85.5
1866 1987 87.8 483 85.8 925 85.4
1867 2431 107.4 585 103.9 1120 103.4
1868 2652 117.1 632 112.3 1209 111.6
1869 2429 107.3 572 101.6 1092 100.8
1870 2539 112.2 591 105.0 1128 104.2
1871 2648 117.0 611 108.5 1165 107.6
1872 2653 117.2 610 108.3 1162 107.3
1873 2823 124.7 648 115.1 1233 113.9
1874 2784 123.0 638 113.3 1214 112.1
1875 3237 143.0 736 130.7 1398 129.1
1876 3132 138.3 704 125.0 1337 123.5
1877 3227 142.5 720 127.9 1366 126.1
1878 3331 147.1 743 132.0 1406 129.8
1879 3413 150.8 754 133.9 1426 131.7
1880 4264 188.3 938 166.6 1773 163.7
1881 3224 142.4 697 123.8 1317 121.6
1882 4297 189.8 917 162.9 1729 159.6
1883 4029 178.0 844 149.9 1590 146.8
1884 3494 154.3 719 127.7 1353 124.9
1885 4281 189.1 863 153.3 1624 150.0
1886 4822 213.0 956 169.8 1797 165.9
1887 4543 200.6 889 157.9 1670 154.2
1888 4778 211.1 923 163.9 1732 159.9
1889 4854 214.4 923 163.9 1731 159.8
1890 4926 217.6 926 164.5 1735 160.2
1891 5118 226.0 949 168.6 1776 164.0
1892 5564 245.7 1026 182.2 1917 177.0
1893 5434 240.0 991 176.0 1850 170.8
1894 5872 259.4 1059 188.1 1977 182.5
1895 5921 261.5 1051 186.7 1959 180.9
1896 6129 270.7 1073 190.6 2000 184.7
1897 5161 228.0 891 158.3 1657 153.0
1898 6223 274.9 1061 188.5 1974 182.3
1899 4397 194.2 738 131.1 1371 126.6
1900 6086 268.8 1007 178.9 1867 172.4

22
Years
Gross domestic product
total per capita per employed
person
million USD indexes USD indexes1 USD indexes1
1 2 3 4 5 6 7
1901 6412 283.2 1047 186.0 1941 179.2
1902 6293 278.0 1016 180.5 1883 173.9
1903 6522 288.1 1037 184.2 1919 177.2
1904 5101 225.3 786 139.6 1466 135.4
1905 7161 316.3 1105 196.3 2041 188.5
1906 7818 345.3 1187 210.8 2191 202.3
1907 6402 282.8 958 170.2 1764 162.9
1908 6971 307.9 1030 182.9 1896 175.1
1909 6935 306.3 1010 179.4 1861 171.8
1910 8931 394.5 1282 227.7 2357 217.6
1911 8824 389.8 1245 221.1 2286 211.1
1912 9088 401.4 1256 223.1 2304 212.7
1913 9211 406.8 1253 222.6 2298 212.2
1914 8192 361.8 1054 187.2 1935 178.7
………................................................................................................................ 1920 11826 100 761 100 1302 100
1921 12960 109.6 824 108.3 1410 108.3
1922 14638 123.8 917 120.5 1569 120.5
1923 16039 135.6 990 130.1 1694 130.1
1924 16290 137.7 991 130.2 1696 130.3
1925 16660 140.9 998 131.1 1709 131.3
1926 18472 156.2 1091 143.4 1868 143.5
1927 18671 157.9 1089 143.1 1864 143.2
1928 18372 155.4 1056 138.8 1808 138.9
1929 19650 166.2 1114 146.4 1907 146.5
1930 19811 167.5 1097 144.2 1896 145.6
1931 20272 171.4 1116 146.6 1910 146.7
1932 18623 157.5 1011 132.9 1730 132.9
1933 18981 160.5 1018 133.8 1742 133.8
1934 19433 164.3 1027 135.0 1759 135.1
1935 21039 177.9 1102 144.8 1887 144.9
1936 21892 185.1 1133 148.9 1940 149.0
1937 22910 193.7 1173 154.1 2008 154.2
1938 22654 191.6 1147 150.7 1963 150.8
1939 23197 196.2 1164 153.0 1991 152.9
1940 15038 127.2 1131 148.6 1938 148.8
1941 15533 131.3 1164 153.0 1962 150.7
1942 14512 122.7 1076 141.4 1826 140.2
1943 16631 140.6 1219 160.2 2086 160.2
1944 12649 107.0 923 121.3 1580 121.4
1945 9863 83.4 627 82.4 1007 77.3
1946 9647 81.6 611 80.3 982 75.4
1947 12352 104.4 777 102.1 1252 96.2
..…….................................................................................................................

23
Years
Gross domestic product
total per capita
per employed
person
million
USD indexes USD indexes1 USD indexes1
1 2 3 4 5 6 7 1950² 21897 100 1342 100 2613 100
1951 28059 128.1 1704 127.0 3265 125.0
1952 27979 127.8 1682 125.3 3230 123.6
1953 31523 144.0 1871 139.4 3511 134.4
1954 32419 148.1 1899 141.5 3544 135.6
1955 40099 183.1 2315 172.5 4282 163.9
1956 34884 159.3 1994 148.6 3672 140.5
1957 41495 189.5 2327 173.4 4407 168.7
1958 38947 177.9 2157 160.7 4111 157.3
1959 43921 200.6 2410 179.6 4629 177.2
1960 48168 220.0 2617 195.0 5050 193.3
1961 52238 238.6 2813 209.6 5479 209.7
1962 54096 247.0 2896 215.8 5647 216.1
1963 58988 269.4 3135 233.6 6142 235.1
1964 64774 295.8 3422 255.0 6720 257.2
1965 70122 320.2 3685 274.6 7241 277.1
1966 78007 356.2 4075 303.7 7971 305.1
1967 85570 390.8 4437 330.6 8683 332.3
1968 91988 420.1 4664 347.5 9320 356.7
1969 97815 446.7 4888 364.2 9885 378.3
1970 107592 491.4 5312 395.8 10842 414.9
1971 115570 527.8 5646 420.7 11627 445.0
1972 130348 595.3 6308 470.0 13072 500.3
1973 146695 669.9 7043 524.8 14638 560.2
1974 148062 676.2 7041 524.7 14703 562.7
1975 151409 691.5 7127 531.1 14915 570.8
1976 168205 768.2 7843 584.4 16447 629.4
1977 178309 814.3 8233 613.5 17372 664.8
1978 194780 889.5 8912 664.1 18929 724.4
1979² 202913 926.7 8957 667.4 19662 752.5
1980 198465 906.4 8939 666.1 19175 733.8
1981 198606 907.0 8885 662.1 19140 732.5
1982 206650 943.7 9194 685.1 19816 758.4
1983 219220 1001.1 9720 724.3 20961 802.2
1984 232237 1060.6 10265 764.9 22117 846.4
1985 232024 1059.6 10211 760.9 21918 838.8
1986 237399 1084.2 10402 775.1 22249 851.5
1987 239415 1093.4 10437 777.7 22335 854.8
1988 238305 1088.3 10337 770.3 22055 844.0
1989 224380 1024.7 9692 722.2 20498 784.5
1990 211813 967.3 9127 680.1 19539 747.8
1991 184409 842.2 7954 592.7 17097 654.3
1992 168096 767.7 7376 549.6 16073 615.1
1993 170599 779.1 7497 558.6 16954 648.8

24
Years
Gross domestic product
total per capita
per employed
person
million USD indexes USD indexes1 USD indexes1
1 2 3 4 5 6 7 1994 177249 809.5 7798 581.1 17705 677.6 1995 189867 867.1 8371 623.8 20011 765.8 1996 197436 901.7 8733 650.7 21051 805.6 1997 185390 846.6 8223 612.7 20546 786.3 1998 176530 806.2 7845 584.6 20031 766.6 1999 174372 796.3 7764 578.5 20709 792.5 2000 177973 812.8 7933 591.1 20625 789.3 2001 187940 858.3 8387 625.0 21948 840.0 2002 197728 903.0 9120 679.6 23740 908.5 2003 208584 952.6 9598 715.2 25124 961.5 2004 226026 1032.2 10429 777.1 27437 1050.0 2005 235458 1075.3 10889 811.4 28064 1074.0 2006 254501 1162.3 11791 878.6 30086 1151.4 2007 271943 1241.9 12627 940.9 31165 1192.7 2008 294901 1346.8 13714 1021.9 33715 1290.3 2009 274078 1251.7 12766 951.3 32586 1247.1 2010 271765 1241.1 12681 944.9 32582 1246.9
Source:
Calculated based on the data from sections B, C, D and the number of inhabitants and employed population.
1 The GDP per capita was kept with the previous base, reflecting faithfully the dynamic of the indicator regardless of the territorial changes that also proportionally modified the number of the population. 2 The modalities of calculating the GDP, as shown in the introduction for the three consecutive periods: 1862-1947, 1950-1979 and 1980-2010 were different; the data of the connection and comparison years seem to be relatively normal, logical, which confirms the accuracy and suitability of the applied methods and techniques. Therefore in the first part of the series, 1862-1947 and in the second part 1950-2010, threshold, 1938 and 1950. The GDP per capita in 1950 was of 1342 USD, a value close to 1938 of 1147 USD. The difference additional to 1938 seems to be acceptable after an interval of 12 years and does not hamper the development and compatibility of the GDP series. The second moment of connection is between the periods 1950-1979 and 1980-2010, calculated based on different methods, when the border between 1979 and 1980 registers a minor difference of the GDP per capita: 1979 – 8957 USD, and the year - 8939 USD PPP 2000. Therefore, the entire series of the GDP 1862-2010 is continuous and comparable, of course with the reserves mentioned in the calculations made during the research. 3 Calculated based on the synthesis tables of sections B2, C2, D2 and total population and employed population
25
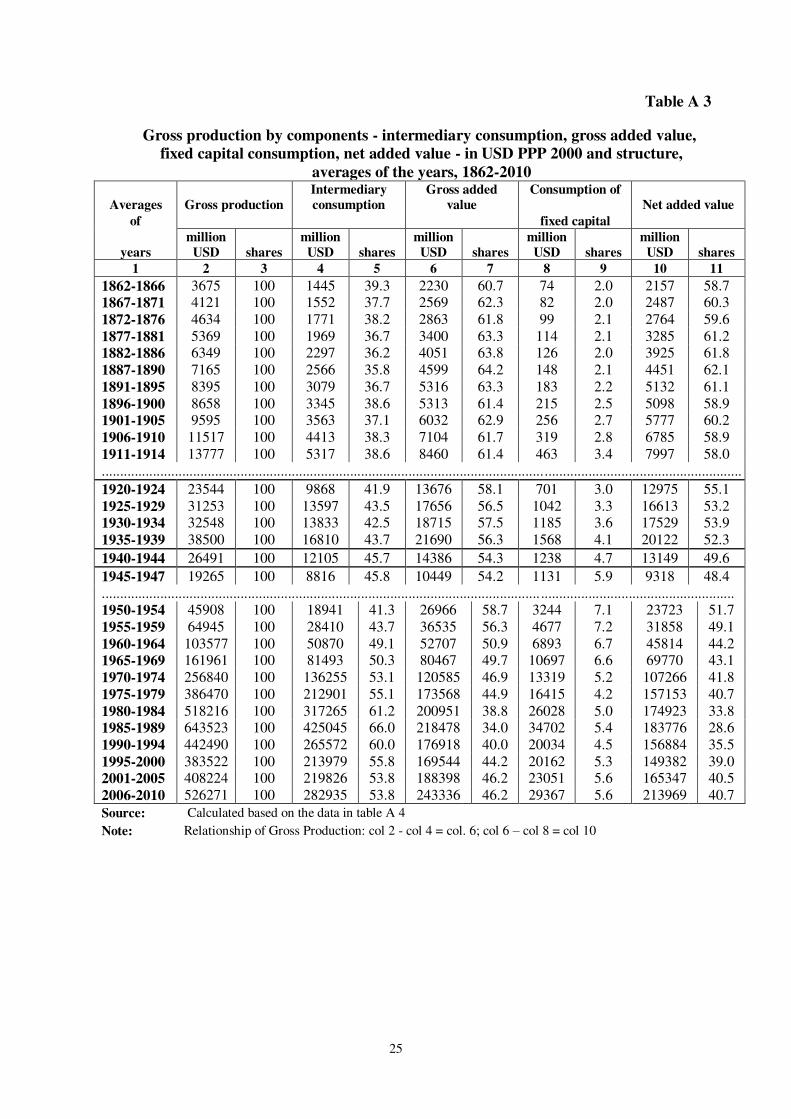
Table A 3
Gross production by components - intermediary consumption, gross added value, fixed capital consumption, net added value - in USD PPP 2000 and structure,
averages of the years, 1862-2010
Averages Gross production Intermediary consumption
Gross added value
Consumption of Net added value
of
fixed capital
years million
USD shares million
USD shares million
USD shares million
USD shares million USD shares
1 2 3 4 5 6 7 8 9 10 11
1862-1866 3675 100 1445 39.3 2230 60.7 74 2.0 2157 58.7 1867-1871 4121 100 1552 37.7 2569 62.3 82 2.0 2487 60.3 1872-1876 4634 100 1771 38.2 2863 61.8 99 2.1 2764 59.6 1877-1881 5369 100 1969 36.7 3400 63.3 114 2.1 3285 61.2 1882-1886 6349 100 2297 36.2 4051 63.8 126 2.0 3925 61.8 1887-1890 7165 100 2566 35.8 4599 64.2 148 2.1 4451 62.1 1891-1895 8395 100 3079 36.7 5316 63.3 183 2.2 5132 61.1 1896-1900 8658 100 3345 38.6 5313 61.4 215 2.5 5098 58.9 1901-1905 9595 100 3563 37.1 6032 62.9 256 2.7 5777 60.2 1906-1910 11517 100 4413 38.3 7104 61.7 319 2.8 6785 58.9 1911-1914 13777 100 5317 38.6 8460 61.4 463 3.4 7997 58.0 ...............................................................................................................................................................................
1920-1924 23544 100 9868 41.9 13676 58.1 701 3.0 12975 55.1 1925-1929 31253 100 13597 43.5 17656 56.5 1042 3.3 16613 53.2 1930-1934 32548 100 13833 42.5 18715 57.5 1185 3.6 17529 53.9 1935-1939 38500 100 16810 43.7 21690 56.3 1568 4.1 20122 52.3
1940-1944 26491 100 12105 45.7 14386 54.3 1238 4.7 13149 49.6
1945-1947 19265 100 8816 45.8 10449 54.2 1131 5.9 9318 48.4 ........................................................................................................................ ..................................................... 1950-1954 45908 100 18941 41.3 26966 58.7 3244 7.1 23723 51.7 1955-1959 64945 100 28410 43.7 36535 56.3 4677 7.2 31858 49.1 1960-1964 103577 100 50870 49.1 52707 50.9 6893 6.7 45814 44.2 1965-1969 161961 100 81493 50.3 80467 49.7 10697 6.6 69770 43.1 1970-1974 256840 100 136255 53.1 120585 46.9 13319 5.2 107266 41.8 1975-1979 386470 100 212901 55.1 173568 44.9 16415 4.2 157153 40.7 1980-1984 518216 100 317265 61.2 200951 38.8 26028 5.0 174923 33.8 1985-1989 643523 100 425045 66.0 218478 34.0 34702 5.4 183776 28.6 1990-1994 442490 100 265572 60.0 176918 40.0 20034 4.5 156884 35.5 1995-2000 383522 100 213979 55.8 169544 44.2 20162 5.3 149382 39.0 2001-2005 408224 100 219826 53.8 188398 46.2 23051 5.6 165347 40.5 2006-2010 526271 100 282935 53.8 243336 46.2 29367 5.6 213969 40.7
Source: Calculated based on the data in table A 4
Note: Relationship of Gross Production: col 2 - col 4 = col. 6; col 6 – col 8 = col 10

26
Table A 4
Gross production by components - intermediary consumption, gross added value, fixed capital consumption, net added value in USD PPP 2000 and structure,
annual series during the period 1862-2010
Years
Total gross Intermediary
consumption
Gross added
value
Consumption
of Net added value
production
fixed capital
million USD
shares million
USD shares
million USD
shares million
USD shares
million USD
shares
1 2 3 4 5 6 7 8 9 10 11
1862 3770 100 1531 40.5 2239 59.5 70 1.9 2169 57.6 1863 3958 100 1508 37.9 2450 62.1 73 1.9 2377 60.2 1864 4128 100 1581 38.2 2547 61.8 74 1.8 2473 60.0 1865 3258 100 1297 39.7 1961 60.3 74 2.3 1887 58.0 1866 3261 100 1306 39.9 1955 60.1 77 2.4 1878 57.7 1867 3913 100 1525 38.8 2388 61.2 78 2.0 2310 59.2 1868 4302 100 1698 39.3 2604 60.7 82 2.0 2522 58.7 1869 4051 100 1485 41.0 2566 59.0 80 2.0 2486 57.0 1870 4106 100 1423 39.0 2683 61.0 84 2.0 2599 59.0 1871 4235 100 1631 38.4 2604 61.6 85 2.0 2519 59.6 1872 4350 100 1759 40.3 2591 59.7 90 2.1 2501 57.6 1873 4426 100 1666 37.5 2760 62.5 95 2.2 2665 60.3 1874 4436 100 1717 38.6 2719 61.4 101 2.3 2618 59.1 1875 5121 100 1948 37.9 3173 62.1 106 2.0 3067 60.1 1876 4835 100 1765 36.4 3070 63.6 102 2.1 2968 61.5 1877 4921 100 1767 35.8 3154 64.2 108 2.2 3046 62.0 1878 5068 100 1827 35.9 3241 64.1 108 2.1 3133 62.0 1879 5261 100 1933 36.6 3328 63.4 116 2.2 3212 61.2 1880 6505 100 2342 35.9 4163 64.1 119 1.8 4044 62.3 1881 5089 100 1977 38.7 3112 61.3 120 2.3 2992 59.0 1882 6462 100 2280 35.2 4182 64.8 121 1.8 4061 63.0
1883 6243 100 2347 37.4 3896 62.6 128 2.0 3768 60.5 1884 5395 100 2023 37.4 3372 62.6 123 2.3 3249 60.3 1885 6431 100 2291 35.5 4140 64.5 126 1.9 4014 62.6 1886 7212 100 2546 35.2 4666 64.8 133 1.8 4533 63.0 1887 6991 100 2616 37.3 4375 62.7 138 2.0 4237 60.7 1888 7144 100 2541 35.4 4603 64.6 142 2.0 4461 62.6 1889 7153 100 2476 34.5 4677 65.5 153 2.1 4524 63.4 1890 7371 100 2631 35.6 4740 64.4 158 2.1 4582 62.3 1891 7823 100 2931 37.3 4892 62.7 174 2.2 4718 60.5 1892 8427 100 3106 36.7 5321 63.3 179 2.2 5142 61.1 1893 8097 100 2965 36.5 5132 63.5 181 2.2 4951 61.3 1894 8662 100 3069 35.3 5593 64.7 188 2.2 5405 62.5 1895 8965 100 3325 36.9 5640 63.1 195 2.2 5445 60.9 1896 9396 100 3555 37.7 5841 62.3 204 2.1 5637 60.2 1897 7872 100 3073 37.9 4799 62.1 199 2.5 4600 59.6 1898 9375 100 3484 37.0 5891 63.0 214 2.3 5677 60.7 1899 7277 100 3112 42.7 4165 57.3 211 2.9 3954 54.4 1900 9372 100 3503 37.2 5869 62.8 245 2.7 5624 60.1 1901 9548 100 3400 35.5 6148 64.5 243 2.5 5905 62.0

27
Years Total gross
production
Intermediary
consumption
Gross added
value
Consumption
of Net added value
fixed capital
million USD
shares million USD
shares million
USD shares
million USD
shares million
USD shares
1 2 3 4 5 6 7 8 9 10 11
1902 9499 100 3493 36.6 6006 63.4 252 2.7 5754 60.7 1903 9989 100 3729 37.2 6260 62.8 265 2.7 5995 60.1 1904 8106 100 3242 39.9 4864 60.1 251 3.0 4613 57.1 1905 10835 100 3952 36.3 6883 63.7 267 2.5 6616 61.2 1906 11906 100 4385 36.7 7521 63.3 290 2.4 7231 60.9 1907 10058 100 3996 39.6 6062 60.4 297 3.0 5765 57.4 1908 10956 100 4284 39.0 6672 61.0 317 2.8 6355 58.2 1909 10962 100 4308 39.2 6654 60.8 333 3.0 6321 57.8 1910 13705 100 5094 37.0 8611 63.0 357 2.7 8254 60.3 1911 13628 100 5071 37.1 8557 62.9 426 3.1 8131 59.8 1912 13948 100 5248 37.5 8700 62.5 456 3.3 8244 59.2 1913 14404 100 5599 38.7 8805 61.3 486 3.4 8319 57.9 1914 13127 100 5351 40.6 7776 59.4 483 3.7 7293 55.7
........................................................................................................................................................................................
1920 19376 100 8073 41.5 11303 58.5 558 2.9 10745 55.6 1921 21584 100 9145 42.3 12439 57.7 635 2.9 11804 54.8 1922 24025 100 10148 42.1 13877 57.9 707 3 13170 54.9 1923 26129 100 10788 41.2 15341 58.8 764 2.9 14577 55.9 1924 26607 100 11185 41.9 15422 58.1 841 3.2 14581 54.9 1925 28175 100 12218 43.2 15957 56.8 893 3.2 15064 53.6 1926 31012 100 13360 42.9 17652 57.1 979 3.2 16673 53.9 1927 31552 100 13557 43.6 17995 56.4 1041 3.3 16954 53.1 1928 31902 100 14206 44.4 17696 55.6 1127 3.5 16569 52.1 1929 33622 100 14643 43.4 18979 56.6 1172 3.5 17807 53.1 1930 32973 100 13855 41.9 19118 58.1 1190 3.6 17928 54.5 1931 33081 100 13473 40.6 19608 59.4 1168 3.5 18440 55.9 1932 30864 100 13048 42.2 17816 57.8 1141 3.6 16675 54.2 1933 32184 100 13931 43.2 18253 56.8 1171 3.6 17082 53.2 1934 33638 100 14859 43.8 18779 56.2 1257 4.0 17522 52.2 1935 36287 100 15831 43.5 20456 56.5 1393 3.8 19063 52.7 1936 37611 100 16381 43.4 21230 56.6 1558 4.2 19672 52.4 1937 39669 100 17368 43.7 22301 56.3 1647 4.1 20654 52.2 1938 39161 100 17202 43.8 21959 56.2 1635 4.2 20324 52.0 1939 39772 100 17266 43.3 22506 56.7 1607 4.0 20899 52.7
1940 26703 100 12201 45.6 14502 54.4 1286 4.8 13216 49.6 1941 27449 100 12507 45.4 14942 54.6 1246 4.6 13696 50.0 1942 26444 100 12399 46.8 14045 53.2 1292 4.9 12753 48.3 1943 29489 100 13420 45.4 16069 54.6 1342 4.5 14727 50.1 1944 22370 100 9997 44.6 12373 55.4 1022 4.5 11351 50.9
1945 18403 100 8774 47.6 9629 52.4 1065 5.7 8564 46.7 1946 17665 100 8155 46.1 9510 53.9 1133 6.4 8377 47.5 1947 21726 100 9518 43.7 12208 56.3 1195 5.5 11013 50.8
........................................................................................................................................................................................
1950 35704 100 14185 42.6 21519 57.4 2536 7.1 18983 50.3 1951 43399 100 16480 40.5 26919 59.5 3111 7.1 23808 52.4 1952 44726 100 18326 43.0 26400 57.0 3338 7.5 23062 49.5 1953 52614 100 22908 44.8 29706 55.2 3535 6.7 26171 48.5 1954 53095 100 22808 44.6 30287 55.4 3698 7.0 26589 48.4

28
Year Total Intermediary
consumption
Gross added
value Consumption of Net added value
gross
production fixed capital
million USD
shares million
USD shares
million USD
shares million USD
shares million USD
shares
1 2 3 4 5 6 7 8 9 10 11
1955 54476 100 18693 36.9 35783 63.1 4019 7.4 31764 55.7
1956 56567 100 25323 46.4 31244 53.6 4530 8.0 26714 45.6
1957 68627 100 31064 46.9 37563 53.1 4900 7.1 32663 46.0
1958 67575 100 31364 48.0 36211 52.0 4967 7.4 31244 44.6
1959 77480 100 35608 48.1 41872 51.9 4967 6.4 36905 45.5
1960 87510 100 41783 49.4 45727 50.6 5719 6.5 40008 44.1
1961 96110 100 46556 49.9 49554 50.1 6238 6.5 43316 43.6
1962 100682 100 49324 50.7 51358 49.3 6947 6.9 44411 42.4
1963 110633 100 54979 50.9 55654 49.1 7539 6.8 48115 42.3
1964 122951 100 61710 51.4 61241 48.6 8022 6.5 53219 42.1
1965 133477 100 67002 51.4 66475 48.6 8774 6.6 57701 42.0
1966 148023 100 74091 51.9 73932 48.1 9600 6.5 64332 41.6
1967 162438 100 81428 52.5 81010 47.5 10972 6.8 70038 40.7
1968 174469 100 87213 52.7 87256 47.3 11713 6.7 75543 40.6
1969 191397 100 97733 53.1 93664 46.9 12426 6.5 81238 40.4
1970 213197 100 111016 53.9 102181 46.1 12726 6.0 89455 40.1
1971 228089 100 118700 54.1 109389 45.9 11915 5.2 97474 40.7
1972 255998 100 135582 54.8 120416 45.2 13092 5.1 107324 40.1
1973 283634 100 151547 55.2 132087 44.8 14066 5.0 118021 39.8
1974 303281 100 164430 55.9 138851 44.1 14794 4.9 124057 39.2
1975 314305 100 170787 56.0 143518 44.0 14997 4.8 128521 39.2
1976 353291 100 192233 56.0 161058 44.0 15693 4.4 145365 39.6
1977 384605 100 208677 56.5 175928 43.5 16477 4.3 159451 39.2
1978 425284 100 232590 57.1 192694 42.9 17105 4.0 175589 38.9
1979 454863 100 260219 57.7 194644 42.3 17804 3.9 176840 38.4
1980 465780 100 270619 58.1 195161 41.9 20687 4.4 174474 37.5
1981 485968 100 292849 59.2 193119 40.8 24586 5.1 168533 35.7
1982 519681 100 325746 60.3 193935 39.7 24964 4.8 168971 34.9
1983 531200 100 326133 58.8 205067 41.2 29764 5.6 175303 35.6
1984 588450 100 370976 60.6 217474 39.4 30140 5.1 187334 34.3
1985 627742 100 411393 63.1 216349 36.9 31503 5.0 184846 31.9
1986 643364 100 423426 63.2 219938 36.8 29863 4.6 190075 32.2
1987 671392 100 445762 64.4 225630 35.6 34418 5.1 191212 30.5
1988 666406 100 441346 64.3 225060 35.7 38303 5.7 186757 30.0
1989 608712 100 403298 63.2 205414 36.8 39425 6.5 165989 30.3
1990 528369 100 329174 62.3 199195 37.7 23260 4.4 175935 33.3
1991 471300 100 294563 62.5 176737 37.5 20251 4.3 156486 33.2
1992 452353 100 280007 61.9 172346 38.1 18459 4.1 153887 34.0
1993 386390 100 221015 57.2 165375 42.8 18735 4.8 146640 38.0
1994 374037 100 203100 54.3 170937 45.7 19465 5.2 151472 40.5
1995 407277 100 226446 55.6 180831 44.4 20851 5.1 159980 39.3
1996 445470 100 257036 57.7 188434 42.3 21682 4.9 166752 37.4
1997 395807 100 224422 56.7 171385 43.3 20358 5.1 151027 38.2
1998 364804 100 203196 55.7 161608 44.3 19386 5.3 142222 39.0
1999 343551 100 187923 54.7 155628 45.3 19149 5.6 136479 39.7
2000 344223 100 184848 53.7 159375 46.3 19544 5.7 139831 40.6

29
Year Total Intermediary consumption
Gross added value Consumption
of Net added
value
gross
production fixed capital
million
USD shares million USD shares
million USD
shares million USD
shares million
USD shares
1 2 3 4 5 6 7 8 9 10 11
2001 364604 100 195459 53.6 169146 46.4 20418 5.6 148728 40.8
2002 384581 100 206626 53.7 177955 46.3 21152 5.5 156803 40.8
2003 403402 100 217762 54.0 185640 46.0 22591 5.6 163049 40.4
2004 442107 100 240766 54.3 201341 45.7 25200 5.9 176141 39.8
2005 446428 100 238518 53.4 207910 46.6 25893 5.8 182017 40.8
2006 484823 100 260098 53.7 224725 46.3 27150 5.5 197575 40.8
2007 512613 100 271944 53.0 240669 47.0 27681 5.5 212988 41.5
2008 564906 100 302145 53.5 262761 46.5 31070 5.5 231691 41.0
2009 534452 100 287778 53.8 246674 46.2 30998 5.8 215676 40.4
2010 534562 100 292711 54.7 241851 45.3 29935 5.7 211916 39.6
Source: Calculated based on the data contained by the synthesis tables of sections B, C, D.
Note: Relationship of Gross Production: col 2 - col 4 = col. 6: col 6 - col 8 = col 10

30
Table A 5
Gross added value in the production of goods and services, in USD PPP 2000,
indexes and structure, averages of the years, 1862-2010
Averages Total gross In the production In the production
of added value of goods of services
years million USD
indexes shares million USD
indexes
shares million USD
indexes shares
1 2 3 4 5 6 7 8 9 10
1862-1866 2230 100 100 1592 100 71.4 638 100 28.6 1867-1871 2569 115.2 100 1877 117.9 75.3 692 108.5 24.7
1872-1876 2863 128.4 100 2101 132.0 73.3 762 119.4 26.7
1877-1881 3400 152.5 100 2388 150.0 69.9 1012 158.6 30.1
1882-1886 4051 181.7 100 2840 178.4 69.9 1211 189.8 30.1
1887-1890 4599 206.2 100 3254 204.4 70.8 1345 210.8 29.2
1891-1895 5316 238.4 100 3671 230.6 69.0 1645 257.8 31.0
1896-1900 5313 238.3 100 3571 224.3 66.6 1742 273.0 33.4
1901-1905 6032 270.5 100 4042 253.9 66.8 1990 311.9 33.2
1906-1910 7104 318.6 100 4635 291.1 65.0 2469 387.0 35.0
1911-1914 8460 379.4 100 5383 338.1 63.6 3077 482.3 36.4
............................................................................................................................................................... 1920-1924 13676 100 100 8682 100 63.5 4994 100 36.5
1925-1929 17656 129.1 100 11140 128.3 63.3 6516 130.5 36.7
1930-1934 18715 136.8 100 11819 136.1 63.2 6896 138.1 36.8
1935-1939 21690 158.6 100 13991 161.1 64.5 7699 154.2 35.5
1940-1944 14386 105.2 100 9085 104.6 63.3 5301 106.1 36.7
1945-1947* 10449 76.4 100 7371 84.9 70.3 3078 61.6 29.7
............................................................................................................................................................... 1950-1954 26966 100 100 19610 100 72.6 7376 100 27.4
1955-1959 36535 135.5 100 26686 136.1 72.9 9849 133.5 27.1
1960-1964 52707 195.5 100 39322 200.5 74.6 13385 181.5 25.4
1965-1969 80467 298.4 100 60427 308.1 75.0 20040 271.7 25.0
1970-1974 120585 447.2 100 92571 472.1 76.7 28014 379.8 23.3
1975-1979 173568 643.7 100 132481 675.6 75.3 43087 584.2 24.7
1980-1984 200951 745.2 100 144399 736.4 71.8 56552 766.7 28.2
1985-1989 218478 810.2 100 157690 804.1 72.2 60788 824.1 27.8
1990-1994 176918 656.1 100 112637 574.4 63.4 64281 871.5 36.6
1995-2000 169544 628.7 100 93400 476.3 54.7 76144 1032.3 45.3 2001-2005 188398 698.7 100 91574 467.0 48.6 96825 1312.7 51.4 2006-2010 243336 902.4 100 112583 574.1 46.3 130753 1772.7 53.7
Source: Calculated based on the data in Table A6
Note: * Base = 100 in the period 1950-1954

31
Table A 6 Gross added value in the production of goods and services, in USD PPP 2000
and structure, annual series, during the period 1862-2010
Years Total gross In the production In the production
added value of goods of services
million USD shares
million USD shares
million USD shares
1 2 3 4 5 6 7
1862 2239 100 1632 72.9 607 27.1
1863 2450 100 1818 74.2 632 25.8
1864 2547 100 1850 72.6 697 27.4
1865 1961 100 1324 67.5 637 32.5
1866 1955 100 1334 68.2 621 31.8
1867 2388 100 1773 74.2 615 25.8
1868 2604 100 1881 72.2 723 27.8
1869 2566 100 1871 72.9 695 27.1
1870 2683 100 1976 73.6 707 26.4
1871 2604 100 1886 72.4 718 27.6
1872 2591 100 1870 72.2 721 27.8
1873 2760 100 2021 73.2 739 26.8
1874 2719 100 1983 72.9 736 27.1
1875 3173 100 2419 76.2 754 23.8
1876 3070 100 2210 72.0 860 28.0
1877 3154 100 2187 69.3 967 30.7
1878 3241 100 2217 68.4 1024 31.6
1879 3328 100 2338 70.3 990 29.7
1880 4163 100 3131 75.2 1032 24.8
1881 3112 100 2067 66.4 1045 33.6
1882 4182 100 3058 73.1 1124 26.9
1883 3896 100 2683 68.9 1213 31.1
1884 3372 100 2225 66.0 1147 34.0
1885 4140 100 2880 69.6 1260 30.4
1886 4666 100 3356 71.9 1310 28.1
1887 4375 100 3036 69.4 1339 30.6
1888 4603 100 3332 72.4 1271 27.6
1889 4677 100 3328 71.2 1349 28.8
1890 4740 100 3320 70.0 1420 30.0
1891 4892 100 3315 67.8 1577 32.2
1892 5321 100 3744 70.4 1577 29.6
1893 5132 100 3437 67.0 1695 33.0
1894 5593 100 3888 69.5 1705 30.5
1895 5640 100 3972 70.4 1668 29.6
1896 5841 100 4052 69.4 1789 30.6
1897 4799 100 3155 65.7 1644 34.3
1898 5891 100 4018 68.2 1873 31.8
1899 4165 100 2535 60.9 1630 39.1
1900 5869 100 4096 69.8 1773 30.2
1901 6148 100 4225 68.7 1923 31.3

32
Years Total gross In the production In the production
added value of goods of services
million USD shares million USD shares million
USD shares
1 2 3 4 5 6 7
1902 6006 100 4055 67.5 1951 32.5
1903 6260 100 4277 68.3 1983 31.7
1904 4864 100 3010 61.9 1854 38.1
1905 6883 100 4645 67.5 2238 32.5
1906 7521 100 5135 68.3 2386 31.7
1907 6062 100 3772 62.2 2290 37.8
1908 6672 100 4317 64.7 2355 35.3
1909 6654 100 4181 62.8 2473 37.2
1910 8611 100 5771 67.0 2840 33.0
1911 8557 100 5468 63.9 3089 36.1
1912 8700 100 5562 63.9 3138 36.1
1913 8805 100 5672 64.4 3133 35.6
1914 7776 100 4831 62.1 2945 37.9
………………........................................................................................................................................................ 1920 11303 100 7314 64.7 3989 35.3
1921 12439 100 7634 61.4 4805 38.6
1922 13877 100 8978 64.7 4899 35.3
1923 15341 100 9863 64.3 5478 35.7
1924 15422 100 9620 62.4 5802 37.6
1925 15957 100 10311 64.6 5646 35.4
1926 17652 100 11278 63.9 6374 36.1
1927 17995 100 10956 60.9 7039 39.1
1928 17696 100 11039 62.4 6657 37.6
1929 18979 100 12116 63.8 6863 36.2
1930 19118 100 11859 62.0 7259 38.0
1931 19608 100 12250 62.5 7358 37.5
1932 17816 100 11186 62.8 6630 37.2
1933 18253 100 11812 64.7 6441 35.3
1934 18779 100 11988 63.8 6791 36.2
1935 20456 100 13119 64.1 7337 35.9
1936 21230 100 13594 64.0 7636 36.0
1937 22301 100 14264 64.0 8037 36.0
1938 21959 100 14280 65.0 7679 35.0
1939 22506 100 14699 65.3 7807 34.7
1940 14502 100 9147 63.1 5355 36.9
1941 14942 100 9231 61.8 5711 38.2
1942 14045 100 8389 59.7 5656 40.3
1943 16069 100 10237 63.7 5832 36.3
1944 12373 100 8420 68.1 3953 31.9
1945 9629 100 6685 69.4 2944 30.6
1946 9510 100 6534 68.7 2976 31.3
1947 12208 100 8894 72.9 3314 27.1
……………….......................................................................................................................................................... 1950 21519 100 15608 72.5 5911 27.5
1951 26919 100 19457 72.3 7462 27.7
1952 26400 100 19136 72.5 7264 27.5
1953 29706 100 21867 73.6 7839 26.4
1954 30287 100 21980 72.6 8307 27.4

33
Years Total gross In the production In the production
added value of goods of services
million USD shares million USD shares
million USD shares
1 2 3 4 5 6 7
1955 35783 100 26362 73.7 9421 26.3
1956 31243 100 22093 70.7 9150 29.3
1957 37564 100 27469 73.1 10095 26.9
1958 36211 100 26323 72.7 9888 27.3
1959 41873 100 31184 74.5 10689 25.5
1960 45727 100 34363 75.1 11364 24.9
1961 49553 100 37186 75.0 12367 25.0
1962 51358 100 38367 74.7 12991 25.3
1963 55654 100 41345 74.3 14309 25.7
1964 61241 100 45349 74.1 15892 25.9
1965 66475 100 49406 74.3 17069 25.7
1966 73932 100 55450 75.0 18482 25.0
1967 81010 100 60622 74.8 20388 25.2
1968 87256 100 65660 75.2 21596 24.8
1969 93664 100 70998 75.8 22666 24.2
1970 102181 100 77934 76.3 24247 23.7
1971 109389 100 83507 76.3 25882 23.7
1972 120416 100 92848 77.1 27568 22.9
1973 132087 100 102318 77.5 29769 22.5
1974 138851 100 106247 76.5 32604 23.5
1975 143518 100 108985 75.9 34533 24.1
1976 161058 100 122714 76.2 38344 23.8
1977 175928 100 132880 75.5 43048 24.5
1978 192693 100 144283 74.9 48410 25.1
1979 194644 100 153543 73.7 51101 26.3
1980 195161 100 139882 71.7 55279 28.3
1981 193119 100 135818 70.3 57301 29.7
1982 193935 100 140912 72.7 53023 27.3
1983 205067 100 147727 72.0 57340 28.0
1984 217474 100 157657 72.5 59817 27.5
1985 216349 100 156586 72.4 59763 27.6
1986 219938 100 160925 73.2 59013 26.8
1987 225630 100 161096 71.4 64534 28.6
1988 225060 100 161777 71.9 63283 28.1
1989 205414 100 148068 72.1 57346 27.9
1990 199195 100 143158 71.9 56037 28.1
1991 176737 100 112670 63.8 64067 36.2
1992 172346 100 104213 60.5 68133 39.5
1993 165375 100 99804 60.3 65571 39.7
1994 170937 100 103341 60.5 67596 39.5
1995 180831 100 112403 62.2 68428 37.8
1996 188434 100 116096 61.6 72338 38.4
1997 171385 100 100129 58.4 71256 41.6
1998 161608 100 83360 51.6 78248 48.4
1999 155628 100 75029 48.2 80599 51.8
2000 159375 100 73380 46.0 85995 54.0

34
Total gross In the production In the production
Years added value of goods of services
million USD shares million USD shares
million USD shares
1 2 3 4 5 6 7
2001 169146 100 83552 49.4 85594 50.6
2002 177955 100 85942 48.3 92013 51.7
2003 185660 100 90370 48.7 95290 51.3
2004 201341 100 100076 49.7 101265 50.3
2005 207910 100 97929 47.1 109981 52.9
2006 224725 100 106377 47.3 118348 52.7
2007 240669 100 104413 43.4 136257 56.6
2008 262757 100 120514 45.9 142243 54.1
2009 246671 100 113527 46.0 133144 54.0
2010 241851 100 118084 48.8 123767 51.2
Source: Calculated based on the data in Tables A 10 and A 16

35
Table A 7
Gross added value in the production of goods and services, in USD PPP 2000 , per capita and structure, averages of the years,
during the period 1862-2010
Averages Gross In the production In the production
of added value of goods of services
years USD shares USD shares USD shares
1 2 3 4 5 6 7
1862-1866 547 100.0 390 71.3 157 28.7
1867-1871 605 100.0 442 73.1 163 26.9
1872-1876 653 100.0 479 73.4 174 26.6
1877-1881 750 100.0 527 70.3 223 29.7
1882-1886 832 100.0 583 70.1 249 29.9
1887-1890 881 100.0 624 70.8 257 29.2
1891-1895 967 100.0 668 69.1 299 30.9
1896-1900 908 100.0 609 67.1 299 32.9
1901-1905 956 100.0 641 67.1 315 32.9
1906-1910 1048 100.0 684 65.3 364 34.7
1911-1914 1152 100.0 733 63.6 419 36.4
............................................................................................................................. .....................
1920-1924 862 100.0 547 63.5 315 36.5
1925-1929 1037 100.0 654 63.1 383 36.9
1930-1934 1017 100.0 642 63.1 375 36.9
1935-1939 1111 100.0 716 64.4 395 35.6
1940-1944 1066 100.0 673 63.1 393 36.9
1945-1947 661 100.0 466 70.5 195 29.5
............................................................................................................................. ..................
1950-1954 1617 100.0 1175 72.7 442 27.3
1955-1959 2052 100.0 1499 73.1 553 26.9
1960-1964 2820 100.0 2104 74.6 716 25.4
1965-1969 4133 100.0 3103 75.1 1030 24.9
1970-1974 5832 100.0 4477 76.8 1355 23.2
1975-1979 8007 100.0 6020 75.2 1987 24.8
1980-1984 8953 100.0 6433 71.9 2520 28.1
1985-1989 9526 100.0 6876 72.2 2650 27.8
1990-1994 7711 100.0 4907 63.6 2804 36.4
1995-2000 7521 100.0 4141 55.1 3380 44.9
2001-2005 8635 100.0 4196 48.6 4439 51.4
2006-2010 11314 100.0 5235 46.3 6079 53.7
Sources: Calculated based on the data in table A 8

36
Table A 8
Gross added value in the production of goods and services, in USD PPP 2000, per capita and structure, annual series,
during the period 1862-2010
Total added value In the production In the production
Years per capita of goods of services
USD shares USD shares USD shares
1 2 3 4 5 6 7
1862 557 100 406 72.9 151 27.1
1863 606 100 450 74.3 156 25.7
1864 622 100 452 72.7 170 27.3
1865 474 100 320 67.5 154 32.5
1866 475 100 324 68.2 151 31.8
1867 575 100 427 74.3 148 25.7
1868 620 100 448 72.3 172 27.7
1869 604 100 440 72.8 164 27.2
1870 625 100 460 73.6 165 26.4
1871 601 100 435 72.4 166 27.6
1872 596 100 430 72.1 166 27.9
1873 633 100 464 73.3 169 26.7
1874 623 100 455 73.0 168 27.0
1875 721 100 550 76.3 171 23.7
1876 690 100 497 72.0 193 28.0
1877 704 100 488 69.3 216 30.7
1878 723 100 494 68.3 229 31.7
1879 735 100 516 70.2 219 29.8
1880 916 100 689 75.2 227 24.8
1881 673 100 447 66.4 226 33.6
1882 892 100 652 73.1 240 26.9
1883 816 100 562 68.9 254 31.1
1884 693 100 458 66.1 235 33.9
1885 835 100 581 69.6 254 30.4
1886 925 100 665 71.9 260 28.1
1887 856 100 594 69.4 262 30.6
1888 889 100 644 72.4 245 27.6
1889 890 100 633 71.1 257 28.9
1890 891 100 624 70.0 267 30.0
1891 907 100 615 67.8 292 32.2
1892 981 100 690 70.3 291 29.7
1893 936 100 627 67.0 309 33.0
1894 1009 100 701 69.5 308 30.5
1895 1001 100 705 70.4 296 29.6
1896 1023 100 710 69.4 313 30.6
1897 842 100 544 64.6 298 35.4
1898 1005 100 685 68.2 320 31.8
1899 699 100 425 60.8 274 39.2
1900 971 100 678 69.8 293 30.2
1901 1003 100 690 68.8 313 31.2

37
Total added value In the production In the production
Years per capita of goods of services
USD shares USD shares USD shares
1 2 3 4 5 6 7
1902 970 100 655 67.5 315 32.5
1903 995 100 680 68.3 315 31.7
1904 750 100 464 61.9 286 38.1
1905 1062 100 717 67.5 345 32.5
1906 1142 100 780 68.3 362 31.7
1907 907 100 564 62.2 343 37.8
1908 986 100 638 64.7 348 35.3
1909 969 100 609 62.8 360 37.2
1910 1236 100 828 67.0 408 33.0
1911 1207 100 772 64.0 435 36.0
1912 1203 100 769 63.9 434 36.1
1913 1197 100 771 64.4 426 35.6
1914 1000 100 622 62.2 378 37.8
..................................................................................................................................................
1920 734 100 475 64.7 259 35.3
1921 798 100 490 61.4 308 38.6
1922 876 100 567 64.7 309 35.3
1923 955 100 614 64.3 341 35.7
1924 946 100 590 62.4 356 37.6
1925 964 100 623 64.6 341 35.4
1926 1052 100 672 63.9 380 36.1
1927 1058 100 644 60.9 414 39.1
1928 1026 100 640 62.4 386 37.6
1929 1085 100 693 63.9 392 36.1
1930 1068 100 662 62.0 406 38.0
1931 1079 100 674 62.5 405 37.5
1932 967 100 607 62.8 360 37.2
1933 979 100 633 64.7 346 35.3
1934 993 100 634 63.8 359 36.2
1935 1072 100 687 64.1 385 35.9
1936 1099 100 704 64.1 395 35.9
1937 1142 100 730 63.9 412 36.1
1938 1112 100 723 65.0 389 35.0
1939 1129 100 737 65.3 392 34.7
1940 1091 100 688 63.1 403 36.9
1941 1120 100 692 61.8 428 38.2
1942 1041 100 622 59.8 419 40.2
1943 1177 100 750 63.7 427 36.3
1944 903 100 615 68.1 288 31.9
1945 612 100 425 69.4 187 30.6
1946 602 100 414 68.8 188 31.2
1947 768 100 560 72.9 208 27.1
.................................................................................................................................................... 1950 1319 100 957 72.6 362 27.4
1951 1635 100 1182 72.3 453 27.7
1952 1587 100 1151 72.5 436 27.5
1953 1763 100 1298 73.6 465 26.4
1954 1774 100 1288 72.6 486 27.4

38
Total added value In the production In the production
Years per capita of goods of services
USD shares USD shares USD shares
1 2 3 4 5 6 7
1955 2065 100 1522 73.7 543 26.3
1956 1786 100 1263 70.7 523 29.3
1957 2107 100 1541 73.1 567 26.9
1958 2005 100 1458 72.7 549 27.4
1959 2297 100 1711 74.5 586 25.5
1960 2485 100 1867 75.1 618 24.9
1961 2669 100 2003 75.0 666 25.0
1962 2749 100 2054 74.7 695 25.3
1963 2958 100 2198 74.3 760 25.7
1964 3236 100 2396 74.0 840 26.0
1965 3494 100 2597 74.3 897 25.7
1966 3862 100 2897 75.0 965 25.0
1967 4201 100 3143 74.8 1058 25.2
1968 4425 100 3329 75.2 1096 24.8
1969 4681 100 3548 75.8 1133 24.2
1970 5045 100 3848 76.3 1197 23.7
1971 5344 100 4079 76.3 1265 23.7
1972 5828 100 4493 77.1 1335 22.9
1973 6342 100 4913 77.5 1429 22.5
1974 6603 100 5052 76.5 1551 23.5
1975 6755 100 5130 75.9 1625 24.1
1976 7510 100 5722 76.2 1788 23.8
1977 8123 100 6135 75.5 1988 24.5
1978 8817 100 6602 74.9 2215 25.1
1979 8828 100 6510 73.7 2318 26.3
1980 8791 100 6301 71.7 2490 28.3
1981 8640 100 6076 70.3 2564 29.7
1982 8628 100 6269 72.7 2359 27.3
1983 9093 100 6550 72.0 2543 28.0
1984 9613 100 6969 72.5 2644 27.5
1985 9521 100 6891 72.4 2630 27.6
1986 9637 100 7051 73.2 2586 26.8
1987 9836 100 7022 71.4 2814 28.6
1988 9763 100 7018 71.9 2745 28.1
1989 8873 100 6396 72.1 2477 27.9
1990 8583 100 6169 71.9 2414 28.1
1991 7623 100 4860 63.8 2763 36.2
1992 7563 100 4573 60.5 2990 39.5
1993 7268 100 4386 60.3 2882 39.7
1994 7520 100 4546 60.5 2974 39.5
1995 7973 100 4956 62.2 3017 37.8
1996 8335 100 5135 61.6 3200 38.4
1997 7602 100 4441 58.4 3161 41.6
1998 7182 100 3704 51.6 3478 48.4
1999 6930 100 3341 48.2 3589 51.8
2000 7104 100 3271 46.0 3833 54.0

39
Total added value In the production In the production
Years per capita of goods of services
USD shares USD shares USD shares
1 2 3 4 5 6 7
2001 7548 100 3729 49.4 3820 50.6 2002 8208 100 3964 48.3 4244 51.7
2003 8543 100 4158 48.7 4384 51.3
2004 9290 100 4618 49.7 4672 50.3
2005 9615 100 4529 47.1 5086 52.9
2006 10412 100 4929 47.3 5483 52.7
2007 11175 100 4848 43.4 6327 56.6
2008 12219 100 5604 45.9 6615 54.1
2009 11490 100 5288 46.0 6202 54.0
2010 11285 100 5510 48.8 5775 51.2
Source: Calculated based on the data in Table A 5 and the population of the country.

40
Table A 9
Gross added value in the production of goods, by branches - resources in
USD PPP 2000, and structure, averages of the years, period 1862-2010
Averages Total production Agriculture Industry Constructions
of of goods
years million USD shares
million USD shares
million USD shares
million USD shares
1 2 3 4 5 6 7 8 9
1862-1866 1592 100 1190 74.7 355 22.3 47 3.0 1867-1871 1877 100 1425 75.9 371 19.8 81 4.3 1872-1876 2101 100 1520 72.3 461 21.9 120 5.7 1877-1881 2388 100 1732 72.5 553 23.2 103 4.3 1882-1886 2840 100 2062 72.6 612 21.5 166 5.8 1887-1890 3254 100 2258 69.4 754 23.2 242 7.4 1891-1895 3671 100 2514 68.5 936 25.5 221 6.0 1896-1900 3571 100 2272 63.6 1014 28.4 285 8.0 1901-1905 4042 100 2730 67.5 1046 25.9 266 6.6 1906-1910 4635 100 2751 59.4 1487 32.1 397 8.6 1911-1914 5383 100 3024 56.2 1895 35.2 464 8.6
......................................................................................................................................................................................... ........
1920-1924 8682 100 5442 62.7 2379 27.4 861 9.9 1925-1929 11140 100 6361 57.1 3595 32.3 1184 10.6 1930-1934 11819 100 6686 56.6 3956 33.5 1177 10.0 1935-1939 13991 100 7376 52.7 5113 36.5 1502 10.7
1940-1944 9085 100 4044 44.5 3939 43.4 1102 12.1
1945-1947 7371 100 2950 40.0 3439 46.7 982 13.3
.................................................................................................................................................................................................. 1950-1954 19610 100 9762 49.8 8618 43.9 1230 6.3 1955-1959 26686 100 11880 44.5 12547 47.0 2259 8.5 1960-1964 39322 100 13831 35.2 21642 55.0 3849 9.8 1965-1969 60427 100 16657 27.6 37881 62.7 5889 9.7 1970-1974 92571 100 18726 20.2 64346 69.5 9499 10.3 1975-1979 132481 100 23612 17.8 94748 71.5 14121 10.7 1980-1984 144399 100 32316 22.4 98166 68.0 13917 9.6 1985-1989 157690 100 33105 21.0 109355 69.3 15230 9.7 1990-1994 112637 100 36822 32.7 66405 59.0 9410 8.4 1995-2000 93400 100 29520 31.6 53655 57.4 10225 10.9 2001-2005 91574 100 25733 28.1 54207 59.2 11634 12.7
2006-2010 112583 100 22783 20.2 66578 59.1 23222 20.6
Source: Calculated based on the data in Table A 10

41
Table A 10
Gross added value in the production of goods, by branches in
USD PPP 2000 and structure, annual series, period 1862-2010
Total production Agriculture Industry Constructions
Years of goods
million
USD shares
million
USD shares
million
USD shares
million
USD shares
1 2 3 4 5 6 7 8 9 1862 1635 100 1223 74.8 369 22.6 43 2.6
1863 1819 100 1449 79.7 327 18.0 43 2.4
1864 1849 100 1485 80.3 317 17.1 47 2.5
1865 1323 100 922 69.7 351 26.5 50 3.8
1866 1335 100 872 65.3 411 30.8 52 3.9
1867 1771 100 1360 76.8 359 20.3 52 2.9
1868 1880 100 1417 75.4 409 21.8 54 2.9
1869 1871 100 1383 73.9 359 19.2 129 6.9
1870 1976 100 1506 76.2 382 19.3 88 4.5
1871 1886 100 1459 77.4 348 18.5 79 4.2
1872 1871 100 1305 69.7 427 22.8 139 7.4
1873 2020 100 1464 72.5 419 20.7 137 6.8
1874 1981 100 1388 70.1 516 26.0 77 3.9
1875 2421 100 1774 73.3 498 20.6 149 6.2
1876 2210 100 1669 75.5 443 20.0 98 4.4
1877 2187 100 1598 73.1 490 22.4 99 4.5
1878 2218 100 1650 74.4 461 20.8 107 4.8
1879 2339 100 1640 70.1 605 25.9 94 4.0
1880 3129 100 2410 77.0 616 19.7 103 3.3
1881 2068 100 1360 65.8 592 28.6 116 5.6
1882 3056 100 2373 77.7 537 17.6 146 4.8
1883 2682 100 1873 69.8 647 24.1 162 6.0
1884 2224 100 1483 66.7 595 26.8 146 6.6
1885 2881 100 2098 72.8 610 21.2 173 6.0
1886 3356 100 2481 73.9 673 20.1 202 6.0
1887 3036 100 2036 67.1 637 21.0 363 12.0
1888 3331 100 2366 71.0 747 22.4 218 6.5
1889 3328 100 2342 70.4 812 24.4 174 5.2
1890 3322 100 2287 68.8 820 24.7 215 6.5
1891 3315 100 2172 65.5 885 26.7 258 7.8
1892 3743 100 2614 69.8 925 24.7 204 5.5
1893 3437 100 2400 69.8 849 24.7 188 5.5
1894 3888 100 2690 69.2 988 25.4 210 5.4
1895 3972 100 2693 67.8 1035 26.1 244 6.1
1896 4053 100 2654 65.5 1092 26.9 307 7.6
1897 3156 100 2028 64.3 885 28.0 243 7.7
1898 4016 100 2664 66.3 1019 25.4 333 8.3
1899 2533 100 1260 49.7 985 38.9 288 11.4
1900 4096 100 2756 67.3 1090 26.6 250 6.1
1901 4226 100 3078 72.8 893 21.1 255 6.0
1902 4054 100 2803 69.1 993 24.5 258 6.4

42
Total production Agriculture Industry Constructions
Years of goods
million
USD shares
million
USD shares
million
USD shares
million
USD shares
1 2 3 4 5 6 7 8 9 1903 4275 100 2945 68.9 1061 24.8 269 6.3
1904 3010 100 1677 55.7 1071 35.6 262 8.7
1905 4645 100 3149 67.8 1210 26.0 286 6.2
1906 5135 100 3453 67.2 1318 25.7 364 7.1
1907 3770 100 1960 52.0 1404 37.2 406 10.8
1908 4317 100 2371 54.9 1574 36.5 372 8.6
1909 4181 100 2332 55.8 1504 36.0 345 8.3
1910 5771 100 3641 63.1 1635 28.3 495 8.6
1911 5467 100 3293 60.2 1771 32.4 403 7.4
1912 5562 100 3110 55.9 1988 35.7 464 8.3
1913 5672 100 3227 56.9 1944 34.3 501 8.8
1914 4831 100 2468 51.1 1878 38.9 485 10.0 ...................................................................................................................................................................................
.........
1920 7317 100 4854 66.3 1719 23.5 744 10.2
1921 7631 100 4818 63.1 2004 26.3 809 10.6
1922 8978 100 5714 63.6 2352 26.2 912 10.2
1923 9863 100 6217 63.0 2735 27.7 911 9.2
1924 9620 100 5606 58.3 3083 32.0 931 9.7
1925 10311 100 5960 57.8 3277 31.8 1074 10.4
1926 11280 100 6767 60.0 3364 29.8 1149 10.2
1927 10956 100 6023 55.0 3660 33.4 1273 11.6
1928 11039 100 5879 53.3 3948 35.8 1212 11.0
1929 12119 100 7178 59.2 3728 30.8 1213 10.0
1930 11859 100 7002 59.0 3809 32.1 1048 8.8
1931 12250 100 7278 59.4 3775 30.8 1197 9.8
1932 11183 100 6319 56.5 3728 33.3 1136 10.2
1933 11812 100 6662 56.4 3945 33.4 1205 10.2
1934 11988 100 6172 51.5 4524 37.7 1292 10.8
1935 13122 100 6908 52.6 4789 36.5 1425 10.9
1936 13594 100 7241 53.3 4891 36.0 1462 10.8
1937 14264 100 7270 51.0 5292 37.1 1702 11.9
1938 14280 100 7521 52.7 5323 37.3 1436 10.1
1939 14699 100 7940 54.0 5271 35.9 1488 10.1
1940 9148 100 4176 45.6 4037 44.1 935 10.2
1941 9232 100 4155 45.0 4003 43.4 1074 11.6
1942 8388 100 3280 39.1 4021 47.9 1087 13.0
1943 10238 100 4556 44.5 4362 42.6 1320 12.9
1944 8422 100 4053 48.1 3272 38.9 1097 13.0
1945 6685 100 2360 35.3 3416 51.1 909 13.6
1946 6534 100 2266 34.7 3309 50.6 959 14.7
1947 8894 100 4223 47.5 3592 40.4 1079 12.1
............................................................................................................................................................................................
1950 15608 100 8171 52.4 6594 42.2 843 5.4
1951 19457 100 10224 52.5 8111 41.7 1122 5.8
1952 19136 100 9194 48.0 8630 45.1 1312 6.9 1953 21867 100 10771 49.3 9490 43.4 1606 7.3
1954 21980 100 10450 47.5 10263 46.7 1267 5.8
1955 26362 100 13237 50.2 11389 43.2 1736 6.6
1956 22093 100 8894 40.3 11082 50.2 2117 9.6
1957 27469 100 12965 47.2 12260 44.6 2244 8.2

43
Total production Agriculture Industry Constructions
Years of goods
million USD
shares million USD
shares million USD
shares million USD
shares
1 2 3 4 5 6 7 8 9
1958 26323 100 10514 39.9 13385 50.8 2424 9.2
1959 31184 100 13788 44.2 14620 46.9 2776 8.9
1960 34363 100 13957 40.6 17058 49.6 3348 9.7
1961 37186 100 14447 38.9 19080 51.3 3659 9.8
1962 38367 100 12955 33.8 21539 56.1 3873 10.1
1963 41345 100 13601 32.9 23733 57.4 4011 9.7
1964 45349 100 14193 31.3 26799 59.1 4357 9.6
1965 49407 100 14504 29.4 30295 61.3 4608 9.3
1966 55450 100 16578 29.9 33693 60.8 5179 9.3
1967 60622 100 16599 27.4 38068 62.8 5955 9.8
1968 65660 100 17848 27.2 41130 62.6 6682 10.2
1969 70998 100 17757 25.0 46221 65.1 7020 9.9
1970 77934 100 15322 19.7 53877 69.1 8735 11.2
1971 83507 100 18905 22.6 55858 66.9 8744 10.5
1972 92849 100 20696 22.3 62296 67.1 9857 10.6
1973 102318 100 19997 19.5 72155 70.5 10166 9.9
1974 106247 100 18708 17.6 77545 73.0 9994 9.4
1975 108985 100 18806 17.3 82411 75.6 7768 7.1
1976 122714 100 24819 20.2 86139 70.2 11756 9.6
1977 132880 100 23508 17.7 93685 70.5 15687 11.8
1978 144283 100 25765 17.9 101625 70.4 16893 11.7
1979 153543 100 25160 16.4 109878 71.6 18505 12.1
1980 139882 100 26550 19.0 98869 70.7 14463 10.3
1981 135819 100 30534 22.5 91801 67.6 13484 9.9
1982 140912 100 37343 26.5 90778 64.4 12791 9.1
1983 147727 100 32609 22.1 101111 68.4 14007 9.5
1988 157658 100 34545 21.9 108274 68.7 14839 9.4
1985 156586 100 34514 22.0 106553 68.0 15519 9.9
1986 160925 100 32706 20.3 112102 69.7 16117 10.0
1987 161096 100 32028 19.9 112576 69.9 16492 10.2
1988 161777 100 34021 21.0 112054 69.3 15702 9.7
1989 148068 100 32257 21.8 103491 69.9 12320 8.3
1990 143159 100 46098 32.2 85641 59.8 11420 8.0
1991 112670 100 34795 30.9 69775 61.9 8100 7.2
1992 104213 100 31885 30.6 64273 61.7 8055 7.7
1993 99804 100 35766 35.8 55182 55.3 8856 8.9
1994 103341 100 35568 34.4 57156 55.3 10617 10.3
1995 112404 100 37531 33.4 62362 55.5 12511 11.1
1996 116096 100 37845 32.6 65439 56.4 12812 11.0
1997 100128 100 33314 33.3 57190 57.1 9624 9.6
1998 83360 100 25554 30.7 48994 58.8 8812 10.6
1999 75029 100 23153 30.9 43172 57.5 8704 11.6

44
Total production Agriculture Industry Constructions
Years goods
million
USD shares
million
USD shares
million
USD shares
million
USD shares
1 2 3 4 5 6 7 8 9 2000 73380 100 19722 26.9 44775 61.0 8883 12.1
2001 83552 100 25284 30.3 48470 58.0 9798 11.7
2002 85942 100 23824 27.7 51379 59.8 10740 12.5
2003 90370 100 25106 27.8 53885 59.6 11379 12.6
2004 100076 100 29780 29.8 57868 57.8 12427 12.4
2005 97929 100 24672 25.2 59435 60.7 13822 14.1
2006 106377 100 25501 24.0 63910 60.1 16967 15.9
2007 104413 100 18677 17.9 63910 61.2 21826 20.9
2008 120514 100 23903 19.8 67804 56.3 28808 23.9
2009 113527 100 21813 19.2 67088 59.1 24627 21.7
2010 118084 100 24021 20.3 70176 59.4 23887 20.2
Source: Calculated based on the data from the tables of sections B, C, D.
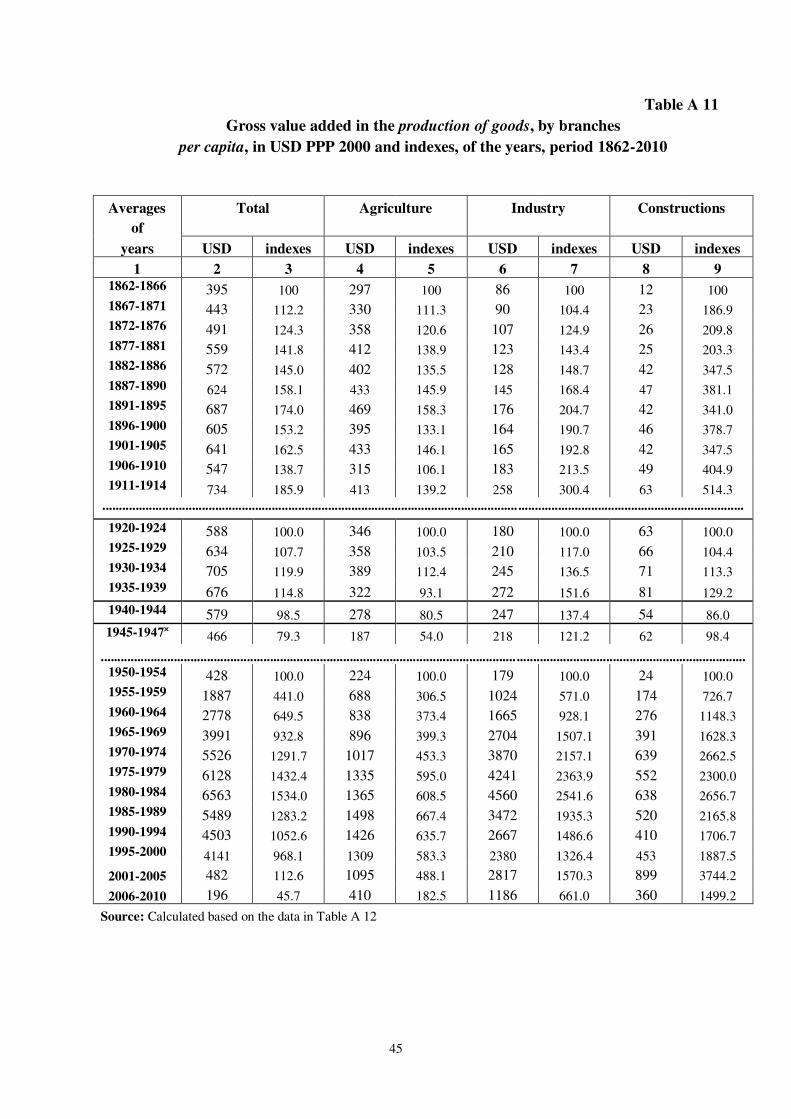
45
Table A 11
Gross value added in the production of goods, by branches
per capita, in USD PPP 2000 and indexes, of the years, period 1862-2010
Averages Total Agriculture Industry Constructions
of
years USD indexes USD indexes USD indexes USD indexes
1 2 3 4 5 6 7 8 9 1862-1866 395 100 297 100 86 100 12 100 1867-1871 443 112.2 330 111.3 90 104.4 23 186.9 1872-1876 491 124.3 358 120.6 107 124.9 26 209.8 1877-1881 559 141.8 412 138.9 123 143.4 25 203.3 1882-1886 572 145.0 402 135.5 128 148.7 42 347.5 1887-1890 624 158.1 433 145.9 145 168.4 47 381.1 1891-1895 687 174.0 469 158.3 176 204.7 42 341.0 1896-1900 605 153.2 395 133.1 164 190.7 46 378.7 1901-1905 641 162.5 433 146.1 165 192.8 42 347.5 1906-1910 547 138.7 315 106.1 183 213.5 49 404.9 1911-1914 734 185.9 413 139.2 258 300.4 63 514.3
............................................................................................................................. ....................................................................
1920-1924 588 100.0 346 100.0 180 100.0 63 100.0 1925-1929 634 107.7 358 103.5 210 117.0 66 104.4 1930-1934 705 119.9 389 112.4 245 136.5 71 113.3 1935-1939 676 114.8 322 93.1 272 151.6 81 129.2
1940-1944 579 98.5 278 80.5 247 137.4 54 86.0
1945-1947˟ 466 79.3 187 54.0 218 121.2 62 98.4
............................................................................................................................. ..................................................................... 1950-1954 428 100.0 224 100.0 179 100.0 24 100.0 1955-1959 1887 441.0 688 306.5 1024 571.0 174 726.7 1960-1964 2778 649.5 838 373.4 1665 928.1 276 1148.3 1965-1969 3991 932.8 896 399.3 2704 1507.1 391 1628.3 1970-1974 5526 1291.7 1017 453.3 3870 2157.1 639 2662.5 1975-1979 6128 1432.4 1335 595.0 4241 2363.9 552 2300.0 1980-1984 6563 1534.0 1365 608.5 4560 2541.6 638 2656.7 1985-1989 5489 1283.2 1498 667.4 3472 1935.3 520 2165.8 1990-1994 4503 1052.6 1426 635.7 2667 1486.6 410 1706.7 1995-2000 4141 968.1 1309 583.3 2380 1326.4 453 1887.5
2001-2005 482 112.6 1095 488.1 2817 1570.3 899 3744.2
2006-2010 196 45.7 410 182.5 1186 661.0 360 1499.2
Source: Calculated based on the data in Table A 12

46
Table A12
Gross added value in the production of goods, by branches in
USD 2000, per capita and indexes, annual series, period 1862-2000
Total Agriculture Industry Constructions
Years
USD indexes USD indexes USD indexes USD indexes
1 2 3 4 5 6 7 8 9
1862 407 100 304 100 92 100 11 100
1863 450 110.6 358 117.8 81 88.0 11 100.0
1864 452 111.1 363 119.4 77 83.7 12 109.1
1865 320 78.6 223 73.4 85 92.4 12 109.1
1866 324 79.6 212 69.7 100 108.7 12 109.1
1867 427 104.9 327 107.6 86 93.5 14 127.3
1868 448 110.1 338 111.2 97 105.4 13 118.2
1869 440 108.1 325 106.9 84 91.3 31 281.8
1870 460 113.0 351 115.5 89 96.7 20 181.8
1871 435 106.9 337 110.9 80 87.0 18 163.6
1872 430 105.7 300 98.7 98 106.5 32 290.9
1873 464 114.0 336 110.5 96 104.3 32 290.9
1874 454 111.5 318 104.6 118 128.3 18 163.6
1875 550 135.1 403 132.6 113 122.8 34 309.1
1876 497 122.1 375 123.4 100 108.7 22 200.0
1877 488 119.9 357 117.4 109 118.5 22 200.0
1878 494 121.4 368 121.1 103 112.0 23 209.1
1879 516 126.8 362 119.1 134 145.7 22 200.0
1880 688 169.0 530 174.3 135 146.7 23 209.1
1881 447 109.8 294 96.7 128 139.1 25 227.3
1882 652 160.2 506 166.4 115 125.0 31 281.8
1883 562 138.1 392 128.9 135 146.7 35 318.2
1884 458 112.5 305 100.3 122 132.6 31 281.8
1885 581 142.8 423 139.1 123 133.7 35 318.2
1886 665 163.4 492 161.8 133 144.6 40 363.6
1887 594 145.9 398 130.9 125 135.9 71 645.5
1888 643 158.0 457 150.3 144 156.5 42 381.8
1889 633 155.5 446 146.7 155 168.5 32 290.9
1890 625 153.6 430 141.4 154 167.4 41 372.7
1891 615 151.1 403 132.6 164 178.3 48 436.4
1892 690 169.5 482 158.6 170 184.8 38 345.5
1893 627 154.1 437 143.8 155 168.5 35 318.2
1894 701 172.2 485 159.5 178 193.5 38 345.5
1895 705 173.2 478 157.2 184 200.0 43 390.9
1896 710 174.4 465 153.0 191 207.6 54 490.9
1897 545 133.9 350 115.1 153 166.3 42 381.8
1898 685 168.3 454 149.3 174 189.1 57 518.2
1899 425 104.4 212 69.7 165 179.3 48 436.4
1900 678 166.6 456 150.0 180 195.7 42 381.8
1901 690 169.5 502 165.1 146 158.7 42 381.8
1902 655 160.9 453 149.0 160 173.9 42 381.8

47
Total Agriculture Industry Constructions
Years
USD indexes USD indexes USD indexes USD indexes
1 2 3 4 5 6 7 8 9
1903 680 167.1 468 153.9 169 183.7 43 390.9 1904 464 114.0 258 84.9 165 179.3 41 372.7 1905 717 176.2 486 159.9 187 203.3 44 400.0 1906 780 191.6 524 172.4 200 217.4 56 509.1 1907 564 138.6 293 96.4 210 228.3 61 554.5 1908 638 156.8 350 115.1 233 253.3 55 500.0 1909 609 149.6 340 111.8 219 238.0 50 454.5 1910 829 203.7 523 172.0 235 255.4 71 645.5 1911 772 189.7 465 153.0 250 271.7 57 518.2 1912 769 188.9 430 141.4 275 298.9 64 581.8 1913 771 189.4 439 144.4 264 287.0 68 618.2 1914 622 152.8 318 104.6 242 263.0 62 563.6
.............................................................................................................................................................................................. .
1920 475 100.0 315 100.0 112 100.0 48 100.0 1921 490 103.2 309 98.1 129 115.2 52 108.3 1922 567 119.4 361 114.6 149 133.0 57 118.8 1923 614 129.3 387 122.9 170 151.8 57 118.8 1924 590 124.2 344 109.2 189 168.8 57 118.8 1925 623 131.2 360 114.3 198 176.8 65 135.4 1926 672 141.5 403 127.9 200 178.6 69 143.8 1927 644 135.6 354 112.4 215 192.0 75 156.3 1928 640 134.7 341 108.3 229 204.5 70 145.8 1929 693 145.9 410 130.2 213 190.2 70 145.8 1930 662 139.4 391 124.1 213 190.2 58 120.8 1931 674 141.9 401 127.3 208 185.7 65 135.4 1932 607 127.8 343 108.9 202 180.4 62 129.2 1933 633 133.3 357 113.3 212 189.3 64 133.3 1934 634 133.5 326 103.5 239 213.4 69 143.8 1935 687 144.6 362 114.9 251 224.1 74 154.2 1936 704 148.2 375 119.0 253 225.9 76 158.3 1937 730 153.7 372 118.1 271 242.0 87 181.3 1938 723 152.2 381 121.0 270 241.1 72 150.0 1939 737 155.2 398 126.3 264 235.7 75 156.3
1940 688 144.8 314 99.7 304 271.4 70 145.8 1941 692 145.7 311 98.7 300 267.9 81 168.8 1942 622 130.9 243 77.1 298 266.1 81 168.8 1943 750 157.9 334 106.0 320 285.7 96 200.0 1944 615 129.5 296 94.0 239 213.4 80 166.7
1945 425 89.5 150 47.6 217 193.8 58 120.8 1946 414 87.2 144 45.7 210 187.5 60 125.0 1947 560 117.9 266 84.4 226 201.8 68 141.7
............................................................................................................................. .................................................................. 1950 957 100.0 501 100.0 404 100.0 52 100.0 1951 1182 123.5 621 124.0 493 122.0 68 130.8 1952 1151 120.3 553 110.4 519 128.5 79 151.9 1953 1298 135.6 639 127.5 563 139.4 96 184.6 1954 1288 134.6 612 122.2 601 148.8 75 144.2
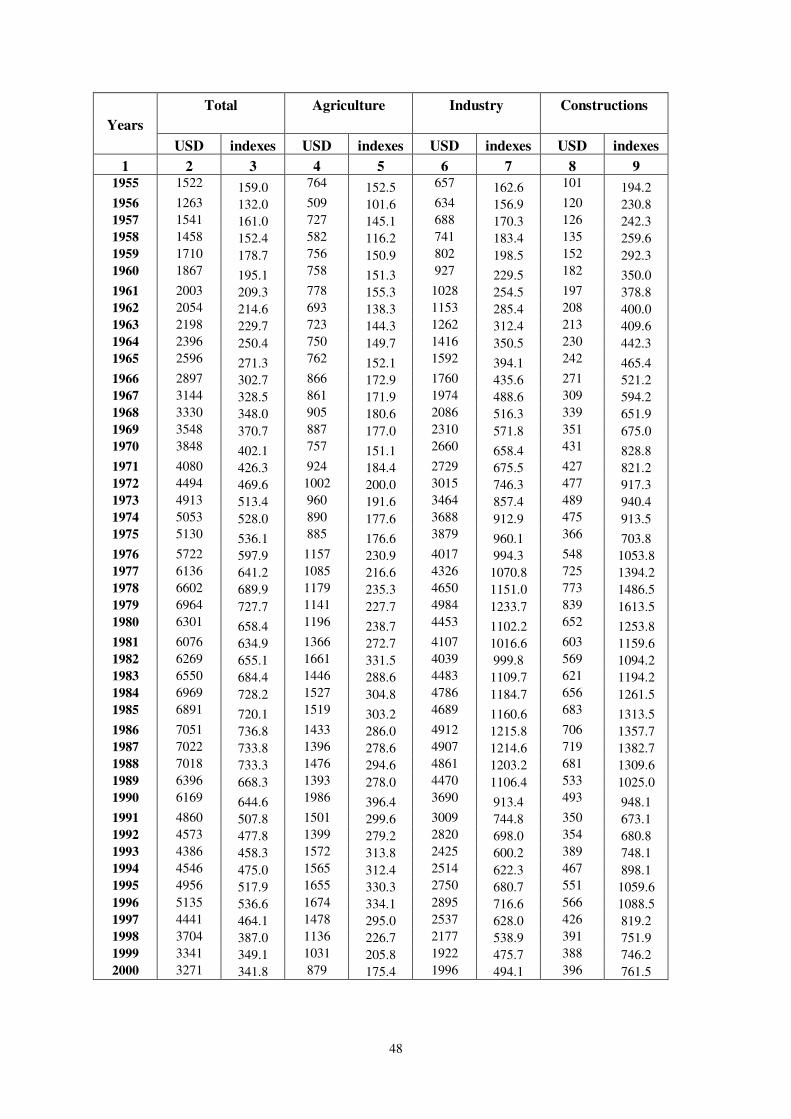
48
Total Agriculture Industry Constructions
Years
USD indexes USD indexes USD indexes USD indexes
1 2 3 4 5 6 7 8 9 1955 1522 159.0 764 152.5 657 162.6 101 194.2 1956 1263 132.0 509 101.6 634 156.9 120 230.8 1957 1541 161.0 727 145.1 688 170.3 126 242.3 1958 1458 152.4 582 116.2 741 183.4 135 259.6 1959 1710 178.7 756 150.9 802 198.5 152 292.3 1960 1867 195.1 758 151.3 927 229.5 182 350.0 1961 2003 209.3 778 155.3 1028 254.5 197 378.8 1962 2054 214.6 693 138.3 1153 285.4 208 400.0 1963 2198 229.7 723 144.3 1262 312.4 213 409.6 1964 2396 250.4 750 149.7 1416 350.5 230 442.3 1965 2596 271.3 762 152.1 1592 394.1 242 465.4 1966 2897 302.7 866 172.9 1760 435.6 271 521.2 1967 3144 328.5 861 171.9 1974 488.6 309 594.2 1968 3330 348.0 905 180.6 2086 516.3 339 651.9 1969 3548 370.7 887 177.0 2310 571.8 351 675.0 1970 3848 402.1 757 151.1 2660 658.4 431 828.8 1971 4080 426.3 924 184.4 2729 675.5 427 821.2 1972 4494 469.6 1002 200.0 3015 746.3 477 917.3 1973 4913 513.4 960 191.6 3464 857.4 489 940.4 1974 5053 528.0 890 177.6 3688 912.9 475 913.5 1975 5130 536.1 885 176.6 3879 960.1 366 703.8 1976 5722 597.9 1157 230.9 4017 994.3 548 1053.8 1977 6136 641.2 1085 216.6 4326 1070.8 725 1394.2 1978 6602 689.9 1179 235.3 4650 1151.0 773 1486.5 1979 6964 727.7 1141 227.7 4984 1233.7 839 1613.5 1980 6301 658.4 1196 238.7 4453 1102.2 652 1253.8 1981 6076 634.9 1366 272.7 4107 1016.6 603 1159.6 1982 6269 655.1 1661 331.5 4039 999.8 569 1094.2 1983 6550 684.4 1446 288.6 4483 1109.7 621 1194.2 1984 6969 728.2 1527 304.8 4786 1184.7 656 1261.5 1985 6891 720.1 1519 303.2 4689 1160.6 683 1313.5 1986 7051 736.8 1433 286.0 4912 1215.8 706 1357.7 1987 7022 733.8 1396 278.6 4907 1214.6 719 1382.7 1988 7018 733.3 1476 294.6 4861 1203.2 681 1309.6 1989 6396 668.3 1393 278.0 4470 1106.4 533 1025.0 1990 6169 644.6 1986 396.4 3690 913.4 493 948.1 1991 4860 507.8 1501 299.6 3009 744.8 350 673.1 1992 4573 477.8 1399 279.2 2820 698.0 354 680.8 1993 4386 458.3 1572 313.8 2425 600.2 389 748.1 1994 4546 475.0 1565 312.4 2514 622.3 467 898.1 1995 4956 517.9 1655 330.3 2750 680.7 551 1059.6 1996 5135 536.6 1674 334.1 2895 716.6 566 1088.5 1997 4441 464.1 1478 295.0 2537 628.0 426 819.2 1998 3704 387.0 1136 226.7 2177 538.9 391 751.9 1999 3341 349.1 1031 205.8 1922 475.7 388 746.2 2000 3271 341.8 879 175.4 1996 494.1 396 761.5

49
Total Agriculture Industry Constructions
Years
USD indexes USD indexes USD indexes USD indexes
1 2 3 4 5 6 7 8 9
2001 373 389.6 1128 225.2 2163 535.4 396 761.5
2002 396 414.2 1099 219.4 2370 586.6 495 951.9
2003 416 434.5 1155 230.5 2480 613.9 524 1007.7
2004 462 482.5 1374 274.3 2670 660.9 573 1101.9
2005 453 473.2 1141 227.7 2749 680.4 639 1228.8
2006 493 515.0 1181 235.7 2961 732.9 786 1511.5
2007 485 506.6 867 173.1 2968 734.6 1013 1948.1
2008 560 585.6 1112 222.0 3153 780.4 1340 2576.9
2009 529 552.6 1016 202.8 3125 773.5 1147 2205.8
2010 551 575.8 1121 223.8 3275 810.6 1115 2144.2
Source: Calculated based on the data in Table A 10 and the population of the country.
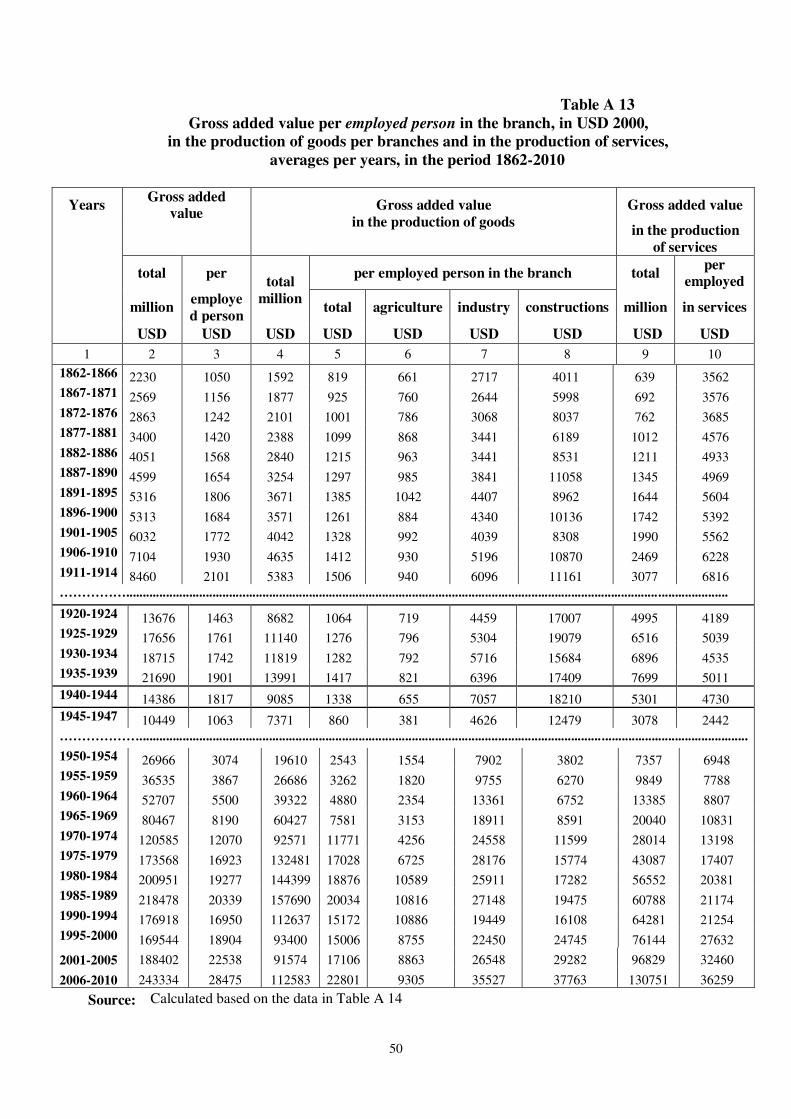
50
Table A 13
Gross added value per employed person in the branch, in USD 2000, in the production of goods per branches and in the production of services,
averages per years, in the period 1862-2010
Years Gross added
value Gross added value
in the production of goods
Gross added value
in the production
of services
total per total
million
per employed person in the branch total per
employed
million employe
d person total agriculture industry constructions million in services
USD USD USD USD USD USD USD USD USD
1 2 3 4 5 6 7 8 9 10
1862-1866 2230 1050 1592 819 661 2717 4011 639 3562 1867-1871 2569 1156 1877 925 760 2644 5998 692 3576 1872-1876 2863 1242 2101 1001 786 3068 8037 762 3685 1877-1881 3400 1420 2388 1099 868 3441 6189 1012 4576 1882-1886 4051 1568 2840 1215 963 3441 8531 1211 4933 1887-1890 4599 1654 3254 1297 985 3841 11058 1345 4969 1891-1895 5316 1806 3671 1385 1042 4407 8962 1644 5604 1896-1900 5313 1684 3571 1261 884 4340 10136 1742 5392 1901-1905 6032 1772 4042 1328 992 4039 8308 1990 5562 1906-1910 7104 1930 4635 1412 930 5196 10870 2469 6228 1911-1914 8460 2101 5383 1506 940 6096 11161 3077 6816 …………….....................................................................................................................................................................................
1920-1924 13676 1463 8682 1064 719 4459 17007 4995 4189 1925-1929 17656 1761 11140 1276 796 5304 19079 6516 5039 1930-1934 18715 1742 11819 1282 792 5716 15684 6896 4535 1935-1939 21690 1901 13991 1417 821 6396 17409 7699 5011
1940-1944 14386 1817 9085 1338 655 7057 18210 5301 4730
1945-1947 10449 1063 7371 860 381 4626 12479 3078 2442 ………………....................................................................................................................................................................................... 1950-1954 26966 3074 19610 2543 1554 7902 3802 7357 6948 1955-1959 36535 3867 26686 3262 1820 9755 6270 9849 7788 1960-1964 52707 5500 39322 4880 2354 13361 6752 13385 8807 1965-1969 80467 8190 60427 7581 3153 18911 8591 20040 10831 1970-1974 120585 12070 92571 11771 4256 24558 11599 28014 13198 1975-1979 173568 16923 132481 17028 6725 28176 15774 43087 17407 1980-1984 200951 19277 144399 18876 10589 25911 17282 56552 20381 1985-1989 218478 20339 157690 20034 10816 27148 19475 60788 21174 1990-1994 176918 16950 112637 15172 10886 19449 16108 64281 21254 1995-2000 169544 18904 93400 15006 8755 22450 24745 76144 27632
2001-2005 188402 22538 91574 17106 8863 26548 29282 96829 32460
2006-2010 243334 28475 112583 22801 9305 35527 37763 130751 36259
Source: Calculated based on the data in Table A 14

51
Table A 14 Gross added value per employed person in the branch, in USD 2000, in the production of
goods by branches in the production of services, annual series, in the period 1862-2010
Years Gross added value Gross added value Gross added value
in the production of goods in the production of
services
total per total per employed person in the branch total per
employed
mil. employed
person mil. total agriculture industry constructions mil.
person
in services USD USD USD USD USD USD USD USD USD 1 2 3 4 5 6 7 8 9 10
1862 2239 1071 1632 852 688 2910 3874 607 3487 1863 2450 1164 1818 943 810 2544 3783 632 3582 1864 2547 1195 1850 948 821 2420 4008 697 3875 1865 1961 910 1324 671 505 2635 4143 637 3482 1866 1955 910 1334 679 479 3077 4247 621 3385 1867 2388 1100 1773 894 741 2645 4132 615 3297 1868 2604 1187 1881 939 765 2964 4174 723 3812 1869 2566 1154 1871 921 737 2550 9667 695 3592 1870 2683 1192 1976 962 794 2667 6412 707 3589 1871 2604 1146 1886 910 763 2392 5608 718 3588 1872 2591 1135 1870 899 680 2906 9668 721 3566 1873 2760 1206 2021 969 762 2826 9352 739 3622 1874 2719 1186 1983 950 722 3455 5166 736 3580 1875 3173 1371 2419 1149 915 3284 9752 754 3611 1876 3070 1311 2210 1038 852 2871 6245 860 4048 1877 3154 1335 2187 1019 810 3131 6164 967 4487 1878 3241 1369 2217 1031 835 2922 6549 1024 4712 1879 3328 1391 2338 1076 822 3774 5612 990 4482 1880 4163 1732 3131 1436 1204 3804 6035 1032 4624 1881 3112 1272 2067 932 668 3572 6584 1045 4574 1882 4182 1684 3058 1359 1150 3175 8052 1124 4819 1883 3896 1538 2683 1170 891 3731 8643 1213 5071 1884 3372 1306 2225 953 693 3349 7542 1147 4680 1885 4140 1571 2880 1208 962 3345 8639 1260 5008 1886 4666 1739 3356 1384 1119 3605 9778 1310 5085 1887 4375 1609 3036 1236 907 3349 17116 1339 5101 1888 4603 1669 3332 1338 1040 3852 10005 1271 4747 1889 4677 1669 3328 1316 1014 4098 7760 1349 4931 1890 4740 1670 3320 1297 980 4066 9353 1420 5098 1891 4892 1698 3315 1277 917 4301 10921 1577 5548 1892 5321 1834 3744 1433 1098 4441 8472 1577 5480 1893 5132 1748 3437 1300 997 4007 7704 1695 5789 1894 5593 1883 3888 1455 1106 4586 8318 1705 5726 1895 5640 1867 3972 1462 1090 4699 9392 1668 5478 1896 5841 1906 4052 1472 1061 4863 11517 1789 5763 1897 4799 1542 3155 1128 799 3860 8870 1644 5185 1898 5891 1869 4018 1420 1037 4368 11870 1873 5804 1899 4165 1300 2535 882 483 4131 9984 1630 4942 1900 5869 1803 4096 1403 1042 4478 8438 1773 5264 1901 6148 1861 4225 1428 1148 3599 8392 1923 5600 1902 6006 1797 4055 1355 1035 3935 8301 1951 5586 1903 6260 1843 4277 1407 1071 4117 8424 1983 5558 1904 4864 1399 3010 968 596 4039 7930 1854 5050 1905 6883 1963 4645 1482 1112 4504 8495 2238 6015

52
Years Gross added value Gross added value Gross added value
in the production of goods in the production of
services
total per total
mil.
per employed person in the branch total per
employed
mil. employed
person total agriculture industry constructions mil.
person in services
USD USD USD USD USD USD USD USD USD
1 2 3 4 5 6 7 8 9 10
1906 7521 2108 5135 1611 1200 4799 10517 2386 6272
1907 6062 1671 3772 1164 671 5003 11419 2290 5891
1908 6672 1815 4317 1316 802 5509 10222 2355 5949
1909 6654 1786 4181 1258 779 5169 9259 2473 6134
1910 8611 2273 5771 1709 1197 5500 12935 2840 6893
1911 8557 2217 5468 1591 1064 5822 10238 3089 7326
1912 8700 2206 5562 1585 985 6398 11537 3138 7235
1913 8805 2144 5672 1558 982 6223 11844 3133 6713
1914 7776 1836 4831 1289 729 5941 11023 2945 5992
............................................................................................................................................................................. ........................
1920 11303 1245 7314 925 657 3673 16174 3989 3412 1921 12439 1354 7634 951 644 4024 16749 4805 4136 1922 13877 1488 8978 1103 756 4455 18024 4899 4130 1923 15341 1621 9863 1194 813 4901 17221 5478 4539 1924 15422 1606 9620 1149 725 5243 16866 5802 4725 1925 15957 1637 10311 1214 762 5303 18678 5646 4511 1926 17652 1786 11278 1310 856 5191 19214 6374 5002 1927 17995 1797 10956 1255 754 5398 20499 7039 5471 1928 17696 1742 11039 1248 728 5576 18820 6657 5080 1929 18979 1843 12116 1352 880 5051 18186 6863 5133 1930 19118 1830 11859 1307 849 5025 14908 7259 5279 1931 19608 1848 12250 1346 872 5558 16488 7358 4879 1932 17816 1656 11186 1220 747 5825 15167 6630 4164 1933 18253 1676 11812 1268 778 5801 15609 6441 4085 1934 18779 1700 11988 1268 712 6372 16252 6791 4267 1935 20456 1835 13119 1368 788 6472 17421 7337 4717 1936 21230 1882 13594 1397 816 6352 17384 7636 4918 1937 22301 1955 14264 1446 810 6615 19699 8037 5214 1938 21959 1903 14280 1427 828 6413 16189 7679 5011 1939 22506 1933 14699 1449 864 6129 16352 7807 5194 1940 14502 1870 9147 1364 687 7133 16121 5355 5095 1941 14942 1888 9231 1370 679 7161 18203 5711 4856 1942 14045 1767 8389 1227 527 7206 17820 5656 5105 1943 16069 2016 10237 1491 731 7845 20625 5832 5268 1944 12373 1546 8420 1236 653 5938 18283 3953 3327
1945 9629 983 6685 788 307 4778 13174 2944 2246 1946 9510 968 6534 763 292 4490 12139 2976 2369 1947 12208 1238 8894 1030 544 4611 12124 3314 2712 ……….............................................................................................................................. ........................................................ 1950 21519 2569 15608 2106 1313 6587 4532 5911 6119 1951 26919 3133 19457 2563 1640 7674 3753 7462 7447 1952 26400 3048 19136 2504 1479 8172 3575 7264 7115 1953 29706 3309 21867 2783 1706 8443 3833 7839 7012 1954 30287 3312 21980 2759 1634 8632 3317 8307 7046
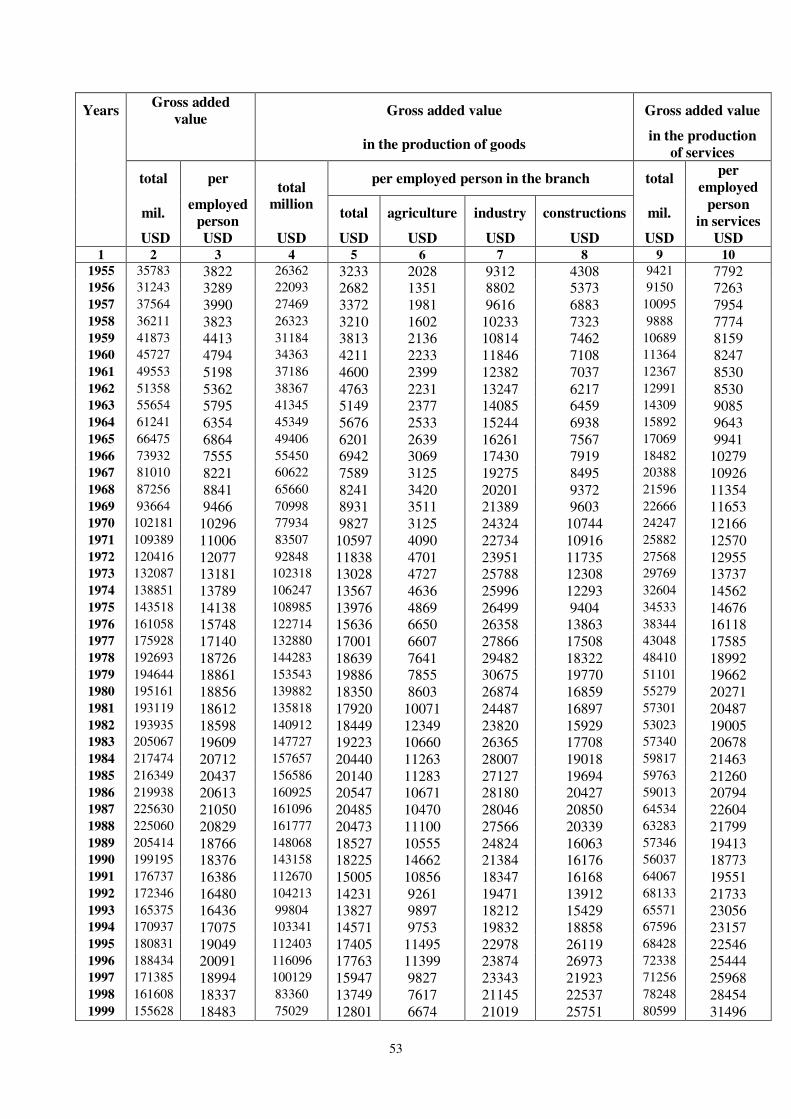
53
Years Gross added
value Gross added value Gross added value
in the production of goods in the production
of services
total per total
million
per employed person in the branch total per
employed
mil. employed
person total agriculture industry constructions mil.
person
in services USD USD USD USD USD USD USD USD USD 1 2 3 4 5 6 7 8 9 10
1955 35783 3822 26362 3233 2028 9312 4308 9421 7792 1956 31243 3289 22093 2682 1351 8802 5373 9150 7263 1957 37564 3990 27469 3372 1981 9616 6883 10095 7954 1958 36211 3823 26323 3210 1602 10233 7323 9888 7774 1959 41873 4413 31184 3813 2136 10814 7462 10689 8159 1960 45727 4794 34363 4211 2233 11846 7108 11364 8247 1961 49553 5198 37186 4600 2399 12382 7037 12367 8530 1962 51358 5362 38367 4763 2231 13247 6217 12991 8530 1963 55654 5795 41345 5149 2377 14085 6459 14309 9085 1964 61241 6354 45349 5676 2533 15244 6938 15892 9643 1965 66475 6864 49406 6201 2639 16261 7567 17069 9941 1966 73932 7555 55450 6942 3069 17430 7919 18482 10279 1967 81010 8221 60622 7589 3125 19275 8495 20388 10926 1968 87256 8841 65660 8241 3420 20201 9372 21596 11354 1969 93664 9466 70998 8931 3511 21389 9603 22666 11653 1970 102181 10296 77934 9827 3125 24324 10744 24247 12166 1971 109389 11006 83507 10597 4090 22734 10916 25882 12570 1972 120416 12077 92848 11838 4701 23951 11735 27568 12955 1973 132087 13181 102318 13028 4727 25788 12308 29769 13737 1974 138851 13789 106247 13567 4636 25996 12293 32604 14562 1975 143518 14138 108985 13976 4869 26499 9404 34533 14676 1976 161058 15748 122714 15636 6650 26358 13863 38344 16118 1977 175928 17140 132880 17001 6607 27866 17508 43048 17585 1978 192693 18726 144283 18639 7641 29482 18322 48410 18992 1979 194644 18861 153543 19886 7855 30675 19770 51101 19662 1980 195161 18856 139882 18350 8603 26874 16859 55279 20271 1981 193119 18612 135818 17920 10071 24487 16897 57301 20487 1982 193935 18598 140912 18449 12349 23820 15929 53023 19005 1983 205067 19609 147727 19223 10660 26365 17708 57340 20678 1984 217474 20712 157657 20440 11263 28007 19018 59817 21463 1985 216349 20437 156586 20140 11283 27127 19694 59763 21260 1986 219938 20613 160925 20547 10671 28180 20427 59013 20794 1987 225630 21050 161096 20485 10470 28046 20850 64534 22604 1988 225060 20829 161777 20473 11100 27566 20339 63283 21799 1989 205414 18766 148068 18527 10555 24824 16063 57346 19413 1990 199195 18376 143158 18225 14662 21384 16176 56037 18773 1991 176737 16386 112670 15005 10856 18347 16168 64067 19551 1992 172346 16480 104213 14231 9261 19471 13912 68133 21733 1993 165375 16436 99804 13827 9897 18212 15429 65571 23056 1994 170937 17075 103341 14571 9753 19832 18858 67596 23157 1995 180831 19049 112403 17405 11495 22978 26119 68428 22546 1996 188434 20091 116096 17763 11399 23874 26973 72338 25444 1997 171385 18994 100129 15947 9827 23343 21923 71256 25968 1998 161608 18337 83360 13749 7617 21145 22537 78248 28454 1999 155628 18483 75029 12801 6674 21019 25751 80599 31496

54
Years Gross added
value Gross added value Gross added value
in the production of goods in the production of
services
total per total
million
per employed person in the branch total per employed
mil. employed
person total agriculture industry constructions mil.
person
in services
USD USD USD USD USD USD USD USD USD
1 2 3 4 5 6 7 8 9 10
2000 159375 18470 73380 12370 5517 22343 25164 85995 31885
2001 169146 19753 83552 14260 7220 24031 28818 85594 31655
2002 177955 21366 85942 15617 7902 24212 29343 92013 32559
2003 185660 22353 90370 16914 8693 26170 28735 95290 32153
2004 201341 24441 100076 19588 11289 28201 29659 101265 32363
2005 207910 24781 97929 19149 9213 30124 29853 109981 33572
2006 224725 26535 106377 21275 10127 32458 33073 118348 34116
2007 240669 27581 104413 20812 7577 32640 36743 136257 36737
2008 262757 30040 120514 23723 9931 34227 41629 142243 38791
2009 246671 29327 113527 23597 9047 37817 39335 133144 36985
2010 241851 28891 118084 24596 9845 40494 38036 123767 34669
Source: Calculated based on the data tables A1 columns 2, 4, 6, 8, 9, 10; A 6 columns 2, 4, 6; A 10 columns 4, 6, 8.

55
Table A 15
Share of added value per employed person, by branch, in the production of goods
and in the production of services, period 1862-2010
Years Total gross Gross added value per employed person Gross added value
added value in the branch and in the production of goods per
per total% as in in in employed person in
the production
employed
person =100
compared
to agriculture industry constructions of services
column 2: %/col.2 %/col.2 %/col.2 %/col.2 1 2 3 4 5 6 7
1862 100 79.5 64.2 271.6 361.6 325.4
1863 100 81.0 69.6 218.6 325.0 307.7 1864 100 79.3 68.7 202.6 335.5 324.4 1865 100 73.8 55.5 289.6 455.3 382.7 1866 100 74.6 52.7 338.1 466.6 371.9 1867 100 81.2 67.3 240.3 375.4 299.6 1868 100 79.1 64.4 249.6 351.5 321.1 1869 100 79.9 63.9 221.1 837.9 311.3 1870 100 80.7 66.6 223.7 537.7 301.0 1871 100 79.4 66.6 208.7 489.3 313.1 1872 100 79.2 59.9 255.9 851.5 314.1 1873 100 80.4 63.2 234.4 775.6 300.4 1874 100 80.1 60.9 291.3 435.7 301.9 1875 100 83.8 66.7 239.6 711.5 263.5 1876 100 79.2 65.0 219.0 476.4 308.8 1877 100 76.3 60.6 234.5 461.6 336.0 1878 100 75.3 61.0 213.5 478.5 344.2 1879 100 77.4 59.1 271.4 403.5 322.3 1880 100 82.9 69.5 219.7 348.5 267.0 1881 100 73.3 52.5 280.9 517.7 359.6 1882 100 80.7 68.3 188.6 478.2 286.2 1883 100 76.0 57.9 242.5 561.9 329.7 1884 100 72.9 53.1 256.3 577.3 358.2 1885 100 76.9 61.2 212.9 549.8 318.7 1886 100 79.6 64.3 207.3 562.2 292.4 1887 100 76.8 56.4 208.1 1063.7 317.0 1888 100 80.2 62.3 230.8 599.5 284.4 1889 100 78.9 60.8 245.6 465.0 295.5 1890 100 77.7 58.6 243.5 560.0 305.3 1891 100 75.2 54.0 253.3 643.2 326.7 1892 100 78.1 59.9 242.1 461.9 298.8 1893 100 74.4 57.1 229.2 440.7 331.2 1894 100 77.3 58.7 243.5 441.7 304.1 1895 100 78.3 58.4 251.7 503.1 293.4 1896 100 77.2 55.6 255.1 604.1 302.3 1897 100 73.2 51.8 250.4 575.4 336.3 1898 100 76.0 55.5 233.7 635.1 310.6 1899 100 67.8 37.2 317.9 768.3 380.3 1900 100 77.8 57.8 248.4 468.1 292.0 1901 100 76.7 61.7 193.3 450.8 300.8 1902 100 75.4 57.6 219.0 461.9 310.9 1903 100 76.3 58.1 223.4 457.1 301.6 1904 100 69.2 42.6 288.8 567.0 361.1 1905 100 75.5 56.6 229.5 432.8 306.5

56
Years Total gross Gross added value per employed person Gross added value
added value in the branch and in the production of goods per
employed person in
per total% as in in in the production
employed
person =100
compared
to agriculture industry constructions of services
column 2: %/col.2 %/col.2 %/col.2 %/col.2
1 2 3 4 5 6 7
1906 100 76.4 56.9 227.6 498.9 297.5
1907 100 69.7 40.1 299.4 683.4 352.6
1908 100 72.5 44.2 303.5 563.2 327.8
1909 100 70.5 43.6 289.4 518.5 343.5
1910 100 75.2 52.7 242.0 569.2 303.3
1911 100 71.7 48.0 262.5 461.7 330.4
1912 100 71.8 44.6 290.0 522.9 327.9
1913 100 72.7 45.8 290.3 552.4 313.1
1914 100 70.2 39.7 323.6 600.3 326.3
.......................................................................................................................................... 1920 100 74.3 52.7 294.9 1298.7 274.0 1921 100 70.3 47.6 297.1 1236.8 305.4 1922 100 74.1 50.8 299.4 1211.4 277.6 1923 100 73.7 50.2 302.4 1062.6 280.0 1924 100 71.5 45.1 326.5 1050.3 294.3 1925 100 74.1 46.6 323.8 1140.7 275.5 1926 100 73.3 48.0 290.7 1076.0 280.1 1927 100 69.9 42.0 300.4 1140.9 304.5 1928 100 71.6 41.8 320.0 1080.1 291.6 1929 100 73.4 47.7 274.2 987.0 278.6 1930 100 71.4 46.4 274.6 814.6 288.5 1931 100 72.8 47.2 300.7 892.1 264.0 1932 100 73.7 45.1 351.8 916.1 251.5 1933 100 75.7 46.4 346.2 931.5 243.8 1934 100 74.6 41.9 374.8 955.9 251.0 1935 100 74.5 42.9 352.7 949.3 257.0 1936 100 74.3 43.4 337.6 923.8 261.3 1937 100 74.0 41.4 338.4 1007.7 266.7 1938 100 75.0 43.5 336.9 850.6 263.3 1939 100 75.0 44.7 317.2 846.1 268.8 1940 100 73.0 36.7 381.5 862.2 272.5 1941 100 72.6 36.0 379.3 964.2 257.2 1942 100 69.4 29.8 407.7 1008.3 288.8 1943 100 74.0 36.3 389.2 1023.1 261.3 1944 100 79.9 42.3 384.0 1182.3 215.2
1945 100 80.2 31.2 485.8 1339.7 228.4 1946 100 78.8 30.2 463.7 1253.7 244.7 1947 100 83.2 43.9 372.3 979.0 219.0
…………………….......................................................................................................................................... 1950 100 82.0 51.1 256.4 176.4 238.2 1951 100 81.8 52.3 245.0 119.8 237.7 1952 100 82.2 48.5 268.1 117.3 233.4 1953 100 84.1 51.5 255.1 115.8 211.9 1954 100 83.3 49.3 260.7 100.2 212.8

57
Years Total gross Gross added value per employed person Gross added value
added value in the branch and in the production of goods per
employed person
per total% as in in in in the production
employed
person =100 compared
to agriculture industry constructions of services
column 2: %/col.2 %/col.2 %/col.2 %/col.2
1 2 3 4 5 6 7 1955 100 84.6 53.1 243.7 112.7 203.9 1956 100 81.5 41.1 267.6 163.3 220.8 1957 100 84.5 49.6 241.0 172.5 199.4 1958 100 84.0 41.9 267.7 191.6 203.3 1959 100 86.4 48.4 245.0 169.1 184.9 1960 100 87.8 46.6 247.1 148.3 172.0 1961 100 88.5 46.1 238.2 135.4 164.1 1962 100 88.8 41.6 247.1 116.0 159.1 1963 100 88.9 41.0 243.1 111.5 156.8 1964 100 89.3 39.9 239.9 109.2 151.8 1965 100 90.3 38.5 236.9 110.2 144.8 1966 100 91.9 40.6 230.7 104.8 136.1 1967 100 92.3 38.0 234.5 103.3 132.9 1968 100 93.2 38.7 228.5 106.0 128.4 1969 100 94.3 37.1 226.0 101.5 123.1 1970 100 95.4 30.4 236.2 104.3 118.2 1971 100 96.3 37.2 206.6 99.2 114.2 1972 100 98.0 38.9 198.3 97.2 107.3 1973 100 98.8 35.9 195.6 93.4 104.2 1974 100 98.4 33.6 188.5 89.2 105.6 1975 100 98.9 34.4 187.4 66.5 103.8 1976 100 99.3 42.2 167.4 88.0 102.3 1977 100 99.2 38.5 162.6 102.1 102.6 1978 100 99.5 40.8 157.4 97.8 101.4 1979 100 105.4 41.6 162.6 104.8 104.2 1980 100 97.3 45.6 142.5 89.4 107.5 1981 100 96.3 54.1 131.6 90.8 110.1 1982 100 99.2 66.4 128.1 85.7 102.2 1983 100 98.0 54.4 134.5 90.3 105.5 1984 100 98.7 54.4 135.2 91.8 103.6 1985 100 98.5 55.2 132.7 96.4 104.0 1986 100 99.7 51.8 136.7 99.1 100.9 1987 100 97.3 49.7 133.2 99.0 107.4 1988 100 98.3 53.3 132.3 97.6 104.7 1989 100 98.7 56.2 132.3 85.6 103.4 1990 100 99.2 79.8 116.4 88.0 102.2 1991 100 91.6 66.3 112.0 98.7 119.3 1992 100 86.4 56.2 118.1 84.4 131.9 1993 100 84.1 60.2 110.8 93.9 140.3 1994 100 85.3 57.1 116.1 110.4 135.6 1995 100 91.4 60.3 120.6 137.1 118.4 1996 100 88.4 56.7 118.8 134.3 126.6 1997 100 84.0 51.7 122.9 115.4 136.7 1998 100 75.0 41.5 115.3 122.9 155.2 1999 100 69.3 36.1 113.7 139.3 170.4 2000 100 67.0 29.9 121.0 136.2 172.6

58
Years Total gross Gross added value per employed person Gross added value
added in the branch and in the production of goods per
value total % in in in
employed person
in the production
per as
compared
to
agriculture industry constructions of services
employed person=100
column 2: %/col.2 %/col.2 %/col.2 %/col.2
1 2 3 4 5 6 7
2001 100 72.2 36.6 121.7 145.9 160.3 2002 100 73.1 37.0 113.3 137.3 152.4 2003 100 75.7 38.9 117.1 128.6 143.8 2004 100 80.1 46.2 115.4 121.4 132.4 2005 100 77.3 37.2 121.6 120.5 135.5 2006 100 80.2 38.2 122.3 124.6 128.6 2007 100 75.5 27.5 118.3 133.2 133.2 2008 100 79.0 33.1 113.9 138.6 129.1 2009 100 80.5 30.8 128.9 134.1 126.1 2010 100 85.1 34.1 140.2 131.7 120.0 Note: Calculated based on the data in Table A 14

59
Summarized statistical data Table A 16
Gross value added in the production of goods1, by branches
in USD PPP 2000, averages of the years, period 1862-2010
Averages Total Trade Transportation, Financial activities,
Public administration
Education,
of Communications, Agriculture, Real estate transactions,
years others insurances Health, others2
army assistance
million USD
million USD
million USD million USD
million USD million USD million USD
1 2 3 4 5 6 7 8
1862-1866 639 318 162 0.9 75 82
1867-1871 692 356 171 1.5 71 92
1872-1876 762 408 180 0.9 70 102
1877-1881 1012 594 215 2.3 87 114
1882-1886 1211 707 235 10 129 130
1887-1890 1076 707 280 17 191 149
1891-1895 1644 901 305 41 226 172
1896-1900 1742 896 339 59 260 204
1901-1905 1990 1015 404 67 257 247
1906-1910 2469 1293 447 90 344 294
1911-1914 1532 1605 512 174 439 346
.................................................................................................................................................................................. .............
1920-1924 4995 2748 691 366 441 748
1925-1929 6516 3033 1170 533 849 931
1930-1934 6896 2230 1302 327 2015 1022
1935-1939 7699 2999 1181 228 2179 1112
1940-1944 5301 1438 902 95 2059 808
1945-1947 1115 928 889 28 398 835
............................................................................................................................. ..................................................................
1950-1954 7357 1774 1637 467 770 1133 1134
1955-1959 9848 2673 2462 617 1048 1518 1531
1960-1964 13385 3167 3796 900 1516 2174 1832
1965-1969 20040 4868 5554 1336 2096 3400 2786
1970-1974 28014 5813 8680 2038 3118 5109 3256
1975-1979 43087 9614 13014 3383 3342 8272 5445
1980-1984 56552 12875 14885 6191 4962 7689 9950
1985-1989 60788 14090 16723 5051 5467 8976 10479
1990-1994 64281 20553 14683 7314 5620 8313 7798
1995-2000 76144 22823 16879 4556 6190 8141 17555
2001-2005 96825 30139 17494 2499 6448 8867 25910
2006-2010 130753 50152 24392 3141 4586 9198 34089
Source: Calculated based on the Table A17 data;
Note: ¹ and ², see notes 1, 2, 3, of Table A 17.

60
Summarized statistical data Table A 17
Gross value added in the production of goods, by branches
in USD PPP 2000, annual series, period 1862-2010
Year Total Trade Transportation, Financial activities,
Public administration,
Education, Real estate transactions3
Communications agriculture,
others2 insurances army health, others
social assistance
million USD
million USD
million USD million USD
million USD million USD
million USD
1 2 3 4 5 6 7 8
1862 607 300 158 - 69 80
1863 632 325 160 - 67 80
1864 697 367 162 - 84 84
1865 637 304 163 - 84 86
1866 621 297 166 0.9 73 85
1867 615 299 166 1.0 62 88
1868 723 386 168 1.5 77 92
1869 695 355 172 1.6 74 94
1870 707 367 174 1.5 71 95
1871 718 373 176 1.7 73 96
1872 721 375 177 0.9 68 101
1873 739 379 187 0.8 72 101
1874 736 388 176 1.3 70 102
1875 754 399 178 1.0 73 104
1876 860 500 183 0.6 68 109
1877 967 537 241 0.6 79 110
1878 1024 591 222 2.5 100 111
1879 990 594 203 1.3 79 114
1880 1032 629 203 0.4 84 116
1881 1045 618 209 6.8 93 125
1882 1124 670 223 6.2 102 129
1883 1213 717 235 11 127 134
1884 1147 646 233 11 127 141
1885 1260 728 239 12 149 144
1886 1310 775 244 12 142 149
1887 1339 662 257 14 263 157
1888 1271 683 269 13 157 162
1889 1349 749 291 13 145 164
1890 1420 732 303 29 198 187
1891 1577 838 318 31 228 193
1892 1577 855 298 35 221 203
1893 1695 983 309 38 193 210
1894 1705 938 300 50 239 228
1895 1668 890 298 49 247 233
1896 1789 962 317 50 272 238
1897 1644 880 321 58 271 172
1898 1873 994 359 61 259 261

61
Years Total Trade Transportation, Financial activities,
Public administration,
Education,
communications, agriculture, Real estate transactions3,
others2 insurances army health, others
social
assistance
million USD
million USD
million USD million USD
million USD million USD million USD
1 2 3 4 5 6 7 8
1899 1630 771 334 62 248 277
1900 1773 873 365 63 249 286
1901 1923 985 395 65 246 297
1902 1951 1006 403 68 237 305
1903 1983 1006 410 65 255 312
1904 1854 907 380 64 248 319
1905 2238 1170 431 75 298 339
1906 2386 1298 441 73 298 349
1907 2290 1262 365 88 291 372
1908 2355 1178 450 89 345 382
1909 2473 1229 475 92 370 399
1910 2840 1495 503 108 417 425
1911 3089 1674 538 134 414 463
1912 3138 1679 525 164 432 502
1913 3133 1665 487 187 443 538
1914 2945 1404 499 213 467 575
............................................................................................................................. ...............................................................
1920 3989 2032 589 337 375 993
1921 4805 2591 688 342 484 1042
1922 4899 2687 700 367 405 1107
1923 5478 3151 681 383 451 1195
1924 5802 3279 798 402 490 1235
1925 5646 2788 956 425 592 1310
1926 6374 3158 1039 506 763 1414
1927 7039 3186 1439 555 932 1482
1928 6657 2992 1191 564 953 1521
1929 6863 3039 1227 612 1004 1593
1930 7259 2434 1366 673 1781 1678
1931 7358 2307 1404 363 2273 1374
1932 6630 2083 1401 235 1888 1258
1933 6441 2069 1201 182 1959 1212
1934 6791 2260 1139 182 2174 1218
1935 7337 2676 1205 196 2199 1257
1936 7636 2903 1155 243 2247 1331
1937 8037 3358 1193 234 2130 1356
1938 7679 3055 1224 244 1985 1415
1939 7807 3005 1129 225 2336 1337
1940 5355 1666 942 149 1807 940
1941 5711 1501 1046 84 2282 882
1942 5656 1464 972 84 2330 890
1943 5832 1499 813 95 2601 919
1944 3953 1060 737 63 1276 880
1945 2944 798 832 30 455 859
1946 2976 923 848 26 345 860

62
Years Total Trade Transportation, Financial activities,
Public administration,
Education, Real estate transactions
communications, agriculture,
others2 insurances army health, others
social assistance
million USD
million USD
million USD million USD
million USD million USD million USD
1 2 3 4 5 6 7 8
1947 3314 1063 988 26 395 868
............................................................................................................................. ............................................................. 1950 5911 1970 1185 353 596 903 904
1951 7462 2513 1471 459 751 1132 1136
1952 7264 2241 1669 459 759 1101 1035
1953 7839 2089 1866 529 868 1245 1242
1954 8307 2358 1993 533 875 1284 1264
1955 9421 2593 2201 603 1023 1503 1498
1956 9150 2739 2367 533 896 1302 1313
1957 10095 2702 2533 639 1083 1559 1579
1958 9888 2666 2551 603 1048 1489 1531
1959 10689 2667 2657 709 1189 1736 1731
1960 11364 2737 3062 780 1316 1895 1574
1961 12367 2903 3408 850 1436 2046 1724
1962 12991 3064 3729 850 1454 2099 1795
1963 14309 3262 4237 956 1612 2286 1956
1964 15892 3868 4541 1062 1764 2544 2113
1965 17069 3982 4946 1132 1926 2773 2310
1966 18482 4553 5045 1245 1933 3172 2534
1967 20388 5131 5627 1351 2050 3433 2796
1968 21596 5251 6001 1422 2194 3676 3052
1969 22666 5422 6153 1528 2374 3948 3241
1970 24247 4915 8263 1633 2519 4170 2747
1971 25882 5735 7486 1740 3141 4731 3049
1972 27568 5785 8228 1981 3246 5033 3295
1973 29769 6192 9134 2388 2985 5552 3518
1974 32604 6437 10285 2447 3700 6056 3679
1975 34533 6224 11153 2841 2813 6963 4539
1976 38344 7452 11927 3138 3100 7690 5037
1977 43048 9830 12752 3385 3344 8284 5453
1978 48410 11619 14762 3641 3591 8889 5908
1979 51101 12946 14478 3912 3859 9536 6370
1980 55279 13275 15454 4557 4755 7331 9907
1981 57301 13483 15466 4759 4957 8129 10507
1982 53023 12379 14442 4745 4745 7427 9285
1983 57340 12256 14225 8316 5252 7441 9850
1984 59817 12984 14838 8578 5101 8115 10201
1985 59763 13667 15288 5559 5791 9266 10192
1986 59013 13509 15879 4977 5214 9006 10428
1987 64534 15058 19121 5258 5497 8844 10756
1988 63283 15226 18319 4758 5234 8802 10944
1989 57346 12992 15008 4704 5600 8960 10082
1990 56037 13111 12265 5709 5921 9727 9304
1991 64067 24854 12335 4787 5707 9205 7179

63
Years Total Trade Transportation, Financial activities,
Public administration,
Education, Real estate transactions
communications, agriculture,
others2 insurances army health others
social
assistance
million USD
million USD million USD million USD million USD million USD million USD
1 2 3 4 5 6 7 8
1992 68133 23998 14264 8894 5706 8055 7216
1993 65571 20097 17031 8686 5280 7324 7153
1994 67596 20704 17518 8494 5486 7255 8139
1995 68428 19903 14595 9477 7013 8340 9100
1996 72338 23061 17740 5913 6110 8870 10644
1997 71256 21099 16657 3146 4997 6478 18879
1998 78248 23439 16390 3172 6344 8459 20444
1999 80599 23849 17234 2959 5745 8704 22108
2000 85995 25585 18656 2665 6929 7995 24165
2001 85594 24997 19552 2572 6347.0 7811 24315 2002 92013 26020 20596 2350 6652.0 8571 27824 2003 95290 29295 22406 2145 7137.0 8851 25456
2004 101265 32621 24887 2670 5987.0 9426 25674
2005 109981 37763 27368 2756 6118.0 9674 26302
2006 118348 44262 29271 2804 5044.0 8970 27997
2007 136257 49942 31100 3147 4899.0 8851 38318
2008 142243 55596 32312 3385 4580.0 9682 36688
2009 133144 49737 28880 3137 4137.0 9634 37619
2010 123767 51221 26398 3230 4268.0 8851 29799
Source: The data are calculated based on the adequate tables in sections B, C, D.
Notes: 1 The services by categories of resources, sectors, in the three intervals: 1862-1947, 1950-1979 and 1980-2010 were
calculated, recalculated by following the same principles, yet the operations which were performed are specific, conditioned by the data sources. The main part of the accounts can be found in the three sub-periods: transportation and
communications; trade; financial-banking and insurance activities; administration, army; education, research, health, social assistance; real estate transactions, etc. The other services are presented below and in the sources, for certain sub-periods: maintenance of roads, streets and bridges, commune household, in the years 1950-1979; using the houses in ownership, rent: in the intervals 1962-1947 and 1950-1979; employed household personnel between 1862-1947 and 1950-1979; liberal professions in the years 1862-1947, real estate transactions in the interval 1980-2010 and for the years 1950-
1979 were estimated in accordance with the 4% average in the GDP in the years 1980-1985. Therefore, the data about certain services in certain time intervals do not appear in the sources; furthermore, the names of the services were modified several times, since the second half of the 21st century until now in the classifications of the national accounts.
The official statistical sources do not always mention the equivalence between the old terms and new ones.
In accordance with the accounting methodology of the national accounts, the gross added of these services expressly
mentioned in the statistical sources of the years 1980-2010, as household employed personnel, liberal professions, rent, which is calculated yet classified in the “others” chapter; they could not stand out. For the sub-period 1862-1947 the gross
added value for the real-estate transactions due to the difficulties of information; liberal professions and in the 1950-1979
period due to the specificity of the state economy did not have a significant share in the national income, thus they are not
in the statistical data. In order to obtain a relatively unitary presentation on groups of services, we cumulated, besides the accounts that cover the entire period, the services mentioned without continuity (column 9) in a single group, except for the account of communal household, maintenance of roads, bridges which was classified in the transportation and
communications group. Therefore, the size of the indicators of these groups, as well as their share in the total services, shall be manifested as inherent deviations to their composition from different sub-periods. We would like to highlight for the interested reader, that all categories of mentioned services are presented and explained in each of the three Sections B,
C, D of Part I volume I, 2012 edition.
² As of 1950 until 1979 the communal household and locative activities and roads and bridges maintenance are calculated.
³ As of 1980 the statistics present the real-estate transactions account and others; the real estate transactions
were also calculated for the period 1950-1979.

64
Summarized statistical data
Table A 18
Structure1 of the gross added value in the production of services, by branches,
averages of the years, period 1862-2010
- % -
Averages Total Trade Transportation, Financial activities,
Public administration,
Education, Real estate,
of communications, agriculture,
years others insurances health others2
army social
assistance
1 2 3 4 5 6 7 8
1862-1866 100 49.8 25.4 0.1 11.8 12.9
1867-1871 100 51.4 24.8 0.2 10.3 13.3
1872-1876 100 53.5 23.8 0.1 9.3 13.4
1877-1881 100 58.7 21.3 0.2 8.6 11.2
1882-1886 100 58.4 19.4 0.8 10.6 10.7
1887-1890 100 52.6 20.8 1.3 14.2 11.1
1891-1895 100 54.7 18.6 2.5 13.7 10.5
1896-1900 100 50.9 19.3 3.4 14.8 11.7
1901-1905 100 50.9 20.3 3.4 12.9 12.5
1906-1910 100 52.4 18.1 3.6 13.9 12.0
1911-1914 100 52.1 16.7 5.7 14.3 11.2
….…………................................................................................................................................................................................ 1920-1924 100 54.8 13.9 7.4 8.9 15.0
1925-1929 100 46.7 17.9 8.1 12.9 14.4
1930-1934 100 32.3 18.9 4.7 29.3 14.9
1935-1939 100 38.9 15.4 3.0 28.3 14.4
1940-1944 100 27.2 17.1 1.8 38.3 15.6
1945-1947 100 30.1 28.9 0.9 13.0 27.2
……………............................................................................................................................................................................... 1950-1954 100 30.5 22.1 6.3 10.4 15.4 15.3
1955-1959 100 27.2 25.5 6.3 10.6 15.4 15.0
1960-1964 100 23.7 28.3 6.7 11.3 16.3 13.7
1965-1969 100 24.3 27.8 6.7 10.5 16.9 13.8
1970-1974 100 20.8 31.0 7.2 11.1 18.2 11.6
1975-1979 100 21.9 30.4 7.9 7.8 19.3 12.7
1980-1984 100 22.8 26.4 10.9 8.8 13.6 17.5
1985-1989 100 23.2 27.4 8.3 9.0 14.8 17.3
1990-1994 100 31.7 22.8 11.3 8.8 13.1 12.3
1995-2000 100 30.0 22.2 6.2 8.2 10.7 22.7
2001-2005 100 31.1 18.1 2.6 6.7 9.2 26.7
2006-2010 100 38.4 18.7 2.4 3.5 7.0 26.1
Source: Calculated based on the data in Table A 16
Notes: ¹ and ², see notes 1, 2, 3, of table A 17.

65
Table A 19
Dynamic of the gross added value in the production of services, by branches,
averages of the years, period 1962-2010
- % -
Averages Total Trade Transportation, Financial
activities,
Public
administration, Education,
Real estate
transactions
of communications
agriculture,
years insurances
health others
army social
assistance
1 2 3 4 5 6 7 8
1862-1866 100 100 100 100 100 100 1867-1871 108.5 111.9 105.6 166.7 94.7 112.2 1872-1876 119.3 128.3 111.1 100.0 98.6 124.4 1877-1881 158.6 186.8 132.7 255.6 124.3 139.0 1882-1886 189.8 222.3 145.1 1111.1 148.3 158.5 1887-1890 210.7 222.3 172.8 1888.9 148.1 181.7 1891-1895 257.8 283.3 188.3 4555.6 118.3 209.8 1896-1900 275.5 281.8 209.3 6555.6 155.0 248.8 1901-1905 311.9 319.2 249.4 7444.4 98.8 301.2 1906-1910 386.8 406.6 275.9 10000.0 133.9 358.5 1911-1914 482.1 504.7 316.0 19333.3 127.6 422.0
................................................................................................................................... ...........................
1920-1924 100 100 100 100 100 100 1925-1929 130.5 110.4 169.3 145.6 192.5 124.5 1930-1934 138.1 81.1 188.4 89.3 456.9 136.6 1935-1939 154.2 109.1 170.9 62.3 494.1 148.7
1940-1944 106.2 52.3 130.5 26.0 466.9 108.0
1945-1947˟ 61.6 33.8 128.7 7.7 90.2 111.6
............................................................................................................................. ................................. 1950-1954 100 100 100 100 100 100 100 1955-1959 133.6 150.7 150.4 132.2 136.1 134.0 135.0 1960-1964 181.5 178.5 231.9 192.9 144.7 191.9 161.5 1965-1969 271.7 274.4 339.3 286.3 138.3 300.1 245.6 1970-1974 379.9 327.7 530.3 436.8 148.8 450.9 287.0 1975-1979 584.0 541.9 795.1 725.0 107.2 730.1 480.0 1980-1984 766.8 725.8 909.4 1326.8 148.5 678.6 877.1 1985-1989 824.3 794.3 1021.7 1082.5 110.2 792.2 923.7 1990-1994 871.7 1158.6 897.1 1567.5 102.8 733.7 687.4 1995-2000 1032.5 1286.5 1031.2 976.4 110.1 718.5 1547.5 2001-2005 1313.7 1698.9 1068.8 535.6 104.2 782.6 2284.0 2006-2010 1772.5 2827.1 1490.2 673.2 71.1 811.8 3005.0
Source: Calculated based on the data in Table A 16
Note: Base = 100 in the years 1950-1954
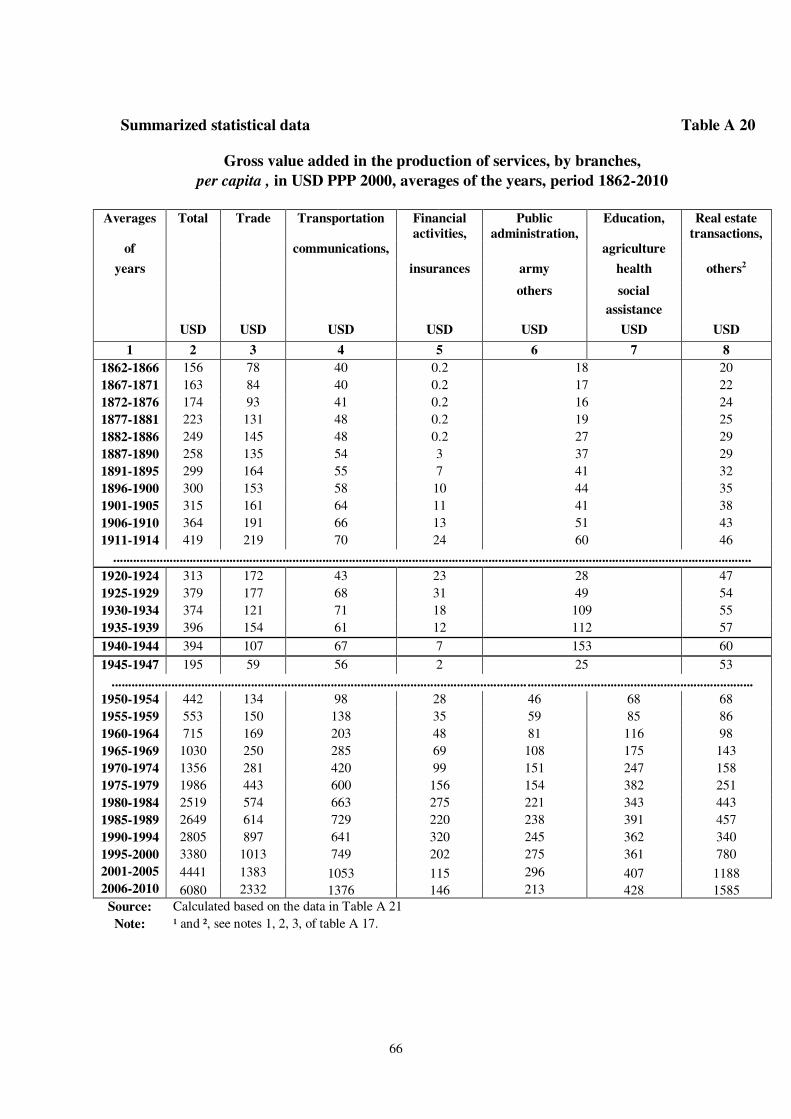
66
Summarized statistical data Table A 20
Gross value added in the production of services, by branches,
per capita , in USD PPP 2000, averages of the years, period 1862-2010
Averages Total Trade Transportation Financial activities,
Public administration,
Education, Real estate transactions,
of communications, agriculture
years insurances army health others2
others social
assistance
USD USD USD USD USD USD USD
1 2 3 4 5 6 7 8
1862-1866 156 78 40 0.2 18 20
1867-1871 163 84 40 0.2 17 22
1872-1876 174 93 41 0.2 16 24
1877-1881 223 131 48 0.2 19 25
1882-1886 249 145 48 0.2 27 29
1887-1890 258 135 54 3 37 29
1891-1895 299 164 55 7 41 32
1896-1900 300 153 58 10 44 35
1901-1905 315 161 64 11 41 38
1906-1910 364 191 66 13 51 43
1911-1914 419 219 70 24 60 46
............................................................................................................................. ...................................................................
1920-1924 313 172 43 23 28 47
1925-1929 379 177 68 31 49 54
1930-1934 374 121 71 18 109 55
1935-1939 396 154 61 12 112 57
1940-1944 394 107 67 7 153 60
1945-1947 195 59 56 2 25 53
............................................................................................................................. ....................................................................
1950-1954 442 134 98 28 46 68 68
1955-1959 553 150 138 35 59 85 86
1960-1964 715 169 203 48 81 116 98
1965-1969 1030 250 285 69 108 175 143
1970-1974 1356 281 420 99 151 247 158
1975-1979 1986 443 600 156 154 382 251
1980-1984 2519 574 663 275 221 343 443
1985-1989 2649 614 729 220 238 391 457
1990-1994 2805 897 641 320 245 362 340
1995-2000 3380 1013 749 202 275 361 780
2001-2005 4441 1383 1053 115 296 407 1188 2006-2010 6080 2332 1376 146 213 428 1585
Source: Calculated based on the data in Table A 21
Note: ¹ and ², see notes 1, 2, 3, of table A 17.

67
Summarized statistical data
Table A 21
Gross value added in the services activity1, by branches,
per capita, in USD PPP 2000, annual series, during the period 1862-2010
Years Total Trade Transportation,
Financial activities,
Public administration,
Education, Real estate
transactions2
communications
agriculture
insurances army health others
others
social assistance
USD USD USD USD USD USD USD
1 2 3 4 5 6 7 8
1862 151 39 75 - 17 20 1863 156 40 80 - 17 19 1864 170 39 90 - 21 20 1865 154 39 74 - 20 21 1866 151 40 72 0.2 18 21 1867 148 40 72 0.2 15 21 1868 172 40 92 0.4 18 22 1869 163 40 83 0.4 18 22 1870 165 41 85 0.4 16 23 1871 166 41 86 0.4 17 22 1872 165 41 86 0.2 16 22 1873 169 43 87 0.2 17 22 1874 169 40 89 0.3 16 24 1875 171 41 91 0.2 17 22 1876 193 41 112 0.1 15 25 1877 216 54 120 0.1 18 24 1878 229 49 132 0.5 22 26 1879 218 45 131 0.3 17 25 1880 227 45 138 0.1 18 26 1881 226 45 134 1.5 20 26 1882 239 48 143 1.3 22 25 1883 254 49 150 2.2 27 26 1884 236 48 133 2.2 26 27 1885 254 48 147 2.3 30 27 1886 260 48 154 2.4 28 28 1887 262 50 130 2.6 51 28 1888 245 52 132 2.6 30 28 1889 257 55 142 2.4 28 30 1890 267 57 138 5.5 37 30 1891 293 59 155 5.8 42 31 1892 291 55 158 6.5 41 31 1893 309 56 179 6.9 35 32 1894 307 54 169 9.0 43 32 1895 296 53 158 8.7 44 32 1896 314 56 169 8.8 48 32 1897 298 55 152 10 47 36 1898 320 61 169 10 44 36

68
Years Total Trade Transportation, Financial activities,
Public administration,
Education, Real estate
transactions2
communications
agriculture
insurances army health others
others social assistance
USD USD USD USD USD USD USD
1 2 3 4 5 6 7 8
1899 273 56 129 10 42 36
1900 293 60 144 10 41 38
1901 314 64 161 11 40 38
1902 315 65 162 11 38 39
1903 315 65 160 10 40 40
1904 286 59 140 10 38 39
1905 346 67 181 12 46 40
1906 362 67 197 11 45 42
1907 343 55 189 13 44 44
1908 348 66 174 13 51 44
1909 360 69 179 13 54 45
1910 408 72 215 15 60 46
1911 436 76 236 19 58 47
1912 434 73 232 23 60 46
1913 426 66 226 25 60 49
1914 379 64 181 27 60 47
---------------------------------------------------------------------------------------------------------------------------------------
1920 257 38 131 22 24 42
1921 305 44 165 22 31 45
1922 307 44 168 23 25 47
1923 338 42 194 24 28 50
1924 353 49 199 24 30 51
1925 338 57 167 25 35 54
1926 377 61 187 30 45 54
1927 410 84 186 32 54 54
1928 383 69 172 32 55 55
1929 389 70 172 35 57 55
1930 402 76 135 37 99 55
1931 405 77 127 20 125 56
1932 360 76 113 13 102 56
1933 345 64 111 10 105 55
1934 359 60 119 10 115 55
1935 384 63 140 10 115 56
1936 395 60 150 13 116 56
1937 411 61 172 12 109 57
1938 389 62 155 12 101 59
1939 392 57 151 11 117 56
1940 403 71 125 11 136 60
1941 428 78 112 6 171 61
1942 419 72 109 6 173 59
1943 427 60 110 7 191 59
1944 288 54 77 5 93 59
1945 187 53 51 2 29 52
1946 188 54 58 2 22 52

69
Years Total Trade Transportation, Financial activities,
Public administration,
Education, Real estate
transactions2
communications
agriculture
insurances army health others
others social
assistance
USD USD USD USD USD USD USD
1 2 3 4 5 6 7 8
1947 208 62 67 2 25 52 ------------------------------------------------------------------------------------------------------------------------ 1950 362 73 121 22 37 55 55 1951 453 89 153 28 46 69 68 1952 442 100 135 28 46 66 69 1953 465 111 124 31 52 74 73 1954 487 117 138 31 51 75 75 1955 544 127 150 35 59 87 86 1956 523 135 157 30 51 74 76 1957 566 142 152 36 61 87 88 1958 548 141 148 33 58 82 86 1959 586 146 146 39 65 95 95 1960 618 166 149 42 72 103 86 1961 666 184 156 46 77 110 93 1962 695 200 164 46 78 112 95 1963 761 225 173 51 86 122 104 1964 840 240 204 56 93 134 111 1965 897 260 209 60 101 146 121 1966 966 264 238 65 101 166 132 1967 1057 292 266 70 106 178 145 1968 1095 304 266 72 111 186 156 1969 1133 307 271 76 119 197 163 1970 1197 408 243 81 124 206 135 1971 1264 366 280 85 153 231 149 1972 1334 398 280 96 157 244 159 1973 1429 439 157 115 143 267 168 1974 1550 489 167 116 176 288 175 1975 1625 525 153 134 132 328 213 1976 1788 556 205 146 145 359 235 1977 1988 589 185 156 154 382 253 1978 2215 675 204 167 164 407 270 1979 2314 657 185 177 175 432 286 1980 2490 696 598 205 214 330 447 1981 2564 692 603 213 222 364 470 1982 2359 643 551 211 211 330 413 1983 2542 631 543 369 233 330 437 1984 2644 656 574 379 225 359 451 1985 2630 673 601 245 255 408 449 1986 2585 696 592 218 228 395 457 1987 2813 834 656 229 240 386 469 1988 2745 795 660 206 227 382 475 1989 2477 648 561 203 242 387 435 1990 2415 528 565 246 255 419 401 1991 2763 532 1072 206 246 397 310

70
Years Total Trade Transportation, Financial activities,
Public administration,
Education, Real estate
transactions2
communications
agriculture
insurances army health others
others social
assistance
USD USD USD USD USD USD USD
1 2 3 4 5 6 7 8
1992 2990 626 1053 390 250 353 317
1993 2882 748 883 382 232 322 314
1994 2974 771 911 374 241 319 358
1995 3017 644 878 418 309 368 400
1996 3200 785 1020 262 270 392 471
1997 3160 739 936 140 222 287 836
1998 3477 728 1042 141 282 376 908
1999 3589 767 1062 132 256 388 984
2000 3833 832 1140 119 309 356 1077
2001 3820 1116 873 115 283 349 1085 2002 4244 1200 950 108 307 395 1283 2003 4385 1348 1031 99 328 407 1171 2004 4672 1505 1148 123 276 435 1185 2005 5086 1746 1266 127 283 447 1216 2006 5483 2051 1356 130 234 416 1297 2007 6327 2319 1444 146 227 411 1779 2008 6615 2585 1503 157 213 450 1706 2009 6202 2317 1345 146 193 449 1752 2010 5775 2390 1232 151 199 413 1390
Source: Calculated based on the data from the tables corresponding to sections B, C, D.
Note: ¹ and ², see notes 1, 2, 3, of table A 16.

71
Section B
THE GROSS DOMESTIC PRODUCT OF ROMANIA
DURING 1862-1947 Historical and methodological introduction
Section B of our study aims to present, in the form of summarized statistical
statements, the results of the researches regarding the gross domestic product of Romania
during the period 1862-1947, expressed in the macro aggregates chain at the level of the
national economy. This section represents a systematic and focused summary of the
calculations and methods presented in a detailed manner in the Volume II of our previous
paper, the Romanian edition-201210.
The researches and presentation of their outcomes, regarding the gross domestic
product of Romania during the period 1862-1947, represent the backbone that was completed
until 2010, by recalculating and matching the GDP indicators of the period 1950-2010 in the
official statistics.
From this perspective we will explain the manner in which the GDP data were
converted from national currency - comparable lei 1913 - to USD PPP 2000, necessary in
order to understand the general benchmark of comparing the entire period 1862-2010. First of
all, the indicators expressed initially in lei 1913 were converted into gold USD 1913, by the
metal parity of 5.18 lei gold = 1 USD gold; between 1890 and 1913 the gold ounce - 31.101g
- had a price of 20.67 USD and 1 USD = 1.505 g of fine gold; in the same period, 1 lei
contained 0.2903 g of fine gold, thus the ratio between the two currencies being 1:5.1811.
In the context of that time, the benchmark utilized at the global level was of gold
specie standard, based on the right of stamp gold coins and on the free circulation of gold on
the market, in the form of coins and gold bars, domestically, as well as among different
countries. This ensured that the nominal value of the coins would be equivalent with the
commercial value of the gold that they contained; the free circulation of gold had as result the
fact that the value of the precious metal from one country was equivalent to its value in all
countries; under the circumstances in which until the first World War, the tariff barriers had
10 Victor Axenciuc, Produsul intern brut al României 1862-2000, Volume I; Produsul intern brut 1862-1947, Volume II, Edit. Economică, Bucureşti, 2012. 11 It has to be mentioned that the leu, in the national monetary system, adopted in 1867, officially losses for the first time the capacity to be converted in 1916 and the second time in 1941, after the stabilization in 1929; it regains it only in the tenth decade of the 20th century. The USD capacity to be converted was suspended in 1973; the American currency, without the capacity to be converted, entered an obvious inflationary process. If between 1913-1973, in 60 years, the depreciation index of the USD GDP increased by 24.5 percentage points out of 100 in the interval, 1973-2000, in only 27 years, the index increased by 68.2 percentage points. The non-convertible USD is fluctuates much more, depending on the index of the prices and the purchasing power.

72
low levels, in international trade, maintaining a relatively balanced ratio between the price of
gold at the global level and the price of the goods that it expressed was maintained. The
situation also manifested in the case of the exchange rate remained very stable; in 22 years
between 1892-1914, the Bucharest stock exchange for 100 francs Gold, the minimum value
was 100.10 lei and the maximum one of 101.75 lei, and for a pound was 25.22 lei and 26.68
lei respectively. Based on the metal parity the exchange rate was close to the purchasing
parity, being both tightly correlated. That is why, during the mentioned period, inmedium and
long term economic studies, the issue of comparing data, nominal indicators was not
questioned.
Therefore, using as base for the metal parity the equivalent of the two convertible
currencies, lei and USD in 1913, of 1 USD=5.18 lei, considered based on the above
arguments, as being hypothetically close to the purchasing power parity, we can accept, as a
plausible option, the change the indicators initially expressed in lei 1913 in USD PPP 1913
until we find a better solution.
Nevertheless, the USD 1913 currency is one century far from the current perception of
the USA benchmark currency. The studies regarding the GNP and GDP of different countries
mostly use the USD at the purchasing power parity, by transforming the national currencies,
in the time horizon of the period 1990-2000.
In our calculations presenting the macroeconomic synthesis indicators, the benchmark
currency is the international USD of 2000; the 1913 USD is the transition currency for the
1862-1947 period, from the national currency to the international benchmark; the 2000 USD
represents its current version. In order to make comparisons of the global indicators for the
entire period 1862-2010, we cannot use the national currency, the leu; as a general rule, the
international USD is utilized, represented by the USD PPP for different years and accepted by
the international monetary and statistical institutions.
By calculations, the GDP indicators were converted from comparable lei 1913 to USD
PPP 1913 and then to the currency of 2000. In order to convert the 1913 USD in USD 2000 at
the purchasing power parity - PPP - we used the depreciation rate of the USD, calculated in
the paper of Samuel H.Williamson12. The depreciation of the USD is the year 2000 is 13.6
times compared to the year 2013.
We have adopted the method of using the price depreciation coefficient of USA GDP
instead of the consumer price depreciation coefficient, since lately the international studies
12 Samuel H.Williamson, Six Ways to Compute the Relative Value of a U.S.Dollar Amount, 1774 to present. Measuring Worth, 2008.

73
consider this solution as being more plausible for indirectly expressing the relative purchasing
parity.
Regarding the conversion calculations presented above, it has to be mentioned that the
average prices of 1913, expressed in lei 1913 and transposed in USD 1913, at the PPP, derive
from the structures of the Romanian economy of the said year; the conversion period contains
the indicators of the previous interval, from 1862 to 1913, and the next interval, 1920-1947,
the structural changes not being fully reflected through the prices, which affect, in a certain
manner, the comparison capacity. A mitigating circumstance is that of maintaining the
economy, along this period, mainly as agrarian profile; the share of the intermediary
consumption and respectively, of the gross added value with small changes between 1862 and
1947 confirms this. This observation refers also to converting USD PPP 1913 in USD PPP
2000 by the depreciation coefficients that were utilized. Therefore, the calculation modalities
which were used and the limitations mentioned induce a certain level of relativity in the value
of the GDP indicators expressed in PPP USD 2000, which cannot be avoided, yet which shall
be taken into account by the reader or the user of these aggregates.
Therefore, by excluding as non-efficient the transformation of the value data from the
national currency - lei - into the international comparable currency - USD - using the
exchange rates for these currencies, on the one hand, and taking into account that the author
of this paper was not able to develop, through his own means, an equivalence computation of
the GDP from lei into USD through the purchasing power parity of the two currencies, for
such a long period of time, for the purpose of this paper the hypothetical procedure of the
simplified calculation as shown above will be used.
In order to open the picture of the outcome indicators evolution of the economic
process during the 1862-1947 interval, we will display first of all some basic elements of the
human and material potential, as well as of the social production of the country during
this period of time.
In the Romanian agrarian economy, and afterwards mainly agrarian, during the
analyzed period, the essential role in producing value was held by first of all the human
potential and natural resources. As the modernization took place and the technical means
were assimilated, especially in the extraction and processing branches, the efficiency of the
social labor increased, as well as of resources utilization, and therefore, the production of
goods and services also increased. Some of the main factors of the economic and social
potential, in the dynamic of the period, are as follows:

74
Table Ba
Total, active, rural population, arable surface and installed capacity in the industry, per selected years, 1862-1947
The total and active population in parallel, as fundamental factor of production,
increased 1.9 times during the period 1862-1914, respectively almost doubled; out of this, the
rural population represented, on average, 82%, the Romanian society having a predominantly
peasant basis.
During the inter-war decades, 1920-1939, which started by doubling the population,
following the unification of the country in 1918, the demographic potential increased by 28%,
Romania's population reaching in 1939 almost 20 million inhabitants. In a harmful decade,
after 1939, due to the territorial dismantling of 1940, the World War, its consequences and
peace treaties, the population of the country was reduced almost to the limit of the year 1920,
was cut down to 15.9 million inhabitants. The demographic potential represented, in an
economy structured on extensive development, the driver of economic growth.
The second major potential element, specific to the economy of Romania during that
period was the productive surface, especially the arable land, which ensured most of the
agricultural production. In half a century, 1862-1914, the arable land, exceeding the growth of
the population, was extended more than twice, from 3 to 6.4 million hectares, mainly due to a
decrease in the surface of pastures and meadows to half of their initial surface. That was the
period of great trenching which was finalized by an excessive high ratio of grains within the
agriculture.
Years1
Population Share of
rural population
%
Arable surface Engine
power in the industry Total
thousand
inhabitants
inhabitants per km2
Active persons
thousand thousand
ha
ha per 100
inhabitants
thousand kw
kw per 100 inhabitants
1 2 3 4 5 6 7 8 9
1862 4019 33 2243 82.8 2982 74 — —
1882 4688 36 2616 82.8 5145 110 — — 1900 6045 46 3373 81.2 5980 99 38.9 0.6 1914 7771 56 4334 82.0 6327 81 146.6 1.9
1920 15541 53 9076 77.8 10695 69 (390) 2.5 1939 19934 68 11641 81.8 13384 67 1250 6.3
1942 13486 69 7878 78.6 8437 63 1155 8.6
1947 15893 67 9885 76.6 9094 57 1521 9.6
Source: The data are taken from the Statistical Yearbook of Romania, 1904-1948, and the paper of Victor Axenciuc, Evoluţia economică a României. Cercetări economico-statistice, 1859-1947, Vol.1, 2, 3, Editura Academiei Române, 1992, 1996, 2000. Note: The horizontal lines mark the territorial and patrimonial changes of the country in 1918, 1940 and 1945.
75
During the inter-war years the process continued, yet at a slower pace. What is
significant is the reduction of the arable surfaces per capita due to the big demographic
increases; after six and a half decades, with all the territorial changes, in 1947, each inhabitant
in Romania had only 0.57 ha as compared to 1.1 ha in 1882. The drastic reduction of the
arable surface per capita, in the conditions of maintaining the production processes with
manual labor and handling and low yields, led, after the second decade of the 20th century, to
an absolute reduction of the contribution of the agricultural potential, of its production to
economic growth, to its final results, the gross domestic product.
Another quantifiable element, included among the rationales of its potential, as the
installed capacity of the modern, mechanized industry, a sector with the function of
transforming the production and its economic and social structures; it was the outcome of
innovation and labor, meant to capitalize at a higher level, the human and natural resources. It
was felt in the growth drivers at the beginning of the 20th century with 0.6 kW for 100
inhabitants, reaching in 15 years - in 1914 to 1.9 kW - and steadily increasing in the following
three decades up to 9.6 kW. The industrial technical potential, multiplied by 15 times per
capita and reflected in the same manner in the volume of industrial production, increased its
contribution to the country’s production and led this sector, during the fourth decade, to the
front position of the created value and efficiency in Romania.
In 1939, the large mechanized industry, with 380 thousand persons employed,
produced a gross added value of 1378 mil. lei (1913), while agriculture, with an active
population of 9110 thousand persons, produced a gross added value, together with that of the
household production and transportation with animals of 3677 mil. lei (1913); therefore, the
agriculture registered 404 lei per person and the mechanized industry 3626 lei, 9.1 times
more; it was the difference between the employed manual agricultural labor, with poor
qualification, using half of the working period, rudimentary endowed, on the one hand, and
the mechanized industrial labor and equipment on the other hand. A decrease in the share of
agricultural production and an increase in the share of industrial production in the total
production of goods will be chronologically noticed further on.
Another element of our approach, a condition which directly depends on the size,
structure and evolution of global indicators is the social production of goods and services; the
field of economic and social activities constitutes the solid and safe foundation, in particular
for a country like Romania, of the resources of new created value for the consumption of the
population and for development.
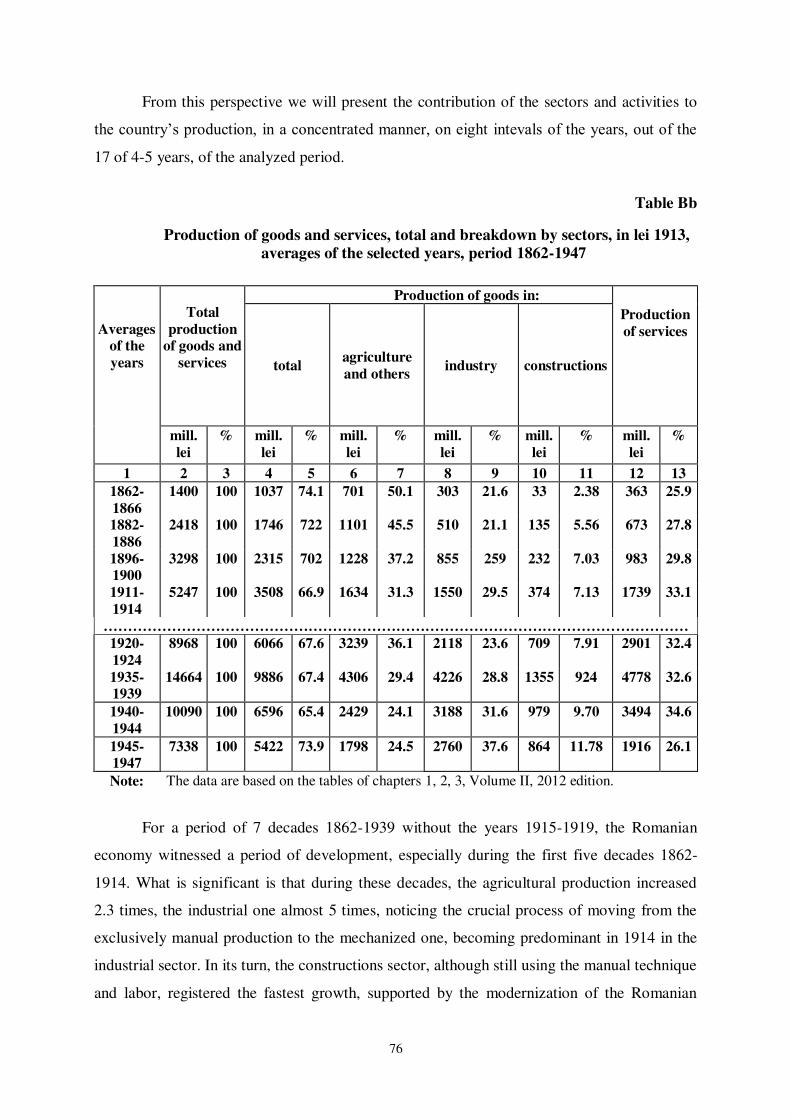
76
From this perspective we will present the contribution of the sectors and activities to
the country’s production, in a concentrated manner, on eight intevals of the years, out of the
17 of 4-5 years, of the analyzed period.
Table Bb
Production of goods and services, total and breakdown by sectors, in lei 1913, averages of the selected years, period 1862-1947
Averages of the
years
Total
production of goods and
services
Production of goods in:
Production
of services
total agriculture
and others industry
constructions
mill.
lei
% mill.
lei
% mill.
lei
% mill.
lei
% mill.
lei
% mill.
lei
%
1 2 3 4 5 6 7 8 9 10 11 12 13
1862-
1866
1400 100 1037 74.1 701 50.1 303 21.6 33 2.38 363 25.9
1882-
1886
2418 100 1746 722 1101 45.5 510 21.1 135 5.56 673 27.8
1896-1900
3298 100 2315 702 1228 37.2 855 259 232 7.03 983 29.8
1911-
1914
5247 100 3508 66.9 1634 31.3 1550 29.5 374 7.13 1739 33.1
………………………………………………………………………………………………………… 1920-
1924
8968 100 6066 67.6 3239 36.1 2118 23.6 709 7.91 2901 32.4
1935-1939
14664 100 9886 67.4 4306 29.4 4226 28.8 1355 924 4778 32.6
1940-
1944
10090 100 6596 65.4 2429 24.1 3188 31.6 979 9.70 3494 34.6
1945-1947
7338 100 5422 73.9 1798 24.5 2760 37.6 864 11.78 1916 26.1
Note: The data are based on the tables of chapters 1, 2, 3, Volume II, 2012 edition.
For a period of 7 decades 1862-1939 without the years 1915-1919, the Romanian
economy witnessed a period of development, especially during the first five decades 1862-
1914. What is significant is that during these decades, the agricultural production increased
2.3 times, the industrial one almost 5 times, noticing the crucial process of moving from the
exclusively manual production to the mechanized one, becoming predominant in 1914 in the
industrial sector. In its turn, the constructions sector, although still using the manual technique
and labor, registered the fastest growth, supported by the modernization of the Romanian

77
society - buildings, urban dwellings, industrial constructions, railways, ports, warehouses,
urban public works. With all these modern developments, the share of the goods sectors in the
total production decreases from 74% at the beginning of the period to 66.9% before the first
World War, with a reduction of 7 percentage points, due to the fast development of services,
their volume being multiplied by 4.8 times in 5 decades, and their share in the total economic
activity increasing from 26% to 33.1%.
Thus, the data confirm that the period between the reign of A.I.Cuza until 1914 had
the most significant development and the biggest economic growth during the entire period,
between the middle of the 19th century until the middle of the 20th century, increasing the
volume of goods and services between 1862-1914 by 53% in each decade.
The losses and destructions endured by Romania and the damage compensations paid
following the two World Wars (1916-1918, 1941-1945), to which the effects of 1929-1933
economic crisis were added, led to a slower economic growth during more than three decades
1915-1947, burdened by big difficulties and deficits; the war, crisis and recovery years
cumulated more than two decades (21years), and those of actual growth of only one decade,
could not compensate and overcome the damages suffered by the national economy.
Table Bc
Production of goods and services, per capita in lei 1913, in the main sectors and dynamics, averages of the selected years, 1862-1947
Averages
Total
production of goods
and services
Production of goods
Total
production
of the
years
agriculture industry constructions of services
lei % lei % lei % lei % lei %
1 2 3 4 5 6 7 8 9 10 11
1862-1866 343 100 172 100 74 100 8 100 89 100
1882-1886 497 145 226 132 105 142 28 350 138 155
1896-1900 561 164 209 122 146 197 39 488 167 188
1911-1914 713 208 222 129 204 275 51 638 236 265
…............................................................................................................................................ 1920-1924 561 164 203 118 133 180 44 550 182 204
1935-1939 751 219 221 128 216 292 69 863 245 275
1940-1944 748 218 180 105 236 319 73 913 259 291
1945-1947 464 135 114 66 175 236 55 688 121 136
Note: Calculations based on the data in Table Bb and the population of the country.

78
Therefore, after the development was balanced, following the unification of the
country - 1918 - and after the material and human patrimony increased 2.1-2.3 times, the fifth
decade, with territorial splits, big war costs, damages and the burden of the economic ruin and
the external debt, pushed the global production per capita until 1947 seven decades
backwards, as it results from the table below. This was the legacy of Romania at the
beginning of the second half of the 20th century.
The Table Bc shows the production of the main sectors of goods and services, per
capita, in parallel with their indexes with the base = 100 at the beginning of the period - 1862
- 1866. In this respect, the evolution seems to be different from the one presented in the
previous table. First of all, the total production shows for the first part of the interval, until
1914, only a doubling - 208%; after its reduction in the period 1920-1924, until the end of the
fourth decade, there is an increase of only five percentage points per capita; however, in the
war years until 1947 the decline fell severely, from 218% to 135%, as compared to 100% at
the beginning of the period - 1862-1866. On the other hand, the sectors evolve in a different
manner; the agricultural production, in five decades, until 1914 witnessed a development of
only 29% per capita, and at the end of the inter-war years, its level remained the same as the
average of 1911-1914. Among all the sectors the agricultural production, as compared to the
100% level of 1862-1866, encountered the most significant decrease, to 105% during the
Second World War - 1940 - 1944 - and to 66% in the post-war period - 1945 - 1947 -
respectively a fall with one third - 34% - below the initial average of - 1862-1866.
Agriculture, having an important share in the total production and population of the country,
hit by the drought of the two post-war years 1945 and 1946 negatively influenced the state of
the entire social and economic situation.
The trajectory of the industry looks totally different; under the qualitative aspect, it
recorded, as mentioned, a deep transformation under the circumstances of the industrial
revolution, and, from the quantitative aspect, it marked an increase per capita of 176% until
1914, but only by 16 percentage points during the inter-war years as compared to the level of
1914; the second World War requires the industrial production for the army, which acquires,
as compared to the previous interval, an additional 27 percentagepoints; yet, during the first
years of the recovery, until 1947, its advance was substantially lost, respectively 83
percentagepoints.
The constructions, required by the modernization of the country, are the sector with
the biggest increases per capita until 1914, namely 6.4 times; their production increased until
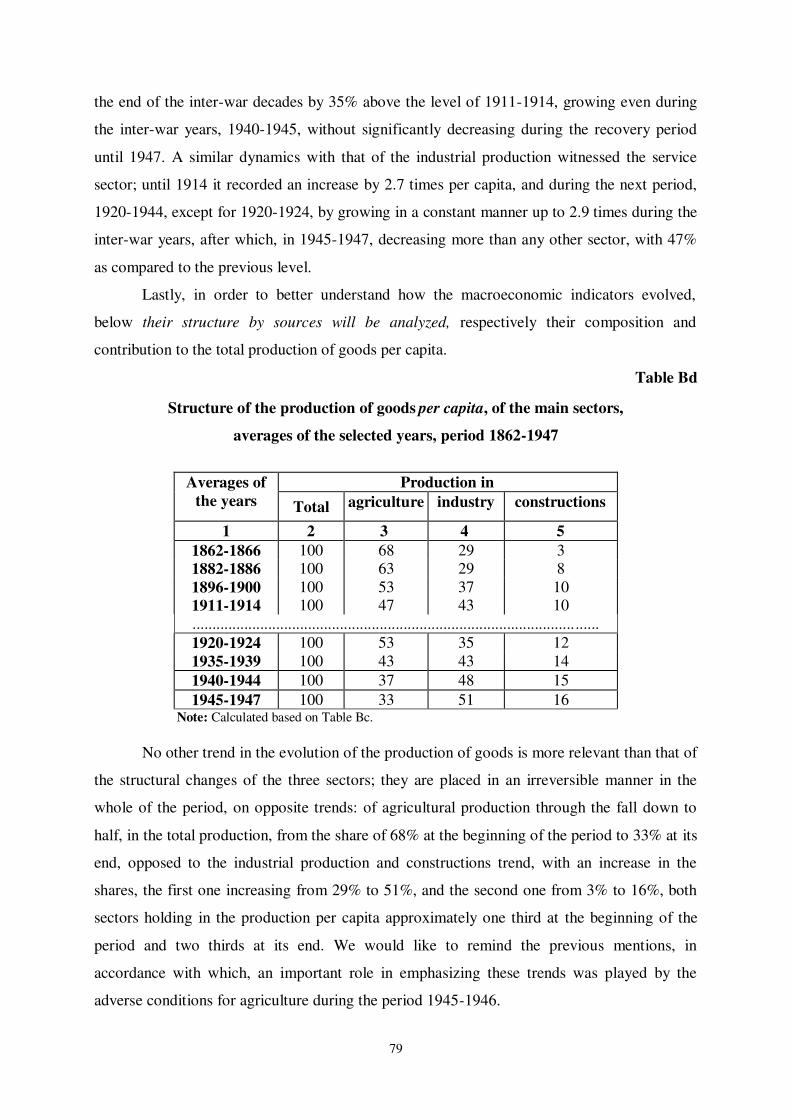
79
the end of the inter-war decades by 35% above the level of 1911-1914, growing even during
the inter-war years, 1940-1945, without significantly decreasing during the recovery period
until 1947. A similar dynamics with that of the industrial production witnessed the service
sector; until 1914 it recorded an increase by 2.7 times per capita, and during the next period,
1920-1944, except for 1920-1924, by growing in a constant manner up to 2.9 times during the
inter-war years, after which, in 1945-1947, decreasing more than any other sector, with 47%
as compared to the previous level.
Lastly, in order to better understand how the macroeconomic indicators evolved,
below their structure by sources will be analyzed, respectively their composition and
contribution to the total production of goods per capita.
Table Bd
Structure of the production of goods per capita, of the main sectors,
averages of the selected years, period 1862-1947
Averages of
the years
Production in
Total agriculture industry constructions
1 2 3 4 5
1862-1866 100 68 29 3 1882-1886 100 63 29 8 1896-1900 100 53 37 10 1911-1914 100 47 43 10 ......................................................................................................
1920-1924 100 53 35 12 1935-1939 100 43 43 14
1940-1944 100 37 48 15
1945-1947 100 33 51 16 Note: Calculated based on Table Bc.
No other trend in the evolution of the production of goods is more relevant than that of
the structural changes of the three sectors; they are placed in an irreversible manner in the
whole of the period, on opposite trends: of agricultural production through the fall down to
half, in the total production, from the share of 68% at the beginning of the period to 33% at its
end, opposed to the industrial production and constructions trend, with an increase in the
shares, the first one increasing from 29% to 51%, and the second one from 3% to 16%, both
sectors holding in the production per capita approximately one third at the beginning of the
period and two thirds at its end. We would like to remind the previous mentions, in
accordance with which, an important role in emphasizing these trends was played by the
adverse conditions for agriculture during the period 1945-1946.

80
After we presented some prerequisitesof the final outcomes of the Romanian
economy, we focus the evolution and structure of thegross domestic product in certain
important aspects; however presenting the outcomes of a significant volume of statistical data
is done only in a summarized terms.
The chronological benchmarks of the indicators are only averages of the years,
selected in such a way as to reflect, in the best possible manner, the evolution and trends of
the real phenomena. Thus, out of 17 intervals, as averages of 4-5 years, as included in the
period 1862-1947, in order to be concise when presenting the facts and point out the basic
milestones of development, we selected six intervals as being the most significant ones; 1862-
1866 and 1911-1914; 1920-1924 and 1935-1939; 1940-1944; 1945-1947. They facilitate a
substantiated image of the outcomes evolution of global outcomes of the national economy;
of course, the summarized presentation of the synthetic data is far from being an analysis of
the indicators; it will be performed for different purposes and in different manners by the
interested researches.
The first picture of the gross domestic product’s evolution, total and related to the
number of inhabitants is presented below in rounded up figures.
Table Be
Evolution of the gross domestic product, in lei 1913, in dynamic and per capita,
averages of the selected years, period 1862-1947
1862-
1866
1911-
1914
1920-
1924
1935-
1939
1940-
1944
1945-
1947 1 2 3 4 5 6 7
Total gross domestic product,
million lei
861
3363
5466
8508
5665
4045
Dynamics (%) 100 391 635 988 658 470
per capita, lei 211 458 345 436 420 256
Dynamics(%) 100 217 162 207 199 121 Note: Based on Table B1
Romania’s economic efforts resulted in a steady increase in the production of goods
and services during half the century 1862-1914, a relatively peaceful period, of uninterrupted
transformation and modernization, in contrast with the period of the next three decades 1915-
1945, marked by two wars and economic crises, with negative impact for the economy. In the
time interval until 1914, the total added value increased 3.9 times, and the GDP correlated
with the population, which grew 1.8 times, increased 2.17 times per capita, respectively

81
doubled based on a growth rate specific to agrarian economiesat the beginning of the
transition towards agrarian-industrial structures.
What led to a significant economic progress in this half of century was not due to
radical qualitative transformations in the structure of the productive forces of the country,
besides the emergence of mechanized industry and transportation, nor of new qualitative
models of labor organizing; the agriculture, with its foundations inherited from Cuza, with the
big property and big cereal farms, with the agricultural undertakings burdensome for the
peasants, drove the pace and structure of the entire economic-social evolution, under the
effects of modernization, institutional and legislative westernization, as well as urban literacy.
The inter-war decades,13 dragged by a post-war recovery period of 5-6 years and by
the economic crisis, especially the agrarian one - 1929 - 1936 - registered an average increase
per capita by 29%, the level of 207% reached in the average of the period 1935-1939, being of
96% compared to the pre-war period (217%), and this mainly due to the decline of
agriculture.
The essential conclusion of these findings is that the highest level of the GDP per
capita, of the 1934-1939 averages was a few percentage points lower than that of the pre-war
period; it is more damaging taking into account that in the upstream there was a higher and a
more qualitative potential than before the First World War. Thus, in the modern period of the
country, the highest level of economic activities, expressed in the GDP indicator per capita,
was recorded in the 1911-1914 averages. It cannot be denied that, during the inter-war
13After the national enthusiasm emerged by the unification of the country in 1918 it was exhausted and at the end of a destructive war, and especially due to the joy and hope of the peasants becoming owners, the ruling classes were faced with the following dilemma: what route would ensure progress after the disappearance of the big agricultural holdings that supported development for half a century. Different solutions were proposed and discussed starting from the existing sources: progress through the development of the peasants’ production and even more, a peasant type of country as an expression of the predominant human potential - more than 80% of the population from the rural area. This did not prove to be feasible; small production does not have power to develop; it did not succeed anywhere around the world. The second modality, following the Western model, of industrialization was tempting and convincing. However the Romanian economists of that period, focusing more on the political and didactic activities, and supporters of projects did not make any calculations regarding the costs, required resources, funding, in order to promote a level of household profitability, or in order to promote the industrialization. Today, after nearly a century, when prognosis has become a fundamental science to forecast the future and necessary instrument for programming, starting from enterprises level up to the national level, no projects are developed without taking into account all the quantifiable resources and their efficiency. During the inter-war years, in accordance with the Romanian economic science, expressed through the opinions of certain important thinkers, with only a few exceptions, certain aspects were measured in regard to the need and efficiency of the national economy (see M. Manoilescu, Mitiţă Constantinescu); nevertheless they did not go any further. The Romanian economic science of the past, due to the fact it was eulogized and because of the patriotic feelings especially of the experts in economic doctrines during the second half of the 20th century, did not perform any analyses thoroughly quantified, neither regarding the national economic body, nor regarding its failures and solutions and achievable perspectives; it was the arena of opinions and disputes, where the subjective political class was too often present, directly or from the shadow. This was also expressed by the low number of Romanian economists like N. Georgescu Röegen, M. Manoilescu, Gr. Mladenatz being present in European economics.
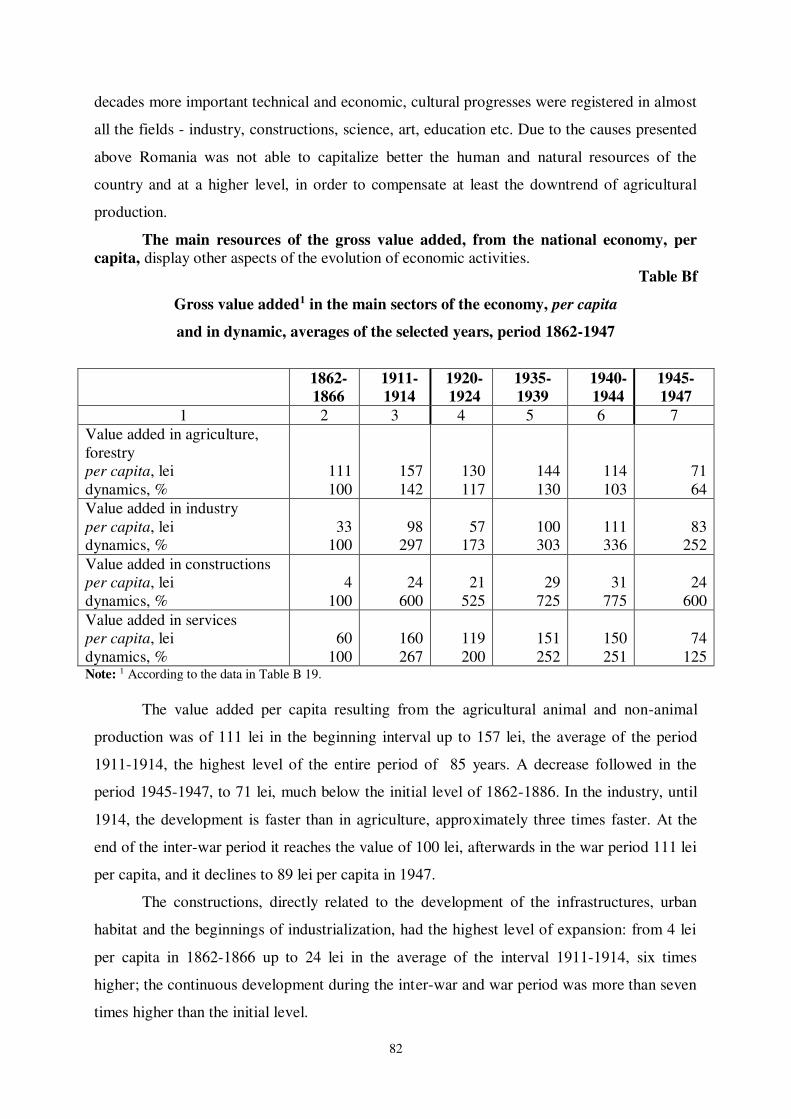
82
decades more important technical and economic, cultural progresses were registered in almost
all the fields - industry, constructions, science, art, education etc. Due to the causes presented
above Romania was not able to capitalize better the human and natural resources of the
country and at a higher level, in order to compensate at least the downtrend of agricultural
production.
The main resources of the gross value added, from the national economy, per capita, display other aspects of the evolution of economic activities.
Table Bf
Gross value added1 in the main sectors of the economy, per capita
and in dynamic, averages of the selected years, period 1862-1947
1862-1866
1911-1914
1920-1924
1935-1939
1940-1944
1945-1947
1 2 3 4 5 6 7
Value added in agriculture, forestry per capita, lei dynamics, %
111 100
157 142
130 117
144 130
114 103
71 64
Value added in industry per capita, lei dynamics, %
33
100
98
297
57
173
100 303
111 336
83
252
Value added in constructions per capita, lei dynamics, %
4
100
24
600
21
525
29
725
31
775
24
600
Value added in services per capita, lei dynamics, %
60
100
160 267
119 200
151 252
150 251
74
125 Note: 1 According to the data in Table B 19.
The value added per capita resulting from the agricultural animal and non-animal
production was of 111 lei in the beginning interval up to 157 lei, the average of the period
1911-1914, the highest level of the entire period of 85 years. A decrease followed in the
period 1945-1947, to 71 lei, much below the initial level of 1862-1886. In the industry, until
1914, the development is faster than in agriculture, approximately three times faster. At the
end of the inter-war period it reaches the value of 100 lei, afterwards in the war period 111 lei
per capita, and it declines to 89 lei per capita in 1947.
The constructions, directly related to the development of the infrastructures, urban
habitat and the beginnings of industrialization, had the highest level of expansion: from 4 lei
per capita in 1862-1866 up to 24 lei in the average of the interval 1911-1914, six times
higher; the continuous development during the inter-war and war period was more than seven
times higher than the initial level.
83
As regards the value added of the services, in the same context and determined by the
transformation due to the modernization of the Romanian society until 1914, increased from
60 lei per capita to 160 lei per capita, 2.6 times, but during the inter-war decades it fell below
the level of 1914;the services ended the negative evolution, only at half size of the previous
interval.
After having presented the main aspects of potential and production of the national
economy, we will present further the summary of statistical data related to the indicators of
the period.
The statistical situations — tables — are classified in the reversed succession of the
elaboration processes, from particular to general; therefore, they are arranged starting from
those with a high level of synthesis - from the gross domestic product global indicator - to
those detailed, by sectors, and branches of the equation components of macroeconomic
synthesis indicators, in the series of the 1862-1947 period.
All the macroeconomic indicators are expressed, for the years 1862-1914 and 1920-
1947, both in annual series as well as in 17 series of averages of 4-5 years; it is a more
concentrated format of data, more expressive and more easily to perceive in dynamics and
structure. The series of the averages of the years was driven, as shown, by the need to level
the high increases and decreases, from one year to another, of the gross production of
agriculture, generated by the climate conditions, from very good to very bad harvests; the
value of the agricultural production, determinant for the value of national production,
influenced all the agricultural upstream and downstream economic activities.
The macroeconomic indicators expressed in lei 1913 and comparable dollars are
presented as a total amount, as well as per capita; the latter allows a more in depth analysis, as
well as comparing the indicators and the related indexes during the entire 1862-1947 period,
due to the fact that the modification of the territory and the country’s population during the
eight decades, through several changes of the borders, excludes the comparability of the
global volume indicators.
The statistical situations presented in the section of final indicators were structured on
groups, according to their level and aggregate structure; the first group includes global
indicators, the gross and net domestic product, the total amount and per capita, in lei 1913 as
benchmark, in USD PPP 1913, in USD 2000, as well as in indexes; the global indicators are
presented in annual series and in series containing the averages of the years. The second
group focuses on the indicators of the product tax and of the customs tax, of the subsidies
operated to the gross value added in order to obtain the global indicators; the third group

84
takes the calculations to a higher level of detail and focuses on the components and structure
of the gross value added in the production of goods and services, afterwards in the production
of goods by branches and in the production of services by branches, all these statistical
situations being arranged on the 17 averages of the years. The fourth group includes the
configuration of the indicators from the previous group, displayed in annual series during the
period 1862-1947.
The following group presents the consumption of fixed capital, the depreciation, by
branches of goods and services in the two temporal contexts: series of the averages of the
years and annual series of the period. The sixth group of indicators presents the equation
utilized in order to obtain the outcomes of the national economy: gross production,
intermediary consumption and gross added value in the three structures: production of goods
and services, production of goods by branches and production of services by branches, all
classified in averages of the years. The statistics of the following group provide the indicators
of the sixth group, in annual series of the time interval analyzed. The last group, besides the
indicators of the equation - gross production, intermediary consumption and gross value
added - also introduces the fixed capital consumption indicator - depreciation, presenting the
indicators in the averages of the years and in annual series.
Thus, the structured pyramid of the macroeconomic synthesis indicators displays their
positioning from the base in analytical stages up to its peak in the stages of global aggregation
syntheses; they can ensure the study of evolution and structure of the Romanian economy
under new aspects and with new conclusions regarding its progress in the researched century.

85
Table B 1
Gross domestic product, total and per capita1, in lei 1913, in USD PPP 1913 and 2000,
and indexes, averages of the years, 1862-1947
Averages GDP in lei 1913 GDP in million USD GDP per capita, USD
of the total
per
capita currency PPP currency PPP
indexes
years mil. lei 1913 2000 indexes 1913 2000
1 2 3 4 5 6 7 8 9
1862-1866 861 211 166 2261 100.0 41 554 100.0
1867-1871 967 228 187 2540 112.3 44 598 107.9
1872-1876 1114 254 215 2926 129.4 49 668 120.6
1877-1881 1330 293 257 3492 154.4 57 771 139.2
1882-1886 1594 327 308 4184 185.1 63 860 155.2
1887-1890 1819 349 351 4775 211.2 67 915 165.2
1891-1895 2126 387 410 5582 246.9 75 1015 183.2
1896-1900 2133 363 412 5599 247.6 70 954 172.2
1901-1905 2399 380 463 6298 278.5 73 998 180.1
1906-1910 2823 417 545 7411 327.8 80 1094 197.5
1911-1914 3363 458 649 8829 390.5 89 1203 217.1
-------------------------------------------------------------------------------------------------------------------
1920-1924 5466 344 1055 14351 100.0 66 897 161.9
1925-1929 6995 411 1350 18365 128.0 79 1070 193.1
1930-1934 7398 408 1428 19424 135.3 78 1054 190.2
1935-1939 8508 436 1643 22338 155.7 84 1144 206.5
1940-1944 5665 420 1094 14873 103.6 81 1102 198.9
1945-1947 4045 256 781 10621 74.0 49 672 121.3
Sources: Calculated based on the data in Table B 2. Note: ¹ See notes 1, 2, and 3 of Table B 2.

86
Table B2
Gross domestic product, total and per capita2, in USD PPP 1913 and 2000,
and indexes, annual series, period 1862-1947
Averages Total million USD per capita2 , USD
of currency PPP currency PPP indexes
years 19131 20001 indexes 1913 2000
1 2 3 4 5 7 8
1862 167 2264 100 41 563 100
1863 182 2479 109.5 45 613 108.9
1864 190 2577 113.8 46 630 111.9
1865 147 1997 88.2 36 483 85.8
1866 146 1987 87.8 36 483 85.8
1867 179 2430 107.3 43 585 103.9
1868 195 2652 117.1 46 631 112.1
1869 179 2429 107.3 42 571 101.4
1870 187 2539 112.1 44 592 105.2
1871 195 2648 117.0 45 611 108.5
1872 195 2652 117.1 45 611 108.5
1873 208 2823 124.7 48 649 115.3
1874 205 2784 123.0 47 639 113.5
1875 238 3237 143.0 54 736 130.7
1876 230 3132 138.3 52 705 125.2
1877 237 3227 142.5 53 721 128.1
1878 245 3331 147.1 55 743 132.0
1879 251 3414 150.8 55 754 133.9
1880 314 4264 188.3 69 938 166.6
1881 237 3225 142.4 51 698 124.0
1882 316 4296 189.8 67 917 162.9
1883 296 4030 178.0 62 843 149.7
1884 257 3494 154.3 53 718 127.5
1885 315 4281 189.1 64 864 153.5
1886 355 4821 212.9 70 956 169.8
1887 334 4542 200.6 65 889 157.9
1888 351 4778 211.0 68 923 163.9
1889 357 4854 214.4 68 923 163.9
1890 362 4926 217.6 68 926 164.5
1891 376 5118 226.1 70 949 168.6
1892 409 5564 245.8 75 1025 182.1
1893 400 5435 240.1 73 990 175.8
1894 432 5873 259.4 78 1059 188.1
1895 435 5920 261.5 77 1051 186.7
1896 451 6128 270.7 79 1073 190.6
1897 380 5161 228.0 66 891 158.1
1898 458 6223 274.9 78 1061 188.5
1899 323 4397 194.2 54 739 131.3
1900 448 6086 268.8 74 1006 178.7

87
Averages Total million USD per capita2, USD
of currency PPP currency PPP
Indexes years 19131 20001 indexes 1913 2000
1 2 3 4 5 6 7
1901 472 6412 283.2 77 1047 186.0
1902 463 6293 278.0 75 1016 180.5 1903 480 6523 288.1 76 1036 184.0
1904 375 5101 225.3 58 786 139.6 1905 527 7160 316.3 81 1106 196.4
1906 575 7817 345.3 87 1187 210.8 1907 471 6403 282.8 70 957 170.0
1908 513 6971 307.9 76 1030 182.9
1909 510 6935 306.3 74 1011 179.6 1910 657 8931 394.5 94 1283 227.9
1911 649 8825 389.8 92 1246 221.3 1912 668 9088 401.4 92 1257 223.3 1913 677 9211 406.8 92 1253 222.6 1914 602 8191 361.8 78 1054 187.2
---------------------------------------------------------------------------------------------------------------------
1920 869 11825 522.3 56 762 135.1
1921 953 12961 572.5 61 824 146.3
1922 1076 14638 646.6 67 917 162.7
1923 1179 16039 708.4 73 990 175.7
1924 1198 16290 100.03 73 991 175.8 1925 1225 16660 102.3 73 998 177.2
1926 1358 18472 113.4 80 1091 193.7 1927 1373 18671 114.6 80 1089 193.3 1928 1351 18372 112.8 78 1057 187.5 1929 1445 19651 120.6 82 1114 197.8
1930 1457 19811 121.6 81 1098 194.7
1931 1491 20272 124.4 82 1117 198.1 1932 1369 18623 114.3 74 1011 179.4 1933 1396 18980 116.5 75 1017 180.6
1934 1429 19433 119.3 76 1027 182.4 1935 1547 21039 129.2 81 1102 195.6 1936 1610 21892 134.4 83 1133 201.1 1937 1685 22909 140.6 86 1173 208.2 1938 1666 22654 139.1 84 1147 203.6 1939 1706 23196 142.4 86 1164 206.6
1940 1106 15038 92.3 83 1130 200.7
1941 1142 15533 95.4 86 1164 206.6
1942 1067 14513 89.1 79 1076 191.0
1943 1223 16631 102.1 90 1219 216.3
1944 930 12648 77.6 68 923 163.9
1945 725 9864 60.6 46 627 111.2
1946 709 9647 59.2 45 611 108.4 1947 908 12352 75.8 57 777 138.0
Source: Calculated based on Table B2, volume I, Victor Axenciuc, Produsul intern brut al României, 1862- 2000, Ed. Economică, Bucharest, 2012.
Note: ¹ GDP in RON 1913 was transformed in USD 1913 based on the ratio of metal parity gold of 5.18 lei = 1 USD. The 1913 USD were converted in USA GDP at the purchasing power parity, being 13.6 times that of the USD depreciation coefficient for the 1913-2000 period.
² The data per capita were obtained by dividing the GDP to the country’s population from the series of the respective years.
³ Calculated with a base=100 in 1924, the year when the inter-war recovery of the economy was concluded.

88
Methodological introduction
to the product taxes and custom taxes accounts
The value of the production of goods and services for the period 1862-1947 was
generally expressed in basic prices of the producer; therefore at the end of the estimations it
was necessary to calculate the product taxes.
The studies of the fiscal literature researched, during shorter or longer periods of time,
the indirect taxes as the main source of revenue for the central public budget; in the local
budgets the main revenues resulted from the direct, personal taxes; those for products and
services represented by excise and others had a smaller share.
Depending on the historical period, the product taxes were related on an ever higher
number of products that were consumed by means of sale; at the beginning of 1862-1871
period, the indirect taxes were for 10-12 products and in the fourth and fifth decade of the 21st
century they reached more than 60 products and activities.
During the inter-war period, according to the new taxation systems, the product taxes
were classified in a general way: taxes on alcohol, consumption tax, turnover, taxes on shows
etc., expanding a lot the scope for products and services.
The indirect taxes increased their share in the budget revenues; in 1870 the ratio
between the direct taxes and the indirect taxes was of 53.5/46.5; in 1902: 37.2/ 62.8; in 1927:
20.8/79.2; after an increase in the ration until 1930 of 32.7/67.3 the share of indirect taxes
reached, in 1944, the level of 70.2% as compared to the level of 18.7% of the direct taxes and
11.1% of other taxes to the state budget.
In order to develop the 1862-1947 product taxes series, the statistical data on
budgetary revenues were used especially the groups called indirect taxes. In the local budgets,
the excises and other taxes were reproduced from other sources, but most of the data were
calculated in accordance with the studies of the specialists, as share, of 3-6% in the indirect
taxes of the central budget.
The customs taxes were estimated by following statistics on the external trade and
fiscal information.
The amounts that we used, in all sources are expressed in current currency. We
transformed them in a comparable currency, lei in the prices of 1913, by deflating with the
general index of the prices with the base = 100 in 1913.

89
Summarized statistical data
Table B 3
Gross domestic product after operations on the gross value added, in lei 1913,
annual series, in the period 1862-1947
Years
Gross
value added
Product
taxes
Subsidies Gross
Domestic Product
and
customs
taxes1
for
products2 (2+3-4)
million lei million lei million lei million lei
1 2 3 4 5
1862 854.4 8.0 - 862.4
1863 935.7 8.6 - 944.3
1864 971.3 10.2 - 981.5
1865 748.1 12.4 - 760.5
1866 746.3 10.7 - 757.0
1867 911.7 14.1 - 925.8
1868 993.7 16.5 - 1010.2
1869 910.0 15.2 - 925.2
1870 954.6 12.5 - 967.1
1871 994.2 14.4 - 1008.6
1872 988.6 21.7 - 1010.3
1873 1053.2 22.0 - 1075.2
1874 1037.7 22.6 - 1060.3
1875 1211.4 21.7 - 1233.1
1876 1170.7 22.2 - 1192.9
1877 1204.1 24.9 - 1229.0
1878 1237.8 30.9 - 1268.7
1879 1270.3 29.7 - 1300.0
1880 1589.1 34.9 - 1624.0
1881 1188.3 39.7 - 1228.0
1882 1595.7 40.8 - 1636.5
1883 1487.8 46.9 - 1534.7
1884 1286.8 43.8 - 1330.6
1885 1580.6 50.0 - 1630.6
1886 1781.1 55.4 - 1836.5
1887 1669.5 61.7 1.0 1730.2
1888 1756.8 64.3 1.2 1819.9
1889 1785.5 64.7 1.6 1848.6
1890 1809.0 69.3 2.0 1876.3
1891 1867.7 83.5 2.2 1949.2
1892 2030.9 90.7 2.6 2119.0
1893 1959.5 113.5 3.1 2069.9
1894 2134.8 105.7 3.8 2236.7
1895 2152.9 106.6 4.4 2255.1
1896 2230.7 108.2 4.6 2334.3
1897 1862.8 107.5 4.6 1965.7
1898 2249.3 125.4 4.6 2370.1
1899 1589.2 90.6 5.0 1674.8
1900 2240.0 83.3 5.4 2317.9
1901 2346.1 101.9 5.9 2442.1

90
Years Gross value
added
Product
taxes Subsidies
Gross Domestic
Product
and
customs taxes1 for
products2 2+3-4
million lei million lei million lei million lei
1 2 3 4 5
1902 2293.1 109.8 5.9 2397.0
1903 2389.3 102.4 7.6 2484.1
1904 1857.1 95.3 9.5 1942.9
1905 2627.1 111.9 11.5 2727.5
1906 2870.7 120.4 13.4 2977.7
1907 2314.0 140.2 15.7 2438.5
1908 2547.5 124.9 17.3 2655.1
1909 2539.1 121.5 19.2 2641.4
1910 3286.2 136.8 21.4 3401.6
1911 3266.0 118.9 23.8 3361.1
1912 3321.4 166.3 26.4 3461.3
1913 3361.4 175.7 28.8 3508.3
1914 2967.7 179.2 26.8 3120.1
--------------------------------------------------------------------------------------
1920 4315.2 192.0 2.9 4504.3
1921 4747.3 192.0 2.9 4936.4
1922 5296.7 281.6 3.0 5575.3
1923 5855.0 256.3 2.3 6109 1924 5887.5 318.7 1.8 6204.4
1925 6090.4 256.5 1.6 6345.4
1926 6738.7 298.5 1.7 7035.5
1927 6778.8 334.6 1.8 7111.6
1928 6754.9 244.6 1.9 6997.6
1929 7245.0 241.4 2.0 7484.4
1930 7297.6 250.6 2.4 7545.8
1931 7485.2 240.0 3.9 7721.3
1932 6800.5 294.3 1.7 7093.1
1933 6967.4 264.4 2.4 7229.4
1934 7168.9 235.5 2.7 7401.7
1935 7808.3 207.8 2.8 8013.3
1936 8103.9 236.4 2.2 8338.1
1937 8513.4 215.1 2.7 8725.8
1938 8381.2 251.7 4.4 8628.5
1939 8590.6 247.6 3.1 8835.1
1940 5536.1 192.4 0.9 5727.6
1941 5704.1 212.6 0.5 5916.2
1942 5361.1 166.5 0.3 5527.3
1943 6134.4 200.4 0.3 6334.5
1944 4722.9 94.8 0.1 4817.6
1945 3676.1 80.6 0.0 3756.7
1946 3629.8 44.6 0.0 3674.4
1947 4660.1 44.6 0.0 4704.7 Source: Based on the data from tables B4 and B5. Note: 1. See the Note of table B 4
2. See the Note of table B 5

91
Summarized statistical data
Table B 4
Product taxes1 and customs taxes2, in lei 1913, annual series,
during the period 1862-1947
Years Total col.
3+4+5 Tax Taxes of
Customs taxes
per product consumption
in the
central budget
in the local budgets
thousand lei
thousand lei
thousand lei
thousand lei
1 2 3 4 5
1862 7993 3235 97 4661
1863 8637 3647 109 4881
1864 10245 3720 112 6413
1865 12380 3802 114 8464
1866 10644 4042 121 6481
1867 14089 4631 139 9319
1868 16455 5996 180 10281
1869 15253 6120 184 8949
1870 12571 4507 135 7929
1871 14378 5111 153 9114
1872 21718 10702 321 10695
1873 21965 12958 389 8618
1874 22612 13443 403 8766
1875 21713 13708 411 7594
1876 22226 14105 423 7698
1877 24955 15244 457 9254
1878 30917 15583 467 14867
1879 29698 17814 534 11350
1880 34936 21914 657 12366
1881 39757 24713 741 14303
1882 40813 24395 732 15686
1883 46882 26581 797 19504
1884 43812 27253 818 15741
1885 50035 30972 929 18134
1886 55383 34617 1039 19727
1887 61800 36979 1109 23712
1888 64380 38742 1162 24476
1889 64724 38241 1147 25336
1890 69270 41906 1257 26107
1891 83650 48738 1950 32962
1892 90687 52042 2082 36563
1893 113400 62699 2508 48193
1894 105606 62256 2490 40860
1895 106531 61094 2444 42993
1896 108190 60709 2428 45053
1897 107434 64826 2593 40015
1898 125403 78982 3159 43261
1899 90500 61527 2461 26512

92
Years Total col.
(3+4+5) Taxes Taxes of
Customs taxes
per product consumption
in the central budget
in the local budgets
million lei
million lei
million lei
million lei
1 2 3 4 5
1900 83308 59473 2379 21456
1901 101987 68160 2726 31101
1902 109796 74984 2999 31813
1903 102432 70194 2808 29432
1904 95327 65512 2620 27195
1905 111879 68154 2726 40999
1906 120437 73486 2939 44012
1907 140205 83465 3339 53401
1908 124924 71504 2860 50560
1909 121410 68798 2752 49860
1910 136774 73948 2958 59868
1911 118916 42251 1690 74975
1912 166375 94875 3795 67705
1913 175688 103969 4159 67560
1914 179144 131486 5259 42399
----------------------------------------------------------------------------
1920⁴ 191978 84270 1685 106021
1921 191978 84270 1685 106021
1922 281598 75190 1504 204904
1923 256356 48533 971 206852
1924 318654 64471 1289 252894
1925 256537 57600 1152 197785
1926 298502 65450 1309 231742
1927 334522 91528 1831 241163
1928 244674 66136 1323 177215
1929 241433 88100 2643 150690
1930 250627 104321 3130 143176
1931 239957 133184 3996 102777
1932 294298 179641 5389 109268
1933 264391 174748 5242 84401
1934 235471 147574 2951 84946
1935 207753 147295 2946 57512
1936 236341 173497 3470 59374
1937 215049 160133 3203 51713
1938 251692 202812 4056 44824
1939 247606 194020 3880 49706
1940 192471 125544 2511 64416 1941 212588 121688 2434 88466
1942 166605 69747 1395 95463 1943 200378 105815 2116 92447 1944 94874 78457 1569 14848
1945 80628 32176 644 47808
1946 44646 32722 654 11270
1947 44646 32722 654 11270

93
Source: 1. Expunere de motive la bugetul general al statului, 1871-1948; Enciclopedia României, vol. IV, Bucureşti, 1943; Gh. M. Dobrovici, Istoricul dezvoltării economice şi financiare a României, 1823-1934, Bucureşti, 1934: Victor Axenciuc, Evoluţia economică a României, vol. III; M. Maevschi, Contribuţii la istoria finanţelor publice ale României între cele două războaie mondiale, Bucureşti, 1957; I. N. Stan, Teoria generală a impozitelor indirecte, Bucureşti, 1945; C.Tăutu, Impozitele directe în România, Bucureşti, 1939. Note: 1. We included taxes on: salt, tobacco, matches, playing cards, sugar, oil, hunting powder, etc. until 1914; as of 1920 until 1947, the following were included in accordance with the official classification: taxes on alcoholic beverages, taxes on consumption, turnover, taxes per shows, other taxes. In certain years of the period, where data are missing, they were estimated by means of statistical methods. 2. Calculated at the value of imports and exports. 3. The excises were calculated as taxes on consumption, estimated by the specialists as a share of 3-6% in the value of the product tax to the state budget. 4. For 1920, due to the lack of data for the customs taxes we used the figure of the year 1921. 5. The data of 1946 were introduced.
Methodological introduction in the subsidies account
The economic subsidies, developed in different forms and practiced in various
modalities by the state, focus on stimulating certain branches on a regular basis, in order to
support their development for positive changes which are expected and to strengthen their
resilience capacity in relation to the internal and external competition, or in certain cases of
crisis, to save some companies facing with financial difficulties.
An important category of subsidies in the history of economic development in the last
centuries refers to encourage the industry, especially the mechanized one; in different
countries, for a longer period of time subsidies were promoted, with the purpose of foundation
of the modern national industry, in order to be independent from the imports of equipment
and machinery, consumer goods from the industrial countries previously developed. This is
the way in which several countries like Germany, France etc. acted at the beginning of the
19th century, countries which initially depended on the imports of cars and industrial
consumer goods from England.
On a larger geographical scale, continental and global, the domestic producers were
encouraged in the 19th and 20th century in the agrarian countries, having a low level of
development, to modify their economic structures by developing industries towards
industrialization and economic independence.
After Romania became a state - 1859 - and acquired its political independence, it
inaugurated, in the ninth decade of the 19th century, an economic policy to support the
industry, policy which was applied during an entire century, 1887-1989.
Romania, in its economic policy, did not directly carry out subsidy actions for the
private economy, except in rare situations and with low amounts; for example, the first action
94
of this kind included stimulating the establishment of the sugar industry by granting the
factories that were established under the law from 1882, 0.16 lei for each kg of sugar
produced and 0.20 lei for each kg of exported sugar, while the price of sugar varied between
1-1.20 lei. Furthermore, two sugar factories, in Chitila andSascut, which incurred losses due
to foreign competition, each received an amount of 230,000 lei in the conditions in which one
kilogram of gold had a price of 3100 lei. Subsidies were not granted for agriculture, but
indirectly, during the agrarian crisis in 1929-1936 and until 1939, premiums were granted in
order to stimulate the export of wheat from the surplus production. Another form of subsidy,
generated by the economic crisis of 1929-1933 was when the state took over the debt of
agricultural debtors, which could no longer reimburse them to the banks and private
companies or persons.
The indirect subsidy which had the longest duration in Romania was the one
established by the laws encouraging the national industry in 1882 and 1912, granting certain
financial and material advantages, to processing mechanized enterprises, for a period of 15-30
years, with the right to prolongation. The factories that could benefit from the advantages
granted by these laws were required to fulfill certain criteria - to use the invested capital of
minimum 50,000 lei and 24 workers (law of 1887), or the mechanical force of at least 5 horse
power and 20 workers etc. (law of 1912). The benefits that they enjoyed after the law of 1887
were: exemption from paying any direct taxes to the state, county and commune; exemption
from customs taxes for the import of equipment and machinery for the factory and for imports
of raw materials necessary for the production process, which could not be found domestically;
a reduction by 45% of the tariffs of CFR (Romanian railway company) for the transportation
of the products of the company; granting to the Romanian entrepreneurs of 1-5 ha from the
state or local administration lands, free of charge, to build the factory or in order to lease this
surface to foreigners etc.
The Law of 1912, which was in force until 1947 stipulated the following: exemption
from customs taxes for the machinery imported for the factory; exemption of taxes to the
state, county and commune; discounts between 20-45% for the railway transportation fees;
free of charge utilization of the hydraulic forces on the public domain; customs facilities for
the factories using imported raw materials which were not produced domestically; priority for
public supplies, even if during the tender procedure the offer of the domestic enterprise was
more expensive by 5% than the offer of the foreign companies etc.
Additionally to these direct advantages, all the industrial enterprises obtained an
increased probability and also due to the protectionist policy introduced by the laws in 1886,

95
1893, 1904, 1924, 1927 etc. which imposed high customs taxes for the import of processed
industrial goods, taxes which had an initial level of 5-12% and reached, on average, 16-40%
of the value of the goods; more severely the protectionism is manifested in the 30s and 40s,
when different categories of goods were subject to contingency, limiting the quantity of
imports. Thus, the domestic producer could benefit from higher prices for the goods sold on
the domestic market, as compared to the prices of the imported goods, the difference being at
least equal to the level of custom protection. All these advantages, subsidies, which were
directly or indirectly supported by the state, could not quantified, estimated in lei due to the
inherent difficulties, the lack of statistics and studies in the field developed by the Ministry of
Finance and by the Ministry of Industry and Trade. The industrial advantages were fully
obtained by the enterprises until 1914, until the First World War.
After the war, Romania’s industrial configuration changes, including new branches,
with other encouragement regimes, especially from Banat, Transilvania, and Bucovina. N.
Arcadian, director in the Ministry of Industry and Trade during the inter-war period, in his
paper published in 1936, Romania’s Industrialization (Industrializarea României), analyzes
the regime of encouraging the national industry in this period and reached the conclusion that,
most of the provisions regarding the advantages granted by the law in 1912 “were abrogated
by other laws, or were suspended, expired or were no longer in use” (page 301): “the
reductions by 45% for the industrial transportations (Romanian Railways-CFR) were replaced
by the local tariff for CFR of September 1930, which no longer favors the industry to the
extent of the provisions of the 1912 law”; at the same time the provisions related to the
exemption of taxes and charges” were abrogated through the law of direct contributions of
1923 and the amendments of 1932 and 1933”. The author concludes the analysis in the
following manner: “Therefore, from the benefits of the law the only ones left in force are the
customs exemptions for the machinery, machinery parts and accessories which are not
produced domestically and transportation reduction which the industry enjoys as tariffs for
resorts” (page 302).
A reason for the reduction of advantages or support of the state for the industry is that
its branch has developed in a consistent manner, accumulated important capitals and obtained
a higher profitability, as it results from the published balance sheets; the encouragement laws,
the advantages granted by the state in the mentioned half century - 1887-1938 - met their
purpose; they stimulated the creation and development of a national industry that had in 1938
a contribution of approximately 40% to the social product and 31% to the national income and
covered approximately 80% of the internal demand for consumer goods.

96
All the benefits which resulted from the encouragement laws finally represented a way
of subsidy from the state, consisting of significant amounts, which in the methodology of
national accounts must be subtracted from the gross value added.
In order to quantify these subsidies we used an indirect path to estimate the currency
expressed in lei. This is based on the information provided by the explanatory statement to the
encouragement law of 1912. Its authors present, according to the statistical data provided by
the factories, the commercial balance sheet and the profit and loss account of the industry, in
order to calculate its return, in two assumptions, encouraged and not-encouraged. The data
show that, when the working capital is not due, the annual average benefit, as compared to the
entire capital - fixed and working - would be of 7.70. For our estimations, we calculated the
size of the benefit, in thousand lei, in relation to the invested capital of the encouraged
industry, and then we compared the profit to the value of production, indicators that we
obtained from other sources and calculations for the 1887-1947 period.
Thus, it results that the profit represents on an annual average 14.2% of the value of
the industrial production when encouraged, and only 6.3% when not encouraged. Therefore,
the advantages of stimulation, namely the subsidies of the state in different forms, would
represent 7.9% of the value of production.
Of course, the profitability was also influenced by other factors - market, prices,
climate for the agricultural raw materials etc. If we accept that, for the long term, the
variations of several factors are balanced, under the assumption of an additional profit of
7.9%, we can estimate the magnitude of advantages for the period that is analyzed. As shown
by N. Arcadian, during the inter-war period, the advantages included in the encouragement
law were reduced little by little until 1935, when they were fewer. Therefore, in our opinion,
in what concerns the inter-war period, in accordance with the calculations of the data included
in the balance sheet of the joint stock companies - 1922-1941- we have reduced the initial
share - before 1914 - of 7.9% additional profit, to the value of production, to 6.9%, in the
period 1924-1930 and to 4.1% in the period 1931-1947. Using these percentages we estimated
the hypothetical value of advantages, respectively of the subsidies granted by the state to the
industry,
Another important category of economic subsidizing concerned the premiums granted
for the exports of wheat in the fourth decade of the 20th century, in order to incentivize the
sale of wheat on the external markets and reduce the internal stocks. The reduction up to 50%
of the price of grains on the European market during the inter-war agrarian crisis, 1929-1936,
made things difficult for Romanian exporters, as well as for the producers-peasants. The

97
intervention of the state to grant premiums increased the price of wheat in the appropriate
manner, improving the return of the wheat crops. The premiums for wheat exports were
modified on an annual basis, depending on the production surplus, the price of the external
markets and the need for foreign currency of the country. In total, the eight big campaigns for
exporting wheat, with premiums or by buying the product and exporting it, indirectly
subsidized the trade and agriculture with 226 million lei, 1913 currency.
The value of the encouraged industrial production for which the benefits granted by
the state were calculated, as well as the premiums for the wheat exports are expressed in
current prices lei. In order to transform the data from current prices to the prices of 1913, the
amount of the industrial subsidies were deflated by the index of the industrial prices with the
base = 100 in 1913, and the value of the wheat premiums was deflated by the agricultural
price index having the same base.
Summarized statistical data
Table B 5
Subsidies granted by the state for industry and wheat export, in lei 1913,
annual series, period 1887-1947
Years Total Value Value
Years
Total Value Value
subsidies
of the industrial
advantages
of the
subsidies subsidies
of industrial
advantages1
of the
subsidies
for wheat
for wheat
exports2 exports2
thousand lei
thousand lei thousand lei
thousand lei
thousand lei
thousand lei
1 2 3 4 1 2 3 4
1887 907 907 - 1920 31370 31370 - 1888 1120 1120 - 1921 41545 41545 - 1889 1490 1490 - 1922 58124 58124 - 1890 1794 1794 - 1923 64719 64719 - 1891 1912 1912 - 1924 57101 57101 - 1892 2132 2132 - 1925 60010 60010 - 1893 2356 2356 - 1926 65903 65903 - 1894 2787 2787 - 1927 68964 68964 - 1895 3133 3133 - 1928 75623 75623 - 1896 3428 3428 - 1929 76542 76542 - 1897 3603 3603 - 1930 73557 73557 - 1898 3788 3788 - 1931 152187 94385 57802 1899 4199 4199 - 1932 39186 39186 - 1900 4479 4479 - 1933 59229 52708 6521 1901 4785 4785 - 1934 63455 56934 6521 1902 4873 4873 - 1935 78257 65381 12876
1903 6451 6451 - 1936 59299 56533 2766 1904 8213 8213 - 1937 98801 77894 20907 1905 10162 10162 - 1938 199126 128654 70472
1906 12263 12263 - 1939 152888 104831 48057

98
1907 14571 14571 - 1940 43669 43669 - 1908 16605 16605 - 1941 41108 41108 - 1909 18713 18713 - 1942 41406 41406 - 1910 20790 20790 - 1943 46272 46272 - 1911 23229 23229 - 1944 27021 27021 -
1912 25881 25881 - 1945 30308 30308 - 1913 28467 28467 - 1946 30991 30991 - 1914 26775 26775 - 1947 31674 31674 -
-------------------------------------------------------------------
Source: The statistics of the Romanian foreign trade, 1910-1914; N. Arcadian, Industrializarea României, Bucureşti, 1936; Olga Constantinescu, N. N. Constantinescu, Regarding the industrial revolution in Romania, 1957; I. I. Tatos, Tehnica operaţiunilor cu cereale, Bucureşti, 1944; Victor Axenciuc, vol. III, Monedă-Credit-Comerţ-Finanţe publice, Bucureşti, 2000.
Note: 1. Subsidies which derive from the law for encouraging industry.
2. Export premiums were granted during the agrarian crisis and until 1939.
Summarized statistical data
Table B 6
Gross value added in the production of goods and services
and structure, averages of the years, period 1862-1947
Averages
Total value added
Gross value added in the production
of
Gross value added
Of the
in the production
years
of goods of services
million
lei %
million
lei %
million
lei %
1 2 3 4 5 6 7
1862-1866 852 100 608 71.1 244 28.9
1867-1871 953 100 717 75.3 236 24.7
1872-1876 1092 100 802 73.3 290 26.7
1877-1881 1298 100 912 69.9 386 30.1
1882-1886 1546 100 1084 69.9 462 30.1
1887-1890 1755 100 1242 70.8 513 29.2
1891-1895 2029 100 1402 69.0 627 31.0
1896-1900 2034 100 1363 66.6 671 33.4
1901-1905 2303 100 1543 66.8 760 33.2
1906-1910 2712 100 1769 65.0 943 35.0
1911-1914 3229 100 2055 63.6 1174 36.4
...............................................................................................................................
1920-1924 5220 100 3314 63.5 1906 36.5
1925-1929 6722 100 4253 63.3 2469 36.7
1930-1934 7144 100 4512 63.2 2632 36.8
1935-1939 8280 100 5341 64.5 2939 35.5
1940-1944 5492 100 3468 63.3 2024 36.7
1945-1947 3989 100 2814 70.3 1175 29.7
Note: Calculated based on the data in Table B7

99
Summarized statistical data
Table B 7
Gross value added in the production of goods and services1, in lei 1913,
annual series, period 1862-1947
Years Total value added Gross value added
Gross value added
in the production in the production
of goods of services
million lei % million lei % million lei %
1 2 3 4 5 6 7
1862 854 100 623 72.9 231 27.1
1863 936 100 694 74.2 242 25.8
1864 971 100 706 72.7 265 27.3
1865 748 100 506 67.6 242 32.4
1866 746 100 509 68.2 237 31.8
1867 912 100 677 74.2 235 25.8
1868 994 100 718 72.3 276 27.7
1869 979 100 714 78.5 265 21.5
1870 1024 100 754 79.0 270 21.0
1871 994 100 720 72.4 274 27.6
1872 989 100 714 72.2 275 27.8
1873 1053 100 772 73.3 281 26.7
1874 1038 100 757 72.9 281 27.1
1875 1211 100 923 76.2 288 23.8
1876 1171 100 844 72.1 327 27.9
1877 1204 100 835 69.3 369 30.7
1878 1238 100 846 68.4 392 31.6
1879 1270 100 893 70.3 377 29.7
1880 1589 100 1195 75.2 394 24.8
1881 1188 100 789 66.4 399 33.6
1882 1596 100 1167 73.2 429 26.8
1883 1488 100 1024 68.8 464 31.2
1884 1287 100 849 66.0 438 34.0
1885 1581 100 1099 69.6 482 30.4
1886 1781 100 1281 71.9 500 28.1
1887 1670 100 1159 69.4 511 30.6
1888 1757 100 1272 72.4 485 27.6
1889 1786 100 1271 71.2 515 28.8
1890 1809 100 1267 70.1 542 29.9
1891 1868 100 1266 67.8 602 32.2
1892 2031 100 1429 70.4 602 29.6
1893 1960 100 1312 67.0 648 33.0
1894 2135 100 1484 69.5 651 30.5
1895 2153 100 1516 70.4 637 29.6
1896 2231 100 1547 69.3 684 30.7
1897 1863 100 1204 64.7 659 35.3
1898 2249 100 1534 68.2 715 31.8
1899 1589 100 968 60.9 621 39.1
1900 2240 100 1564 69.8 676 30.2
1901 2346 100 1613 68.8 733 31.2

100
Years Total value added Gross value added in the production of
goods
Gross value added in the production of services
million lei % million lei % million lei %
1 2 3 4 5 6 7
1902 2293 100 1548 67.5 745 32.5
1903 2389 100 1633 68.3 756 31.7
1904 1857 100 1149 61.9 708 38.1
1905 2627 100 1773 67.5 854 32.5
1906 2871 100 1960 68.3 911 31.7
1907 2314 100 1440 62.2 874 37.8
1908 2548 100 1648 64.7 900 35.3
1909 2539 100 1596 62.8 943 37.2
1910 3286 100 2203 67.0 1083 33.0
1911 3266 100 2087 63.9 1179 36.1
1912 3321 100 2123 63.9 1198 36.1
1913 3361 100 2165 64.4 1196 35.6
1914 2968 100 1844 62.1 1124 37.9
-------------------------------------------------------------------------------------------
1920 4315 100 2792 64.7 1523 35.3
1921 4747 100 2914 61.4 1833 38.6
1922 5297 100 3427 64.7 1870 35.3
1923 5855 100 3765 64.3 2090 35.7
1924 5888 100 3672 62.4 2216 37.6
1925 6090 100 3936 64.6 2154 35.4
1926 6739 100 4305 63.9 2434 36.1
1927 6779 100 4182 61.7 2597 38.3
1928 6755 100 4214 62.4 2541 37.6
1929 7245 100 4625 63.8 2620 36.2
1930 7298 100 4527 62.0 2771 38.0
1931 7485 100 4676 62.5 2809 37.5
1932 6801 100 4270 62.8 2531 37.2
1933 6967 100 4509 64.7 2458 35.3
1934 7169 100 4576 63.8 2593 36.2
1935 7808 100 5008 64.1 2800 35.9
1936 8104 100 5189 64.0 2915 36.0
1937 8513 100 5445 64.0 3068 36.0
1938 8381 100 5451 65.0 2930 35.0
1939 8591 100 5611 65.3 2980 34.7
1940 5536 100 3492 63.1 2044 36.9
1941 5704 100 3524 61.8 2180 38.2
1942 5361 100 3202 59.7 2159 40.3
1943 6134 100 3908 63.7 2226 36.3
1944 4723 100 3214 68.1 1509 31.9
1945 3676 100 2552 69.4 1124 30.6
1946 3630 100 2494 68.7 1136 31.3
1947 4660 100 3395 72.9 1265 27.1
Note: Calculated based on tables B 9 and B 11.

101
Summarized statistical data
Table B 8
Gross value added in the production of goods,
by branches, in lei 1913, and structure, averages of the years, 1862-1947
Averages Total
Agriculture Industry Constructions
of the and others
years
million
lei %
million
lei %
million
lei %
million
lei %
1 2 3 4 5 6 7 8 9
1862-1866 608 100 454 74.0 136 23.0 18 3.0
1867-1871 717 100 544 75.9 142 19.8 31 4.3
1872-1876 802 100 580 72.2 176 22.0 46 5.7
1877-1881 912 100 661 72.1 211 23.5 40 4.5
1882-1886 1084 100 787 72.2 234 21.9 63 5.9
1887-1890 1242 100 862 69.3 288 23.1 92 7.6
1891-1895 1402 100 959 68.4 358 25.5 85 6.1
1896-1900 1363 100 867 62.6 387 29.2 109 8.2
1901-1905 1543 100 1042 66.9 399 26.4 102 6.7
1906-1910 1769 100 1050 58.6 568 32.7 151 8.7
1911-1914 2055 100 1155 56.0 724 35.3 176 8.6
..................................................................................................................................................
1920-1924 3314 100 2077 62.9 908 27.1 329 10.0
1925-1929 4252 100 2428 57.1 1372 32.3 452 10.6
1930-1934 4512 100 2553 56.6 1510 33.5 449 10.0
1935-1939 5341 100 2816 52.7 1952 36.5 573 10.7
1940-1944 3468 100 1544 44.5 1504 43.4 420 12.1 1945-1947 2814 100 1126 39.2 1312 47.4 376 13.5
Source: Calculated based on the data in Table B 9.

102
Summarized statistical data Table B 9
Gross value added in the production of goods, by branches,
in lei 1913, and structure, averages of the years, period 1862-1947
Years Total Agriculture Industry Constructions
and others
million
lei %
million
lei %
million
lei %
million
lei %
1 2 3 4 5 6 7 8 9
1862 623 100 467 74.9 141 22.6 15 2.6
1863 694 100 553 79.6 125 18.1 16 2.3
1864 706 100 568 80.4 121 17.1 17 2.5
1865 506 100 352 69.7 134 26.5 20 3.8
1866 509 100 333 65.4 157 30.8 19 3.8
1867 677 100 519 76.7 137 20.3 21 3.0
1868 718 100 541 75.3 156 21.8 21 2.9
1869 714 100 528 73.9 137 19.2 49 6.9
1870 754 100 575 76.2 146 19.4 33 4.4
1871 720 100 557 77.4 133 18.4 30 4.1
1872 714 100 498 69.7 163 22.8 53 7.5
1873 772 100 559 72.5 160 20.8 53 6.7
1874 757 100 531 70.1 197 26.0 29 3.9
1875 924 100 677 73.3 190 20.5 57 6.2
1876 844 100 638 75.6 169 20.0 37 4.5
1877 835 100 610 73.1 187 22.4 38 4.5
1878 846 100 630 74.4 176 20.8 40 4.8
1879 893 100 626 70.1 231 25.8 36 4.0
1880 1195 100 920 77 235 19.7 40 3.3
1881 789 100 519 65.8 226 28.6 44 5.6
1882 1167 100 906 77.6 205 17.6 56 4.8
1883 1024 100 715 69.8 247 24.1 62 6.0
1884 849 100 566 66.6 227 26.8 56 6.6
1885 1099 100 801 72.9 233 21.2 65 6.0
1886 1281 100 947 74.0 257 20.0 77 6.0
1887 1159 100 778 67.1 243 20.9 138 12.0
1888 1272 100 903 71.0 285 22.4 84 6.6
1889 1271 100 894 70.4 311 24.4 66 5.2
1890 1267 100 873 68.9 313 24.7 81 6.5
1891 1266 100 829 65.5 339 26.7 98 7.8
1892 1429 100 998 69.8 353 24.7 78 5.5
1893 1312 100 916 69.8 324 24.7 72 5.5
1894 1484 100 1027 69.2 377 25.4 80 5.4
1895 1516 100 1028 67.8 395 26.1 93 6.2
1896 1547 100 1013 65.5 417 26.9 117 7.6
1897 1204 100 774 64.2 338 28.1 92 7.7
1898 1534 100 1017 66.3 390 25.4 127 8.3
1899 968 100 481 49.8 376 38.9 111 11.4
1900 1564 100 1052 67.3 416 26.6 96 6.1
1901 1613 100 1175 72.9 341 21.1 97 6.0
1902 1548 100 1070 69.1 380 24.5 98 6.4

103
Total Agriculture Industry Constructions
Years and others
million
lei % million
lei % million
lei % million
lei %
1 2 3 4 5 6 7 8 9
1903 1633 100 1124 68.9 405 24.8 104 6.3
1904 1149 100 640 55.7 409 35.6 100 8.7
1905 1773 100 1202 67.8 462 26.1 109 6.2
1906 1960 100 1318 67.2 503 25.7 139 7.1
1907 1440 100 748 52.0 536 37.2 156 10.8
1908 1648 100 905 54.9 601 36.4 142 8.6
1909 1596 100 890 55.8 574 36.0 132 8.3
1910 2203 100 1390 63.1 624 28.3 189 8.6
1911 2087 100 1257 60.2 676 32.4 154 7.4
1912 2123 100 1187 55.9 759 35.8 177 8.3
1913 2165 100 1232 56.9 742 34.3 191 8.8
1914 1844 100 942 51.1 717 38.9 185 10.0 ............................................................................................................................. ...............
1920 2792 100 1853 66.4 656 23.5 283 10.2
1921 2914 100 1839 63.1 765 26.3 310 10.6
1922 3427 100 2181 63.6 898 26.2 348 10.2
1923 3765 100 2373 63 1044 27.7 348 9.2
1924 3672 100 2140 58.3 1177 32.1 355 9.7
1925 3936 100 2275 57.8 1251 31.8 410 10.4
1926 4305 100 2583 60 1284 29.8 438 10.2
1927 4182 100 2299 55 1397 33.4 486 11.6
1928 4214 100 2244 53.3 1507 35.8 463 11.0
1929 4625 100 2740 59.2 1423 30.8 462 10.0
1930 4527 100 2673 59 1454 32.1 400 8.8
1931 4676 100 2778 59.4 1441 30.8 457 9.8
1932 4270 100 2412 56.5 1423 33.3 435 10.2
1933 4509 100 2543 56.4 1506 33.4 460 10.2
1934 4576 100 2356 51.5 1727 37.7 493 10.8 1935 5008 100 2637 52.7 1828 36.5 543 10.9 1936 5189 100 2764 53.3 1867 36 558 10.8 1937 5445 100 2775 51 2020 37.1 650 11.9 1938 5451 100 2871 52.7 2032 37.3 548 10.1 1939 5611 100 3031 54 2012 35.9 568 10.1
1940 3492 100 1594 45.6 1541 44.1 357 10.2 1941 3524 100 1586 45 1528 43.3 410 11.6
1942 3202 100 1252 39.1 1535 47.9 415 13.0 1943 3908 100 1739 44.5 1665 42.6 504 12.9 1944 3214 100 1547 48.1 1249 38.9 418 13
1945 2552 100 901 35.3 1304 51.1 347 13.6 1946 2494 100 865 34.7 1263 50.6 366 14.7
1947 3395 100 1613 47.5 1371 40.4 411 12.1 Source: Indicators calculated based on the data from sections 1, 2, 3, Volume II, 2012 edition.

104
Table B 10
Gross value added in the services1, by branches, in lei 1913,
and structure, averages of the years, 1862-1947
Averages of the years
Total
Transportation,
Trade Financial services Administration Liberal
Employed household personnel
Real estate transactions
others
communications
army professions
insurance
Education, culture, health
mill.
lei %
mill.
lei %
mill.
lei %
mill.
lei %
mill.
lei %
mill.
lei %
mill.
lei %
mill.
lei %
1 2 3 4 5 6 7 8 9 10 11 12 13 14 15 16 17
1862-1866 244 100 62 25.4 122 49.8 0.1 0.0 29 11.8 1 0.4 20 8.0 10 4.6
1867-1871 264 100 65 24.8 136 51.4 0.6 0.2 27 10.3 1 0.5 21 7.8 13 5.0
1872-1876 290 100 69 23.8 156 53.5 0.4 0.1 27 9.3 2 0.7 21 7.4 15 5.4
1877-1881 386 100 82 21.3 227 58.7 0.9 0.2 33 8.6 3 0.7 23 5.8 17 4.7
1882-1886 462 100 90 19.4 270 58.4 4 0.8 49 10.7 4 0.8 24 5.2 21 4.7
1887-1890 513 100 107 20.8 270 52.6 7 1.3 73 14.2 6 1.1 26 5.1 24 4.9
1891-1895 628 100 116 18.6 344 54.7 16 2.5 86 13.7 8 1.3 28 4.4 30 4.8
1896-1900 671 100 130 19.3 342 50.9 23 3.4 99 14.8 11 1.6 31 4.6 35 5.5
1901-1905 760 100 154 20.3 387 50.9 26 3.4 98 12.9 15 1.9 34 4.5 46 6.0
1906-1910 942 100 170 18.1 493 52.4 34 3.6 131 13.9 19 2.0 37 3.9 58 6.1
1911-1914 1174 100 196 16.7 613 52.1 67 5.7 168 14.3 23 1.9 39 3.3 68 5.9
………................................................................................................................................................................. ..................... 1920-1924 1906 100 264 13.9 1049 54.8 140 7.4 168 8.9 87 4.6 70 3.7 128 6.8
1925-1929 2487 100 447 17.9 1158 46.7 203 8.1 324 12.9 116 4.7 74 3.0 165 6.7
1930-1934 2632 100 497 18.9 851 32.3 125 4.7 769 29.3 121 4.6 64 2.4 205 7.8
1935-1939 2939 100 451 15.4 1145 38.9 87 3.0 832 28.3 125 4.3 60 2.0 239 8.1
1940-1944 2024 100 344 17.1 549 27.2 36 1.8 786 38.4 84 4.2 39 2.0 186 9.4
1945-1947 1175 100 340 28.9 354 30.1 11 0.9 152 13.0 32 2.7 37 3.2 249 21.3
Source: 1Calculated based on the data in table B 11.
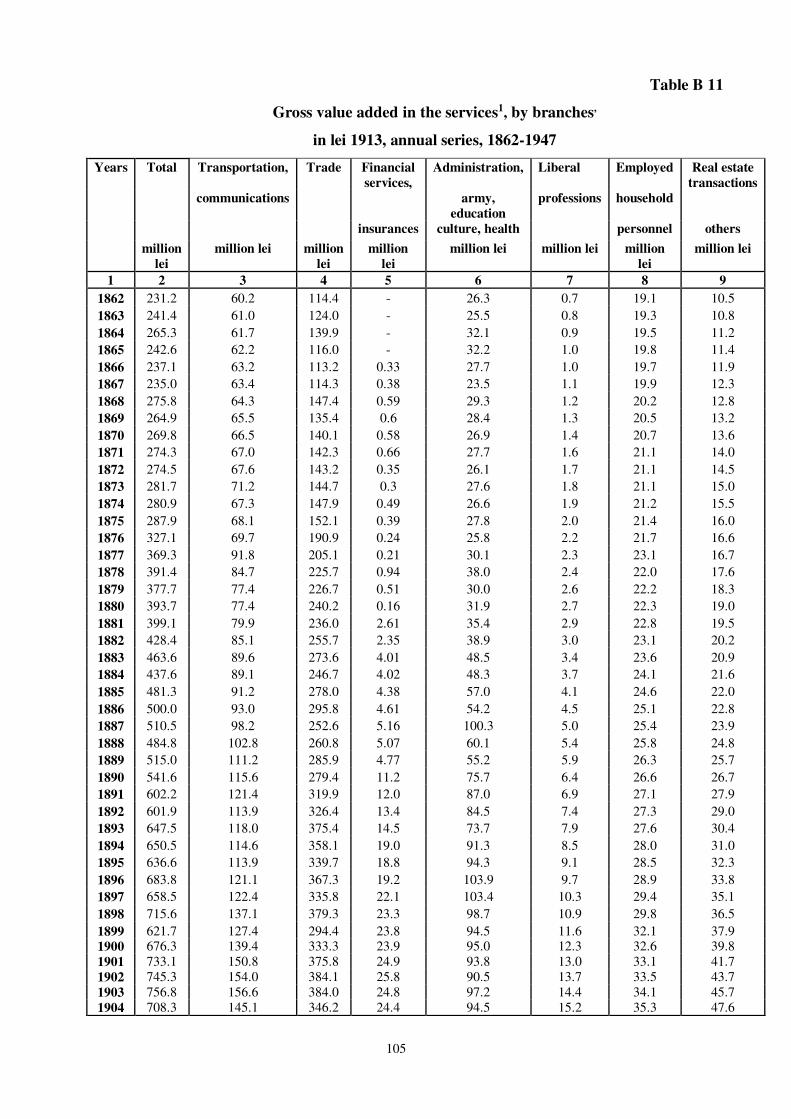
105
Table B 11
Gross value added in the services1, by branches,
in lei 1913, annual series, 1862-1947
Years Total Transportation, Trade Financial services,
Administration, Liberal Employed Real estate transactions
communications army, education
professions household
insurances culture, health personnel others
million lei
million lei million lei
million lei
million lei million lei million lei
million lei
1 2 3 4 5 6 7 8 9
1862 231.2 60.2 114.4 - 26.3 0.7 19.1 10.5
1863 241.4 61.0 124.0 - 25.5 0.8 19.3 10.8
1864 265.3 61.7 139.9 - 32.1 0.9 19.5 11.2
1865 242.6 62.2 116.0 - 32.2 1.0 19.8 11.4
1866 237.1 63.2 113.2 0.33 27.7 1.0 19.7 11.9
1867 235.0 63.4 114.3 0.38 23.5 1.1 19.9 12.3
1868 275.8 64.3 147.4 0.59 29.3 1.2 20.2 12.8
1869 264.9 65.5 135.4 0.6 28.4 1.3 20.5 13.2
1870 269.8 66.5 140.1 0.58 26.9 1.4 20.7 13.6
1871 274.3 67.0 142.3 0.66 27.7 1.6 21.1 14.0
1872 274.5 67.6 143.2 0.35 26.1 1.7 21.1 14.5
1873 281.7 71.2 144.7 0.3 27.6 1.8 21.1 15.0
1874 280.9 67.3 147.9 0.49 26.6 1.9 21.2 15.5
1875 287.9 68.1 152.1 0.39 27.8 2.0 21.4 16.0
1876 327.1 69.7 190.9 0.24 25.8 2.2 21.7 16.6
1877 369.3 91.8 205.1 0.21 30.1 2.3 23.1 16.7
1878 391.4 84.7 225.7 0.94 38.0 2.4 22.0 17.6
1879 377.7 77.4 226.7 0.51 30.0 2.6 22.2 18.3
1880 393.7 77.4 240.2 0.16 31.9 2.7 22.3 19.0
1881 399.1 79.9 236.0 2.61 35.4 2.9 22.8 19.5
1882 428.4 85.1 255.7 2.35 38.9 3.0 23.1 20.2
1883 463.6 89.6 273.6 4.01 48.5 3.4 23.6 20.9
1884 437.6 89.1 246.7 4.02 48.3 3.7 24.1 21.6
1885 481.3 91.2 278.0 4.38 57.0 4.1 24.6 22.0
1886 500.0 93.0 295.8 4.61 54.2 4.5 25.1 22.8
1887 510.5 98.2 252.6 5.16 100.3 5.0 25.4 23.9
1888 484.8 102.8 260.8 5.07 60.1 5.4 25.8 24.8
1889 515.0 111.2 285.9 4.77 55.2 5.9 26.3 25.7
1890 541.6 115.6 279.4 11.2 75.7 6.4 26.6 26.7
1891 602.2 121.4 319.9 12.0 87.0 6.9 27.1 27.9
1892 601.9 113.9 326.4 13.4 84.5 7.4 27.3 29.0
1893 647.5 118.0 375.4 14.5 73.7 7.9 27.6 30.4
1894 650.5 114.6 358.1 19.0 91.3 8.5 28.0 31.0
1895 636.6 113.9 339.7 18.8 94.3 9.1 28.5 32.3
1896 683.8 121.1 367.3 19.2 103.9 9.7 28.9 33.8
1897 658.5 122.4 335.8 22.1 103.4 10.3 29.4 35.1
1898 715.6 137.1 379.3 23.3 98.7 10.9 29.8 36.5
1899 621.7 127.4 294.4 23.8 94.5 11.6 32.1 37.9
1900 676.3 139.4 333.3 23.9 95.0 12.3 32.6 39.8
1901 733.1 150.8 375.8 24.9 93.8 13.0 33.1 41.7
1902 745.3 154.0 384.1 25.8 90.5 13.7 33.5 43.7
1903 756.8 156.6 384.0 24.8 97.2 14.4 34.1 45.7
1904 708.3 145.1 346.2 24.4 94.5 15.2 35.3 47.6

106
Years Total Transportation, Trade Financial services,
Administration, Liberal Employed Real estate transactions
communications army, education
professions household
insurances culture, health personnel others
million lei
million lei million lei
million lei
million lei million lei million lei
million lei
1 2 3 4 5 6 7 8 9
1905 854.6 164.6 446.6 28.5 113.7 16.0 35.3 49.9
1906 910.4 168.3 495.6 28.0 113.6 16.8 35.9 52.2
1907 874.1 139.5 481.6 33.4 111.1 17.6 36.4 54.5
1908 899.5 171.7 449.6 33.9 131.8 18.5 36.9 57.1
1909 943.5 181.2 469.3 35.2 141.2 19.5 37.4 59.7
1910 1083.5 191.8 570.7 41.2 159.1 20.4 38 62.4
1911 1178.9 205.5 638.8 51.3 158.2 21.4 38.6 65.2
1912 1198.2 200.5 640.8 62.4 164.8 22.3 39.3 68.1
1913 1195.7 185.8 635.7 71.3 169.0 23.3 39.5 71.1
1914 1123.7 190.3 535.8 81.2 178.2 24.2 39.7 74.3
…...............................................................................................................................................................................................
1920 1523 225.0 775.5 128.7 143.0 69.9 63.7 117.2
1921 1833.8 262.7 989.2 130.4 184.8 78.1 67.3 121.3
1922 1869.3 267.0 1025.6 140.2 154.4 86.8 68.8 126.5
1923 2090.1 260.0 1202.7 146.3 172.3 95.9 79.3 133.6
1924 2215.7 304.6 1251.7 153.5 187.0 105.4 71.9 141.6
1925 2154.7 364.8 1064.2 162.3 225.9 115.4 73.6 148.7
1926 2433.3 396.6 1205.3 193.2 291.2 115.7 75.2 156.1
1927 2687.0 549.1 1216.1 212.0 355.8 116.0 73.5 164.5
1928 2540.5 454.8 1142.1 215.3 363.8 116.4 74.2 173.9
1929 2620.1 468.5 1160.2 233.5 383.1 116.7 73.4 184.7
1930 2770.9 521.5 929.1 257.0 680.0 118.2 71.0 194.1
1931 2809.4 535.9 880.5 138.4 867.7 119.8 68.1 199.0
1932 2530.5 534.6 795.0 89.8 720.9 121.4 64.7 204.1
1933 2458.8 458.3 789.6 69.6 747.8 123.0 60.5 210.0
1934 2592.6 434.7 862.7 69.4 830.0 124.6 54.9 216.3
1935 2800.3 460.1 1021.6 74.8 839.5 126.1 55.0 223.2
1936 2915.1 441.0 1108.2 92.6 857.7 127.7 55.2 232.7
1937 3068.2 455.4 1281.8 89.4 813.0 129.3 58.3 241.0
1938 2930.1 467.2 1166.3 93.0 757.7 130.9 66.0 249.0
1939 2979.6 430.9 1146.9 85.8 891.7 111.9 66.0 246.4
1940 2044.6 359.6 635.8 56.7 689.7 94.2 39.0 169.6
1941 2180.3 399.2 572.8 32.2 871.0 89.4 38.8 176.9
1942 2158.8 371.1 559.0 31.9 889.3 84.6 37.3 185.6
1943 2226.5 310.4 572.0 36.3 992.9 79.7 39.9 195.3
1944 1508.7 281.4 404.6 24.0 487.2 71.3 38.9 201.3
1945 1124.0 317.7 304.5 11.6 173.7 37.3 40.0 239.2
1946 1135.8 323.7 352.5 10.0 131.8 31.6 37.1 249.1
1947 1264.7 377.1 405.7 10.0 150.7 25.8 33.7 261.7
Source: 1 Calculated based on the data from chapters 4-10, Volume II, 2012 edition.

107
Summarized statistical data Table B12
Fixed capital consumption1, in the production of goods by branches and in the production of services, in lei 1913, averages of the years, period 1862-1947
Averages Total Fixed capital consumption in the production of
goods services
of the years general col. 3+7
Total col. 4+5+6
agriculture industry constructions
million lei million lei million lei million lei million lei million lei
1 2 3 4 5 6 7
1862-1866 28.0 16.3 12.4 3.8 0.1 11.7 1867-1871 31.5 19.0 14.9 3.9 0.2 12.5 1872-1876 37.5 24.5 19.0 5.2 0.3 13.0 1877-1881 43.5 28.3 21.1 6.9 0.3 15.3 1882-1886 48.2 31.0 22.7 7.8 0.5 17.2 1887-1890 56.3 36.2 24.8 10.8 0.6 20.1 1891-1895 69.9 46.3 28.7 16.9 0.7 23.6 1896-1900 81.7 56.1 35.4 19.9 0.8 25.6 1901-1905 97.3 67.2 41.2 24.6 1.4 30.1 1906-1910 121.5 85.8 45.1 37.1 3.6 35.6 1911-1914 176.4 132.7 51.0 74.2 7.5 43.7 .......................................................................................................................................
1920-1924 267.0 179.3 83.5 83.3 12.5 87.7 1925-1929 397.0 271.5 101.5 147.0 23.0 125.5 1930-1934 451.3 326.6 79.9 219.2 27.5 124.7 1935-1939 597.1 453.1 127.3 284.7 41.1 144.0
1940-1944 471.3 365.1 69.7 245.3 50.1 106.2
1945-1947 430.8 346.9 63.7 235.4 47.8 84.0
Source: 1 Calculated based on the data in Table B13.

108
Summarized statistical data
Table B 13
Fixed capital consumption1, in the production of goods by branches and in the production
of services, in lei 1913, annual series, period 1862-1947
Fixed capital consumption in the production of
Years Total general
col. 3+7
goods services
Total
col. 4+5+6 agriculture industry constructions
million lei million lei million lei million lei million lei million lei
1 2 3 4 5 6 7
1862 26.7 15.4 11.3 4.04 0.03 11.3
1863 27.6 16.0 12.5 3.33 0.14 11.6
1864 28.3 16.2 13.0 3.11 0.05 12.0
1865 28.1 16.3 12.5 3.64 0.16 11.8
1866 29.6 17.8 12.9 4.82 0.06 11.8
1867 29.7 17.7 14.0 3.53 0.16 11.9
1868 31.3 18.8 14.4 4.27 0.17 12.5
1869 31.3 18.7 14.9 3.46 0.34 12.6
1870 32.7 19.9 15.3 4.36 0.25 12.8
1871 32.4 19.5 15.6 3.68 0.23 12.9
1872 34.2 21.2 16.1 4.76 0.37 13.0
1873 36.2 23.0 18.3 4.31 0.37 13.2
1874 38.5 26.1 19.5 6.33 0.23 12.5
1875 40.0 27.2 20.5 6.32 0.4 12.8
1876 38.8 25.3 20.5 4.44 0.38 13.5
1877 41.1 26.5 20.7 5.53 0.28 14.6
1878 41.1 25.8 20.7 4.79 0.3 15.3
1879 44.4 29.3 21.2 7.82 0.28 15
1880 45.4 29.8 21 8.5 0.3 15.6
1881 45.6 29.9 21.7 7.88 0.33 15.7
1882 46.1 29.7 22.5 6.75 0.41 16.5
1883 48.7 31.6 22.6 8.52 0.45 17.1
1884 47.2 30.4 22.8 7.19 0.42 16.8
1885 48.1 30.4 22.8 7.11 0.48 17.7
1886 50.9 32.8 23.0 9.28 0.6 18.1
1887 52.6 33.1 24.0 8.2 0.9 19.4
1888 54.2 35.0 24.2 10.2 0.6 19.2
1889 58.2 37.4 24.7 12.2 0.5 20.8
1890 60.3 39.2 26.1 12.5 0.6 21.1
1891 66.3 42.5 27.0 14.7 0.8 23.9
1892 68.4 45.5 28.1 16.9 0.5 22.9
1893 68.7 44.7 29.4 14.8 0.5 23.9
1894 71.6 47.6 28.1 18.9 0.6 24.1
1895 74.4 50.9 31.0 19.3 0.6 23.5
1896 77.7 53.5 32.8 19.9 0.8 24.1
1897 75.6 50.7 34.7 15.3 0.7 24.8
1898 81.6 54.8 35.8 18.0 1.0 26.8
1899 80.4 55.0 34.9 19.2 0.7 25.5
1900 93.3 66.7 38.7 27.1 0.9 26.7

109
Fixed capital consumption in the production of
Years Total general
col. 3+7
goods services
Total col.
4+5+6
agriculture industry constructions
million
lei million
lei million lei million lei million lei million
lei 1 2 3 4 5 6 7
1901 92.3 63.0 39.7 22.3 0.8 29.3 1902 96.2 66.8 40.8 25.0 1.0 29.4 1903 100.9 70.7 41.6 28.0 1.1 30.3 1904 95.5 66.4 42.2 22.2 2.0 29.1 1905 101.6 69.3 41.7 25.3 2.3 32.4 1906 110.5 76.0 44.1 29.4 2.7 34.4 1907 113.2 79.9 42.5 34.4 3.0 33.3 1908 120.8 86.0 45.4 36.8 3.8 34.8 1909 126.9 91.0 46.2 40.6 4.2 35.9 1910 136.0 96.3 47.2 44.2 4.9 39.7 1911 162.3 119.5 47.9 66.1 5.5 42.8 1912 173.9 130.1 49.0 73.9 7.2 43.8 1913 185.2 140.3 53.8 78.4 8.1 44.9 1914 184.0 140.8 53.2 78.3 9.3 43.2 ------------------------------------------------------------------------------ 1920 212.6 139.8 76.8 53.1 9.9 72.9 1921 241.9 156.7 79.8 66 10.9 85.2 1922 269.4 182.1 82.9 86.9 12.3 87.3 1923 290.9 198.5 86.7 98.2 13.6 92.4 1924 320.3 219.3 91.6 112.3 15.4 101 1925 340.2 231.1 93.9 118.6 18.6 109.1 1926 373.1 250.7 97.7 132.1 20.9 122.3 1927 396.2 265.8 101.3 141.2 23.3 130.4 1928 429.3 297.9 106.2 165.6 26.1 131.5 1929 446.2 312.0 108.3 177.7 26.0 134.2 1930 453.1 321.0 97.4 197.4 26.2 132.1 1931 444.8 315.2 89.9 199.7 25.6 129.6 1932 434.5 314.6 77.5 210.8 26.3 119.9 1933 445.8 326.6 71.4 227.5 27.7 119.2 1934 478.6 355.7 63.5 260.6 31.6 122.9 1935 530.5 394.1 93.5 266.2 34.4 136.4 1936 593.3 454.4 125.9 290.9 37.6 138.9 1937 627.2 477.9 140.0 294.5 43.4 149.3 1938 622.5 473.4 138.6 290.5 44.3 149 1939 612.2 465.8 138.7 281.5 45.6 146.3 1940 489.7 380.2 83.8 251 45.4 109.6 1941 474.4 363 78.7 237.9 46.4 111.5 1942 492.3 379.8 72.7 255.3 51.8 112.5 1943 511.0 398.1 66.4 277.9 53.8 112.9 1944 389.1 304.6 46.9 204.2 53.3 84.5 1945 405.6 326.2 53.2 224.9 48.1 79.4 1946 431.7 350.0 63.9 237.3 48.8 81.7 1947 455.2 364.4 73.9 244.1 46.4 90.8 Source: 1 Calculated based on chapters I-X of Volume II, 2012 edition in Romanian.
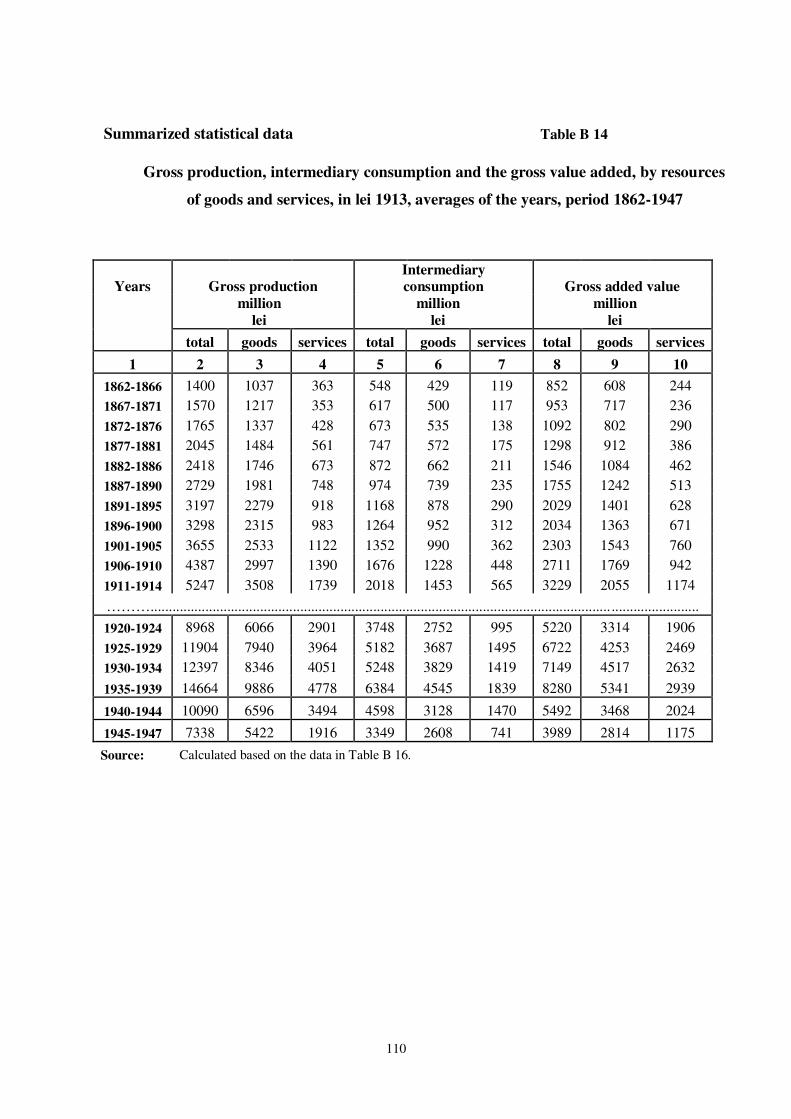
110
Summarized statistical data
Table B 14
Gross production, intermediary consumption and the gross value added, by resources
of goods and services, in lei 1913, averages of the years, period 1862-1947
Years Gross production Intermediary consumption Gross added value
million
lei
million
lei
million
lei total goods services total goods services total goods services
1 2 3 4 5 6 7 8 9 10
1862-1866 1400 1037 363 548 429 119 852 608 244 1867-1871 1570 1217 353 617 500 117 953 717 236 1872-1876 1765 1337 428 673 535 138 1092 802 290 1877-1881 2045 1484 561 747 572 175 1298 912 386 1882-1886 2418 1746 673 872 662 211 1546 1084 462 1887-1890 2729 1981 748 974 739 235 1755 1242 513 1891-1895 3197 2279 918 1168 878 290 2029 1401 628 1896-1900 3298 2315 983 1264 952 312 2034 1363 671 1901-1905 3655 2533 1122 1352 990 362 2303 1543 760 1906-1910 4387 2997 1390 1676 1228 448 2711 1769 942 1911-1914 5247 3508 1739 2018 1453 565 3229 2055 1174 ……….............................................................................................................................. ........................ 1920-1924 8968 6066 2901 3748 2752 995 5220 3314 1906 1925-1929 11904 7940 3964 5182 3687 1495 6722 4253 2469 1930-1934 12397 8346 4051 5248 3829 1419 7149 4517 2632 1935-1939 14664 9886 4778 6384 4545 1839 8280 5341 2939 1940-1944 10090 6596 3494 4598 3128 1470 5492 3468 2024 1945-1947 7338 5422 1916 3349 2608 741 3989 2814 1175 Source: Calculated based on the data in Table B 16.

111
Table B15
Structure of the gross production, intermediary consumption and gross value added,
by resources of goods and services, averages of the years, period 1862-1947
Averages Gross production Intermediary
consumption Value added
of the total goods services total goods services total goods services
years % % % % % % % % %
1 2 3 4 5 6 7 8 9 10
1862-1866 100 74.1 25.9 100 78.3 21.7 100 71.4 28.6
1867-1871 100 77.5 22.5 100 81.0 19.0 100 75.2 24.8
1872-1876 100 75.8 24.2 100 79.5 20.5 100 73.4 26.6
1877-1881 100 72.6 27.4 100 76.6 23.4 100 70.3 29.7
1882-1886 100 72.2 27.8 100 75.9 24.1 100 70.1 29.9
1887-1890 100 72.6 27.4 100 75.9 24.1 100 70.8 29.2
1891-1895 100 71.3 28.7 100 75.2 24.8 100 69.0 31.0
1896-1900 100 70.2 29.8 100 75.3 24.7 100 67.0 33.0
1901-1905 100 69.3 30.7 100 73.2 26.8 100 67.0 33.0
1906-1910 100 68.3 31.7 100 73.3 26.7 100 65.3 34.7
1911-1914 100 66.9 33.1 100 72.0 28.0 100 63.6 36.4
……………............................................................................................................................................
1920-1924 100 67.6 32.4 100 73.4 26.6 100 63.5 36.5
1925-1929 100 66.7 33.3 100 71.2 28.8 100 63.3 36.7
1930-1934 100 67.3 32.7 100 73.0 27.0 100 63.2 36.8
1935-1939 100 67.4 32.6 100 71.2 28.8 100 64.5 35.5
1940-1944 100 65.4 34.6 100 68.0 32.0 100 63.1 36.9
1945-1947 100 73.9 26.1 100 77.9 22.1 100 70.5 29.5 Source: Calculated based on the data in Table B 16.

112
Summarized statistical data
Table B 16
Gross production, intermediary consumption and gross value
added, in lei 1913 and structure, annual series, period 1862-1947
Years Gross production Intermediary consumption
Gross added value
million lei % million lei % million lei % 1 2 3 4 5 6 7 1862 1436 100 582 40.5 854 59.5 1863 1508 100 572 37.9 936 62.1 1864 1572 100 601 38.2 971 61.8 1865 1241 100 493 39.7 748 60.3 1866 1242 100 496 39.9 746 60.1 1867 1490 100 578 38.8 912 61.2 1868 1638 100 644 39.3 994 60.7 1869 1543 100 633 41.0 910 59.0 1870 1564 100 609 38.9 955 61.1 1871 1613 100 619 38.4 994 61.6 1872 1657 100 668 40.3 989 59.7 1873 1686 100 633 37.5 1053 62.5 1874 1690 100 652 38.6 1038 61.4 1875 1950 100 739 37.9 1211 62.1 1876 1841 100 670 36.4 1171 63.6 1877 1874 100 670 35.8 1204 64.2 1878 1930 100 692 35.9 1238 64.1 1879 2004 100 734 36.6 1270 63.4 1880 2478 100 889 35.9 1589 64.1 1881 1938 100 750 38.7 1188 61.3 1882 2461 100 865 35.1 1596 64.9 1883 2378 100 890 37.4 1488 62.6 1884 2055 100 768 37.4 1287 62.6 1885 2450 100 869 35.5 1581 64.5 1886 2747 100 966 35.2 1781 64.8 1887 2663 100 993 37.3 1670 62.7 1888 2721 100 964 35.4 1757 64.6 1889 2724 100 938 34.4 1786 65.6 1890 2808 100 999 35.6 1809 64.4 1891 2980 100 1112 37.3 1868 62.7 1892 3210 100 1179 36.7 2031 63.3 1893 3084 100 1124 36.4 1960 63.6 1894 3299 100 1164 35.3 2135 64.7 1895 3415 100 1262 37.0 2153 63.0 1896 3579 100 1348 37.7 2231 62.3 1897 2998 100 1135 37.9 1863 62.1 1898 3571 100 1322 37.0 2249 63.0 1899 2772 100 1183 42.7 1589 57.3 1900 3570 100 1330 37.3 2240 62.7 1901 3637 100 1291 35.5 2346 64.5

113
Years Gross production Intermediary consumption
Gross added value
million lei % million lei % million lei %
1 2 3 4 5 6 7
1902 3618 100 1325 36.6 2293 63.4 1903 3805 100 1416 37.2 2389 62.8 1904 3088 100 1231 39.9 1857 60.1 1905 4127 100 1500 36.3 2627 63.7 1906 4535 100 1664 36.7 2871 63.3 1907 3831 100 1517 39.6 2314 60.4 1908 4173 100 1625 38.9 2548 61.1 1909 4175 100 1636 39.2 2539 60.8 1910 5220 100 1934 37.0 3286 63.0 1911 5191 100 1925 37.1 3266 62.9 1912 5313 100 1992 37.5 3321 62.5 1913 5486 100 2125 38.7 3361 61.3 1914 5000 100 2032 40.6 2968 59.4
............................................................................................................................................................
1920 7380 100 3065 41.5 4315 58.5 1921 8221 100 3474 42.3 4747 57.7 1922 9151 100 3854 42.1 5297 57.9 1923 9952 100 4097 41.2 5855 58.8 1924 10134 100 4246 41.9 5888 58.1 1925 10731 100 4641 43.2 6090 56.8 1926 11812 100 5073 42.9 6739 57.1 1927 12018 100 5239 43.6 6779 56.4 1928 12151 100 5396 44.4 6755 55.6 1929 12806 100 5561 43.4 7245 56.6 1930 12559 100 5261 41.9 7298 58.1 1931 12600 100 5115 40.6 7485 59.4 1932 11756 100 4956 42.2 6800 57.8 1933 12258 100 5291 43.2 6967 56.8 1934 12812 100 5643 44.0 7169 56.0 1935 13821 100 6013 43.5 7808 56.5 1936 14326 100 6222 43.4 8104 56.6 1937 15109 100 6596 43.7 8513 56.3 1938 14916 100 6535 43.8 8381 56.2 1939 15148 100 6557 43.3 8591 56.7
1940 10171 100 4635 45.6 5536 54.4 1941 10455 100 4751 45.4 5704 54.6 1942 10072 100 4711 46.8 5361 53.2 1943 11232 100 5098 45.4 6134 54.6 1944 8521 100 3798 44.6 4723 55.4
1945 7009 100 3333 47.6 3676 52.4 1946 6728 100 3098 46.0 3630 54.0 1947 8275 100 3615 43.7 4660 56.3
Source: Calculated based on the data from chapters 1-10, Volume II, 2012 edition.

114
Summarized statistical data
Table B 17
Gross production, intermediary consumption and gross value added
in the production of goods, in lei 1913, annual series, period 1862-1947
Years Gross production
Intermediary consumption
Gross
value added
Years
Gross production
Intermediary consumption
Gross
value added
million lei million lei million lei million lei million lei million lei
1 2 3 4 1 2 3 4
1862 1092 469 623 1903 2685 1052 1633
1863 1148 454 694 1904 2036 887 1149
1864 1177 471 706 1905 2869 1096 1773
1865 880 374 506 1906 3186 1226 1960
1866 889 380 509 1907 2549 1109 1440
1867 1140 465 677 1908 2844 1196 1648
1868 1229 511 718 1909 2788 1192 1596
1869 1247 533 714 1910 3618 1415 2203
1870 1262 508 754 1911 3460 1373 2087
1871 1205 485 720 1912 3548 1425 2123
1872 1249 535 714 1913 3697 1532 2165
1873 1268 496 772 1914 3328 1484 1844
1874 1276 519 757 -------------------------------------------------------------------
1875 1525 601 924 1920 5061 2269 2792
1876 1368 524 844 1921 5400 2486 2914
1877 1341 506 835 1922 6317 2890 3427
1878 1360 514 846 1923 6804 3039 3765
1879 1455 562 893 1924 6751 3079 3672
1880 1904 709 1195 1925 7303 3367 3936
1881 1359 570 789 1926 7889 3584 4305
1882 1839 672 1167 1927 7860 3678 4182
1883 1703 679 1024 1928 8057 3843 4214
1884 1416 567 849 1929 8590 3965 4625
1885 1750 651 1099 1930 8339 3814 4527
1886 2020 739 1281 1931 8333 3657 4676
1887 1911 752 1159 1932 7917 3647 4270
1888 2015 743 1272 1933 8412 3903 4509
1889 1974 703 1271 1934 8729 4126 4603
1890 2023 756 1267 1935 9302 4294 5008
1891 2096 830 1266 1936 9609 4420 5189
1892 2329 900 1429 1937 10124 4679 5445
1893 2143 831 1312 1938 10118 4667 5451
1894 2346 862 1484 1939 10278 4667 5611
1895 2483 967 1516 1940 6592 3100 3492
1896 2583 1036 1547 1941 6729 3205 3524
1897 2030 826 1204 1942 6387 3185 3202
1898 2527 993 1534 1943 7346 3438 3908
1899 1850 882 968 1944 5928 2714 3214
1900 2585 1021 1564 1945 5179 2627 2552
1901 2550 937 1613 1946 4901 2407 2494
1902 2522 974 1548 1947 6186 2791 3395
Source: Calculated based on the data from chapters 1-3, Volume II, 2012 edition.

115
Summarized statistical data
Table B 18
Gross production, intermediary consumption and gross added
in the production of services, in lei 1913, annual series, period 1862-1947
Years Gross production
Intermediary consumption
Gross value added
Years Gross production
Intermediary consumption
Gross value added
intermediary
million lei million lei million lei million lei million lei million lei
1 2 3 4 1 2 3 4
1862 344 113 231 1903 1119 362 757 1863 359 118 241 1904 1052 344 708 1864 395 130 265 1905 1258 404 854 1865 361 118 243 1906 1349 439 910 1866 353 116 237 1907 1282 408 874 1867 350 115 235 1908 1329 429 900 1868 410 134 276 1909 1387 443 943 1869 296 100 196 1910 1602 519 1084 1870 302 102 200 1911 1731 552 1179 1871 408 134 274 1912 1765 567 1198 1872 408 133 275 1913 1790 593 1197 1873 418 136 282 1914 1672 548 1124 1874 413 132 281 ........................................................................................................
1875 426 138 288 1920 2319 796 1523 1876 474 147 327 1921 2822 988 1834 1877 533 164 369 1922 2834 965 1869 1878 570 179 391 1923 3148 1058 2090 1879 549 171 378 1924 3384 1168 2216 1880 574 180 394 1925 3428 1273 2155 1881 579 180 399 1926 3923 1490 2433 1882 623 195 428 1927 4158 1561 2597 1883 675 211 464 1928 4094 1553 2541 1884 639 201 438 1929 4216 1596 2620 1885 700 219 481 1930 4220 1449 2771 1886 727 227 500 1931 4266 1457 2809 1887 752 241 511 1932 3838 1307 2531 1888 706 221 485 1933 3846 1387 2459 1889 750 235 515 1934 4083 1490 2593 1890 785 243 542 1935 4519 1719 2800 1891 884 282 602 1936 4717 1802 2915 1892 881 279 602 1937 4985 1917 3068 1893 941 293 648 1938 4798 1868 2930 1894 954 303 651 1939 4870 1890 2980 1895 932 295 637 1940 3579 1534 2045 1896 996 312 684 1941 3726 1546 2180 1897 968 309 659 1942 3685 1526 2159 1898 1044 328 716 1943 3886 1659 2227 1899 922 300 622 1944 2592 1083 1509 1900 985 309 676 1945 1831 707 1124 1901 1086 353 733 1946 1828 692 1136 1902 1096 351 745 1947 2089 824 1265
Source: Calculated based on the data from chapters 4-10, Volume II, 2012 edition.
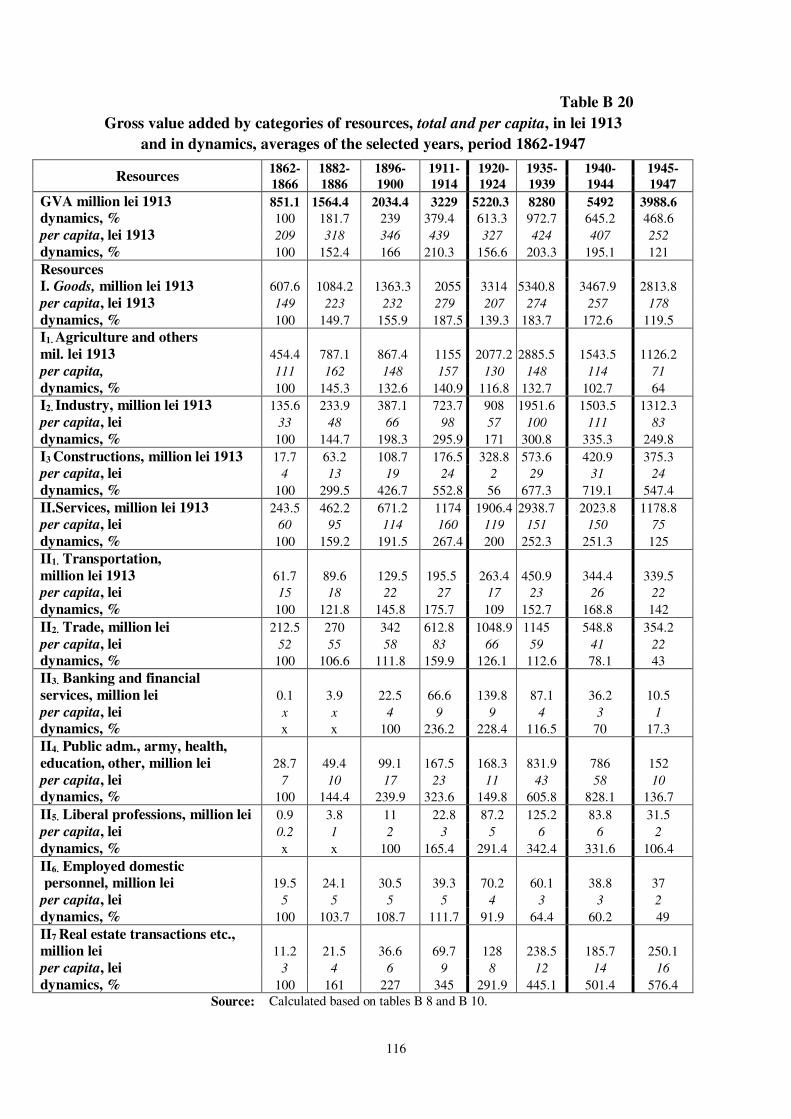
116
Table B 20
Gross value added by categories of resources, total and per capita, in lei 1913
and in dynamics, averages of the selected years, period 1862-1947
Resources
1862- 1882- 1896- 1911- 1920- 1935- 1940- 1945-
1866 1886 1900 1914 1924 1939 1944 1947
GVA million lei 1913 851.1 1564.4 2034.4 3229 5220.3 8280 5492 3988.6
dynamics, % 100 181.7 239 379.4 613.3 972.7 645.2 468.6
per capita, lei 1913 209 318 346 439 327 424 407 252 dynamics, % 100 152.4 166 210.3 156.6 203.3 195.1 121
Resources I. Goods, million lei 1913 607.6 1084.2 1363.3 2055 3314 5340.8 3467.9 2813.8
per capita, lei 1913 149 223 232 279 207 274 257 178 dynamics, % 100 149.7 155.9 187.5 139.3 183.7 172.6 119.5
I1. Agriculture and others mil. lei 1913 454.4 787.1 867.4 1155 2077.2 2885.5 1543.5 1126.2
per capita, 111 162 148 157 130 148 114 71 dynamics, % 100 145.3 132.6 140.9 116.8 132.7 102.7 64
I2. Industry, million lei 1913 135.6 233.9 387.1 723.7 908 1951.6 1503.5 1312.3
per capita, lei 33 48 66 98 57 100 111 83 dynamics, % 100 144.7 198.3 295.9 171 300.8 335.3 249.8
I3 Constructions, million lei 1913 17.7 63.2 108.7 176.5 328.8 573.6 420.9 375.3
per capita, lei 4 13 19 24 2 29 31 24 dynamics, % 100 299.5 426.7 552.8 56 677.3 719.1 547.4
II.Services, million lei 1913 243.5 462.2 671.2 1174 1906.4 2938.7 2023.8 1178.8
per capita, lei 60 95 114 160 119 151 150 75 dynamics, % 100 159.2 191.5 267.4 200 252.3 251.3 125
II1. Transportation,
million lei 1913 61.7 89.6 129.5 195.5 263.4 450.9 344.4 339.5
per capita, lei 15 18 22 27 17 23 26 22 dynamics, % 100 121.8 145.8 175.7 109 152.7 168.8 142
II2. Trade, million lei 212.5 270 342 612.8 1048.9 1145 548.8 354.2
per capita, lei 52 55 58 83 66 59 41 22 dynamics, % 100 106.6 111.8 159.9 126.1 112.6 78.1 43
II3. Banking and financial services, million lei 0.1 3.9 22.5 66.6 139.8 87.1 36.2 10.5
per capita, lei x x 4 9 9 4 3 1 dynamics, % x x 100 236.2 228.4 116.5 70 17.3
II4. Public adm., army, health,
education, other, million lei 28.7 49.4 99.1 167.5 168.3 831.9 786 152
per capita, lei 7 10 17 23 11 43 58 10 dynamics, % 100 144.4 239.9 323.6 149.8 605.8 828.1 136.7
II5. Liberal professions, million lei 0.9 3.8 11 22.8 87.2 125.2 83.8 31.5
per capita, lei 0.2 1 2 3 5 6 6 2 dynamics, % x x 100 165.4 291.4 342.4 331.6 106.4
II6. Employed domestic personnel, million lei 19.5 24.1 30.5 39.3 70.2 60.1 38.8 37
per capita, lei 5 5 5 5 4 3 3 2 dynamics, % 100 103.7 108.7 111.7 91.9 64.4 60.2 49
II7 Real estate transactions etc., million lei 11.2 21.5 36.6 69.7 128 238.5 185.7 250.1
per capita, lei 3 4 6 9 8 12 14 16 dynamics, % 100 161 227 345 291.9 445.1 501.4 576.4
Source: Calculated based on tables B 8 and B 10.

117
Section C
GROSS DOMESTIC PRODUCT DURING THE PERIOD 1950-1979
Historical and methodological introduction
In the previous Section B, the macroeconomic indicators compiled for 1862-1947
were briefly presented.
The sections C and D, that follow chronologically (1950-1979 and 1980-2010),
continue the research in order to complete the secular time series of the gross domestic
product until 2010; for this purpose, being processed in various ways, the indicators of the
national income in the material production system –MPS- and of the gross domestic product
in the national accounting system -NAS-, were used, calculated by the official statistics.
The synthesis macroeconomic indicators, regarding the 1950-1990 period, of the
centralized economy in Romania - social product and national income - are based on the MPS
methodology. According to it, value creators are only the material production activities and
material services; the other activities: social, medical, educational, cultural, related to the
public administration etc. are considered as necessary, but not as creating value; they feed
from the value generated by the productive sectors. On the contrary, the NAS methodology
considers that any activity involving goods or services that enters the money circuit generates
value.
Both systems, of the material and production and that of the national accounts, have
undergone revisions along the decades, and adjustments by each country of the two economic
and social systems. Thus, in each system, there were deviations from the standard scheme.
The UN specialized bodies were periodically reprocessing and harmonizing the data of the
countries in order to make them comparable, but recalculated also some macroeconomic
indicators of the countries with planned economy, in order to make them compatible with the
indicators of the national accounts, used by most states, in order to compare them with those
of other countries.
In Romania, until 1990, the modification or the improvement of the calculation
system, usually took place, based on the studies of the synthesis institutions – The General
Directorate of Statistics (the current National Institute of Statistics), the State Planning
Committee, the Ministry of Finance, and those of the research institutes for economics,
finance etc. The moments of these re-examinations were due to the accumulation of certain
disparities in the values and material structure of the sectors of the national economy sectors,
which involved changes in price leverages, in their calculation basis, etc.

118
This is what happened when the prices were “settled” in 1955, 1963 etc. In the
centralized economy, there was the practice of harmonizing the modifications of the
economy’s structure, of the costs prices, of labour productivity etc., unlike market economies,
where the rebalancing is restored continuously and automatically, mainly by the free market.
In centralized economies, on the other hand, studies for the calculation of the macro-
economic synthesis indicators, based on the national accounts system have been performed.
In Romania, since the 70s, competent teams of the synthesis institutions have
developed studies for the calculation of the gross domestic product and its components, for
the methodological compatibility of the two systems, drafting, in parallel, the synthesis
aggregates. For this paper, we had access to some of these studies that were very useful.14
The situation of the basic synthesis indicators of the national economy for the period
1950-2010, calculated by the official statistics, is as follows: for the first period, 1950-1990,
the global indicator - national revenue, calculated based on the MPS; this is presented in the
series Romania’s Statistical Yearbook, NIS, in the unit – million lei current prices –, from
1970 until 1991, and in the dynamics indexes, for the entire period 1950-1990.
After 1991, this indicator no longer appears in the statistics, being replaced by the
aggregated gross domestic product published in a retrospective manner from 1980, in the
Statistical Yearbook – 1990 and 1991- with the current prices, by resources, with indexes and
structure.
Thus, in our research, we have converted the national income (MPS), into the gross
domestic product for the period 1950-1979, and for the years 1980-2010, for which the
official gross domestic product is available, this was harmonized with comparable prices.
In this section C, the indicator national income and its aggregates for the period 1950-
1979, registered by the national statistics in MPS, were translated in the indicator GDP based
on the NAS methodology; the latter, expressed in comparable prices was converted into USD
14 Amongst these studies, we mention: The calculation of the social product and of the national income at an extanded scale, DCS (The Central Directorate of Statistics), BDS (The Bureau of Secret Documents), no.0194-1973; The social product, the material expenditures and the national income in 1974, comparable prices 1963, DCS-BDS-0151-1974; The calculation of the gross domestic product and of the national income for 1971-1973, based on the UN methodology, DCS-BDS-0190/1974; The national income, the gross and net domestic product based on the UN methodology, for 1970-1973, as comparable prices, DCS-BDS-0193-1973; The social product, the material expenditure and the national income generated and used in 1973-DCS-BDS-0189-1973; The balance of the generation, distribution and end use of the national income, DCS-BDS-0188-1973; The methodology to determine the social product and the national income, of the global product and of the gross value added, proposals for improvement, 1979-DCS-BDS-017-1979, etc. The Centre for Financial and Monetary Research of the Ministry of Finances also had such studies: The content of the main economic indicators in the countries with a market economy, 1974; Studies on the possibilities of use in the Socialist Republic of Romania of a national account system, 1974; The calculation methodology for the national income, the gross and net domestic product, according to the national accounting system, 1976, etc.

119
at the purchasing power parity, currency of 2000, according to the procedures explained that
in Introduction, in order to ensure the comparison and continuity with the previous set of GDP
1862-1947 and with the subsequent one – 1980-2010 – as well as for possible comparisons
with other countries.
***
Before we start explaining the conversion method of the national income to the gross
domestic product, we briefly describe the background of the national economy development,
as ground for the evolution of the macroeconomic indicators.
At the end of the World War, 1939-1945, a great part of the structures of the European
political and governance system was radically changed, as a result of the winning powers
decisions, regarding the partition of the influence and domination areas, often without
consulting the people in question.
Romania, like other countries in the Eastern and South-Eastern part of the continent,
was assigned to the sphere of influence of the Soviet Union that, immediately after 1945,
covered by the treaties concluded with the other winner partners, enforced the pro-Soviet
power in this area.
The internal communist forces, getting the power backed by soviet army, promoted
political, ideological and administrative dictatorship in Romania; through violence, social
elites and traditional institutions were eliminated from the public and political life; the
institutions, the democratic forms and their structures – parties, parliament, free press etc.
were suppressed; they drafted and enforced, by coercion means, legalized by the Constitution
of 1948, the principles of forming and developing the socialist centralized state economy:
nationalization – confiscating the main individual economic means, the “capitalist” ones,
establishing the state property and the cooperatives, as dominating property in the national
economy, the development of the economic, social, cultural etc. activities, based on the
central planning, the single plan and the short, medium and long term forecast.
The fundamental purpose of the country social and economic development, claimed
by the Constitution, was the increase of the material and cultural living standard of the entire
population.
The achievement means envisaged were the increase of the production of goods and
services, of the social labour efficiency by industrializing and electrifying the country, by
going from manual production processes and techniques to the mechanized ones.

120
The social and economic evolution took place in several stages, as follows: the period
of economy recovery –1945-1950 -, after the severe damages caused by the war; in 1950, the
economy of Romania was reaching, to a great extent, the level before of 1938; in 1949 and
1950 the first two annual development plans were implemented, followed by 5 year plans
until 1989. By setting up the Council for Mutual Economic Support -CMES- of the socialist
countries in Europe, the 5 year economic plans were coordinated between the participating
countries.
At the beginning of the researched period, it was expected that the development take
place based on its own resources, without foreign technical and capital contribution;
subsequently, after the change in the communist leadership of the country, since the 60s, in
order to counteract the low level of domestic technique and technology and from CMES
sources, Romania became more open to the collaboration with the international financial and
commercial institutions, with the global market; it becomes a member of the IMF and of other
international financial and economic institutions; it took loans from the Western financial
institutions to import advanced technologies, for the construction of some big industrial and
electric power objectives, for irrigation installations etc.
The economic evolution of Romania in the period 1950-1979 recorded a sustained
development, enhanced by the funds coming from big external loans, which led to structural
and qualitative transformations and a high growth rate of the domestic product. These were
expressed in a set of indicators briefly presented below.
The most important potential resource of the country15 is the population and its
professional qualification (Table Ca).
In the three decades, 1950-1980, we notice a growth of six million inhabitants, partly
due also to the restrictions imposed to abortion, enforced by the state in 1966; the
demographic evolution in this period reflects a high rate of the natural growth.
Equally important is the change in the ratio between the urban and rural population;
Romania, in the modern era, for a century, as an agricultural country, has kept the relative
ratio between the inhabitants of cities and villages constant, around 1:4. Following the forced
industrialization and economic and social restructuring, the status of an agricultural or
predominantly agricultural country was exceeded, the new profile being that of an
industrialized and agricultural country.
15 The main sources based on which the data in these part of the study were replicated or calculated are: the Statistical Yearbook of Romania, 1966-1981; RENEL, Electrificarea în România, 1951-1992, Bucharest, 1996; etc.

121
Table Ca
Population, by urban/rural residence and participation in economic activities
in the period 1950-1980 Total Population Working population Employed
population
Years population by urban/rural residence
total shares
agriculture industry and
constructions
services total share in the
working population
urban rural mil.
inhabi- tants
% % mil. per- sons
% % % mil. per- sons
%
1 2 3 4 5 6 7 8 9 10
1950 16.3 25.4 74.6 8.4 74.1 14.2 11.7 2.1 25.0 1960 18.4 32.1 67.9 9.5 65.4 20.0 14.6 3.2 34.7 1970 20.3 40.8 59.2 9.9 49.1 30.8 20.1 5.1 51.5 1980 22.2 45.8 54.2 10.4 29.4 43.8 26.8 7.3 70.2
Source: see the footnote 15
The urban population has increased also, both in absolute terms and as percentage,
compared to the rural one. The industrialization has created over 80 new cities has expanded
the old ones, and the urban population increased from 4 million inhabitants in 1950 to 10.2
mil. in 1980, mainly due to the transfer of the labour force from villages to cities, from
agriculture to non-agricultural sectors, mainly to the industry
The professional structure, by sector, of the working population changed; from 74% -
the share of agriculture at the beginning of the period, until 1980, this sector is left with
29.4% of the working population; the share of the population working in industry and
constructions increased to 43.8%, and in the services sectors double, from 13.1% to 26.8%.
The third significant change in the employment structure is the multiplied increase in
the payrolled labour force; the number of jobs increases from 2.1 mil. to 7.3 mil. at the end of
the period –1980- ; approx. 70% of the working population appears as having a salary,
respectively with higher qualification, efficiency and remuneration. The speed of such
restructuring, amongst which the on the job training, has generated and sustained in the
economic and social body serious managerial gaps, individual and collective and mind-sets
behaviours, with negative effects on the quality of the development.
Of all the sectors of the economy, agriculture, respectively the rural environment
where in the 40s approx. 80% of the country’s population was living, was the production
sector with the poorest work equipment - overwhelmingly manual - and with the lowest
efficiency; it also had the most difficult problems to be solved in the Romanian society.

122
Industrialization had as objectives, besides the electrification of the country, the
foundation of the basic industry branches, building infrastructure, but also the reorganization
and the mechanization of the agriculture based on vegetable and animal mass production.
Placing agriculture on a modern automated foundation in all the developed countries took
place after the industrialization of the other production and material services sectors, which
ensured big accumulations for the transformation of the agricultural sector. In Romania, the
centralized political power mobilized financial and technical resources for the simultaneous
development of the sectors, accompanied though by a set of structural gaps strongly
manifested during the crisis of the ninth decade.
From a total agricultural surface of 15 mil. ha, the one that could be cultivated was of
approximately 10 mil. ha; here the investment efforts were focused. The big agricultural
holdings were set up through political and economic means, by various methods of extra-
economically and economically constraining the small producers; the organization of the
agriculture, besides the individual households in the mountain areas, was represented in 1980,
by 400 state agricultural enterprises with 1.6 mil. ha arable land, 4600 agricultural
cooperatives –CAP- with 7.3 mil. ha arable land and 700 stations for the mechanization of
agriculture16; these were equipped with the main stock of work and transportation machinery
for agriculture, provided by the new industrial branches; factories producing tractors, trucks,
harvesters, irrigation installations etc. were set up, as well as plants producing chemical
fertilizers, pesticides etc. in order to ensure the internal resources of the agricultural sector.
The animal mass production was organized in big units for breeding cattle, swine, poultry etc.
Also, the secondary and higher education in the field of agriculture has developed for the
training of the executive and management positions, new station and institutes for research
and agricultural experiments were created; the irrigation system was started, which in 1980
covered 2050 thousand ha; silos and warehouses were built for the storage of the vegetable
and animal production etc. The main data showing how agriculture was equipped are
presented in Table Cb.
These data show the transformation of agriculture, through massive investments, into a
mechanized sector, its fixed assets reaching 13.3 bn. USD in 1980; the value in USD was
calculated using the exchange rate in 1989 of 14.9 lei. These investments were reflected by
the multiplication of the number of tractors from 14 thousand to 147 thousand, of the number
of harvesters increased up to 57 thousand, of the agricultural specialists several times more;
16 Popescu Marin, Lecţii ale tranziţiei. Agricultura 1990-2000, Editura Expert, 2001.

123
the fertilizer plants supplied in 1980 1114 thousand tons active substance, namely 117 kg per
cultivated ha.
Table Cb The evolution of agriculture endowments during the period 1950-1980
Years Agricultural machinery
stock Agriculture educated
specialists Chemical
fertilizers used The
surface covered
with irrigation systems
Annual investments
in agriculture
of which:
tractors harvesters higher secondary total per ha arable thousand
pieces thousand
pieces thousand
people thousand thousand
tons kg thousand
ha thousand dollars
1 2 3 4 5 6 7 8 9
1950 14 0.0 3.3 3.1 6 0.6 43 45 1960 44 3.3 5.3 5.9 75 7.8 138 355 1970 107 23.7 16.4 12.8 594 63 665 858 1980 147 56.8 26.4 20.9 1114 117 2048 1828
Source: Romania’s Yearbook of Statistics 1990, 1991
With this technical and human resources, agriculture doubled and tripled its vegetable
and animal production; comparing the averages of years 1951-1955 and 1976-1980, the
annual production of grains increased from 8.2 mil. tons to 19.4 million tons, the sugar beet
production from 1.3 million tons to 6.1 million tons etc.
In turn, the livestock, according to the annual censuses, increased between 1951-1981,
for cattle from 4.5 million heads to 6.5 million heads, for swine from 2.2 million heads to 11.5
million heads, and the number of poultry increased from 17.6 million to 97.8 million.
The efforts of organizing and investing in the agricultural sector had also qualitative
results. The average yield per ha for various grains, just like in the field of animal breeding,
has doubled or tripled, being far from the levels before the war. However, the specialized
studies underline big gaps, from 1.5 to 3 times of the domestic yields compared to the ones in
the developed countries, and also low efficiency and high investment costs in Romania’s
agriculture.
There were changes also in the non-agricultural sectors. The industry inherited in
1948, with a structure with light and extractive sectors was renewed with modern techniques
and technologies, was completed with new branches like metallurgy, manufacture of
machinery and equipment, chemicals, construction materials for industrial sites, housing etc.
But, here too, essential shortages were related to high costs, low efficiency, poor quality of

124
some products, very poor external competitiveness accompanied by big losses in the
international trade.
The facilities for industrial production and constructions have multiplied in the 20th
century. In the period 1950-1980, 3.1 million jobs were created, and an installed motive
power of 9,342 mil. kW was built. This human and energetic potential proportionally
increased the industrial production and the constructions, starting, of course, from a low base
in 1950.
The electrification of Romania was one of the pillars of industrialization, the installed
capacity growing from 740 MW in 1950 to 16,109 MW in 1980, ensuring the entire industrial
and residential energy consumption of the country. The investments in production and
distribution installations until 1980 cumulated 9.1 billion $. A positive result was the
electrification of villages (from 445 to approx. 13,000) the number of the subscribers (rural
households) growing from 151 thousand to 2,958 thousand.
The development of the three sectors for the production of goods - agriculture,
industry and constructions - led to the proportional expansion of the services sectors -
transport, telecommunications, domestic and international trade, education, medical care,
culture, arts, administration etc.
However, the economic growth had only a partial impact on the consumption and
welfare of the population, as the accumulation fund for investments was higher and higher17.
Compared to the extreme poverty of most of the population in the first years following
the war, 1945-1948, the following decades until 1980 witnessed increased real incomes of the
population, the salaries, reflected in a corresponding consumption of industrial and food
products per capita, which improved the standard of living that, however, was much lower
than in the Western industrialized European countries.
To this, millions of new homes built between 1950-1980, from public funds were
added; most of the employed people moved to the cities following industrialization received,
in renting regime18, a dwelling with the minimum comfort – central heating system, water,
electricity etc.
17 National income used, of which (%): 1950 1960 1970 1980
Total 100 100 100 100
accumulation fund 24 20 29 36
consumption fund 76 80 71 64
Source:Romania’s Yearbook of Statistics 1990 18 The lease for modest state dwellings represented between 4 and 8% of the expenditures budget of the families of employees.

125
In terms of medical and social care, during the same period, 1950-1980, an increased
number of beds in the medical units from 69 thousand to 208 thousand, and of the number of
doctors from 16 thousand to 40 thousand etc. has to be noticed. For rest and treatment
purposes, mountain and seaside resorts were extended and built, which in 1980 had 2.2 mil.
visitors, approximately 10% of the country’s population.
As a result of improving the conditions for living, consumption, medical care, the life
expectancy of the population increased from 42 years in 1946-1947, to 69.3 years in 1977-
1978.
Romania’s economic growth in this period was no exception; our country followed the
general trend, specific to the long term cycle, post war, of economic and industrial growth of
Europe and other continents, with annual growth rates of 6-9%. The favourable international
economic context also played a stimulating role, next to the substantial loans contracted from
abroad, materialized in imports of Western advanced technique and technology.
The fundamental characteristic of the economic development of the sixth and seventh
decade of the 20th century in Romania, was an extensive and quantitative growth that, due the
mechanism of the economic system and to the despotic political management, brought about a
lot of the qualitative and efficiency lacks of the social and economic body.
The situation worsened in the 9th decade also at the global level, when the negative
effects of the oil crisis and USD inflation, after the suspension of its convertibility in the 8 th
decade, as to become general; the European economic growth rate decreased, in average, to
1.5-2.5% per year.
Amongst the shortages that envisaged the efficiency of the economy, have to be
mentioned: productivity below the designed one for many of the imported machinery, but also
for the one manufactured in the country; qualification below labour force standards, especially
for the “on the workplace” training; the incomplete use of the fixed assets and production
capacity; in this sense, the immobilizations of funds have increased from 29 bn. lei in 1975, to
94 bn. lei in 1980, the latter representing almost 20% from the value of the domestic revenue.
The losses and subsidies in the economy, mainly revealed by the foreign trade,
increased from 4.2 billion lei in 1955 to 17.8 billion lei in 1965 and 47.1 billion lei in 1979.
During the latter year, the losses and subsidies represented 9.6% of the domestic income.
A last remark regards the forced industrialization that envisaged the autarchy of the
industrial structures; industrial units and branches with a narrow domestic market, with high
production costs, which, when it came to export, were constantly generating significant losses
for the national economy.

126
The dialectics of an extensive industrialization policy like this showed that, as the
quantity of production increased and the production quality decreased, the economy
accumulated more and more difficulties, including financial arrears; and the central planned
management was trying to solve them through the same means that had caused them –
overinvestments, subsidies, forcing the export that generated the losses etc.
***
In this Section C, the objective of the research was to calculate, until the beginning of
1980, when the National Institute of Statistics started to publish the GDP, and based on the
official indicator - domestic revenue, 1950-1979, the necessary data for the area of non-
material services and the consumption of fixed capital, specific to NAS, that we can cumulate
in the global indicator.
In our data conversion operations of the domestic revenue into the gross domestic
product, we have used the conventional group – material and non-material services according
to the MPS - because of methodological needs.
As it was shown before, the published data of the domestic income do not provide
information in absolute figures and in comparable prices, for the necessary calculations.
This is why, besides the published figures, we have used information from the above-
mentioned archived statistics of the Institute of National Economy, provided officially by the
General Directorate of Statistics. These studies, at that time, were considered as trade secrets
and strictly classified; we mentioned them when we referred to that information.
We emphasize that the operations of transposing the domestic income indicator, from
the MPS methodology, into the gross domestic product in the NAS methodology, were carried
out using simplified methods that are explained in those chapters, as we didn’t have all the
necessary elements for a very rigorous accuracy.
Before starting the compatibility statistical operations it is necessary to adjust the
official series of the domestic income which has many errors that could lead to important
distortions of the resulted GDP series.
The compatibility of the basic indicators from the period 1950-1979 was done
through the following operations:
a. adjusting the official series of the domestic income showed by the publications of
that time, in order to obtain a new series as close as possible to the historical
reality, free from official exaggerations and expressed in comparable prices;

127
b. calculating in comparable prices the nonmaterial services and the ccumulation of
their net value to the domestic income in order to complete its structure in MPS and the one in
NAS;
c. calculating the fixed capital consumption, from the national economy, for the entire
structure for the period 1950-1979 and adding the amounts to the indicator that will become
the GDP.
Explaining each operation.
a. Adjusting the official statistics series of the domestic income for the period 1950 – 1979
In order to understand the causes and the need for these operations on the main
indicator of the economic growth, we want to remind the reader that the communist regime, in
the opinions of the people living both in Romania and abroad, used many “justifications” in
order to confirm the fundamental thesis of its ideology, of the superiority of the socialist
system.
The “fast” economic growth was persuasively expressed by the high growth rate of the
domestic income. Of course, most of the domestic income was obtained by increasing the
number of employees, the investment fund, and partly to the labour productivity as it resulted
from the previous data. In the official statistics published, the series of the domestic income is
shown, as mentioned, using dynamics indexes for the entire period, with a flat base for some
years and in absolute figures for certain intervals, in current or comparable prices; in
comparable data19 the domestic income, for all calculations, is expressed in 1963 prices.
However, some critical studies20 point out differences in the size of the domestic
revenue generated by factors other than production. The entire set of data of the domestic
income, 1950 –1979, was accepted in the comparable prices of 1963 because we have
information from archive statistics that allow us to restore the indicator’s evolution for the
researched period21.
19Romania’s Statistical Yearbook 1990. 20 Marvin R. Jackson, National Accounts and The Estimation of Gross Domestic Product and lts Growth Rates for Romania, The World Bank, 1985. In this paper we see, after the careful examination of the components of the domestic income and of their estimation prices, that “the official value of the material production income has ± 5-6% error margin, and the GDP numbers for sure have a wider error margin, possibly of ± 10-12%” (p. 44). 21 The situation of the Social product, material expenditure and domestic income by sectors and per capita, 1950-1970, DCS-BDS, tables document no. 027/1972. The statistics present in a new way the domestic income
on three bases, starting with 1950: prices 1950 until 1959; inprices 1955 from 1950 until 1965 and as the prices
were in 1963 from 1950 until 1970. For years 1970-1975 the data comes from the tables annexed to the letter of
the Directorate of Statistics sent to the Central Institute for Economic Research no. 7605 from 23.II.1977, where
the domestic income, by sectors and per capita, is shown in current prices and in comparable prices 1963.

128
The economic policy of the period was focusing on exceeding the socialist plans, on
saving the production means, on discovering and putting to good capitalizing new growth
resources etc. In the domestic income, calculated by the synthesis institutions, all these
“efforts” were accumulated and expressed.
As the expression and the argument for economic growth in that period were the
indicators expressed in absolute numbers but also the indexes which were easier to understand
and that dominated the volume of the official statistics publications of that time; the effort was
made in order to show their dynamic increase.
Thus, the data, as indicators and indexes, of the social product and of the domestic
income increased, besides by the increase of the economic activities, also by periodically
including some new categories of resources, which have not been considered previously due
to objective or subjective reasons, which contributed to the growth of the domestic income.
We would like to mention some of these resources, the novelty of which is sometimes
almost ridiculous: peasants selling their products in markets, the amateur film production, the
increase of the value of the agricultural production with that of the products consumed by
people and animals during harvest – fruits, animal feed etc., the animal feed resulted from the
cooling of the crops, the grazing of the cattle on the side of the ditches, roads etc.
The biggest adjustment, after the ones in 1955 and 1966, derives from the action
carried out in the synthesis institutions starting with 1970 to expand the area covered by the 22
domestic income, as well as to reassess some activities generating domestic income, until the
end of the 70s23.
22 Thus, new elements were included, among which: the activity of the units for agriculture (stations for the mechanization of agriculture, enterprises for the maintenance and exploitation of the irrigation system, veterinary clinics, centres to fight pests etc.); passenger transport and telecommunications serving the population; services in order to insure the operation of ports and airports; the activity of hotels and balneoclimateric enterprises; scientific research serving production; maintenance and current repairs performed on roads, bridges and streets from budgetary funds; food processing in school and hospital cafeterias; the activity of the workshops for washing, cleaning, painting and photo shops; home processing of purchased threads and fabrics etc. Also, some modification have been introduced due to the improvement of the assessment of some activities, especially those concerning: the production of the individual craftsmen; the construction of homes financed from the resources of the population and the construction works performed for free (called patriotic work); the agricultural production in the population’s households; the consumption of the agricultural products in the field. 23 Until 1979, the extension of coverage area and the change of the assessment of some activities included in the domestic income were done twice, according to DCS-BDS-017/15-1979, as follows: in industry: the activity of the workshops attached to the communal popular councils, of the workshops for the maintenance and repair of material goods in the budgetary institutions, done with inhouse staff; the production of the workshops attached to the public schools, high schools and higher education institutions; the activity of the multiplication workshops from budgetary units; in constructions: workover and maintenance activities for the constructions built by private workers; in the foreign trade: sellling personal goods of the private merchants; in other sectors: the activity of the computing centres in the bugetary units, the film production of the amateur clubs. The way the foreign trade activity was included was also corrected, in order to accurately reflect the contribution of different sectors to the domestic income. In this respect, the balance of the price differences in the import-export activity, related to the

129
The biggest accumulations were made mainly in two stages: in 1970 and in 1974;
these have increased the domestic income24 by 34.7 billion lei per year, respectively a
nominal growth of 8.7% until 1970 and 4.2% more in the next period until 1974, the real
revenue increase from the production activity25.
But the activity categories newly included in 1970, practically previously as well –
1950-1969- were generating a domestic income that was not recorded; thus, the data
regarding the global indicator before 1970 remained unchanged – the number and dynamics
serie in the official statistics has not been corrected retrospectively - the continuity and
comparison of the data from the two periods has suffered.
As a result, in order to ensure an optimum comparison level, the data on the domestic
revenue until 1970 were adjusted and balanced.
In order to make compatible the domestic income data from the two periods and to
make them comparable as well, we have adjusted the figures for the period 1950–1970,
balancing them with the share of the surplus of 8.7%, and for the period 1971–1974 by 4.2%.
The second adjustment is related to the domestic income data for 1975–1979; this is
calculated, as the Statistical Yearbook shows, at the prices on January 1st, 1977.
The sources mentioned above show that the domestic income after 1975 using the
prices on the January 1st, 1977 is 3.8% higher than the one calculated using the prices of 1963.
As a consequence, in order to ensure the comparison we diminished the data for 1975–
1979 by 3.8% in order to bring them to the level of the entire set, at the prices of 1963. The
results of the adjustment are presented in Table Cc.
resulted losses, was distributed to the sectors producing export goods (industry, agriculture, forestry, constructions, transport, tourism), proportionally to their share in the export of goods and services. The area covered by the social product and domestic income was extended with the insertion of some activities, not included before. (Methodology for the determination of the social product and domestic revenue and proposals for its improvement, March 1979). 24 An official difference in the Yearbooks of Statistics, where for 1970 two sets of data about the domestic income are shown: 1970=210.1 billion lei using the methodology of the period 1950-1970 and 217.9 billions using the methodology of 1974 ( Romania’s Yearbook of Statistics 1990, p. 230). 25 The effort of the administrative institutions to increase production and the domestic income, respectively, by adding new consumptions not included by most of the countries, like: the value of the vegetal and animal products consumed by the workers during harvesting and storage, the value of the animal feed resulting from the weeding out of the vegetal crops, of the animal feed on the side of water, roads, railways, which usually are not used or recorded in any country, as well as other such “surpluses” suggests the insistent action – coming from the top management of the country, to increase by all possible means the size of the domestic income and to prove the growth and the high development of the national economy. This can imply overestimates of the indicators, resulting also from various calculations of foreign authors of the Romanian domestic income from that period, calculations that decrease the size and the growth rate of the synthesis indicator by various percentages (see Marvin R. Jackson).
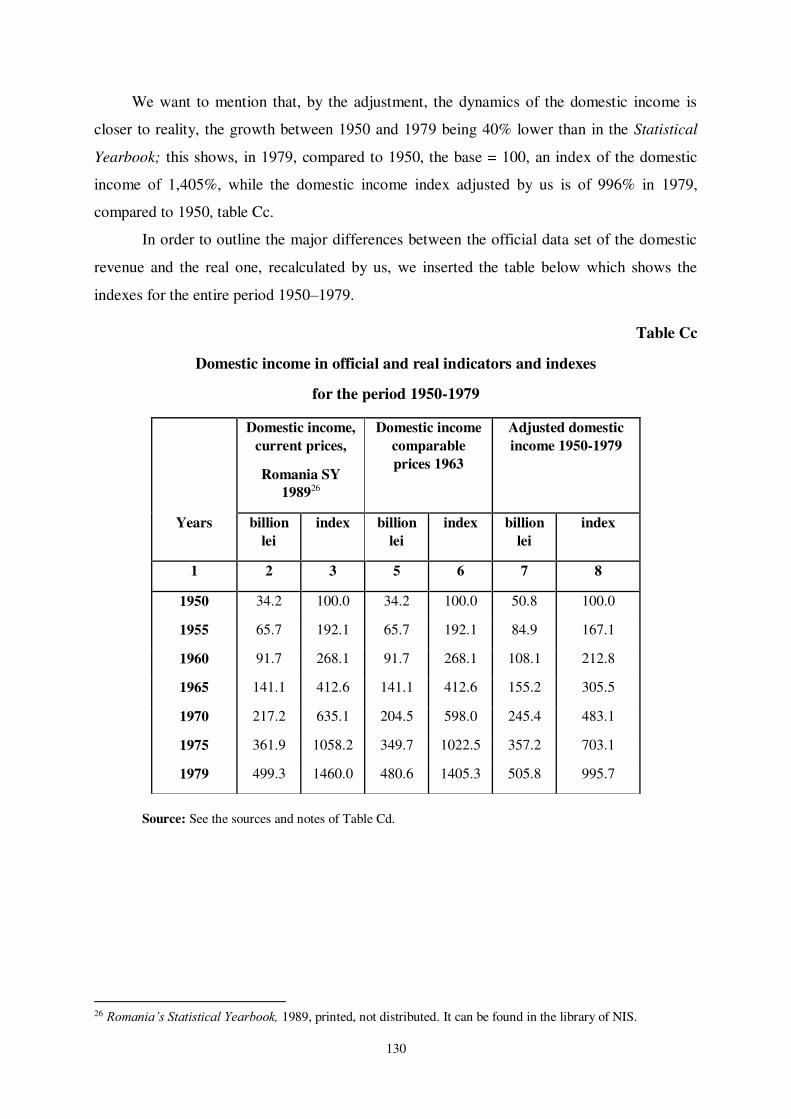
130
We want to mention that, by the adjustment, the dynamics of the domestic income is
closer to reality, the growth between 1950 and 1979 being 40% lower than in the Statistical
Yearbook; this shows, in 1979, compared to 1950, the base = 100, an index of the domestic
income of 1,405%, while the domestic income index adjusted by us is of 996% in 1979,
compared to 1950, table Cc.
In order to outline the major differences between the official data set of the domestic
revenue and the real one, recalculated by us, we inserted the table below which shows the
indexes for the entire period 1950–1979.
Table Cc
Domestic income in official and real indicators and indexes
for the period 1950-1979
Source: See the sources and notes of Table Cd.
26 Romania’s Statistical Yearbook, 1989, printed, not distributed. It can be found in the library of NIS.
Domestic income,
current prices,
Romania SY
198926
Domestic income
comparable
prices 1963
Adjusted domestic
income 1950-1979
Years billion
lei
index billion
lei
index billion
lei
index
1 2 3 5 6 7 8
1950 34.2 100.0 34.2 100.0 50.8 100.0
1955 65.7 192.1 65.7 192.1 84.9 167.1
1960 91.7 268.1 91.7 268.1 108.1 212.8
1965 141.1 412.6 141.1 412.6 155.2 305.5
1970 217.2 635.1 204.5 598.0 245.4 483.1
1975 361.9 1058.2 349.7 1022.5 357.2 703.1
1979 499.3 1460.0 480.6 1405.3 505.8 995.7
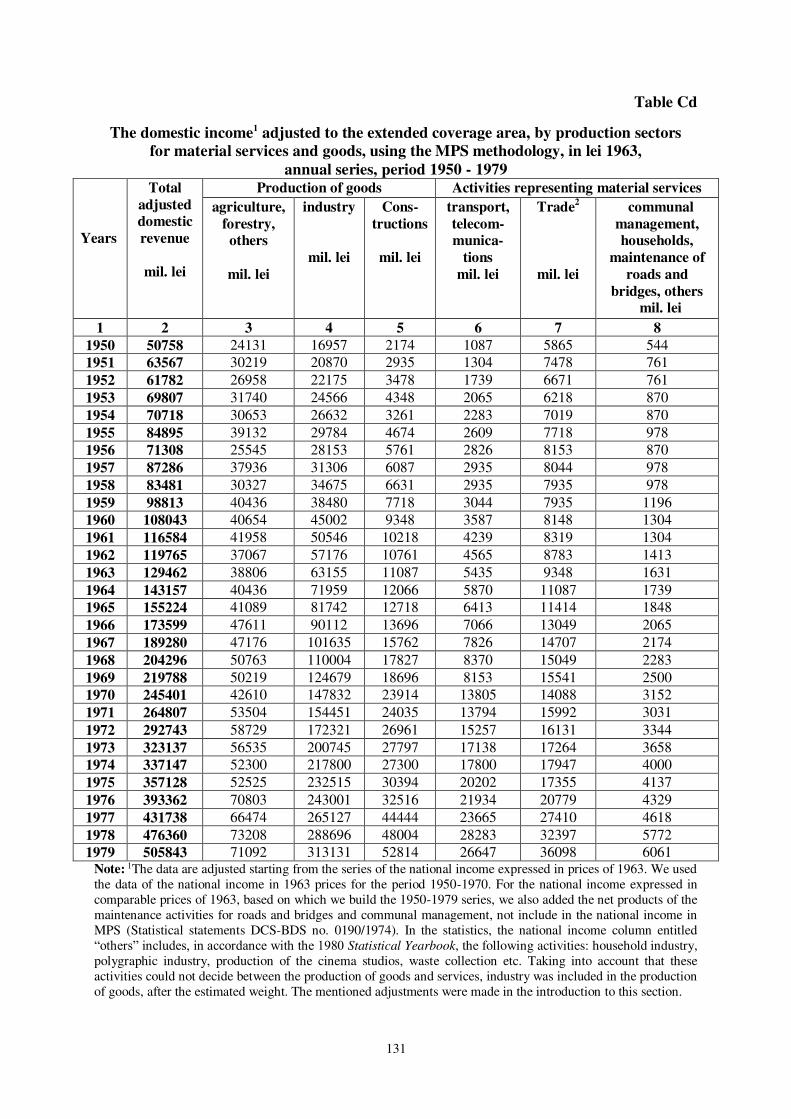
131
Table Cd
The domestic income1 adjusted to the extended coverage area, by production sectors for material services and goods, using the MPS methodology, in lei 1963,
annual series, period 1950 - 1979 Years
Total
adjusted domestic
revenue
mil. lei
Production of goods Activities representing material services
agriculture,
forestry, others
mil. lei
industry
mil. lei
Cons-
tructions
mil. lei
transport,
telecom-munica-
tions
mil. lei
Trade2
mil. lei
communal
management, households,
maintenance of
roads and
bridges, others mil. lei
1 2 3 4 5 6 7 8
1950 50758 24131 16957 2174 1087 5865 544
1951 63567 30219 20870 2935 1304 7478 761
1952 61782 26958 22175 3478 1739 6671 761
1953 69807 31740 24566 4348 2065 6218 870
1954 70718 30653 26632 3261 2283 7019 870
1955 84895 39132 29784 4674 2609 7718 978
1956 71308 25545 28153 5761 2826 8153 870
1957 87286 37936 31306 6087 2935 8044 978
1958 83481 30327 34675 6631 2935 7935 978
1959 98813 40436 38480 7718 3044 7935 1196
1960 108043 40654 45002 9348 3587 8148 1304
1961 116584 41958 50546 10218 4239 8319 1304
1962 119765 37067 57176 10761 4565 8783 1413
1963 129462 38806 63155 11087 5435 9348 1631
1964 143157 40436 71959 12066 5870 11087 1739
1965 155224 41089 81742 12718 6413 11414 1848
1966 173599 47611 90112 13696 7066 13049 2065
1967 189280 47176 101635 15762 7826 14707 2174
1968 204296 50763 110004 17827 8370 15049 2283
1969 219788 50219 124679 18696 8153 15541 2500
1970 245401 42610 147832 23914 13805 14088 3152
1971 264807 53504 154451 24035 13794 15992 3031
1972 292743 58729 172321 26961 15257 16131 3344
1973 323137 56535 200745 27797 17138 17264 3658
1974 337147 52300 217800 27300 17800 17947 4000
1975 357128 52525 232515 30394 20202 17355 4137
1976 393362 70803 243001 32516 21934 20779 4329
1977 431738 66474 265127 44444 23665 27410 4618
1978 476360 73208 288696 48004 28283 32397 5772
1979 505843 71092 313131 52814 26647 36098 6061 Note: 1The data are adjusted starting from the series of the national income expressed in prices of 1963. We used the data of the national income in 1963 prices for the period 1950-1970. For the national income expressed in comparable prices of 1963, based on which we build the 1950-1979 series, we also added the net products of the maintenance activities for roads and bridges and communal management, not include in the national income in MPS (Statistical statements DCS-BDS no. 0190/1974). In the statistics, the national income column entitled “others” includes, in accordance with the 1980 Statistical Yearbook, the following activities: household industry, polygraphic industry, production of the cinema studios, waste collection etc. Taking into account that these activities could not decide between the production of goods and services, industry was included in the production of goods, after the estimated weight. The mentioned adjustments were made in the introduction to this section.

132
2 In the sources, trade cummulates the data of the domestic and foreign trade, considered with the tax on product. While the domestic trade was generating a lot of domestic income, the foreign trade, especially for export, important losses were suffered. The net revenue in the foreign trade at the prices of year 1963 in mil. lei:
Years mil. lei Years mil. lei 1950 +1831 1970 -11331 1955 +1979 1973 -19237 1960 +659 1975 -14609 1965 +828
Calculated based on DCS-BDS: The domestic income by branches and per capita 1950-1979, file no. 832/1974; DCS-BDS, S. 119, Letter DCS no. 07605/25.II.1977, Domestic income by sector in the period 1970-1975. Significant losses were generated by the export of goods, as a result of the difference between domestic and external prices. As an example, the data in the archive shows us the benefits and losses for the imported and exported products for the period 1955-1959:
Years
Overpricing differences for imports
mil. lei
Underpricing differences for exports
mil. lei 1955 +4989 -3056 1956 +4306 -3574 1957 +5417 -3484 1958 +6029 -5161 1959 +5974 -5876
DCS, Strictly confidential, 266/22.V.1962, The analysis of the domestic income of the SRR for 1950-1959. Source: Romania’s Statistical Yearbook, 1970-1981, 1990, 1991; The social product, material expenditure and domestic income by sectors and per capita, 1950-1970 in prices of years 1950, 1955 and 1963. DCS-BDS, tables, document no. 027/1972.
In our subsequent calculations, for which we translated the domestic income into GDP
(1950-1979) the prices of 1963 were determined for the entire period as comparable prices,
total by resources according to table Cd.
b. The second essential operation on the global indicator for 1950-1979 is the
calculation of the net value of the activities included in the non-material services and
adding it to the net value of production and material services.
At a certain moment, these27 were included in the statistics, not for the generation but
for the use of the domestic income, especially since the indicator “national fund for economic
and social development” started to be calculated.
According to the MPS methodology, the non-material services refer to the following
activities: educational, social, cultural, financial-banking-insurance, scientific and geological
research services, street, road and bridge maintenance services, communal and private
27 Some of the services not included in the national income, which are mostly classified in non-material services, are presented in the joint consumption fund at the utilization of the national income: cultural services – theaters,operas, philharmonics, cinemas, amateur clubs, hygiene services – barber shops, cosmetics, etc.; commune and household management – sewerage, sanitation, public toilets, renting dwellings; tourism services, wear of the population’s swellings, maintenance and repairs of the public and private dwellings, private transportation and CAPs, consumption of the institutions and organizations from the non-productive field, respectively of the social and cultural services – education, culture and art, health, physical education and sports, social assistance and administration (Produsul social, cheltuielile materiale şi venitul naţional creat şi utilizat în anul 1973. D.C.S.–B.D.S. nr.0189-1973, multiplicat 30.II.1974).

133
household services, the revenue assigned to the privately-owned homes, the remuneration of
the household administration, defence and others.
In general, the main completion activities from the national accounts are included,
which we will calculate28 for the period 1950-1979. But we have corrected something here,
namely we included the value of the communal and residential management services, as well
as the road and bridge maintenance and repair services in the material services; these
activities represent mainly, in terms of content, the consumption of materials and operate on
material objectives, the unquestionable criteria being the material processes; we have a similar
situation for the sectors of the material production – industry, constructions, agriculture etc. -
maintenance and repair activities for roads, buildings, water supply units, electricity, sewage,
gas supply etc. In the above-mentioned papers, the non-material services, in current and
comparable prices, were around 11-12% of the gross domestic product of those years;
however, the share of the non-material services compared to the domestic revenue, calculated
in the MPS is higher, for sure.
Lacking accurate information about the non-material services, we have assigned them
values based on the average of the their share in the domestic income; thus, the data
calculated by the Central Directorate of Statistics, for years 1971-1973, respectively the
resulted shares of the non-material services, were used to determine the absolute data of these
services for the period 1950-1970, and the share of non-material services in the gross
domestic product in 1980 was used for the period 1974-1979.
Regarding the non-material services during the period of the centralized economy,
1950-1989, it is important to remember that most of them were underestimated compared to
our calculations of the GDP for the periods 1862-1947 and 1990-2010. The area covered by
the non-material services in 1950-1989 has some particularities; part of the services - health,
education etc. - were free of charge for the population; another part –banking and insurance
services - with interests of 1-3% for loans – communal household, charged rent, has low
calculation rates; the use of own dwellings represented 3% of the GDP in 1938, and only
1.3% in 1973. For the material services, we see the same phenomenon; in domestic trade, the
goods went through two links: from the producers to the warehouses and from there to the
retail stores. The official commercial discount of 10-13% and the benefits of 3-4%, as well as
28 In current prices, which were slightly different from the comparable ones due to the stability of the prices in the 60s and 70s, the gross product of the non-material services for 1971-1973, represented 12%, 11.8% and 11.3% in the GDP. Source: Calculation of the Gross Domestic Product and of the national revenue for 1973, according to the UN methodology (preliminary data) DCS-BDS no. 0180, 1973. RD no.1679
134
the tax on the value added (VAT) 9-12% did not increase much the price of the products and
added a low rate of added value.
The change in time of the size of the domestic income determines, thus, the
modification of the volume of non-material services in the given structure, but, because of
that, the calculations include a certain level of relativity related to their size.
In conclusion, the net revenue for 1950-1979 was added to the net value of the non-
material services29, calculated as shown.
c. The next important operation on the domestic income, in the MPS methodology, in
order to obtain the gross domestic product, consisted in calculating the fixed capital
consumption in the economy, for the period 1950-1979.
In the official statistics published until 1990, this data set is missing; however, indexes
and shares were published. Only Romania’s Statistical Yearbook, from 1990 and 1991, show
retrospectively, in current prices, the value of the depreciation of the fixed assets, at certain
intervals: 3.9 billion lei in 1950, 10.3 billion lei in 1960, 31.4 billion lei in 1970, 56 billion lei
in 1980, 84.1 billion lei in 1985 and then every year until 1990, when this reached 100.5
billion lei. In 1980, when the Central Directorate of Statistics published the GDP, the fixed
capital consumption in the gross domestic product of 61.4 billion RON contained also the
depreciation in the non-material services group. With the heterogeneous data and in current
prices, it was difficult to calculate the entire annual series of the fixed capital consumption,
moreover its distribution by sectors to add it to the net product.30
However, the most detailed operations are in the statistic records presenting the
conversion of the domestic income from the MPS methodology into the NAS one, drafted
29 We wat to emphasize that the net value of the non-material services used for material production, which were included in the production costs, like net payments of bank interest, the balance of premiums and insurance damages, travelling expenses, garbage fee etc. that should be included in the intermediary consumption of the sectors, was deducted from the domestic income by the authors of the calculations of the gross domestic product (DCS-BDS 0190/1974, p. 5). Their share in the domestic income, calculated in the material production system was around 2%-2.2%.
30In the archived statistics that we were able to have access to, there is a set of information, data in short series, others separated, on the fixed capital consumption in the sectors of the national economy in various years. The first data series on the amortisation fund comes from the document DCS-BDS from 1974-474-S, called Data on the social product, material expenses and domestic income for the period 1950-1966, where we see, in a separate column, the amortisation of the fixed assets that are included in the material expenses, expressed in 1963-comparable prices, of course under material production, so without the amortisation of the fixed assets of the non-material services. Another source, of the same nature, from 1962 presents the amortisation, also in the MPS methodology, in 1955-comparable prices, for the period 1950-1959; the data is close to the data in th previous document. The following source, The Domestic Revenue of the Socialist Republic of Romania for 1965, in US dollars, – experimental calculation – (DCS-BDS no. 0831 from 1967) provides data on the amortsation in all the sectors of the national economy and converts, from lei to dollars, the amortisation of the fixed assets in the sectors of the material services and production and those of the non-material services. The data in lei show the composition of the amortisation fund by sectors, in 1963 – comparable prices.

135
based on the research from 1970-1975, of the National Institute of Statistics. Here, the
coverage area of the gross domestic product was determined, by calculating the non-material
services and the fixed capital consumption in order to add them to the net income. The
depreciation is presented in this way, in these documents, for all the branches for the period
1970-1973. The statistic records with the indicative 0180 and 0193 include the calculation of
the macroeconomic indicators, the domestic income based on the MPS method, the net
product, the fixed capital consumption and the gross domestic product based on the national
accounts methodology.
Besides these main sources, the Centralized Financial Plan of the Socialist Economy
for 1980 – developed by the Ministry of Finance – shows as a resource of the economy, the
depreciation of the productive fixed assets, in current prices, for 1979. Important are also the
depreciation norms, by sectors and subsectors, presented in the paper “Proposals for the re-
assessment of the fixed assets”, from 1978, of the Institute of Finances, cash flow and prices.
These norms, from which we give a few examples,31 have been applied in the periods 1951-
1953 and 1954-1969.
Using the information and the above data and some indexes from the Statistical
Yearbooks of that period, we have compiled the series in absolute figures, in comparable
million lei, of the fixed capital consumption in the category of material services and
production; there where the data was not available – for a few years – we calculated it based
on the available data and its share in the fixed assets. For the fixed capital consumption from
non-material services we used the data from years 1965 and 1971-1973, from the above-
mentioned sources, where the depreciation by sector is specified, in absolute figures, 1963
comparable prices.
Thus, with the share of depreciations in the domestic income in 1965, we calculated
by extrapolation the fixed capital consumption in billion lei for the period 1950-1970, and
with the average share of the depreciation in the domestic income for 1971-1973, calculated
31 Depreciation norms, in annual percentages, from the value of the fixed assets of the sector:
Sector 1951-1953 1954-1969 Coal 6.7 6.7 Ferrous mines 5.5 7.3 Electricity 4.2 5.3 Metallurgy 4.1 5.3 Chemicals 5.0 7.0 Electrotechnics 3.6 4.7 Cement 4.0 5.0 Wood 4.8 6.0 Textiles 3.5-4.2 4.7-5.6 Railroad 17 17

136
by the sources, we determined the fixed capital consumption for 1971-1979. We did this
because in 1970 and in the following years, as it was mentioned, the area covered by the
social product and by the domestic income was extended and relocations of prices took place.
As a consequence, the fixed capital consumption was calculated with greater or lower
accuracy, for the period 1950-1979, per total and by branches, at the same comparable prices
as those of the domestic income.
The annual data of this consumption were added to the net incomes from the material
production, material services and non-material services, by branches, obtaining in the end,
through the simplified method, the gross value added for the three sectors for the period 1950-
1979.
In terms of the tax on product – the added value tax - back then called the tax on the
movement of goods - and of the customs duties, these were calculated and added to the gross
value added. What’s interesting is that these do not appear in the statistics of the gross
domestic product from 1980-1989.
Another issue is that of subsidies and losses in the centralized economy; there were
special accounts ‘planned losses”, subsidies for the foreign trade etc. increasing from one
period to another, which we deducted from the gross value added.
At the end of converting the domestic income into gross domestic product, in the
comparable currency ‘lei it is necessary to transform the amounts from lei into USD 2000.
In this respect, we did not use the exchange rate, as this was not the proper one; the rationales
are known so we won’t insist on them.
The most frequently used method and with the results the closest to the economic
reality is that of the purchasing parity power of currencies, studied and applied by the
international official institutions under various international comparison programmes. The
calculations for the conversion of the long term series of the gross domestic product from the
national currency, lei, into international USD, based on the purchasing power parity method
are explained in sections A and B. The calculation methods in order to obtain a GDP
expressed in USD 2000, for the period 1950-1979, are detailed in the Methodological
Introduction in the following pages of this Section C.
The result of calculating the GDP for 1950-1979 is shown, thus, in the 11 statistical
statements that follow. We mention that the presentation order of the table is reversed to their
chronological drafting order; respectively, first we present the final synthesis tables and then
the analytical ones, which were the basis for the calculation of the synthesis ones. The statistic
synthesis statements present these indicators, as a rule in two instances, in tandem, the first

137
one, in (six) averages of the years –four-five years-, in a centralized and concise form, and the
second one in annual series of the three examined decades. We mention that some partial data
are expressed in the tables with a difference of one unit resulting from rounding up the
amounts by a decimal factor after the point.
As a last part of the introduction to section C we summarized the global indicators for
the period 1950-1979 from the perspective of some main aspects of dynamics and structure;
first of all, the gross domestic product expressed in comparable RON 1963, with which all the
components were aggregated.
Table Ce
The gross domestic product, total and per capita, in dynamics, in lei 1963,
selected annual averages, for the period 1950-1979
Average Total GDP GDP per capita
of the
years
mill. lei % thousand
lei
%
1 2 3 4 5
1950-1954 87.3 100 5.2 100
1960-1964 171.2 196.1 9.2 176.9
1970-1974 398.8 456.8 19.3 371.2
1975-1979 551.0 631.2 25.4 488.5
Source: Based on the data in table C1
The gross domestic product is presented through the annual averages, which make the
differences more homogeneous, generated especially by the variations of the value added in
agriculture, due to the weather conditions. For a more concentrated presentation, we took the
averages of four periods in the interval of three decades. The first thing noticed and the most
important is the approximate doubling of the GDP in each decade; per total, between the
average of years 1950-1954 and 1975-1979, this has increased 6.3 times; but if we correlate
with the population, which between 1950-1979 increased by 35%, the gross domestic product
per capita increased only 4.9 times. In absolute figures, the new value generated per capita,
between the averages of the years, at the beginning and at the end of the period, increased
from 5.2 thousand lei to 25.4 thousand lei.

138
However, the evolution, by resources, of the value added outlines considerable
differences and discrepancies between the dynamics of the value obtained from the
production of goods and that of services, as well as in the composing branches. The following
table uses the annual data at 5-year intervals.
Table Cf
The gross value added based on the production of goods and services,
by sectors, in dynamics, lei 1963, selected years, for the period 1950-1979
Years Total In the production of goods, 1950 = 100 In services 1950=100
total agri-
culture
in-
dustry
construc-
tions
total mate-
rial
non-
material
billion
lei
billion
lei
% % % % billion
lei
% %
1 2 3 4 5 6 7 8 9 10
1950 66.3 48.1 100 100 100 100 18.2 100 100
1955 110.3 81.3 170 162 173 206 29.0 152 168
1960 140.9 105.9 220 171 259 397 35.0 184 202
1965 204.8 152.2 317 178 459 546 52.6 283 296
1970 344.8 240.1 499 188 817 1036 74.7 418 402
1975 442.2 335.8 698 230 1250 1306 106.4 551 623
1979 630.3 473.1 983 308 1666 2195 157.2 869 856
Source: Calculated based on tables C7, C8 and C10.
Following the dynamics of the two sectors, goods and services for 1950-1979, we note
a higher increase in the production of value in the goods sector, by 9.8 times, compared to the
services one, by 8.6 times, which appears like a deviation from the trend of the contemporary
developed economies to have a higher increase of services, following the increase of the
social division of labour. The existence itself of an economic sector like non-productive
services, which, based on the socialist theory did not contribute to the production of value,
determined the economic policy of the state to underestimate and to limit various services for
the population to the disadvantage of its standard of living, in order to mobilize the resources
to force the production of goods.

139
The phenomenon, specific to the economies of communist countries, could also be a
result of the bureaucracy reduction in the centralized state system, to the way the prices were
formed – minimum links between production and consumption – prices fixed below the costs
etc., but also a result of practicing some categories of services free of charge or with
preferential, not taxed prices – like medical services and education at all levels, dorms and
canteens (provided free of charge), spa treatments, symbolic rent for the state housing etc.
Some of these, correlated also with the major imbalances in the economy, accumulated and
generated, in the ninth decade, serious turmoil for the social and economic system.
In the area of the goods production, of the three basic sectors, the dynamics of creating
value records considerable differences; while agriculture (that received annual investments
from 0.7 billion lei in 1950 to 27.2 billion lei in 1980) increased its production 3.1 times only,
while the industry increased it 16.7 times, and constructions 22 times compared to 1950.
The forced industrialization process, which generalized the machinery instead of
manual techniques in two out of the three sectors of the goods production (agriculture and
constructions) determined higher growth rates of the production of value added; but the poor
production of value added in one of the basic sectors of the economy – agriculture - revealed
big lacks of efficiency in the field. However, if we look at this problem from the contribution
perspective, i.e., of its share in the total value added, as it is presented in the next table, the
conclusions seem optimistic.
As for the services activity, the two subsectors, conventionally separated into material
and non-material, their dynamics were similar.
On the other hand, the contribution of the two categories of resources, of the
production of goods and services, has not recorded, in these three decades, significant
changes: an increasing trend of the share of the goods sector value, from 72.5% to 76.1% and
a corresponding decreasing trend of the participation of the services sector from 27.5% to
23.9%, following the more accelerated growth rate of the production of the first sector.
In the structure of the production of services value, the ratio between the material and
non-material ones does not show sensitive deviations, the main share, an average of 50-54%
belonging to the material ones and the lower share, 46-50%, to the non-material ones; we
believe that the explanation resides in the arguments above mentioned.
Otherwise, the change in the shares of the value added in the goods production sectors
is spectacular; the agriculture, which in 1950 contributed with most of the value, around 52%,
decreased in three decades to 16.4% in total gross value added; the industry and constructions

140
went in the opposite direction; with 42.2% and 5.4% in 1950, the two branches increased
visibly their share going up to 71.6% and 12% in 1979, respectively.
The macroeconomic synthesis indicators, presented in the following set of tables,
decodes, via the averages of the years and annual series, the main results of the development
and transformation processes of the Romanian economy during this period of growth,
followed from 1980 and until 2010 by another period, also of three decades, but with crises,
transition, radical restructuring and the cancellation, to a great extent, of the previous growth,
of substantial loss from the wealth of the country, from the accumulated economic patrimony.
Introduction to the conversion of the GDP from the national currency, lei,
in international USD PPP 2000, for the period 1950 - 1979
The gross domestic product for the period 1862-1947 was calculated in comparable
prices 1913 and converted in USD PPP 2000 based on the method showed in the Introduction
to Section B of the study.
For the next stages, since 1950 until 2010, the official statistics provided, as it was
shown, data on the domestic revenue in the MPS -1950-1990 and on the gross domestic
product for 1980-2010.
The operations for the conversion of the domestic income according to MPS into GDP
based on the NAS and for the calculation of the GDP from current prices into comparable
prices was done separately for the two Sections, C and D; then, we had to convert the two
series into the international comparable currency – USD PPP 2000.
The specialized literature, published by international financial and economic
institutions, universities and research centres, by various calculation and conversion methods,
provides data with different levels for Romania’s GDP, in absolute figures and per capita,
expressed in the US currencies of the different years –1975-2000.
The calculation methods in the combined or purchasing power parity methodology,
being drafted in a complicated way, cannot be decoded, checked and applied by the author in
order to determine the GDP in an international monetary reference for Romania.
The Programme for International Comparisons, as well as the European Comparison
Programme, in all their rounds, required complex methodologies and the effort of hundreds of
specialists.

141
Thus, for the conversion of Romania’s GDP from lei into USD PPP for the period
1950-1979 we had two solutions: the first, to use a convertor from lei into USD for the GDP,
calculated at the level of the domestic income from 1965 by the General Directorate of
Statistics, at the purchasing power parity of the two currencies32; the second solution was to
use the convertor developed in the third round, in 1975, of the International Comparison
Programme, in which our country was also involved and where it provided the results of its
calculations according to Romania’s Economic Memorandum, addressed to the International
Monetary Fund, related to its relation with this institution.
A competent analysis of Romania’s GDP and its conversion from lei to USD at the
purchasing power parity was done, for the period 1970-1980, in this paper, under the umbrella
of the World Bank, by Marvin R. Jackson (National Accounts and Estimation of Gross
Domestic Product and its Growth Rates for Romania, Washington, 1985), which uses the
information of the third round –1975– of the International Comparison Programme and of
Romania’s Economic Memorandum.
The convertor resulted for the GDP prices is of 8.80 lei for 1 USD at the purchasing
power parity.
We chose to convert the GDP from lei into USD, based on the convertor of the third
round of the ICP from 1975, as this solution offered calculations from a period closer to the
Romanian economic reality and which implicitly reflect a stage and a matured structure of the
social and economic body.
32 That study was drafted by the NIS with the support of the economic ministries, of the Ministry of Foreign Affairs, and presents the calculation methodology, the minutious operations performed and the obtained results. It is a valuable study of the calculation of the ratio leu-dollar, based on a Romanian model of the purchase power parity. The lei-USD parity was calculated at the level of the year 1965 with the help of the prices of hundreds of products and categories of products from Romania and the US, using a system of grouping and balancing of the economic sectors. In the study’s summary, the ratio of the purchase power of the two currencies is different, based on the economic coverage area included in the calculation. For the entire domestic income, with the production method, 1 dolar was 12.34 lei, and based on the domestic revenue used, it was of 13.13 lei; for the consumption fund –with a share of 75% from the product mass– 1 US dolar = 11.47 lei, and for the accumulation fund, it was of 23.37 lei; we estimate that the lei-dollar price ratio, according to the Romanian calculations is close to the ratio used by the International Monetary Fund. The European Department of the IMF, in an internal document from 30.11.1965, based on the drafted research and compared to the exchange rate practiced by Romania, proposed an exchanged rate of 13.60 lei for 1 US dollar, in order to calculate the domestic income of Romania in dollars PPP. It results that, according to the Romanian estimation, the exchange rate for the dollar represented 91% of the one proposed by the IMF. In terms of the cost of living, the ratio leu-dollar for the monthly expenses of the consumer’s price basket was, per total, of 8.10 lei; of which food products 10.40 lei=1 dollar; non-food products 17.40 lei=1 dollar and for services 3.70 lei = 1 dollar. For the entire consumption fund, in the most favourable version, using the same categories, 1 dollar was the equivalent of : per total 10.40 lei; for food products 9.90 lei; for non-food products 16.60 lei and for services 7.40 lei. DSC, The Domestic Income of the Socialist Republic of Romania for 1965, in US dollars, - experimental calculation DCS-BDS no.0831. The Addendum of the Volume, the Romanian version, presents the main excerpts of that research.

142
We underline that the purchasing power parity is presented, in the quoted study, for
various categories of products and activities, as well as for the gross domestic product.33
The same USD-lei convertor for the purchasing power parity of the year 1975 is
shown by the study of Angus Maddison – Monitoring the World Economy, 1820-1992 –
OECD,199534, convertor that was used by the author to convert Romania’s GDP also in USD
PPP 1990 using the depreciation coefficient of the US GDP dollar between 1975 and 1990.
However, we mention that irrespective of the PPP lei-USD convertor used,
irrespective of the period, 1965 or 197535 or another one, through the accepted and used
methodology, this is updated using the dollar depreciation coefficients from one period to
another. In the calculation of converting the GDP from comparable lei into PPP USD, the
problem was in applying the convertor in 1975 to the GDP series expressed in comparable
prices of 1975. In this respect, the GDP in 1950-1979, which was calculated in comparable lei
1963, was brought to the level of the comparable prices 1975, weighting by 8.6%, the growth
rate of the indicator prices during 1963-1975. The next operation consisted in relating the
GDP series in comparable prices 1975 to the convertor 8.80 RON for one USD at the PPP. As
the GDP comparison for all three stages –1862-1947, 1950-1979 and 1980-2010– is done
with international dollars 2000, also the series for 1950-1979, expressed in USD 1975 must be
updated at the level of the USD of 2000. This is done by weighting the GDP data series in
33 Thus, for 1 dollar in 1975 the price ration in Romania and the US was in lei compared to dollar: food products 7.60 lei to 1 dollar; clothing and footwerar 13.30 lei; rent 2 lei; furniture 15 lei; medical care 2.40 lei; transport and communications 19.20 lei; education and leisure 9.10 lei; constructions 8.60 lei; long term use goods 22.20 lei; guvernmental consumption 6.70 lei to 1 dollar. As aggreggates, according to the ICP concept: the consumption fund was 7.60 lei to 1 dollar; accumulation 12.90 lei, guvernmental consumption 6.70 lei and the GDP 8.80 lei to 1 dollar. According to NAS: consumption was 8.80 lei to 1 dollar; accumulation 12.9 lei, guvernmental consumption 4.30 lei and the GDP 8.80 lei to 1 dollar. The data comes from table no.45, of the mentioned research, Marvin R. Jackson. 34 Table C 12a ICP –1975 for some European countries, the equivalence with ppc of the national currencies for one dollar is shown:
Hungary 12.3 Poland 14.3 Romania 8.8 Yugoslavia 11.7
The Romanian currency proves to have the best ppp ratio in dollars, amongst the four East-European countries. OECD, Angus Maddison, Monitoring the World Economy, 1820-1995, Paris, 1995, p. 177. 35 The difference between the convertor calculated by the institution of statistics in Romania in 1965, of 12.34 lei=1 US dollar ppp (or the one proposed by the IMF of 13.60 lei=1 dollar) and the one calculated by the ICP in 1975 of 8.80 lei=1 dollar ppp, is only apparent. In reality, the product prices in the US between 1965 and 1975 have increased a lot, from 100 to 173, especially after the oil price shock and the suspension of the dollar convertibility, which inflated, while the prices in Romania, under the absolute control of the State, increased by 6-8% only, during the same period. Calculations show that the convertor from 1965, of 12.34 lei to 1 dollar ppp, compared to the one from 1975, of 8.80 lei to 1 dollar ppp, represents an increase in the purchase power of the Romanian currency, of 71%, respectively a close difference in the US price increase from the decade 1965-1975. These correlations show that, if you start from the convertor of any year, if this was calculated correctly, and use the price coefficient –of the US GDP– as deflator, you get to an amount close to the convertor for that year.

143
USD 1975, with a depreciation coefficient of the USD until 2000. We calculated this
coefficient based on the depreciation index of the US GDP prices from the reference paper of
Samuel H.Williamson, Six Ways to Compute the Relative Value of a U.S. Dollar Amount,
1774 to present. Measuring Worth, 2008.36
We note that, according to the practice of the recent methodology, deflating values,
respectively the global indicators in currency, including in dollars, is no longer done by using
the consumption price index, but by using the US GDP price index. We used this deflator and
coefficient, whose magnitude is different from the one of the US consumption price index.37
Thus, the coefficient used to balance the GDP series 1950-1979 shown in dollars PPP
1975, was of 2.63 in order to reach the GDP series in dollars 2000.
After these compatibility operations, the gross domestic product is shown in the final
statistic synthesis statements of the period 1950-1979, in absolute figures, per total and per
capita, and in indexes, being able to ensure, through the presentation in USD PPP 2000, the
continuity of the previous period –1862-1947 and of the following period 1980-2010.
36 http://www.measuringworth.com/uscompare/
37 2000 1995 1990 1985 1980 1975
US GDP price index
100
98.12
81.61
69.72
54.06
38.01
US consumption price index
100
88.5
75.90
62.49
47.48
31.27

144
Table C 1
Summarized statistical data
The gross domestic product, total and per capita, in lei 1963 and USD PPP 2000,
the annual averages, period 1950-1979
Averages GDP GDP GDP GDP GDP per capita
of lei
1963
lei
19751
USD USD Index USD index
the years 1975² 2000³ 2000
mil. mil. mil. mil.
1 2 3 4 5 6 7 8
1950-1954 87280 94786 10771 28375 100 1700 100
1955-1959 122634 133180 15134 39869 140.5 2241 131.8
1960-1964 171182 185904 21125 55653 196.1 2977 175.1
1965-1969 260530 282935 32152 84700 298.5 4350 255.9
1970-1974 398800 433097 49216 129653 456.9 6270 368.8
1975-1979 550965 598347 67994 179123 631.3 8264 486.1
Source: 1 see Table C2.
Note: ¹˒²˒³: see notes 1, 2, 3, from Table C2.

145
Summarized statistical statements Table C 2
The gross domestic product, total and per capita, in lei 1963 and USD PPP 2000,
annual series, period 1950-1979
GDP GDP GDP GDP GDP per capita
Years lei 1963 lei 19751 lei USD Index USD Index
1975² 2000³ 2000
mil. mil. mil. mil.
1 2 3 4 5 6 7 8
1950 67352 73144 8312 21897 100.0 1342 100.0
1951 86307 93730 10651 28059 128.1 1704 126.9
1952 86060 93461 10621 27979 127.8 1682 125.3
1953 96963 105302 11966 31523 144 1871 139.4
1954 99718 108294 12306 32419 148.1 1899 141.5
1955 123342 133949 15222 40099 183.1 2315 172.4
1956 107299 116526 13242 34884 159.3 1994 148.5
1957 127635 138612 15751 41495 189.5 2327 173.3
1958 119798 130101 14784 38947 177.9 2157 160.7
1959 135095 146714 16672 43921 200.6 2410 179.5
1960 148160 160902 18284 48168 220 2617 194.9
1961 160679 174498 19829 52238 238.6 2813 209.5
1962 166393 180702 20534 54096 247.1 2896 215.7
1963 181441 197045 22391 58988 269.4 3135 233.5
1964 199237 216372 24588 64774 295.8 3422 254.9
1965 215687 234236 26618 70122 320.2 3685 274.5
1966 239941 260576 29611 78007 356.3 4075 303.6
1967 263204 285840 32482 85570 390.8 4437 330.5
1968 282946 307279 34918 91988 420.1 4664 347.4
1969 300870 326745 37130 97815 446.7 4888 364.1
1970 330941 359402 40841 107592 491.4 5312 395.7
1971 355482 386054 43870 115570 527.8 5646 420.6
1972 400937 435417 49479 130348 595.3 6308 469.9
1973 451218 490023 55684 146695 669.9 7043 524.6
1974 455423 494590 56203 148062 676.2 7041 524.5
1975 465719 505771 57474 151409 691.5 7127 530.9
1976 517380 561875 63849 168205 768.2 7843 584.2
1977 548462 595630 67685 178309 814.3 8233 613.3
1978 599123 650647 73937 194780 889.5 8912 663.9
1979 624139 677815 77024 202913 926.7 8957 667.5
Source: Table C4; World Bank, Marvin R.Jackson, National Accounts and Estimation of Gross Domestic Product and 1ts Growth Rates for Romania, Washington, 1985; Samuel H.Williamson, Six Ways to Compute the Relative Value of a U.S. Dollar Amount, 1774 to present. Measuring Worth, 2008.
Note: 1 The depreciation of the GDP lei from 1963 until 1975 was of 8.6%, figure used to convert the GDP from comparable prices 1963 to prices 1975.

146
2 According to the Economic Memorandum of Romania 1983 and to the International Comparison Programme round III 1975, the purchasing power parity of the USD in the GDP calculation was of 8.80 lei = 1 USD. As a consequence, the GDP series transformed in comparable prices 1975 was converted to USD PPP 1975 dividing it with the convertor 8.8.
3 The GDP in US PPP 1975 was converted into USD 2000, multiplying it with the depreciation coefficient of 2.63 of the US GDP USD for 1975-2000, calculated according to Samuel H. Williamson.
Introduction to the calculation of product taxes, the estimation of subsidies and losses in the national economy for the period 1950 – 1979
During the conversion of the domestic income (MPS) into the gross domestic product,
it is necessary to adjust the value at the level of the supplier’s cost to the level of the market
prices. At the same time, we need to investigate the amount of the gross value added, taking
into account the particularities of the centralized-planned economy, during that period in
Romania. Here, the planning mechanisms imposed the strict control of prices in order to
ensure cost stability and the balance of the connection between branches and sectors. For this,
by various leverages –regularization taxes, subsidies, planned losses etc., they tried to
maintain and bring the prices to the planned level. A major problem generating great
imbalances in the size of the generated and distributed revenues were the foreign economic
relations, the exchange of goods and services with the external market; irrespective of the
level of price where the export goods were produced, they were sold normally, at the price of
the external market; hence, due to the internal costs due to a lower national work productivity
and intangible salaries, there were big discrepancies; many of the internal costs, especially for
the manufactured products, were higher, over the world average price, the export generating
significant losses, expressed also in the recovery exchange rate lei-USD. In its turn, the import
of some categories of products was more expensive; for example, for some raw materials –
crude oil, ore etc.: those obtained in the country from natural resources and without rent,
transport and taxes, etc. had lower prices than the foreign ones. But the imported products had
to enter the domestic economic circuit at a compatible or domestic price in order not to
disturb the subsequent chain of the planned costs.
In all these conditions, the state was allocating subsidies, was planning losses that
were taken over by the budget; then the various imbalances in the economy generated losses
due to the shortages in the technical and material procurement, delayed commissioning of
some planned production facilities etc., which were passed on in the economy’s branches.

147
Thus, as the complexity of the economy was increasing, the rigid mechanisms of
planned adjustment of the Romanian economic system did not manage to prevent and not to
solve, due to the lack of a market reference, all the discrepancies occurred. As a result, almost
proportional with the increase of the economy’s potential and of its production, the losses due
to negative processes were bigger.
The access that we had to the archive sources38 facilitated the estimation of the size of
the subsidies and losses in the economy in the seventh decade. These sources, strictly secret,
in limited copies, 20-30, only for the leaders of the party and of the state, showed, in statistic
data and analyses, not only the fulfilment of the economic and financial plan, but also many
difficulties, shortages, even serious gaps in the economy, mentioning also some of the causes
generating them.
The one who will investigate and draft a history of the evolution of the Romanian
economy during that time cannot carry out a survey and properly present it without consulting
such archived information, crucial in order to know the realities, very different from the
reports, the triumphant presentation and the official figures of that time.
The data series that we calculated and estimated come from the Statistical Yearbooks–
product taxes – and from the documents mentioned in the archive – subsidies and losses that
were not published. For the last two indicators, in some years, the missing data were obtained
by statistic computing, interpolations, ratios etc. In some of the analysed documents, in certain
cases – like the export or import deficit – the subsidies were considered losses or the other
way around; for our calculations, both of them are deductions from the tax on product.
However, what is certain is the growth of subsidies and losses, with significant annual
variations, which was faster than the value generated in the three decades; in 1950, the
subsidies and losses were of 7.5 billion lei, and the taxes and duties on products of 8.5 billion
lei, exceeding by 12% the first ones; in 1979, it was the other way around, the subsidies and
losses were of 47 billion lei, 6.3 times more than the reference year, the share of losses
increasing in the official domestic revenue from 7.2%, in 1950, to 10% in 1979.
38 Among these we mention the extensive studies periodically performed by the Ministry of Finances, by other official central institutions: The Analysis Based on the Balance Sheet of the Economic and Financial Results, annual paper from the period 1970-1988; the report on the analysis based on the balance sheet of the economic and financial results from the period 1977-1980; the centralized financial plan of the national economy 1980-1984; Reports on the General Account for the ending of the financial year, 1978-1983; the State Budget of the Socialist Republisc of Romania, 1980-1986; Achieving the International Economic Cooperation Plan, semestral, annual paper, 1982-1986; Analysis of the Domestic Income of the Socialist Republic of Romania: for 1950-1959, etc.

148
Summarized statistical data Table C 3
The gross domestic product1 after operations on the gross value added,
in lei 1963, annual averages, period 1950 - 1979
Averages Gross
value
Taxes on
product
Subsidies Gross
of added and customs and domestic
product
the years duties losses col.2+3-4
mil. lei mil. lei mil. lei mil. lei
1 2 3 4 5
1950-1954 83139 12779 -8638 87280
1955-1959 112565 16319 -6250 122634
1960-1964 162392 22366 -13576 171182
1965-1696 247924 33617 -21011 260530
1970-1974 371526 52063 -24789 398800
1975-1979 540880 46849 -33764 550965
Source: ¹ Calculated based on Table C4.

149
Summarized statistical data Table C 4
The gross domestic product1 after operations on the gross value added 2,
in lei 1963, annual series, period 1950 - 1979
Gross value Taxes on Subsidies
and losses
Gross
domestic
Years added products product
and custom
duties
col. 2+3-4
mil. lei mil. lei mil. lei mil. lei
1 2 3 4 5
1950 66300 8510 7458 67352
1951 82937 11337 7967 86307
1952 81618 13465 9023 86060
1953 91525 15104 9666 96963
1954 93314 15480 9076 99718
1955 110248 17248 4154 123342
1956 96262 15880 4843 107299
1957 115735 17087 5187 127635
1958 111567 15970 7739 119798
1959 129011 15409 9325 135095
1960 140887 18015 10742 148160
1961 152675 20163 12159 160679
1962 158236 21733 13576 166393
1963 171473 24961 14993 181441
1964 188687 26960 16410 199237
1965 204813 28701 17827 215687
1966 227788 31397 19244 239941
1967 249595 34270 20661 263204
1968 268840 36184 22078 282946
1969 288583 37531 25244 300870
1970 314824 47522 31405 330941
1971 337031 52353 33902 355482
1972 371008 53849 23920 400937
1973 406965 57373 13120 451218
1974 427804 49219 21600 455423
1975 442185 49234 25700 465719
1976 496225 52495 31340 517380
1977 542040 37372 30950 548462
1978 593695 39152 33724 599123
1979 630254 40993 47108 624139
Note: ¹Data according to Table C5. ² See the notes in tables C5, C8 and C11. There was no adjustment for the production from banking services. This one was not included in the calculation of the domestic income, according to the material production system, from which we started to determine the gross domestic product; and for the calculation of the non-material services, at the account of the financial banking services, the archive sources used for operations (see the sources of table C12), due to the lack of information (the balance between the cashed and paid interests) the necessary data were not presented. Moreover, we must keep in mind that this balance in the state economy was reduced –by 1-2%- probably in order to cover the banking management expenses and not to gain profit. The proof for this is the share of the entire value added from the banking system which was only 1.6% of the GDP in 1970.

150
Summarized statistical data
Table C 5
The taxes on product – on the movement of goods (ICM)- and customs duties, subsidies
and losses in the national economy in lei 1963, annual series for the period 1950 – 1979
Years Total tax on the
movement
of goods
Tax on product Subsidies Losses⁷ Tax on
product I.C.M. 1 I.C.M.
to the
central2
I.C.M. to
the local1
customs
minus
subsidies
customs
duties,
others
budget budgets duties3 and
Col.3+4+5 losses mil. lei mil. lei mil. lei mil. lei mil. lei mil. lei mil. lei
1 2 3 4 5 6 7 8 1950 8510 8510 - - 50905) 2368 1052 1951 11337 11337 - - 51755) 2792 3370 1952 13465 13465 - - 51475) 3876 4442 1953 15104 15104 - - 54525) 4214 5438 1954 15480 15480 - - 46595) 4417 6404 1955 17248 17248 - - 1130 30244) 13094 1956 15880 15880 - - 1300 35434) 11037 1957 17087 17087 - - 1712 34754) 11900 1958 15970 15970 - - 2586 51534) 8231 1959 15409 15409 - - 3460 58654) 6084 1960 18015 18015 - - 4334 6408 7273 1961 20163 20163 - - 5208 6951 8004 1962 21733 21733 - - 6082 7494 8157 1963 24961 24961 - - 6956 8037 9968 1964 26960 26960 - - 7830 8580 10550 1965 28701 28701 - - 8704 9123 10874 1966 31397 31397 - - 9578 9666 12153 1967 34270 34270 - - 10452 10209 13609 1968 36184 36184 - - 11326 10752 14106 1969 37531 37531 - - 13944 113004) 23576 1970 47522 40544 6978 - 17505 139004) 30003 1971 52353 44026 8327 - 16402 175004) 35934 1972 53849 45086 8763 - 13809 101114) 29929 1973 57373 48046 9327 - 65204) 6600 44253 1974 49219 46007 3212 - 98004) 11800 27619 1975 49234 42136 5788 1310 11100 146004) 23534 1976 52495 44947 6018 1530 13900 17440 21155 1977 37372 32481 3081 1810 21550 9400 6422 1978 39152 34400 2722 2030 13000 207246) 5428 1979 40993 35674 2869 2450 31600 15508 -6115

151
Source: Romania’s Statistical Yearbook 1966, 1971, 1976, 1981; The analysis of the domestic income of the Socialist Republic of Romania in 1950-1979; The Ministry of Finance – works classified as –secret; DCS –Special
Bureau 22.V.1963; The State Budget of the Socialist Republic of Romania, 1969-1981; strictly secret, The basic balance sheet analysis of the financial and economic results, annual paper from the period 1970-1988;
The centralized financial plan of the national economy, for 1980-1984, etc.
Notes: 1.The tax on the movement of goods (I.C.M.), tax similar to the VAT, but with differences in terms of
content, during various periods; starting with 1970, it was also charged for the local budgets at different
quotas. 2. Until 1955, I.C.M. covered all commodities; after 1955, it was applied only to the consumption
goods; the production means were exempted in order to reduce their production costs. 3. The customs duties
were applied to the import of commodities, after the enforcement of the custom fee adopted in 1974. 4. Only
for foreign trade; the data for the other branches were not available. The great variation in the different years
of the amounts representing losses, confirms also the lack of information in some periods. In general, the data
for this position are certainly underestimated. 5. Subsidies through lower prices for food products and
clothing distributed based on variation cards until 1954 and discounts for the prices of the products sold
through “economat stores” (stores with lower prices). 6. The only planned losses that we were able to
discover from the available sources. 7. The quoted sources also show, as losses in the 70s, the annual
damages to the public wealth, between 600 mil. lei and 1200 mil. lei.
Summarized Statistical data
Table C 6
The total and structure gross added value, according to the production areas,
in lei 1963, annual averages,1 period 1950 - 1979
Averages Total Production of Production of
of gross added
value
goods services
the years mil. lei % mil. lei % mil. lei %
1 2 3 4 5 6 7
1950-1954 83139 100 60418 72.7 22721 27.3
1955-1959 112565 100 82221 73.0 30344 27.0
1960-1964 162392 100 121153 74.6 41239 25.4
1965-1969 247924 100 186179 75.1 61745 24.9
1970-1974 371526 100 285214 76.8 86312 23.2
1975-1979 540880 100 408179 75.5 132701 24.5
Source: ¹ Calculated based on the data from Table C7.

152
Summarized Statistical data Table C7
The total and structure gross added value, according to the production sectors1,
in lei 1963, annual series, period 1950 - 1979
Total Production of Production of
Years gross value added goods services
mil. lei % mil. lei % mil. lei %
1 2 3 4 5 6 7 1950 66300 100 48089 72.5 18211 27.5
1951 82937 100 59948 72.3 22989 27.7
1952 81618 100 58959 72.2 22659 27.8
1953 91525 100 67372 73.6 24153 26.4
1954 93314 100 67720 72.6 25594 27.4
1955 110248 100 81221 73.7 29027 26.3
1956 96262 100 68068 70.7 28194 29.3
1957 115735 100 84634 73.1 31101 26.9
1958 111567 100 81101 72.7 30466 27.3
1959 129011 100 96080 74.5 32931 25.5
1960 140887 100 105874 75.1 35013 24.9
1961 152675 100 114570 75.0 38105 25.0
1962 158236 100 118211 74.7 40025 25.3
1963 171473 100 127386 74.3 44087 25.7
1964 188687 100 139723 74.1 48964 25.9
1965 204813 100 152223 74.3 52590 25.7
1966 227788 100 170844 75.0 56944 25.0
1967 249595 100 186779 74.8 62816 25.2
1968 268840 100 202302 75.3 66538 24.7
1969 288583 100 218748 75.8 69835 24.2
1970 314824 100 240118 76.3 74706 23.7
1971 337031 100 257289 76.3 79742 23.7
1972 371008 100 286069 77.1 84939 22.9
1973 406965 100 315245 77.5 91720 22.5

153
1974 427804 100 327350 76.5 100454 23.5
1975 442185 100 335786 75.9 106399 24.1
1976 496225 100 378085 76.2 118140 23.8
1977 542040 100 409408 75.5 132632 24.5
1978 593695 100 444540 74.9 149155 25.1
1979 630254 100 473073 75.1 157181 24.9
Note: 1 Calculated based on the data from tables C8, C10 and C11.
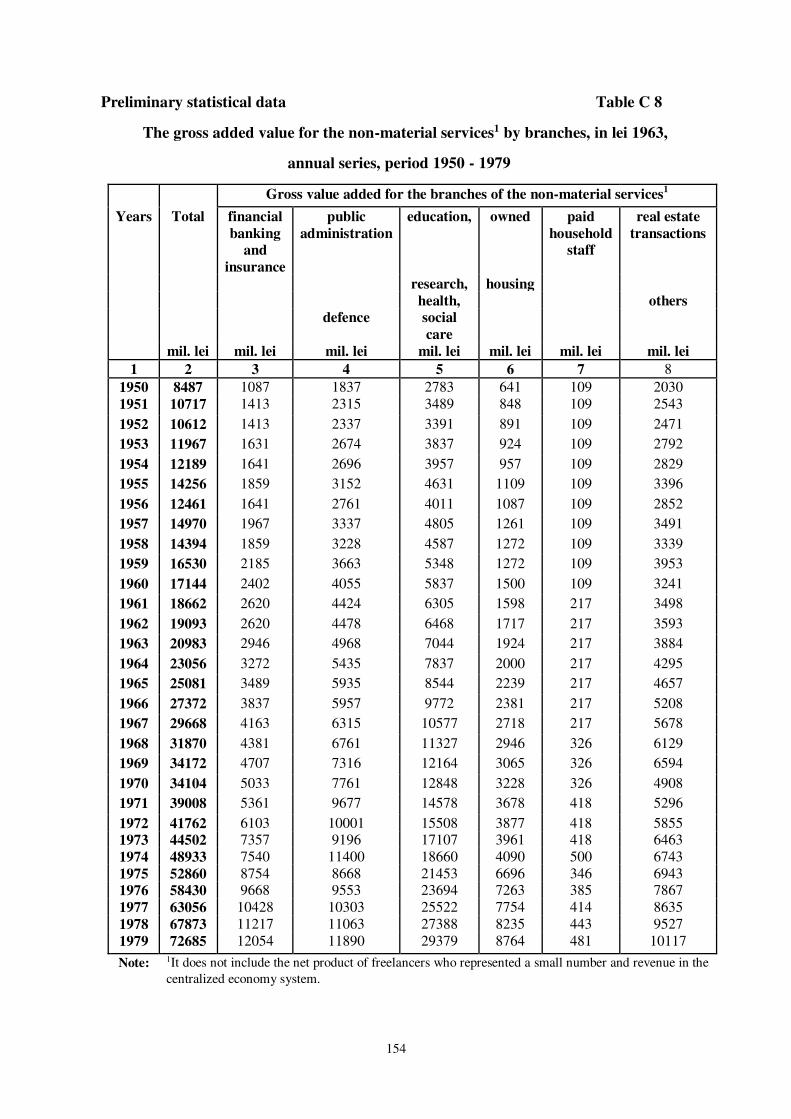
154
Preliminary statistical data Table C 8
The gross added value for the non-material services1 by branches, in lei 1963,
annual series, period 1950 - 1979
Gross value added for the branches of the non-material services1
Years Total financial
banking and
insurance
public
administration
education, owned paid
household staff
real estate
transactions
research, housing health, others defence social
care
mil. lei mil. lei mil. lei mil. lei mil. lei mil. lei mil. lei 1 2 3 4 5 6 7 8 1950 8487 1087 1837 2783 641 109 2030 1951 10717 1413 2315 3489 848 109 2543
1952 10612 1413 2337 3391 891 109 2471
1953 11967 1631 2674 3837 924 109 2792
1954 12189 1641 2696 3957 957 109 2829
1955 14256 1859 3152 4631 1109 109 3396
1956 12461 1641 2761 4011 1087 109 2852
1957 14970 1967 3337 4805 1261 109 3491
1958 14394 1859 3228 4587 1272 109 3339
1959 16530 2185 3663 5348 1272 109 3953
1960 17144 2402 4055 5837 1500 109 3241
1961 18662 2620 4424 6305 1598 217 3498
1962 19093 2620 4478 6468 1717 217 3593
1963 20983 2946 4968 7044 1924 217 3884
1964 23056 3272 5435 7837 2000 217 4295
1965 25081 3489 5935 8544 2239 217 4657
1966 27372 3837 5957 9772 2381 217 5208
1967 29668 4163 6315 10577 2718 217 5678
1968 31870 4381 6761 11327 2946 326 6129
1969 34172 4707 7316 12164 3065 326 6594
1970 34104 5033 7761 12848 3228 326 4908
1971 39008 5361 9677 14578 3678 418 5296
1972 41762 6103 10001 15508 3877 418 5855 1973 44502 7357 9196 17107 3961 418 6463 1974 48933 7540 11400 18660 4090 500 6743 1975 52860 8754 8668 21453 6696 346 6943 1976 58430 9668 9553 23694 7263 385 7867 1977 63056 10428 10303 25522 7754 414 8635 1978 67873 11217 11063 27388 8235 443 9527 1979 72685 12054 11890 29379 8764 481 10117
Note: 1It does not include the net product of freelancers who represented a small number and revenue in the
centralized economy system.

155
Preliminary statistical data Table C9
The fixed capital consumption for the non-material services1 in lei 1963, by
branches, annual series, period 1950 - 1979
Fixed capital consumption for the branches of non-material services
Years Total financial- public education, the rent of owned
banking and
insurance
admini-
stration
research,
health,
housing
defence social care
mil. lei mil. lei mil. lei mil. lei mil. lei
1 2 3 4 5 6
1950 804 x 207 174 424
1951 1000 x 250 228 522
1952 1076 x 272 239 565
1953 1130 x 283 250 598
1954 1207 11 304 261 630
1955 1294 11 326 283 674
1956 1457 11 370 315 761
1957 1587 11 402 348 826
1958 1598 11 402 348 837
1959 1598 11 402 348 837
1960 1837 11 467 402 957
1961 2011 11 511 435 1054
1962 2239 11 565 489 1174
1963 2424 11 620 522 1272
1964 2565 11 652 554 1348
1965 2815 11 717 609 1478
1966 2924 33 196 1076 1620
1967 3337 33 228 1228 1848
1968 3554 33 239 1315 1967
1969 3772 33 250 1402 2087
1970 3870 33 261 1435 2141
1971 4138 31 272 1411 2424
1972 4347 42 282 1505 2518
1973 4598 42 314 1641 2602
1974 4490 40 300 1660 2490
1975 4560 48 308 1684 2520
1976 4772 48 317 1760 2646
1977 5002 48 337 1847 2771
1978 5195 48 346 1924 2876
1979 5416 48 366 2001 3001
Note: 1 See the notes from Table C11.

156
Preliminary statistical data
Table C10
The gross 2 value added1 for the production of material goods and services,
by branches, in lei 1963, annual series, period 1950-1979
Production of goods Material services
agricul-ture
indus-try
construc-tions
trans-port
com-munal
Years Total Total forestry and Total teleco-mmunication
commerce house- hold,
col. 4+5+6 others others 8+9+10 resi-dential house- hold,
3+7 roads,
bridges
mil. lei mil. lei mil. lei mil. lei mil. lei mil. lei mil. lei mil. lei mil. lei
1 2 3 4 5 6 7 8 9 10
1950 57812 48089 25175 20316 2598 9723 1957 6070 1696 1951 72221 59948 31501 24990 3457 12273 2370 7740 2163 1952 71005 58959 28327 26588 4044 12046 2881 6904 2261 1953 79558 67372 33186 29240 4946 12186 3283 6436 2467 1954 81126 67720 32197 31621 3902 13406 3576 7265 2565 1955 95992 81221 40784 35088 5348 14771 3989 7988 2794 1956 83800 68068 27403 34143 6522 15732 4381 8438 2913
1957 100765 84634 39947 37773 6913 16131 4620 8326 3185 1958 97173 81101 32393 41241 7468 16072 4641 8213 3218 1959 112482 96080 42480 45045 8555 16402 4750 8217 3435 1960 123743 105874 43002 52556 10316 17869 5555 8433 3881 1961 134014 114570 44513 58785 11272 19444 6381 8943 4120 1962 139143 118211 39915 66361 11935 20932 6946 9442 4544 1963 150490 127386 41904 73122 12359 23104 8022 10049 5033 1964 165632 139723 43730 82569 13424 25909 8631 11919 5359 1965 179732 152223 44687 93341 14196 27509 9424 12270 5815 1966 200416 170844 51078 103809 15957 29572 10261 14028 5283
1967 219927 186779 51143 117287 18349 33148 11490 15810 5848 1968 236970 202302 54991 126722 20588 34668 12283 16178 6207 1969 254412 218748 54709 142408 21631 35664 12294 16707 6663 1970 280720 240118 47208 165996 26914 40602 18044 15145 7413 1971 298023 257289 58248 172101 26940 40734 17974 17671 5089 1972 329246 286069 63766 191935 30368 43177 19845 17825 5507 1973 362464 315245 61613 222313 31319 47219 22196 19077 5946 1974 378871 327350 57640 238920 30790 51521 22730 19831 8960 1975 399325 345786 57941 253910 33935 53539 25204 19177 9158 1976 437795 378085 76469 265397 36219 59710 27167 22961 9582 1977 478984 409408 72429 288648 48331 69576 29158 30288 10130
1978 525822 444540 79384 313112 52044 81282 33987 35799 11496
1979 557569 473073 77518 338537 57018 84496 32583 39888 12025
Note: 1 The net revenue plus the fixed capital consumption are considered.
2 The initial data of the net domestic revenue were adjusted according to Note 1 of Table Cd.
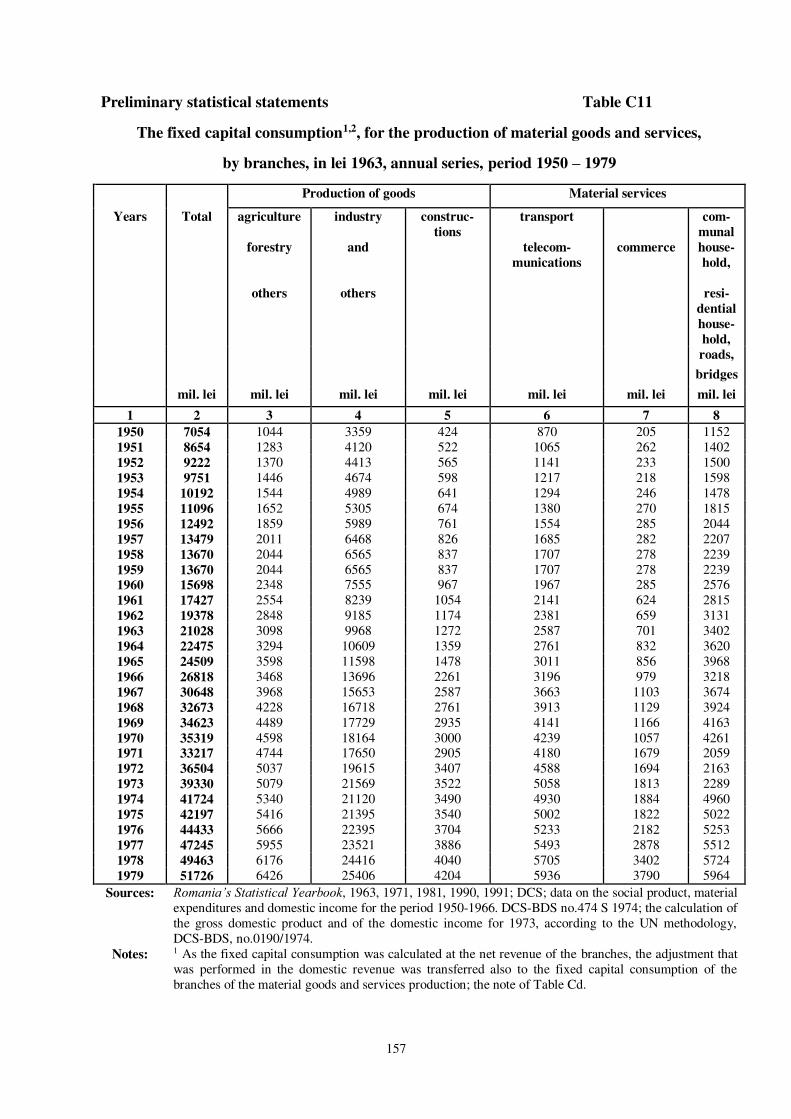
157
Preliminary statistical statements Table C11
The fixed capital consumption1,2, for the production of material goods and services,
by branches, in lei 1963, annual series, period 1950 – 1979
Production of goods Material services
Years Total agriculture industry construc-tions
transport com-munal
forestry and telecom-munications
commerce house-hold,
others others resi-dential house-hold,
roads, bridges mil. lei mil. lei mil. lei mil. lei mil. lei mil. lei mil. lei
1 2 3 4 5 6 7 8 1950 7054 1044 3359 424 870 205 1152 1951 8654 1283 4120 522 1065 262 1402 1952 9222 1370 4413 565 1141 233 1500 1953 9751 1446 4674 598 1217 218 1598 1954 10192 1544 4989 641 1294 246 1478 1955 11096 1652 5305 674 1380 270 1815 1956 12492 1859 5989 761 1554 285 2044 1957 13479 2011 6468 826 1685 282 2207 1958 13670 2044 6565 837 1707 278 2239 1959 13670 2044 6565 837 1707 278 2239 1960 15698 2348 7555 967 1967 285 2576 1961 17427 2554 8239 1054 2141 624 2815 1962 19378 2848 9185 1174 2381 659 3131 1963 21028 3098 9968 1272 2587 701 3402 1964 22475 3294 10609 1359 2761 832 3620 1965 24509 3598 11598 1478 3011 856 3968 1966 26818 3468 13696 2261 3196 979 3218 1967 30648 3968 15653 2587 3663 1103 3674 1968 32673 4228 16718 2761 3913 1129 3924 1969 34623 4489 17729 2935 4141 1166 4163 1970 35319 4598 18164 3000 4239 1057 4261 1971 33217 4744 17650 2905 4180 1679 2059 1972 36504 5037 19615 3407 4588 1694 2163 1973 39330 5079 21569 3522 5058 1813 2289 1974 41724 5340 21120 3490 4930 1884 4960 1975 42197 5416 21395 3540 5002 1822 5022 1976 44433 5666 22395 3704 5233 2182 5253 1977 47245 5955 23521 3886 5493 2878 5512 1978 49463 6176 24416 4040 5705 3402 5724 1979 51726 6426 25406 4204 5936 3790 5964
Sources: Romania’s Statistical Yearbook, 1963, 1971, 1981, 1990, 1991; DCS; data on the social product, material expenditures and domestic income for the period 1950-1966. DCS-BDS no.474 S 1974; the calculation of the gross domestic product and of the domestic income for 1973, according to the UN methodology, DCS-BDS, no.0190/1974.
Notes: 1 As the fixed capital consumption was calculated at the net revenue of the branches, the adjustment that was performed in the domestic revenue was transferred also to the fixed capital consumption of the branches of the material goods and services production; the note of Table Cd.
158
2 As it was mentioned in the Introduction to this section, the series of the amounts representing the fixed capital consumption was done, in comparable prices 1963 based on the presented sources and on the amortisation indexes of the fixed assets and, for the years the information is missing, the volume of the fixed capital was estimated by interpolation.
Section D
GROSS DOMESTIC PRODUCT DURING THE 1980-2010 PERIOD
Historical and methodological introduction
The researched period is represented by the last decade - 1980-1989 - of the command
economy system, facing with a crisis and blockage39 and the 1990-2010 decades, of transition
(and recovery) to the market economy also confronted with the deterioration phenomena, of
the economic potential. Thus, from the historical standpoint, a long and costly economic
decline process, was cumulated in the two sub-periods due to different causes40.
In the third decade, 2000-2010 of the period, the transition to a market economy was
almost completed and at the same time the recovery and development of a new socio-
economic system started. In 2000 Romania had reached a development level that was 25 years
ago; an equal loss of economic growth.
The evolution and structure of the gross domestic product, which we present in the
following statistics, confirm this sinuous type of evolution of the Romanian economy.
The value representation of these processes, and in particular of the gross domestic
product is presented in the official statistics, in the Statistical Yearbook of Romania, in current
prices and indexes.
The GDP indicator in the 1980-2000 stage, expressed in lei current prices, was
converted through the official deflator published by the Central Bank of Romania, to
comparable lei 1990. The GDP series thus obtained was converted then in USD PPP 2000
based on the method mentioned at section A, and as for the previous period 1950-1979, based
on the 8.8 lei converter for one dollar using the purchasing power parity of 1975, calculated in
the Economic Memorandum of Romania, 1983, according to the International Comparisons
Program, 3rd round. For this, the GDP between 1980-2000, expressed in 1990 comparable lei
was calculated to the prices of 1975 based on the price index, being reduced by 10.9%, the
difference of their increase between 1975 and 1990; the GDP in comparable prices 1975 was
divided by the 8.8 lei converter = 1 USD PPP, thus resulting the GDP series in USD 1975.
39 Constantin M. Ionete, Criza de sistem a economiei de comandă şi etapa sa explozivă, Bucureşti, 1993. 40 Belli Nicolae, Tranziţia mai grea ca un război. România 1990-2000, Bucureşti, 2001.

159
Furthermore, by weighting the new GDP series with 3.38, the depreciation coefficient of the
USD for calculating the USA GDP between 1975 and 2000, we obtained the GDP of the
Romanian economy for the period 1980-2000 in USD PPP 2000.
The last time interval, of the section D, GDP in the period 2001-2010 was calculated
based on dynamics and structure indexes of the period, which were obtained from the
National Institute of Statistics, on a fixed base, the year 2000 = 100, indexes applied to the
GDP data of the year 2000 and directly expressed in USD PPP 2000. Thus, section D,
comprising the GDP series for the 1980-2010 period complemented the period of sections B -
1862-1947 and C - 1950-1979, therefore obtaining the entire series of the 150 years,
compatible and comparable in USD PPP 2000 presented in the summary section A.
Further we will present, as it was the case for the other section Introductions, in a
summarized manner, by statistical data, the main aspects related to Romania’s evolution41.
a.The population, as akey factor of potential and social production, underwent radical
changes in the evolution of its structures during the three decades.
Table Da
Romania’s population, demo-economic indicators, selected years
Years Total Urban Rural
Employed
population1 Population employed
in Employees
% in
production
of % in
mil. % % mil.
total
population
goods2 services mil. employed
population
inhabi-
tants persons (col.5/2) % % persons
1 2 3 4 5 6 7 8 9 10
1980 22.2 45.8 54.2 10.4 46.8 73.4 26.6 7.3 70.2
1985 22.7 50.0 50.0 10.6 46.7 73.6 26.4 7.7 72.6
1990 23.2 54.3 45.7 10.9¹ 47.0 72.2 27.8 8.2 75.2
1995 22.7 54.9 45.1 9.5 41.9 68.4 31.6 6.2 65.3
2000 22.4 54.6 45.4 10.5 46.9 69.8 30.2 4.6 53.4
2005 21.6 54.9 45.1 9.2 42.6 61.9 38.1 4.6 50.1
2010 21.4 55.1 44.9 9.2 43.0 57.1 42.9 4.4 47.8
Notes: ¹ Since 1990, only civil employed population.
² Includes agriculture, industry and constructions.
41 The data and calculations performed based on the Statistical Yearbook of Romania, 1981, 1991, 2012 time series.

160
Among the specific demo-economic elements of the period, for the first time in the
modern and contemporary history of the country one can notice a demographic decline; after
1990, the reduction between the two decades reaches the level of 2 million inhabitants. The
forecast of the demographers registers this decline for the long term.
On the other hand, in the first decade of the period, in 1985, as another first historical
event, the ratio between the urban and rural population became equal, the latter dominating
earliest times since the Romanian history; the process in favor of the urban area advances, and
in 2010 it reached the level of 55% of the country’s total population.
The employed population, for which the official statistics introduced new indicators
after 1990, has registered as of that year a declining trend since this year; in 2010 the
employed population represented 43% of the total population, as compared to 47% in 1990.
The more radical are the changes in the shares between the employed population in the
two sectors; in three decades, the population working in the production of goods decreases
from 73.1% to 57.1%, while the share of services increases from 26.6%, in a more sustained
manner after 1990, to 42.9% in 2010.
The same radical changes are manifested in what concerns the employed population;
after an increase of one million between 1980-1990, the number of employees decreases from
8.2 million to 4.4 million in 2010, due to the loss of jobs following the dissolving or
restructuring of several enterprises with state-owned capital, as well through the expansion of
the economic entrepreneurial activities.
As concerns the goods production sectors, the changes are much more radical and
negative as compared to the production of services.
b. In agriculture, a national strategic sector with a more complicated social issue, the
situation can be presented in a summarized manner in the tables Db and Dc.
What is dominating is the downward trend, with some exceptions, of the potential and
production indicators; the cultivated surface decreases by 1.5 million ha, and the effect is loss
of food products; the supply of fertilizers is also reduced: for the natural ones, under half of
the 1980 level and a higher share for the chemical fertilizers; most irrigations have been
destroyed and lost - 90%.
The same destructive processes occur in livestock; in livestock units, out of the total
livestock in 2010, only 38% is left; for bovines only 31% and for swine 45% as compared to
the number of 1985.

161
Table Db
Agriculture key indicators, selected years (a) potential
Years
Tractors Fertilizers Irrigated Livestock (livestock units)
Cultivated surface
natural chemicals surface total out of which million
heads
mil. ha mil. pcs mil. t
thousand
t Kg/ha mil. ha mil. bovine sheep swine
1 2 3 4 5 6 7 8 9 10 11
1980 6.5 147 34.3 1114 113 1.6 12.1 5.7 1.5 4.2
1985 6.3 184 37.9 1200 120 2.4 13.6 5.8 1.5 5.4
1990 5.7 127 35.1 1103 117 1.9 11.4 5.1 1.4 4.4
1995 6.4 163 21.5 470 50 0.4 7.6 2.9 1.0 2.7
2000 5.7 160 18.3 342 37 0.2 5.5 2.5 0.7 1.6
2005 5.9 173 19.4 461 50 0.05 6.5 2.5 0.7 2.3
2010 5.0 180 16.4 481 51 0.08 5.2 1.8 0.9 1.9
The agricultural properties and holdings are fragmented by the parceling processes. In
2002 the agricultural surface was divided in 34 million parcels which contributes to the
decrease of the agricultural production.
Some of the indicators of the agricultural activity’s outcomes highlight the decline
tendencies in this sector.
Table Dc
Agriculture – key indicators, averages of the years (b) production
Averages Value of the agricultural production,
lei 2005-2010
Average production
per ha Number Number Animal production
of vegetables animals
per arable hectare per wheat corn of of meat milk eggs
years
inhabitant cows birds
billion lei billion
lei thousand
lei thousand
lei tons tons mil. mil. million
tons million liters billion
1 2 3 4 5 6 7 8 9 10 11 12
1980-1984 47.0 18.8 4.6 3.0 2.7 3.3 3.1 106.5 2.3 48.9 6.8
1985-1989 45.4 19.2 4.5 2.9 2.9 3.1 2.8 125.3 2.3 50.2 7.5
1990-1994 32.1 17.9 3.5 2.3 2.6 2.9 2.2 101.1 2.2 47.2 6.4
1995-1999 32.0 16.9 3.4 2.2 2.6 3.3 1.9 73.0 1.7 55.4 5.5
2000-2004 31.3 16.3 3.3 2.2 2.4 3.0 1.8 76.5 1.5 55.4 6.4
2005-2010 29.5 16.6 3.2 2.2 2.6 3.3 1.6 83.8 1.4 58.5 6.7

162
As a synthetic indicator, the value of the agricultural production, expressed in the
average prices of 2005-2010, significantly reduced during the three decades; the vegetal one
by 37% and the animal one by 14%; this is also confirmed by a decrease in the production per
hectare and per inhabitant; in turn, the yield per hectare for wheat and corn did not decrease,
which seems to be paradoxical compared to the table of potential data; under the
circumstances when the irrigations practically disappear from 2.4 mil hectares, the quantity of
fertilizers was significantly reduced, and the agricultural holdings were in the most
fragmented situation in the history of the country, it is difficult to accept that yields were
maintained at approximately the same level, as estimated by the ministry of agriculture.
The same situation can be acknowledged for some animal products; while the number
of cows decreased to almost half and the number of birds decreased by 33%, the milk
production increased by 20% as compared to the initial period, and the egg production, with
variations, reached its initial level during the last period; average productions per animal and
bird without any precedent in the Romanian history.
c. In industry, the most advanced sector from the technological perspective and with a
production having the highest share in the economy, the highest losses and damages of the
country’s economic potential has been registered. With an unbalanced structure, doubled by
some inefficient branches, industry during the last decade of the command economy, was
characterized in 1990 by the prime minister as “a mountain of scrap”. It seemed like a signal
to give up, the destruction of most of the big industrial factories and of entire economic
branches.
During the ninth decade, 1980-1990, the major difficulties of the economy were
expressed, in a summarized manner as a decrease of labor productivity, despite the increased
investments in industry42.
Thus, the official statistics registered the reduction of this basic indicator, per
employee, in certain essential industrial branches43.
42 Investments in certain industrial branches, indexes (1970 = 100)
1970 1980 1985 1989 Industry total, out of which: 100 282 313 271 electricity 100 200 488 367 fuels 100 271 494 437 non-ferrous metallurgy 100 237 366 411 chemistry 100 350 265 252 celluloses, paper 100 208 265 128

163
Labor productivity (indexes 1980 = 100)
During the three decades, 1980-2010, the industrial production, with increase and
decrease variations, and its potential are significantly reduced; a massive dezindustrialization
process is recorded, involving the loss of most of the production capacities accumulated in the
last century.
Industry by basic indicators
Employees Production Energy consumption
thousand 1980=100 1980=100
billion
kWh 1980=100
1980 3198 100.0 100.0 60.5 100.0
1985 3501 109.5 120.0 54.6 90.3
1990 3702 115.8 108.0 53.2 88.0
1995 2815 81.2 63.9 35.7 59.0
2000 2004 62.7 57.1 22.4 37.0
2005 1973 61.7 71.4 26.1 43.1
2010 1739 54.2 88.1 17.5 28.9
From the highest level of the ninth decade to the tenth one, the workforce and
production indicators are reduced by almost half, and the energy consumption to 37%.
The Romanian economy to be able to function, besides using its own resources, it had
to move to massive imports, in particular of consumer goods, becoming a retail market for
foreign goods and an external debtor in order to cover the costs of imports; records were also
registered for this situation: the biggest imports and the highest foreign debt, as compared to
the capabilities of the national economy.
43 The Statistical Yearbook of Romania, 1991.
Branch 1980 1985 1989 1990
electricity 100 32 35 28
fuels 100 70 77 55
non-ferrous metals 100 88 86 59
chemistry 100 96 90 72
cement 100 67 75 67
celluloses, paper 100 88 57 77

164
In the other branches of the economy, especially services, the evolution was similar to
that of the production of goods, except for the monetary field, which in the period 1990-2000
witnessed the highest level of inflation after 1944-1947, e.g. ten thousand times higher.
This caused difficulties for the Romanian economy, affecting, first of all, the standard
of living of the employees and retirees, respectively of most of the population with fixed
incomes, as well as hindering the investments, especially the long term ones.
Incomes and consumption indicators of the population, selected years
Years
Average
real pension
Average consumption per capita
Average
meat sugar grains
Daily calorie
consumption
Domestic
consumption
of
real
energy per
salary
capita
indexes indexes kg kg kg kWh
1 2 3 4 5 6 7 8
1980 100.0 100.0 62.0 28.2 173 3254 220
1985 95.9 91.0 55.1 26.3 143 3037 212
1990 100.5 101.0 60.1 27.3 156 2930 186
1995 66.1 64.1 47.8 23.5 216 3038 313
2000 58.6 42.3 46.3 23.0 220 2908 303
2005 89.5 63.9 68.0 26.0 207 3450 291
2010 123.0 127.9 60.0 22.1 200 3212 306
Source: The Statistical Yearbook of Romania, 1990, 2001.
The contraction of the economic activities during the ninth decade with a great
shortage of food, electricity, reduced by the communist power to internal consumption in
order to increase exports, with the view of paying the external debt, is reflected in a decrease
of real revenues until 1990; in the following decade their reduction in real terms was caused
by the inflation and by the fall of production. Although the economic recovery had a slow
pace, the democratic state, using specific tools, increased the incomes of the civil servants and
retirees, being in the latest period higher than the previous peak level.
The dynamics of the economy, with its ups and downs, was synthetically expressed in
the evolution of the global indicators - gross domestic product - gross added value.
At the end of the three decades of crises and restructuring, the economy registering an
upward trend and balance, shows a GDP per capita higher by 35% as compared to the
beginning of the same period; more specifically, the services sector was developed faster,

165
although it was deprived before 1990; this sector marked an increase to 241% in the 2006-
2010 period as compared to the initial time interval, while for the goods sector the increase
was of only 81%.
Table Df
Gross domestic product per capita and the gross added value per capita
in the production of goods and services, USD PPP 2000
Averages GDP per capita Gross added value per capita
of
in the production of goods
in the production of services
years USD indexes USD indexes USD indexes 1 2 3 4 5 6 7 1980-1984 9401 100.0 6433 100.0 2520 100.0 1990-1994 7950 84.6 4907 76.3 2804 111.3 2001-2005 9675 103.9 4196 65.5 4439 176.2 2006-2010 12715 135.3 5235 81.4 6079 241.2
In all the final statistical situations of this section D, the presentation of the 13 tables,
as well as in sections B and C, was made chronologically reversed as compared with the
primary calculations; they are presented in the absolute and relative data.

166
Summarized statistical data Gross domestic product, total and per capita, in comparable prices, lei and USD PPP 2000,
annual series, 1980-2010 period
GDP NIS Index
GDP Index GDP per capita
Years lei 1990 USD PPP 2000
USD PPP 2000
Index
mil. mil.
1 2 3 4 5 7
1980 734986 198465 100 8939 100
1981 735510 198606 100.1 8885 99.4
1982 765328 206658 104.1 9194 102.8
1983 811850 219220 110.5 9720 108.7
1984 860055 232237 117 10265 114.8
1985 859266 232024 116.9 10211 114.2
1986 879171 237399 119.6 10402 116.4
1987 886638 239415 120.6 10437 116.7
1988 882526 238305 120.1 10337 115.6
1989 830960 224380 113.1 9692 108.4
1990 784420 211813 100 9127 100
1991 682933 184409 87.1 7954 87.1
1992 622518 168096 79.4 7376 80.8
1993 631787 170599 80.5 7497 82.1
1994 656417 177249 83.7 7798 85.4
1995 703145 189867 89.6 8371 91.7
1996 731175 197436 93.2 8733 95.7
1997 686564 185390 87.5 8223 90.1
1998 653754 176530 83.3 7845 86.0
1999 645762 174372 82.3 7764 85.0
2000 659098 100 177973 84.0 7933 86.9
2001 105.6 187940 88.7 8387 91.9
2002 111.1 197728 93.4 9120 99.9
2003 117.2 208584 98.5 9598 105.2
2004 127.0 226026 106.7 10429 114.3
2005 132.3 235458 111.2 10889 119.3
2006 143.0 254501 120.2 11791 129.2
2007 152.8 271943 128.4 12627 138.3
2008 165.7 294901 139.2 13714 150.3
2009 154.0 274078 129.4 12766 139.9
2010 152.7 271765 128.3 12681 138.9
Source: Statistical yearbook of Romania 1990, 1996, 2001; Central Bank of Romania, Annual reports 1991-1995, 1996, 2002 World Bank, Marvin R. Jackson, National Accounts and Estimation of Gross Domestic Product and its Growth Rates for Romania, Washington, 1985; Samuel H. Williamson, Six Ways to Compute the Value of a U.S. Dollar Amount 1774 to present, Measuring worth, 2008. Notes 1: The transformation of GDP from lei comparable prices 1975 was done by multiplying the 1990 series with a 0.902 coefficient representing the increase by 10.9%. of GDP prices between 1975-1990. 2. The GDP conversion from lei 1975 in USD at the purchasing power parity, by means of the 8.8 lei = 1 USD 1975 ratio was calculated by following the International Comparisons Program, ICP, 3rd round and the Economic Memorandum of Romania 1983. 3. 1975 USD PPP were transformed in USD 2000 by means of the 3.8 USA GDP depreciation coefficient during 1975-2000, calculated according to Samuel H. Williamson.

167
Summarized statistical data
Table D 2
Gross domestic product by branches - training resources, in lei 1990, 1980-1989 period
Resources 1980 1981 1982 1983 1984 1985 1986 1987 1988 1989
1 2 3 4 5 6 7 8 9 10 11
1. Agriculture 98488 113269 138524 120966 128148 128031 121326 118809 126201 119658
2. Industry 366758 340541 336744 375075 401646 295262 415848 417606 415670 383904
3. Constructions 53654 50014 47450 51958 55043 57571 59784 61178 58247 45703
1-3. Total production
of goods 518900 503824 522719 547999 584837 580864 596957 597593 600118 549265
4. Transportation, communications,
storage 57329 57370 53573 52770 55044 56712 58904 70931 67955 55674
5. Trade 49244 50015 45920 45464 48163 50697 50113 55858 56482 48196
6. Financial activities,
insurance 16905 17652 17603 30850 31822 20622 18463 19506 17651 17450
7. Public administration,
army 17640 18388 17603 19484 18921 21482 19342 20393 19416 20774
8. Education, health
assistance 27194 30156 27552 27603 30101 34371 33408 32806 32653 33238
9. Real estate
transactions, professional
scientific, cultural, activities,
others 36749 38982 34440 36533 37842 37808 38684 39899 40596 37393
4-9. Total services 205061 212536 196690 212705 221895 221691 211907 239392 234753 212726
10. Total 1-9 723961 716388 719409 760705 806733 802555 815871 836985 834871 761991
11. Adjustments for the
production of
banking services -22785 -25007 -24490 -32474 -39563 -26637 -23738 -31032 -23828 -12464
12. Gross
Added
Value 701177 691379 694918 728229 767169 775917 792133 805954 811041 749526
13. Customs taxes
+ charges - subsidies
44834 44131 72706 86868 97186 87645 94071 88664 81192 85589
14. Subsidies -11025 - -2296 -3247 -4300 -4296 -7033 -7980 -9708 -4155
15. Gross Domestic
Product 734986 735510 765328 811850 860055 859266 879171 886638 8826526 830960
Source: Statistical Yearbook of Romania, 1990, 1991, 2012, time series; Reports of the National Bank of Romania, 1991, 1995, 2002.

168
Table D 3
Gross domestic product by branches, in lei 1990, 1990-2000 period
mil. lei 1990
Resources 1990 1991 1992 1993 1994 1995 1996 1997 1998 1999 2000
1 2 3 4 5 6 7 8 9 10 11 12
1. Agriculture 171004 129074 118278 132675 131940 139223 140386 123581 94794 85886 73160
2. Industry 317690 258832 238424 204699 212023 231335 242750 212148 181744 160149 166093
3. Constructions 42359 30048 29882 32853 39385 46407 47526 35702 32688 32288 32954
1-3. Total
production of goods 531052 417955 386584 370227 383348 416965 430662 371431 309226 278323 272207
4.Transportation, communications,
storage 45496 45757 52914 63179 64985 54142 65806 61791 60799 63930 69205
5. Trade 48634 92196 89020 74551 76801 73830 85547 78268 86949 88469 94910 6. Financial activities,
insurance 21179 17756 32993 32221 31508 35157 21935 11672 11768 10978 9886 7. Public administration
army 21964 21171 21166 19585 20349 26016 22666 18537 23535 21310 25705 8. Education, health,
assistance 36083 34147 29881 27167 26913 30938 32903 24030 31380 32288 29659 9. Real estate transactions,
professional, scientific, cultural
activities, culture, others 34514 26634 26768 26535 30195 33751 39483 70030 75835 82012 89637
4-9. Total services 207870 237661 252742 243238 250751 253834 268340 264328 290266 298937 319002
10. Total 1-9 738923 655615 639325 613465 634099 670800 699002 635758 599492 577311 591210
11. Adjustments for the
banking services -18042 -14342 -29258 -26535 -25600 -21094 -14624 -3433 -9806 -9686 -7250
12. Gross
Added Value 720881 641273 610068 586930 608499 649706 684379 632325 589686 567625 583961 13. Taxes customs
- subsidies 94130 66245 59762 66969 59078 65392 62150 60418 67990 82658 79092
14. Subsidies -30592 24586 -47311 -22112 -11159 -11953 -15355 -6179 -3923 -4520 -3955
15. GROSS
DOMESTIC PRODUCT 784420 682933 622518 631787 656417 703145 731175 686564 653754 645762 659098
Source: Statistical Yearbook of Romania, 1993, 1993, 2001 and 2002, time series; Reports of the National Bank of Romania, 1993-2002.

169
Summarized statistical data
Table D 4
Gross domestic product by branches, in lei 2000, 2000-2010 period
Resources 2001 2002 2003 2004 2005 2006 2007 2008 2009 2010
1 2 3 4 5 6 7 8 9 10 11
1. Agriculture million USD
25284 23824 25106 29780 24672 25501 18677 23903 21813 24021
2. Industry million USD 48470 51379 53885 57868 59435 63910 63910 67804 67088 70176
3. Constructions million USD 9798 10740 11379 12427 13822 16967 21826 28808 24624 23887
1-3. Total production
of goods million USD 83552 85942 90370 100076 97929 106377 104413 120514 113527 118084
4. Transportation, communications,
storage
million USD 19552 20596 22406 24887 27368 29271 31100 32312 28880 26398
5. Trade million USD
24997 26020 29295 32621 37763 44262 49942 55596 49737 51221
6. Financial activities,
insurance million USD 2572 2350 2145 2670 2756 2804 3147 3385 3137 3230
7. Public
administration,
army million USD
6347 6652 7137 5987 6118 5044 4899 4580 4137 4268
8. Education, health
assistance million USD 7811 8571 8851 9426 9674 8970 8851 9682 9634 8851
9. Real estate transactions, professional,
scientific, cultural
activities, others
million USD 24315 27824 25436 25674 26302 27997 38318 36688 37622 29819
4-9. Total
services million USD 85594 92013 95270 101265 109981 118348 136257 142247 133147 123767
10. GROSS
ADDED VALUE million USD 169146 177955 185660 201341 207910 224725 240669 262757 246671 241851
11. Taxes customs
- subsidies million USD 18794 19773 22944 24185 27549 29777 31273 32144 27408 29894
12. GROSS
DOMESTIC
PRODUCT
million USD
187940 197728 208584 226026 235458 254501 271943 294901 274078 271765
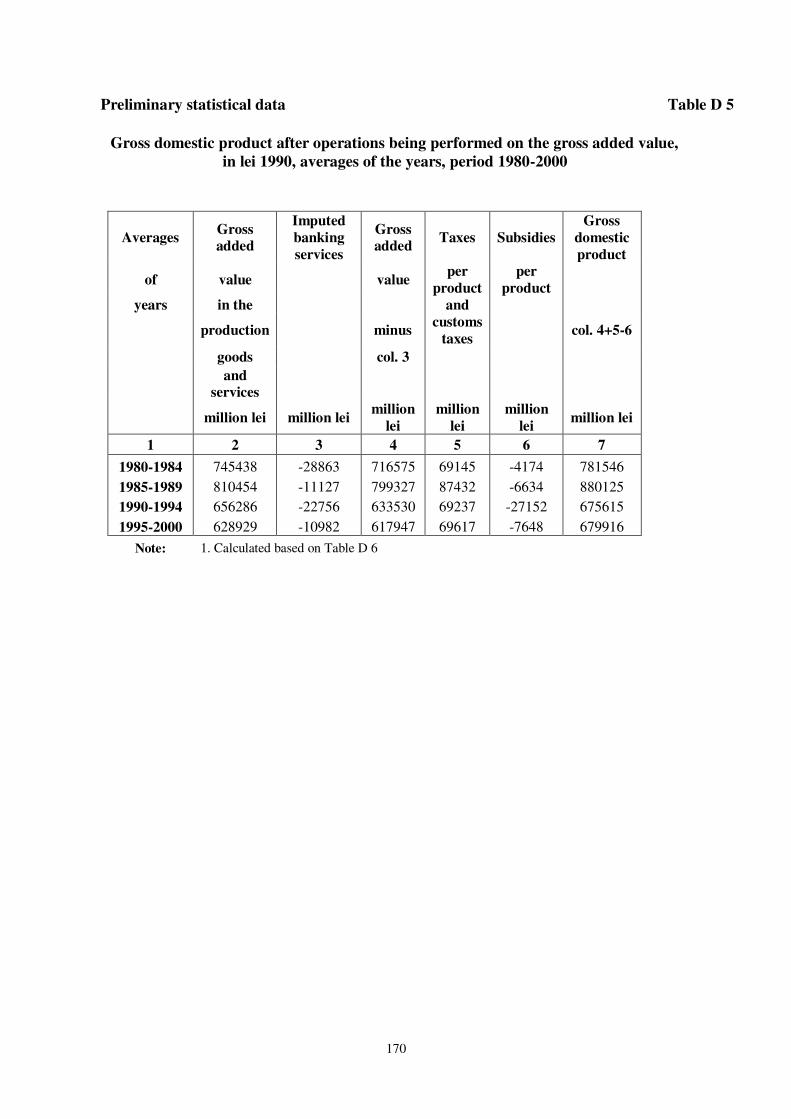
170
Preliminary statistical data
Table D 5
Gross domestic product after operations being performed on the gross added value,
in lei 1990, averages of the years, period 1980-2000
Averages Gross added
Imputed
banking
services
Gross added
Taxes Subsidies
Gross
domestic
product
of value value per
product
per
product
years in the
and
production minus customs
taxes col. 4+5-6
goods
col. 3
and
services
million lei million lei million
lei
million
lei
million
lei million lei
1 2 3 4 5 6 7
1980-1984 745438 -28863 716575 69145 -4174 781546
1985-1989 810454 -11127 799327 87432 -6634 880125
1990-1994 656286 -22756 633530 69237 -27152 675615
1995-2000 628929 -10982 617947 69617 -7648 679916
Note: 1. Calculated based on Table D 6
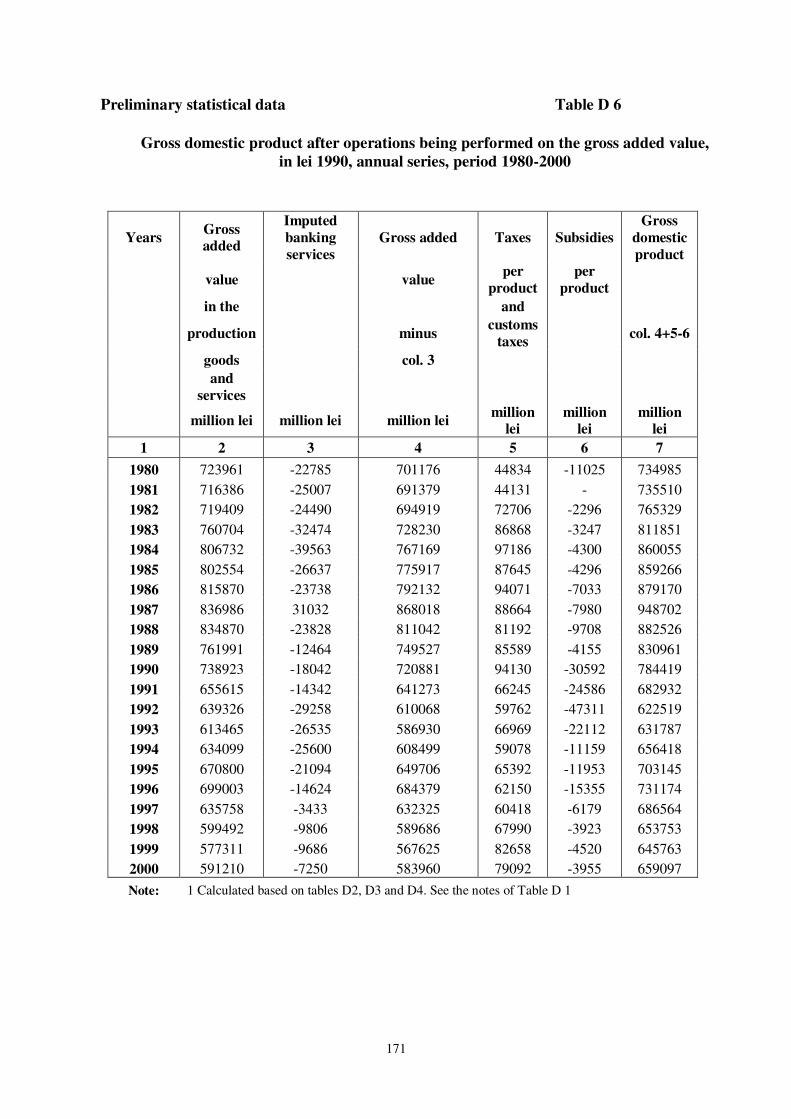
171
Preliminary statistical data
Table D 6
Gross domestic product after operations being performed on the gross added value,
in lei 1990, annual series, period 1980-2000
Years Gross added
Imputed
banking
services
Gross added Taxes Subsidies
Gross
domestic
product
value
value
per
product
per
product
in the
and
production
minus customs
taxes col. 4+5-6
goods
col. 3
and
services
million lei million lei million lei million
lei million
lei million
lei
1 2 3 4 5 6 7
1980 723961 -22785 701176 44834 -11025 734985
1981 716386 -25007 691379 44131 - 735510
1982 719409 -24490 694919 72706 -2296 765329
1983 760704 -32474 728230 86868 -3247 811851
1984 806732 -39563 767169 97186 -4300 860055
1985 802554 -26637 775917 87645 -4296 859266
1986 815870 -23738 792132 94071 -7033 879170
1987 836986 31032 868018 88664 -7980 948702
1988 834870 -23828 811042 81192 -9708 882526
1989 761991 -12464 749527 85589 -4155 830961
1990 738923 -18042 720881 94130 -30592 784419
1991 655615 -14342 641273 66245 -24586 682932
1992 639326 -29258 610068 59762 -47311 622519
1993 613465 -26535 586930 66969 -22112 631787
1994 634099 -25600 608499 59078 -11159 656418
1995 670800 -21094 649706 65392 -11953 703145
1996 699003 -14624 684379 62150 -15355 731174
1997 635758 -3433 632325 60418 -6179 686564
1998 599492 -9806 589686 67990 -3923 653753
1999 577311 -9686 567625 82658 -4520 645763
2000 591210 -7250 583960 79092 -3955 659097
Note: 1 Calculated based on tables D2, D3 and D4. See the notes of Table D 1
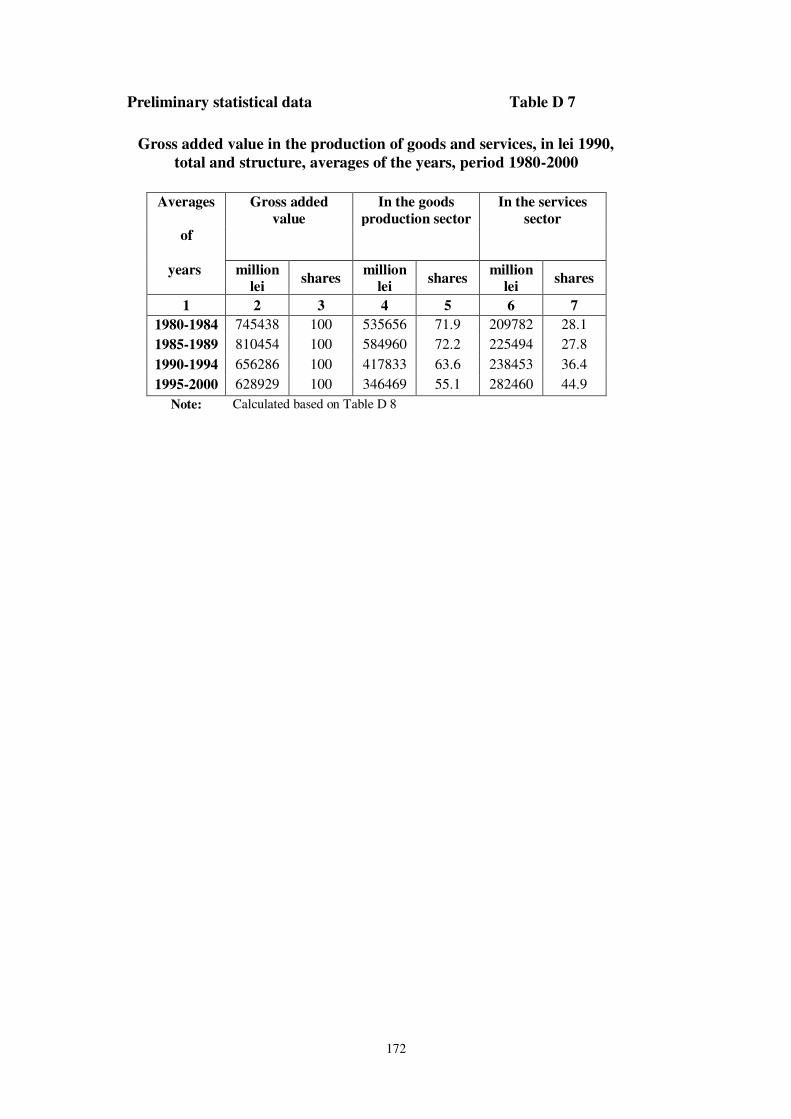
172
Preliminary statistical data Table D 7
Gross added value in the production of goods and services, in lei 1990,
total and structure, averages of the years, period 1980-2000
Averages Gross added
value
In the goods
production sector
In the services
sector
of
years million lei
shares million
lei shares
million lei
shares
1 2 3 4 5 6 7
1980-1984 745438 100 535656 71.9 209782 28.1
1985-1989 810454 100 584960 72.2 225494 27.8
1990-1994 656286 100 417833 63.6 238453 36.4
1995-2000 628929 100 346469 55.1 282460 44.9
Note: Calculated based on Table D 8

173
Preliminary statistical data
Table D 8
Gross added value in the production of goods and services, in lei 1990, total and structure, annual series, period 1980-2000
Years Gross added
value
In the goods
production sector
In the services
sector
million lei
% million lei
% million lei
%
1 2 3 4 5 6 7
1980 723961 100 518900 71.7 205061 28.3
1981 716386 100 503824 70.3 212562 29.7
1982 719409 100 522719 72.7 196690 27.3
1983 760704 100 547999 72.0 212705 28.0
1984 806732 100 584837 72.5 221895 27.5
1985 802554 100 580864 72.4 221690 27.6
1986 815870 100 596957 73.2 218913 26.8
1987 836986 100 597594 71.4 239392 28.6
1988 834870 100 600118 71.9 234752 28.1
1989 761991 100 549265 72.1 212726 27.9
1990 738923 100 531052 71.9 207871 28.1
1991 655615 100 417955 63.8 237660 36.2
1992 639326 100 386584 60.5 252742 39.5
1993 613465 100 370227 60.4 243238 39.6
1994 634099 100 383348 60.5 250751 39.5
1995 670800 100 416965 62.2 253835 37.8
1996 699003 100 430662 61.6 268341 38.4
1997 635758 100 371431 58.4 264327 41.6
1998 599492 100 309226 51.6 290266 48.4
1999 577311 100 278323 48.2 298988 51.8
2000 591210 100 272207 46.0 319003 54.0
Note: 1. Calculated based on the data in tables D2 and D3

174
Preliminary statistical data Table D 9
Gross added value in the goods production sector, by
branches, in lei 1990, total and structure, averages of the years,
period 1980-2000
Averages Gross added value
In agriculture In industry In constructions
of
years million
lei %
million
lei %
million
lei %
million
lei %
1 2 3 4 5 6 7 8 9
1980-1984 535656 100 119879 22.4 364153 68.0 51624 9.6
1985-1989 584960 100 122805 21.0 405658 69.3 56497 9.7
1990-1994 417833 100 136594 32.7 246334 59.0 34905 8.3
1995-2000 346469 100 109505 31.6 199037 57.4 37927 11.0
Note: 1. Calculated based on the data in Table D 10

175
Preliminary statistical data
Table D 10
Gross added value in the goods production sector, by
branches, in lei 1990, total and structure, annual series, period 1980-2000
Years Gross added value In agriculture In industry In constructions
million
lei %
million
lei %
million
lei %
million
lei %
1 2 3 4 5 6 7 8 9
1980 518900 100 98488 19.0 366758 70.7 53654 10.3
1981 503824 100 113269 22.5 340541 67.6 50014 9.9
1982 522719 100 138524 26.5 336744 64.4 47450 9.1
1983 547999 100 120966 22.1 375075 68.4 51958 9.5
1984 584837 100 128148 21.9 401646 68.7 55043 9.4
1985 580864 100 128031 22.0 395262 68.0 57571 9.9
1986 596957 100 121326 20.3 415848 69.7 59783 10.0
1987 597594 100 118809 19.9 417606 69.9 61179 10.2
1988 600118 100 126201 21.0 415670 69.3 58247 9.7
1989 549265 100 119658 21.8 383904 69.9 45703 8.3
1990 531052 100 171004 32.2 317690 59.8 42359 8.0
1991 417955 100 129074 30.9 258832 61.9 30048 7.2
1992 386584 100 118278 30.6 238424 61.7 29882 7.7
1993 370227 100 132675 35.8 204699 55.3 32853 8.9
1994 383348 100 131940 34.4 212023 55.3 39385 10.3
1995 416965 100 139223 33.4 231335 55.5 46407 11.1
1996 430662 100 140386 32.6 242750 56.4 47526 11.0
1997 371431 100 123581 33.3 212148 57.1 35702 9.6
1998 309226 100 94794 30.7 181744 58.8 32688 10.6
1999 278323 100 85886 30.9 160149 57.5 32288 11.6
2000 272207 100 73160 26.9 166093 61.0 32954 12.1
Note: 1. Calculated based on the data in tables D2 and D3

176
Preliminary statistical data Table D 11
Gross added value in the goods production sector, by
branches in lei 1990, averages of the years, period 1980-2000
Averages Gross
added
value
Transportation,
Education Public
administration
Financial
and
banking
activities
Real estate
transactions
of Trade research,
years communications health and and and others
social
assistance
insurance
million
lei
million lei million
lei
million lei million lei million
lei
million lei
1 2 3 4 5 6 7 8
1980-1984 209781 55217 47761 28521 18407 22966 36909
1985-1989 225487 62035 52269 33295 20281 18738 38869
1990-1994 238451 54466 76240 30838 20847 27131 28929
1995-2000 282460 62612 84662 30200 22962 16899 65125
Note: 1. Calculated based on the data in Table D 12

177
Preliminary statistical data
Table D 12
Gross added value in the goods production sector, by
branches in lei 1990, annual series, period 1980-2000
Years Gross
added value
Transportation, Education Public
administration
Financial
and banking
activities
Real estate
transactions
Trade research,
communications health and and and others
social
assistance
insurance
million
lei
million lei million
lei
million lei million lei million lei million lei
1 2 3 4 5 6 7 8
1980 205061 57329 49244 27194 17640 16905 36749
1981 212563 57370 50015 30156 18388 17652 38982
1982 196691 53573 45920 27552 17603 17603 34440
1983 212704 52770 45464 27603 19484 30850 36533
1984 221894 55044 48163 30102 18921 31822 37842
1985 221692 56712 50697 34371 21482 20622 37808
1986 218878 58904 50113 33408 19342 18463 38648
1987 239393 70931 55858 32806 20393 19506 39899
1988 234753 67955 56482 32653 19416 17651 40596
1989 212725 55674 48196 33238 20774 17450 37393
1990 207870 45496 48634 36083 21964 21179 34514
1991 237661 45757 92196 34147 21171 17756 26634
1992 252742 52914 89020 29881 21166 32993 26768
1993 243238 63179 74551 27167 19585 32221 26535
1994 250751 64985 76801 26913 20349 31508 30195
1995 253834 54142 73830 30938 26016 35157 33751
1996 268340 65806 85547 32903 22666 21935 39483
1997 264328 61791 78268 24030 18537 11672 70030
1998 290266 60799 86949 31380 23535 11768 75835
1999 298987 63930 88469 32288 21310 10978 82012
2000 319002 69205 94910 29659 25705 9886 89637
Source: Statistical yearbook of Romania, 1991, 1993, 1006, 2001; Report of the National Bank of Romania 1995-2002
Note: 1. The data of the 1990-2000 period were calculated based on the added value by branches presented in tables D 2 and D 3.

178
Preliminary statistical data
Table D 13
Dynamics of the gross added value in the services sector, by branches-resources
in indexes, annual series, period 1980-2000
Years Total Transportation, Trade Education, Public administration
communications
research Financial
and
Real estate
transactions
health and banking
and
insurance
activities
and others
social
assistance
% % % % % % %
1 2 3 4 5 6 7 8
1980 100 100 100 100 100 100 100
1981 103.7 100.1 101.6 110.9 104.2 104.4 106.1
1982 95.9 93.4 93.2 101.3 99.8 104.1 93.7
1983 103.7 92.0 92.3 101.5 110.5 182.5 99.4
1984 108.2 96.0 97.8 110.7 107.3 188.2 103.0
1985 108.1 98.9 103.0 126.4 121.8 122.0 102.9
1986 106.7 102.7 101.8 122.9 109.6 109.2 105.2
1987 116.7 123.7 113.4 120.6 115.6 115.4 108.6
1988 114.5 118.5 114.7 120.1 110.1 104.4 110.5
1989 103.7 97.1 97.9 122.2 117.8 103.2 101.8
1990 101.4 79.4 98.8 132.7 124.5 125.3 93.9
1991 115.9 79.8 187.2 125.6 120.0 105.0 72.5
1992 123.3 92.3 180.8 109.9 120.0 195.2 72.8
1993 118.6 110.2 151.4 99.9 111.0 190.6 72.2
1994 122.3 113.4 156.0 99.0 115.4 186.4 82.2
1995 123.8 94.4 149.9 113.8 147.5 208.0 91.8
1996 130.9 114.8 173.7 121.0 128.5 129.8 107.4
1997 128.9 107.8 158.9 88.4 105.1 69.0 190.6
1998 141.6 106.1 176.6 115.4 133.4 69.6 206.4
1999 145.8 111.5 179.7 118.7 120.8 64.9 223.2
2000 155.6 120.7 192.7 109.1 145.7 58.5 243.9
Note: 1. Calculated based on the data in tables D2 and D3

179
EXTERNAL SECTOR INDICATORS
THE EXTERNAL DEBT OF ROMANIA DURING 1864-2010
HISTORICAL AND METHODOLOGICAL COMMENTS
In the modern and contemporary period, Romania was a debtor state, a market of
capital investment from developed countries.
By 1859, as a rule, the Romanian Principalities, did rarely contract external loans,
confining themselves more to domestic loans; but they found themselves in a permanent debt
situation, through the dependency obligations – the annual tribute - to the Ottoman Empire.
After the formation of the national state, in 1859, the major processes of
institutionalization, modernization and building up the infrastructure called for increased
expenses; these expenses were significantly covered through foreign loans. For the purpose of
budgetary needs, domestic loans were also retained, but they were much smaller.
The first foreign loan was contracted in 1864 with the Stren Bank House in London
accounting to £ 916,000 or Francs 4.6 million for a 22 years period, with a real interest rate of
16%.
Once with it, Romania joined the world debtor countries and remained in this situation
for a 125 years period, namely until 1989 when, episodically, by paying back the whole
external debt, it loses the debtor position. Next year, however, it again opens the external debt
account, thus becoming again a debtor for an unpredictable period.
Contracting of the first loans of the 60s and 70s of the 19th century, was burdening,
with rate differences of 20-30% and high interest rates of 10-17%, and it included the
concession of the country's sources of revenue - the Customs revenue, the tobacco revenue
etc. After the consolidation of the country, the conditions for foreign loans obtaining became
more moderate, with a 4-5% interest rate and the normal course.
Most of the foreign loans of the Romanian State originated in the Berlin market,
Germany thus becoming Romania's main creditor. In fact, Romania's loans by 1914 were
granted by the great German financial groups: Disconto Gesellschaft, S. Bleichröder and A.
M. Rothschild; this placed Romania in the sphere of interest of the German Empire, until
World War I.
A key feature of the external loans of this period was that of their very long term. By
the end of the 19th century, loans that were to be returned up to 1950-1960, were engaged.

180
When assessing the state of the external indebtness for the 1864-1914 period, it
appears that a nominal amount of 2,16144 million lei gold was contracted with foreign banks.
Out of this it was only the amount of net 1,860 million lei that was received. For this real
amount received by the Romanian State, the actual amount charged was paid and was to be
paid, for the next 40 years, totaling 5,600 million lei, amortization and interest included in
value of 3,730 lei more than the amount initially received.
The payments of these loans increased along with the size of the debt: in the first
decade, 1864 -1873, 47 million lei, and in the last decade, 1905 - 1915, 1,022 million lei; this
charged even more the state budget; in 1864 the payment of the external debt represented 14%
and in 1905 - 37% of state expenditures.
But the most important indicator is the increase in annuity - amortization and interest -
per capita; in 1864 - 2.2 lei; in 1884 - 9.45 lei, in 1914 – 1,915 lei per capita, thus growing
faster than the national income. In 1912, the external annuity cut over 5% of the national
income and the total external debt per capita - 272 lei - was roughly equal to the production of
national income - 271 lei.
The positive result was that the predominant part of the foreign loans was productively
used to build infrastructure, railways, public buildings etc. - 68%; investments and military
endowments - 23%, and 9% to cover budget deficits.
In spite of the fact that the foreign loans constituted a task for the generations of the
1864-1914 periods and were extended up to those of 1950s, they were actually the only
solution for the country's modernization, for the endowment with modern mechanized means
of transport and communication, with defense equipment etc45.
During the interwar period, the external obligations followed two trends: in the first
part of the period - 1919-1931 - they increased, and in the second part - 1932-1940 - they
decreased.
The causes and sources of the external commitments growth were Romania's external
public debt inherited during the prewar period, Romania's succession external debt, the peace
treaties, namely the share of the external debt for Transylvania and Bucovina of the former
Austro -Hungarian Empire; the country's external debt contracted during the World War and
thereafter until 1931 etc.
44 Gold leu = 0.32664 g gold, that is 1 gold gram cost 3.10 lei; the gold leu had the same standard and was equal to the French franc, the Swiss franc, the Italian lira, etc by 1916. 45 Out of the amounts of the foreign loans the railway network of over 3,500 km was built, equipped with rolling stock, thousands of wagons and locomotives; the Danube and the Black Sea ports, the port silos were built, the country's telegraphy and telephony networks were set up, the major metal bridges over the country's roads and railways etc.

181
The declining trends of the external commitments and obligations concerned within of
the 1932-1939 period consisted in non-contracting important new foreign borrowings; in
suspending, in 1932, Romania’s inter-war external debt of over 40 billion lei according to the
resolutions of the international forums, in deferring the payment of part of the external debt.
On the other hand, in the 1932-1936 period, as well, an influx of foreign capital into the
country through bank and public loans was recorded, but of some lesser importance.
In the first interwar decade, the economic policy related to the foreign capital was
dominated by the conception “by ourselves” which aimed to empower the domestic capital
positions.
In the first part of the 1919-1931 period, the state debt combined the contracted loans
during the neutrality and war years (1914-1918), needed for the payment of weapons and
military equipment, the loans contracted in the early post-war years (1919-1922) for country's
supply with consumer goods - cereals, foods, machines etc., when the domestic economic
situation was disastrous. Their total rises in 1928, after final calculations, amounted to 39
billion lei.
Another chapter of the public debts is connected to the state debt to foreign oil
companies; they represented the value of the oil installations destroyed by order of England,
at the withdrawal of the Romanian authorities from Wallachia to Moldova in 1916, in order
not to leave any fuel sources to the German occupier. Despite England had committed to pay
these damages, but after the peace conclusion, these were passed onto the Romanian State;
they amounted to approximatively 8.2 billion lei in 1928.
Regarding the liabilities resulting from aftermath of World War I, the most important
chapter came from the obligation incumbent on Romania, in its capacity as debt successor of
the former Austro-Hungarian Empire, namely the share for Banat, Transylvania and
Bukovina. This debt was assessed at 650 million Fr (gold). But Romania conditioned its
payment to recovering the damage caused by the war from the Central Powers. The country
damages, calculated by the Romanian State, were estimated at 31 billion lei gold, plus the
contracted debt connected to the war, treasury bills etc. Romania hoped to cover some of
these huge amounts of damages through “the repair” that was to be received, under the peace
treaties, from the obligations imposed to Germany.
But they gradually diminished; in 1920 the Allied Powers imposed Germany, as a
defeated country, the amount of 269 billion marks gold, compensation payable in 42 years;
out of it France was to receive 52%, England - 22%, Italy - 10%, Belgium - 8.0%, Serbia -
5.0% etc.; Romania was allocated only 1.1%. Later, Germany's debt was reduced by the

182
Dawes Plan (1924) by half, at 132 billion marks and by the Young Plan (1929) at only 38
billion marks. Romania appeared disadvantaged and frustrated, the diminished "repairs" not
allowing it to pay any debts to the Allied Powers.
The growth of the external debt by 1932 is due mainly to two loans contracted: one for
“stabilization” and one for “development” in 1929 and 1931 respectively; the former was
contracted for the monetary stabilization in 1929, and it was necessary for stopping the
inflation of the 1917-1926 period, which had depreciated the national currency - the leu - 36
times. However the high external financing conditioned the loans, requested by Romania, by
the regulation of all the country's external financial litigations. The disputes between Romania
and Germany were included among these conditions. The latter owed Romania large amounts
of money: for the cereals and the oil exported to Germany during the neutrality period (329
million marks), for our country's gold storage having remained with the Reich Bank (78.9
million marks); for the equivalent value of overdrawn exchequer bills issued by Germany, in
the occupied territory (1,692 million marks), for the Romanian deposits (329 million marks)
in the banks of Berlin, sequestrated by the German Government on the country's joining the
war (1916); a total, therefore, of more than 2.4 billion marks gold.
During the negotiations developed in Berlin in 1928, Romania was constrained by the
international financial circles to accept, for all due repairs, the derisory amount of just 75.7
million marks, representing only 3.4% of the amount due by Germany and to waive any
claims for repair compensation from any debtor.
As a result, by January 1st, 1929, the total external debt of Romania increased to 140
billion lei46, without having contracted substantial loans in the postwar period, and without
having received any amounts for covering the national economy needs. Two important
foreign loans were added to this: the one of 1929 intended for the stabilization and the one of
1931 intended for Romania's development. Therefore, Romania's contracts with the Western
financial centers, that is the new loans, amounted to USD150 million or over 25 billion
stabilized lei - 1929. The payment of the loans for a 30 years’-period, interest included,
amounted to approximatively three times the initial amounts. The loans were secured by a
series of concessions granted to foreign creditors: tobacco production and sale, cigarettes,
matches, national telephony operation, as well as agreements for the construction of the
Bucharest - Oradea highway.
46 Depreciated lei due to inflation, 1 leu gold = 32.2 lei 1 leu banknote or stabilized lei in 1929.
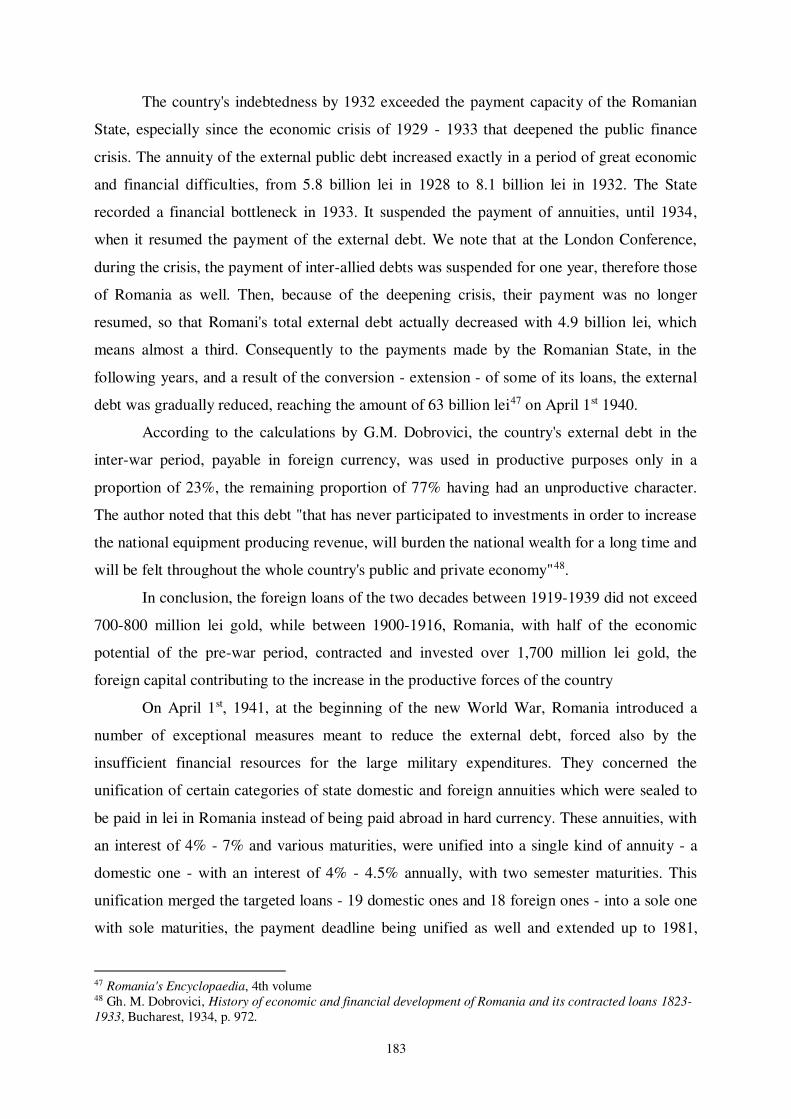
183
The country's indebtedness by 1932 exceeded the payment capacity of the Romanian
State, especially since the economic crisis of 1929 - 1933 that deepened the public finance
crisis. The annuity of the external public debt increased exactly in a period of great economic
and financial difficulties, from 5.8 billion lei in 1928 to 8.1 billion lei in 1932. The State
recorded a financial bottleneck in 1933. It suspended the payment of annuities, until 1934,
when it resumed the payment of the external debt. We note that at the London Conference,
during the crisis, the payment of inter-allied debts was suspended for one year, therefore those
of Romania as well. Then, because of the deepening crisis, their payment was no longer
resumed, so that Romani's total external debt actually decreased with 4.9 billion lei, which
means almost a third. Consequently to the payments made by the Romanian State, in the
following years, and a result of the conversion - extension - of some of its loans, the external
debt was gradually reduced, reaching the amount of 63 billion lei47 on April 1st 1940.
According to the calculations by G.M. Dobrovici, the country's external debt in the
inter-war period, payable in foreign currency, was used in productive purposes only in a
proportion of 23%, the remaining proportion of 77% having had an unproductive character.
The author noted that this debt "that has never participated to investments in order to increase
the national equipment producing revenue, will burden the national wealth for a long time and
will be felt throughout the whole country's public and private economy"48.
In conclusion, the foreign loans of the two decades between 1919-1939 did not exceed
700-800 million lei gold, while between 1900-1916, Romania, with half of the economic
potential of the pre-war period, contracted and invested over 1,700 million lei gold, the
foreign capital contributing to the increase in the productive forces of the country
On April 1st, 1941, at the beginning of the new World War, Romania introduced a
number of exceptional measures meant to reduce the external debt, forced also by the
insufficient financial resources for the large military expenditures. They concerned the
unification of certain categories of state domestic and foreign annuities which were sealed to
be paid in lei in Romania instead of being paid abroad in hard currency. These annuities, with
an interest of 4% - 7% and various maturities, were unified into a single kind of annuity - a
domestic one - with an interest of 4% - 4.5% annually, with two semester maturities. This
unification merged the targeted loans - 19 domestic ones and 18 foreign ones - into a sole one
with sole maturities, the payment deadline being unified as well and extended up to 1981,
47 Romania's Encyclopaedia, 4th volume 48 Gh. M. Dobrovici, History of economic and financial development of Romania and its contracted loans 1823-1933, Bucharest, 1934, p. 972.

184
respectively developing along four decades. All in all, by means of the unification and
conversion, an initial cumulative capital in lei was created: 19 domestic loans of a nominal
value of 4,355 billion lei and 18 foreign loans with a capital of 7,550 million lei49.
On April 4th, 1941, three days after the unification decree, another decree, on the
suspension of the external public debt service, for other older loans contracted abroad, was
issued; the Romanian State, stopped the payment of all liabilities, annuities, external debts, for
an unspecified period of time. The provisions of the unification and State, internal and
external, annuity conversion decree, will be enforced in the next years, making the financial
burden of the state budget more comfortable. Since they did not admit the external debt,
foreign loan contracts concluded by the previous governments, the communist power, in
development during 1945-1947, extended the suspension state. As a result, in the seventh
decade after 1948, the prewar financial liabilities no longer appear in Romania's external
flow50.
Following the conclusion of the peace treaty with the Allied Powers, in 1947,
according to which our country was considered a defeated country, in spite of the fact that it
had participated to the war, with immense sacrifices for almost one year (1944 -1945), with
all its human and material potential until the end of the war (May 1945), Romania had to
endure both Germany's severe claims for the oil and foods supplied to the Reich, and not paid
during 1940 -1944, as well as other claims, including war reparations imposed by the Allied
Powers - that is the Soviet Union - under whose domination Romania was left by the Yalta
understanding. In no other previous historical conflagrations did our country suffer so
burdensome losses and liabilities on behalf of the both belligerent parties during 1940 -1947.
Firstly, by means of the economic agreements with the Reich, between 1939 - 1944,
Germany imposed Romania non-equivalent trade relations in favor of the German partner
indirectly, through the export and import prices overvalued at the fixed exchange rate of the
German mark, throughout the war etc.; practically, Germany had, due to the war situation, a
quasi-monopoly in the Romanian foreign trade. The bilateral trade was conducted through
clearing or exchange of goods based on prices against goods, based on expense accounts;
records and settlements were authorized by the entitled German bank which did not settled
49 Gh. M. Dobrovici, Romania's financial and economic evolution during 1934 -1943, Bucharest, 1944. 50 After the change of the leadership of the communist State in 1965, with the view to restore the economy based on advanced Western technology, Nicolae Ceaușescu endeavours external measures of political opening; Romania's applications for loans are accepted by I.M.F. and other international financial institutions; one of the requirements of these fora was that of regulating Romania's situation regarding the suspended debt; in a few years the negotiations were concluded, the Romanian State accepting the payment of some reduced amounts; the only debt remaining in suspension, that is the one with the Swedish creditors, will be regulated later, after three decades.

185
Romania's balances periodically, so that in 1944, Germany had accumulated a considerable
debt to our country51. The total damage of the “cooperation” with Germany was estimated to
446 million dollars52, of which Romania, according to the peace treaty, in 1947, had no right
to request anything and, thus, it received nothing.
The second category of losses for the Romanian economy resulted from the
consequences of the war on its own territory, destruction, lootings, etc. and from the
obligations arising from the international documents concluding peace. Through the Truce
Convention (1945) and then the Peace Treaty (1947) heavy burdens were called for the
Romanian economy; the Romanian State, treated as a loser, was forced to pay damages not
only to the Soviet Union but also to the other allied countries for the losses inflicted to their
investments in Romania as a result of the war. The war reparations imposed by the Truce
Convention in favor of the Soviet Union amounted to 300 million USD in 1938, and were
spread out over eight years and were payable in goods, equipment, means of transport etc. In
addition, Romania was obliged to return the materials, facilities etc. or their value, captured
from the occupied Soviet territory by Romanian troops during the anti-Soviet war, which
exceeded the value of the damages. After 1949 some provisions of these liabilities have been
amended53.
After the imposition of the communist political regime in Romania, the process of
establishing and building up the socialist economy started, which required significant
investment resources; in the 50s and 60s they were obtained from the national income
accumulation fund, and investment technical means - machines, equipment - for the
industrialization were provided by domestic production and partly by imports from the
CMEA countries. In both cases, the technical and technological level was below the Western
advanced one, which would require the orientation towards imports in this area of the
economic policies
During the 1950-1970 period, Romania's foreign economic relations were developed
primarily by means of trading, goods exports and imports, and mainly with the socialist
countries. For payments, annual clearing agreements were used, which, as a rule settled
balanced54. By about 1970, Romania's balance of payments had no significant negative
balances and did not affect the national income. The current account appeared loaded, mainly
51 Minister of Propaganda, Results of the economic „cooperation” with Germany and of our participation in Hitler's war, Bucharest, 1945. 52 Ion Alexandrescu, Romania's economy in the early post-war years (1945-1947), Bucharest, 1986. 53 Costin C. Kiriţescu, The financial leu system rate and its precursors, 3rd volume, Bucharest, 1997 54 Gh. Stroe, The 1971-1989 Balance of payments, The external debt crisis, in: acad. N. N. Constantinescu, Romania's economic history, 2nd volume, Economic Publishing House, 2000.

186
with negative balance of trade, generated by imports of equipment and machinery, which
were higher than exports.
After changing the country's political leadership in 1965, Ceausescu and his team
designed Romania's opening to the Western world, thus activating economic and financial
relations with developed and developing states. By means of laborious negotiations, in
December 1971, our country, the only one of Soviet bloc, became a member of the
International Monetary Fund and in 1972 a member of the World Bank, with the purpose to
procure foreign loans. Romania was interested in obtaining loans from the West in order to
finance imports of high technology from developed countries in order to accelerate the
industrialization.
The international financial context in which Romania contracted and then paid the
external debt seriously affected the situation of the national economy55. Since the late 60s the
world economy witnessed emerging monetary crisis and economic phenomena; the monetary
stability, cored over the gold convertibility of the dollar to other currencies was shaken by
monetary devaluation phenomena in some countries, by inflation and escalation of prices for
raw materials and consumer goods. The deepening of the crisis after 1968 produced the first
restrictions for the convertibility of the dollar into gold and other strong currencies; for the
first time in its history, US suspended in 1971 the free conversion of banknotes into gold,
which triggered a chain of restrictions for the convertibility of other hard currencies; this
affected the foreign exchange reserves of the states; the inflation, which was situated between
1-1.5% grew up to 4 - 5% in the eighth decade. An ounce of gold, which sold for $ 35 in
1971, reached in 1979 the amount of $220. The international currency, the US dollar,
depreciated in a decade to less than half of its value.
During the 1970 - 1974 period, in order to compensate the value losses due to the
depreciations, the large oil producing countries increased the oil prices more than 4 times,
thus creating large imbalances in the global economy and increasing inflation; on the other
hand, the purchasing power of the monetary reserves in dollars of the majority of the world
states depreciated, thus worsening the conditions of contracting external loans, especially for
the developing countries.
Consequently to these conjugated crisis phenomena, the international bank interests
increased unprecedentedly; commissions were added to interests in order to compensate for
depreciation and, in total, they reached in 1980 20% as compared to 3-3.5% in the 60s and 10-
55 Dorel Oprescu, The international financial system, Bucharest, 1981.

187
14% in 1974 for loans in US dollars. By 1980, foreign banks’ interest ratess plus other
expenses for debtor countries came to double the external debt burden in 4 - 5 years. As a
result, the deficit balance of payments increased unprecedentedly in the developing countries,
the main world debtor, from $8 billion in 1973 to $53 billion in 1979. In order to unlock this
part of the global economy, in the following decades, the international financial institutions
reduced and also delayed partially some countries' external debt payments.
Under such unfavorable circumstances of the 60s and 70s, Romania contracted its
largest loans; in the latter half of the eighth decade56 the largest external debts were
accumulated and their main repayments were placed towards the end of the same decade. The
external loan amount increased as follows:
An amount of almost $21 billion58 was reached with a rapid growth of $14 billion in
four years. But since the foreign loan had also grace periods, the largest burden of repayment
was after 1978, the external debt service amounting to over $1 billion in 1979. Romania
entered a serious imbalance of the balance of payments due to the negative balance of trade,
burdened by the prevalence of imports in the foreign trade.
Significant losses and the non-payment of Romania's benefits from the operations in
joint ventures with foreign partners contributed to the high external debt, to the external
payment difficulties of this period.
Joint ventures - with Romanian and foreign capital - for production and installation,
marketing and banking were created in the early 70s, under the program of international
cooperation. A number of 77 joint ventures were set up and operated by 1980; 8 of them in
56 The first external loans were contracted from IBRD; in 1974 there were three loans in progress, amounting to $190 million, for the purchase of equipment and machinery, needed for the new industrial facilities (The highly alloyed and stainless steels enterprise in Târgoviște -$70 million, The Chemical fertilizer enterprise in Bacău - $60 million, and Termoelectrica in Turceni - $60 million). The loans were long-termed and developed over 15 - 25 years, bearing an interest at the rate of 7.25% with a grace period of 5 years. In the same year, a series of loans from the World Bank were contracted to achieve the 3 million Ha of irrigation. Large loans from the International Monetary Fund bearing an interest at the rate of 5% were also contracted. Ministry of Finance, Assessment Report based on the analysis of economic and financial balance sheet of 1974, Classified information no. 00261890 /March 25th, 1975. 57I.M.F. Memorandum, România, 1983. 58 Former Finance Minister at the time, Petre Gigea - Gorun - estimated that in 1981 Romania had an external debt of $15 billion bearing interest rates of another $6 billion. The manner and the reason of Romania's negotiations with the IMF in the 80s are to be found on http: //www.Cotidianul. EN 15537 /.
Year 1972 1976 1977 1978 1979 1980 1981
Million US
dollars 30.2 2,812 3,582 5,074 7,173 9,557 21,00057

188
Romania and 69 abroad, especially in the area of underdeveloped countries: Nigeria,
Morocco, Liberia, Zambia, Gabon, Central African Republic, Zaire, D.R.Congo, Libya,
Mauritania, Mexico, India, etc. Their objective was facilitating the Romanian exports of
machinery and equipment, of enterprises producing cement, industrial constructions,
irrigation, mining (copper, etc.), and the imports of some products as raw materials and
feedstock for the Romanian economy. The Romanian Foreign Trade Bank ensured the equity
capital for the Romanian party and loans for operations; the economic ministries, under whose
competence the joint ventures fell, had the technological and managerial responsibility. The
activity of joint ventures amounted to several hundred million dollars annually.
In the early years, positive activities were revealed in most of the companies, but
afterwards ever deeper difficulties appeared in the in supply, in operating the equipment sent
there, because of the local low-skilled labor force, of the poor management, etc. More and
more companies did not fulfill their activity program either because of technological reasons,
due to the lack of raw materials, insufficient working capital, or because of weak support
from local authorities etc., or uncompetitive product prices. Thus, many of these joint
ventures incurred debts, could not pay their suppliers, causing damages of millions of dollars
and ultimately underwent bankruptcy, liquidation.
Early in the eighties the general situation of joint ventures was affected by the
monetary and economic crisis triggered by the oil crisis and the suspension, in 1971, of the
dollar convertibility, by the chain inflation of the national currencies.
In 1986, the last year for which we have archive information59 on this issue, a partial
assessment on Romania's foreign trade and on that of joint ventures, indicates a serious
situation of crisis: in December 1986, only 34% of the goods export plan and that of facilities
for 1987 was covered by orders in convertible currencies; the production and external
marketing joint ventures recorded in 1986 "unsatisfactory results"; receivables uncollected for
years reached $220 million; the joint ventures (5) in Romania accomplished their production
plan only 30%; their exports reached 44% and the product sales on the Romanian market
reached only 20.4% of the annual program.
Out of the 77 foreign joint ventures, existing in 1980, most were liquidated or ceased
their activity; in 1986 five operated in Romania and seventeen abroad; out of these six were
59 The information in this paragraph comes from the following sources: Annual reports based on the assessments of economic and financial results for the 1974 - 1986 period, presented by the Ministry of Finance (Bureau of classified documents - BDS- as strictly classified); Annual reports on the general account of the budgetary exercise, in different years; Centralized financial plan of the socialist economy in certain years; fulfillment of the international economic cooperation plan for the 1984 - 1987 period, reports drafted by the Ministry of Trade and International Economic Cooperation etc

189
proposed for liquidation, a company - for sale, three of them had a difficult financial and
economic situation, which in the coming years brought about bankruptcy; that year all of
them registered losses or debts of over $250 million. Finally, the action of cooperation in
production and marketing through joint ventures with foreign partners was a big failure,
mostly because of managerial causes and the political anti-economic “indications” of the
communist dictatorship, a disaster that brought about damages of hundreds of millions of
dollars for the Romanian economy, thus contributing to the reduction of the national income.
After 1989 efforts were made to recover claims from some partners, who until that
moment refused the payment of the arrears. The damage sufferred by the national economy
due to the unfavorable activities of the joint ventures, increased according to certain
information, from $0.5 - 0.8 million annually in the early 80s to $70 - 90 million in the late
80s, when most of them lost their economic and financial heritage.
Since 1990 Romania has normalized its economic and financial relations with the
Western world, has developed commercial and banking connections. In the early years, in
order to solve the communist “inheritance” of a deep crisis of goods, especially consumer
goods, imports were increased but the deficit of the balance of trades increased as well. At the
same time, it was recourse to external loans for external payments and for budgetary needs.
Thus, the external debt has accumulated year after year, increasing the country's payment
obligations. The National Bank of Romania's statistics published the external debt account in
US dollars until year 2000 and then in euros; in comparable international currency, ppc
dollars 2000, this debt increased from 1,359 million in 1991 to 10,430 million in 2000 and to
99,081 million in 2010, returning to its highest level of $4,623 comparable per capita.
The share of the debt accumulated in a quarter-century that was devoted to the
economic development, to the production of new value meant to contribute to its payment as
well, remains a requirement for research. We note that the series of the external debt up to
1990, regarded mainly the public debt; the national economy debt until 1947 included
however the public debt of several municipalities, of certain public institutions etc. as well as
that of several private companies - banks, industrial and commercial companies; the share of
their size was not significant. During the 1948-1990 period, the external debt obligations were
represented exclusively by the public external debt of the State. The chapter on the external
debt was drafted to show Romania's international financial position in the last century and a
half and to state the evolution causes and the dimensions of the balance of payments in
relation to the GDP, with the purpose to calculate the net national product - the national
income.

190
The External Debt 1
The Public External Debt in Current Currency and Comparable US Dollars 2000,
Total, Per Capita and Related to the Gross Domestic Product, during the 1864 – 2010, Selected Years
Years External Public Debt Gross
Domestic Product⁶
Share of the External
Debt in GDP Per capita
in hard currency¹
million US dollars
col.(4/5) % External Gross
current 2000
Public Domestic
million US dollars
million US dollars
debt
Product
2000
dollars 2000 dollars 2000
1 2 3 4 5 6 7
1864 10.8 103,5 2577 4.0 25.30 630
………........................................................................................................................................................ 1868 16.0 184,5 2652 7.0 43.94 632
…………......................................................................................................................................................
1878 75.9 1273,6 3331 38.2 283.91 743
………….............................................................................................................................. ......................... 1882 95.4 1572,2 4297 36.6 335.37 917
………….............................................................................................................................. ......................... 1902 266.3 4591,0 6293 25.3 741.32 1,016
…………................................................................................................................................ ....................... 1914 372.1 5001,0 8192 61.0 643.55 1,054 ………....................................................................................................................................................... 1921 254.2 2059.0 12960 15.9 130.90 824 …………......................................................................................................................................................
1927 518.7 4537.1 18671 24.3 264.57 1,089
………….............................................................................................................................. ......................... 1929 828.6 6960.2 19650 35.4 394.60 1,114
…………........................................................................................................................................................ 1933 512.4³ 5790.1 18981 30.5 310.41 1,018
……………................................................................................................................................................ ......
1936 553.0 5695.9 21892 26.0 294.83 1,133
……………........................................................................................................................................................ 1940 627.2 6397.4 15038 42.5 481.66 1,131
……………....................................................................................................................................................... 1945 744.0 5952.0 9863 60.4 378.10 627
……………............................................................................................................................... ......................... 1950-1954 75.2 440.5 28,375.4 1.8 26.8 1.699.6 1955-1959 - - - - - - 39,869.2 - - - - - - 2,240.6 1960-1964 - - - - - - 55,652.8 - - - - - - 2,976.6
1965-1969 - - - - - - 84,700.4 - - - - - - 4,349.8
1970-1974 171 500.9 129,653.4 0.3 24.0 6,270
1975-1979 4,212.8 9,434.5 179,123.2 5.1 433.4 8,214.4
1980-1984 9,371.4 15,364.8 211,035.6 7.4 685.4 9,400.6
1985-1989 4,451.4 6,212.4 234,304.6 2.6 271.9 10,215.8
1990-1994 2,548.0 2,854.4 182,433.2 1.6 125.2 7,950.4
1995-2000 8,805.8 8,805.5 183,594.7 4.8 390.9 8,144.8
mil. euro⁵
mil. euro 2001-2005 20,268.4 21,206.8 211,147.2 9.8 974.7 9,684.6
2006-2010 69,149.6 78,141.8 273,437.6 28.4 3,635.9 12,715.8

191
The External Debt 2
The Public External Debt in Current Currency and Comparable US Dollars 2000,
Total, Per Capita and Related to the Gross Domestic Product, during the 1864 – 2010, Selected Years
Years External Public Debt
Gross
Domestic Product⁶
Share of Per capita
in Hard Currency¹
the External Public Debt
Gross Domestic Product
current comparable²
million US dollars
2000
External Debt in
dollars 2000
dollars 2000
million US
dollars million US
dollars 2000 GDP
col.(4/5) %
1 2 3 4 5 6 7
1864 10.8 103.5 2,577 4.0 25.30 630
…………...................................................................................................................................................................... 1868 16.0 184.5 2,652 7.0 43.94 632
…………...................................................................................................................................................................... 1878 75.9 1,273.6 3,331 38.2 283.91 743
………........................................................................................................................................................................... 1882 95.4 1,572.2 4,297 36.6 335.37 917
………….......................................................................................................................................................................
1902 266.3 4,591.0 6,293 73.0 741.32 1,016
………….......................................................................................................................................................................... 1914 372.1 5,001.0 8,192 61.0 643.55 1,054
……………….................................................................................................................................................................... 1921 254.2 2,059.0 12,960 15.9 130.90 824
……………….................................................................................................................................................................... 1927 518.7 4,537.1 18,671 24.3 264.57 1,089
……………................................................................................................................................................................... 1929 828.6 6,960.2 19,650 35.4 394.60 1,114
……………….................................................................................................................................................................... 1933 512.4³ 5,790.1 18,981 30.5 310.41 1,018
…………............................................................................................................................................................................
1936 553.0 5,695.9 21,892 26.0 294.83 1,133
…………….......................................................................................................................................................................
1940 627.2 6,397.4 15,038 42.5 481.66 1,131
............................................................................................................................. ......................... 1945 744.0 5,952.0 9,863 60.3 378.10 627 ……………........................................................................................................................................................................ 1950 112.5 681.8 21,897 3.1 41.80 1,342
1951 75.7 431.5 28,059 1.5 26.20 1,704
1952 37.5 208.1 27,979 0.7 12.91 1,682
1953⁷ - - - - - - 31,523 - - - - - - 1,871
1954 - - - - - - 32,419 - - - - - - 1,899
1955 - - - - - - 40,099 - - - - - - 2,315
1956 - - - - - - 34,884 - - - - - - 1,994
1957 - - - - - - 41,495 - - - - - - 2,327
1958 - - - - - - 38,947 - - - - - - 2,157
1959 - - - - - - 43,921 - - - - - - 2,410
1960 - - - - - - 48,168 - - - - - - 2,617
1961 - - - - - - 52,238 - - - - - - 2,813
1962 - - - - - - 54,096 - - - - - - 2,896
1963 - - - - - - 58,988 - - - - - - 3,135
1964 - - - - - - 64,774 - - - - - - 3,422
1965 - - - - - - 70,122 - - - - - - 3,685
1966 - - - - - - 78,007 - - - - - - 4,075
1967 - - - - - - 85,570 - - - - - - 4,437
1968 - - - - - - 91,988 - - - - - - 4,664
1969 - - - - - - 97,815 - - - - - - 4,888

192
1970 - - - - - - 107,592 - - - - - - 5,312
1971 12.2 42.2 115,570 0.0 2.1 5,646
1972 30.2 100.0 130,348 0.1 5.2 6,308
1973 51.6 162.0 146,695 0.1 7.8 7,043
1974 590 1,699.3 148,062 1.1 80.8 7,041
1975 1992 5,239.0 151,409 3.5 246.7 7,127
1976 2876 7,161.2 168,205 4.3 333.6 7,843
1977 3684 8,620.0 178,309 4.8 397.8 8,233
1978 5170 11,322.0 194,780 5.8 517.0 8,912
1979 7342 14,830.1 202,913 7.3 672.1 8,957
Years External Public Debt
Gross
Domestic
Product⁶
Share of the external debt
in GDP (col.4/5) %
Per capita
in Hard Currency¹
million US
dollars
2000
External Public Debt
US dollars 2000
Gross Domestic Product
current
Gross
Domestic
Product⁶ US dollars
2000
million US
dollars
million US
dollars 2000
1 2 3 4 5 6 7
1980 9,810 18,148.5 198,465 9.1 817.6 8,939
1981 10,564 17,863.0 198,606 9.0 799.2 8,885
1982 9,969 15,880.0 206,650 7.7 706.5 9,194
1983 9,077 13,903.0 219,220 6.3 616.5 9,720
1984 7,437 11,027.0 232,237 4.7 487.4 10,265
1985 6,830 9,792.0 232,024 4.2 430.9 10,211
1986 6,875 9,730.0 237,399 4.1 426.3 10,402
1987 6,272 8,531.0 239,415 3.6 371.9 10,437
1988 2,106 2,787.0 238,305 1.2 120.9 10,337
1989 174 222.0 224,380 0.1 9.6 9,692
1990 230 282.0 211,813 0.1 12.2 9,127
1991 1,143 1,359.0 184,409 0.7 58.6 7,954
1992 2,479 2,855.0 168,096 1.7 125.3 7,376
1993 3,357 3,784.0 170,599 2.2 166.3 7,497
1994 5,531 5,992.0 177,249 3.4 263.6 7,798
1995 5,458 5,953.0 189,867 3.1 262.5 8,371
1996 8,349 7,685.0 197,436 3.9 339.9 8,733
1997 9,503 9,612.0 185,390 5.2 426.3 8,223
1998 9,899 9,991.0 176,530 5.7 444.0 7,845
1999 9,136 9,162.0 174,372 5.3 408.0 7,764
2000 10,490 10,430.0 177,973 5.9 464.9 7,933
mil. euro⁵
mil. euro
2001 14,685 13,206.0 187940 7.0 589.3 8,387
2002 16,200 14,752.0 197,728 7.5 680.4 9,120

193
2003 17,835 19,051.0 208,584 9.1 876.6 9,598
2004 21,708 24,786.0 226,026 11.0 1,143.6 10,429
2005 30,914 34,239.0 235,458 14.5 1,583.5 10,889
2006 41,196 44,637.0 254,501 17.5 2,068.1 11,791
2007 58,531 67,342.0 271,943 24.8 3,126.8 12,627
2008 72,354 87,278.0 294,901 29.6 4,058.7 13,714
2009 81,205 92,371.0 274,078 33.7 4,302.5 12,766
2010 92,462 99,081.0 271,765 36.5 4,623.3 12,681 Sources: Explanatory statement to the State general budget, 1877-1948.
Romania’s Statistical Yearbook, 1915-2010.
I.N. Angelescu, Balance de payement de la Roumanie, Bucharest, 1925.
Ion Alexandrescu, Romania's economy in the early postwar years,1945-1947, Bucharest, 1986.
Victor Axenciuc, Romania's economic evolution, statistical and historical research 1859-1947, 3rd volume, Public Finance Section, Bucharest, 2000.
Angela Banu, Romania’s Public Debt (1864-1949), Bucharest, 2012.
Constanţa Bogdan, Adrian Platon, Foreign capital in public limited companies in Romania in the interwar period, Bucharest, 1981.
M. Cancicov, La capacité de payement et la capacité de transfert de la Roumanie. Memorandum, Bucharest, 1936.
N. N. Constantinescu, coordinator, Romania’s economic History, 2nd volume, Bucharest, 2000.
Costin C. Kirițescu, The cash rate and its precursors, 2nd volume, II, 1964, 1967, 3rd volume, 1997.
Gh. M. Dobrovici, History of the Romanian public debt, Bucharest,1913.
Gh. M. Dobrovici, History of Romania's economic and financial development and its loans during 1823-1934, Bucharest, 1935.
Gh. M. Dobrovici, Romania's economic and financial developments 1934-1943, Bucharest, 1944.
Mugur C. Isărescu, Economic Reflections, 2nd and 3rd volume, Bucharest, 2007, 2003.
Petre Gigea, Memories of a Public Finance Minister, 1st and 2nd volume, Bucharest, 2004.
Petre Gigea, How and what did Romania negotiate with I.M.F. in the 80s; http://www.cotidianul.ro/115537.
Radu Paul (co-author), Contribuţii la istoria capitalului străin în România, Bucharest, 1960.
Victor Slăvescu, La situation économique de la Roumanie et sa capacité de payement, Bucharest, 1934.
N. Xenopol, La Richesse de la Roumanie, Bucharest, 1916.
Williamson M. Samuel, Six Ways to Compute the Relative Value of a U.S. Dollar Amount, 1774 to present, Measuring-Worth, 2008. Williamson M. Samuel, Seven Ways to Compute the Relative Value of a U.S. Dollar Amount, 1774 to present, Measuring-Worth, 2015.
R.N.B., Bulletin d’information et de documentation, 1929-1947.
R.N.B., Activity Report, 1992-2011.
R.N.B., Annual Report, Balance of payments and the Romania’s investment position, 1996-2011. I.M.F., Economic Memorandum, Romania, 1983, 1986. Archives: Ministry of Finance, Report on the balance sheet analysis based on the economic and financial results - annually, 1972 - 1984, top secret; Report on the draft centralized financial plan and the State budget, annually: 1978 – 1984, top secret; Plan of resources and expenditures for external loans, 1981 - 1986, annually, top secret; Report on the general account of the budgetary year closing, annually. Notes:
¹ The State external debt during 1862 - 1940, contracted in foreign currencies, according to the banking institutions - sterling, French francs, German marks, etc., in the State budgets and in biographical sources, especially in the works of Gh. N. Dobrovici, wherefrom we have used data, is presented as converted into current lei according to the average exchange rate. With the purpose to transpose the amount in comparable currency, ppc dollars, the external debt, presented in current currency was converted into US dollars and then into current ppc dollars 2000 according to Samuel M. Williamson's paper methodology. ² The State external debt during 1862 - 1940 was contracted in foreign currencies, according to the banking institutions. As a monetary unit of comparison, for the entire period, the US dollar was used according to the

194
purchasing power of the GDP in 2000 and the degree of impairment during the 1862 - 2010 period; if the dollar level in 2000 was equal to 100 at the beginning of the period, that is in year 1862, it was equal to 6.96; it means that the US dollar reached, in year 2000, a depreciation by 14.38 times, as compared to year 1862, the dollar thus representing, in year 2000, only 6.96 cents of the dollar value in 1862. ³ According to the Hower moratorium, the external debt diminished after 1931, as a result of the suspension of the obligations to pay post-war inter-allied compensations belonging to Romania. Later they were totally cancelled. ⁴ Only the payment obligations of the 1947 – 1953 period, according to the Armistice Convention (19450 and the Peace Treaty (1947) due to the Soviet Union. Romania's external debt by 1940 was suspended in April 1941 and its payment was not resumed because of the war. ⁵ Since 2001, the external debt has been expressed in current Euro currency. It was converted into dollars at the average current annual currency according to the methodology by Samuel Williamson and then in ppc dollar 2000 to ensure comparability. ⁶ The gross domestic product according to the data in Part I/1, of table A 2. ⁷ During 1953 - 1970 there were not registered significant amounts of Romania's external debt.

195
THE BOP CURRENT ACCOUNT BALANCE OF ROMANIA
DURING 1862-2010
HISTORICAL AND METHODOLOGICAL COMMENTS
In the modern and contemporary era, in the poorly developed agrarian and
predominantly agrarian countries - with massive foreign capital investments and large debts
contracted with international financial centers, and therefore value exporters - interest, profits,
etc., - the national product synthetic indicator expresses rather the level and dynamics of
long-term revenue of the national economy.
The economic literature statistic on the current account provided data only since the
70s of the 20th century; for the previous period, that is retrospectively back to 1860,
calculations were not performed. Thus, in order to determine the 1860-2010 national product
indicator it is necessary to draft the data series of the current account balance for the period
they do not exist.
Therefore, we conducted researches on the country's balance of external financial
relations. One should note that, in the surveyed period, Romania did not contract loans and
public or private credits abroad, failed to obtain foreign revenues, etc.; on the contrary,
important values, varying in different periods between 5% and 80% of the domestic product,
were transferred through various channels, by virtue of market mechanisms; if we add the fact
that an increasingly important part of the non-agricultural, industrial-banking-commercial,
national wealth became the property of foreign companies, Romania's debtor position, with
all the economic and social consequences arising from this, had already been decided for an
imprecise period of time.
For a century and a half, the balance of payments accounts witnessed substantial
changes, the current ones based on the accounting methodology for the national accounts,
applied in Romania after 1990. By then, in the external financial relations, managed by the
Ministry of Finance, the account inflow and outflow amounts were recorded systematically in
different categories of balance of payments which were not published; since 1860 until the
mid-twentieth century the books of external debits and credits were made by the State
Accounting Directorate of the Ministry of Finance. Researches on the balance of payments
accounts became more frequent in the interwar period.
Therefore, based on the existing information, calculations were made, in the spirit of
the meaning and content of the actual amounts, corresponding to the current account balance
196
configuration. Depending on the existing information and opportunities to determine the
sources of the current account balance, three tables of annual data, covering the entire
investigated interval, were created, namely for: 1) the 1862-1947period; 2) the 1950-1989
period; 3) the 1990-2010 period. The statistic information and resources are historically
different so as the components and the data accuracy vary; the size of the amounts in the first
period, 1862-1947, is more relative, becoming more accurate in the second period, 1950-
1989, and measured with the accuracy and method of the national accounts by the National
Bank of Romania, during the 1990-2010, since after 1990, it was its attributions to draft the
balance of payments.
The currency in which the data were calculated was the gold leu for 1913, the US
dollar for the 1862 - 1947 period, and the euro for the 1950-2000 and 2001-2010 periods.
They were converted, according to the explanations in the notes to the statistical tables, in
comparable international currency, that is ppc dollars 2000 for the entire period, 1862 - 2010.
The determining relation between the external debt and the current account balance
imposed a special paragraph devoted to the calculation and explanation of the evolution of the
Romanian State's external financial obligations during the 1864-2010 period, which complete
the understanding, argumentation of the current account balance.
For the first period, 1862-194760, the foreign-held balances, interests, commissions,
exchange differences on loans and public credits, as well as important expenditures abroad,
particularly up to the agrarian reform of 1921, made by the Romanian big landowners who
lived, in large number, in France, Italy, Germany; there, a significant proportion of the estate
revenues and, in many cases, even the value obtained from the sale of properties was
consumed; the landowners formed a specific social group, officially called the “absentees”.
The payments for voyages, the balance of emigrants and immigrants' incoming and outgoing
amounts (remittences), the balance of foreign legations' expenses in Romania and that of the
Romanian legations abroad etc. were included in the transfers.
60 In 1929, the State Statistics Institute published a statement named Romania's Balance of Payments for 1926, 1927 and 1928 requested by the League of Nations. It is actually the first official balance of payments developed and published. Important seem to appear the positions for which Passive or Exit payments were made. For instance in 1928, in million lei current prices: interests on interstate debts - 11 million lei; interests and dividends on the State and municipal public debt - 3,912 million lei; interests, dividends on foreign short-term capital - 480 million lei; payments for sea and river transport - 48 million; taxes for Romanian ships in foreign ports - 67 million; commissions, insurance premiums, etc., - 12 million; PTT royalties - 28 million; funds sent by immigrants abroad, by Romanian tourists to foreign countries - 1,188 million; expenses of Romanian legations, consulates abroad - 349 million; fees for foreign citizens having served Romania - 4 million; and so on. All in all, without the balance of the trade balance - 9,099 million; plus passive foreign trade balance 5,300 million lei we achieve the external balance picture of 14,393 million lei. Thus after the calculation of the balance accounts, during the year taken as an example - 1928, Romania could have financed its balance of payments through foreign funds and massive exports of goods.
197
We note that during 1862-1876, the annual traditional tribute of 923 million lei was
paid to the Otoman Porte from the country's budget; in 1863, following the monastery estate
impropriation, with farmlands, vineyards, forests, etc., 1/3 of the country's surface was
donated, by different rulers and boyars to the Athos holy places, and the Romanian State had
to pay compensations of 14.2 million lei. We had leeway to separate data for the interests on
foreign loans and their depreciation for the 1864 - 1912 period, with the help of Gh. M.
Dobrovici who calculated the total amount of 2,053 million gold lei. We distributed it in
annual amounts for the 1864 -1912 period, proportional to the size of each year annuities. We
note that, in the absence of data, we did not include interests, commissions, etc., payable for
external loans of municipalities, local credit unions, professional unions etc. However they
held a small share in the external debt.
For the 1941-1947 period, that is the war and postwar periods, the amounts are: 1. for
the 1941 - 1944 period, Germany's unpaid debt, for the Romanian goods exports in clearing,
amounting to 62,459 lei in 1938, that is $446 million ($1 = 140lei). These amounts would
have represented $318.6 million in 1913 - the dollar being depreciated in January 1934 by
41%. Since in 1913, $1 = 5.18 lei, and thus $318.6 million = $1,650 million lei, which
allocated over four years, 1941-1944, mean 412.5 million lei annually; 2. During the 1945-
1947, according to Alexandrescu's data, Romania paid to the Soviet Union 1938 $1,200
million, out of which $500 million refunds - equivalent value of the goods transferred to
Romania from the occupied territory of the Soviet Union during the 1941-1943 period. The
remaining 1938 $700 million or 1913 $421.7 million or 2,184.4 million gold lei represented
reparations to the Soviet Union. These sums amounted to an average of 728 million in 1913
lei.
Besides these transfer estimates, Romania's debt increased, as it can be seen from the
table below, with the negative balance of the balance of trade in 34 years out of eight decades.
For the next period, 1950-1989, for the current account balance, we have at our
disposal the main data calculated in US dollars by Gh. Stroe in “Romania's Economic
History”, 2nd volume, coordinator Academician N. N. Constantinescu. The 1990-2010 period
is totally covered with data on the current account balance, in dollars for the 1990 - 2000
period and in euros for the 2001 - 2010 period, published in the Annual Reports of the
National Bank of Romania.
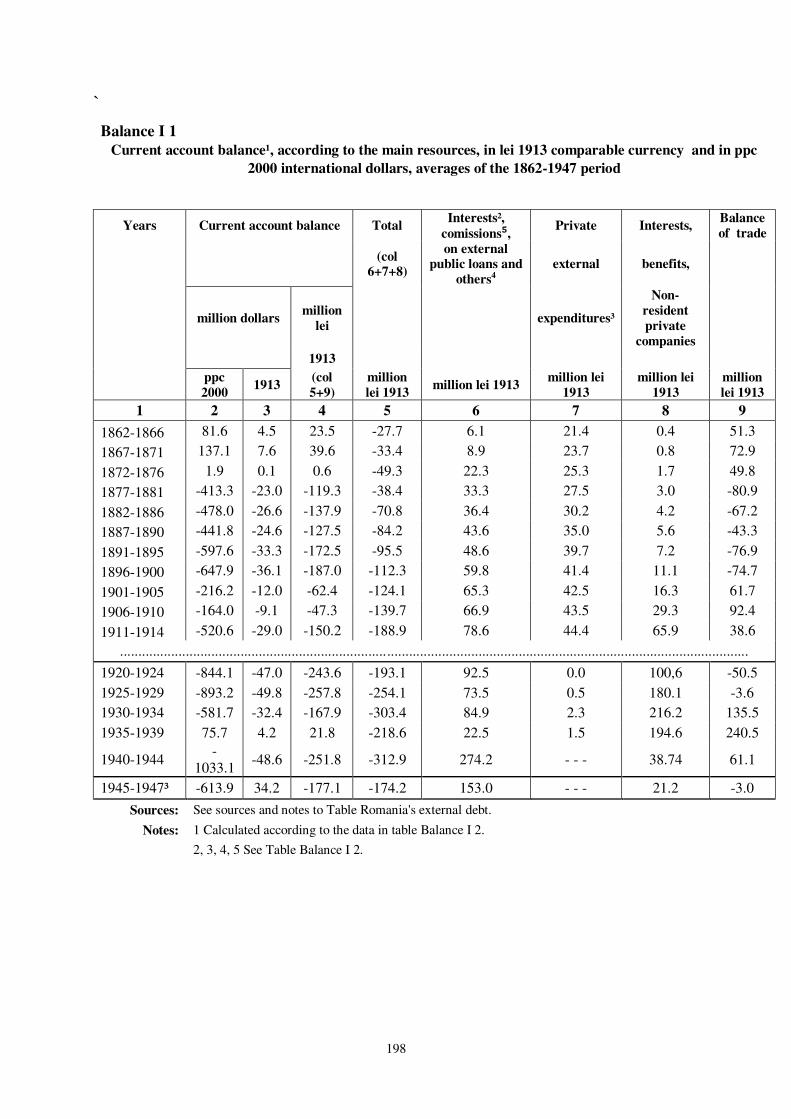
198
`
Balance I 1
Current account balance¹, according to the main resources, in lei 1913 comparable currency and in ppc
2000 international dollars, averages of the 1862-1947 period
Years Current account balance Total Interests²,
comissions⁵, Private Interests,
Balance of trade
(col 6+7+8)
on external public loans and
others4 external benefits,
million dollars million
lei
expenditures³
Non-resident private
companies
1913
ppc 2000
1913 (col 5+9)
million lei 1913
million lei 1913 million lei
1913 million lei
1913 million lei 1913
1 2 3 4 5 6 7 8 9
1862-1866 81.6 4.5 23.5 -27.7 6.1 21.4 0.4 51.3
1867-1871 137.1 7.6 39.6 -33.4 8.9 23.7 0.8 72.9
1872-1876 1.9 0.1 0.6 -49.3 22.3 25.3 1.7 49.8
1877-1881 -413.3 -23.0 -119.3 -38.4 33.3 27.5 3.0 -80.9
1882-1886 -478.0 -26.6 -137.9 -70.8 36.4 30.2 4.2 -67.2
1887-1890 -441.8 -24.6 -127.5 -84.2 43.6 35.0 5.6 -43.3
1891-1895 -597.6 -33.3 -172.5 -95.5 48.6 39.7 7.2 -76.9
1896-1900 -647.9 -36.1 -187.0 -112.3 59.8 41.4 11.1 -74.7
1901-1905 -216.2 -12.0 -62.4 -124.1 65.3 42.5 16.3 61.7
1906-1910 -164.0 -9.1 -47.3 -139.7 66.9 43.5 29.3 92.4
1911-1914 -520.6 -29.0 -150.2 -188.9 78.6 44.4 65.9 38.6
............................................................................................................................................................................
1920-1924 -844.1 -47.0 -243.6 -193.1 92.5 0.0 100,6 -50.5
1925-1929 -893.2 -49.8 -257.8 -254.1 73.5 0.5 180.1 -3.6
1930-1934 -581.7 -32.4 -167.9 -303.4 84.9 2.3 216.2 135.5
1935-1939 75.7 4.2 21.8 -218.6 22.5 1.5 194.6 240.5
1940-1944 -
1033.1 -48.6 -251.8 -312.9 274.2 - - - 38.74 61.1
1945-1947³ -613.9 34.2 -177.1 -174.2 153.0 - - - 21.2 -3.0
Sources: See sources and notes to Table Romania's external debt.
Notes: 1 Calculated according to the data in table Balance I 2.
2, 3, 4, 5 See Table Balance I 2.

199
Balance I 2
Current account balance¹, according to the main resources, in lei 1913 comparable currency
and in ppc 2000 international dollars, annual series of the 1862-1947 period
Years
Current account balance Total
Interests², commissions⁵,
Private external
expenditures³ Interests,
Balance of trade
(col 6+7+8) on external public loans
benefits,
million dolars
million lei
and others⁴
non-resident private
companies
1913
ppc 2000 1913 (col 5+9)
million lei 1913
million lei 1913 Million lei 1913 million lei
1913 million lei
1913
1 2 3 4 5 6 7 8 9
1862 102.6 5.7 29.6 -19.6 0.9 18.6 0.1 49.2
1863 45.0 2.5 13.0 -35.8 15.1 20.5 0.2 48.8
1864 147.3 8.2 42.5 -27.2 4.6 22.3 0.3 69.7 1865 56.5 3.1 16.3 -27.4 4.4 22.6 0.4 43.7
1866 56.5 3.1 16.3 -28.8 5.4 22.9 0.5 45.1
1867 30.1 1.7 8.7 -31.2 7.5 23.1 0.6 39.9
1868 250.2 13.9 72.2 -35.0 10.9 23.4 0.7 107.2
1869 110.5 6.2 31.9 -34.8 10.3 23.7 0.8 66.7
1870 74.5 4.2 21.5 -34.6 9.8 23.9 0.9 56.1
1871 220.0 12.3 63.5 -31.3 6.1 24.2 1.0 94.8
1872 93.9 5.2 27.1 -37.1 11.5 24.5 1.1 64.2 1873 71.7 4.0 20.7 -39.0 12.7 24.8 1.5 59.7
1874 -127.2 -7.1 -36.7 -48.6 21.7 25.2 1.7 11.9 1875 -56.8 -3.2 -16.4 -60.5 32.8 25.7 2.0 44.1 1876 28.1 1.6 8.1 -61.2 32.8 26.2 2.2 69.3 1877 -888.1 -49.5 -256.3 -61.8 32.7 26.6 2.5 -194.5 1878 -527.1 -29.4 -152.1 -62.6 32.9 27.0 2.7 -89.5 1879 165.3 9.2 47.7 63.5 33.0 27.5 3.0 -15.8 1880 -350.7 -19.5 -101.2 -64.7 33.5 28.0 3.2 -36.5 1881 -465.7 -25.9 -134.4 -66.2 34.3 28.4 3.5 -68.2 1882 -308.4 -17.2 -89.0 -64.9 32.4 28.8 3.7 -24.1 1883 -717.7 -40.0 -207.1 -67.8 34.6 29.3 3.9 -139.3 1884 -626.5 -34.9 -180.8 -69.9 36.0 29.8 4.1 -110.9 1885 -323.7 -18.0 -93.4 -72.8 37.5 30.9 4.4 -20.6 1886 -413.8 -23.1 -119.4 -78.4 41.6 32.1 4.7 -41.0 1887 -422.4 -23.5 -121.9 -82.9 44.5 33.3 5.1 -39.0 1888 -468.5 -26.1 -135.2 -81.6 41.8 34.4 5.4 -53.6 1889 -621.7 -34.6 -179.4 -85.6 44.3 35.6 5.7 -93.8 1890 -254.7 -14.2 -73.5 -86.7 43.9 36.8 6.0 13.2 1891 -520.1 -29.0 -150.1 -88.1 43.9 37.9 6.3 -62.0 1892 -651.1 -36.3 -187.9 -92.5 46.7 39.1 6.7 -95.4 1893 -539.9 -30.1 -155.8 -96.0 48.8 40.3 6.9 -59.8 1894 -785.2 -43.7 -226.6 -98.7 50.5 40.5 7.7 -127.9 1895 -491.7 -27.4 -141.9 -102.4 53.1 40.7 8.6 -39.5
1896 -414.8 -23.1 -119.7 -105.8 55.4 41.0 9.4 -13.9 1897 -832.7 -46.4 -240.3 -108.7 57.2 41.2 10.3 -131.6 1898 -755.8 -42.1 -218.1 -111.4 59.0 41.4 11.0 -106.7 1899 -1,037.1 -57.8 -299.3 -115.2 61.6 41.7 11.9 -184.1 1900 -199.3 -11.1 -57.5 -120.5 65.9 41.9 12.7 63.0
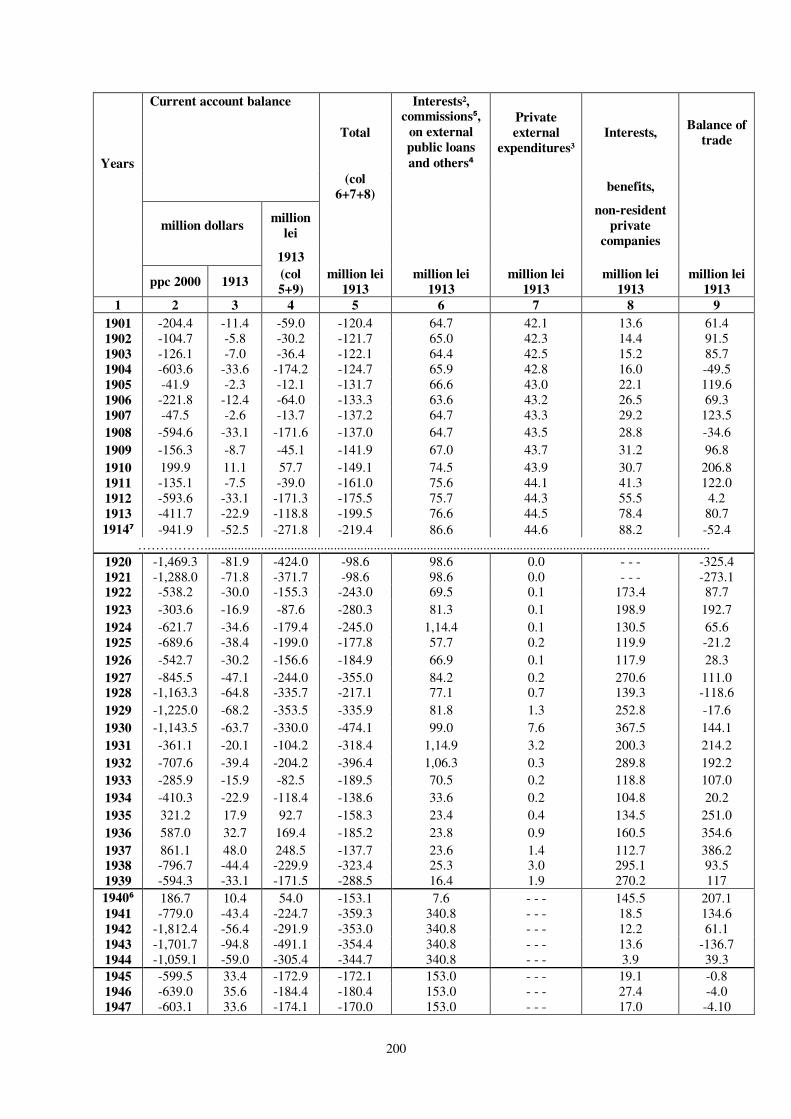
200
Years
Current account balance
Total
Interests², commissions⁵,
on external public loans
and others⁴
Private external
expenditures³ Interests,
Balance of trade
(col
6+7+8) benefits,
million dollars
million lei
non-resident private
companies
1913
ppc 2000 1913
(col 5+9)
million lei 1913
million lei 1913
million lei 1913
million lei 1913
million lei 1913
1 2 3 4 5 6 7 8 9
1901 -204.4 -11.4 -59.0 -120.4 64.7 42.1 13.6 61.4 1902 -104.7 -5.8 -30.2 -121.7 65.0 42.3 14.4 91.5 1903 -126.1 -7.0 -36.4 -122.1 64.4 42.5 15.2 85.7 1904 -603.6 -33.6 -174.2 -124.7 65.9 42.8 16.0 -49.5 1905 -41.9 -2.3 -12.1 -131.7 66.6 43.0 22.1 119.6 1906 -221.8 -12.4 -64.0 -133.3 63.6 43.2 26.5 69.3 1907 -47.5 -2.6 -13.7 -137.2 64.7 43.3 29.2 123.5
1908 -594.6 -33.1 -171.6 -137.0 64.7 43.5 28.8 -34.6
1909 -156.3 -8.7 -45.1 -141.9 67.0 43.7 31.2 96.8
1910 199.9 11.1 57.7 -149.1 74.5 43.9 30.7 206.8 1911 -135.1 -7.5 -39.0 -161.0 75.6 44.1 41.3 122.0 1912 -593.6 -33.1 -171.3 -175.5 75.7 44.3 55.5 4.2 1913 -411.7 -22.9 -118.8 -199.5 76.6 44.5 78.4 80.7
1914⁷ -941.9 -52.5 -271.8 -219.4 86.6 44.6 88.2 -52.4 ……………............................................................................................................................... .........................
1920 -1,469.3 -81.9 -424.0 -98.6 98.6 0.0 - - - -325.4 1921 -1,288.0 -71.8 -371.7 -98.6 98.6 0.0 - - - -273.1 1922 -538.2 -30.0 -155.3 -243.0 69.5 0.1 173.4 87.7
1923 -303.6 -16.9 -87.6 -280.3 81.3 0.1 198.9 192.7
1924 -621.7 -34.6 -179.4 -245.0 1,14.4 0.1 130.5 65.6 1925 -689.6 -38.4 -199.0 -177.8 57.7 0.2 119.9 -21.2
1926 -542.7 -30.2 -156.6 -184.9 66.9 0.1 117.9 28.3
1927 -845.5 -47.1 -244.0 -355.0 84.2 0.2 270.6 111.0 1928 -1,163.3 -64.8 -335.7 -217.1 77.1 0.7 139.3 -118.6
1929 -1,225.0 -68.2 -353.5 -335.9 81.8 1.3 252.8 -17.6
1930 -1,143.5 -63.7 -330.0 -474.1 99.0 7.6 367.5 144.1
1931 -361.1 -20.1 -104.2 -318.4 1,14.9 3.2 200.3 214.2
1932 -707.6 -39.4 -204.2 -396.4 1,06.3 0.3 289.8 192.2
1933 -285.9 -15.9 -82.5 -189.5 70.5 0.2 118.8 107.0
1934 -410.3 -22.9 -118.4 -138.6 33.6 0.2 104.8 20.2
1935 321.2 17.9 92.7 -158.3 23.4 0.4 134.5 251.0
1936 587.0 32.7 169.4 -185.2 23.8 0.9 160.5 354.6
1937 861.1 48.0 248.5 -137.7 23.6 1.4 112.7 386.2 1938 -796.7 -44.4 -229.9 -323.4 25.3 3.0 295.1 93.5 1939 -594.3 -33.1 -171.5 -288.5 16.4 1.9 270.2 117
1940⁶ 186.7 10.4 54.0 -153.1 7.6 - - - 145.5 207.1 1941 -779.0 -43.4 -224.7 -359.3 340.8 - - - 18.5 134.6 1942 -1,812.4 -56.4 -291.9 -353.0 340.8 - - - 12.2 61.1 1943 -1,701.7 -94.8 -491.1 -354.4 340.8 - - - 13.6 -136.7 1944 -1,059.1 -59.0 -305.4 -344.7 340.8 - - - 3.9 39.3
1945 -599.5 33.4 -172.9 -172.1 153.0 - - - 19.1 -0.8 1946 -639.0 35.6 -184.4 -180.4 153.0 - - - 27.4 -4.0 1947 -603.1 33.6 -174.1 -170.0 153.0 - - - 17.0 -4.10

201
Source: See sources and notes to Table Romania's foreign public debt.
Note:1. All the statistics sources consulted, including the balance of payments during the inter-war period
drafted by various authors to estimate, capital inflows and outflows were calculated at net balance transfers with
no value across the border: there were not taken into consideration the calculations for refunds of foreign capital
placed in Romania, external payments for Romanian freight to other states and foreign cashing for transporting
goods in transit through Romania etc., etc.
2. Interests, fees, exchange differences on loans and external public credits were taken into account as net
transfers.
3. In what concerns expenditures abroad, especially by World War I, made by the Romanian big landowners
who lived, in large numbers, in France, Italy, Germany; where a significant proportion of the estate revenues
and, in many cases, even the value obtained from the sale of properties was consumed and the landowners
formed a specific social group, officially called the “absentees”. The payments for voyages, the balance of
emigrants and immigrants' incoming and outgoing amounts, the balance of foreign legations' expenses in
Romania and that of the Romanian legations abroad etc. were included in the transfers..
4. During 1862-1876, the annual traditional tribute of 923 million lei was paid to the Ottoman Porte from the
country's budget and in 1863, following the monastery estate impropriation, with farmlands, vineyards, forests,
mills, etc., 1/3 of the country's surface was donated, by different rulers and boyars to the Athos holy places, and
the Romanian State paid compensations of 14.2 million lei.
5. Separate data on interests on external public loans and on their depreciation are available only until 1912
because of Gh. M. Dobrovici who calculated them for the 1864-1912 period amounting to a total of 2,053
million lei gold. We distributed the annual amounts for the period 1864-1912 in proportion with the annuities.
6. For the 1941-1947 period, that is the war and postwar periods, the amounts are: 1. for the 1941 - 1944 period,
Germany's unpaid debt, for the Romanian goods exports in clearing, amounting to 62,459 lei in 1938, that is
$446 million ($1 = 140lei). Since 1913 up to 1938, the dollar devalued up to the rate $1 = 5.18 lei, and thus
1913 $263 million = 1,363 million lei, which allocated over four years, 1941-1944, mean 340.8 million lei
annually. Practically, Germany's unpaid debt represented losses for Romania.
No other amounts were paid after 1940 in external debt account since after the outbreak of the World War,
external annuities payment was suspended in April 1941. Not even after the peace conclusion was the payment
of the pre-1940 external obligation on payment resumed; the communist regime after 1948, did not accept the
external financial obligations contracted by the previous governments. During the post-war years, according to
the Armistice Convention, 1938 $300 million were paid to the Soviet Union, spread over 8 years in goods as
war compensations; to all this added were, reimbursements or values of the goods brought from the occupied
territory of the Soviet Union during the 1941-1943 period and the administration of the Transnistrian
Government organized by the Romanian State as well as the expenditures incurred by Romania for the
maintenance and supplies for the Soviet troops after August 23rd, 1944.
7. N. Xenopol, former minister of Industry and Trade, in his book "La Richesse de la Roumanie", published in
1916, was the first researcher to estimate the transfers of value, from individuals abroad, before the World War;
they were assessed at approximately 200 million lei gold annually. The debt main positions summarized:
- Annuity of the external public debt 84 million lei;
- Benefits, private loans interests, dividends, etc.:
- benefits of the important banks with foreign capital 4 mil. lei
- benefits of the foreign insurance companies in Vienna and Trieste 12 mil. lei
- benefits for foreign electricity, forestry, oil companies 90 mil. lei
- Other amounts transferred and spent abroad, etc
- revenues of important landowners, "absentees", from leased or sold lands
(after the 1905 fiscal census) 4,8 mil lei
- incomes of the large properties leased by important tenant farmers
(60% of all properties were leased producing 76 million lei) 7,8 mil. lei
- expenditures for scholarships and support abroad for approximately
1,500 university students and 600 high-school students 9,3 mil. lei
- domestic holidays, holidays abroad, Paris, Nice, Monte Carlo, Switzerland etc.
for over 8000 people 25 mil. lei
- wages of foreign agricultural and industrial workers - Italians, Bulgarians, Serbs
- over 20 thousand persons, and servants, male and female, approximately
40 thousand from Transylvania, employed by wealthy families 35 mil. lei

202
Balance II 1 Current account balance¹, according to the main resources, in dollars current and comparable currency
ppc 2000 in annual series of the 1950 - 1979 period
Years Balance of the current
account million dollars
Losses of joint venture
companies and others⁴, External financial
liabilities Balance of trade
million dollars million dollars
Comparable
Current currency
Comparable Current currency
Comparable Current currency
Comparable Current currency
currency
currency
currency
currency
dollars 2000³
dollars 2000
dollars 2000
dollars 2000
1 2 3 4 5 6 7 8 9
1950 -607.1 -68.5 - - 419.0 37,5¹ -188.1 -31 1951 -469.7 -47.5 - - 413.0 37,5¹ -56.7 -10
1952 -713.8 -97.5 - - 381.4 37,5¹ -332.4 -60
1953 -603.8 -103 - - 32.4 6² -571.4 -97
1954 -130.2 -24 - - 27.0 5² -103.2 -19
1955 -269.7 -51 - - 56.0 11² -213.7 -40
1956 199.6 37 - - 24.8 5² 224.4 42
1957 -413.1 -83 - - 9.1 2² -404.0 -81
1958 -72.7 -15 - - 4.5 1 -68.2 -14
1959 97.4 20 - - - - - - - - 97.4 20
1960 336.0 69 - - - - - - - - 336.0 69
1961 -103.5 -22 - - - - - - - - -103.5 -22
1962 -569.8 -123 - - - - - - - - -569.8 -123
1963 -500.2 -107 - - - - - - - - -500.2 -107
1964 -759.7 -168 - - - - - - - - -759.7 -168
1965 107.8 25 - - - - - - - - 107.8 25
1966 -116.4 -27 - - - - - - - - -116.4 -27
1967 -634.7 -151 - - - - - - - - -634.7 -151
1968 -560.9 -140 - - - - - - - - -560.9 -140
1969 -412.9 -108 - - - - - - - - -412.9 -108
1970 -395.3 -109 - - - - - - - - - - - - -395.3 -109
1971 -86.2 -25 - - - - - - 79.3 23 -6.9 -2
1972 -213.0 -64 0.3 0.1 156.1 47 -56.5 -17
1973 669.3 232.5 1.6 0.5 - - - - - - 670.9 233
1974 -1,812.6 -629.0 1.3 0.4 1,033.8 359 -777.5 -270
1975 -394.0 -136.8 2.5 0.8 388.8 135 -2.7 -1
1976 54.4 24.9 6.5 2.1 39.8 16 100.7 43
1977 -211.3 -364.3 49.8 21.3 70.2 304 -91.3 -39 1978 -3,805.3 -1,666.8 126.2 57.8 1,825.2 759 -1,853.9 -850 1979 -5,944.7 -2,940.9 193.8 96.9 3,342.9 1,653 -2,408.0 -1,191 Source:
Note:
See sources and notes to Table Romania's external public debt.
¹ In 1938 dollar currency. Payments in the liability account of Romania, according to the 1947 postwar peace treaty provisions, 300 million US dollars spread out over eight years.
² After 1955 estimated shares of repurchasing assets from Sovrom companies of the Soviet Union.
³ Amounts resulting from multiplying the current currency - US dollars, by the rate of depreciation of the dollar up to 2000.
⁴ See detailed explanations in the study of Romania's external debt.

203
Balance III 1
Current account balance¹ current dollars and euros and in comparable
currency, ppc dollars 2000, annual series of the 1980 - 2010 period
Years Balance of the current acount
million dollars per capita
ppc 2000
Current
currency
dollars
2000
1 2 3 4
1980 -4,477 -2,420 -202
1981 -1,409 -833 -63
1982 1,274 1,040 57
1983 1,777 1,160 79
1984 2,106 1,719 93
1985 1,701 1,381 75
1986 1,709 1,395 75
1987 2,503 2,043 109
1988 4,806 3,922 208
1989 3,081 2,514 263
1990 -3,963 -3,337 -171
1991 -1,265 -1,012 -55
1992 -1,916 -1,564 -84
1993 -1,439 -1,174 -63
1994 -472 -428 -21
1995 -2,174 -1,774 -96
1996 -3,150 -2,571 -139
1997 -2,619 -2,137 -116
1998 -3,637 -2,968 -162
1999 -1,800 -1,709 -80
2000 -1,670 -1,663 -74
million euro¹
2001 -2,179 -2,488 -97
2002 -1,478 -1,623 -68
2003 -3,268 -3,060 -150
2004 -5,822 -5,099 -269
2005 -7,627 -6,888 -353
2006 -11,004 -10,156 -510
2007 -19,115 -16,614 -888
2008 -19,489 -16,157 -906
2009 -5,589 -4,913 -260
2010 -5,887 -5,493 -275
Source: See sources and notes to Table Romania's external public debt.
Note: ¹ Since 2001 the balance of the current account is displayed in the main
source - the Annual Activity Report of R.N.B.- in international currency, that
is euro. It was converted according to the average of the exchange rate in
dollar current currency, calculated afterwards in ppc dollars 2000 by means
of the dollar depreciation coefficient.

204
GDP-Vn 1 Gross domestic product, net domestic product and national income - net national product, total and per
capita, comparable currency in ppc dollars 2000, averages of the 1862-2010 period
Years
Gross domestic product
million dollars
Consump- tion of fixed
capital¹
million dollars
Net domestic product²
(col. 2-3) million dollars
Balance of the
current account³
million dollars
National income⁴ -
Net national product
Per capita
(col. 4+5) million dollars
Share in the gross
domestic product (col.6/2)
%
Goss domestic product
dollars
Net domestic product
dollars
National income
dollars
1 2 3 4 5 6 7 8 9 10
1862-1866 2,260.8 73.6 2,187.2 81.6 2,268.8 100.2 554.4 536.3 5563 1867-1871 2,539.8 81.8 2,458.0 137.1 2,595.1 102.1 598.2 578.9 611.1 1872-1876 2,925.8 98.8 2,827.0 1.9 2,828.9 96.7 667.4 644.8 645.3 1877-1881 3,491.8 114.2 3,377.6 -413.3 2,964.3 84.5 770.3 745.1 653.7 1882-1886 4,184.6 126.2 4,058.4 -478.0 3,580.4 85.1 859.5 833.6 735.1 1887-1890 4,775.3 147.8 4,627.5 -441.8 4,185.7 87.6 915.5 887.2 802.3 1891-1895 5,581.8 183.4 5,398.4 -597.6 4,800.8 86.0 1,015.0 981.6 872.9 1896-1900 5,599.2 214.6 5,384.6 -647.9 4,736.7 83.7 954.1 917.6 807.1 1901-1905 6,297.8 255.6 6,042.2 -216.2 5,826.0 92.1 1,000.6 960.0 925.8 1906-1910 7,411.4 318.8 7,092.6 -164.0 6,928.6 93.2 1,093.8 1,046.7 1,022.2 1911-1914 8,828.8 462.8 8,366.0 -520.6 7,845.4 88.7 1,202.1 1,139.2 1,069.6
...................................................................................................................................................................................................
1920-1924 14,350.6 701.0 13,649.6 -844.1 12,805.5 88.8 896.3 852.6 799.2
1925-1929 18,365.0 1,042.4 17,322.6 -893.2 16,429.4 89.5 1,069.8 1,009.1 957.3
1930-1934 19,424.0 1,185.4 18,238.6 -581.7 17,656.9 90.9 1,055.8 991.4 959.6
1935-1939 22,338.4 1,568.0 20,770.4 75.7 20,846.1 93.4 1,143.8 1,063.5 1,067.7
1940-1944 14,872.6 1,237.6 13,635.0 -1,033.1 12,601.9 84.7 1,097.3 1,006.0 930.3
1945-1947³ 10,620.7 1,131.0 9,489.7 -613.9 8,875.8 83.4 672.3 600.7 561.8 .........................,....................................................................................................................................... ................................ 1950-1954 28,375.4 3,243.6 25,131.8 -504.9 24,626.9 86.7 1,699.9 1,505.6 1,475.1
1955-1959 39,869.2 4,676.6 35,192.6 -91.7 35,100.9 88.0 2,240.6 1,978.0 1,972.8 1960-1964 55,652.8 6,893.0 48,759.8 -319.4 48,440.4 87.1 2,976.9 2,608.3 2,591.3 1965-1969 84,700.4 10,697.0 74,003.4 -323.4 73,680.0 87.0 4,350.1 3,800.8 3,784.3 1970-1974 129,653.4 13,318.6 116,334.8 -367.5 115,967.3 89.4 6,270.1 5,625.5 5,607.9
1975-1979 179,123.2 16,415.2 162,708.0 -2,060.2 160,647.8 89.7 8,263.7 7,506.0 7,412.1
1980-1984 211,035.6 26,028.2 185,007.4 -145.8 184,861.6 87.6 9,400.8 8,241.9 8,234.7 1985-1989 234,304.6 34,702.4 199,602.2 2,760.0 202,362.2 86.3 10,215.5 8,703.6 8,823.7
1990-1994 182,433.2 20,034.0 162,399.2 -1,811.0 160,588.2 88.1 7,950.4 7,077.3 6,998.6
1995-2000 183,594.7 20,161.7 163,433.0 -2,508.3 160,924,7 87.7 8,144.8 7,250.4 7,139.1
2001-2005 211,147.2 23,050.8 188,096.4 -4,074.8 184,021.6 87,2 9,684.6 8,627.3 8,439.8
2006-2010 273,437.6 29,366.8 244,070.8 -12,216.8 231,854.0 84,8 12,715.8 11,350.0 10,782.3
Source: Calculated based on Ta ble GDP-Vn 2
Note: ¹1-4 see table GDP - Vn 2
² In column 8, 9, 10 amounts rounded up to units.

205
GDP-Vn 2
Gross domestic product, net domestic product and national income - net national product, total and per capita, comparable currency in ppc dollars 2000, annual series of the 1862-2010 period
Years Gross
domestic product
Consum-ption
Net
domestic
product²
Balance of
the current account³
National income⁴ - Per capita
of
Net national product Gross
domestic product
Net domestic product
National income
fixed capital¹
(col. 2-3)
(col. 4+5)
Share in the gross domestic product
million dollars
million dollars
million dollars
million dollars
million dollars
(col.6/2) %
dollars dollars dollars
1 2 3 4 5 6 7 8 9 10
1862 2,264 70 2,194 102,6 2,296.6 101,4 563 546 571
1863 2,479 73 2,406 45,0 2,451.0 98,9 613 595 606 1864 2,577 74 2,503 147,3 2,650.3 102,8 630 612 648
1865 1,997 74 1,923 56,5 1,979.5 99,1 483 465 479 1866 1,987 77 1,910 56,5 1,966.5 99,0 483 464 478 1867 2,431 78 2,353 30,1 2,383.1 98,0 585 567 574 1868 2,652 82 2,570 250,2 2,820.2 106,3 632 612 672 1869 2,429 80 2,349 110,5 2,459.5 101,3 572 553 579 1870 2,539 84 2,455 74,5 2,529.5 99,6 591 572 589 1871 2,648 85 2,563 220,0 2,783.0 105,1 611 592 642 1872 2,653 90 2,563 93,9 2,656.9 100,1 610 589 611 1873 2,823 95 2,728 71,7 2,799.7 99,2 648 626 643 1874 2,784 101 2,683 -127,2 2,555.8 91,8 638 615 586 1875 3,237 106 3,131 -56,8 3,074.2 95,0 736 712 699 1876 3,132 102 3,030 28,1 3,058.1 97,6 704 682 688 1877 3,227 108 3,119 -888,1 2,230.9 69,1 720 696 498 1878 3,331 108 3,223 -527,1 2,695.9 80,9 743 718 601 1879 3,413 116 3,297 165,3 3,462.3 101,4 753 728 764 1880 4,264 119 4,145 -350,7 3,794.3 89,0 938 912 835 1881 3,224 120 3,104 -465,7 2,638.3 81,8 697 671 571 1882 4,297 121 4,176 -308,4 3,867.6 90,0 917 891 825 1883 4,029 128 3,901 -717,7 3,183.3 79,0 844 817 667 1884 3,494 123 3,371 -626,5 2,744.5 78,5 719 693 564 1885 4,281 126 4,155 -323,7 3,831.3 89,5 863 838 772 1886 4,822 133 4,689 -413,8 4,275.2 88,7 956 929 847 1887 4,543 138 4,405 -422,4 3,982.6 87,7 889 862 780 1888 4,778 142 4,636 -468,5 4,167.5 87,2 923 895 805 1889 4,854 153 4,701 -621,7 4,079.3 84,0 924 894 776 1890 4,926 158 4,768 -254,7 4,513.3 91,6 926 897 849 1891 5,118 174 4,944 -520,1 4,423.9 86,4 949 917 820
1892 5,564 179 5,385 -651,1 4,733.9 85,1 1,026 993 873 1893 5,434 181 5,253 -539,9 4,713.1 86,7 991 958 859 1894 5,872 188 5,684 -785,2 4,898.8 83,4 1,059 1,025 883 1895 5,921 195 5,726 -491,7 5,234.3 88,4 1,051 1,016 929 1896 6,129 204 5,925 -414,8 5,510.2 89,9 1,073 1,038 965 1897 5,161 199 4,962 -832,7 4,129.3 80,0 891 ,856 713 1898 6,223 214 6,009 -755,8 5,253.2 84,4 1,061 1,025 896 1899 4,397 211 4,186 -1,037,1 3,148.9 71,6 738 703 529 1900 6,086 245 5,841 -199,3 5,641.7 92,7 1,007 966 933

206
Years Gross
domestic product
Consum- ption
Net
domestic
product²
Balance of the
current account³
National income⁴ - Per capita
of
Net national product
Gross domestic product
Net domestic product
National income
fixed capital¹
Share in the gross domestic product
(col. 2-3)
(col. 4+5)
(col.6/2)
million dollars
million dollars
million dollars
million dollars
million dollars
% dollars dollars dollars
1 2 3 4 5 6 7 8 9 10
1901 6,412 243 6,169 -204,4 5,964,6 93,0 1,047 1,007 974 1902 6,293 252 6,041 -104,7 5,936,3 94,3 1,016 975 959 1903 6,522 265 6,257 -126,1 6,130,9 94,0 1,037 995 975 1904 5,101 251 4,850 -603,6 4,246,4 83,2 798 759 664 1905 7,161 267 6,894 -41,9 6,852,1 95,7 1,105 1,064 1,058 1906 7,818 290 7,528 -221,8 7,306,2 93,5 1,187 1,143 1,110 1907 6,402 297 6,105 -47,5 6,057,5 94,6 958 914 906 1908 6,971 317 6,654 -594,6 6,059,4 86,9 1,030 983 895 1909 6,935 333 6,602 -156,3 6,445,7 92,9 1,012 963 940 1910 8,931 357 8,574 199,9 8,773,9 98,2 1,282 1,231 1,260 1911 8,824 426 8,398 -135,1 8,262,9 93,6 1,245 1,185 1,166 1912 9,088 456 8,632 -593,6 8,038,4 88,5 1,256 1,193 1,111 1913 9,211 486 8,725 -411,7 8,313,3 90,3 1,253 1,187 1,131 1914 8,192 483 7,709 -941,9 6,767,1 82,6 1,054 992 871
............................................................................................................................. ..........................
1920 11,826 558 11,268 -1,469,3 9,798,7 82,9 761 725 631 1921 12,960 635 12,325 -1,288,0 11,037,0 85,2 824 784 702 1922 14,638 707 13,931 -538,2 13,392,8 91,5 917 872 839 1923 16,039 764 15,275 -303,6 14,971,4 93,3 990 942 924 1924 16,290 841 15,449 -621,7 14,827,3 91,0 991 939 902 1925 16,660 893 15,767 -689,6 15,077,4 90,5 998 945 904 1926 18,472 979 17,,493 -542,7 16,950,3 91,8 1,091 1,033 1,001 1927 18,671 1,041 17,630 -845,5 16,784,5 89,9 1,089 1,028 979 1928 18,372 1,127 17,245 -1,163,3 16,081,7 87,5 1,056 992 925 1929 19,650 1,172 18,478 -1,225,0 17,253,0 87,8 1,114 1,048 978 1930 19,811 1,190 18,621 -1,143,5 17,477,5 88,2 1,107 1,041 977 1931 20,272 1,168 19,104 -361,1 18,742,9 92,5 1,116 1,052 1,032 1932 18,623 1,141 17,482 -707,6 16,774,4 90,1 1,011 949 910 1933 18,981 1,171 17,810 -285,9 17,524,1 92,3 1,018 955 939 1934 19,433 1,257 18,176 -410,3 17,765,7 91,4 1,027 961 939 1935 21,039 1,393 19,646 321,2 19,967,2 94,9 1,102 1,029 1046 1936 21,892 1,558 20,334 587,0 20,921,0 95,6 1,133 1,053 1,083 1937 22,910 1,647 21,263 861,1 22,124,1 96,6 1,173 1,088 1,133 1938 22,654 1,635 21,019 -796,7 20,222,3 89,3 1,147 1,064 1,024 1939 23,197 1,607 21,590 -594,3 20,995,7 90,5 1,164 1,083 1,053
1940 15,038 1,286 13,752 186,7 13,938,7 92,7 1,132 1,035 1,049 1941 15,533 1,246 14,287 -779,0 13,508,0 87,0 1,146 1,054 997 1942 14,512 1,292 13,220 -1,812,4 11,407,6 78,6 1,066 971 838
1943 16,631 1,342 15,289 -1,701,7 13,587,3 81,7 1,218 1,120 995 1944 12,649 1,022 11,627 -1,059,1 10,567,9 83,5 923 849 771
1945 9,863 1,065 8,798 -599,5 8,198,5 83,1 627 559 521 1946 9,647 1,133 8,514 -639,0 7,875,0 81,6 611 539 499
1947 12,352 1,195 11,157 -603,1 10,553,9 85,4 779 704 666 .......................................................................................................................................................

207
Years Gross
domestic product
Consum- ption
Net
domestic
product²
Balance of the current
account³ National income⁴ - Per capita
of
Net national product
Gross domestic product
fixed capital¹
Share in the gross domestic product
fixed capital¹
(col. 2-3) (col. 4+5) (col.6/2)
million dollars
million dollars
million dollars
million dollars
million dollars
% million dollars
million dollars
1 2 3 4 5 6 7 8 9 10
1950 21,897 2,536 19,361 -607.1 18,753.9 85.6 1,342 1,187 1,150 1951 28,059 3,111 24,948 -469.7 24,478.3 87.2 1,704 1,515 1,487 1952 27,979 3,338 24,641 -713.8 23,927.2 85.5 1,682 1,482 1,439 1953 31,523 3,535 27,988 -603.8 27,384.2 86.9 1,871 1,661 1,625 1954 32,419 3,698 28,721 -130.2 28,590.8 88.2 1,899 1,683 1,675 1955 40,099 4,019 36,080 -269.7 35,810.3 89.3 2,315 2,083 2,067 1956 34,884 4,530 30,354 199.6 30,553.6 87.6 1,995 1,736 1,747 1957 41,495 4,900 36,595 -413.1 36,181.9 87.2 2,327 2,053 2,029 1958 38,947 4,967 33,980 -72.7 33,907.3 87.1 2,157 1,882 1,878 1959 43,921 4,967 38,954 97.4 39,051.4 88.9 2,410 2,137 2,143 1960 48,168 5,719 42,449 336.0 42,785.0 88.8 2,617 2,307 2,325 1961 52,238 6,238 46,000 -103.5 45,896.5 87.9 2,813 2,478 2,472 1962 54,096 6,947 47,149 -569.8 46,579.2 86.1 2,896 2,524 2,493 1963 58,988 7,539 51,449 -500.2 50,948.8 86.4 3,135 2,735 2,708 1964 64,774 8,022 56,752 -759.7 55,992.3 86.4 3,422 2,998 2,958 1965 70,122 8,774 61,348 107.8 61,455.8 87.6 3,685 3,224 3,230 1966 78,007 9,600 68,407 -116.4 68,290.6 87.5 4,075 3,574 3,568 1967 85,570 10,972 74,598 -634.7 73,963.3 86.4 4,437 3,868 3,835 1968 91,988 11,713 80,275 -560.9 79,714.1 86.7 4,664 4,071 4,042 1969 97,815 12,426 85,389 -412.9 84,976.1 86.9 4,888 4,267 4,247 1970 107,592 12,726 94,866 -395.3 94,470.7 87.8 5,312 4,684 4,665 1971 115,570 11,915 103,655 -86.2 103,568.8 89.6 5,646 5,064 5,060 1972 130,348 13,092 117,256 -212.9 117,043.1 89.8 6,308 5,675 5,664 1973 146,695 14,066 132,629 669.3 133,298.3 90.9 7,043 6,368 6,400 1974 148,062 14,794 133,268 -1,812.6 131,455.4 88.8 7,041 6,337 6,251 1975 151,409 14,997 136,412 -394.0 1,360.8 89.8 7,127 6,421 6,402 1976 168,205 15,693 152,512 54.4 152,566.4 90.7 7,843 7,111 7,114 1977 178,309 16,477 161,832 -211.3 161,620.7 90.6 8,233 7,472 7,462 1978 194,780 17,105 177,675 -3,805.3 173,869.7 89.3 8,912 8,130 7,,956 1979 202,913 17,804 185,109 -5,944.7 179,164.3 88.3 9,203 8,396 8,126 1980 198,465 20,687 177,778 -4,477 17,3301 87.3 8,939 8,008 7,806 1981 198,606 24,586 174,020 -1,409 17,2611 86.9 8,885 7,785 7,722 1982 206,650 24,964 181,686 1,274 18,2960 88.5 9,194 8,083 8,140 1983 219,220 29,764 189,456 1,777 19,1233 87.2 9,720 8,400 8,479 1984 232,237 30,140 202,097 2,106 20,4203 87.9 10,265 8,933 9,026
1985 232,024 31,503 200,521 1,701 20,2222 87.2 10,211 8,824 8,899 1986 237,399 29,863 207,536 1,709 20,9245 88.1 10,402 9,093 9,168 1987 239,415 34,418 204,997 2,503 20,7500 86.7 10,437 8,936 9,045 1988 238,305 38,303 200,002 4,806 20,4808 85.9 10,337 8,675 8,884 1989 224,380 39,425 184,955 3,081 18,8036 83.8 9,692 7,989 8,122

208
Years Gross
domestic product
Consum- ption
Net
domestic
product²
Balance of
the current account³
National income⁴ - Per capita
of the
Net national product
Gross domestic product
fixed capital¹
Share in the gross domestic
fixed capital¹
(col. 2-3) (col. 4+5) (col.6/2)
million dollars
million dollars
million dollars
million dollars
million dollars
% dollars dollars dollars
1 2 3 4 5 6 7 8 9 10
1990 211,813 2,3260 188,553 -3,963 184,590 87.1 9,127 8,125 7,954
1991 184,409 2,0251 164,158 -1,265 162,893 88.3 7,954 7,080 7,026
1992 168,096 1,8459 149,637 -1,916 147,721 87.9 7,376 6,566 6,482
1993 170,599 1,8735 151,864 -1,439 150,425 88.2 7,497 6,674 6,611
1994 177,249 1,9465 157,784 -472 157,312 88.8 7,798 6,941 6,921
1995 189,867 2,0851 169,016 -2,174 166,842 87.9 8,371 7,452 7,356
1996 197,436 2,1682 175,754 -3,150 172,604 87.4 8,733 7,774 7,635
1997 185,390 20,358 165,032 -2,619 162,413 87.6 8,223 7,320 7,204
1998 176,530 19,386 157,144 -3,637 153,507 87.0 7,845 6,983 6,822
1999 174,372 19,149 155,223 -1,800 153,423 88.0 7,764 6,912 6,832
2000 177,973 19,544 158,429 -1,670 156,759 88.1 7,933 7,062 6,987
2001 187,940 20,418 167,522 -2,179 165,343 88.0 8,387 7,476 7,379
2002 197,728 21,152 176,576 -1,478 175,098 88.6 9,120 8,144 8,076
2003 208,584 22,591 185,993 -3,268 182,725 87.6 9,598 8,558 8,408
2004 226,026 25,200 200,826 -5,822 195,004 86.3 10,429 9,266 8,998
2005 235,458 25,893 209,565 -7,627 201,938 85.8 10,889 9,692 9,339
2006 254,501 27,150 227,351 -11,004 216,347 85.0 11,791 10,533 10,023
2007 271,943 27,681 244,262 -19,115 225,147 82.8 12,627 11,342 10,454
2008 294,901 31,070 263,831 -19,489 244,342 82.9 13,714 12,269 11,363
2009 274,078 30,998 243,080 -5,589 237,491 86.7 12,766 11,322 11,062
2010 271,765 29,935 241,830 -5,887 235,943 86.8 12,681 11,284 11,009
Source: V. Axenciuc, Romania’s Gross domestic Product, 1862-2000, 1st volume, table A 2, Bucharest 2012. Note: ¹V. Axenciuc, quoted, table A21.
²Resulted from the deduction of fixed capital consumption from the GDP.
³See Tables Balance I2, II1, III1.
⁴Net domestic product + current account balance.
⁵The averages of the years the indicators per capita for columns 8, 9, 10 are rounded up to units.
209
PART TWO
GDP history, relevance and limitations
1. GDP and National Accounts
1.1 Brief history of National Accounts
The first attempts to estimate the National Accounts dates back to the seventeenth
century, being attributed to William Petty (167661) who, in the assessment of income and
wealth at the personal and national levels included components such as land, ships, housing
and other real estate, recommending that taxes to be paid in other ways than gold and silver,
as a result of the increase in fiscal capacity of England, at that time, engaged in a war with
the Netherlands.
A century later, Adam Smith (177662) introduced the idea that the wealth of a nation is
based not only on activities in agriculture and mining, but the domestic production should
include also manufacturing activities, although without providing a concrete way of
measuring wealth (or production). After another century of economic thought evolution, in
the late of 1800s, the neoclassical approach of welfare, particularly through the work of
Alfred Marshall (189063), recorded significant progress towards a more rigorous conceptual
and terminological framework of economics (defining supply and demand, marginal utility,
costs of production, market value or price), including notions on production metrics.
In terms of measuring the aggregate economic activity, domestic production and the
development of econometrics, in the 1930s, the work of Colin Clark (193264) in the United
Kingdom and Simon Kuznets (193465) in the United States made a major contribution. The
latter, at the request of US Congress, has developed a uniform set of National Accounts,
considered the prototype of what was to be transformed afterwards into a system of standards
at international level.
John Maynard Keynes (193666) had a revolutionary approach to economic thought in
the interwar period. In his macroeconomic vision, based on the primacy of demand and an
active role of the state in moderating the economic cycles fluctuations (boom and bust),
61W. Petty, Essays on Mankind and Political Arithmetic, Project Gutenberg, transcribed from the Cassell & Co. edition by David Price, London, 2014 (First edition: 1676). 62 A. Smith, An Inquiry into the Nature and causes of the Wealth of Nations, Edited by S.M. Soares, Metalibri edition, London, 2007 (First edition: 1776). 63 A. Marshall, Principles of Economics, Palgrave Macmillan, London, 2011 (First edition:1890). 64 C. Clark, The National Income 1924-31, Frank Cass & Co Ltd, london, 1965 (First edition: 1932). 65 S. Kuznets, National Income, 1929-1932, 73rd US Congress, 2d session, Senate document no. 124, 1934. 66J.M. Keynes, The General Theory of Employment, Interest and Money, Palgrave Macmillan, London, 2007 (First edition: 1936).
210
including the US post-crisis recovery after the '30s Great Depression and the World War II,
the use of new tools of National Accounts was of crucial importance.
Following the theoretical and methodological improvements in the National Accounts
framework, including the Gross Domestic (or National) Product measurement, not without
disputes and confrontations of views67, subject on which we shall further return, the growing
complexity of economic phenomena and the increasing difficulties encountered by the
decision makers in the design, monitoring and implementing specific policies, exacerbated by
crises or wars, have imposed the necessity of amending the macroeconomic tools, associated
with more clear indicators and methodologies, both nationally and internationally agreed.
Shortly after the establishment of the United Nations in 1947, a committee of experts
from the Statistics Commission, under the leadership of the British economist Richard Stone68
(Nobel laureate for economics in 1984) delivered a report on National Accounts, containing
principles and methodological recommendations of compiling them, in order to ensure also
the international comparability of data. This report is considered as substantiating the first
version of National Accounts (System of National Accounts - SNA) drafted in 1953 by the UN
Statistical Commission, which included a set of 12 standard tables, designing a detailed
classification of flows in the economy, appropriate practically for all countries in the world.
After slight revisions done in 1960 and 1964, the SNA was considerably extended in
1968, by adding input-output tables, methodological changes that allowed the estimates of
indicators in constant prices being also operated. Subsequently, the SNA was reviewed in two
stages, namely in 1993 by harmonizing National Accounts with other international standards,
and in 2008, by updating and adapting, somewhat late in our opinion, to the changes in the
global economic environment.
It is worth mentioning that these revisions were coordinated by a working group
including experts from five institutions of international importance, namely the UN, IMF,
World Bank, European Union (Eurostat) and OECD, that aimed at developing a reference
67In the context of multiple critics over time about the limitations of GDP as a measure of macroeconomic performance (between them, Nobel Prize winners for economics as Daniel Kahneman, Robert Solow, Joseph Stiglitz, Amartya Sen, Muhammad Yunus) it should be pointed out that Kuznets himself, in arguing the utility and interpretation of the indicator, in 1934, made some remarks about its shortcomings, warning that the welfare of a nation can scarcely result by measuring the national income. Moreover, in 1962, returning to the subject, Kuznets mentioned that one have to distinguish between the quantity and quality of growth, and between the short-term and long-term, and, in case of establishing a specific objective of economic growth, its type and purpose requiring to be clearly specified (European Parliament, Alternative progress indicators to Gross Domestic Product as a Means Toward Sustainable Development, EP, Policy Department, Brussels, 2007, p. 12). 68United Nations, Measurement of National Income and the Construction of Social Accounts (Appendix: Definitions and Measurement of the National Income and Related Totals by Richard Stone), Studies and Reports on Statistical Methods, No 7, UN, Geneva, 1947.
211
framework of definitions, standards, classifications and accounting rules, e.g. a unified
statistical toolkit, able to ensure a consistent set of macroeconomic accounts in order to satisfy
the information needs of policy making, analysis and research.
The SNA international standards, although just recommended and not mandatory,
were adopted by most countries, with some exceptions, for reasons that are rather related to
the economic development level and/or the type of political regime (many countries on the
African continent, North Korea, Cuba).
At the European Union level, the SNA standards were adapted to the structures of
Member Countries, under the European System of Accounts (ESA), established in 1995
(according to the SNA 1993) and revised in 2010 (according to the SNA 2008).
It must be emphasized that, in accordance with the European Parliament Regulation
No. 549/2013, the reporting and publication of National Accounts data, based on the
methodology envisaged by ESA 2010 standard, became mandatory for the Member States in
September 2014.
The necessity of these last amendments was generated by the accelerating
globalization, the fragmentation of the world production and the expansion of international
value-added chains led, mainly, by the multinational companies, the increased cross-border
movement of persons, goods, services, capital, information and the increasing interconnection
of national economies, as well as the financial markets, dramatically highlighted by the global
crisis triggered in 2008, with rapid spillover effects around the entire world.
It was found that these new phenomena induced by the globalization have affected the
relevance of traditional indicators, including those based on the National Accounts,
introducing distortions that have damaged the quality of data and their correspondence with
real phenomena in the world economy, directly impacting on their usefulness in decision
making and having to be corrected by revising the existing international standards and
introducing new ones to compensate the lack of information and the emergence of so-called
data gaps69.
Furthermore, we will briefly focus on some major effects of the 2008-2009 global
crisis upon the macroeconomic and financial concepts and approaches.
69 United Nations, The Impact of Globalization on National Accounts, UN-ECE, Geneva, 2011.

212
1.2 Effects of the global crisis on macroeconomic and financial concepts
The shock of the global crisis of 2008-2009 highlighted, in a dramatic manner, the
need for another conceptual and methodological approaches to macroeconomic and financial
stability, fundamentally different, with effects on GDP relevance, including its interpretation
paying maximum analytical attention of the related data.
One of the most important changes has been generated by the observation that a crisis
triggered on a financial market niche (the sub-prime mortgage market in the US), appreciated
as having an insignificant dimension compared to the overall American financial system,
could be transmitted extremely fast, by contagion effects, in an interconnected global context,
on a large number of markets around the world, which imposed, among others, new
connotations regarding the definition and assessment of the systemic risk70.
In general, the systemic risk is considered as referring to the failure in complying with
the obligations, financial or other, of one participant in the system, which has led to the failure
of meeting the commitments of another participant, thus jeopardizing the stability of the entire
system. From this definition it follows that the systemic risk is associated with all and,
respectively, each system / subsystem related to the functioning of global markets
mechanisms and can be validated at the local level too, in the sense of countries or group of
countries with a major influence on the financial balances and the world economy. For
instance, as concerns G-20, a number of 10 countries are listed as having systemically
important financial sectors.
In terms of financial stability, the systemic risk is associated with the possibility of
occurrence, suddenly and unpredictably, of an event that causes a loss of economic value or
confidence in an important area of the financial system, with significant adverse effects on the
real economy, under the circumstances of the absence of strong and immediate responses
from policy makers or policy-led authorities.
If this definition may be categorized as having an abstract substance, the
operationalization of evaluating and monitoring the systemic risk represents a challenge that,
at least so far, the academic world and the regulatory national and / or international
institutions, have failed to agree on the adequate solutions. In practice, a number of indicators,
simple or aggregated, both in the category that have the ability to report phenomena having a
crucial role in triggering previous crises (as the widening of current account deficits) and new
70 Gerlach S., Defining and measuring systemic risk, Economic and monetary affairs, European Parliament-DGIP, November, 2009.

213
indicators, with a more complex nature (as the interbank network connections), which implies
immediate data access and the use of sophisticated methods and models to process them for
assessing and monitoring the credit risk or the default contagion risk.
In order to manage, supervise and assess the systemic risk, on the occasion of G-20
meeting in April 2009, it was decided to establish a Financial Stability Board (the successor to
the Financial Stability Forum), which was confirmed at the important summit at the level of
heads of state held in September 2009 (Pittsburgh, USA). The Financial Stability Board
(FSB) has its own Charter and organizational structure, with the essential task of promoting
the reform of international financial regulations. In January 2013, this multinational board
was set up as a non-profit organization based in Basel, under Swiss jurisdiction.
The structure of the FSB is extremely complex, comprising, at the level of G-20
member countries, the national authorities responsible for financial stability (ministries of
finance / treasury, central banks, supervision agencies / committees), international
organizations (EU, OECD), regulatory or financial institutions (IMF, World Bank, BIS),
international financial markets committees / associations in specific sectors, involved in
developing standards and best practices.
Despite certain progress (mainly, the implementation of Basel III standards in the
banking system), as stated in the last report of the G-20 FSB71, a number of inconsistencies in
critical areas concerning, in particular, the implementation of resolution mechanisms, the
reform of OTC (over-the-counter) derivatives, the prevention of new risks and vulnerabilities
arising from changes in the structure and liquidity of markets, the financial institutions
misconduct (especially at the level of top management) etc. is still maintaining.
Reducing the risks to financial stability, as clearly stated in the FSB report's
conclusions72, depends on the improvement of information quality, the transparency and due
time they are made known, in such a way as to allow economic and financial actors to
understand and better manage the risks and the sudden changes occurring in the markets.
In this regard, starting from the IMF / FSB report presented in November 200973, on
the financial crisis and the scarcity of information, the G-20 have launched the Data Gap
Initiative (DGI) and a multiannual action program, which includes 20 recommendations
aimed to recover the situation regarding the lack of information in four major areas: risk
71 Financial Stability Board, Financial Reforms – Achieving and Sustaining Resilience for All, FSB Report to the G20, November 9, 2015, p. 4. 72Idem, p. 7. 73The Financial Crisis and Information Gaps, Report to the G-20 Finance Ministers and Central Bank Governors, Prepared by the IMF Staff and the FSB Secretariat, October 29, 2009.

214
assessment in the financial sector; cross-border financial links; vulnerability of the domestic
economy to external shocks; improving communication of official statistical data.
At the international level, the DGI was coordinated by an inter-agency group chaired
by the IMF and including BIS, ECB, Eurostat, OECD, UN and World Bank.
On the occasion of the Global Conference on the DGI progress held in June 2014, the
representative of the IMF Statistics Department, He Qi74, said that, virtually, in all four major
areas of interest, the conceptual and statistical framework needs to be developed further and,
more important, despite the existence of this framework, efforts should be focused on
collecting data on financial soundness indicators, CDS (Credit Default Swap), housing market
prices etc., and on improving the communication of official statistical data regarding key
global indicators (PGI - Principal Global Indicators)75.
Clearly, one of the most important indicators which is seeking to eliminate the lack of
information is the GDP, including its detailed breakdown on the demand side (expenditures
method).
The inter-agency group is trying to contribute to the improvement and implementation
of common standards also regarding the methodology based on purchasing power parity
(PPP), the harmonization and dissemination of real estate market price indices etc.76.
Since a detailed analysis of methodological changes suffered by SNA over time
exceeds the objectives of this paper, we focus further on the main changes of the ESA 2010
standard compared to 1995 edition, and their effects on the GDP revision at the European
Union level.
1.3 Methodological changes of ESA 2010 and the impact on GDP revision
The new ESA 2010 standard imposed a series of conceptual adjustments in the
framework of the National Accounts, in its scope and coverage, also by the expansion of
quarterly and regional accounts, and the introduction of new chapters concerning the satellite
accounts, of the public administration and the rest of the world.
Summarizing, the main changes relate to:
74 He Qi, G-20 Data Gaps Initiative, IMF/FSB Global Conference on the G-20 DGI-Progress in Five Years, June 25-26, Basel, Switzerland, 2014, p. 5. 75 A database managed by the IMF, designed to provide comparable data to the G-20 member countries, of high quality and easily accessible, including over 100 indicators covering the real sector, external sector, financial sector, public finances, public debt, inflation, exchange rate etc. 76 International Monetary Fund, Recent Developments and Current Initiatives, Statistics Department, IMF, Washington, 2012, pp. 24-25.

215
- reclassifying Research and Development (R&D) expenditures from intermediate
consumption to gross fixed capital formation, materialized in intellectual property assets, to
be recorded in a satellite account;
- reclassifying expenditures for weapons systems from intermediate consumption to
gross fixed capital formation;
- changing the methodology for the financial services assessment by introducing the
analytical concept of capital services, registered separately, as a component of the value
added;
- redefining the financial assets, by including a wider coverage of the financial
derivative contracts;
- introducing new rules for pension funds registration, by including the entitlements
and associated flows for all public and private pension schemes;
- changing the registration of purchases and resale of goods subject to processing in
the same country or abroad, according to the "change in economic ownership" principle;
- redefining the regime of the financial companies, mainly on "special purpose
entities" type, the public-private partnership, the dividends paid by the public corporations,
the credit guarantees;
- introducing new accounting rules for the registration into the GDP of illegal
activities (prostitution, production and smuggling of drugs, alcohol, tobacco).
Nominal GDP (thousand billion euro) ESA 2010 compared to ESA 95, in 2000-2013
Figure 1
Source: Eurostat Statistics Explained,Annual national Accounts – how ESA 2010 has changed the main GDP aggregates, 2015.

216
In accordance with the preliminary Eurostat estimates published in 201477, the
implementation of ESA 2010 and the review of the figures for the period 1997 to 2013
resulted in a significantly higher nominal GDP, by 3.5% on average annually over the whole
EU-28 for the entire period, compared with the estimations of the ESA '95 methodology,
mentioning also a limited impact on the GDP growth rates.
As shown in Figure 1, in terms of nominal GDP, the differences between the two
methodologies, in absolute terms, ranged from 250 billion euro to almost 400 billion euro
annually at the EU-28 level, throughout the period 1997-201378.
These significant differences following the revision of GDP figures according to ESA
2010 were caused both by methodological changes and statistical improvements, the latter due
to the use of new data sources, mainly as concerns the estimation of illegal activities.
In 2010, in some countries, where the differences in the GDP levels estimated under
ESA 2010 compared to ESA '95, were significant, comparing also with the average of +2.3%
registered at the level of EU-28 (Sweden: +5.5%; Finland: +4.7%), they are explained, almost
exclusively, through the impact of methodological changes, mainly due to the reclassification
of expenses for Research and Development (see Table 1).
Table 1
The impact of methodological changes and statistical improvements in several EU countries in 2010
- % of GDP -
Source: Eurostat, First estimation of European aggregates based on ESA 2010, Eurostat News Release no 157/2014 - 17 October, 2014, p. 4.
77 Eurostat, First estimation of European aggregates based on ESA 2010, Eurostat News Release no 157/2014, 17 October, 2014. 78For the US, the data revision according to SNA 2008 led to a higher nominal GDP by nearly 4%, while in the case of China it was estimated that the impact of methodological changes on GDP stood at 16% (Independent Evaluation Office, Behind the scenes with data at the IMF: an IEO evaluation, IEO-IMF, Washington, February 25, 2016, p. 8).
Country Difference (GDP increase)
Methodological changes
ESA 2010
Statistical
improvements Total Total out of which: R&D
EU-28 3.7 2.3 1.9 1.4
Bulgaria 2.0 0.4 0.3 1.6
Czech Republic 4.3 3.1 1.2 1.2
Cyprus 9.5 1.1 0.2 8.4
Finland 4.7 4.2 4.0 0.5
Netherlands 7.6 1.7 1.7 5.9
Poland 1.5 1.2 0.5 0.2
ROMANIA 1.9 0.6 0.5 1.3
Sweden 5.5 4.4 4.0 1.1

217
In other countries (the Netherlands: +7.6%; Cyprus: +9.5%) the differences are due
mostly to the impact of statistical improvements. In this context, it is worth mentioning that,
the revision by Eurostat of Romania's GDP, showed a difference of +1.9% in 2010, of which
+0.6% on the account of methodological changes, and +1.3% due to statistical improvements.
Beside the illegal activities, that continue to encounter major difficulties for an
adequate registration, a study of Bruegel79 pointed out that a significant influence on GDP
estimations has the legal hidden economy (legal shadow economy) defined as referring to the
production and services carried on so-called "black" (or "gray") market.
To these, the tax evasion, which has reached alarming levels, exacerbated by tax
optimization practices and intra-group pricing transfer, mainly by the multinationals or their
subsidiaries is added. It is estimated that, in 2013, the informal economy accounted for over
20% of GDP in countries like Italy, Greece, Cyprus, Lithuania, Latvia and Slovenia80. For
Romania, the non-observed (hidden) economy was estimated at 28.4% of GDP by a report of
the European Commission published in 2013, which was double compared to the EU-27
average (e.g. 14.3%), noting that half of it was caused by the undeclared work, especially due
to the high tax burden on labor81. In some emergent countries (India, Philippines) the share of
the hidden economy is significantly higher, ranging between 40% and 50% of GDP and, in
other countries, usually less developed (many African countries and some from Latin
America) even exceeding 50% of GDP82. The Implementation Guide of SNA 2008 prepared
by the UN experts, in the chapter on time series, revisions and statistical discrepancies, was
drawing attention on the fact that, in most cases, the published data cover a historical period
of 10-15 years, while the macroeconomic quantitative modeling principles and methods
require the use of longer time series, up to 50 years83.
Under the circumstances of increased uncertainty and lack of reliable data, based on
the evolution of real phenomena, the quality of macroeconomic forecasts, as essential tools in
the management of policies and the orientation of international financial markets, has
deteriorated, both globally and at the regional and country levels, the time intervals for their
revision from the responsible institutions becoming smaller and the corrections, in most cases,
bigger.
79S. Merler, P. Huttl, Wellcome to the dark side: GDP Revision and the non-observed economy, Bruegel, February 26, 2015. 80OECD, Base Erosion and Profit Shifting Project, Final Reports, OECD Better Policies for Better Lives, Paris, 2015. 81European Commission, Tax reforms in EU Member States 2013 Report, EC Brussels, 2013, p. 78. 82Countries with the biggest shadow economy, Bloomberg, USA, 2016. 83United Nations, System of National Accounts 2008, UN, New York, 2009, p. 395
218
2. GDP relevance and limitations
2.1 Major methodological inconsistencies in estimating GDP
The conceptual consistency of the three methods for estimating GDP (output,
expenditures and incomes approaches) does not always correspond to the effective means of
compiling data, due to the diversity of sources, especially for exports and imports of services.
Any error in each of these methods is leading to differences, which, necessarily, have to be
published as “statistical discrepancies”, but, in practice, it does not often happen84.
The average user will encounter many difficulties to realize, unless the explicit size of
statistical discrepancies is made known, if they do not exist, or merely they have not been
published, so his degree of attention to this issue needs to be the highest, in order to ascertain
a benchmark on the data accuracy.
Beside the statistical distortions occurring mainly because of measurement errors of
exports and imports of services, the accuracy of GDP data is affected also by the substitution
of the lack of direct sources for data with estimates, such as the case of some expenditures of
the central and / or local government, the fixed capital depreciation, the interest paid /
received, some emergent activities (Internet, purchase of software, mobile phone services etc.)
in rapid expansion.
Another major methodological inconsistency of GDP estimates is generated by the
consumption of goods and services in-kind, associated, mainly, with the household sector and
the subsistence agriculture.
Although they should be included in National Accounts, the transfer of such goods and
services among resident households escapes, usually, to statistics, which have more
significant effects in countries where the non-fiscalized economy has a more important size.
Assessing the households’ self-consumption in rural areas, which, in many countries,
has a significant dimension, shows a high degree of approximation, both due to the difficulties
of estimating the contribution of product inventories from the previous period, taking into
account the seasonality of production, and the use of relative prices associated to the principle
of nearest local market, including the related transportation costs.
In Romania, the share of self-consumption in GDP is relatively high, although
registering a downward trend in recent years, namely from 13% in 2004 to 6.4% in 2011 and
84 In the case of USA, which published the statistical discrepancies, these are significant, in the years 2014 and 2015 being around 200 billion dollars and representing more than 1% of GDP (Bureau of Economic Analysis, Gross Domestic Product: Forth Quarter and Annual 2015, BEA News release, US DC, March 25, Washington, 2016, p. 14). In the case of Romania, except for seasonal GDP adjustments, the National Institute for Statistics does not specify the statistical discrepancies.

219
about 5% in 2014, with the mention of the difference ranging from simple to triple between
this ratio in rural and urban areas respectively85.
In the category of goods and services produced in households for their own
consumption the construction / expansion of dwellings, shelters for livestock, warehouses for
grains, domestic services for own consumption etc. are also included, making virtually
impossible the exhaustive and accurate measurement of the entire self-consumption.
Another methodological problem is generated by the inclusion in the households final
consumption of the imputed rent for owner-occupied houses or the market rent collected /
paid for rented houses, especially if the proportion of dwellings for rental is high and the real
estate market has a high degree of stratification / segmentation (e.g. urban / rural, major
regional disparities in the standard of living86), as is the case of Romania.
The GDP limitations arise also from the fact that non-market activities escape National
Accounts records. Despite many attempts, there is no consensus on the valuation of
homework (noted also as unpaid or non-market housework, sometimes as household
production) e.g. some domestic activities, especially in the category of services, such as meal
preparation, house cleaning, washing, children care and elderly care etc.
Some studies have revealed a monetary value of domestic work estimated at
percentages between 30% and 50% of GDP during 1970-1990 in countries like USA,
Germany, France and Canada87.
More recent calculations have pointed out that, in the US, the value of domestic work
accounted for 26% of GDP in 2010, compared to 39% in 196588.
In most of the EU Member States, the household production was estimated at figures
between 20% and 40% of GDP89.
Even if the numbers have a certain degree of approximation, the downward trend in
the share of GDP of the housework value is consistent with the increase in the development
level, reflecting the more and more domestic activities transition to the market services.
Although the idea dates back to the 1970s90, only recently, at the UN level, a
development in the context of national accounts has been agreed, the extended (satellite)
85 National Commission of Prognosis, The projection of main macroeconomic indicators, CNP, Bucharest, September, 2010 and November 2012, 2015. 86 United Nations, idem, p. 466. 87A. Chadeau, What is households non-market production worth?, OECD Economic Studies, No 18, Spring, 1992, pp. 85-103 88B. Bridgman, A. Dugan, M. Lal, M. Osborne, S. Villones, Accounting for Household Production in the National Accounts, 1965–2010, BEA Survey of Current Business, May 2012, pp. 23-36. 89V. Miranda, Cooking, Caring and Volunteering: unpaid work around the world, OECD Social, Employment and Migration Working Papers, 3 March, 2011, p. 30.

220
accounts for highlighting the accounting of non-market activities, especially of social and
environmental nature, that can be important growth factors, including capital and household
services and unpaid household work.
At the EU level, despite some progress, the record of these activities in satellite
accounts is still in the phase of methodological debates, the reconciliation of data and their
proper integration remaining a difficult challenge91.
These methodological deficiencies, whose persistence, through a multiplier effect, lead
to considerable margins of error in measuring GDP at national level, are multiplied by
international comparisons, which implies the figures conversion into a single currency
(usually US dollars or euro, time series in constant prices) by using increasingly volatile
exchange rates and / or by using specific methodologies in virtual currencies (PPP, PCS) that
take into account the purchasing power parity, in order to ensure the comparability of data.
A more detailed discussion on the matter related to the data comparability shall be
made further, where the evolution of the GDP in Romania during the last 150 years, including
various international comparisons will be analyzed.
2.2 Criticisms of GDP
The criticisms of GDP are manifold, some of their roots being fundamentally different,
but having an interfering area, which, in the attempt - often apparent - of harmonizing them,
seems to have drifted on the land of speculations, farther from the frontiers of real phenomena
knowledge that face the contemporary world and their dynamics understanding, making
almost invisible and, therefore inoperative, the maneuver room in correcting the adverse
effects and, respectively, in their orientation towards the desirable objectives of development
at the national, regional, continental and global levels.
One of these roots has, as origin, the hegemony of the economic thought after the
Second World War, e.g. the approach based on growth (growth-centric thinking), prevailing
until the '90s, which had, among the adverse implications, the politicization of GDP, by
diverting its meaning and function, essentially economic, and assigning it an untouchable
nature, which stemmed from the fear that, granting a greater consideration, otherwise rightful,
to other factors (the environment for example) would have meant taking decisions with
90W.D. Nordhaus, J. Tobin, Is Growth Obsolete?, Cowles Foundation Discussion Paper No. 319, Yale University, 1971. 91Eurostat, Review on National Accounts and Macroeconomic Indicators, Eurostat 1/2014, p. 25.

221
potential political complications, requiring legislative changes, revising the economic,
monetary and fiscal policies, that would suppose increases in government expenditures.
Thus, despite clearer evidences of its limits, the GDP has become a standard of
success or failure, the singular measure indicating the course of the development progress,
opposed to the gradually increase in the complexity of social and economic issues under the
circumstances of more interconnected global markets, diverting and concentrating the
attention of all stakeholders and decision makers in one direction only.
At the level of the public perception, it has been induced, by "omniscient" officials,
maybe deliberately, the idea that GDP has the ability to compress the diversity and immensity
of an economy, condensing into a single measure all phenomena of any kind, which occurs
within an area, at national or global levels92.
Moreover, it has witnessed the foundation and strengthening, per se, of a "reversed"
logic of the development process, namely, in terms of market economy, rule of law and
democracy, by converting GDP, from a means of increasing the population wellbeing, to an
end in itself, acting sometimes as a campaigner agent during the general elections, rendering
absolute the assessment of the measure in which this policy target is being reached with the
real performances of the economy, implicitly, as result of the political power in office93.
This new paradigm, in a political interpretation, most often wrong, generates the
manipulation of voters on the basis of flawed promises (economic growth, employment
creation, social assistance etc.) without a real foundation, and, into an economic approach,
that could be merely validated, influences, in a decisive manner, the investors decisions and
the financial flows on capital and / or goods markets and, to some extent, the national and
international policies94.
An example of an arbitrary manipulation of GDP, its conversion to political ends and
distorting the realities, occurred just in Romania during 2007-2008, preceding the economic
92J. Gertner, The Rise and Fall of the G.D.P., The New York Time Magazine, May 13, 2010. 93The intentional manipulation is often a case of Goodhart’s Law, the popular formulation of which is “When a measure becomes a target, it ceases to be a good measure”. Goodhart’s Law (named after an economist who was a member of the Bank of England’s Monetary Policy Committee) refers to the vulnerability of a statistical indicator to manipulation once it is used to define a policy target (Independent Evaluation Office, Behind the scenes with data at the IMF: an IEO evaluation, IEO-IMF, Washington, February 25, 2016, p. 8). 94It is noteworthy in this respect, the confidentiality surrounding the GDP estimates before being officially communicated (usually quarterly) and the absolute ban for those holding such information to disclose them before exiting the embargo, especially in the cases of systemically important countries for the global economy. For example, in the US, a team of analysts from BEA (Bureau of Economic Analysis, under the Department of Commerce), after finalizing the figures on GDP in a completely isolated room (lock-up room), these are sent in a sealed envelope to the chief of economic advisers at the White House, who, after informing the US President, retransmits them to the BEA, the next day following to be communicated officially by a press conference (Ibid).

222
and social effects caused by the global crisis of 2008-2009, but which, more likely, have even
exacerbated them. Examining the contribution of Romania's GDP growth factors on the
demand side (Table 2) it was found an atypical macroeconomic picture during 2007-2009,
marked by major structural changes in only three years, i.e. from a situation that seemed
favorable (high GDP growth rates in 2007 and 2008) to one of extreme fragility (GDP decline
by 7.1% in 2009).
Table 2
Contributions to GDP growth in Romania and other macroeconomic indicators
in 2007, 2008 and 2009
- percent -
Source: based on data from International Monetary Fund, National Commission for
Prognosis, National Bank of Romania.
It is worth mentioning that, in 2009, Romania was saved from a financial collapse only
by resorting to the external assistance from the IMF and the EU (amounting to 20 billion
euro), procured under conditions of extreme emergency. Without going into details, just
noting that this slippage, apparently from one extreme to the other, occurred amid a major
imbalance between the domestic demand (+15.7%) and the external demand (net exports
contribution of -9,5%) in 2007, witnessing an unsustainable increase in GDP in 2007 and
2008, based less on the gross capital formation (helped anyway by the massive inflows of
Foreign Direct Investments up to 2008) but mainly on the increase in final household
consumption, fueled by the wage rises and the consumer credit boom, under the
circumstances of budget deficits widening and of the trade and current account deficits.
The fact that the increase in consumption and, therefore, in generating economic
growth, was unsustainable is proved by its transformation from the factor with the biggest
contribution to the GDP growth (+8.2% and +7.5% in 2007 and 2008 respectively) in the
Years 2007 2008 2009
Gross Domestic Product 6.2 7.3 -7.1
Internal demand 15.7 8.2 -14.4
Final Consumption 8.2 7.5 -6.7
Gross Fixed Capital Formation 7.5 0.6 -7.7
External demand (net exports) -9.5 -0.8 7.3
Other macroeconomic indicators (% of GDP) Balance of consolidated budget -3.1 -4.8 -9.1
Current account balance -13.4 -11.6 -4.2 Foreign Direct Investments (net) 5.7 6.7 3.0

223
determinant of GDP decline in 2009 (a negative contribution of 6.7%), offset partially, in an
atypical manner for the Romanian economy, by the hyper-positive contribution of net exports
(+7.3%), due, in fact, to the fall in imports of goods (38.9 billion euro in 2009 compared to
57.2 billion euro in 2008) and reversing, in a shock-type manner, the ratio between the
indexes used for calculating this contribution.
The Romanian authorities, placed in an election year in 2008, rendering absolute the
figures showing high GDP growth rates, without an analysis of its factors, which would have
identified specific vulnerabilities, have pushed the government expenditures to excessive
levels, especially due to significant wages growth, leading in 2009 to a record budget deficit,
accounting for 9.1% of GDP. In June 2010, according also to the conditionality regarding the
decrease in the ratio of budgetary sector wages to GDP, stipulated in the IMF-EU agreement
for financial assistance concluded in 2009, the public finances recovery imposed severe
austerity measures, including the wage cutting by 25% in the budgetary sector, which have
had severe economic and social effects, some of them being felt until today.
On the other hand, the authorities have not adopted the most appropriate monetary
policy in order to mitigate the momentum of lending (the increase, in 2006, in the reserve
requirements ratios to 40% on forex-denominated liabilities of credit institutions and to 20%
on those in leu-denominated, in order to contain the credit expansion, has proved detrimental)
and did not properly perceived the dangers of a real estate bubble occurring, as well as the
severity of external financial imbalances impact, stressed by the global financial crisis
triggered in September 2008, which affected, directly and indirectly, the banking system in
Romania, dominated by foreign-capital banks, has not been anticipated95.
Therefore, a radical change in the aggregate demand composition, happened in a
relatively short period of time, as shown in the case of Romania, which reveals rather a
vulnerable economy, especially if the GDP growth is achieved, mainly, by an excessive
increase in consumption.
A sustainable development, even if looked upon through the angle of the evolution of
a single aggregate indicator (GDP), requires a long-term balance between the domestic and
the external demand contribution and also between the domestic demand components, in such
a way that the gross fixed capital formation and, particularly, the investments - private and
public - could spread their spillover effects vertically and horizontally, strengthening the
overall economic growth in time and space.
95 Gh. Zaman, G. Georgescu, Sovereign Risk and Debt Sustainability - Warning Levels for Romania,in: „Non-Linear Modelling in Economics. Beyond Standard Economics”, Expert Publishing House, Bucharest, 2011.

224
Another vulnerability of the economy, unreported by the GDP indicator, even in an
apparently stable configuration and balanced growth factors, stems from the fact that it does
not reflects the degree of indebtedness nor the international investment position of a country,
i.e. the extent to which growth was due to the increase in consumption and / or investments on
the account of internal and / or external loans.
Or, if the rise in the indebtedness degree has not positive effects on raising the
productive capacity of the economy and the added value, also by multiplier effects, the
payments associated to the outstanding debt and / or the volatility of foreign capital may turn
into real barriers to growth.
A significant example in this respect is still the case of Romania, where the public
debt, expressed in euro, increased two times faster than GDP between 2000 and 2015, and
being in the situation as the annual service (representing over 10% of GDP in the last years)
has to be honored mainly by debt refinancing96.
As regards the conceptual shortfalls, it should be mentioned that GDP, taken as such
or per capita, does not reflect inequalities in income distribution and could hide disparities,
both in time and space, which, as shown in some recent studies97 have deepened in recent
years, becoming of high concern at national, continental and world levels, that witnessed an
increase in the degree of poverty, social inequalities and territorial discrepancies, despite the
overall GDP growth.
The attempt to bring goods and services domestically produced in a given period to a
common value denominator, using average or aggregate prices, is somewhat forced, as many
reserves in interpretation due to inconsistencies of estimating the "real" growth by computing
the GDP deflator, which is based on a variable basket of goods and services, corresponding
only approximately to the complex patterns of consumption and investments and their
changes.
The analysis of GDP, both statically and dynamically, is far from be able to provide a
clear picture of the situation and the evolution of an economy, lacking in essential
information, such as those concerning the fixed capital, the material, financial and human
resources, as well as the availability, sustainability and effectiveness of their utilization.
In cases when GDP is taken as a reference, one must not neglect the effects of
distortion on other important derived indicators to which it relates, among them, for example,
the calculations of productivity, the public debt and the annual service, the different
96Idem. 97 T. Piketty, Capital in the Twenty-First Century, Harvard University Press, 2014.
225
components of the budget spending (defense, education, health, R&D), international
investment position etc.
Arguing that GDP still remains the best indicator for measuring the performance of a
market economy, a European Commission document published in 201098, recognizes
explicitly the limits of GDP, especially in terms of its relevance in assessing the progress and
social welfare.
Moreover, it stated that some GDP components can be presumed to imply even a drop
in citizens' wellbeing, such as, for example, increased defense spending, including the related
investments, which absorb some of resources designed for infrastructure development,
education and health.
In this regard, a classic example quoted in the literature, is the hypothetical case, in
which a government decides to build a pyramid, the huge related costs concurring to the
economic growth revealed by the GDP, but having no contribution to the increase in the
population standard of living. On the contrary, it diverts funds that could have been allocated
to activities associated with the wellbeing of citizens99.
Other criticisms of GDP refers to the fact that it does not take into account the impact
of some important factors reflecting the economic and social progress, such as the depletion
of natural resources, the environmental damages, the urban concentration, the rural
depopulation, the social inclusion and, taken as such, it provides no perspective on the
medium- and long-term dynamics100.
In a wider approach, in order to understand the sources of growth, as Nakamura
showed101, the economic theory and the measurement of economic phenomena should be
developed simultaneously, in a correlated and interdependent manner.
Thus, the National Accounts analytical framework, originally built on the basis of
industrial and production structures in the middle of the last century, in terms of consumer
welfare too, should be developed with other indicators, able to reflect the sources of aggregate
growth, and also the intangible assets, as part of individual wellbeing.
98V.A. Areces, Measurement of Progress – beyond GDP, the 86-th Plenary Session, 5-6 October 2010, Committeeof Regions, European Union, ENVE-V-002, Brussels, 28 June, 2010. 99F. Shostack, What is up with the GDP?, Mises Institute Daily, August 23, 2001. 100V. Voineagu, C. Mindricelu, D. Ștefanescu, Beyond GDP – through environmental accounts, Romanian Statistical Journal, No. 6 / 2010, p. 4. 101L.I. Nakamura, Intangible assets and national income accounting, Review of Income and Wealth, Series 56, Special issue1, June, 2010, p. S153.

226
In this context, as mentioned by Nakamura, it should be understood that the GDP
growth rate is totally inadequate for guiding the economic policies in this century, by far too
complex to be guided by the dynamics of a single indicator102.
The work towards the improvement of macroeconomic tools and the development of
new statistical standards, amid the transition from an analytical debate based on accounts to
the one having philosophical connotations, focused on two major directions, namely that of
complementing GDP with a series of other relevant indicators, reflecting better the wellbeing
of citizens, as well as of building a composite indicator that integrates various aspects of the
quality of life.
3. Addressing GDP deficiencies
3.1 Stiglitz-Sen -Fitoussi Commission and its recommendations
Starting from the GDP limitations, in February 2008, at the initiative of French
President, Nicolas Sarkozy, a Commission for the measurement of economic performance and
social progress, led by Joseph Stigliz, Amartya Sen and Jean Paul Fitoussi was set up, in order
to assess the validity of alternative tools and the requirements for the coverage of statistical
information needs, including to ensure the data sources reliability and to identify other
indicators relevant to the progress of society.
In the Commission’ work, more than 20 experts from various international
organizations (UN, OECD, INSEE), and prestigious universities in the world (Harvard,
Princeton, Stanford, Massachusetts, Chicago, Columbia, London School of Economics and
other) were co-opted. The activity for almost two years of the Stiglitz-Sen-Fitoussi
Commission has ended up in a 300-page report, released in September 2009, in Paris103.
This report presented, based on an extremely laborious analysis, the problems that the
complex phenomena of contemporary society are facing with, ending with a series of
recommendations that covers three major areas, as follows:
I. Developments / interpretations related to GDP
- Taking into account, in a larger extent, the income and consumption compared with
production;
102V.A. Areces, Idem. 103J. Stiglitz, A. Sen, J.P. Fitoussi, Report by the Commission on the Measurement of Economic Performance and Social Progress, INSEE Publications, Paris, September, 2009.

227
- Closer association of income and consumption with wellbeing;
- More emphasis in terms of household’s perspective;
- Greater attention paid to income distribution, consumption and wellbeing;
- Implementing of tools for revenue measurement to non-market activities.
II. Life quality
- Inclusion, in the surveys conducted by statistical institutions, of questions on
evaluations, experiences and priorities of citizens;
- Improved measurement of the public health, education, social connections,
environmental conditions and social insecurity;
- Assessing inequalities, in a comprehensive manner, by indicators that reflect the
quality of life;
- Structuring the surveys so as to allow the assessment of the connections between the
different components of the quality of life at the level of each person and using this
information in the policy designing in various fields;
- Providing the necessary information for the aggregation of various dimensions of
quality of life and for building different indexes.
III. Sustainable development and the environment
- Building a set of well-defined indicators, required by the assessment of development
sustainability;
- Defining the components of this set to allow their interpretation in support of human
wellbeing;
- Emphasizing the economic aspects of sustainability, even if a monetary index of
sustainability would be appropriate in completing this set;
- Evaluating the environmental aspects of sustainability by monitoring separate
indicators in their physical expression.
It can be concluded that the work of the Stiglitz-Sen-Fitoussi Commission, benefiting
from a high scientific, analytical and credibility status, at the most prestigious level,
demonstrated the need for a comprehensive approach of social wellbeing in relation to GDP,
proving to be crucial in changing the manner of macroeconomic indicators interpretation.
The political reflection of this major change was that governments should pursue the
social wellbeing and not, in an absolutist way, the GDP, which represented a turning point in
the behavior of decision makers and the configuration of economic and social policies.

228
The European Union authorities, who have closely monitored the work of Stiglitz-Sen-
Fitoussi Commission, have taken, at once, in discussion its recommendations, thereby
promoting a series of debates with the aim of identifying the most appropriate formula to
supplement GDP with other indicators. In 2009, the European Commission, along with the
revision of the European System of Accounts (ESA 2010) previously mentioned, sent a
communication to the European Council and the European Parliament104 concerning the need
to extend National Accounts and to supplement it with social and environmental indicators,
advancing the idea of creating a dashboard for monitoring the sustainable development.
In November 2011, the European Statistical System Committee adopted a report
launching a concrete action plan to implement the recommendations of Stiglitz-Sen-Fitoussi
Commission, including the materialization of the idea of building a dashboard comprising a
series of sustainable development indicators105.
This dashboard was conceived as an instrument of action for the operationalization of
the Europe 2020 strategy, including issues of financing (budgets, sectoral programs),
containing a total of 10 headline indicators, covering five priority objectives in the fields of
employment, R&D, energy and climate change, education, poverty and social exclusion, on
which depends the wellbeing of EU citizens, in all Member States and their regions
(according to NUTS 2 classification), ensuring also the compatibility of the statistical systems
for each level106.
A significant example of the multidimensional measure of quality of life is the
population at risk of poverty or social exclusion, monitored as a key indicator under the
Europe 2020 Strategy. The headline target set at the EU-28 level for this indicator is lifting at
least 20 million people out of the risk of poverty or social exclusion by 2020 (compared to the
122 million people at risk in 2014, over 8 million people being in Romania).
At the level of OECD, a group of high level experts was set up in 2011 to continue the
work of the Stiglitz-Sen-Fitoussi Commission107, focusing on further research on specific
topics such as inequalities and gaps assessing, a work program on measuring wellbeing and
progress being launched, based on the evaluation of quality of life and material conditions, as
well as their sustainability, initiative on which we will return further.
104European Commission, GDP and beyond – Measuring progress in a changing world, EC COM (2009) 433 final, Brussels, 2009. 105Eurostat, Well-being and Sustainable Development, Final Report adopted by the European Statistical System Committee, Sponsorship Group on Measuring Progress, Eurostat, November, 2011. 106Eurostat, Smarter, greener, more inclusive? Indicators to support the Europe 2020 Strategy, Eurostat Statistical Books, European Union, Luxembourg, 2015. 107A. Gurria, Remarks delivered at the Conference Two Years after the release of Stiglitz-Sen-Fitoussi Report, Paris, 12 October, 2011.

229
Along with these initiatives at the level of various international organizations aimed at
reconsidering the GDP relevance and complementing it with other indicators that reflect the
quality of life or environment, some advanced countries have built their own system of
indicators. A notable example in this regard is the United States. After a first attempt dating
back from 2002, based on a law adopted in 2008 (The Key National Indicator Act), a National
system of key indicators managed by a non-profit and non-partisan entity (composed of
experts from the academic, scientific, statistical communities), independent of governance
structures, was set up, with the associated website: State of the USA. This system, divided into
20 sub-indicators, has the mission to provide Americans, transparently, data and information
to help them understand and assess the progress of the nation, under the most important
aspects of it108.
As regards all these attempts to address the GDP deficiencies, based on
complementary indicators, notable in fact and having indisputably positive effects amid
improving the overall quality of macroeconomic analysis, but also of government policies, it
should be noted that there remain at least two major inaccuracies of conceptual and
methodological nature. On the one hand, the mix of indicators, no matter how well-
articulated, is lacking, to a greater or smaller extent, the real consistency imposed by the
analytical and interpretive rightness of macroeconomic data. On the other hand, in the case of
developing indicators systems at the national level, they may contradict the requirements of
international comparability.
Some other attempts, more significant in our view, concerning the construction of
synthetic indicators of social wellbeing or systems of alternative indicators that mitigate some
of the shortcomings of GDP and of its complementary indicators are presented forwards.
3.2 Indicators and systems of alternative indicators of social wellbeing
Yet in the year 1970, Richard Easterlin has argued that in the US, as in other countries,
despite the significant increase in the income per capita, the national average, in terms of
wellbeing (happiness) and / or life satisfaction, seemed not to register a real growth on long-
term, a phenomenon known as the “Easterlin paradox”109.
Among the reasons of this paradox there are keeping unchanged the relative position
of the individuals’ social status, due to the unbalanced distribution of benefits arising from the 108J. Gertner, Idem. 109R. A. Easterlin, Does Economic Growth Improve the Human Lot? in Paul A. David, Melvin W. Reder, eds., Nations and Households in Economic Growth: Essays in Honor of Moses Abramovitz, Academic Press Inc., New York, 1974.

230
increased revenues, as well as the total or partial cancellation of such gains by the losses
stemming from the deterioration of other important social factors (increased insecurity, lack
of confidence in authorities etc.).
The first attempts to substitute GDP are attributed to William Nordhaus and James
Tobin, who have defined the measurement of Net Economic Welfare (NEW) by amending the
gross national product with the “negative” spin-offs (defense spending, public order),
environmental damages, adding instead the non-market activities (as leisure and underground
economy)110.
Since then, many studies on the consideration of various measures of welfare have
been carried out, among others: the Index of Sustainable Economic Welfare (ISEW)
developed by Herman Daly and John Cobb in 1980, which takes into account the links
between the economy, society and the environment; the Genuine Progress Indicator (GPI)
developed by Clifford Cobb, a version of ISEW that incorporates more aspects of
unemployment, crime, leisure time, homework; the Genuine Savings (or Adjusted Net
Savings) built by the World Bank, which measures the net investment in human capital,
depreciation of fixed capital, depletion of natural resources, damages caused by pollution111.
Regarding alternative indicators, an internationally notable attempt dates back to 1990.
Under the aegis of UNDP (United Nations Development Program) the economists Mahbub ul
Haq and Amartya Sen launched the Human Development Index (HDI), a composite tri-
dimensional indicator meant to reflect the human prosperity, built as geometric mean of three
normalized indices of life expectancy, education and income per capita (at PPP), published
starting with 1990, in the annual UNDP human development reports.
Since 2010, including as a result of the criticism that has been subjected, primarily
because of disputable indicators which were considered112, the HDI has been adjusted by the
aggregate level of inequality associated with each of its three dimensions (IHDI - Inequality-
adjusted Human Development Index).
According to the report published in 2015, on top positions of the HDI global
rankings, which includes 188 countries, were Norway, Australia and Switzerland (with HDI
110W.D. Nordhaus, J. Tobin, Is Growth Obsolete?, Cowles Foundation Discussion Paper No. 319, Yale University, 1971. 111 European Parliament, Alternative progress indicators to Gross Domestic Product (GDP) as a means towards sustainable development, Policy Department, Economic and Scientific Policy, IP/A/ENVI/ST, October, 2007. 112The criticism focused on some HDI deficiencies both conceptual (the human development definition and its determinants) and methodological (the aggregation of various indicators, the perfect substitution of the three dimensions) such that, in time, the index suffered certain improvements, including by the calculation of IHDI (M. Kovacevic, Review of HDI Critique and Potential Improvements, Human Development Research Papers 2010/33, UNDP, New York, February, 2011, pp. 2-5).
231
between 0.950 and 0.930, respectively IHDI between 0.890 and 0.860) while Romania stood
on a modest 52 position (HDI 0.793, respectively IHDI: 0.711) behind all other EU Member
countries, except Bulgaria113.
At the UN and World Bank levels, the concerns to assess various aspects of the
economic and social conditions have resulted in the pursuit of well-being indicators, directly
or by expanding various initiatives in this respect, carried on by governmental and / or non-
governmental organizations.
For example, in 2002, the UN launched the MDG (Millennium Development Goals)
platform, a global partnership for development having eight objectives, to which all Member
States agreed, action plans with specific indicators in the areas of poverty, education, health,
gender equality and the environment being elaborated.
In 2015, this platform has been updated and converted into 2030 Agenda for
Sustainable Development (SDG - Sustainable Development Goals), which monitors 17
economic, social and environmental objectives, 169 targets and about 250 indicators114.
Also, in 2011, the UN General Assembly adopted a resolution115, in the explanatory
statement arguing that GDP does not adequately reflect citizens' wellbeing, recommending to
all Member States and international organizations to develop a new indicator reflecting the
happiness of citizens, following the model introduced many decades ago by the Kingdom of
Bhutan, build on 4 pillars, 9 areas and 72 indicators116.
Thus, in 2012, the first annual report on the state of global happiness (World
Happiness Report) has been published, under the coordination of a group of independent
experts and the aegis of the UN. The report presents a global ranking based on the estimated
level of happiness, including a number of more than 150 countries.
It is worth mentioning that the composite indicator of happiness is built based on six
key variables (the GDP per capita at PPP, the social support in case of need, the healthy life,
the freedom to make choices in life, the prevalence for generosity and the corruption
perception at population and companies levels), one of the main data sources being the Gallup
surveys (Gallup World Poll) focusing on the quality of life.
113United Nations, Human Development Report 2015, UNDP, New York, 2015, p. 216. 114United Nations, Transforming our World: the 2030 Agenda for Sustainable Development, UN A/RES/70/1, New York, 2015. 115UN General Assembly, Happiness: towards a holistic approach to development, Resolution No. 65/309, 109th Plenary Meeting, July 19, 2011. 116The GNH (Gross National Happiness) has a philosophical inspiration, containing many elements of spiritual, ethic and cultural nature.
232
The World Happiness Report report on 2016117, according to national scores of
population happiness, as average of the period 2013-2015, witnessed on the global hierarchy
top countries as Denmark, Switzerland and Iceland (scores between 7501 and 7526), Romania
hovering barely the 71 position (score: 5528).
Almost surprising appears the poor positions of Japan (53rd), South Korea (58th),
Hungary (91th), Portugal (94th), Greece (99th), explained mainly by the unequal distribution
of wealth and the determinants of the life quality, despite much higher levels of such positions
in terms of GDP per capita at PPP.
The result of an inter-collaborative research project initiated in 2010 by several global
leaders in social sciences, gathered in the multinational foundation Social Progress
Imperative, which has gained increasing recognition from the scientific and international
institutions, materialized in the development of the Social Progress Index (SPI).
This composite indicator, constructed by the aggregation of 54 indicators, focuses on
three dimensions of wellbeing e.g. the covering of basic human needs (food, water, shelter,
safety), the access to wellbeing fundamentals (education, information, health, environment)
and the opportunities for achieving individual goals and aspirations (rights, freedom of
choice, freedom from discrimination and access to the most advanced information).
The Social Progress Index was redesigned in 2015 by Eurostat for the EU regions
(NUTS2) focusing on the same three dimensions and including all twelve components. The
composite index of regional EU-SPI is built on a set of 50 indicators (differing from the ones
of the original SPI), according to the criterion of time series availability and the reliability of
data sources.
The purpose of building this indicator is to ease the assessment of how the targets of
policies and programs pursued by the European Commission for 2014-2020 are achieved, in
particular those relating to social and territorial cohesion, helping regions to identify and take
best practices from other regions with similar levels of development.
The publication of the final version of the EU-SPI for the 272 EU regions is foreseen
by the end of 2016118.
Following an analysis of the conceptual framework of wellbeing and the integrated
approach to its multidimensional aspects, a group of Eurostat experts proposed in 2009 a
methodology for calculating a composite indicator of wellbeing, called satisfied life
117 J. Helliwell, R. Layard, J. Sachs (editors), World Happiness Report 2016, Update (Vol. I), UN Sustainable Development Solutions Network, New York, 2016, pp. 20-22. 118European Commission, The EU Regional Social Progress Index: Methodological Note, EC, DG Regio, Economic Analysis Unit, Brussels, 2015, p. 3.

233
expectancy, based on the concept of happy life expectancy introduced in 1996 by Ruut
Veenhoven119, professor emeritus at the Erasmus University of Rotterdam.
The Eurostat experts recommended also a set of 44 indicators of wellbeing, grouped
into five components, concerning psychological needs, security-safety, individual and
relational activities, skills and self-confidence120.
As previously mentioned, at OECD level, more than a decade ago, researches on the
measurement of wellbeing and progress have started, developing a methodological
framework, updated in 2011 by the launch of the Better Life Initiative, that focuses more on
aspects of life that are considered essential by citizens, as well as improving the information
base, in a manner to enable a better understanding of welfare and its determinants trends,
including for structuring the related policies. The framework of measurement the individual
wellbeing is built on two dimensions (the quality of life, with eight areas, and the material
conditions, with three areas) having associated more than 30 indicators, attempting also an
evaluation of capital resources (natural, economic, human and social) needed to ensure the
sustainability of improving the wellbeing of citizens.
The report for 2015 stated that, despite the progress of the OECD average compared
with the crisis year 2009, in some countries (Spain, Portugal, Italy, Greece) several pressure
factors on material conditions and quality of life have been felt, due to the decrease in real
income of households, high unemployment and limited housing access. Also, an increase in
the disparities, including at regional levels, has been revealed by many indicators (income
distribution, access to services, employment opportunities, personal security, air pollution),
which is affecting the resources for future improvements of wellbeing121.
In conclusion, despite many attempts to address the deficiencies of GDP, by
methodological updating, using complementary indicators or substituting it with the
composite or alternative indexes, of which those that seemed more relevant were presented in
this chapter, one can say that, at least so far, the academic research, the national, international
and / or global institutions, the governmental or non-governmental organizations have failed
to reach a consensus on the best way of measuring the wellbeing and social progress.
If this failure can be attributed, superficially, to economics as a social science, in
whose object of study is found, according to most recognized definitions, the issue of
119 R. Veenhoven, Happy Life-Expectancy. A Comprehensive Measure of Quality-of-Life in Nations, Social Indicators Research, Vol. 39, 1996, Springer, pp. 1-58. 120Eurostat, Feasibility Study for Well-Being Indicators. Task 4: Critical review, European Commission, 2009, pp. 33-40. 121OECD, How’s Life? 2015: MeasuringWell-being, Better Life Initiative, OECD Publishing, Paris, 2015, pp. 32-35.

234
wellbeing, welfare and prosperity of nations, on a broader level, it should be admitted that, in
essence, the defining elements of wellbeing are outside the perimeter of this science, their
metric being influenced, in a decisive manner, by the subjective perceptions of reality at the
individual level, incompatible in relation to specific generalizations that substantiate the
economic laws. Equally true is that the accelerating globalization has led to rising
interconnections and interdependences of world phenomena, their increasingly greater
complexity putting to a tough test the ability of policy makers to understand and manage them
adequately, much less to identify the most appropriate ways to soften their negative
externalities and to head in desirable directions the sustainable development of mankind,
under conditions of extreme uncertainty122.
Without diminishing the merit of these attempts and stressing the importance of
continuing efforts to identify other ways of reflecting the citizens' wellbeing, further on we
will return to the GDP, which remains the reference indicator, in one way or another, in the
quasi-majority of studies devoted to assessing the performance of economies and the social
progress, at the level of the most important institutions and organizations.
Thus, the GDP indicator, expressed per capita, converted to a single currency of
reference and taking into account the purchasing power parity of various currencies, will be
examined in the context of international comparisons, including Romania's evolution from
this point of view, of its position in the global and / or European rankings, and the
perspectives for reducing the development gaps against the advanced countries on the
medium and long term.
4. International comparisons
4.1 Romania’s GDP during 1870-2000
The purpose of this section is to reveal the results of researches on the evolution of
Romania's Gross Domestic Product over a historical period of over 130 years, not as long as
duration but disrupted by radical changes in the system and even territorially.
The efforts to build long data series have required an extremely careful archival
documentation, coupled with laborious calculations, based on an own methodological
argumentation, in order to ensure a higher degree of data comparability123.
122G. Georgescu, The world trade data distortion and its contagion impact, MPRA Paper No 69483, Munich, 2016. 123V. Axenciuc, Produsul Intern Brut al României 1862-2000, Editura Economică, Volumele I și II, București, 2012.

235
The GDP per capita data series for the period 1870-2000, based on the specified
principles and methodological calculation criteria, was built sequentially, as follows:
- for the period 1870-1947, the data on GDP per capita, initially converted and
expressed in comparable lei 1913, were equated in US gold dollars 1913, based on the metal
parity ratio of 5.18 lei = 1 $; thereafter, the data series was recalculated by converting the US
dollars 1913 to US dollars at 1990 purchasing power parity, multiplied by a factor of dollar
depreciation during the period 1913-1990, of 11.07, calculated by Williamson124;
- for the period 1950-1979, the National Income indicator has been transposed into
Gross Domestic Product indicator according to SNA methodology, then converted in
comparable prices and in US dollars at 1990 purchasing power parity, to ensure the
comparison and continuity with both the previous series of GDP during 1862-1947, and the
subsequent 1980-2000 (data series published by the National Institute of Statistics in current
prices), making possible also the international comparisons.
For a period far back in time, comparing Romania's GDP with other countries
encounters many difficulties. The calculation methods of some institutions or foreign authors,
aiming at ensuring the GDP compatibility in international currencies were different; as a
consequence, the resulted GDP, expressed in international dollars, was also different.
Table 3 presents some historical series of GDP per capita in Romania, calculated and
published by various institutions, presented for comparison with our data series. The
calculation methodology is specified in the data sources.
It was found that our figures for Romania’s GDP per capita in the first half of the last
century, especially for the period 1926-1947, are relatively close to those provided by A.
Maddison and the University of Warwick (the only data sources for this period) i.e. between $
900 and $ 1,200 per capita.
In Romania's communist period (1950-1989), however, the figures begin to
differentiate, the assessments made by A. Maddison for the end of this period (about $ 4,000
per capita) stood at half of the figures estimated by us.
Moreover, for the decade 1990-2000, the calculations both by A. Maddison and those
of the University of Warwick, shows a decrease in GDP per capita of about $ 3,000 in the last
year of the period, i.e. below the level recorded by Romania three decades ago, which is not
confirmed from the analysis of GDP (at PPP) evolution, that will be presented below.
124S. H. Williamson, Six Ways to Compute the Relative Value of a U.S. Dollar Amount, 1774 to Present, Measuring Worth, 2008.

236
Table 3
GDP per capita in Romania, from different statistical sources, in comparable dollars, during 1870-2000
Years OECD UN Atlaseco University World Table University V. Axenciuc
Maddison National Université of Pennsylvaniaof
Warwick
GDP
per capita
international Accountsde
SherbrookGröningen University
dollarsdollars
20053) dollars PPP dollars PPP dollars
dollars
PPPdollars PPP
19901,2)
20001,4)
19965)
19961,6)
19907) 1990
1 2 3 4 5 6 7 8..........................................................................................................................................................................
1870 931 1143 481..........................................................................................................................................................................
1880 ..... 763..........................................................................................................................................................................
1890 1246 1395 754..........................................................................................................................................................................
1900 1415 819..........................................................................................................................................................................
1913 1741 1705 1020..........................................................................................................................................................................
1926 1258 888
1927 1241 886
1928 1225 860
1929 1152 1102 907
1930 1219 893
1931 1229 908
1932 1144 823
1933 1184 828
1934 1182 836
1935 1196 897
1936 1194 922
1937 1130 1206 955
1938 1242 934..........................................................................................................................................................................
1950 1182 1176 1044
1951 1256 1337
1952 1333 1324
1953 1411 1495
1954 1496 1508
1955 1578 1822
1956 1623 1585
1957 1672 1848
1958 1724 1712
1959 1783 1892
1960 1844 1477 2072
1961 1951 1714 2234
1962 2007 1858 2288
1963 2137 2070 2501
1964 2258 2131 2729
1965 2386 2323 2939
1966 2643 2457 3209
1967 2743 2740 3458
1968 2739 2888 3611
1969 2824 3055 3980

237
Years OECD UN Atlaseco University World Table University V. Axenciuc
Maddison National Université of Pennsylvaniaof
Warwick
GDP
per capita
international Accountsde
SherbrookGröningen University
dollarsdollars
20053) dollars PPP dollars PPP dollars
dollars
PPPdollars PPP
19901,2)
20001,4)
19965)
19961,6)
19907) 1990
1 2 3 4 5 6 7 8
1970 2853 1679 3262 4360
1971 3221 1877 3626 4647
1972 3396 2057 4013 4962
1973 3477 2253 4233 3457 5551
1974 3637 2506 4802 5548
1975 3761 2737 5404 5615
1976 3917 3013 5658 6187
1977 3966 3234 6446 6394
1978 4063 3439 7282 6890
1979 4148 3624 7642 7060
1980 4135 3753 7639 7715 7296
1981 4087 3731 7645 7369 7252
1982 4072 3857 7907 7426 7504
1983 4027 4076 8360 7486 7933
1984 4178 4306 8826 7717 8378
1985 4159 4283 8779 7632 8333
1986 4215 4364 8951 7836 8489
1987 4110 4378 8987 7820 8518
1988 4085 4335 8887 7789 8437
1989 3941 4067 8336 7576 7254 7910
1990 3511 3829 7851 6739 6969 3460 7449
1991 3063 3338 6845 5926 6019 6491
1992 2797 3098 6348 5461 5576 6020
1993 2843 3150 6454 5695 5634 6119
1994 2957 3277 6717 5931 5841 6364
1995 3174 3519 7214 6371 6177 6832
1996 3307 3670 7527 6636 6443 7127
1997 3114 3457 7085 6195 6074 6711
1998 2972 3297 6761 5760 5923 6402
1999 2943 3266 6693 5814 6337
2000 3002 3348 6838 6141 3008 6474
1) Calculated at the current la territory of Romania. 2) A. Maddison, The World Economy: Historical Statistics, OECD Development Center Studies, 2004. 3) ONU Statistics Division, National Accounts, Main Aggregates Database. 4) Atlaseco, Perspectiv Mondo, Université de Sherbrook.
5) B. van Ark, Economic Growth and Labor Productivity in Europe. Half a Century of East-West Comparisons, Gröningen Growth and Development Center, University of Gröningen, 2000.
6) World Table, The Center of Internationl Comparisons, Pennsylvania University.
7) S. Broadberry, A. Klein, Agregate and per capita GDP in Europe, 1870-2000: Continental, Regional and National Data with Changing Boundaries, University of Warwick, United Kingdom, 2011.
Source:V. Axenciuc, Produsul Intern Brut al României 1862-2000, Editura Economică, Volumul I, București, 2012, Table A24, pp. 83-84.

238
We appreciate that our estimates for Romania, i.e. a level of GDP per capita situated
between $ 6500 and $ 7500 during 1990-2000, are closer to reality, and, as seen from the data
in Table 3, in line with estimates by other institutions (the universities of Sherbrook,
Groningen and Pennsylvania) and, as to show further, with the ones of the United Nations and
the World Bank, according to the International Comparison Programme.
Skipping over the different levels of historical series regarding the GDP per capita,
from the different authors and institutions, we think that the major disparities between
countries revealed by these estimates are much more important.
For example, the calculations carried out by professors Stephen Broadberry and
Alexander Klein of the University of Warwick125, showed that in the last 130 years, the
relative and absolute gaps between Romania and other European countries in terms of GDP
per capita at PPP increased, compared both to the advanced Western countries and the
Eastern countries. The data presented in Table 4 show that, if in 1870, the GDP per capita at
PPP in Germany, France, Italy, the Netherlands, was 1.5-2.1 times higher than that of
Romania, in 1937 this ratio increased to 2.9-4.0 times, and in 2000 to 6.3-7.2 times.
Table 4
The evolution of GDP per capita (PPP) gaps in Romania (=1.00)
compared to other European countries, during 1850-1973
Note: the country boundaries are those from the respective years. Source: authors calculations, based on GDP data, in 1990 dollars, PPP, from: S. Broadberry, A. Klein, Agregate and per capita GDP in Europe, 1870-2000: Continental, Regional and National Data with Changing Boundaries, University of Warwick, United Kingdom, 2011.
125 S. Broadberry, A. Klein, Agregate and per capita GDP in Europe, 1870-2000: Continental, Regional and National Data with Changing Boundaries, University of Warwick, United Kingdom, 2011.
Region / Country 1850 1870 1890 1910 1925 1938 1950 1973
Western Europe - - - - 2.25 2.45 2.85 1.66
France 1.75 2.08 2.09 2.21 2.83 2.73 3.56 2.23
Germany (West) 1.62 2.03 2.18 2.30 2.25 3.28 2.92 2.11
Italy 1.46 1.49 1.26 1.19 1.52 1.61 1.85 1.25
Netherlands 2.25 2.41 2.38 2.30 2.88 2.68 3.19 1.72
Eastern Europe - - - - 1.00 1.48 1.78 1.37
Bulgaria - 1.05 1.02 0.88 0.96 1.22 1.33 1.29
Czechoslovakia - - - - 1.59 1.60 2.46 1.79
Poland - - - - 0.78 1.08 1.74 1.35
Hungary - - - - 1.16 1.31 1.76 1.36
Romania 1.00 1.00 1.00 1.00 1.00 1.00 1.00 1.00

239
Also, compared with 1870, when the GDP per capita at PPP in Bulgaria represented
only about 70% of that of Romania, in 2000, it was 1.7 times higher than that of our country.
Relatively to Czechoslovakia, Poland and Hungary, compared with 1913, when the GDP per
capita at PPP in Romania's case was only 1.2-1.4 times lower, in 1973 this ratio reached 1,5-
2.0 in disfavor of our country, increasing to 2.4-3.0 in 2000.
Considering another attempt in building long data series of macroeconomic indicators,
belonging to the Swiss historian Paul Bairoch126, the evolution of differences between
Romania’s GDP per capita at PPP and some countries in Western Europe, respectively
Eastern Europe, during the period 1850-1973 is presented in Table 5.
Table 5
The evolution of GNP per capita gaps in Romania (= 1,00) compared to other European countries, during 1870-2000
Note: the country boundaries are those from the respective years; the frontier between Wesstarn Europe and Eastern Europe, defined by Bairoch, correspond to the „Iron Curtain” (Bairoch, 1976, p. 317). Source: authors calculations, based on GDP data, in 1990 dollars, PPP, from: Paul Bairoch,
European Gross National Product 1800-1975, in: Journal of European Economic History,
No. 5, 1976.
It is worth mentioning that during 125 years, on the whole period, these gaps have
increased significantly, especially if the size in absolute terms is taken into account.
Comparing with Germany, France, Italy, the Netherlands, while in 1850, the gaps in disfavor
of Romania were situated between 1.5 and 2.1, similar to those revealed by Broadberry and
Klein, in 1938 these increased to 1.6-3.7, after which a slight decrease was recorded up to
1973, a similar trend with the one resulted from the figures presented in the Table 4.
126P. Bairoch, European Gross National Product 1800-1975, în: Journal of European Economic History, No. 5, 1976.
Region / Country 1870 1890 1913 1937 1950 1973 1990 2000
France 1.53 1.59 1.90 3.49 4.20 3.77 5.23 7.06
Germany 1.76 1.98 2.45 4.01 3.76 3.75 5.36 6.30
Italy 1.61 1.44 1.60 2.88 3.04 3.32 4.64 6.30
Netherlands 2.11 2.00 2.08 3.97 4.49 3.86 4.99 7.18
Bulgaria 0.71 0.78 0.85 1.24 1.34 1.53 1.60 1.70
Czechoslovakia … … 1.24 2.28 2.92 2.02 2.45 3.04
Poland … … 1.14 1.59 2.08 1.54 1.48 2.40 Hungary … … 1.43 2.16 2.11 1.62 1.87 2.36
Romania 1.00 1.00 1.00 1.00 1.00 1.00 1.00 1.00

240
As regards the comparison with the countries of Eastern Europe, if in 1925, the GNP
per capita in Romania was higher than that of Bulgaria and Poland, and lower compared to
Czechoslovakia and Hungary, in 1973, gaps in disfavor of our country, between 1.3 and 1.8
were recorded relatively to all these states.
4.2 The UN and the World Bank International Comparison Programme.
Since the second half of the twentieth century, concerted actions focusing on drawing
sets of synthetic macroeconomic indicators (national income, gross domestic product, gross
national product etc.) utilized for substantiating the development strategies and economic and
social policies were initiated.
These indicators were calculated both at the national level, in most countries, by
official statistics or individual researchers and international level by official and / or private
economic, financial or research institutions.
Thus, data series of macroeconomic indicators on short and medium term have been
produced, which, continued until today, have become long-term series. The calculation
methodologies, in addition to those generated by economic and social systems - National
Accounts and material production system- were also varied, suffering revisions and updates,
the most important being previously presented and discussed.
One of the most notable event that have focused the efforts, mainly from the US, and
have contributed to building a system of National Accounts according to standards that allow
international comparisons was the organization, under NBER (National Bureau of Economic
Research) aegis, of a series of conferences on researches regarding the income and wealth,
held in Princeton in the 50s. At the edition of October 1954, John W. Kendrick, editor of the
Conference volume, noted some progress towards international comparability of national
economic accounts, highlighting the importance of developing uniform standards regarding
the size and structure of national macroeconomic aggregates, so as to eliminate the risk of
knowledge counterfeiting in this domain127.
An imperative of the various systems and methods for global indicators calculation
was their compatibility in order to allow the comparisons between different countries. Mainly,
the global institutions which looked for comparisons based on a single common monetary unit
of the synthetic indicators, have initially adopted, as factor conversion, the average annual
exchange rate and / or adjusted by the price index.
127J. W. Kendrick (editor) Problems in the International Comparison of Economic Accounts, The Conference on Research in Income and Wealth, CWER, Princeton University Press, 1957, pp. 3-6.

241
In the 60s and 70s, several prominent researchers have developed a new method for
international comparisons, based on purchasing power parity of currencies, which, since then,
is constantly refined, updated and generalized128.
In the landscape of the global scale comparisons, an International Comparison
Programme (ICP) was set up and implemented, based on purchasing power parities of
national currencies with the international dollar.
Systematic worldwide researches, under the aegis of the United Nations and the World
Bank support, date back to 1968 when the ICP project started.
The first report was published in 1975 and included, based on a multilateral
comparisons methodology, the calculations of GDP at purchasing power parity for ten
countries and the years 1967 and 1970. This first pilot phase was followed by others,
increasing gradually the number of participating countries or regional groups of countries, in
parallel with continuous improvements in calculation methodology, including through the
involvement of national statistical offices and Eurostat, both as inter-regional technical
assistants and comparable data providers.
Currently, the ICP includes 199 countries, providing comparable data regarding GDP
and its components on the expenditure side, by the conversion at the purchasing power parity
(PPP) estimated based on surveys that collect data on prices and costs considering the full
range of final products and services recorded for GDP calculation, including consumer goods
and services, government services and capital goods129.
It is worth mentioning that PPP represents both spatial deflators and currency
converters, each nation’s GDP being thus expressed in comparable prices and converted into a
single currency (international dollar). By dividing the result to the population number, the real
wellbeing of the citizens may be reflected, considering also the limitations previously
mentioned.
The aggregation systems into international prices used by the ICP are extremely
complex, implying a series of iterative processes and methods, among these the Geary-
Khamis, EKS and therewith additive or associated systems.
128See the works of R.C. Geary, A Note on the Comparison of Exchange Rates and Purchasing Power BetweenCountries (1958); D. Paige, G. Bombach, A Comparison of National Output and Productivity, OEEC, Paris (1959); H. Salam, A. Khamis, A New System of Index Numbers for National and International Purposes (1972); B. Irving, Z. Kravis, A.W. Kenessey, H.R. Summers, A System of International Comparisons of Gross Product and Purchasing Power (1975) etc. 129United Nations, Report of the World Bank on the interim activities of the International Comparison Programme, Statistical Commission, Forty-seventh session, CN.3/2016/10, 8-11 March, 2016.

242
4.3 Romania’s position in the global rankings of GDP per capita at PPP
The overall picture of the evolution of GDP per capita in comparable prices has
registered significant changes at global scale during the 35 years of our analysis, noting that
1980 is the first available year of data series from the IMF WEO Database.
Table 6
The evolution of GDP per capita at PPP during 1980 – 2015 - current international dollars -
Source: World Economic Outlook Database, International Monetary Fund.
Year / Country 1980 1989 1990 2000 2005 2008 2009 2010 2015
Austria 11,166 18,812 20,201 30,754 36,644 42,421 40,989 42,145 47,031
Belgium 10,977 18,706 19,966 29,714 35,659 40,206 39,134 40,278 43,800
Bulgaria 4,652 9,200 8,743 7,631 11,676 15,388 14,811 15,208 18,326
Croatia … … … 12,444 17,694 21,476 20,073 20,034 21,169
Cyprus 6,297 13,990 15,262 24,422 30,641 35,062 33,669 33,703 30,769
Czech Republic … … … 16,524 22,677 27,947 26,584 27,431 30,895
Denmark 11,528 20,238 21,272 32,715 38,699 42,874 40,736 41,726 45,451
Estonia … … … 11,756 19,221 23,746 20,442 21,245 27,994
Finland 9,653 18,129 18,808 27,352 34,420 40,395 37,161 38,569 40,838
France 10,763 18,524 19,661 28,514 33,571 37,313 36,297 37,284 41,018
Germany 11,222 19,179 20,631 29,529 34,003 39,920 38,072 40,080 46,895
Greece 8,998 13,357 13,760 20,064 26,818 31,253 30,084 28,810 26,773
Hungary 6,288 10,881 10,937 14,152 19,778 22,613 21,321 21,789 25,895
Ireland 7,593 13,137 14,689 32,982 43,057 46,149 43,074 43,275 51,118
Italy 10,551 18,929 20,016 28,614 33,128 36,123 34,200 35,097 35,811
Latvia … … … 8,797 15,664 20,584 18,037 18,087 24,540
Lithuania … … … 9,790 16,399 22,507 19,534 20,521 28,210
Luxemburg 15,348 33,563 36,243 63,611 78,089 89,992 84,288 88,063 93,173
Netherlands 11,715 19,658 21,091 33,051 38,436 45,447 44,055 44,839 48,317
Poland 4,724 6,847 6,529 11,559 15,065 19,259 19,906 20,956 26,210
Portugal 5,991 11,380 12,752 20,460 23,508 26,315 25,700 26,496 27,624
Slovakia … … … 12,346 17,727 24,092 22,933 24,278 29,209
Slovenia … … … 17,975 23,973 29,999 27,567 28,043 30,508
Spain 7,944 14,336 15,412 24,239 29,665 33,220 32,008 32,269 34,899
Sweden 10,844 18,878 19,631 29,256 36,735 41,704 39,482 42,021 47,228
United Kingdom 8,707 16,466 17,118 25,853 32,807 36,574 35,039 35,872 40,676
ROMANIA 4,797 7,531 7,362 8,046 12,358 16,771 15,728 15,821 20,526
China 302 899 954 2,846 4,937 7,399 8,103 9,012 13,801
India 566 1,103 1,177 2,041 2,938 3,788 4,084 4,495 6,265
Japan 8,539 17,517 19,110 25,519 30,197 33,429 31,825 33,713 38,215
South Korea 2,183 6,667 7,518 16,452 22,741 27,522 27,795 29,824 36,601
Norway 14,973 26,562 27,967 46,488 56,578 62,489 61,230 61,520 67,445
USA 12,575 22,879 23,913 36,432 44,218 48,302 46,909 48,309 56,421

243
As show the data presented in Table 6, the Romania’s GDP per capita (at PPP),
increased by almost four times during the period 1980-2015. Under these circumstances, as
compared to other countries, which recorded similar GDP growth rates, the relative gap, of 2-
3 times in the disfavor of Romania, has been maintained (Table 7).
Table 7
The evolution of GDP per capita (PPP) gaps during 1980 – 2015 Romania= 1.00
Source: based on Table 6 data
Year / Country
1980 1989 1990 2000 2005 2008 2009 2010 2015
Austria 2.33 2.50 2.74 3.82 2.97 2.53 2.61 2.66 2.29
Belgium 2.29 2.48 2.71 3.69 2.89 2.40 2.49 2.55 2.13
Bulgaria 0.97 1.22 1.19 0.95 0.94 0.92 0.94 0.96 0.89
Croatia n/a n/a n/a 1.55 1.43 1.28 1.28 1.27 1.03
Cyprus 1.31 1.86 2.07 3.04 2.48 2.09 2.14 2.13 1.50
Czech Republic n/a n/a n/a 2.05 1.84 1.67 1.69 1.73 1.51
Denmark 2.40 2.69 2.89 4.07 3.13 2.56 2.59 2.64 2.21
Estonia n/a n/a n/a 1.46 1.56 1.42 1.30 1.34 1.36
Finland 2.01 2.41 2.55 3.40 2.79 2.41 2.36 2.44 1.99
France 2.24 2.46 2.67 3.54 2.72 2.22 2.31 2.36 2.00
Germany 2.34 2.55 2.80 3.67 2.75 2.38 2.42 2.53 2.28
Greece 1.88 1.77 1.87 2.49 2.17 1.86 1.91 1.82 1.30
Hungary 1.31 1.44 1.49 1.76 1.60 1.35 1.36 1.38 1.26
Ireland 1.58 1.74 2.00 4.10 3.48 2.75 2.74 2.74 2.49
Italy 2.20 2.51 2.72 3.56 2.68 2.15 2.17 2.22 1.74
Latvia n/a n/a n/a 1.09 1.27 1.23 1.15 1.14 1.20
Lithuania n/a n/a n/a 1.22 1.33 1.34 1.24 1.30 1.37
Luxemburg 3.20 4.46 4.92 7.91 6.32 5.37 5.36 5.57 4.54
Netherlands 2.44 2.61 2.86 4.11 3.11 2.71 2.80 2.83 2.35
Poland 0.98 0.91 0.89 1.44 1.22 1.15 1.27 1.32 1.28
Portugal 1.25 1.51 1.73 2.54 1.90 1.57 1.63 1.67 1.35
Slovakia n/a n/a n/a 1.53 1.43 1.44 1.46 1.53 1.42
Slovenia n/a n/a n/a 2.23 1.94 1.79 1.75 1.77 1.49
Spain 1.66 1.90 2.09 3.01 2.40 1.98 2.04 2.04 1.70
Sweden 2.26 2.51 2.67 3.64 2.97 2.49 2.51 2.66 2.30
United Kingdom 1.82 2.19 2.33 3.21 2.65 2.18 2.23 2.27 1.98
ROMANIA 1.00 1.00 1.00 1.00 1.00 1.00 1.00 1.00 1.00
China 0.06 0.12 0.13 0.35 0.40 0.44 0.52 0.57 0.67
India 0.12 0.15 0.16 0.25 0.24 0.23 0.26 0.28 0.31
Japan 1.78 2.33 2.60 3.17 2.44 1.99 2.02 2.13 1.86
South Korea 0.46 0.89 1.02 2.04 1.84 1.64 1.77 1.89 1.78
Norway 3.12 3.53 3.80 5.78 4.58 3.73 3.89 3.89 3.29
USA 2.62 3.04 3.25 4.53 3.58 2.88 2.98 3.05 2.75

244
Comparing with countries from Eastern Europe, it became obvious that, while in
relation to the Czech Republic, Slovakia, Hungary and Slovenia, the relative GDP gaps of
Romania registered a slight decrease, as concerns the comparison with Poland, the situation
has reversed, i.e. from a parity registered in 1980, to an unfavorable report of 1:1.3 in 2015.
As compared to many advanced countries (Germany, Netherlands, Norway, Finland
and Austria) relative gaps for more than 2:1 in disfavor of Romania have remained. In relation
to other advanced countries (US, Japan, South Korea, United Kingdom, Sweden and Ireland)
these gaps have increased just over 3:1. Only compared to some advanced countries (Italy,
France and Denmark) Romania has slightly reduced the relative GDP gaps during the
reference period.
However, it should be stressed that except Bulgaria, the differences in absolute terms
concerning the GDP per capita recorded an increase in Romania compared to all EU
countries. Comparing with some advanced countries (Germany, Austria, Sweden and
Netherlands) the gaps of 6,000 - 7,000 dollars existing in 1980 rose to about 26,000-28,000
dollars in 2015.
In this context, it has to be highlighted the remarkable evolution of several countries
during the last 35 years, such as China, which recorded an increase by about 45 times of its
GDP per capita at PPP, South Korea, with an increase by about 17 times and India, with an
increase by about 11 times, which allowed these countries to achieve a significant reduction in
their development gaps compared to advanced countries.
At European level, the International Comparison Programme, including on prices and
purchasing power parity, is run under the coordination of UNECE, OECD and Eurostat.
It is important to note that the estimated data on GDP at PPP under this program
focuses only on OECD countries and a number of 6 non-member countries (China, Colombia,
India, Indonesia, Russian Federation and South African Republic).
5. Eurostat indicators for the EU cross country comparisons
5.1 The GDP conversion at Purchasing Power Standard (PPS) and the Actual Individual
Consumption.
According to the methodology used by the UN and the World Bank, the consistency of
GDP at PPP conversion depends on the quality of data collection on prices, some
imperfections or distortions can occur due to spatial and temporal differences in terms of the
consumer basket, namely its representativeness in relation to market realities, so diverse and
rapidly changing.
245
Based on these considerations, at European Union level, Eurostat uses, as analytical
tool for international comparisons, the estimates of GDP at purchasing power standard (PPS),
which basically is an artificial coin that can be interpreted as an exchange rate of euro
compared to PPP. It is appreciated that the conversion at purchasing power standard takes into
account, in a more appropriate manner, the price differences between the EU Member States
and the currency fluctuations130.
However, it is worth mentioning that, in the case of regional comparisons within the
EU, at NUTS 2 level, the utilization of the same conversion rates at PPS as the national level
ones cannot provide an accurate picture concerning the real regional disparities and the
divergence deepening, already seized in the last period, given the significant price differences
between different areas and regions of the EU, including in Romania's territory case.
At the level of the EU Member States, the GDP expressed in PPS is of particular
importance, being used to assess the level of real convergence, both for highlighting the
progress of the economy and as a criterion for the accession to the Eurozone.
On a larger scale, from this point of view, it should be stressed that, unlike institutional
and nominal convergence, which are evaluated according to some indicators which have
became classics, assessing the real convergence, which has a decisive role in the architecture
and dynamics of the process across the entire Europe Union, relies almost exclusively on the
indicator GDP at PPS and the related gaps compared to the EU average.
Depending on the case, possible qualitative considerations concerning the economic
governance, functionality of the institutional framework, the health of the banking sector and
other considerations can be added.
As concerns the GDP expressed in PPS, the data presented in Table 8, show that
Romania has made significant progress in reducing the relative gap compared to the EU28
average, respectively, from 26.3% in 2000 to 34% in 2004 and to 57% in 2015, by registering
a double pace of GDP per capita growth rate comparing with the EU28 average and gaining
31 percentage points in 15 years, of which 23 percentage points only in the last decade.
It is also worth noting that, according to GDP in PPS as percent of EU average, in
some countries, a process of convergence has been recorded, either ascending (especially the
countries of Central and Eastern Europe and the Baltic’s) or descending (Belgium, Italy,
Spain, Netherlands, Finland, Sweden and United Kingdom).
130F. Magnien, The Measure of GDP per capita in Puchasing Power Standard (PPS), OECD Meeting of National Accounts Experts, Paris, 8-11 October, 2002.

246
Table 8
The evolution of GDP per capita at PPS in Romania compared to other EU28 Member Countries during 2004-2015
- % of EU28 average -
Source: Eurostat
However, other countries witnessed a divergence process by distancing from the EU28
average and gaps increases, either positively (the case of Germany being the most significant
one) or negatively (Greece and Cyprus, the most affected ones by the financial crisis).
Referring to Romania, we should mention that, despite progress in the catching up
with the advanced EU countries due to the closeness of GDP per capita at PPS relative to the
EU average in percentage terms, there remain significant gaps in absolute terms.
Year/
/ Country 2004 2007 2008 2011 2015
EU28 average 100 100 100 100 100
Belgium 120 115 114 119 117
Bulgaria 35 42 45 45 46
Czech Republic 79 83 81 83 85
Denmark 125 121 123 125 124
Germany 117 117 118 124 125
Estonia 55 68 68 69 74
Ireland 144 146 132 132 145
Greece 96 92 94 77 71
Spain 100 103 101 94 92
France 109 107 106 108 106
Croatia 57 61 63 59 58
Italy 108 105 105 102 95
Cyprus 97 100 105 96 81
Latvia 47 60 60 56 64
Lithuania 50 60 63 65 74
Luxemburg 246 259 255 263 271
Hungary 62 61 63 65 68
Malta 80 78 80 84 89
Netherlands 133 137 139 134 129
Austria 127 123 124 127 127
Poland 49 53 54 64 69
Portugal 76 79 79 78 77
ROMANIA 34 41 48 51 57
Slovenia 85 87 89 82 83
Slovakia 56 67 71 73 77
Finland 117 117 120 116 108
Sweden 129 127 126 126 123
United Kingdom 125 117 114 106 110

247
Over the last 15 years these gaps have been reduced by only about 1,600 euros i.e.
from about 14,000 euro in 2000 to about 12,400 euro in 2015. In Figure 2, suggestively, the
evolution of absolute gaps, somehow unfavorable to Romania is revealed.
Figure 2
Source: based on Eurostat data.
In order to improve the international comparisons, at the UN and the World Bank
levels, starting from 2014, the Actual Individual Consumption (AIC) is calculated, as a more
appropriate indicator reflecting the level of citizen’s wellbeing.
According to an agreed methodology, to which Eurostat and OECD have contributed,
this indicator is calculated on the bases of goods and services effectively entered the
household consumption, whether they were paid by households, government or non-profit
organizations131.
From this point of view, one can say that the calculation of AIC is likely to improve
the comparability in the cross-country analysis, removing the differences in the systems of
131The World Bank, Purchasing Power Parities and Real Expenditures of World Economies. Summary of Results and Findings of the 2011 International Comparison Program, WB, Washington, 2014.
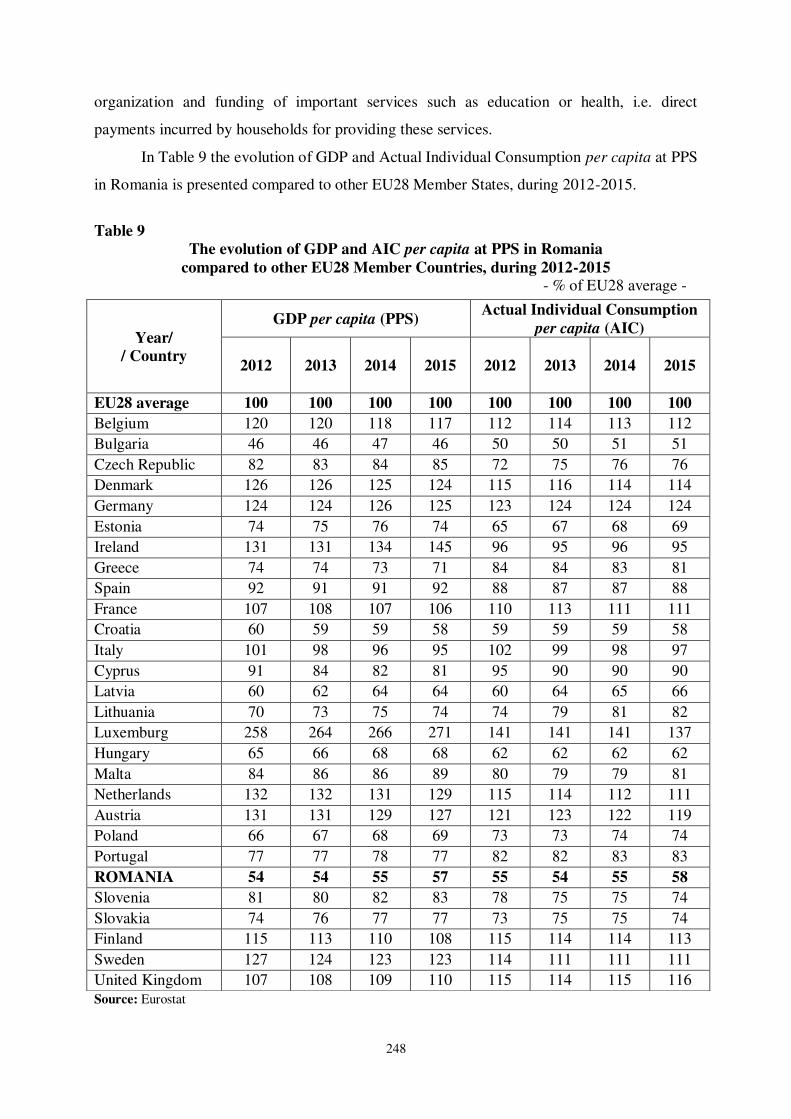
248
organization and funding of important services such as education or health, i.e. direct
payments incurred by households for providing these services.
In Table 9 the evolution of GDP and Actual Individual Consumption per capita at PPS
in Romania is presented compared to other EU28 Member States, during 2012-2015.
Table 9 The evolution of GDP and AIC per capita at PPS in Romania
compared to other EU28 Member Countries, during 2012-2015 - % of EU28 average -
Source: Eurostat
Year/ / Country
GDP per capita (PPS) Actual Individual Consumption
per capita (AIC)
2012
2013 2014 2015 2012 2013 2014 2015
EU28 average 100 100 100 100 100 100 100 100
Belgium 120 120 118 117 112 114 113 112
Bulgaria 46 46 47 46 50 50 51 51
Czech Republic 82 83 84 85 72 75 76 76
Denmark 126 126 125 124 115 116 114 114
Germany 124 124 126 125 123 124 124 124
Estonia 74 75 76 74 65 67 68 69
Ireland 131 131 134 145 96 95 96 95
Greece 74 74 73 71 84 84 83 81
Spain 92 91 91 92 88 87 87 88
France 107 108 107 106 110 113 111 111
Croatia 60 59 59 58 59 59 59 58
Italy 101 98 96 95 102 99 98 97
Cyprus 91 84 82 81 95 90 90 90
Latvia 60 62 64 64 60 64 65 66
Lithuania 70 73 75 74 74 79 81 82
Luxemburg 258 264 266 271 141 141 141 137
Hungary 65 66 68 68 62 62 62 62
Malta 84 86 86 89 80 79 79 81
Netherlands 132 132 131 129 115 114 112 111
Austria 131 131 129 127 121 123 122 119
Poland 66 67 68 69 73 73 74 74
Portugal 77 77 78 77 82 82 83 83
ROMANIA 54 54 55 57 55 54 55 58
Slovenia 81 80 82 83 78 75 75 74
Slovakia 74 76 77 77 73 75 75 74
Finland 115 113 110 108 115 114 114 113
Sweden 127 124 123 123 114 111 111 111
United Kingdom 107 108 109 110 115 114 115 116

249
The data show that, in many EU advanced countries (Germany, Netherlands, Austria,
Denmark, Sweden, Belgium), even if there are no significant differences between the relative
positions of both indicators against the EU28 for the same countries, in general, the GDP per
capita stands a few percentage points over the AIC per capita, except for Ireland, where this
difference was about 50 percentage points in 2015.
In other advanced EU countries (France, United Kingdom and Finland), due also to
higher levels of government spending on education and health, the GDP per capita is less by
5-6 percentage points than the AIC per capita, compared to the EU28 average.
Regarding the emerging countries of Central and Eastern Europe, all situated below
the EU28 average for both indicators, it was found that in Czech Republic, Estonia and
Slovenia, the GDP per capita stood for 5-10 percentage points higher than the AIC per capita,
while in Bulgaria, Lithuania and Poland, for 5-8 percentage points lower. In the case of
Croatia, both indicators stood at the same level (58%) compared to the EU28 average, as in
the one of Slovakia, but at a significantly higher level (77%).
Referring to Romania, we found that the relative position of GDP per capita and AIC
per capita relative to the EU28 average is similar, i.e. between 54% and 55% in 2012-2014,
registering a slight increase in 2015, for both indicators, up to 57% and 58% respectively, our
country remaining on the penultimate position in the European hierarchy in this regard, ahead
only of Bulgaria.
In this context we should mention that, for analytical purposes, including international
comparisons, a distinction between the Gross Domestic Product (GDP) and Gross National
Product (GNP) is made, according to territorial (or geographical location) criterion and
respectively national (or ownership location) one.
If GDP is an indicator of the market value of all goods and services produced within
the borders of a state, the GNP reflects the market value of goods and services produced by
labor and property supplied by the citizens (residents) of a country.
So, GNP measures the incomes generated both internally and externally, being
calculated by subtracting or adding to the GDP, the result of the balance between incomes
earned by residents in other countries and incomes earned by nonresidents in the domestic
economy. It is worth mentioning that GNP takes into account only the productive activities,
irrespective of gains / losses arising from changes in value of fixed and / or financial assets.
The international financial institutions, mainly for operational purposes, have
gradually replaced the GNP with Gross National Income (GNI), an identical concept, but
different in the calculation methodology, being obtained on the basis of data from the current
250
account balance of payments, by amending the GDP with the factor incomes derived from the
balance between primary incomes received from "the rest of the world" by resident units and
primary incomes paid by resident to the nonresident units.
In general, the differences between these two indicators are not significant. In the US
for example, the GNI is only about one percent higher than GDP. In the case of Romania,
while GDP amounted to 160.4 billion euro in 2015, GNI stood for 157.3 billion euro i.e. by
about 2 percent lower, due to the negative balance of residents-nonresidents primary incomes.
The World Bank, in order to guide its administrative and financial assistance policy,
classifies the 187 member countries in four groups according to their development level, the
main criterion being the indicator GNI per capita (expressed in dollars by converting the
national currencies applying the WB Atlas method, adjusted to PPP) as follows:
- countries with advanced economies (high-incomes): more than 12,500 $
- developing countries with upper-middle income: $ 4,000 – 12,500
- developing countries with lower-middle incomes: $ 1,000 – 4,000
- less developed countries (low-incomes): below $ 1,000
These thresholds, updated annually with adjustments for inflation, are used by the
World Bank to determine its operational lending policy i.e. for establishing the lending terms
and eligibility for classifying different countries in one of the 3 types / modalities of funds
allocation. For example, the less developed countries receive a preferential treatment IDA
(International Development Association), through interest-free loans granted, in particular, to
support programs in the fight against poverty on the medium and long run.
At the EU level, according to the principles of solidarity and ability to pay and of
financing based on own resources, the main revenue source of the EU budget (accounting for
more than ¾) comes from the Member States contribution, which is calculated as a percentage
of Gross National Income (GNI-based own resource), representing approximately 0.7% on
average at EU28 overall.
The cohesion policy of the European Union provides the allocation of important funds
aimed to promote sustainable development and reduce economic and social disparities,
including the supporting of infrastructure projects, which are granted to those countries with a
level of GNI per capita below 90% of the EU average.
In this context it should be also mentioned that the eligibility of the regions (NUTS 2)
for the allocation of funds from the Community budget is determined according to GDP per
capita in PPS, respectively for the regions where this indicator recorded a level below 75% of
the EU average. For example, for the financial period 2014-2020, Romania's structural and
251
investment funds allocated from the EU budget amount to about 22 billion euro, of which
about 7 billion euro from the Cohesion Fund, about 10 billion euro from the European
Regional Development Fund and about 5 billion euro from the European Social Fund.
5.2 Romania and the real convergence with the EU countries.
Following the financial and economic crisis of 2008-2009, in order to monitor the
financial stability of the European Union and to prevent excessive external imbalances,
generated also by high levels of current account deficits and / or an unsustainable degree of
external indebtedness, the European Commission introduced in 2011 a mechanism for the
supervision, alert and resolution of macroeconomic imbalances (MIP - Macroeconomic
Imbalance Procedure) which, indirectly, monitors also the progress towards real convergence
of the Member States 132.
This mechanism is based on a risk dashboard (MIP Scoreboard) that includes a set of
14 core indicators, each of them associated with alert (reference) thresholds and 34 auxiliary
indicators.Every year, the European Commission publishes a report (Alert Mechanism
Report) identifying the Member States requiring a more detailed analysis in order to identify
imbalances, assessing their nature and severity and providing corrective actions if they are
appreciated as excessive133.
Currently, Romania complies with all basic indicators monitored by the MIP
Scoreboard, except for the Net International Investment Position (NIIP), which exceeds the
threshold (-50.2% of GDP at end-2015 in Romania, compared to the MIP alert threshold of
-35%), mentioning that a clear downward trend is registered in recent years, comparing with
the peak of -70.4% of GDP in 2012134.
Looking to the coming decades, according to estimates by scenarios developed under
the aegis of the Romanian Academy, the convergence of Romania with the Member States of
the European Union is expected to accelerate so that, under the circumstances of achieving
sustained growth rates, the GDP per capita (at PPS) would be around the EU average by the
year 2035135.
132European Commission, Scoreboard for the Surveillance of Macroeconomic Imbalances, European Economy Occasional PapersNo 92, EC-DGECFIN, Brussels, 2012. 133European Commission, Alert Mechanism Report 2016, COM (2015) 691, EC, Brussels, November 26, 2015. 134 G. Georgescu, Prospects of Romania’s international investment position and financial stability risks, MPRA Paper 69501, January, 2016. 135Academician Vlad Ionel-Valentin (coordinator) Strategia de dezvoltare a Romaniei în urmatorii 20 de ani (The Strategy of Romania’s development during the next two decades), Vol. I, Editura Academiei, Bucharest, 2015, p. 271.

252
Increasing the integration with the EU countries would require joining the Eurozone.
The year 2019 established by the Romanian Government, in 2014, as target year for joining
the EMU has proven unrealistic, both as convergence degree in terms of GDP per capita (at
PPS) and the preparedness, from economic and institutional point of view, especially if one
considers that this approach requires the completion of preliminary phases (the accession to
the Banking Union, two years earlier entry into the Exchange Rate Mechanism ERM II),
which had not even been initiated up to 2017.
In our opinion, it would be more realistic, under a favorable internal and external
environment, to develop a consistent roadmap on short, medium and long term, agreed by all
political, social and civic stakeholders, accompanied by the implementation of coherent,
economic, budgetary, monetary, social and environmental policies, coordinated with those of
the European Union, including their support by absorbing the largest possible proportion of
the EU allocated funds, as well as Romania's participation in Community investment
programs.
Under these circumstances, the time horizon of Romania's accession to Economic and
Monetary Union can be configured by the years 2023-2025. By maintaining further within the
parameters of institutional and nominal convergence criteria and recording significant
progress in the real convergence, the indicators GDP and AIC per capita (at PPS) are
expected to reach about 75-80% of the EU average in the anticipated timeframe, while
reducing the development disparities, both at the country and regional levels.

253
Referencies
Theorical, methodological and historical sources
Adumitrăcesei, Ioan D. (2010), Viaţa economică – o viziune actuală şi de perspectivă, Editura Noel, Iaşi.
Agrigoroaie, Ion (2001), România interbelică, Editura Universității „Al.I. Cuza”, Iaşi.
Albu, Lucian-Liviu (1998), Tranziţia economiei sau tranziţia ştiinţei economice?, Editura Expert, Bucureşti.
Albu, Lucian-Liviu (coord.) (2008), Determinanţi ai creşterii economice, ocupării şi competitivităţii. Metode şi tehnici de măsurare. Analize comparative, Editura Academiei Române, Bucureşti.
Aldcroft, Derek H., Sutcliffe, A. (eds.) (1999), Europe in the International Economy – 1500-2000, Edward Elgar Publishing Limited, Cheltenham.
Alexandrescu, Ioan (1986), Economia României în primii ani postbelici (1945-1947), Editura Ştiinţifică, Bucureşti.
Aligică, Dragoş (2000), Structură instituţională, expansiune sistemică şi performanţă în economia mondială modernă, Editura ASE, Bucureşti.
Anderson, Victor (1991), Alternative Economic Indicators, Routledge, London.
Anghelache, Constantin (1996), Măsurarea şi compararea dezvoltării economice, Editura Economică, Bucureşti.
Anghelache, Constantin, Isaic-Maniu, Alexandru, Mitruţ, Constantin, Voineagu, Vergil (2007), Sistemul Conturilor Naţionale, ediţia a doua, Editura Economică, Bucureşti.
Arcadian, N. (1936), Industrializarea României. Studiu evolutiv-istoric, economic şi juridic, Imprimeria Naţională, Bucureşti.
Areces, Alvares (2010), Măsurarea progreselor - dincolo de PIB, a 86-a Sesiune Plenară, 5-6 octombrie 2010, Comitetul Regiunilor, Uniunea Europeană, ENVE-V-002, Brussels.
Antipa, Grigore (1919), Problemele evoluţiei poporului român, Academia Română, Bucureşti. -
van Ark, Bart (1993), International Comparisons of Output and Productivity. Manufacturing Productivity Performance of Ten Countries from 1950 to 1990, University of Groningen, Groningen.
van Ark, Bart (2000), Economic Growth and Labor Productivity in Europe. Half a Century of East-West Comparisons, Gröningen Growth and Development Center, University of Groningen, Groningen.
Axenciuc, Victor (1997), Introducere în istoria economică a României. Epoca modernă, Editura Fundației România de Mâine, Bucureşti.
Axenciuc, Victor (2000), Avuţia naţională a României. Cercetări istorice comparate 1860-1939, Editura Expert, Bucureşti.
Axenciuc, Victor (2012), Produsul Intern Brut al României 1862-2000, Editura Economică, Volumele I, II, București.

254
Bafoil, François (2006), Europe centrale et orientale. Mondialisation, européanisation et changement social, Presses de la Fondation Nationale, Paris.
Bairoch, Paul (1976), Europe’s Gross National Product: 1800-1975, Journal of European Economic History No. 5, London.
Bairoch, Paul (1997), Victoires et déboires. Histoire économique et sociale du monde du XVIe siècle à nos jours, 3 vol., Gallimard, Paris.
Bari, Ioan (2003), Probleme globale contemporane, Editura Economică, Bucureşti.
Bass, E.M. (1975), Bulgarian GNP by Sector of Origin, 1950, 1955, 1960-1974, London.
Băcescu, Marius, Băcescu, Angelica (2002), Analiză macroeconomică, Editura Economică, Bucureşti.
Băcescu-Cărbunaru, Angelica (2000), Macroeconomia relaţiilor economice internaţionale, Editura Economică, Bucureşti.
Băicoianu, I.C. (1904), Istoria politicii noastre vamale şi comerciale de la Regulamentul Organic şi până în prezent, vol. I, II, Bucureşti.
Becherman, Wilfred (1966), Comparison internationale du revenu réel, OECD Development Center, Paris.
Belli, Nicolae (2001), Tranziţia, mai grea decât un război. România 1990-2000, Editura
Expert, Bucureşti.
Berend, Iván T., Ránki, Gyorgy (1974), Economic Development in East-Central Europe in the 19th and 20th Century, Columbia University Press, New York.
Berindei, Dan (1991), Românii şi Europa în istorie, societate, cultură, vol. I, Editura Museion, Bucureşti.
Berindei, Dan (2009), Constituirea României moderne, Editura Academiei Române, Bucureşti.
Bernal, John (1964), Ştiinţa în istoria societăţii, Editura Politică, Bucureşti.
Blaga, I. (1983), Industrializarea, Editura Ştiinţifică şi Enciclopedică, Bucureşti.
Bowley, A.L. (1930), The Change in the Distribution of the National Income, 1880-1930, Oxford.
Brateş, Teodor (1997), Privatizare, Editura Economică, Bucureşti.
Braudel, Fernand (1985), Jocurile schimbului, 2 vol., Editura Meridiane, Bucureşti.
Braudel, Fernand (1989), Timpul lumii, 2 vol., Editura Meridiane, Bucureşti.
Bridgman, Benjamin, Dugan, Andrew, Lal, Mikhael, Osborne, Mattheu, Villones, Shaunda (2012), Accounting for Household Production in the National Accounts, 1965–2010, BEA Survey of Current Business, May.
Broadberry, Stephen, Klein, Alexander (2008), Aggregate and per Capita GDP in Europe, 1878-2000: Continental, Regional and National Data with Changing Boundaries, University of Warwick, United Kingdom.

255
Capanu, I., Anghelache, C. (2001), Indicatorii macroeconomici. Conţinut, metodologie de calcul şi analiză economică, Editura Economică, Bucureşti.
Câmpeanu, Virginia (2004), Comensurarea şi evaluarea decalajelor economice în perspectiva integrării, Editura Expert, Bucureşti.
Chadeau, Ann (1992), What is households non-market production worth?, OECD Economic Studies, No 18, Spring.
Chirot, Daniel (2002), Schimbare socială într-o societate periferică. Formarea unei colonii balcanice, Editura Corint, Bucureşti.
Cioriceano, Georges D. (1928), La Roumanie économique et ses rapports avec l’étranger de 1860 à 1915, Editeur Marcel Giard, Paris.
Cipolla, Carlo M. (ed.) (1973), The Fontana Economic History of Europe, vol. 3-6, Collins- Fontana Books, London.
Ciutacu, Constantin (2001), Reformă şi metareformă, Editura Expert, Bucureşti.
Clark, Colin (1932), The National Income, 1924-1931, Cambridge.
Clark, Colin (1937), National Income and Outlay, Macmillan, London.
Colescu, Leonida (1907), Progresele economice ale României îndeplinite sub domnia M.S. Regelui Carol I, 1866-1906, Institutul de Arte Grafice „Carol Göbl”, Bucureşti.
Constantinescu, Mitiţă (coord.) (1939-1941), Contribuţiuni la problema materiilor prime în România, vol. I-V, Tiparul Românesc, Bucureşti.
Constantinescu, Mitiţă (1943), Politică economică aplicată, vol. I-III, Editura Tiparul Românesc, Bucureşti.
Constantinescu, N.N. (1992), Acumularea primitivă a capitalului în România, Editura Tiparul Românesc, Bucureşti.
Constantinescu, N.N. (coord.), (1996, 2000), Istoria economică a României, vol. I, II, Editura Economică, Bucureşti.
Constantiniu, Florin (1999), O istorie sinceră a poporului român, Editura Univers
Enciclopedic, Bucureşti
Coşea, Mircea (2001), Jurnal în tranziţie, Editura Dacia, Bucureşti.
Crafts, Nicholas, Toniolo, Gianni (eds.) (1996), Economic growth in Europe since 1945, Cambridge University Press, Cambridge.
Croitoru, Lucian (1993), Macrostabilizare şi tranziţie, Editura Expert, Bucureşti.
Csaba, László (1990), Eastern Europe in the World Economy, Cambridge University Press, Cambridge.
David, Thomas (2009), Nationalisme économique et industrialisation. L’experiénce des pays de l’Est, Droz, Géneve.
Dăianu, Daniel (1999), Transformarea ca proces real: de la comandă la piaţă, Editura IRLI, Bucureşti.
256
Dăianu, Daniel (2009), Capitalismul încotro? Criza economică, mersul ideilor, instituţii, Editura Polirom, Iaşi.
Deane, Ph. (1961), The Long Terms Trends in World Economic Growth, London.
Delaisi, Françis (1929), Les deux Europes, Payot, Paris.
Deletant, D. (1997), România sub regimul comunist, Fundaţia Academia Civică, Bucureşti.
Dinu, Marin (2000), Economie contemporană. Ce este globalizarea?, Editura Economică, Bucureşti.
Dinu, Marin (2010), Economia de dicţionar. Exerciţii de îndemânare epistemică, Editura Economică, Bucureşti.
Dobre, Gh. (1997), Economia României în context european în anul 1947, Editura Fundaţiei Ştiinţifice Memoria Oeconomica, Bucureşti.
Dobrescu, Emilian (1989), Măsurarea economică, in: Tratat de economie contemporană, vol. 2, partea a doua, Bucureşti.
Dobrescu, Emilian (2002), Tranziţia în România. Abordări econometrice, Editura Economică, Bucureşti.
Dobrescu, Emilian (2006), Macromodels of the Romanian Market Economy, Editura Economică, Bucureşti.
Dobrescu, Emilian M. (coordonare generală) (2005), Dicţionar de istorie economică şi istoria gândirii economice, Editura All Beck, Bucureşti.
Dobrovici, Gh.M. (1935), Istoricul dezvoltării economice şi financiare a României şi împrumuturile contractate, 1823-1933, Tipografia Universul, Bucureşti.
Dobrovici, Gh.M. (1943), Evoluţia economică şi financiară a României în perioada 1934-1943, Editura Bucovina I.O. Toronţiu, Bucureşti.
Dochia, A., Molnar, M., Poenaru, M. (1986), Probleme ale determinării indicatorilor macroeconomici sintetici, Caiet de studiu nr. 112, Institutul de Economie Naţională, Bucureşti.
Dolgu, Gh. (coautor) (1997), Principia Oeconomica; fundamente vechi şi noi ale analizei economice, Editura Academiei Române, Bucureşti.
Dumitrescu, Ilie (1999), Compararea internaţională a Produsului Intern Brut şi încrederea utilizatorilor în rolul statisticii în economia de piaţă, Editura ASE, Bucureşti.
Easterlin, Richard (1974), Does Economic Growth Improve the Human Lot? in: Paul A. David, Melvin W. Reder, eds., Nations and Households in Economic Growth: Essays in Honor of Moses Abramovitz, Academic Press Inc., New York.
Ehrlich, Eva (1966), An Examination of the Interrelation between Consumption. Indicators Expressed in Physical Units and per Capita National Income, Praga.
Evelpidi, Ch. (1949), The National Income of Greece and Its Composition, Cambridge.
Feinstein, C.H. (1972), Statistical Tables of National Income, Expenditure and Output of U.K. 1855-1965, Cambridge University Press, London.

257
Fota, Dionysius (2007), Cum se ruinează o economie naţională, Editura Universitară, Bucureşti.
Fota, Dionysius (2008), Introducere în macroeconomia comparată, Editura Universitară, Bucureşti.
Friedman, Milton (1995), Capitalism şi libertate, Editura Enciclopedică, Bucureşti.
Galbraith, John Kenneth (1982), Ştiinţa economică şi interesul public, Editura Politică, Bucureşti.
Georgescu, Florin (2000), Starea economico-socială a României în anul 2000, Editura Expert, Bucureşti.
Georgescu, George (2016), Prospects of Romania’s international investment position and financial stability risks, MPRA Paper No 69501, Munich.
Georgescu, George (1989), Optimizarea structurilor economice, Editura Științifică și Enciclopedică, București.
Gerlach Stefan (2009), Defining and measuring systemic risk, Economic and monetary affairs, European Parliament-DGIP, Brussels.
Gurria, Angel (2011), Remarks delivered at the Conference Two Years after the release of Stiglitz-Sen-Fitoussi Report, Paris, 12 October.
Georgescu-Roegen, Nicolas (1997), Opere complete, vol. II, Economia României, Editura Expert, Bucureşti.
Goldsmith, W. Raymond (1985), Comparative National Balance Sheets: A Study of Twenty Countries 1688-1978, The University of Chicago Press, London.
Good, David F. (ed.) (1994), Economic Transformations in East and Central Europe. Legacies from the Past and Policies for the Future, Routledge, London.
Good, David F., Ma, Tongshu (1999), The Economic Growth of Central and Eastern Europe in Comparative Perspective, 1870-1989, European Review of Economic History.
Grigorescu, Constantin (coord.) (1993), Nivelul dezvoltării economico-sociale a României în context european în anul 1989, Editura Expert, Bucureşti.
Gusti, Dimitrie. (director edit.) (1939-1942), Enciclopedia României, vol. I-IV, Imprimeria Naţională, Bucureşti.
Harrison, Mark (1994), GDPs of the USSR and Eastern Europe: Towards an Interwar Comparison, University of Warwick, Europe-Asia Studies, 46.
Helliwell, John, Layard, Richard, Sachs Jeffrey (editors) (2016), World Happiness Report 2016, Update (Vol. I), UN Sustainable Development Solutions Network, New York.
He Qi (2014), G-20 Data Gaps Initiative, IMF/FSB Global Conference on the G-20 DGI-Progress in Five Years, June 25-26, Basel.
Hoffmann, W.G., Muller, J.H. (1959), Das deutsche Volkseinkommen (1851-1957), Tubingen.
Hurezeanu, Damian (2000), Civilizaţia română modernă. Premise, Editura Institutului de Teorie Socială, Bucureşti.

258
Iacob, Gheorghe, Iacob, Luminiţa (1995), Modernizare-europenism. România de la Cuza-Vodă la Carol al II-lea, vol. 1, 2, Editura Universităţii „Alexandru Ioan Cuza”, Iaşi.
Iancu, Aurel (1986), Structura economiei şi sistemul industrial, Editura Ştiinţifică şi Enciclopedică, Bucureşti.
Iancu, Aurel (1998), Bazele teoriei politicii economice, Editura All Beck, Bucureşti.
Iancu, Aurel (coord.) (2008), Convergenţa economică, vol. I, II, Editura Academiei Române, Bucureşti.
Ionete, Constantin (1993), Criza de sistem a economiei de comandă în etapa sa explozivă, Editura Expert, Bucureşti.
Isărescu, Mugur Constantin (2009), Contribuţii teoretice şi practice în domeniul politicilor monetare şi bancare, Editura Academiei Române, Bucureşti.
Isărescu, Mugur Constantin (2010), Contribuţii la analiza limitelor creşterii economice, Clubul de la Roma.
Isărescu, Mugur Constantin, Postolache, Tudorel (2000), Un proiect deschis: strategia naţională de dezvoltare economică a României pe termen mediu, Centrul Român de Economie Comparată şi Consensuală, Bucureşti.
Jackson, Marvin R. (1985), National Accounts and the Estimation of Gross Domestic Product and Its Growth Rates for Romania, World Bank, Washington.
Josan, Andrei (2004), Economia României interbelice în context european, Editura ASE, Bucureşti.
Kaser, M.C., Radice, E.A. (1985), The Economic History of Eastern Europe, 1919-1975, vol. I, Oxford.
Kendrick, John W. (editor) (1957), Problems in the International Comparison of Economic Accounts, The Conference on Research in Income and Wealth, CWER, Princeton University Press.
Keynes, John, Maynard (2007), The General Theory of Employment, Interest and Money, Palgrave Macmillan, London.
Kirițescu, Costin C. (1997), Sistemul bănesc al leului şi precursorii lui, vol. I-III, Editura Academiei Române, Bucureşti.
Klein, Lawrence, (coord.), Belousov, Andrei, Albu, Lucian-Liviu (2004), Research on the Potential and Mechanisms of Long-Term Economic Growth in Transition Economies, Editura Expert, București.
Kovacevic, Milorad (1975), Review of HDI Critique and Potential Improvements, Human Development Research Papers 2010/33, UNDP, New York, February.
Kravis, I.B., Kenessey, Z., Heston, A., Summers, R. (1975), A System of International Comparisons of Gross Product and Purchasing Power, The John Hopkins University Press, Baltimore, London.
Kuznets, Simon (1972), Economic Growth of Nations. Total Output and Production Structure, The Belknap Press of Harvard University Press, Cambridge, Massachusetts.

259
Lampe, John R., Jackson, Marvin R. (1982), Balkan Economic History, 1550-1950. From Borderlands to Developing Nations, Indiana University Press, Bloomington.
Landau, Z., Tomaszewski, J. (1967), Gospodarska Polske miedzywoyenny 1918-1939, Warszawa.
Lazarzik, G. (1969), Czechoslovak Gross National Product by Sector of Origin and Final Use, 1937 and 1948-1965.
Leon, Pierre (coord.) (1977), Histoire economique et sociale du monde, Tomes 1-6, Armand Colin, Paris.
Lewis, Cleona (1945), Debtor and Creditor Countries, 1938-1944, Washington DC.
Maddison, Angus (1995), Monitoring the World Economy 1820-1992, Development Center of the OECD, Paris.
Maddison, Angus (2001), The World Economy: A Millennial Perspective, Development Center of the OECD, Paris.
Maddison, Angus (2003), The World Economy: Historical Statistics, Development Center of the OECD, Paris.
Magnien, Francois (2002), The Measure of GDP per capita in Purchasing Power Standard (PPS), OECD Meeting of National Accounts Experts, Paris, 8-11 October, 2002.
Madgearu, N. Virgil (1940), Evoluţia economiei româneşti după războiul mondial, ediţia 1993, Editura Ştiinţifică, Bucureşti.
Maliţa, Mircea (2009), Mintea cea socotitoare, Editura Academiei Române, Bucureşti.
Manoilescu, Mihail (1929), Théorie du protectionnisme et de l’échange international, Marcel Giards, Paris.
Marczewski, J. (1965), Histoire quantitative de l’économie française, Paris.
Marshall, Alfred (2011), Principles of Economics, Palgrave Macmillan, London.
Merler, Silvia, Huttl, Pia (2015), Wellcome to the dark side: GDP Revision and the non-observed economy, Bruegel, February.
Miranda, Veerle (2011), Cooking, Caring and Volunteering: unpaid work around the world, OECD Social, Employment and Migration Working Papers, 3 March.
Moldovan, Roman (1983), Formarea şi mişcarea capitalurilor în România în perioada 1925-1938, Editura Academiei Române, Bucureşti.
Murgescu, Bogdan (2010), România şi Europa. Acumularea decalajelor economice (1500-2010), Editura Polirom, Bucureşti.
Murgescu, Costin (1987, 1990), Mersul ideilor economice la români, vol. 1-2, Editura Ştiinţifică şi Enciclopedică, Bucureşti.
Nakamura,Leonard I. (2010), Intangible assets and national income accounting, Review of
Income and Wealth, Series 56, Special issue 1, June.
Niculescu, N.G., Adumitrăcesei, D. (2000), Post-socialist Romania confronted with underdevelopment, Editura Economică, Bucureşti.
260
Nordhaus, William D., Tobin, James (1971), Is Growth Obsolete?, Cowles Foundation Discussion Paper No. 319, Yale University, 1971.
Păun, N. (1991), Stat şi economie, Editura Interferenţe, Cluj-Napoca.
Perroux, Fr. (1969), L’economie du XXe siécle, Presses Universitaires de France, Paris.
Petra, N. (1939), Probleme economice româneşti. Planul economic, Sibiu.
Petty, William (2014), Essays on Mankind and Political Arithmetic, Project Gutenberg, transcribed from the Cassell & Co. edition by David Price, London.
Pilat, Vasile (2006), Funcţionarea economiei naţionale, Editura Rosetti Educaţional, Bucureşti.
Piketty, Thomas (2014), Capital in the Twenty-First Century, Harvard University Press.
Poenaru, D., Sârbu, C. (1970), Istoriografia economică românească. Bibliografie selectivă (1944-1969), Editura Expert, Bucureşti.
Pohoaţă, Ion (2009), Repere în economia instituţională, Editura Economică, Bucureşti.
Pollard, Sidney (1981), Peaceful Conquest. The Industrialization of Europe, 1760-1970, Oxford.
Pop, Napoleon (2010), Despre criză, fără mânie şi cu discernământ, Editura Expert, Bucureşti.
Postelnicu, Gheorghe, Postelnicu, Cătălin (2002), Obsesia decalajelor economice, Editura Economică, Bucureşti.
Postolache, Tudorel (coord.) (1987, 1989), Tratat de economie contemporană. Economia naţională, reproducţia socială şi mecanisme economice, vol. 2, Cartea I, Cartea a II-a, Editura
Politică, Bucureşti.
Postolache, Tudorel (coordinateur scientifique) (1992), L’Economie de la Roumanie – le XX-éme siecle – la nouvelle transition a l’économie de marché; prémises historiques et perspectives, Editura Expert, București.
Rogowski, E. (1926), Das deutsche Volkseinkommen, Berlin.
Rommenhöeller, C.G. (1926), La grande Roumanie, sa structure économique, sociale, financière, politique et particulièrement ses richesses, La Haye, Martinus Nijhoff.
Rostow, W.W. (1960), The Stage of Economic Growth, Cambridge University Press, Cambridge.
Ruiu, Nicuşor (2010), Romanian Tranzition Economy Mid 1990’s, compared studies, Romanian Center for Comparative Economics and Consensus, Bucureşti.
Saizu, Ioan, Tacu, Alexandru (1997), Europa economică interbelică, Institutul European, Iaşi.
Scurtu, Ioan (coord.) (2003), Istoria românilor – Tratat, vol. VIII – 1918-1940, Academia Română, Editura Enciclopedică, Bucureşti.
Sitescu, Pant M. (1939), Der Rumänische Wirtschaftsraum, București.
Slăvescu, Victor (1934), La situation économique de la Roumanie et sa capacité de payement, Imprimeria Centrală, București.

261
Smith, Adam (2007), An Inquiry into the Nature and causes of the Wealth of Nations, Edited by S.M. Soares, Metalibri edition, London.
Soare, Aurel Constantin (2000), România în Europa secolului XX, Editura Semne, Bucureşti.
Soulet, Jean-Francois (1998), Istoria contemporană a statelor comuniste din 1945 până în zilele noastre, Editura Polirom, Iaşi.
Stadnik, M. (1947), National Income and Its Distribution with Special Reference to Czechoslovakia, Praga.
Stiglitz, Joseph (2003), Globalizarea: speranţe şi deziluzii, Editura Economică, Bucureşti.
Stiglitz, Joseph, Sen, Amartya, Fitoussi, Jean-Paul (2009), Report by the Commission on the Measurement of Economic Performance and Social Progress, INSEE Publications, Paris, September.
Studenski, Paul (1961), The Income of Nations. Part one, History; Part two, Theory and Methodology, New York University Press, New York.
Swennilson, Ingvar (1954), Growth and Stagnation in the European Economy, Geneve.
Tchakaloff, A. (1946), National Income and Outlay of Bulgaria 1921-1945, Sofia.
Teichova, Alice (1974), An Economic Background to Munich, Cambridge University Press, Cambridge.
Trebici, Vladimir (1979), Demografia, Editura Ştiinţifică şi Enciclopedică, Bucureşti.
Turdeanu, Lucian (1993), Avuţia naţională pe plan mondial şi naţional, Editura Academiei Române, Bucureşti.
Turnock, David (2006), The Economy of East Central Europe, 1815-1989: Stages of Transformation in a Peripheral Region, Routledge, London, New York.
Ungureanu Ivan, Clementina (2003), Contabilitatea naţională, Casa de Editură Irecson, Bucureşti.
Vasile, Valentina (coautor) (1998), Economia în România 2020, Editura Expert, Bucureşti.
Vasile, Valentina (coautor) (2005), Analysis of the Correlation between the GDP Evolutions, the Capital and Labour Factors, in Romania, in: Romanian Journal of Economic Forecasting.
Văcărel, Iulian (1999), Politici economice şi financiare de ieri şi de azi, Editura Economică, Bucureşti.
Vâlceanu, Gr. (coord.) (1986), Probleme ale comparabilităţii internaţionale a indicatorilor sintetici, Caiet de studiu nr. 113, IEN, Bucureşti.
Veenhoven Ruut (1996), Happy Life-Expectancy. A Comprehensive Measure of Quality-of-Life in Nations, Social Indicators Research, Vol. 39, Springer.
Vinski, Ivo (1978), World Gross Product 1910-1975, Economiski Institut, Zagreb.
Voineagu, V. (1999), Comparaţii internaţionale – probleme metodologice, SNSPE, Bucureşti
Voineagu, V., Isaic-Maniu, Al., Mitruţ, C. (2005), Sistemul Conturilor Naţionale, Editura Economică, Bucureşti.

262
Wagner, Pavel, Ştefănescu, Daniela E. (1999), Compararea internaţională a produsului intern brut, Editura Economică, Bucureşti.
Wallerstein, Immanuel (1992, 1993), Sistemul mondial modern, vol. 1-4, Editura Meridiane, Bucureşti.
Williamson, Samuel H. (2008), Six Ways to Compute the Relative Value of a U.S. Dollar Amount 1774 to Present, Measuring Worth.
Xenopol, Nicolas (1916), La richesse de la Roumanie, Tipografia Socec & Co, București.
Zaman, Gheorghe (1986), La correlation entre le produit social, le revenu national et les dépenses matérielles, in: Revue Roumaine des Science Sociales, Bucureşti.
Zaman, Gheorghe (2001), Bilanţul economiei de tranziţie, în România (1990-1999), Editura Expert, Bucureşti.
Zaman, Gheorghe, Georgescu, George (2011), Sovereign Risk and Debt Sustainability - Warning Levels for Romania, in: Non-Linear Modelling in Economics. Beyond Standard Economics, Expert Publishing House, Bucharest.
Zamfir, Cătălin (1977), Strategii ale dezvoltării sociale, Bucureşti.
Zamfir, Cătălin (1998), Social Policy in Transition, UNDP, New York.
Zamfir, Elena, Zamfir, Cătălin, Bădescu, Ilie (2000), Starea societăţii româneşti după 10 ani de tranziţie, Editura Expert, Bucureşti.
Zane, Gheorghe (1930), Economia de schimb în Principatele Române, Editura Casa Şcoalelor, Bucureşti.
Zub, Al. (1981), A scrie şi a face istorie, Editura Junimea, Iaşi.
Zub, Al. (1998), Discurs istoric şi tranziţie, Institutul European, Iaşi.
Consiliul Superior Economic (1938), Orientări generale pentru alcătuirea unui plan economic pe un termen mai lung, Imprimeria Naţională, Bucureşti.
Consiliul Superior Economic (1939), Aspecte ale economiei româneşti. Material documentar pentru cunoaşterea unor probleme în cadrul planului economic, Bucureşti.
European Commission (2013), Tax reforms in EU Member States. 2013 Report, EC, Brussels.
European Commission (2009), GDP and beyond – Measuring progress in a changing world, EC COM (2009) 433 final, Brussels.
European Parliament (2007), Alternative progress indicators to Gross Domestic Product as a means toward sustainable development, EP, Policy Department, Brussels.
European Parliament (2007), Alternative progress indicators to Gross Domestic Product (GDP) as a means towards sustainable development, Policy Department, Economic and Scientific Policy, IP/A/ENVI/ST, October.
Eurostat (2015), Smarter, greener, more inclusive? Indicators to support the Europe 2020 Strategy, Eurostat Statistical Books, European Union, Luxembourg.
Eurostat (2011), Well-being and Sustainable Development, Final Report adopted by the European Statistical System Committee, Sponsorship Group on Measuring Progress.

263
International Monetary Fund (2016), Behind the scenes with data at the IMF: an IEO evaluation, IEO-IMF, Washington, February 25.
International Monetary Fund (2012), Recent Developments and Current Initiatives, Statistics Department, IMF, Washington.
International Monetary Fund (2009), The Financial Crisis and Information Gaps, Report to the G-20 Finance Ministers and Central Bank Governors, Prepared by the IMF Staff and the FSB Secretariat, October 29.
OECD (2015), How’s Life? 2015: Measuring Well-being, Better Life Initiative, OECD Publishing, Paris.
OECD (2015), Base Erosion and Profit Shifting Project, Final Reports, OECD Better Policies for Better Lives, Paris.
United Nations (1950), National Income Statistics of Various Countries 1938-1948, New York.
United Nations (2011), The Impact of Globalization on National Accounts, UN-ECE, Geneva.
United Nations (2016), Report of the World Bank on the interim activities of the International Comparison Programme, Statistical Commission, Forty-seventh session, CN.3/2016/10, 8-11 March.
World Bank (2014), Purchasing Power Parities and Real Expenditures of World Economies. Summary of Results and Findings of the 2011 International Comparison Program, Washington.
US Department of Commerce (1966), Long-Term Economic Growth 1860-1965: A Statistical Compendium, Washington, DC.
Analytical, statistical, monographic and sectorial sources
Adam, I., Marcu, N. (1956, 1959), Studii despre dezvoltarea capitalismului în agricultura României, după reforma din 1864, vol. I-II, Editura Ştiinţifică, Bucureşti.
Albu, Lucian-Liviu, Pelinescu, Elena, Scutaru, Cornelia (2003), Modele şi prognoze pe termen scurt. Aplicaţii pentru România, Editura Expert, Bucureşti.
Alessandrini, N.A. (1898), Statistica României de la Unirea Principatelor până în prezent, vol. I, II, Tipografia H. Goldner, Iaşi.
Alexandri, Cecilia, Davidovici, Ioan, Gavrilescu, Dinu (2003) (coord.), Tratat de economia agriculturii, Editura Expert, Bucureşti..
Alexandru, Bogdan (1935), Pavajele municipiului Bucureşti, Bucureşti.
Anastasiu, Oreste (1928), Industriile săteşti în raport cu localizarea marii industrii, Bucureşti.
Andreea, Ioan (1921), La situation de l’industrie minière metallurgique du Roumanie, Bucureşti.
Andrievici, Dumitru (1942), Creditul funciar-urban (1881-1941), Iaşi.

264
Anescu, V. (1964), Efortul economic al poporului român în războiul antihitlerist, Editura Militară, Bucureşti.
Antipa, Gr. (1929), L’occupation ennemie de la Roumanie et ses conséquences économiques et sociales, Les Presses Universitaires de France, Paris.
Antonescu, Petre (1929), Arcul de Triumf, Bucureşti.
Antoniu, C. (1939), Podul metalic de şosea peste Nistru între România şi Polonia, in: Buletinul Societăţii Politehnice, LIII, Bucureşti.
Apolzan, Lucia (1944), Portul şi industria casnică textilă în Munţii Apuseni, Institutul de Ştiinţe Sociale, Bucureşti.
Asquini, Victor, Prager, Emil (1942), Indicator tehnic în construcţii. Organizarea lucrărilor. Metode de lucru. Analize de preţuri. Date tehnice, Cartea Românească, Bucureşti.
Assan B.G. (1904), O jumătate de secol de la introducerea maşinii cu abur în industria română (1853-1903), Tipografia Minerva, Bucureşti.
Axenciuc, Victor (1992, 1996, 2000), Evoluţia economică a României. Cercetări statistico-istorice 1859-1947, vol. I – Industria, vol. II – Agricultura, vol. III – Moneda-Credit-Comerţ Finanţe publice, Editura Academiei, Bucureşti.
Axenciuc, Victor (2008), Formarea sistemului industrial modern în România (1859-1914), Editura Academiei Române, Bucureşti.
Banu, Dr.G. (1935), Sănătatea poporului român, Fundaţia pentru literatură şi artă „Regele Carol II”, Bucureşti.
Banu, Fl. (2004), Asalt asupra economiei României de la Solagra la Sovrom (1936-1956), Editura Nemira, Bucureşti.
Baron, Mircea (2006), Din istoria mineritului aurifer în România – 1918-1948, Editura Universitară, Petroşani.
Baron, Mircea (2006), Societatea „Mica” – 1920-1948, Editura Universitară, Petroşani.
Báthory, L. (1999), Societăţile carbonifere şi sistemul economic şi politic al României: 1919-1929, Presa Universitară Clujeană, Cluj-Napoca.
Bădescu, C. (1943), Cadrul general de locuinţe ieftine, Bucureşti.
Băicoianu, C. I. (1932), (1939), Istoria politicii noastre monetare şi a Băncii Naţionale, vol. I, p. I, p. II; vol. II, p. I, p. II, Anexele 1 şi 2, Editura Cartea Românească, Bucureşti.
Bănescu, D. (1929), Câteva consideraţiuni asupra cerinţelor şoselelor. Construcţia şi preţul lor, Bucureşti.
Bejan, P.N. (1942), Cărbunii româneşti în economia naţională, în Buletinul I.R.E. nr. 3-4, Bucureşti.
Berindei, Dan (2010), În mijlocul cetăţii, Bucureşti.
Billek, G. (1926), Locuinţe ieftine, Craiova.
Botez, Constantin Th. (1979), Istoricul exploatărilor forestiere din România în perioada interbelică, Iaşi.

265
Botez, C., Urma, Dem., Saizu, I. (1977), Epopeea feroviară românească, Editura Sport-Turism, Bucureşti.
Bozga, Vasile (1975), Criza agrară în România dintre cele două războaie mondiale, Editura Academiei Române, Bucureşti.
Brancovici, Emil (1922), Organizarea comerţului cu cereale în România, Atelierele Tiparul Românesc, Bucureşti.
Brauner, H. (1936), Comerţul şi industria lemnului în România, Sibiu.
Brăteanu, I.C. (1912), Proiectul de lege pentru încurajarea industriei naţionale, Bucureşti.
Brătescu, Gh. (1976), Spitale vechi şi noi, Editura Medicală, Bucureşti.
Brătianu, Vintilă (1922), Politica de stat a lemnului, Tipografia Gutenberg, Bucureşti.
Brătianu, Vintilă (1927), La politique d’État du pétrole en Roumanie à la suite de la nouvelle Constitution et de Loi des mines, Cartea Românească, Bucureşti.
Budeanu, C. (1942), Situaţia politicii energetice, Bucureşti.
Budeanu, C. (1944), Problema electrificării în România, Bucureşti.
Bungeţianu, Constantin (1912), Les bois et forêts en Roumanie sous le rapport forestier, industriel et commercial, Georges Erèsat, Paris.
Bungeţianu, Constantin (1923), Le probléme du bois dans la Grande Roumanie, Bucureşti.
Busuioceanu, Dumitru (1912), Sistemele de arendare aplicate pe moşiile Academiei. Studiu economic, Socec et comp., Bucureşti.
Buşilă, Constantin (1931), Industria în cadrul actualei situaţii economice, Editura Scrisul Românesc, Bucureşti.
Buzatu, Gheorghe (1998), O istorie a petrolului românesc, Editura Enciclopedică, Bucureşti.
Calcan, Gheorghe (1997), Industria petrolieră din România în perioada interbelică. Confruntări şi opţiuni în cercurile de specialişti, Editura Tehnică, Bucureşti.
Camera de Comerţ şi Industrie, Cluj (1927), Industria şi bogăţiile naturale din Ardeal şi Banat, Tipografia Cartea Românească, Cluj.
Carabella, A.D. (1942), Marea proprietate. Exploatări şi realizări cu 100 prezentări documentare, vol. I, Tipografia SAR Marian, Bucureşti.
Caranfil, G. (1926), Studiu statistic asupra valorii leului, 1916-1925, Bucureşti.
Cassasovici, Corneliu (1922), La production de l’industrie textile, du coton et du chanvre en Roumanie, Bucureşti.
Casseli, D. (1935), Cum au fost Bucureştii odinioară, Bucureşti.
Cebuc, Alexandru (1967), Din istoria transporturilor de călători în România, S.P.C. Muzeul de istorie a oraşului Bucureşti, Bucureşti.
Cerchez, P. (1939), Aperçu général sur les raffineries de pétrole en Roumanie, Bucureşti.
Chicoş, Ştefan (1907), Meseriaşul român şi legea meseriilor, Tipografia Mihai Lazăr, Piteşti.

266
Chicoş, Ştefan (1909), Monografia stării meseriilor în Piteşti, Tipografia Mihai Lazăr, Piteşti.
Chivu, Luminița, (2002), Competitivitatea în agricultură, Editura Expert, Bucureşti.
Chivu, Luminiţa, Ciutacu, Constantin, Ioan Franc Valeriu (2003), Agricultura între restricţiile comerciale globale şi politicile comunitare, Editura Expert, Bucureşti.
Christodorescu, Gheorghe (1933), Problema dezechilibrului dintre preţurile agricole şi cele industriale, Documentar, litografiat, UCCI, Bucureşti.
Cîncea, Paraschiva (1969), Încercări de redresare a meseriilor în perioada 1864-1900, Studii de istorie, 1, Bucureşti.
Clopoţel, Ion (1928), Sociologie românească. Ancheta plăşilor muntoase Marginea, Almaj, Văşcău, Beniu, Cluj.
Colescu, Leonida (1900), La loi rurale de 1864 et la statistique des paysans devenues propriétaires, Bucureşti.
Colescu, Leonida (1903), Statistica animalelor domestice din România, Bucureşti.
Comşa, N. (1899), Cauzele progresului social şi criteriul intervenţionalismului, Bucureşti.
Constantinescu, G.K. (1930), Tratat de zootehnie generală, vol. I, Bucureşti.
Constantinescu-Ismail, N. (1934), Producţia şi valorificarea fructelor în România, Bucureşti.
Constantinescu-Ismail, N. (1940), Noi contribuţii la stabilirea numărului de pomi şi a producţiunii noastre de fructe, Bucureşti.
Constantinescu, Mihail N. (1942), Producerea şi folosirea energiei electrice în România, dezvoltarea ei raţională, Bucureşti.
Constantinescu, Mitiţă (coord.) (1938), Contribuţiuni la problema reorganizării creditului în România, vol. I, II, Editura Cartea Românească, Bucureşti.
Corduneanu, Dumitru (2010), Sistemul de transport naval în România în secolul XX, Editura C.T.A., Bucureşti.
Cornăţeanu, N. (1947), Economie agrară, vol. I-III, multiplicat, Bucureşti.
Cornăţeanu, Nicolae, (1935), Cercetări asupra rentabilităţii agriculturii ţărăneşti, Imprimeria Naţională, Bucureşti.
Costescu, George, (1944), Bucureştii vechiului regat, Bucureşti.
Cramariuc, Gh.P. (1931), Din satele Bucovinei, Bucureşti.
Crăciunescu, C. (1914), Exploatarea, industria şi comerţul lemnelor în România, Bucureşti.
Crăiniceanu, C. (1895), Igiena ţăranului român, locuinţa, încălţămintea, îmbrăcămintea, alimentaţiunea, Bucureşti.
Creangă, G.D. (1907), Proprietatea rurală în România, Editura Institutului de Arte Grafice „Carol Göbl”, Bucureşti.
Creangă, G.D. (1908), Creşterea arenzii pământului în bani şi dijmă, a preţurilor muncilor agricole, 1870-1906, Bucureşti.
267
Cresin, Roman (1945), Recensământul agricol al României din 1941, Imprimeria Institutului Statistic, Bucureşti.
Crupenski, C.E., Turburi, Gr.I. (1895), Asupra agriculturii României – studiu statistic, Bucureşti.
Cucu, Vasile (1970), Oraşele României, Bucureşti.
Davidescu, Th. (1930), Curs de urbanism, Bucureşti.
Deconinck, Henri (1940), L’industrie textile de la Roumanie, Bucureşti.
Decuseară, E.C. (1933), Conversiunea datoriilor agricole, Bucureşti.
Demetriad, P. (1921), Magazii cu silozuri pentru cereale în staţiile C.F.R. şi porturi, Bucureşti.
Demian, Petru V. (1935), Industria siderurgică de laminate în România (1921-1933), Studiu economic, Deva.
Diaconescu, Pantelimon (1915), Industriile casnice ţărăneşti de in, Bucureşti.
Dimitrescu, Gr.I. (1914), Die Grossindustrie Roumanien, Bonn.
Dimitriu, Sorin, Popescu, V.I., Popescu, Cătălin (2000), Istoria metalurgiei în România, Editura Bren, Bucureşti.
Dinculescu, Constantin (coordonare generală) (1981), Istoria energeticii şi electrotehnicii în România, vol. I, Electrificarea României de la primele începuturi până la anul 1950, Editura Tehnică, Bucureşti.
Dinu, Marin, (1999), Criza reformei. Eu sunt român?, Editura Economică, Bucureşti.
Dinulescu, D.I. (1947), Industria hârtiei în România, Editura Cartea Românească, Bucureşti.
Dobrescu, Emilian (2000), Romanian Transition Economy as a Weakly, Structured System, in: Starea societăţii româneşti după 10 ani de tranziţie, Bucureşti.
Dobrescu, Emilian M. (coautor) (1998), Băncile – mică enciclopedie, Editura Expert, Bucureşti.
Dobrescu, Tudor (1940), Industria rafinajului în România în perioada 1930-1938, Bucureşti.
Dobrovici, Gh.M. (1913), Istoricul datoriei publice a României, Bucureşti.
Dropu, Constantin (2007), Agricultura şi politicianismul. Un secol de politică agrară în România, Iaşi.
Duca, G.I. (1893), Raport general asupra C.F.R., Bucureşti.
Dumitraşcu, Ion (2008), Industria Aeronautică Română, Braşov (1925-1945), Editura Domino, Bucureşti.
Dumitrescu, Ilie (2009), Raţiunea utilizării indicatorilor compoziţi pentru compararea internaţională, în Revista Română de Statistică, Bucureşti.
Dumitru, Mihail, Diminescu, Dana, Lazea, Valentin (2004), Dezvoltarea rurală şi reforma agriculturii româneşti, Bucureşti.
Emilian, D.Şt. (1918), L’industrie en Roumanie, Socec et Comp, Bucureşti.

268
Emilian, D.Şt. (1919), Capitalul în industria din România, in: Analele statistice şi economice, nr. 3, Bucureşti.
Filipescu, C. (director editor) (1937-1942), Marea enciclopedie agricolă, vol. I-V, Editura P.A.S., Bucureşti.
Filipescu, C. (1939), Textilele României, 1939, Bucureşti.
Filipescu, Constantin, Hrana vitelor. Păşuni, fâneţe, plante de nutreţ, Bucureşti.
Filipescu, N. (1893), Raport asupra iluminării cu gaz şi electricitate a capitalei, Bucureşti.
Florinescu, Paul (1927), Tabele pentru calculul volumelor şi construcţia podurilor şi a fierăriei necesare, Bucureşti.
Frunzănescu, A., Dumitraşcu G. (1940), Munca cu vitele în agricultura noastră, Tiparul Românesc, Bucureşti.
Frunzănescu, A., Dumitraşcu G. (1940), Munca omenească folosită în agricultură, Tiparul Românesc, Bucureşti.
Galan, A.G. (1935), Monografia cooperaţiei de credit în România, Imprimeria Naţională, Bucureşti.
Galan, A.G. (1937), Cooperaţia şi agricultura în România, Bucureşti.
Galopenţia, Anton, Georgescu, George (1941-1942), 60 sate româneşti cercetate de echipele regale studenţeşti, vol. I-V, Tipografia Cartea Românească, Bucureşti.
Galopenţia, Anton, Onică, P. (1948), Recensământul agricol în Republica Populară Română din 25 ianuarie 1948, M.O. Imprimeria naţională, Bucureşti.
Ganea, Ioan, Croitoru, Marcel, Filomeno, Savin (editori) (1996), Electrificarea în România, 1951-1992, Editura Tehnică, Bucureşti.
Gavand, E.H. (1867), Chemins de fer roumains. Lignes de Bucarest à Piteşti et à Ploieşti, Bucureşti.
Gălătescu, V. (1945), Les societés privées d’assurance de Roumanie et la Régie Autonome des Assurances d’Etat, Bucureşti.
Georgescu, Gh.C. (1940), Industria de petrol în cadrul politicii economice româneşti, Bucureşti.
Georgescu, Liliana (1941), Localizarea şi structura industriei româneşti, Tipografia Cartea Românească, Bucureşti.
Georgescu Nina (1936), La production minière et métallurgique de la Roumanie en 1935, Bucureşti.
Ghiorghiţă, Eugen (1999), Protecţionismul industrial în perioada interbelică în România, teză de doctorat, Bucureşti.
Ghişa, V., Păunescu, Gh. (2001), Parteneriatul comercial extern al României (1900-2000), Bucureşti.
Ghiţescu, N.M. (1915), Studii industrial: industria făinei, Bucureşti.

269
Gigurtu, I. (1913), Dezvoltarea industriei în România, Industria mecano-metalurgică. Studiu economico-statistic, Craiova.
Gigurtu, I. (1916), Dezvoltarea industriei în România, Craiova.
Giurescu, C.C. (1976), Istoria pădurii româneşti din cele mai vechi timpuri până astăzi, Editura Ceres, Bucureşti.
Gomescu, Ioan (1922), Industria pielăriei în România, Bucureşti.
Greceanu, N. (1935), Problema zahărului în România. Intensificarea consumului la sate, Bucureşti.
Groza, Horia (1946), Economia de schimb şi agricultura ţărănească, Tipografia Tiparul Românesc, Bucureşti.
Hagi-Theodoraky, Dimitrie, Amintiri din trecutul negustoresc, industrial, al profesiunilor libere şi meseriilor de dincoace de Milcov, Bucureşti.
Haiduc, Ilie (1940), Industria aurului în România, Bucureşti.
Haşiganu, D.O. (1930), Statistica agricolă, producţia agricolă a României de la 1906 la 1928, Bucureşti.
Hălăuceanu, C. (1910), Fabricile de petrol din România şi legea contingentării, Bucureşti.
Herseni, Traian (1942), Drăguş, un sat din Ţara Oltului. Monografie sociologică, Bucureşti.
Ianculescu, C. (1934), Problemele agrare şi dezvoltarea industrială a României, Editura Geller, Bucureşti.
Ianculescu, P. Aurel (1928), Les richesses minière de la nouvelle Roumanie, Paris.
Ioaniţiu, George (1932), Industria cimentului în România, Imprimeria R. Sergies, Bucureşti.
Ioaniţiu, George, Costache, Nicolae (1929), Industria hârtiei în România, Imprimeria R. Sergies, Bucureşti.
Ionescu, Ion (de la Brad) (1866), Agricultura română din judeţul Dorohoi, Imprimeriile Statului, Bucureşti.
Ionescu, Lucian C. (1996), Băncile şi operaţiunile bancare, Institutul Bancar Român, Editura Economică, Bucureşti.
Ionescu, Paul (1919), Podul peste Borcea, Bucureşti.
Ionescu, Ştefan, Dezvoltarea edilitar-urbanistică a oraşului Bucureşti, la sfârşitul secolului XIX, Bucureşti.
Ionescu-Şişeşti, G. (1924), Structure agraire et production agricole de la Roumanie, L’Imprimerie Adevărul şi Dimineaţa, Bucureşti.
Ionescu-Şişeşti, G., Cornăţeanu, N. (1937), La réforme agraire en Roumanie et ses conséquences, Bucureşti.
Iordache, Gheorghe (1986), Ocupaţii tradiţionale pe teritoriul României, Craiova.
Iorga, Nicolae (1923), L’art populaire en Roumanie, Paris.

270
Iorga, Nicolae (1927), Istoria industriilor la români, Tiparul „Datina Românească”, Vălenii de Munte.
Isărescu, Mugur C. (2001), Reflecţii economice. Pieţe, Bani, Bănci, Editura Expert, Bucureşti.
Isărescu, Mugur C. (2006), Reflecţii economice. Contribuţii la teoria macrostabilizării, Editura Expert, Bucureşti.
Isărescu, Mugur C. (2006), Reflecţii economice. Politici ale Băncii Naţionale a României, Editura Expert, Bucureşti.
Iscu, Vasile (1916), Industria şi comerţul petrolului. Cu aplicaţiuni la rentabilitate şi administraţie, Bucureşti.
Iscu, Vasile (1937), Secătuirea zăcămintelor de ţiţei şi viitorul industriei petrolifere din România, Bucureşti.
Ivanov, Martin, Tooze, Adam (2007), Convergence on Declin on Europe’s Southeastern periferie? Agriculture, population and GNP in Bulgaria, 1892-1945, Journal of Economic History, 67.
Ivănescu, Dumitru (1972), Din istoria silviculturii româneşti, Bucureşti.
Ivănuş, Gheorghe (cooord.) (2004), Istoria petrolului în România, Bucureşti.
Jinga, Victor (1981), Moneda şi problemele contemporane, vol. I, II, Editura Dacia, Cluj-
Napoca.
Jormescu, C., Popa, Burcă (1907), Harta agronomică a României, Institutul de Arte Grafice „Carol Göbl”, Bucureşti.
Kiriţescu, Costin C. (1996), Un secol de frământări monetare, Editura Enciclopedică, Bucureşti.
Lazăr, Theodor, Derescu, Fr.-Robin (1901), Starea şi statistica meseriaşilor, Bucureşti.
Leon, Gh.N. (1940), Finanţele administraţiei locale, Bucureşti.
Leonăchescu, Nicolae (1927), Introducere în istoria construcţiilor în România, Bucureşti.
Leonida, Dimitrie (1915), Din istoricul instalaţiilor mecanice şi electrotehnice ale oraşului Bucureşti, Bucureşti.
Lupan, Horia (1936), Anchetă statistică asupra preţurilor de vânzare şi arendare a pământurilor în România, Imprimeria Naţională, Bucureşti.
Maer, M.T. (1926), Drumurile de fier. Date istorice şi biografice, vol. I, II, Bucureşti.
Madgearu, N., Virgil (1911), În chestia meseriaşilor, Bucureşti.
Madgearu, N., Virgil (1914), Cercetări despre industria la domiciliu, Bucureşti.
Manoilescu, Mihail (1923), Politica producţiei naţionale, Editura Cultura Naţională, Bucureşti.
Manuilă, Sabin, Georgescu, D.C. (1938), Populaţia României, Editura Institutului Central de Statistică, Bucureşti.

271
Marcu, D. (1931), Arhitectură şi clădiri. Contribuţii la istoria dezvoltării arhitecturii în România de la 1891 şi până azi, Bucureşti.
Marin, Henri (1898), Călăuza conducătorului de lucrări, Bucureşti.
Mănescu, Constantin (1908), Istoricul C.F.R., vol. I, II, Bucureşti.
Mincu, Ion (1933), Întreprinderile comunale în România, Bucureşti.
Mincu, Ion (1938), Problema finanţării întreprinderilor comunale, Bucureşti.
Mircea, C.R. (1902), Efectele aplicării legii pentru încurajarea industriei naţionale, Bucureşti.
Mişicu, Vangheli (1940), Dare de seamă asupra mersului Căilor Ferate Române, Bucureşti.
Mitchell, Brian R. (2003), International Historical Statistics-Europe, 1750-2000, Palgrave Macmillan, Houndmills.
Molnar, C. (1949), Tehnica morăritului, Timişoara.
Mrazec, L. (1938), Le développement de l’exploitation minière en Roumanie, Bucureşti.
Munteanu, Enric (1934), L’industrie métalurgique en Roumanie, Imprimeria Naţională, București.
Nacian, I.I. (1893), Industria indigenă şi comerţul exterior; forţele productive ale României, Bucureşti.
Nicolae, Gheorghe (1932), Desfiinţarea prestaţiei, Bucureşti.
Obedenaru, M.G. (1869), La Roumanie économique d’après les données les plus recentes, Bucureşti.
Otiman, Ion Păun (1997), Dezvoltarea rurală în România, Editura Agroprint, Timişoara.
Pamfilie, Tudor (1910), Industria casnică la români, Bucureşti.
Panaitescu, Alexandru (1941), Agricultura ţărănească. Cauzele care au făcut-o să nu progreseze. Cum trebuie organizată, Bucureşti.
Panaitescu, N.P. (1932), Politica industrială într-o ţară agricolă şi în special în România, Tipografia Libertatea, Bucureşti.
Papp, Ioan (1941), Organizarea întreprinderilor comunale, Bucureşti.
Pascu, Iuliu (1937), Drept urbanistic şi sistematizarea Bucureştiului. Norme, plan de sistematizare, Bucureşti.
Paşcanu, Sergiu (1929), Industria uzinelor electrice în România, Bucureşti.
Pavel, Dorin (1933), Plan général d’aménagement des forces hydrauliques en Roumanie, Bucureşti.
Pavlescu, Eugen (1939), Economia breslelor în Moldova, „Fundaţia Regele Carol II”, Bucureşti
Păianu, N.I. (1906), Industria mare 1866-1906, Bucureşti.
Perton, Maurice (1975), Oil on the Romanian State 1895-1948, Oxford.

272
Petrescu, Nicolae (1921), Industria textilă în România şi posibilităţile ei de dezvoltare, Bucureşti.
Pizanty, Mihail (1929), Les problemes actueles de l’industrie pétrolière roumaine. Aperçu général du point de vue économique, statistique et juridique, Triumful SA, Bucureşti.
Plătăreanu, N. (1933), Politica industrială, Studii şi rapoarte alcătuite de secţiile economice ale cercului central de studii PNL, Bucureşti.
Pleşa, I. (f.a.), Studiu economic, social şi sanitar al regiunii carbonifere Dâmboviţa, Turnu Măgurele.
Popa-Vereş, M. (1938), Geneza şi morfologia vieţii economice româneşti. O schemă (Lito, C. Ionescu), Bucureşti.
Popescu, Claudia Rodica (2000), Industria României în secolul XX. Analiză geografică, Bucureşti.
Popescu, V. (1968), Realizări în construcţiile metalice în perioada 1867-1920, Bucureşti.
Popp, Aurel N. (1916), Industria cimentului în România, Bucureşti.
Prager, Emil (1963), Centenarul dezvoltării construcţiilor în România, Buletinul ştiinţific al Institutului de Construcţii, Bucureşti.
Profiri, Nicolae (1932), Norme practice, tehnice şi economice la executarea lucrărilor de drumuri, Bucureşti.
Profiri, Nicolae (1937), Problema drumurilor noastre, Bucureşti.
Racoviţă, Raphael (1921), Din istoria marii industrii în România. Industria hârtiei, Bucureşti.
Radu, Elie (1903), Alimentarea cu apă a oraşelor, Bucureşti.
Radu, Elie (1913), Starea şoselelor şi mijloacele de îndreptare, Bucureşti.
Raiciof, George (1946), Gazele naturale în România, Bucureşti.
Rainu, Aurel (1940), Materiale de construcţii de origine pământoasă din România, Bucureşti.
Rarincescu, Ion (1930), Electrificarea României, IRE, Bucureşti.
Rarincescu, Ion (1943), Privire retrospectivă în politica energiei, Bucureşti.
Rădulescu, Al. Florian (1940), Problema agrară şi nevoia de industrializare a României, Cluj-Napoca.
Reuţ, V. Radu (1933), Protecţionismul industrial în România, Arte Grafice Glasul României,
Cernăuţi.
Roceric, Ioan Alexandru (1937), Meseriile şi mica industrie în România, Bucureşti.
Ronnas, Per (1984), Urbanization in Romania. A geography of social and economic change since independence, Stockholm.
Sabău, Vasile (1937), Organizarea producţiei forestiere în cadrul unei politici economice naţionale, Bucureşti.
Sabău, Vasile (1937), Politica de amenajare a pădurilor româneşti în lumina statisticii, Bucureşti.

273
Sachelarie, P. (1935), Locuinţa urbană, Bucureşti.
Săndulescu, Paul (1936), Istoricul pavajelor bucureştene. Studii şi documente, Bucureşti.
Sburlan, D. (1929), Holzproduction, Holzindustrie und Holzhandel in Rumänien, Bucureşti.
Sburlan, D., Ionescu, C.I. (1932), Les conditions forestières de la Roumanie. Production, industrie et commerce du bois, Bucureşti.
Sfinţescu, Cincinat (1931), Urbanism în general şi în România în special, Bucureşti .
Sfinţescu, Cincinat (1933), Urbanistică generală, vol. I-VIII, Bucureşti.
Slăvescu, Victor (1928), Analiza critică a bilanţului unei întreprinderi, Curierul Judiciar, Bucureşti.
Stahl, H.H. (1964), Casa ţărănească la români în sec. XIX, Cluj.
Stănciulescu, A.N. (1907), Industria frîngheriei în România, Râmnicu Vâlcea.
Stănculescu, P. (1927), Case şi gospodării la ţară, Bucureşti.
Stănculescu, P. (1943), Organizarea şi sistematizarea satelor, Bucureşti.
Stănculescu, P.P., Ştefănescu, C. (1941), 60 sate româneşti II, Situaţia economică, Tipografia Cartea Românească, Bucureşti.
Stinghie, V. (1920), Rezerva lemnoasă a ţării, Bucureşti.
Stinghie, V., Sburlan, D. (1930), Agenda forestieră, Bucureşti.
Strat, George (1929), Industrii şi meserii române, Bucureşti.
Şandru, D. (1985), Creditul agricol în România, 1918-1944, Editura Academiei Române,
Bucureşti.
Şerban, Mihail (1914), Problemele noastre social-agrare, Bucureşti.
Taşcă, Gh., Rolul micii industrii în viaţa economică a statului nostru, Editura Cercului de Studii al UGMI, Bucureşti.
Taşcă, Gh. (1942), Preţul de vânzare al produselor agricole faţă de preţul de cost şi repercusiunea lor asupra producţiei solului, Bucureşti.
Tatos, I.I. (1940), Valorificarea produselor agricole, Bucureşti.
Tatos, I.I., Ivănescu, I. (1941), Industria morăritului în România, Independenţa Economică, Bucureşti.
Tăruşanu, Radu (1940), L’industrie du savon, de bougies et de la glycérine, Bucureşti.
Theodorescu, C.S. (1938), Finanţarea lucrărilor edilitare, Bucureşti.
Theodoru, Henri (1929), Chestiuni edilitare la noi. O ramură de lucrări publice productive, Buletinul Societăţii Politehnice.
Topa, Ioan (1968), Istoria oraşului, Bucureşti.
Topliceanu, Alexandru (1923), Locul ocupat de industrie în complexul economic al României, Bucureşti.

274
Tutuc, I. (1916), Împrumuturile publice ale României 1864-1916, Bucureşti.
Ţiculescu, Dumitru (1937), Costul de producţie în agricultură, Tipografia Dimitrie Cantemir, Bucureşti.
Ţiculescu, Dumitru (1943), Agricultura şi evoluţia preţurilor la cereale în România de la 1922 la 1939 inclusiv, Imprimeria Monitorul Oficial, Bucureşti.
Varga, E. (1937), World Economic Crises, 1848-1935, Comparative Data, Moscow.
Vasiliu, Ioan C. (1945), Disponibilităţi de muncă omenească şi animală în agricultura României, Tipografia Remus Cioflec, Bucureşti.
Văcărel, Iulian (1970), Finanţe, vol. I, Editura Didactică şi Pedagogică, Bucureşti.
Vântu, Ion G. (1939), Începuturi de legislaţie urbanistică în România, Bucureşti.
Vârtosu, Gh. (f.a.), Locuinţe pentru populaţia nevoiaşă, Bucureşti.
Wittner, E. (1938), Întreprinderile de electricitate din România, Sibiu.
Woytinski, W. (1926), Die Welt in Zahlen, 7 Buchs, Rudolf Mosse, Buchwerlag, Berlin.
Woytinski, W.S. (1956), World Population and Production, New York.
Zaharia, P.A. (1934), Apărarea şi consolidarea malurilor de nord-est ale oraşului Constanţa. Evaluarea lucrărilor, Bucureşti.
Zaman, Gheorghe (1987), Technological Progress and Material Costs, Bucureşti.
Zaman, Gheorghe, Vasile, Valentina (coord.) (2005), Structural Developments of Romanian Exports, vol. III, Editura Expert, Bucureşti.
Zane, G. (1970), Industria din România în a doua jumătate a secolului al XIX-lea. Despre stadiile premergătoare industriei mecanizate, Editura Academiei Române, Bucureşti.
AGER (1937), Aspectele crizei româneşti în cadrul crizei mondiale, Tipografia Bucovina, Bucureşti.
CEC Centenarul Casei de Economii şi Consemnaţiuni, 1864-1964, Bucureşti.
Direcţia Centrală de Statistică (1949), Recensământul întreprinderilor industriale din 15 noiembrie 1948, vol. 1, Bucureşti.
Direcţia Centrală de Statistică (1969), Agricultura în Republica Socialistă România (1938-1968), Date statistice, uz intern, Bucureşti.
Direcţia Centrală de Statistică (1969), Comerţul interior în Republica Socialistă România (1938-1968), Date statistice, uz intern, Bucureşti.
Direcţia Centrală de Statistică (1969), Investiţii-construcţii în Republica Socialistă România (1938-1968), Date statistice, uz intern, Bucureşti.
Direcţia Centrală de Statistică (1969), Transporturile şi telecomunicaţiile în Republica Socialistă România (1938-1968), Date statistice, uz intern Bucureşti.
Direcţia Generală a Statisticii (1920), Statistica clădirilor şi locuinţelor pe baza recensământului general al populaţiei din 19 decembrie 1912/1 ianuarie 1913, Bucureşti.

275
Institutul Central de Statistică (1938), Recensământul general al populaţiei României din 29 decembrie 1930, Vol. X – Întreprinderi industriale şi comerciale, M.O. Imprimeria Naţională, Bucureşti.
Institutul Central de Statistică (1947), Întreprinderile particulare industriale, comerciale şi de transport. Rezultate provizorii ale inventarierii din octombrie 1947, vol. I, M.O. Imprimeria Naţională, Bucureşti.
L’Institut International d’Agriculture (1903), Réponse Officielle de la Roumanie au Questionaire établi par la délégation du Comité permanent de L’Institut, Bucureşti.
Ministerul Agriculturii şi Domeniilor (1940), Realizări agricole, 1930-1940, Bucureşti.
Ministerul Economiei Naţionale (1941), Industria românească 1930-1940, Institutul de Arte Grafice „Lupta”, Bucureşti.
Ministerul Industriei şi Comerţului (1908), Ancheta cu privire la meseriaşi şi la aplicarea legii pentru organizarea meseriilor, partea I, Bucureşti.
Ministerul Industriei şi Comerţului (1911), Proiect de lege pentru organizarea meseriilor, creditului şi asigurărilor sociale, Bucureşti.
Ministerul Industriei şi Comerţului (1921), Ancheta industrială din anul 1920, Bucureşti.
*** (1904), Ancheta industrială din anii 1901-1902, vol. I-II, Bucureşti.
*** (1907), Monografia meseriaşilor din judeţul Botoşani, Dorohoi şi Suceava, Botoşani.
*** (1908-1909), Anchetă cu privire la meserii şi la aplicarea legii pentru organizarea meseriilor, vol. I-II, Bucureşti.
*** (1909), Studii şi rapoarte asupra industriei mari încurajată de stat, Bucureşti.
*** (1938), Evoluţia preţurilor de gros pe piaţa Bucureşti, 1926-1938, București.
*** (1971), Istoricul dezvoltării tehnice în România, vol. I-III, Bucureşti.
*** (1995), Banca Naţională a României, Bucureşti.
*** (2004), Recensământul General Agricol, 2002, Bucureşti.
Periodical sources
Agricultura nouă, 1920-1947.
Almanahul industriei, 1908-1911.
Amicul agricultorului, 1890-1912.
Anale statistice, 1860-1863.
Anale statistice şi economice, 1864-1869.
Analele Academiei Române, 1881-1915.
Memoriile secţiunii literare Analele economice şi statistice, 1918-1946.
Analele industriei şi comerţului, 1936-1940.
Analele Institutului de Cercetări Agronomice al României, 1929-194.1

276
Analele Ministerului Lucrărilor Publice, 1893/1901, 1907, 1918, 1943/1944.
Annuaire international de statistique agricole, 1910-1914, 1920-1939, Roma.
Annuaire statistique de la France, 1890-1966.
Annuaire statistique de la Société des Nations, 1924-1940.
Annuaire statistique international, 1913-1939.
Anuarul de comerţ exterior al României, 1994-1996, 1998, 2001.
Anuarul Ministerului Lucrărilor Publice, 1892-1916.
Anuarul P.T.T., 1926-1938.
Anuarul statistic al oraşului Bucureşti, 1879-1936
Anuarul statistic al României, 1904, 1909, 1912, 1915-1916, 1922-1940, 1948, 1957-2001, 2015, Serii de timp 1990-2012.
Anuarul statistic CFR, 1926-1938.
Balanţa de plăţi, Banca Naţională a României, 1996-2002, Bucureşti.
Breslaşul român, 1899-1903.
Bugetul general de venituri şi cheltuieli, 1862-1948 (Cuprinde şi bugetele anuale ale ministerelor, regiilor autonome şi regiilor comerciale care se publicau in extenso şi separat. Publicaţia Ministerului de Finanţe a avut în diferite perioade denumiri diferite).
Buletin informativ pentru departamente economice – trimestrial – 1947, 1948.
Buletin lunar și trimestrial, Banca Naţională a României, 1993-2001, Bucureşti.
Buletin statistic al Casei Autonome a Pădurilor Statului, 1934-1945.
Buletinul Antreprenorilor, organ al intereselor antreprenoriale de lucrări publice şi particulare, 1906-1912.
Buletinul Asociaţiei generale a producătorilor şi distribuitorilor de energie electrică din România, 1922-1943.
Buletinul Camerei de Comerţ şi Industrie, 1889-1914, 1921-1940, Bucureşti.
Buletinul drumurilor, Casa Autonomă a Drumurilor de Stat, 1920-1931.
Buletinul industriei, 1920-1921, 1926-1929.
Bulletin d’information et de documentation (Banque Nationale de Roumanie), 1929-1947.
Buletinul informativ al Ministerului Agriculturii şi Domeniilor, 1930-1947.
Buletinul Institutului Român de Energie, 1930-1943.
Buletinul Institutului Român pentru Betoane, Construcţii şi Drumuri, 1936-1940.
Buletinul Ministerului Agriculturii şi Domeniilor, 1907-1914, 1920-1929.
Buletinul muncii, cooperaţiei şi asigurărilor sociale, 1925-1928-1944.
Buletinul Societăţii Politehnice din România, 1880-1938.
277
Buletinul statistic al României, 1892-1945.
Buletinul statistic CFR, 1928-1935, 1940-1947.
Buletin trimestrial, Institutul Românesc de Conjunctură, 1933-1936.
Bursa, 1905-1948.
Casa Pădurilor Statului (1923-1924), Statistica Pădurilor din România din anul 1922, vol. I-III, Chişinău.
Comerţul exterior al României, 1870-1944.
Compass Rumänien, 1927, 1929, 1940-1944.
Comunicări statistice, 1945-1948.
Conjunctura economiei româneşti, 1936-1940.
Construcţii publice şi particulare, 1928-1930.
Correspondance économique roumaine, 1926-1934.
Curierul lucrărilor publice şi al licitaţiilor, 1923-1930.
Curierul UGIR, 1945-1947.
Dare de seamă a Serviciului Maritim Român pe exerciţiul anului bugetar, 1906-1938.
Dare de seamă a Uniunii Camerelor de Comerţ şi Industrie, 1922-1940.
Dare de seamă asupra activităţii Casei Pădurilor, 1920-1926.
Dare de seamă statistică asupra activităţii întreprinderilor comercializate ale statului, 1935-1940.
Dare de seamă statistică asupra exploatării Căilor Ferate Române, 1896-1912, 1935-1936, 1940-1941.
Economia naţională, 1887-1915, 1919-1940.
Economia română, 1940-1944.
Economia rurală, 1877-1904.
Economic Outlook, 1990-2000, OECD.
Economistul, 1990-2010.
Edilitatea, organ de îndrumare şi critică edilitară, 1928-1930.
Evoluţia economiei româneşti, 1940-1948.
Expunere de motive la bugetul general al Ministerului de Finanţe, 1877-1948 .
Expunerea situaţiei lucrărilor publice, agriculturii şi comerţului, 1868-1870, 1874, 1880, 1887, 1901, 1922, 1926.
Expunerea situaţiei tezaurului public, Ministerul de Finanţe, 1887-1940
Gospodăria comunală şi judeţeană, 1922-1923, 1927.

278
Independenţa economică, 1919-1947.
Indicatorul industriei româneşti, 1920-1941.
L’industrie roumaine, 1904-1916.
International Financial Statistics, 1970-2010, IMF.
Journal of Economic Forecasting, 2004-2010.
Meseriaşul de încălţăminte, 1909-1910, 1920, Bucureşti.
Meseriaşul executor, Piteşti, 1911-1915.
Meseriaşul român, 1887-1890, Iaşi.
Meseriaşul român, 1900-1919, Bucureşti .
Mişcarea salariilor, 1923-1934.
Moniteur commercial roumain, 1908-1916.
Monitorul de locuinţe, 1933-1934
Monitorul licitaţiilor publice şi particulare, 1891-1943.
Monitorul Lucrărilor Publice, 1893/1894-1901, 1919-1943/1944.
Monitorul petrolului român, 1900-1948.
National Accounts Statistics, Main Aggregate, Database, 1980-2005, UN Statistics Division
Probleme economice, 1948-1970.
Raport anual, Banca Naţională a României, 1991-2001, Bucureşti.
Revista Asociaţiei Generale a Conducătorilor de Lucrări Publice, 1906-1943.
Revista pădurilor, 1890-1947.
Revista română de economie, 1990-2010.
Revista română de statistică, 1949-2002.
Sănătatea publică, 1920-1939.
Situaţia financiară a judeţelor, 1896-1901.
Situaţiunea tezaurului public al României, 1887-1938.
Statistica agricolă a României, 1870-1876, 1901-1940, 1941-1947.
Statistica animalelor domestice, 1900-1945 (la recensăminte şi unele înregistrări anuale).
Statistica impozitelor directe, 1923-1931.
Statistica industriei extractive, 1897-1912, 1922-1935-1944.
Statistica judiciară a României, 1874-1914, 1922-1939.
Statistica minieră, 1902-1903, 1914-1915, 1920-1934.
Statistica preţurilor, 1910-1914, 1920-1932, 1937-1942.

279
Statistica societăţilor pe acţiuni, 1918-1919, 1921-1931, 1933-1935-1940.
Statistica succesiunilor, 1905.
Statistica uzinelor electrice din România, 1922-1938, 1940-1941.
Statistique internationale de l’agriculture, 1873, Nancy.
Urbanismul, 1932-1939.
Viaţa economică, 1963-1984.
World Economic Outlook, 1990-2010, IMF.
280
Addendum 1
Foreword to the Romanian edition
Professor Vergil Voineagu, President of National Institute of Statistics136
Result of long and laborious research on Romania’s development, over almost 140
years, Professor Victor Axenciuc’s study “Romania's Gross Domestic Product duringthe
1862 - 2000 periods”, is a book that really deserves this qualification. It even exceeds it due
to its amplitude, originality, and, last but not least, by its analysis demonstration, converted
into a rigorous synthesis achieved with a minimum of text meant to maximize the share of
information hosted by any word, by any figure.
If I am allowed to make the comparison, it is a work which reminds one of those
titanic endeavours developed in other temporal areas of the spirit by Bogdan Petriceicu
Hașdeu with his infinite dictionary of Romanism, “Etimologicum Magnum Romaniae”, or by
Nicolae Iorga, when he decided to settle on the historian's study table his “Codex
Hurmuzachi”.
Well, professor Victor Axenciuc places Romania’s undistorted image at the disposal
of today’s statisticians and economists, and especially those of the tomorrow, by
reconstructing a historical series of the most comprehensive macroeconomic indicators. The
literature of countries with an old and recognized reputation for the seriousness of their
statistics sums up the creative efforts of dozens of researchers gathered in institutions, clearly
benefiting from an important public support, but Victor Axenciuc and the few collaborators
that followed him in this audacious approach, have achieved everything alone.
He had the patience, dedication, tenacity, in a word the devotion to offer the Romanian
economic science the meeting of an objective, craved by many, but achieved by noone so far.
Testimony to this notorious oneness are the previous writings and studies of the
scientist Victor Axenciuc, which are exemplary for restoring the figures placed
chronologically, coherently and consistently in the book of the history of Romania’s national
economy.
The author’s efforts are worth mentioning in the present foreword, as is his group of
collaborators who helped to conceptualize the study, identify sources of data and information,
elaborate approaches and procedures, formulate and describe the historical conditions,
operate calculations, techniques and methods of aggregation of the available data and
136 Victor Axenciuc, Produsul Intern Brut al României 1862-2000, Editura Economică, Vol. I, București, 2012.

281
information, adopt the solutions considered the most relevant and compile data sets, that one
will hardly be able to challenge otherwise than by repeating the whole process. The best,
though, would be to leave things as they were designed by professor Axenciuc, in order to be
able to value them all, and especially use them when life and the tormented history of this
nation will require it, as a need, without which our society could not shape its perspective for
development.
The magnitude of the documents studied by the author is impressive, as well as the
way he explored similar studies, international and domestic – the latter, unfortunately, not
very, the way he knew to approach statistical methods and techniques, by valuing the
information, most often inconsistent and irrelevant, due to objective circumstances,
vicissitudes and precarious times, which were not generous with the statistical approaches
and efforts of our great predecessors in order for them to provide a statistical material, if not
complete and relevant, at least consistent through its compatibility and comparability.
This assertion refers not only to the 1862-1947 period, which has its specificity by the
nature of its attempts of that time to develop statistics in consonance with the European
approach, but also to the period of the centralized planned economy, in which most of the
approaches at a methodological and statistical level, subordinated to the material production
system, were totally detached from the European statistical system, resulted from which its
substantial differences between the material production system and the system of national
accounts. I will not go into details on these issues because they are synthetized with effective
clarity and sharpness by the author and they shall become evident with the first reading of the
book.
Professor Axenciuc’s knowledge and, why not, his courage and temerity facing an
endeavour of maximum difficulty and exceptional complexity should be highlighted.
The study is conditioned by two essential elements. The first one is the development
of time series of the quantitative expression of economic growth indicators evolution in
general, of its core sectors, of the compatibility and comparability congruence of these series,
which, par excellence, represents the task of the national statistics office, namely the National
Institute of Statistics. This is, or should be, the best equipped in order to be able to settle, in a
unitary conception, the historical time series, this being not only a task, but also an obligation
to the present and future generations. The second one is the idea of drafting historical time
series, which inspired us too, members of the National Institute of Statistics, with the intention
to offer them to us and posterity, when in 2009 we commemorated 150 years of official
statistics. But the lack of funds and, especially, of the human resources to allocate to the

282
study, forced us to stop on just editing a short history of the Romanian statistics. But we are
satisfied with having made available to professor Axenciuc all the materials he requested and
which he used in the best possible way.
The information and statistical data which constituted the basis for the author’s
information is spread beyond the statistical publications, unfortunately rather limited in
volume during the period before 1990, so that he was also offered the sole alternative to
accede to information so far confidential and unused. Therefore, we are considering the
declassification of confidential aggregate information and make it available to users through
our databases over a defined period of time.
I particularly appreciate the solution adopted by professor Axenciuc when using
adequate converters according to scientific criteria and especially when using the purchasing
power parity as a conversion and transformation element in a sole currency, in this case the
dollar, in order to create the conditions of coherence and sustainability for data series.
Otherwise, any other alternative sources, some identifiable with international organizations,
such as the World Bank based on the exchange rate, or others, would have been justly
criticized.
In conclusion, from now on, we shall need relatively more time to get deeper into the
content of the study’s statistical data and information, into the structures and in the absolute
and relative data series expression and, especially, into the techniques, methods and solutions
adopted by the author.
Irrespective of the way of action from now on, irrespective of the procedure or manner
of use of this admirable study, researchers of the future will be forced to recognize its
scientific value, the author’s successful symbiosis to masterly approach both the scientific
research and the applicative aspect, which gives the study the character of reference work, par
excellence.
Bucharest, 2011
Professor Vergil Voineagu, Ph.D.
President of the National Institute of Statistics
283
Addendum 2
Historical background and aknowledgements
for the Romanian edition137
This paper is the result of the research carried out by the author in the past four
decades, reflecting the effort of previous studies in various forms and variants of the national
income in Romania, calculated according to the system of material production (SMP) for the
1862-1938 period, to the gross domestic product in Romania, under the System of National
Accounts (SNA) for the 1862-2000 period, according to the statistical methodology under the
current structure.
The setting up of the national economy synthetic indicators was made according to the
production method, for reasons described in the methodological introduction of the paper.
The research work covers the 1862-2000 period, arranged in three successive sub-
periods, intervals: 1862-1947, 1950-1979, 1980-2000, out of which three modules with
specific information and methodology have bases resulted: a) the component of the 1862-
1947 period, representing the core work of the paper, was drafted according to the
information collection and processing for primary operations to the elaboration of the GDP
synthetic indicators; b) the module of the 1950-1979 period was achieved by converting data
on the national income according to SMP, displayed in the official statistics, to the gross
domestic product; c) the component of the 1980-2000 period was achieved through the
transposition, in comparable prices, of the GDP data published in current prices, obtained
from the National Institute of Statistics138 and the National Bank of Romania139.
In order to provide comparability for the entire period, the indicators of the three sub-
periods, calculated initially in comparable national prices, specific to each period – 1913 lei,
1963 lei, 1990 lei – were brought to a common denominator by converting the data in lei into
international dollars at the purchasing power parity – PPP – of years 1990 and 2000.
The calculations of homogenization and compatibility of the statistical data are
explained in detail in the methodological introduction to each module.
The completed project looked as follows:
137Victor Axenciuc, Produsul Intern Brut al României 1862-2000, Editura Economică, Vol. I, București, 2012. 138Statistical Yearbook of Romania, 1990, 1991, 1996, 2001. 139National Bank of Romania, Annual Reports, 1991, 1995, 1997, 2002

284
Romania’s Gross Domestic Product 1862 - 2000
Secular Statistical Series and Methodological Arguments
1st volume Romania’s Gross Domestic Product 1862-2000. Synthesis of global
indicators time series, by temporal sections
Section A Gross Domestic Product during the 1862-2000 period; general synthesis
of the integral statistical series of synthetic indicators, expressed in
comparable prices, 1990 and 2000 PPP dollars; comparisons with
Romania’s GDP calculated by several foreign sources.
Section B Gross Domestic Product during the 1862-1947 period; synthesis of
indicators according to the calculations detailed in the 2nd volume of the
present paper; series of indicators displayed in comparable prices, 1913
lei, 1990 and 2000 PPP dollars.
Section C Gross Domestic Product during the 1950-1979 period; conversion
calculations of the national income data (SMP) in gross domestic product,
series of indicators displayed in comparable prices, 1963 lei, 1990 and
2000 PPP dollars
Section D Gross Domestic Product during the 1980-2000 period; compatibility
calculations in comparable prices; series of indicators expressed in 1990
lei, 1990 and 2000 PPP dollars.
Addenda Archive studies and genuinely innovative researches; statistical
methodology and information related to Romania's gross domestic
product.
2nd volume Romania’s Gross Domestic Product 1862-2000. Detailed calculations
and methods for compiling the series of indicators, according to
resource activities, consisting of the following:
1. Agriculture and forestry: vegetal and animal agricultural production,
forestry, fisheries, and others.
2. Industry: mining industry, electric power industry, large manufacturing
industry, handicraft and household production.
3. Constructions: production of public buildings, transport routes, industrial
constructions, urban constructions, housing and others.
4. Transport and communications: railway transport services, animal
traction, automotive services, electric services, river and sea services,
285
communications and telecommunications.
5. Trade: commercialization of agricultural, industrial and other products,
on the domestic market, foreign trade of import and export.
6. Banking and financial services, insurance services.
7. Public administration, defense: education, health, culture, cults, social
assistance and others.
8. Use of real estate property, imputed rents.
9. Services of domestic employed workers.
10. Services of free professions.
Bibliography Theoretical, methodological, historical sources.
Analytical, statistical, monographic sources, branches.
Periodical sources.
The author undertook the elaboration of the study starting from the importance and
need of knowing one of the most relevant issues of Romania’s structure and dynamics of the
economic progress, in terms of its synthetic indicators, of its gross domestic product by
resources. In the research the author adopted and applied, with severe rigor, those criteria
backing the calculations, checked by strict methods, demanding the removing possible errors
that would have resulted in the deformation of the results and thus ensuring the accuracy of
data, so that they expressed more precisely the real value of the static indicators, making the
data be closer to the historical reality.
As with any original theme, the quality and usefulness of these GDP statistical series
will be certified by the future practice of knowledge and by further research in the field. We
emphasize that for the indicator construction operations, the criteria and methodologies are
explained so that the resulting data can be verified or possibly reconstructed in a better shape,
by interested authors, there, in the case they would enjoy richer and more relevant statistical
information as well as methodological improvements would be available.140
During the elaboration of the work, I have been guided by the conviction and
aspiration that data and indicators obtained will be used for scientific research of historians,
economists, sociologists, by all those who will undertake retrospective or prospective analyses
on Romania’s economic and social life. The statistics and macroeconomic indicator system,
140 In a forthcoming paper, based on 1862-2000 GDP series, the national product-national income will be calculated, and the analysis of the dynamics and structure of these synthetic indicators will be drafted. At the
same time, both limitations and reservations will be expressed by some authors on the scope and ways of estimating these macroeconomic aggregates.

286
over long periods of time, may therefore constitute landmark fundamentals for policies
targeting the economic present and future of our country, focusing on cyclical characteristic
secular developments and the nature of social and economic disparities and possibilities for
convergence in European and global context.
At the end of this long investigations I realize how much truth is in Seneca’s words:
“Much remains to be done and much will remain. No one will be deprived of the chance to
add something”.
Any elaboration, especially one with a historical profile, is based on our predecessor’s
creative heritage; and for this paper, the information and analyses of the Romanian
economists of the last century and a half, starting with D. P. Martian until now, have been
very useful. I express gratitude to all those who, by their work, facilitated my investigation.
Special thanks are due primarily to my collaborators who have supported the
development of the paper according to their training and capacity; I will mention them
alphabetically: researchers Adrian Corcodel, Leontina Datcu, Gabriela Drăgan, PhD, Eugen
Ghiorghiţă, PhD, Daniela Poenaru, Cornel Sârbu, and assistants lecturers Roxana Iordache,
Adriana Marin, Georgeta Niţă, Georgeta Rőrich.
I received a sustained support on behalf of the Scientific Council of the Institute of
National Economy of the Romanian Academy where the study, in its variants, was debated in
the latest two decades. In this respect evaluation reports, with substantial improvement
solutions, were developed by the following: Prof. Emilian Dobrescu, member of the
Romanian Academy, Prof. Costin C. Kiriţescu, member of the Romanian Academy, Vasile
Bogza, PhD, Constantin Ciutacu, PhD, statistician Elena Hlevca, researcher Vergiliu
Iordache, Maria Molnar, PhD, Maria Mureșan, PhD, Maria Poenaru, PhD, Marin Popescu,
PhD, Florin Pavelescu, PhD, Grigore Vâlceanu, PhD and other referents. These debates were
enhanced by the improvement proposals for the content of the study by the following
researchers: Prof. Gheorghe Zaman, president of the Scientific Council of the Institute of
National Economy, corresponding member of the Romanian Academy, Constantin
Grigorescu, PhD, Ion Bratu, PhD, Mircea Ciumara, PhD, Camelia Cămășoiu, PhD, Valentina
Vasile, PhD, Aurelian Dochia, PhD, George Georgescu, PhD, Steliana Perţ, PhD, Vasile Pilat,
PhD, Steliana Sandu, PhD, Sorica Sava, PhD, and others. The contribution of referents and
participants in the debates represented a scientific investment in the quality of future work; I
express my gratitude to all of them.
Of special importance was the discussion of the study in its final phase, in March
2011, within the extended Scientific Council of the Institute of National Economy. My thanks

287
to those who read the study with interest, making judicious comments and assessments: Prof.
Aurel Iancu, member of the Romanian Academy, Prof. Lucian Albu, member of the
Romanian Academy, Prof. Gheorghe Zaman, corresponding member of the Romanian
Academy, PhD Valentina Vasile, Ilie Dumitrescu, director of the National Institute of
Statistics, Prof. Ion Răvar, Maria Molnar, PhD, Florin Pavelescu, PhD. I address special
thanks to Prof. Vergiliu Voineagu, President of the National Institute of Statistics for the
extensive scientific report, displayed in the Council, with comments on the content and
importance of the study.
Part of the statistical and methodological information of the project on the national
income and, subsequently, on the gross domestic product, and valuable analyses on the
synthetic indicators, have been revealed from archival studies of the National Institute of
Statistics. I also considered useful the fruitful discussions on the methodology for calculating
synthetic indicators, in various stages of the research, with reputed statisticians from National
Institute of Statistics, among whom I wish to mention the following: Vasile V. Dumitrescu,
Ştefan Mateescu, Dumitru Şandru, Ilie Dumitrescu, Radu Halus, Maria Hlevca, Vladimir
Alexandrescu, etc. This work would have been difficult to accomplish, without the
documentary and methodological sources of the National Institute of Statistics.
The original information, obtained from various funds of the National Archives,
helped me a lot in preparing the project; in this regard I mention the consistent support that I
had on behalf of the head of the institution during this period, Ioan Scurtu, PhD and the
archives staff who granted me professional assistance.
In the recent years, the Romanian National Committee, the ESEN Reflection Group of
the Romanian Academy developed laborious debates on the draft of “Romania’s New
Encyclopedia”, created under the aegis of the Romanian Academy; the ones dedicated to the
theme of 2nd volume “Romania's Evolution. Main Body of National Statistical and Historical
Series and International Comparisons 1860-2007”, highlighted the important procedures and
methods with the view to structure and finalize our study “Gross Domestic Product”. I
express my special gratitude to Prof. Tudorel Postolache, member of the Romanian Academy,
initiator and coordinator of national encyclopedic work, for the valuable solutions proposed.
The entire work invested in this project could be taken into account with the support of
the National Bank of Romania. I gratefully thank the Board of Directors, the Bank’s
Governor, distinguished Prof. Mugur Isărescu, member of the Romanian Academy, who in
the spirit of the National Bank of Romania’s tradition of generosity and understanding,
supports and encourages the publication of Romanian cultural and scientific creation. Warm

288
thanks to Prof. Gheorghe Zaman, in his position as President of the General Association of
Economists of Romania and to Prof. Dinu Marin, Secretary General of the General
Association of Economists of Romania for the support with the purpose of publishing this
study.
The staff of the Economic Publishing House is entitled to receive my thanks, too, for
their professional support to issue this book.
I owe all my collaborators, researchers and academics, scientific personalities, who
offered me confidence and support throughout the entire writing process, who supported and
encouraged me in difficult moments and situations a debt of gratitude; I dedicate this work to
all of them, for everything they offered me, in deference to scientific research.
The author
October, 2011