gross regional domestic product...the gross regional domestic product (grdp) is a publication...
TRANSCRIPT

GROSS REGIONALDOMESTIC PRODUCT
Base Year: 20002010– 2012
Republika ng PilipinasPAMBANSANG LUPON SA UGNAYANG PANG-ESTADISTIKA(NATIONAL STATISTICAL COORDINATION BOARD)http://www.nscb.gov.ph
ISSN-0119-4518As of July 2013

The Gross Regional Domestic Product (GRDP) is a publication prepared by
the Economic Statistics Office (ESO) and the Subnational Statistics Office (SnSO)
of the NATIONAL STATISTICAL COORDINATION BOARD (NSCB). For technical inquiries, please contact us at: (632) (897-2170) or email us at [email protected].
TERMS OF USE OF NSCB PUBLICATIONS The NSCB reserves its exclusive right to reproduce all its publications in whatever form. Any part of this publication should not be reproduced, recopied, lend or repackaged for other parties for any commercial
purposes without written permission from the NSCB. Any part of this publication may only be reproduced for internal use of the recipient/customer company. Should any portion of the data in this publication are to be included in a report/article, the title of the publication and the NSCB should be cited as the source of the
data Any information derived from the processing of data contained in this publication will not be the responsibility of NSCB.
ISSN-0119-4518
Published by the National Statistical Coordination Board
Midland Buendia Building 403 Sen. Gil Puyat Avenue
Makati City 1200 Philippines.
July 2013
The Gross Regional Domestic Product (GRDP) is available in printed and electronic formats (Excel/Word/PDF in CDRom). Back issues of this publication are available for purchase. For details, please contact us at
(632) 890-8456 or at [email protected].

SOURCES OF DATA
Air Transportation Office (ATO)
Bangko Sentral ng Pilipinas (BSP)
Bureau of Agricultural Statistics (BAS)
Bureau of Internal Revenue (BIR)
Bureau of Local Government Finance
Bureau of Treasury (BTR)
Civil Service Commission (CSC)
Commission on Audit (COA)
Commission on Higher Education (CHED)
Department of Agriculture (DA)
Department of Budget and Management (DBM)
Department of Education (DepEd)
Department of Environment and Natural Resources (DENR)
Department of Health (DOH)
Department of Public Works and Highways (DPWH)
Department of Science and Technology (DOST)
Department of Tourism (DOT)
Electric Cooperatives and Companies
Fertilizer and Pesticide Authority (FDA)
Fiber Industry Development Authority (FIDA)
Forest Management Bureau (FMB) - DENR
Government Service Insurance System (GSIS)
Home Development and Mutual Fund (HDMF)
Industry Associations
Insurance Commission and Companies
Land Registration Authority (LRA)
Land Transportation Franchising and Regulatory Board (LTFRB)
Land Transportation Office (LTO)
Local Water Utilities Administration (LWUA)
Manila Electric Company (MERALCO)
Manila Water Company Inc. (MWCI)
Maritime Industry Authority (MARINA)
Maynilad Water Services Inc. (MWSI)
Mines and Geosciences Bureau (MGB)

National Economic Development Authority (NEDA)
National Electrification Administration (NEA)
National Irrigation Administration (NIA)
National Power Corporation (NPC)
National Statistics Office (NSO)
National Telecommunications Commission (NTC)
National Water Resources Board (NWRB)
Office of Civil Defense
Philippine National Oil Company (PNOC)
Philippine National Police (PNP)
Philippine Overseas Employment Administration (POEA)
Philippine Ports Authority (PPA)
Philippine Postal Corporation (PPC)
Provincial/City Planning and
Development Offices (PPDO/CPDOs)
Southern Luzon Regional Center
Southern Philippines Power Corporation
Sugar Regulatory Administration (SRA)
Technical Education and Skills Development Authority (TESDA)

iii
NSCB Publications
Multisectoral Statistics The Philippine Statistical Yearbook * The Countryside in Figures *
(Philippines, selected provinces) Regional Social and Economic Trends (RSET)
(CAR, I , V, VI, VIII, IX , X, XI, XII)* Metro Manila: Gateway to the Philippines
Economic Statistics National Accounts of the Philippines: Quarterly,
Annual and Annual with Consolidated Accounts and Income and Outlay Accounts *
Gross Regional Domestic Product * Gross Regional Domestic Expenditure * Input-Output Accounts of the Philippines * Economic Indicators * Quarterly Economic Indices* Foreign Direct Investments* Food Balance Sheet of the Philippines* Leading Economic Indicators
Social Statistics Official Poverty Statistics of the Philippines* Statistical Handbook on Women and Men
(Philippines, CAR, I, V, VI, VIII, IX, X, XI, XII)* Report on the Philippine Human Development
Index Philippine National Health Accounts National Education Expenditure Accounts Poverty Maps (Selected Provinces)*
Environmental Statistics
Compendium of Philippine Environment Statistics*
Statistical Standards and Classifications Philippine Classification of Individual
Consumption According to Purpose (PCOICOP)*
Philippine Standard Classification for Education (PSCEd)*
Philippine Standard Commodity Classification (PSCC)*
Philippine Standard Geographic Classification (PSGC)*
Philippine Standard Industrial Classification (PSIC)*
Philippine Standard Occupational Classification (PSOC)*
Philippine Central Product Classification (PCPC)*
Reference Materials
Philippine Statistical Development Program* NSCB Annual Report* Profile of Censuses and Surveys conducted by
the Philippine Statistical System* Directory of Government Statistical Services in
the Philippines (DGSSP)* A Guide to Statistics for Business Planning Framework for the Development
of Environment Statistics State of the Philippine Land and Soil
Resources Statistics for Entrepreneurs
Proceedings of Conventions
National Convention on Statistics* Asian Regional Section, International
Conference on Statistical Computing InformationSheets
Statwatch (Philippines, CAR, I, V, VI, VIII, IX, X, XI, XII and selected provinces and cities)
Factsheets (Philippines, CAR, I, V, VI, VIII, IX, X, XI, XII)
MDG Watch (Philippines, CAR, I, V, VI, VIII, IX, X, XI, XII)
Genderwatch (VI) Statwatch on Children (VI) Stat Informer (VI) Stat Trivia (CAR) Statistics Series
Technical Papers
Things Statisticians Wanted to Know About the Tourism Satellite Account but were Afraid to Ask (2012)
Major Revisions on the Philippine System of National Accounts: Implementation of the 2008 System of National Accounts (2012)
Gearing a National Statistical System Towards the Measurement of the Impact of Climate Change: The Case of the Philippines (2008)
Distributive Trade Statistics in the Philippines (2006)
Official Poverty Statistics in the Philippines: Methodology and 2003 Estimates (2006)
Green GDP Towards Sustainable Development: The Philippine Experience (2005)
Real Estate Price Index: A Model for the Philippines (2004)
iv
Official Provincial Poverty Statistics in the Philippines and the Issue of Comparability Across Space (2003)
The NSCB: Our Products and Services (2003) Enhancing the Relevance of the Philippine
System of National Accounts (2002) The Philippine Tourism Satellite Accounts:
Dealing with Data Shortfalls (2002) Development, Institutionalization and
Improvement of the Philippine National Health Accounts (2001)
Measuring the Contribution of the Informal Sector in the Philippines (2001)
Rebasing, Linking and Constant Price Estimation of the National Accounts of the Philippines (2001)
Recent Initiatives of the NSCB in Improving Official Statistics in the Philippines (2001)
Environmental Accounting in the Philippines (2000)
Poverty Assessment in the Philippines (2000) Online Articles and References
Beyond the Numbers Sexy Statistics StatFocus Statistically Speaking Statistical Indicators on Philippine
Development (StatDev) Philippine Standard Geographic Codes Provincial and Municipal Profiles Statistical Reference System Official Concepts and Definitions
for Statistical Purposes Technical Notes
* CD-ROM versions of publications are available in PDF format.
For orders and subscription, Please contact us at: The National Statistical Information Center G/F Midland Buendia Building 403 Sen. Gil Puyat Avenue Makati City Tel. No. (632) 895‐2767 Fax No. (632) 890‐8456

v
Other NSCB Products and Services
Products
1. Statistical policies and measures to
resolve specific issues and provide policy directions in the Philippine Statistical System (PSS)
2. The Philippine Statistical
Development Program (PSDP) to serve as blueprint of priority programs and activities to be undertaken to improve the PSS in the Medium Term
3. National Accounts and related
economic accounts to assess the economic performance of the country thru the following: National Accounts Regional Accounts Input‐Output (I‐O) Accounts Consolidated and Income and
Outlay Accounts Tourism Satellite Accounts Economic ‐Environmental and
Natural Resources Accounts National Health Accounts National Education Accounts Informal Sector Contribution of Women to the
Economy
4. Other social and economic indicators Poverty statistics Happiness index Good governance index Environment statistics Gender statistics (including
children) Gender development index Food balance sheet Quarterly economic indices Foreign direct investment
statistics Leading economic indicators Statistical indicators for
Philippine development Human development index Hunger Index
5. Standards and classification systems to prescribe uniform standards in government statistics Philippine Classification of
Individual Consumption According to Purpose (PCOICOP)
Philippine Standard Classification for Education (PSCEd)
Philippine Standard Commodity Classification (PSCC)
Philippine Standard Geographic Classification (PSGC)
Philippine Standard Industrial Classification (PSIC)
Philippine Standard Occupational Classification (PSOC)
Philippine Central Product Classification (PCPC)
6. Statistical publications to disseminate
the most relevant information produced by the PSS and to make statistics more accessible to the public
Services
1. One‐stop statistical information center – the National Statistical Information Center (NSIC)
2. Monitoring of designated statistics 3. Coordination of subnational statistical
system 4. Coordination of inter‐agency
concerns on statistics 5. Survey review and clearance 6. Online statistical service through the
Internet (http://www.nscb.gov.ph) 7. Servicing data requests 8. Technical services 9. Advocacy for statistical awareness 10. National Statistics Month 11. National Convention on Statistics 12. Government Statistics Accessibility
Program 13. Hosting of international conferences
in statistics 14. Users fora, workshops, seminar

vi
TABLE OF CONTENTS PAGE SOURCES OF DATA NSCB PUBLICATIONS OTHER NSCB PRODUCTS AND SERVICES
The GROSS REGIONAL DOMESTIC PRODUCT OF THE PHILIPPINES Highlights for 2010 -2012 H-1 Economic Performance of the Regions H-3 Economic Performance by Industry H-22 Per Capita GRDP H-26 Economic Performance by Island Group H-27 Inflation H-28 THEMATIC MAPS i-iv TABLE 1.1A GROSS REGIONAL DOMESTIC PRODUCT BY REGION 1
AT CURRENT PRICES TABLE 1.1B GROSS REGIONAL DOMESTIC PRODUCT BY REGION 1 AT CONSTANT PRICES TABLE 1.2A PERCENT DISTRIBUTION, GROSS REGIONAL DOMESTIC PRODUCT BY REGION, AT CURRENT PRICES 2 TABLE 1.2B PERCENT DISTRIBUTION, GROSS REGIONAL DOMESTIC PRODUCT BY REGION, AT CONSTANT PRICES 2 TABLE 1.3A GROWTH RATES, GROSS REGIONAL DOMESTIC PRODUCT BY REGION, AT CURRENT PRICES 3 TABLE 1.3B GROWTH RATES, GROSS REGIONAL DOMESTIC PRODUCT BY REGION, AT CONSTANT PRICES 3 TABLE 1.4 IMPLICIT PRICE INDEX, GROSS REGIONAL DOMESTIC PRODUCT BY REGION 4 TABLE 2.1A GROSS VALUE ADDED IN AGRICULTURE, HUNTING, FORESTRY and
FISHING, BY REGION, AT CURRENT PRICES 5 TABLE 2.1B GROSS VALUE ADDED IN AGRICULTURE, HUNTING, FORESTRY and FISHING, BY REGION, AT CONSTANT PRICES 5 TABLE 2.2A PERCENT DISTRIBUTION GROSS VALUE ADDED IN AGRICULTURE,
HUNTING, FORESTRY and FISHING, BY REGION, AT CURRENT PRICES 6
TABLE 2.2B PERCENT DISTRIBUTION GROSS VALUE ADDED IN AGRICULTURE,
HUNTING, FORESTRY and FISHING, BY REGION, AT CONSTANT PRICES 6

vii
TABLE 2.3A GROWTH RATES GROSS VALUE ADDED IN AGRICULTURE, HUNTING, FORESTRY and FISHING, BY REGION, AT CURRENT PRICES 7
TABLE 2.3B GROWTH RATES GROSS VALUE ADDED IN AGRICULTURE,
HUNTING, FORESTRY and FISHING BY REGION, AT CONSTANT PRICES 7
TABLE 2.4 IMPLICIT PRICE INDEX GROSS VALUE ADDED IN AGRICULTURE,
HUNTING, FORESTRY and FISHING BY REGION 8 TABLE 2.1.1A GROSS VALUE ADDED IN AGRICULTURE, HUNTING and FORESTRY BY REGION, AT CURRENT PRICES 9 TABLE 2.1.1B GROSS VALUE ADDED IN AGRICULTURE, HUNTING and FORESTRY BY REGION, AT CONSTANT PRICES 9 TABLE 2.1.2A PERCENT DISTRIBUTION GROSS VALUE ADDED IN AGRICULTURE, HUNTING and FORESTRY BY REGION, AT CURRENT PRICES 10 TABLE 2.1.2B PERCENT DISTRIBUTION GROSS VALUE ADDED IN AGRICULTURE, HUNTING and FORESTRY BY REGION, AT CONSTANT PRICES 10 TABLE 2.1.3A GROWTH RATES GROSS VALUE ADDED IN AGRICULTURE, HUNTING and FORESTRY BY REGION, AT CURRENT PRICES 11 TABLE 2.1.3B GROWTH RATES GROSS VALUE ADDED IN AGRICULTURE, HUNTING and FORESTRY BY REGION, AT CONSTANT PRICES 11 TABLE 2.1.4 IMPLICIT PRICE INDEX
GROSS VALUE ADDED IN AGRICULTURE, HUNTING and FORESTRY BY REGION 12 TABLE 2.2.1A GROSS VALUE ADDED IN FISHING BY REGION, AT CURRENT PRICES 13 TABLE 2.2.1B GROSS VALUE ADDED IN FISHING BY REGION, AT CONSTANT PRICES 13 TABLE 2.2.2A PERCENT DISTRIBUTION, GROSS VALUE ADDED IN FISHING BY REGION, AT CURRENT PRICES 14 TABLE 2.2.2B PERCENT DISTRIBUTION, GROSS VALUE ADDED IN FISHING BY REGION, AT CONSTANT PRICES 14 TABLE 2.2.3A GROWTH RATES, GROSS VALUE ADDED IN FISHING BY REGION, AT CURRENT PRICES 15 TABLE 2.2.3B GROWTH RATES, GROSS VALUE ADDED IN FISHING BY REGION, AT CONSTANT PRICES 15 TABLE 2.2.4 IMPLICIT PRICE INDEX, GROSS VALUE ADDED IN FISHING BY REGION 16 TABLE 3.1A GROSS VALUE ADDED IN INDUSTRY BY REGION, AT CURRENT PRICES 17
viii
TABLE 3.1B GROSS VALUE ADDED IN INDUSTRY BY REGION, AT CONSTANT PRICES 17 TABLE 3.2A PERCENT DISTRIBUTION, GROSS VALUE ADDED IN INDUSTRY BY REGION, AT CURRENT PRICES 18 TABLE 3.2B PERCENT DISTRIBUTION, GROSS VALUE ADDED IN INDUSTRY BY REGION, AT CONSTANT PRICES 18 TABLE 3.3A GROWTH RATES, GROSS VALUE ADDED IN INDUSTRY BY REGION, AT CURRENT PRICES 19 TABLE 3.3B GROWTH RATES, GROSS VALUE ADDED IN INDUSTRY BY REGION, AT CONSTANT PRICES 19 TABLE 3.4 IMPLICIT PRICE INDEX, GROSS VALUE ADDED IN INDUSTRY BY REGION 20 TABLE 3.1.1A GROSS VALUE ADDED IN MINING AND QUARRYING BY REGION, AT CURRENT PRICES 21 TABLE 3.1.1B GROSS VALUE ADDED IN MINING AND QUARRYING BY REGION, AT CONSTANT PRICES 21 TABLE 3.1.2A PERCENT DISTRIBUTION GROSS VALUE ADDED IN MINING AND QUARRYING BY REGION, AT CURRENT PRICES 22 TABLE 3.1.2B PERCENT DISTRIBUTION GROSS VALUE ADDED IN MINING AND QUARRYING BY REGION, AT CONSTANT PRICES 22 TABLE 3.1.3A GROWTH RATES GROSS VALUE ADDED IN MINING AND QUARRYING BY REGION, AT CURRENT PRICES 23 TABLE 3.1.3B GROWTH RATES GROSS VALUE ADDED IN MINING AND QUARRYING BY REGION, AT CONSTANT PRICES 23 TABLE 3.1.4 IMPLICIT PRICE INDEX GROSS VALUE ADDED IN MINING AND QUARRYING BY REGION 24 TABLE 3.2.1A GROSS VALUE ADDED IN MANUFACTURING BY REGION, AT CURRENT PRICES 25 TABLE 3.2.1B GROSS VALUE ADDED IN MANUFACTURING BY REGION, AT CONSTANT PRICES 25 TABLE 3.2.2A PERCENT DISTRIBUTION, GROSS VALUE ADDED IN MANUFACTURING BY REGION, AT CURRENT PRICES 26 TABLE 3.2.2B PERCENT DISTRIBUTION, GROSS VALUE ADDED IN MANUFACTURING BY REGION, AT CONSTANT PRICES 26 TABLE 3.2.3A GROWTH RATES, GROSS VALUE ADDED IN MANUFACTURING BY REGION, AT CURRENT PRICES 27

ix
TABLE 3.2.3B GROWTH RATES, GROSS VALUE ADDED IN MANUFACTURING BY REGION, AT CONSTANT PRICES 27 TABLE 3.2.4 IMPLICIT PRICE INDEX, GROSS VALUE ADDED IN MANUFACTURING BY REGION 28 TABLE 3.3.1A GROSS VALUE ADDED IN CONSTRUCTION BY REGION, AT CURRENT PRICES 29 TABLE 3.3.1B GROSS VALUE ADDED IN CONSTRUCTION BY REGION, AT CONSTANT PRICES 29 TABLE 3.3.2A PERCENT DISTRIBUTION, GROSS VALUE ADDED IN CONSTRUCTION BY REGION, AT CURRENT PRICES 30 TABLE 3.3.2B PERCENT DISTRIBUTION, GROSS VALUE ADDED IN CONSTRUCTION BY REGION, AT CONSTANT PRICES 30 TABLE 3.3.3A GROWTH RATES, GROSS VALUE ADDED IN CONSTRUCTION BY REGION, AT CURRENT PRICES 31 TABLE 3.3.3B GROWTH RATES, GROSS VALUE ADDED IN CONSTRUCTION BY REGION, AT CONSTANT PRICES 31 TABLE 3.3.4 IMPLICIT PRICE INDEX, GROSS VALUE ADDED IN CONSTRUCTION BY REGION 32 TABLE 3.4.1A GROSS VALUE ADDED IN ELECTRICITY, GAS AND WATER SUPPLY BY REGION, AT CURRENT PRICES 33 TABLE 3.4.1B GROSS VALUE ADDED IN ELECTRICITY, GAS AND WATER SUPPLY BY REGION, AT CONSTANT PRICES 33 TABLE 3.4.2A PERCENT DISTRIBUTION GROSS VALUE ADDED IN ELECTRICITY, GAS AND WATER SUPPLY BY REGION, AT CURRENT PRICES 34 TABLE 3.4.2B PERCENT DISTRIBUTION GROSS VALUE ADDED IN ELECTRICITY, GAS AND WATER SUPPLY BY REGION, AT CONSTANT PRICES 34 TABLE 3.4.3A GROWTH RATES GROSS VALUE ADDED IN ELECTRICITY, GAS AND WATER SUPPLY BY REGION, AT CURRENT PRICES 35 TABLE 3.4.3B GROWTH RATES GROSS VALUE ADDED IN ELECTRICITY, GAS AND WATER SUPPLY BY REGION, AT CONSTANT PRICES 35 TABLE 3.4.4 IMPLICIT PRICE INDEX GROSS VALUE ADDED IN ELECTRICITY, GAS AND WATER SUPPLY BY REGION 36 TABLE 4.1A GROSS VALUE ADDED IN SERVICES BY REGION, AT CURRENT PRICES 37 TABLE 4.1B GROSS VALUE ADDED IN SERVICES BY REGION, AT CONSTANT PRICES 37

x
TABLE 4.2A PERCENT DISTRIBUTION, GROSS VALUE ADDED IN SERVICES BY REGION, AT CURRENT PRICES 38 TABLE 4.2B PERCENT DISTRIBUTION, GROSS VALUE ADDED IN SERVICES BY REGION, AT CONSTANT PRICES 38 TABLE 4.3A GROWTH RATES, GROSS VALUE ADDED IN SERVICES BY REGION, AT CURRENT PRICES 39 TABLE 4.3B GROWTH RATES, GROSS VALUE ADDED IN SERVICES BY REGION, AT CONSTANT PRICES 39 TABLE 4.4 IMPLICIT PRICE INDEX, GROSS VALUE ADDED IN SERVICES BY REGION 40 TABLE 4.1.1A GROSS VALUE ADDED IN TRANSPORT., STORAGE and COMM., BY REGION, AT CURRENT PRICES 41 TABLE 4.1.1B GROSS VALUE ADDED IN TRANSPORT., STORAGE and COMM., BY REGION, AT CONSTANT PRICES 41 TABLE 4.1.2A PERCENT DISTRIBUTION GROSS VALUE ADDED IN TRANSPORT., STORAGE and COMM., BY REGION, AT CURRENT PRICES 42 TABLE 4.1.2B PERCENT DISTRIBUTION GROSS VALUE ADDED IN TRANSPORT., STORAGE and COMM., BY REGION, AT CONSTANT PRICES 42 TABLE 4.1.3A GROWTH RATES GROSS VALUE ADDED IN TRANSPORT., STORAGE and COMM., BY REGION, AT CURRENT PRICES 43 TABLE 4.1.3B GROWTH RATES GROSS VALUE ADDED IN TRANSPORT., STORAGE and COMM., BY REGION, AT CONSTANT PRICES 43 TABLE 4.1.4 IMPLICIT PRICE INDEX GROSS VALUE ADDED IN TRANSPORT., STORAGE and COMM., BY REGION 44 TABLE 4.2.1A GROSS VALUE ADDED IN TRADE AND REPAIR OF MOTOR VEHICLES, MOTORCYCLES, PERSONAL AND HOUSEHOLD GOODS BY REGION, AT CURRENT PRICES 45 TABLE 4.2.1B GROSS VALUE ADDED IN TRADE AND REPAIR OF MOTOR VEHICLES, MOTORCYCLES, PERSONAL AND HOUSEHOLD GOODS BY REGION, AT CONSTANT PRICES 45 TABLE 4.2.2A PERCENT DISTRIBUTION, GROSS VALUE ADDED IN TRADE AND REPAIR OF MOTOR VEHICLES, MOTORCYCLES, PERSONAL AND HOUSEHOLD GOODS, BY REGION, AT CURRENT PRICES 46 TABLE 4.2.2B PERCENT DISTRIBUTION, GROSS VALUE ADDED IN TRADE AND REPAIR OF MOTOR VEHICLES, MOTORCYCLES, PERSONAL AND HOUSEHOLD GOODS, BY REGION, AT CONSTANT PRICES 46 TABLE 4.2.3A GROWTH RATES, GROSS VALUE ADDED TRADE AND REPAIR OF MOTOR VEHICLES, MOTORCYCLES, PERSONAL AND HOUSEHOLD GOODS, BY REGION, AT CURRENT PRICES 47
xi
TABLE 4.2.3B GROWTH RATES, GROSS VALUE ADDED IN TRADE AND REPAIR OF MOTOR VEHICLES, MOTORCYCLES, PERSONAL AND HOUSEHOLD GOODS, BY REGION, AT CONSTANT PRICES 47 TABLE 4.2.4 IMPLICIT PRICE INDEX, GROSS VALUE ADDED IN TRADE AND REPAIR OF MOTOR VEHICLES, MOTORCYCLES, PERSONAL AND HOUSEHOLD GOODS, BY REGION 48 TABLE 4.3.1A GROSS VALUE ADDED IN FINANCIAL INTERMEDIATION BY REGION, AT CURRENT PRICES 49 TABLE 4.3.1B GROSS VALUE ADDED IN FINANCE BY REGION, AT CONSTANT PRICES 49 TABLE 4.3.2A PERCENT DISTRIBUTION, GROSS VALUE ADDED IN FINANCIAL INTERMEDIATION, BY REGION, AT CURRENT PRICES 50 TABLE 4.3.2B PERCENT DISTRIBUTION, GROSS VALUE ADDED IN FINANCIAL INTERMEDIATION, BY REGION, AT CONSTANT PRICES 50 TABLE 4.3.3A GROWTH RATES, GROSS VALUE ADDED IN FINANCIAL INTERMEDIATION, BY REGION, AT CURRENT PRICES 51 TABLE 4.3.3B GROWTH RATES, GROSS VALUE ADDED IN FINANCIAL INTERMEDIATION, BY REGION, AT CONSTANT PRICES 51 TABLE 4.3.4 IMPLICIT PRICE INDEX, GROSS VALUE ADDED IN FINANCIAL INTERMEDIATION, BY REGION 52 TABLE 4.4.1A GROSS VALUE ADDED IN REAL ESTATE, RENTING, and BUSINESS ACTIVITIES, BY REGION, AT CURRENT PRICES 53 TABLE 4.4.1B GROSS VALUE ADDED IN REAL ESTATE, RENTING, and BUSINESS ACTIVITIES, BY REGION, AT CONSTANT PRICES 53 TABLE 4.4.2A PERCENT DISTRIBUTION, GROSS VALUE ADDED IN REAL ESTATE, RENTING, and BUSINESS ACTIVITIES, BY REGION, AT CURRENT PRICES 54 TABLE 4.4.2B PERCENT DISTRIBUTION, GROSS VALUE ADDED IN REAL ESTATE, RENTING, and BUSINESS ACTIVITIES, BY REGION, AT CONSTANT PRICES 54 TABLE 4.4.3A GROWTH RATES, GROSS VALUE ADDED IN REAL ESTATE, RENTING, and BUSINESS ACTIVITIES, BY REGION, AT CURRENT PRICES 55 TABLE 4.4.3B GROWTH RATES, GROSS VALUE ADDED IN REAL ESTATE, RENTING, and BUSINESS ACTIVITIES, BY REGION, AT CONSTANT PRICES 55 TABLE 4.4.4 IMPLICIT PRICE INDEX, GROSS VALUE ADDED IN REAL ESTATE, RENTING, and BUSINESS ACTIVITIES, BY REGION 56 TABLE 4.5.1A GROSS VALUE ADDED IN OTHER SERVICES BY REGION, AT CURRENT PRICES 57 TABLE 4.5.1B GROSS VALUE ADDED IN OTHER SERVICES BY REGION, AT CONSTANT PRICES 57
xii
TABLE 4.5.2A PERCENT DISTRIBUTION, GROSS VALUE ADDED IN OTHER SERVICES BY REGION, AT CURRENT PRICES 58 TABLE 4.5.2B PERCENT DISTRIBUTION, GROSS VALUE ADDED IN OTHER SERVICES BY REGION, AT CONSTANT PRICES 58 TABLE 4.5.3A GROWTH RATES, GROSS VALUE ADDED IN OTHER SERVICES BY REGION, AT CURRENT PRICES 59 TABLE 4.5.3B GROWTH RATES, GROSS VALUE ADDED IN OTHER SERVICES BY REGION, AT CONSTANT PRICES 59 TABLE 4.5.4 IMPLICIT PRICE INDEX, GROSS VALUE ADDED IN OTHER SERVICES BY REGION 60 TABLE 4.6.1A GROSS VALUE ADDED IN PUBLIC ADMINISTRATION and DEFENSE; COMPULSORY SOCIAL SECURITY, BY REGION, AT CURRENT PRICES 61 TABLE 4.6.1B GROSS VALUE ADDED IN PUBLIC ADMINISTRATION and DEFENSE; COMPULSORY SOCIAL SECURITY, BY REGION, AT CONSTANT PRICES 61 TABLE 4.6.2A PERCENT DISTRIBUTION, GROSS VALUE ADDED IN PUBLIC ADMINISTRATION and DEFENSE; COMPULSORY SOCIAL SECURITY, BY REGION, AT CURRENT PRICES 62 TABLE 4.6.2B PERCENT DISTRIBUTION, GROSS VALUE ADDED IN PUBLIC ADMINISTRATION and DEFENSE; COMPULSORY SOCIAL SECURITY, BY REGION, AT CONSTANT PRICES 62 TABLE 4.6.3A GROWTH RATES, GROSS VALUE ADDED IN PUBLIC ADMINISTRATION And DEFENSE; COMPULSORY SOCIAL SECURITY, BY REGION, AT CURRENT PRICES 63 TABLE 4.6.3B GROWTH RATES, GROSS VALUE ADDED IN PUBLIC ADMINISTRATION and DEFENSE; COMPULSORY SOCIAL SECURITY, BY REGION, AT CONSTANT PRICES 63 TABLE 4.6.4 IMPLICIT PRICE INDEX , GROSS VALUE ADDED IN PUBLIC ADMINISTRATION and DEFENSE; COMPULSORY SOCIAL SECURITY, BY REGION 64 TABLE 5.1A PER CAPITA GROSS REGIONAL DOMESTIC PRODUCT BY REGION, AT CURRENT PRICES 65 TABLE 5.1B PER CAPITA GROSS REGIONAL DOMESTIC PRODUCT BY REGION, AT CONSTANT PRICES 65 TABLE 5.2A PER CAPITA INDEX WITH REFERENCE TO THE NATIONAL AVERAGE BY REGION, AT CURRENT PRICES 66 TABLE 5.2B PER CAPITA INDEX WITH REFERENCE TO THE NATIONAL AVERAGE BY REGION, AT CONSTANT PRICES 66 TABLE 5.3A GROWTH RATES, PER CAPITA GROSS REGIONAL DOMESTIC PRODUCT BY REGION, AT CURRENT PRICES 67 TABLE 5.3B GROWTH RATES, PER CAPITA GROSS REGIONAL DOMESTIC PRODUCT BY REGION, AT CONSTANT PRICES 67
xiii
TABLE 6.1 REGIONAL POPULATION BY REGION 68 TABLE 6.2 PERCENT DISTRIBUTION, REGIONAL POPULATION 68 TABLE 6.3 GROWTH RATES, REGIONAL POPULATION 69
GROSS REGIONAL DOMESTIC PRODUCT, BY INDUSTRIAL ORIGIN
TABLE 1.1-4.1 PHILIPPINES 70 - 73 TABLE 1.2-4.2 NCR, NATIONAL CAPITAL REGION 74 - 77 TABLE 1.3-4.3 CAR, CORDILLERA ADMINISTRATIVE REGION 78 - 81 TABLE 1.4-4.4 REGION I, ILOCOS REGION 82 - 85 TABLE 1.5-4.5 REGION II, CAGAYAN VALLEY 86 - 89 TABLE 1.6-4.6 REGION III, CENTRAL LUZON 90 - 93 TABLE 1.7-4.7 REGION IVA, CALABARZON 94 - 97 TABLE 1.8-4.8 REGION IVB, MIMAROPA 98 - 101 TABLE 1.9-4.9 REGION V, BICOL REGION 102 - 105 TABLE 1.10-4.10 REGION VI, WESTERN VISAYAS 106 - 109 TABLE 1.11-4.11 REGION VII, CENTRAL VISAYAS 110 - 113 TABLE 1.12-4.12 REGION VIII, EASTERN VISAYAS 114 - 117 TABLE 1.13-4.13 REGION IX, ZAMBOANGA PENINSULA 118 - 121 TABLE 1.14-4.14 REGION X, NORTHERN MINDANAO 122 - 125 TABLE 1.15-4.15 REGION XI, DAVAO REGION 126 - 129 TABLE 1.16-4.16 REGION XII, SOCCSKSARGEN 130 - 133 TABLE 1.17-4.17 REGION XIII, CARAGA REGION 134 - 137 TABLE 1.18-4.18 ARMM, AUTONOMOUS REGION IN MUSLIM MINDANAO 138 – 141
Calendar of Release of the National and Regional Accounts for CY 2013
NSCB Staff

H-1
GROSS REGIONAL DOMESTIC PRODUCT OF THE PHILIPPINES
HIGHLIGHTS FOR 2012
Philippine economy grows by 6.8 percent
The Philippine economy posted an accelerated growth of 6.8 percent in 2012 from 3.6
percent in the previous year amidst a favorable macroeconomic environment and
increased government spending on infrastructure.
All sectors improved their performance, with Services posting the highest growth of
7.6 percent in 2012, from 4.9 percent in 2011. Industry accelerated from 1.8 percent
in 2011 to 6.8 percent in 2012. Agriculture, Hunting, Forestry and Fishing (AHFF)
grew slightly from 2.6 percent in 2011 to 2.8 percent in 2012.
Other major subsectors that contributed to the growth were: Trade (7.5 percent);
Manufacturing (5.4 percent); Construction (15.7 percent); Real Estate, Renting and
Business Activities (7.5 percent); and, Other Services (7.7 percent).
Zamboanga Peninsula’s economy records fastest growth
Zamboanga Peninsula’s economy posted the fastest growth among the country’s 17
regions with a robust growth of 12.4 percent in 2012 from a modest growth of 0.1
percent in 2011. This was followed by: Caraga with 10.6 percent; Central Visayas, 9.3
percent; Cagayan Valley, 8.2 percent; and SOCCSKSARGEN with 8.1 percent.
On the other hand, the economy of Eastern Visayas contracted by 6.2 percent in
2012 from a 2.1 percent growth in 2011. The other regions that posted decelerated
growths were Cordillera Administrative Region (CAR), with 1.0 percent from 1.3
percent; and Central Luzon, with 6.3 percent from 7.1 percent.

H-2
Growth Rates of Regional Economies: 2010-11 and 2011-12, at Constant 2000 Prices
Fourteen regions post accelerated growths
Out of the country’s 17 regions, fourteen regional economies posted accelerated
growths from 2011 to 2012.
Zamboanga Peninsula posted the highest growth as its economy soared from a
modest growth rate of 0.1 percent in 2011 to a robust growth of 12.4 percent in 2012.
Other regions which experienced accelerated growths were: NCR, from 3.1 percent to
7.3 percent; Ilocos, 2.4 percent to 5.2 percent; Cagayan Valley, 5.6 percent to 8.2
percent; CALABARZON, 1.7 percent to 7.0 percent; MIMAROPA, 3.1 percent to 4.2
percent; Bicol, 1.9 percent to 7.1 percent; Western Visayas, 6.2 percent to 7.5
percent; Central Visayas, 6.8 percent to 9.3 percent; Northern Mindanao, 5.8 percent
to 7.4 percent; Davao Region, 3.7 percent to 7.4 percent; SOCCSKSARGEN, 5.3
percent to 8.1 percent; Caraga, 8.5 percent to 10.6 percent; and, the Autonomous
Region in Muslim Mindanao (ARMM) from negative 0.3 percent to 1.2 percent.
Meanwhile, the growth rate of Eastern Visayas’ economy nosedived by 8.3
percentage points from 2.1 percent in 2011 to negative 6.2 percent in 2012 while that
of CAR and Central Luzon dropped by 0.3 percentage point and 0.8 percentage point,
respectively.

H-3
NCR remains top contributor to the national economy
NCR continued to have the largest share of the country’s total output with a 35.7
percent share in 2012, slightly higher than the 35.6 percent recorded in 2011. It was
followed by CALABARZON with a share of 17.4 percent and Central Luzon with 9.2
percent. On the other hand, ARMM had the lowest share of 0.8 percent of the
country’s GDP.
In terms of share to the national GDP growth of 6.8 percent in 2012, NCR contributed
2.6 percentage points, followed by CALABARZON with 1.2 percentage points and
Central Luzon with 0.6 percentage point. ARMM, on the other hand, had a meager
contribution of 0.01 percentage point.
Economic Performance of the Regions
NCR’s economic growth doubles as Services accelerates
The economy of the National Capital Region (NCR) more than doubled its growth
from 3.1 percent in 2011 to 7.3 percent in 2012. This upswing was brought about by
the acceleration of Services and AHFF, and the turnaround of the Industry sector.
The Services sector comprised the largest share of NCR’s economy at 82.4 percent,
a slight increase from 82.3 percent in 2011. Industry contributed 17.4 percent while
AHFF shared 0.3 percent.
Services showed an accelerated growth from 4.8 percent in 2011 to 7.4 percent in
2012 due to faster growth of all sectors except for Real Estate, Renting and Business
Activities (RERBA). Transport, Storage and Communication (TSC) accelerated from
2.2 percent in 2011 to 7.7 percent in 2012. Trade and Financial Intermediation sped-
up from 3.0 percent in 2011 to 6.5 percent in 2012 and from 5.4 percent in 2011 to 6.8
percent in 2012, respectively. Likewise, Public Administration and Defense (PAD)
accelerated from 3.6 percent in 2011 to 5.8 percent in 2012, and Other Services from
5.4 percent in 2011 to 10.9 percent in 2012. Meanwhile, RERBA slowed down from
9.1 percent in 2011 to 7.1 percent in 2012.

H-4
Industry rebounded from a decline of 4.3 percent in 2011 to a 6.8 percent growth in
2012. Construction turned around from a negative 21.5 percent in 2011 to 7.4 percent
in 2012, while Electricity, Gas, and Water Supply (EGWS) swung from negative 0.1
percent in 2011 to 4.9 percent in 2012. Contributing to the growth of NCR’s Industry
was Manufacturing which accelerated from 1.6 percent in 2011 to 7.1 percent in 2012.
AHFF grew faster from 3.2 percent in 2011 to 10.8 percent in 2012. This was due to
the acceleration of Agriculture and Forestry from 3.3 percent in 2011 to 11.0 percent
in 2012. The region’s Fishing sector, however, further decelerated from negative 1.3
percent in 2011 to negative 2.8 percent in 2012.
Services contributed most to the region’s growth with 6.1 percentage points, followed
by Industry with 1.8 percentage points. AHFF’s contribution to NCR’s economic
growth was nil.
Cordillera economy decelerates as Manufacturing contracts
The CAR economy slowed down from 1.3 percent in 2011 to 1.0 percent in 2012.
This was largely attributed to the contraction of the region’s Industry sector.
The Industry sector contributed the lion’s share to the region’s economy at 49.9
percent in 2012, down from its 52.3 percent share in 2011. Meanwhile, the Services
sector accounted for 39.3 percent in 2012, while AHFF accounted for 10.8 percent.
Industry contracted from 0.3 percent in 2011 to negative 3.6 percent in 2012. Mining
and Quarrying further declined from negative 9.3 percent to negative 54.8 percent
due to a drop in metallic mineral production. Manufacturing suffered a reversal from
3.2 percent to negative 2.1 percent due to the overall decline in output from the
region’s sole export processing zone. Construction and EGWS managed to
accelerate by 11.1 percent and 6.9 percent, respectively during the period.
The Services sector sped up from 3.1 percent in 2011 to 7.4 percent in 2012.
Financial Intermediation recovered from negative 7.7 percent in 2011 to 11.4 percent
in 2012. TSC more than doubled its pace from 2.0 percent to 9.6 percent while Trade
accelerated from 3.8 percent to 9.0 percent during the period. All other subsectors

H-5
also accelerated, except for Other Services which decelerated from 8.7 percent in
2011 to 5.9 percent in 2012.
The AHFF sector posted a better growth of 1.5 percent in 2012 from a modest growth
of 0.4 percent the previous year. This improvement was due to the growth of
Agriculture and Forestry from 0.3 percent in 2011 to 3.1 percent in 2012.
The Services sector contributed most to the region’s economic growth rate at 2.7
percentage points followed by AHFF with 0.2 percentage point. Industry pulled down
the growth of the region by 1.9 percentage point.
Ilocos Region’s economy accelerates, driven by the Services sector
The economy of Ilocos Region accelerated from a 2.4 percent growth in 2011 to 5.2
percent in 2012 due to the faster growth of Services and the rebound of Industry.
Services remained the biggest contributor to the region’s economy with a 48.8
percent share in 2012, slightly higher than its 48.1 percent share in 2011. Meanwhile,
AHFF and Industry accounted for 26.0 percent and 25.2 percent, respectively, of the
region’s output in 2012, slightly lower than their shares in 2011.
Services grew faster from 5.3 percent in 2011 to 6.8 percent in 2012 largely due to
the accelerated growths of TSC and Trade. TSC recorded the fastest growth from 3.3
percent in 2011 to 8.1 percent in 2012. Trade closely followed from a 3.4 percent
growth in 2011 to 8.0 percent in 2012. Public Administration also posted an
accelerated growth from 0.5 percent in 2011 to 5.1 percent in 2012. On the other
hand, Financial Intermediation (from 11.4 percent to 7.9 percent) and Other Services
(from 5.3 percent to 4.3 percent) slowed down from 2011 to 2012 while RERBA
sustained its 6.9 percent growth in 2012.
The AHFF sector experienced a higher growth from 3.0 percent in 2011 to 3.7 percent
in 2012 as Agriculture and Forestry accelerated, from 1.2 percent to 4.8 percent due
to higher production of palay, corn, livestock and poultry. However, Fishing suffered a
0.8 percent contraction in 2012 from a robust 11.2 percent growth the previous year,
due to the lower production of commercial and municipal fishery.

H-6
On the other hand, Industry rebounded from a negative 3.2 percent growth in 2011 to
a 3.6 percent growth in 2012 due to the turnaround of Manufacturing and
Construction. Manufacturing recovered from a negative 0.2 percent growth in 2011 as
it posted a 2.9 percent growth in 2012. Meanwhile, Construction rebounded from a
12.0 percent decline in 2011 to a 1.2 percent growth in 2012 due to more public
construction activities. In addition, Mining and Quarrying, and EGWS grew faster as
they recorded 14.8 percent and 3.9 percent growths, respectively, in 2012.
All the major industries contributed to the region’s overall growth with Services
accounting the biggest share at 3.3 percentage points. AHFF and Industry also
contributed 1.0 and 0.9 percentage points, respectively.
Cagayan Valley’s economy improves as all sectors post high growths
The economy of Cagayan Valley accelerated from 5.6 percent in 2011 to 8.2 percent
in 2012. This was brought about by the acceleration of the Services sector, and the
rebound of the Industry sector.
The Services sector had the largest share to the region’s total domestic output in
2012 at 48.2 percent, followed closely by AHFF at 40.9 percent. Industry had the
smallest share at only 11.0 percent.
Services accelerated from 4.5 percent in 2011 to 7.1 percent in 2012. Financial
Intermediation, TSC, Trade and RERBA accelerated in 2012 to 11.5 percent, 11.1
percent, 5.4 percent and 5.3 percent, respectively. Meanwhile, Other Services
slowed down to 4.5 percent in 2012 while Public Administration and Defense
rebounded with a 4.3 percent growth in 2012.
The AHFF sector decelerated from 13.6 percent in 2011 to 8.3 percent in 2012 due to
slower growth in Agriculture and Forestry at 9.4 percent; while Fishing suffered a
reversal at 6.4 percent in 2012.
Meanwhile, the Industry sector rebounded from a negative 13.8 percent growth in
2011 to 12.8 percent in 2012. This was brought about by the turnaround in
Construction from a negative 26.8 percent growth in 2011 to 18.5 percent in 2012.
Mining and Quarrying and EGWS also posted accelerated growths of 15.8 percent

H-7
and 4.8 percent, respectively in 2012. On the other hand, Manufacturing slowed
down to 0.8 percent in 2012.
The Services sector and AHFF both contributed 3.4 percentage points to the region’s
overall growth, while the Industry sector provided 1.3 percentage points to the
region’s growth.
Central Luzon economy improves with higher growths of Services and
Agriculture
The economy of Central Luzon improved at a decelerated rate from 7.1 percent in
2011 to 6.3 percent in 2012. This was largely attributed to the lower growth of the
region’s Industry sector.
The Industry sector recorded the biggest share of the region’s economy in 2012 with
a 42.2 percentage share, which is 0.4 percentage points lower from its share of 42.6
percent in 2011. The Services sector almost maintained its share in 2012 with 40.9
percent from 41.0 percent in 2011. Meanwhile, AHFF accounted for 16.8 percent,
higher than its previous share of 16.4 percent.
The Industry sector decelerated from 13.6 percent in 2011 to 5.4 percent in 2012 due
to the slower growth of Manufacturing which was the major contributor to the sector.
Manufacturing slowed down from 16.4 percent to 3.3 percent. On the other hand,
Construction accelerated from 3.2 percent to 15.0 percent while Mining and Quarrying
also posted a faster growth from 32.7 percent to 41.7 percent. Meanwhile, EGWS
bounced back from a negative 0.5 percent in 2011 to 5.9 percent in 2012.
The Services sector accelerated from 4.4 percent in 2011 to 6.2 percent in 2012. The
TSC subsector accelerated from 2.8 percent in 2011 to 5.9 percent in 2012. Other
subsectors which also posted accelerated growths during the period were Trade, from
3.2 percent to 6.6 percent, RERBA from 6.2 percent to 7.2 percent, and PAD from 0.6
percent to 6.2 percent. Meanwhile, Financial Intermediation and Other Services
recorded decelerated growths from 9.2 to 7.8 percent and 3.9 to 3.5 percent,
respectively.
H-8
The AHFF sector bounced back from a negative 1.3 percent growth in 2011 to 9.1
percent growth in 2012. This was brought about by the positive growth of the
Agriculture and Forestry subsector.
The Services and Industry sectors contributed 2.5 and 2.3 percentage points,
respectively, to the region’s overall growth. The entire Agriculture sector provided 1.5
percentage points to the region’s growth.
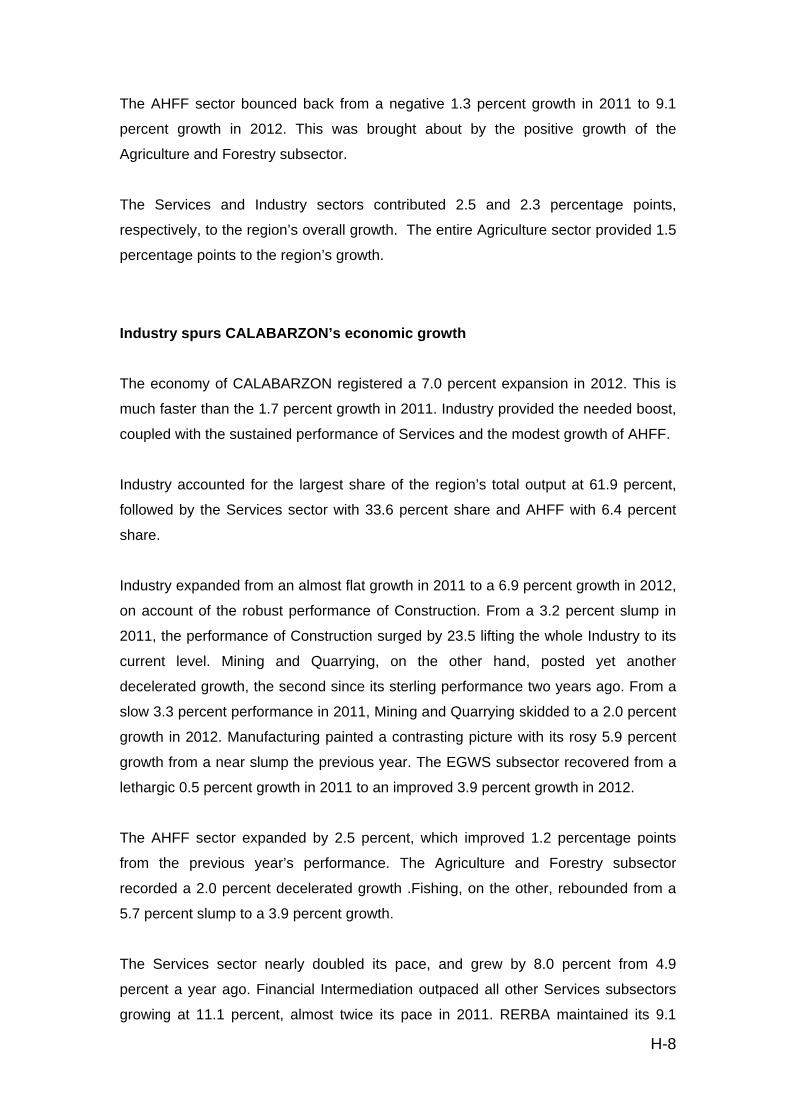
Industry spurs CALABARZON’s economic growth
The economy of CALABARZON registered a 7.0 percent expansion in 2012. This is
much faster than the 1.7 percent growth in 2011. Industry provided the needed boost,
coupled with the sustained performance of Services and the modest growth of AHFF.
Industry accounted for the largest share of the region’s total output at 61.9 percent,
followed by the Services sector with 33.6 percent share and AHFF with 6.4 percent
share.
Industry expanded from an almost flat growth in 2011 to a 6.9 percent growth in 2012,
on account of the robust performance of Construction. From a 3.2 percent slump in
2011, the performance of Construction surged by 23.5 lifting the whole Industry to its
current level. Mining and Quarrying, on the other hand, posted yet another
decelerated growth, the second since its sterling performance two years ago. From a
slow 3.3 percent performance in 2011, Mining and Quarrying skidded to a 2.0 percent
growth in 2012. Manufacturing painted a contrasting picture with its rosy 5.9 percent
growth from a near slump the previous year. The EGWS subsector recovered from a
lethargic 0.5 percent growth in 2011 to an improved 3.9 percent growth in 2012.
The AHFF sector expanded by 2.5 percent, which improved 1.2 percentage points
from the previous year’s performance. The Agriculture and Forestry subsector
recorded a 2.0 percent decelerated growth .Fishing, on the other, rebounded from a
5.7 percent slump to a 3.9 percent growth.
The Services sector nearly doubled its pace, and grew by 8.0 percent from 4.9
percent a year ago. Financial Intermediation outpaced all other Services subsectors
growing at 11.1 percent, almost twice its pace in 2011. RERBA maintained its 9.1

H-9
percent growth. The remaining Services subsectors all posted improved
performances in 2012 compared to the previous year: TSC from 3.4 percent to 7.8
percent; Trade, from 4.4 percent to 7.3 percent; Public Administration and Defense
from 0.9 percent to 7.0 percent; and Other Services from 1.8 percent to 5.7 percent.
Industry was the biggest contributor to the growth of CALABARZON’s economy in
2012 with a 4.3 percentage points share of the 7.0 percent growth. Services
accounted for 2.6 percentage points of the growth in 2012 while AHFF contributed the
least at 0.2 percentage point.
Industry and Services sectors propel MIMAROPA’s economy
MIMAROPA’s economy accelerated to 4.2 percent in 2012 from 3.1 percent in 2011
despite the negative growth of the AHFF sector. The improved economy of the region
was brought about by the faster growth of Services and Industry sectors.
Services posted the biggest share of 40.0 percent of the regional economy in 2012,
slightly higher than its 39.0 percent share in the previous year. It was followed by the
Industry sector, which accounted for 34.7 percent, and the AHFF sector with a
contribution of 25.3 percent.
Services improved to 6.8 percent in 2012 from 5.5 percent of the previous year,
boosted by TSC, which contributed 23.8 percent to the total Services sector.
Financial Intermediation soared to 12.3 percent from its 5.7 percent in 2011. Public
Administration and Defense rebounded from a negative 1.1 percent in 2011 to 9.2
percent in 2012. Meanwhile, RERBA and Other Services dropped to 2.9 percent and
4.8 percent from their previous growths of 8.6 percent and 5.8 percent, respectively.
Meanwhile, Industry grew to 4.8 percent in 2012 from a slower growth of 0.8 percent
a year ago despite the slowdown in Mining and Quarrying, which accounted for 69.0
percent of the total Industry sector. Construction rebounded from a negative 29.1
percent to a faster pace of 7.4 percent in 2012, while EGWS accelerated to 6.6
percent in 2012 from 1.1 percent growth in the previous year. Likewise, Manufacturing
posted a decelerated growth of 14.6 percent from its previous year’s growth of 16.1
percent.

H-10
The AHFF sector plunged to negative 0.3 percent in 2012 from 2.7 percent in 2011.
The reversal in growth was due to the decline in Agriculture and Forestry from 6.6
percent in 2011 to 2.6 percent in 2012. Moreover, Fishing further decelerated to
negative 6.8 percent from its negative 4.8 percent growth in 2011.
The Services sector was the largest contributor to the over-all regional economic
growth of MIMAROPA in 2012, accounting for 2.7 percentage points, followed by the
Industry sector with 1.7 percentage points, and AHFF with a contribution of 0.1
percentage point.
Industry fuels Bicol Region’s economy
Bicol Region’s economy grew to a high of 7.1 percent in 2012, nearly four times faster
than its 1.9 percent pace in 2011. Industry spurred the region’s economy while AHFF
and Services recorded accelerated growths.
Services accounted for the biggest share of the region’s economy at 56.0 percent,
followed by AHFF at 24.4 percent, and Industry at 19.6 percent. AHFF’s share to the
total economy dropped from 25.4 percent in 2011 to 24.4 percent in 2012.
The Services sector grew at a faster rate from 3.9 percent in 2011 to 6.1 percent in
2012. The TSC subsector sustained its momentum expanding in 2012 by 10.2
percent, 5.7 percentage points faster than the 6.5 growth percent in 2011. Similarly,
performance of Trade continued to improve from 3.3 percent a year ago to 9.7
percent in 2012.. From a 0.1 percent contraction in 2011, growth of Finance surged to
10.9 percent in 2012. The growth of RERBA slowed down from 3.5 percent to 2.3
percent while PAD grew at a faster 5.0 percent pace in 2012 from 0.2 percent in the
previous year. Other Services turned in the most sluggish performance among the
Services subsectors from 7.0 percent expansion in 2011 to 1.9 percent in 2012.
The AHFF sector showed signs of improvement expanding by 2.9 percent in 2012
from 0.8 percent growth a year back. Agriculture and Forestry accelerated from a 1.2
percent growth in 2011 to 3.1 percent. Fishing recovered from 0.5 percent slump a

H-11
year ago to grow by 2.5 percent in 2012. The share of AHFF to the total economy
dropped from 25.4 percent in 2011 to 24.4 percent in 2012.
Industry bounced back from a negative 2.6 percent growth in 2011 and grew by 16.1
percent in 2012. Construction spurred Industry’s growth surging by 25.8 percent from
a 12.7 percent slump in 2011. Similarly, Mining and Quarrying posted an 11.8 percent
growth, a complete turnaround from the 4.0 percent contraction in the previous year.
Manufacturing, on the other hand, decelerated from a fast 24.4 percent growth in
2011 to 5.0 percent in 2012. This deceleration was not enough however, to dampen
Industry’s upsurge. The EGWS subsector almost tripled its pace from 3.2 percent a
year ago to 9.3 percent.
Services was the largest contributor to the growth of Bicol Region’s economy in 2012
accounting for 3.4 percentage points of the 7.1 percent growth. Industry contributed
2.9 percentage points, while AHFF’s share was 0.7 percentage point.
Western Visayas economy sustains fast growth
The economy of Western Visayas continued to grow at a faster rate of 7.5 percent in
2012 from 6.2 percent in 2011. The growth was fueled by the Industry and the
Services sectors.
Services still comprised the bulk of the region’s economy at 57.1 percent, followed by
AHFF and Industry with percentage shares of 25.4 and 17.5 percent, respectively.
Services remarkably grew by 7.6 percent in 2012, from 4.8 percent in 2011. All
subsectors managed to surpass their previous year’s performance, except for Other
Services. Trade, which accounted for 23.3 percent of the Services sector, posted a
double digit growth of 11.7 percent- three times higher than its 3.9 percent growth a
year ago. Financial Intermediation accelerated to 9.2 percent up by 3.1 percentage
points from its 6.1 percent growth in 2011. The TSC subsector posted 8.2 percent
growth surpassing its 5.4 percent growth a year ago. Public Administration and
Defense posted accelerated growth of 5.7 percent greater by 5.2 percentage points
from its 0.5 percent meager growth in 2011. The RERBA subsector grew by 5.4
percent faster than its 3.9 percent growth in 2011. However, Other Services managed
to grow at a slower pace of 4.8 percent from its 6.7 percent recorded growth in 2011.
H-12
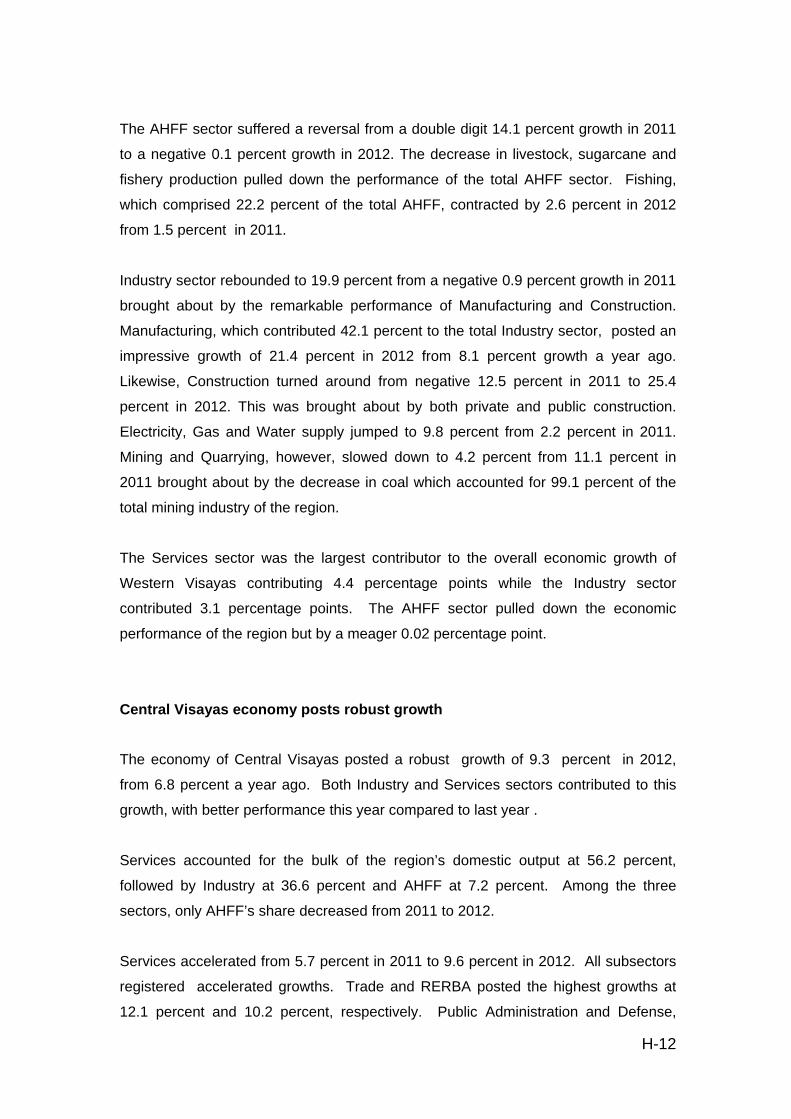
The AHFF sector suffered a reversal from a double digit 14.1 percent growth in 2011
to a negative 0.1 percent growth in 2012. The decrease in livestock, sugarcane and
fishery production pulled down the performance of the total AHFF sector. Fishing,
which comprised 22.2 percent of the total AHFF, contracted by 2.6 percent in 2012
from 1.5 percent in 2011.
Industry sector rebounded to 19.9 percent from a negative 0.9 percent growth in 2011
brought about by the remarkable performance of Manufacturing and Construction.
Manufacturing, which contributed 42.1 percent to the total Industry sector, posted an
impressive growth of 21.4 percent in 2012 from 8.1 percent growth a year ago.
Likewise, Construction turned around from negative 12.5 percent in 2011 to 25.4
percent in 2012. This was brought about by both private and public construction.
Electricity, Gas and Water supply jumped to 9.8 percent from 2.2 percent in 2011.
Mining and Quarrying, however, slowed down to 4.2 percent from 11.1 percent in
2011 brought about by the decrease in coal which accounted for 99.1 percent of the
total mining industry of the region.
The Services sector was the largest contributor to the overall economic growth of
Western Visayas contributing 4.4 percentage points while the Industry sector
contributed 3.1 percentage points. The AHFF sector pulled down the economic
performance of the region but by a meager 0.02 percentage point.
Central Visayas economy posts robust growth
The economy of Central Visayas posted a robust growth of 9.3 percent in 2012,
from 6.8 percent a year ago. Both Industry and Services sectors contributed to this
growth, with better performance this year compared to last year .
Services accounted for the bulk of the region’s domestic output at 56.2 percent,
followed by Industry at 36.6 percent and AHFF at 7.2 percent. Among the three
sectors, only AHFF’s share decreased from 2011 to 2012.
Services accelerated from 5.7 percent in 2011 to 9.6 percent in 2012. All subsectors
registered accelerated growths. Trade and RERBA posted the highest growths at
12.1 percent and 10.2 percent, respectively. Public Administration and Defense,

H-13
Financial Intermediation and TSC also expanded by 9.5 percent, 9.1 percent and 9.0
percent, respectively. Other Services posted the lowest growth at 6.7 percent.
Industry further expanded from 9.3 percent in 2011 to 10.9 percent in 2012.
Construction posted the biggest growth of 23.3 percent in 2012, from 13.8 percent a
year ago. The EGWS subsector accelerated from 4.6 percent in 2011 to 7.8 percent
in 2012. Mining and Quarrying, on the other hand, slowed down from a 13.0 percent
growth in 2011 to 6.5 percent in 2012. Manufacturing, the biggest contributor among
the subsectors, decelerated from 7.9 percent in 2011 to 6.3 percent in 2012.
The AHFF sector declined from a 3.7 percent growth in 2011 to negative 0.6 percent
in 2012. Agriculture and Forestry slowed down from a 6.3 percent growth in 2011 to
negative 0.4 percent in 2012. Meanwhile, Fishing improved from a negative 7.2
percent growth in 2011 to negative 1.7 percent in 2012.
The Services sector was the biggest contributor to the region’s GDP at 5.4
percentage points while Industry contributed 3.9 percentage points.
Eastern Visayas economy contracts as manufacturing slumps
The economy of Eastern Visayas contracted by 6.2 percent in 2012 from a 2.1
percent growth in 2011 brought about by the slump in Manufacturing subsector.
Services accounted for the biggest share of the region’s economy at 39.3 percent,
closely followed by Industry at 38.1 percent. The AHFF sector had the smallest share
among the major sectors at 22.6 percent.
Services accelerated from 4.5 percent in 2011 to 7.5 percent in 2012. All subsectors
posted accelerated growths, except for Other Services. High growths were posted by
Financial Intermediation, Trade, RERBA and TSC at 13.5 percent, 10.2 percent, 8.1
percent and 8.0 percent, respectively. Public Administration and Defense also grew,
albeit slower, by 5.2 percent while Other Services grew by 4.2 percent.
Industry suffered a reversal from a 1.7 percent growth in 2011 to a negative 18.5
percent growth in 2012. This was mainly due to the slump in Manufacturing
subsector, the biggest contributor among the subsectors, which plunged to a negative

H-14
40.4 percent growth in 2012 from a 6.9 percent growth in 2011. Meanwhile,
Construction rebounded from a negative 17.3 percent growth in 2011 to a hefty 31.8
percent growth in 2012. EGWS also improved from a negative 0.1 percent growth in
2011 to 7.7 percent growth in 2012. Mining and Quarrying, on the other hand,
suffered a huge slowdown from 116.5 percent in 2011 to 26.0 percent in 2012.
The AHFF sector further contracted from a negative 0.8 percent growth in 2011 to
negative 3.0 percent in 2012. Agriculture and Forestry subsector slowed down from
0.3 percent growth in 2011 to negative 2.0 percent in 2012. Fishing decelerated
further from negative 4.1 percent in 2011 to negative 6.3 percent in 2012.
The Services sector was the biggest contributor to the region’s GDP at 2.6
percentage points. Industry and AHFF sectors pulled down the growth by 8.1 and 0.7
percentage points, respectively.
Industry and Services sectors boost Zamboanga Peninsula’s fast-growing economy Zamboanga Peninsula’s economy soared high to 12.4 percent in 2012 from 0.1
percent in 2011. This was the fastest growth in 2012 among the country’s 17 regions.
The impressive economic performance of the region was brought about by the
accelerated growths of the Industry and Services sectors.
Among the sectors, Services accounted for the largest share of the region’s total
economy at 42.7 percent in 2012, followed by the Industry sector with 34.8
percentage share and AHFF with 22.5 percent. While the percentage share of the
Industry sector increased over the period 2010 to 2012, the percentage shares of the
Services and AHFF sectors decreased.
Services expanded by 8.3 percent in 2012 from 6.0 percent in 2011. The growth was
due to the increase in all its subsectors, except the Other Services which decelerated
from 11.0 percent in 2011 to 7.0 percent in 2012. Public Administration and Defense
rebounded from negative 0.1 percent in 2011 to 5.6 percent in 2012. Financial
Intermediation grew from 4.4 percent in 2011 to 11.7 percent in 2012, Trade from 3.4
percent to 10.5 percent, RERBA from 6.1 percent to 7.0 percent, and TSC from 8.0
percent to 8.2 percent.

H-15
Industry surged to 31.6 percent in 2012 from 1.5 percent in 2011 due to the
accelerated growths in all its subsectors. Manufacturing, which accounted for 27.4
percent of the region’s total economy, grew remarkably by 35.2 percent in 2012 from
5.9 percent in 2011. The double-digit growth was attributed to a high increase in
production of canned sardines. Construction rebounded from negative 12.3 percent
in 2011 to 28.5 percent in 2012 due to the increase in both the public and private
construction. Mining and quarrying and EGWS, likewise, turned around from negative
14.4 percent in 2011 to 0.6 percent in 2012 and negative 0.3 percent in 2011 to 4.0
percent in 2012, respectively.
Growth in the AHFF sector improved from negative 9.7 percent in 2011 to negative
2.6 percent in 2012. Fishing, which accounted for 7.8 percent of the region’s domestic
output, improved from negative 23.5 percent in 2011 to negative 7.3 in 2012.
Agriculture and Forestry, on the other hand, decelerated to 0.1 percent in 2012 from
0.6 percent in 2011.
Industry was the largest contributor to the region’s overall economic growth in 2012
with 9.4 percentage points, followed by the Services sector with 3.7 percentage
points.The AHFF sector, however, pulled down the region’s growth by 0.7 percentage
point.
Industry and Services robust growths spur Northern Mindanao’s economy Northern Mindanao’s economy registered a 7.4 percent growth in 2012, higher than
its 5.8 percent growth the previous year. The regional economic growth spurred in
2012 as Industry and Services posted higher growths as compared to the previous
year.
The region’s economy was largely comprised by the Services sector with a 41.8
percentage share, followed by Industry and AHFF with a share of 33.4 percent and
24.8 percent, respectively.
Services sector grew at a faster pace in 2012 by 9.0 percent as compared to its
growth in the previous year of 4.6 percent. All the subsectors in the Services sector
H-16
except Other Services posted accelerated growths. Trade showed a remarkable
growth of 11.1 percent from 3.5 percent. TSC grew by 10.5 percent from 7.1 percent
in 2011. Public Administration and Defense also showed an impressive growth of 7.1
percent in 2012 from a meager growth of 0.3 percent in 2011. Likewise, Financial
Intermediation and RERBA posted accelerated growths of 9.0 percent in 2012 from
5.2 percent in 2011 and 9.8 percent in 2012 from 6.2 percent in 2011, respectively.
On the other hand, Other Services slightly decelerated to 4.4 percent in 2012 from 5.3
percent the previous year.
Industry expanded by 9.2 percent in 2012 from 6.7 percent in 2011. The accelerated
growth in the Industry sector was attributed to the higher growth rates in all its
subsectors. Construction, doubling its pace of expansion in 2012, grew by 10.6
percent from 5.8 percent growth a year ago. Mining & Quarrying, likewise, grew by
9.5 percent in 2012 from 4.2 percent in 2011. Manufacturing also showed a higher
growth of 10.8 percent from 8.3 percent growth in 2011, and EGWS grew by 3.4
percent from 2.9 percent.
The AHFF sector posted a decelerated growth of 2.5 percent in 2012 from 6.5 percent
in 2011. The deceleration was attributed to the slowdown of Agriculture and Forestry
from 7.5 percent growth in 2011 to 2.2 percent growth in 2012. On the other hand,
Fishing rebounded from a negative 0.6 growth in the previous year to 4.7 percent
growth in 2012. However, the turnaround of the Fishing subsector was not enough to
pull up the performance of the AHFF.
The Services sector provided the biggest contribution to the region’s economic growth
at 3.7 percentage points, followed by the Industry and AHFF contributing 3.0 and 0.6
percentage points, respectively.
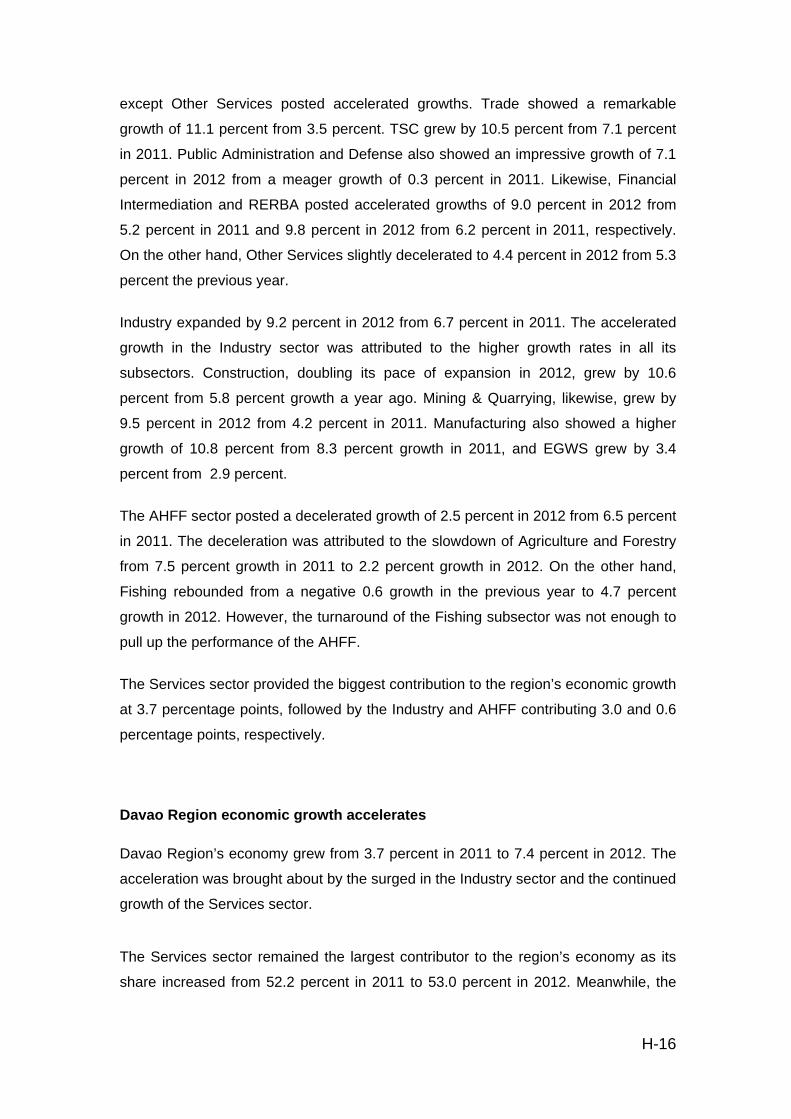
Davao Region economic growth accelerates Davao Region’s economy grew from 3.7 percent in 2011 to 7.4 percent in 2012. The
acceleration was brought about by the surged in the Industry sector and the continued
growth of the Services sector.
The Services sector remained the largest contributor to the region’s economy as its
share increased from 52.2 percent in 2011 to 53.0 percent in 2012. Meanwhile, the

H-17
contributions of Industry and AHFF to the total domestic output were 29.0 percent and
17.9 percent, respectively.
The Services sector expanded by 9.2 percent in 2012 from 6.7 percent in 2011. The
growth was brought about by the accelerations in Trade, Financial Intermediation, as
well as PAD. Trade accelerated from 4.5 percent in 2011 to 10.0 percent in 2012.
Financial Intermediation showed faster growth from 4.6 percent in 2011 to 12.1
percent in 2012, while PAD accelerated from 1.0 percent in 2011 to 6.9 percent in
2012. TSC posted a decelerated growth from 8.6 percent in 2011 to 8.2 percent in
2012. Decelerated growths were likewise recorded in RERBA from 12.0 percent in
2011 to 10.8 percent in 2012, and Other Services from 8.9 percent in 2011 to 6.5
percent in 2012.
The growth of the Industry sector surged from 0.7 percent in 2011 to 8.9 percent in
2012. Construction and EGWS rebounded from negative 9.6 percent in 2011 to 13.7
percent in 2012 and negative 0.1 percent in 2011 to 6.5 percent in 2012, respectively.
Manufacturing posted an accelerated growth of 14.0 percent in 2012 from 11.8
percent in 2011. On the other hand, Mining and Quarrying sank deeper from negative
30.0 percent in 2011 to negative 59.8 percent in 2012.
The AHFF sector decelerated from 0.6 percent in 2011 to 0.4 percent in 2012.
Agriculture and Forestry registered a decelerated growth of 0.1 percent in 2012 from
1.0 percent in 2011. Although Fishing rebounded from negative 6.2 percent in 2011 to
6.5 percent in 2012, it was not enough to pull up the AHFF sector as it only
contributed 1.1 percent to the region’s total domestic output.
Services sector contributed the largest to Davao Region’s economic performance in
2012 with 4.8 percentage points share to the 7.4 percent growth. Industry accounted
for 2.6 percentage points share, while AFF contributed a meager 0.1 percentage point
to the region’s total economic growth.
SOCCSKSARGEN’s economy posts robust growth as all major sectors expand The economy of SOCCSKARGEN Region posted a robust growth of 8.1 percent in
2012 from 5.3 percent in 2011 as all its major sectors continued to expand.
H-18
The Services sector, accounting the bulk of the regional economy, sustained its share
of 37.2 percent in 2012. The Industry sector accounting, for 33.0 percent of the
regional economy in 2012, slightly expanded from its share of 32.2 percent in 2011.
The AHFF sector contributed 29.9 percent of the region’s total economic output in
2012, slightly lower than its 30.6 percent share the previous year.
The Services sector almost doubled its previous year’s performance registering a
growth of 8.1 percent in 2012 from a 4.3 percent growth in 2011. All its subsectors
posted accelerated growths except TSC, which slowed down to 5.5 percent in 2012
from 7.3 percent in 2011. Financial Intermediation posted an impressive growth of
12.6 percent from 4.7 percent, RERBA grew by 10.5 percent from 6.8 percent, Trade
expanded by 9.0 percent from 3.5 percent, PAD rebounded to 7.4 percent in 2012
from a negative 0.1 percent growth in 2011, while Other Services posted a growth of
6.0 percent in 2012 from 3.1 percent in 2011.
The Industry sector slightly expanded by 0.8 percentage point, from 10.0 percent in
2011 to 10.8 percent in 2012. The strong performances of Construction, EGWS and
Mining and Quarrying cushioned the lackluster performance of Manufacturing.
Construction rebounded to 9.4 percent growth in 2012 from negative 12.0 percent in
2011. The EGWS subsector expanded by 5.0 percent from 2.4 percent, while Mining
and Quarrying expanded to 12.1 percent from 6.6 percent. Manufacturing, the biggest
Industry subsector, decelerated to 12.0 percent from its 19.1 percent growth the
previous year.
The AHFF sector grew faster at 5.4 percent in 2012 from a modest growth of 1.8
percent in 2011. Fishing, which comprised 5.2 percent share of the region’s AHFF,
rebounded from negative 11.5 percent in 2011 to 16.8 percent growth in 2012. The
lustrous performance was attributed to the remarkable increase in the region’s
commercial fish production brought about by the lifting of the ban for tuna fishing in
the deep seas around Indonesia, Papua New Guinea and Micronesia which are the
fishing grounds of fishing companies in the region. Commercial fishing accounted for
the biggest share of the region’s fishing industry at about 75.0 percent. General
Santos City, a highly urbanized city of SOCCSKSARGEN Region, is tagged as the
Tuna Capital of the Philippines.
The Industry sector contributed 3.5 percentage points to the region’s economic
growth in 2012 while the Services sector chipped in 3.0 percentage points. The

H-19
AHFF sector managed to contribute 1.6 percentage points to the total economic
growth of the region.
Caraga sustains high economic growth
Caraga’s economy grew by 10.6 percent in 2012 from 8.5 percent in 2011. The
growth was attributed to the good performance of all its major sectors, particularly
high growths of Industry and Services sectors.
Services remained to have the biggest share of 44.9 percent of the region’s economy
in 2012, slightly lower than its 45.5 percentage share in 2011. The share of AHFF
decreased to 20.8 percent in 2012 from 22.5 percentage share the previous year.
Industry, on the other hand, increased its share in 2012 at 34.2 percent from 32.0
percent in 2011.
Services expanded by 9.2 percent in 2012 from 8.5 percent in 2011. This was brought
about by the turnaround in the performances of Financial Intermediation and PAD as
well as the accelerated growths in Trade and RERBA. Financial Intermediation
rebounded from negative 1.2 percent in 2011 to a remarkable 11.4 percent growth in
2012. Likewise, PAD recovered from a decline of 0.6 percent in 2011 to 7.6 percent
growth in 2012. Moreover, Trade grew by 8.7 percent in 2012 from 4.2 percent in
2011. The RERBA subsector also grew at a faster pace by 8.4 percent from 6.9
percent. TSC, however, decelerated from 18.5 percent in 2011 to 15.6 percent in
2012 while Other Services likewise decelerated from 7.9 percent in 2011 to 1.3
percent in 2012.
Industry grew faster by 18.4 percent in 2012 from 15.0 percent the previous year.
The growth was attributed to the recovery of Construction from a decline of 7.8
percent in 2011 to an impressive 22.2 percent growth in 2012, and the accelerated
growth in EGWS from 2.3 to 5.0 percent. Meanwhile, Mining and Quarrying
decelerated from 28.0 percent in 2011 to 20.5 percent in 2012. Manufacturing also
managed to grow by 4.4 percent, a slower pace than its growth in the previous year at
11.0 percent.

H-20
The AHFF sector expanded by 2.4 percent in 2012 from a meager 0.4 percent growth
in 2011. Agriculture and Forestry posted an accelerated growth from 1.9 percent in
2011 to 3.5 percent in 2012. However, Fishing declined by 3.8 percent in 2012.
Industry provided the biggest contribution of 5.9 percentage points to the economic
growth of the region. Services sector contributed 4.2 percentage points while AHFF
contributed a meager 0.5 percentage point.
Services sector bouys up ARMM’s regional economy The regional economy of the ARMM rebounded from a negative 0.3 percent in 2011
to 1.2 percent in 2012. The Services sector managed to keep the region’s economy
afloat by cushioning the lackluster performances of the AHFF and Industry sectors.
The AHFF sector remained the biggest contributor to the region’s economy
accounting for 61.9 percent of the region’s total domestic output in 2012, followed by
Services which accounted for 32.8 percent. The Industry sector, however, contributed
a minimal share of 5.3 percent.
The Services sector grew by 6.3 percent in 2012 from 1.4 percent in 2011. All its
subsectors showed good performances. Financial Intermediation grew by 10.7
percent from 2.4 percent. TSC expanded by 8.4 percent from 2.1 percent. The PAD
subsector rebounded to 5.8 percent in 2012 from a negative growth of 1.7 percent in
2011. The RERBA subsector accelerated from 1.9 percent to 4.9 percent, Trade
registered an improved performance as it grew by 4.0 percent in 2012 from 1.0
percent in 2011. Other Services sustained its strong performance of 6.3 percent.
On the other hand, AHFF continued to suffer a negative growth of 1.1 percent in
2012, albeit an improvement from its negative 2.1 percent growth in 2011. Agriculture
and Forestry grew negligibly while Fishing contracted by 4.6 percent in 2012 from a
modest growth of 1.6 percent in 2011. The lackluster performance of the AHFF sector
was attributed to a decrease in production of major crops like palay and corn as well
as livestock, poultry and fishery.
The Industry sector contracted to a negative 1.0 percent in 2012 from 13.3 percent in
2011. All its subsectors experienced decelerations except Mining and Quarrying

H-21
which registered an improved performance of 2.3 percent growth in 2012 from 1.5
percent in 2011. Construction plunged to negative 9.8 percent in 2012 from a
remarkable growth rate of 73.0 percent in 2011, EGWS slowed down to 0.7 percent in
2012 from 3.3 percent in 2011, and Manufacturing decelerated to 3.0 percent from 4.1
percent.
The Services sector contributed 2.0 percentage points to the economic growth of the
region while Industry and AHFF pulled down the region’s growth by 0.1 and 0.7
percentage point, respectively.

H-22
Economic Performance by Industry
AHFF posts accelerated growth
The AHFF sector slightly grew from 2.6 percent in 2011 to 2.8 percent in 2012. Its
share to the total GDP of the country remained the smallest as it slightly decelerated
to 11.1 percent in 2012 from 11.5 percent in 2011. Its contribution to the country’s
GDP growth slightly increased to 0.32 percentage point in 2012 from 0.30 percentage
point contribution the previous year.
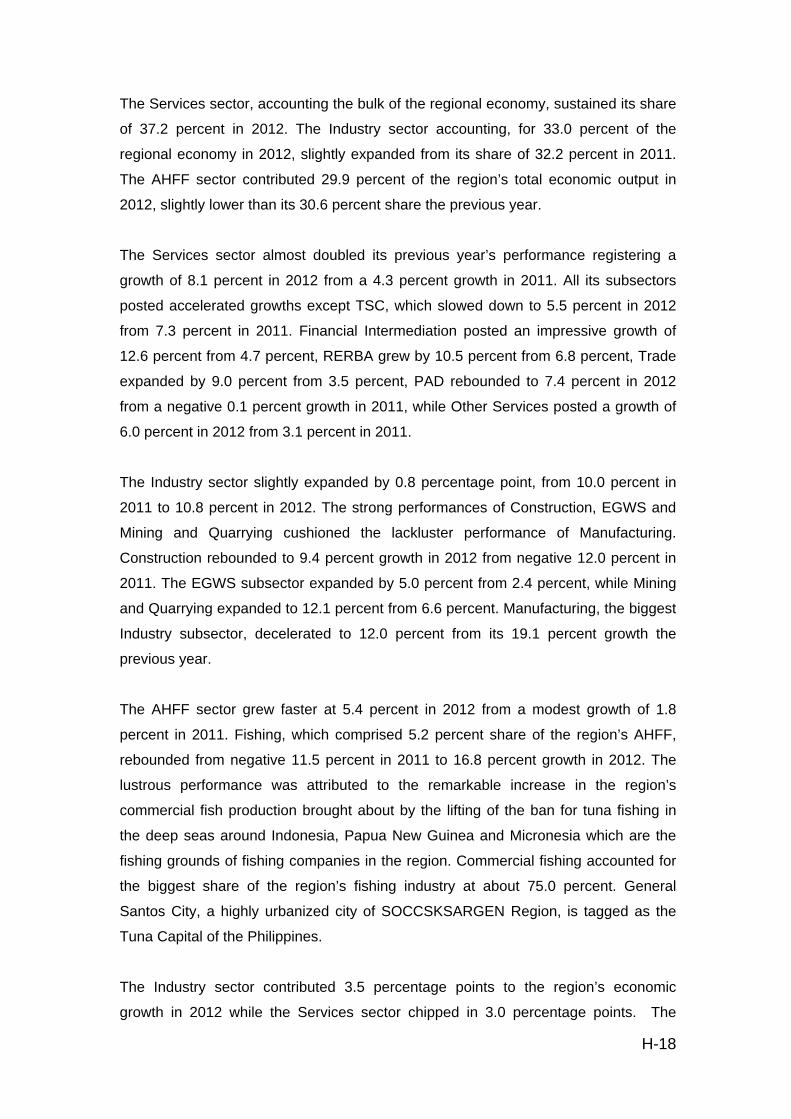
Only one region of the 17 regions of the country made a rebound in AHFF, seven
regions recorded accelerations, two regions improved but still had negative growths,
while three regions posted decelerated growths. On the other hand, three regions
suffered reversals in growths and one region sank deeper.
The AHFF sector of Central Luzon rebounded to 9.1 percent in 2012 from negative
1.3 percent the previous year. The NCR, CAR, Ilocos, CALABARZON, Bicol,
SOCCSKSARGEN and Caraga regions posted accelerations of 10.8, 1.5, 3.7, 2.5,
2.9, 5.4 and 2.4 percent, respectively. Zamboanga Peninsula and ARMM showed
improvement though still with negative growths; negative 2.6 percent from negative
9.7 percent and negative 1.1 percent from negative 2.1 percent, respectively.
Meanwhile, Cagayan Valley, Northern Mindanao and Davao Region posted
decelerated growths of 8.3, 2.5 and 0.4 percent, respectively.
The AHFF sector of Western Visayas suffered a reversal from 14.1 percent in 2011 to
negative 0.1 percent in 2012. MIMAROPA and Central Visayas also recorded
reversals of negative 0.3 percent and negative 0.6 percent, respectively. Eastern
Visayas sank deeper from negative 0.8 percent in 2011 to negative 3.0 percent in
2012.
Central Luzon, CALABARZON and Western Visayas remained the top three regions
with the largest shares of the Gross Value Added (GVA) of AHFF in 2012 with 14.0,
9.9 and 9.4 percentage shares, respectively.
Central Luzon was the top contributor to AHFF growth with 1.2 percentage points,
followed by Cagayan Valley and SOCCSKSARGEN with 0.5 percentage point and 0.4
percentage point, respectively.
H-23
Growth Rates of Regional Economies in Agriculture, Hunting, Forestry and Fishing 2010-2012, at Constant 2000 Prices
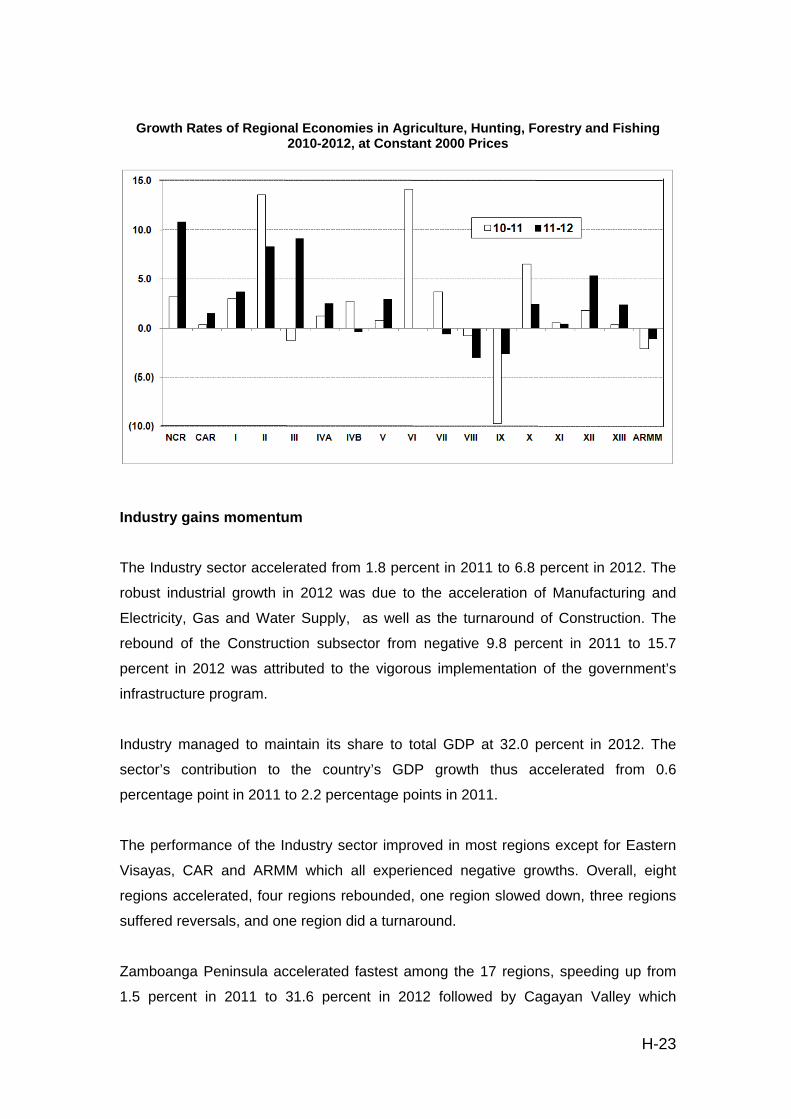
Industry gains momentum
The Industry sector accelerated from 1.8 percent in 2011 to 6.8 percent in 2012. The
robust industrial growth in 2012 was due to the acceleration of Manufacturing and
Electricity, Gas and Water Supply, as well as the turnaround of Construction. The
rebound of the Construction subsector from negative 9.8 percent in 2011 to 15.7
percent in 2012 was attributed to the vigorous implementation of the government’s
infrastructure program.
Industry managed to maintain its share to total GDP at 32.0 percent in 2012. The
sector’s contribution to the country’s GDP growth thus accelerated from 0.6
percentage point in 2011 to 2.2 percentage points in 2011.
The performance of the Industry sector improved in most regions except for Eastern
Visayas, CAR and ARMM which all experienced negative growths. Overall, eight
regions accelerated, four regions rebounded, one region slowed down, three regions
suffered reversals, and one region did a turnaround.
Zamboanga Peninsula accelerated fastest among the 17 regions, speeding up from
1.5 percent in 2011 to 31.6 percent in 2012 followed by Cagayan Valley which

H-24
rebounded from negative 13.8 percent to 12.8 percent during the same period. On the
other hand, Eastern Visayas suffered the biggest reversal from 1.7 percent in 2011 to
negative 18.5 percent in 2012 due to a substantial decline in the output of its
Manufacturing subsector.
The CALABARZON region continued to account for the largest share of the country’s
total industry output with 33.3 percent share in 2012. This was followed by NCR with
19.4 percent and Central Luzon with 12.1 percent. One region from Visayas and two
from Mindanao had the next largest share to total industrial sector output in 2012:
Central Visayas with 7.2 percent, Northern Mindanao with 4.0 percent, and Davao
Region with 3.5 percent. On the other hand, ARMM registered the smallest share of
0.1 percent, followed by Cagayan Valley (0.6 percent) and Bicol (1.2 percent).
Central Luzon was the top contributor to the growth of the Industry sector in 2012 at
2.3 percentage points. The next major contributors were NCR at 1.3 percentage
points, and Central Visayas at 0.8 percentage point.
Growth Rates of Regional Economies in the Industry Sector: 2010-2012, at Constant 2000 Prices
Services remains major driver of the country’s economy
The Services sector remained the major contributor to the country’s economy. The
sector accounted for 56.9 percent of the domestic economy, a slight increase from its
H-25
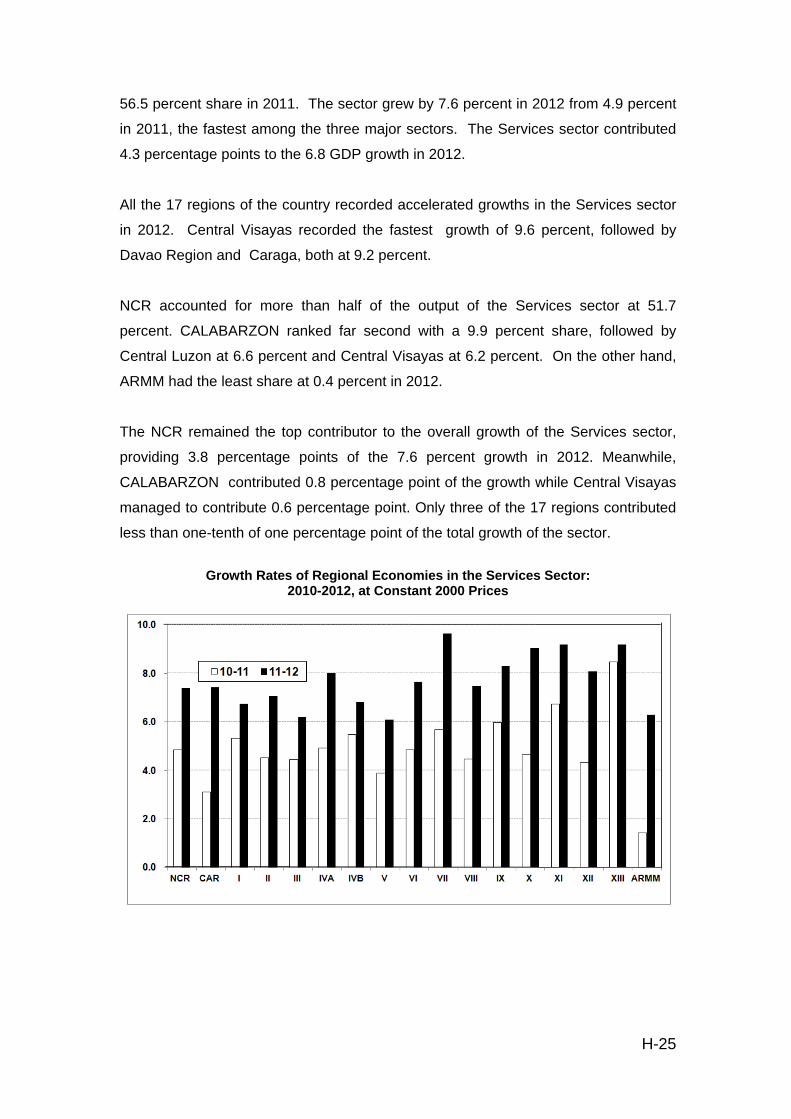
56.5 percent share in 2011. The sector grew by 7.6 percent in 2012 from 4.9 percent
in 2011, the fastest among the three major sectors. The Services sector contributed
4.3 percentage points to the 6.8 GDP growth in 2012.
All the 17 regions of the country recorded accelerated growths in the Services sector
in 2012. Central Visayas recorded the fastest growth of 9.6 percent, followed by
Davao Region and Caraga, both at 9.2 percent.
NCR accounted for more than half of the output of the Services sector at 51.7
percent. CALABARZON ranked far second with a 9.9 percent share, followed by
Central Luzon at 6.6 percent and Central Visayas at 6.2 percent. On the other hand,
ARMM had the least share at 0.4 percent in 2012.
The NCR remained the top contributor to the overall growth of the Services sector,
providing 3.8 percentage points of the 7.6 percent growth in 2012. Meanwhile,
CALABARZON contributed 0.8 percentage point of the growth while Central Visayas
managed to contribute 0.6 percentage point. Only three of the 17 regions contributed
less than one-tenth of one percentage point of the total growth of the sector.
Growth Rates of Regional Economies in the Services Sector:
2010-2012, at Constant 2000 Prices

H-26
Per Capita GRDP
Real per capita GRDP of NCR nearly three times the national per capita GDP
The average real per capita GDP of the Philippines increased by 5.0 percent or from
PhP62,739 in 2011 to PhP65,904 in 2012.
NCR posted the highest per capita GRDP at PhP183,747, nearly three times the
national average. This level of per capita GRDP was 5.6 percent more than NCR’s
per capita GRDP in 2011. Aside from NCR, two other regions, CALABARZON and
CAR likewise had per capita GRDP higher than the national average at PhP82,393
and PhP73,573, respectively. Meanwhile, ARMM had the lowest per capita GRDP
among the regions at PhP14,321.
Among the island groups, Luzon (excluding NCR) recorded the highest per capita
GDP. The average per capita GDP in the Luzon island group was PhP55.595 in 2012,
up by 4.3 percent from PhP53,279 in 2011. Meanwhile, the Mindanao island group
posted the biggest increase in per capita GDP between 2011 and 2012 - from
PhP37,589 in 2011, its average per capita GDP increased by 6.3 percent to
PhP39,972 in 2012. Per capita GDP in the Visayas island group increased by 4.2
percent from PhP41,503 to PhP43,226.
Fourteen of the 17 regions of the country registered improved per capita GRDP with
Zamboanga Peninsula recording the highest increase at 10.6 percent from PhP
33,726 in 2011 to PhP37,284 in 2012. On the other hand, three regions recorded
negative growths in per capita GRDP with Eastern Visayas dropping the most at
negative 7.3 percent from PhP37,006 to PhP34,305 in 2012, followed by CAR by
negative 0.5 percent and ARMM by negative 0.2 percent.
The NCR posted the highest per capita index relative to the national average at 278.8
with CALABARZON a distant second at 125.0 and CAR, third at 111.6. All 14 other
regions have indices lower than the national average with ARMM at the bottom at
21.7.
H-27
Economic Performance by Island Group
The economies of Luzon and Mindanao island groups posted accelerated growths
from 2011 to 2012 while Visayas island group maintained its performance.
Luzon’s economic performance improves
Luzon’s economy (excluding NCR) accelerated from 3.3 percent in 2011 to 6.3
percent in 2012.
The Luzon island group accounted for 37.1 percent of the country’s total domestic
output in 2012, the biggest among the island groups. The share, however, was
slightly smaller compared to previous year.
In 2012, the Luzon island group contributed 2.3 percentage points to the country’s
GDP of 6.8 percent, higher than its contribution of 1.2 percentage points in 2011.
Visayas’ economy sustains growth
The economy of the Visayas island group remained constant with 5.6 percent growth
in 2011 and 2012.
Central Visayas accounted for the biggest share of the island’s total output in 2012 at
49.6 percent, followed by Western Visayas at 32.4 percent. Eastern Visayas
accounted for the smallest share at 18.0 percent.
The Visayas island group contribution to the country’s economy decreased from 12.8
percent in 2011 to 12.7 percent in 2012.
The Visayas island group contributed 0.7 percentage point to the country’s GDP in
2012, the same contribution in 2011.
Mindanao economy posts robust growth
The economy of Mindanao posted a robust growth of 8.2 percent in 2012, almost
double its 4.2 percent growth in 2011. This was largely due to the faster growth
posted by all regional economies in Mindanao.

In te
incr
Min
muc
Infla
ARM
The
cou
ARM
Amo
last
ARM
201
erms of con
reased from
danao con
ch lower fro
ation
MM registe
e ARMM re
ntry at 4.7
MM’s econo
ong the 17
two (2) ye
MM was es
2.
ntribution to
m 14.3 perce
tributed 1.2
om its 0.6 pe
Percentag
ers highest
egistered th
percent. In
omy.
regions, AR
ears while E
stimated at
o the total n
ent in 2011
2 percentag
ercentage s
ge Share to 2010-2012,
t inflation
e highest i
flation rate
RMM record
Eastern Vis
194.2 whil
national out
to 14.4 perc
ge points to
share the pr
Total GDP bat Constant
nflation rate
was partic
ded the hig
sayas regist
e that for I
tput, the Mi
cent in 2012
o the count
revious yea
by Major Islat 2000 Price
e year-on-y
cularly high
ghest Implic
tered the lo
locos Regi
ndanao isla
2.
try’s GDP g
r.
and Group: s
year among
in the EGW
it Price Inde
owest in 20
on was pla
and group s
growth in 2
g regions o
WS subsect
ex (IPIN) fo
012. The IP
aced at 158
H-28
share
2012,
of the
tor of
or the
IN of
8.1 in

GRDP 2012
Gross Regional Domestic Product by Industrial Origin
In Percent (at constant 2000 prices)
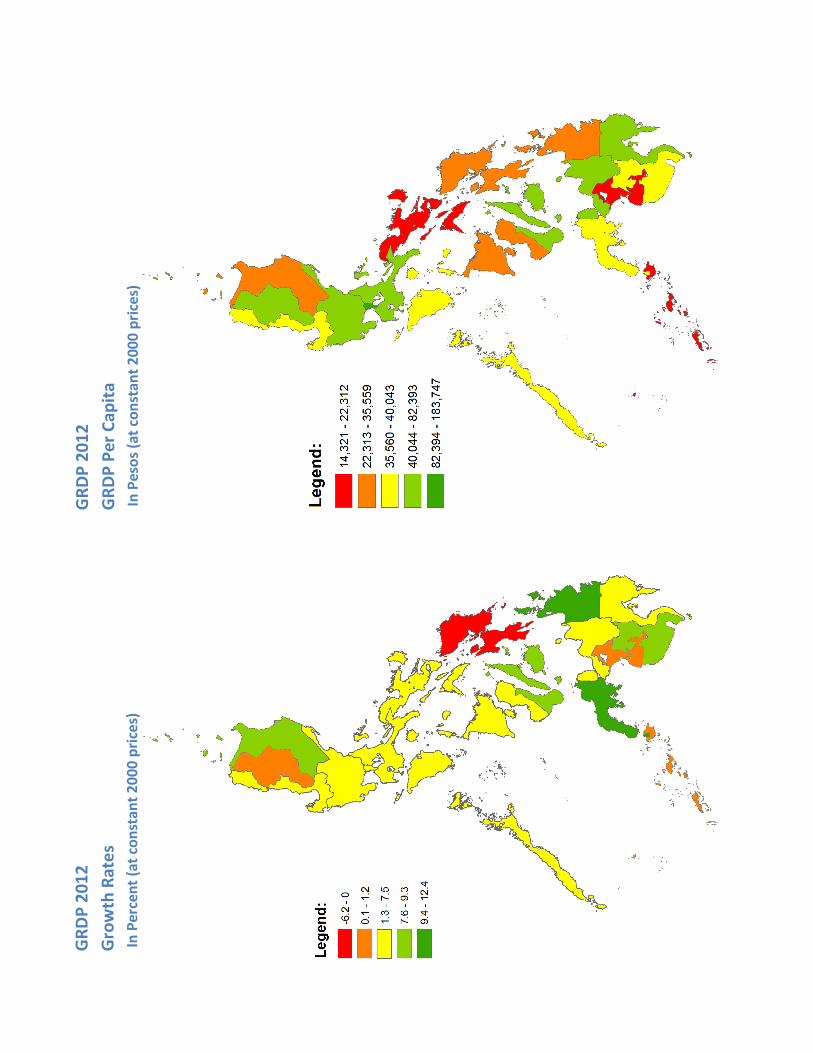
GR
DP
20
12
Gro
wth
Rat
es
In P
erce
nt
(at
con
stan
t 2
00
0 p
rice
s)
GR
DP
20
12
GR
DP
Per
Cap
ita
In P
eso
s (a
t co
nst
ant
20
00
pri
ces)

GR
DP
20
12
Gro
ss V
alu
e A
dd
ed in
Agr
icu
ltu
re, H
un
tin
g, F
ish
ery
and
Fore
stry
In P
eso
s (a
t co
nst
ant
20
00
pri
ces)
GR
DP
20
12
Gro
ss V
alu
e A
dd
ed in
Ind
ust
ry
In P
eso
s (a
t co
nst
ant
20
00
pri
ces)

GR
DP
20
12
Gro
ss V
alu
e A
dd
ed in
Se
rvic
es
In P
eso
s (a
t co
nst
ant
20
00
pri
ces)
GR
DP
20
12
Infl
atio
n R
ate
In P
erce
nt
(bas
ed o
n G
DP
IPIN
)

As of July 2013
GROSS REGIONAL DOMESTIC PRODUCT
Base Year : 2000
2010-2012 By Region
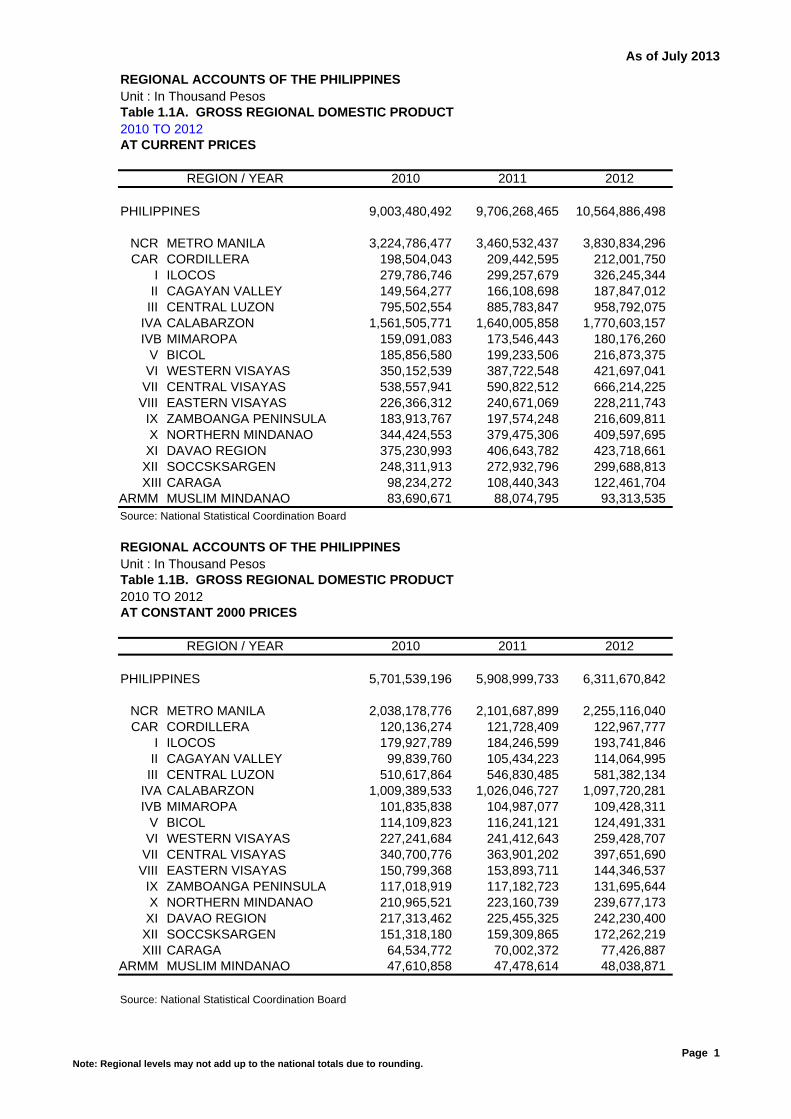
As of July 2013
REGIONAL ACCOUNTS OF THE PHILIPPINESUnit : In Thousand PesosTable 1.1A. GROSS REGIONAL DOMESTIC PRODUCT2010 TO 2012AT CURRENT PRICES 9,003,480 9,706,268 10,564,886
2010 2011 2012
PHILIPPINES 9,003,480,492 9,706,268,465 10,564,886,498
NCR METRO MANILA 3,224,786,477 3,460,532,437 3,830,834,296CAR CORDILLERA 198,504,043 209,442,595 212,001,750
I ILOCOS 279,786,746 299,257,679 326,245,344II CAGAYAN VALLEY 149,564,277 166,108,698 187,847,012
III CENTRAL LUZON 795,502,554 885,783,847 958,792,075IVA CALABARZON 1,561,505,771 1,640,005,858 1,770,603,157IVB MIMAROPA 159,091,083 173,546,443 180,176,260
V BICOL 185,856,580 199,233,506 216,873,375VI WESTERN VISAYAS 350,152,539 387,722,548 421,697,041
VII CENTRAL VISAYAS 538,557,941 590,822,512 666,214,225VIII EASTERN VISAYAS 226,366,312 240,671,069 228,211,743
IX ZAMBOANGA PENINSULA 183,913,767 197,574,248 216,609,811X NORTHERN MINDANAO 344,424,553 379,475,306 409,597,695
XI DAVAO REGION 375,230,993 406,643,782 423,718,661XII SOCCSKSARGEN 248,311,913 272,932,796 299,688,813XIII CARAGA 98,234,272 108,440,343 122,461,704
ARMM MUSLIM MINDANAO 83,690,671 88,074,795 93,313,535Source: National Statistical Coordination Board
REGIONAL ACCOUNTS OF THE PHILIPPINESUnit : In Thousand PesosTable 1.1B. GROSS REGIONAL DOMESTIC PRODUCT2010 TO 2012 1,417,087 1,432,115AT CONSTANT 2000 PRICES 5,701,539 5,909,000 6,311,671
2010 2011 2012
PHILIPPINES 5,701,539,196 5,908,999,733 6,311,670,842
NCR METRO MANILA 2,038,178,776 2,101,687,899 2,255,116,040CAR CORDILLERA 120,136,274 121,728,409 122,967,777
I ILOCOS 179,927,789 184,246,599 193,741,846II CAGAYAN VALLEY 99,839,760 105,434,223 114,064,995
III CENTRAL LUZON 510,617,864 546,830,485 581,382,134IVA CALABARZON 1,009,389,533 1,026,046,727 1,097,720,281IVB MIMAROPA 101,835,838 104,987,077 109,428,311
V BICOL 114,109,823 116,241,121 124,491,331VI WESTERN VISAYAS 227,241,684 241,412,643 259,428,707
VII CENTRAL VISAYAS 340,700,776 363,901,202 397,651,690VIII EASTERN VISAYAS 150,799,368 153,893,711 144,346,537
IX ZAMBOANGA PENINSULA 117,018,919 117,182,723 131,695,644X NORTHERN MINDANAO 210,965,521 223,160,739 239,677,173
XI DAVAO REGION 217,313,462 225,455,325 242,230,400XII SOCCSKSARGEN 151,318,180 159,309,865 172,262,219XIII CARAGA 64,534,772 70,002,372 77,426,887
ARMM MUSLIM MINDANAO 47,610,858 47,478,614 48,038,871Note: GDP series not linked with previous years due to revisions in some sectors. Source: National Statistical Coordination Board
REGION / YEAR
REGION / YEAR
Note: Regional levels may not add up to the national totals due to rounding.Page 1
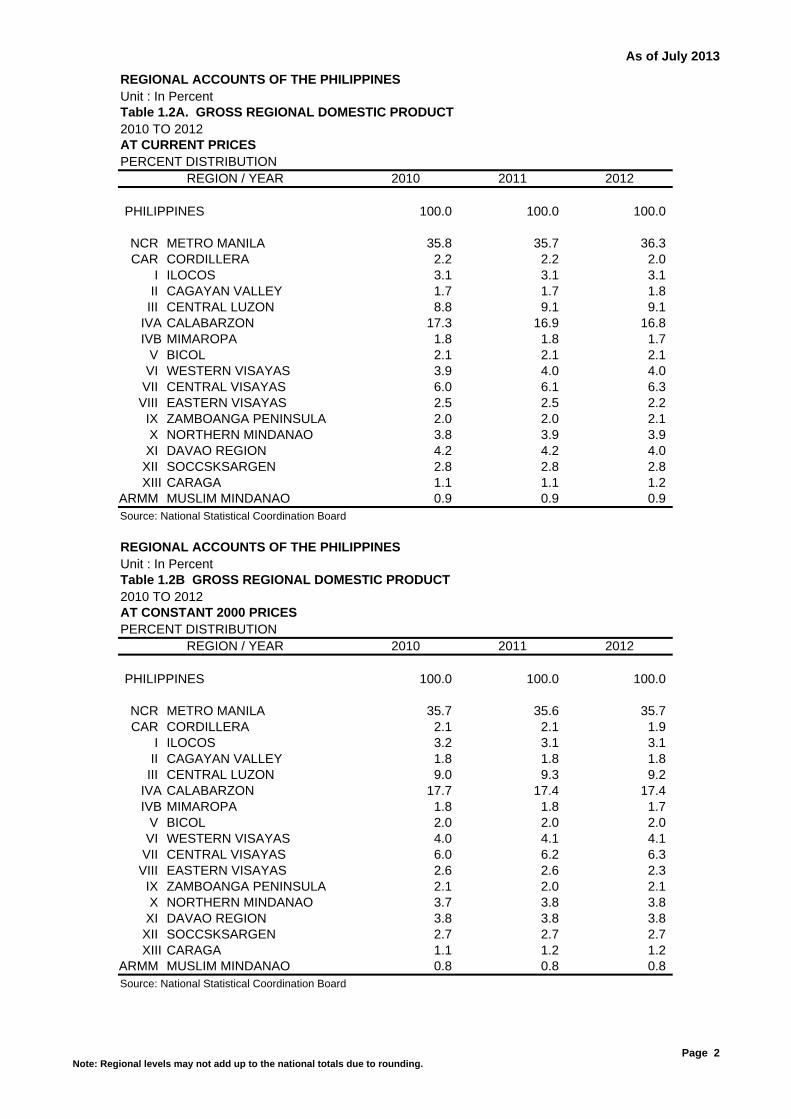
As of July 2013
REGIONAL ACCOUNTS OF THE PHILIPPINESUnit : In PercentTable 1.2A. GROSS REGIONAL DOMESTIC PRODUCT2010 TO 2012AT CURRENT PRICESPERCENT DISTRIBUTION
2010 2011 2012
PHILIPPINES 100.0 100.0 100.0
NCR METRO MANILA 35.8 35.7 36.3 CAR CORDILLERA 2.2 2.2 2.0
I ILOCOS 3.1 3.1 3.1 II CAGAYAN VALLEY 1.7 1.7 1.8
III CENTRAL LUZON 8.8 9.1 9.1 IVA CALABARZON 17.3 16.9 16.8 IVB MIMAROPA 1.8 1.8 1.7
V BICOL 2.1 2.1 2.1 VI WESTERN VISAYAS 3.9 4.0 4.0
VII CENTRAL VISAYAS 6.0 6.1 6.3 VIII EASTERN VISAYAS 2.5 2.5 2.2
IX ZAMBOANGA PENINSULA 2.0 2.0 2.1 X NORTHERN MINDANAO 3.8 3.9 3.9
XI DAVAO REGION 4.2 4.2 4.0 XII SOCCSKSARGEN 2.8 2.8 2.8 XIII CARAGA 1.1 1.1 1.2
ARMM MUSLIM MINDANAO 0.9 0.9 0.9 Source: National Statistical Coordination Board
REGIONAL ACCOUNTS OF THE PHILIPPINESUnit : In PercentTable 1.2B GROSS REGIONAL DOMESTIC PRODUCT2010 TO 2012AT CONSTANT 2000 PRICESPERCENT DISTRIBUTION
2010 2011 2012
PHILIPPINES 100.0 100.0 100.0
NCR METRO MANILA 35.7 35.6 35.7 CAR CORDILLERA 2.1 2.1 1.9
I ILOCOS 3.2 3.1 3.1 II CAGAYAN VALLEY 1.8 1.8 1.8
III CENTRAL LUZON 9.0 9.3 9.2 IVA CALABARZON 17.7 17.4 17.4 IVB MIMAROPA 1.8 1.8 1.7
V BICOL 2.0 2.0 2.0 VI WESTERN VISAYAS 4.0 4.1 4.1
VII CENTRAL VISAYAS 6.0 6.2 6.3 VIII EASTERN VISAYAS 2.6 2.6 2.3
IX ZAMBOANGA PENINSULA 2.1 2.0 2.1 X NORTHERN MINDANAO 3.7 3.8 3.8
XI DAVAO REGION 3.8 3.8 3.8 XII SOCCSKSARGEN 2.7 2.7 2.7 XIII CARAGA 1.1 1.2 1.2
ARMM MUSLIM MINDANAO 0.8 0.8 0.8 Source: National Statistical Coordination Board
REGION / YEAR
REGION / YEAR
Note: Regional levels may not add up to the national totals due to rounding.Page 2

As of July 2013
REGIONAL ACCOUNTS OF THE PHILIPPINESUnit : In PercentTable 1.3A GROSS REGIONAL DOMESTIC PRODUCT2010 TO 2012AT CURRENT PRICESGROWTH RATES
10-11 11-12
PHILIPPINES 7.8 8.8
NCR METRO MANILA 7.3 10.7CAR CORDILLERA 5.5 1.2
I ILOCOS 7.0 9.0II CAGAYAN VALLEY 11.1 13.1
III CENTRAL LUZON 11.3 8.2IVA CALABARZON 5.0 8.0IVB MIMAROPA 9.1 3.8
V BICOL 7.2 8.9VI WESTERN VISAYAS 10.7 8.8
VII CENTRAL VISAYAS 9.7 12.8VIII EASTERN VISAYAS 6.3 (5.2)
IX ZAMBOANGA PENINSULA 7.4 9.6X NORTHERN MINDANAO 10.2 7.9
XI DAVAO REGION 8.4 4.2XII SOCCSKSARGEN 9.9 9.8XIII CARAGA 10.4 12.9
ARMM MUSLIM MINDANAO 5.2 5.9Source: National Statistical Coordination Board
REGIONAL ACCOUNTS OF THE PHILIPPINESUnit : In PercentTable 1.3B GROSS REGIONAL DOMESTIC PRODUCT2010 TO 2012AT CONSTANT 2000 PRICESGROWTH RATES
10-11 11-12
PHILIPPINES 3.6 6.8
NCR METRO MANILA 3.1 7.3CAR CORDILLERA 1.3 1.0
I ILOCOS 2.4 5.2II CAGAYAN VALLEY 5.6 8.2
III CENTRAL LUZON 7.1 6.3IVA CALABARZON 1.7 7.0IVB MIMAROPA 3.1 4.2
V BICOL 1.9 7.1VI WESTERN VISAYAS 6.2 7.5
VII CENTRAL VISAYAS 6.8 9.3VIII EASTERN VISAYAS 2.1 (6.2)
IX ZAMBOANGA PENINSULA 0.1 12.4X NORTHERN MINDANAO 5.8 7.4
XI DAVAO REGION 3.7 7.4XII SOCCSKSARGEN 5.3 8.1XIII CARAGA 8.5 10.6
ARMM MUSLIM MINDANAO (0.3) 1.2Note: GDP series not linked with previous years due to revisions in some sectors. Source: National Statistical Coordination Board
REGION / YEAR
REGION / YEAR
Note: Regional levels may not add up to the national totals due to rounding.Page 3
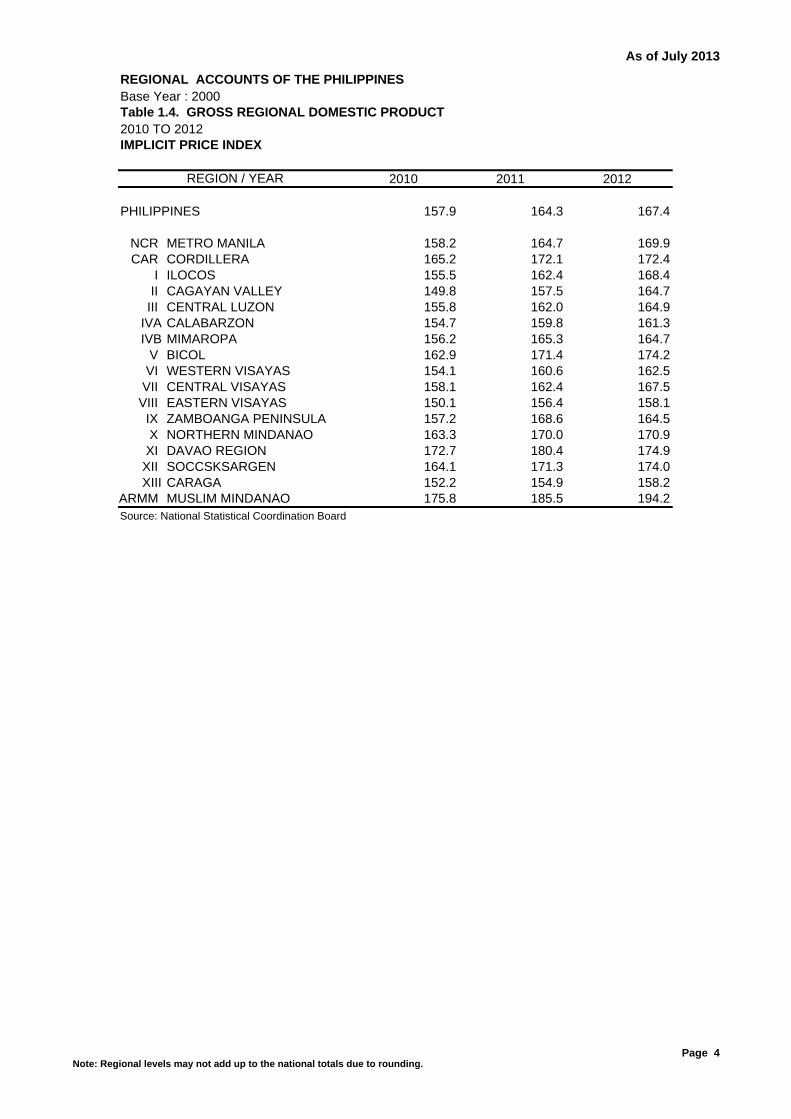
As of July 2013
REGIONAL ACCOUNTS OF THE PHILIPPINES Base Year : 2000Table 1.4. GROSS REGIONAL DOMESTIC PRODUCT2010 TO 2012IMPLICIT PRICE INDEX
2010 2011 2012
PHILIPPINES 157.9 164.3 167.4
NCR METRO MANILA 158.2 164.7 169.9CAR CORDILLERA 165.2 172.1 172.4
I ILOCOS 155.5 162.4 168.4II CAGAYAN VALLEY 149.8 157.5 164.7
III CENTRAL LUZON 155.8 162.0 164.9IVA CALABARZON 154.7 159.8 161.3IVB MIMAROPA 156.2 165.3 164.7
V BICOL 162.9 171.4 174.2VI WESTERN VISAYAS 154.1 160.6 162.5
VII CENTRAL VISAYAS 158.1 162.4 167.5VIII EASTERN VISAYAS 150.1 156.4 158.1
IX ZAMBOANGA PENINSULA 157.2 168.6 164.5X NORTHERN MINDANAO 163.3 170.0 170.9
XI DAVAO REGION 172.7 180.4 174.9XII SOCCSKSARGEN 164.1 171.3 174.0XIII CARAGA 152.2 154.9 158.2
ARMM MUSLIM MINDANAO 175.8 185.5 194.2Source: National Statistical Coordination Board
REGION / YEAR
Note: Regional levels may not add up to the national totals due to rounding.Page 4

As of July 2013
REGIONAL ACCOUNTS OF THE PHILIPPINESUnit : In Thousand PesosTable 2.1A. GROSS VALUE ADDED IN AGRI., HUNTING, FORESTRY and FISHING by Region2010 TO 2012AT CURRENT PRICES 1,108,718 1,235,013 1,250,616
2010 2011 2012
PHILIPPINES 1,108,718,040 1,235,012,509 1,250,616,415
NCR METRO MANILA 8,946,930 9,963,332 9,944,574 CAR CORDILLERA 18,273,587 21,269,156 22,253,282
I ILOCOS 75,324,942 81,584,364 89,867,390 II CAGAYAN VALLEY 58,177,040 70,658,506 80,944,596 III CENTRAL LUZON 144,601,804 150,699,474 164,285,822
IVA CALABARZON 103,982,332 112,759,271 108,587,142 IVB MIMAROPA 39,162,592 44,302,263 45,068,641
V BICOL 48,096,932 52,754,479 52,731,633 VI WESTERN VISAYAS 92,924,858 109,568,504 108,724,537 VII CENTRAL VISAYAS 45,383,790 50,036,763 50,163,547 VIII EASTERN VISAYAS 48,548,739 55,327,990 49,744,337 IX ZAMBOANGA PENINSULA 56,799,180 62,513,238 56,741,094 X NORTHERN MINDANAO 99,887,103 114,554,573 110,878,943 XI DAVAO REGION 91,140,709 105,392,280 97,973,747 XII SOCCSKSARGEN 94,760,324 106,840,708 113,472,617 XIII CARAGA 26,304,825 28,046,577 28,327,865
ARMM MUSLIM MINDANAO 56,402,354 58,741,031 60,906,649 Source: National Statistical Coordination Board
REGIONAL ACCOUNTS OF THE PHILIPPINESUnit : In Thousand PesosTable 2.1B. GROSS VALUE ADDED IN AGRI., HUNTING, FORESTRY and FISHING by Region2010 TO 2012AT CONSTANT 2000 PRICES 662,665 679,835 698,937
2010 2011 2012
PHILIPPINES 662,665,270 679,835,107 698,936,758
NCR METRO MANILA 5,526,304 5,703,486 6,321,269 CAR CORDILLERA 13,042,566 13,093,121 13,290,697
I ILOCOS 47,101,435 48,500,991 50,293,503 II CAGAYAN VALLEY 37,870,777 43,020,729 46,598,261 III CENTRAL LUZON 90,796,967 89,646,191 97,832,317
IVA CALABARZON 66,912,669 67,743,388 69,443,773 IVB MIMAROPA 26,994,741 27,735,967 27,640,149
V BICOL 29,260,587 29,494,292 30,361,715 VI WESTERN VISAYAS 57,691,168 65,843,773 65,798,273 VII CENTRAL VISAYAS 27,919,058 28,954,931 28,781,383 VIII EASTERN VISAYAS 33,898,988 33,629,846 32,607,288 IX ZAMBOANGA PENINSULA 33,764,949 30,491,167 29,697,119 X NORTHERN MINDANAO 54,471,105 58,026,532 59,469,283 XI DAVAO REGION 43,035,970 43,276,973 43,469,605 XII SOCCSKSARGEN 47,948,497 48,826,661 51,451,508 XIII CARAGA 15,696,774 15,757,521 16,135,852
ARMM MUSLIM MINDANAO 30,732,715 30,089,537 29,744,765 Note: Estimates were based on 2002 Census of Agriculture and Fisheries and BAS dataSource: National Statistical Coordination Board
REGION / YEAR
REGION / YEAR
Note: Regional levels may not add up to the national totals due to rounding.
Page 5

As of July 2013
REGIONAL ACCOUNTS OF THE PHILIPPINESUnit : In PercentTable 2.2A. GROSS VALUE ADDED IN AGRI., HUNTING, FORESTRY and FISHING by Region2010 TO 2012AT CURRENT PRICESPERCENT DISTRIBUTION
2010 2011 2012
PHILIPPINES 100.0 100.0 100.0
NCR METRO MANILA 0.8 0.8 0.8 CAR CORDILLERA 1.6 1.7 1.8
I ILOCOS 6.8 6.6 7.2 II CAGAYAN VALLEY 5.2 5.7 6.5 III CENTRAL LUZON 13.0 12.2 13.1
IVA CALABARZON 9.4 9.1 8.7 IVB MIMAROPA 3.5 3.6 3.6
V BICOL 4.3 4.3 4.2 VI WESTERN VISAYAS 8.4 8.9 8.7 VII CENTRAL VISAYAS 4.1 4.1 4.0 VIII EASTERN VISAYAS 4.4 4.5 4.0 IX ZAMBOANGA PENINSULA 5.1 5.1 4.5 X NORTHERN MINDANAO 9.0 9.3 8.9 XI DAVAO REGION 8.2 8.5 7.8 XII SOCCSKSARGEN 8.5 8.7 9.1 XIII CARAGA 2.4 2.3 2.3
ARMM MUSLIM MINDANAO 5.1 4.8 4.9 Source: National Statistical Coordination Board
REGIONAL ACCOUNTS OF THE PHILIPPINESUnit : In PercentTable 2.2B GROSS VALUE ADDED IN AGRI., HUNTING, FORESTRY and FISHING by Region2010 TO 2012AT CONSTANT 2000 PRICESPERCENT DISTRIBUTION
2010 2011 2012
PHILIPPINES 100.0 100.0 100.0
NCR METRO MANILA 0.8 0.8 0.9 CAR CORDILLERA 2.0 1.9 1.9
I ILOCOS 7.1 7.1 7.2 II CAGAYAN VALLEY 5.7 6.3 6.7 III CENTRAL LUZON 13.7 13.2 14.0
IVA CALABARZON 10.1 10.0 9.9 IVB MIMAROPA 4.1 4.1 4.0
V BICOL 4.4 4.3 4.3 VI WESTERN VISAYAS 8.7 9.7 9.4 VII CENTRAL VISAYAS 4.2 4.3 4.1 VIII EASTERN VISAYAS 5.1 4.9 4.7 IX ZAMBOANGA PENINSULA 5.1 4.5 4.2 X NORTHERN MINDANAO 8.2 8.5 8.5 XI DAVAO REGION 6.5 6.4 6.2 XII SOCCSKSARGEN 7.2 7.2 7.4 XIII CARAGA 2.4 2.3 2.3
ARMM MUSLIM MINDANAO 4.6 4.4 4.3 Source: National Statistical Coordination Board
REGION / YEAR
REGION / YEAR
Note: Regional levels may not add up to the national totals due to rounding.
Page 6
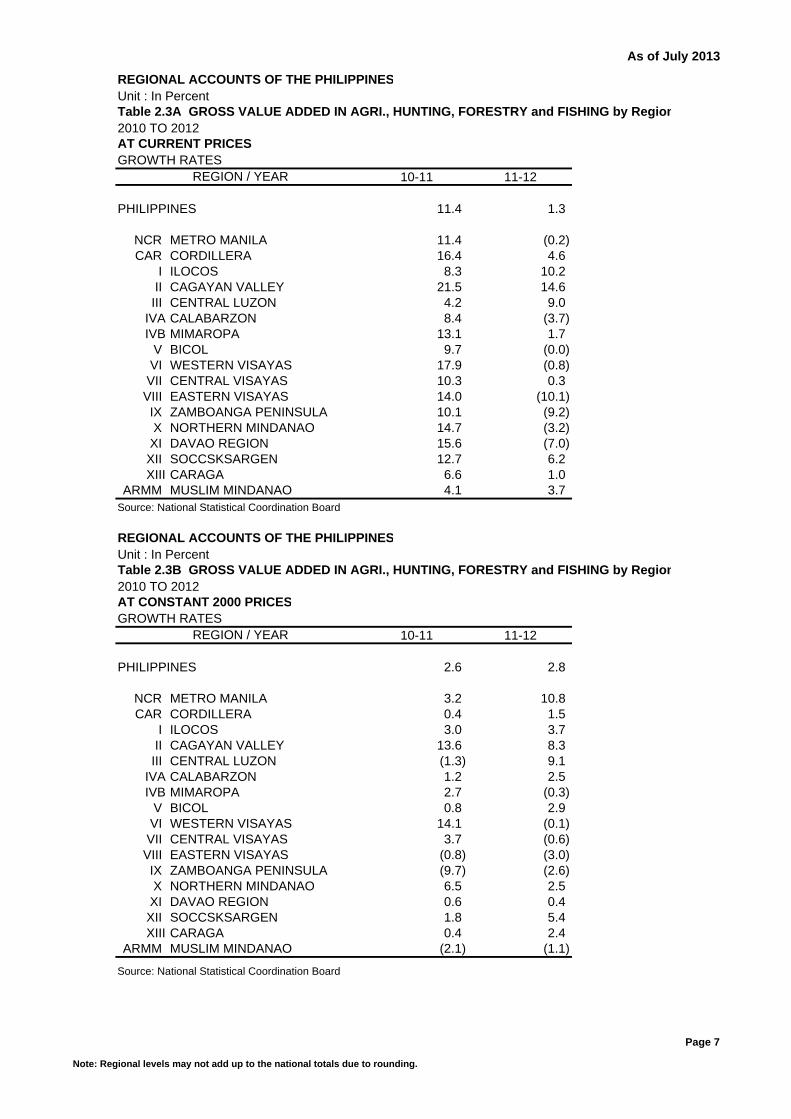
As of July 2013
REGIONAL ACCOUNTS OF THE PHILIPPINESUnit : In PercentTable 2.3A GROSS VALUE ADDED IN AGRI., HUNTING, FORESTRY and FISHING by Region2010 TO 2012AT CURRENT PRICESGROWTH RATES
10-11 11-12
PHILIPPINES 11.4 1.3
NCR METRO MANILA 11.4 (0.2)CAR CORDILLERA 16.4 4.6
I ILOCOS 8.3 10.2II CAGAYAN VALLEY 21.5 14.6III CENTRAL LUZON 4.2 9.0
IVA CALABARZON 8.4 (3.7)IVB MIMAROPA 13.1 1.7
V BICOL 9.7 (0.0)VI WESTERN VISAYAS 17.9 (0.8)VII CENTRAL VISAYAS 10.3 0.3VIII EASTERN VISAYAS 14.0 (10.1)IX ZAMBOANGA PENINSULA 10.1 (9.2)X NORTHERN MINDANAO 14.7 (3.2)XI DAVAO REGION 15.6 (7.0)XII SOCCSKSARGEN 12.7 6.2XIII CARAGA 6.6 1.0
ARMM MUSLIM MINDANAO 4.1 3.7Source: National Statistical Coordination Board
REGIONAL ACCOUNTS OF THE PHILIPPINESUnit : In PercentTable 2.3B GROSS VALUE ADDED IN AGRI., HUNTING, FORESTRY and FISHING by Region2010 TO 2012AT CONSTANT 2000 PRICESGROWTH RATES
10-11 11-12
PHILIPPINES 2.6 2.8
NCR METRO MANILA 3.2 10.8CAR CORDILLERA 0.4 1.5
I ILOCOS 3.0 3.7II CAGAYAN VALLEY 13.6 8.3III CENTRAL LUZON (1.3) 9.1
IVA CALABARZON 1.2 2.5IVB MIMAROPA 2.7 (0.3)
V BICOL 0.8 2.9VI WESTERN VISAYAS 14.1 (0.1)VII CENTRAL VISAYAS 3.7 (0.6)VIII EASTERN VISAYAS (0.8) (3.0)IX ZAMBOANGA PENINSULA (9.7) (2.6)X NORTHERN MINDANAO 6.5 2.5XI DAVAO REGION 0.6 0.4XII SOCCSKSARGEN 1.8 5.4XIII CARAGA 0.4 2.4
ARMM MUSLIM MINDANAO (2.1) (1.1)Note: Estimates were based on 2002 Census of Agriculture and Fisheries and BAS dataSource: National Statistical Coordination Board
REGION / YEAR
REGION / YEAR
Note: Regional levels may not add up to the national totals due to rounding.
Page 7
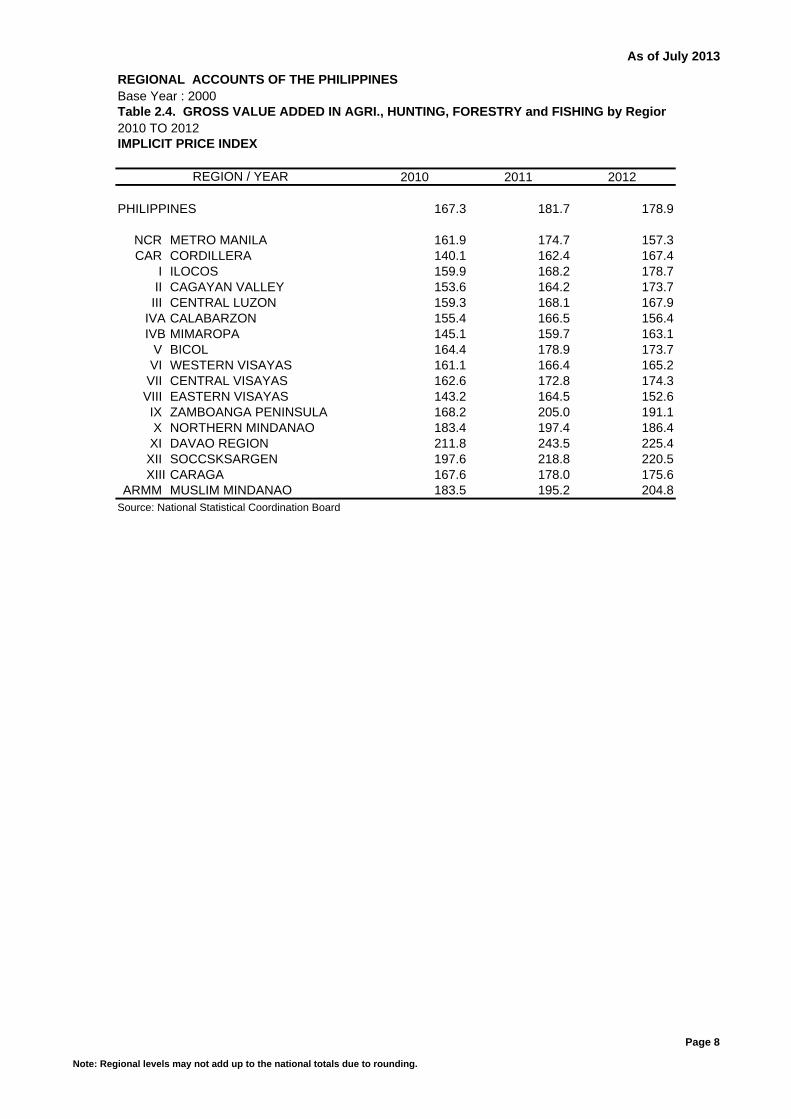
As of July 2013
REGIONAL ACCOUNTS OF THE PHILIPPINES Base Year : 2000Table 2.4. GROSS VALUE ADDED IN AGRI., HUNTING, FORESTRY and FISHING by Region2010 TO 2012IMPLICIT PRICE INDEX
2010 2011 2012
PHILIPPINES 167.3 181.7 178.9
NCR METRO MANILA 161.9 174.7 157.3CAR CORDILLERA 140.1 162.4 167.4
I ILOCOS 159.9 168.2 178.7II CAGAYAN VALLEY 153.6 164.2 173.7III CENTRAL LUZON 159.3 168.1 167.9
IVA CALABARZON 155.4 166.5 156.4IVB MIMAROPA 145.1 159.7 163.1
V BICOL 164.4 178.9 173.7VI WESTERN VISAYAS 161.1 166.4 165.2VII CENTRAL VISAYAS 162.6 172.8 174.3VIII EASTERN VISAYAS 143.2 164.5 152.6IX ZAMBOANGA PENINSULA 168.2 205.0 191.1X NORTHERN MINDANAO 183.4 197.4 186.4XI DAVAO REGION 211.8 243.5 225.4XII SOCCSKSARGEN 197.6 218.8 220.5XIII CARAGA 167.6 178.0 175.6
ARMM MUSLIM MINDANAO 183.5 195.2 204.8Source: National Statistical Coordination Board
REGION / YEAR
Note: Regional levels may not add up to the national totals due to rounding.
Page 8

As of July 2013
REGIONAL ACCOUNTS OF THE PHILIPPINESUnit : In Thousand PesosTable 2.1.1A. GROSS VALUE ADDED IN AGRI., HUNTING AND FORESTRY by Region2010 TO 2012AT CURRENT PRICES
2010 2011 2012
PHILIPPINES 928,588,230 1,052,167,132 1,056,964,211
NCR METRO MANILA 8,857,096 9,872,144 9,847,997CAR CORDILLERA 17,858,661 20,826,614 21,797,489
I ILOCOS 61,593,599 65,176,000 71,850,691II CAGAYAN VALLEY 55,985,652 68,159,849 78,332,130III CENTRAL LUZON 109,203,250 114,761,612 127,770,762
IVA CALABARZON 79,232,634 88,754,058 81,425,746IVB MIMAROPA 29,793,093 35,489,823 37,069,349
V BICOL 42,225,972 46,631,618 45,879,167VI WESTERN VISAYAS 79,292,415 94,083,045 94,245,203VII CENTRAL VISAYAS 40,793,071 45,903,553 45,924,594VIII EASTERN VISAYAS 41,774,697 47,883,334 42,823,760IX ZAMBOANGA PENINSULA 42,594,071 49,815,597 46,003,722X NORTHERN MINDANAO 91,510,189 105,983,146 101,898,398XI DAVAO REGION 86,585,134 100,945,973 92,805,167XII SOCCSKSARGEN 72,835,084 85,171,073 82,755,795XIII CARAGA 23,851,616 25,793,111 26,201,904
ARMM MUSLIM MINDANAO 44,601,996 46,916,581 50,332,336Source: National Statistical Coordination Board
REGIONAL ACCOUNTS OF THE PHILIPPINESUnit : In Thousand PesosTable 2.1.1B. GROSS VALUE ADDED IN AGRI., HUNTING AND FORESTRY by Region2010 TO 2012AT CONSTANT 2000 PRICES
2010 2011 2012
PHILIPPINES 526,238,306 549,306,160 568,904,787
NCR METRO MANILA 5,460,807 5,638,815 6,258,377 CAR CORDILLERA 12,847,386 12,891,616 13,082,846
I ILOCOS 38,565,406 39,012,293 40,878,103 II CAGAYAN VALLEY 35,066,767 40,086,871 43,851,520 III CENTRAL LUZON 71,726,112 70,861,409 79,063,946
IVA CALABARZON 48,867,760 50,718,517 51,756,013 IVB MIMAROPA 17,837,441 19,021,756 19,518,010
V BICOL 21,971,630 22,242,636 22,931,063 VI WESTERN VISAYAS 42,924,634 50,857,094 51,205,260 VII CENTRAL VISAYAS 22,526,726 23,952,983 23,864,102 VIII EASTERN VISAYAS 25,275,455 25,361,995 24,862,979 IX ZAMBOANGA PENINSULA 19,344,620 19,460,043 19,472,338 X NORTHERN MINDANAO 47,804,657 51,402,230 52,536,264 XI DAVAO REGION 40,265,297 40,677,774 40,701,709 XII SOCCSKSARGEN 39,233,803 41,116,131 42,448,227 XIII CARAGA 13,182,228 13,429,151 13,895,940
ARMM MUSLIM MINDANAO 23,337,577 22,574,847 22,578,089 Note: Estimates were based on 2002 Census of Agriculture and Fisheries and BAS dataSource: National Statistical Coordination Board
REGION / YEAR
REGION / YEAR
Note: Regional levels may not add up to the national totals due to rounding.Page 9

As of July 2013
REGIONAL ACCOUNTS OF THE PHILIPPINESUnit : In PercentTable 2.1.2A. GROSS VALUE ADDED IN AGRI., HUNTING AND FORESTRY by Region2010 TO 2012AT CURRENT PRICESPERCENT DISTRIBUTION
2010 2011 2012
PHILIPPINES 100.0 100.0 100.0
NCR METRO MANILA 1.0 0.9 0.9 CAR CORDILLERA 1.9 2.0 2.1
I ILOCOS 6.6 6.2 6.8 II CAGAYAN VALLEY 6.0 6.5 7.4 III CENTRAL LUZON 11.8 10.9 12.1
IVA CALABARZON 8.5 8.4 7.7 IVB MIMAROPA 3.2 3.4 3.5
V BICOL 4.5 4.4 4.3 VI WESTERN VISAYAS 8.5 8.9 8.9 VII CENTRAL VISAYAS 4.4 4.4 4.3 VIII EASTERN VISAYAS 4.5 4.6 4.1 IX ZAMBOANGA PENINSULA 4.6 4.7 4.4 X NORTHERN MINDANAO 9.9 10.1 9.6 XI DAVAO REGION 9.3 9.6 8.8 XII SOCCSKSARGEN 7.8 8.1 7.8 XIII CARAGA 2.6 2.5 2.5
ARMM MUSLIM MINDANAO 4.8 4.5 4.8 Source: National Statistical Coordination Board
REGIONAL ACCOUNTS OF THE PHILIPPINESUnit : In PercentTable 2.1.2B GROSS VALUE ADDED IN AGRI., HUNTING AND FORESTRY by Region2010 TO 2012AT CONSTANT 2000 PRICESPERCENT DISTRIBUTION
2010 2011 2012
PHILIPPINES 100.0 100.0 100.0
NCR METRO MANILA 1.0 1.0 1.1 CAR CORDILLERA 2.4 2.3 2.3
I ILOCOS 7.3 7.1 7.2 II CAGAYAN VALLEY 6.7 7.3 7.7 III CENTRAL LUZON 13.6 12.9 13.9
IVA CALABARZON 9.3 9.2 9.1 IVB MIMAROPA 3.4 3.5 3.4
V BICOL 4.2 4.0 4.0 VI WESTERN VISAYAS 8.2 9.3 9.0 VII CENTRAL VISAYAS 4.3 4.4 4.2 VIII EASTERN VISAYAS 4.8 4.6 4.4 IX ZAMBOANGA PENINSULA 3.7 3.5 3.4 X NORTHERN MINDANAO 9.1 9.4 9.2 XI DAVAO REGION 7.7 7.4 7.2 XII SOCCSKSARGEN 7.5 7.5 7.5 XIII CARAGA 2.5 2.4 2.4
ARMM MUSLIM MINDANAO 4.4 4.1 4.0 Source: National Statistical Coordination Board
REGION / YEAR
REGION / YEAR
Note: Regional levels may not add up to the national totals due to rounding.Page 10

As of July 2013
REGIONAL ACCOUNTS OF THE PHILIPPINESUnit : In PercentTable 2.1.3A GROSS VALUE ADDED IN A AGRI., HUNTING AND FORESTRY by Regio2010 TO 2012AT CURRENT PRICESGROWTH RATES
10-11 11-12
PHILIPPINES 13.3 0.5
NCR METRO MANILA 11.5 (0.2)CAR CORDILLERA 16.6 4.7
I ILOCOS 5.8 10.2II CAGAYAN VALLEY 21.7 14.9III CENTRAL LUZON 5.1 11.3
IVA CALABARZON 12.0 (8.3)IVB MIMAROPA 19.1 4.5
V BICOL 10.4 (1.6)VI WESTERN VISAYAS 18.7 0.2VII CENTRAL VISAYAS 12.5 0.0VIII EASTERN VISAYAS 14.6 (10.6)IX ZAMBOANGA PENINSULA 17.0 (7.7)X NORTHERN MINDANAO 15.8 (3.9)XI DAVAO REGION 16.6 (8.1)XII SOCCSKSARGEN 16.9 (2.8)XIII CARAGA 8.1 1.6
ARMM MUSLIM MINDANAO 5.2 7.3Source: National Statistical Coordination Board
REGIONAL ACCOUNTS OF THE PHILIPPINESUnit : In PercentTable 2.1.3B GROSS VALUE ADDED IN AGRI., HUNTING AND FORESTRY by Region2010 TO 2012AT CONSTANT 2000 PRICESGROWTH RATES
10-11 11-12
PHILIPPINES 4.4 3.6
NCR METRO MANILA 3.3 11.0CAR CORDILLERA 0.3 1.5
I ILOCOS 1.2 4.8II CAGAYAN VALLEY 14.3 9.4III CENTRAL LUZON (1.2) 11.6
IVA CALABARZON 3.8 2.0IVB MIMAROPA 6.6 2.6
V BICOL 1.2 3.1VI WESTERN VISAYAS 18.5 0.7VII CENTRAL VISAYAS 6.3 (0.4)VIII EASTERN VISAYAS 0.3 (2.0)IX ZAMBOANGA PENINSULA 0.6 0.1X NORTHERN MINDANAO 7.5 2.2XI DAVAO REGION 1.0 0.1XII SOCCSKSARGEN 4.8 3.2XIII CARAGA 1.9 3.5
ARMM MUSLIM MINDANAO (3.3) 0.0Note: Estimates were based on 2002 Census of Agriculture and Fisheries and BAS dataSource: National Statistical Coordination Board
REGION / YEAR
REGION / YEAR
Note: Regional levels may not add up to the national totals due to rounding.Page 11

As of July 2013
REGIONAL ACCOUNTS OF THE PHILIPPINES Base Year : 2000Table 2.1.4. GROSS VALUE ADDED IN AGRI., HUNTING AND FORESTRY by Region2010 TO 2012IMPLICIT PRICE INDEX
2010 2011 2012
PHILIPPINES 176.5 191.5 185.8
NCR METRO MANILA 162.2 175.1 157.4CAR CORDILLERA 139.0 161.6 166.6
I ILOCOS 159.7 167.1 175.8II CAGAYAN VALLEY 159.7 170.0 178.6III CENTRAL LUZON 152.3 162.0 161.6
IVA CALABARZON 162.1 175.0 157.3IVB MIMAROPA 167.0 186.6 189.9
V BICOL 192.2 209.6 200.1VI WESTERN VISAYAS 184.7 185.0 184.1VII CENTRAL VISAYAS 181.1 191.6 192.4VIII EASTERN VISAYAS 165.3 188.8 172.2IX ZAMBOANGA PENINSULA 220.2 256.0 236.3X NORTHERN MINDANAO 191.4 206.2 194.0XI DAVAO REGION 215.0 248.2 228.0XII SOCCSKSARGEN 185.6 207.1 195.0XIII CARAGA 180.9 192.1 188.6
ARMM MUSLIM MINDANAO 191.1 207.8 222.9Source: National Statistical Coordination Board
REGION / YEAR
Note: Regional levels may not add up to the national totals due to rounding.Page 12

As of July 2013
REGIONAL ACCOUNTS OF THE PHILIPPINESUnit : In Thousand PesosTable 2.2.1A. GROSS VALUE ADDED IN FISHING by Region2010 TO 2012AT CURRENT PRICES
2010 2011 2012
PHILIPPINES 180,129,810 182,845,377 193,652,203
NCR METRO MANILA 89,833 91,188 96,577CAR CORDILLERA 414,927 442,541 455,793
I ILOCOS 13,731,343 16,408,364 18,016,699II CAGAYAN VALLEY 2,191,388 2,498,657 2,612,465III CENTRAL LUZON 35,398,554 35,937,862 36,515,060
IVA CALABARZON 24,749,698 24,005,213 27,161,395IVB MIMAROPA 9,369,499 8,812,440 7,999,292
V BICOL 5,870,960 6,122,861 6,852,465VI WESTERN VISAYAS 13,632,443 15,485,460 14,479,334VII CENTRAL VISAYAS 4,590,719 4,133,210 4,238,952VIII EASTERN VISAYAS 6,774,042 7,444,656 6,920,577IX ZAMBOANGA PENINSULA 14,205,109 12,697,641 10,737,372X NORTHERN MINDANAO 8,376,914 8,571,427 8,980,544XI DAVAO REGION 4,555,575 4,446,307 5,168,580XII SOCCSKSARGEN 21,925,240 21,669,635 30,716,823XIII CARAGA 2,453,209 2,253,466 2,125,960
ARMM MUSLIM MINDANAO 11,800,358 11,824,450 10,574,313Source: National Statistical Coordination Board
REGIONAL ACCOUNTS OF THE PHILIPPINESUnit : In Thousand PesosTable 2.2.1B. GROSS VALUE ADDED IN FISHING by Region2010 TO 2012AT CONSTANT 2000 PRICES
2010 2011 2012
PHILIPPINES 136,426,964 130,528,946 130,031,971
NCR METRO MANILA 65,497 64,672 62,892 CAR CORDILLERA 195,180 201,505 207,851
I ILOCOS 8,536,029 9,488,698 9,415,400 II CAGAYAN VALLEY 2,804,010 2,933,858 2,746,741 III CENTRAL LUZON 19,070,855 18,784,782 18,768,371
IVA CALABARZON 18,044,909 17,024,871 17,687,760 IVB MIMAROPA 9,157,301 8,714,211 8,122,139
V BICOL 7,288,957 7,251,657 7,430,651 VI WESTERN VISAYAS 14,766,534 14,986,679 14,593,013 VII CENTRAL VISAYAS 5,392,333 5,001,947 4,917,281 VIII EASTERN VISAYAS 8,623,533 8,267,851 7,744,309 IX ZAMBOANGA PENINSULA 14,420,329 11,031,124 10,224,780 X NORTHERN MINDANAO 6,666,448 6,624,301 6,933,019 XI DAVAO REGION 2,770,673 2,599,198 2,767,896 XII SOCCSKSARGEN 8,714,695 7,710,531 9,003,281 XIII CARAGA 2,514,545 2,328,369 2,239,912
ARMM MUSLIM MINDANAO 7,395,137 7,514,690 7,166,676 Source: National Statistical Coordination Board
REGION / YEAR
REGION / YEAR
Note: Regional levels may not add up to the national totals due to rounding.
Page 13
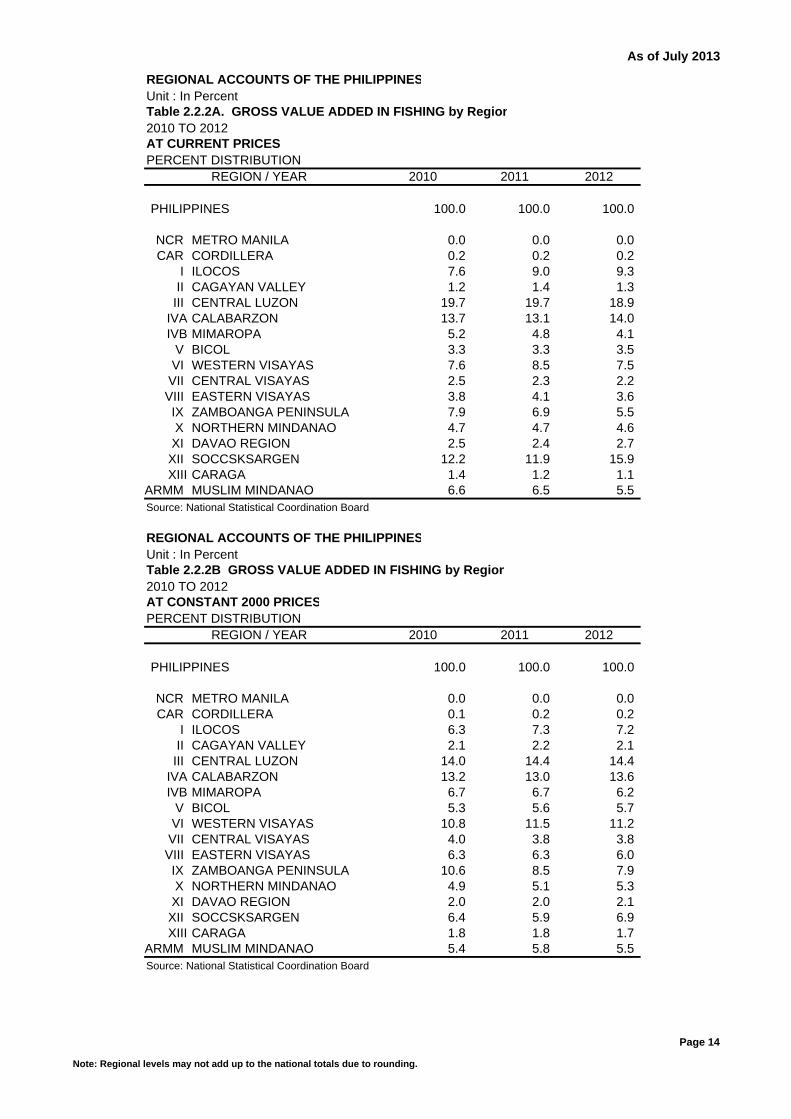
As of July 2013
REGIONAL ACCOUNTS OF THE PHILIPPINESUnit : In PercentTable 2.2.2A. GROSS VALUE ADDED IN FISHING by Region2010 TO 2012AT CURRENT PRICESPERCENT DISTRIBUTION
2010 2011 2012
PHILIPPINES 100.0 100.0 100.0
NCR METRO MANILA 0.0 0.0 0.0 CAR CORDILLERA 0.2 0.2 0.2
I ILOCOS 7.6 9.0 9.3 II CAGAYAN VALLEY 1.2 1.4 1.3 III CENTRAL LUZON 19.7 19.7 18.9
IVA CALABARZON 13.7 13.1 14.0 IVB MIMAROPA 5.2 4.8 4.1
V BICOL 3.3 3.3 3.5 VI WESTERN VISAYAS 7.6 8.5 7.5 VII CENTRAL VISAYAS 2.5 2.3 2.2 VIII EASTERN VISAYAS 3.8 4.1 3.6 IX ZAMBOANGA PENINSULA 7.9 6.9 5.5 X NORTHERN MINDANAO 4.7 4.7 4.6 XI DAVAO REGION 2.5 2.4 2.7 XII SOCCSKSARGEN 12.2 11.9 15.9 XIII CARAGA 1.4 1.2 1.1
ARMM MUSLIM MINDANAO 6.6 6.5 5.5 Source: National Statistical Coordination Board
REGIONAL ACCOUNTS OF THE PHILIPPINESUnit : In PercentTable 2.2.2B GROSS VALUE ADDED IN FISHING by Region2010 TO 2012AT CONSTANT 2000 PRICESPERCENT DISTRIBUTION
2010 2011 2012
PHILIPPINES 100.0 100.0 100.0
NCR METRO MANILA 0.0 0.0 0.0 CAR CORDILLERA 0.1 0.2 0.2
I ILOCOS 6.3 7.3 7.2 II CAGAYAN VALLEY 2.1 2.2 2.1 III CENTRAL LUZON 14.0 14.4 14.4
IVA CALABARZON 13.2 13.0 13.6 IVB MIMAROPA 6.7 6.7 6.2
V BICOL 5.3 5.6 5.7 VI WESTERN VISAYAS 10.8 11.5 11.2 VII CENTRAL VISAYAS 4.0 3.8 3.8 VIII EASTERN VISAYAS 6.3 6.3 6.0 IX ZAMBOANGA PENINSULA 10.6 8.5 7.9 X NORTHERN MINDANAO 4.9 5.1 5.3 XI DAVAO REGION 2.0 2.0 2.1 XII SOCCSKSARGEN 6.4 5.9 6.9 XIII CARAGA 1.8 1.8 1.7
ARMM MUSLIM MINDANAO 5.4 5.8 5.5 Source: National Statistical Coordination Board
REGION / YEAR
REGION / YEAR
Note: Regional levels may not add up to the national totals due to rounding.
Page 14
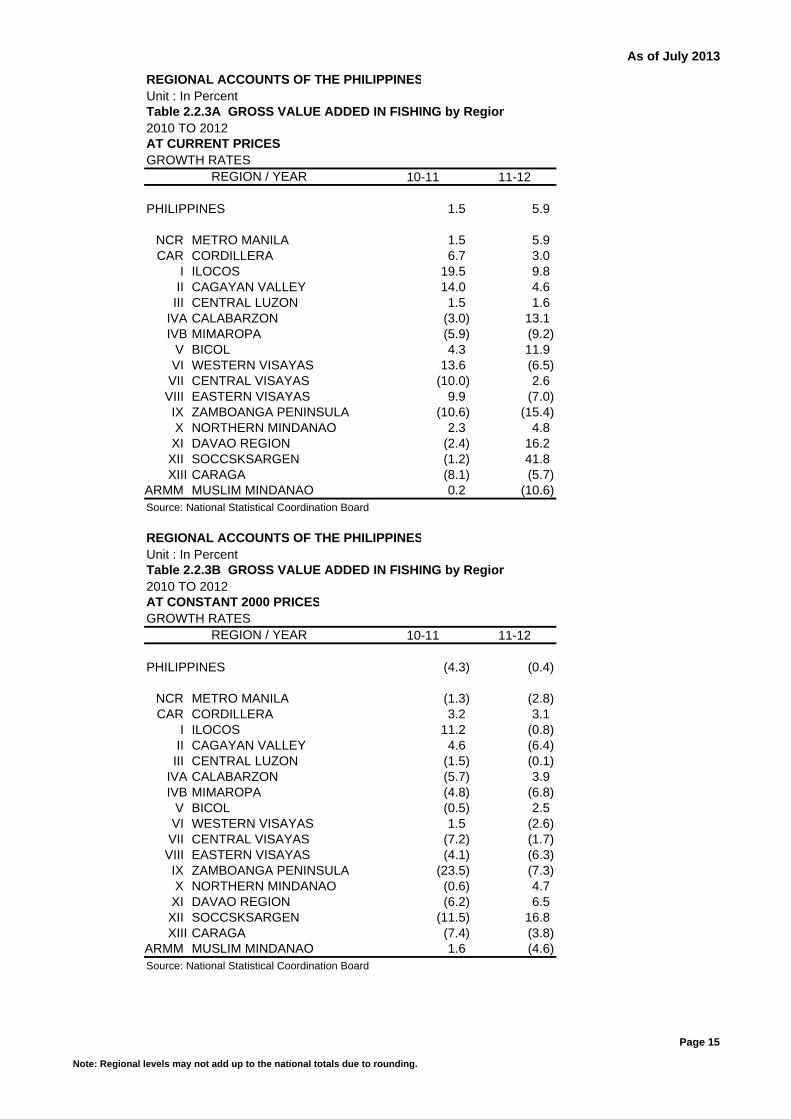
As of July 2013
REGIONAL ACCOUNTS OF THE PHILIPPINESUnit : In PercentTable 2.2.3A GROSS VALUE ADDED IN FISHING by Region2010 TO 2012AT CURRENT PRICESGROWTH RATES
10-11 11-12
PHILIPPINES 1.5 5.9
NCR METRO MANILA 1.5 5.9CAR CORDILLERA 6.7 3.0
I ILOCOS 19.5 9.8II CAGAYAN VALLEY 14.0 4.6III CENTRAL LUZON 1.5 1.6
IVA CALABARZON (3.0) 13.1IVB MIMAROPA (5.9) (9.2)
V BICOL 4.3 11.9VI WESTERN VISAYAS 13.6 (6.5)VII CENTRAL VISAYAS (10.0) 2.6VIII EASTERN VISAYAS 9.9 (7.0)IX ZAMBOANGA PENINSULA (10.6) (15.4)X NORTHERN MINDANAO 2.3 4.8XI DAVAO REGION (2.4) 16.2XII SOCCSKSARGEN (1.2) 41.8XIII CARAGA (8.1) (5.7)
ARMM MUSLIM MINDANAO 0.2 (10.6) Source: National Statistical Coordination Board
REGIONAL ACCOUNTS OF THE PHILIPPINESUnit : In PercentTable 2.2.3B GROSS VALUE ADDED IN FISHING by Region2010 TO 2012AT CONSTANT 2000 PRICESGROWTH RATES
10-11 11-12
PHILIPPINES (4.3) (0.4)
NCR METRO MANILA (1.3) (2.8)CAR CORDILLERA 3.2 3.1
I ILOCOS 11.2 (0.8)II CAGAYAN VALLEY 4.6 (6.4)III CENTRAL LUZON (1.5) (0.1)
IVA CALABARZON (5.7) 3.9IVB MIMAROPA (4.8) (6.8)
V BICOL (0.5) 2.5VI WESTERN VISAYAS 1.5 (2.6)VII CENTRAL VISAYAS (7.2) (1.7)VIII EASTERN VISAYAS (4.1) (6.3)IX ZAMBOANGA PENINSULA (23.5) (7.3)X NORTHERN MINDANAO (0.6) 4.7XI DAVAO REGION (6.2) 6.5XII SOCCSKSARGEN (11.5) 16.8XIII CARAGA (7.4) (3.8)
ARMM MUSLIM MINDANAO 1.6 (4.6) Source: National Statistical Coordination Board
REGION / YEAR
REGION / YEAR
Note: Regional levels may not add up to the national totals due to rounding.
Page 15
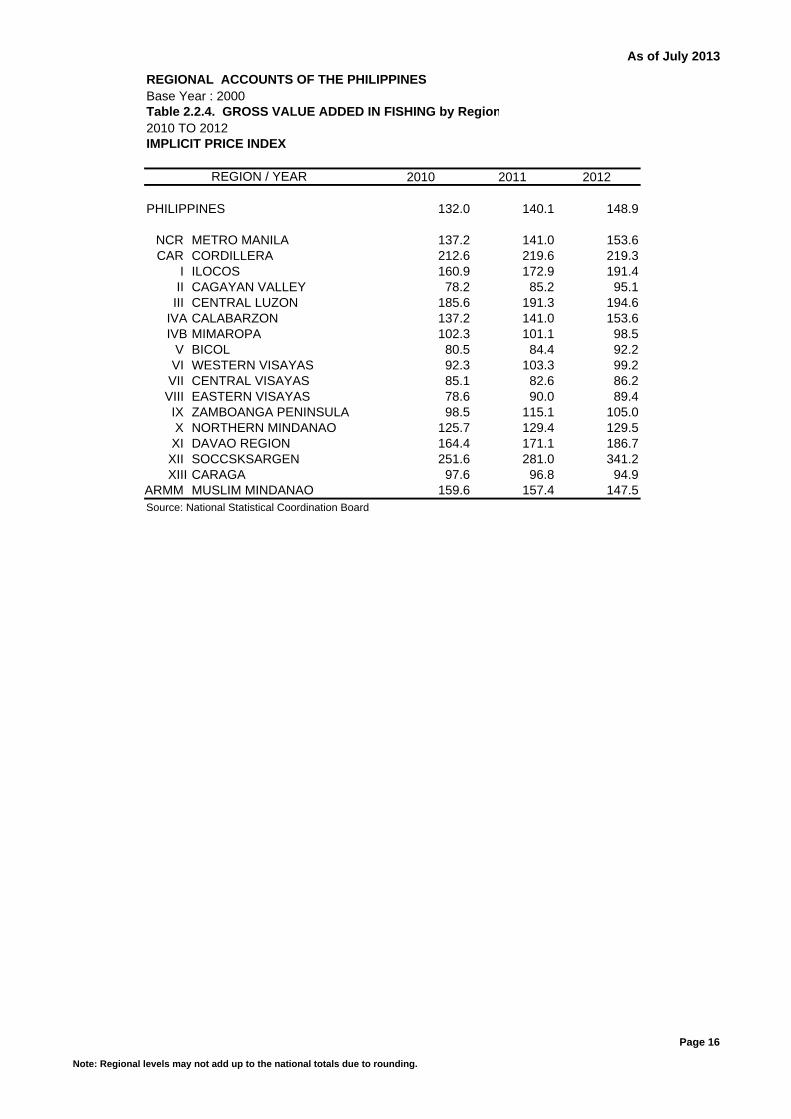
As of July 2013
REGIONAL ACCOUNTS OF THE PHILIPPINES Base Year : 2000Table 2.2.4. GROSS VALUE ADDED IN FISHING by Region2010 TO 2012IMPLICIT PRICE INDEX
2010 2011 2012
PHILIPPINES 132.0 140.1 148.9
NCR METRO MANILA 137.2 141.0 153.6CAR CORDILLERA 212.6 219.6 219.3
I ILOCOS 160.9 172.9 191.4II CAGAYAN VALLEY 78.2 85.2 95.1III CENTRAL LUZON 185.6 191.3 194.6
IVA CALABARZON 137.2 141.0 153.6IVB MIMAROPA 102.3 101.1 98.5
V BICOL 80.5 84.4 92.2VI WESTERN VISAYAS 92.3 103.3 99.2VII CENTRAL VISAYAS 85.1 82.6 86.2VIII EASTERN VISAYAS 78.6 90.0 89.4IX ZAMBOANGA PENINSULA 98.5 115.1 105.0X NORTHERN MINDANAO 125.7 129.4 129.5XI DAVAO REGION 164.4 171.1 186.7XII SOCCSKSARGEN 251.6 281.0 341.2XIII CARAGA 97.6 96.8 94.9
ARMM MUSLIM MINDANAO 159.6 157.4 147.5Source: National Statistical Coordination Board
REGION / YEAR
Note: Regional levels may not add up to the national totals due to rounding.
Page 16

As of July 2013
REGIONAL ACCOUNTS OF THE PHILIPPINESUnit : In Thousand PesosTable 3.1A. GROSS VALUE ADDED IN INDUSTRY by Region2010 TO 2012AT CURRENT PRICES 2,932,279 3,042,060 3,284,508
2010 2011 2012
PHILIPPINES 2,932,278,989 3,042,059,773 3,284,507,878
NCR METRO MANILA 597,578,702 585,769,667 649,017,597CAR CORDILLERA 112,098,467 115,351,860 108,662,518
I ILOCOS 78,396,831 78,232,231 84,202,556II CAGAYAN VALLEY 19,465,105 17,150,923 20,008,115III CENTRAL LUZON 319,691,249 372,777,105 398,155,916
IVA CALABARZON 983,217,202 1,009,599,221 1,086,145,388IVB MIMAROPA 61,926,666 65,944,987 65,250,128
V BICOL 41,148,823 42,222,459 49,623,328VI WESTERN VISAYAS 62,298,868 65,765,162 75,530,245VII CENTRAL VISAYAS 187,919,434 207,251,121 234,964,275VIII EASTERN VISAYAS 102,372,486 104,204,254 88,048,647IX ZAMBOANGA PENINSULA 51,550,311 51,729,852 66,746,805X NORTHERN MINDANAO 106,017,640 112,900,910 127,460,937XI DAVAO REGION 111,221,247 108,170,693 109,120,615XII SOCCSKSARGEN 68,000,778 72,812,833 82,208,254XIII CARAGA 25,951,042 28,134,892 34,977,617
ARMM MUSLIM MINDANAO 3,424,138 4,041,603 4,384,938Source: National Statistical Coordination Board
REGIONAL ACCOUNTS OF THE PHILIPPINESUnit : In Thousand PesosTable 3.1B. GROSS VALUE ADDED IN INDUSTRY by Region2010 TO 2012AT CONSTANT 2000 PRICES 1,859,515 1,893,256 2,022,623
2010 2011 2012
PHILIPPINES 1,859,515,225 1,893,256,054 2,022,623,205
NCR METRO MANILA 383,152,918 366,713,177 391,478,178 CAR CORDILLERA 63,447,349 63,626,668 61,325,424
I ILOCOS 48,717,542 47,156,712 48,870,782 II CAGAYAN VALLEY 12,857,869 11,087,956 12,509,453 III CENTRAL LUZON 205,185,504 233,021,730 245,523,241
IVA CALABARZON 628,755,840 629,125,013 672,757,543 IVB MIMAROPA 35,989,267 36,273,642 38,010,628
V BICOL 21,541,759 20,981,366 24,361,246 VI WESTERN VISAYAS 38,221,291 37,883,880 45,417,682 VII CENTRAL VISAYAS 120,000,002 131,210,410 145,507,370 VIII EASTERN VISAYAS 66,345,205 67,449,910 54,973,650 IX ZAMBOANGA PENINSULA 34,310,094 34,823,724 45,823,686 X NORTHERN MINDANAO 68,631,228 73,196,493 79,964,178 XI DAVAO REGION 64,049,280 64,516,224 70,278,434 XII SOCCSKSARGEN 46,569,979 51,224,574 56,768,670 XIII CARAGA 19,461,296 22,381,826 26,496,806
ARMM MUSLIM MINDANAO 2,278,802 2,582,747 2,556,233 Source: National Statistical Coordination Board
REGION / YEAR
REGION / YEAR
Note: Regional levels may not add up to the national totals due to rounding.
Page 17

As of July 2013
REGIONAL ACCOUNTS OF THE PHILIPPINESUnit : In PercentTable 3.2A. GROSS VALUE ADDED IN INDUSTRY by Region2010 TO 2012AT CURRENT PRICESPERCENT DISTRIBUTION
2010 2011 2012
PHILIPPINES 100.0 100.0 100.0
NCR METRO MANILA 20.4 19.3 19.8 CAR CORDILLERA 3.8 3.8 3.3
I ILOCOS 2.7 2.6 2.6 II CAGAYAN VALLEY 0.7 0.6 0.6 III CENTRAL LUZON 10.9 12.3 12.1
IVA CALABARZON 33.5 33.2 33.1 IVB MIMAROPA 2.1 2.2 2.0
V BICOL 1.4 1.4 1.5 VI WESTERN VISAYAS 2.1 2.2 2.3 VII CENTRAL VISAYAS 6.4 6.8 7.2 VIII EASTERN VISAYAS 3.5 3.4 2.7 IX ZAMBOANGA PENINSULA 1.8 1.7 2.0 X NORTHERN MINDANAO 3.6 3.7 3.9 XI DAVAO REGION 3.8 3.6 3.3 XII SOCCSKSARGEN 2.3 2.4 2.5 XIII CARAGA 0.9 0.9 1.1
ARMM MUSLIM MINDANAO 0.1 0.1 0.1 Source: National Statistical Coordination Board
REGIONAL ACCOUNTS OF THE PHILIPPINESUnit : In PercentTable 3.2B GROSS VALUE ADDED IN INDUSTRY by Region2010 TO 2012AT CONSTANT 2000 PRICESPERCENT DISTRIBUTION
2010 2011 2012
PHILIPPINES 100.0 100.0 100.0
NCR METRO MANILA 20.6 19.4 19.4 CAR CORDILLERA 3.4 3.4 3.0
I ILOCOS 2.6 2.5 2.4 II CAGAYAN VALLEY 0.7 0.6 0.6 III CENTRAL LUZON 11.0 12.3 12.1
IVA CALABARZON 33.8 33.2 33.3 IVB MIMAROPA 1.9 1.9 1.9
V BICOL 1.2 1.1 1.2 VI WESTERN VISAYAS 2.1 2.0 2.2 VII CENTRAL VISAYAS 6.5 6.9 7.2 VIII EASTERN VISAYAS 3.6 3.6 2.7 IX ZAMBOANGA PENINSULA 1.8 1.8 2.3 X NORTHERN MINDANAO 3.7 3.9 4.0 XI DAVAO REGION 3.4 3.4 3.5 XII SOCCSKSARGEN 2.5 2.7 2.8 XIII CARAGA 1.0 1.2 1.3
ARMM MUSLIM MINDANAO 0.1 0.1 0.1 Source: National Statistical Coordination Board
REGION / YEAR
REGION / YEAR
Note: Regional levels may not add up to the national totals due to rounding.
Page 18

As of July 2013
REGIONAL ACCOUNTS OF THE PHILIPPINESUnit : In PercentTable 3.3A GROSS VALUE ADDED IN INDUSTRY by Region2010 TO 2012AT CURRENT PRICESGROWTH RATES
10-11 11-12
PHILIPPINES 3.7 8.0
NCR METRO MANILA (2.0) 10.8CAR CORDILLERA 2.9 (5.8)
I ILOCOS (0.2) 7.6II CAGAYAN VALLEY (11.9) 16.7III CENTRAL LUZON 16.6 6.8
IVA CALABARZON 2.7 7.6IVB MIMAROPA 6.5 (1.1)
V BICOL 2.6 17.5VI WESTERN VISAYAS 5.6 14.8VII CENTRAL VISAYAS 10.3 13.4VIII EASTERN VISAYAS 1.8 (15.5)IX ZAMBOANGA PENINSULA 0.3 29.0X NORTHERN MINDANAO 6.5 12.9XI DAVAO REGION (2.7) 0.9XII SOCCSKSARGEN 7.1 12.9XIII CARAGA 8.4 24.3
ARMM MUSLIM MINDANAO 18.0 8.5Source: National Statistical Coordination Board
REGIONAL ACCOUNTS OF THE PHILIPPINESUnit : In PercentTable 3.3B GROSS VALUE ADDED IN INDUSTRY by Region2010 TO 2012AT CONSTANT 2000 PRICESGROWTH RATES
10-11 11-12
PHILIPPINES 1.8 6.8
NCR METRO MANILA (4.3) 6.8CAR CORDILLERA 0.3 (3.6)
I ILOCOS (3.2) 3.6II CAGAYAN VALLEY (13.8) 12.8III CENTRAL LUZON 13.6 5.4
IVA CALABARZON 0.1 6.9IVB MIMAROPA 0.8 4.8
V BICOL (2.6) 16.1VI WESTERN VISAYAS (0.9) 19.9VII CENTRAL VISAYAS 9.3 10.9VIII EASTERN VISAYAS 1.7 (18.5)IX ZAMBOANGA PENINSULA 1.5 31.6X NORTHERN MINDANAO 6.7 9.2XI DAVAO REGION 0.7 8.9XII SOCCSKSARGEN 10.0 10.8XIII CARAGA 15.0 18.4
ARMM MUSLIM MINDANAO 13.3 (1.0)Source: National Statistical Coordination Board
REGION / YEAR
REGION / YEAR
Note: Regional levels may not add up to the national totals due to rounding.
Page 19
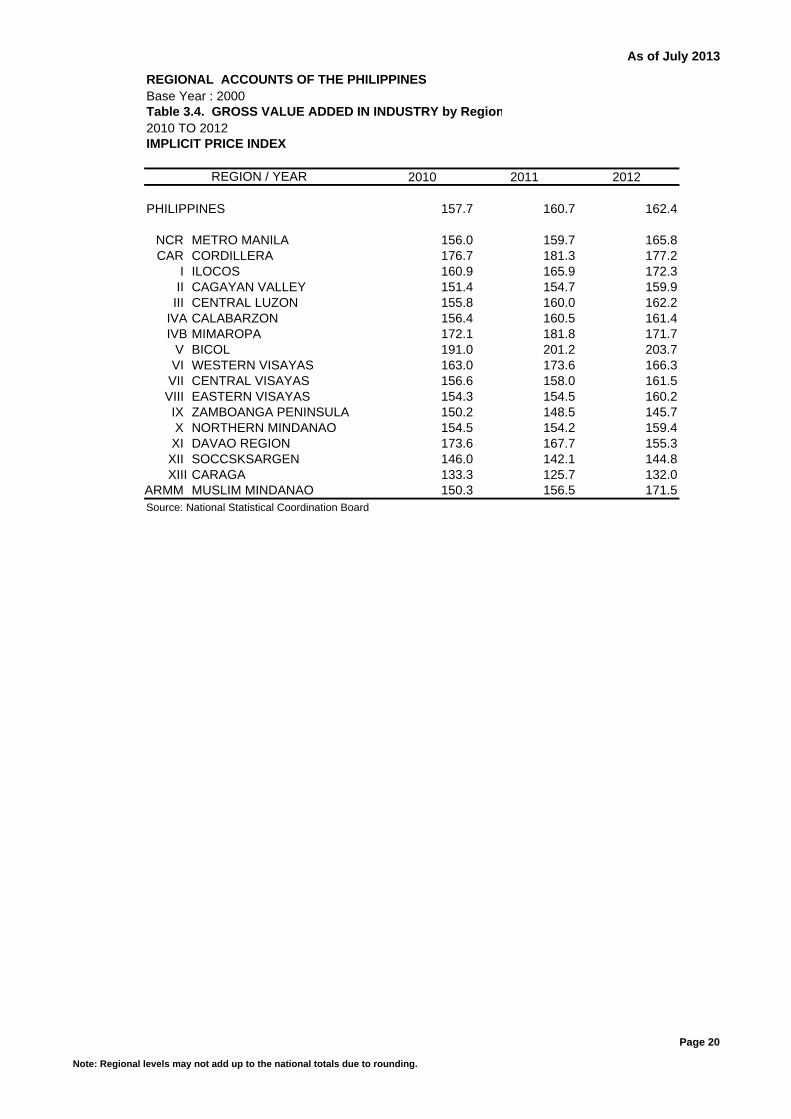
As of July 2013
REGIONAL ACCOUNTS OF THE PHILIPPINES Base Year : 2000Table 3.4. GROSS VALUE ADDED IN INDUSTRY by Region2010 TO 2012IMPLICIT PRICE INDEX
2010 2011 2012
PHILIPPINES 157.7 160.7 162.4
NCR METRO MANILA 156.0 159.7 165.8CAR CORDILLERA 176.7 181.3 177.2
I ILOCOS 160.9 165.9 172.3II CAGAYAN VALLEY 151.4 154.7 159.9III CENTRAL LUZON 155.8 160.0 162.2
IVA CALABARZON 156.4 160.5 161.4IVB MIMAROPA 172.1 181.8 171.7
V BICOL 191.0 201.2 203.7VI WESTERN VISAYAS 163.0 173.6 166.3VII CENTRAL VISAYAS 156.6 158.0 161.5VIII EASTERN VISAYAS 154.3 154.5 160.2IX ZAMBOANGA PENINSULA 150.2 148.5 145.7X NORTHERN MINDANAO 154.5 154.2 159.4XI DAVAO REGION 173.6 167.7 155.3XII SOCCSKSARGEN 146.0 142.1 144.8XIII CARAGA 133.3 125.7 132.0
ARMM MUSLIM MINDANAO 150.3 156.5 171.5Source: National Statistical Coordination Board
REGION / YEAR
Note: Regional levels may not add up to the national totals due to rounding.
Page 20

As of July 2013
REGIONAL ACCOUNTS OF THE PHILIPPINESUnit : In Thousand PesosTable 3.1.1A. GROSS VALUE ADDED IN MINING AND QUARRYING by Region2010 TO 2012AT CURRENT PRICES 128,727 143,027 121,435
2010 2011 2012
PHILIPPINES 128,727,400 143,026,956 121,435,141
NCR METRO MANILA 0 0 0CAR CORDILLERA 16,499,659 17,261,304 7,344,505
I ILOCOS 3,051,061 3,453,053 4,220,393II CAGAYAN VALLEY 1,531,014 1,746,519 2,135,346
III CENTRAL LUZON 1,725,206 2,927,017 4,242,376IVA CALABARZON 1,739,324 1,916,330 2,161,857IVB MIMAROPA 41,291,552 48,009,361 45,150,539
V BICOL 10,739,438 11,973,693 13,042,395VI WESTERN VISAYAS 8,833,371 13,045,021 9,747,771
VII CENTRAL VISAYAS 4,720,949 6,208,438 6,225,198VIII EASTERN VISAYAS 115,617 488,938 532,671
IX ZAMBOANGA PENINSULA 3,483,987 3,919,656 2,819,695X NORTHERN MINDANAO 750,410 840,263 979,655
XI DAVAO REGION 21,698,828 16,491,704 3,886,523XII SOCCSKSARGEN 345,320 414,354 481,200XIII CARAGA 12,101,672 14,223,002 18,343,076
ARMM MUSLIM MINDANAO 99,993 108,303 121,941Source: National Statistical Coordination Board
REGIONAL ACCOUNTS OF THE PHILIPPINESUnit : In Thousand PesosTable 3.1.1B. GROSS VALUE ADDED IN MINING AND QUARRYING by Region2010 TO 2012AT CONSTANT 2000 PRICES 65,898 70,509 72,047
2010 2011 2012
PHILIPPINES 65,898,068 70,509,209 72,047,154
NCR METRO MANILA - - - CAR CORDILLERA 4,242,622 3,849,807 1,740,283
I ILOCOS 2,765,065 2,913,468 3,343,237 II CAGAYAN VALLEY 1,618,000 1,722,221 1,995,138
III CENTRAL LUZON 1,623,419 2,154,988 3,053,134 IVA CALABARZON 1,780,027 1,838,350 1,875,682 IVB MIMAROPA 23,508,566 25,596,991 26,236,928
V BICOL 2,997,974 2,878,724 3,219,368 VI WESTERN VISAYAS 4,715,121 5,240,071 5,461,717
VII CENTRAL VISAYAS 2,913,096 3,290,753 3,503,423 VIII EASTERN VISAYAS 122,453 265,077 334,128
IX ZAMBOANGA PENINSULA 1,461,156 1,250,827 1,258,175 X NORTHERN MINDANAO 760,899 793,149 868,691
XI DAVAO REGION 5,925,568 4,150,484 1,666,615 XII SOCCSKSARGEN 371,147 395,628 443,670 XIII CARAGA 10,986,626 14,060,794 16,936,652
ARMM MUSLIM MINDANAO 106,331 107,878 110,313 Source: National Statistical Coordination Board
REGION / YEAR
REGION / YEAR
Note: Regional levels may not add up to the national totals due to rounding.
Page 21
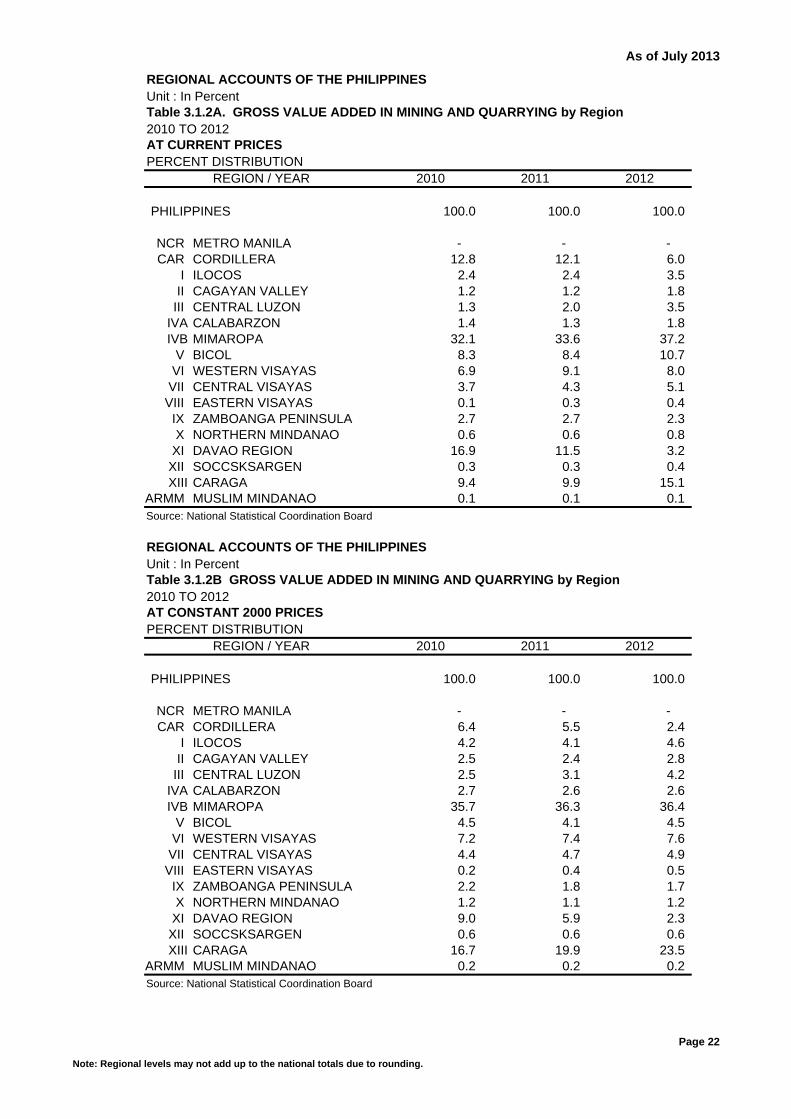
As of July 2013
REGIONAL ACCOUNTS OF THE PHILIPPINESUnit : In PercentTable 3.1.2A. GROSS VALUE ADDED IN MINING AND QUARRYING by Region2010 TO 2012AT CURRENT PRICESPERCENT DISTRIBUTION
2010 2011 2012
PHILIPPINES 100.0 100.0 100.0
NCR METRO MANILA - - - CAR CORDILLERA 12.8 12.1 6.0
I ILOCOS 2.4 2.4 3.5 II CAGAYAN VALLEY 1.2 1.2 1.8
III CENTRAL LUZON 1.3 2.0 3.5 IVA CALABARZON 1.4 1.3 1.8 IVB MIMAROPA 32.1 33.6 37.2
V BICOL 8.3 8.4 10.7 VI WESTERN VISAYAS 6.9 9.1 8.0
VII CENTRAL VISAYAS 3.7 4.3 5.1 VIII EASTERN VISAYAS 0.1 0.3 0.4
IX ZAMBOANGA PENINSULA 2.7 2.7 2.3 X NORTHERN MINDANAO 0.6 0.6 0.8
XI DAVAO REGION 16.9 11.5 3.2 XII SOCCSKSARGEN 0.3 0.3 0.4 XIII CARAGA 9.4 9.9 15.1
ARMM MUSLIM MINDANAO 0.1 0.1 0.1 Source: National Statistical Coordination Board
REGIONAL ACCOUNTS OF THE PHILIPPINESUnit : In PercentTable 3.1.2B GROSS VALUE ADDED IN MINING AND QUARRYING by Region2010 TO 2012AT CONSTANT 2000 PRICESPERCENT DISTRIBUTION
2010 2011 2012
PHILIPPINES 100.0 100.0 100.0
NCR METRO MANILA - - - CAR CORDILLERA 6.4 5.5 2.4
I ILOCOS 4.2 4.1 4.6 II CAGAYAN VALLEY 2.5 2.4 2.8
III CENTRAL LUZON 2.5 3.1 4.2 IVA CALABARZON 2.7 2.6 2.6 IVB MIMAROPA 35.7 36.3 36.4
V BICOL 4.5 4.1 4.5 VI WESTERN VISAYAS 7.2 7.4 7.6
VII CENTRAL VISAYAS 4.4 4.7 4.9 VIII EASTERN VISAYAS 0.2 0.4 0.5
IX ZAMBOANGA PENINSULA 2.2 1.8 1.7 X NORTHERN MINDANAO 1.2 1.1 1.2
XI DAVAO REGION 9.0 5.9 2.3 XII SOCCSKSARGEN 0.6 0.6 0.6 XIII CARAGA 16.7 19.9 23.5
ARMM MUSLIM MINDANAO 0.2 0.2 0.2 Source: National Statistical Coordination Board
REGION / YEAR
REGION / YEAR
Note: Regional levels may not add up to the national totals due to rounding.
Page 22

As of July 2013
REGIONAL ACCOUNTS OF THE PHILIPPINESUnit : In PercentTable 3.1.3A GROSS VALUE ADDED IN MINING AND QUARRYING by Region2010 TO 2012AT CURRENT PRICESGROWTH RATES
10-11 11-12
PHILIPPINES 11.1 (15.1)
NCR METRO MANILA - -CAR CORDILLERA 4.6 (57.5)
I ILOCOS 13.2 22.2 II CAGAYAN VALLEY 14.1 22.3
III CENTRAL LUZON 69.7 44.9 IVA CALABARZON 10.2 12.8 IVB MIMAROPA 16.3 (6.0)
V BICOL 11.5 8.9 VI WESTERN VISAYAS 47.7 (25.3)
VII CENTRAL VISAYAS 31.5 0.3 VIII EASTERN VISAYAS 322.9 8.9
IX ZAMBOANGA PENINSULA 12.5 (28.1) X NORTHERN MINDANAO 12.0 16.6
XI DAVAO REGION (24.0) (76.4) XII SOCCSKSARGEN 20.0 16.1 XIII CARAGA 17.5 29.0
ARMM MUSLIM MINDANAO 8.3 12.6 Source: National Statistical Coordination Board
REGIONAL ACCOUNTS OF THE PHILIPPINESUnit : In PercentTable 3.1.3B GROSS VALUE ADDED IN MINING AND QUARRYING by Region2010 TO 2012AT CONSTANT 2000 PRICESGROWTH RATES
10-11 11-12
PHILIPPINES 7.0 2.2
NCR METRO MANILA - -CAR CORDILLERA (9.3) (54.8)
I ILOCOS 5.4 14.8 II CAGAYAN VALLEY 6.4 15.8
III CENTRAL LUZON 32.7 41.7 IVA CALABARZON 3.3 2.0 IVB MIMAROPA 8.9 2.5
V BICOL (4.0) 11.8 VI WESTERN VISAYAS 11.1 4.2
VII CENTRAL VISAYAS 13.0 6.5 VIII EASTERN VISAYAS 116.5 26.0
IX ZAMBOANGA PENINSULA (14.4) 0.6 X NORTHERN MINDANAO 4.2 9.5
XI DAVAO REGION (30.0) (59.8) XII SOCCSKSARGEN 6.6 12.1 XIII CARAGA 28.0 20.5
ARMM MUSLIM MINDANAO 1.5 2.3 Source: National Statistical Coordination Board
REGION / YEAR
REGION / YEAR
Note: Regional levels may not add up to the national totals due to rounding.
Page 23

As of July 2013
REGIONAL ACCOUNTS OF THE PHILIPPINES Base Year : 2000Table 3.1.4. GROSS VALUE ADDED IN MINING AND QUARRYING by Region2010 TO 2012IMPLICIT PRICE INDEX
2010 2011 2012
PHILIPPINES 195.3 202.8 168.5
NCR METRO MANILA - - -CAR CORDILLERA 388.9 448.4 422.0
I ILOCOS 110.3 118.5 126.2II CAGAYAN VALLEY 94.6 101.4 107.0
III CENTRAL LUZON 106.3 135.8 139.0IVA CALABARZON 97.7 104.2 115.3IVB MIMAROPA 175.6 187.6 172.1
V BICOL 358.2 415.9 405.1VI WESTERN VISAYAS 187.3 248.9 178.5
VII CENTRAL VISAYAS 162.1 188.7 177.7VIII EASTERN VISAYAS 94.4 184.5 159.4
IX ZAMBOANGA PENINSULA 238.4 313.4 224.1X NORTHERN MINDANAO 98.6 105.9 112.8
XI DAVAO REGION 366.2 397.3 233.2XII SOCCSKSARGEN 93.0 104.7 108.5XIII CARAGA 110.1 101.2 108.3
ARMM MUSLIM MINDANAO 94.0 100.4 110.5Source: National Statistical Coordination Board
REGION / YEAR
Note: Regional levels may not add up to the national totals due to rounding.
Page 24

As of July 2013
REGIONAL ACCOUNTS OF THE PHILIPPINESUnit : In Thousand PesosTable 3.2.1A. GROSS VALUE ADDED IN MANUFACTURING by Region2010 TO 2012AT CURRENT PRICES 1,930,779 2,047,718 2,170,918
2010 2011 2012
PHILIPPINES 1,930,779,002 2,047,718,430 2,170,918,379
NCR METRO MANILA 335,896,868 346,169,501 380,934,781CAR CORDILLERA 78,156,260 82,073,067 82,728,426
I ILOCOS 14,224,390 14,445,477 15,220,776II CAGAYAN VALLEY 2,055,327 2,349,906 2,375,755III CENTRAL LUZON 248,467,722 296,291,304 307,550,373
IVA CALABARZON 844,200,346 868,939,958 918,498,671IVB MIMAROPA 5,688,297 6,713,400 7,709,141
V BICOL 4,787,636 6,018,559 6,313,468VI WESTERN VISAYAS 21,529,296 23,201,031 28,170,887VII CENTRAL VISAYAS 122,911,919 130,968,842 140,594,273VIII EASTERN VISAYAS 58,012,274 61,158,159 36,097,105IX ZAMBOANGA PENINSULA 36,044,574 36,656,573 49,666,497X NORTHERN MINDANAO 59,618,110 63,029,249 71,069,514XI DAVAO REGION 52,206,123 56,317,343 64,263,195XII SOCCSKSARGEN 43,002,299 49,148,268 55,242,357XIII CARAGA 3,134,763 3,385,028 3,598,600
ARMM MUSLIM MINDANAO 842,798 852,765 884,559Source: National Statistical Coordination Board
REGIONAL ACCOUNTS OF THE PHILIPPINESUnit : In Thousand PesosTable 3.2.1B. GROSS VALUE ADDED IN MANUFACTURING by Region2010 TO 2012AT CONSTANT 2000 PRICES 1,264,523 1,324,330 1,395,711
2010 2011 2012
PHILIPPINES 1,264,523,479 1,324,330,168 1,395,711,457
NCR METRO MANILA 222,483,872 226,148,902 242,201,162 CAR CORDILLERA 49,508,829 51,078,187 50,010,785
I ILOCOS 9,152,302 9,131,598 9,399,720 II CAGAYAN VALLEY 1,337,822 1,482,020 1,494,334 III CENTRAL LUZON 161,333,911 187,735,906 194,000,272
IVA CALABARZON 547,089,228 548,548,205 581,083,857 IVB MIMAROPA 3,723,047 4,321,901 4,954,154
V BICOL 3,036,391 3,775,980 3,965,482 VI WESTERN VISAYAS 14,546,572 15,730,629 19,102,197 VII CENTRAL VISAYAS 79,713,686 86,011,329 91,417,859 VIII EASTERN VISAYAS 38,184,287 40,834,124 24,341,876 IX ZAMBOANGA PENINSULA 25,193,058 26,690,025 36,082,800 X NORTHERN MINDANAO 40,626,188 44,014,975 48,778,302 XI DAVAO REGION 35,559,965 39,741,660 45,322,155 XII SOCCSKSARGEN 30,394,448 36,191,239 40,543,559 XIII CARAGA 2,118,052 2,350,051 2,453,057
ARMM MUSLIM MINDANAO 521,821 543,436 559,885 Source: National Statistical Coordination Board
REGION / YEAR
REGION / YEAR
Note: Regional levels may not add up to the national totals due to rounding.
Page 25
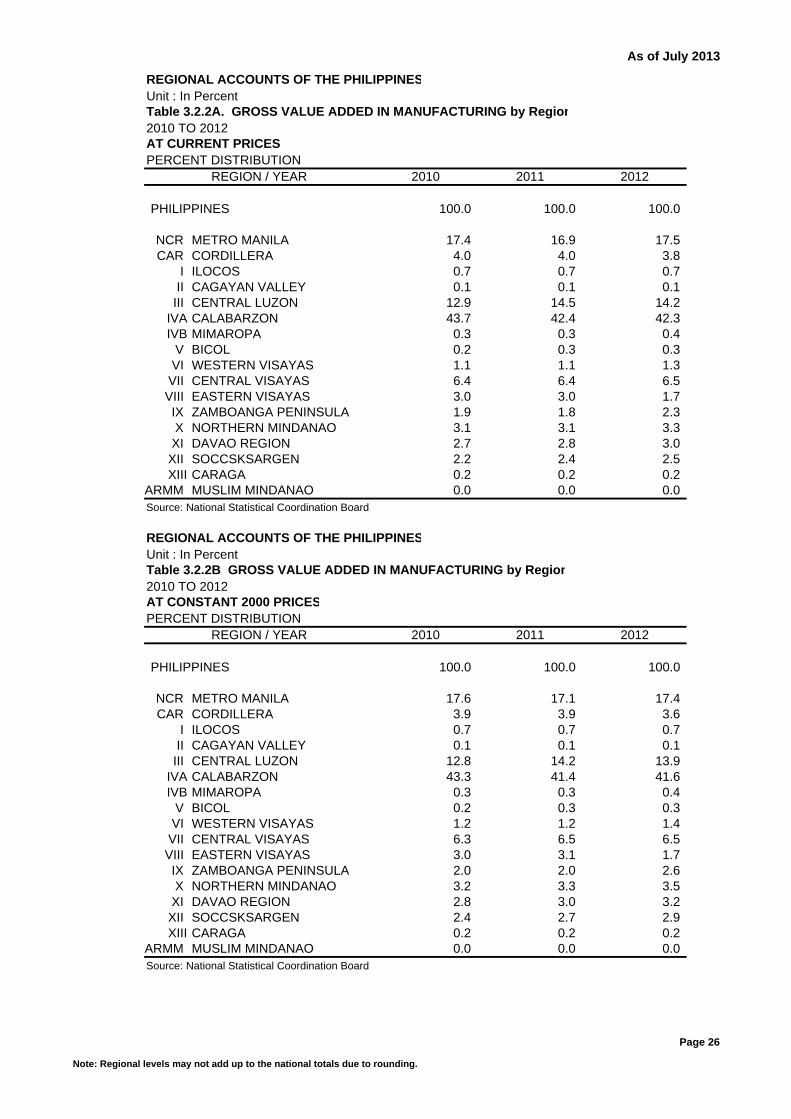
As of July 2013
REGIONAL ACCOUNTS OF THE PHILIPPINESUnit : In PercentTable 3.2.2A. GROSS VALUE ADDED IN MANUFACTURING by Region2010 TO 2012AT CURRENT PRICESPERCENT DISTRIBUTION
2010 2011 2012
PHILIPPINES 100.0 100.0 100.0
NCR METRO MANILA 17.4 16.9 17.5 CAR CORDILLERA 4.0 4.0 3.8
I ILOCOS 0.7 0.7 0.7 II CAGAYAN VALLEY 0.1 0.1 0.1 III CENTRAL LUZON 12.9 14.5 14.2
IVA CALABARZON 43.7 42.4 42.3 IVB MIMAROPA 0.3 0.3 0.4
V BICOL 0.2 0.3 0.3 VI WESTERN VISAYAS 1.1 1.1 1.3 VII CENTRAL VISAYAS 6.4 6.4 6.5 VIII EASTERN VISAYAS 3.0 3.0 1.7 IX ZAMBOANGA PENINSULA 1.9 1.8 2.3 X NORTHERN MINDANAO 3.1 3.1 3.3 XI DAVAO REGION 2.7 2.8 3.0 XII SOCCSKSARGEN 2.2 2.4 2.5 XIII CARAGA 0.2 0.2 0.2
ARMM MUSLIM MINDANAO 0.0 0.0 0.0 Source: National Statistical Coordination Board
REGIONAL ACCOUNTS OF THE PHILIPPINESUnit : In PercentTable 3.2.2B GROSS VALUE ADDED IN MANUFACTURING by Region2010 TO 2012AT CONSTANT 2000 PRICESPERCENT DISTRIBUTION
2010 2011 2012
PHILIPPINES 100.0 100.0 100.0
NCR METRO MANILA 17.6 17.1 17.4 CAR CORDILLERA 3.9 3.9 3.6
I ILOCOS 0.7 0.7 0.7 II CAGAYAN VALLEY 0.1 0.1 0.1 III CENTRAL LUZON 12.8 14.2 13.9
IVA CALABARZON 43.3 41.4 41.6 IVB MIMAROPA 0.3 0.3 0.4
V BICOL 0.2 0.3 0.3 VI WESTERN VISAYAS 1.2 1.2 1.4 VII CENTRAL VISAYAS 6.3 6.5 6.5 VIII EASTERN VISAYAS 3.0 3.1 1.7 IX ZAMBOANGA PENINSULA 2.0 2.0 2.6 X NORTHERN MINDANAO 3.2 3.3 3.5 XI DAVAO REGION 2.8 3.0 3.2 XII SOCCSKSARGEN 2.4 2.7 2.9 XIII CARAGA 0.2 0.2 0.2
ARMM MUSLIM MINDANAO 0.0 0.0 0.0 Source: National Statistical Coordination Board
REGION / YEAR
REGION / YEAR
Note: Regional levels may not add up to the national totals due to rounding.
Page 26

As of July 2013
REGIONAL ACCOUNTS OF THE PHILIPPINESUnit : In PercentTable 3.2.3A GROSS VALUE ADDED IN MANUFACTURING by Region2010 TO 2012AT CURRENT PRICESGROWTH RATES
10-11 11-12
PHILIPPINES 6.1 6.0
NCR METRO MANILA 3.1 10.0CAR CORDILLERA 5.0 0.8
I ILOCOS 1.6 5.4II CAGAYAN VALLEY 14.3 1.1III CENTRAL LUZON 19.2 3.8
IVA CALABARZON 2.9 5.7IVB MIMAROPA 18.0 14.8
V BICOL 25.7 4.9VI WESTERN VISAYAS 7.8 21.4VII CENTRAL VISAYAS 6.6 7.3VIII EASTERN VISAYAS 5.4 (41.0)IX ZAMBOANGA PENINSULA 1.7 35.5X NORTHERN MINDANAO 5.7 12.8XI DAVAO REGION 7.9 14.1XII SOCCSKSARGEN 14.3 12.4XIII CARAGA 8.0 6.3
ARMM MUSLIM MINDANAO 1.2 3.7Source: National Statistical Coordination Board
REGIONAL ACCOUNTS OF THE PHILIPPINESUnit : In PercentTable 3.2.3B GROSS VALUE ADDED IN MANUFACTURING by Region2010 TO 2012AT CONSTANT 2000 PRICESGROWTH RATES
10-11 11-12
PHILIPPINES 4.7 5.4
NCR METRO MANILA 1.6 7.1CAR CORDILLERA 3.2 (2.1)
I ILOCOS (0.2) 2.9II CAGAYAN VALLEY 10.8 0.8III CENTRAL LUZON 16.4 3.3
IVA CALABARZON 0.3 5.9IVB MIMAROPA 16.1 14.6
V BICOL 24.4 5.0VI WESTERN VISAYAS 8.1 21.4VII CENTRAL VISAYAS 7.9 6.3VIII EASTERN VISAYAS 6.9 (40.4)IX ZAMBOANGA PENINSULA 5.9 35.2X NORTHERN MINDANAO 8.3 10.8XI DAVAO REGION 11.8 14.0XII SOCCSKSARGEN 19.1 12.0XIII CARAGA 11.0 4.4
ARMM MUSLIM MINDANAO 4.1 3.0Source: National Statistical Coordination Board
REGION / YEAR
REGION / YEAR
Note: Regional levels may not add up to the national totals due to rounding.
Page 27
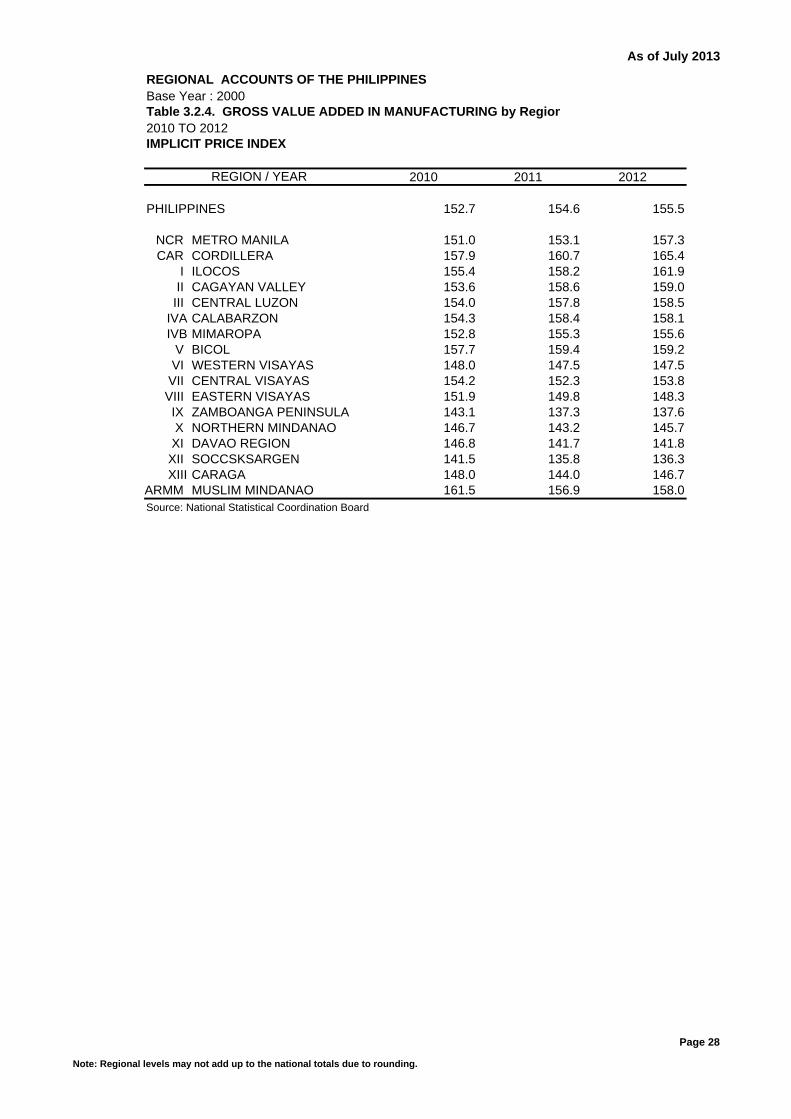
As of July 2013
REGIONAL ACCOUNTS OF THE PHILIPPINES Base Year : 2000Table 3.2.4. GROSS VALUE ADDED IN MANUFACTURING by Region2010 TO 2012IMPLICIT PRICE INDEX
2010 2011 2012
PHILIPPINES 152.7 154.6 155.5
NCR METRO MANILA 151.0 153.1 157.3CAR CORDILLERA 157.9 160.7 165.4
I ILOCOS 155.4 158.2 161.9II CAGAYAN VALLEY 153.6 158.6 159.0III CENTRAL LUZON 154.0 157.8 158.5
IVA CALABARZON 154.3 158.4 158.1IVB MIMAROPA 152.8 155.3 155.6
V BICOL 157.7 159.4 159.2VI WESTERN VISAYAS 148.0 147.5 147.5VII CENTRAL VISAYAS 154.2 152.3 153.8VIII EASTERN VISAYAS 151.9 149.8 148.3IX ZAMBOANGA PENINSULA 143.1 137.3 137.6X NORTHERN MINDANAO 146.7 143.2 145.7XI DAVAO REGION 146.8 141.7 141.8XII SOCCSKSARGEN 141.5 135.8 136.3XIII CARAGA 148.0 144.0 146.7
ARMM MUSLIM MINDANAO 161.5 156.9 158.0Source: National Statistical Coordination Board
REGION / YEAR
Note: Regional levels may not add up to the national totals due to rounding.
Page 28

As of July 2013
REGIONAL ACCOUNTS OF THE PHILIPPINESUnit : In Thousand PesosTable 3.3.1A. GROSS VALUE ADDED IN CONSTRUCTION by Region2010 TO 2012AT CURRENT PRICES 551,230 520,969 618,077
2010 2011 2012
PHILIPPINES 551,229,666 520,968,826 618,077,359
NCR METRO MANILA 155,439,107 129,771,750 142,875,936CAR CORDILLERA 14,208,768 12,683,986 14,646,048
I ILOCOS 24,493,551 22,639,874 23,199,024II CAGAYAN VALLEY 12,323,927 9,447,398 11,450,803III CENTRAL LUZON 51,296,980 54,992,125 65,090,007
IVA CALABARZON 72,996,292 73,656,903 93,255,643IVB MIMAROPA 14,174,040 10,442,361 11,501,650
V BICOL 18,017,659 16,317,304 20,966,102VI WESTERN VISAYAS 28,275,960 25,715,190 33,101,201VII CENTRAL VISAYAS 50,773,127 60,031,199 76,602,985VIII EASTERN VISAYAS 15,929,633 13,612,783 18,315,045IX ZAMBOANGA PENINSULA 10,143,952 9,238,275 12,130,656X NORTHERN MINDANAO 22,008,170 24,599,253 27,888,114XI DAVAO REGION 33,830,145 31,762,036 36,871,256XII SOCCSKSARGEN 17,576,188 16,083,706 18,053,713XIII CARAGA 9,146,296 8,904,057 11,139,317
ARMM MUSLIM MINDANAO 595,869 1,070,629 989,858Source: National Statistical Coordination Board
REGIONAL ACCOUNTS OF THE PHILIPPINESUnit : In Thousand PesosTable 3.3.1B. GROSS VALUE ADDED IN CONSTRUCTION by Region2010 TO 2012AT CONSTANT 2000 PRICES 325,820 293,870 339,921
2010 2011 2012
PHILIPPINES 325,819,808 293,869,821 339,920,594
NCR METRO MANILA 92,990,226 72,962,418 78,355,634 CAR CORDILLERA 7,588,930 6,525,209 7,251,093
I ILOCOS 14,476,198 12,745,760 12,898,878 II CAGAYAN VALLEY 7,568,205 5,539,796 6,564,192 III CENTRAL LUZON 29,874,541 30,837,311 35,454,260
IVA CALABARZON 42,082,824 40,741,522 50,325,256 IVB MIMAROPA 8,282,883 5,874,947 6,308,082
V BICOL 10,539,761 9,201,465 11,572,473 VI WESTERN VISAYAS 16,746,334 14,651,081 18,369,043 VII CENTRAL VISAYAS 30,631,265 34,854,009 42,978,513 VIII EASTERN VISAYAS 9,593,410 7,933,245 10,452,869 IX ZAMBOANGA PENINSULA 6,222,778 5,454,652 6,997,310 X NORTHERN MINDANAO 12,636,835 13,363,932 14,783,446 XI DAVAO REGION 20,266,920 18,328,747 20,845,248 XII SOCCSKSARGEN 10,720,658 9,431,216 10,314,291 XIII CARAGA 5,272,898 4,862,032 5,942,770
ARMM MUSLIM MINDANAO 325,146 562,478 507,235 Source: National Statistical Coordination Board
REGION / YEAR
REGION / YEAR
Note: Regional levels may not add up to the national totals due to rounding.
Page 29

As of July 2013
REGIONAL ACCOUNTS OF THE PHILIPPINESUnit : In PercentTable 3.3.2A. GROSS VALUE ADDED IN CONSTRUCTION by Region2010 TO 2012AT CURRENT PRICESPERCENT DISTRIBUTION
2010 2011 2012
PHILIPPINES 100.0 100.0 100.0
NCR METRO MANILA 28.2 24.9 23.1 CAR CORDILLERA 2.6 2.4 2.4
I ILOCOS 4.4 4.3 3.8 II CAGAYAN VALLEY 2.2 1.8 1.9 III CENTRAL LUZON 9.3 10.6 10.5
IVA CALABARZON 13.2 14.1 15.1 IVB MIMAROPA 2.6 2.0 1.9
V BICOL 3.3 3.1 3.4 VI WESTERN VISAYAS 5.1 4.9 5.4 VII CENTRAL VISAYAS 9.2 11.5 12.4 VIII EASTERN VISAYAS 2.9 2.6 3.0 IX ZAMBOANGA PENINSULA 1.8 1.8 2.0 X NORTHERN MINDANAO 4.0 4.7 4.5 XI DAVAO REGION 6.1 6.1 6.0 XII SOCCSKSARGEN 3.2 3.1 2.9 XIII CARAGA 1.7 1.7 1.8
ARMM MUSLIM MINDANAO 0.1 0.2 0.2 Source: National Statistical Coordination Board
REGIONAL ACCOUNTS OF THE PHILIPPINESUnit : In PercentTable 3.3.2B GROSS VALUE ADDED IN CONSTRUCTION by Region2010 TO 2012AT CONSTANT 2000 PRICESPERCENT DISTRIBUTION
2010 2011 2012
PHILIPPINES 100.0 100.0 100.0
NCR METRO MANILA 28.5 24.8 23.1 CAR CORDILLERA 2.3 2.2 2.1
I ILOCOS 4.4 4.3 3.8 II CAGAYAN VALLEY 2.3 1.9 1.9 III CENTRAL LUZON 9.2 10.5 10.4
IVA CALABARZON 12.9 13.9 14.8 IVB MIMAROPA 2.5 2.0 1.9
V BICOL 3.2 3.1 3.4 VI WESTERN VISAYAS 5.1 5.0 5.4 VII CENTRAL VISAYAS 9.4 11.9 12.6 VIII EASTERN VISAYAS 2.9 2.7 3.1 IX ZAMBOANGA PENINSULA 1.9 1.9 2.1 X NORTHERN MINDANAO 3.9 4.5 4.3 XI DAVAO REGION 6.2 6.2 6.1 XII SOCCSKSARGEN 3.3 3.2 3.0 XIII CARAGA 1.6 1.7 1.7
ARMM MUSLIM MINDANAO 0.1 0.2 0.1 Source: National Statistical Coordination Board
REGION / YEAR
REGION / YEAR
Note: Regional levels may not add up to the national totals due to rounding.
Page 30
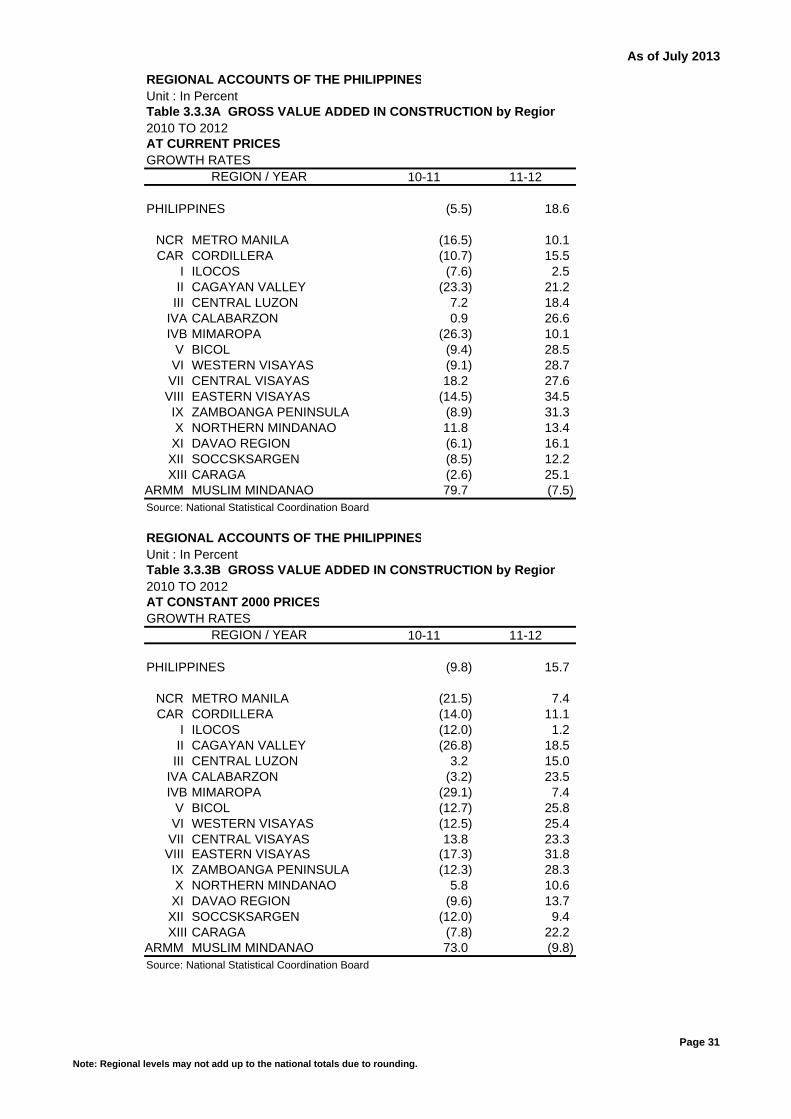
As of July 2013
REGIONAL ACCOUNTS OF THE PHILIPPINESUnit : In PercentTable 3.3.3A GROSS VALUE ADDED IN CONSTRUCTION by Region2010 TO 2012AT CURRENT PRICESGROWTH RATES
10-11 11-12
PHILIPPINES (5.5) 18.6
NCR METRO MANILA (16.5) 10.1CAR CORDILLERA (10.7) 15.5
I ILOCOS (7.6) 2.5II CAGAYAN VALLEY (23.3) 21.2III CENTRAL LUZON 7.2 18.4
IVA CALABARZON 0.9 26.6IVB MIMAROPA (26.3) 10.1
V BICOL (9.4) 28.5VI WESTERN VISAYAS (9.1) 28.7VII CENTRAL VISAYAS 18.2 27.6VIII EASTERN VISAYAS (14.5) 34.5IX ZAMBOANGA PENINSULA (8.9) 31.3X NORTHERN MINDANAO 11.8 13.4XI DAVAO REGION (6.1) 16.1XII SOCCSKSARGEN (8.5) 12.2XIII CARAGA (2.6) 25.1
ARMM MUSLIM MINDANAO 79.7 (7.5)Source: National Statistical Coordination Board
REGIONAL ACCOUNTS OF THE PHILIPPINESUnit : In PercentTable 3.3.3B GROSS VALUE ADDED IN CONSTRUCTION by Region2010 TO 2012AT CONSTANT 2000 PRICESGROWTH RATES
10-11 11-12
PHILIPPINES (9.8) 15.7
NCR METRO MANILA (21.5) 7.4CAR CORDILLERA (14.0) 11.1
I ILOCOS (12.0) 1.2II CAGAYAN VALLEY (26.8) 18.5III CENTRAL LUZON 3.2 15.0
IVA CALABARZON (3.2) 23.5IVB MIMAROPA (29.1) 7.4
V BICOL (12.7) 25.8VI WESTERN VISAYAS (12.5) 25.4VII CENTRAL VISAYAS 13.8 23.3VIII EASTERN VISAYAS (17.3) 31.8IX ZAMBOANGA PENINSULA (12.3) 28.3X NORTHERN MINDANAO 5.8 10.6XI DAVAO REGION (9.6) 13.7XII SOCCSKSARGEN (12.0) 9.4XIII CARAGA (7.8) 22.2
ARMM MUSLIM MINDANAO 73.0 (9.8)Source: National Statistical Coordination Board
REGION / YEAR
REGION / YEAR
Note: Regional levels may not add up to the national totals due to rounding.
Page 31
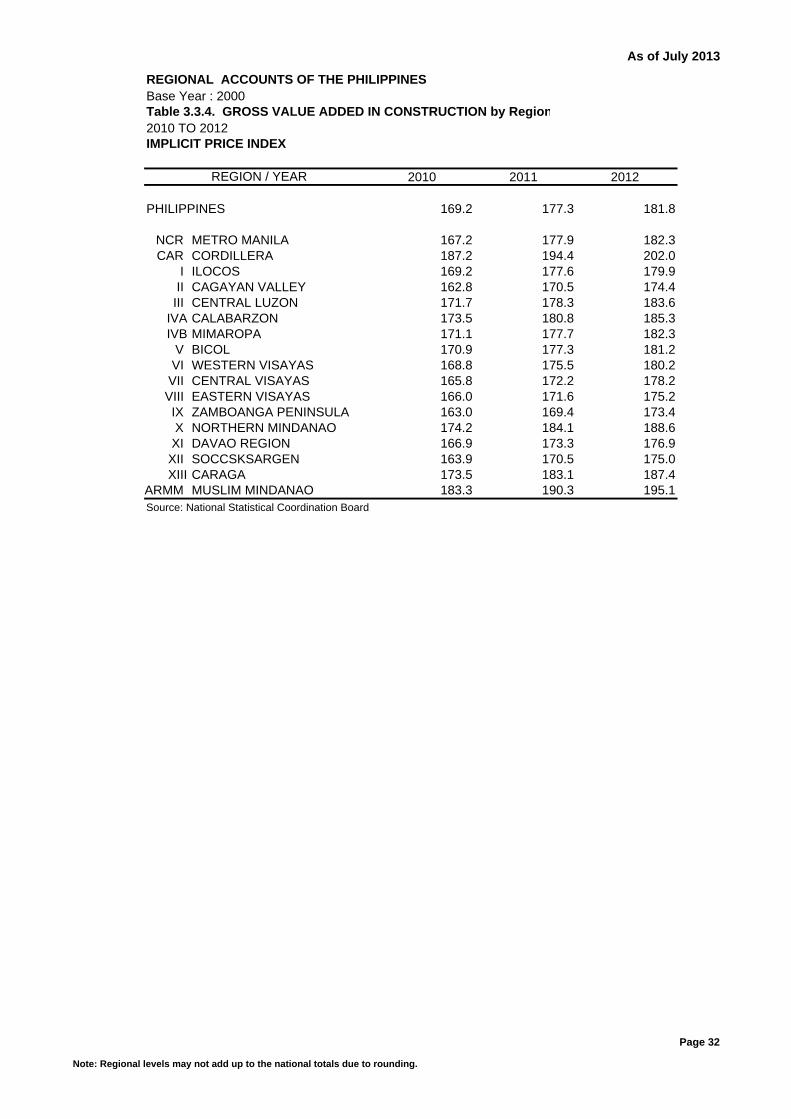
As of July 2013
REGIONAL ACCOUNTS OF THE PHILIPPINES Base Year : 2000Table 3.3.4. GROSS VALUE ADDED IN CONSTRUCTION by Region2010 TO 2012IMPLICIT PRICE INDEX
2010 2011 2012
PHILIPPINES 169.2 177.3 181.8
NCR METRO MANILA 167.2 177.9 182.3CAR CORDILLERA 187.2 194.4 202.0
I ILOCOS 169.2 177.6 179.9II CAGAYAN VALLEY 162.8 170.5 174.4III CENTRAL LUZON 171.7 178.3 183.6
IVA CALABARZON 173.5 180.8 185.3IVB MIMAROPA 171.1 177.7 182.3
V BICOL 170.9 177.3 181.2VI WESTERN VISAYAS 168.8 175.5 180.2VII CENTRAL VISAYAS 165.8 172.2 178.2VIII EASTERN VISAYAS 166.0 171.6 175.2IX ZAMBOANGA PENINSULA 163.0 169.4 173.4X NORTHERN MINDANAO 174.2 184.1 188.6XI DAVAO REGION 166.9 173.3 176.9XII SOCCSKSARGEN 163.9 170.5 175.0XIII CARAGA 173.5 183.1 187.4
ARMM MUSLIM MINDANAO 183.3 190.3 195.1Source: National Statistical Coordination Board
REGION / YEAR
Note: Regional levels may not add up to the national totals due to rounding.
Page 32
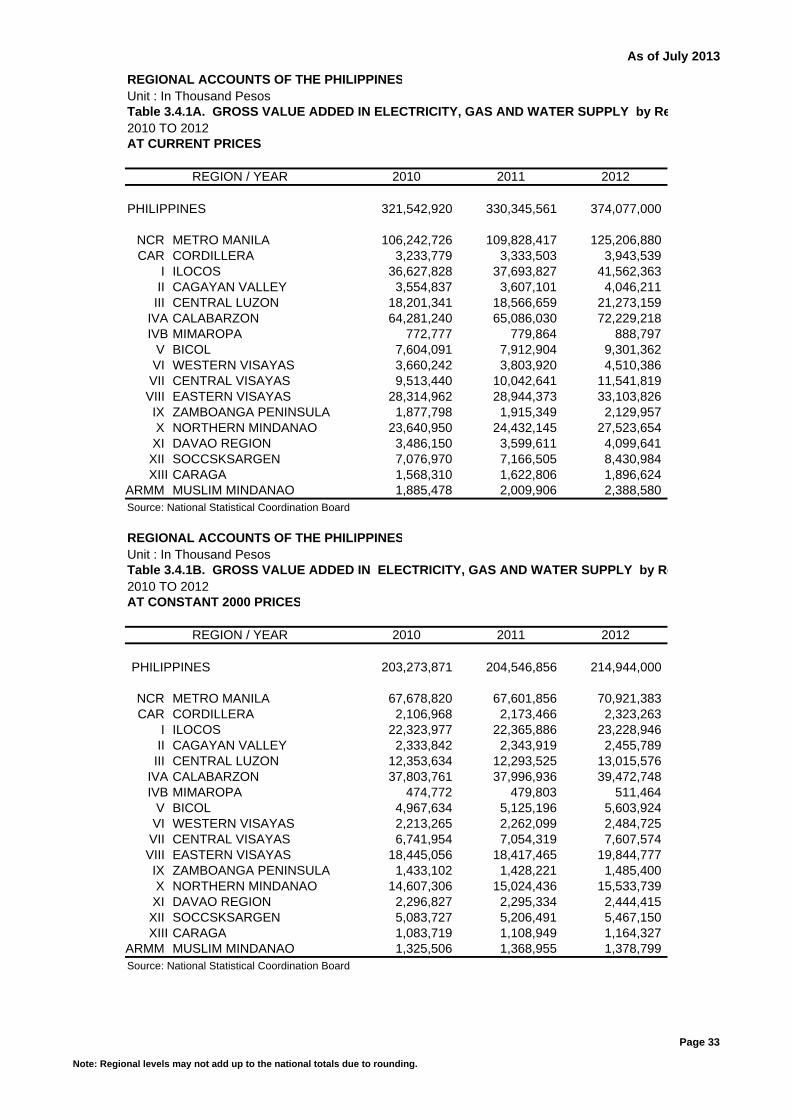
As of July 2013
REGIONAL ACCOUNTS OF THE PHILIPPINESUnit : In Thousand PesosTable 3.4.1A. GROSS VALUE ADDED IN ELECTRICITY, GAS AND WATER SUPPLY by Re2010 TO 2012AT CURRENT PRICES 321,543 330,346 374,077
2010 2011 2012
PHILIPPINES 321,542,920 330,345,561 374,077,000
NCR METRO MANILA 106,242,726 109,828,417 125,206,880CAR CORDILLERA 3,233,779 3,333,503 3,943,539
I ILOCOS 36,627,828 37,693,827 41,562,363II CAGAYAN VALLEY 3,554,837 3,607,101 4,046,211III CENTRAL LUZON 18,201,341 18,566,659 21,273,159
IVA CALABARZON 64,281,240 65,086,030 72,229,218IVB MIMAROPA 772,777 779,864 888,797
V BICOL 7,604,091 7,912,904 9,301,362VI WESTERN VISAYAS 3,660,242 3,803,920 4,510,386VII CENTRAL VISAYAS 9,513,440 10,042,641 11,541,819VIII EASTERN VISAYAS 28,314,962 28,944,373 33,103,826IX ZAMBOANGA PENINSULA 1,877,798 1,915,349 2,129,957X NORTHERN MINDANAO 23,640,950 24,432,145 27,523,654XI DAVAO REGION 3,486,150 3,599,611 4,099,641XII SOCCSKSARGEN 7,076,970 7,166,505 8,430,984XIII CARAGA 1,568,310 1,622,806 1,896,624
ARMM MUSLIM MINDANAO 1,885,478 2,009,906 2,388,580Source: National Statistical Coordination Board
REGIONAL ACCOUNTS OF THE PHILIPPINESUnit : In Thousand PesosTable 3.4.1B. GROSS VALUE ADDED IN ELECTRICITY, GAS AND WATER SUPPLY by Re2010 TO 2012AT CONSTANT 2000 PRICES 203,274 204,547 214,944
2010 2011 2012
PHILIPPINES 203,273,871 204,546,856 214,944,000
NCR METRO MANILA 67,678,820 67,601,856 70,921,383 CAR CORDILLERA 2,106,968 2,173,466 2,323,263
I ILOCOS 22,323,977 22,365,886 23,228,946 II CAGAYAN VALLEY 2,333,842 2,343,919 2,455,789 III CENTRAL LUZON 12,353,634 12,293,525 13,015,576
IVA CALABARZON 37,803,761 37,996,936 39,472,748 IVB MIMAROPA 474,772 479,803 511,464
V BICOL 4,967,634 5,125,196 5,603,924 VI WESTERN VISAYAS 2,213,265 2,262,099 2,484,725 VII CENTRAL VISAYAS 6,741,954 7,054,319 7,607,574 VIII EASTERN VISAYAS 18,445,056 18,417,465 19,844,777 IX ZAMBOANGA PENINSULA 1,433,102 1,428,221 1,485,400 X NORTHERN MINDANAO 14,607,306 15,024,436 15,533,739 XI DAVAO REGION 2,296,827 2,295,334 2,444,415 XII SOCCSKSARGEN 5,083,727 5,206,491 5,467,150 XIII CARAGA 1,083,719 1,108,949 1,164,327
ARMM MUSLIM MINDANAO 1,325,506 1,368,955 1,378,799 Source: National Statistical Coordination Board
REGION / YEAR
REGION / YEAR
Note: Regional levels may not add up to the national totals due to rounding.
Page 33
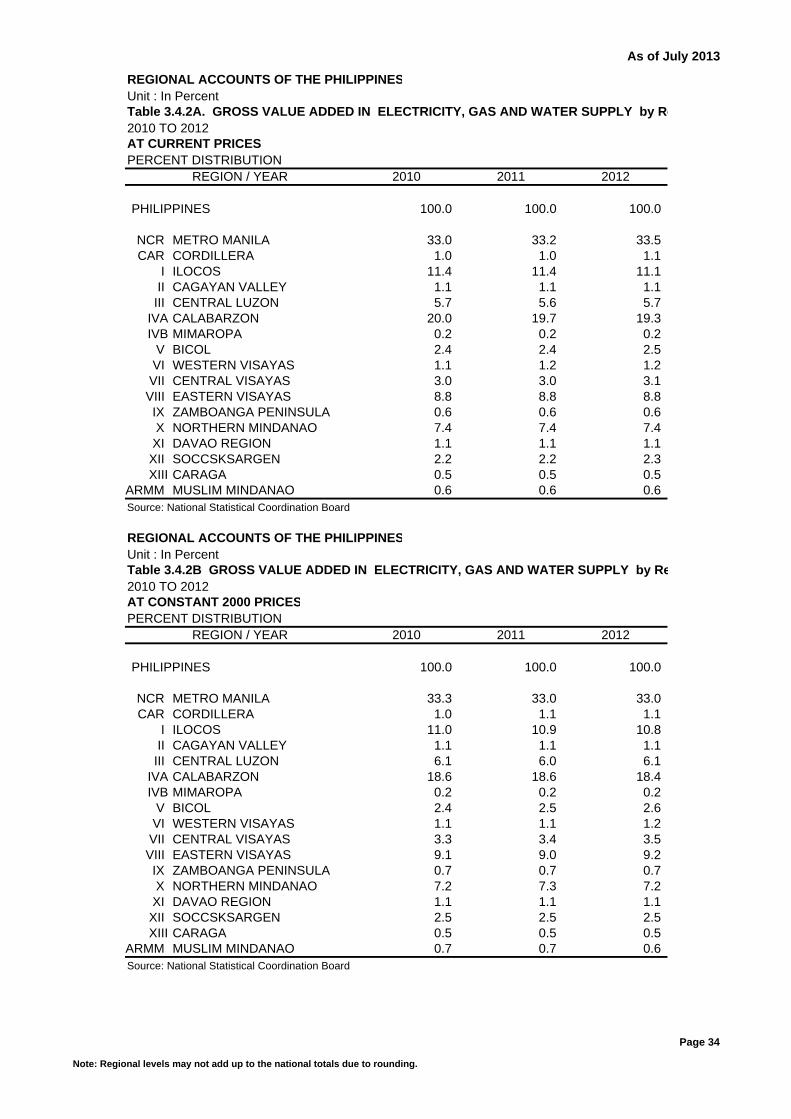
As of July 2013
REGIONAL ACCOUNTS OF THE PHILIPPINESUnit : In PercentTable 3.4.2A. GROSS VALUE ADDED IN ELECTRICITY, GAS AND WATER SUPPLY by Re2010 TO 2012AT CURRENT PRICESPERCENT DISTRIBUTION
2010 2011 2012
PHILIPPINES 100.0 100.0 100.0
NCR METRO MANILA 33.0 33.2 33.5 CAR CORDILLERA 1.0 1.0 1.1
I ILOCOS 11.4 11.4 11.1 II CAGAYAN VALLEY 1.1 1.1 1.1 III CENTRAL LUZON 5.7 5.6 5.7
IVA CALABARZON 20.0 19.7 19.3 IVB MIMAROPA 0.2 0.2 0.2
V BICOL 2.4 2.4 2.5 VI WESTERN VISAYAS 1.1 1.2 1.2 VII CENTRAL VISAYAS 3.0 3.0 3.1 VIII EASTERN VISAYAS 8.8 8.8 8.8 IX ZAMBOANGA PENINSULA 0.6 0.6 0.6 X NORTHERN MINDANAO 7.4 7.4 7.4 XI DAVAO REGION 1.1 1.1 1.1 XII SOCCSKSARGEN 2.2 2.2 2.3 XIII CARAGA 0.5 0.5 0.5
ARMM MUSLIM MINDANAO 0.6 0.6 0.6 Source: National Statistical Coordination Board
REGIONAL ACCOUNTS OF THE PHILIPPINESUnit : In PercentTable 3.4.2B GROSS VALUE ADDED IN ELECTRICITY, GAS AND WATER SUPPLY by Re2010 TO 2012AT CONSTANT 2000 PRICESPERCENT DISTRIBUTION
2010 2011 2012
PHILIPPINES 100.0 100.0 100.0
NCR METRO MANILA 33.3 33.0 33.0 CAR CORDILLERA 1.0 1.1 1.1
I ILOCOS 11.0 10.9 10.8 II CAGAYAN VALLEY 1.1 1.1 1.1 III CENTRAL LUZON 6.1 6.0 6.1
IVA CALABARZON 18.6 18.6 18.4 IVB MIMAROPA 0.2 0.2 0.2
V BICOL 2.4 2.5 2.6 VI WESTERN VISAYAS 1.1 1.1 1.2 VII CENTRAL VISAYAS 3.3 3.4 3.5 VIII EASTERN VISAYAS 9.1 9.0 9.2 IX ZAMBOANGA PENINSULA 0.7 0.7 0.7 X NORTHERN MINDANAO 7.2 7.3 7.2 XI DAVAO REGION 1.1 1.1 1.1 XII SOCCSKSARGEN 2.5 2.5 2.5 XIII CARAGA 0.5 0.5 0.5
ARMM MUSLIM MINDANAO 0.7 0.7 0.6 Source: National Statistical Coordination Board
REGION / YEAR
REGION / YEAR
Note: Regional levels may not add up to the national totals due to rounding.
Page 34

As of July 2013
REGIONAL ACCOUNTS OF THE PHILIPPINESUnit : In PercentTable 3.4.3A GROSS VALUE ADDED IN ELECTRICITY, GAS AND WATER SUPPLY by Re2010 TO 2012AT CURRENT PRICESGROWTH RATES
10-11 11-12
PHILIPPINES 2.7 13.2
NCR METRO MANILA 3.4 14.0CAR CORDILLERA 3.1 18.3
I ILOCOS 2.9 10.3II CAGAYAN VALLEY 1.5 12.2III CENTRAL LUZON 2.0 14.6
IVA CALABARZON 1.3 11.0IVB MIMAROPA 0.9 14.0
V BICOL 4.1 17.5VI WESTERN VISAYAS 3.9 18.6VII CENTRAL VISAYAS 5.6 14.9VIII EASTERN VISAYAS 2.2 14.4IX ZAMBOANGA PENINSULA 2.0 11.2X NORTHERN MINDANAO 3.3 12.7XI DAVAO REGION 3.3 13.9XII SOCCSKSARGEN 1.3 17.6XIII CARAGA 3.5 16.9
ARMM MUSLIM MINDANAO 6.6 18.8Source: National Statistical Coordination Board
REGIONAL ACCOUNTS OF THE PHILIPPINESUnit : In PercentTable 3.4.3B GROSS VALUE ADDED IN ELECTRICITY, GAS AND WATER SUPPLY by Re2010 TO 2012AT CONSTANT 2000 PRICESGROWTH RATES
10-11 11-12
PHILIPPINES 0.6 5.1
NCR METRO MANILA (0.1) 4.9CAR CORDILLERA 3.2 6.9
I ILOCOS 0.2 3.9II CAGAYAN VALLEY 0.4 4.8III CENTRAL LUZON (0.5) 5.9
IVA CALABARZON 0.5 3.9IVB MIMAROPA 1.1 6.6
V BICOL 3.2 9.3VI WESTERN VISAYAS 2.2 9.8VII CENTRAL VISAYAS 4.6 7.8VIII EASTERN VISAYAS (0.1) 7.7IX ZAMBOANGA PENINSULA (0.3) 4.0X NORTHERN MINDANAO 2.9 3.4XI DAVAO REGION (0.1) 6.5XII SOCCSKSARGEN 2.4 5.0XIII CARAGA 2.3 5.0
ARMM MUSLIM MINDANAO 3.3 0.7Source: National Statistical Coordination Board
REGION / YEAR
REGION / YEAR
Note: Regional levels may not add up to the national totals due to rounding.
Page 35

As of July 2013
REGIONAL ACCOUNTS OF THE PHILIPPINES Base Year : 2000Table 3.4.4. GROSS VALUE ADDED IN ELECTRICITY, GAS AND WATER SUPPLY by Reg2010 TO 2012IMPLICIT PRICE INDEX
2010 2011 2012
PHILIPPINES 158.2 161.5 174.0
NCR METRO MANILA 157.0 162.5 176.5CAR CORDILLERA 153.5 153.4 169.7
I ILOCOS 164.1 168.5 178.9II CAGAYAN VALLEY 152.3 153.9 164.8III CENTRAL LUZON 147.3 151.0 163.4
IVA CALABARZON 170.0 171.3 183.0IVB MIMAROPA 162.8 162.5 173.8
V BICOL 153.1 154.4 166.0VI WESTERN VISAYAS 165.4 168.2 181.5VII CENTRAL VISAYAS 141.1 142.4 151.7VIII EASTERN VISAYAS 153.5 157.2 166.8IX ZAMBOANGA PENINSULA 131.0 134.1 143.4X NORTHERN MINDANAO 161.8 162.6 177.2XI DAVAO REGION 151.8 156.8 167.7XII SOCCSKSARGEN 139.2 137.6 154.2XIII CARAGA 144.7 146.3 162.9
ARMM MUSLIM MINDANAO 142.2 146.8 173.2Source: National Statistical Coordination Board
REGION / YEAR
Note: Regional levels may not add up to the national totals due to rounding.
Page 36
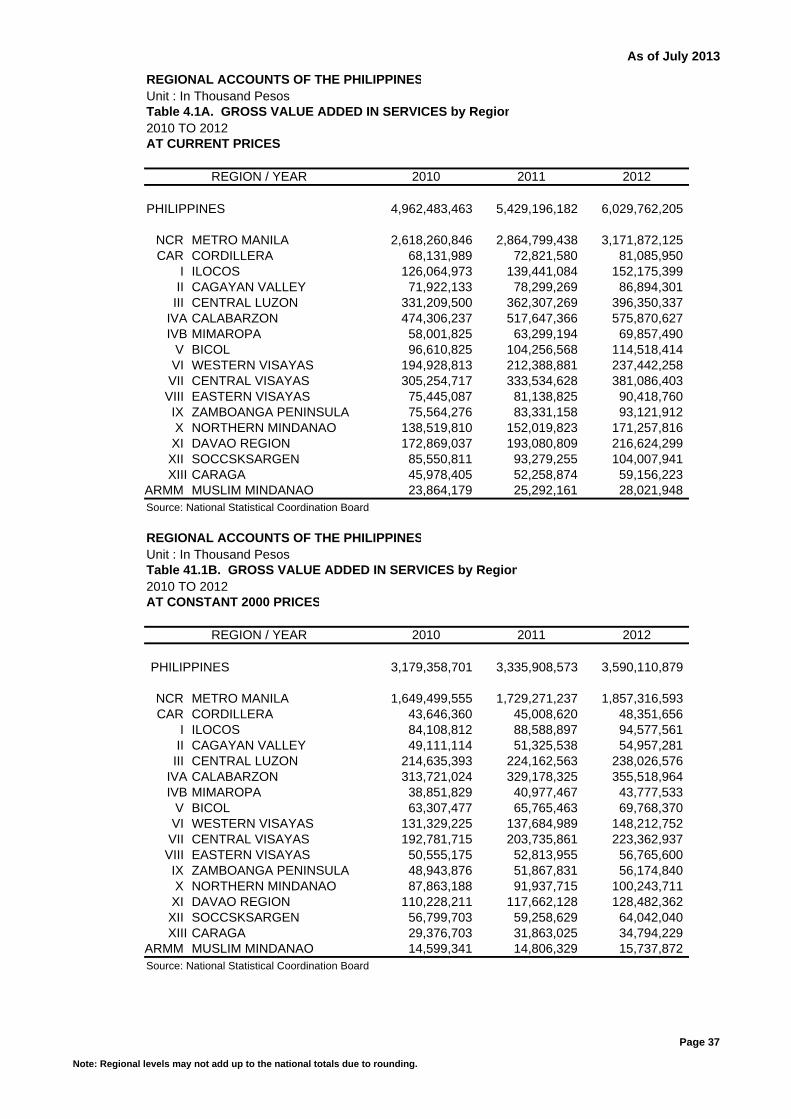
As of July 2013
REGIONAL ACCOUNTS OF THE PHILIPPINESUnit : In Thousand PesosTable 4.1A. GROSS VALUE ADDED IN SERVICES by Region2010 TO 2012AT CURRENT PRICES 4,962,483 5,429,196 6,029,762
2010 2011 2012
PHILIPPINES 4,962,483,463 5,429,196,182 6,029,762,205
NCR METRO MANILA 2,618,260,846 2,864,799,438 3,171,872,125CAR CORDILLERA 68,131,989 72,821,580 81,085,950
I ILOCOS 126,064,973 139,441,084 152,175,399II CAGAYAN VALLEY 71,922,133 78,299,269 86,894,301III CENTRAL LUZON 331,209,500 362,307,269 396,350,337
IVA CALABARZON 474,306,237 517,647,366 575,870,627IVB MIMAROPA 58,001,825 63,299,194 69,857,490
V BICOL 96,610,825 104,256,568 114,518,414VI WESTERN VISAYAS 194,928,813 212,388,881 237,442,258VII CENTRAL VISAYAS 305,254,717 333,534,628 381,086,403VIII EASTERN VISAYAS 75,445,087 81,138,825 90,418,760IX ZAMBOANGA PENINSULA 75,564,276 83,331,158 93,121,912X NORTHERN MINDANAO 138,519,810 152,019,823 171,257,816XI DAVAO REGION 172,869,037 193,080,809 216,624,299XII SOCCSKSARGEN 85,550,811 93,279,255 104,007,941XIII CARAGA 45,978,405 52,258,874 59,156,223
ARMM MUSLIM MINDANAO 23,864,179 25,292,161 28,021,948Source: National Statistical Coordination Board
REGIONAL ACCOUNTS OF THE PHILIPPINESUnit : In Thousand PesosTable 41.1B. GROSS VALUE ADDED IN SERVICES by Region2010 TO 2012AT CONSTANT 2000 PRICES 3,179,359 3,335,909 3,590,111
2010 2011 2012
PHILIPPINES 3,179,358,701 3,335,908,573 3,590,110,879
NCR METRO MANILA 1,649,499,555 1,729,271,237 1,857,316,593 CAR CORDILLERA 43,646,360 45,008,620 48,351,656
I ILOCOS 84,108,812 88,588,897 94,577,561 II CAGAYAN VALLEY 49,111,114 51,325,538 54,957,281 III CENTRAL LUZON 214,635,393 224,162,563 238,026,576
IVA CALABARZON 313,721,024 329,178,325 355,518,964 IVB MIMAROPA 38,851,829 40,977,467 43,777,533
V BICOL 63,307,477 65,765,463 69,768,370 VI WESTERN VISAYAS 131,329,225 137,684,989 148,212,752 VII CENTRAL VISAYAS 192,781,715 203,735,861 223,362,937 VIII EASTERN VISAYAS 50,555,175 52,813,955 56,765,600 IX ZAMBOANGA PENINSULA 48,943,876 51,867,831 56,174,840 X NORTHERN MINDANAO 87,863,188 91,937,715 100,243,711 XI DAVAO REGION 110,228,211 117,662,128 128,482,362 XII SOCCSKSARGEN 56,799,703 59,258,629 64,042,040 XIII CARAGA 29,376,703 31,863,025 34,794,229
ARMM MUSLIM MINDANAO 14,599,341 14,806,329 15,737,872 Source: National Statistical Coordination Board
REGION / YEAR
REGION / YEAR
Note: Regional levels may not add up to the national totals due to rounding.
Page 37
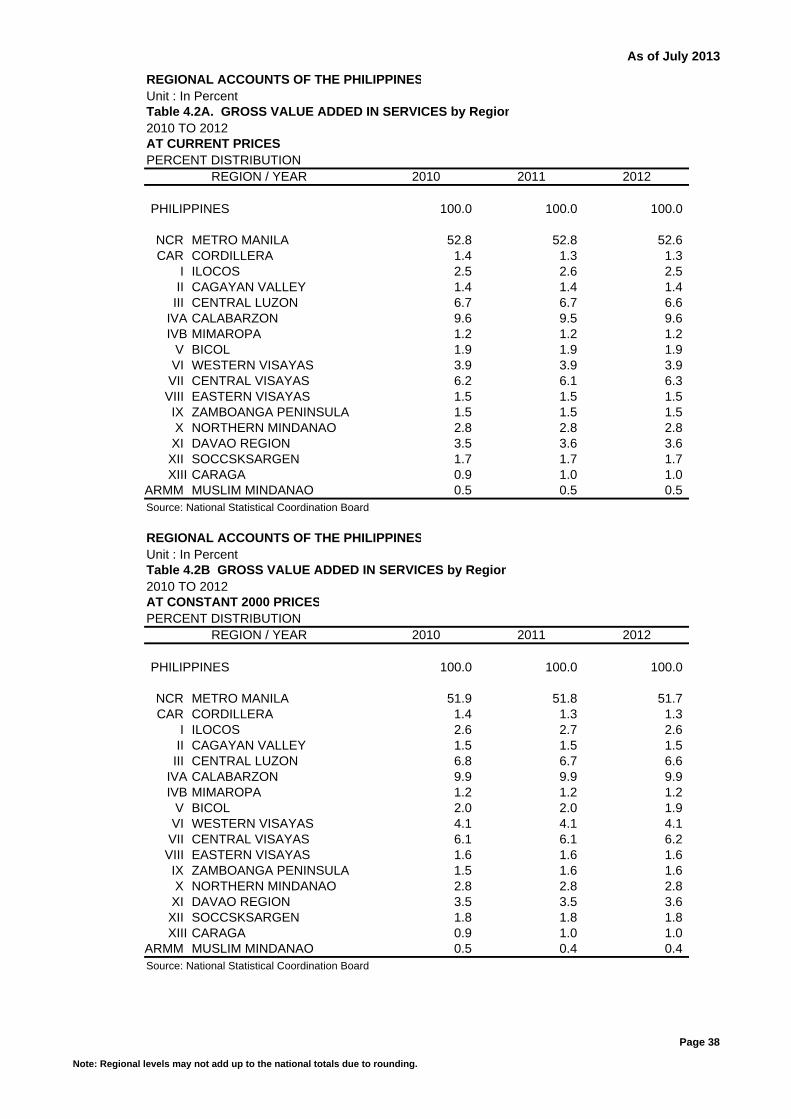
As of July 2013
REGIONAL ACCOUNTS OF THE PHILIPPINESUnit : In PercentTable 4.2A. GROSS VALUE ADDED IN SERVICES by Region2010 TO 2012AT CURRENT PRICESPERCENT DISTRIBUTION
2010 2011 2012
PHILIPPINES 100.0 100.0 100.0
NCR METRO MANILA 52.8 52.8 52.6 CAR CORDILLERA 1.4 1.3 1.3
I ILOCOS 2.5 2.6 2.5 II CAGAYAN VALLEY 1.4 1.4 1.4 III CENTRAL LUZON 6.7 6.7 6.6
IVA CALABARZON 9.6 9.5 9.6 IVB MIMAROPA 1.2 1.2 1.2
V BICOL 1.9 1.9 1.9 VI WESTERN VISAYAS 3.9 3.9 3.9 VII CENTRAL VISAYAS 6.2 6.1 6.3 VIII EASTERN VISAYAS 1.5 1.5 1.5 IX ZAMBOANGA PENINSULA 1.5 1.5 1.5 X NORTHERN MINDANAO 2.8 2.8 2.8 XI DAVAO REGION 3.5 3.6 3.6 XII SOCCSKSARGEN 1.7 1.7 1.7 XIII CARAGA 0.9 1.0 1.0
ARMM MUSLIM MINDANAO 0.5 0.5 0.5 Source: National Statistical Coordination Board
REGIONAL ACCOUNTS OF THE PHILIPPINESUnit : In PercentTable 4.2B GROSS VALUE ADDED IN SERVICES by Region2010 TO 2012AT CONSTANT 2000 PRICESPERCENT DISTRIBUTION
2010 2011 2012
PHILIPPINES 100.0 100.0 100.0
NCR METRO MANILA 51.9 51.8 51.7 CAR CORDILLERA 1.4 1.3 1.3
I ILOCOS 2.6 2.7 2.6 II CAGAYAN VALLEY 1.5 1.5 1.5 III CENTRAL LUZON 6.8 6.7 6.6
IVA CALABARZON 9.9 9.9 9.9 IVB MIMAROPA 1.2 1.2 1.2
V BICOL 2.0 2.0 1.9 VI WESTERN VISAYAS 4.1 4.1 4.1 VII CENTRAL VISAYAS 6.1 6.1 6.2 VIII EASTERN VISAYAS 1.6 1.6 1.6 IX ZAMBOANGA PENINSULA 1.5 1.6 1.6 X NORTHERN MINDANAO 2.8 2.8 2.8 XI DAVAO REGION 3.5 3.5 3.6 XII SOCCSKSARGEN 1.8 1.8 1.8 XIII CARAGA 0.9 1.0 1.0
ARMM MUSLIM MINDANAO 0.5 0.4 0.4 Source: National Statistical Coordination Board
REGION / YEAR
REGION / YEAR
Note: Regional levels may not add up to the national totals due to rounding.
Page 38

As of July 2013
REGIONAL ACCOUNTS OF THE PHILIPPINESUnit : In PercentTable 4.3A GROSS VALUE ADDED IN SERVICES by Region2010 TO 2012AT CURRENT PRICESGROWTH RATES
10-11 11-12
PHILIPPINES 9.4 11.1
NCR METRO MANILA 9.4 10.7CAR CORDILLERA 6.9 11.3
I ILOCOS 10.6 9.1II CAGAYAN VALLEY 8.9 11.0III CENTRAL LUZON 9.4 9.4
IVA CALABARZON 9.1 11.2IVB MIMAROPA 9.1 10.4
V BICOL 7.9 9.8VI WESTERN VISAYAS 9.0 11.8VII CENTRAL VISAYAS 9.3 14.3VIII EASTERN VISAYAS 7.5 11.4IX ZAMBOANGA PENINSULA 10.3 11.7X NORTHERN MINDANAO 9.7 12.7XI DAVAO REGION 11.7 12.2XII SOCCSKSARGEN 9.0 11.5XIII CARAGA 13.7 13.2
ARMM MUSLIM MINDANAO 6.0 10.8Source: National Statistical Coordination Board
REGIONAL ACCOUNTS OF THE PHILIPPINESUnit : In PercentTable 4.3B GROSS VALUE ADDED IN SERVICES by Region2010 TO 2012AT CONSTANT 2000 PRICESGROWTH RATES
10-11 11-12
PHILIPPINES 4.9 7.6
NCR METRO MANILA 4.8 7.4CAR CORDILLERA 3.1 7.4
I ILOCOS 5.3 6.8II CAGAYAN VALLEY 4.5 7.1III CENTRAL LUZON 4.4 6.2
IVA CALABARZON 4.9 8.0IVB MIMAROPA 5.5 6.8
V BICOL 3.9 6.1VI WESTERN VISAYAS 4.8 7.6VII CENTRAL VISAYAS 5.7 9.6VIII EASTERN VISAYAS 4.5 7.5IX ZAMBOANGA PENINSULA 6.0 8.3X NORTHERN MINDANAO 4.6 9.0XI DAVAO REGION 6.7 9.2XII SOCCSKSARGEN 4.3 8.1XIII CARAGA 8.5 9.2
ARMM MUSLIM MINDANAO 1.4 6.3Source: National Statistical Coordination Board
REGION / YEAR
REGION / YEAR
Note: Regional levels may not add up to the national totals due to rounding.
Page 39

As of July 2013
REGIONAL ACCOUNTS OF THE PHILIPPINES Base Year : 2000Table 4.4. GROSS VALUE ADDED IN SERVICES by Region2010 TO 2012IMPLICIT PRICE INDEX
2010 2011 2012
PHILIPPINES 156.1 162.8 168.0
NCR METRO MANILA 158.7 165.7 170.8CAR CORDILLERA 156.1 161.8 167.7
I ILOCOS 149.9 157.4 160.9II CAGAYAN VALLEY 146.4 152.6 158.1III CENTRAL LUZON 154.3 161.6 166.5
IVA CALABARZON 151.2 157.3 162.0IVB MIMAROPA 149.3 154.5 159.6
V BICOL 152.6 158.5 164.1VI WESTERN VISAYAS 148.4 154.3 160.2VII CENTRAL VISAYAS 158.3 163.7 170.6VIII EASTERN VISAYAS 149.2 153.6 159.3IX ZAMBOANGA PENINSULA 154.4 160.7 165.8X NORTHERN MINDANAO 157.7 165.4 170.8XI DAVAO REGION 156.8 164.1 168.6XII SOCCSKSARGEN 150.6 157.4 162.4XIII CARAGA 156.5 164.0 170.0
ARMM MUSLIM MINDANAO 163.5 170.8 178.1Source: National Statistical Coordination Board
REGION / YEAR
Note: Regional levels may not add up to the national totals due to rounding.
Page 40
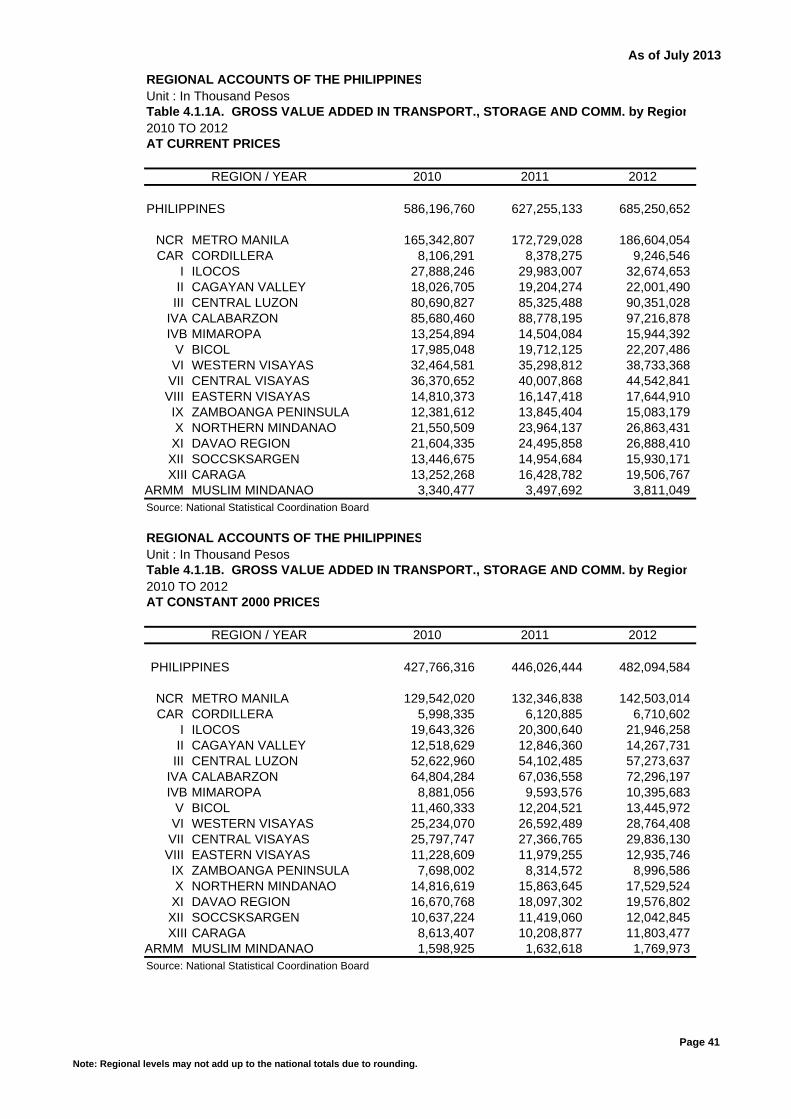
As of July 2013
REGIONAL ACCOUNTS OF THE PHILIPPINESUnit : In Thousand PesosTable 4.1.1A. GROSS VALUE ADDED IN TRANSPORT., STORAGE AND COMM. by Region2010 TO 2012AT CURRENT PRICES 586,197 627,255 685,251
2010 2011 2012
PHILIPPINES 586,196,760 627,255,133 685,250,652
NCR METRO MANILA 165,342,807 172,729,028 186,604,054CAR CORDILLERA 8,106,291 8,378,275 9,246,546
I ILOCOS 27,888,246 29,983,007 32,674,653II CAGAYAN VALLEY 18,026,705 19,204,274 22,001,490III CENTRAL LUZON 80,690,827 85,325,488 90,351,028
IVA CALABARZON 85,680,460 88,778,195 97,216,878IVB MIMAROPA 13,254,894 14,504,084 15,944,392
V BICOL 17,985,048 19,712,125 22,207,486VI WESTERN VISAYAS 32,464,581 35,298,812 38,733,368VII CENTRAL VISAYAS 36,370,652 40,007,868 44,542,841VIII EASTERN VISAYAS 14,810,373 16,147,418 17,644,910IX ZAMBOANGA PENINSULA 12,381,612 13,845,404 15,083,179X NORTHERN MINDANAO 21,550,509 23,964,137 26,863,431XI DAVAO REGION 21,604,335 24,495,858 26,888,410XII SOCCSKSARGEN 13,446,675 14,954,684 15,930,171XIII CARAGA 13,252,268 16,428,782 19,506,767
ARMM MUSLIM MINDANAO 3,340,477 3,497,692 3,811,049Source: National Statistical Coordination Board
REGIONAL ACCOUNTS OF THE PHILIPPINESUnit : In Thousand PesosTable 4.1.1B. GROSS VALUE ADDED IN TRANSPORT., STORAGE AND COMM. by Region2010 TO 2012AT CONSTANT 2000 PRICES 427,766 446,026 482,095
2010 2011 2012
PHILIPPINES 427,766,316 446,026,444 482,094,584
NCR METRO MANILA 129,542,020 132,346,838 142,503,014 CAR CORDILLERA 5,998,335 6,120,885 6,710,602
I ILOCOS 19,643,326 20,300,640 21,946,258 II CAGAYAN VALLEY 12,518,629 12,846,360 14,267,731 III CENTRAL LUZON 52,622,960 54,102,485 57,273,637
IVA CALABARZON 64,804,284 67,036,558 72,296,197 IVB MIMAROPA 8,881,056 9,593,576 10,395,683
V BICOL 11,460,333 12,204,521 13,445,972 VI WESTERN VISAYAS 25,234,070 26,592,489 28,764,408 VII CENTRAL VISAYAS 25,797,747 27,366,765 29,836,130 VIII EASTERN VISAYAS 11,228,609 11,979,255 12,935,746 IX ZAMBOANGA PENINSULA 7,698,002 8,314,572 8,996,586 X NORTHERN MINDANAO 14,816,619 15,863,645 17,529,524 XI DAVAO REGION 16,670,768 18,097,302 19,576,802 XII SOCCSKSARGEN 10,637,224 11,419,060 12,042,845 XIII CARAGA 8,613,407 10,208,877 11,803,477
ARMM MUSLIM MINDANAO 1,598,925 1,632,618 1,769,973 Source: National Statistical Coordination Board
REGION / YEAR
REGION / YEAR
Note: Regional levels may not add up to the national totals due to rounding.
Page 41
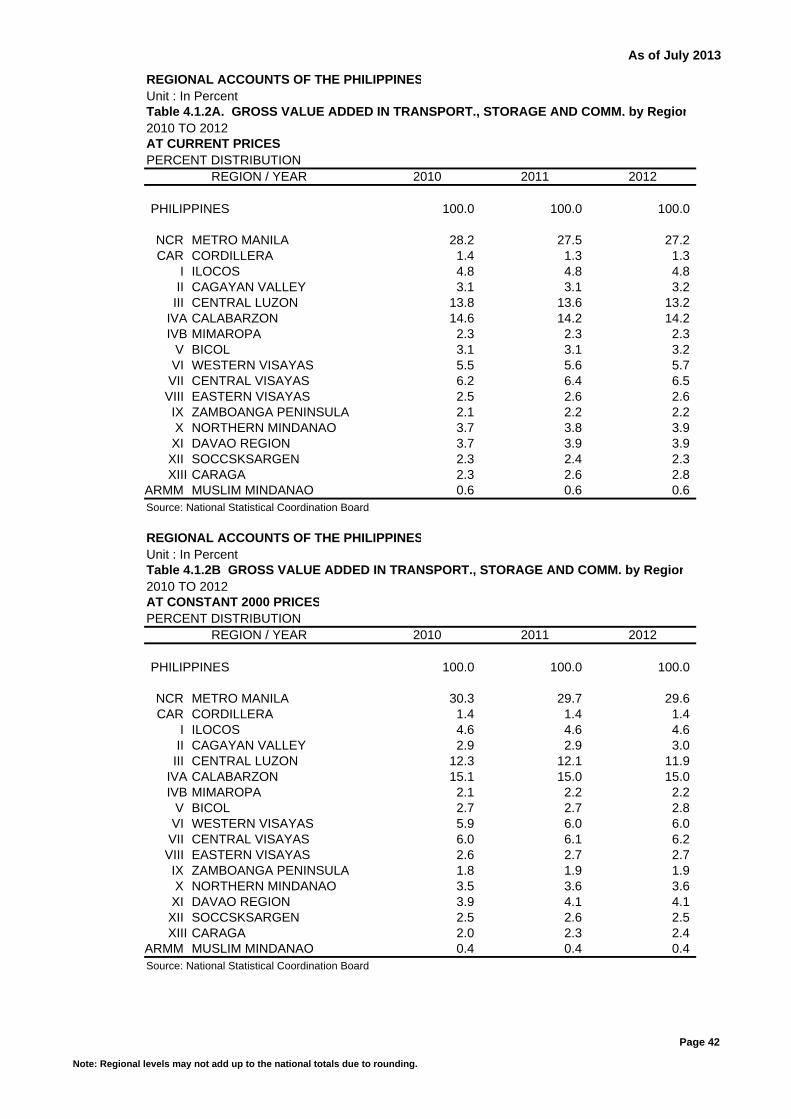
As of July 2013
REGIONAL ACCOUNTS OF THE PHILIPPINESUnit : In PercentTable 4.1.2A. GROSS VALUE ADDED IN TRANSPORT., STORAGE AND COMM. by Region2010 TO 2012AT CURRENT PRICESPERCENT DISTRIBUTION
2010 2011 2012
PHILIPPINES 100.0 100.0 100.0
NCR METRO MANILA 28.2 27.5 27.2 CAR CORDILLERA 1.4 1.3 1.3
I ILOCOS 4.8 4.8 4.8 II CAGAYAN VALLEY 3.1 3.1 3.2 III CENTRAL LUZON 13.8 13.6 13.2
IVA CALABARZON 14.6 14.2 14.2 IVB MIMAROPA 2.3 2.3 2.3
V BICOL 3.1 3.1 3.2 VI WESTERN VISAYAS 5.5 5.6 5.7 VII CENTRAL VISAYAS 6.2 6.4 6.5 VIII EASTERN VISAYAS 2.5 2.6 2.6 IX ZAMBOANGA PENINSULA 2.1 2.2 2.2 X NORTHERN MINDANAO 3.7 3.8 3.9 XI DAVAO REGION 3.7 3.9 3.9 XII SOCCSKSARGEN 2.3 2.4 2.3 XIII CARAGA 2.3 2.6 2.8
ARMM MUSLIM MINDANAO 0.6 0.6 0.6 Source: National Statistical Coordination Board
REGIONAL ACCOUNTS OF THE PHILIPPINESUnit : In PercentTable 4.1.2B GROSS VALUE ADDED IN TRANSPORT., STORAGE AND COMM. by Region2010 TO 2012AT CONSTANT 2000 PRICESPERCENT DISTRIBUTION
2010 2011 2012
PHILIPPINES 100.0 100.0 100.0
NCR METRO MANILA 30.3 29.7 29.6 CAR CORDILLERA 1.4 1.4 1.4
I ILOCOS 4.6 4.6 4.6 II CAGAYAN VALLEY 2.9 2.9 3.0 III CENTRAL LUZON 12.3 12.1 11.9
IVA CALABARZON 15.1 15.0 15.0 IVB MIMAROPA 2.1 2.2 2.2
V BICOL 2.7 2.7 2.8 VI WESTERN VISAYAS 5.9 6.0 6.0 VII CENTRAL VISAYAS 6.0 6.1 6.2 VIII EASTERN VISAYAS 2.6 2.7 2.7 IX ZAMBOANGA PENINSULA 1.8 1.9 1.9 X NORTHERN MINDANAO 3.5 3.6 3.6 XI DAVAO REGION 3.9 4.1 4.1 XII SOCCSKSARGEN 2.5 2.6 2.5 XIII CARAGA 2.0 2.3 2.4
ARMM MUSLIM MINDANAO 0.4 0.4 0.4 Source: National Statistical Coordination Board
REGION / YEAR
REGION / YEAR
Note: Regional levels may not add up to the national totals due to rounding.
Page 42
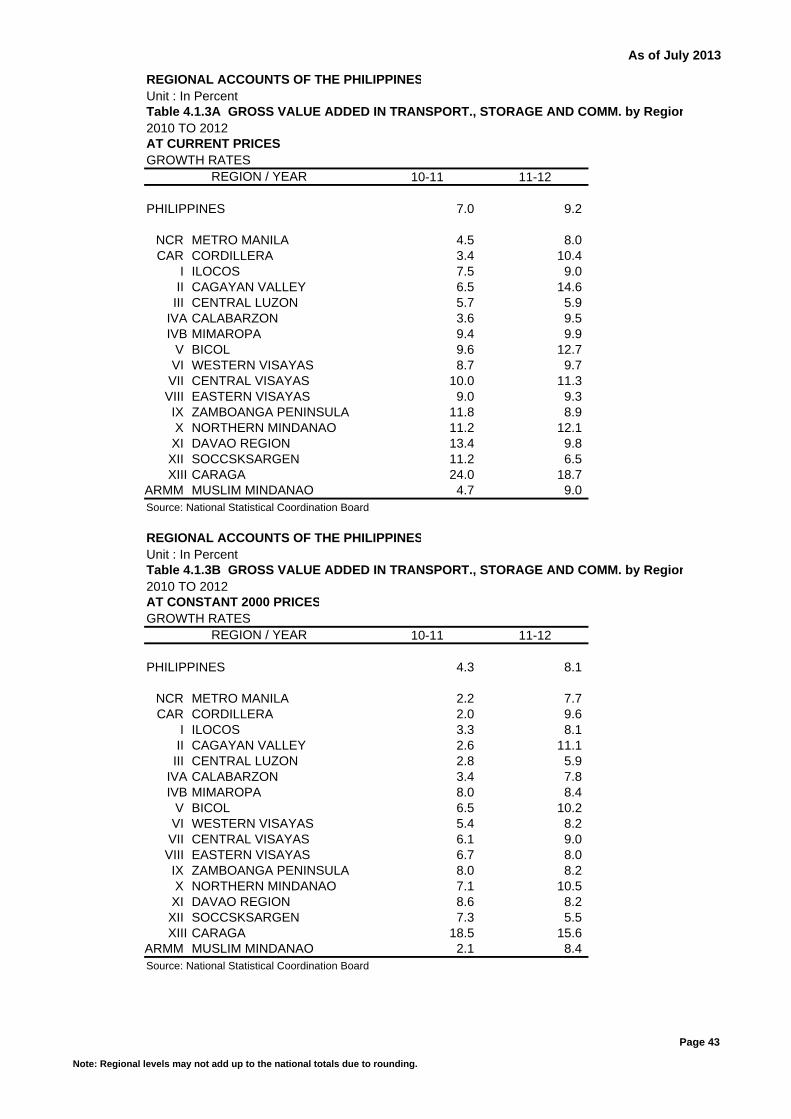
As of July 2013
REGIONAL ACCOUNTS OF THE PHILIPPINESUnit : In PercentTable 4.1.3A GROSS VALUE ADDED IN TRANSPORT., STORAGE AND COMM. by Region2010 TO 2012AT CURRENT PRICESGROWTH RATES
10-11 11-12
PHILIPPINES 7.0 9.2
NCR METRO MANILA 4.5 8.0CAR CORDILLERA 3.4 10.4
I ILOCOS 7.5 9.0II CAGAYAN VALLEY 6.5 14.6III CENTRAL LUZON 5.7 5.9
IVA CALABARZON 3.6 9.5IVB MIMAROPA 9.4 9.9
V BICOL 9.6 12.7VI WESTERN VISAYAS 8.7 9.7VII CENTRAL VISAYAS 10.0 11.3VIII EASTERN VISAYAS 9.0 9.3IX ZAMBOANGA PENINSULA 11.8 8.9X NORTHERN MINDANAO 11.2 12.1XI DAVAO REGION 13.4 9.8XII SOCCSKSARGEN 11.2 6.5XIII CARAGA 24.0 18.7
ARMM MUSLIM MINDANAO 4.7 9.0Source: National Statistical Coordination Board
REGIONAL ACCOUNTS OF THE PHILIPPINESUnit : In PercentTable 4.1.3B GROSS VALUE ADDED IN TRANSPORT., STORAGE AND COMM. by Region2010 TO 2012AT CONSTANT 2000 PRICESGROWTH RATES
10-11 11-12
PHILIPPINES 4.3 8.1
NCR METRO MANILA 2.2 7.7CAR CORDILLERA 2.0 9.6
I ILOCOS 3.3 8.1II CAGAYAN VALLEY 2.6 11.1III CENTRAL LUZON 2.8 5.9
IVA CALABARZON 3.4 7.8IVB MIMAROPA 8.0 8.4
V BICOL 6.5 10.2VI WESTERN VISAYAS 5.4 8.2VII CENTRAL VISAYAS 6.1 9.0VIII EASTERN VISAYAS 6.7 8.0IX ZAMBOANGA PENINSULA 8.0 8.2X NORTHERN MINDANAO 7.1 10.5XI DAVAO REGION 8.6 8.2XII SOCCSKSARGEN 7.3 5.5XIII CARAGA 18.5 15.6
ARMM MUSLIM MINDANAO 2.1 8.4Source: National Statistical Coordination Board
REGION / YEAR
REGION / YEAR
Note: Regional levels may not add up to the national totals due to rounding.
Page 43
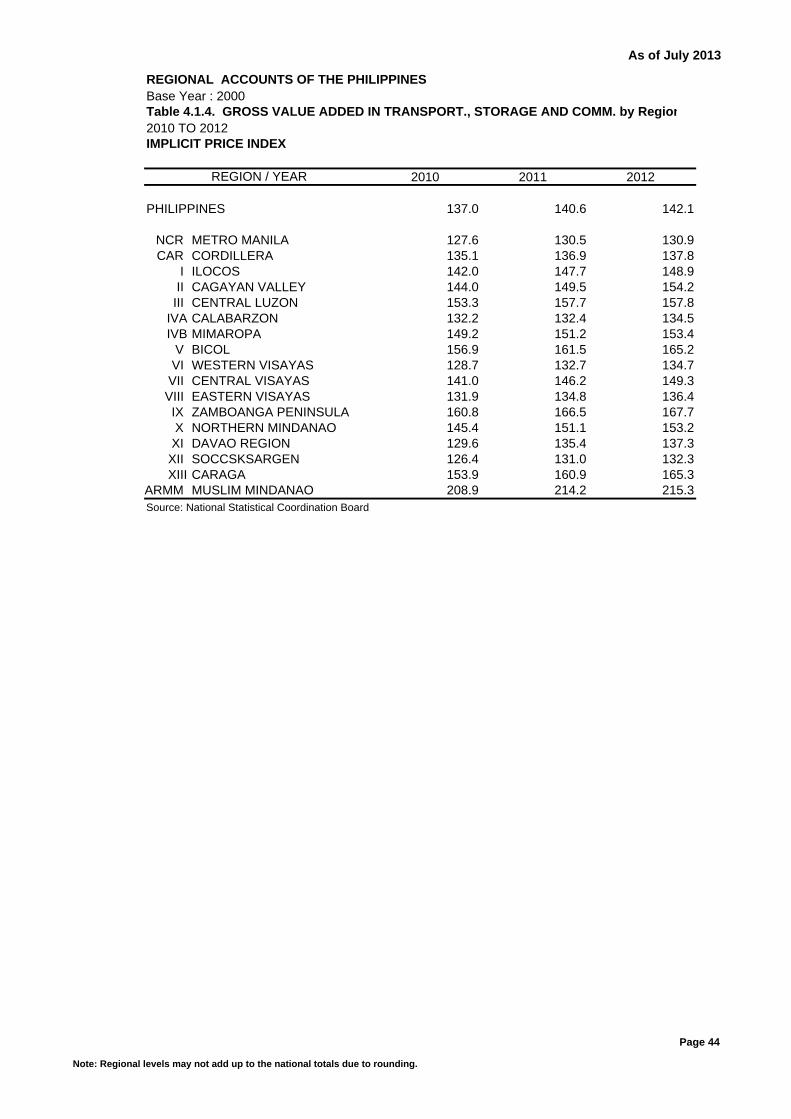
As of July 2013
REGIONAL ACCOUNTS OF THE PHILIPPINES Base Year : 2000Table 4.1.4. GROSS VALUE ADDED IN TRANSPORT., STORAGE AND COMM. by Region2010 TO 2012IMPLICIT PRICE INDEX
2010 2011 2012
PHILIPPINES 137.0 140.6 142.1
NCR METRO MANILA 127.6 130.5 130.9CAR CORDILLERA 135.1 136.9 137.8
I ILOCOS 142.0 147.7 148.9II CAGAYAN VALLEY 144.0 149.5 154.2III CENTRAL LUZON 153.3 157.7 157.8
IVA CALABARZON 132.2 132.4 134.5IVB MIMAROPA 149.2 151.2 153.4
V BICOL 156.9 161.5 165.2VI WESTERN VISAYAS 128.7 132.7 134.7VII CENTRAL VISAYAS 141.0 146.2 149.3VIII EASTERN VISAYAS 131.9 134.8 136.4IX ZAMBOANGA PENINSULA 160.8 166.5 167.7X NORTHERN MINDANAO 145.4 151.1 153.2XI DAVAO REGION 129.6 135.4 137.3XII SOCCSKSARGEN 126.4 131.0 132.3XIII CARAGA 153.9 160.9 165.3
ARMM MUSLIM MINDANAO 208.9 214.2 215.3Source: National Statistical Coordination Board
REGION / YEAR
Note: Regional levels may not add up to the national totals due to rounding.
Page 44
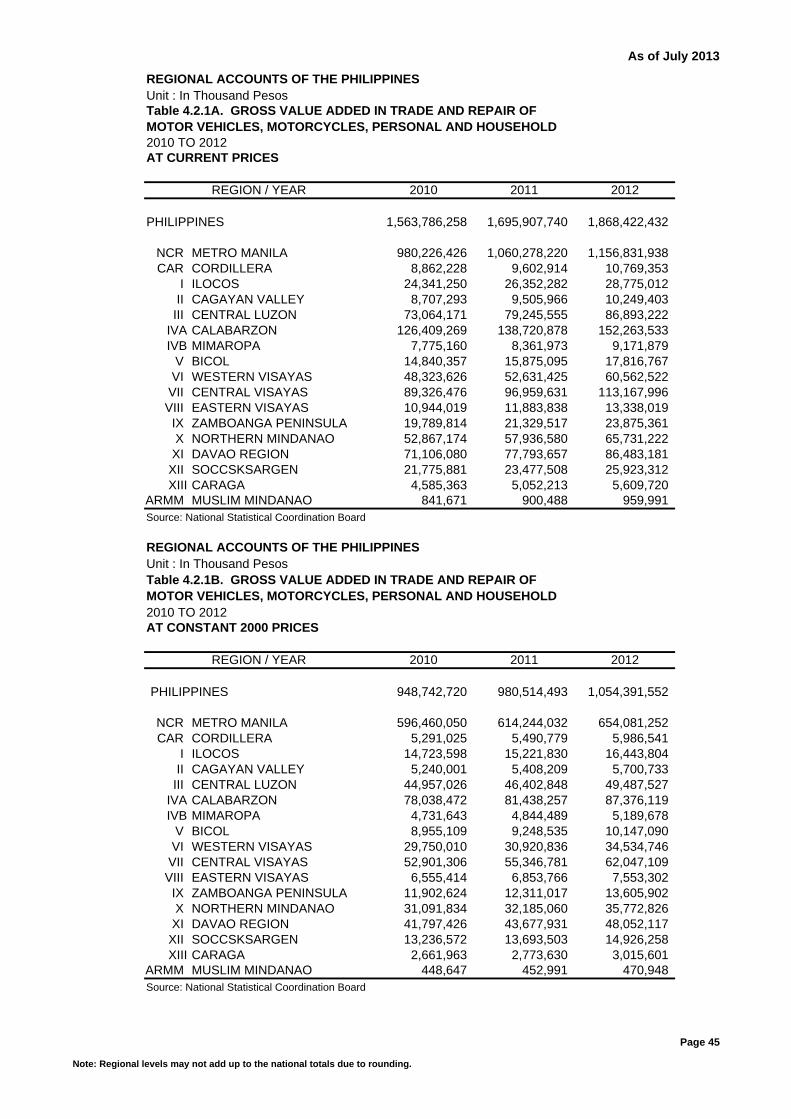
As of July 2013
REGIONAL ACCOUNTS OF THE PHILIPPINESUnit : In Thousand Pesos
2010 TO 2012AT CURRENT PRICES 1,563,786 1,695,908 1,868,423
2010 2011 2012
PHILIPPINES 1,563,786,258 1,695,907,740 1,868,422,432
NCR METRO MANILA 980,226,426 1,060,278,220 1,156,831,938CAR CORDILLERA 8,862,228 9,602,914 10,769,353
I ILOCOS 24,341,250 26,352,282 28,775,012II CAGAYAN VALLEY 8,707,293 9,505,966 10,249,403
III CENTRAL LUZON 73,064,171 79,245,555 86,893,222IVA CALABARZON 126,409,269 138,720,878 152,263,533IVB MIMAROPA 7,775,160 8,361,973 9,171,879
V BICOL 14,840,357 15,875,095 17,816,767VI WESTERN VISAYAS 48,323,626 52,631,425 60,562,522
VII CENTRAL VISAYAS 89,326,476 96,959,631 113,167,996VIII EASTERN VISAYAS 10,944,019 11,883,838 13,338,019
IX ZAMBOANGA PENINSULA 19,789,814 21,329,517 23,875,361X NORTHERN MINDANAO 52,867,174 57,936,580 65,731,222
XI DAVAO REGION 71,106,080 77,793,657 86,483,181XII SOCCSKSARGEN 21,775,881 23,477,508 25,923,312XIII CARAGA 4,585,363 5,052,213 5,609,720
ARMM MUSLIM MINDANAO 841,671 900,488 959,991Source: National Statistical Coordination Board
REGIONAL ACCOUNTS OF THE PHILIPPINESUnit : In Thousand Pesos
2010 TO 2012AT CONSTANT 2000 PRICES 948,743 980,514 1,054,392
2010 2011 2012
PHILIPPINES 948,742,720 980,514,493 1,054,391,552
NCR METRO MANILA 596,460,050 614,244,032 654,081,252 CAR CORDILLERA 5,291,025 5,490,779 5,986,541
I ILOCOS 14,723,598 15,221,830 16,443,804 II CAGAYAN VALLEY 5,240,001 5,408,209 5,700,733
III CENTRAL LUZON 44,957,026 46,402,848 49,487,527 IVA CALABARZON 78,038,472 81,438,257 87,376,119 IVB MIMAROPA 4,731,643 4,844,489 5,189,678
V BICOL 8,955,109 9,248,535 10,147,090 VI WESTERN VISAYAS 29,750,010 30,920,836 34,534,746
VII CENTRAL VISAYAS 52,901,306 55,346,781 62,047,109 VIII EASTERN VISAYAS 6,555,414 6,853,766 7,553,302
IX ZAMBOANGA PENINSULA 11,902,624 12,311,017 13,605,902 X NORTHERN MINDANAO 31,091,834 32,185,060 35,772,826
XI DAVAO REGION 41,797,426 43,677,931 48,052,117 XII SOCCSKSARGEN 13,236,572 13,693,503 14,926,258 XIII CARAGA 2,661,963 2,773,630 3,015,601
ARMM MUSLIM MINDANAO 448,647 452,991 470,948 Source: National Statistical Coordination Board
Table 4.2.1A. GROSS VALUE ADDED IN TRADE AND REPAIR OF MOTOR VEHICLES, MOTORCYCLES, PERSONAL AND HOUSEHOLD
Table 4.2.1B. GROSS VALUE ADDED IN TRADE AND REPAIR OF MOTOR VEHICLES, MOTORCYCLES, PERSONAL AND HOUSEHOLD
REGION / YEAR
REGION / YEAR
Note: Regional levels may not add up to the national totals due to rounding.
Page 45
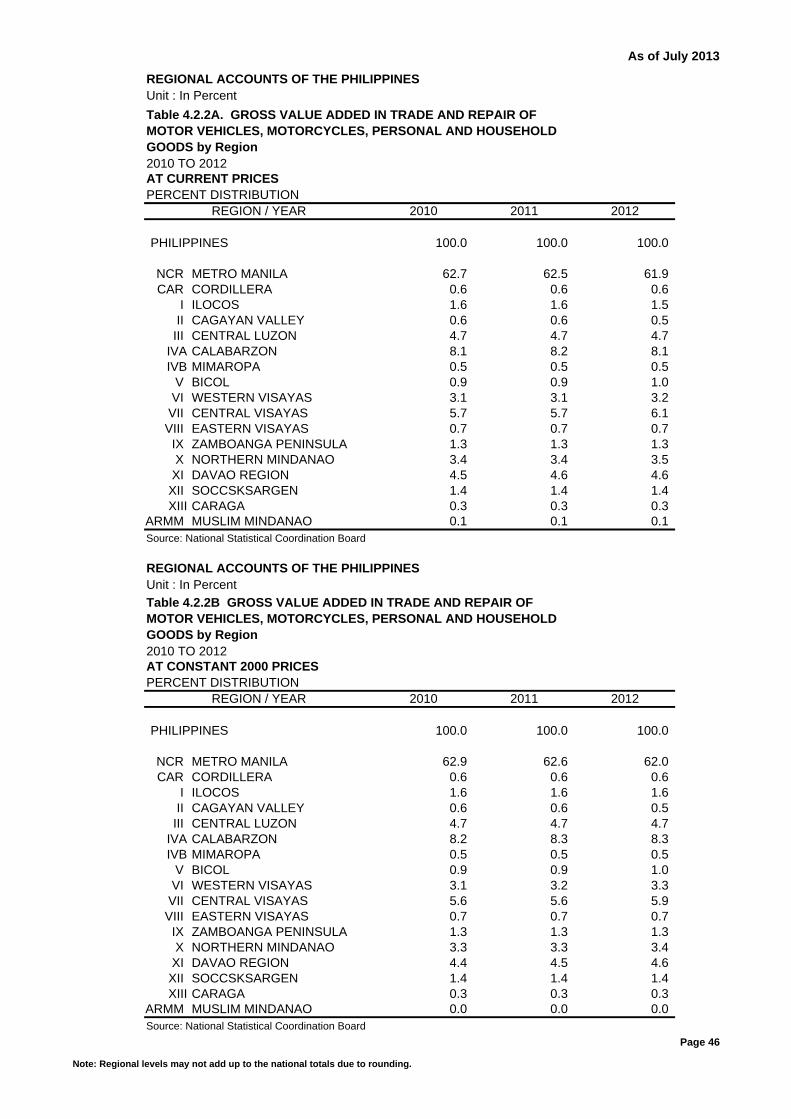
As of July 2013
REGIONAL ACCOUNTS OF THE PHILIPPINESUnit : In Percent
2010 TO 2012AT CURRENT PRICESPERCENT DISTRIBUTION
2010 2011 2012
PHILIPPINES 100.0 100.0 100.0
NCR METRO MANILA 62.7 62.5 61.9 CAR CORDILLERA 0.6 0.6 0.6
I ILOCOS 1.6 1.6 1.5 II CAGAYAN VALLEY 0.6 0.6 0.5
III CENTRAL LUZON 4.7 4.7 4.7 IVA CALABARZON 8.1 8.2 8.1 IVB MIMAROPA 0.5 0.5 0.5
V BICOL 0.9 0.9 1.0 VI WESTERN VISAYAS 3.1 3.1 3.2
VII CENTRAL VISAYAS 5.7 5.7 6.1 VIII EASTERN VISAYAS 0.7 0.7 0.7
IX ZAMBOANGA PENINSULA 1.3 1.3 1.3 X NORTHERN MINDANAO 3.4 3.4 3.5
XI DAVAO REGION 4.5 4.6 4.6 XII SOCCSKSARGEN 1.4 1.4 1.4 XIII CARAGA 0.3 0.3 0.3
ARMM MUSLIM MINDANAO 0.1 0.1 0.1 Source: National Statistical Coordination Board
REGIONAL ACCOUNTS OF THE PHILIPPINESUnit : In Percent
2010 TO 2012AT CONSTANT 2000 PRICESPERCENT DISTRIBUTION
2010 2011 2012
PHILIPPINES 100.0 100.0 100.0
NCR METRO MANILA 62.9 62.6 62.0 CAR CORDILLERA 0.6 0.6 0.6
I ILOCOS 1.6 1.6 1.6 II CAGAYAN VALLEY 0.6 0.6 0.5
III CENTRAL LUZON 4.7 4.7 4.7 IVA CALABARZON 8.2 8.3 8.3 IVB MIMAROPA 0.5 0.5 0.5
V BICOL 0.9 0.9 1.0 VI WESTERN VISAYAS 3.1 3.2 3.3
VII CENTRAL VISAYAS 5.6 5.6 5.9 VIII EASTERN VISAYAS 0.7 0.7 0.7
IX ZAMBOANGA PENINSULA 1.3 1.3 1.3 X NORTHERN MINDANAO 3.3 3.3 3.4
XI DAVAO REGION 4.4 4.5 4.6 XII SOCCSKSARGEN 1.4 1.4 1.4 XIII CARAGA 0.3 0.3 0.3
ARMM MUSLIM MINDANAO 0.0 0.0 0.0 Source: National Statistical Coordination Board
Table 4.2.2A. GROSS VALUE ADDED IN TRADE AND REPAIR OF MOTOR VEHICLES, MOTORCYCLES, PERSONAL AND HOUSEHOLD GOODS by Region
Table 4.2.2B GROSS VALUE ADDED IN TRADE AND REPAIR OF MOTOR VEHICLES, MOTORCYCLES, PERSONAL AND HOUSEHOLD GOODS by Region
REGION / YEAR
REGION / YEAR
Note: Regional levels may not add up to the national totals due to rounding.
Page 46

As of July 2013
REGIONAL ACCOUNTS OF THE PHILIPPINESUnit : In Percent
2010 TO 2012AT CURRENT PRICESGROWTH RATES
10-11 11-12
PHILIPPINES 8.4 10.2
NCR METRO MANILA 8.2 9.1CAR CORDILLERA 8.4 12.1
I ILOCOS 8.3 9.2II CAGAYAN VALLEY 9.2 7.8
III CENTRAL LUZON 8.5 9.7IVA CALABARZON 9.7 9.8IVB MIMAROPA 7.5 9.7
V BICOL 7.0 12.2VI WESTERN VISAYAS 8.9 15.1
VII CENTRAL VISAYAS 8.5 16.7VIII EASTERN VISAYAS 8.6 12.2
IX ZAMBOANGA PENINSULA 7.8 11.9X NORTHERN MINDANAO 9.6 13.5
XI DAVAO REGION 9.4 11.2XII SOCCSKSARGEN 7.8 10.4XIII CARAGA 10.2 11.0
ARMM MUSLIM MINDANAO 7.0 6.6Source: National Statistical Coordination Board
REGIONAL ACCOUNTS OF THE PHILIPPINESUnit : In Percent
2010 TO 2012AT CONSTANT 2000 PRICESGROWTH RATES
10-11 11-12
PHILIPPINES 3.3 7.5
NCR METRO MANILA 3.0 6.5CAR CORDILLERA 3.8 9.0
I ILOCOS 3.4 8.0II CAGAYAN VALLEY 3.2 5.4
III CENTRAL LUZON 3.2 6.6IVA CALABARZON 4.4 7.3IVB MIMAROPA 2.4 7.1
V BICOL 3.3 9.7VI WESTERN VISAYAS 3.9 11.7
VII CENTRAL VISAYAS 4.6 12.1VIII EASTERN VISAYAS 4.6 10.2
IX ZAMBOANGA PENINSULA 3.4 10.5X NORTHERN MINDANAO 3.5 11.1
XI DAVAO REGION 4.5 10.0XII SOCCSKSARGEN 3.5 9.0XIII CARAGA 4.2 8.7
ARMM MUSLIM MINDANAO 1.0 4.0Source: National Statistical Coordination Board
REGION / YEAR
REGION / YEAR
Table 4.2.3A GROSS VALUE ADDED IN TRADE AND REPAIR OF MOTOR VEHICLES, MOTORCYCLES, PERSONAL AND HOUSEHOLD GOODS by Region
Table 4.2.3B GROSS VALUE ADDED IN TRADE AND REPAIR OF MOTOR VEHICLES, MOTORCYCLES, PERSONAL AND HOUSEHOLD
Note: Regional levels may not add up to the national totals due to rounding.
Page 47
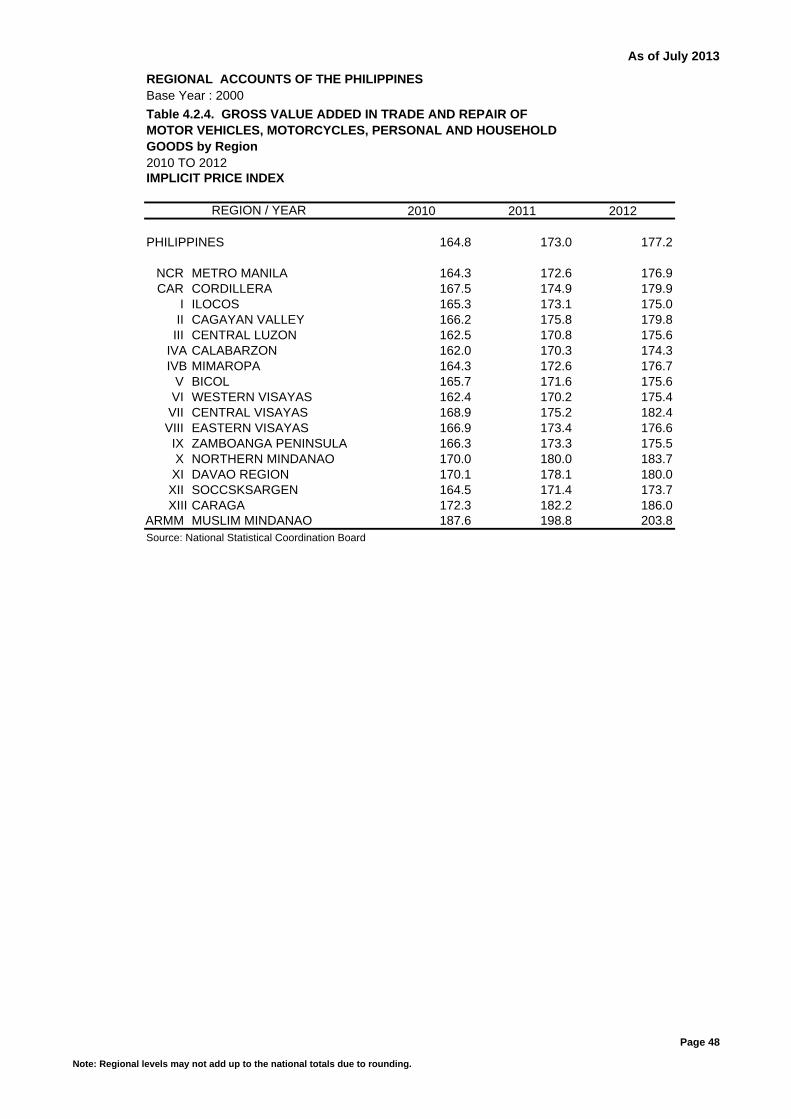
As of July 2013
REGIONAL ACCOUNTS OF THE PHILIPPINES Base Year : 2000
2010 TO 2012IMPLICIT PRICE INDEX
2010 2011 2012
PHILIPPINES 164.8 173.0 177.2
NCR METRO MANILA 164.3 172.6 176.9CAR CORDILLERA 167.5 174.9 179.9
I ILOCOS 165.3 173.1 175.0II CAGAYAN VALLEY 166.2 175.8 179.8
III CENTRAL LUZON 162.5 170.8 175.6IVA CALABARZON 162.0 170.3 174.3IVB MIMAROPA 164.3 172.6 176.7
V BICOL 165.7 171.6 175.6VI WESTERN VISAYAS 162.4 170.2 175.4
VII CENTRAL VISAYAS 168.9 175.2 182.4VIII EASTERN VISAYAS 166.9 173.4 176.6
IX ZAMBOANGA PENINSULA 166.3 173.3 175.5X NORTHERN MINDANAO 170.0 180.0 183.7
XI DAVAO REGION 170.1 178.1 180.0XII SOCCSKSARGEN 164.5 171.4 173.7XIII CARAGA 172.3 182.2 186.0
ARMM MUSLIM MINDANAO 187.6 198.8 203.8Source: National Statistical Coordination Board
REGION / YEAR
Table 4.2.4. GROSS VALUE ADDED IN TRADE AND REPAIR OF MOTOR VEHICLES, MOTORCYCLES, PERSONAL AND HOUSEHOLD GOODS by Region
Note: Regional levels may not add up to the national totals due to rounding.
Page 48
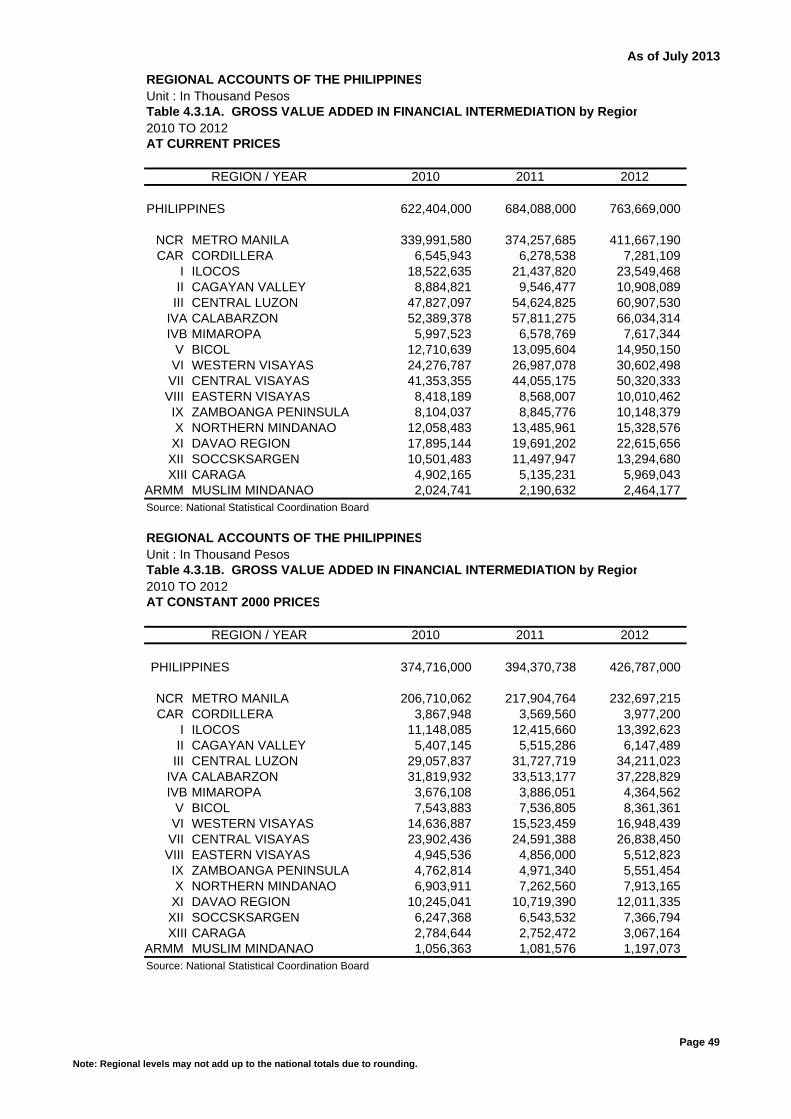
As of July 2013
REGIONAL ACCOUNTS OF THE PHILIPPINESUnit : In Thousand PesosTable 4.3.1A. GROSS VALUE ADDED IN FINANCIAL INTERMEDIATION by Region2010 TO 2012AT CURRENT PRICES 622,404 684,088 763,669
2010 2011 2012
PHILIPPINES 622,404,000 684,088,000 763,669,000
NCR METRO MANILA 339,991,580 374,257,685 411,667,190CAR CORDILLERA 6,545,943 6,278,538 7,281,109
I ILOCOS 18,522,635 21,437,820 23,549,468II CAGAYAN VALLEY 8,884,821 9,546,477 10,908,089III CENTRAL LUZON 47,827,097 54,624,825 60,907,530
IVA CALABARZON 52,389,378 57,811,275 66,034,314IVB MIMAROPA 5,997,523 6,578,769 7,617,344
V BICOL 12,710,639 13,095,604 14,950,150VI WESTERN VISAYAS 24,276,787 26,987,078 30,602,498VII CENTRAL VISAYAS 41,353,355 44,055,175 50,320,333VIII EASTERN VISAYAS 8,418,189 8,568,007 10,010,462IX ZAMBOANGA PENINSULA 8,104,037 8,845,776 10,148,379X NORTHERN MINDANAO 12,058,483 13,485,961 15,328,576XI DAVAO REGION 17,895,144 19,691,202 22,615,656XII SOCCSKSARGEN 10,501,483 11,497,947 13,294,680XIII CARAGA 4,902,165 5,135,231 5,969,043
ARMM MUSLIM MINDANAO 2,024,741 2,190,632 2,464,177Source: National Statistical Coordination Board
REGIONAL ACCOUNTS OF THE PHILIPPINESUnit : In Thousand PesosTable 4.3.1B. GROSS VALUE ADDED IN FINANCIAL INTERMEDIATION by Region2010 TO 2012AT CONSTANT 2000 PRICES 374,716 394,371 426,787
2010 2011 2012
PHILIPPINES 374,716,000 394,370,738 426,787,000
NCR METRO MANILA 206,710,062 217,904,764 232,697,215 CAR CORDILLERA 3,867,948 3,569,560 3,977,200
I ILOCOS 11,148,085 12,415,660 13,392,623 II CAGAYAN VALLEY 5,407,145 5,515,286 6,147,489 III CENTRAL LUZON 29,057,837 31,727,719 34,211,023
IVA CALABARZON 31,819,932 33,513,177 37,228,829 IVB MIMAROPA 3,676,108 3,886,051 4,364,562
V BICOL 7,543,883 7,536,805 8,361,361 VI WESTERN VISAYAS 14,636,887 15,523,459 16,948,439 VII CENTRAL VISAYAS 23,902,436 24,591,388 26,838,450 VIII EASTERN VISAYAS 4,945,536 4,856,000 5,512,823 IX ZAMBOANGA PENINSULA 4,762,814 4,971,340 5,551,454 X NORTHERN MINDANAO 6,903,911 7,262,560 7,913,165 XI DAVAO REGION 10,245,041 10,719,390 12,011,335 XII SOCCSKSARGEN 6,247,368 6,543,532 7,366,794 XIII CARAGA 2,784,644 2,752,472 3,067,164
ARMM MUSLIM MINDANAO 1,056,363 1,081,576 1,197,073 Source: National Statistical Coordination Board
REGION / YEAR
REGION / YEAR
Note: Regional levels may not add up to the national totals due to rounding.
Page 49

As of July 2013
REGIONAL ACCOUNTS OF THE PHILIPPINESUnit : In PercentTable 4.3.2A. GROSS VALUE ADDED IN FINANCIAL INTERMEDIATION by Region2010 TO 2012AT CURRENT PRICESPERCENT DISTRIBUTION
2010 2011 2012
PHILIPPINES 100.0 100.0 100.0
NCR METRO MANILA 54.6 54.7 53.9 CAR CORDILLERA 1.1 0.9 1.0
I ILOCOS 3.0 3.1 3.1 II CAGAYAN VALLEY 1.4 1.4 1.4 III CENTRAL LUZON 7.7 8.0 8.0
IVA CALABARZON 8.4 8.5 8.6 IVB MIMAROPA 1.0 1.0 1.0
V BICOL 2.0 1.9 2.0 VI WESTERN VISAYAS 3.9 3.9 4.0 VII CENTRAL VISAYAS 6.6 6.4 6.6 VIII EASTERN VISAYAS 1.4 1.3 1.3 IX ZAMBOANGA PENINSULA 1.3 1.3 1.3 X NORTHERN MINDANAO 1.9 2.0 2.0 XI DAVAO REGION 2.9 2.9 3.0 XII SOCCSKSARGEN 1.7 1.7 1.7 XIII CARAGA 0.8 0.8 0.8
ARMM MUSLIM MINDANAO 0.3 0.3 0.3 Source: National Statistical Coordination Board
REGIONAL ACCOUNTS OF THE PHILIPPINESUnit : In PercentTable 4.3.2B GROSS VALUE ADDED IN FINANCIAL INTERMEDIATION by Region2010 TO 2012AT CONSTANT 2000 PRICESPERCENT DISTRIBUTION
2010 2011 2012
PHILIPPINES 100.0 100.0 100.0
NCR METRO MANILA 55.2 55.3 54.5 CAR CORDILLERA 1.0 0.9 0.9
I ILOCOS 3.0 3.1 3.1 II CAGAYAN VALLEY 1.4 1.4 1.4 III CENTRAL LUZON 7.8 8.0 8.0
IVA CALABARZON 8.5 8.5 8.7 IVB MIMAROPA 1.0 1.0 1.0
V BICOL 2.0 1.9 2.0 VI WESTERN VISAYAS 3.9 3.9 4.0 VII CENTRAL VISAYAS 6.4 6.2 6.3 VIII EASTERN VISAYAS 1.3 1.2 1.3 IX ZAMBOANGA PENINSULA 1.3 1.3 1.3 X NORTHERN MINDANAO 1.8 1.8 1.9 XI DAVAO REGION 2.7 2.7 2.8 XII SOCCSKSARGEN 1.7 1.7 1.7 XIII CARAGA 0.7 0.7 0.7
ARMM MUSLIM MINDANAO 0.3 0.3 0.3 Source: National Statistical Coordination Board
REGION / YEAR
REGION / YEAR
Note: Regional levels may not add up to the national totals due to rounding.
Page 50

As of July 2013
REGIONAL ACCOUNTS OF THE PHILIPPINESUnit : In PercentTable 4.3.3A GROSS VALUE ADDED IN FINANCIAL INTERMEDIATION by Region2010 TO 2012AT CURRENT PRICESGROWTH RATES
10-11 11-12
PHILIPPINES 9.9 11.6
NCR METRO MANILA 10.1 10.0CAR CORDILLERA (4.1) 16.0
I ILOCOS 15.7 9.9II CAGAYAN VALLEY 7.4 14.3III CENTRAL LUZON 14.2 11.5
IVA CALABARZON 10.3 14.2IVB MIMAROPA 9.7 15.8
V BICOL 3.0 14.2VI WESTERN VISAYAS 11.2 13.4VII CENTRAL VISAYAS 6.5 14.2VIII EASTERN VISAYAS 1.8 16.8IX ZAMBOANGA PENINSULA 9.2 14.7X NORTHERN MINDANAO 11.8 13.7XI DAVAO REGION 10.0 14.9XII SOCCSKSARGEN 9.5 15.6XIII CARAGA 4.8 16.2
ARMM MUSLIM MINDANAO 8.2 12.5Source: National Statistical Coordination Board
REGIONAL ACCOUNTS OF THE PHILIPPINESUnit : In PercentTable 4.3.3B GROSS VALUE ADDED IN FINANCIAL INTERMEDIATION by Region2010 TO 2012AT CONSTANT 2000 PRICESGROWTH RATES
10-11 11-12
PHILIPPINES 5.2 8.2
NCR METRO MANILA 5.4 6.8CAR CORDILLERA (7.7) 11.4
I ILOCOS 11.4 7.9II CAGAYAN VALLEY 2.0 11.5III CENTRAL LUZON 9.2 7.8
IVA CALABARZON 5.3 11.1IVB MIMAROPA 5.7 12.3
V BICOL (0.1) 10.9VI WESTERN VISAYAS 6.1 9.2VII CENTRAL VISAYAS 2.9 9.1VIII EASTERN VISAYAS (1.8) 13.5IX ZAMBOANGA PENINSULA 4.4 11.7X NORTHERN MINDANAO 5.2 9.0XI DAVAO REGION 4.6 12.1XII SOCCSKSARGEN 4.7 12.6XIII CARAGA (1.2) 11.4
ARMM MUSLIM MINDANAO 2.4 10.7Source: National Statistical Coordination Board
REGION / YEAR
REGION / YEAR
Note: Regional levels may not add up to the national totals due to rounding.
Page 51
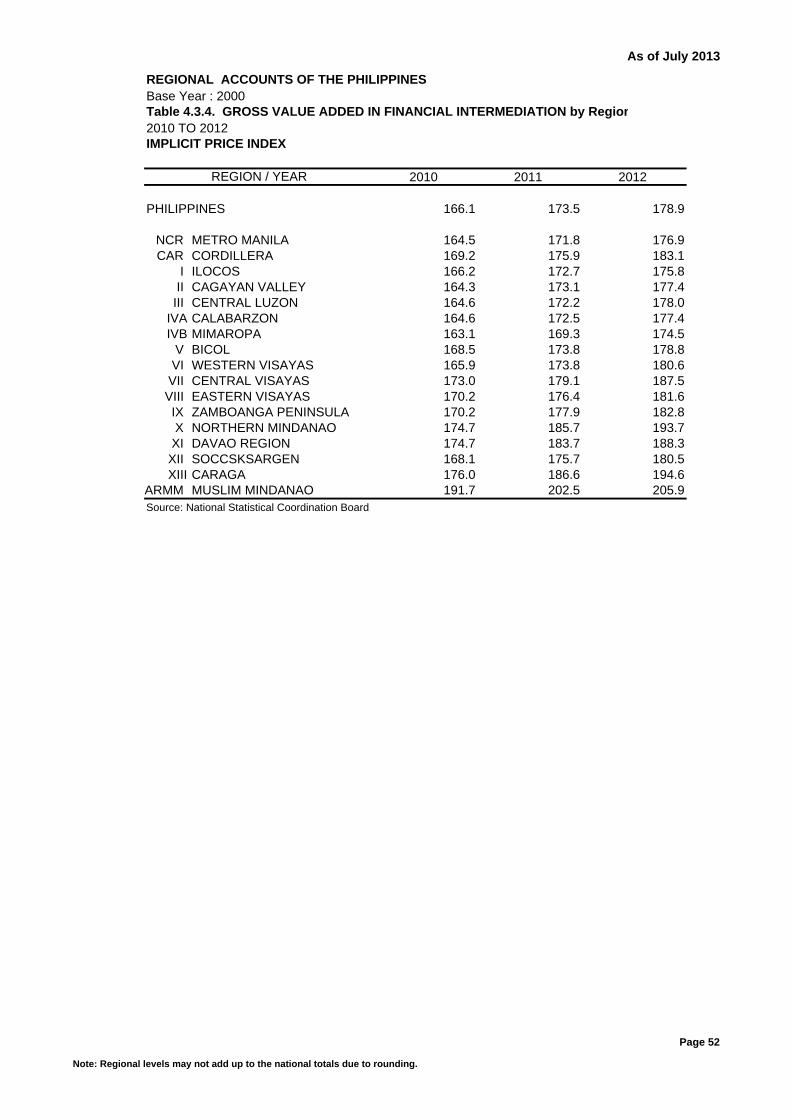
As of July 2013
REGIONAL ACCOUNTS OF THE PHILIPPINES Base Year : 2000Table 4.3.4. GROSS VALUE ADDED IN FINANCIAL INTERMEDIATION by Region2010 TO 2012IMPLICIT PRICE INDEX
2010 2011 2012
PHILIPPINES 166.1 173.5 178.9
NCR METRO MANILA 164.5 171.8 176.9CAR CORDILLERA 169.2 175.9 183.1
I ILOCOS 166.2 172.7 175.8II CAGAYAN VALLEY 164.3 173.1 177.4III CENTRAL LUZON 164.6 172.2 178.0
IVA CALABARZON 164.6 172.5 177.4IVB MIMAROPA 163.1 169.3 174.5
V BICOL 168.5 173.8 178.8VI WESTERN VISAYAS 165.9 173.8 180.6VII CENTRAL VISAYAS 173.0 179.1 187.5VIII EASTERN VISAYAS 170.2 176.4 181.6IX ZAMBOANGA PENINSULA 170.2 177.9 182.8X NORTHERN MINDANAO 174.7 185.7 193.7XI DAVAO REGION 174.7 183.7 188.3XII SOCCSKSARGEN 168.1 175.7 180.5XIII CARAGA 176.0 186.6 194.6
ARMM MUSLIM MINDANAO 191.7 202.5 205.9Source: National Statistical Coordination Board
REGION / YEAR
Note: Regional levels may not add up to the national totals due to rounding.
Page 52

As of July 2013
REGIONAL ACCOUNTS OF THE PHILIPPINESUnit : In Thousand PesosTable 4.4.1A. GROSS VALUE ADDED IN R. ESTATE, RENTING & BUSINESS ACTIVITIES by Regio2010 TO 2012AT CURRENT PRICES 979,129 1,105,120 1,236,489
2010 2011 2012
PHILIPPINES 979,128,882 1,105,120,757 1,236,489,000
NCR METRO MANILA 541,909,622 617,524,225 688,774,116CAR CORDILLERA 16,512,136 17,919,188 19,824,647
I ILOCOS 19,369,439 21,672,810 24,051,294II CAGAYAN VALLEY 8,770,954 9,559,187 10,381,848III CENTRAL LUZON 62,336,942 68,380,436 75,970,786
IVA CALABARZON 127,557,260 144,525,004 163,946,914IVB MIMAROPA 9,462,208 10,655,513 11,257,367
V BICOL 17,553,236 18,610,144 19,593,776VI WESTERN VISAYAS 29,943,157 31,914,065 34,866,877VII CENTRAL VISAYAS 60,962,052 69,564,413 80,077,738VIII EASTERN VISAYAS 12,226,347 13,250,673 14,917,286IX ZAMBOANGA PENINSULA 8,973,277 9,904,569 11,096,394X NORTHERN MINDANAO 16,595,092 18,400,480 20,911,604XI DAVAO REGION 23,253,248 27,248,255 31,457,971XII SOCCSKSARGEN 11,415,263 12,683,123 14,611,951XIII CARAGA 6,377,264 7,078,380 7,938,994
ARMM MUSLIM MINDANAO 5,911,386 6,230,292 6,809,438Source: National Statistical Coordination Board
REGIONAL ACCOUNTS OF THE PHILIPPINESUnit : In Thousand PesosTable 4.4.1B. GROSS VALUE ADDED IN R. ESTATE, RENTING & BUSINESS ACTIVITIES by Regi2010 TO 2012AT CONSTANT 2000 PRICES 588,947 638,244 686,430
2010 2011 2012
PHILIPPINES 588,947,091 638,243,916 686,430,000
NCR METRO MANILA 312,890,059 341,460,112 365,667,150 CAR CORDILLERA 8,820,215 9,304,237 9,948,479
I ILOCOS 12,880,818 13,775,922 14,724,937 II CAGAYAN VALLEY 6,291,368 6,585,216 6,931,371 III CENTRAL LUZON 39,689,226 42,144,073 45,166,782
IVA CALABARZON 78,233,176 85,362,809 93,113,498 IVB MIMAROPA 6,145,807 6,674,603 6,869,529
V BICOL 11,510,993 11,912,319 12,180,422 VI WESTERN VISAYAS 19,641,431 20,408,315 21,513,851 VII CENTRAL VISAYAS 37,716,327 41,357,944 45,593,661 VIII EASTERN VISAYAS 8,434,585 8,887,352 9,604,039 IX ZAMBOANGA PENINSULA 6,316,459 6,701,460 7,169,752 X NORTHERN MINDANAO 10,206,652 10,835,485 11,902,527 XI DAVAO REGION 15,005,686 16,803,346 18,616,667 XII SOCCSKSARGEN 7,717,427 8,241,699 9,107,486 XIII CARAGA 4,002,304 4,280,129 4,638,764
ARMM MUSLIM MINDANAO 3,444,556 3,508,893 3,681,087 Source: National Statistical Coordination Board
REGION / YEAR
REGION / YEAR
Note: Regional levels may not add up to the national totals due to rounding.
Page 53
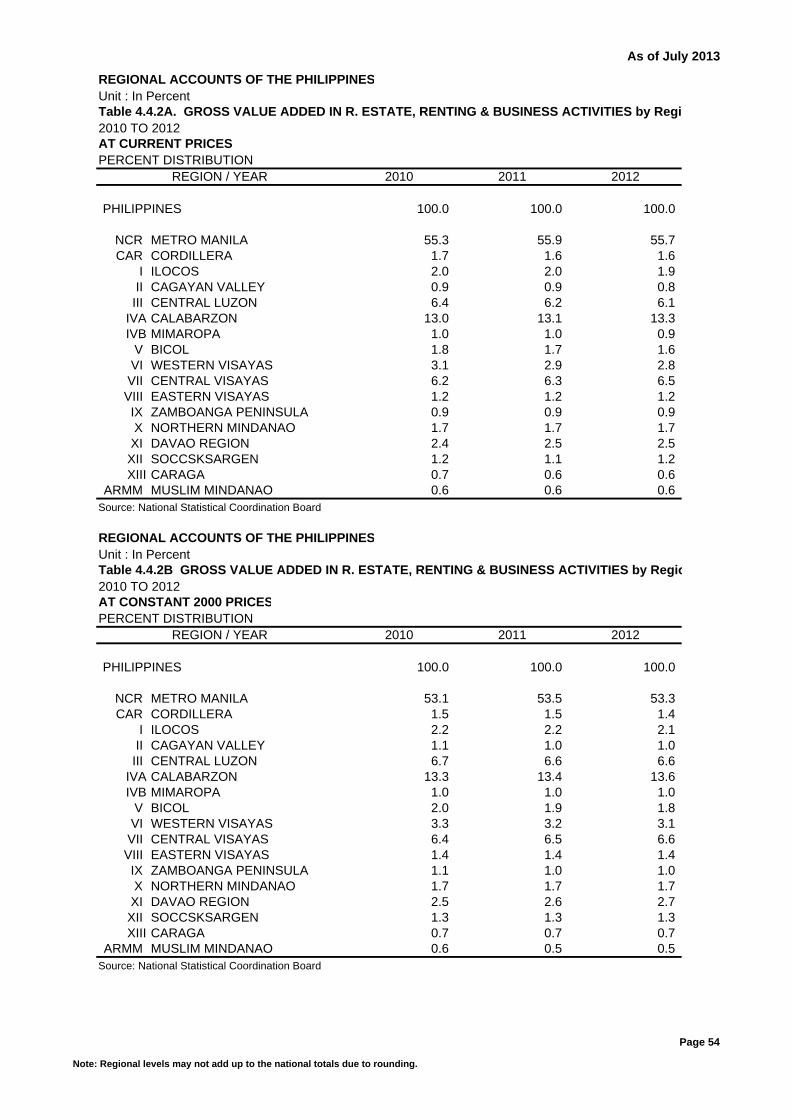
As of July 2013
REGIONAL ACCOUNTS OF THE PHILIPPINESUnit : In PercentTable 4.4.2A. GROSS VALUE ADDED IN R. ESTATE, RENTING & BUSINESS ACTIVITIES by Regi2010 TO 2012AT CURRENT PRICESPERCENT DISTRIBUTION
2010 2011 2012
PHILIPPINES 100.0 100.0 100.0
NCR METRO MANILA 55.3 55.9 55.7 CAR CORDILLERA 1.7 1.6 1.6
I ILOCOS 2.0 2.0 1.9 II CAGAYAN VALLEY 0.9 0.9 0.8 III CENTRAL LUZON 6.4 6.2 6.1
IVA CALABARZON 13.0 13.1 13.3 IVB MIMAROPA 1.0 1.0 0.9
V BICOL 1.8 1.7 1.6 VI WESTERN VISAYAS 3.1 2.9 2.8 VII CENTRAL VISAYAS 6.2 6.3 6.5 VIII EASTERN VISAYAS 1.2 1.2 1.2 IX ZAMBOANGA PENINSULA 0.9 0.9 0.9 X NORTHERN MINDANAO 1.7 1.7 1.7 XI DAVAO REGION 2.4 2.5 2.5 XII SOCCSKSARGEN 1.2 1.1 1.2 XIII CARAGA 0.7 0.6 0.6
ARMM MUSLIM MINDANAO 0.6 0.6 0.6 Source: National Statistical Coordination Board
REGIONAL ACCOUNTS OF THE PHILIPPINESUnit : In PercentTable 4.4.2B GROSS VALUE ADDED IN R. ESTATE, RENTING & BUSINESS ACTIVITIES by Regio2010 TO 2012AT CONSTANT 2000 PRICESPERCENT DISTRIBUTION
2010 2011 2012
PHILIPPINES 100.0 100.0 100.0
NCR METRO MANILA 53.1 53.5 53.3 CAR CORDILLERA 1.5 1.5 1.4
I ILOCOS 2.2 2.2 2.1 II CAGAYAN VALLEY 1.1 1.0 1.0 III CENTRAL LUZON 6.7 6.6 6.6
IVA CALABARZON 13.3 13.4 13.6 IVB MIMAROPA 1.0 1.0 1.0
V BICOL 2.0 1.9 1.8 VI WESTERN VISAYAS 3.3 3.2 3.1 VII CENTRAL VISAYAS 6.4 6.5 6.6 VIII EASTERN VISAYAS 1.4 1.4 1.4 IX ZAMBOANGA PENINSULA 1.1 1.0 1.0 X NORTHERN MINDANAO 1.7 1.7 1.7 XI DAVAO REGION 2.5 2.6 2.7 XII SOCCSKSARGEN 1.3 1.3 1.3 XIII CARAGA 0.7 0.7 0.7
ARMM MUSLIM MINDANAO 0.6 0.5 0.5 Source: National Statistical Coordination Board
REGION / YEAR
REGION / YEAR
Note: Regional levels may not add up to the national totals due to rounding.
Page 54

As of July 2013
REGIONAL ACCOUNTS OF THE PHILIPPINESUnit : In PercentTable 4.4.3A GROSS VALUE ADDED IN R. ESTATE, RENTING & BUSINESS ACTIVITIES by Regio2010 TO 2012AT CURRENT PRICESGROWTH RATES
10-11 11-12
PHILIPPINES 12.9 11.9
NCR METRO MANILA 14.0 11.5CAR CORDILLERA 8.5 10.6
I ILOCOS 11.9 11.0II CAGAYAN VALLEY 9.0 8.6III CENTRAL LUZON 9.7 11.1
IVA CALABARZON 13.3 13.4IVB MIMAROPA 12.6 5.6
V BICOL 6.0 5.3VI WESTERN VISAYAS 6.6 9.3VII CENTRAL VISAYAS 14.1 15.1VIII EASTERN VISAYAS 8.4 12.6IX ZAMBOANGA PENINSULA 10.4 12.0X NORTHERN MINDANAO 10.9 13.6XI DAVAO REGION 17.2 15.4XII SOCCSKSARGEN 11.1 15.2XIII CARAGA 11.0 12.2
ARMM MUSLIM MINDANAO 5.4 9.3Source: National Statistical Coordination Board
REGIONAL ACCOUNTS OF THE PHILIPPINESUnit : In PercentTable 4.4.3B GROSS VALUE ADDED IN R. ESTATE, RENTING & BUSINESS ACTIVITIES by Regio2010 TO 2012AT CONSTANT 2000 PRICESGROWTH RATES
10-11 11-12
PHILIPPINES 8.4 7.5
NCR METRO MANILA 9.1 7.1CAR CORDILLERA 5.5 6.9
I ILOCOS 6.9 6.9II CAGAYAN VALLEY 4.7 5.3III CENTRAL LUZON 6.2 7.2
IVA CALABARZON 9.1 9.1IVB MIMAROPA 8.6 2.9
V BICOL 3.5 2.3VI WESTERN VISAYAS 3.9 5.4VII CENTRAL VISAYAS 9.7 10.2VIII EASTERN VISAYAS 5.4 8.1IX ZAMBOANGA PENINSULA 6.1 7.0X NORTHERN MINDANAO 6.2 9.8XI DAVAO REGION 12.0 10.8XII SOCCSKSARGEN 6.8 10.5XIII CARAGA 6.9 8.4
ARMM MUSLIM MINDANAO 1.9 4.9Source: National Statistical Coordination Board
REGION / YEAR
REGION / YEAR
Note: Regional levels may not add up to the national totals due to rounding.
Page 55

As of July 2013
REGIONAL ACCOUNTS OF THE PHILIPPINES Base Year : 2000Table 4.4.4. GROSS VALUE ADDED IN R. ESTATE, RENTING & BUSINESS ACTIVITIES by Region2010 TO 2012IMPLICIT PRICE INDEX
2010 2011 2012
PHILIPPINES 166.3 173.2 180.1
NCR METRO MANILA 173.2 180.8 188.4CAR CORDILLERA 187.2 192.6 199.3
I ILOCOS 150.4 157.3 163.3II CAGAYAN VALLEY 139.4 145.2 149.8III CENTRAL LUZON 157.1 162.3 168.2
IVA CALABARZON 163.0 169.3 176.1IVB MIMAROPA 154.0 159.6 163.9
V BICOL 152.5 156.2 160.9VI WESTERN VISAYAS 152.4 156.4 162.1VII CENTRAL VISAYAS 161.6 168.2 175.6VIII EASTERN VISAYAS 145.0 149.1 155.3IX ZAMBOANGA PENINSULA 142.1 147.8 154.8X NORTHERN MINDANAO 162.6 169.8 175.7XI DAVAO REGION 155.0 162.2 169.0XII SOCCSKSARGEN 147.9 153.9 160.4XIII CARAGA 159.3 165.4 171.1
ARMM MUSLIM MINDANAO 171.6 177.6 185.0Source: National Statistical Coordination Board
REGION / YEAR
Note: Regional levels may not add up to the national totals due to rounding.
Page 56

As of July 2013
REGIONAL ACCOUNTS OF THE PHILIPPINESUnit : In Thousand PesosTable 4.5.1A. GROSS VALUE ADDED IN OTHER SERVICES by Region2010 TO 2012AT CURRENT PRICES 838,663 912,502 1,020,455
2010 2011 2012
PHILIPPINES 838,663,067 912,501,552 1,020,455,020
NCR METRO MANILA 398,331,687 427,516,529 489,406,192CAR CORDILLERA 15,819,896 17,743,315 19,463,405
I ILOCOS 29,865,829 33,487,470 35,860,739II CAGAYAN VALLEY 18,254,177 20,666,198 22,477,252III CENTRAL LUZON 48,336,775 54,407,231 59,302,461
IVA CALABARZON 63,568,616 67,708,544 73,571,186IVB MIMAROPA 14,532,383 15,841,929 17,335,018
V BICOL 19,786,139 22,302,523 23,599,108VI WESTERN VISAYAS 44,587,828 49,133,031 54,250,421VII CENTRAL VISAYAS 61,417,375 65,926,706 73,191,301VIII EASTERN VISAYAS 17,811,016 19,315,192 21,139,536IX ZAMBOANGA PENINSULA 17,102,161 19,602,651 21,929,815X NORTHERN MINDANAO 24,839,518 26,894,622 29,530,540XI DAVAO REGION 29,884,132 34,033,505 38,032,768XII SOCCSKSARGEN 19,930,661 21,635,422 23,952,978XIII CARAGA 10,679,210 12,014,988 12,651,606
ARMM MUSLIM MINDANAO 3,915,663 4,271,697 4,760,692Source: National Statistical Coordination Board
REGIONAL ACCOUNTS OF THE PHILIPPINESUnit : In Thousand PesosTable 4.5.1B. GROSS VALUE ADDED IN OTHER SERVICES by Region2010 TO 2012AT CONSTANT 2000 PRICES 584,100 616,791 664,573
2010 2011 2012
PHILIPPINES 584,099,853 616,790,981 664,572,621
NCR METRO MANILA 272,033,082 286,716,352 317,900,172 CAR CORDILLERA 11,251,354 12,227,758 12,945,739
I ILOCOS 21,548,897 22,689,833 23,670,041 II CAGAYAN VALLEY 13,296,967 14,657,176 15,322,302 III CENTRAL LUZON 35,322,107 36,715,514 38,001,895
IVA CALABARZON 48,011,881 48,899,248 51,671,614 IVB MIMAROPA 10,635,061 11,247,606 11,790,613
V BICOL 14,426,261 15,434,938 15,729,753 VI WESTERN VISAYAS 31,561,440 33,677,529 35,290,454 VII CENTRAL VISAYAS 41,621,434 44,127,108 47,063,219 VIII EASTERN VISAYAS 11,693,203 12,537,454 13,062,448 IX ZAMBOANGA PENINSULA 11,951,378 13,265,108 14,195,310 X NORTHERN MINDANAO 17,575,327 18,499,618 19,316,800 XI DAVAO REGION 20,256,486 22,050,119 23,474,192 XII SOCCSKSARGEN 13,150,407 13,553,395 14,363,135 XIII CARAGA 7,078,658 7,636,162 7,738,580
ARMM MUSLIM MINDANAO 2,685,912 2,856,065 3,036,355
Source: National Statistical Coordination Board
Note: Revised to incorporate Business Process Outsourcing (BPO) which includes Contact Centers, under Business Services.
REGION / YEAR
REGION / YEAR
Note: Regional levels may not add up to the national totals due to rounding.
Page 57
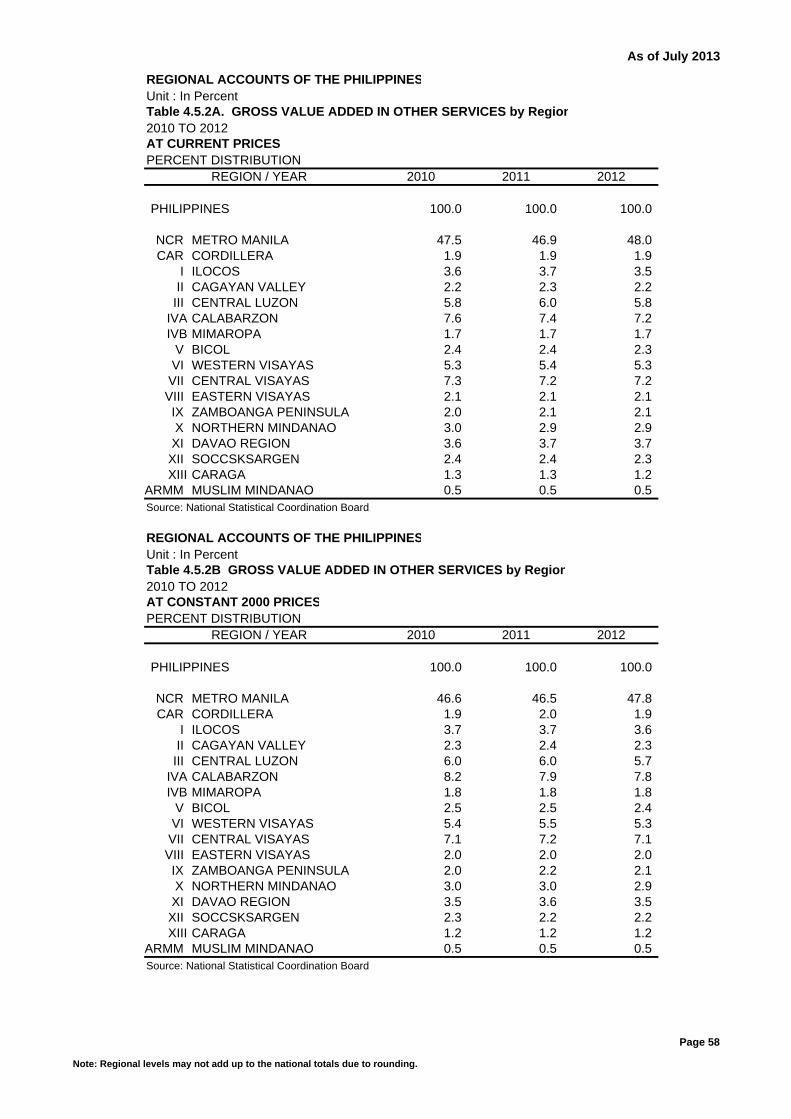
As of July 2013
REGIONAL ACCOUNTS OF THE PHILIPPINESUnit : In PercentTable 4.5.2A. GROSS VALUE ADDED IN OTHER SERVICES by Region2010 TO 2012AT CURRENT PRICESPERCENT DISTRIBUTION
2010 2011 2012
PHILIPPINES 100.0 100.0 100.0
NCR METRO MANILA 47.5 46.9 48.0 CAR CORDILLERA 1.9 1.9 1.9
I ILOCOS 3.6 3.7 3.5 II CAGAYAN VALLEY 2.2 2.3 2.2 III CENTRAL LUZON 5.8 6.0 5.8
IVA CALABARZON 7.6 7.4 7.2 IVB MIMAROPA 1.7 1.7 1.7
V BICOL 2.4 2.4 2.3 VI WESTERN VISAYAS 5.3 5.4 5.3 VII CENTRAL VISAYAS 7.3 7.2 7.2 VIII EASTERN VISAYAS 2.1 2.1 2.1 IX ZAMBOANGA PENINSULA 2.0 2.1 2.1 X NORTHERN MINDANAO 3.0 2.9 2.9 XI DAVAO REGION 3.6 3.7 3.7 XII SOCCSKSARGEN 2.4 2.4 2.3 XIII CARAGA 1.3 1.3 1.2
ARMM MUSLIM MINDANAO 0.5 0.5 0.5 Source: National Statistical Coordination Board
REGIONAL ACCOUNTS OF THE PHILIPPINESUnit : In PercentTable 4.5.2B GROSS VALUE ADDED IN OTHER SERVICES by Region2010 TO 2012AT CONSTANT 2000 PRICESPERCENT DISTRIBUTION
2010 2011 2012
PHILIPPINES 100.0 100.0 100.0
NCR METRO MANILA 46.6 46.5 47.8 CAR CORDILLERA 1.9 2.0 1.9
I ILOCOS 3.7 3.7 3.6 II CAGAYAN VALLEY 2.3 2.4 2.3 III CENTRAL LUZON 6.0 6.0 5.7
IVA CALABARZON 8.2 7.9 7.8 IVB MIMAROPA 1.8 1.8 1.8
V BICOL 2.5 2.5 2.4 VI WESTERN VISAYAS 5.4 5.5 5.3 VII CENTRAL VISAYAS 7.1 7.2 7.1 VIII EASTERN VISAYAS 2.0 2.0 2.0 IX ZAMBOANGA PENINSULA 2.0 2.2 2.1 X NORTHERN MINDANAO 3.0 3.0 2.9 XI DAVAO REGION 3.5 3.6 3.5 XII SOCCSKSARGEN 2.3 2.2 2.2 XIII CARAGA 1.2 1.2 1.2
ARMM MUSLIM MINDANAO 0.5 0.5 0.5 Source: National Statistical Coordination Board
REGION / YEAR
REGION / YEAR
Note: Regional levels may not add up to the national totals due to rounding.
Page 58
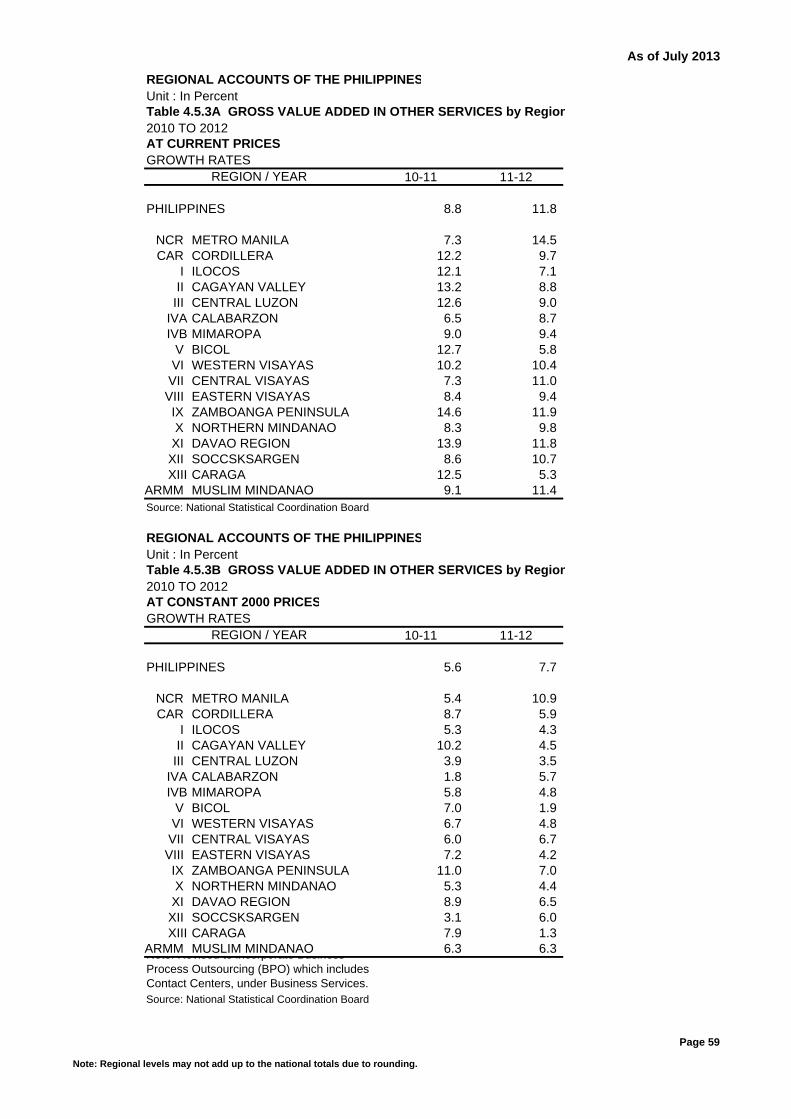
As of July 2013
REGIONAL ACCOUNTS OF THE PHILIPPINESUnit : In PercentTable 4.5.3A GROSS VALUE ADDED IN OTHER SERVICES by Region2010 TO 2012AT CURRENT PRICESGROWTH RATES
10-11 11-12
PHILIPPINES 8.8 11.8
NCR METRO MANILA 7.3 14.5CAR CORDILLERA 12.2 9.7
I ILOCOS 12.1 7.1II CAGAYAN VALLEY 13.2 8.8III CENTRAL LUZON 12.6 9.0
IVA CALABARZON 6.5 8.7IVB MIMAROPA 9.0 9.4
V BICOL 12.7 5.8VI WESTERN VISAYAS 10.2 10.4VII CENTRAL VISAYAS 7.3 11.0VIII EASTERN VISAYAS 8.4 9.4IX ZAMBOANGA PENINSULA 14.6 11.9X NORTHERN MINDANAO 8.3 9.8XI DAVAO REGION 13.9 11.8XII SOCCSKSARGEN 8.6 10.7XIII CARAGA 12.5 5.3
ARMM MUSLIM MINDANAO 9.1 11.4Source: National Statistical Coordination Board
REGIONAL ACCOUNTS OF THE PHILIPPINESUnit : In PercentTable 4.5.3B GROSS VALUE ADDED IN OTHER SERVICES by Region2010 TO 2012AT CONSTANT 2000 PRICESGROWTH RATES
10-11 11-12
PHILIPPINES 5.6 7.7
NCR METRO MANILA 5.4 10.9CAR CORDILLERA 8.7 5.9
I ILOCOS 5.3 4.3II CAGAYAN VALLEY 10.2 4.5III CENTRAL LUZON 3.9 3.5
IVA CALABARZON 1.8 5.7IVB MIMAROPA 5.8 4.8
V BICOL 7.0 1.9VI WESTERN VISAYAS 6.7 4.8VII CENTRAL VISAYAS 6.0 6.7VIII EASTERN VISAYAS 7.2 4.2IX ZAMBOANGA PENINSULA 11.0 7.0X NORTHERN MINDANAO 5.3 4.4XI DAVAO REGION 8.9 6.5XII SOCCSKSARGEN 3.1 6.0XIII CARAGA 7.9 1.3
ARMM MUSLIM MINDANAO 6.3 6.3
Source: National Statistical Coordination Board
REGION / YEAR
Note: Revised to incorporate Business Process Outsourcing (BPO) which includes Contact Centers, under Business Services.
REGION / YEAR
Note: Regional levels may not add up to the national totals due to rounding.
Page 59

As of July 2013
REGIONAL ACCOUNTS OF THE PHILIPPINES Base Year : 2000Table 4.5.4. GROSS VALUE ADDED IN OTHER SERVICES by Region2010 TO 2012IMPLICIT PRICE INDEX
2010 2011 2012
PHILIPPINES 143.6 147.9 153.6
NCR METRO MANILA 146.4 149.1 153.9CAR CORDILLERA 140.6 145.1 150.3
I ILOCOS 138.6 147.6 151.5II CAGAYAN VALLEY 137.3 141.0 146.7III CENTRAL LUZON 136.8 148.2 156.1
IVA CALABARZON 132.4 138.5 142.4IVB MIMAROPA 136.6 140.8 147.0
V BICOL 137.2 144.5 150.0VI WESTERN VISAYAS 141.3 145.9 153.7VII CENTRAL VISAYAS 147.6 149.4 155.5VIII EASTERN VISAYAS 152.3 154.1 161.8IX ZAMBOANGA PENINSULA 143.1 147.8 154.5X NORTHERN MINDANAO 141.3 145.4 152.9XI DAVAO REGION 147.5 154.3 162.0XII SOCCSKSARGEN 151.6 159.6 166.8XIII CARAGA 150.9 157.3 163.5
ARMM MUSLIM MINDANAO 145.8 149.6 156.8Source: National Statistical Coordination Board
REGION / YEAR
Note: Regional levels may not add up to the national totals due to rounding.
Page 60
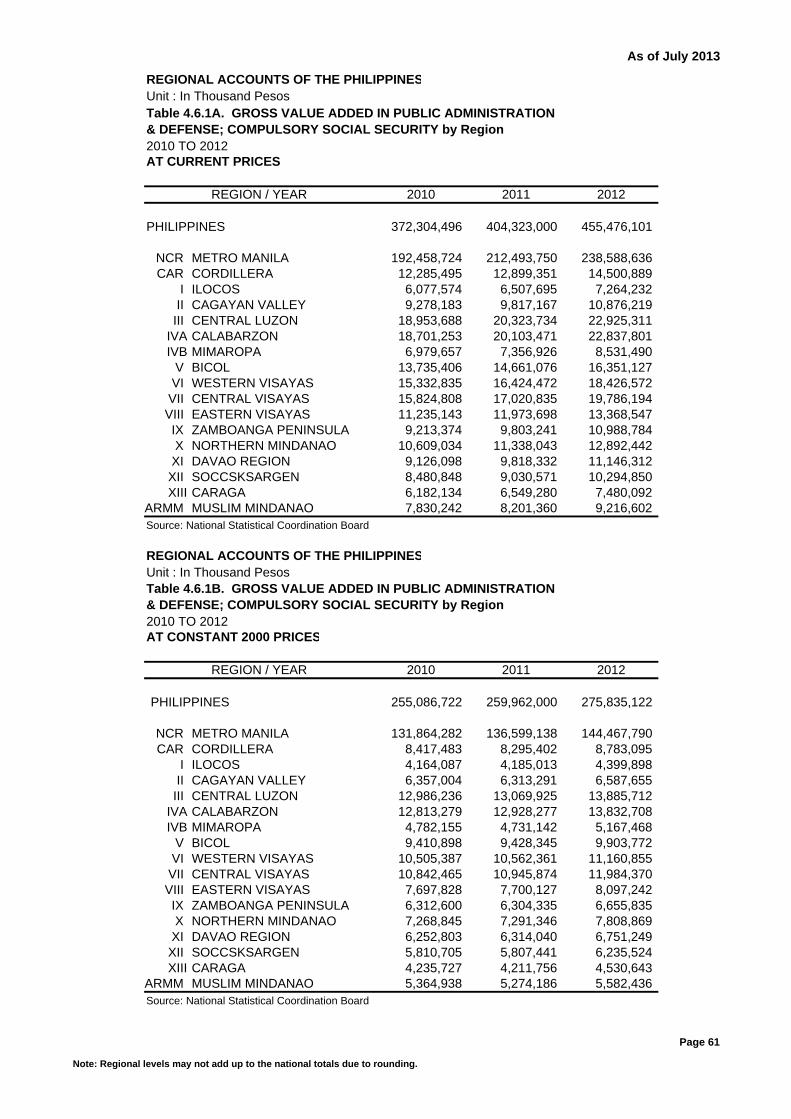
As of July 2013
REGIONAL ACCOUNTS OF THE PHILIPPINESUnit : In Thousand Pesos
2010 TO 2012AT CURRENT PRICES 372,304 404,323 455,476
2010 2011 2012
PHILIPPINES 372,304,496 404,323,000 455,476,101
NCR METRO MANILA 192,458,724 212,493,750 238,588,636CAR CORDILLERA 12,285,495 12,899,351 14,500,889
I ILOCOS 6,077,574 6,507,695 7,264,232II CAGAYAN VALLEY 9,278,183 9,817,167 10,876,219III CENTRAL LUZON 18,953,688 20,323,734 22,925,311
IVA CALABARZON 18,701,253 20,103,471 22,837,801IVB MIMAROPA 6,979,657 7,356,926 8,531,490
V BICOL 13,735,406 14,661,076 16,351,127VI WESTERN VISAYAS 15,332,835 16,424,472 18,426,572VII CENTRAL VISAYAS 15,824,808 17,020,835 19,786,194VIII EASTERN VISAYAS 11,235,143 11,973,698 13,368,547IX ZAMBOANGA PENINSULA 9,213,374 9,803,241 10,988,784X NORTHERN MINDANAO 10,609,034 11,338,043 12,892,442XI DAVAO REGION 9,126,098 9,818,332 11,146,312XII SOCCSKSARGEN 8,480,848 9,030,571 10,294,850XIII CARAGA 6,182,134 6,549,280 7,480,092
ARMM MUSLIM MINDANAO 7,830,242 8,201,360 9,216,602Source: National Statistical Coordination Board
REGIONAL ACCOUNTS OF THE PHILIPPINESUnit : In Thousand Pesos
2010 TO 2012AT CONSTANT 2000 PRICES 255,087 259,962 275,835
2010 2011 2012
PHILIPPINES 255,086,722 259,962,000 275,835,122
NCR METRO MANILA 131,864,282 136,599,138 144,467,790 CAR CORDILLERA 8,417,483 8,295,402 8,783,095
I ILOCOS 4,164,087 4,185,013 4,399,898 II CAGAYAN VALLEY 6,357,004 6,313,291 6,587,655 III CENTRAL LUZON 12,986,236 13,069,925 13,885,712
IVA CALABARZON 12,813,279 12,928,277 13,832,708 IVB MIMAROPA 4,782,155 4,731,142 5,167,468
V BICOL 9,410,898 9,428,345 9,903,772 VI WESTERN VISAYAS 10,505,387 10,562,361 11,160,855 VII CENTRAL VISAYAS 10,842,465 10,945,874 11,984,370 VIII EASTERN VISAYAS 7,697,828 7,700,127 8,097,242 IX ZAMBOANGA PENINSULA 6,312,600 6,304,335 6,655,835 X NORTHERN MINDANAO 7,268,845 7,291,346 7,808,869 XI DAVAO REGION 6,252,803 6,314,040 6,751,249 XII SOCCSKSARGEN 5,810,705 5,807,441 6,235,524 XIII CARAGA 4,235,727 4,211,756 4,530,643
ARMM MUSLIM MINDANAO 5,364,938 5,274,186 5,582,436 Source: National Statistical Coordination Board
REGION / YEAR
REGION / YEAR
Table 4.6.1A. GROSS VALUE ADDED IN PUBLIC ADMINISTRATION & DEFENSE; COMPULSORY SOCIAL SECURITY by Region
Table 4.6.1B. GROSS VALUE ADDED IN PUBLIC ADMINISTRATION & DEFENSE; COMPULSORY SOCIAL SECURITY by Region
Note: Regional levels may not add up to the national totals due to rounding.
Page 61
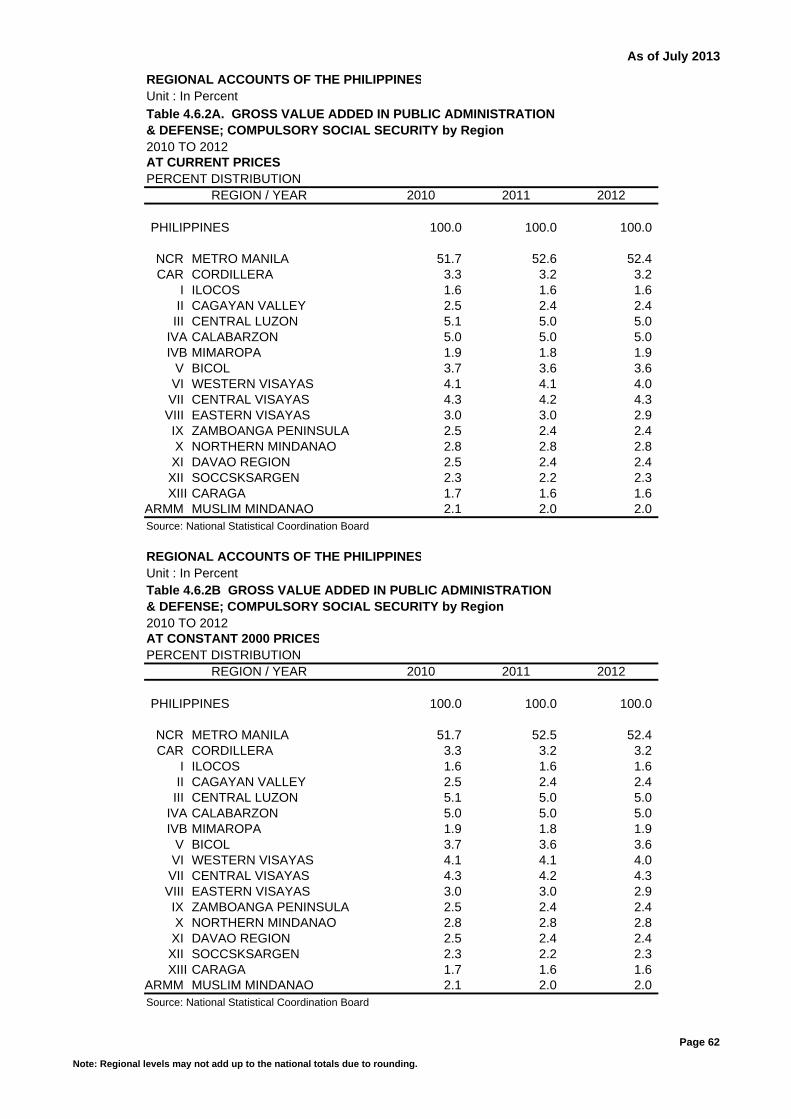
As of July 2013
REGIONAL ACCOUNTS OF THE PHILIPPINESUnit : In Percent
2010 TO 2012AT CURRENT PRICESPERCENT DISTRIBUTION
2010 2011 2012
PHILIPPINES 100.0 100.0 100.0
NCR METRO MANILA 51.7 52.6 52.4 CAR CORDILLERA 3.3 3.2 3.2
I ILOCOS 1.6 1.6 1.6 II CAGAYAN VALLEY 2.5 2.4 2.4 III CENTRAL LUZON 5.1 5.0 5.0
IVA CALABARZON 5.0 5.0 5.0 IVB MIMAROPA 1.9 1.8 1.9
V BICOL 3.7 3.6 3.6 VI WESTERN VISAYAS 4.1 4.1 4.0 VII CENTRAL VISAYAS 4.3 4.2 4.3 VIII EASTERN VISAYAS 3.0 3.0 2.9 IX ZAMBOANGA PENINSULA 2.5 2.4 2.4 X NORTHERN MINDANAO 2.8 2.8 2.8 XI DAVAO REGION 2.5 2.4 2.4 XII SOCCSKSARGEN 2.3 2.2 2.3 XIII CARAGA 1.7 1.6 1.6
ARMM MUSLIM MINDANAO 2.1 2.0 2.0 Source: National Statistical Coordination Board
REGIONAL ACCOUNTS OF THE PHILIPPINESUnit : In Percent
2010 TO 2012AT CONSTANT 2000 PRICESPERCENT DISTRIBUTION
2010 2011 2012
PHILIPPINES 100.0 100.0 100.0
NCR METRO MANILA 51.7 52.5 52.4 CAR CORDILLERA 3.3 3.2 3.2
I ILOCOS 1.6 1.6 1.6 II CAGAYAN VALLEY 2.5 2.4 2.4 III CENTRAL LUZON 5.1 5.0 5.0
IVA CALABARZON 5.0 5.0 5.0 IVB MIMAROPA 1.9 1.8 1.9
V BICOL 3.7 3.6 3.6 VI WESTERN VISAYAS 4.1 4.1 4.0 VII CENTRAL VISAYAS 4.3 4.2 4.3 VIII EASTERN VISAYAS 3.0 3.0 2.9 IX ZAMBOANGA PENINSULA 2.5 2.4 2.4 X NORTHERN MINDANAO 2.8 2.8 2.8 XI DAVAO REGION 2.5 2.4 2.4 XII SOCCSKSARGEN 2.3 2.2 2.3 XIII CARAGA 1.7 1.6 1.6
ARMM MUSLIM MINDANAO 2.1 2.0 2.0 Source: National Statistical Coordination Board
REGION / YEAR
REGION / YEAR
Table 4.6.2A. GROSS VALUE ADDED IN PUBLIC ADMINISTRATION & DEFENSE; COMPULSORY SOCIAL SECURITY by Region
Table 4.6.2B GROSS VALUE ADDED IN PUBLIC ADMINISTRATION & DEFENSE; COMPULSORY SOCIAL SECURITY by Region
Note: Regional levels may not add up to the national totals due to rounding.
Page 62
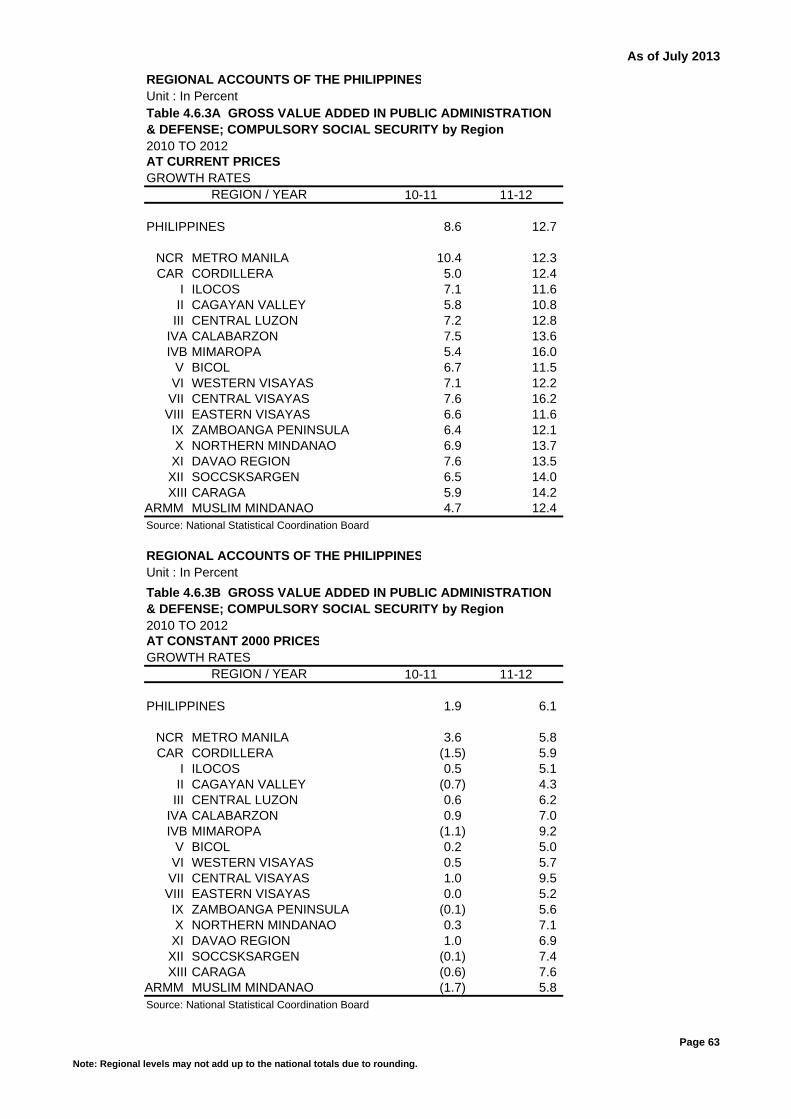
As of July 2013
REGIONAL ACCOUNTS OF THE PHILIPPINESUnit : In Percent
2010 TO 2012AT CURRENT PRICESGROWTH RATES
10-11 11-12
PHILIPPINES 8.6 12.7
NCR METRO MANILA 10.4 12.3CAR CORDILLERA 5.0 12.4
I ILOCOS 7.1 11.6II CAGAYAN VALLEY 5.8 10.8III CENTRAL LUZON 7.2 12.8
IVA CALABARZON 7.5 13.6IVB MIMAROPA 5.4 16.0
V BICOL 6.7 11.5VI WESTERN VISAYAS 7.1 12.2VII CENTRAL VISAYAS 7.6 16.2VIII EASTERN VISAYAS 6.6 11.6IX ZAMBOANGA PENINSULA 6.4 12.1X NORTHERN MINDANAO 6.9 13.7XI DAVAO REGION 7.6 13.5XII SOCCSKSARGEN 6.5 14.0XIII CARAGA 5.9 14.2
ARMM MUSLIM MINDANAO 4.7 12.4Source: National Statistical Coordination Board
REGIONAL ACCOUNTS OF THE PHILIPPINESUnit : In Percent
2010 TO 2012AT CONSTANT 2000 PRICESGROWTH RATES
10-11 11-12
PHILIPPINES 1.9 6.1
NCR METRO MANILA 3.6 5.8CAR CORDILLERA (1.5) 5.9
I ILOCOS 0.5 5.1II CAGAYAN VALLEY (0.7) 4.3III CENTRAL LUZON 0.6 6.2
IVA CALABARZON 0.9 7.0IVB MIMAROPA (1.1) 9.2
V BICOL 0.2 5.0VI WESTERN VISAYAS 0.5 5.7VII CENTRAL VISAYAS 1.0 9.5VIII EASTERN VISAYAS 0.0 5.2IX ZAMBOANGA PENINSULA (0.1) 5.6X NORTHERN MINDANAO 0.3 7.1XI DAVAO REGION 1.0 6.9XII SOCCSKSARGEN (0.1) 7.4XIII CARAGA (0.6) 7.6
ARMM MUSLIM MINDANAO (1.7) 5.8Source: National Statistical Coordination Board
REGION / YEAR
REGION / YEAR
Table 4.6.3A GROSS VALUE ADDED IN PUBLIC ADMINISTRATION & DEFENSE; COMPULSORY SOCIAL SECURITY by Region
Table 4.6.3B GROSS VALUE ADDED IN PUBLIC ADMINISTRATION & DEFENSE; COMPULSORY SOCIAL SECURITY by Region
Note: Regional levels may not add up to the national totals due to rounding.
Page 63
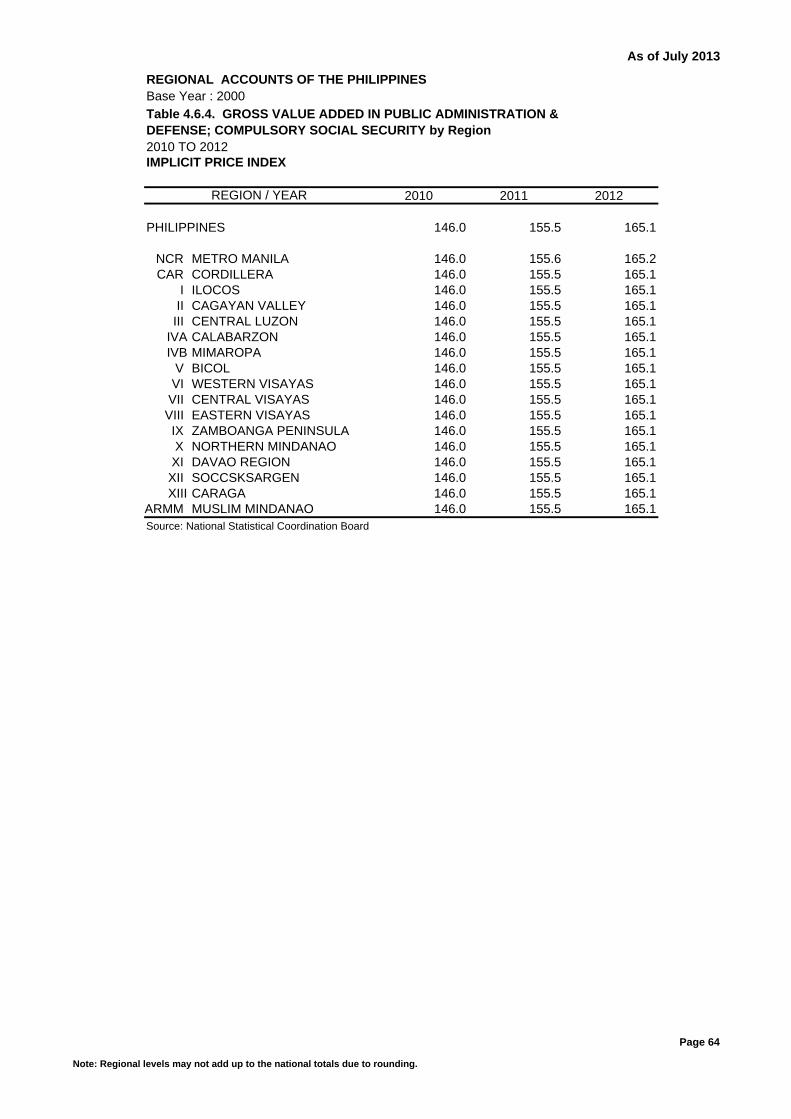
As of July 2013
REGIONAL ACCOUNTS OF THE PHILIPPINES Base Year : 2000
2010 TO 2012IMPLICIT PRICE INDEX
2010 2011 2012
PHILIPPINES 146.0 155.5 165.1
NCR METRO MANILA 146.0 155.6 165.2CAR CORDILLERA 146.0 155.5 165.1
I ILOCOS 146.0 155.5 165.1II CAGAYAN VALLEY 146.0 155.5 165.1III CENTRAL LUZON 146.0 155.5 165.1
IVA CALABARZON 146.0 155.5 165.1IVB MIMAROPA 146.0 155.5 165.1
V BICOL 146.0 155.5 165.1VI WESTERN VISAYAS 146.0 155.5 165.1VII CENTRAL VISAYAS 146.0 155.5 165.1VIII EASTERN VISAYAS 146.0 155.5 165.1IX ZAMBOANGA PENINSULA 146.0 155.5 165.1X NORTHERN MINDANAO 146.0 155.5 165.1XI DAVAO REGION 146.0 155.5 165.1XII SOCCSKSARGEN 146.0 155.5 165.1XIII CARAGA 146.0 155.5 165.1
ARMM MUSLIM MINDANAO 146.0 155.5 165.1Source: National Statistical Coordination Board
REGION / YEAR
Table 4.6.4. GROSS VALUE ADDED IN PUBLIC ADMINISTRATION & DEFENSE; COMPULSORY SOCIAL SECURITY by Region
Note: Regional levels may not add up to the national totals due to rounding.
Page 64

As of July 2013
REGIONAL ACCOUNTS OF THE PHILIPPINES Unit : In PesosTable 5.1A. PER CAPITA GROSS REGIONAL DOMESTIC PRODUCT2010 TO 2012AT CURRENT PRICES
2010 2011 2012
PHILIPPINES 97,227 103,056 110,314
NCR METRO MANILA 271,255 286,458 312,137CAR CORDILLERA 122,449 127,227 126,843
I ILOCOS 58,808 62,186 67,030II CAGAYAN VALLEY 46,216 50,678 56,592III CENTRAL LUZON 78,218 85,473 90,822
IVA CALABARZON 123,292 126,217 132,899IVB MIMAROPA 57,805 62,055 63,415
V BICOL 34,210 36,185 38,870VI WESTERN VISAYAS 49,196 53,802 57,801VII CENTRAL VISAYAS 78,983 85,284 94,671VIII EASTERN VISAYAS 55,082 57,873 54,236IX ZAMBOANGA PENINSULA 53,822 56,863 61,324X NORTHERN MINDANAO 79,901 86,447 91,654XI DAVAO REGION 83,721 89,156 91,312XII SOCCSKSARGEN 60,204 64,782 69,663XIII CARAGA 40,345 43,935 48,954
ARMM MUSLIM MINDANAO 25,642 26,617 27,819Source: National Statistical Coordination Board
REGIONAL ACCOUNTS OF THE PHILIPPINESUnit : In PesosTable 5.1B. PER CAPITA GROSS REGIONAL DOMESTIC PRODUCT2010 TO 2012AT CONSTANT 2000 PRICES
2010 2011 2012
PHILIPPINES 61,570 62,739 65,904
NCR METRO MANILA 171,442 173,975 183,747 CAR CORDILLERA 74,107 73,945 73,573
I ILOCOS 37,819 38,287 39,806 II CAGAYAN VALLEY 30,851 32,167 34,364 III CENTRAL LUZON 50,207 52,766 55,072
IVA CALABARZON 79,699 78,966 82,393 IVB MIMAROPA 37,002 37,540 38,514
V BICOL 21,004 21,112 22,312 VI WESTERN VISAYAS 31,927 33,499 35,559 VII CENTRAL VISAYAS 49,966 52,528 56,507 VIII EASTERN VISAYAS 36,694 37,006 34,305 IX ZAMBOANGA PENINSULA 34,245 33,726 37,284 X NORTHERN MINDANAO 48,940 50,838 53,632 XI DAVAO REGION 48,487 49,431 52,201 XII SOCCSKSARGEN 36,688 37,813 40,043 XIII CARAGA 26,504 28,362 30,951
ARMM MUSLIM MINDANAO 14,588 14,348 14,321 Source: National Statistical Coordination Board
REGION / YEAR
REGION / YEAR
Note: Regional levels may not add up to the national totals due to rounding.
Page 65

As of July 2013
REGIONAL ACCOUNTS OF THE PHILIPPINESUnit : In PercentTable 5.2A. PER CAPITA INDEX WITH REFERENCE TO THE NATIONAL AVERAGE2010 TO 2012AT CURRENT PRICES
2010 2011 2012
PHILIPPINES 100.0 100.0 100.0
NCR METRO MANILA 279.0 278.0 283.0 CAR CORDILLERA 125.9 123.5 115.0
I ILOCOS 60.5 60.3 60.8 II CAGAYAN VALLEY 47.5 49.2 51.3 III CENTRAL LUZON 80.4 82.9 82.3
IVA CALABARZON 126.8 122.5 120.5 IVB MIMAROPA 59.5 60.2 57.5
V BICOL 35.2 35.1 35.2 VI WESTERN VISAYAS 50.6 52.2 52.4 VII CENTRAL VISAYAS 81.2 82.8 85.8 VIII EASTERN VISAYAS 56.7 56.2 49.2 IX ZAMBOANGA PENINSULA 55.4 55.2 55.6 X NORTHERN MINDANAO 82.2 83.9 83.1 XI DAVAO REGION 86.1 86.5 82.8 XII SOCCSKSARGEN 61.9 62.9 63.2 XIII CARAGA 41.5 42.6 44.4
ARMM MUSLIM MINDANAO 26.4 25.8 25.2 Source: National Statistical Coordination Board
REGIONAL ACCOUNTS OF THE PHILIPPINESUnit : In PercentTable 5.2B PER CAPITA INDEX WITH REFERENCE TO THE NATIONAL AVERAGE2010 TO 2012AT CONSTANT 2000 PRICES
2010 2011 2012
PHILIPPINES 100.0 100.0 100.0
NCR METRO MANILA 278.5 277.3 278.8 CAR CORDILLERA 120.4 117.9 111.6
I ILOCOS 61.4 61.0 60.4 II CAGAYAN VALLEY 50.1 51.3 52.1 III CENTRAL LUZON 81.5 84.1 83.6
IVA CALABARZON 129.4 125.9 125.0 IVB MIMAROPA 60.1 59.8 58.4
V BICOL 34.1 33.7 33.9 VI WESTERN VISAYAS 51.9 53.4 54.0 VII CENTRAL VISAYAS 81.2 83.7 85.7 VIII EASTERN VISAYAS 59.6 59.0 52.1 IX ZAMBOANGA PENINSULA 55.6 53.8 56.6 X NORTHERN MINDANAO 79.5 81.0 81.4 XI DAVAO REGION 78.8 78.8 79.2 XII SOCCSKSARGEN 59.6 60.3 60.8 XIII CARAGA 43.0 45.2 47.0
ARMM MUSLIM MINDANAO 23.7 22.9 21.7 Source: National Statistical Coordination Board
REGION / YEAR
REGION / YEAR
Note: Regional levels may not add up to the national totals due to rounding.
Page 66
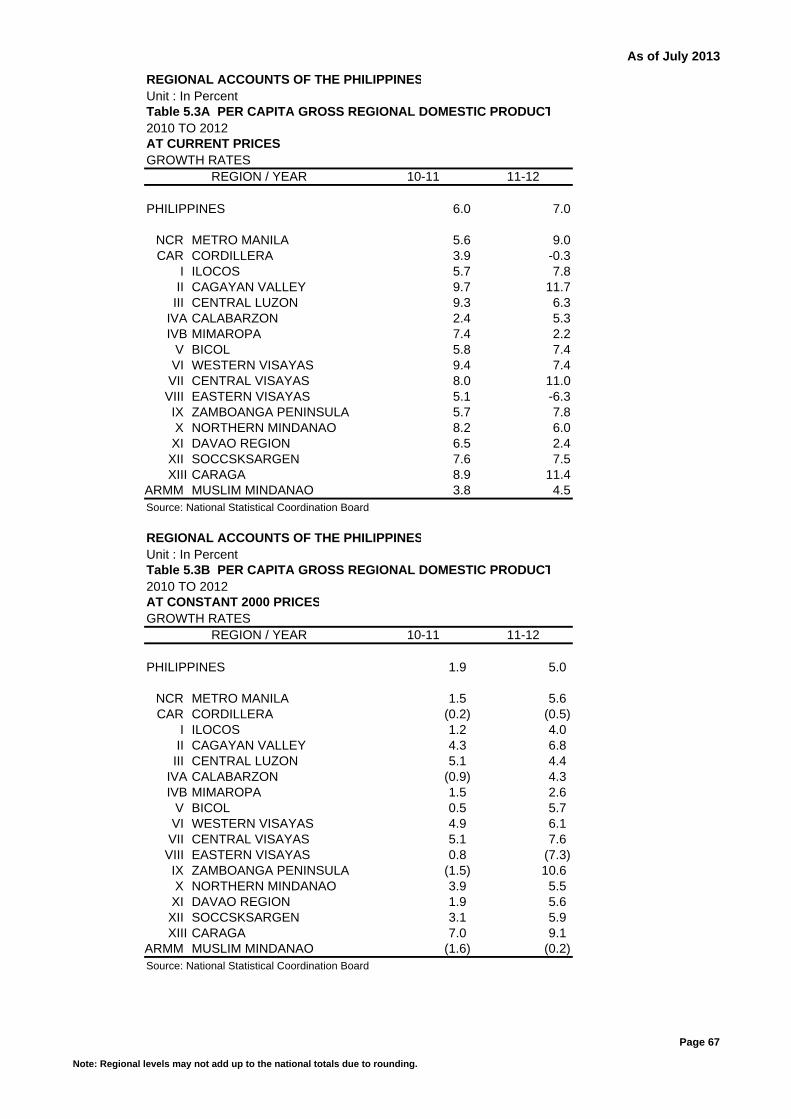
As of July 2013
REGIONAL ACCOUNTS OF THE PHILIPPINESUnit : In PercentTable 5.3A PER CAPITA GROSS REGIONAL DOMESTIC PRODUCT2010 TO 2012AT CURRENT PRICESGROWTH RATES
10-11 11-12
PHILIPPINES 6.0 7.0
NCR METRO MANILA 5.6 9.0CAR CORDILLERA 3.9 -0.3
I ILOCOS 5.7 7.8II CAGAYAN VALLEY 9.7 11.7III CENTRAL LUZON 9.3 6.3
IVA CALABARZON 2.4 5.3IVB MIMAROPA 7.4 2.2
V BICOL 5.8 7.4VI WESTERN VISAYAS 9.4 7.4VII CENTRAL VISAYAS 8.0 11.0VIII EASTERN VISAYAS 5.1 -6.3IX ZAMBOANGA PENINSULA 5.7 7.8X NORTHERN MINDANAO 8.2 6.0XI DAVAO REGION 6.5 2.4XII SOCCSKSARGEN 7.6 7.5XIII CARAGA 8.9 11.4
ARMM MUSLIM MINDANAO 3.8 4.5Source: National Statistical Coordination Board
REGIONAL ACCOUNTS OF THE PHILIPPINESUnit : In PercentTable 5.3B PER CAPITA GROSS REGIONAL DOMESTIC PRODUCT2010 TO 2012AT CONSTANT 2000 PRICESGROWTH RATES
10-11 11-12
PHILIPPINES 1.9 5.0
NCR METRO MANILA 1.5 5.6 CAR CORDILLERA (0.2) (0.5)
I ILOCOS 1.2 4.0 II CAGAYAN VALLEY 4.3 6.8 III CENTRAL LUZON 5.1 4.4
IVA CALABARZON (0.9) 4.3 IVB MIMAROPA 1.5 2.6
V BICOL 0.5 5.7 VI WESTERN VISAYAS 4.9 6.1 VII CENTRAL VISAYAS 5.1 7.6 VIII EASTERN VISAYAS 0.8 (7.3) IX ZAMBOANGA PENINSULA (1.5) 10.6 X NORTHERN MINDANAO 3.9 5.5 XI DAVAO REGION 1.9 5.6 XII SOCCSKSARGEN 3.1 5.9 XIII CARAGA 7.0 9.1
ARMM MUSLIM MINDANAO (1.6) (0.2) Source: National Statistical Coordination Board
REGION / YEAR
REGION / YEAR
Note: Regional levels may not add up to the national totals due to rounding.
Page 67
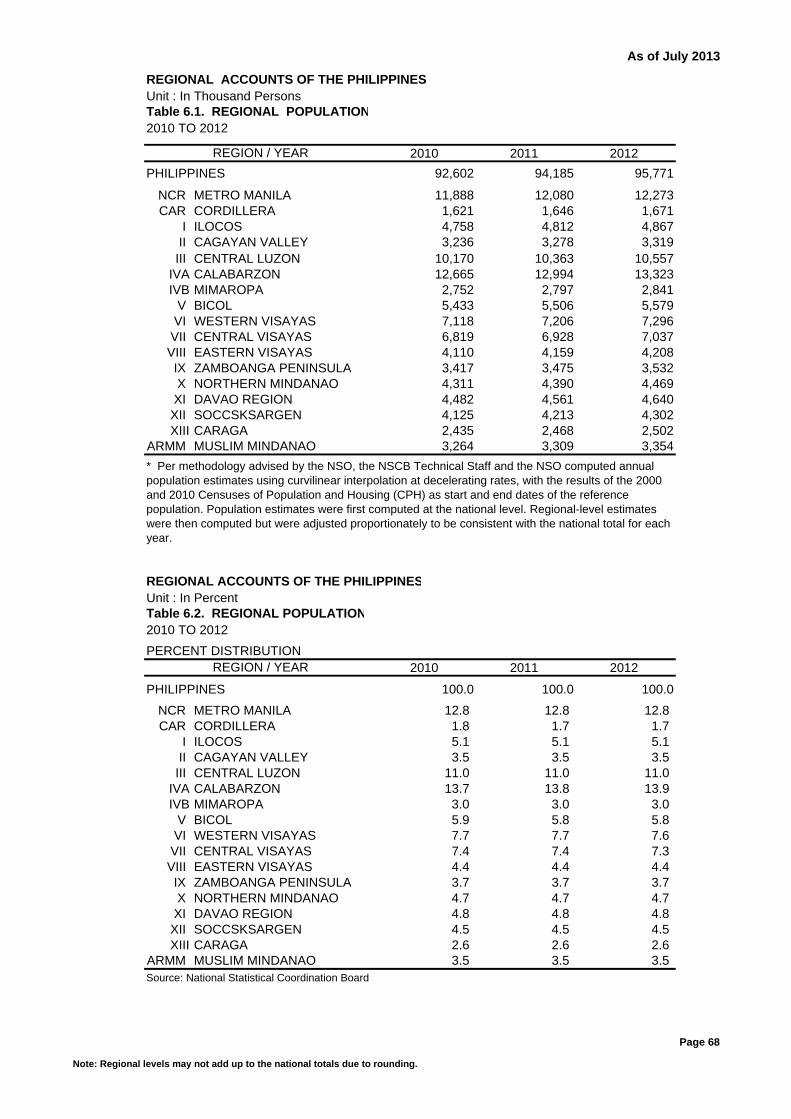
As of July 2013
REGIONAL ACCOUNTS OF THE PHILIPPINES Unit : In Thousand PersonsTable 6.1. REGIONAL POPULATION2010 TO 2012
2010 2011 2012
PHILIPPINES 92,602 94,185 95,771
NCR METRO MANILA 11,888 12,080 12,273CAR CORDILLERA 1,621 1,646 1,671
I ILOCOS 4,758 4,812 4,867II CAGAYAN VALLEY 3,236 3,278 3,319III CENTRAL LUZON 10,170 10,363 10,557
IVA CALABARZON 12,665 12,994 13,323IVB MIMAROPA 2,752 2,797 2,841
V BICOL 5,433 5,506 5,579VI WESTERN VISAYAS 7,118 7,206 7,296VII CENTRAL VISAYAS 6,819 6,928 7,037VIII EASTERN VISAYAS 4,110 4,159 4,208IX ZAMBOANGA PENINSULA 3,417 3,475 3,532X NORTHERN MINDANAO 4,311 4,390 4,469XI DAVAO REGION 4,482 4,561 4,640XII SOCCSKSARGEN 4,125 4,213 4,302XIII CARAGA 2,435 2,468 2,502
ARMM MUSLIM MINDANAO 3,264 3,309 3,354
Source: National Statistical Coordination Board
REGIONAL ACCOUNTS OF THE PHILIPPINESUnit : In PercentTable 6.2. REGIONAL POPULATION2010 TO 2012
PERCENT DISTRIBUTION2010 2011 2012
PHILIPPINES 100.0 100.0 100.0
NCR METRO MANILA 12.8 12.8 12.8 CAR CORDILLERA 1.8 1.7 1.7
I ILOCOS 5.1 5.1 5.1 II CAGAYAN VALLEY 3.5 3.5 3.5 III CENTRAL LUZON 11.0 11.0 11.0
IVA CALABARZON 13.7 13.8 13.9 IVB MIMAROPA 3.0 3.0 3.0
V BICOL 5.9 5.8 5.8 VI WESTERN VISAYAS 7.7 7.7 7.6 VII CENTRAL VISAYAS 7.4 7.4 7.3 VIII EASTERN VISAYAS 4.4 4.4 4.4 IX ZAMBOANGA PENINSULA 3.7 3.7 3.7 X NORTHERN MINDANAO 4.7 4.7 4.7 XI DAVAO REGION 4.8 4.8 4.8 XII SOCCSKSARGEN 4.5 4.5 4.5 XIII CARAGA 2.6 2.6 2.6
ARMM MUSLIM MINDANAO 3.5 3.5 3.5 Source: National Statistical Coordination Board
REGION / YEAR
REGION / YEAR
* Per methodology advised by the NSO, the NSCB Technical Staff and the NSO computed annual population estimates using curvilinear interpolation at decelerating rates, with the results of the 2000 and 2010 Censuses of Population and Housing (CPH) as start and end dates of the reference population. Population estimates were first computed at the national level. Regional-level estimates were then computed but were adjusted proportionately to be consistent with the national total for each year.
Note: Regional levels may not add up to the national totals due to rounding.
Page 68

As of July 2013
REGIONAL ACCOUNTS OF THE PHILIPPINESUnit : In PercentTable 6.3. REGIONAL POPULATION2010 TO 2012GROWTH RATES
10-11 11-12
PHILIPPINES 1.7 1.7
NCR METRO MANILA 1.6 1.6 CAR CORDILLERA 1.5 1.5
I ILOCOS 1.1 1.1 II CAGAYAN VALLEY 1.3 1.3 III CENTRAL LUZON 1.9 1.9
IVA CALABARZON 2.6 2.5 IVB MIMAROPA 1.6 1.6
V BICOL 1.3 1.3 VI WESTERN VISAYAS 1.2 1.2 VII CENTRAL VISAYAS 1.6 1.6 VIII EASTERN VISAYAS 1.2 1.2 IX ZAMBOANGA PENINSULA 1.7 1.7 X NORTHERN MINDANAO 1.8 1.8 XI DAVAO REGION 1.8 1.7 XII SOCCSKSARGEN 2.1 2.1 XIII CARAGA 1.4 1.4
ARMM MUSLIM MINDANAO 1.4 1.4 Source: National Statistical Coordination Board
REGION / YEAR
Note: Regional levels may not add up to the national totals due to rounding.
Page 69
As of July 2013
GROSS REGIONAL DOMESTIC PRODUCT
Base Year : 2000
2010-2012 By Industry

As of July 2013
REGIONAL ACCOUNTS OF THE PHILIPPINESUnit : In Thousand PesosTable 1.1A. PHILIPPINESGROSS REGIONAL DOMESTIC PRODUCT BY INDUSTRIAL ORIGIN2010 TO 2012AT CURRENT PRICES
2010 2011 2012
I. AGRI., HUNTING, FORESTRY & FISHING 1,108,718,040 1,235,012,509 1,250,616,415 a. Agriculture and Forestry 928,588,230 1,052,167,132 1,056,964,211 b. Fishing 180,129,810 182,845,377 193,652,203
II INDUSTRY SECTOR 2,932,278,989 3,042,059,773 3,284,507,878 a. Mining and Quarrying 128,727,400 143,026,956 121,435,141 b. Manufacturing 1,930,779,002 2,047,718,430 2,170,918,379 c. Construction 551,229,666 520,968,826 618,077,359 d. Electricity, Gas and Water Supply 321,542,920 330,345,561 374,077,000
III SERVICE SECTOR 4,962,483,463 5,429,196,182 6,029,762,205 a. Transport, Storage & Communication 586,196,760 627,255,133 685,250,652
1,563,786,258 1,695,907,740 1,868,422,432 c. Financial Intermediation 622,404,000 684,088,000 763,669,000
979,128,882 1,105,120,757 1,236,489,000
372,304,496 404,323,000 455,476,101 f. Other Services 838,663,067 912,501,552 1,020,455,020
GROSS DOMESTIC PRODUCT 9,003,480,492 9,706,268,465 10,564,886,498Source : National Statistical Coordination Board
REGIONAL ACCOUNTS OF THE PHILIPPINESUnit : In Thousand PesosTable 1.1B. PHILIPPINESGROSS REGIONAL DOMESTIC PRODUCT BY INDUSTRIAL ORIGIN2010 TO 2012AT CONSTANT 2000 PRICES
2010 2011 2012
I. AGRI., HUNTING, FORESTRY & FISHING 662,665,270 679,835,107 698,936,758 a. Agriculture and Forestry 526,238,306 549,306,160 568,904,787 b. Fishing 136,426,964 130,528,946 130,031,971
II INDUSTRY SECTOR 1,859,515,225 1,893,256,054 2,022,623,205 a. Mining and Quarrying 65,898,068 70,509,209 72,047,154 b. Manufacturing 1,264,523,479 1,324,330,168 1,395,711,457 c. Construction 325,819,808 293,869,821 339,920,594 d. Electricity, Gas and Water Supply 203,273,871 204,546,856 214,944,000
III SERVICE SECTOR 3,179,358,701 3,335,908,573 3,590,110,879 a. Transport, Storage & Communication 427,766,316 446,026,444 482,094,584
948,742,720 980,514,493 1,054,391,552 c. Financial Intermediation 374,716,000 394,370,738 426,787,000
588,947,091 638,243,916 686,430,000
255,086,722 259,962,000 275,835,122 f. Other Services 584,099,853 616,790,981 664,572,621
GROSS DOMESTIC PRODUCT 5,701,539,196 5,908,999,733 6,311,670,842Source : National Statistical Coordination Board
INDUSTRY/YEAR
INDUSTRY/YEAR
b. Trade and Repair of Motor Vehicles, Motorcycles, Personal and Household Goods
d. R. Estate, Renting & Business
b. Trade and Repair of Motor Vehicles, Motorcycles, Personal and Household Goods
d. R. Estate, Renting & Business e. Public Administration & Defense; Compulsory Social Security
e. Public Administration & Defense; Compulsory Social Security
Note: Regional levels may not add up to the national totals due to rounding. Page 70
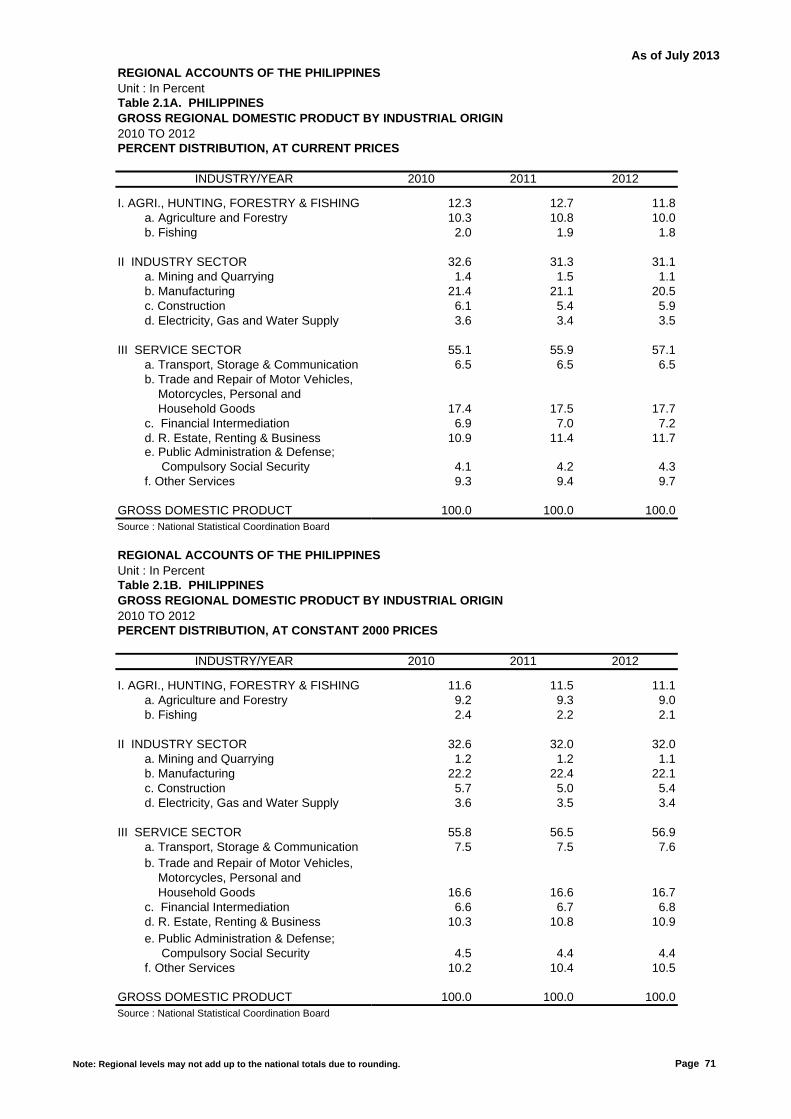
As of July 2013
REGIONAL ACCOUNTS OF THE PHILIPPINESUnit : In PercentTable 2.1A. PHILIPPINESGROSS REGIONAL DOMESTIC PRODUCT BY INDUSTRIAL ORIGIN2010 TO 2012PERCENT DISTRIBUTION, AT CURRENT PRICES
2010 2011 2012
I. AGRI., HUNTING, FORESTRY & FISHING 12.3 12.7 11.8 a. Agriculture and Forestry 10.3 10.8 10.0 b. Fishing 2.0 1.9 1.8
II INDUSTRY SECTOR 32.6 31.3 31.1 a. Mining and Quarrying 1.4 1.5 1.1 b. Manufacturing 21.4 21.1 20.5 c. Construction 6.1 5.4 5.9 d. Electricity, Gas and Water Supply 3.6 3.4 3.5
III SERVICE SECTOR 55.1 55.9 57.1 a. Transport, Storage & Communication 6.5 6.5 6.5
17.4 17.5 17.7 c. Financial Intermediation 6.9 7.0 7.2
10.9 11.4 11.7
4.1 4.2 4.3 f. Other Services 9.3 9.4 9.7
GROSS DOMESTIC PRODUCT 100.0 100.0 100.0Source : National Statistical Coordination Board
REGIONAL ACCOUNTS OF THE PHILIPPINESUnit : In PercentTable 2.1B. PHILIPPINESGROSS REGIONAL DOMESTIC PRODUCT BY INDUSTRIAL ORIGIN2010 TO 2012PERCENT DISTRIBUTION, AT CONSTANT 2000 PRICES
2010 2011 2012
I. AGRI., HUNTING, FORESTRY & FISHING 11.6 11.5 11.1 a. Agriculture and Forestry 9.2 9.3 9.0 b. Fishing 2.4 2.2 2.1
II INDUSTRY SECTOR 32.6 32.0 32.0 a. Mining and Quarrying 1.2 1.2 1.1 b. Manufacturing 22.2 22.4 22.1 c. Construction 5.7 5.0 5.4 d. Electricity, Gas and Water Supply 3.6 3.5 3.4
III SERVICE SECTOR 55.8 56.5 56.9 a. Transport, Storage & Communication 7.5 7.5 7.6
16.6 16.6 16.7 c. Financial Intermediation 6.6 6.7 6.8
10.3 10.8 10.9
4.5 4.4 4.4 f. Other Services 10.2 10.4 10.5
GROSS DOMESTIC PRODUCT 100.0 100.0 100.0Source : National Statistical Coordination Board
b. Trade and Repair of Motor Vehicles, Motorcycles, Personal and Household Goods
d. R. Estate, Renting & Business e. Public Administration & Defense; Compulsory Social Security
INDUSTRY/YEAR
INDUSTRY/YEAR
b. Trade and Repair of Motor Vehicles, Motorcycles, Personal and Household Goods
d. R. Estate, Renting & Business e. Public Administration & Defense; Compulsory Social Security
Note: Regional levels may not add up to the national totals due to rounding. Page 71
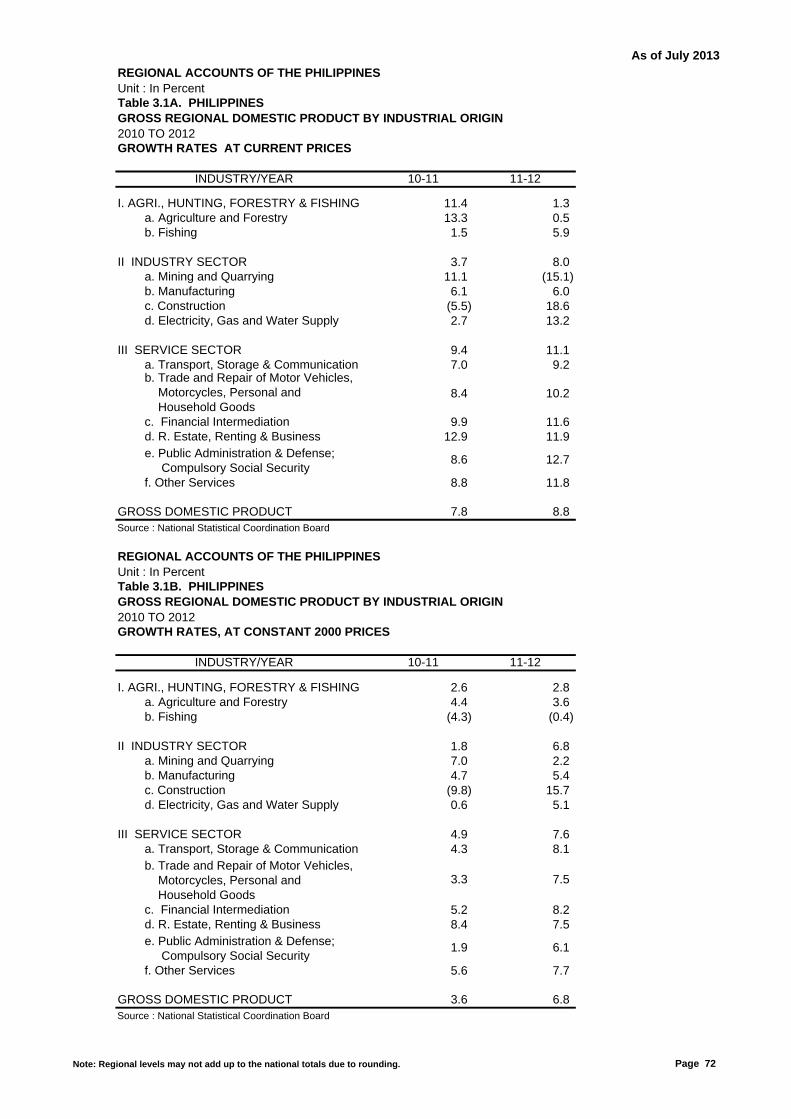
As of July 2013
REGIONAL ACCOUNTS OF THE PHILIPPINESUnit : In PercentTable 3.1A. PHILIPPINESGROSS REGIONAL DOMESTIC PRODUCT BY INDUSTRIAL ORIGIN2010 TO 2012GROWTH RATES AT CURRENT PRICES
10-11 11-12
I. AGRI., HUNTING, FORESTRY & FISHING 11.4 1.3 a. Agriculture and Forestry 13.3 0.5 b. Fishing 1.5 5.9
II INDUSTRY SECTOR 3.7 8.0 a. Mining and Quarrying 11.1 (15.1) b. Manufacturing 6.1 6.0 c. Construction (5.5) 18.6 d. Electricity, Gas and Water Supply 2.7 13.2
III SERVICE SECTOR 9.4 11.1 a. Transport, Storage & Communication 7.0 9.2
8.4 10.2
c. Financial Intermediation 9.9 11.612.9 11.9
8.6 12.7
f. Other Services 8.8 11.8
GROSS DOMESTIC PRODUCT 7.8 8.8Source : National Statistical Coordination Board
REGIONAL ACCOUNTS OF THE PHILIPPINESUnit : In PercentTable 3.1B. PHILIPPINESGROSS REGIONAL DOMESTIC PRODUCT BY INDUSTRIAL ORIGIN2010 TO 2012GROWTH RATES, AT CONSTANT 2000 PRICES
10-11 11-12
I. AGRI., HUNTING, FORESTRY & FISHING 2.6 2.8 a. Agriculture and Forestry 4.4 3.6 b. Fishing (4.3) (0.4)
II INDUSTRY SECTOR 1.8 6.8 a. Mining and Quarrying 7.0 2.2 b. Manufacturing 4.7 5.4 c. Construction (9.8) 15.7 d. Electricity, Gas and Water Supply 0.6 5.1
III SERVICE SECTOR 4.9 7.6 a. Transport, Storage & Communication 4.3 8.1
3.3 7.5
c. Financial Intermediation 5.2 8.28.4 7.5
1.9 6.1
f. Other Services 5.6 7.7
GROSS DOMESTIC PRODUCT 3.6 6.8Source : National Statistical Coordination Board
e. Public Administration & Defense; Compulsory Social Security
b. Trade and Repair of Motor Vehicles, Motorcycles, Personal and Household Goods
d. R. Estate, Renting & Business e. Public Administration & Defense; Compulsory Social Security
INDUSTRY/YEAR
INDUSTRY/YEAR
b. Trade and Repair of Motor Vehicles, Motorcycles, Personal and Household Goods
d. R. Estate, Renting & Business
Note: Regional levels may not add up to the national totals due to rounding. Page 72
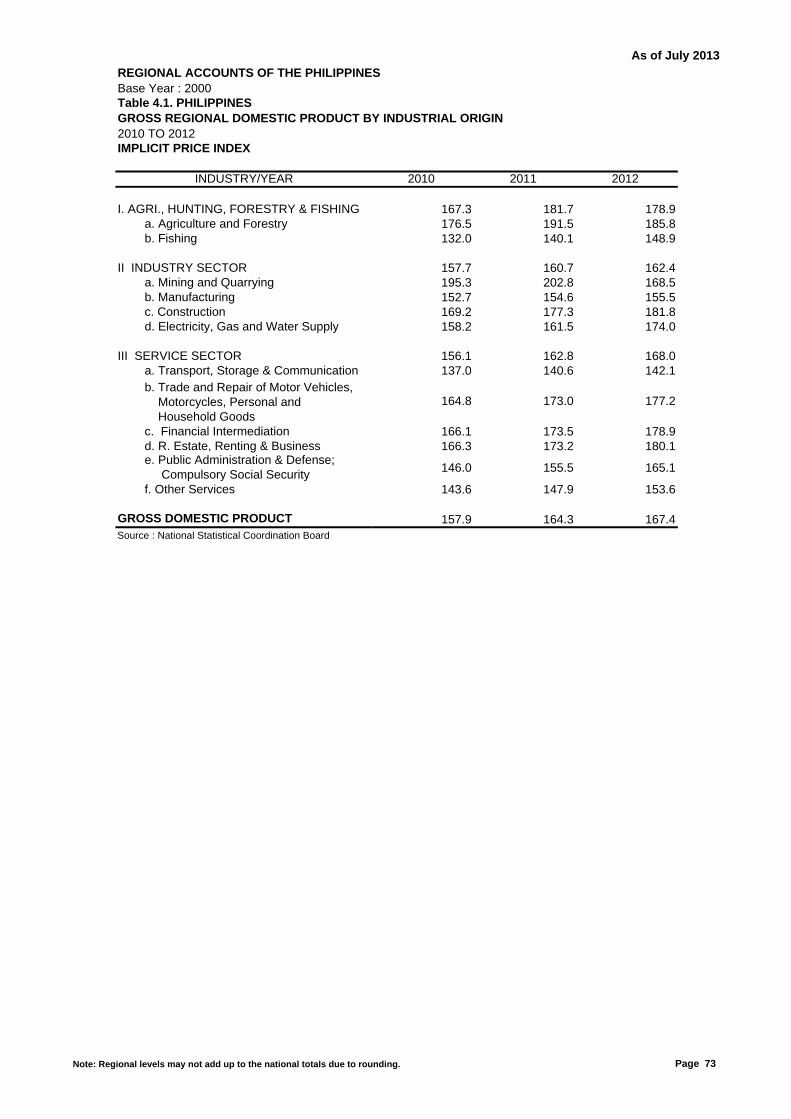
As of July 2013
REGIONAL ACCOUNTS OF THE PHILIPPINESBase Year : 2000Table 4.1. PHILIPPINESGROSS REGIONAL DOMESTIC PRODUCT BY INDUSTRIAL ORIGIN2010 TO 2012IMPLICIT PRICE INDEX
2010 2011 2012
I. AGRI., HUNTING, FORESTRY & FISHING 167.3 181.7 178.9 a. Agriculture and Forestry 176.5 191.5 185.8 b. Fishing 132.0 140.1 148.9
II INDUSTRY SECTOR 157.7 160.7 162.4 a. Mining and Quarrying 195.3 202.8 168.5 b. Manufacturing 152.7 154.6 155.5 c. Construction 169.2 177.3 181.8 d. Electricity, Gas and Water Supply 158.2 161.5 174.0
III SERVICE SECTOR 156.1 162.8 168.0 a. Transport, Storage & Communication 137.0 140.6 142.1
164.8 173.0 177.2
c. Financial Intermediation 166.1 173.5 178.9166.3 173.2 180.1
146.0 155.5 165.1
f. Other Services 143.6 147.9 153.6
GROSS DOMESTIC PRODUCT 157.9 164.3 167.4Source : National Statistical Coordination Board
d. R. Estate, Renting & Business
b. Trade and Repair of Motor Vehicles, Motorcycles, Personal and Household Goods
e. Public Administration & Defense; Compulsory Social Security
INDUSTRY/YEAR
Note: Regional levels may not add up to the national totals due to rounding. Page 73
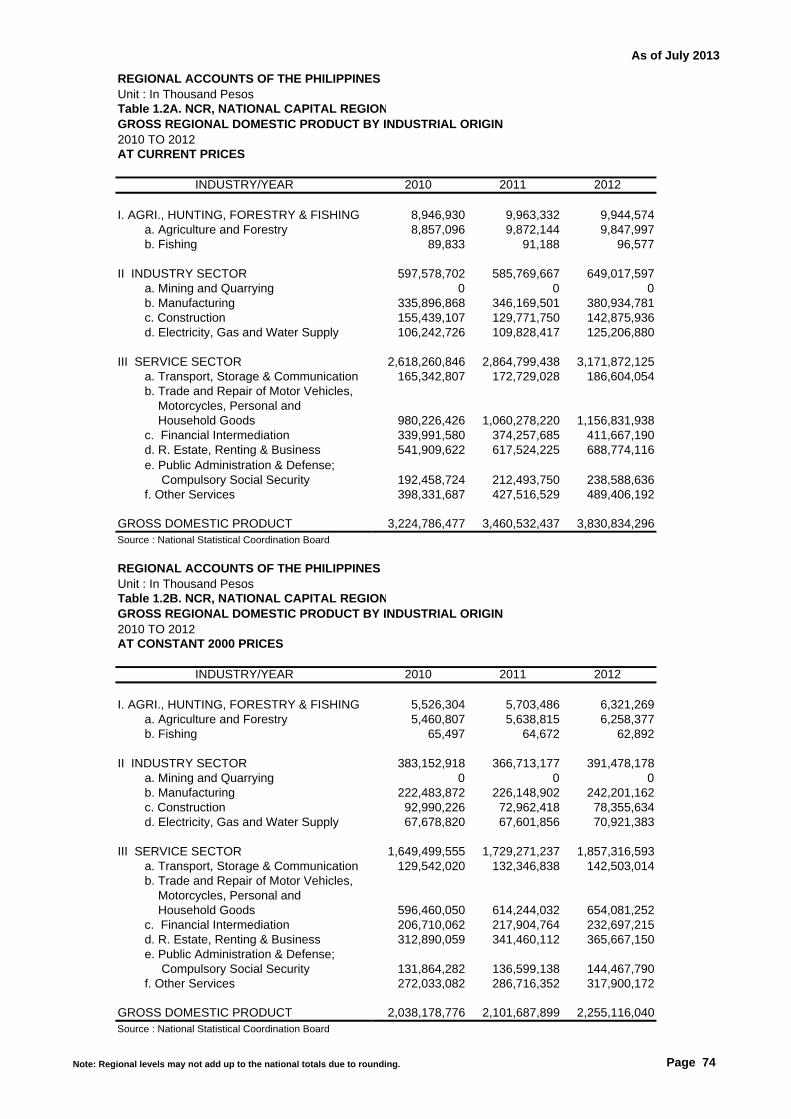
As of July 2013
REGIONAL ACCOUNTS OF THE PHILIPPINESUnit : In Thousand PesosTable 1.2A. NCR, NATIONAL CAPITAL REGIONGROSS REGIONAL DOMESTIC PRODUCT BY INDUSTRIAL ORIGIN2010 TO 2012AT CURRENT PRICES
2010 2011 2012
I. AGRI., HUNTING, FORESTRY & FISHING 8,946,930 9,963,332 9,944,574 a. Agriculture and Forestry 8,857,096 9,872,144 9,847,997 b. Fishing 89,833 91,188 96,577
II INDUSTRY SECTOR 597,578,702 585,769,667 649,017,597 a. Mining and Quarrying 0 0 0 b. Manufacturing 335,896,868 346,169,501 380,934,781 c. Construction 155,439,107 129,771,750 142,875,936 d. Electricity, Gas and Water Supply 106,242,726 109,828,417 125,206,880
III SERVICE SECTOR 2,618,260,846 2,864,799,438 3,171,872,125 a. Transport, Storage & Communication 165,342,807 172,729,028 186,604,054
980,226,426 1,060,278,220 1,156,831,938 c. Financial Intermediation 339,991,580 374,257,685 411,667,190
541,909,622 617,524,225 688,774,116
192,458,724 212,493,750 238,588,636 f. Other Services 398,331,687 427,516,529 489,406,192
GROSS DOMESTIC PRODUCT 3,224,786,477 3,460,532,437 3,830,834,296Source : National Statistical Coordination Board
REGIONAL ACCOUNTS OF THE PHILIPPINESUnit : In Thousand PesosTable 1.2B. NCR, NATIONAL CAPITAL REGIONGROSS REGIONAL DOMESTIC PRODUCT BY INDUSTRIAL ORIGIN2010 TO 2012AT CONSTANT 2000 PRICES
2010 2011 2012
I. AGRI., HUNTING, FORESTRY & FISHING 5,526,304 5,703,486 6,321,269 a. Agriculture and Forestry 5,460,807 5,638,815 6,258,377 b. Fishing 65,497 64,672 62,892
II INDUSTRY SECTOR 383,152,918 366,713,177 391,478,178 a. Mining and Quarrying 0 0 0 b. Manufacturing 222,483,872 226,148,902 242,201,162 c. Construction 92,990,226 72,962,418 78,355,634 d. Electricity, Gas and Water Supply 67,678,820 67,601,856 70,921,383
III SERVICE SECTOR 1,649,499,555 1,729,271,237 1,857,316,593 a. Transport, Storage & Communication 129,542,020 132,346,838 142,503,014
596,460,050 614,244,032 654,081,252 c. Financial Intermediation 206,710,062 217,904,764 232,697,215
312,890,059 341,460,112 365,667,150
131,864,282 136,599,138 144,467,790 f. Other Services 272,033,082 286,716,352 317,900,172
GROSS DOMESTIC PRODUCT 2,038,178,776 2,101,687,899 2,255,116,040Source : National Statistical Coordination Board
b. Trade and Repair of Motor Vehicles, Motorcycles, Personal and Household Goods
d. R. Estate, Renting & Business e. Public Administration & Defense; Compulsory Social Security
INDUSTRY/YEAR
INDUSTRY/YEAR
b. Trade and Repair of Motor Vehicles, Motorcycles, Personal and Household Goods
d. R. Estate, Renting & Business e. Public Administration & Defense; Compulsory Social Security
Note: Regional levels may not add up to the national totals due to rounding. Page 74

As of July 2013
REGIONAL ACCOUNTS OF THE PHILIPPINESUnit : In PercentTable 2.2A. NCR, NATIONAL CAPITAL REGIONGROSS REGIONAL DOMESTIC PRODUCT BY INDUSTRIAL ORIGIN2010 TO 2012PERCENT DISTRIBUTION, AT CURRENT PRICES
2010 2011 2012
I. AGRI., HUNTING, FORESTRY & FISHING 0.3 0.3 0.3 a. Agriculture and Forestry 0.3 0.3 0.3 b. Fishing 0.0 0.0 0.0
II INDUSTRY SECTOR 18.5 16.9 16.9 a. Mining and Quarrying 0.0 0.0 0.0 b. Manufacturing 10.4 10.0 9.9 c. Construction 4.8 3.8 3.7 d. Electricity, Gas and Water Supply 3.3 3.2 3.3
III SERVICE SECTOR 81.2 82.8 82.8 a. Transport, Storage & Communication 5.1 5.0 4.9
30.4 30.6 30.2 c. Financial Intermediation 10.5 10.8 10.7
16.8 17.8 18.0
6.0 6.1 6.2 f. Other Services 12.4 12.4 12.8
GROSS DOMESTIC PRODUCT 100.0 100.0 100.0Source : National Statistical Coordination Board
REGIONAL ACCOUNTS OF THE PHILIPPINESUnit :In Percent Table 2.2B. NCR, NATIONAL CAPITAL REGIONGROSS REGIONAL DOMESTIC PRODUCT BY INDUSTRIAL ORIGIN2010 TO 2012PERCENT DISTRIBUTION, AT CONSTANT 2000 PRICES
2010 2011 2012
I. AGRI., HUNTING, FORESTRY & FISHING 0.3 0.3 0.3 a. Agriculture and Forestry 0.3 0.3 0.3 b. Fishing 0.0 0.0 0.0
II INDUSTRY SECTOR 18.8 17.4 17.4 a. Mining and Quarrying 0.0 0.0 0.0 b. Manufacturing 10.9 10.8 10.7 c. Construction 4.6 3.5 3.5 d. Electricity, Gas and Water Supply 3.3 3.2 3.1
III SERVICE SECTOR 80.9 82.3 82.4 a. Transport, Storage & Communication 6.4 6.3 6.3
29.3 29.2 29.0 c. Financial Intermediation 10.1 10.4 10.3
15.4 16.2 16.2
6.5 6.5 6.4 f. Other Services 13.3 13.6 14.1
GROSS DOMESTIC PRODUCT 100.0 100.0 100.0Source : National Statistical Coordination Board
INDUSTRY/YEAR
b. Trade and Repair of Motor Vehicles, Motorcycles, Personal and Household Goods
d. R. Estate, Renting & Business e. Public Administration & Defense; Compulsory Social Security
b. Trade and Repair of Motor Vehicles, Motorcycles, Personal and Household Goods
INDUSTRY/YEAR
d. R. Estate, Renting & Business e. Public Administration & Defense; Compulsory Social Security
Note: Regional levels may not add up to the national totals due to rounding. Page 75
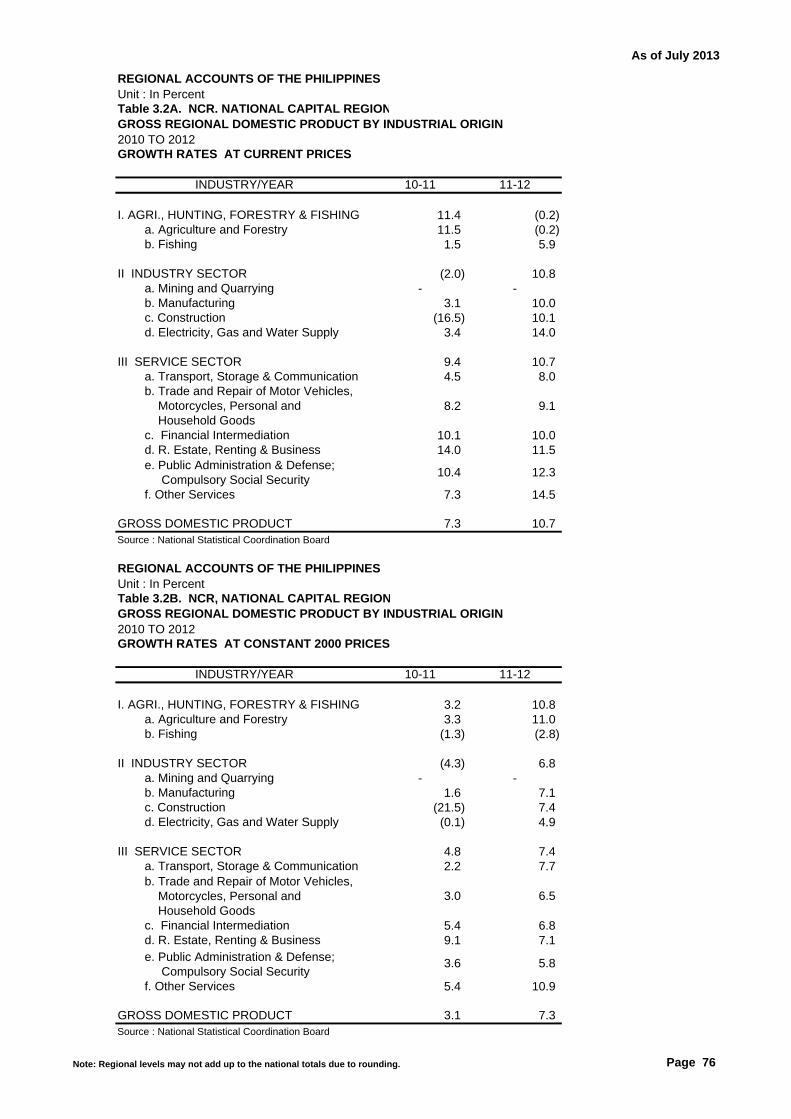
As of July 2013
REGIONAL ACCOUNTS OF THE PHILIPPINESUnit : In PercentTable 3.2A. NCR. NATIONAL CAPITAL REGIONGROSS REGIONAL DOMESTIC PRODUCT BY INDUSTRIAL ORIGIN2010 TO 2012GROWTH RATES AT CURRENT PRICES
10-11 11-12
I. AGRI., HUNTING, FORESTRY & FISHING 11.4 (0.2) a. Agriculture and Forestry 11.5 (0.2) b. Fishing 1.5 5.9
II INDUSTRY SECTOR (2.0) 10.8 a. Mining and Quarrying - - b. Manufacturing 3.1 10.0 c. Construction (16.5) 10.1 d. Electricity, Gas and Water Supply 3.4 14.0
III SERVICE SECTOR 9.4 10.7 a. Transport, Storage & Communication 4.5 8.0
8.2 9.1
c. Financial Intermediation 10.1 10.014.0 11.5
10.4 12.3
f. Other Services 7.3 14.5
GROSS DOMESTIC PRODUCT 7.3 10.7Source : National Statistical Coordination Board
REGIONAL ACCOUNTS OF THE PHILIPPINESUnit : In PercentTable 3.2B. NCR, NATIONAL CAPITAL REGIONGROSS REGIONAL DOMESTIC PRODUCT BY INDUSTRIAL ORIGIN2010 TO 2012GROWTH RATES AT CONSTANT 2000 PRICES
10-11 11-12
I. AGRI., HUNTING, FORESTRY & FISHING 3.2 10.8 a. Agriculture and Forestry 3.3 11.0 b. Fishing (1.3) (2.8)
II INDUSTRY SECTOR (4.3) 6.8 a. Mining and Quarrying - - b. Manufacturing 1.6 7.1 c. Construction (21.5) 7.4 d. Electricity, Gas and Water Supply (0.1) 4.9
III SERVICE SECTOR 4.8 7.4 a. Transport, Storage & Communication 2.2 7.7
3.0 6.5
c. Financial Intermediation 5.4 6.89.1 7.1
3.6 5.8
f. Other Services 5.4 10.9
GROSS DOMESTIC PRODUCT 3.1 7.3Source : National Statistical Coordination Board
b. Trade and Repair of Motor Vehicles, Motorcycles, Personal and Household Goods
d. R. Estate, Renting & Business
INDUSTRY/YEAR
INDUSTRY/YEAR
b. Trade and Repair of Motor Vehicles, Motorcycles, Personal and Household Goods
d. R. Estate, Renting & Business
e. Public Administration & Defense; Compulsory Social Security
e. Public Administration & Defense; Compulsory Social Security
Note: Regional levels may not add up to the national totals due to rounding. Page 76
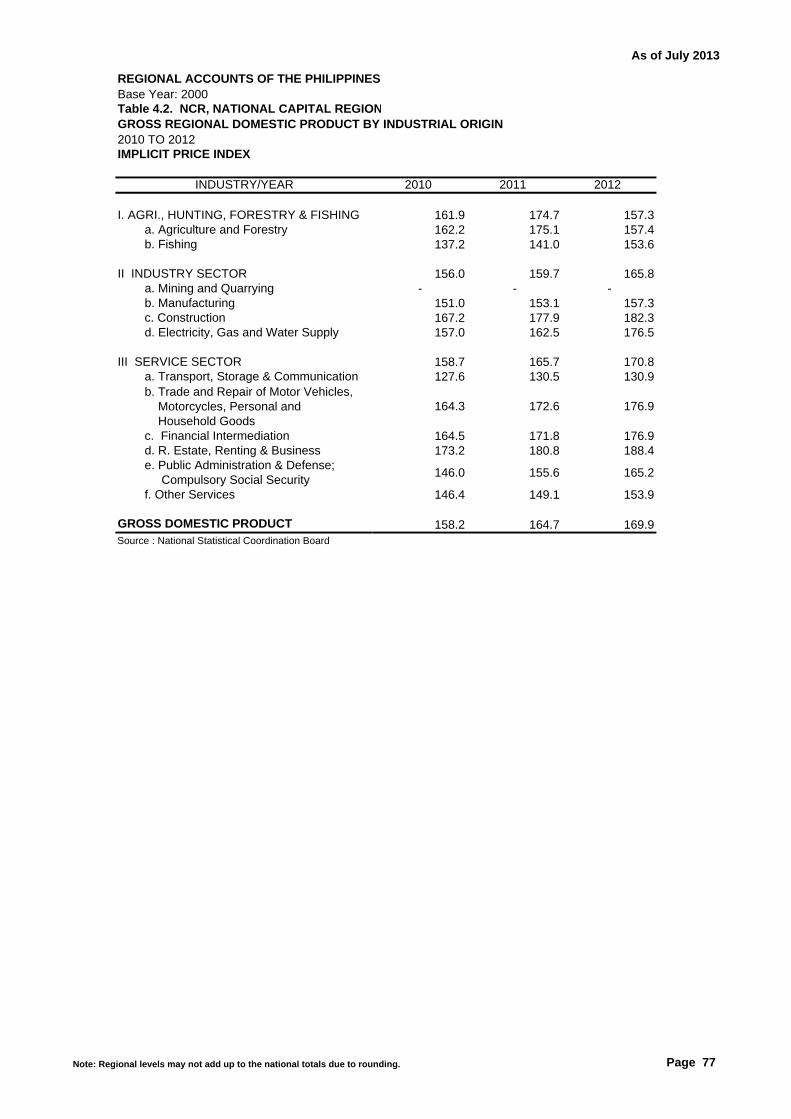
As of July 2013
REGIONAL ACCOUNTS OF THE PHILIPPINESBase Year: 2000Table 4.2. NCR, NATIONAL CAPITAL REGIONGROSS REGIONAL DOMESTIC PRODUCT BY INDUSTRIAL ORIGIN2010 TO 2012IMPLICIT PRICE INDEX
2010 2011 2012
I. AGRI., HUNTING, FORESTRY & FISHING 161.9 174.7 157.3 a. Agriculture and Forestry 162.2 175.1 157.4 b. Fishing 137.2 141.0 153.6
II INDUSTRY SECTOR 156.0 159.7 165.8 a. Mining and Quarrying - - - b. Manufacturing 151.0 153.1 157.3 c. Construction 167.2 177.9 182.3 d. Electricity, Gas and Water Supply 157.0 162.5 176.5
III SERVICE SECTOR 158.7 165.7 170.8 a. Transport, Storage & Communication 127.6 130.5 130.9
164.3 172.6 176.9
c. Financial Intermediation 164.5 171.8 176.9173.2 180.8 188.4
146.0 155.6 165.2
f. Other Services 146.4 149.1 153.9
GROSS DOMESTIC PRODUCT 158.2 164.7 169.9Source : National Statistical Coordination Board
INDUSTRY/YEAR
d. R. Estate, Renting & Business e. Public Administration & Defense; Compulsory Social Security
b. Trade and Repair of Motor Vehicles, Motorcycles, Personal and Household Goods
Note: Regional levels may not add up to the national totals due to rounding. Page 77
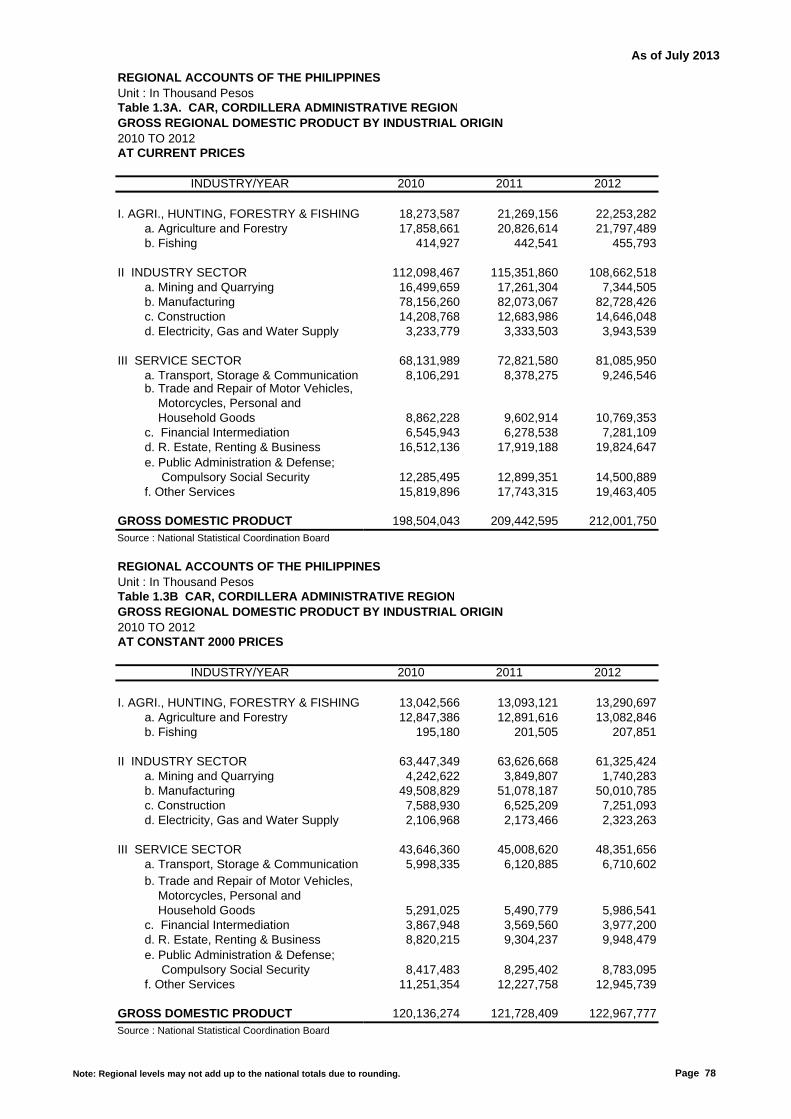
As of July 2013
REGIONAL ACCOUNTS OF THE PHILIPPINESUnit : In Thousand PesosTable 1.3A. CAR, CORDILLERA ADMINISTRATIVE REGIONGROSS REGIONAL DOMESTIC PRODUCT BY INDUSTRIAL ORIGIN2010 TO 2012AT CURRENT PRICES
2010 2011 2012
I. AGRI., HUNTING, FORESTRY & FISHING 18,273,587 21,269,156 22,253,282 a. Agriculture and Forestry 17,858,661 20,826,614 21,797,489 b. Fishing 414,927 442,541 455,793
II INDUSTRY SECTOR 112,098,467 115,351,860 108,662,518 a. Mining and Quarrying 16,499,659 17,261,304 7,344,505 b. Manufacturing 78,156,260 82,073,067 82,728,426 c. Construction 14,208,768 12,683,986 14,646,048 d. Electricity, Gas and Water Supply 3,233,779 3,333,503 3,943,539
III SERVICE SECTOR 68,131,989 72,821,580 81,085,950 a. Transport, Storage & Communication 8,106,291 8,378,275 9,246,546
8,862,228 9,602,914 10,769,353 c. Financial Intermediation 6,545,943 6,278,538 7,281,109
16,512,136 17,919,188 19,824,647
12,285,495 12,899,351 14,500,889 f. Other Services 15,819,896 17,743,315 19,463,405
GROSS DOMESTIC PRODUCT 198,504,043 209,442,595 212,001,750Source : National Statistical Coordination Board
REGIONAL ACCOUNTS OF THE PHILIPPINESUnit : In Thousand PesosTable 1.3B CAR, CORDILLERA ADMINISTRATIVE REGIONGROSS REGIONAL DOMESTIC PRODUCT BY INDUSTRIAL ORIGIN2010 TO 2012AT CONSTANT 2000 PRICES
2010 2011 2012
I. AGRI., HUNTING, FORESTRY & FISHING 13,042,566 13,093,121 13,290,697 a. Agriculture and Forestry 12,847,386 12,891,616 13,082,846 b. Fishing 195,180 201,505 207,851
II INDUSTRY SECTOR 63,447,349 63,626,668 61,325,424 a. Mining and Quarrying 4,242,622 3,849,807 1,740,283 b. Manufacturing 49,508,829 51,078,187 50,010,785 c. Construction 7,588,930 6,525,209 7,251,093 d. Electricity, Gas and Water Supply 2,106,968 2,173,466 2,323,263
III SERVICE SECTOR 43,646,360 45,008,620 48,351,656 a. Transport, Storage & Communication 5,998,335 6,120,885 6,710,602
5,291,025 5,490,779 5,986,541 c. Financial Intermediation 3,867,948 3,569,560 3,977,200
8,820,215 9,304,237 9,948,479
8,417,483 8,295,402 8,783,095 f. Other Services 11,251,354 12,227,758 12,945,739
GROSS DOMESTIC PRODUCT 120,136,274 121,728,409 122,967,777Source : National Statistical Coordination Board
b. Trade and Repair of Motor Vehicles, Motorcycles, Personal and Household Goods
d. R. Estate, Renting & Business e. Public Administration & Defense; Compulsory Social Security
INDUSTRY/YEAR
INDUSTRY/YEAR
b. Trade and Repair of Motor Vehicles, Motorcycles, Personal and Household Goods
d. R. Estate, Renting & Business e. Public Administration & Defense; Compulsory Social Security
Note: Regional levels may not add up to the national totals due to rounding. Page 78
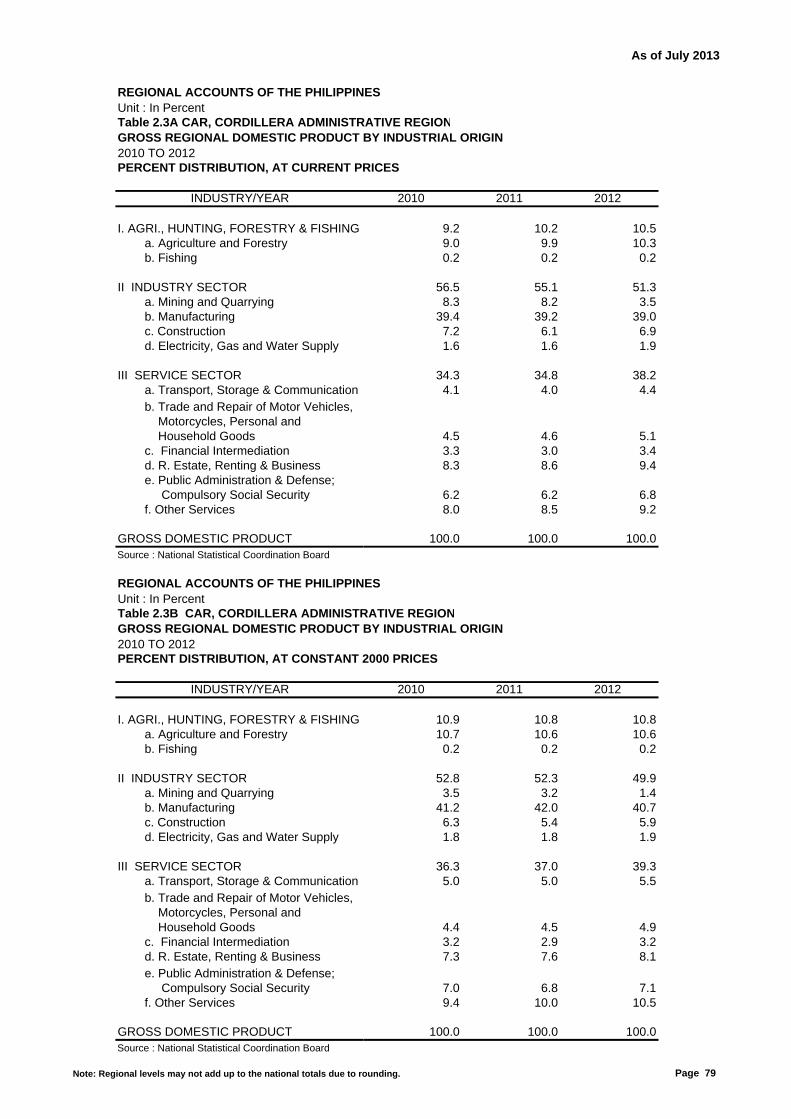
As of July 2013
REGIONAL ACCOUNTS OF THE PHILIPPINESUnit : In PercentTable 2.3A CAR, CORDILLERA ADMINISTRATIVE REGIONGROSS REGIONAL DOMESTIC PRODUCT BY INDUSTRIAL ORIGIN2010 TO 2012PERCENT DISTRIBUTION, AT CURRENT PRICES
2010 2011 2012
I. AGRI., HUNTING, FORESTRY & FISHING 9.2 10.2 10.5 a. Agriculture and Forestry 9.0 9.9 10.3 b. Fishing 0.2 0.2 0.2
II INDUSTRY SECTOR 56.5 55.1 51.3 a. Mining and Quarrying 8.3 8.2 3.5 b. Manufacturing 39.4 39.2 39.0 c. Construction 7.2 6.1 6.9 d. Electricity, Gas and Water Supply 1.6 1.6 1.9
III SERVICE SECTOR 34.3 34.8 38.2 a. Transport, Storage & Communication 4.1 4.0 4.4
4.5 4.6 5.1 c. Financial Intermediation 3.3 3.0 3.4
8.3 8.6 9.4
6.2 6.2 6.8 f. Other Services 8.0 8.5 9.2
GROSS DOMESTIC PRODUCT 100.0 100.0 100.0Source : National Statistical Coordination Board
REGIONAL ACCOUNTS OF THE PHILIPPINESUnit : In PercentTable 2.3B CAR, CORDILLERA ADMINISTRATIVE REGIONGROSS REGIONAL DOMESTIC PRODUCT BY INDUSTRIAL ORIGIN2010 TO 2012PERCENT DISTRIBUTION, AT CONSTANT 2000 PRICES
2010 2011 2012
I. AGRI., HUNTING, FORESTRY & FISHING 10.9 10.8 10.8 a. Agriculture and Forestry 10.7 10.6 10.6 b. Fishing 0.2 0.2 0.2
II INDUSTRY SECTOR 52.8 52.3 49.9 a. Mining and Quarrying 3.5 3.2 1.4 b. Manufacturing 41.2 42.0 40.7 c. Construction 6.3 5.4 5.9 d. Electricity, Gas and Water Supply 1.8 1.8 1.9
III SERVICE SECTOR 36.3 37.0 39.3 a. Transport, Storage & Communication 5.0 5.0 5.5
4.4 4.5 4.9 c. Financial Intermediation 3.2 2.9 3.2
7.3 7.6 8.1
7.0 6.8 7.1 f. Other Services 9.4 10.0 10.5
GROSS DOMESTIC PRODUCT 100.0 100.0 100.0Source : National Statistical Coordination Board
INDUSTRY/YEAR
b. Trade and Repair of Motor Vehicles, Motorcycles, Personal and Household Goods
d. R. Estate, Renting & Business e. Public Administration & Defense; Compulsory Social Security
b. Trade and Repair of Motor Vehicles, Motorcycles, Personal and Household Goods
INDUSTRY/YEAR
d. R. Estate, Renting & Business e. Public Administration & Defense; Compulsory Social Security
Note: Regional levels may not add up to the national totals due to rounding. Page 79
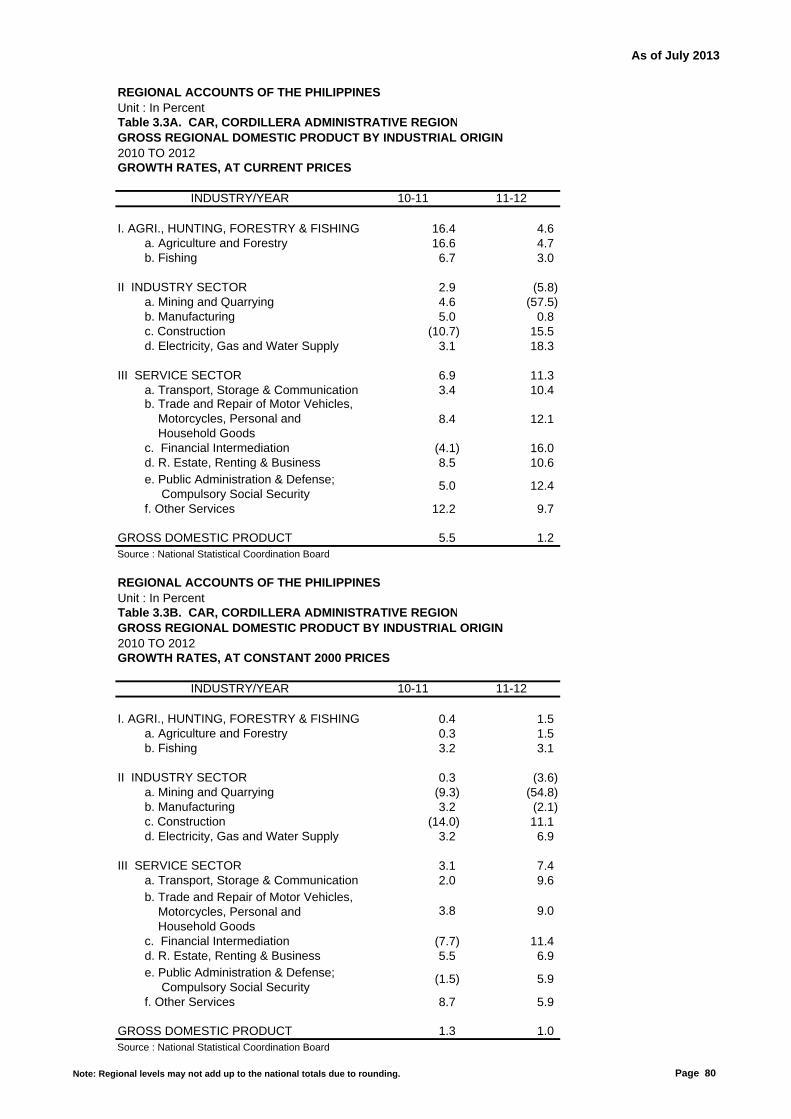
As of July 2013
REGIONAL ACCOUNTS OF THE PHILIPPINESUnit : In PercentTable 3.3A. CAR, CORDILLERA ADMINISTRATIVE REGIONGROSS REGIONAL DOMESTIC PRODUCT BY INDUSTRIAL ORIGIN2010 TO 2012GROWTH RATES, AT CURRENT PRICES
10-11 11-12
I. AGRI., HUNTING, FORESTRY & FISHING 16.4 4.6 a. Agriculture and Forestry 16.6 4.7 b. Fishing 6.7 3.0
II INDUSTRY SECTOR 2.9 (5.8) a. Mining and Quarrying 4.6 (57.5) b. Manufacturing 5.0 0.8 c. Construction (10.7) 15.5 d. Electricity, Gas and Water Supply 3.1 18.3
III SERVICE SECTOR 6.9 11.3 a. Transport, Storage & Communication 3.4 10.4
8.4 12.1
c. Financial Intermediation (4.1) 16.08.5 10.6
5.0 12.4
f. Other Services 12.2 9.7
GROSS DOMESTIC PRODUCT 5.5 1.2Source : National Statistical Coordination Board
REGIONAL ACCOUNTS OF THE PHILIPPINESUnit : In PercentTable 3.3B. CAR, CORDILLERA ADMINISTRATIVE REGIONGROSS REGIONAL DOMESTIC PRODUCT BY INDUSTRIAL ORIGIN2010 TO 2012GROWTH RATES, AT CONSTANT 2000 PRICES
10-11 11-12
I. AGRI., HUNTING, FORESTRY & FISHING 0.4 1.5 a. Agriculture and Forestry 0.3 1.5 b. Fishing 3.2 3.1
II INDUSTRY SECTOR 0.3 (3.6) a. Mining and Quarrying (9.3) (54.8) b. Manufacturing 3.2 (2.1) c. Construction (14.0) 11.1 d. Electricity, Gas and Water Supply 3.2 6.9
III SERVICE SECTOR 3.1 7.4 a. Transport, Storage & Communication 2.0 9.6
3.8 9.0
c. Financial Intermediation (7.7) 11.45.5 6.9
(1.5) 5.9
f. Other Services 8.7 5.9
GROSS DOMESTIC PRODUCT 1.3 1.0Source : National Statistical Coordination Board
b. Trade and Repair of Motor Vehicles, Motorcycles, Personal and Household Goods
d. R. Estate, Renting & Business
INDUSTRY/YEAR
INDUSTRY/YEAR
b. Trade and Repair of Motor Vehicles, Motorcycles, Personal and Household Goods
d. R. Estate, Renting & Business
e. Public Administration & Defense; Compulsory Social Security
e. Public Administration & Defense; Compulsory Social Security
Note: Regional levels may not add up to the national totals due to rounding. Page 80

As of July 2013
REGIONAL ACCOUNTS OF THE PHILIPPINESBase Year : 2000Table 4.3. CAR, CORDILLERA ADMINISTRATIVE REGIONGROSS REGIONAL DOMESTIC PRODUCT BY INDUSTRIAL ORIGIN2010 TO 2012IMPLICIT PRICE INDEX
2010 2011 2012
I. AGRI., HUNTING, FORESTRY & FISHING 140.1 162.4 167.4 a. Agriculture and Forestry 139.0 161.6 166.6 b. Fishing 212.6 219.6 219.3
II INDUSTRY SECTOR 176.7 181.3 177.2 a. Mining and Quarrying 388.9 448.4 422.0 b. Manufacturing 157.9 160.7 165.4 c. Construction 187.2 194.4 202.0 d. Electricity, Gas and Water Supply 153.5 153.4 169.7
III SERVICE SECTOR 156.1 161.8 167.7 a. Transport, Storage & Communication 135.1 136.9 137.8
167.5 174.9 179.9
c. Financial Intermediation 169.2 175.9 183.1187.2 192.6 199.3
146.0 155.5 165.1
f. Other Services 140.6 145.1 150.3
GROSS DOMESTIC PRODUCT 165.2 172.1 172.4Source : National Statistical Coordination Board
INDUSTRY/YEAR
d. R. Estate, Renting & Business e. Public Administration & Defense; Compulsory Social Security
b. Trade and Repair of Motor Vehicles, Motorcycles, Personal and Household Goods
Note: Regional levels may not add up to the national totals due to rounding. Page 81

As of July 2013
REGIONAL ACCOUNTS OF THE PHILIPPINESUnit : In Thousand PesosTable 1.4A. REGION I, ILOCOSGROSS REGIONAL DOMESTIC PRODUCT BY INDUSTRIAL ORIGIN2010 TO 2012AT CURRENT PRICES
2010 2011 2012
I. AGRI., HUNTING, FORESTRY & FISHING 75,324,942 81,584,364 89,867,390 a. Agriculture and Forestry 61,593,599 65,176,000 71,850,691 b. Fishing 13,731,343 16,408,364 18,016,699
II INDUSTRY SECTOR 78,396,831 78,232,231 84,202,556 a. Mining and Quarrying 3,051,061 3,453,053 4,220,393 b. Manufacturing 14,224,390 14,445,477 15,220,776 c. Construction 24,493,551 22,639,874 23,199,024 d. Electricity, Gas and Water Supply 36,627,828 37,693,827 41,562,363
III SERVICE SECTOR 126,064,973 139,441,084 152,175,399 a. Transport, Storage & Communication 27,888,246 29,983,007 32,674,653
24,341,250 26,352,282 28,775,012 c. Financial Intermediation 18,522,635 21,437,820 23,549,468
19,369,439 21,672,810 24,051,294
6,077,574 6,507,695 7,264,232 f. Other Services 29,865,829 33,487,470 35,860,739
GROSS DOMESTIC PRODUCT 279,786,746 299,257,679 326,245,344Source : National Statistical Coordination Board
REGIONAL ACCOUNTS OF THE PHILIPPINESUnit : In Thousand PesosTable 1.4B. REGION I, ILOCOSGROSS REGIONAL DOMESTIC PRODUCT BY INDUSTRIAL ORIGIN2010 TO 2012AT CONSTANT 2000 PRICES
2010 2011 2012
I. AGRI., HUNTING, FORESTRY & FISHING 47,101,435 48,500,991 50,293,503 a. Agriculture and Forestry 38,565,406 39,012,293 40,878,103 b. Fishing 8,536,029 9,488,698 9,415,400
II INDUSTRY SECTOR 48,717,542 47,156,712 48,870,782 a. Mining and Quarrying 2,765,065 2,913,468 3,343,237 b. Manufacturing 9,152,302 9,131,598 9,399,720 c. Construction 14,476,198 12,745,760 12,898,878 d. Electricity, Gas and Water Supply 22,323,977 22,365,886 23,228,946
III SERVICE SECTOR 84,108,812 88,588,897 94,577,561 a. Transport, Storage & Communication 19,643,326 20,300,640 21,946,258
14,723,598 15,221,830 16,443,804 c. Financial Intermediation 11,148,085 12,415,660 13,392,623
12,880,818 13,775,922 14,724,937
4,164,087 4,185,013 4,399,898 f. Other Services 21,548,897 22,689,833 23,670,041
GROSS DOMESTIC PRODUCT 179,927,789 184,246,599 193,741,846Source : National Statistical Coordination Board
d. R. Estate, Renting & Business e. Public Administration & Defense; Compulsory Social Security
INDUSTRY/YEAR
INDUSTRY/YEAR
b. Trade and Repair of Motor Vehicles, Motorcycles, Personal and Household Goods
d. R. Estate, Renting & Business e. Public Administration & Defense; Compulsory Social Security
b. Trade and Repair of Motor Vehicles, Motorcycles, Personal and Household Goods
Note: Regional levels may not add up to the national totals due to rounding. Page 82
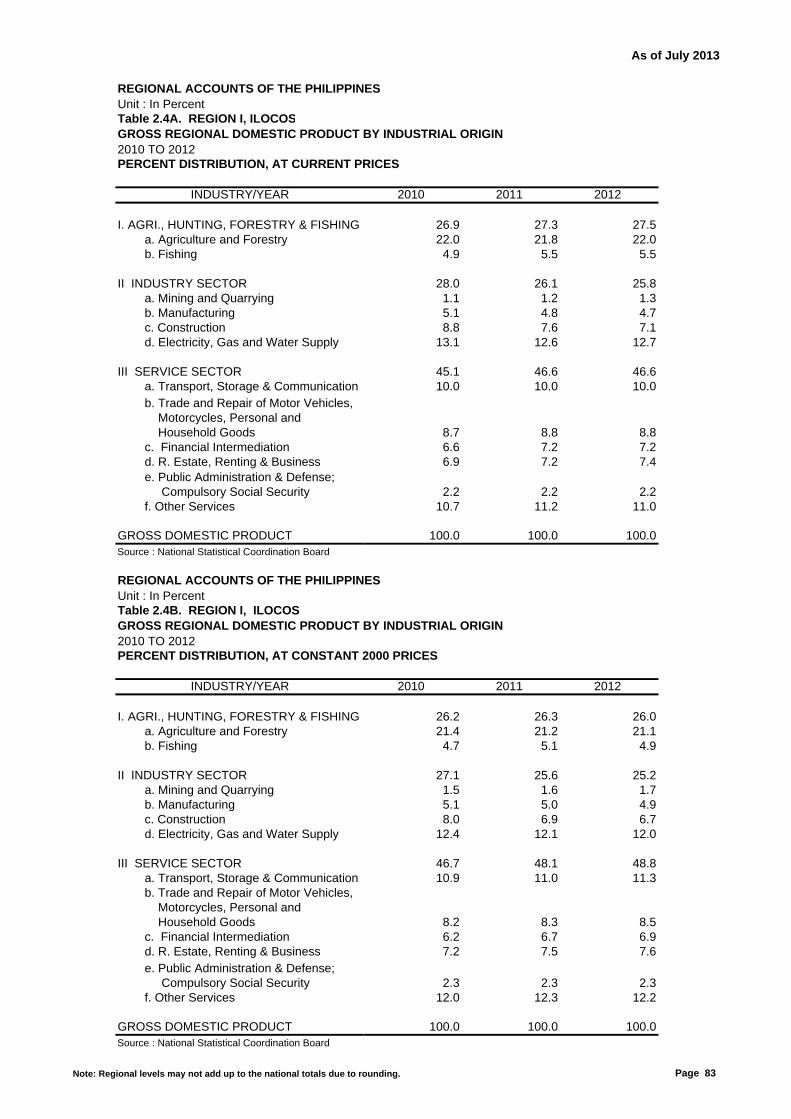
As of July 2013
REGIONAL ACCOUNTS OF THE PHILIPPINESUnit : In PercentTable 2.4A. REGION I, ILOCOSGROSS REGIONAL DOMESTIC PRODUCT BY INDUSTRIAL ORIGIN2010 TO 2012PERCENT DISTRIBUTION, AT CURRENT PRICES
2010 2011 2012
I. AGRI., HUNTING, FORESTRY & FISHING 26.9 27.3 27.5 a. Agriculture and Forestry 22.0 21.8 22.0 b. Fishing 4.9 5.5 5.5
II INDUSTRY SECTOR 28.0 26.1 25.8 a. Mining and Quarrying 1.1 1.2 1.3 b. Manufacturing 5.1 4.8 4.7 c. Construction 8.8 7.6 7.1 d. Electricity, Gas and Water Supply 13.1 12.6 12.7
III SERVICE SECTOR 45.1 46.6 46.6 a. Transport, Storage & Communication 10.0 10.0 10.0
8.7 8.8 8.8 c. Financial Intermediation 6.6 7.2 7.2
6.9 7.2 7.4
2.2 2.2 2.2 f. Other Services 10.7 11.2 11.0
GROSS DOMESTIC PRODUCT 100.0 100.0 100.0Source : National Statistical Coordination Board
REGIONAL ACCOUNTS OF THE PHILIPPINESUnit : In PercentTable 2.4B. REGION I, ILOCOSGROSS REGIONAL DOMESTIC PRODUCT BY INDUSTRIAL ORIGIN2010 TO 2012PERCENT DISTRIBUTION, AT CONSTANT 2000 PRICES
2010 2011 2012
I. AGRI., HUNTING, FORESTRY & FISHING 26.2 26.3 26.0 a. Agriculture and Forestry 21.4 21.2 21.1 b. Fishing 4.7 5.1 4.9
II INDUSTRY SECTOR 27.1 25.6 25.2 a. Mining and Quarrying 1.5 1.6 1.7 b. Manufacturing 5.1 5.0 4.9 c. Construction 8.0 6.9 6.7 d. Electricity, Gas and Water Supply 12.4 12.1 12.0
III SERVICE SECTOR 46.7 48.1 48.8 a. Transport, Storage & Communication 10.9 11.0 11.3
8.2 8.3 8.5 c. Financial Intermediation 6.2 6.7 6.9
7.2 7.5 7.6
2.3 2.3 2.3 f. Other Services 12.0 12.3 12.2
GROSS DOMESTIC PRODUCT 100.0 100.0 100.0Source : National Statistical Coordination Board
INDUSTRY/YEAR
b. Trade and Repair of Motor Vehicles, Motorcycles, Personal and Household Goods
d. R. Estate, Renting & Business e. Public Administration & Defense; Compulsory Social Security
b. Trade and Repair of Motor Vehicles, Motorcycles, Personal and Household Goods
INDUSTRY/YEAR
d. R. Estate, Renting & Business e. Public Administration & Defense; Compulsory Social Security
Note: Regional levels may not add up to the national totals due to rounding. Page 83
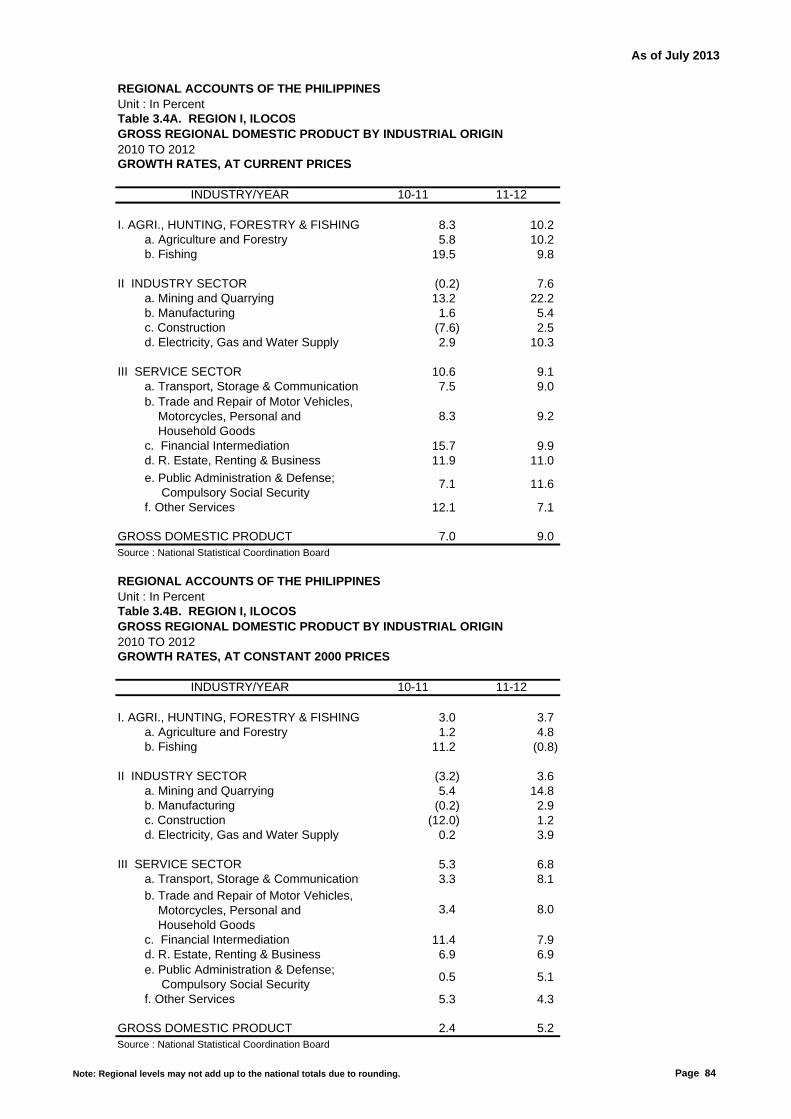
As of July 2013
REGIONAL ACCOUNTS OF THE PHILIPPINESUnit : In PercentTable 3.4A. REGION I, ILOCOSGROSS REGIONAL DOMESTIC PRODUCT BY INDUSTRIAL ORIGIN2010 TO 2012GROWTH RATES, AT CURRENT PRICES
10-11 11-12
I. AGRI., HUNTING, FORESTRY & FISHING 8.3 10.2 a. Agriculture and Forestry 5.8 10.2 b. Fishing 19.5 9.8
II INDUSTRY SECTOR (0.2) 7.6 a. Mining and Quarrying 13.2 22.2 b. Manufacturing 1.6 5.4 c. Construction (7.6) 2.5 d. Electricity, Gas and Water Supply 2.9 10.3
III SERVICE SECTOR 10.6 9.1 a. Transport, Storage & Communication 7.5 9.0
8.3 9.2
c. Financial Intermediation 15.7 9.911.9 11.0
7.1 11.6
f. Other Services 12.1 7.1
GROSS DOMESTIC PRODUCT 7.0 9.0Source : National Statistical Coordination Board
REGIONAL ACCOUNTS OF THE PHILIPPINESUnit : In PercentTable 3.4B. REGION I, ILOCOSGROSS REGIONAL DOMESTIC PRODUCT BY INDUSTRIAL ORIGIN2010 TO 2012GROWTH RATES, AT CONSTANT 2000 PRICES
10-11 11-12
I. AGRI., HUNTING, FORESTRY & FISHING 3.0 3.7 a. Agriculture and Forestry 1.2 4.8 b. Fishing 11.2 (0.8)
II INDUSTRY SECTOR (3.2) 3.6 a. Mining and Quarrying 5.4 14.8 b. Manufacturing (0.2) 2.9 c. Construction (12.0) 1.2 d. Electricity, Gas and Water Supply 0.2 3.9
III SERVICE SECTOR 5.3 6.8 a. Transport, Storage & Communication 3.3 8.1
3.4 8.0
c. Financial Intermediation 11.4 7.96.9 6.9
0.5 5.1
f. Other Services 5.3 4.3
GROSS DOMESTIC PRODUCT 2.4 5.2Source : National Statistical Coordination Board
e. Public Administration & Defense; Compulsory Social Security
b. Trade and Repair of Motor Vehicles, Motorcycles, Personal and Household Goods
d. R. Estate, Renting & Business
INDUSTRY/YEAR
INDUSTRY/YEAR
b. Trade and Repair of Motor Vehicles, Motorcycles, Personal and Household Goods
e. Public Administration & Defense; Compulsory Social Security
d. R. Estate, Renting & Business
Note: Regional levels may not add up to the national totals due to rounding. Page 84

As of July 2013
REGIONAL ACCOUNTS OF THE PHILIPPINESBase Year: 2000Table 4.4. REGION I, ILOCOSGROSS REGIONAL DOMESTIC PRODUCT BY INDUSTRIAL ORIGIN2010 TO 2012IMPLICIT PRICE INDEX
2010 2011 2012
I. AGRI., HUNTING, FORESTRY & FISHING 159.9 168.2 178.7 a. Agriculture and Forestry 159.7 167.1 175.8 b. Fishing 160.9 172.9 191.4
II INDUSTRY SECTOR 160.9 165.9 172.3 a. Mining and Quarrying 110.3 118.5 126.2 b. Manufacturing 155.4 158.2 161.9 c. Construction 169.2 177.6 179.9 d. Electricity, Gas and Water Supply 164.1 168.5 178.9
III SERVICE SECTOR 149.9 157.4 160.9 a. Transport, Storage & Communication 142.0 147.7 148.9
165.3 173.1 175.0
c. Financial Intermediation 166.2 172.7 175.8150.4 157.3 163.3
146.0 155.5 165.1
f. Other Services 138.6 147.6 151.5
GROSS DOMESTIC PRODUCT 155.5 162.4 168.4Source : National Statistical Coordination Board
INDUSTRY/YEAR
d. R. Estate, Renting & Business e. Public Administration & Defense; Compulsory Social Security
b. Trade and Repair of Motor Vehicles, Motorcycles, Personal and Household Goods
Note: Regional levels may not add up to the national totals due to rounding. Page 85

As of July 2013
REGIONAL ACCOUNTS OF THE PHILIPPINESUnit : In Thousand PesosTable 1.5A. REGION II, CAGAYAN VALLEYGROSS REGIONAL DOMESTIC PRODUCT BY INDUSTRIAL ORIGIN2010 TO 2012AT CURRENT PRICES
2010 2011 2012
I. AGRI., HUNTING, FORESTRY & FISHING 58,177,040 70,658,506 80,944,596 a. Agriculture and Forestry 55,985,652 68,159,849 78,332,130 b. Fishing 2,191,388 2,498,657 2,612,465
II INDUSTRY SECTOR 19,465,105 17,150,923 20,008,115 a. Mining and Quarrying 1,531,014 1,746,519 2,135,346 b. Manufacturing 2,055,327 2,349,906 2,375,755 c. Construction 12,323,927 9,447,398 11,450,803 d. Electricity, Gas and Water Supply 3,554,837 3,607,101 4,046,211
III SERVICE SECTOR 71,922,133 78,299,269 86,894,301 a. Transport, Storage & Communication 18,026,705 19,204,274 22,001,490
8,707,293 9,505,966 10,249,403 c. Financial Intermediation 8,884,821 9,546,477 10,908,089
8,770,954 9,559,187 10,381,848
9,278,183 9,817,167 10,876,219 f. Other Services 18,254,177 20,666,198 22,477,252
GROSS DOMESTIC PRODUCT 149,564,277 166,108,698 187,847,012Source : National Statistical Coordination Board
REGIONAL ACCOUNTS OF THE PHILIPPINESUnit : In Thousand PesosTable 1.5B. REGION II, CAGAYAN VALLEYGROSS REGIONAL DOMESTIC PRODUCT BY INDUSTRIAL ORIGIN2010 TO 2012AT CONSTANT 2000 PRICES
2010 2011 2012
I. AGRI., HUNTING, FORESTRY & FISHING 37,870,777 43,020,729 46,598,261 a. Agriculture and Forestry 35,066,767 40,086,871 43,851,520 b. Fishing 2,804,010 2,933,858 2,746,741
II INDUSTRY SECTOR 12,857,869 11,087,956 12,509,453 a. Mining and Quarrying 1,618,000 1,722,221 1,995,138 b. Manufacturing 1,337,822 1,482,020 1,494,334 c. Construction 7,568,205 5,539,796 6,564,192 d. Electricity, Gas and Water Supply 2,333,842 2,343,919 2,455,789
III SERVICE SECTOR 49,111,114 51,325,538 54,957,281 a. Transport, Storage & Communication 12,518,629 12,846,360 14,267,731
5,240,001 5,408,209 5,700,733 c. Financial Intermediation 5,407,145 5,515,286 6,147,489
6,291,368 6,585,216 6,931,371
6,357,004 6,313,291 6,587,655 f. Other Services 13,296,967 14,657,176 15,322,302
GROSS DOMESTIC PRODUCT 99,839,760 105,434,223 114,064,995Source : National Statistical Coordination Board
b. Trade and Repair of Motor Vehicles, Motorcycles, Personal and Household Goods
d. R. Estate, Renting & Business e. Public Administration & Defense; Compulsory Social Security
INDUSTRY/YEAR
INDUSTRY/YEAR
b. Trade and Repair of Motor Vehicles, Motorcycles, Personal and Household Goods
d. R. Estate, Renting & Business e. Public Administration & Defense; Compulsory Social Security
Note: Regional levels may not add up to the national totals due to rounding. Page 86
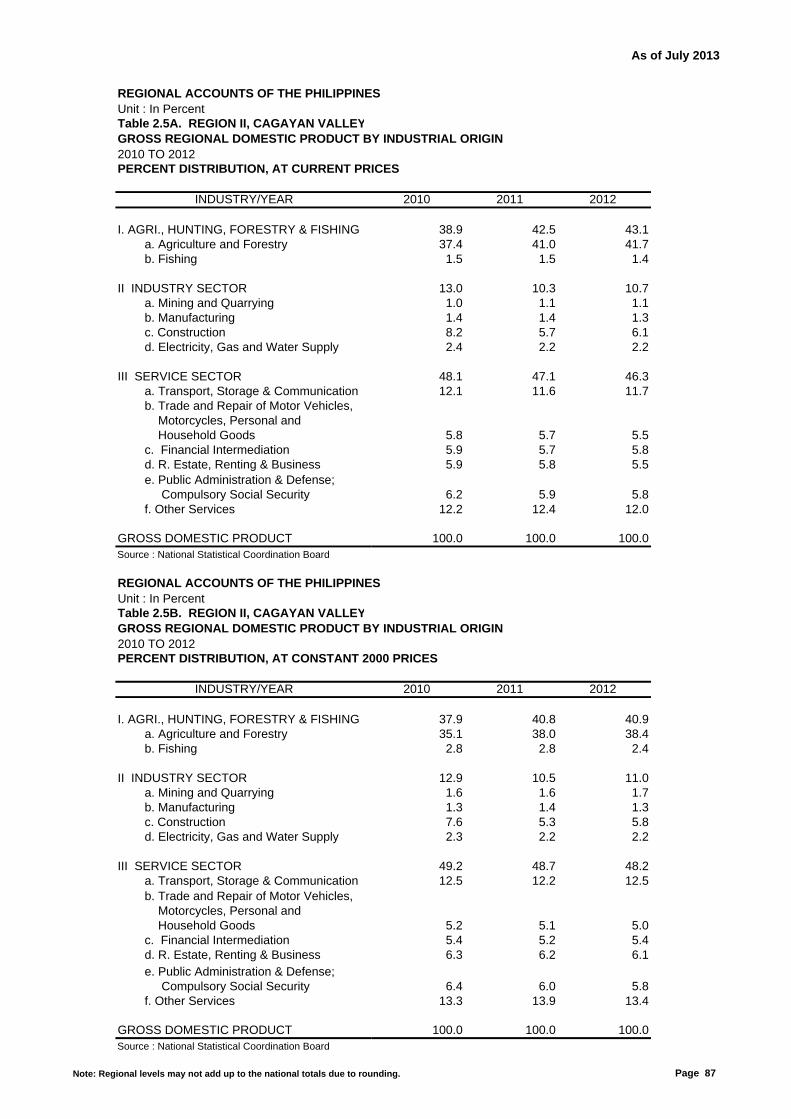
As of July 2013
REGIONAL ACCOUNTS OF THE PHILIPPINESUnit : In PercentTable 2.5A. REGION II, CAGAYAN VALLEYGROSS REGIONAL DOMESTIC PRODUCT BY INDUSTRIAL ORIGIN2010 TO 2012PERCENT DISTRIBUTION, AT CURRENT PRICES
2010 2011 2012
I. AGRI., HUNTING, FORESTRY & FISHING 38.9 42.5 43.1 a. Agriculture and Forestry 37.4 41.0 41.7 b. Fishing 1.5 1.5 1.4
II INDUSTRY SECTOR 13.0 10.3 10.7 a. Mining and Quarrying 1.0 1.1 1.1 b. Manufacturing 1.4 1.4 1.3 c. Construction 8.2 5.7 6.1 d. Electricity, Gas and Water Supply 2.4 2.2 2.2
III SERVICE SECTOR 48.1 47.1 46.3 a. Transport, Storage & Communication 12.1 11.6 11.7
5.8 5.7 5.5 c. Financial Intermediation 5.9 5.7 5.8
5.9 5.8 5.5
6.2 5.9 5.8 f. Other Services 12.2 12.4 12.0
GROSS DOMESTIC PRODUCT 100.0 100.0 100.0Source : National Statistical Coordination Board
REGIONAL ACCOUNTS OF THE PHILIPPINESUnit : In PercentTable 2.5B. REGION II, CAGAYAN VALLEYGROSS REGIONAL DOMESTIC PRODUCT BY INDUSTRIAL ORIGIN2010 TO 2012PERCENT DISTRIBUTION, AT CONSTANT 2000 PRICES
2010 2011 2012
I. AGRI., HUNTING, FORESTRY & FISHING 37.9 40.8 40.9 a. Agriculture and Forestry 35.1 38.0 38.4 b. Fishing 2.8 2.8 2.4
II INDUSTRY SECTOR 12.9 10.5 11.0 a. Mining and Quarrying 1.6 1.6 1.7 b. Manufacturing 1.3 1.4 1.3 c. Construction 7.6 5.3 5.8 d. Electricity, Gas and Water Supply 2.3 2.2 2.2
III SERVICE SECTOR 49.2 48.7 48.2 a. Transport, Storage & Communication 12.5 12.2 12.5
5.2 5.1 5.0 c. Financial Intermediation 5.4 5.2 5.4
6.3 6.2 6.1
6.4 6.0 5.8 f. Other Services 13.3 13.9 13.4
GROSS DOMESTIC PRODUCT 100.0 100.0 100.0Source : National Statistical Coordination Board
INDUSTRY/YEAR
b. Trade and Repair of Motor Vehicles, Motorcycles, Personal and Household Goods
d. R. Estate, Renting & Business e. Public Administration & Defense; Compulsory Social Security
b. Trade and Repair of Motor Vehicles, Motorcycles, Personal and Household Goods
INDUSTRY/YEAR
d. R. Estate, Renting & Business e. Public Administration & Defense; Compulsory Social Security
Note: Regional levels may not add up to the national totals due to rounding. Page 87

As of July 2013
REGIONAL ACCOUNTS OF THE PHILIPPINESUnit : In PercentTable 3.5A. REGION II, CAGAYAN VALLEYGROSS REGIONAL DOMESTIC PRODUCT BY INDUSTRIAL ORIGIN2010 TO 2012GROWTH RATES, AT CURRENT PRICES
10-11 11-12
I. AGRI., HUNTING, FORESTRY & FISHING 21.5 14.6 a. Agriculture and Forestry 21.7 14.9 b. Fishing 14.0 4.6
II INDUSTRY SECTOR (11.9) 16.7 a. Mining and Quarrying 14.1 22.3 b. Manufacturing 14.3 1.1 c. Construction (23.3) 21.2 d. Electricity, Gas and Water Supply 1.5 12.2
III SERVICE SECTOR 8.9 11.0 a. Transport, Storage & Communication 6.5 14.6
9.2 7.8
c. Financial Intermediation 7.4 14.39.0 8.6
5.8 10.8
f. Other Services 13.2 8.8
GROSS DOMESTIC PRODUCT 11.1 13.1Source : National Statistical Coordination Board
REGIONAL ACCOUNTS OF THE PHILIPPINESUnit : In PercentTable 3.5B. REGION II, CAGAYAN VALLEYGROSS REGIONAL DOMESTIC PRODUCT BY INDUSTRIAL ORIGIN2010 TO 2012GROWTH RATES, AT CONSTANT 2000 PRICES
10-11 11-12
I. AGRI., HUNTING, FORESTRY & FISHING 13.6 8.3 a. Agriculture and Forestry 14.3 9.4 b. Fishing 4.6 (6.4)
II INDUSTRY SECTOR (13.8) 12.8 a. Mining and Quarrying 6.4 15.8 b. Manufacturing 10.8 0.8 c. Construction (26.8) 18.5 d. Electricity, Gas and Water Supply 0.4 4.8
III SERVICE SECTOR 4.5 7.1 a. Transport, Storage & Communication 2.6 11.1
3.2 5.4
c. Financial Intermediation 2.0 11.54.7 5.3
(0.7) 4.3
f. Other Services 10.2 4.5
GROSS DOMESTIC PRODUCT 5.6 8.2Source : National Statistical Coordination Board
b. Trade and Repair of Motor Vehicles, Motorcycles, Personal and Household Goods
d. R. Estate, Renting & Business
INDUSTRY/YEAR
INDUSTRY/YEAR
b. Trade and Repair of Motor Vehicles, Motorcycles, Personal and Household Goods
d. R. Estate, Renting & Business
e. Public Administration & Defense; Compulsory Social Security
e. Public Administration & Defense; Compulsory Social Security
Note: Regional levels may not add up to the national totals due to rounding. Page 88

As of July 2013
REGIONAL ACCOUNTS OF THE PHILIPPINESBase Year: 2000Table 4.5. REGION II, CAGAYAN VALLEYGROSS REGIONAL DOMESTIC PRODUCT BY INDUSTRIAL ORIGIN2010 TO 2012IMPLICIT PRICE INDEX
2010 2011 2012
I. AGRI., HUNTING, FORESTRY & FISHING 153.6 164.2 173.7 a. Agriculture and Forestry 159.7 170.0 178.6 b. Fishing 78.2 85.2 95.1
II INDUSTRY SECTOR 151.4 154.7 159.9 a. Mining and Quarrying 94.6 101.4 107.0 b. Manufacturing 153.6 158.6 159.0 c. Construction 162.8 170.5 174.4 d. Electricity, Gas and Water Supply 152.3 153.9 164.8
III SERVICE SECTOR 146.4 152.6 158.1 a. Transport, Storage & Communication 144.0 149.5 154.2
166.2 175.8 179.8
c. Financial Intermediation 164.3 173.1 177.4139.4 145.2 149.8
146.0 155.5 165.1
f. Other Services 137.3 141.0 146.7
GROSS DOMESTIC PRODUCT 149.8 157.5 164.7Source : National Statistical Coordination Board
INDUSTRY/YEAR
d. R. Estate, Renting & Business
e. Public Administration & Defense; Compulsory Social Security
b. Trade and Repair of Motor Vehicles, Motorcycles, Personal and Household Goods
Note: Regional levels may not add up to the national totals due to rounding. Page 89

As of July 2013
REGIONAL ACCOUNTS OF THE PHILIPPINESUnit : In Thousand PesosTable 1.6A. REGION III, CENTRAL LUZONGROSS REGIONAL DOMESTIC PRODUCT BY INDUSTRIAL ORIGIN2010 TO 2012AT CURRENT PRICES
2010 2011 2012
I. AGRI., HUNTING, FORESTRY & FISHING 144,601,804 150,699,474 164,285,822 a. Agriculture and Forestry 109,203,250 114,761,612 127,770,762 b. Fishing 35,398,554 35,937,862 36,515,060
II INDUSTRY SECTOR 319,691,249 372,777,105 398,155,916 a. Mining and Quarrying 1,725,206 2,927,017 4,242,376 b. Manufacturing 248,467,722 296,291,304 307,550,373 c. Construction 51,296,980 54,992,125 65,090,007 d. Electricity, Gas and Water Supply 18,201,341 18,566,659 21,273,159
III SERVICE SECTOR 331,209,500 362,307,269 396,350,337 a. Transport, Storage & Communication 80,690,827 85,325,488 90,351,028
73,064,171 79,245,555 86,893,222 c. Financial Intermediation 47,827,097 54,624,825 60,907,530
62,336,942 68,380,436 75,970,786
18,953,688 20,323,734 22,925,311 f. Other Services 48,336,775 54,407,231 59,302,461
GROSS DOMESTIC PRODUCT 795,502,554 885,783,847 958,792,075Source : National Statistical Coordination Board
REGIONAL ACCOUNTS OF THE PHILIPPINESUnit : In Thousand PesosTable 1.6B REGION III, CENTRAL LUZONGROSS REGIONAL DOMESTIC PRODUCT BY INDUSTRIAL ORIGIN2010 TO 2012AT CONSTANT 2000 PRICES
2010 2011 2012
I. AGRI., HUNTING, FORESTRY & FISHING 90,796,967 89,646,191 97,832,317 a. Agriculture and Forestry 71,726,112 70,861,409 79,063,946 b. Fishing 19,070,855 18,784,782 18,768,371
II INDUSTRY SECTOR 205,185,504 233,021,730 245,523,241 a. Mining and Quarrying 1,623,419 2,154,988 3,053,134 b. Manufacturing 161,333,911 187,735,906 194,000,272 c. Construction 29,874,541 30,837,311 35,454,260 d. Electricity, Gas and Water Supply 12,353,634 12,293,525 13,015,576
III SERVICE SECTOR 214,635,393 224,162,563 238,026,576 a. Transport, Storage & Communication 52,622,960 54,102,485 57,273,637
44,957,026 46,402,848 49,487,527 c. Financial Intermediation 29,057,837 31,727,719 34,211,023
39,689,226 42,144,073 45,166,782
12,986,236 13,069,925 13,885,712 f. Other Services 35,322,107 36,715,514 38,001,895
GROSS DOMESTIC PRODUCT 510,617,864 546,830,485 581,382,134Source : National Statistical Coordination Board
b. Trade and Repair of Motor Vehicles, Motorcycles, Personal and Household Goods
d. R. Estate, Renting & Business e. Public Administration & Defense; Compulsory Social Security
INDUSTRY/YEAR
INDUSTRY/YEAR
b. Trade and Repair of Motor Vehicles, Motorcycles, Personal and Household Goods
d. R. Estate, Renting & Business e. Public Administration & Defense; Compulsory Social Security
Note: Regional levels may not add up to the national totals due to rounding. Page 90
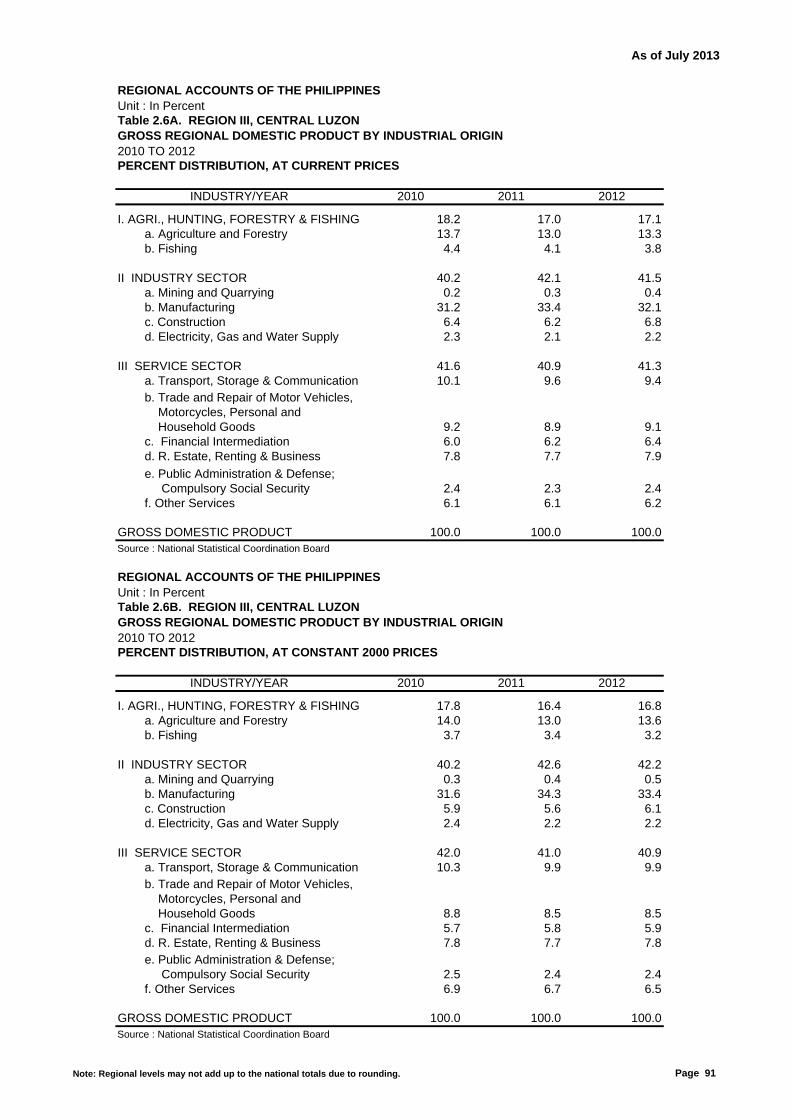
As of July 2013
REGIONAL ACCOUNTS OF THE PHILIPPINESUnit : In PercentTable 2.6A. REGION III, CENTRAL LUZONGROSS REGIONAL DOMESTIC PRODUCT BY INDUSTRIAL ORIGIN2010 TO 2012PERCENT DISTRIBUTION, AT CURRENT PRICES
2010 2011 2012
I. AGRI., HUNTING, FORESTRY & FISHING 18.2 17.0 17.1 a. Agriculture and Forestry 13.7 13.0 13.3 b. Fishing 4.4 4.1 3.8
II INDUSTRY SECTOR 40.2 42.1 41.5 a. Mining and Quarrying 0.2 0.3 0.4 b. Manufacturing 31.2 33.4 32.1 c. Construction 6.4 6.2 6.8 d. Electricity, Gas and Water Supply 2.3 2.1 2.2
III SERVICE SECTOR 41.6 40.9 41.3 a. Transport, Storage & Communication 10.1 9.6 9.4
9.2 8.9 9.1 c. Financial Intermediation 6.0 6.2 6.4
7.8 7.7 7.9
2.4 2.3 2.4 f. Other Services 6.1 6.1 6.2
GROSS DOMESTIC PRODUCT 100.0 100.0 100.0Source : National Statistical Coordination Board
REGIONAL ACCOUNTS OF THE PHILIPPINESUnit : In PercentTable 2.6B. REGION III, CENTRAL LUZONGROSS REGIONAL DOMESTIC PRODUCT BY INDUSTRIAL ORIGIN2010 TO 2012PERCENT DISTRIBUTION, AT CONSTANT 2000 PRICES
2010 2011 2012
I. AGRI., HUNTING, FORESTRY & FISHING 17.8 16.4 16.8 a. Agriculture and Forestry 14.0 13.0 13.6 b. Fishing 3.7 3.4 3.2
II INDUSTRY SECTOR 40.2 42.6 42.2 a. Mining and Quarrying 0.3 0.4 0.5 b. Manufacturing 31.6 34.3 33.4 c. Construction 5.9 5.6 6.1 d. Electricity, Gas and Water Supply 2.4 2.2 2.2
III SERVICE SECTOR 42.0 41.0 40.9 a. Transport, Storage & Communication 10.3 9.9 9.9
8.8 8.5 8.5 c. Financial Intermediation 5.7 5.8 5.9
7.8 7.7 7.8
2.5 2.4 2.4 f. Other Services 6.9 6.7 6.5
GROSS DOMESTIC PRODUCT 100.0 100.0 100.0Source : National Statistical Coordination Board
INDUSTRY/YEAR
b. Trade and Repair of Motor Vehicles, Motorcycles, Personal and Household Goods
d. R. Estate, Renting & Business
e. Public Administration & Defense; Compulsory Social Security
b. Trade and Repair of Motor Vehicles, Motorcycles, Personal and Household Goods
INDUSTRY/YEAR
d. R. Estate, Renting & Business e. Public Administration & Defense; Compulsory Social Security
Note: Regional levels may not add up to the national totals due to rounding. Page 91
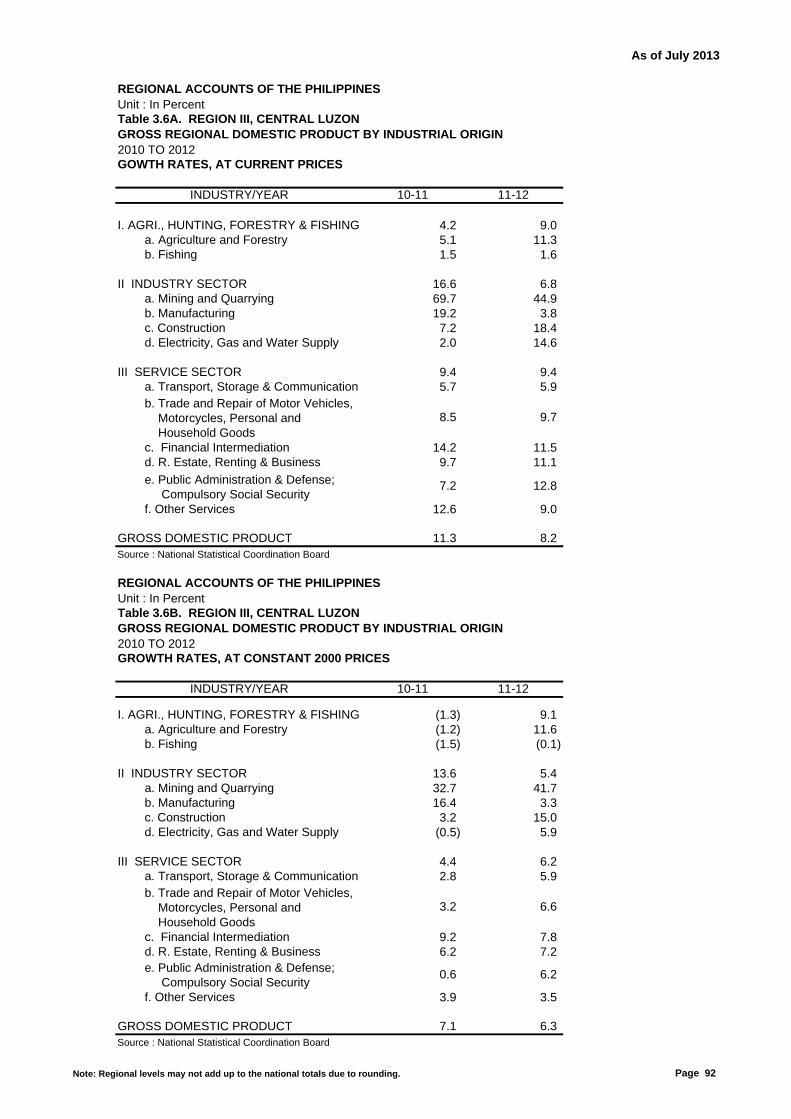
As of July 2013
REGIONAL ACCOUNTS OF THE PHILIPPINESUnit : In PercentTable 3.6A. REGION III, CENTRAL LUZONGROSS REGIONAL DOMESTIC PRODUCT BY INDUSTRIAL ORIGIN2010 TO 2012GOWTH RATES, AT CURRENT PRICES
10-11 11-12
I. AGRI., HUNTING, FORESTRY & FISHING 4.2 9.0 a. Agriculture and Forestry 5.1 11.3 b. Fishing 1.5 1.6
II INDUSTRY SECTOR 16.6 6.8 a. Mining and Quarrying 69.7 44.9 b. Manufacturing 19.2 3.8 c. Construction 7.2 18.4 d. Electricity, Gas and Water Supply 2.0 14.6
III SERVICE SECTOR 9.4 9.4 a. Transport, Storage & Communication 5.7 5.9
8.5 9.7
c. Financial Intermediation 14.2 11.59.7 11.1
7.2 12.8
f. Other Services 12.6 9.0
GROSS DOMESTIC PRODUCT 11.3 8.2Source : National Statistical Coordination Board
REGIONAL ACCOUNTS OF THE PHILIPPINESUnit : In PercentTable 3.6B. REGION III, CENTRAL LUZONGROSS REGIONAL DOMESTIC PRODUCT BY INDUSTRIAL ORIGIN2010 TO 2012GROWTH RATES, AT CONSTANT 2000 PRICES
10-11 11-12
I. AGRI., HUNTING, FORESTRY & FISHING (1.3) 9.1 a. Agriculture and Forestry (1.2) 11.6 b. Fishing (1.5) (0.1)
II INDUSTRY SECTOR 13.6 5.4 a. Mining and Quarrying 32.7 41.7 b. Manufacturing 16.4 3.3 c. Construction 3.2 15.0 d. Electricity, Gas and Water Supply (0.5) 5.9
III SERVICE SECTOR 4.4 6.2 a. Transport, Storage & Communication 2.8 5.9
3.2 6.6
c. Financial Intermediation 9.2 7.86.2 7.2
0.6 6.2
f. Other Services 3.9 3.5
GROSS DOMESTIC PRODUCT 7.1 6.3Source : National Statistical Coordination Board
b. Trade and Repair of Motor Vehicles, Motorcycles, Personal and Household Goods
d. R. Estate, Renting & Business
INDUSTRY/YEAR
INDUSTRY/YEAR
b. Trade and Repair of Motor Vehicles, Motorcycles, Personal and Household Goods
d. R. Estate, Renting & Business
e. Public Administration & Defense; Compulsory Social Security
e. Public Administration & Defense; Compulsory Social Security
Note: Regional levels may not add up to the national totals due to rounding. Page 92

As of July 2013
REGIONAL ACCOUNTS OF THE PHILIPPINESBase Year: 2000Table 4.6. REGION III, CENTRAL LUZONGROSS REGIONAL DOMESTIC PRODUCT BY INDUSTRIAL ORIGIN2010 TO 2012IMPLICIT PRICE INDEX
2010 2011 2012
I. AGRI., HUNTING, FORESTRY & FISHING 159.3 168.1 167.9 a. Agriculture and Forestry 152.3 162.0 161.6 b. Fishing 185.6 191.3 194.6
II INDUSTRY SECTOR 155.8 160.0 162.2 a. Mining and Quarrying 106.3 135.8 139.0 b. Manufacturing 154.0 157.8 158.5 c. Construction 171.7 178.3 183.6 d. Electricity, Gas and Water Supply 147.3 151.0 163.4
III SERVICE SECTOR 154.3 161.6 166.5 a. Transport, Storage & Communication 153.3 157.7 157.8
162.5 170.8 175.6
c. Financial Intermediation 164.6 172.2 178.0157.1 162.3 168.2
146.0 155.5 165.1
f. Other Services 136.8 148.2 156.1
GROSS DOMESTIC PRODUCT 155.8 162.0 164.9Source : National Statistical Coordination Board
INDUSTRY/YEAR
d. R. Estate, Renting & Business e. Public Administration & Defense; Compulsory Social Security
b. Trade and Repair of Motor Vehicles, Motorcycles, Personal and Household Goods
Note: Regional levels may not add up to the national totals due to rounding. Page 93

As of July 2013
REGIONAL ACCOUNTS OF THE PHILIPPINESUnit : In Thousand PesosTable 1.7A. REGION IVA, CALABARZONGROSS REGIONAL DOMESTIC PRODUCT BY INDUSTRIAL ORIGIN2010 TO 2012AT CURRENT PRICES
2010 2011 2012
I. AGRI., HUNTING, FORESTRY & FISHING 103,982,332 112,759,271 108,587,142 a. Agriculture and Forestry 79,232,634 88,754,058 81,425,746 b. Fishing 24,749,698 24,005,213 27,161,395
II INDUSTRY SECTOR 983,217,202 1,009,599,221 1,086,145,388 a. Mining and Quarrying 1,739,324 1,916,330 2,161,857 b. Manufacturing 844,200,346 868,939,958 918,498,671 c. Construction 72,996,292 73,656,903 93,255,643 d. Electricity, Gas and Water Supply 64,281,240 65,086,030 72,229,218
III SERVICE SECTOR 474,306,237 517,647,366 575,870,627 a. Transport, Storage & Communication 85,680,460 88,778,195 97,216,878
126,409,269 138,720,878 152,263,533 c. Financial Intermediation 52,389,378 57,811,275 66,034,314
127,557,260 144,525,004 163,946,914
18,701,253 20,103,471 22,837,801 f. Other Services 63,568,616 67,708,544 73,571,186
GROSS DOMESTIC PRODUCT 1,561,505,771 1,640,005,858 1,770,603,157Source : National Statistical Coordination Board
REGIONAL ACCOUNTS OF THE PHILIPPINESUnit : In Thousand PesosTable 1.7B. REGION IVA, CALABARZONGROSS REGIONAL DOMESTIC PRODUCT BY INDUSTRIAL ORIGIN2010 TO 2012AT CONSTANT 2000 PRICES
2010 2011 2012
I. AGRI., HUNTING, FORESTRY & FISHING 66,912,669 67,743,388 69,443,773 a. Agriculture and Forestry 48,867,760 50,718,517 51,756,013 b. Fishing 18,044,909 17,024,871 17,687,760
II INDUSTRY SECTOR 628,755,840 629,125,013 672,757,543 a. Mining and Quarrying 1,780,027 1,838,350 1,875,682 b. Manufacturing 547,089,228 548,548,205 581,083,857 c. Construction 42,082,824 40,741,522 50,325,256 d. Electricity, Gas and Water Supply 37,803,761 37,996,936 39,472,748
III SERVICE SECTOR 313,721,024 329,178,325 355,518,964 a. Transport, Storage & Communication 64,804,284 67,036,558 72,296,197
78,038,472 81,438,257 87,376,119 c. Financial Intermediation 31,819,932 33,513,177 37,228,829
78,233,176 85,362,809 93,113,498
12,813,279 12,928,277 13,832,708 f. Other Services 48,011,881 48,899,248 51,671,614
GROSS DOMESTIC PRODUCT 1,009,389,533 1,026,046,727 1,097,720,281Source : National Statistical Coordination Board
d. R. Estate, Renting & Business e. Public Administration & Defense; Compulsory Social Security
INDUSTRY/YEAR
INDUSTRY/YEAR
b. Trade and Repair of Motor Vehicles, Motorcycles, Personal and Household Goods
d. R. Estate, Renting & Business e. Public Administration & Defense; Compulsory Social Security
b. Trade and Repair of Motor Vehicles, Motorcycles, Personal and Household Goods
Note: Regional levels may not add up to the national totals due to rounding. Page 94
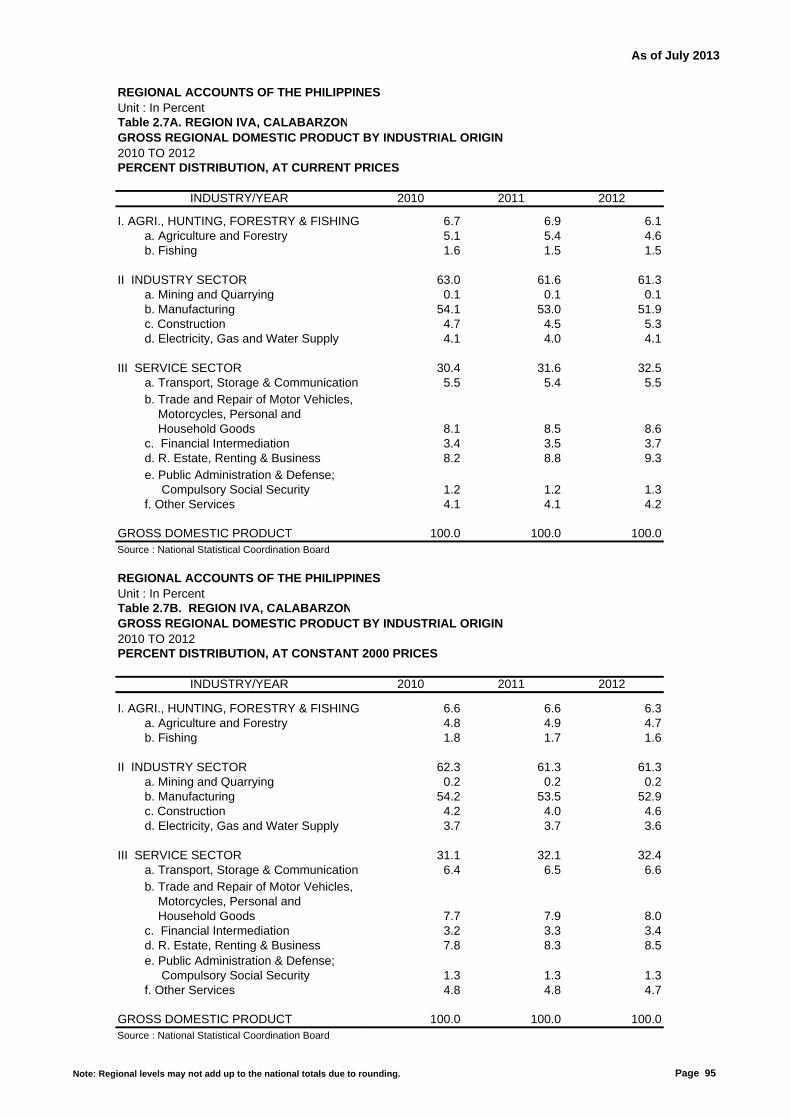
As of July 2013
REGIONAL ACCOUNTS OF THE PHILIPPINESUnit : In PercentTable 2.7A. REGION IVA, CALABARZONGROSS REGIONAL DOMESTIC PRODUCT BY INDUSTRIAL ORIGIN2010 TO 2012PERCENT DISTRIBUTION, AT CURRENT PRICES
2010 2011 2012
I. AGRI., HUNTING, FORESTRY & FISHING 6.7 6.9 6.1 a. Agriculture and Forestry 5.1 5.4 4.6 b. Fishing 1.6 1.5 1.5
II INDUSTRY SECTOR 63.0 61.6 61.3 a. Mining and Quarrying 0.1 0.1 0.1 b. Manufacturing 54.1 53.0 51.9 c. Construction 4.7 4.5 5.3 d. Electricity, Gas and Water Supply 4.1 4.0 4.1
III SERVICE SECTOR 30.4 31.6 32.5 a. Transport, Storage & Communication 5.5 5.4 5.5
8.1 8.5 8.6 c. Financial Intermediation 3.4 3.5 3.7
8.2 8.8 9.3
1.2 1.2 1.3 f. Other Services 4.1 4.1 4.2
GROSS DOMESTIC PRODUCT 100.0 100.0 100.0Source : National Statistical Coordination Board
REGIONAL ACCOUNTS OF THE PHILIPPINESUnit : In PercentTable 2.7B. REGION IVA, CALABARZONGROSS REGIONAL DOMESTIC PRODUCT BY INDUSTRIAL ORIGIN2010 TO 2012PERCENT DISTRIBUTION, AT CONSTANT 2000 PRICES
2010 2011 2012
I. AGRI., HUNTING, FORESTRY & FISHING 6.6 6.6 6.3 a. Agriculture and Forestry 4.8 4.9 4.7 b. Fishing 1.8 1.7 1.6
II INDUSTRY SECTOR 62.3 61.3 61.3 a. Mining and Quarrying 0.2 0.2 0.2 b. Manufacturing 54.2 53.5 52.9 c. Construction 4.2 4.0 4.6 d. Electricity, Gas and Water Supply 3.7 3.7 3.6
III SERVICE SECTOR 31.1 32.1 32.4 a. Transport, Storage & Communication 6.4 6.5 6.6
7.7 7.9 8.0 c. Financial Intermediation 3.2 3.3 3.4
7.8 8.3 8.5
1.3 1.3 1.3 f. Other Services 4.8 4.8 4.7
GROSS DOMESTIC PRODUCT 100.0 100.0 100.0Source : National Statistical Coordination Board
INDUSTRY/YEAR
b. Trade and Repair of Motor Vehicles, Motorcycles, Personal and Household Goods
d. R. Estate, Renting & Business e. Public Administration & Defense; Compulsory Social Security
b. Trade and Repair of Motor Vehicles, Motorcycles, Personal and Household Goods
INDUSTRY/YEAR
d. R. Estate, Renting & Business e. Public Administration & Defense; Compulsory Social Security
Note: Regional levels may not add up to the national totals due to rounding. Page 95
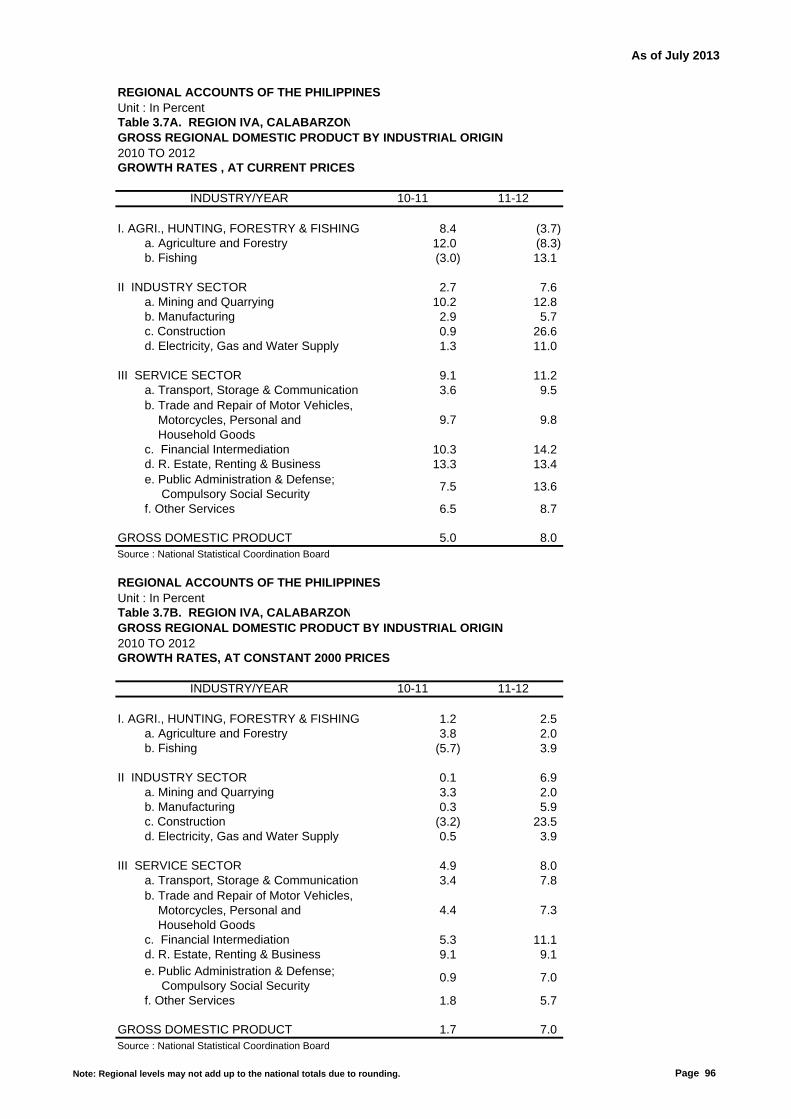
As of July 2013
REGIONAL ACCOUNTS OF THE PHILIPPINESUnit : In PercentTable 3.7A. REGION IVA, CALABARZONGROSS REGIONAL DOMESTIC PRODUCT BY INDUSTRIAL ORIGIN2010 TO 2012GROWTH RATES , AT CURRENT PRICES
10-11 11-12
I. AGRI., HUNTING, FORESTRY & FISHING 8.4 (3.7) a. Agriculture and Forestry 12.0 (8.3) b. Fishing (3.0) 13.1
II INDUSTRY SECTOR 2.7 7.6 a. Mining and Quarrying 10.2 12.8 b. Manufacturing 2.9 5.7 c. Construction 0.9 26.6 d. Electricity, Gas and Water Supply 1.3 11.0
III SERVICE SECTOR 9.1 11.2 a. Transport, Storage & Communication 3.6 9.5
9.7 9.8
c. Financial Intermediation 10.3 14.213.3 13.4
7.5 13.6
f. Other Services 6.5 8.7
GROSS DOMESTIC PRODUCT 5.0 8.0Source : National Statistical Coordination Board
REGIONAL ACCOUNTS OF THE PHILIPPINESUnit : In PercentTable 3.7B. REGION IVA, CALABARZONGROSS REGIONAL DOMESTIC PRODUCT BY INDUSTRIAL ORIGIN2010 TO 2012GROWTH RATES, AT CONSTANT 2000 PRICES
10-11 11-12
I. AGRI., HUNTING, FORESTRY & FISHING 1.2 2.5 a. Agriculture and Forestry 3.8 2.0 b. Fishing (5.7) 3.9
II INDUSTRY SECTOR 0.1 6.9 a. Mining and Quarrying 3.3 2.0 b. Manufacturing 0.3 5.9 c. Construction (3.2) 23.5 d. Electricity, Gas and Water Supply 0.5 3.9
III SERVICE SECTOR 4.9 8.0 a. Transport, Storage & Communication 3.4 7.8
4.4 7.3
c. Financial Intermediation 5.3 11.19.1 9.1
0.9 7.0
f. Other Services 1.8 5.7
GROSS DOMESTIC PRODUCT 1.7 7.0Source : National Statistical Coordination Board
e. Public Administration & Defense; Compulsory Social Security
b. Trade and Repair of Motor Vehicles, Motorcycles, Personal and Household Goods
d. R. Estate, Renting & Business
INDUSTRY/YEAR
INDUSTRY/YEAR
b. Trade and Repair of Motor Vehicles, Motorcycles, Personal and Household Goods
e. Public Administration & Defense; Compulsory Social Security
d. R. Estate, Renting & Business
Note: Regional levels may not add up to the national totals due to rounding. Page 96

As of July 2013
REGIONAL ACCOUNTS OF THE PHILIPPINESBase Year: 2000Table 4.7. REGION IVA, CALABARZONGROSS REGIONAL DOMESTIC PRODUCT BY INDUSTRIAL ORIGIN2010 TO 2012IMPLICIT PRICE INDEX
2010 2011 2012
I. AGRI., HUNTING, FORESTRY & FISHING 155.4 166.5 156.4 a. Agriculture and Forestry 162.1 175.0 157.3 b. Fishing 137.2 141.0 153.6
II INDUSTRY SECTOR 156.4 160.5 161.4 a. Mining and Quarrying 97.7 104.2 115.3 b. Manufacturing 154.3 158.4 158.1 c. Construction 173.5 180.8 185.3 d. Electricity, Gas and Water Supply 170.0 171.3 183.0
III SERVICE SECTOR 151.2 157.3 162.0 a. Transport, Storage & Communication 132.2 132.4 134.5
162.0 170.3 174.3
c. Financial Intermediation 164.6 172.5 177.4163.0 169.3 176.1
146.0 155.5 165.1
f. Other Services 132.4 138.5 142.4
GROSS DOMESTIC PRODUCT 154.7 159.8 161.3Source : National Statistical Coordination Board
INDUSTRY/YEAR
d. R. Estate, Renting & Business e. Public Administration & Defense; Compulsory Social Security
b. Trade and Repair of Motor Vehicles, Motorcycles, Personal and Household Goods
Note: Regional levels may not add up to the national totals due to rounding. Page 97

As of July 2013
REGIONAL ACCOUNTS OF THE PHILIPPINESUnit : In Thousand PesosTable 1.8A. REGION IVB, MIMAROPAGROSS REGIONAL DOMESTIC PRODUCT BY INDUSTRIAL ORIGIN2010 TO 2012AT CURRENT PRICES
2010 2011 2012
I. AGRI., HUNTING, FORESTRY & FISHING 39,162,592 44,302,263 45,068,641 a. Agriculture and Forestry 29,793,093 35,489,823 37,069,349 b. Fishing 9,369,499 8,812,440 7,999,292
II INDUSTRY SECTOR 61,926,666 65,944,987 65,250,128 a. Mining and Quarrying 41,291,552 48,009,361 45,150,539 b. Manufacturing 5,688,297 6,713,400 7,709,141 c. Construction 14,174,040 10,442,361 11,501,650 d. Electricity, Gas and Water Supply 772,777 779,864 888,797
III SERVICE SECTOR 58,001,825 63,299,194 69,857,490 a. Transport, Storage & Communication 13,254,894 14,504,084 15,944,392
7,775,160 8,361,973 9,171,879 c. Financial Intermediation 5,997,523 6,578,769 7,617,344
9,462,208 10,655,513 11,257,367
6,979,657 7,356,926 8,531,490 f. Other Services 14,532,383 15,841,929 17,335,018
GROSS DOMESTIC PRODUCT 159,091,083 173,546,443 180,176,260Source : National Statistical Coordination Board
REGIONAL ACCOUNTS OF THE PHILIPPINESUnit : In Thousand PesosTable 1.8B. REGION IVB, MIMAROPAGROSS REGIONAL DOMESTIC PRODUCT BY INDUSTRIAL ORIGIN2010 TO 2012AT CONSTANT 2000 PRICES
2010 2011 2012
I. AGRI., HUNTING, FORESTRY & FISHING 26,994,741 27,735,967 27,640,149 a. Agriculture and Forestry 17,837,441 19,021,756 19,518,010 b. Fishing 9,157,301 8,714,211 8,122,139
II INDUSTRY SECTOR 35,989,267 36,273,642 38,010,628 a. Mining and Quarrying 23,508,566 25,596,991 26,236,928 b. Manufacturing 3,723,047 4,321,901 4,954,154 c. Construction 8,282,883 5,874,947 6,308,082 d. Electricity, Gas and Water Supply 474,772 479,803 511,464
III SERVICE SECTOR 38,851,829 40,977,467 43,777,533 a. Transport, Storage & Communication 8,881,056 9,593,576 10,395,683
4,731,643 4,844,489 5,189,678 c. Financial Intermediation 3,676,108 3,886,051 4,364,562
6,145,807 6,674,603 6,869,529
4,782,155 4,731,142 5,167,468 f. Other Services 10,635,061 11,247,606 11,790,613
GROSS DOMESTIC PRODUCT 101,835,838 104,987,077 109,428,311Source : National Statistical Coordination Board
d. R. Estate, Renting & Business e. Public Administration & Defense; Compulsory Social Security
INDUSTRY/YEAR
INDUSTRY/YEAR
b. Trade and Repair of Motor Vehicles, Motorcycles, Personal and Household Goods
d. R. Estate, Renting & Business e. Public Administration & Defense; Compulsory Social Security
b. Trade and Repair of Motor Vehicles, Motorcycles, Personal and Household Goods
Note: Regional levels may not add up to the national totals due to rounding. Page 98

As of July 2013
REGIONAL ACCOUNTS OF THE PHILIPPINESUnit : In PercentTable 2.8A. REGION IVB, MIMAROPAGROSS REGIONAL DOMESTIC PRODUCT BY INDUSTRIAL ORIGIN2010 TO 2012PERCENT DISTRIBUTION, AT CURRENT PRICES
2010 2011 2012
I. AGRI., HUNTING, FORESTRY & FISHING 24.6 25.5 25.0 a. Agriculture and Forestry 18.7 20.4 20.6 b. Fishing 5.9 5.1 4.4
II INDUSTRY SECTOR 38.9 38.0 36.2 a. Mining and Quarrying 26.0 27.7 25.1 b. Manufacturing 3.6 3.9 4.3 c. Construction 8.9 6.0 6.4 d. Electricity, Gas and Water Supply 0.5 0.4 0.5
III SERVICE SECTOR 36.5 36.5 38.8 a. Transport, Storage & Communication 8.3 8.4 8.8
4.9 4.8 5.1 c. Financial Intermediation 3.8 3.8 4.2
5.9 6.1 6.2
4.4 4.2 4.7 f. Other Services 9.1 9.1 9.6
GROSS DOMESTIC PRODUCT 100.0 100.0 100.0Source : National Statistical Coordination Board
REGIONAL ACCOUNTS OF THE PHILIPPINESUnit : In PercentTable 2.8B. REGION IVB, MIMAROPAGROSS REGIONAL DOMESTIC PRODUCT BY INDUSTRIAL ORIGIN2010 TO 2012PERCENT DISTRIBUTION, AT CONSTANT 2000 PRICES
2010 2011 2012
I. AGRI., HUNTING, FORESTRY & FISHING 26.5 26.4 25.3 a. Agriculture and Forestry 17.5 18.1 17.8 b. Fishing 9.0 8.3 7.4
II INDUSTRY SECTOR 35.3 34.6 34.7 a. Mining and Quarrying 23.1 24.4 24.0 b. Manufacturing 3.7 4.1 4.5 c. Construction 8.1 5.6 5.8 d. Electricity, Gas and Water Supply 0.5 0.5 0.5
III SERVICE SECTOR 38.2 39.0 40.0 a. Transport, Storage & Communication 8.7 9.1 9.5
4.6 4.6 4.7 c. Financial Intermediation 3.6 3.7 4.0
6.0 6.4 6.3
4.7 4.5 4.7 f. Other Services 10.4 10.7 10.8
GROSS DOMESTIC PRODUCT 100.0 100.0 100.0Source : National Statistical Coordination Board
INDUSTRY/YEAR
b. Trade and Repair of Motor Vehicles, Motorcycles, Personal and Household Goods
d. R. Estate, Renting & Business e. Public Administration & Defense; Compulsory Social Security
b. Trade and Repair of Motor Vehicles, Motorcycles, Personal and Household Goods
INDUSTRY/YEAR
d. R. Estate, Renting & Business e. Public Administration & Defense; Compulsory Social Security
Note: Regional levels may not add up to the national totals due to rounding. Page 99

As of July 2013
REGIONAL ACCOUNTS OF THE PHILIPPINESUnit : In PercentTable 3.8A. REGION IVB, MIMAROPAGROSS REGIONAL DOMESTIC PRODUCT BY INDUSTRIAL ORIGIN2010 TO 2012GROWTH RATES , AT CURRENT PRICES
10-11 11-12
I. AGRI., HUNTING, FORESTRY & FISHING 13.1 1.7 a. Agriculture and Forestry 19.1 4.5 b. Fishing (5.9) (9.2)
II INDUSTRY SECTOR 6.5 (1.1) a. Mining and Quarrying 16.3 (6.0) b. Manufacturing 18.0 14.8 c. Construction (26.3) 10.1 d. Electricity, Gas and Water Supply 0.9 14.0
III SERVICE SECTOR 9.1 10.4 a. Transport, Storage & Communication 9.4 9.9
7.5 9.7
c. Financial Intermediation 9.7 15.812.6 5.6
5.4 16.0
f. Other Services 9.0 9.4
GROSS DOMESTIC PRODUCT 9.1 3.8Source : National Statistical Coordination Board
REGIONAL ACCOUNTS OF THE PHILIPPINESUnit : In PercentTable 3.8B. REGION IVB, MIMAROPAGROSS REGIONAL DOMESTIC PRODUCT BY INDUSTRIAL ORIGIN2010 TO 2012GROWTH RATES, AT CONSTANT 2000 PRICES
10-11 11-12
I. AGRI., HUNTING, FORESTRY & FISHING 2.7 (0.3) a. Agriculture and Forestry 6.6 2.6 b. Fishing (4.8) (6.8)
II INDUSTRY SECTOR 0.8 4.8 a. Mining and Quarrying 8.9 2.5 b. Manufacturing 16.1 14.6 c. Construction (29.1) 7.4 d. Electricity, Gas and Water Supply 1.1 6.6
III SERVICE SECTOR 5.5 6.8 a. Transport, Storage & Communication 8.0 8.4
2.4 7.1
c. Financial Intermediation 5.7 12.38.6 2.9
(1.1) 9.2
f. Other Services 5.8 4.8
GROSS DOMESTIC PRODUCT 3.1 4.2Source : National Statistical Coordination Board
e. Public Administration & Defense; Compulsory Social Security
b. Trade and Repair of Motor Vehicles, Motorcycles, Personal and Household Goods
d. R. Estate, Renting & Business
INDUSTRY/YEAR
INDUSTRY/YEAR
b. Trade and Repair of Motor Vehicles, Motorcycles, Personal and Household Goods
e. Public Administration & Defense; Compulsory Social Security
d. R. Estate, Renting & Business
Note: Regional levels may not add up to the national totals due to rounding. Page 100
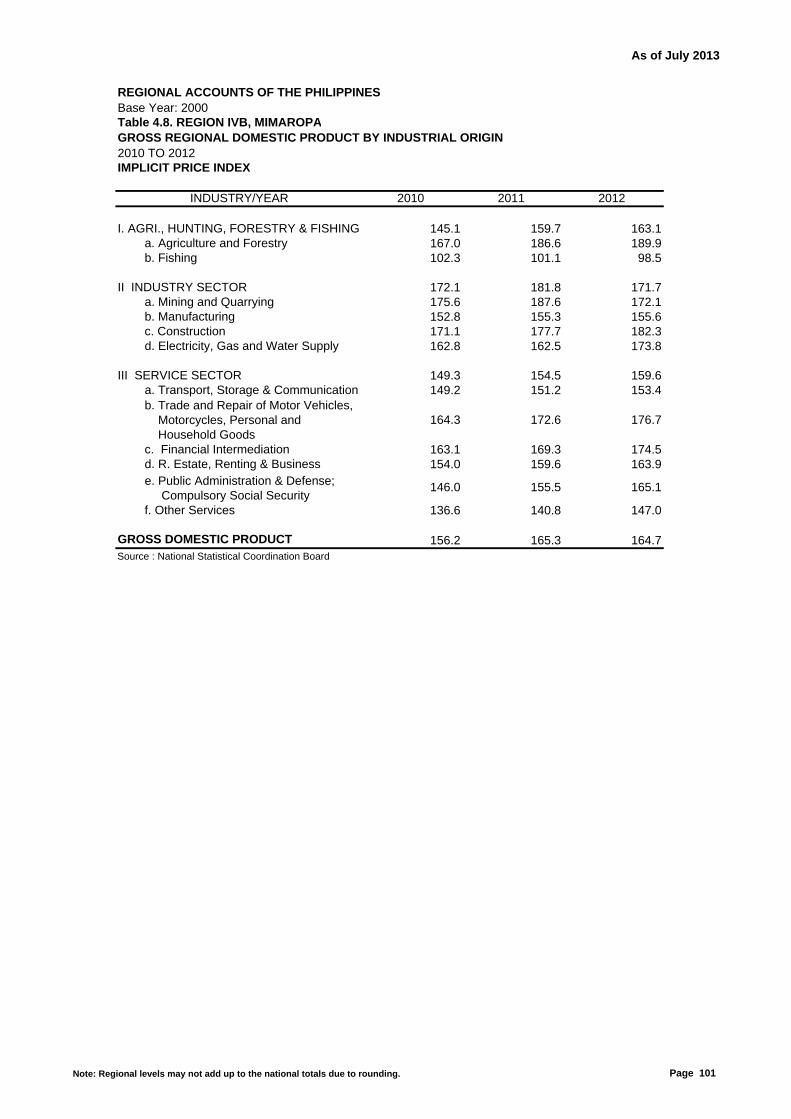
As of July 2013
REGIONAL ACCOUNTS OF THE PHILIPPINESBase Year: 2000Table 4.8. REGION IVB, MIMAROPAGROSS REGIONAL DOMESTIC PRODUCT BY INDUSTRIAL ORIGIN2010 TO 2012IMPLICIT PRICE INDEX
2010 2011 2012
I. AGRI., HUNTING, FORESTRY & FISHING 145.1 159.7 163.1 a. Agriculture and Forestry 167.0 186.6 189.9 b. Fishing 102.3 101.1 98.5
II INDUSTRY SECTOR 172.1 181.8 171.7 a. Mining and Quarrying 175.6 187.6 172.1 b. Manufacturing 152.8 155.3 155.6 c. Construction 171.1 177.7 182.3 d. Electricity, Gas and Water Supply 162.8 162.5 173.8
III SERVICE SECTOR 149.3 154.5 159.6 a. Transport, Storage & Communication 149.2 151.2 153.4
164.3 172.6 176.7
c. Financial Intermediation 163.1 169.3 174.5154.0 159.6 163.9
146.0 155.5 165.1
f. Other Services 136.6 140.8 147.0
GROSS DOMESTIC PRODUCT 156.2 165.3 164.7Source : National Statistical Coordination Board
INDUSTRY/YEAR
d. R. Estate, Renting & Business e. Public Administration & Defense; Compulsory Social Security
b. Trade and Repair of Motor Vehicles, Motorcycles, Personal and Household Goods
Note: Regional levels may not add up to the national totals due to rounding. Page 101
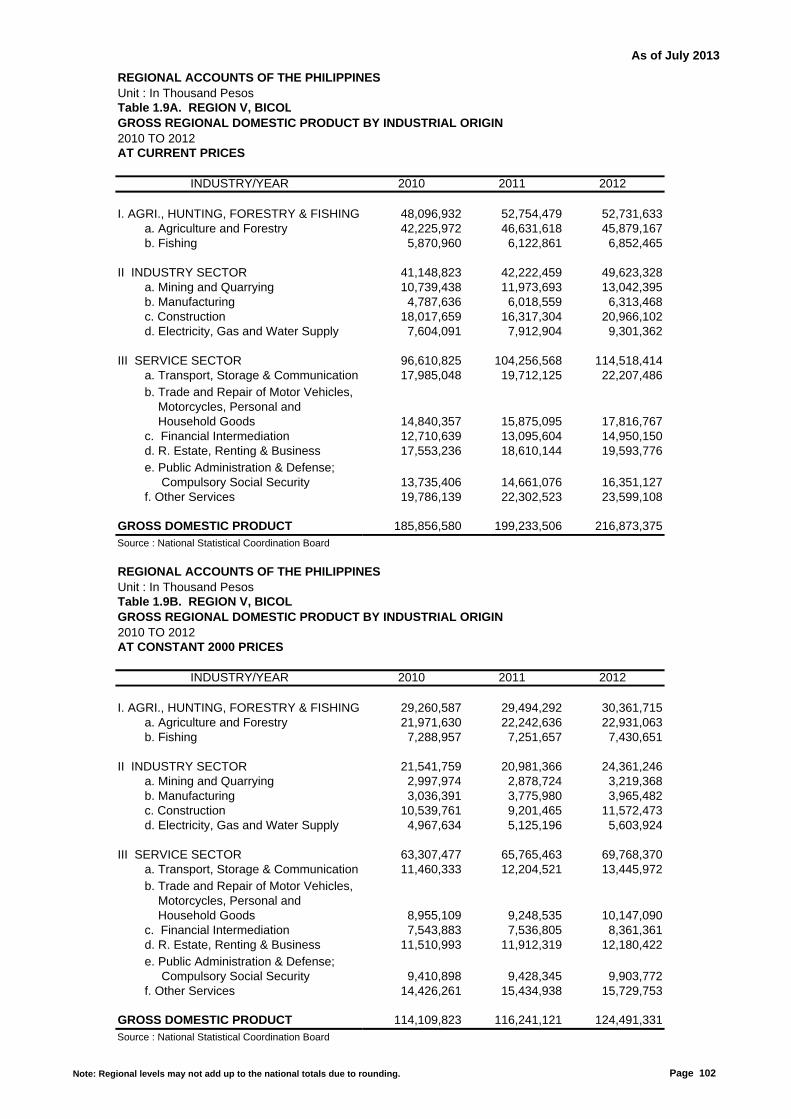
As of July 2013
REGIONAL ACCOUNTS OF THE PHILIPPINESUnit : In Thousand PesosTable 1.9A. REGION V, BICOLGROSS REGIONAL DOMESTIC PRODUCT BY INDUSTRIAL ORIGIN2010 TO 2012AT CURRENT PRICES
2010 2011 2012
I. AGRI., HUNTING, FORESTRY & FISHING 48,096,932 52,754,479 52,731,633 a. Agriculture and Forestry 42,225,972 46,631,618 45,879,167 b. Fishing 5,870,960 6,122,861 6,852,465
II INDUSTRY SECTOR 41,148,823 42,222,459 49,623,328 a. Mining and Quarrying 10,739,438 11,973,693 13,042,395 b. Manufacturing 4,787,636 6,018,559 6,313,468 c. Construction 18,017,659 16,317,304 20,966,102 d. Electricity, Gas and Water Supply 7,604,091 7,912,904 9,301,362
III SERVICE SECTOR 96,610,825 104,256,568 114,518,414 a. Transport, Storage & Communication 17,985,048 19,712,125 22,207,486
14,840,357 15,875,095 17,816,767 c. Financial Intermediation 12,710,639 13,095,604 14,950,150
17,553,236 18,610,144 19,593,776
13,735,406 14,661,076 16,351,127 f. Other Services 19,786,139 22,302,523 23,599,108
GROSS DOMESTIC PRODUCT 185,856,580 199,233,506 216,873,375Source : National Statistical Coordination Board
REGIONAL ACCOUNTS OF THE PHILIPPINESUnit : In Thousand PesosTable 1.9B. REGION V, BICOLGROSS REGIONAL DOMESTIC PRODUCT BY INDUSTRIAL ORIGIN2010 TO 2012AT CONSTANT 2000 PRICES
2010 2011 2012
I. AGRI., HUNTING, FORESTRY & FISHING 29,260,587 29,494,292 30,361,715 a. Agriculture and Forestry 21,971,630 22,242,636 22,931,063 b. Fishing 7,288,957 7,251,657 7,430,651
II INDUSTRY SECTOR 21,541,759 20,981,366 24,361,246 a. Mining and Quarrying 2,997,974 2,878,724 3,219,368 b. Manufacturing 3,036,391 3,775,980 3,965,482 c. Construction 10,539,761 9,201,465 11,572,473 d. Electricity, Gas and Water Supply 4,967,634 5,125,196 5,603,924
III SERVICE SECTOR 63,307,477 65,765,463 69,768,370 a. Transport, Storage & Communication 11,460,333 12,204,521 13,445,972
8,955,109 9,248,535 10,147,090 c. Financial Intermediation 7,543,883 7,536,805 8,361,361
11,510,993 11,912,319 12,180,422
9,410,898 9,428,345 9,903,772 f. Other Services 14,426,261 15,434,938 15,729,753
GROSS DOMESTIC PRODUCT 114,109,823 116,241,121 124,491,331Source : National Statistical Coordination Board
d. R. Estate, Renting & Business e. Public Administration & Defense; Compulsory Social Security
INDUSTRY/YEAR
INDUSTRY/YEAR
b. Trade and Repair of Motor Vehicles, Motorcycles, Personal and Household Goods
d. R. Estate, Renting & Business e. Public Administration & Defense; Compulsory Social Security
b. Trade and Repair of Motor Vehicles, Motorcycles, Personal and Household Goods
Note: Regional levels may not add up to the national totals due to rounding. Page 102

As of July 2013
REGIONAL ACCOUNTS OF THE PHILIPPINESUnit : In percentTable 2.9A. REGION V, BICOLGROSS REGIONAL DOMESTIC PRODUCT BY INDUSTRIAL ORIGIN2010 TO 2012PERCENT DISTRIBUTION, AT CURRENT PRICES
2010 2011 2012
I. AGRI., HUNTING, FORESTRY & FISHING 25.9 26.5 24.3 a. Agriculture and Forestry 22.7 23.4 21.2 b. Fishing 3.2 3.1 3.2
II INDUSTRY SECTOR 22.1 21.2 22.9 a. Mining and Quarrying 5.8 6.0 6.0 b. Manufacturing 2.6 3.0 2.9 c. Construction 9.7 8.2 9.7 d. Electricity, Gas and Water Supply 4.1 4.0 4.3
III SERVICE SECTOR 52.0 52.3 52.8 a. Transport, Storage & Communication 9.7 9.9 10.2
8.0 8.0 8.2 c. Financial Intermediation 6.8 6.6 6.9
9.4 9.3 9.0
7.4 7.4 7.5 f. Other Services 10.6 11.2 10.9
GROSS DOMESTIC PRODUCT 100.0 100.0 100.0Source : National Statistical Coordination Board
REGIONAL ACCOUNTS OF THE PHILIPPINESUnit : In PercentTable 2.9B. REGION V, BICOLGROSS REGIONAL DOMESTIC PRODUCT BY INDUSTRIAL ORIGIN2010 TO 2012PERCENT DISTRIBUTION, AT CONSTANT 2000 PRICES
2010 2011 2012
I. AGRI., HUNTING, FORESTRY & FISHING 25.6 25.4 24.4 a. Agriculture and Forestry 19.3 19.1 18.4 b. Fishing 6.4 6.2 6.0
II INDUSTRY SECTOR 18.9 18.0 19.6 a. Mining and Quarrying 2.6 2.5 2.6 b. Manufacturing 2.7 3.2 3.2 c. Construction 9.2 7.9 9.3 d. Electricity, Gas and Water Supply 4.4 4.4 4.5
III SERVICE SECTOR 55.5 56.6 56.0 a. Transport, Storage & Communication 10.0 10.5 10.8
7.8 8.0 8.2 c. Financial Intermediation 6.6 6.5 6.7
10.1 10.2 9.8
8.2 8.1 8.0 f. Other Services 12.6 13.3 12.6
GROSS DOMESTIC PRODUCT 100.0 100.0 100.0Source : National Statistical Coordination Board
INDUSTRY/YEAR
b. Trade and Repair of Motor Vehicles, Motorcycles, Personal and Household Goods
d. R. Estate, Renting & Business e. Public Administration & Defense; Compulsory Social Security
b. Trade and Repair of Motor Vehicles, Motorcycles, Personal and Household Goods
INDUSTRY/YEAR
d. R. Estate, Renting & Business e. Public Administration & Defense; Compulsory Social Security
Note: Regional levels may not add up to the national totals due to rounding. Page 103

As of July 2013
REGIONAL ACCOUNTS OF THE PHILIPPINESUnit : In PercentTable 3.9A. REGION V, BICOLGROSS REGIONAL DOMESTIC PRODUCT BY INDUSTRIAL ORIGIN2010 TO 2012GROWTH RATES, AT CURRENT PRICES
10-11 11-12
I. AGRI., HUNTING, FORESTRY & FISHING 9.7 (0.0) a. Agriculture and Forestry 10.4 (1.6) b. Fishing 4.3 11.9
II INDUSTRY SECTOR 2.6 17.5 a. Mining and Quarrying 11.5 8.9 b. Manufacturing 25.7 4.9 c. Construction (9.4) 28.5 d. Electricity, Gas and Water Supply 4.1 17.5
III SERVICE SECTOR 7.9 9.8 a. Transport, Storage & Communication 9.6 12.7
7.0 12.2
c. Financial Intermediation 3.0 14.26.0 5.3
6.7 11.5
f. Other Services 12.7 5.8
GROSS DOMESTIC PRODUCT 7.2 8.9Source : National Statistical Coordination Board
REGIONAL ACCOUNTS OF THE PHILIPPINESUnit : In PercentTable 3.9B. REGION V, BICOLGROSS REGIONAL DOMESTIC PRODUCT BY INDUSTRIAL ORIGIN2010 TO 2012GROWTH RATES, AT CONSTANT 2000 PRICES
10-11 11-12
I. AGRI., HUNTING, FORESTRY & FISHING 0.8 2.9 a. Agriculture and Forestry 1.2 3.1 b. Fishing (0.5) 2.5
II INDUSTRY SECTOR (2.6) 16.1 a. Mining and Quarrying (4.0) 11.8 b. Manufacturing 24.4 5.0 c. Construction (12.7) 25.8 d. Electricity, Gas and Water Supply 3.2 9.3
III SERVICE SECTOR 3.9 6.1 a. Transport, Storage & Communication 6.5 10.2
3.3 9.7
c. Financial Intermediation (0.1) 10.93.5 2.3
0.2 5.0
f. Other Services 7.0 1.9
GROSS DOMESTIC PRODUCT 1.9 7.1Source : National Statistical Coordination Board
e. Public Administration & Defense; Compulsory Social Security
b. Trade and Repair of Motor Vehicles, Motorcycles, Personal and Household Goods
d. R. Estate, Renting & Business
INDUSTRY/YEAR
INDUSTRY/YEAR
b. Trade and Repair of Motor Vehicles, Motorcycles, Personal and Household Goods
e. Public Administration & Defense; Compulsory Social Security
d. R. Estate, Renting & Business
Note: Regional levels may not add up to the national totals due to rounding. Page 104

As of July 2013
REGIONAL ACCOUNTS OF THE PHILIPPINESBase Year: 2000Table 4.9. REGION V, BICOLGROSS REGIONAL DOMESTIC PRODUCT BY INDUSTRIAL ORIGIN2010 TO 2012IMPLICIT PRICE INDEX
2010 2011 2012
I. AGRI., HUNTING, FORESTRY & FISHING 164.4 178.9 173.7 a. Agriculture and Forestry 192.2 209.6 200.1 b. Fishing 80.5 84.4 92.2
II INDUSTRY SECTOR 191.0 201.2 203.7 a. Mining and Quarrying 358.2 415.9 405.1 b. Manufacturing 157.7 159.4 159.2 c. Construction 170.9 177.3 181.2 d. Electricity, Gas and Water Supply 153.1 154.4 166.0
III SERVICE SECTOR 152.6 158.5 164.1 a. Transport, Storage & Communication 156.9 161.5 165.2
165.7 171.6 175.6
c. Financial Intermediation 168.5 173.8 178.8152.5 156.2 160.9
146.0 155.5 165.1
f. Other Services 137.2 144.5 150.0
GROSS DOMESTIC PRODUCT 162.9 171.4 174.2Source : National Statistical Coordination Board
INDUSTRY/YEAR
d. R. Estate, Renting & Business e. Public Administration & Defense; Compulsory Social Security
b. Trade and Repair of Motor Vehicles, Motorcycles, Personal and Household Goods
Note: Regional levels may not add up to the national totals due to rounding. Page 105

As of July 2013
REGIONAL ACCOUNTS OF THE PHILIPPINESUnit : In Thousand PesosTable 1.10A. REGION VI, WESTERN VISAYASGROSS REGIONAL DOMESTIC PRODUCT BY INDUSTRIAL ORIGIN2010 TO 2012AT CURRENT PRICES
2010 2011 2012
I. AGRI., HUNTING, FORESTRY & FISHING 92,924,858 109,568,504 108,724,537 a. Agriculture and Forestry 79,292,415 94,083,045 94,245,203 b. Fishing 13,632,443 15,485,460 14,479,334
II INDUSTRY SECTOR 62,298,868 65,765,162 75,530,245 a. Mining and Quarrying 8,833,371 13,045,021 9,747,771 b. Manufacturing 21,529,296 23,201,031 28,170,887 c. Construction 28,275,960 25,715,190 33,101,201 d. Electricity, Gas and Water Supply 3,660,242 3,803,920 4,510,386
III SERVICE SECTOR 194,928,813 212,388,881 237,442,258 a. Transport, Storage & Communication 32,464,581 35,298,812 38,733,368
48,323,626 52,631,425 60,562,522 c. Financial Intermediation 24,276,787 26,987,078 30,602,498
29,943,157 31,914,065 34,866,877
15,332,835 16,424,472 18,426,572 f. Other Services 44,587,828 49,133,031 54,250,421
GROSS DOMESTIC PRODUCT 350,152,539 387,722,548 421,697,041Source : National Statistical Coordination Board
REGIONAL ACCOUNTS OF THE PHILIPPINESUnit : In Thousand PesosTable 1.10B. REGION VI, WESTERN VISAYASGROSS REGIONAL DOMESTIC PRODUCT BY INDUSTRIAL ORIGIN2010 TO 2012AT CONSTANT 2000 PRICES
2010 2011 2012
I. AGRI., HUNTING, FORESTRY & FISHING 57,691,168 65,843,773 65,798,273 a. Agriculture and Forestry 42,924,634 50,857,094 51,205,260 b. Fishing 14,766,534 14,986,679 14,593,013
II INDUSTRY SECTOR 38,221,291 37,883,880 45,417,682 a. Mining and Quarrying 4,715,121 5,240,071 5,461,717 b. Manufacturing 14,546,572 15,730,629 19,102,197 c. Construction 16,746,334 14,651,081 18,369,043 d. Electricity, Gas and Water Supply 2,213,265 2,262,099 2,484,725
III SERVICE SECTOR 131,329,225 137,684,989 148,212,752 a. Transport, Storage & Communication 25,234,070 26,592,489 28,764,408
29,750,010 30,920,836 34,534,746 c. Financial Intermediation 14,636,887 15,523,459 16,948,439
19,641,431 20,408,315 21,513,851
10,505,387 10,562,361 11,160,855 f. Other Services 31,561,440 33,677,529 35,290,454
GROSS DOMESTIC PRODUCT 227,241,684 241,412,643 259,428,707Source : National Statistical Coordination Board
d. R. Estate, Renting & Business e. Public Administration & Defense; Compulsory Social Security
INDUSTRY/YEAR
INDUSTRY/YEAR
b. Trade and Repair of Motor Vehicles, Motorcycles, Personal and Household Goods
d. R. Estate, Renting & Business e. Public Administration & Defense; Compulsory Social Security
b. Trade and Repair of Motor Vehicles, Motorcycles, Personal and Household Goods
Note: Regional levels may not add up to the national totals due to rounding. Page 106
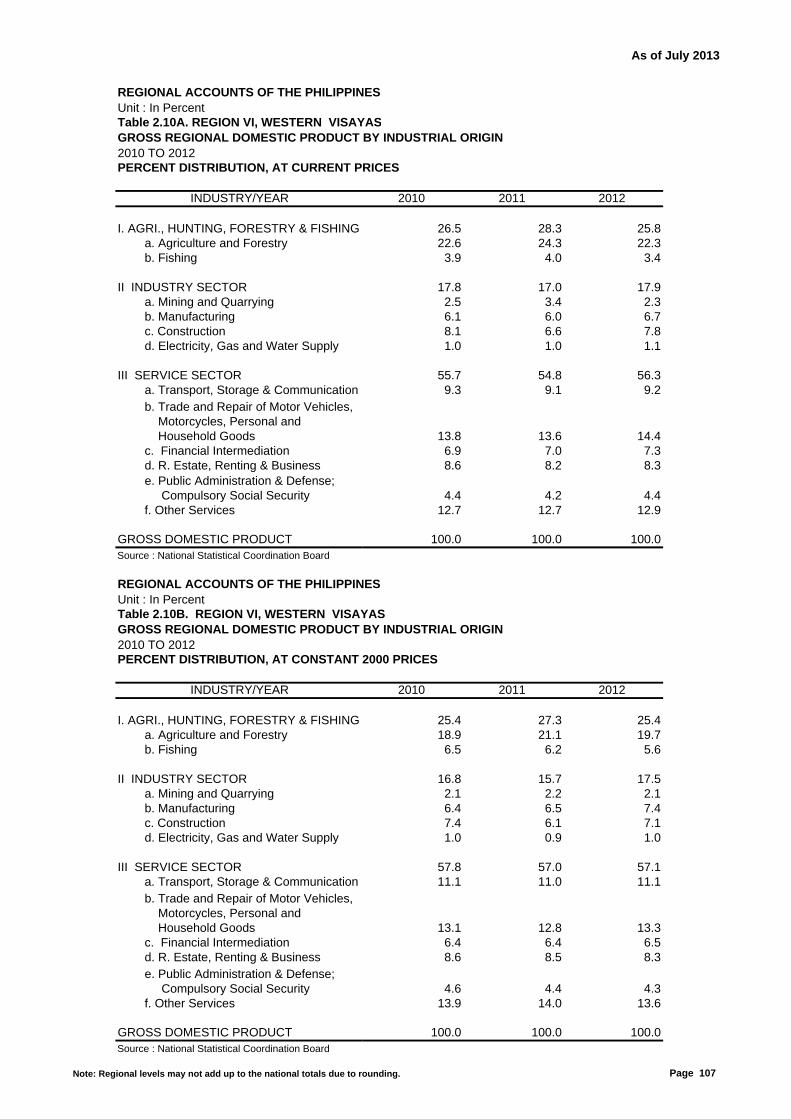
As of July 2013
REGIONAL ACCOUNTS OF THE PHILIPPINESUnit : In PercentTable 2.10A. REGION VI, WESTERN VISAYASGROSS REGIONAL DOMESTIC PRODUCT BY INDUSTRIAL ORIGIN2010 TO 2012PERCENT DISTRIBUTION, AT CURRENT PRICES
2010 2011 2012
I. AGRI., HUNTING, FORESTRY & FISHING 26.5 28.3 25.8 a. Agriculture and Forestry 22.6 24.3 22.3 b. Fishing 3.9 4.0 3.4
II INDUSTRY SECTOR 17.8 17.0 17.9 a. Mining and Quarrying 2.5 3.4 2.3 b. Manufacturing 6.1 6.0 6.7 c. Construction 8.1 6.6 7.8 d. Electricity, Gas and Water Supply 1.0 1.0 1.1
III SERVICE SECTOR 55.7 54.8 56.3 a. Transport, Storage & Communication 9.3 9.1 9.2
13.8 13.6 14.4 c. Financial Intermediation 6.9 7.0 7.3
8.6 8.2 8.3
4.4 4.2 4.4 f. Other Services 12.7 12.7 12.9
GROSS DOMESTIC PRODUCT 100.0 100.0 100.0Source : National Statistical Coordination Board
REGIONAL ACCOUNTS OF THE PHILIPPINESUnit : In PercentTable 2.10B. REGION VI, WESTERN VISAYASGROSS REGIONAL DOMESTIC PRODUCT BY INDUSTRIAL ORIGIN2010 TO 2012PERCENT DISTRIBUTION, AT CONSTANT 2000 PRICES
2010 2011 2012
I. AGRI., HUNTING, FORESTRY & FISHING 25.4 27.3 25.4 a. Agriculture and Forestry 18.9 21.1 19.7 b. Fishing 6.5 6.2 5.6
II INDUSTRY SECTOR 16.8 15.7 17.5 a. Mining and Quarrying 2.1 2.2 2.1 b. Manufacturing 6.4 6.5 7.4 c. Construction 7.4 6.1 7.1 d. Electricity, Gas and Water Supply 1.0 0.9 1.0
III SERVICE SECTOR 57.8 57.0 57.1 a. Transport, Storage & Communication 11.1 11.0 11.1
13.1 12.8 13.3 c. Financial Intermediation 6.4 6.4 6.5
8.6 8.5 8.3
4.6 4.4 4.3 f. Other Services 13.9 14.0 13.6
GROSS DOMESTIC PRODUCT 100.0 100.0 100.0Source : National Statistical Coordination Board
INDUSTRY/YEAR
b. Trade and Repair of Motor Vehicles, Motorcycles, Personal and Household Goods
d. R. Estate, Renting & Business e. Public Administration & Defense; Compulsory Social Security
b. Trade and Repair of Motor Vehicles, Motorcycles, Personal and Household Goods
INDUSTRY/YEAR
d. R. Estate, Renting & Business e. Public Administration & Defense; Compulsory Social Security
Note: Regional levels may not add up to the national totals due to rounding. Page 107

As of July 2013
REGIONAL ACCOUNTS OF THE PHILIPPINESUnit : In PercentTable 3.10A. REGION VI, WESTERN VISAYASGROSS REGIONAL DOMESTIC PRODUCT BY INDUSTRIAL ORIGIN2010 TO 2012GROWTH RATES, AT CURRENT PRICES
10-11 11-12
I. AGRI., HUNTING, FORESTRY & FISHING 17.9 (0.8) a. Agriculture and Forestry 18.7 0.2 b. Fishing 13.6 (6.5)
II INDUSTRY SECTOR 5.6 14.8 a. Mining and Quarrying 47.7 (25.3) b. Manufacturing 7.8 21.4 c. Construction (9.1) 28.7 d. Electricity, Gas and Water Supply 3.9 18.6
III SERVICE SECTOR 9.0 11.8 a. Transport, Storage & Communication 8.7 9.7
8.9 15.1
c. Financial Intermediation 11.2 13.46.6 9.3
7.1 12.2
f. Other Services 10.2 10.4
GROSS DOMESTIC PRODUCT 10.7 8.8Source : National Statistical Coordination Board
REGIONAL ACCOUNTS OF THE PHILIPPINESUnit : In PercentTable 3.10B. REGION VI, WESTERN VISAYASGROSS REGIONAL DOMESTIC PRODUCT BY INDUSTRIAL ORIGIN2010 TO 2012GROWTH RATES, AT CONSTANT 2000 PRICES
10-11 11-12
I. AGRI., HUNTING, FORESTRY & FISHING 14.1 (0.1) a. Agriculture and Forestry 18.5 0.7 b. Fishing 1.5 (2.6)
II INDUSTRY SECTOR (0.9) 19.9 a. Mining and Quarrying 11.1 4.2 b. Manufacturing 8.1 21.4 c. Construction (12.5) 25.4 d. Electricity, Gas and Water Supply 2.2 9.8
III SERVICE SECTOR 4.8 7.6 a. Transport, Storage & Communication 5.4 8.2
3.9 11.7
c. Financial Intermediation 6.1 9.23.9 5.4
0.5 5.7
f. Other Services 6.7 4.8
GROSS DOMESTIC PRODUCT 6.2 7.5Source : National Statistical Coordination Board
e. Public Administration & Defense; Compulsory Social Security
b. Trade and Repair of Motor Vehicles, Motorcycles, Personal and Household Goods
d. R. Estate, Renting & Business
INDUSTRY/YEAR
INDUSTRY/YEAR
b. Trade and Repair of Motor Vehicles, Motorcycles, Personal and Household Goods
e. Public Administration & Defense; Compulsory Social Security
d. R. Estate, Renting & Business
Note: Regional levels may not add up to the national totals due to rounding. Page 108

As of July 2013
REGIONAL ACCOUNTS OF THE PHILIPPINESBase Year: 2000Table 4.10. REGION VI, WESTERN VISAYASGROSS REGIONAL DOMESTIC PRODUCT BY INDUSTRIAL ORIGIN2010 TO 2012IMPLICIT PRICE INDEX
2010 2011 2012
I. AGRI., HUNTING, FORESTRY & FISHING 161.1 166.4 165.2 a. Agriculture and Forestry 184.7 185.0 184.1 b. Fishing 92.3 103.3 99.2
II INDUSTRY SECTOR 163.0 173.6 166.3 a. Mining and Quarrying 187.3 248.9 178.5 b. Manufacturing 148.0 147.5 147.5 c. Construction 168.8 175.5 180.2 d. Electricity, Gas and Water Supply 165.4 168.2 181.5
III SERVICE SECTOR 148.4 154.3 160.2 a. Transport, Storage & Communication 128.7 132.7 134.7
162.4 170.2 175.4
c. Financial Intermediation 165.9 173.8 180.6152.4 156.4 162.1
146.0 155.5 165.1
f. Other Services 141.3 145.9 153.7
GROSS DOMESTIC PRODUCT 154.1 160.6 162.5Source : National Statistical Coordination Board
INDUSTRY/YEAR
d. R. Estate, Renting & Business e. Public Administration & Defense; Compulsory Social Security
b. Trade and Repair of Motor Vehicles, Motorcycles, Personal and Household Goods
Note: Regional levels may not add up to the national totals due to rounding. Page 109

As of July 2013
REGIONAL ACCOUNTS OF THE PHILIPPINESUnit : In Thousand PesosTable 1.11A. REGION VII, CENTRAL VISAYASGROSS REGIONAL DOMESTIC PRODUCT BY INDUSTRIAL ORIGIN2010 TO 2012AT CURRENT PRICES
2010 2011 2012
I. AGRI., HUNTING, FORESTRY & FISHING 45,383,790 50,036,763 50,163,547 a. Agriculture and Forestry 40,793,071 45,903,553 45,924,594 b. Fishing 4,590,719 4,133,210 4,238,952
II INDUSTRY SECTOR 187,919,434 207,251,121 234,964,275 a. Mining and Quarrying 4,720,949 6,208,438 6,225,198 b. Manufacturing 122,911,919 130,968,842 140,594,273 c. Construction 50,773,127 60,031,199 76,602,985 d. Electricity, Gas and Water Supply 9,513,440 10,042,641 11,541,819
III SERVICE SECTOR 305,254,717 333,534,628 381,086,403 a. Transport, Storage & Communication 36,370,652 40,007,868 44,542,841
89,326,476 96,959,631 113,167,996 c. Financial Intermediation 41,353,355 44,055,175 50,320,333
60,962,052 69,564,413 80,077,738
15,824,808 17,020,835 19,786,194 f. Other Services 61,417,375 65,926,706 73,191,301
GROSS DOMESTIC PRODUCT 538,557,941 590,822,512 666,214,225Source : National Statistical Coordination Board
REGIONAL ACCOUNTS OF THE PHILIPPINESUnit : In Thousand PesosTable 1.11B. REGION VII, CENTRAL VISAYASGROSS REGIONAL DOMESTIC PRODUCT BY INDUSTRIAL ORIGIN2010 TO 2012AT CONSTANT 2000 PRICES
2010 2011 2012
I. AGRI., HUNTING, FORESTRY & FISHING 27,919,058 28,954,931 28,781,383 a. Agriculture and Forestry 22,526,726 23,952,983 23,864,102 b. Fishing 5,392,333 5,001,947 4,917,281
II INDUSTRY SECTOR 120,000,002 131,210,410 145,507,370 a. Mining and Quarrying 2,913,096 3,290,753 3,503,423 b. Manufacturing 79,713,686 86,011,329 91,417,859 c. Construction 30,631,265 34,854,009 42,978,513 d. Electricity, Gas and Water Supply 6,741,954 7,054,319 7,607,574
III SERVICE SECTOR 192,781,715 203,735,861 223,362,937 a. Transport, Storage & Communication 25,797,747 27,366,765 29,836,130
52,901,306 55,346,781 62,047,109 c. Financial Intermediation 23,902,436 24,591,388 26,838,450
37,716,327 41,357,944 45,593,661
10,842,465 10,945,874 11,984,370 f. Other Services 41,621,434 44,127,108 47,063,219
GROSS DOMESTIC PRODUCT 340,700,776 363,901,202 397,651,690Source : National Statistical Coordination Board
d. R. Estate, Renting & Business e. Public Administration & Defense; Compulsory Social Security
INDUSTRY/YEAR
INDUSTRY/YEAR
b. Trade and Repair of Motor Vehicles, Motorcycles, Personal and Household Goods
d. R. Estate, Renting & Business e. Public Administration & Defense; Compulsory Social Security
b. Trade and Repair of Motor Vehicles, Motorcycles, Personal and Household Goods
Note: Regional levels may not add up to the national totals due to rounding. Page 110
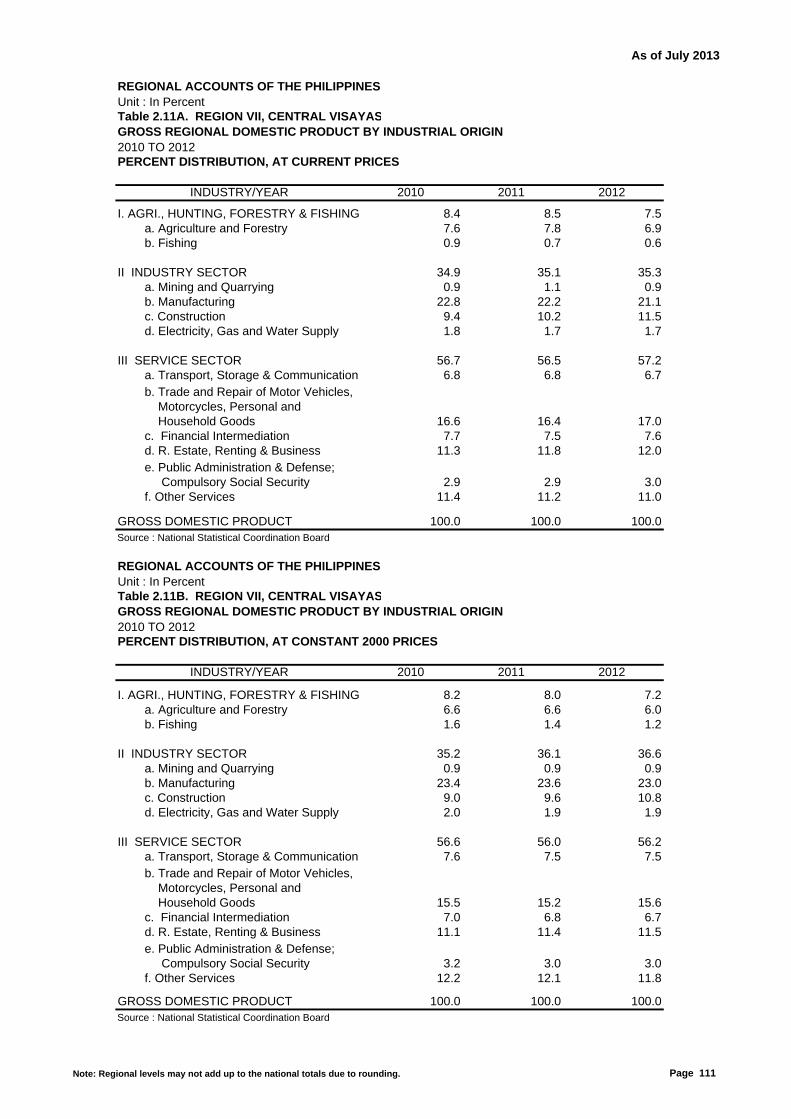
As of July 2013
REGIONAL ACCOUNTS OF THE PHILIPPINESUnit : In PercentTable 2.11A. REGION VII, CENTRAL VISAYASGROSS REGIONAL DOMESTIC PRODUCT BY INDUSTRIAL ORIGIN2010 TO 2012PERCENT DISTRIBUTION, AT CURRENT PRICES
2010 2011 2012
I. AGRI., HUNTING, FORESTRY & FISHING 8.4 8.5 7.5 a. Agriculture and Forestry 7.6 7.8 6.9 b. Fishing 0.9 0.7 0.6
II INDUSTRY SECTOR 34.9 35.1 35.3 a. Mining and Quarrying 0.9 1.1 0.9 b. Manufacturing 22.8 22.2 21.1 c. Construction 9.4 10.2 11.5 d. Electricity, Gas and Water Supply 1.8 1.7 1.7
III SERVICE SECTOR 56.7 56.5 57.2 a. Transport, Storage & Communication 6.8 6.8 6.7
16.6 16.4 17.0 c. Financial Intermediation 7.7 7.5 7.6
11.3 11.8 12.0
2.9 2.9 3.0 f. Other Services 11.4 11.2 11.0
GROSS DOMESTIC PRODUCT 100.0 100.0 100.0Source : National Statistical Coordination Board
REGIONAL ACCOUNTS OF THE PHILIPPINESUnit : In PercentTable 2.11B. REGION VII, CENTRAL VISAYASGROSS REGIONAL DOMESTIC PRODUCT BY INDUSTRIAL ORIGIN2010 TO 2012PERCENT DISTRIBUTION, AT CONSTANT 2000 PRICES
2010 2011 2012
I. AGRI., HUNTING, FORESTRY & FISHING 8.2 8.0 7.2 a. Agriculture and Forestry 6.6 6.6 6.0 b. Fishing 1.6 1.4 1.2
II INDUSTRY SECTOR 35.2 36.1 36.6 a. Mining and Quarrying 0.9 0.9 0.9 b. Manufacturing 23.4 23.6 23.0 c. Construction 9.0 9.6 10.8 d. Electricity, Gas and Water Supply 2.0 1.9 1.9
III SERVICE SECTOR 56.6 56.0 56.2 a. Transport, Storage & Communication 7.6 7.5 7.5
15.5 15.2 15.6 c. Financial Intermediation 7.0 6.8 6.7
11.1 11.4 11.5
3.2 3.0 3.0 f. Other Services 12.2 12.1 11.8
GROSS DOMESTIC PRODUCT 100.0 100.0 100.0Source : National Statistical Coordination Board
INDUSTRY/YEAR
b. Trade and Repair of Motor Vehicles, Motorcycles, Personal and Household Goods
d. R. Estate, Renting & Business e. Public Administration & Defense; Compulsory Social Security
b. Trade and Repair of Motor Vehicles, Motorcycles, Personal and Household Goods
INDUSTRY/YEAR
d. R. Estate, Renting & Business e. Public Administration & Defense; Compulsory Social Security
Note: Regional levels may not add up to the national totals due to rounding. Page 111
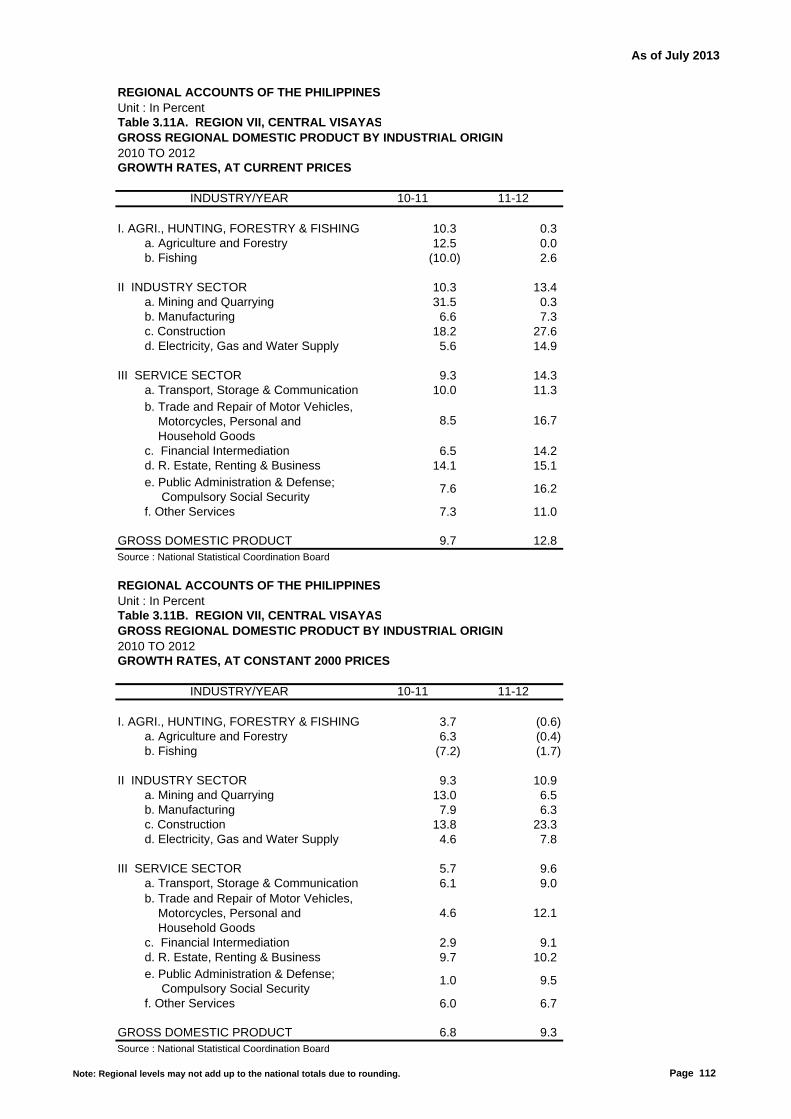
As of July 2013
REGIONAL ACCOUNTS OF THE PHILIPPINESUnit : In PercentTable 3.11A. REGION VII, CENTRAL VISAYASGROSS REGIONAL DOMESTIC PRODUCT BY INDUSTRIAL ORIGIN2010 TO 2012GROWTH RATES, AT CURRENT PRICES
10-11 11-12
I. AGRI., HUNTING, FORESTRY & FISHING 10.3 0.3 a. Agriculture and Forestry 12.5 0.0 b. Fishing (10.0) 2.6
II INDUSTRY SECTOR 10.3 13.4 a. Mining and Quarrying 31.5 0.3 b. Manufacturing 6.6 7.3 c. Construction 18.2 27.6 d. Electricity, Gas and Water Supply 5.6 14.9
III SERVICE SECTOR 9.3 14.3 a. Transport, Storage & Communication 10.0 11.3
8.5 16.7
c. Financial Intermediation 6.5 14.214.1 15.1
7.6 16.2
f. Other Services 7.3 11.0
GROSS DOMESTIC PRODUCT 9.7 12.8Source : National Statistical Coordination Board
REGIONAL ACCOUNTS OF THE PHILIPPINESUnit : In PercentTable 3.11B. REGION VII, CENTRAL VISAYASGROSS REGIONAL DOMESTIC PRODUCT BY INDUSTRIAL ORIGIN2010 TO 2012GROWTH RATES, AT CONSTANT 2000 PRICES
10-11 11-12
I. AGRI., HUNTING, FORESTRY & FISHING 3.7 (0.6) a. Agriculture and Forestry 6.3 (0.4) b. Fishing (7.2) (1.7)
II INDUSTRY SECTOR 9.3 10.9 a. Mining and Quarrying 13.0 6.5 b. Manufacturing 7.9 6.3 c. Construction 13.8 23.3 d. Electricity, Gas and Water Supply 4.6 7.8
III SERVICE SECTOR 5.7 9.6 a. Transport, Storage & Communication 6.1 9.0
4.6 12.1
c. Financial Intermediation 2.9 9.19.7 10.2
1.0 9.5
f. Other Services 6.0 6.7
GROSS DOMESTIC PRODUCT 6.8 9.3Source : National Statistical Coordination Board
e. Public Administration & Defense; Compulsory Social Security
b. Trade and Repair of Motor Vehicles, Motorcycles, Personal and Household Goods
d. R. Estate, Renting & Business
INDUSTRY/YEAR
INDUSTRY/YEAR
b. Trade and Repair of Motor Vehicles, Motorcycles, Personal and Household Goods
e. Public Administration & Defense; Compulsory Social Security
d. R. Estate, Renting & Business
Note: Regional levels may not add up to the national totals due to rounding. Page 112
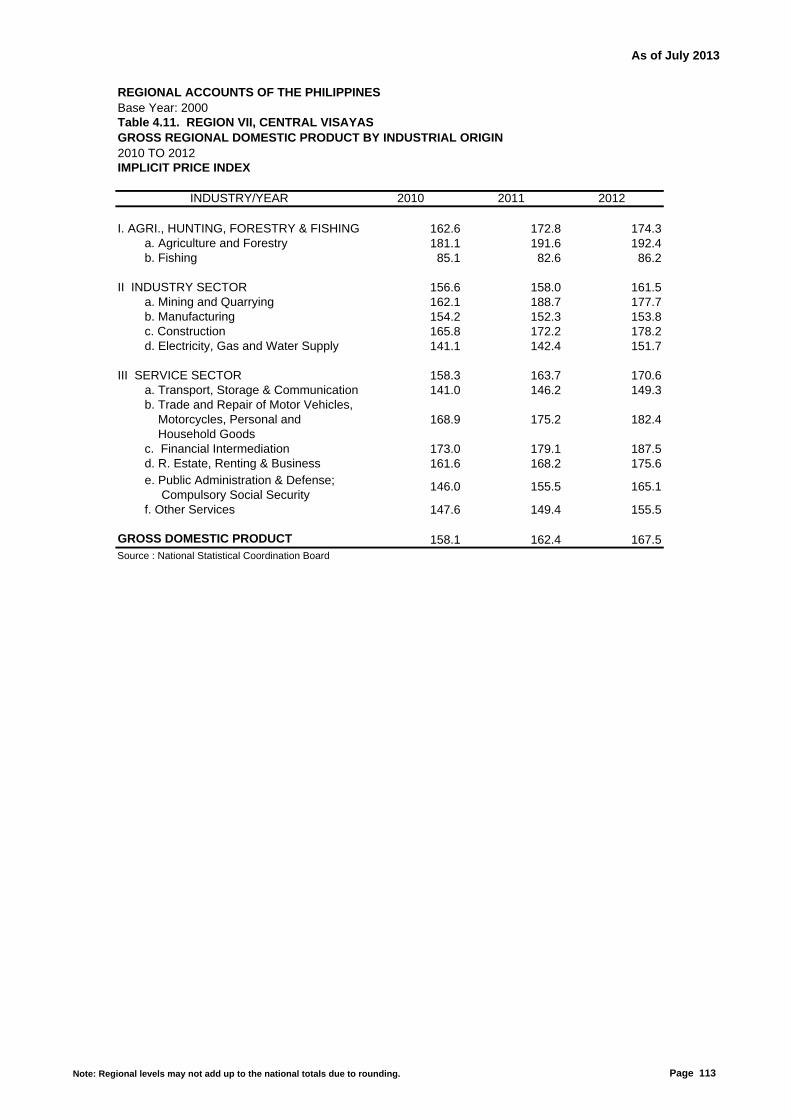
As of July 2013
REGIONAL ACCOUNTS OF THE PHILIPPINESBase Year: 2000Table 4.11. REGION VII, CENTRAL VISAYASGROSS REGIONAL DOMESTIC PRODUCT BY INDUSTRIAL ORIGIN2010 TO 2012IMPLICIT PRICE INDEX
2010 2011 2012
I. AGRI., HUNTING, FORESTRY & FISHING 162.6 172.8 174.3 a. Agriculture and Forestry 181.1 191.6 192.4 b. Fishing 85.1 82.6 86.2
II INDUSTRY SECTOR 156.6 158.0 161.5 a. Mining and Quarrying 162.1 188.7 177.7 b. Manufacturing 154.2 152.3 153.8 c. Construction 165.8 172.2 178.2 d. Electricity, Gas and Water Supply 141.1 142.4 151.7
III SERVICE SECTOR 158.3 163.7 170.6 a. Transport, Storage & Communication 141.0 146.2 149.3
168.9 175.2 182.4
c. Financial Intermediation 173.0 179.1 187.5161.6 168.2 175.6
146.0 155.5 165.1
f. Other Services 147.6 149.4 155.5
GROSS DOMESTIC PRODUCT 158.1 162.4 167.5Source : National Statistical Coordination Board
INDUSTRY/YEAR
d. R. Estate, Renting & Business e. Public Administration & Defense; Compulsory Social Security
b. Trade and Repair of Motor Vehicles, Motorcycles, Personal and Household Goods
Note: Regional levels may not add up to the national totals due to rounding. Page 113
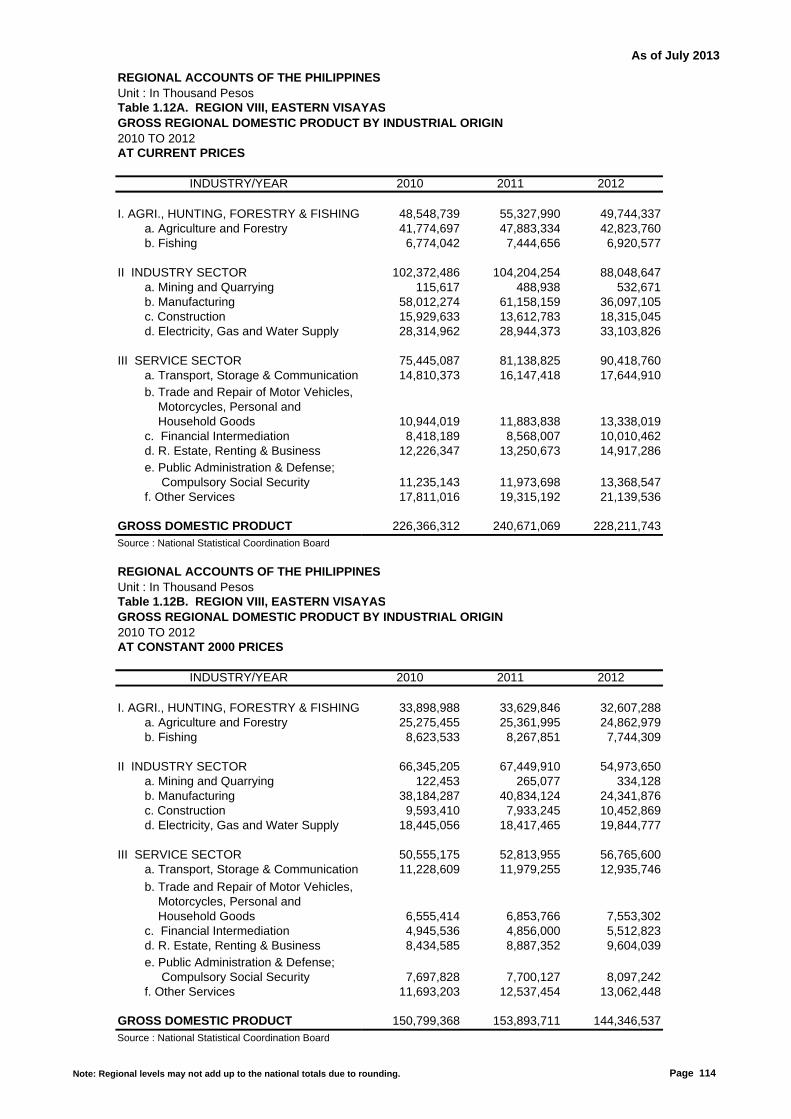
As of July 2013
REGIONAL ACCOUNTS OF THE PHILIPPINESUnit : In Thousand PesosTable 1.12A. REGION VIII, EASTERN VISAYASGROSS REGIONAL DOMESTIC PRODUCT BY INDUSTRIAL ORIGIN2010 TO 2012AT CURRENT PRICES
2010 2011 2012
I. AGRI., HUNTING, FORESTRY & FISHING 48,548,739 55,327,990 49,744,337 a. Agriculture and Forestry 41,774,697 47,883,334 42,823,760 b. Fishing 6,774,042 7,444,656 6,920,577
II INDUSTRY SECTOR 102,372,486 104,204,254 88,048,647 a. Mining and Quarrying 115,617 488,938 532,671 b. Manufacturing 58,012,274 61,158,159 36,097,105 c. Construction 15,929,633 13,612,783 18,315,045 d. Electricity, Gas and Water Supply 28,314,962 28,944,373 33,103,826
III SERVICE SECTOR 75,445,087 81,138,825 90,418,760 a. Transport, Storage & Communication 14,810,373 16,147,418 17,644,910
10,944,019 11,883,838 13,338,019 c. Financial Intermediation 8,418,189 8,568,007 10,010,462
12,226,347 13,250,673 14,917,286
11,235,143 11,973,698 13,368,547 f. Other Services 17,811,016 19,315,192 21,139,536
GROSS DOMESTIC PRODUCT 226,366,312 240,671,069 228,211,743Source : National Statistical Coordination Board
REGIONAL ACCOUNTS OF THE PHILIPPINESUnit : In Thousand PesosTable 1.12B. REGION VIII, EASTERN VISAYASGROSS REGIONAL DOMESTIC PRODUCT BY INDUSTRIAL ORIGIN2010 TO 2012AT CONSTANT 2000 PRICES
2010 2011 2012
I. AGRI., HUNTING, FORESTRY & FISHING 33,898,988 33,629,846 32,607,288 a. Agriculture and Forestry 25,275,455 25,361,995 24,862,979 b. Fishing 8,623,533 8,267,851 7,744,309
II INDUSTRY SECTOR 66,345,205 67,449,910 54,973,650 a. Mining and Quarrying 122,453 265,077 334,128 b. Manufacturing 38,184,287 40,834,124 24,341,876 c. Construction 9,593,410 7,933,245 10,452,869 d. Electricity, Gas and Water Supply 18,445,056 18,417,465 19,844,777
III SERVICE SECTOR 50,555,175 52,813,955 56,765,600 a. Transport, Storage & Communication 11,228,609 11,979,255 12,935,746
6,555,414 6,853,766 7,553,302 c. Financial Intermediation 4,945,536 4,856,000 5,512,823
8,434,585 8,887,352 9,604,039
7,697,828 7,700,127 8,097,242 f. Other Services 11,693,203 12,537,454 13,062,448
GROSS DOMESTIC PRODUCT 150,799,368 153,893,711 144,346,537Source : National Statistical Coordination Board
d. R. Estate, Renting & Business e. Public Administration & Defense; Compulsory Social Security
INDUSTRY/YEAR
INDUSTRY/YEAR
b. Trade and Repair of Motor Vehicles, Motorcycles, Personal and Household Goods
d. R. Estate, Renting & Business e. Public Administration & Defense; Compulsory Social Security
b. Trade and Repair of Motor Vehicles, Motorcycles, Personal and Household Goods
Note: Regional levels may not add up to the national totals due to rounding. Page 114
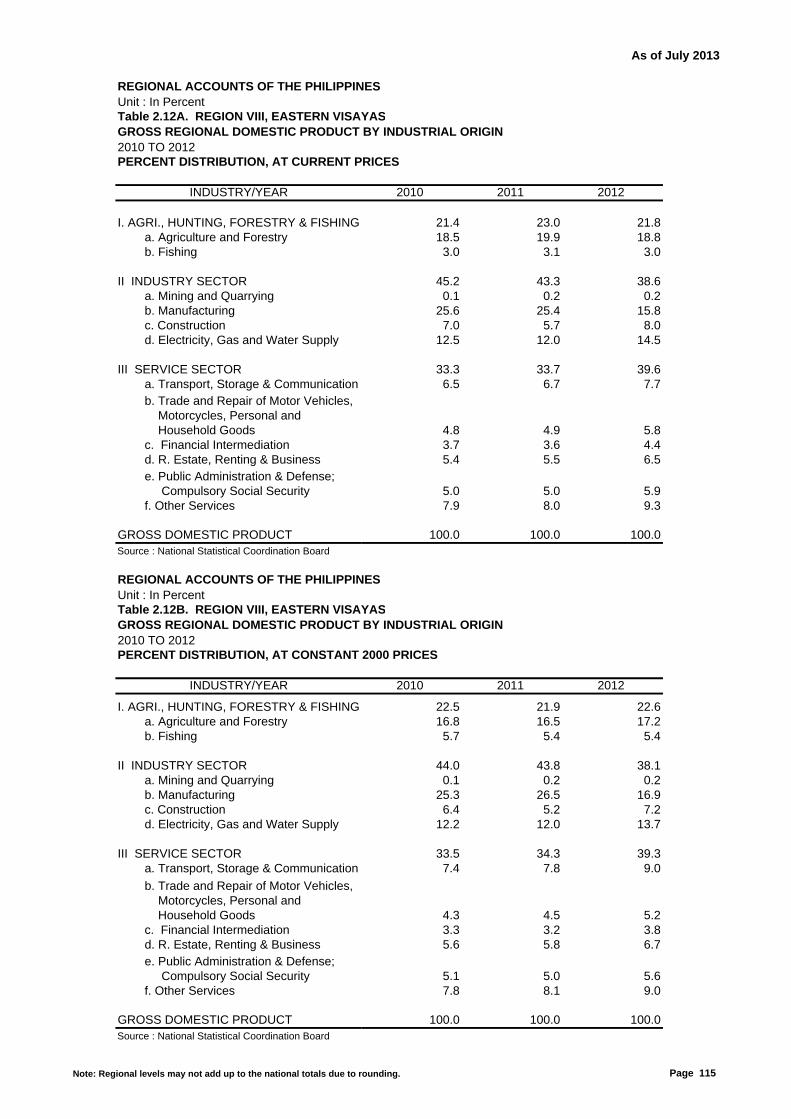
As of July 2013
REGIONAL ACCOUNTS OF THE PHILIPPINESUnit : In PercentTable 2.12A. REGION VIII, EASTERN VISAYASGROSS REGIONAL DOMESTIC PRODUCT BY INDUSTRIAL ORIGIN2010 TO 2012PERCENT DISTRIBUTION, AT CURRENT PRICES
2010 2011 2012
I. AGRI., HUNTING, FORESTRY & FISHING 21.4 23.0 21.8 a. Agriculture and Forestry 18.5 19.9 18.8 b. Fishing 3.0 3.1 3.0
II INDUSTRY SECTOR 45.2 43.3 38.6 a. Mining and Quarrying 0.1 0.2 0.2 b. Manufacturing 25.6 25.4 15.8 c. Construction 7.0 5.7 8.0 d. Electricity, Gas and Water Supply 12.5 12.0 14.5
III SERVICE SECTOR 33.3 33.7 39.6 a. Transport, Storage & Communication 6.5 6.7 7.7
4.8 4.9 5.8 c. Financial Intermediation 3.7 3.6 4.4
5.4 5.5 6.5
5.0 5.0 5.9 f. Other Services 7.9 8.0 9.3
GROSS DOMESTIC PRODUCT 100.0 100.0 100.0Source : National Statistical Coordination Board
REGIONAL ACCOUNTS OF THE PHILIPPINESUnit : In PercentTable 2.12B. REGION VIII, EASTERN VISAYASGROSS REGIONAL DOMESTIC PRODUCT BY INDUSTRIAL ORIGIN2010 TO 2012PERCENT DISTRIBUTION, AT CONSTANT 2000 PRICES
2010 2011 2012
I. AGRI., HUNTING, FORESTRY & FISHING 22.5 21.9 22.6 a. Agriculture and Forestry 16.8 16.5 17.2 b. Fishing 5.7 5.4 5.4
II INDUSTRY SECTOR 44.0 43.8 38.1 a. Mining and Quarrying 0.1 0.2 0.2 b. Manufacturing 25.3 26.5 16.9 c. Construction 6.4 5.2 7.2 d. Electricity, Gas and Water Supply 12.2 12.0 13.7
III SERVICE SECTOR 33.5 34.3 39.3 a. Transport, Storage & Communication 7.4 7.8 9.0
4.3 4.5 5.2 c. Financial Intermediation 3.3 3.2 3.8
5.6 5.8 6.7
5.1 5.0 5.6 f. Other Services 7.8 8.1 9.0
GROSS DOMESTIC PRODUCT 100.0 100.0 100.0Source : National Statistical Coordination Board
INDUSTRY/YEAR
b. Trade and Repair of Motor Vehicles, Motorcycles, Personal and Household Goods
d. R. Estate, Renting & Business e. Public Administration & Defense; Compulsory Social Security
b. Trade and Repair of Motor Vehicles, Motorcycles, Personal and Household Goods
INDUSTRY/YEAR
d. R. Estate, Renting & Business e. Public Administration & Defense; Compulsory Social Security
Note: Regional levels may not add up to the national totals due to rounding. Page 115

As of July 2013
REGIONAL ACCOUNTS OF THE PHILIPPINESUnit : In PercentTable 3.12A. REGION VIII, EASTERN VISAYASGROSS REGIONAL DOMESTIC PRODUCT BY INDUSTRIAL ORIGIN2010 TO 2012GROWTH RATES, AT CURRENT PRICES
10-11 11-12
I. AGRI., HUNTING, FORESTRY & FISHING 14.0 (10.1) a. Agriculture and Forestry 14.6 (10.6) b. Fishing 9.9 (7.0)
II INDUSTRY SECTOR 1.8 (15.5) a. Mining and Quarrying 322.9 8.9 b. Manufacturing 5.4 (41.0) c. Construction (14.5) 34.5 d. Electricity, Gas and Water Supply 2.2 14.4
III SERVICE SECTOR 7.5 11.4 a. Transport, Storage & Communication 9.0 9.3
8.6 12.2
c. Financial Intermediation 1.8 16.88.4 12.6
6.6 11.6
f. Other Services 8.4 9.4
GROSS DOMESTIC PRODUCT 6.3 (5.2)Source : National Statistical Coordination Board
REGIONAL ACCOUNTS OF THE PHILIPPINESUnit : In PercentTable 3.12B. REGION VIII, EASTERN VISAYASGROSS REGIONAL DOMESTIC PRODUCT BY INDUSTRIAL ORIGIN2010 TO 2012GROWTH RATES, AT CONSTANT 2000 PRICES
10-11 11-12
I. AGRI., HUNTING, FORESTRY & FISHING (0.8) (3.0) a. Agriculture and Forestry 0.3 (2.0) b. Fishing (4.1) (6.3)
II INDUSTRY SECTOR 1.7 (18.5) a. Mining and Quarrying 116.5 26.0 b. Manufacturing 6.9 (40.4) c. Construction (17.3) 31.8 d. Electricity, Gas and Water Supply (0.1) 7.7
III SERVICE SECTOR 4.5 7.5 a. Transport, Storage & Communication 6.7 8.0
4.6 10.2
c. Financial Intermediation (1.8) 13.55.4 8.1
0.0 5.2
f. Other Services 7.2 4.2
GROSS DOMESTIC PRODUCT 2.1 (6.2)Source : National Statistical Coordination Board
e. Public Administration & Defense; Compulsory Social Security
b. Trade and Repair of Motor Vehicles, Motorcycles, Personal and Household Goods
d. R. Estate, Renting & Business
INDUSTRY/YEAR
INDUSTRY/YEAR
b. Trade and Repair of Motor Vehicles, Motorcycles, Personal and Household Goods
e. Public Administration & Defense; Compulsory Social Security
d. R. Estate, Renting & Business
Note: Regional levels may not add up to the national totals due to rounding. Page 116

As of July 2013
REGIONAL ACCOUNTS OF THE PHILIPPINESBase Year: 2000Table 4.12. REGION VIII, EASTERN VISAYASGROSS REGIONAL DOMESTIC PRODUCT BY INDUSTRIAL ORIGIN2010 TO 2012IMPLICIT PRICE INDEX
2010 2011 2012
I. AGRI., HUNTING, FORESTRY & FISHING 143.2 164.5 152.6 a. Agriculture and Forestry 165.3 188.8 172.2 b. Fishing 78.6 90.0 89.4
II INDUSTRY SECTOR 154.3 154.5 160.2 a. Mining and Quarrying 94.4 184.5 159.4 b. Manufacturing 151.9 149.8 148.3 c. Construction 166.0 171.6 175.2 d. Electricity, Gas and Water Supply 153.5 157.2 166.8
III SERVICE SECTOR 149.2 153.6 159.3 a. Transport, Storage & Communication 131.9 134.8 136.4
166.9 173.4 176.6
c. Financial Intermediation 170.2 176.4 181.6145.0 149.1 155.3
146.0 155.5 165.1
f. Other Services 152.3 154.1 161.8
GROSS DOMESTIC PRODUCT 150.1 156.4 158.1Source : National Statistical Coordination Board
INDUSTRY/YEAR
d. R. Estate, Renting & Business e. Public Administration & Defense; Compulsory Social Security
b. Trade and Repair of Motor Vehicles, Motorcycles, Personal and Household Goods
Note: Regional levels may not add up to the national totals due to rounding. Page 117

As of July 2013
REGIONAL ACCOUNTS OF THE PHILIPPINESUnit : In Thousand PesosTable 1.13A. REGION IX, ZAMBOANGA PENINSULAGROSS REGIONAL DOMESTIC PRODUCT BY INDUSTRIAL ORIGIN2010 TO 2012AT CURRENT PRICES
2010 2011 2012
I. AGRI., HUNTING, FORESTRY & FISHING 56,799,180 62,513,238 56,741,094 a. Agriculture and Forestry 42,594,071 49,815,597 46,003,722 b. Fishing 14,205,109 12,697,641 10,737,372
II INDUSTRY SECTOR 51,550,311 51,729,852 66,746,805 a. Mining and Quarrying 3,483,987 3,919,656 2,819,695 b. Manufacturing 36,044,574 36,656,573 49,666,497 c. Construction 10,143,952 9,238,275 12,130,656 d. Electricity, Gas and Water Supply 1,877,798 1,915,349 2,129,957
III SERVICE SECTOR 75,564,276 83,331,158 93,121,912 a. Transport, Storage & Communication 12,381,612 13,845,404 15,083,179
19,789,814 21,329,517 23,875,361 c. Financial Intermediation 8,104,037 8,845,776 10,148,379
8,973,277 9,904,569 11,096,394
9,213,374 9,803,241 10,988,784 f. Other Services 17,102,161 19,602,651 21,929,815
GROSS DOMESTIC PRODUCT 183,913,767 197,574,248 216,609,811Source : National Statistical Coordination Board
REGIONAL ACCOUNTS OF THE PHILIPPINESUnit : In Thousand PesosTable 1.13B. REGION IX, ZAMBOANGA PENINSULAGROSS REGIONAL DOMESTIC PRODUCT BY INDUSTRIAL ORIGIN2010 TO 2012AT CONSTANT 2000 PRICES
2010 2011 2012
I. AGRI., HUNTING, FORESTRY & FISHING 33,764,949 30,491,167 29,697,119 a. Agriculture and Forestry 19,344,620 19,460,043 19,472,338 b. Fishing 14,420,329 11,031,124 10,224,780
II INDUSTRY SECTOR 34,310,094 34,823,724 45,823,686 a. Mining and Quarrying 1,461,156 1,250,827 1,258,175 b. Manufacturing 25,193,058 26,690,025 36,082,800 c. Construction 6,222,778 5,454,652 6,997,310 d. Electricity, Gas and Water Supply 1,433,102 1,428,221 1,485,400
III SERVICE SECTOR 48,943,876 51,867,831 56,174,840 a. Transport, Storage & Communication 7,698,002 8,314,572 8,996,586
11,902,624 12,311,017 13,605,902 c. Financial Intermediation 4,762,814 4,971,340 5,551,454
6,316,459 6,701,460 7,169,752
6,312,600 6,304,335 6,655,835 f. Other Services 11,951,378 13,265,108 14,195,310
GROSS DOMESTIC PRODUCT 117,018,919 117,182,723 131,695,644Source : National Statistical Coordination Board
d. R. Estate, Renting & Business e. Public Administration & Defense; Compulsory Social Security
INDUSTRY/YEAR
INDUSTRY/YEAR
b. Trade and Repair of Motor Vehicles, Motorcycles, Personal and Household Goods
d. R. Estate, Renting & Business e. Public Administration & Defense; Compulsory Social Security
b. Trade and Repair of Motor Vehicles, Motorcycles, Personal and Household Goods
Note: Regional levels may not add up to the national totals due to rounding. Page 118

As of July 2013
REGIONAL ACCOUNTS OF THE PHILIPPINESUnit : In PercentTable 2.13A. REGION IX, ZAMBOANGA PENINSULAGROSS REGIONAL DOMESTIC PRODUCT BY INDUSTRIAL ORIGIN2010 TO 2012PERCENT DISTRIBUTION, AT CURRENT PRICES
2010 2011 2012
I. AGRI., HUNTING, FORESTRY & FISHING 30.9 31.6 26.2 a. Agriculture and Forestry 23.2 25.2 21.2 b. Fishing 7.7 6.4 5.0
II INDUSTRY SECTOR 28.0 26.2 30.8 a. Mining and Quarrying 1.9 2.0 1.3 b. Manufacturing 19.6 18.6 22.9 c. Construction 5.5 4.7 5.6 d. Electricity, Gas and Water Supply 1.0 1.0 1.0
III SERVICE SECTOR 41.1 42.2 43.0 a. Transport, Storage & Communication 6.7 7.0 7.0
10.8 10.8 11.0 c. Financial Intermediation 4.4 4.5 4.7
4.9 5.0 5.1
5.0 5.0 5.1 f. Other Services 9.3 9.9 10.1
GROSS DOMESTIC PRODUCT 100.0 100.0 100.0Source : National Statistical Coordination Board
REGIONAL ACCOUNTS OF THE PHILIPPINESUnit : In PercentTable 2.13B. REGION IX, ZAMBOANGA PENINSULAGROSS REGIONAL DOMESTIC PRODUCT BY INDUSTRIAL ORIGIN2010 TO 2012PERCENT DISTRIBUTION, AT CONSTANT 2000 PRICES
2010 2011 2012
I. AGRI., HUNTING, FORESTRY & FISHING 28.9 26.0 22.5 a. Agriculture and Forestry 16.5 16.6 14.8 b. Fishing 12.3 9.4 7.8
II INDUSTRY SECTOR 29.3 29.7 34.8 a. Mining and Quarrying 1.2 1.1 1.0 b. Manufacturing 21.5 22.8 27.4 c. Construction 5.3 4.7 5.3 d. Electricity, Gas and Water Supply 1.2 1.2 1.1
III SERVICE SECTOR 41.8 44.3 42.7 a. Transport, Storage & Communication 6.6 7.1 6.8
10.2 10.5 10.3 c. Financial Intermediation 4.1 4.2 4.2
5.4 5.7 5.4
5.4 5.4 5.1 f. Other Services 10.2 11.3 10.8
GROSS DOMESTIC PRODUCT 100.0 100.0 100.0Source : National Statistical Coordination Board
INDUSTRY/YEAR
b. Trade and Repair of Motor Vehicles, Motorcycles, Personal and Household Goods
d. R. Estate, Renting & Business e. Public Administration & Defense; Compulsory Social Security
b. Trade and Repair of Motor Vehicles, Motorcycles, Personal and Household Goods
INDUSTRY/YEAR
d. R. Estate, Renting & Business e. Public Administration & Defense; Compulsory Social Security
Note: Regional levels may not add up to the national totals due to rounding. Page 119
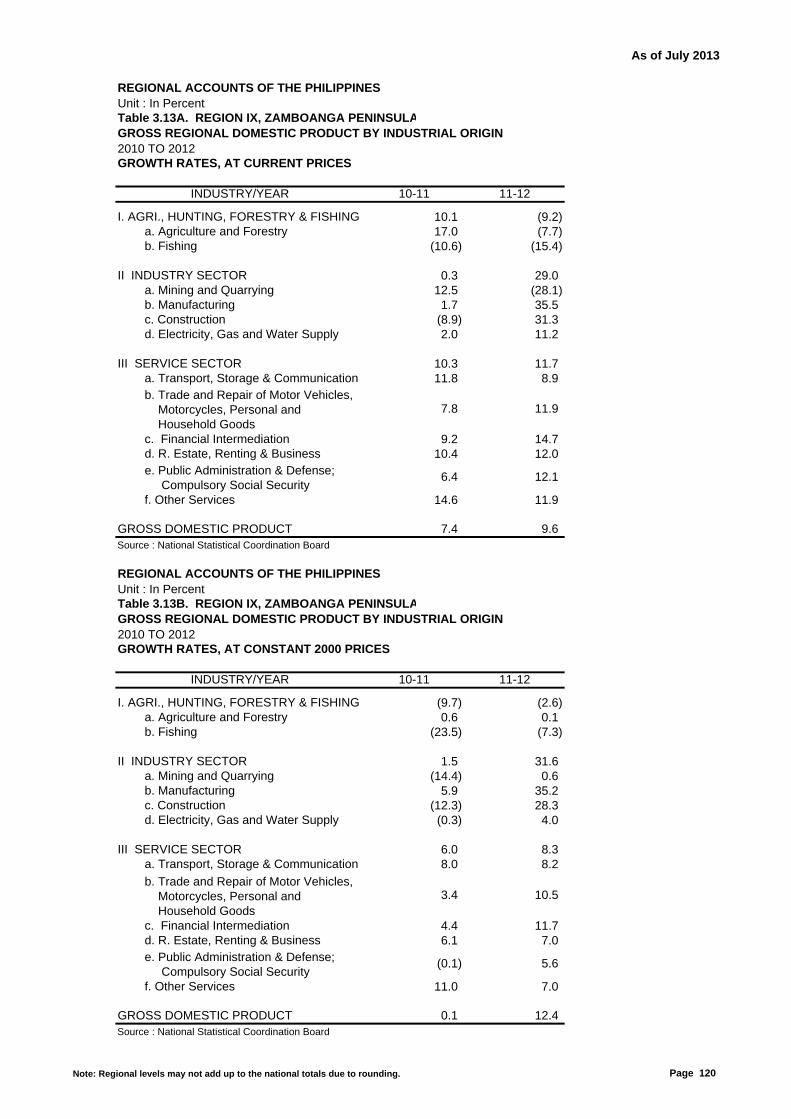
As of July 2013
REGIONAL ACCOUNTS OF THE PHILIPPINESUnit : In PercentTable 3.13A. REGION IX, ZAMBOANGA PENINSULAGROSS REGIONAL DOMESTIC PRODUCT BY INDUSTRIAL ORIGIN2010 TO 2012GROWTH RATES, AT CURRENT PRICES
10-11 11-12
I. AGRI., HUNTING, FORESTRY & FISHING 10.1 (9.2) a. Agriculture and Forestry 17.0 (7.7) b. Fishing (10.6) (15.4)
II INDUSTRY SECTOR 0.3 29.0 a. Mining and Quarrying 12.5 (28.1) b. Manufacturing 1.7 35.5 c. Construction (8.9) 31.3 d. Electricity, Gas and Water Supply 2.0 11.2
III SERVICE SECTOR 10.3 11.7 a. Transport, Storage & Communication 11.8 8.9
7.8 11.9
c. Financial Intermediation 9.2 14.710.4 12.0
6.4 12.1
f. Other Services 14.6 11.9
GROSS DOMESTIC PRODUCT 7.4 9.6Source : National Statistical Coordination Board
REGIONAL ACCOUNTS OF THE PHILIPPINESUnit : In PercentTable 3.13B. REGION IX, ZAMBOANGA PENINSULAGROSS REGIONAL DOMESTIC PRODUCT BY INDUSTRIAL ORIGIN2010 TO 2012GROWTH RATES, AT CONSTANT 2000 PRICES
10-11 11-12
I. AGRI., HUNTING, FORESTRY & FISHING (9.7) (2.6) a. Agriculture and Forestry 0.6 0.1 b. Fishing (23.5) (7.3)
II INDUSTRY SECTOR 1.5 31.6 a. Mining and Quarrying (14.4) 0.6 b. Manufacturing 5.9 35.2 c. Construction (12.3) 28.3 d. Electricity, Gas and Water Supply (0.3) 4.0
III SERVICE SECTOR 6.0 8.3 a. Transport, Storage & Communication 8.0 8.2
3.4 10.5
c. Financial Intermediation 4.4 11.76.1 7.0
(0.1) 5.6
f. Other Services 11.0 7.0
GROSS DOMESTIC PRODUCT 0.1 12.4Source : National Statistical Coordination Board
e. Public Administration & Defense; Compulsory Social Security
b. Trade and Repair of Motor Vehicles, Motorcycles, Personal and Household Goods
d. R. Estate, Renting & Business
INDUSTRY/YEAR
INDUSTRY/YEAR
b. Trade and Repair of Motor Vehicles, Motorcycles, Personal and Household Goods
e. Public Administration & Defense; Compulsory Social Security
d. R. Estate, Renting & Business
Note: Regional levels may not add up to the national totals due to rounding. Page 120

As of July 2013
REGIONAL ACCOUNTS OF THE PHILIPPINESBase Year: 2000Table 4.13. REGION IX, ZAMBOANGA PENINSULA GROSS REGIONAL DOMESTIC PRODUCT BY INDUSTRIAL ORIGIN2010 TO 2012IMPLICIT PRICE INDEX
2010 2011 2012
I. AGRI., HUNTING, FORESTRY & FISHING 168.2 205.0 191.1 a. Agriculture and Forestry 220.2 256.0 236.3 b. Fishing 98.5 115.1 105.0
II INDUSTRY SECTOR 150.2 148.5 145.7 a. Mining and Quarrying 238.4 313.4 224.1 b. Manufacturing 143.1 137.3 137.6 c. Construction 163.0 169.4 173.4 d. Electricity, Gas and Water Supply 131.0 134.1 143.4
III SERVICE SECTOR 154.4 160.7 165.8 a. Transport, Storage & Communication 160.8 166.5 167.7
166.3 173.3 175.5
c. Financial Intermediation 170.2 177.9 182.8142.1 147.8 154.8
146.0 155.5 165.1
f. Other Services 143.1 147.8 154.5
GROSS DOMESTIC PRODUCT 157.2 168.6 164.5Source : National Statistical Coordination Board
INDUSTRY/YEAR
d. R. Estate, Renting & Business e. Public Administration & Defense; Compulsory Social Security
b. Trade and Repair of Motor Vehicles, Motorcycles, Personal and Household Goods
Note: Regional levels may not add up to the national totals due to rounding. Page 121

As of July 2013
REGIONAL ACCOUNTS OF THE PHILIPPINESUnit : In Thousand PesosTable 1.14A. REGION X, NORTHERN MINDANAOGROSS REGIONAL DOMESTIC PRODUCT BY INDUSTRIAL ORIGIN2010 TO 2012AT CURRENT PRICES
2010 2011 2012
I. AGRI., HUNTING, FORESTRY & FISHING 99,887,103 114,554,573 110,878,943 a. Agriculture and Forestry 91,510,189 105,983,146 101,898,398 b. Fishing 8,376,914 8,571,427 8,980,544
II INDUSTRY SECTOR 106,017,640 112,900,910 127,460,937 a. Mining and Quarrying 750,410 840,263 979,655 b. Manufacturing 59,618,110 63,029,249 71,069,514 c. Construction 22,008,170 24,599,253 27,888,114 d. Electricity, Gas and Water Supply 23,640,950 24,432,145 27,523,654
III SERVICE SECTOR 138,519,810 152,019,823 171,257,816 a. Transport, Storage & Communication 21,550,509 23,964,137 26,863,431
52,867,174 57,936,580 65,731,222 c. Financial Intermediation 12,058,483 13,485,961 15,328,576
16,595,092 18,400,480 20,911,604
10,609,034 11,338,043 12,892,442 f. Other Services 24,839,518 26,894,622 29,530,540
GROSS DOMESTIC PRODUCT 344,424,553 379,475,306 409,597,695Source : National Statistical Coordination Board
REGIONAL ACCOUNTS OF THE PHILIPPINESUnit : In Thousand PesosTable 1.14B. REGION X, NORTHERN MINDANAOGROSS REGIONAL DOMESTIC PRODUCT BY INDUSTRIAL ORIGIN2010 TO 2012AT CONSTANT 2000 PRICES
2010 2011 2012
I. AGRI., HUNTING, FORESTRY & FISHING 54,471,105 58,026,532 59,469,283 a. Agriculture and Forestry 47,804,657 51,402,230 52,536,264 b. Fishing 6,666,448 6,624,301 6,933,019
II INDUSTRY SECTOR 68,631,228 73,196,493 79,964,178 a. Mining and Quarrying 760,899 793,149 868,691 b. Manufacturing 40,626,188 44,014,975 48,778,302 c. Construction 12,636,835 13,363,932 14,783,446 d. Electricity, Gas and Water Supply 14,607,306 15,024,436 15,533,739
III SERVICE SECTOR 87,863,188 91,937,715 100,243,711 a. Transport, Storage & Communication 14,816,619 15,863,645 17,529,524
31,091,834 32,185,060 35,772,826 c. Financial Intermediation 6,903,911 7,262,560 7,913,165
10,206,652 10,835,485 11,902,527
7,268,845 7,291,346 7,808,869 f. Other Services 17,575,327 18,499,618 19,316,800
GROSS DOMESTIC PRODUCT 210,965,521 223,160,739 239,677,173Source : National Statistical Coordination Board
b. Trade and Repair of Motor Vehicles, Motorcycles, Personal and Household Goods
d. R. Estate, Renting & Business e. Public Administration & Defense; Compulsory Social Security
INDUSTRY/YEAR
INDUSTRY/YEAR
b. Trade and Repair of Motor Vehicles, Motorcycles, Personal and Household Goods
d. R. Estate, Renting & Business e. Public Administration & Defense; Compulsory Social Security
Note: Regional levels may not add up to the national totals due to rounding. Page 122
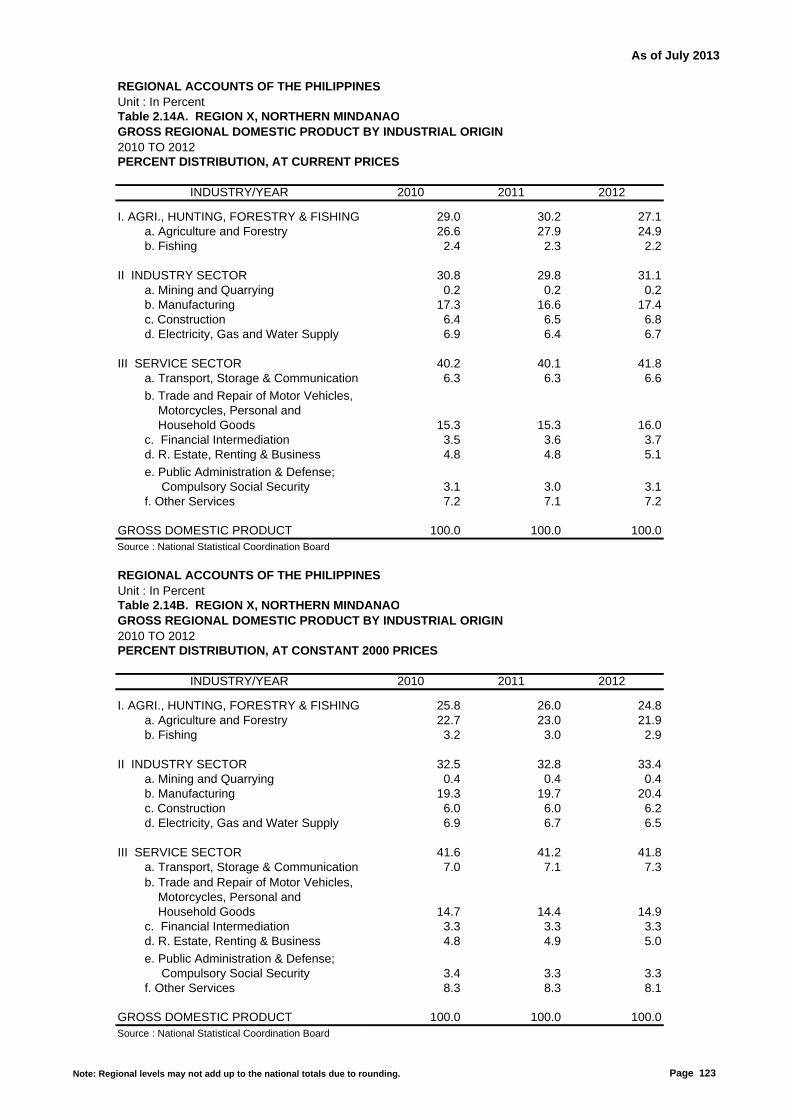
As of July 2013
REGIONAL ACCOUNTS OF THE PHILIPPINESUnit : In PercentTable 2.14A. REGION X, NORTHERN MINDANAOGROSS REGIONAL DOMESTIC PRODUCT BY INDUSTRIAL ORIGIN2010 TO 2012PERCENT DISTRIBUTION, AT CURRENT PRICES
2010 2011 2012
I. AGRI., HUNTING, FORESTRY & FISHING 29.0 30.2 27.1 a. Agriculture and Forestry 26.6 27.9 24.9 b. Fishing 2.4 2.3 2.2
II INDUSTRY SECTOR 30.8 29.8 31.1 a. Mining and Quarrying 0.2 0.2 0.2 b. Manufacturing 17.3 16.6 17.4 c. Construction 6.4 6.5 6.8 d. Electricity, Gas and Water Supply 6.9 6.4 6.7
III SERVICE SECTOR 40.2 40.1 41.8 a. Transport, Storage & Communication 6.3 6.3 6.6
15.3 15.3 16.0 c. Financial Intermediation 3.5 3.6 3.7
4.8 4.8 5.1
3.1 3.0 3.1 f. Other Services 7.2 7.1 7.2
GROSS DOMESTIC PRODUCT 100.0 100.0 100.0Source : National Statistical Coordination Board
REGIONAL ACCOUNTS OF THE PHILIPPINESUnit : In PercentTable 2.14B. REGION X, NORTHERN MINDANAOGROSS REGIONAL DOMESTIC PRODUCT BY INDUSTRIAL ORIGIN2010 TO 2012PERCENT DISTRIBUTION, AT CONSTANT 2000 PRICES
2010 2011 2012
I. AGRI., HUNTING, FORESTRY & FISHING 25.8 26.0 24.8 a. Agriculture and Forestry 22.7 23.0 21.9 b. Fishing 3.2 3.0 2.9
II INDUSTRY SECTOR 32.5 32.8 33.4 a. Mining and Quarrying 0.4 0.4 0.4 b. Manufacturing 19.3 19.7 20.4 c. Construction 6.0 6.0 6.2 d. Electricity, Gas and Water Supply 6.9 6.7 6.5
III SERVICE SECTOR 41.6 41.2 41.8 a. Transport, Storage & Communication 7.0 7.1 7.3
14.7 14.4 14.9 c. Financial Intermediation 3.3 3.3 3.3
4.8 4.9 5.0
3.4 3.3 3.3 f. Other Services 8.3 8.3 8.1
GROSS DOMESTIC PRODUCT 100.0 100.0 100.0Source : National Statistical Coordination Board
d. R. Estate, Renting & Business
e. Public Administration & Defense; Compulsory Social Security
INDUSTRY/YEAR
b. Trade and Repair of Motor Vehicles, Motorcycles, Personal and Household Goods
d. R. Estate, Renting & Business
e. Public Administration & Defense; Compulsory Social Security
INDUSTRY/YEAR
b. Trade and Repair of Motor Vehicles, Motorcycles, Personal and Household Goods
Note: Regional levels may not add up to the national totals due to rounding. Page 123

As of July 2013
REGIONAL ACCOUNTS OF THE PHILIPPINESUnit : In PercentTable 3.14A. REGION X, NORTHERN MINDANAOGROSS REGIONAL DOMESTIC PRODUCT BY INDUSTRIAL ORIGIN2010 TO 2012GROWTH RATES, AT CURRENT PRICES
10-11 11-12
I. AGRI., HUNTING, FORESTRY & FISHING 14.7 (3.2) a. Agriculture and Forestry 15.8 (3.9) b. Fishing 2.3 4.8
II INDUSTRY SECTOR 6.5 12.9 a. Mining and Quarrying 12.0 16.6 b. Manufacturing 5.7 12.8 c. Construction 11.8 13.4 d. Electricity, Gas and Water Supply 3.3 12.7
III SERVICE SECTOR 9.7 12.7 a. Transport, Storage & Communication 11.2 12.1
9.6 13.5
c. Financial Intermediation 11.8 13.710.9 13.6
6.9 13.7
f. Other Services 8.3 9.8
GROSS DOMESTIC PRODUCT 10.2 7.9Source : National Statistical Coordination Board
REGIONAL ACCOUNTS OF THE PHILIPPINESUnit : In PercentTable 3.14B. REGION X, NORTHERN MINDANAOGROSS REGIONAL DOMESTIC PRODUCT BY INDUSTRIAL ORIGIN2010 TO 2012GROWTH RATES, AT CONSTANT 2000 PRICES
10-11 11-12
I. AGRI., HUNTING, FORESTRY & FISHING 6.5 2.5 a. Agriculture and Forestry 7.5 2.2 b. Fishing (0.6) 4.7
II INDUSTRY SECTOR 6.7 9.2 a. Mining and Quarrying 4.2 9.5 b. Manufacturing 8.3 10.8 c. Construction 5.8 10.6 d. Electricity, Gas and Water Supply 2.9 3.4
III SERVICE SECTOR 4.6 9.0 a. Transport, Storage & Communication 7.1 10.5
3.5 11.1
c. Financial Intermediation 5.2 9.06.2 9.8
0.3 7.1
f. Other Services 5.3 4.4
GROSS DOMESTIC PRODUCT 5.8 7.4Source : National Statistical Coordination Board
b. Trade and Repair of Motor Vehicles, Motorcycles, Personal and Household Goods
d. R. Estate, Renting & Business e. Public Administration & Defense; Compulsory Social Security
INDUSTRY/YEAR
INDUSTRY/YEAR
b. Trade and Repair of Motor Vehicles, Motorcycles, Personal and Household Goods
d. R. Estate, Renting & Business e. Public Administration & Defense; Compulsory Social Security
Note: Regional levels may not add up to the national totals due to rounding. Page 124

As of July 2013
REGIONAL ACCOUNTS OF THE PHILIPPINESbase Year: 2000Table 4.14. REGION X, NORTHERN MINDANAOGROSS REGIONAL DOMESTIC PRODUCT BY INDUSTRIAL ORIGIN2010 TO 2012IMPLICIT PRICE INDEX
2010 2011 2012
I. AGRI., HUNTING, FORESTRY & FISHING 183.4 197.4 186.4 a. Agriculture and Forestry 191.4 206.2 194.0 b. Fishing 125.7 129.4 129.5
II INDUSTRY SECTOR 154.5 154.2 159.4 a. Mining and Quarrying 98.6 105.9 112.8 b. Manufacturing 146.7 143.2 145.7 c. Construction 174.2 184.1 188.6 d. Electricity, Gas and Water Supply 161.8 162.6 177.2
III SERVICE SECTOR 157.7 165.4 170.8 a. Transport, Storage & Communication 145.4 151.1 153.2
170.0 180.0 183.7
c. Financial Intermediation 174.7 185.7 193.7162.6 169.8 175.7
146.0 155.5 165.1
f. Other Services 141.3 145.4 152.9
GROSS DOMESTIC PRODUCT 163.3 170.0 170.9Source : National Statistical Coordination Board
INDUSTRY/YEAR
d. R. Estate, Renting & Business e. Public Administration & Defense; Compulsory Social Security
b. Trade and Repair of Motor Vehicles, Motorcycles, Personal and Household Goods
Note: Regional levels may not add up to the national totals due to rounding. Page 125
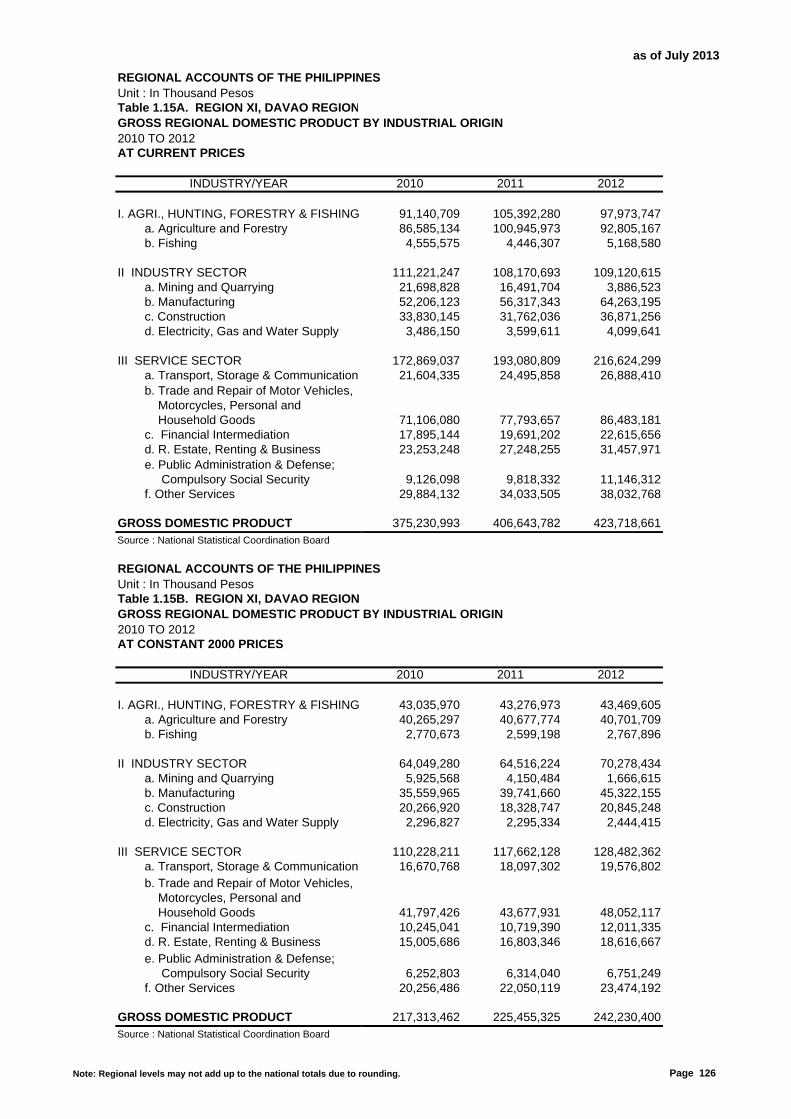
as of July 2013
REGIONAL ACCOUNTS OF THE PHILIPPINESUnit : In Thousand PesosTable 1.15A. REGION XI, DAVAO REGIONGROSS REGIONAL DOMESTIC PRODUCT BY INDUSTRIAL ORIGIN2010 TO 2012AT CURRENT PRICES
2010 2011 2012
I. AGRI., HUNTING, FORESTRY & FISHING 91,140,709 105,392,280 97,973,747 a. Agriculture and Forestry 86,585,134 100,945,973 92,805,167 b. Fishing 4,555,575 4,446,307 5,168,580
II INDUSTRY SECTOR 111,221,247 108,170,693 109,120,615 a. Mining and Quarrying 21,698,828 16,491,704 3,886,523 b. Manufacturing 52,206,123 56,317,343 64,263,195 c. Construction 33,830,145 31,762,036 36,871,256 d. Electricity, Gas and Water Supply 3,486,150 3,599,611 4,099,641
III SERVICE SECTOR 172,869,037 193,080,809 216,624,299 a. Transport, Storage & Communication 21,604,335 24,495,858 26,888,410
71,106,080 77,793,657 86,483,181 c. Financial Intermediation 17,895,144 19,691,202 22,615,656
23,253,248 27,248,255 31,457,971
9,126,098 9,818,332 11,146,312 f. Other Services 29,884,132 34,033,505 38,032,768
GROSS DOMESTIC PRODUCT 375,230,993 406,643,782 423,718,661Source : National Statistical Coordination Board
REGIONAL ACCOUNTS OF THE PHILIPPINESUnit : In Thousand PesosTable 1.15B. REGION XI, DAVAO REGIONGROSS REGIONAL DOMESTIC PRODUCT BY INDUSTRIAL ORIGIN2010 TO 2012AT CONSTANT 2000 PRICES
2010 2011 2012
I. AGRI., HUNTING, FORESTRY & FISHING 43,035,970 43,276,973 43,469,605 a. Agriculture and Forestry 40,265,297 40,677,774 40,701,709 b. Fishing 2,770,673 2,599,198 2,767,896
II INDUSTRY SECTOR 64,049,280 64,516,224 70,278,434 a. Mining and Quarrying 5,925,568 4,150,484 1,666,615 b. Manufacturing 35,559,965 39,741,660 45,322,155 c. Construction 20,266,920 18,328,747 20,845,248 d. Electricity, Gas and Water Supply 2,296,827 2,295,334 2,444,415
III SERVICE SECTOR 110,228,211 117,662,128 128,482,362 a. Transport, Storage & Communication 16,670,768 18,097,302 19,576,802
41,797,426 43,677,931 48,052,117 c. Financial Intermediation 10,245,041 10,719,390 12,011,335
15,005,686 16,803,346 18,616,667
6,252,803 6,314,040 6,751,249 f. Other Services 20,256,486 22,050,119 23,474,192
GROSS DOMESTIC PRODUCT 217,313,462 225,455,325 242,230,400Source : National Statistical Coordination Board
d. R. Estate, Renting & Business e. Public Administration & Defense; Compulsory Social Security
INDUSTRY/YEAR
INDUSTRY/YEAR
b. Trade and Repair of Motor Vehicles, Motorcycles, Personal and Household Goods
d. R. Estate, Renting & Business e. Public Administration & Defense; Compulsory Social Security
b. Trade and Repair of Motor Vehicles, Motorcycles, Personal and Household Goods
Note: Regional levels may not add up to the national totals due to rounding. Page 126

as of July 2013
REGIONAL ACCOUNTS OF THE PHILIPPINESUnit : In PercentTable 2.15A. REGION XI, DAVAO REGIONGROSS REGIONAL DOMESTIC PRODUCT BY INDUSTRIAL ORIGIN2010 TO 2012PERCENT DISTRIBUTION, AT CURRENT PRICES
2010 2011 2012
I. AGRI., HUNTING, FORESTRY & FISHING 24.3 25.9 23.1 a. Agriculture and Forestry 23.1 24.8 21.9 b. Fishing 1.2 1.1 1.2
II INDUSTRY SECTOR 29.6 26.6 25.8 a. Mining and Quarrying 5.8 4.1 0.9 b. Manufacturing 13.9 13.8 15.2 c. Construction 9.0 7.8 8.7 d. Electricity, Gas and Water Supply 0.9 0.9 1.0
III SERVICE SECTOR 46.1 47.5 51.1 a. Transport, Storage & Communication 5.8 6.0 6.3
18.9 19.1 20.4 c. Financial Intermediation 4.8 4.8 5.3
6.2 6.7 7.4
2.4 2.4 2.6 f. Other Services 8.0 8.4 9.0
GROSS DOMESTIC PRODUCT 100.0 100.0 100.0Source : National Statistical Coordination Board
REGIONAL ACCOUNTS OF THE PHILIPPINESUnit : In PercentTable 2.15B. REGION XI, DAVAO REGIONGROSS REGIONAL DOMESTIC PRODUCT BY INDUSTRIAL ORIGIN2010 TO 2012PERCENT DISTRIBUTION, AT CONSTANT 2000 PRICES
2010 2011 2012
I. AGRI., HUNTING, FORESTRY & FISHING 19.8 19.2 17.9 a. Agriculture and Forestry 18.5 18.0 16.8 b. Fishing 1.3 1.2 1.1
II INDUSTRY SECTOR 29.5 28.6 29.0 a. Mining and Quarrying 2.7 1.8 0.7 b. Manufacturing 16.4 17.6 18.7 c. Construction 9.3 8.1 8.6 d. Electricity, Gas and Water Supply 1.1 1.0 1.0
III SERVICE SECTOR 50.7 52.2 53.0 a. Transport, Storage & Communication 7.7 8.0 8.1
19.2 19.4 19.8 c. Financial Intermediation 4.7 4.8 5.0
6.9 7.5 7.7
2.9 2.8 2.8 f. Other Services 9.3 9.8 9.7
GROSS DOMESTIC PRODUCT 100.0 100.0 100.0Source : National Statistical Coordination Board
INDUSTRY/YEAR
b. Trade and Repair of Motor Vehicles, Motorcycles, Personal and Household Goods
d. R. Estate, Renting & Business e. Public Administration & Defense; Compulsory Social Security
b. Trade and Repair of Motor Vehicles, Motorcycles, Personal and Household Goods
INDUSTRY/YEAR
d. R. Estate, Renting & Business e. Public Administration & Defense; Compulsory Social Security
Note: Regional levels may not add up to the national totals due to rounding. Page 127

as of July 2013
REGIONAL ACCOUNTS OF THE PHILIPPINESUnit : In PercentTable 3.15A. REGION XI, DAVAO REGIONGROSS REGIONAL DOMESTIC PRODUCT BY INDUSTRIAL ORIGIN2010 TO 2012GROWTH RATES, AT CURRENT PRICES
10-11 11-12
I. AGRI., HUNTING, FORESTRY & FISHING 15.6 (7.0) a. Agriculture and Forestry 16.6 (8.1) b. Fishing (2.4) 16.2
II INDUSTRY SECTOR (2.7) 0.9 a. Mining and Quarrying (24.0) (76.4) b. Manufacturing 7.9 14.1 c. Construction (6.1) 16.1 d. Electricity, Gas and Water Supply 3.3 13.9
III SERVICE SECTOR 11.7 12.2 a. Transport, Storage & Communication 13.4 9.8
9.4 11.2
c. Financial Intermediation 10.0 14.917.2 15.4
7.6 13.5
f. Other Services 13.9 11.8
GROSS DOMESTIC PRODUCT 8.4 4.2Source : National Statistical Coordination Board
REGIONAL ACCOUNTS OF THE PHILIPPINESUnit : In PercentTable 3.15B. REGION XI, DAVAO REGIONGROSS REGIONAL DOMESTIC PRODUCT BY INDUSTRIAL ORIGIN2010 TO 2012GROWTH RATES, AT CONSTANT 2000 PRICES
10-11 11-12
I. AGRI., HUNTING, FORESTRY & FISHING 0.6 0.4 a. Agriculture and Forestry 1.0 0.1 b. Fishing (6.2) 6.5
II INDUSTRY SECTOR 0.7 8.9 a. Mining and Quarrying (30.0) (59.8) b. Manufacturing 11.8 14.0 c. Construction (9.6) 13.7 d. Electricity, Gas and Water Supply (0.1) 6.5
III SERVICE SECTOR 6.7 9.2 a. Transport, Storage & Communication 8.6 8.2
4.5 10.0
c. Financial Intermediation 4.6 12.112.0 10.8
1.0 6.9
f. Other Services 8.9 6.5
GROSS DOMESTIC PRODUCT 3.7 7.4Source : National Statistical Coordination Board
e. Public Administration & Defense; Compulsory Social Security
b. Trade and Repair of Motor Vehicles, Motorcycles, Personal and Household Goods
d. R. Estate, Renting & Business
INDUSTRY/YEAR
INDUSTRY/YEAR
b. Trade and Repair of Motor Vehicles, Motorcycles, Personal and Household Goods
e. Public Administration & Defense; Compulsory Social Security
d. R. Estate, Renting & Business
Note: Regional levels may not add up to the national totals due to rounding. Page 128

as of July 2013
REGIONAL ACCOUNTS OF THE PHILIPPINESBase Year: 2000Table 4.15. REGION XI, DAVAO REGIONGROSS REGIONAL DOMESTIC PRODUCT BY INDUSTRIAL ORIGIN2010 TO 2012IMPLICIT PRICE INDEX
2010 2011 2012
I. AGRI., HUNTING, FORESTRY & FISHING 211.8 243.5 225.4 a. Agriculture and Forestry 215.0 248.2 228.0 b. Fishing 164.4 171.1 186.7
II INDUSTRY SECTOR 173.6 167.7 155.3 a. Mining and Quarrying 366.2 397.3 233.2 b. Manufacturing 146.8 141.7 141.8 c. Construction 166.9 173.3 176.9 d. Electricity, Gas and Water Supply 151.8 156.8 167.7
III SERVICE SECTOR 156.8 164.1 168.6 a. Transport, Storage & Communication 129.6 135.4 137.3
170.1 178.1 180.0
c. Financial Intermediation 174.7 183.7 188.3155.0 162.2 169.0
146.0 155.5 165.1
f. Other Services 147.5 154.3 162.0
GROSS DOMESTIC PRODUCT 172.7 180.4 174.9Source : National Statistical Coordination Board
INDUSTRY/YEAR
d. R. Estate, Renting & Business e. Public Administration & Defense; Compulsory Social Security
b. Trade and Repair of Motor Vehicles, Motorcycles, Personal and Household Goods
Note: Regional levels may not add up to the national totals due to rounding. Page 129
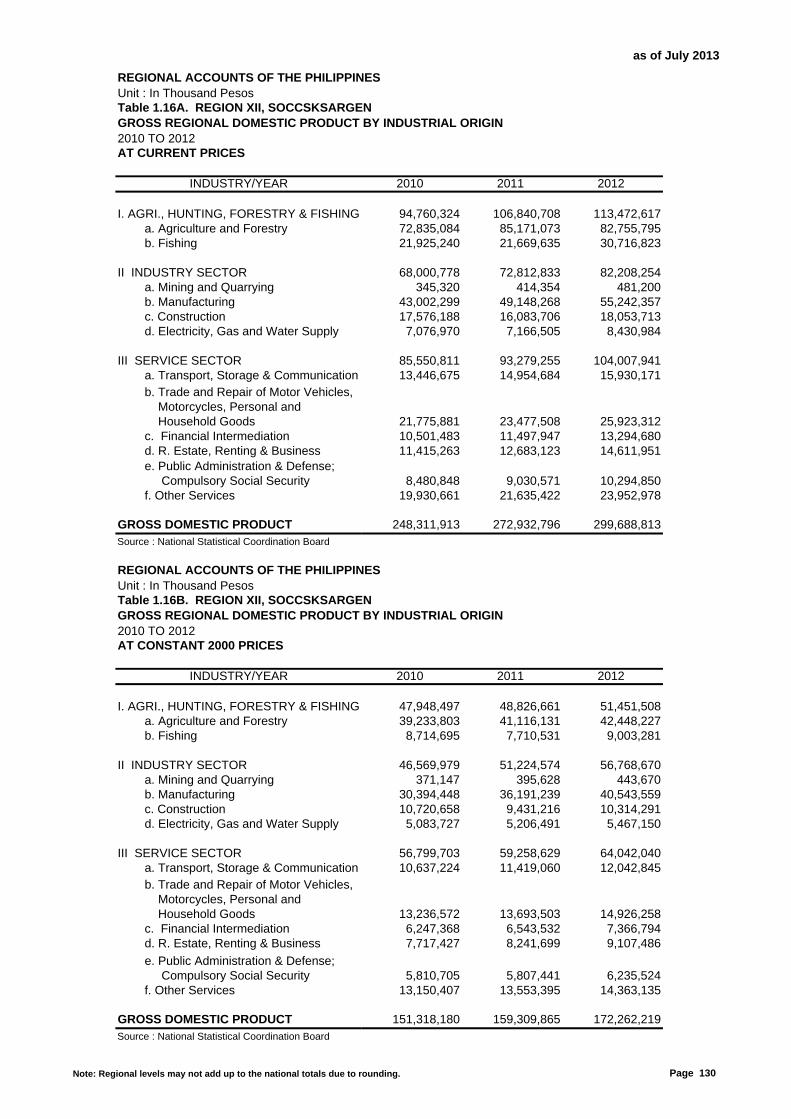
as of July 2013
REGIONAL ACCOUNTS OF THE PHILIPPINESUnit : In Thousand PesosTable 1.16A. REGION XII, SOCCSKSARGENGROSS REGIONAL DOMESTIC PRODUCT BY INDUSTRIAL ORIGIN2010 TO 2012AT CURRENT PRICES
2010 2011 2012
I. AGRI., HUNTING, FORESTRY & FISHING 94,760,324 106,840,708 113,472,617 a. Agriculture and Forestry 72,835,084 85,171,073 82,755,795 b. Fishing 21,925,240 21,669,635 30,716,823
II INDUSTRY SECTOR 68,000,778 72,812,833 82,208,254 a. Mining and Quarrying 345,320 414,354 481,200 b. Manufacturing 43,002,299 49,148,268 55,242,357 c. Construction 17,576,188 16,083,706 18,053,713 d. Electricity, Gas and Water Supply 7,076,970 7,166,505 8,430,984
III SERVICE SECTOR 85,550,811 93,279,255 104,007,941 a. Transport, Storage & Communication 13,446,675 14,954,684 15,930,171
21,775,881 23,477,508 25,923,312 c. Financial Intermediation 10,501,483 11,497,947 13,294,680
11,415,263 12,683,123 14,611,951
8,480,848 9,030,571 10,294,850 f. Other Services 19,930,661 21,635,422 23,952,978
GROSS DOMESTIC PRODUCT 248,311,913 272,932,796 299,688,813Source : National Statistical Coordination Board
REGIONAL ACCOUNTS OF THE PHILIPPINESUnit : In Thousand PesosTable 1.16B. REGION XII, SOCCSKSARGENGROSS REGIONAL DOMESTIC PRODUCT BY INDUSTRIAL ORIGIN2010 TO 2012AT CONSTANT 2000 PRICES
2010 2011 2012
I. AGRI., HUNTING, FORESTRY & FISHING 47,948,497 48,826,661 51,451,508 a. Agriculture and Forestry 39,233,803 41,116,131 42,448,227 b. Fishing 8,714,695 7,710,531 9,003,281
II INDUSTRY SECTOR 46,569,979 51,224,574 56,768,670 a. Mining and Quarrying 371,147 395,628 443,670 b. Manufacturing 30,394,448 36,191,239 40,543,559 c. Construction 10,720,658 9,431,216 10,314,291 d. Electricity, Gas and Water Supply 5,083,727 5,206,491 5,467,150
III SERVICE SECTOR 56,799,703 59,258,629 64,042,040 a. Transport, Storage & Communication 10,637,224 11,419,060 12,042,845
13,236,572 13,693,503 14,926,258 c. Financial Intermediation 6,247,368 6,543,532 7,366,794
7,717,427 8,241,699 9,107,486
5,810,705 5,807,441 6,235,524 f. Other Services 13,150,407 13,553,395 14,363,135
GROSS DOMESTIC PRODUCT 151,318,180 159,309,865 172,262,219Source : National Statistical Coordination Board
d. R. Estate, Renting & Business
e. Public Administration & Defense; Compulsory Social Security
INDUSTRY/YEAR
INDUSTRY/YEAR
b. Trade and Repair of Motor Vehicles, Motorcycles, Personal and Household Goods
d. R. Estate, Renting & Business e. Public Administration & Defense; Compulsory Social Security
b. Trade and Repair of Motor Vehicles, Motorcycles, Personal and Household Goods
Note: Regional levels may not add up to the national totals due to rounding. Page 130

as of July 2013
REGIONAL ACCOUNTS OF THE PHILIPPINESUnit : In PercentTable 2.16A. REGION XII, SOCCSKSARGENGROSS REGIONAL DOMESTIC PRODUCT BY INDUSTRIAL ORIGIN2010 TO 2012PERCENT DISTRIBUTION, AT CURRENT PRICES
2010 2011 2012
I. AGRI., HUNTING, FORESTRY & FISHING 38.2 39.1 37.9 a. Agriculture and Forestry 29.3 31.2 27.6 b. Fishing 8.8 7.9 10.2
II INDUSTRY SECTOR 27.4 26.7 27.4 a. Mining and Quarrying 0.1 0.2 0.2 b. Manufacturing 17.3 18.0 18.4 c. Construction 7.1 5.9 6.0 d. Electricity, Gas and Water Supply 2.9 2.6 2.8
III SERVICE SECTOR 34.5 34.2 34.7 a. Transport, Storage & Communication 5.4 5.5 5.3
8.8 8.6 8.7 c. Financial Intermediation 4.2 4.2 4.4
4.6 4.6 4.9
3.4 3.3 3.4 f. Other Services 8.0 7.9 8.0
GROSS DOMESTIC PRODUCT 100.0 100.0 100.0Source : National Statistical Coordination Board
REGIONAL ACCOUNTS OF THE PHILIPPINESUnit : In PercentTable 2.16B. REGION XII, SOCCSKSARGENGROSS REGIONAL DOMESTIC PRODUCT BY INDUSTRIAL ORIGIN2010 TO 2012PERCENT DISTRIBUTION, AT CONSTANT 2000 PRICES
2010 2011 2012
I. AGRI., HUNTING, FORESTRY & FISHING 31.7 30.6 29.9 a. Agriculture and Forestry 25.9 25.8 24.6 b. Fishing 5.8 4.8 5.2
II INDUSTRY SECTOR 30.8 32.2 33.0 a. Mining and Quarrying 0.2 0.2 0.3 b. Manufacturing 20.1 22.7 23.5 c. Construction 7.1 5.9 6.0 d. Electricity, Gas and Water Supply 3.4 3.3 3.2
III SERVICE SECTOR 37.5 37.2 37.2 a. Transport, Storage & Communication 7.0 7.2 7.0
8.7 8.6 8.7 c. Financial Intermediation 4.1 4.1 4.3
5.1 5.2 5.3
3.8 3.6 3.6 f. Other Services 8.7 8.5 8.3
GROSS DOMESTIC PRODUCT 100.0 100.0 100.0Source : National Statistical Coordination Board
INDUSTRY/YEAR
b. Trade and Repair of Motor Vehicles, Motorcycles, Personal and Household Goods
d. R. Estate, Renting & Business e. Public Administration & Defense; Compulsory Social Security
b. Trade and Repair of Motor Vehicles, Motorcycles, Personal and Household Goods
INDUSTRY/YEAR
d. R. Estate, Renting & Business e. Public Administration & Defense; Compulsory Social Security
Note: Regional levels may not add up to the national totals due to rounding. Page 131

as of July 2013
REGIONAL ACCOUNTS OF THE PHILIPPINESUnit : In PercentTable 3.16A. REGION XII, SOCCSKSARGENGROSS REGIONAL DOMESTIC PRODUCT BY INDUSTRIAL ORIGIN2010 TO 2012GROWTH RATES, AT CURRENT PRICES
10-11 11-12
I. AGRI., HUNTING, FORESTRY & FISHING 12.7 6.2 a. Agriculture and Forestry 16.9 (2.8) b. Fishing (1.2) 41.8
II INDUSTRY SECTOR 7.1 12.9 a. Mining and Quarrying 20.0 16.1 b. Manufacturing 14.3 12.4 c. Construction (8.5) 12.2 d. Electricity, Gas and Water Supply 1.3 17.6
III SERVICE SECTOR 9.0 11.5 a. Transport, Storage & Communication 11.2 6.5
7.8 10.4
c. Financial Intermediation 9.5 15.611.1 15.2
6.5 14.0
f. Other Services 8.6 10.7
GROSS DOMESTIC PRODUCT 9.9 9.8Source : National Statistical Coordination Board
REGIONAL ACCOUNTS OF THE PHILIPPINESUnit : In PercentTable 3.16B. REGION XII, SOCCSKSARGENGROSS REGIONAL DOMESTIC PRODUCT BY INDUSTRIAL ORIGIN2010 TO 2012GROWTH RATES, AT CONSTANT 2000 PRICES
10-11 11-12
I. AGRI., HUNTING, FORESTRY & FISHING 1.8 5.4 a. Agriculture and Forestry 4.8 3.2 b. Fishing (11.5) 16.8
II INDUSTRY SECTOR 10.0 10.8 a. Mining and Quarrying 6.6 12.1 b. Manufacturing 19.1 12.0 c. Construction (12.0) 9.4 d. Electricity, Gas and Water Supply 2.4 5.0
III SERVICE SECTOR 4.3 8.1 a. Transport, Storage & Communication 7.3 5.5
3.5 9.0
c. Financial Intermediation 4.7 12.66.8 10.5
(0.1) 7.4
f. Other Services 3.1 6.0
GROSS DOMESTIC PRODUCT 5.3 8.1Source : National Statistical Coordination Board
e. Public Administration & Defense; Compulsory Social Security
b. Trade and Repair of Motor Vehicles, Motorcycles, Personal and Household Goods
d. R. Estate, Renting & Business
INDUSTRY/YEAR
INDUSTRY/YEAR
b. Trade and Repair of Motor Vehicles, Motorcycles, Personal and Household Goods
e. Public Administration & Defense; Compulsory Social Security
d. R. Estate, Renting & Business
Note: Regional levels may not add up to the national totals due to rounding. Page 132

as of July 2013
REGIONAL ACCOUNTS OF THE PHILIPPINESBase Year: 2000Table 4.16. REGION XII, SOCCSKSARGENGROSS REGIONAL DOMESTIC PRODUCT BY INDUSTRIAL ORIGIN2010 TO 2012IMPLICIT PRICE INDEX
2010 2011 2012
I. AGRI., HUNTING, FORESTRY & FISHING 197.6 218.8 220.5 a. Agriculture and Forestry 185.6 207.1 195.0 b. Fishing 251.6 281.0 341.2
II INDUSTRY SECTOR 146.0 142.1 144.8 a. Mining and Quarrying 93.0 104.7 108.5 b. Manufacturing 141.5 135.8 136.3 c. Construction 163.9 170.5 175.0 d. Electricity, Gas and Water Supply 139.2 137.6 154.2
III SERVICE SECTOR 150.6 157.4 162.4 a. Transport, Storage & Communication 126.4 131.0 132.3
164.5 171.4 173.7
c. Financial Intermediation 168.1 175.7 180.5147.9 153.9 160.4
146.0 155.5 165.1
f. Other Services 151.6 159.6 166.8
GROSS DOMESTIC PRODUCT 164.1 171.3 174.0Source : National Statistical Coordination Board
INDUSTRY/YEAR
d. R. Estate, Renting & Business e. Public Administration & Defense; Compulsory Social Security
b. Trade and Repair of Motor Vehicles, Motorcycles, Personal and Household Goods
Note: Regional levels may not add up to the national totals due to rounding. Page 133
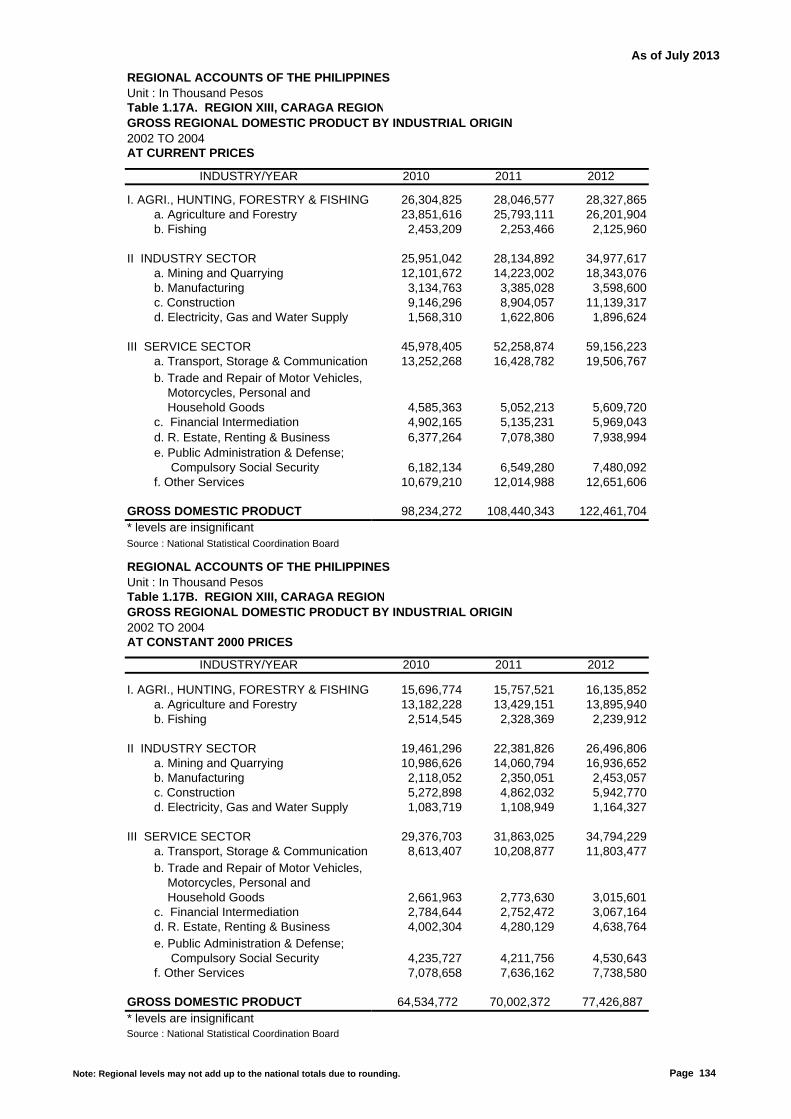
As of July 2013
REGIONAL ACCOUNTS OF THE PHILIPPINESUnit : In Thousand PesosTable 1.17A. REGION XIII, CARAGA REGIONGROSS REGIONAL DOMESTIC PRODUCT BY INDUSTRIAL ORIGIN2002 TO 2004AT CURRENT PRICES
2010 2011 2012
I. AGRI., HUNTING, FORESTRY & FISHING 26,304,825 28,046,577 28,327,865 a. Agriculture and Forestry 23,851,616 25,793,111 26,201,904 b. Fishing 2,453,209 2,253,466 2,125,960
II INDUSTRY SECTOR 25,951,042 28,134,892 34,977,617 a. Mining and Quarrying 12,101,672 14,223,002 18,343,076 b. Manufacturing 3,134,763 3,385,028 3,598,600 c. Construction 9,146,296 8,904,057 11,139,317 d. Electricity, Gas and Water Supply 1,568,310 1,622,806 1,896,624
III SERVICE SECTOR 45,978,405 52,258,874 59,156,223 a. Transport, Storage & Communication 13,252,268 16,428,782 19,506,767
4,585,363 5,052,213 5,609,720 c. Financial Intermediation 4,902,165 5,135,231 5,969,043
6,377,264 7,078,380 7,938,994
6,182,134 6,549,280 7,480,092 f. Other Services 10,679,210 12,014,988 12,651,606
GROSS DOMESTIC PRODUCT 98,234,272 108,440,343 122,461,704* levels are insignificantSource : National Statistical Coordination Board
REGIONAL ACCOUNTS OF THE PHILIPPINESUnit : In Thousand PesosTable 1.17B. REGION XIII, CARAGA REGIONGROSS REGIONAL DOMESTIC PRODUCT BY INDUSTRIAL ORIGIN2002 TO 2004AT CONSTANT 2000 PRICES
2010 2011 2012
I. AGRI., HUNTING, FORESTRY & FISHING 15,696,774 15,757,521 16,135,852 a. Agriculture and Forestry 13,182,228 13,429,151 13,895,940 b. Fishing 2,514,545 2,328,369 2,239,912
II INDUSTRY SECTOR 19,461,296 22,381,826 26,496,806 a. Mining and Quarrying 10,986,626 14,060,794 16,936,652 b. Manufacturing 2,118,052 2,350,051 2,453,057 c. Construction 5,272,898 4,862,032 5,942,770 d. Electricity, Gas and Water Supply 1,083,719 1,108,949 1,164,327
III SERVICE SECTOR 29,376,703 31,863,025 34,794,229 a. Transport, Storage & Communication 8,613,407 10,208,877 11,803,477
2,661,963 2,773,630 3,015,601 c. Financial Intermediation 2,784,644 2,752,472 3,067,164
4,002,304 4,280,129 4,638,764
4,235,727 4,211,756 4,530,643 f. Other Services 7,078,658 7,636,162 7,738,580
GROSS DOMESTIC PRODUCT 64,534,772 70,002,372 77,426,887 * levels are insignificantSource : National Statistical Coordination Board
d. R. Estate, Renting & Business e. Public Administration & Defense; Compulsory Social Security
INDUSTRY/YEAR
INDUSTRY/YEAR
b. Trade and Repair of Motor Vehicles, Motorcycles, Personal and Household Goods
d. R. Estate, Renting & Business e. Public Administration & Defense; Compulsory Social Security
b. Trade and Repair of Motor Vehicles, Motorcycles, Personal and Household Goods
Note: Regional levels may not add up to the national totals due to rounding. Page 134

As of July 2013
REGIONAL ACCOUNTS OF THE PHILIPPINESUnit : In PercentTable 2.17A. REGION XIII, CARAGA REGIONGROSS REGIONAL DOMESTIC PRODUCT BY INDUSTRIAL ORIGIN2002 TO 2004PERCENT DISTRIBUTION, AT CURRENT PRICES
2010 2011 2012
I. AGRI., HUNTING, FORESTRY & FISHING 26.8 25.9 23.1 a. Agriculture and Forestry 24.3 23.8 21.4 b. Fishing 2.5 2.1 1.7
II INDUSTRY SECTOR 26.4 25.9 28.6 a. Mining and Quarrying 12.3 13.1 15.0 b. Manufacturing 3.2 3.1 2.9 c. Construction 9.3 8.2 9.1 d. Electricity, Gas and Water Supply 1.6 1.5 1.5
III SERVICE SECTOR 46.8 48.2 48.3 a. Transport, Storage & Communication 13.5 15.2 15.9
4.7 4.7 4.6 c. Financial Intermediation 5.0 4.7 4.9
6.5 6.5 6.5
6.3 6.0 6.1 f. Other Services 10.9 11.1 10.3
GROSS DOMESTIC PRODUCT 100.0 100.0 100.0Source : National Statistical Coordination Board
REGIONAL ACCOUNTS OF THE PHILIPPINESUnit : In PercentTable 2.17B. REGION XIII, CARAGA REGIONGROSS REGIONAL DOMESTIC PRODUCT BY INDUSTRIAL ORIGIN2002 TO 2004PERCENT DISTRIBUTION, AT CONSTANT 2000 PRICES
2010 2011 2012
I. AGRI., HUNTING, FORESTRY & FISHING 24.3 22.5 20.8 a. Agriculture and Forestry 20.4 19.2 17.9 b. Fishing 3.9 3.3 2.9
II INDUSTRY SECTOR 30.2 32.0 34.2 a. Mining and Quarrying 17.0 20.1 21.9 b. Manufacturing 3.3 3.4 3.2 c. Construction 8.2 6.9 7.7 d. Electricity, Gas and Water Supply 1.7 1.6 1.5
III SERVICE SECTOR 45.5 45.5 44.9 a. Transport, Storage & Communication 13.3 14.6 15.2
4.1 4.0 3.9 c. Financial Intermediation 4.3 3.9 4.0
6.2 6.1 6.0
6.6 6.0 5.9 f. Other Services 11.0 10.9 10.0
GROSS DOMESTIC PRODUCT 100.0 100.0 100.0Source : National Statistical Coordination Board
INDUSTRY/YEAR
b. Trade and Repair of Motor Vehicles, Motorcycles, Personal and Household Goods
d. R. Estate, Renting & Business e. Public Administration & Defense; Compulsory Social Security
b. Trade and Repair of Motor Vehicles, Motorcycles, Personal and Household Goods
INDUSTRY/YEAR
d. R. Estate, Renting & Business e. Public Administration & Defense; Compulsory Social Security
Note: Regional levels may not add up to the national totals due to rounding. Page 135
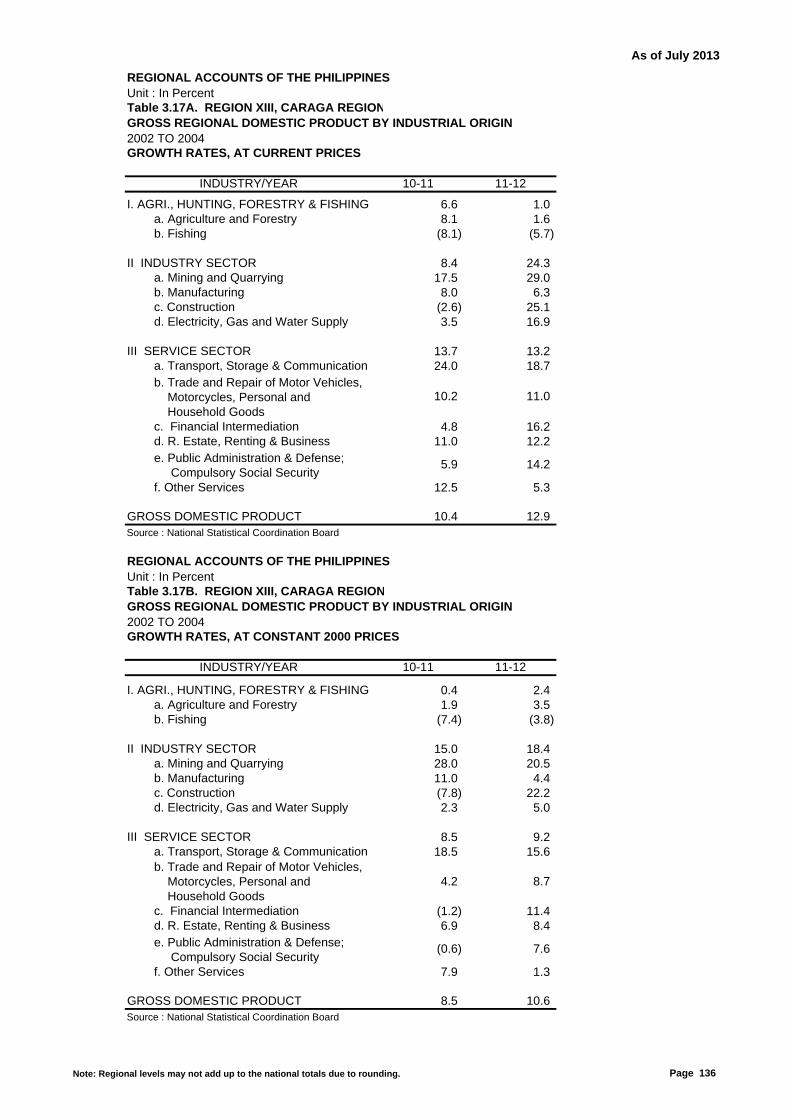
As of July 2013
REGIONAL ACCOUNTS OF THE PHILIPPINESUnit : In PercentTable 3.17A. REGION XIII, CARAGA REGIONGROSS REGIONAL DOMESTIC PRODUCT BY INDUSTRIAL ORIGIN2002 TO 2004GROWTH RATES, AT CURRENT PRICES
10-11 11-12
I. AGRI., HUNTING, FORESTRY & FISHING 6.6 1.0 a. Agriculture and Forestry 8.1 1.6 b. Fishing (8.1) (5.7)
II INDUSTRY SECTOR 8.4 24.3 a. Mining and Quarrying 17.5 29.0 b. Manufacturing 8.0 6.3 c. Construction (2.6) 25.1 d. Electricity, Gas and Water Supply 3.5 16.9
III SERVICE SECTOR 13.7 13.2 a. Transport, Storage & Communication 24.0 18.7
10.2 11.0
c. Financial Intermediation 4.8 16.211.0 12.2
5.9 14.2
f. Other Services 12.5 5.3
GROSS DOMESTIC PRODUCT 10.4 12.9Source : National Statistical Coordination Board
REGIONAL ACCOUNTS OF THE PHILIPPINESUnit : In PercentTable 3.17B. REGION XIII, CARAGA REGIONGROSS REGIONAL DOMESTIC PRODUCT BY INDUSTRIAL ORIGIN2002 TO 2004GROWTH RATES, AT CONSTANT 2000 PRICES
10-11 11-12
I. AGRI., HUNTING, FORESTRY & FISHING 0.4 2.4 a. Agriculture and Forestry 1.9 3.5 b. Fishing (7.4) (3.8)
II INDUSTRY SECTOR 15.0 18.4 a. Mining and Quarrying 28.0 20.5 b. Manufacturing 11.0 4.4 c. Construction (7.8) 22.2 d. Electricity, Gas and Water Supply 2.3 5.0
III SERVICE SECTOR 8.5 9.2 a. Transport, Storage & Communication 18.5 15.6
4.2 8.7
c. Financial Intermediation (1.2) 11.46.9 8.4
(0.6) 7.6
f. Other Services 7.9 1.3
GROSS DOMESTIC PRODUCT 8.5 10.6Source : National Statistical Coordination Board
e. Public Administration & Defense; Compulsory Social Security
b. Trade and Repair of Motor Vehicles, Motorcycles, Personal and Household Goods
d. R. Estate, Renting & Business
INDUSTRY/YEAR
INDUSTRY/YEAR
b. Trade and Repair of Motor Vehicles, Motorcycles, Personal and Household Goods
e. Public Administration & Defense; Compulsory Social Security
d. R. Estate, Renting & Business
Note: Regional levels may not add up to the national totals due to rounding. Page 136

As of July 2013
REGIONAL ACCOUNTS OF THE PHILIPPINESbase Year: 2000Table 4.17. REGION XIII, CARAGA REGIONGROSS REGIONAL DOMESTIC PRODUCT BY INDUSTRIAL ORIGIN2002 TO 2004IMPLICIT PRICE INDEX
2010 2011 2012
I. AGRI., HUNTING, FORESTRY & FISHING 167.6 178.0 175.6 a. Agriculture and Forestry 180.9 192.1 188.6 b. Fishing 97.6 96.8 94.9
II INDUSTRY SECTOR 133.3 125.7 132.0 a. Mining and Quarrying 110.1 101.2 108.3 b. Manufacturing 148.0 144.0 146.7 c. Construction 173.5 183.1 187.4 d. Electricity, Gas and Water Supply 144.7 146.3 162.9
III SERVICE SECTOR 156.5 164.0 170.0 a. Transport, Storage & Communication 153.9 160.9 165.3
172.3 182.2 186.0
c. Financial Intermediation 176.0 186.6 194.6159.3 165.4 171.1
146.0 155.5 165.1
f. Other Services 150.9 157.3 163.5
GROSS DOMESTIC PRODUCT 152.2 154.9 158.2Source : National Statistical Coordination Board
INDUSTRY/YEAR
d. R. Estate, Renting & Business e. Public Administration & Defense; Compulsory Social Security
b. Trade and Repair of Motor Vehicles, Motorcycles, Personal and Household Goods
Note: Regional levels may not add up to the national totals due to rounding. Page 137
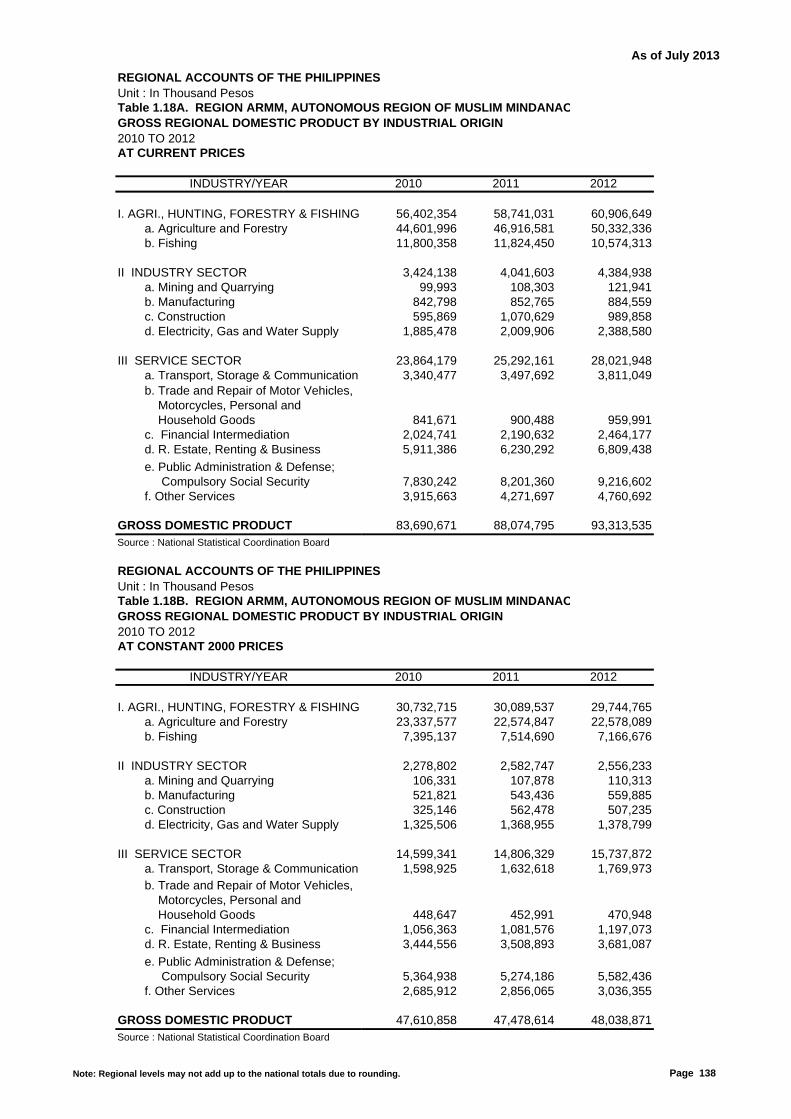
As of July 2013
REGIONAL ACCOUNTS OF THE PHILIPPINESUnit : In Thousand PesosTable 1.18A. REGION ARMM, AUTONOMOUS REGION OF MUSLIM MINDANAOGROSS REGIONAL DOMESTIC PRODUCT BY INDUSTRIAL ORIGIN2010 TO 2012AT CURRENT PRICES
2010 2011 2012
I. AGRI., HUNTING, FORESTRY & FISHING 56,402,354 58,741,031 60,906,649 a. Agriculture and Forestry 44,601,996 46,916,581 50,332,336 b. Fishing 11,800,358 11,824,450 10,574,313
II INDUSTRY SECTOR 3,424,138 4,041,603 4,384,938 a. Mining and Quarrying 99,993 108,303 121,941 b. Manufacturing 842,798 852,765 884,559 c. Construction 595,869 1,070,629 989,858 d. Electricity, Gas and Water Supply 1,885,478 2,009,906 2,388,580
III SERVICE SECTOR 23,864,179 25,292,161 28,021,948 a. Transport, Storage & Communication 3,340,477 3,497,692 3,811,049
841,671 900,488 959,991 c. Financial Intermediation 2,024,741 2,190,632 2,464,177
5,911,386 6,230,292 6,809,438
7,830,242 8,201,360 9,216,602 f. Other Services 3,915,663 4,271,697 4,760,692
GROSS DOMESTIC PRODUCT 83,690,671 88,074,795 93,313,535Source : National Statistical Coordination Board
REGIONAL ACCOUNTS OF THE PHILIPPINESUnit : In Thousand PesosTable 1.18B. REGION ARMM, AUTONOMOUS REGION OF MUSLIM MINDANAOGROSS REGIONAL DOMESTIC PRODUCT BY INDUSTRIAL ORIGIN2010 TO 2012AT CONSTANT 2000 PRICES
2010 2011 2012
I. AGRI., HUNTING, FORESTRY & FISHING 30,732,715 30,089,537 29,744,765 a. Agriculture and Forestry 23,337,577 22,574,847 22,578,089 b. Fishing 7,395,137 7,514,690 7,166,676
II INDUSTRY SECTOR 2,278,802 2,582,747 2,556,233 a. Mining and Quarrying 106,331 107,878 110,313 b. Manufacturing 521,821 543,436 559,885 c. Construction 325,146 562,478 507,235 d. Electricity, Gas and Water Supply 1,325,506 1,368,955 1,378,799
III SERVICE SECTOR 14,599,341 14,806,329 15,737,872 a. Transport, Storage & Communication 1,598,925 1,632,618 1,769,973
448,647 452,991 470,948 c. Financial Intermediation 1,056,363 1,081,576 1,197,073
3,444,556 3,508,893 3,681,087
5,364,938 5,274,186 5,582,436 f. Other Services 2,685,912 2,856,065 3,036,355
GROSS DOMESTIC PRODUCT 47,610,858 47,478,614 48,038,871Source : National Statistical Coordination Board
d. R. Estate, Renting & Business
e. Public Administration & Defense; Compulsory Social Security
INDUSTRY/YEAR
INDUSTRY/YEAR
b. Trade and Repair of Motor Vehicles, Motorcycles, Personal and Household Goods
d. R. Estate, Renting & Business
e. Public Administration & Defense; Compulsory Social Security
b. Trade and Repair of Motor Vehicles, Motorcycles, Personal and Household Goods
Note: Regional levels may not add up to the national totals due to rounding. Page 138

As of July 2013
REGIONAL ACCOUNTS OF THE PHILIPPINESUnit : In PercentTable 2.18A. REGION ARMM, AUTONOMOUS REGION OF MUSLIM MINDANAOGROSS REGIONAL DOMESTIC PRODUCT BY INDUSTRIAL ORIGIN2010 TO 2012PERCENT DISTRIBUTION, AT CURRENT PRICES
2010 2011 2012
I. AGRI., HUNTING, FORESTRY & FISHING 67.4 66.7 65.3 a. Agriculture and Forestry 53.3 53.3 53.9 b. Fishing 14.1 13.4 11.3
II INDUSTRY SECTOR 4.1 4.6 4.7 a. Mining and Quarrying 0.1 0.1 0.1 b. Manufacturing 1.0 1.0 0.9 c. Construction 0.7 1.2 1.1 d. Electricity, Gas and Water Supply 2.3 2.3 2.6
III SERVICE SECTOR 28.5 28.7 30.0 a. Transport, Storage & Communication 4.0 4.0 4.1
1.0 1.0 1.0 c. Financial Intermediation 2.4 2.5 2.6
7.1 7.1 7.3
9.4 9.3 9.9 f. Other Services 4.7 4.9 5.1
GROSS DOMESTIC PRODUCT 100.0 100.0 100.0Source : National Statistical Coordination Board
REGIONAL ACCOUNTS OF THE PHILIPPINESUnit : In PercentTable 2.18B. REGION ARMM, AUTONOMOUS REGION OF MUSLIM MINDANAOGROSS REGIONAL DOMESTIC PRODUCT BY INDUSTRIAL ORIGIN2010 TO 2012PERCENT DISTRIBUTION, AT CONSTANT 2000 PRICES
2010 2011 2012
I. AGRI., HUNTING, FORESTRY & FISHING 64.5 63.4 61.9 a. Agriculture and Forestry 49.0 47.5 47.0 b. Fishing 15.5 15.8 14.9
II INDUSTRY SECTOR 4.8 5.4 5.3 a. Mining and Quarrying 0.2 0.2 0.2 b. Manufacturing 1.1 1.1 1.2 c. Construction 0.7 1.2 1.1 d. Electricity, Gas and Water Supply 2.8 2.9 2.9
III SERVICE SECTOR 30.7 31.2 32.8 a. Transport, Storage & Communication 3.4 3.4 3.7
0.9 1.0 1.0 c. Financial Intermediation 2.2 2.3 2.5
7.2 7.4 7.7
11.3 11.1 11.6 f. Other Services 5.6 6.0 6.3
GROSS DOMESTIC PRODUCT 100.0 100.0 100.0Source : National Statistical Coordination Board
INDUSTRY/YEAR
b. Trade and Repair of Motor Vehicles, Motorcycles, Personal and Household Goods
d. R. Estate, Renting & Business
e. Public Administration & Defense; Compulsory Social Security
b. Trade and Repair of Motor Vehicles, Motorcycles, Personal and Household Goods
INDUSTRY/YEAR
d. R. Estate, Renting & Business
e. Public Administration & Defense; Compulsory Social Security
Note: Regional levels may not add up to the national totals due to rounding. Page 139

As of July 2013
REGIONAL ACCOUNTS OF THE PHILIPPINESUnit : In PercentTable 3.18A. REGION ARMM, AUTONOMOUS REGION OF MUSLIM MINDANAOGROSS REGIONAL DOMESTIC PRODUCT BY INDUSTRIAL ORIGIN2010 TO 2012GROWTH RATES, AT CURRENT PRICES
10-11 11-12
I. AGRI., HUNTING, FORESTRY & FISHING 4.1 3.7 a. Agriculture and Forestry 5.2 7.3 b. Fishing 0.2 (10.6)
II INDUSTRY SECTOR 18.0 8.5 a. Mining and Quarrying 8.3 12.6 b. Manufacturing 1.2 3.7 c. Construction 79.7 (7.5) d. Electricity, Gas and Water Supply 6.6 18.8
III SERVICE SECTOR 6.0 10.8 a. Transport, Storage & Communication 4.7 9.0
7.0 6.6
c. Financial Intermediation 8.2 12.55.4 9.3
4.7 12.4
f. Other Services 9.1 11.4
GROSS DOMESTIC PRODUCT 5.2 5.9Source : National Statistical Coordination Board
REGIONAL ACCOUNTS OF THE PHILIPPINESUnit : In PercentTable 3.18B. REGION ARMM, AUTONOMOUS REGION OF MUSLIM MINDANAOGROSS REGIONAL DOMESTIC PRODUCT BY INDUSTRIAL ORIGIN2010 TO 2012GROWTH RATES, AT CONSTANT 2000 PRICES
10-11 11-12
I. AGRI., HUNTING, FORESTRY & FISHING (2.1) (1.1) a. Agriculture and Forestry (3.3) 0.0 b. Fishing 1.6 (4.6)
II INDUSTRY SECTOR 13.3 (1.0) a. Mining and Quarrying 1.5 2.3 b. Manufacturing 4.1 3.0 c. Construction 73.0 (9.8) d. Electricity, Gas and Water Supply 3.3 0.7
III SERVICE SECTOR 1.4 6.3 a. Transport, Storage & Communication 2.1 8.4
1.0 4.0
c. Financial Intermediation 2.4 10.71.9 4.9
(1.7) 5.8
f. Other Services 6.3 6.3
GROSS DOMESTIC PRODUCT (0.3) 1.2Source : National Statistical Coordination Board
e. Public Administration & Defense; Compulsory Social Security
b. Trade and Repair of Motor Vehicles, Motorcycles, Personal and Household Goods
d. R. Estate, Renting & Business
INDUSTRY/YEAR
INDUSTRY/YEAR
b. Trade and Repair of Motor Vehicles, Motorcycles, Personal and Household Goods
e. Public Administration & Defense; Compulsory Social Security
d. R. Estate, Renting & Business
Note: Regional levels may not add up to the national totals due to rounding. Page 140

As of July 2013
REGIONAL ACCOUNTS OF THE PHILIPPINESBase Year: 2000Table 4.18. REGION ARMM, AUTONOMOUS REGION OF MUSLIM MINDANAOGROSS REGIONAL DOMESTIC PRODUCT BY INDUSTRIAL ORIGIN2010 TO 2012IMPLICIT PRICE INDEX
2010 2011 2012
I. AGRI., HUNTING, FORESTRY & FISHING 183.5 195.2 204.8 a. Agriculture and Forestry 191.1 207.8 222.9 b. Fishing 159.6 157.4 147.5
II INDUSTRY SECTOR 150.3 156.5 171.5 a. Mining and Quarrying 94.0 100.4 110.5 b. Manufacturing 161.5 156.9 158.0 c. Construction 183.3 190.3 195.1 d. Electricity, Gas and Water Supply 142.2 146.8 173.2
III SERVICE SECTOR 163.5 170.8 178.1 a. Transport, Storage & Communication 208.9 214.2 215.3
187.6 198.8 203.8
c. Financial Intermediation 191.7 202.5 205.9171.6 177.6 185.0
146.0 155.5 165.1
f. Other Services 145.8 149.6 156.8
GROSS DOMESTIC PRODUCT 175.8 185.5 194.2Source : National Statistical Coordination Board
INDUSTRY/YEAR
d. R. Estate, Renting & Business e. Public Administration & Defense; Compulsory Social Security
b. Trade and Repair of Motor Vehicles, Motorcycles, Personal and Household Goods
Note: Regional levels may not add up to the national totals due to rounding. Page 141
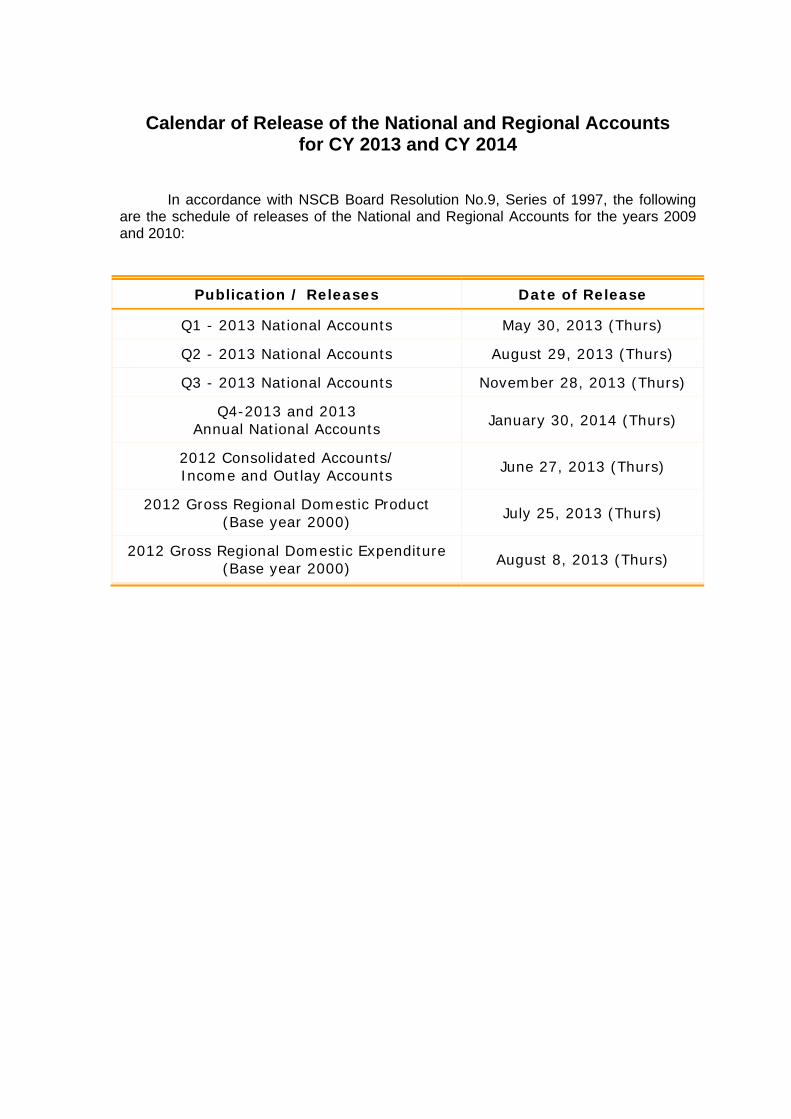
Calendar of Release of the National and Regional Accounts for CY 2013 and CY 2014
In accordance with NSCB Board Resolution No.9, Series of 1997, the following are the schedule of releases of the National and Regional Accounts for the years 2009 and 2010:
Publication / Releases Date of Release
Q1 - 2013 National Accounts May 30, 2013 (Thurs)
Q2 - 2013 National Accounts August 29, 2013 (Thurs)
Q3 - 2013 National Accounts November 28, 2013 (Thurs)
Q4-2013 and 2013 Annual National Accounts January 30, 2014 (Thurs)
2012 Consolidated Accounts/ Income and Outlay Accounts June 27, 2013 (Thurs)
2012 Gross Regional Domestic Product (Base year 2000) July 25, 2013 (Thurs)
2012 Gross Regional Domestic Expenditure (Base year 2000) August 8, 2013 (Thurs)

GROSS REGIONAL DOMESTIC PRODUCT OF THE PHILIPPINES NATIONAL STATISTICAL COORDINATION BOARD
JOSE RAMON G. ALBERT
Secretary General
LINA V. CASTRO Assistant Secretary General
RAYMUNDO J. TALENTO CANDIDO J. ASTROLOGO, JR. Director, Economic Statistics Office Director, Subnational Statistics Office
VIVIAN R. ILARINA MARIA FE M. TALENTO Chief Chief Expenditure Accounts Division Production Accounts Division CYNTHIA S. REGALADO EDWARD EUGENIO P. LOPEZ-DEE Chief Chief Economic Indicators and Satellite Integrated Accounts Division Accounts Division Subnational Statistics Office Bonifacio R. Manuson Evelyn A. Tolentino LEAD STAFF BY INDUSTRY Agriculture, Hunting, Forestry & Fishing Mai Lin C. Villaruel Industry Sector
Mining and Quarrying Ma. Fe M. Talento Manufacturing Priscille C. Villanueva Construction Priscille C. Villanueva Electricity, Gas & Water Supply Ma. Fe M. Talento /
John Lourenze S. Poquiz Services
Transportation, Storage & Communication Priscille C. Villanueva / Magnolia C. San Diego
Trade Mai Lin C. Villaruel / Magnolia C. San Diego Financial Intermediation Ma. Fe M. Talento Real Estate, Renting & Business Activities Stephanie Rose R. Moscoso Other Services Mai Lin C. Villaruel Public Administration & Defense Vivian R. Ilarina
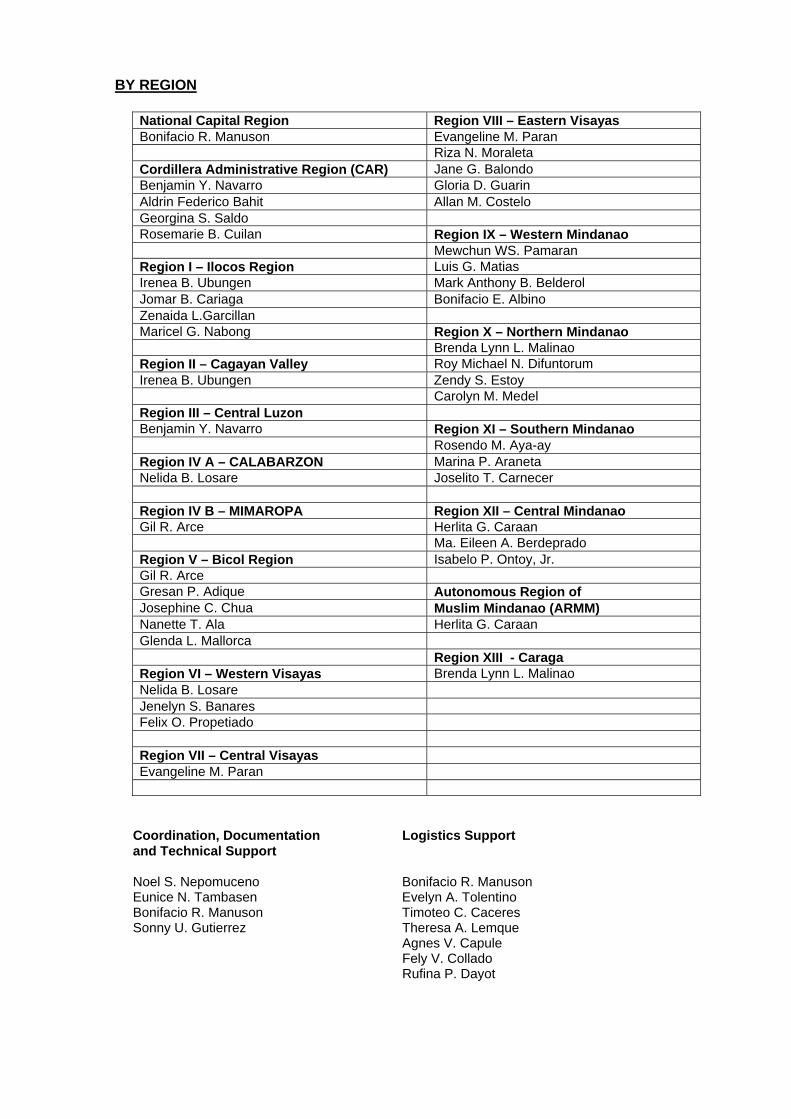
BY REGION
National Capital Region Region VIII – Eastern Visayas Bonifacio R. Manuson Evangeline M. Paran Riza N. Moraleta Cordillera Administrative Region (CAR) Jane G. Balondo Benjamin Y. Navarro Gloria D. Guarin Aldrin Federico Bahit Allan M. Costelo Georgina S. Saldo Rosemarie B. Cuilan Region IX – Western Mindanao Mewchun WS. Pamaran Region I – Ilocos Region Luis G. Matias Irenea B. Ubungen Mark Anthony B. Belderol Jomar B. Cariaga Bonifacio E. Albino Zenaida L.Garcillan Maricel G. Nabong Region X – Northern Mindanao Brenda Lynn L. Malinao Region II – Cagayan Valley Roy Michael N. Difuntorum Irenea B. Ubungen Zendy S. Estoy Carolyn M. Medel Region III – Central Luzon Benjamin Y. Navarro Region XI – Southern Mindanao Rosendo M. Aya-ay Region IV A – CALABARZON Marina P. Araneta Nelida B. Losare Joselito T. Carnecer Region IV B – MIMAROPA Region XII – Central Mindanao Gil R. Arce Herlita G. Caraan Ma. Eileen A. Berdeprado Region V – Bicol Region Isabelo P. Ontoy, Jr. Gil R. Arce Gresan P. Adique Autonomous Region of Josephine C. Chua Muslim Mindanao (ARMM) Nanette T. Ala Herlita G. Caraan Glenda L. Mallorca Region XIII - Caraga Region VI – Western Visayas Brenda Lynn L. Malinao Nelida B. Losare Jenelyn S. Banares Felix O. Propetiado Region VII – Central Visayas Evangeline M. Paran
Coordination, Documentation Logistics Support and Technical Support Noel S. Nepomuceno Bonifacio R. Manuson Eunice N. Tambasen Evelyn A. Tolentino Bonifacio R. Manuson Timoteo C. Caceres Sonny U. Gutierrez Theresa A. Lemque
Agnes V. Capule Fely V. Collado Rufina P. Dayot

For Inquiries:
NATIONAL STATISTICAL COORDINATION BOARDNATIONAL STATISTICAL INFORMATION CENTERGround Floor Midland Buendia Building403 Sen. Gil J. Puyat Avenue, Makati CityPhilippines 1200
Tel. Nos. +63(2) 8952767 +63(2) 8909405Telefax No. +63(2) 8908456
E-mail address: [email protected]: www.nscb.gov.ph
/NSCBPhilippines /NSCBPhilippines