ground-and excited-state properties of inorganic solids...
TRANSCRIPT
Journal of Solid State Chemistry 176 (2003) 338–374
.
Ground- and excited-state properties of inorganic solidsfrom full-potential density-functional calculations
P. Ravindran,� R. Vidya, P. Vajeeston, A. Kjekshus, and H. Fjellvag
Department of Chemistry, University of Oslo, Box 1033 Blindern, N-0315 Oslo, Norway
Received 17 January 2003; received in revised form 3 April 2003; accepted 10 April 2003
Abstract
The development in theoretical condensed-matter science based on density-functional theory (DFT) has reached a level where it is
possible, from ‘‘parameter-free’’ quantum mechanical calculations to obtain total energies, forces, vibrational frequencies, magnetic
moments, mechanical and optical properties and so forth. The calculation of such properties are important in the analyses of
experimental data and they can be predicted with a precision that is sufficient for comparison with experiments. It is almost
impossible to do justice to all developments achieved by DFT because of its rapid growth. Hence, it has here been focused on a few
advances, primarily from our laboratory. Unusual bonding behaviors in complex materials are conveniently explored using the
combination of charge density, charge transfer, and electron-localization function along with crystal-orbital Hamilton-population
analyses. It is indicated that the elastic properties of materials can reliably be predicted from DFT calculations if one takes into
account the structural relaxations along with gradient corrections in the calculations. Experimental techniques have their limitations
in studies of the structural stability and pressure-induced structural transitions in hydride materials whereas the present theoretical
approach can be applied to reliably predict properties under extreme pressures. From the spin-polarized, relativistic full-potential
calculations one can study novel materials such as ruthenates, quasi-one-dimensional oxides, and spin-, charge-, and orbital-
ordering in magnetic perovskite-like oxides. The importance of orbital-polarization correction to the DFT to predict the magnetic
anisotropy in transition-metal compounds and magnetic moments in lanthanides and actinides are emphasized. Apart from the full-
potential treatment, proper magnetic ordering as well as structural distortions have to be taken into account to predict correctly the
insulating behavior of transition-metal oxides. The computational variants LDA and GGA fail to predict insulating behavior of
Mott insulators whereas electronic structures can be described correctly when correlation effects are taken into account through
LDA þ U or similar approaches to explain their electronic structures correctly. Excited-state properties such as linear optical
properties, magneto-optical properties, XANES, XPS, UPS, BIS, and Raman spectra can be obtained from accurate DFT
calculations.
r 2003 Elsevier Inc. All rights reserved.
PACS: 71.20.�b; 71.20.Be; 71.20.Lp; 75.50.Cc
1. Introduction
Since its introduction in the 1960s [1,2], density-functional theory (DFT) has evolved into a powerfultool that is widely used in solid-state chemistry andmaterials science for the calculation of electronic,magnetic, and structural properties of solids. Thistheory has been remarkably successful in predicting,reproducing, and/or explaining a wide variety ofmaterials ground-state phenomena. Excited states, on
the other hand, are not contained within the frameworkof DFT, and are generally speaking much more demand-ing. However, it is these properties that are probed byspectroscopic methods, and utilized for technologicalapplications. Therefore, it is necessary to develop and testab initio techniques that are capable of predicting excited-state properties equally reliable as, for instance, DFT doesfor the ground-state properties. This review aims at givingexamples of the recent developments in the calculation ofground- and excited-state properties of crystalline solidsbased on the DFT. The examples are chosen from thework of the present authors. A short summarizingaccount of theoretical perspectives are given in theintroduction to each subsection.
ARTICLE IN PRESS
�Corresponding author.
E-mail address: [email protected] (P. Ravindran).
URL: http://folk.uio.no/ravi.
0022-4596/03/$ - see front matter r 2003 Elsevier Inc. All rights reserved.
doi:10.1016/S0022-4596(03)00215-9
2. Ground-state properties
2.1. Unusual bonding in metal hydrides
Classically, the chemical bonding in solids areclassified as ionic, covalent, and metallic. However, thebonding in a real system is certainly a mixturecharacteristic of the three classes. The results oftheoretical electronic-structure calculations can be easilyused to study the nature of chemical bonds since thecalculations refer to the ground-state electronic struc-ture, i.e., the distribution of electrons in the crystal.Traditionally, the distribution of electron bands inreciprocal space or the distribution of states in energy[the density of states (DOS)] helps one to study thebonding in a given material. By analyzing the DOSdecomposed according to site and angular momenta,one can distinguish between ionic and covalent bondsin solid systems. The nature of the bonding can beanalyzed with several other tools such as valence-charge-density plot, charge-transfer plot, electron-localizationfunction (ELF), and crystal-orbital Hamilton popula-tion (COHP); which all can be derived from theelectronic structure calculations. In this section weillustrate how the above-mentioned tools can be usedto gain insight into the chemical bonding in metalhydrides.
The most attractive aspect of metal hydrides froma technological point of view is their potential use asenergy-storage materials. The amount of hydrogen pervolume unit in metal hydrides is very high; in some caseshigher than in liquid or solid hydrogen, e.g., VH2 storesmore than twice the amount of hydrogen compared withsolid H2 at 4:2 K: It is unfortunate, however, that mostmetal hydrides are heavy in relation to the amount ofhydrogen they contain. FeTiH2 and LaNi5H7; e.g., onlycontain 1.9 and 1:6 wt% hydrogen, respectively. There-fore, efforts in hydride research have over the past 25–30years been concentrated on designing new, or modifyingknown, intermetallic hydrides to increase the storagecapacity and simultaneously adjust their properties tomake them capable of delivering hydrogen at usefulpressures ð40:1 MPaÞ and acceptable temperaturesðo425 KÞ [3]. These aspects are particularly importantfor most mobile applications where hydrogen wouldbe used directly in combustion engines or indirectly viafuel cells.
The search for efficient hydrogen-storage metalhydrides [4] has to some extent been hampered by themental barriers which empirical rules have put on thethinking. For example, the interstitial hole size whichhydrogen is expected to occupy should be 40:40 A [5].Switendick [6] observed from a compilation of experi-mental structure data that the minimum H–H separa-tion in ordered metal hydrides is 42 A (‘‘the 2-A rule’’).This empirical picture is later [7] supported by
band-structure calculations which ascribe the effect torepulsive interaction generated by the partially chargedhydrogen atoms. A practical consequence of thisrepulsive H–H interaction in metal hydrides is that itputs a limit to the amount of hydrogen which can beaccommodated within a given structural framework. So,if H�H separations less than 2 A would be possible thiscould open for new efforts to identify potentialintermetallics with higher hydrogen-storage capacity.However, there are indeed metal hydrides which doviolate ‘‘the 2-A rule’’ and the origin for such behaviorhas been identified [8].
RNiIn (R ¼ La; Ce, Pr, and Nd) crystallizes in theZrNiAl-type structure and can formally be considered asa layered arrangement with a repeated stacking oftwo different planar nets of composition R3Ni2 andNiIn3 along [001] of the hexagonal unit cell. If thehydrides of these materials obey the hole-size demandand ‘‘the 2-A rule’’ one would expect H to occupythe interstice formed by the trigonal bipyramid R3Ni2(2d site of space group P%62m). However, proton-magnetic-resonance (PMR) studies suggest [9,10] thatH occupies both the 4h and 6i sites or either of themwith H–H distances in the range 1.5–1:8 A: Recentpowder X-ray and neutron-diffraction studies [11] onRNiInD1:333�x (ideally R3Ni3In3D4) show that deuter-ium occupies the 4h site located on three-fold axis ofR3Ni tetrahedra that share a common face to formtrigonal bipyramids (see Fig. 1 in Ref. [8]). Thisconfiguration gives rise to extraordinary short H–Hseparations of around 1:6 A [11]. As the diffractiontechniques generally determine the average structure,neglect of partial H-site occupancies and local latticedistortions may lead one to conclude with shorter H–Hseparations than actually present in the real structure[12]. Hence, it is of interest to perform structuraloptimization theoretically.
All calculations relate to ideal and fully saturatedhydrides with composition R3T3In3H4 (RTInH1:333;R ¼ La; Ce, Pr or Nd, T ¼ Ni; Pd or Pt). For (trivalent)R the 4f electrons were treated as core electrons (exceptfor La; 4f ). As Ce-4f electrons are known to takedifferent valence states in intermetallic compounds,different possibilities [13] for the valence states of Cewere considered in both the hydrides and intermetallicphases during the structural optimization. For thisoptimization all atom positions were relaxed by forceminimization and equilibrium c=a and volume wereobtained by total-energy minimization. Optimizedstructural parameters for the Ce compounds are ingood agreement with experimental values only when Ceare assumed to be in the trivalent state. The calculatedequilibrium lattice parameters and the changes betweenthe intermetallic and corresponding hydride phases aregiven for selected compounds along with experimentalparameters in Table 1.
ARTICLE IN PRESSP. Ravindran et al. / Journal of Solid State Chemistry 176 (2003) 338–374 339
In general, the calculated lattice parameters are ingood agreement with the experimental values, and thesmall differences found may partly be attributed tohydrogen non-stoichiometry (around 10%) in theexperimental studies. The hydrogen-induced latticeexpansion is strongly anisotropic (Table 1); a hugeexpansion along [001] ðDc=c ¼ 14220%Þ and a smallerintra-layer contraction ð�Da=a ¼ 025:8%Þ: The calcu-lated cohesive energy and heat of formation for thehydrides are larger than for the corresponding inter-metallic phases indicating that it might be possible tosynthesize all these hydrides. The electronic structurestudies show that all considered phases are in themetallic state consistent with experimental findings.Calculated R2H; T2H; and H–H distances are givenin Table 2 along with experimentally available values.
An interesting observation is that all RTInH1:333
materials have unusually short H–H distances. Twoexplanations have been proposed. Pairing of thehydrogen atoms (either by molecular H2-like bondingor by bonding mediated by the intermediate T atom)has been advanced to explain the anomalous PMRspectrum of CeNiInH1:0 [9]. The second explanationfocuses on the significantly shorter La–La distance inLaNiInH1:333 than in closely related phases [11], where-by the La atoms (generally R) may act as a shieldingthat compensates the repulsive H–H interaction.
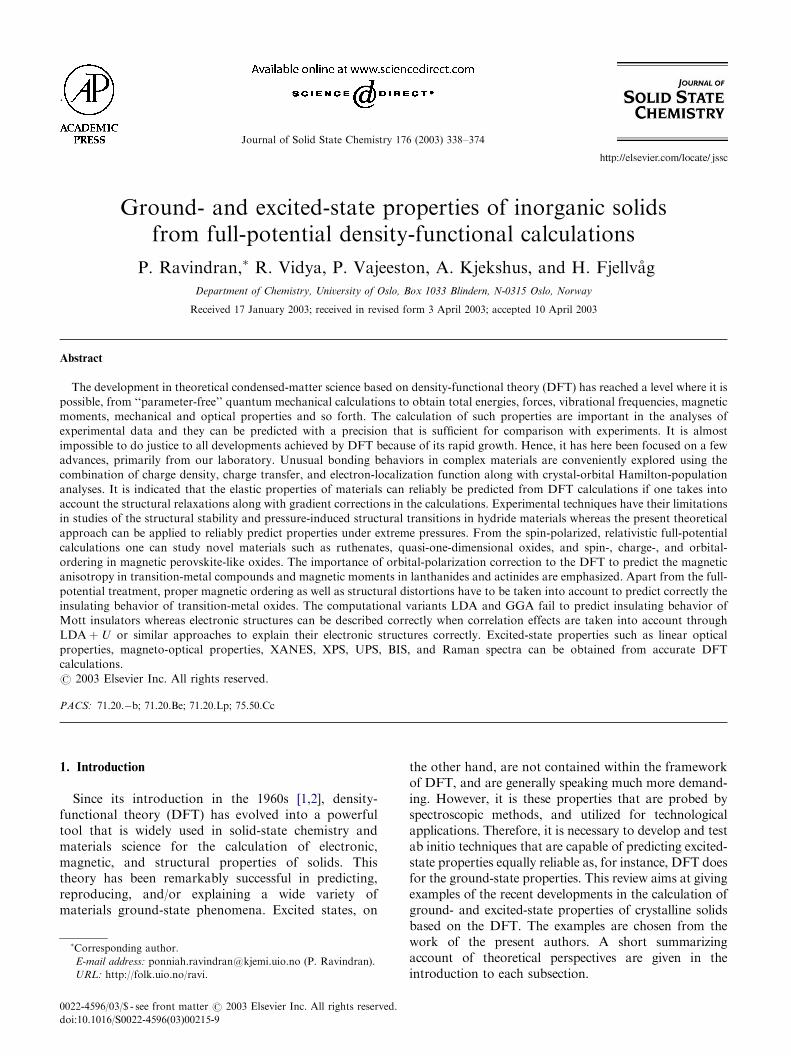
In order to evaluate these possibilities we havecalculated the total energy for (hypothetical)LaPtInH1:333 as a function of H–H separation according
to three different scenarios: (1) Keeping La, Pt, and Infixed in their equilibrium positions, (2) moving La0:08 A out of the equilibrium position toward H, and (3)moving La 0:08 A out of the equilibrium positionaway from H. The obtained results are illustrated inFig. 1. When La, Pt, and In are in their optimizedequilibrium position, the equilibrium H–H separation is1:454 A: This scenario corresponds to a lower totalenergy than the two alternatives. For scenario 2 weobtain a shorter H–H separation ð1:438 AÞ than for theground-state configuration, and for scenario 3 acorrespondingly larger separation ð1:462 AÞ:
As the total-energy curves increase steadily onreduction of the H–H separations, the possibility ofstabilization of hydrogen in the form of molecularH2-like units seems completely ruled out. The totalenergy increases drastically also for increased H–Hseparation beyond the equilibrium value. This is due to
ARTICLE IN PRESS
1.3 1.4 1.5 1.6
H−H distance ( Å)
-0.1925
-0.1875
-0.1825
-0.1775
-0.1725
∆E (
Ry/
f.u.)
1.454
1.462
1.438
(a)
(c)
(b)
Fig. 1. Total energy vs. H–H distance in LaPtInH1:333: (a) All atoms
except H are fixed at their equilibrium positions. (b) La atoms are
moved 0:08 A out of their equilibrium position toward H. (c) La atoms
are moved 0:08 A out of their equilibrium position away from H.
Table 2
Calculated interatomic distances (in A) for RTInH1:333
R2H T2H H–H
Compound Theor. Exp. Theor. Exp. Theor. Exp.
LaNiInH1:333 2.379 2.406 1.489 1.506 1.573 1.635
LaPdInH1:333 2.373 — 1.644 — 1.523 —
LaPtInH1:333 2.475 — 1.618 — 1.454 —
CeNiInH1:333 2.427 2.371 1.457 1.508 1.572 1.606
PrNiInH1:333 2.387 — 1.492 — 1.487 —
NdNiInH1:333 2.350 2.350 1.493 1.506 1.492 1.562
Table 1
Calculated lattice parameters (a and c in A) and c=a for LaTInH1:333 and relative variation in unit-cell dimensions (in %) consequent on
hydrogenation from RTIn to RTInH1:333; experimental values from Ref. [11]
a c c=a Da=a Dc=c DV=V
Compound Theor. Exp. Theor. Exp. Theor. Exp. Theor. Exp. Theor. Exp. Theor. Exp.
LaNiInH1:333 7.2603 7.3810 4.5522 4.6489 0.6270 0.6399 �3.969 �2.76 14.02 14.8 5.14 8.54
LaPdInH1:333 7.3501 — 4.8112 — 0.6546 — �5.42 — 16.64 — 4.33 —
LaPtInH1:333 7.7274 — 4.6903 — 0.6070 — �0.04 — 13.98 — 14.00 —
CeNiInH1:333 7.4536 7.2921 4.4871 4.6238 0.6020 0.6341 �1.68 �3.21 12.72 16.3 8.97 8.98
PrNiInH1:333 7.3783 7.260 4.4726 4.560 0.6062 0.6281 �2.85 �3.73 13.93 15.4 7.52 7.01
NdNiInH1:333 7.2408 7.2255 4.5560 4.5752 0.6292 0.6332 �3.72 �3.92 16.75 16.5 7.60 7.53
P. Ravindran et al. / Journal of Solid State Chemistry 176 (2003) 338–374340
increasing repulsive T2H interaction and decreasingattractive H–H interaction. The considerable changes inthe equilibrium H–H distance on R displacementindicate that R in the R3T2 trigonal bipyramidalconfiguration acts as a shielding that to some extentcompensates the repulsive H–H interactions. When theR2H separation is reduced the H atoms are allowed toapproach each other more closely.
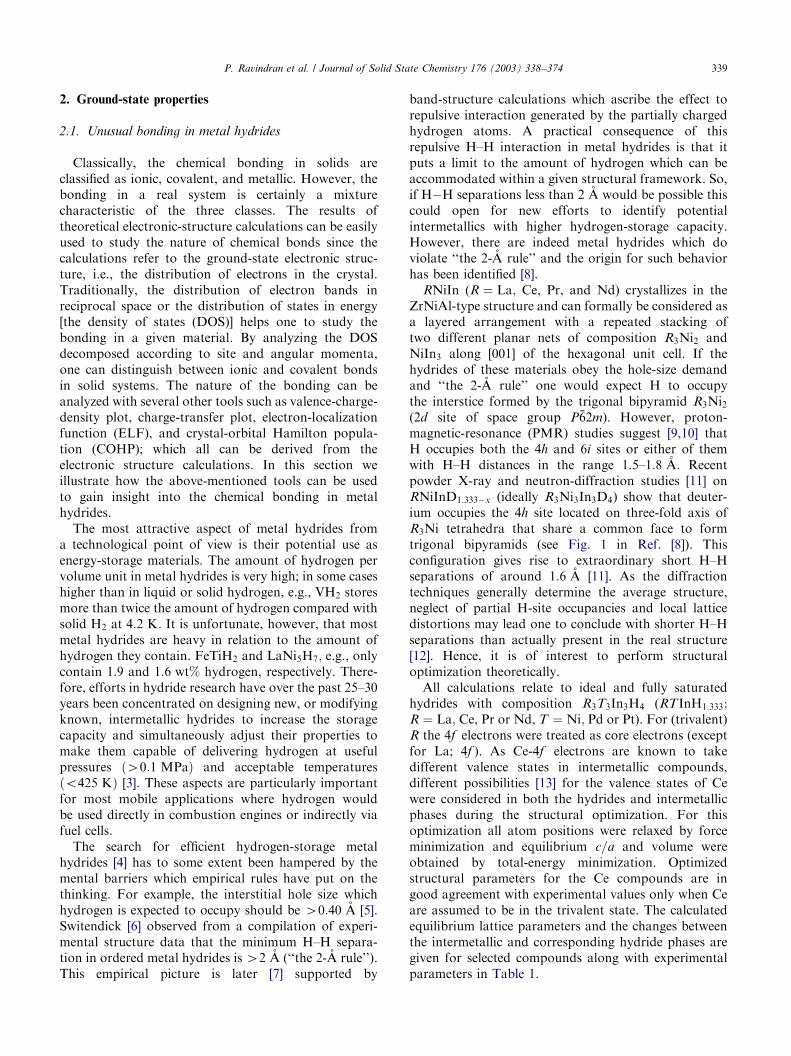
Owing to charge transfer from metal to hydrogen therepulsive H–H interaction in metal hydrides aregenerally larger than that within the H2 molecule andthis may be the physical basis for ‘‘the 2-A rule’’.Another example of violation of ‘‘the 2-A rule’’ is foundfor Th2AlH4 [14], but here the minimum H–H separa-tion ð1:945 AÞ within the Th5 trigonal bipyramids ismuch larger than the bond distance in the H2 moleculeand the H–H separations in RTInH1:333: To gauge thebond strength we have used COHP [15] analyses, as isimplemented in the TBLMTO-47 package [16,17].COHP, which is the Hamiltonian population weightedDOS, is identical with the crystal-orbital-overlap popu-lation. If COHP is negative, it indicates bondingcharacter, whereas positive COHP indicates antibond-ing character. Results from such COHP analysesfor LaNiInH1:333 are shown in Fig. 2 for all possibleinteractions within a 3:5 A range. This illustrationshows that the valence band (VB) comprises mainlybonding orbitals and that antibonding orbitals arefound B3 eV above the Fermi level ðEFÞ: In orderto quantify the bonding interaction between theconstituents in the RTInH1:333 series the integrated
crystal-orbital Hamilton population (ICOHP) werecalculated. For example, the ICOHP values up to EF
for LaNiInH1:333 are �3:44; �0:14; �0:72; �0:85;�0:86;�1:21; and �0:61 eV for Nið2cÞ–H, H–H, La–H,Nið2cÞ–In, La–Nið1bÞ; Nið1bÞ–In, and Nið2cÞ–La, re-spectively. This indicates that the strongest bonds arebetween Nið2cÞ and H. Another important observationis that the bonding interaction between the hydrogens issmall, which further confirms that the short H–Hseparation in these materials are not rooted in hydrogenpairing or formation of H2-like molecular units.
As measured by ICOHP, the bonding interactionNið2cÞ–In is reduced upon hydrogenation (from around�1:20 to �0:85 eV). The bonding ICOHP values for theshort H–H separations are very small, around �0:04 eV;thus supporting the already advanced inference thatthere is no significant covalent bonding interactionbetween the H atoms [18]. The low ICOHP value reflectsthe fact that both bonding and antibonding states arepresent below EF; but even if one takes into accountonly the bonding states, the ICOHP remains low [�0:14to �0:23 eV; which is much smaller than ICOHP forNið2cÞ–H]. Hence, both COHP and charge-densityanalyses agree that the H–H interaction is considerablysmaller than the Nið2cÞ–H interaction. This thereforedisagrees with NMR findings for CeNiInHx andPrNiInHx [9,10,19] which conclude that H?H pairingis the main reason for the unusually short H–Hseparation in these hydrides. On the basis of neutron-diffraction results [11] it has been speculated that theH–H interaction is shielded by the R–R interaction.However, our COHP study shows that the R–R
interaction is only ca. �0:62 eV in ICOHP which is5–6 times smaller than for the Nið2cÞ–H interactionand closer to the bond strength for R2H and R2Nið2cÞ:
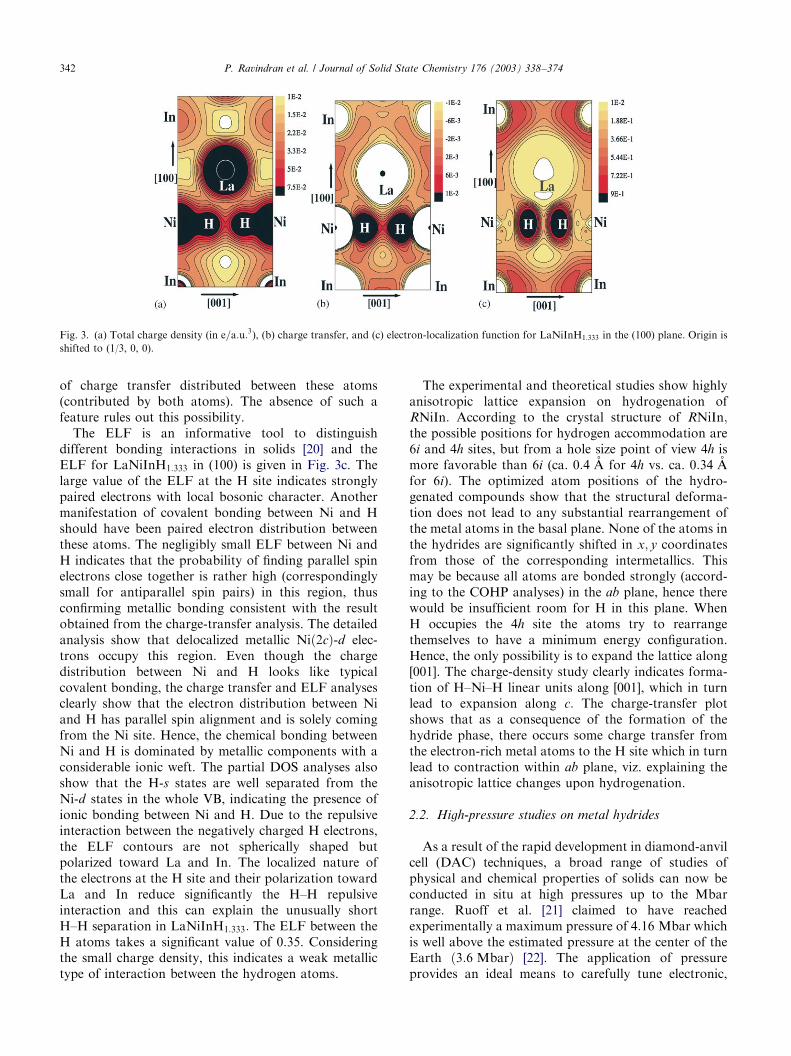
In order to substantiate this observation further wehave calculated the valence-charge-density distributionin (100) of LaNiInH1:333 (Fig. 3a). From this figure, it isapparent that Ni and H form an NiH2 molecule-likestructural subunit. Moreover, Fig. 3a demonstrates thatthere is no substantial charge-density distributed be-tween the H atoms. The charge transfer (the differencein the electron density of the compound and that ofconstituent atoms superimposed on the lattice grid) forLaNiInH1:333 within (100) depicted in Fig. 3b shows thatelectrons are transferred from La, In, and Ni to theH site. So, there is a considerable ionic-bondingcomponent between H and the metal-host lattice. Thetransferred electrons from the metal-host lattice to theH2-like subunit of the structure enter the antibonding s�
levels and gives rise to repulsive interaction. Thisrepulsive interaction between the negatively chargedH atoms could explain why the H–H separation in thesematerials are larger than that in the H2 molecule. Ifthere had been strong covalent bonding between Ni andH one would have expected a significant (positive) value
ARTICLE IN PRESS
-10 -5 0 5 510
-0.25
0
0.25
Ni(2c)−In
-0.25
0
0.25
La−H
-0.5
0
0.5
H−H
-1
0
1
Ni(2c)−H
-10 -5 0 10
-0.25
0
0.25
Ni(2c)−La
-0.05
0
0.05
In−H
-0.25
0
0.25
Ni(1b)−In
-0.25
0
0.25
La−Ni(1b)
Energy (Ry)
CO
HP
Fig. 2. COHPs for LaNiInH1:333; referring to the short distances
corresponding to the combinations Nið2cÞ–H, H–H, La–H, Nið2cÞ–In,
La–Nið1bÞ; Nið1bÞ–In, In–H, and Nið2cÞ–La.
P. Ravindran et al. / Journal of Solid State Chemistry 176 (2003) 338–374 341
of charge transfer distributed between these atoms(contributed by both atoms). The absence of such afeature rules out this possibility.
The ELF is an informative tool to distinguishdifferent bonding interactions in solids [20] and theELF for LaNiInH1:333 in (100) is given in Fig. 3c. Thelarge value of the ELF at the H site indicates stronglypaired electrons with local bosonic character. Anothermanifestation of covalent bonding between Ni and Hshould have been paired electron distribution betweenthese atoms. The negligibly small ELF between Ni andH indicates that the probability of finding parallel spinelectrons close together is rather high (correspondinglysmall for antiparallel spin pairs) in this region, thusconfirming metallic bonding consistent with the resultobtained from the charge-transfer analysis. The detailedanalysis show that delocalized metallic Nið2cÞ-d elec-trons occupy this region. Even though the chargedistribution between Ni and H looks like typicalcovalent bonding, the charge transfer and ELF analysesclearly show that the electron distribution between Niand H has parallel spin alignment and is solely comingfrom the Ni site. Hence, the chemical bonding betweenNi and H is dominated by metallic components with aconsiderable ionic weft. The partial DOS analyses alsoshow that the H-s states are well separated from theNi-d states in the whole VB, indicating the presence ofionic bonding between Ni and H. Due to the repulsiveinteraction between the negatively charged H electrons,the ELF contours are not spherically shaped butpolarized toward La and In. The localized nature ofthe electrons at the H site and their polarization towardLa and In reduce significantly the H–H repulsiveinteraction and this can explain the unusually shortH–H separation in LaNiInH1:333: The ELF between theH atoms takes a significant value of 0.35. Consideringthe small charge density, this indicates a weak metallictype of interaction between the hydrogen atoms.
The experimental and theoretical studies show highlyanisotropic lattice expansion on hydrogenation ofRNiIn: According to the crystal structure of RNiIn;the possible positions for hydrogen accommodation are6i and 4h sites, but from a hole size point of view 4h ismore favorable than 6i (ca. 0:4 A for 4h vs. ca. 0:34 Afor 6i). The optimized atom positions of the hydro-genated compounds show that the structural deforma-tion does not lead to any substantial rearrangement ofthe metal atoms in the basal plane. None of the atoms inthe hydrides are significantly shifted in x; y coordinatesfrom those of the corresponding intermetallics. Thismay be because all atoms are bonded strongly (accord-ing to the COHP analyses) in the ab plane, hence therewould be insufficient room for H in this plane. WhenH occupies the 4h site the atoms try to rearrangethemselves to have a minimum energy configuration.Hence, the only possibility is to expand the lattice along[001]. The charge-density study clearly indicates forma-tion of H–Ni–H linear units along [001], which in turnlead to expansion along c: The charge-transfer plotshows that as a consequence of the formation of thehydride phase, there occurs some charge transfer fromthe electron-rich metal atoms to the H site which in turnlead to contraction within ab plane, viz. explaining theanisotropic lattice changes upon hydrogenation.
2.2. High-pressure studies on metal hydrides
As a result of the rapid development in diamond-anvilcell (DAC) techniques, a broad range of studies ofphysical and chemical properties of solids can now beconducted in situ at high pressures up to the Mbarrange. Ruoff et al. [21] claimed to have reachedexperimentally a maximum pressure of 4:16 Mbar whichis well above the estimated pressure at the center of theEarth ð3:6 MbarÞ [22]. The application of pressureprovides an ideal means to carefully tune electronic,
ARTICLE IN PRESS
Fig. 3. (a) Total charge density (in e=a:u:3), (b) charge transfer, and (c) electron-localization function for LaNiInH1:333 in the (100) plane. Origin is
shifted to (1/3, 0, 0).
P. Ravindran et al. / Journal of Solid State Chemistry 176 (2003) 338–374342
magnetic, structural, and vibrational properties for awide range of applications. Total-energy calculationsbased on the DFT allow us to derive free energies, andhence the energetics of different structures for a givensolid as a function of pressure. Extreme pressuresprovide a fertile ground for the formation of newmaterials, evidenced by the new phase transitionsobserved in scores of materials studied to date, andthe appearance of entirely new classes of materials[23,24]. As theory has no limitations for studies ofproperties of materials at high pressures, one can usethis tool to explore the multi-Mbar range. For hydridematerials experimental high-pressure studies are ham-pered by the small scattering cross section of hydrogento X-rays, poor output intensity from DAC measure-ments (compared to normal X-ray-diffraction measure-ments) and various challenges connected with the use ofneutron-diffraction techniques. Hence, computationalmeans are very favorable approaches to high-pressurebehaviors of hydrides.
The utilization of high-pressure technology has madeconsiderable progress both in experimental and theore-tical studies of hydrogen-storage materials. Magnesiumis an attractive material for hydrogen-storage applica-tions because of its light weight, low manufacture cost,and high hydrogen-storage capacity ð7:66 wt:%Þ: On theother hand, owing to its high operation temperature(pressure plateau of 1 bar at 525 K) and slow absorptionkinetics, practical applications of magnesium-basedalloys have been limited. However, it has recently beenestablished that improved hydrogen-absorption kineticscan be achieved by means of reduced particle size and/oraddition of transition metals to magnesium andmagnesium hydrides [25]. g-MgH2 often occurs as aby-product in high-pressure synthesis of technologicallyimportant metal hydrides like Mg2NiH4: Hence, acomplete characterization of g-MgH2; in particularknowledge about its stability at high pressures, isdesirable. As high-pressure X-ray-diffraction studieshave difficulties to identify the exact position ofhydrogen atoms owing to its very low scattering crosssection, the theoretical identification of the hydrogenpositions would be of great values.
a-MgH2 crystallizes with TiO2-r-type ðr ¼ rutileÞstructure at ambient pressure and low temperature[26]. At higher temperatures and pressures tetragonala-MgH2 transforms into orthorhombic g-MgH2: Re-cently Bortz et al. [27] solved the crystal structure ofg-MgH2 (a-PbO2 type) on the basis of powder neutron-diffraction data collected at 2 GPa: The a- to g-MgH2
transition pressure is not yet known. In addition tothe experimentally identified a- and g-modifications ofMgH2; calculations have been performed for severalother possible [28] types of structural arrangements forMgH2 (details in Ref. [29]). The generalized gradientapproximation (GGA) [30] has been used to obtain
accurate exchange and correlation energies for thestructural arrangements considered. The structures arefully relaxed for all volumes considered using force aswell as stress minimization. Experimentally establishedstructural data were used as input for the calculationswhen available. The Vienna ab initio simulation packageprojected-augmented plane-wave (VASPPAW) methodwas used for the total-energy calculations to establishphase stability and transition pressures. In order toavoid ambiguities regarding the free-energy results thesame energy cutoff and a similar k-grid density forconvergence were used; 500 k points in the wholeBrillouin zone for a-MgH2 and a similar density of k
points for the other structural arrangements. The PAWpseudo potentials [31] were used for all VASP calcula-tions, a demand of at least 0:01 meV=atom for theself-consistent convergence of the total energy, and aplane-wave cutoff of 400 eV:
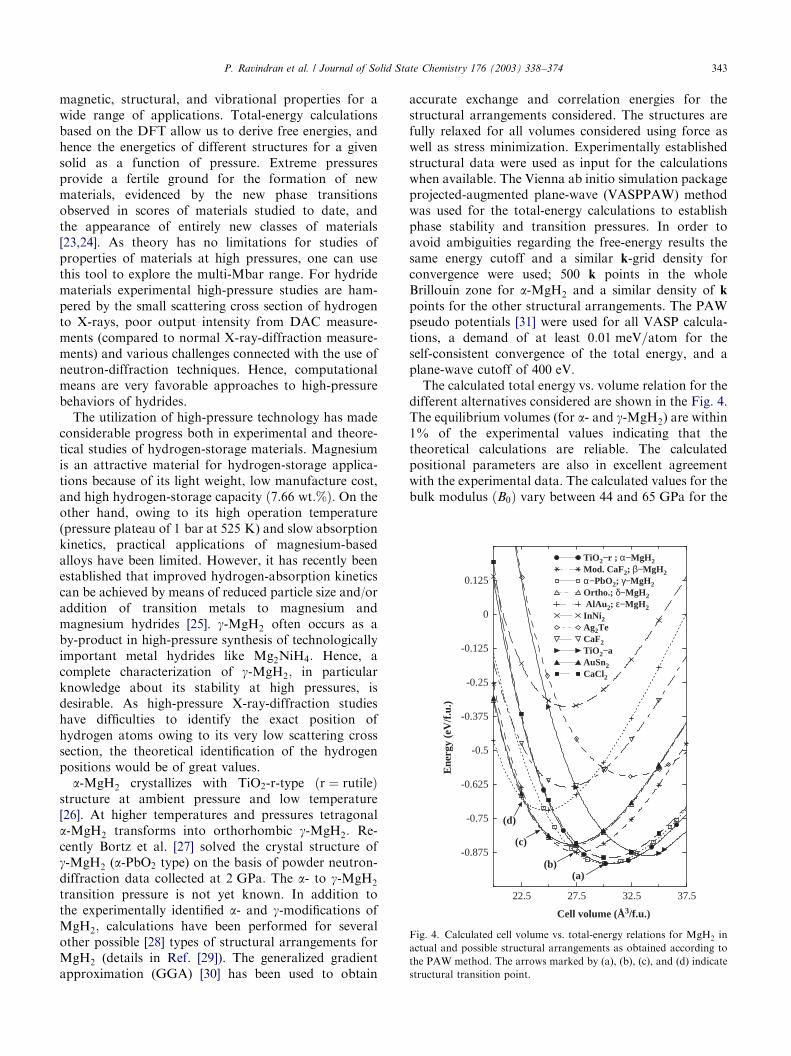
The calculated total energy vs. volume relation for thedifferent alternatives considered are shown in the Fig. 4.The equilibrium volumes (for a- and g-MgH2) are within1% of the experimental values indicating that thetheoretical calculations are reliable. The calculatedpositional parameters are also in excellent agreementwith the experimental data. The calculated values for thebulk modulus ðB0Þ vary between 44 and 65 GPa for the
ARTICLE IN PRESS
22.5 27.5 32.5 37.5
-0.875
-0.75
-0.625
-0.5
-0.375
-0.25
-0.125
0
0.125
TiO2−r ; α−MgH2Mod. CaF2; β−MgH2α−PbO2; γ−MgH2Ortho.; δ−MgH2 AlAu2; ε−MgH2InNi2Ag2TeCaF2TiO2−aAuSn2CaCl2
(a)(b)
(c)
Cell volume (Å3/f.u.)
Ene
rgy
(eV
/f.u
.)
(d)
Fig. 4. Calculated cell volume vs. total-energy relations for MgH2 in
actual and possible structural arrangements as obtained according to
the PAW method. The arrows marked by (a), (b), (c), and (d) indicate
structural transition point.
P. Ravindran et al. / Journal of Solid State Chemistry 176 (2003) 338–374 343
various structural arrangements. Among the elevenpossibilities considered the Ag2Te-type structure leadsto the smallest B0 value and the AlAu2 type to thehighest.
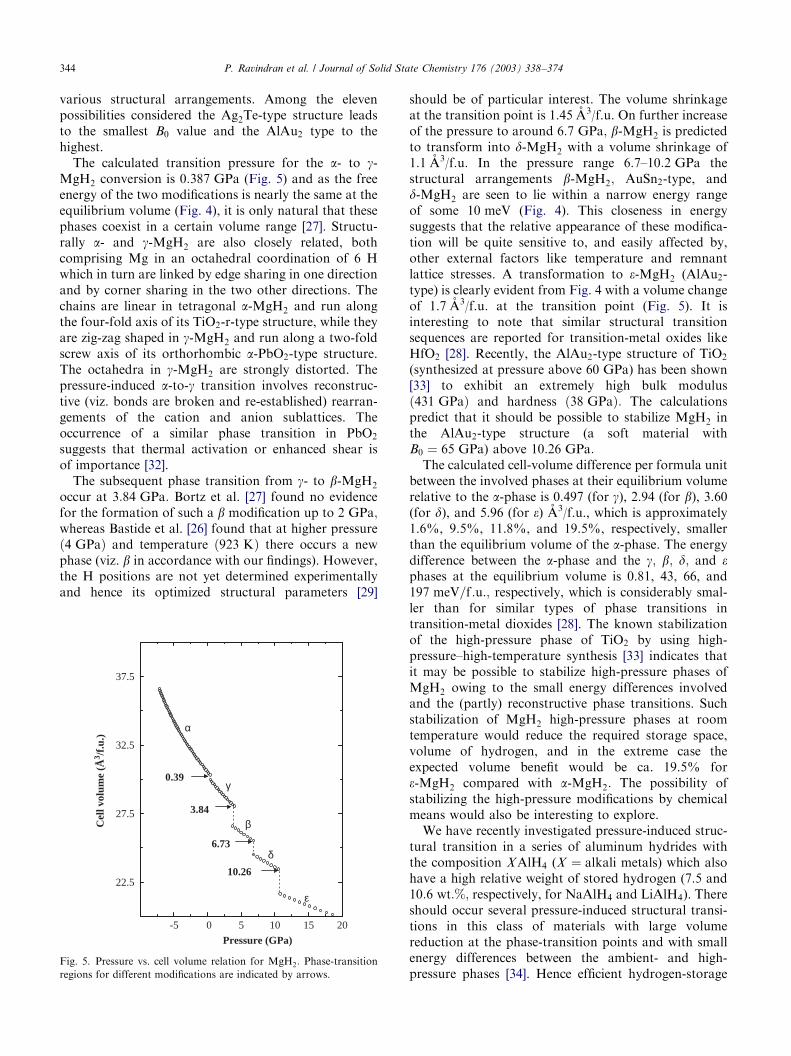
The calculated transition pressure for the a- to g-MgH2 conversion is 0:387 GPa (Fig. 5) and as the freeenergy of the two modifications is nearly the same at theequilibrium volume (Fig. 4), it is only natural that thesephases coexist in a certain volume range [27]. Structu-rally a- and g-MgH2 are also closely related, bothcomprising Mg in an octahedral coordination of 6 Hwhich in turn are linked by edge sharing in one directionand by corner sharing in the two other directions. Thechains are linear in tetragonal a-MgH2 and run alongthe four-fold axis of its TiO2-r-type structure, while theyare zig-zag shaped in g-MgH2 and run along a two-foldscrew axis of its orthorhombic a-PbO2-type structure.The octahedra in g-MgH2 are strongly distorted. Thepressure-induced a-to-g transition involves reconstruc-tive (viz. bonds are broken and re-established) rearran-gements of the cation and anion sublattices. Theoccurrence of a similar phase transition in PbO2
suggests that thermal activation or enhanced shear isof importance [32].
The subsequent phase transition from g- to b-MgH2
occur at 3:84 GPa: Bortz et al. [27] found no evidencefor the formation of such a b modification up to 2 GPa;whereas Bastide et al. [26] found that at higher pressureð4 GPaÞ and temperature ð923 KÞ there occurs a newphase (viz. b in accordance with our findings). However,the H positions are not yet determined experimentallyand hence its optimized structural parameters [29]
should be of particular interest. The volume shrinkageat the transition point is 1.45 A3/f.u. On further increaseof the pressure to around 6:7 GPa; b-MgH2 is predictedto transform into d-MgH2 with a volume shrinkage of1.1 A3/f.u. In the pressure range 6.7–10:2 GPa thestructural arrangements b-MgH2; AuSn2-type, andd-MgH2 are seen to lie within a narrow energy rangeof some 10 meV (Fig. 4). This closeness in energysuggests that the relative appearance of these modifica-tion will be quite sensitive to, and easily affected by,other external factors like temperature and remnantlattice stresses. A transformation to e-MgH2 (AlAu2-type) is clearly evident from Fig. 4 with a volume changeof 1.7 A3/f.u. at the transition point (Fig. 5). It isinteresting to note that similar structural transitionsequences are reported for transition-metal oxides likeHfO2 [28]. Recently, the AlAu2-type structure of TiO2
(synthesized at pressure above 60 GPa) has been shown[33] to exhibit an extremely high bulk modulusð431 GPaÞ and hardness ð38 GPaÞ: The calculationspredict that it should be possible to stabilize MgH2 inthe AlAu2-type structure (a soft material withB0 ¼ 65 GPa) above 10:26 GPa:
The calculated cell-volume difference per formula unitbetween the involved phases at their equilibrium volumerelative to the a-phase is 0.497 (for g), 2.94 (for b), 3.60(for d), and 5.96 (for e) A3/f.u., which is approximately1.6%, 9.5%, 11.8%, and 19.5%, respectively, smallerthan the equilibrium volume of the a-phase. The energydifference between the a-phase and the g; b; d; and ephases at the equilibrium volume is 0.81, 43, 66, and197 meV=f :u:; respectively, which is considerably smal-ler than for similar types of phase transitions intransition-metal dioxides [28]. The known stabilizationof the high-pressure phase of TiO2 by using high-pressure–high-temperature synthesis [33] indicates thatit may be possible to stabilize high-pressure phases ofMgH2 owing to the small energy differences involvedand the (partly) reconstructive phase transitions. Suchstabilization of MgH2 high-pressure phases at roomtemperature would reduce the required storage space,volume of hydrogen, and in the extreme case theexpected volume benefit would be ca. 19.5% fore-MgH2 compared with a-MgH2: The possibility ofstabilizing the high-pressure modifications by chemicalmeans would also be interesting to explore.
We have recently investigated pressure-induced struc-tural transition in a series of aluminum hydrides withthe composition XAlH4 (X ¼ alkali metals) which alsohave a high relative weight of stored hydrogen (7.5 and10:6 wt:%; respectively, for NaAlH4 and LiAlH4). Thereshould occur several pressure-induced structural transi-tions in this class of materials with large volumereduction at the phase-transition points and with smallenergy differences between the ambient- and high-pressure phases [34]. Hence efficient hydrogen-storage
ARTICLE IN PRESS
-5 0 5 10 15 20
22.5
27.5
32.5
37.5
Pressure (GPa)
Cel
l vol
ume
(Å3 /f
.u.)
α
γ0.39
3.84
10.26
δ
ε
6.73
β
Fig. 5. Pressure vs. cell volume relation for MgH2: Phase-transition
regions for different modifications are indicated by arrows.
P. Ravindran et al. / Journal of Solid State Chemistry 176 (2003) 338–374344
materials with high volume density of hydrogen wouldbe obtained if one could stabilize such high-pressurephases by chemical means.
2.3. Elastic properties
Structural intermetallics for high-temperature appli-cations are currently in the center of interest owing totheir high strength, oxidation resistance, high meltingpoint, and for some of them also low density and highresistance against fatigue, wear, erosion, and caviation.The hindrance to use these materials for structuralapplications is their brittleness especially at and belowroom temperature. World-wide development effortshave been focused on improving the ductility ofstructural intermetallics. As the elastic constants arethe fundamental quantities for describing the mechan-ical properties of materials, it is of interest to estimatesuch quantities.
Elastic constants for most pure metals are availablein the literature. In contrast, available data fortechnologically important alloys and intermetallicphases are very limited. In particular, single-crystalelastic constants are available only for a few inter-metallic phases [35] partly owing to the difficultiesinvolved in growing single crystals of sufficient size andalso to estimate the parameters from experimentalresonance spectra. Hence, efforts have been made toderive the elastic constants from first-principles DFTcalculations. Although, the bulk modulus have beencalculated for various materials, the calculations of theother elastic constants are relatively scarce. Even thoughmany attempts have been made to calculate the elasticconstants of cubic materials from first principles, veryfew attempts have been made to calculate the elasticconstants for moderately low-symmetric cases such astetragonal and hexagonal systems. The task of calculat-ing the elastic constants for low-symmetric structuresbecomes more difficult when realizing that the strainsneeded in the calculation of some of them give rise to ageometry with very low symmetry. It has been recentlydemonstrated [36] that full-potential DFT calculationalong with the GGA gives reliable prediction of elasticconstants for low-symmetric materials such as orthor-hombic TiSi2: Here we show the reliability of DFTcalculations to predict elastic properties for the aero-space engineering material hexagonal Ti3Al:
The hexagonal lattice is described by the parametersa and c with Bravais lattice vectors in matrix form:
R ¼
ffiffi3
p
2�1
20
0 1 0
0 0 ca
0B@
1CA:
The VASP [37] method allows total-energy calculationsto be performed for arbitrary crystal symmetry. One can
therefore apply small strains to the equilibrium lattice,determine the resulting change in the total energy, andfrom this information deduce the elastic constants.Linear combinations of the elastic constants can bedetermined by straining the lattice vectors R by meansof the matrix product R0 ¼ R D; where R0 is a matrixcontaining the components of the distorted latticevectors and D is the symmetric distortion matrix, whichcontains the strain components. One must consider onlysmall lattice distortions in order to remain within theelastic limit of the crystal. There are several distortionswhich can be used to determine the elastic constants.For several purposes it is convenient to considervolume-conserving or symmetry-preserving distortions.The internal energy of a crystal under a strain d can beexpanded in powers of the strain tensor with respect tothe initial internal energy of the unstrained crystal. Theenergy of the strained lattice can be expressed by meansof the second-power terms in a Taylor expansion withthe distortion parameters d as variables
EðV ; dÞ ¼EðV0; 0Þ þ V0
Xi
tixidi þ 1=2X
ij
cijdixidjxj
!
þ Oðd3Þ þ?: ð1Þ
The volume of the unstrained system is denoted V0;EðV0; 0Þ is the corresponding total energy, ti an elementof the stress tensor, and cij the elastic constants. Withthe five independent elastic constants for the hexagonalcrystal systems one needs five different strains todetermine them (see Ref. [38]). The total energies forthe various distortions are calculated using the PAWimplementation of VASP [37] with a sufficiently largenumber of k points.
The calculated single-crystal elastic constants forTi3Al are compared with the experimental values [39]in Table 3. The theoretical data are obtained accordingto four different approaches such as local densityapproximation (LDA) [40] with and without relaxationof atom positions, and the GGA [41] with and withoutrelaxation of atom positions. Most of the elasticconstant calculations reported in the literature areobtained without the relaxation of atom positions dueto the extensive computations involved in such calcula-tions. If one does not take into account the atomicrelaxation during the estimation of the total energy withdistortion, one generally obtains higher values for theelastic constants (particularly the shear modulus) thanfound when atomic relaxation is included. Table 3shows that the calculated elastic constants are closer tothe experimental values when atomic relaxations areincluded. The calculated equilibrium volumes deviatefrom the experimental values by 3% and 8% accordingto our GGA and LDA calculations, respectively, andthe single-crystal elastic constants obtained from GGAcalculations are closer to the experimental values than
ARTICLE IN PRESSP. Ravindran et al. / Journal of Solid State Chemistry 176 (2003) 338–374 345
from LDA calculations. The bulk modulus from GGAcalculations deviates only 4% from experiment com-pared with the 18% deviation found according to LDAcalculations.
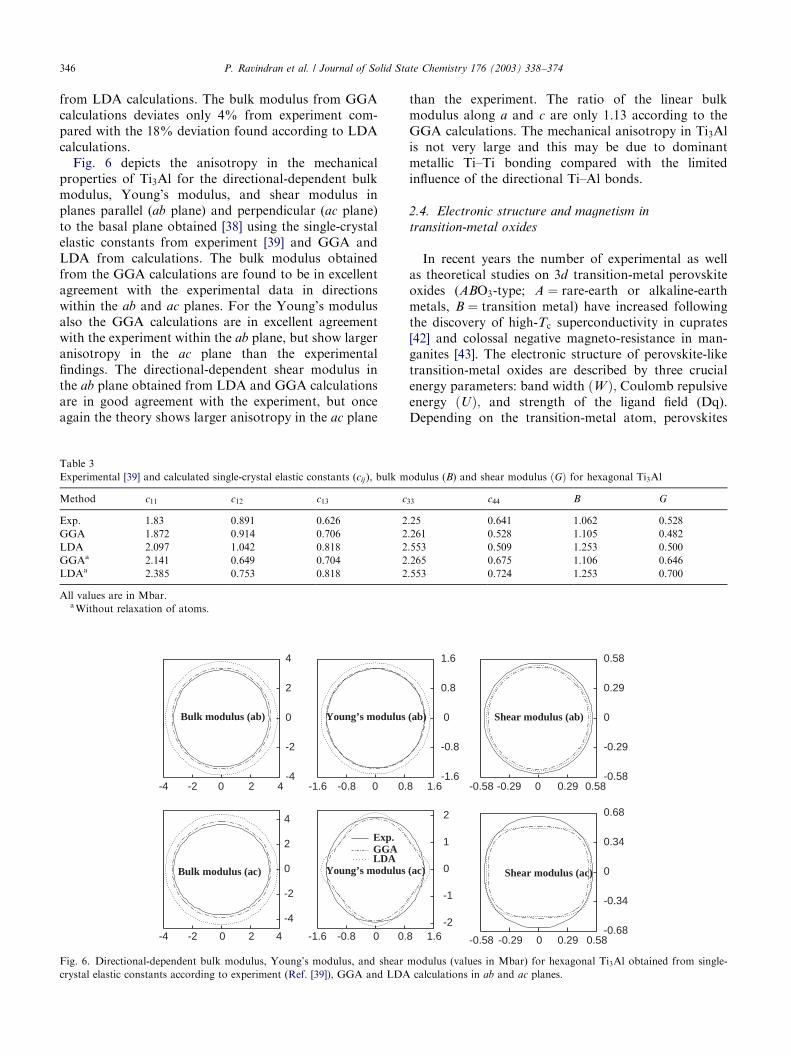
Fig. 6 depicts the anisotropy in the mechanicalproperties of Ti3Al for the directional-dependent bulkmodulus, Young’s modulus, and shear modulus inplanes parallel (ab plane) and perpendicular (ac plane)to the basal plane obtained [38] using the single-crystalelastic constants from experiment [39] and GGA andLDA from calculations. The bulk modulus obtainedfrom the GGA calculations are found to be in excellentagreement with the experimental data in directionswithin the ab and ac planes. For the Young’s modulusalso the GGA calculations are in excellent agreementwith the experiment within the ab plane, but show largeranisotropy in the ac plane than the experimentalfindings. The directional-dependent shear modulus inthe ab plane obtained from LDA and GGA calculationsare in good agreement with the experiment, but onceagain the theory shows larger anisotropy in the ac plane
than the experiment. The ratio of the linear bulkmodulus along a and c are only 1.13 according to theGGA calculations. The mechanical anisotropy in Ti3Alis not very large and this may be due to dominantmetallic Ti–Ti bonding compared with the limitedinfluence of the directional Ti–Al bonds.
2.4. Electronic structure and magnetism in
transition-metal oxides
In recent years the number of experimental as wellas theoretical studies on 3d transition-metal perovskiteoxides (ABO3-type; A ¼ rare-earth or alkaline-earthmetals, B ¼ transition metal) have increased followingthe discovery of high-Tc superconductivity in cuprates[42] and colossal negative magneto-resistance in man-ganites [43]. The electronic structure of perovskite-liketransition-metal oxides are described by three crucialenergy parameters: band width ðWÞ; Coulomb repulsiveenergy ðUÞ; and strength of the ligand field (Dq).Depending on the transition-metal atom, perovskites
ARTICLE IN PRESS
Table 3
Experimental [39] and calculated single-crystal elastic constants (cij), bulk modulus (B) and shear modulus ðGÞ for hexagonal Ti3Al
Method c11 c12 c13 c33 c44 B G
Exp. 1.83 0.891 0.626 2.25 0.641 1.062 0.528
GGA 1.872 0.914 0.706 2.261 0.528 1.105 0.482
LDA 2.097 1.042 0.818 2.553 0.509 1.253 0.500
GGAa 2.141 0.649 0.704 2.265 0.675 1.106 0.646
LDAa 2.385 0.753 0.818 2.553 0.724 1.253 0.700
All values are in Mbar.aWithout relaxation of atoms.
-4 -2 0 2 4-4
-2
0
2
4
-1.6 -0.8 0 0.8 1.6-1.6
-0.8
0
0.8
1.6
-0.58 -0.29 0 0.29 0.58-0.58
-0.29
0
0.29
0.58
-0.58 -0.29 0 0.29 0.58-0.68
-0.34
0
0.34
0.68
-1.6 -0.8 0 0.8 1.6-2
-1
0
1
2
-4 -2 0 2 4
-4
-2
0
2
4
Bulk modulus (ab)
Bulk modulus (ac) Young’s modulus (ac)
Young’s modulus (ab) Shear modulus (ab)
Shear modulus (ac)
Exp.
LDAGGA
Fig. 6. Directional-dependent bulk modulus, Young’s modulus, and shear modulus (values in Mbar) for hexagonal Ti3Al obtained from single-
crystal elastic constants according to experiment (Ref. [39]), GGA and LDA calculations in ab and ac planes.
P. Ravindran et al. / Journal of Solid State Chemistry 176 (2003) 338–374346
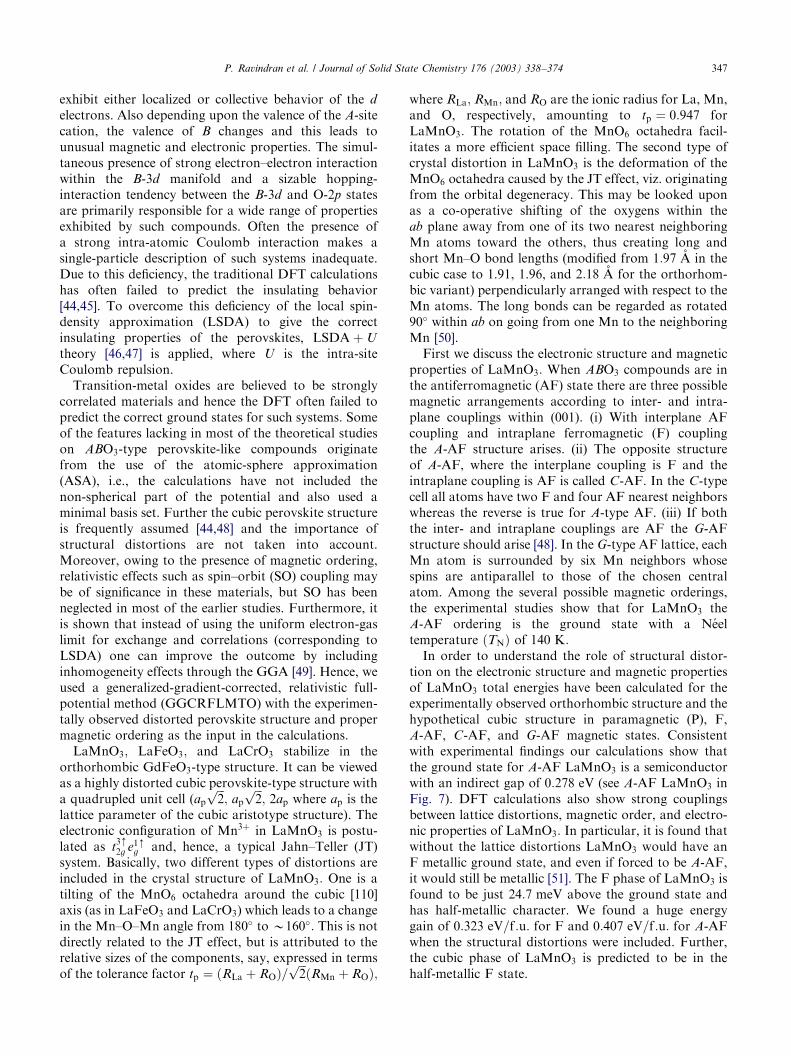
exhibit either localized or collective behavior of the d
electrons. Also depending upon the valence of the A-sitecation, the valence of B changes and this leads tounusual magnetic and electronic properties. The simul-taneous presence of strong electron–electron interactionwithin the B-3d manifold and a sizable hopping-interaction tendency between the B-3d and O-2p statesare primarily responsible for a wide range of propertiesexhibited by such compounds. Often the presence ofa strong intra-atomic Coulomb interaction makes asingle-particle description of such systems inadequate.Due to this deficiency, the traditional DFT calculationshas often failed to predict the insulating behavior[44,45]. To overcome this deficiency of the local spin-density approximation (LSDA) to give the correctinsulating properties of the perovskites, LSDA þ U
theory [46,47] is applied, where U is the intra-siteCoulomb repulsion.
Transition-metal oxides are believed to be stronglycorrelated materials and hence the DFT often failed topredict the correct ground states for such systems. Someof the features lacking in most of the theoretical studieson ABO3-type perovskite-like compounds originatefrom the use of the atomic-sphere approximation(ASA), i.e., the calculations have not included thenon-spherical part of the potential and also used aminimal basis set. Further the cubic perovskite structureis frequently assumed [44,48] and the importance ofstructural distortions are not taken into account.Moreover, owing to the presence of magnetic ordering,relativistic effects such as spin–orbit (SO) coupling maybe of significance in these materials, but SO has beenneglected in most of the earlier studies. Furthermore, itis shown that instead of using the uniform electron-gaslimit for exchange and correlations (corresponding toLSDA) one can improve the outcome by includinginhomogeneity effects through the GGA [49]. Hence, weused a generalized-gradient-corrected, relativistic full-potential method (GGCRFLMTO) with the experimen-tally observed distorted perovskite structure and propermagnetic ordering as the input in the calculations.
LaMnO3; LaFeO3; and LaCrO3 stabilize in theorthorhombic GdFeO3-type structure. It can be viewedas a highly distorted cubic perovskite-type structure witha quadrupled unit cell (ap
ffiffiffi2
p; ap
ffiffiffi2
p; 2ap where ap is the
lattice parameter of the cubic aristotype structure). Theelectronic configuration of Mn3þ in LaMnO3 is postu-lated as t
3m2g e1m
g and, hence, a typical Jahn–Teller (JT)system. Basically, two different types of distortions areincluded in the crystal structure of LaMnO3: One is atilting of the MnO6 octahedra around the cubic [110]axis (as in LaFeO3 and LaCrO3) which leads to a changein the Mn–O–Mn angle from 180 to B160: This is notdirectly related to the JT effect, but is attributed to therelative sizes of the components, say, expressed in termsof the tolerance factor tp ¼ ðRLa þ ROÞ=
ffiffiffi2
pðRMn þ ROÞ;
where RLa; RMn; and RO are the ionic radius for La, Mn,and O, respectively, amounting to tp ¼ 0:947 forLaMnO3: The rotation of the MnO6 octahedra facil-itates a more efficient space filling. The second type ofcrystal distortion in LaMnO3 is the deformation of theMnO6 octahedra caused by the JT effect, viz. originatingfrom the orbital degeneracy. This may be looked uponas a co-operative shifting of the oxygens within theab plane away from one of its two nearest neighboringMn atoms toward the others, thus creating long andshort Mn–O bond lengths (modified from 1:97 A in thecubic case to 1.91, 1.96, and 2:18 A for the orthorhom-bic variant) perpendicularly arranged with respect to theMn atoms. The long bonds can be regarded as rotated90 within ab on going from one Mn to the neighboringMn [50].
First we discuss the electronic structure and magneticproperties of LaMnO3: When ABO3 compounds are inthe antiferromagnetic (AF) state there are three possiblemagnetic arrangements according to inter- and intra-plane couplings within (001). (i) With interplane AFcoupling and intraplane ferromagnetic (F) couplingthe A-AF structure arises. (ii) The opposite structureof A-AF, where the interplane coupling is F and theintraplane coupling is AF is called C-AF. In the C-typecell all atoms have two F and four AF nearest neighborswhereas the reverse is true for A-type AF. (iii) If boththe inter- and intraplane couplings are AF the G-AFstructure should arise [48]. In the G-type AF lattice, eachMn atom is surrounded by six Mn neighbors whosespins are antiparallel to those of the chosen centralatom. Among the several possible magnetic orderings,the experimental studies show that for LaMnO3 theA-AF ordering is the ground state with a Neeltemperature ðTNÞ of 140 K:
In order to understand the role of structural distor-tion on the electronic structure and magnetic propertiesof LaMnO3 total energies have been calculated for theexperimentally observed orthorhombic structure and thehypothetical cubic structure in paramagnetic (P), F,A-AF, C-AF, and G-AF magnetic states. Consistentwith experimental findings our calculations show thatthe ground state for A-AF LaMnO3 is a semiconductorwith an indirect gap of 0:278 eV (see A-AF LaMnO3 inFig. 7). DFT calculations also show strong couplingsbetween lattice distortions, magnetic order, and electro-nic properties of LaMnO3: In particular, it is found thatwithout the lattice distortions LaMnO3 would have anF metallic ground state, and even if forced to be A-AF,it would still be metallic [51]. The F phase of LaMnO3 isfound to be just 24:7 meV above the ground state andhas half-metallic character. We found a huge energygain of 0:323 eV=f :u: for F and 0:407 eV=f :u: for A-AFwhen the structural distortions were included. Further,the cubic phase of LaMnO3 is predicted to be in thehalf-metallic F state.
ARTICLE IN PRESSP. Ravindran et al. / Journal of Solid State Chemistry 176 (2003) 338–374 347
The calculated total DOS for A-AF LaMnO3 in thecubic as well as the experimentally found orthorhombicstructure are given in Fig. 7. From this figure it is clearthat the semiconducting behavior appears only when thestructural distortions are included in the calculationwhereas the cubic A-AF phase is predicted to be a metal.Further, even if we include the structural distortions inthe calculations the P, F, and C-AF phases of LaMnO3
exhibit metallic character. The JT distortion lifts thedegeneracy of the eg level. The eg-level splitting is foundto be 0:278 eV according to the calculation and thisis nothing but the (semiconducting) band gap in thismaterial. Saitoh et al. [52] reported strong covalency andsuggested that the energy gap in LaMnO3 should beconsidered as of the charge-transfer (CT) type. The bandgap estimated from the DOS for A-AF state LaMnO3 isfound to be in good agreement with the value ð0:24 eVÞobtained by Mahendiran et al. [53] from resistivitymeasurements (Jonker [54] reported 0:15 eV). However,our value for the direct gap ð0:677 eVÞ between occupiedand empty states at the same location in the Brillouinzone (BZ) is too low compared with optical ð1:1 eVÞ [55]
and photoemission ð1:7 eVÞ [52] measurements. (How-ever, it should be noted that experimental optical gapsare usually defined at the onset of an increase in spectralintensity in the measured optical variable.) It is alsouseful to compare our calculated band gap with othertheoretical results. The LSDA and LSDA þ U calcula-tions of Yang et al. [56] using the LMTO-ASA methodgave a band gap of 0.1 and 1:0 eV; respectively. TheLSDA þ U2 approach (where U is applied only to thet2g electrons) [57] yielded a band gap of 0:2 eV: Hence,our band gap is somewhat larger than that of otherLSDA calculations. On the other hand, Hartree–Fockcalculations [58] gave an unphysically large gap ð3 eVÞfor LaMnO3:
Usually, the eg splitting caused by the JT effect issomewhat underestimated in ASA calculations[44,45,57,59] and a discrepancy could reflect an un-certainty introduced by the ASA approach. It is worthto recall that when we performed a band-structurecalculation for monoclinic SnI2 with the widely usedTBLMTO-ASA method [17] we found a band-gap of0:72 eV only, whereas a value of 1:54 eV was obtainedfrom the full-potential LMTO method without SOcoupling [60]. These values are smaller than theexperimental values by Kostyshin et al. [61] (2:52 eVat 85 K), Gorban et al. [62] (2:2 eV at 86 K), and Fujitaet al. [63] (2:275 eV at 298 K). Hence discrepancies inband-gap values not only rise from the LSDA treat-ment, but also from other approximations used in thecalculations. Even though our calculation predicts [64]the correct non-magnetic ground state for LaCoO3 itfailed to predict the semiconducting behavior (instead,EF is lying on a pseudogap-like feature). It is interestingto note that optical conductivity studies [65] show aspin-gap energy of B30 meV and a charge-gap ofB0:1 eV for this material. So the failure to obtainproper semiconducting behavior may be due to a smallvalue for the charge gap, which is within the accuracy ofthe present type of calculations. The calculated bandgap is here identified with the difference between thehighest occupied and the lowest unoccupied Kohn–Sham eigenvalues, the so-called Kohn–Sham gap. Thereal band gap, however, is the smallest energy requiredto move an electron from the VB of the insulatingN-particle ground state to infinity minus the energygained by adding an electron to the conduction band(CB) of the insulating N-particle ground state. This gapcan be written as a sum of the Kohn–Sham gap and apart originating from the discontinuity in the exchange-correlation potential at the integer particle numberN [66]. Because of difficulties with the discontinuity,there are no standard methods for calculating (correctly)the size of band gaps, although recent work based on theGW approximation (where G is the Green function of afree electron and W is the screened interaction potential)seems promising in this regard [67]. These aspects are
ARTICLE IN PRESS
-8 -6 -4 -2 0 2 4 6 8Energy (eV)
5
10
15
5
10
15
5
10
15
TD
OS
[sta
tes/
(eV
f.u.
)]
5
10
15
5
10
15
LaVO3 (C−AF)
LaCrO3 (G−AF)
LaMnO3 (A−AF)
LaMnO3 (cubic A−AF)
LaFeO3 (G−AF)
Fig. 7. Calculated total DOS for LaBO3 ðB ¼ V;Cr;Mn;FeÞ in the
magnetic ground states obtained from gradient-corrected SO-coupling-
included full-potential LMTO method. For B ¼ Mn also including the
DOS for a hypothetical cubic perovskite aristotype structure with
A-AF ordering.
P. Ravindran et al. / Journal of Solid State Chemistry 176 (2003) 338–374348
not explored further in this review. The importantconclusion arrived from the above observations is thatin order to obtain reasonable band-gap values forsemiconductors or insulators one has to include properstructural distortions and magnetic ordering in additionto the full-potential treatment.
As mentioned earlier, the JT distortion as well as therotation of the octahedra are present in LaMnO3: Inorder to gain insight into the role of JT distortion androtation of the octahedra we have carried out two sets ofcalculations for LaMnO3 in the five different magneticstates (P, F, A-, C-, and G-AF). In one set we have takeninto account only the JT distortion and neglected therotation of the octahedra and in the other set vice versa.The first set of calculations gave A-AF as the groundstate with 5:8 meV=f :u: lower energy than the secondbest choice, the F phase. In the other set withthe opposite situation: we found that the F state is theground state with 53:4 meV=f :u: lower energy than theA-AF phase. These results indicate that the lifting ofthe degeneracy in the band structures by JT distortionplays an important role in stabilizing the A-AF orderingin LaMnO3: Further, we found that both the rotation ofthe octahedra and the JT distortion are necessary toobtain the insulating behavior for LaMnO3: The energyseparation between the eg and t2g levels, caused by thecrystal-field splitting, is known to be larger than 1 eV[68]. Owing to strong overlap between the eg and t2g
levels in the A-AF orthorhombic phase, we are unableto estimate the crystal-field splitting energy. However,owing to the well separated eg and t2g levels in the cubicphase we estimated this energy to be B0:96 eV: The Mnd-exchange splitting obtained from our calculation is3:34 eV in agreement with 3:5 eV found by Pickett andSingh [69] by linear-augmented plane-wave (LAPW)calculations and 3:48 eV reported by Mahadevan et al.[70] from LMTO-ASA calculations.
The orthorhombic LaFeO3 is found to take aninsulating G-AF-type arrangement with TN ¼ 738 K:We have calculated the total energies for P, F, A-, C-,and G-AF phases of LaFeO3 using the GGCRFLMTOmethod. These correctly provide G-AF as the groundstate for LaFeO3 with A-, C-AF, F, and P phases higherin energy by 191, 132, 185, and 798 meV=f :u:; respec-tively. Fig. 7 also show that LaFeO3 in the G-AF phaseis an insulator with a band gap of 0:61 eV: Theobservation of insulating behavior is in agreement withthe experimental observation of a CT gap (2:1 eVaccording to optical measurements [55]). The calculatedmagnetic moment at the Fe site is 3:67 mB which iscomparable with 4:670:2 mB obtained by neutrondiffraction [71]. LaCrO3 is also a CT insulator in theorthorhombic GdFeO3-type structure and has G-AFordering with TN ¼ 289 K as the ground state. Thecalculated magnetic moment at the Cr site is 2:50 mB
which is in good agreement with 2:870:2 mB obtained
by neutron diffraction [71]. Also, our calculations wereable to reproduce the correct insulating ground statewith a band gap of 1:48 eV (see Fig. 7). Experimentaloptical reflectivity measurements [55] yielded a bandgap of 3:4 eV in this compound (remember: the usualLDA or GGA underestimates band gaps). TheGGCRFLMTO calculations appear to be able toprovide the correct ground state for CT insulators.
Arima et al. [55] measured the optical gap of LaTiO3
and LaVO3 and concluded that they are Mott insula-tors. In LaVO3; the magnetic transition occurs at 143 K;and the ordered spin configuration is C-AF [72] Thiscompound undergoes another phase transition, a first-order structural transition (orthorhombic to monocli-nic) at 141 K [73]. The calculated magnetic moment atthe V site in LaVO3 according to GGCRFLMTOcalculation is 1:51 mB=f :u: in good agreement with theexperimental value of 1:3 mB obtained by neutrondiffraction [72]. Our calculations also correctly providethe C-AF phase as the magnetic ground state forLaVO3; while the A-, G-AF, F, and P phases are 20, 87,25, and 310 meV=f :u: higher in energy, respectively.LaVO3 is an insulator with an semiconducting gap [74]of about 0:2 eV and an optical gap of 1:1 eV [55]. Eventhough our calculations give the correct magneticground state and magnetic moment at the V site, itfailed to reproduce the experimentally establishedinsulating behavior of LaVO3: From the Fig. 7 it isclear that LaVO3 is a metal with a finite DOS of39:98 states=Ry=f :u: at the EF: Also for LaTiO3
the GGCRFLMTO calculations failed to reproducethe insulating behavior. So, we conclude that theGGCRFLMTO approach is not sufficient to study theground-state properties of Mott insulators althoughit is quite successful in predicting insulating behaviorfor other such materials. It was understood manyyears ago that this problem is connected with theinadequate description of many-body effects in DFTcalculations of excitation spectra. In order to overcomethis failure, there are several remedies such as Coulomb-correlation-corrected DFT (LDA þ U approach) [46],GW approximation (GWA) [67], self-interaction cor-rected DFT ðLDA þ SICÞ [75], time-dependent DFT[76], dynamical mean-field theory ðLDA þ DMFTÞ[77] etc.
2.5. Magnetic phase-diagram studies in ruthenates
Ever since unconventional superconductivity wasobserved in Sr2RuO4 [78], ruthenates have attractedmuch interest. Poorly metallic non-Fermi liquid-behav-ing SrRuO3 is the only known F ðTC ¼ 160 KÞ 4d
transition-metal oxide [79,80]. CaRuO3 is also metallic,but experimental and theoretical studies concludecontradictory regarding the nature of the magneticground state [e.g., AF [79,81,82], nearly F [83], exchange
ARTICLE IN PRESSP. Ravindran et al. / Journal of Solid State Chemistry 176 (2003) 338–374 349
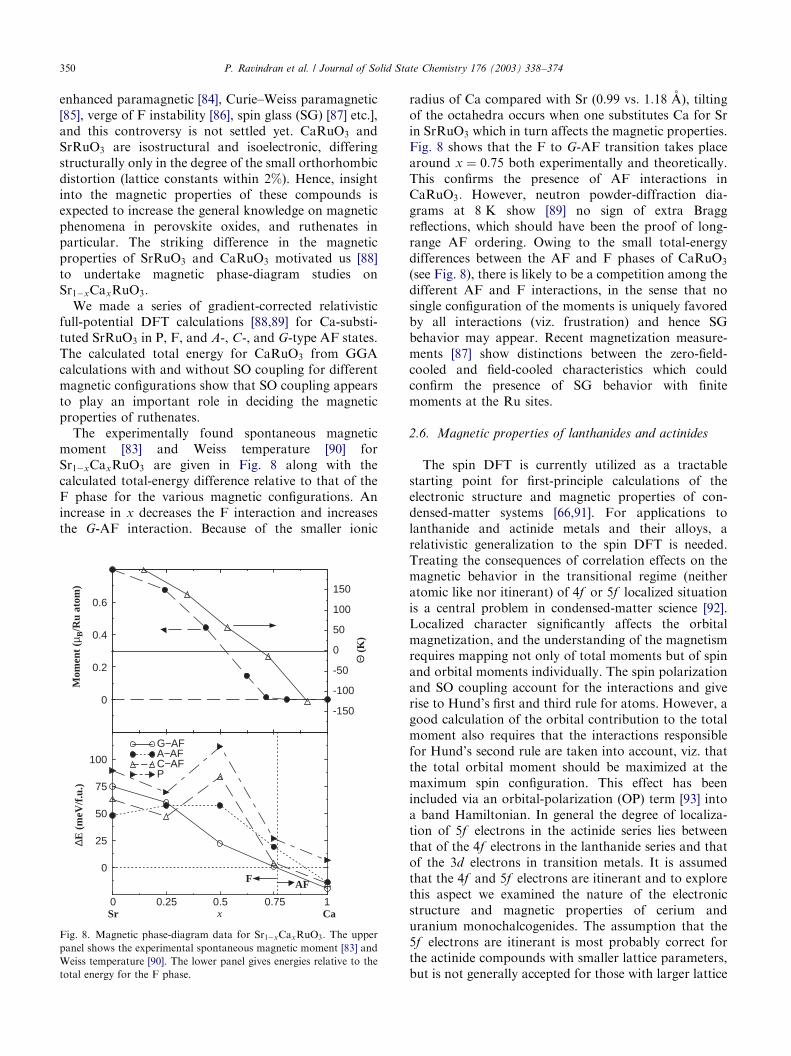
enhanced paramagnetic [84], Curie–Weiss paramagnetic[85], verge of F instability [86], spin glass (SG) [87] etc.],and this controversy is not settled yet. CaRuO3 andSrRuO3 are isostructural and isoelectronic, differingstructurally only in the degree of the small orthorhombicdistortion (lattice constants within 2%). Hence, insightinto the magnetic properties of these compounds isexpected to increase the general knowledge on magneticphenomena in perovskite oxides, and ruthenates inparticular. The striking difference in the magneticproperties of SrRuO3 and CaRuO3 motivated us [88]to undertake magnetic phase-diagram studies onSr1�xCaxRuO3:
We made a series of gradient-corrected relativisticfull-potential DFT calculations [88,89] for Ca-substi-tuted SrRuO3 in P, F, and A-, C-, and G-type AF states.The calculated total energy for CaRuO3 from GGAcalculations with and without SO coupling for differentmagnetic configurations show that SO coupling appearsto play an important role in deciding the magneticproperties of ruthenates.
The experimentally found spontaneous magneticmoment [83] and Weiss temperature [90] forSr1�xCaxRuO3 are given in Fig. 8 along with thecalculated total-energy difference relative to that of theF phase for the various magnetic configurations. Anincrease in x decreases the F interaction and increasesthe G-AF interaction. Because of the smaller ionic
radius of Ca compared with Sr (0.99 vs. 1:18 A), tiltingof the octahedra occurs when one substitutes Ca for Srin SrRuO3 which in turn affects the magnetic properties.Fig. 8 shows that the F to G-AF transition takes placearound x ¼ 0:75 both experimentally and theoretically.This confirms the presence of AF interactions inCaRuO3: However, neutron powder-diffraction dia-grams at 8 K show [89] no sign of extra Braggreflections, which should have been the proof of long-range AF ordering. Owing to the small total-energydifferences between the AF and F phases of CaRuO3
(see Fig. 8), there is likely to be a competition among thedifferent AF and F interactions, in the sense that nosingle configuration of the moments is uniquely favoredby all interactions (viz. frustration) and hence SGbehavior may appear. Recent magnetization measure-ments [87] show distinctions between the zero-field-cooled and field-cooled characteristics which couldconfirm the presence of SG behavior with finitemoments at the Ru sites.
2.6. Magnetic properties of lanthanides and actinides
The spin DFT is currently utilized as a tractablestarting point for first-principle calculations of theelectronic structure and magnetic properties of con-densed-matter systems [66,91]. For applications tolanthanide and actinide metals and their alloys, arelativistic generalization to the spin DFT is needed.Treating the consequences of correlation effects on themagnetic behavior in the transitional regime (neitheratomic like nor itinerant) of 4f or 5f localized situationis a central problem in condensed-matter science [92].Localized character significantly affects the orbitalmagnetization, and the understanding of the magnetismrequires mapping not only of total moments but of spinand orbital moments individually. The spin polarizationand SO coupling account for the interactions and giverise to Hund’s first and third rule for atoms. However, agood calculation of the orbital contribution to the totalmoment also requires that the interactions responsiblefor Hund’s second rule are taken into account, viz. thatthe total orbital moment should be maximized at themaximum spin configuration. This effect has beenincluded via an orbital-polarization (OP) term [93] intoa band Hamiltonian. In general the degree of localiza-tion of 5f electrons in the actinide series lies betweenthat of the 4f electrons in the lanthanide series and thatof the 3d electrons in transition metals. It is assumedthat the 4f and 5f electrons are itinerant and to explorethis aspect we examined the nature of the electronicstructure and magnetic properties of cerium anduranium monochalcogenides. The assumption that the5f electrons are itinerant is most probably correct forthe actinide compounds with smaller lattice parameters,but is not generally accepted for those with larger lattice
ARTICLE IN PRESS
0 0.25 0.5 0.75 1
0
25
50
75
100
G−AFA−AFC−AFP
0
0.2
0.4
0.6
-150
-100
-50
0
50
100
150
Mom
ent
(µB
/Ru
atom
)
Θ (
K)
Sr Ca
F AF
x
∆E (
meV
/f.u
.)
Fig. 8. Magnetic phase-diagram data for Sr1�xCaxRuO3: The upper
panel shows the experimental spontaneous magnetic moment [83] and
Weiss temperature [90]. The lower panel gives energies relative to the
total energy for the F phase.
P. Ravindran et al. / Journal of Solid State Chemistry 176 (2003) 338–374350
parameters such as UTe. Considering the change fromUS to UTe and CeS to CeTe, one can vary the 5f –5f
and 4f –4f separation and hence the degree of localiza-tion. So, we studied the magnetic properties of uraniumand cerium chalcogenides with the spin DFT at differentlevels of approximations.
In order to account for the magnetic properties oflanthanide and actinide compounds one has to calculatethe orbital moments reliably. From analyses of experi-mental and theoretical magnetic anisotropy energy(MAE), Jansen [94] concluded that the energy func-tional together with the SO coupling must contain termswhich depend directly on the orbital moment. Based onvan Vleck and Racha’s vector model for atomic multi-plets an approximate energy expression for Hund’ssecond rule is derived [93,95,96]. The OP energy fora particular spin-quantization direction n was found tobe well approximated by
EnOP ¼ �1
2
Xs
BL2nz;s; ð2Þ
where B (for d states) is a Racah parameter [97] and Lz;s
is the z component of the orbital-angular momentum ofthe spin state s in the n direction. Just as the spinmoment can be written as the expectation value of sz onecan calculate the orbital moment. The orbital magneticmoment at the Nth site is given by the expression [98]
/LnzSN ¼ mB
ð2pÞ3O
Xi
Zdk/ikjLn
z jikSN ; ð3Þ
where i refers to a given occupied relativistic band state,the z projection of the orbital moment operator is Lz;
and O is the unit-cell volume. The expectation value/ikjLzjikSN is calculated over the Nth atomic site.
The physical meaning of OP is that states withdifferent angular momentum have different angularshape and hence different Coulombic interactions,which via Eq. (2) are included in the energy functional.Applying this energy expression to solids one finds thatit gives rise to energy shifts for single-particle states withdifferent magnetic quantum numbers. The OP term isincluded in the diagonal elements of the Hamiltonianmatrix. Thus at each atom site, OP is taken into accountby means of an eigenvalue shift, DVml
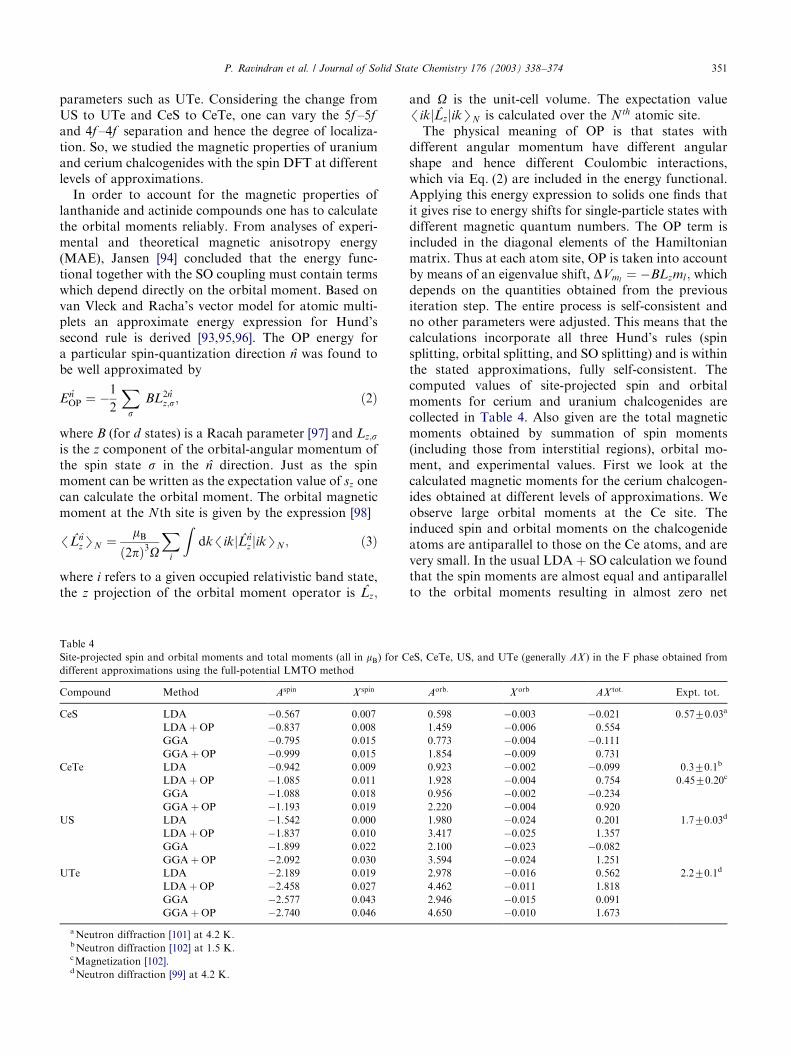
¼ �BLzml ; whichdepends on the quantities obtained from the previousiteration step. The entire process is self-consistent andno other parameters were adjusted. This means that thecalculations incorporate all three Hund’s rules (spinsplitting, orbital splitting, and SO splitting) and is withinthe stated approximations, fully self-consistent. Thecomputed values of site-projected spin and orbitalmoments for cerium and uranium chalcogenides arecollected in Table 4. Also given are the total magneticmoments obtained by summation of spin moments(including those from interstitial regions), orbital mo-ment, and experimental values. First we look at thecalculated magnetic moments for the cerium chalcogen-ides obtained at different levels of approximations. Weobserve large orbital moments at the Ce site. Theinduced spin and orbital moments on the chalcogenideatoms are antiparallel to those on the Ce atoms, and arevery small. In the usual LDA þ SO calculation we foundthat the spin moments are almost equal and antiparallelto the orbital moments resulting in almost zero net
ARTICLE IN PRESS
Table 4
Site-projected spin and orbital moments and total moments (all in mB) for CeS, CeTe, US, and UTe (generally AX ) in the F phase obtained from
different approximations using the full-potential LMTO method
Compound Method Aspin X spin Aorb: Xorb AX tot: Expt. tot.
CeS LDA �0:567 0.007 0.598 �0:003 �0.021 0:5770:03a
LDA þ OP �0:837 0.008 1.459 �0:006 0.554
GGA �0:795 0.015 0.773 �0:004 �0.111
GGA þ OP �0:999 0.015 1.854 �0:009 0.731
CeTe LDA �0:942 0.009 0.923 �0:002 �0.099 0:370:1b
LDA þ OP �1:085 0.011 1.928 �0:004 0.754 0:4570:20c
GGA �1:088 0.018 0.956 �0:002 �0.234
GGA þ OP �1:193 0.019 2.220 �0:004 0.920
US LDA �1:542 0.000 1.980 �0:024 0.201 1:770:03d
LDA þ OP �1:837 0.010 3.417 �0:025 1.357
GGA �1:899 0.022 2.100 �0:023 �0.082
GGA þ OP �2:092 0.030 3.594 �0:024 1.251
UTe LDA �2:189 0.019 2.978 �0:016 0.562 2:270:1d
LDA þ OP �2:458 0.027 4.462 �0:011 1.818
GGA �2:577 0.043 2.946 �0:015 0.091
GGA þ OP �2:740 0.046 4.650 �0:010 1.673
aNeutron diffraction [101] at 4:2 K:bNeutron diffraction [102] at 1:5 K:cMagnetization [102].dNeutron diffraction [99] at 4:2 K:
P. Ravindran et al. / Journal of Solid State Chemistry 176 (2003) 338–374 351
moments for both CeS and CeTe against the finitemoments experimentally established.
Now we try to understand the origin of theantiparallel alignment of spin and orbital moments inthese systems. Compounds of the light lanthanides(actinides) have less than half-filled 4f ð5f Þ band,therefore the induced orbital moments are antiparallelto the 4f ð5f Þ spin moments. The diffuse electron-spinmoment ‘‘spd’’, mostly from 5d states for the Cecompounds and 6d states for the U compounds, areobserved to be antiparallel to the total moment. Thisinference is obtained by comparing the observed relativemagnitudes of f -electron and total moments by neutronscattering and magnetization measurements [99,100].Only if the orbital component of the moment at thelanthanide (actinide) site is larger than, and antiparallelto, the spin component can theory and experiment beconsistent. In these cases the sign of the total momentis determined by the orbital component.
When we used the GGA we found that the spinmoment at the Ce site increases and hence we get smalltotal moments which are much smaller than theexperimentally observed values (see Table 4). However,when we include OP correction (LDA þ OP orGGA þ OP) the orbital moment increases to almostthe double, resulting in good agreement betweentheoretical and experimental total moments. So, thetotal moment in such systems are determined by theorbital contribution. For the uranium chalcogenidesalso we found a similar impact of the OP correction;such computational improvements are the conditionfor a correct account for the total moments. Frommagnetic Compton scattering experiments [103] theorbital moment from the 5f electrons of UTe is3:48 mB and comparable with the calculated value of4:38 mB according to LDA þ OP:
Next we look at the variation of the magnetic momenton changing the chalcogenide component. Comparedto S2� ð1:84 AÞ the size of Te2� ð2:21 AÞ [104] is largeand consequently the Ce–Ce (U–U) distance increasedfrom 4:094 A ð3:881 AÞ to 4:498 A ð4:357 AÞ: Hence,the narrowing of the bands due to localization ofthe electrons tends to increase the size of both the spinand orbital moment on going from sulfides to tellurides.The GGA appears to improve the total magneticmoments compared with those according to the LDAin the case of cerium chalcogenides owing to theenhancement in orbital moments. However, in uraniumchalcogenides such treatment worsens the calculatedtotal moments (LDA gave finite total momentswhereas those obtained from GGA were negligible).Hence, we are unable to see a consistent pattern in thecalculated magnetic moments for both lanthanides andactinides by the inclusion of the gradient corrections.More systematic studies are needed to arrive at a correctconclusion.
2.7. Magnetic anisotropy energy
Ferromagnetic materials exhibit intrinsic ‘‘easy’’ and‘‘hard’’ directions of magnetization. This magneticanisotropy is, both from technological and fundamentalpoints of view, among the most important properties ofmagnetic materials. Depending on the type of applica-tion, materials with high, medium, and low magneticanisotropy will be required, e.g., for permanent mag-nets, information storage media, magnetic cores intransformers, and magnetic recording heads. Manypotential applications of epitaxial ferromagnetic filmson semiconductor substrates require a perpendicularcomponent of the magnetization. Such a configurationwould permit perpendicular magnetic recording ormagneto-optical (MO) recording employing either theFaraday effect (in transmission) or the MO Kerr effect(MOKE; in reflection) to rotate the plane of polariza-tion of light propagating perpendicular to the substrate.Magnetic layers with strong perpendicular magneticanisotropy (PMA) are of great interest for MOrecording media with predicted performances of up to300 Gbit=inch2; in comparison with present commercialhard disks which have storage densities around2 Gbit=inch2 [105]. As the mechanisms responsible forPMA are so poorly understood, the search for newmaterials currently proceeds empirically. Hence, it isimportant to investigate the microscopic origin ofmagnetic anisotropy in detail in order to identifypotential candidates (see Ref. [106]).
Calculations based on a modified (needed to treat theMAE problem [107]) FPLMTO [108] method was used.Usually the calculated orbital moment for such systemsfrom relativistic calculations are lower than the experi-mental values. Hence, the OP term is included inthe diagonal elements of the Hamiltonian matrix. Thiscorrection has yielded larger orbital moments for Fe,Co, and Ni and thus a better agreement for thecalculated g factors for Fe and Co with experiment[95]. The energy involved in rotating the magnetizationfrom a direction of low energy toward one of highenergy is a measure for the magnetic anisotropy. Wedefine the magnetic anisotropy energy as the differencein total energy between the magnetization within theplane (i.e., n ¼ ½110 ) and along [001]. Hence, accordingto this definition positive MAE means that the easy axisis along c and the hard axis within the ab plane. TheMAE obtained from the relativistic full-potentialLMTO method with SO and with SO þ OP calculationsare given in Table 5 along with available experimentalvalues.
It should be noted that for all phases the easy axis iscorrectly predicted, both with and without OP, but onlyfair agreement between the experimental and theoreticalenergies is obtained from the SO calculations. The MAEis roughly doubled (except for NiPt) when OP is
ARTICLE IN PRESSP. Ravindran et al. / Journal of Solid State Chemistry 176 (2003) 338–374352
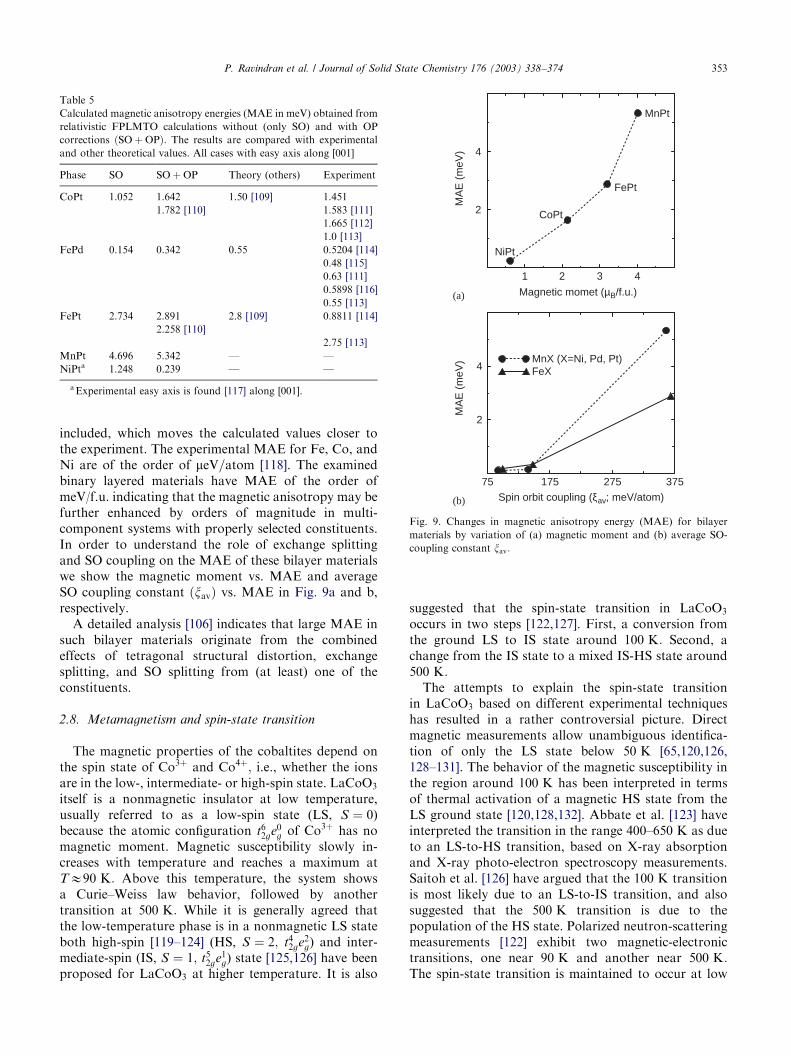
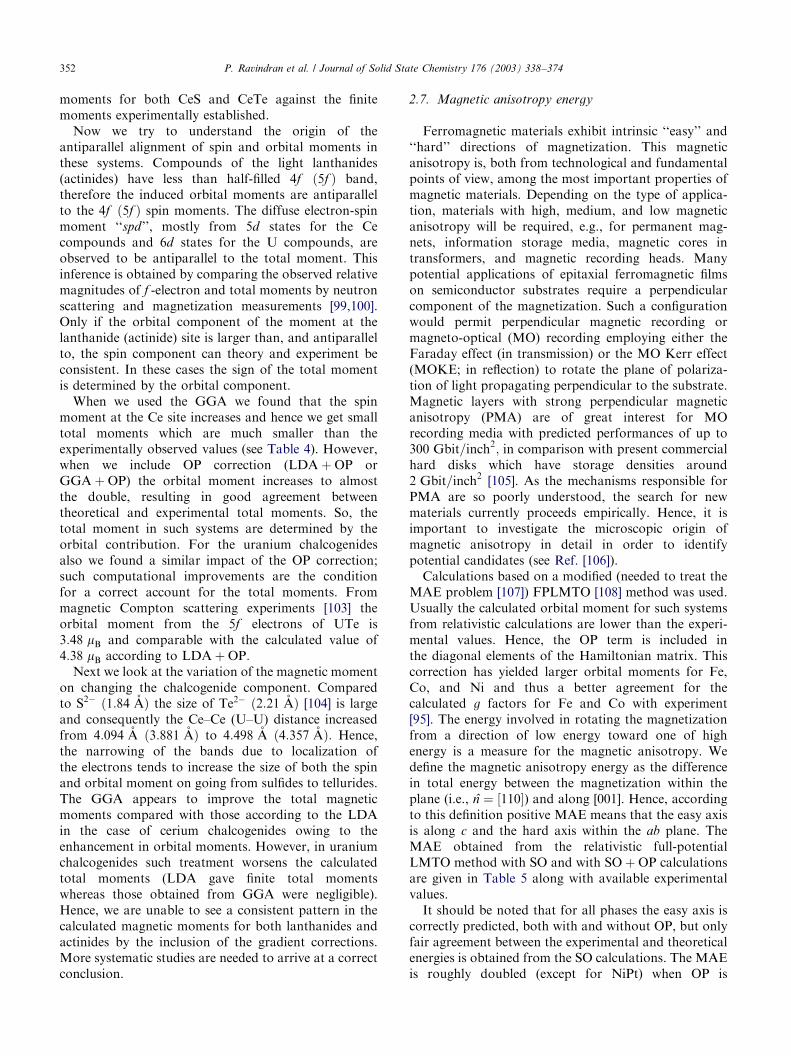
included, which moves the calculated values closer tothe experiment. The experimental MAE for Fe, Co, andNi are of the order of meV=atom [118]. The examinedbinary layered materials have MAE of the order ofmeV/f.u. indicating that the magnetic anisotropy may befurther enhanced by orders of magnitude in multi-component systems with properly selected constituents.In order to understand the role of exchange splittingand SO coupling on the MAE of these bilayer materialswe show the magnetic moment vs. MAE and averageSO coupling constant ðxavÞ vs. MAE in Fig. 9a and b,respectively.
A detailed analysis [106] indicates that large MAE insuch bilayer materials originate from the combinedeffects of tetragonal structural distortion, exchangesplitting, and SO splitting from (at least) one of theconstituents.
2.8. Metamagnetism and spin-state transition
The magnetic properties of the cobaltites depend onthe spin state of Co3þ and Co4þ; i.e., whether the ionsare in the low-, intermediate- or high-spin state. LaCoO3
itself is a nonmagnetic insulator at low temperature,usually referred to as a low-spin state (LS, S ¼ 0)because the atomic configuration t62ge0
g of Co3þ has nomagnetic moment. Magnetic susceptibility slowly in-creases with temperature and reaches a maximum atTE90 K: Above this temperature, the system showsa Curie–Weiss law behavior, followed by anothertransition at 500 K: While it is generally agreed thatthe low-temperature phase is in a nonmagnetic LS stateboth high-spin [119–124] (HS, S ¼ 2; t42ge2
g) and inter-mediate-spin (IS, S ¼ 1; t52ge1
g) state [125,126] have beenproposed for LaCoO3 at higher temperature. It is also
suggested that the spin-state transition in LaCoO3
occurs in two steps [122,127]. First, a conversion fromthe ground LS to IS state around 100 K: Second, achange from the IS state to a mixed IS-HS state around500 K:
The attempts to explain the spin-state transitionin LaCoO3 based on different experimental techniqueshas resulted in a rather controversial picture. Directmagnetic measurements allow unambiguous identifica-tion of only the LS state below 50 K [65,120,126,128–131]. The behavior of the magnetic susceptibility inthe region around 100 K has been interpreted in termsof thermal activation of a magnetic HS state from theLS ground state [120,128,132]. Abbate et al. [123] haveinterpreted the transition in the range 400–650 K as dueto an LS-to-HS transition, based on X-ray absorptionand X-ray photo-electron spectroscopy measurements.Saitoh et al. [126] have argued that the 100 K transitionis most likely due to an LS-to-IS transition, and alsosuggested that the 500 K transition is due to thepopulation of the HS state. Polarized neutron-scatteringmeasurements [122] exhibit two magnetic-electronictransitions, one near 90 K and another near 500 K:The spin-state transition is maintained to occur at low
ARTICLE IN PRESS
1 2 3 4
2
4
75 175 275 375
2
4MnX (X=Ni, Pd, Pt)FeX
Magnetic momet (µB/f.u.)
MA
E (
meV
)
NiPt
CoPt
FePt
MnPt
MA
E (
meV
)
(a)
(b) Spin orbit coupling (ξav; meV/atom)
Fig. 9. Changes in magnetic anisotropy energy (MAE) for bilayer
materials by variation of (a) magnetic moment and (b) average SO-
coupling constant xav:
Table 5
Calculated magnetic anisotropy energies (MAE in meV) obtained from
relativistic FPLMTO calculations without (only SO) and with OP
corrections ðSO þ OPÞ: The results are compared with experimental
and other theoretical values. All cases with easy axis along [001]
Phase SO SO þ OP Theory (others) Experiment
CoPt 1.052 1.642 1.50 [109] 1.451
1.782 [110] 1.583 [111]
1.665 [112]
1.0 [113]
FePd 0.154 0.342 0.55 0.5204 [114]
0.48 [115]
0.63 [111]
0.5898 [116]
0.55 [113]
FePt 2.734 2.891 2.8 [109] 0.8811 [114]
2.258 [110]
2.75 [113]
MnPt 4.696 5.342 — —
NiPta 1.248 0.239 — —
aExperimental easy axis is found [117] along [001].
P. Ravindran et al. / Journal of Solid State Chemistry 176 (2003) 338–374 353
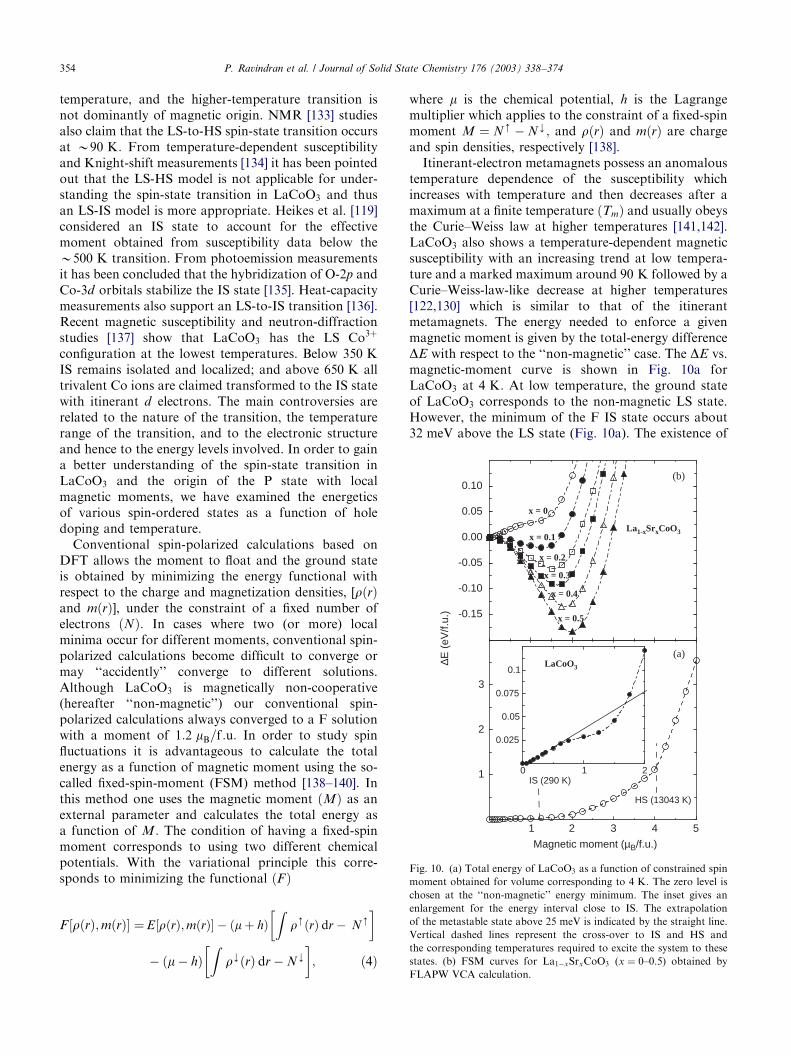
temperature, and the higher-temperature transition isnot dominantly of magnetic origin. NMR [133] studiesalso claim that the LS-to-HS spin-state transition occursat B90 K: From temperature-dependent susceptibilityand Knight-shift measurements [134] it has been pointedout that the LS-HS model is not applicable for under-standing the spin-state transition in LaCoO3 and thusan LS-IS model is more appropriate. Heikes et al. [119]considered an IS state to account for the effectivemoment obtained from susceptibility data below theB500 K transition. From photoemission measurementsit has been concluded that the hybridization of O-2p andCo-3d orbitals stabilize the IS state [135]. Heat-capacitymeasurements also support an LS-to-IS transition [136].Recent magnetic susceptibility and neutron-diffractionstudies [137] show that LaCoO3 has the LS Co3þ
configuration at the lowest temperatures. Below 350 KIS remains isolated and localized; and above 650 K alltrivalent Co ions are claimed transformed to the IS statewith itinerant d electrons. The main controversies arerelated to the nature of the transition, the temperaturerange of the transition, and to the electronic structureand hence to the energy levels involved. In order to gaina better understanding of the spin-state transition inLaCoO3 and the origin of the P state with localmagnetic moments, we have examined the energeticsof various spin-ordered states as a function of holedoping and temperature.
Conventional spin-polarized calculations based onDFT allows the moment to float and the ground stateis obtained by minimizing the energy functional withrespect to the charge and magnetization densities, [rðrÞand mðrÞ], under the constraint of a fixed number ofelectrons ðNÞ: In cases where two (or more) localminima occur for different moments, conventional spin-polarized calculations become difficult to converge ormay ‘‘accidently’’ converge to different solutions.Although LaCoO3 is magnetically non-cooperative(hereafter ‘‘non-magnetic’’) our conventional spin-polarized calculations always converged to a F solutionwith a moment of 1:2 mB=f :u: In order to study spinfluctuations it is advantageous to calculate the totalenergy as a function of magnetic moment using the so-called fixed-spin-moment (FSM) method [138–140]. Inthis method one uses the magnetic moment ðMÞ as anexternal parameter and calculates the total energy asa function of M: The condition of having a fixed-spinmoment corresponds to using two different chemicalpotentials. With the variational principle this corre-sponds to minimizing the functional ðFÞ
F ½rðrÞ;mðrÞ ¼E½rðrÞ;mðrÞ � ðmþ hÞZ
rmðrÞ dr � Nm
�
� ðm� hÞZ
rkðrÞ dr � Nk
� ; ð4Þ
where m is the chemical potential, h is the Lagrangemultiplier which applies to the constraint of a fixed-spinmoment M ¼ Nm � Nk; and rðrÞ and mðrÞ are chargeand spin densities, respectively [138].
Itinerant-electron metamagnets possess an anomaloustemperature dependence of the susceptibility whichincreases with temperature and then decreases after amaximum at a finite temperature ðTmÞ and usually obeysthe Curie–Weiss law at higher temperatures [141,142].LaCoO3 also shows a temperature-dependent magneticsusceptibility with an increasing trend at low tempera-ture and a marked maximum around 90 K followed by aCurie–Weiss-law-like decrease at higher temperatures[122,130] which is similar to that of the itinerantmetamagnets. The energy needed to enforce a givenmagnetic moment is given by the total-energy differenceDE with respect to the ‘‘non-magnetic’’ case. The DE vs.magnetic-moment curve is shown in Fig. 10a forLaCoO3 at 4 K: At low temperature, the ground stateof LaCoO3 corresponds to the non-magnetic LS state.However, the minimum of the F IS state occurs about32 meV above the LS state (Fig. 10a). The existence of
ARTICLE IN PRESS
1 2 3 4 5
Magnetic moment (µB/f.u.)
1
2
3
0 1 2
0.025
0.05
0.075
0.1
-0.15
-0.10
-0.05
0.00
0.05
0.10
IS (290 K)
HS (13043 K)
∆E (
eV/f.
u.)
(a)
x = 0
x = 0.1
x = 0.2
x = 0.3
x = 0.4
x = 0.5
LaCoO3
La1-xSrxCoO3
(b)
Fig. 10. (a) Total energy of LaCoO3 as a function of constrained spin
moment obtained for volume corresponding to 4 K: The zero level is
chosen at the ‘‘non-magnetic’’ energy minimum. The inset gives an
enlargement for the energy interval close to IS. The extrapolation
of the metastable state above 25 meV is indicated by the straight line.
Vertical dashed lines represent the cross-over to IS and HS and
the corresponding temperatures required to excite the system to these
states. (b) FSM curves for La1�xSrxCoO3 (x ¼ 0–0.5) obtained by
FLAPW VCA calculation.
P. Ravindran et al. / Journal of Solid State Chemistry 176 (2003) 338–374354
a F solution as a quasi-stable state implies that adiscontinuous transition in magnetization would bepossible by application of a magnetic field. The appliedexternal field shifts the up- and down-spin bands by asmall amount. As a consequence the system gainspotential energy owing to the reduced Coulomb inter-action, but at the same time loses energy owing to anincrease in the kinetic energy. The final inducedmagnetic moment will be given by the balance betweenthese two terms. However, in some systems there will,for a certain critical value of the applied field, occur asudden gain in potential energy which is not sufficientlycounterbalanced by the kinetic term. Hence, a meta-magnetic spin state develops [143].
A detailed examination of the energy vs. momentshows a flattened region in the vicinity of 1:2 mB (inset toFig. 10a) where the F state gets stabilized according tothe F spin-polarized calculations. So, it seems appro-priate to assign a moment of 1:2 mB to the IS state. TheDOSs for the IS and HS states show that non-bondingt2g electrons are present at EF in the minority-spin state.Consequently these states are at a energetically higherlevel than the LS state (Fig. 10a). The energy differencebetween the LS and HS states of Co3þ ions is reported[119] to be less than 80 meV and may even be as low as30 meV [65]. From magnetization measurements theenergy difference between the LS and HS states isreported to be 6–22 meV [121,144,145]. Asai et al. [131]estimated the energy of the IS and HS states at 0 K tobe 22.5 and 124:6 meV above LS, respectively. Thecalculated energy differences (see Fig. 10a) between theLS and IS states is 32 meV and that between LS andHS states 1113 meV: As the HS state is much higher inenergy than the LS and IS states, the possibility ofstabilizing the HS state by temperature and/or holedoping is not very favorable in a system likeLa1�xSrxCaO3: Hence, the present calculations ruleout the possibility of stabilizing mixed-spin states suchas LS-HS and IS-HS. Since Co3þ is a d6 case, LS wouldbe more stable than HS if the crystal-field splitting of the3d states into t2g and eg levels is larger than the intra-atomic exchange splitting (i.e., 10Dq42J). Conversely,if the exchange energy dominates, the result would be anHS state with S ¼ 2: Owing to the degenerate nature ofthe IS state with S ¼ 1; it is not possible to obtainstabilization within this framework. However, if hybri-dization with the oxygen band is taken into accountthe stability of an IS situation can be accounted for. InFig. 10a, nearly degeneracy of the LS and IS statesoccurs because the intra-atomic exchange splitting Dex ofthe S ¼ 1 state is close to the crystal-field splitting Dcf :
It has been reported [146–148] that the La1�xSrxCaO3
phase develops F long-range order above x ¼ 0:05 andthat the metal–insulator transition takes place at xE0:2:Optical measurements [149] show that the electronicstructure of the high-temperature metallic state of
LaCoO3 is very similar to that of the doping-inducedmetallic state. Hence, the FSM calculations on hole-doped LaCoO3 is expected to give a better under-standing about the nature of the temperature-inducedspin-state transition. From the FSM curve obtained as afunction of x (Fig. 10b), it is clear that the LS phase ofCo3þ is the most stable among the magnetic configura-tions for x ¼ 0; but the LS state is found to be unstablewith increasing values of x: The instability of the ‘‘non-magnetic’’ phase on hole doping is consistent with theexperimentally observed P behavior of the susceptibilityfor xX0:08 [122]. The total DOS for LaCoO3 in the LSstate shows [138] that EF is located in a deep valley, viz.being in a ‘‘non-magnetic’’ state. The hole doping shiftsEF to the peak on the lower energy side of DOS. Asa result the Stoner criterion for band ferromagnetismbecomes fulfilled and co-operative magnetism appears.The equilibrium spin moment for La1�xSrxCaO3 as afunction of x; calculated according to FSM-VCA isfound to be in excellent agreement with the experimentalfindings [150,151] as well as previous FPLMTO results[64]. This indicates that the FSM method is reliable togive correct predictions for equilibrium magnetic phases.The disappearence of the metamagnetic behavior andthe appearence of the F state on hole doping of LaCoO3
can be understood as follows. The reduction in thenumber of valence electrons by the Sr substitution shiftsEF to the lower energy side of VB toward the peakposition in the DOS. As a result, the Stoner criterionbecomes fulfilled and the metastable state becomesstabilized.
Calculations of the electronic structure for LaCoO3
with lattice parameters for 1248 K can imitate theinfluence of the temperature via thermal expansion. TheHS state (with 4 mB) lies much higher in energy thanLS and IS at low as well as high temperature indicatingthat it is less probable to stabilize the HS state bytemperature/hole doping. However, the FSM calcula-tions show that the IS state is always lower in energythan the HS state for hole-doped LaCoO3: So, theoryrules out the possibility of stabilizing HS or mixed spinstates by either temperature or hole doping. Hence, theLS-to-IS spin-state transition is the more probabletransition in LaCoO3: In confirmity with this view pointthe calculated X-ray emission spectrum (XES) forLaCoO3 in the LS and IS states are in good agreementwith the experimental spectra measured at 85 and300 K; respectively [152].
2.9. Spin, charge, and orbital ordering
in perovskite-like oxides
In reduced band-width systems, such as 3d transition-metal oxides, the close interplay between spin, charge,and orbital is quite important to understand manyunconventional physical properties and has been the
ARTICLE IN PRESSP. Ravindran et al. / Journal of Solid State Chemistry 176 (2003) 338–374 355
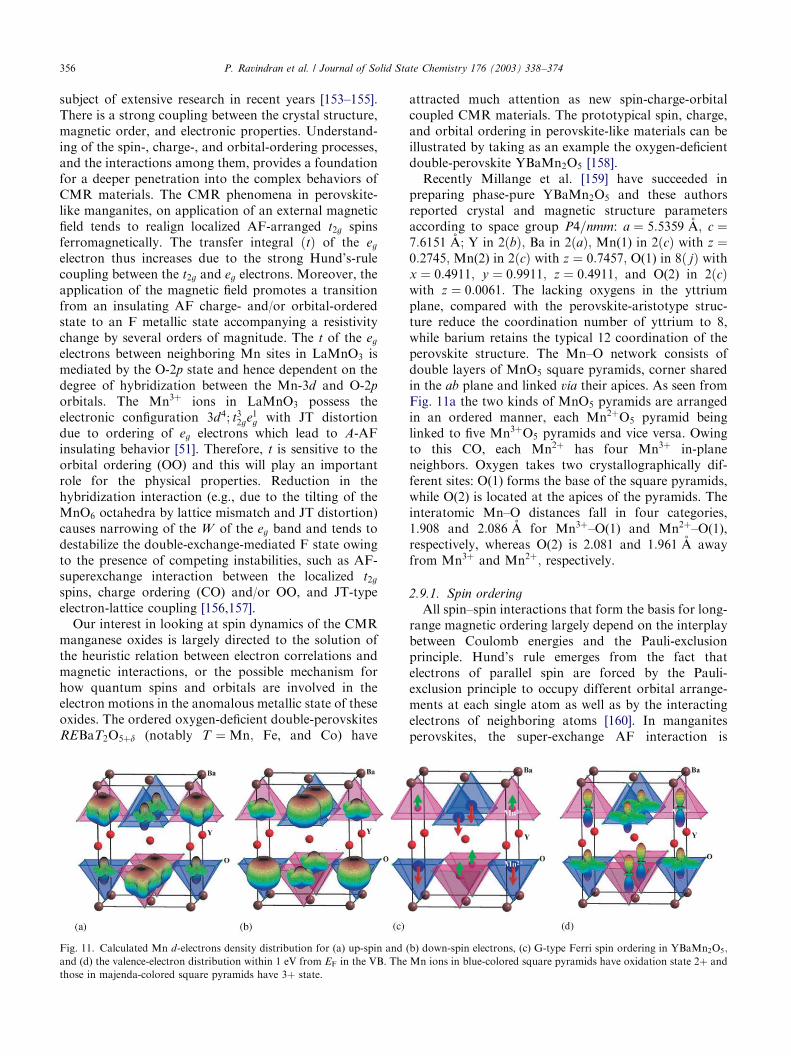
subject of extensive research in recent years [153–155].There is a strong coupling between the crystal structure,magnetic order, and electronic properties. Understand-ing of the spin-, charge-, and orbital-ordering processes,and the interactions among them, provides a foundationfor a deeper penetration into the complex behaviors ofCMR materials. The CMR phenomena in perovskite-like manganites, on application of an external magneticfield tends to realign localized AF-arranged t2g spinsferromagnetically. The transfer integral ðtÞ of the eg
electron thus increases due to the strong Hund’s-rulecoupling between the t2g and eg electrons. Moreover, theapplication of the magnetic field promotes a transitionfrom an insulating AF charge- and/or orbital-orderedstate to an F metallic state accompanying a resistivitychange by several orders of magnitude. The t of the eg
electrons between neighboring Mn sites in LaMnO3 ismediated by the O-2p state and hence dependent on thedegree of hybridization between the Mn-3d and O-2p
orbitals. The Mn3þ ions in LaMnO3 possess theelectronic configuration 3d4; t32ge1
g with JT distortiondue to ordering of eg electrons which lead to A-AFinsulating behavior [51]. Therefore, t is sensitive to theorbital ordering (OO) and this will play an importantrole for the physical properties. Reduction in thehybridization interaction (e.g., due to the tilting of theMnO6 octahedra by lattice mismatch and JT distortion)causes narrowing of the W of the eg band and tends todestabilize the double-exchange-mediated F state owingto the presence of competing instabilities, such as AF-superexchange interaction between the localized t2g
spins, charge ordering (CO) and/or OO, and JT-typeelectron-lattice coupling [156,157].
Our interest in looking at spin dynamics of the CMRmanganese oxides is largely directed to the solution ofthe heuristic relation between electron correlations andmagnetic interactions, or the possible mechanism forhow quantum spins and orbitals are involved in theelectron motions in the anomalous metallic state of theseoxides. The ordered oxygen-deficient double-perovskitesREBaT2O5þd (notably T ¼ Mn; Fe, and Co) have
attracted much attention as new spin-charge-orbitalcoupled CMR materials. The prototypical spin, charge,and orbital ordering in perovskite-like materials can beillustrated by taking as an example the oxygen-deficientdouble-perovskite YBaMn2O5 [158].
Recently Millange et al. [159] have succeeded inpreparing phase-pure YBaMn2O5 and these authorsreported crystal and magnetic structure parametersaccording to space group P4=nmm: a ¼ 5:5359 A; c ¼7:6151 A; Y in 2ðbÞ; Ba in 2ðaÞ; Mn(1) in 2ðcÞ with z ¼0:2745; Mn(2) in 2ðcÞ with z ¼ 0:7457; O(1) in 8ð jÞ withx ¼ 0:4911; y ¼ 0:9911; z ¼ 0:4911; and O(2) in 2ðcÞwith z ¼ 0:0061: The lacking oxygens in the yttriumplane, compared with the perovskite-aristotype struc-ture reduce the coordination number of yttrium to 8,while barium retains the typical 12 coordination of theperovskite structure. The Mn–O network consists ofdouble layers of MnO5 square pyramids, corner sharedin the ab plane and linked via their apices. As seen fromFig. 11a the two kinds of MnO5 pyramids are arrangedin an ordered manner, each Mn2þO5 pyramid beinglinked to five Mn3þO5 pyramids and vice versa. Owingto this CO, each Mn2þ has four Mn3þ in-planeneighbors. Oxygen takes two crystallographically dif-ferent sites: O(1) forms the base of the square pyramids,while O(2) is located at the apices of the pyramids. Theinteratomic Mn–O distances fall in four categories,1.908 and 2:086 A for Mn3þ–O(1) and Mn2þ–O(1),respectively, whereas O(2) is 2.081 and 1:961 A awayfrom Mn3þ and Mn2þ; respectively.
2.9.1. Spin ordering
All spin–spin interactions that form the basis for long-range magnetic ordering largely depend on the interplaybetween Coulomb energies and the Pauli-exclusionprinciple. Hund’s rule emerges from the fact thatelectrons of parallel spin are forced by the Pauli-exclusion principle to occupy different orbital arrange-ments at each single atom as well as by the interactingelectrons of neighboring atoms [160]. In manganitesperovskites, the super-exchange AF interaction is
ARTICLE IN PRESS
Fig. 11. Calculated Mn d-electrons density distribution for (a) up-spin and (b) down-spin electrons, (c) G-type Ferri spin ordering in YBaMn2O5;
and (d) the valence-electron distribution within 1 eV from EF in the VB. The Mn ions in blue-colored square pyramids have oxidation state 2þ and
those in majenda-colored square pyramids have 3þ state.
P. Ravindran et al. / Journal of Solid State Chemistry 176 (2003) 338–374356
involved through a virtual electron transfer betweenhalf-filled t2g orbitals which is constrained by the Pauli-exclusion principle to have a component of thetransferred electron-spin antiparallel to those of theacceptor atom (e.g., G-AF LaCrO3). On the other handthe double-exchange interaction involves a real electrontransfer from a filled eg orbital to an empty one and,thus, not constrained by the Pauli-exclusion principle(e.g., hole-doped F LaMnO3).
FPLMTO calculations performed on YBaMn2O5 forP, F, and AF configurations show that the AF state haslower energy than the P and F configurations. Further,the spins are not canceled in the AF configuration andhence this state is really ferrimagnetic (Ferri).YBaMn2O5 is seen to be an indirect-band-gap semi-conductor with a finite band gap of 0:88 eV: In theP and F cases finite DOS values are present in thevicinity of the EF thus showing metallic behavior;the insulating behavior appears only when we introduceFerri ordering in the calculations [158]. Unlike LaMnO3
(where the energy difference between the F and A-AFcases is B25 meV) [51] there is large energy differenceðB0:5 eVÞ between the Ferri and F states ofYBaMn2O5: So, a very large magnetic field is requiredto stabilize the F phase and induce an insulator-to-metaltransition in YBaMn2O5: The stabilization of a Ferriground state in YBaMn2O5 is consistent with theexperimentally established magnetic structure [159].The calculated magnetic moment at the Mn3þ site is3:07 mB and that at Mn2þ site is 3:91 mB indicating thatboth Mn ions are in HS states.
In LaMnO3 the spin ordering is found to be A-AFwith the spins of the electrons coupled F in the ab planeand AF along the c-axis [51] which may be rationalizedas follows. Due to the JT distortion of the MnO6
octahedra the half-filled dz2 orbitals in the ab planesorder to give long and short Mn–O bonds, while thedx2�y2 orbitals remain empty. Thus, within the ab plane,the superexchange is from a half-filled orbital on oneatom to an empty one on a neighboring Mn atomleading to F coupling according to Hund’s rule (viz. thetransferred electrons prefer to have a parallel orantiparallel spin arrangement with respect to thereceiving cation depending upon which state hasthe larger atomic spin). The superexchange betweenthe half-filled dz2 orbitals leads to AF coupling along c:
In YBaMn2O5; the Mn3þ–O(1)–Mn2þ angle is 157:8
along the basal plane and the Mn3þ–O(2)–Mn2þ angle is180 in the apical direction. The large difference betweenthese angles plays a key role in the magnetic properties.In YBaMn2O5 the real hopping of the dxy; dxz; and dyz
(t2g-like) electrons between Mn3þ and Mn2þ producesa superexchange AF coupling. The exchange interactionbetween Mn2þ and Mn3þ along c is AF owing to the180 bond angle which facilitates p–d s bonding with theO(2)–pz orbital and superexchange interaction [161].
With a bond angle of only 157 within the basal plane,the dðMnÞ–pðOÞ covalent bond is weak and moreoverdue to the HS state of Mn3þ in the square-pyramidalcrystal field, the dx2�y2 orbitals at the Mn3þ site is almostempty whereas those at Mn2þ ion is half filled (seeFig. 12). Hence, the AF superexchange interactionbetween Mn2þ and Mn3þ within the basal plane isweaker than that along c:
The calculated exchange-splitting energy for Mn3þ
and Mn2þ are 3.1 and 3:4 eV; respectively and thisdifference leads to incomplete cancellation of the spinson Mnð1Þ3þ and Mnð2Þ2þ despite the AF superexchangeinteraction between them, resulting in a Ferri state witha total magnetic moment of 0:85 mB=f :u: If oneconsiders the Goodenough–Kanamori [162] rules formagnetic interactions in manganese oxides, the expectedmagnetic order should be A-AF (viz. F ordering withinthe layers from the double-exchange interactions be-tween occupied dx2�y2 orbitals on Mn2þ and emptydx2�y2 on Mn3þ and AF ordering between the layersfrom the superexchange interaction between half-filleddz2 orbitals of Mn2þ and Mn3þ). However, owing tothe large deviation of the basal plane Mn–O–Mn bondangle from 180 along with the JT distortion for bothMn sites the dx2�y2 orbital is not completely empty onMn3þ (see Fig. 12) and consequently AF ordering isobserved between Mn within as well as betweenthe planes (see Fig. 11c). Thus, the competition betweenthe superexchange and double-exchange interactionsgives G-type Ferri ordering in YBaMn2O5 in accordancewith the experimental findings [159].
2.9.2. Charge ordering
At low temperatures, manganese perovskites arecharacterized by strong competition between charge-carrier itinerancy and localization. Mixed-valent per-ovskite-like manganites are typically considered to bedisordered with Mn3þ and Mn4þ ions randomlydistributed in the lattice. However, under certainchemical and temperature conditions, and especiallywhen Mn3þ and Mn4þ are present in equal amounts,these cations order coherently over long distances toform a CO lattice. Generally a transition to a CO AFstate is preceded by a transition from an AF or Pinsulator to an F metal state at higher temperatures.Moreover, the CO state can readily be melted to F stateby application of magnetic field [163], pressure[164] orexposure to X-ray photons [165].
Usually if the carrier-to-lattice coupling becomesstronger the tendency to CO becomes larger. The COdrastically influences the magnetic correlations inmanganites. In the double-exchange picture, localizedcarriers cannot induce the F coupling. Investigations onCO have established the intimate connection betweenlattice distortion and CO. It is the lattice distortionassociated with the OO that appears to initiate and
ARTICLE IN PRESSP. Ravindran et al. / Journal of Solid State Chemistry 176 (2003) 338–374 357
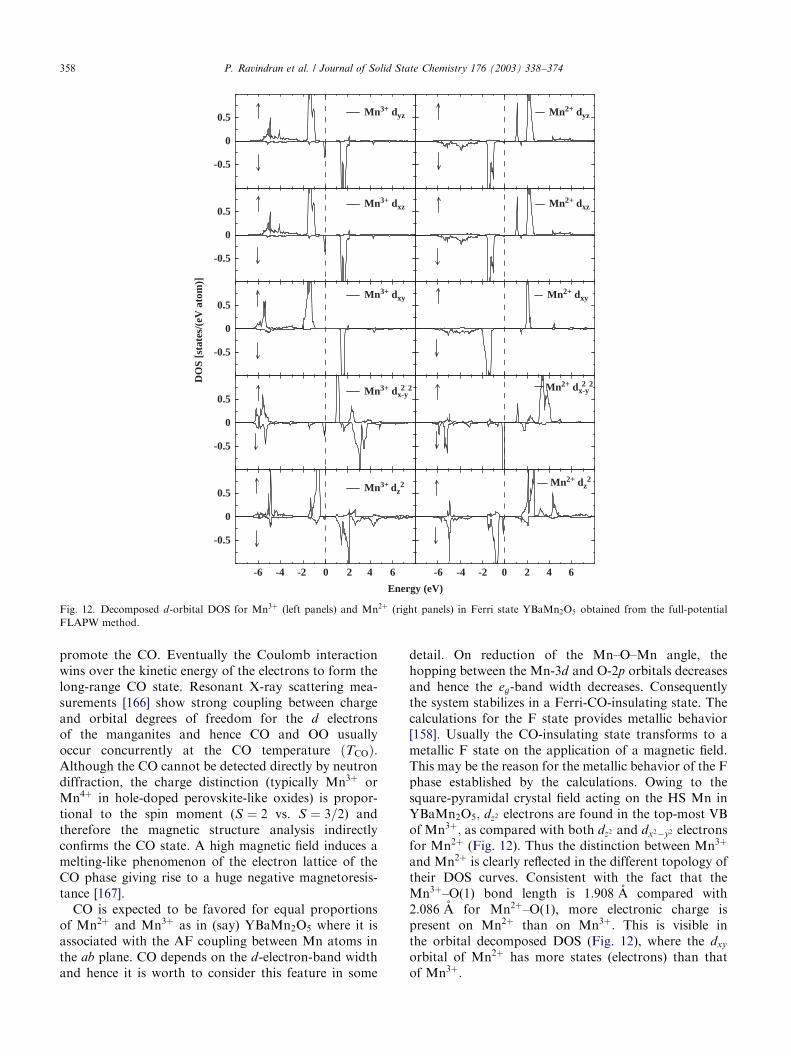
promote the CO. Eventually the Coulomb interactionwins over the kinetic energy of the electrons to form thelong-range CO state. Resonant X-ray scattering mea-surements [166] show strong coupling between chargeand orbital degrees of freedom for the d electronsof the manganites and hence CO and OO usuallyoccur concurrently at the CO temperature ðTCOÞ:Although the CO cannot be detected directly by neutrondiffraction, the charge distinction (typically Mn3þ orMn4þ in hole-doped perovskite-like oxides) is propor-tional to the spin moment (S ¼ 2 vs. S ¼ 3=2) andtherefore the magnetic structure analysis indirectlyconfirms the CO state. A high magnetic field induces amelting-like phenomenon of the electron lattice of theCO phase giving rise to a huge negative magnetoresis-tance [167].
CO is expected to be favored for equal proportionsof Mn2þ and Mn3þ as in (say) YBaMn2O5 where it isassociated with the AF coupling between Mn atoms inthe ab plane. CO depends on the d-electron-band widthand hence it is worth to consider this feature in some
detail. On reduction of the Mn–O–Mn angle, thehopping between the Mn-3d and O-2p orbitals decreasesand hence the eg-band width decreases. Consequentlythe system stabilizes in a Ferri-CO-insulating state. Thecalculations for the F state provides metallic behavior[158]. Usually the CO-insulating state transforms to ametallic F state on the application of a magnetic field.This may be the reason for the metallic behavior of the Fphase established by the calculations. Owing to thesquare-pyramidal crystal field acting on the HS Mn inYBaMn2O5; dz2 electrons are found in the top-most VBof Mn3þ; as compared with both dz2 and dx2�y2 electronsfor Mn2þ (Fig. 12). Thus the distinction between Mn3þ
and Mn2þ is clearly reflected in the different topology oftheir DOS curves. Consistent with the fact that theMn3þ–O(1) bond length is 1:908 A compared with2:086 A for Mn2þ–O(1), more electronic charge ispresent on Mn2þ than on Mn3þ: This is visible inthe orbital decomposed DOS (Fig. 12), where the dxy
orbital of Mn2þ has more states (electrons) than thatof Mn3þ:
ARTICLE IN PRESS
-0.5
0
0.5 Mn3+ dz2
-0.5
0
0.5Mn3+ dx-y
2
-0.5
0
0.5Mn3+ dxy
-0.5
0
0.5Mn3+ dxz
-0.5
0
0.5 Mn3+ dyz
Mn2+ dz2
Mn2+ dxy
Mn2+ dxz
Mn2+ dyz
Energy (eV)
DO
S [s
tate
s/(e
V a
tom
)]
6420-2-4-66420-2-4-6
2 Mn2+ dx-y22
Fig. 12. Decomposed d-orbital DOS for Mn3þ (left panels) and Mn2þ (right panels) in Ferri state YBaMn2O5 obtained from the full-potential
FLAPW method.
P. Ravindran et al. / Journal of Solid State Chemistry 176 (2003) 338–374358
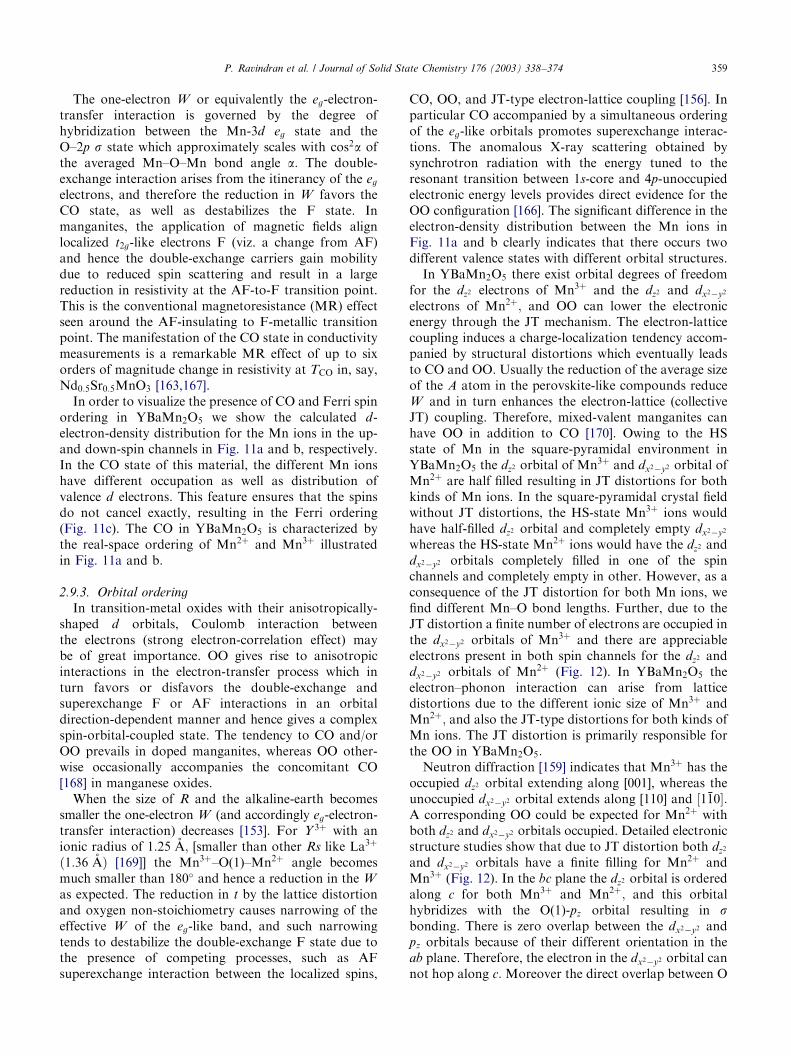
The one-electron W or equivalently the eg-electron-transfer interaction is governed by the degree ofhybridization between the Mn-3d eg state and theO–2p s state which approximately scales with cos2a ofthe averaged Mn–O–Mn bond angle a: The double-exchange interaction arises from the itinerancy of the eg
electrons, and therefore the reduction in W favors theCO state, as well as destabilizes the F state. Inmanganites, the application of magnetic fields alignlocalized t2g-like electrons F (viz. a change from AF)and hence the double-exchange carriers gain mobilitydue to reduced spin scattering and result in a largereduction in resistivity at the AF-to-F transition point.This is the conventional magnetoresistance (MR) effectseen around the AF-insulating to F-metallic transitionpoint. The manifestation of the CO state in conductivitymeasurements is a remarkable MR effect of up to sixorders of magnitude change in resistivity at TCO in, say,Nd0:5Sr0:5MnO3 [163,167].
In order to visualize the presence of CO and Ferri spinordering in YBaMn2O5 we show the calculated d-electron-density distribution for the Mn ions in the up-and down-spin channels in Fig. 11a and b, respectively.In the CO state of this material, the different Mn ionshave different occupation as well as distribution ofvalence d electrons. This feature ensures that the spinsdo not cancel exactly, resulting in the Ferri ordering(Fig. 11c). The CO in YBaMn2O5 is characterized bythe real-space ordering of Mn2þ and Mn3þ illustratedin Fig. 11a and b.
2.9.3. Orbital ordering
In transition-metal oxides with their anisotropically-shaped d orbitals, Coulomb interaction betweenthe electrons (strong electron-correlation effect) maybe of great importance. OO gives rise to anisotropicinteractions in the electron-transfer process which inturn favors or disfavors the double-exchange andsuperexchange F or AF interactions in an orbitaldirection-dependent manner and hence gives a complexspin-orbital-coupled state. The tendency to CO and/orOO prevails in doped manganites, whereas OO other-wise occasionally accompanies the concomitant CO[168] in manganese oxides.
When the size of R and the alkaline-earth becomessmaller the one-electron W (and accordingly eg-electron-transfer interaction) decreases [153]. For Y 3þ with anionic radius of 1:25 A; [smaller than other Rs like La3þ
ð1:36 AÞ [169]] the Mn3þ–O(1)–Mn2þ angle becomesmuch smaller than 180 and hence a reduction in the W
as expected. The reduction in t by the lattice distortionand oxygen non-stoichiometry causes narrowing of theeffective W of the eg-like band, and such narrowingtends to destabilize the double-exchange F state due tothe presence of competing processes, such as AFsuperexchange interaction between the localized spins,
CO, OO, and JT-type electron-lattice coupling [156]. Inparticular CO accompanied by a simultaneous orderingof the eg-like orbitals promotes superexchange interac-tions. The anomalous X-ray scattering obtained bysynchrotron radiation with the energy tuned to theresonant transition between 1s-core and 4p-unoccupiedelectronic energy levels provides direct evidence for theOO configuration [166]. The significant difference in theelectron-density distribution between the Mn ions inFig. 11a and b clearly indicates that there occurs twodifferent valence states with different orbital structures.
In YBaMn2O5 there exist orbital degrees of freedomfor the dz2 electrons of Mn3þ and the dz2 and dx2�y2
electrons of Mn2þ; and OO can lower the electronicenergy through the JT mechanism. The electron-latticecoupling induces a charge-localization tendency accom-panied by structural distortions which eventually leadsto CO and OO. Usually the reduction of the average sizeof the A atom in the perovskite-like compounds reduceW and in turn enhances the electron-lattice (collectiveJT) coupling. Therefore, mixed-valent manganites canhave OO in addition to CO [170]. Owing to the HSstate of Mn in the square-pyramidal environment inYBaMn2O5 the dz2 orbital of Mn3þ and dx2�y2 orbital ofMn2þ are half filled resulting in JT distortions for bothkinds of Mn ions. In the square-pyramidal crystal fieldwithout JT distortions, the HS-state Mn3þ ions wouldhave half-filled dz2 orbital and completely empty dx2�y2
whereas the HS-state Mn2þ ions would have the dz2 anddx2�y2 orbitals completely filled in one of the spinchannels and completely empty in other. However, as aconsequence of the JT distortion for both Mn ions, wefind different Mn–O bond lengths. Further, due to theJT distortion a finite number of electrons are occupied inthe dx2�y2 orbitals of Mn3þ and there are appreciableelectrons present in both spin channels for the dz2 anddx2�y2 orbitals of Mn2þ (Fig. 12). In YBaMn2O5 theelectron–phonon interaction can arise from latticedistortions due to the different ionic size of Mn3þ andMn2þ; and also the JT-type distortions for both kinds ofMn ions. The JT distortion is primarily responsible forthe OO in YBaMn2O5:
Neutron diffraction [159] indicates that Mn3þ has theoccupied dz2 orbital extending along [001], whereas theunoccupied dx2�y2 orbital extends along [110] and ½1%10 :A corresponding OO could be expected for Mn2þ withboth dz2 and dx2�y2 orbitals occupied. Detailed electronicstructure studies show that due to JT distortion both dz2
and dx2�y2 orbitals have a finite filling for Mn2þ andMn3þ (Fig. 12). In the bc plane the dz2 orbital is orderedalong c for both Mn3þ and Mn2þ; and this orbitalhybridizes with the O(1)-pz orbital resulting in sbonding. There is zero overlap between the dx2�y2 andpz orbitals because of their different orientation in theab plane. Therefore, the electron in the dx2�y2 orbital cannot hop along c: Moreover the direct overlap between O
ARTICLE IN PRESSP. Ravindran et al. / Journal of Solid State Chemistry 176 (2003) 338–374 359
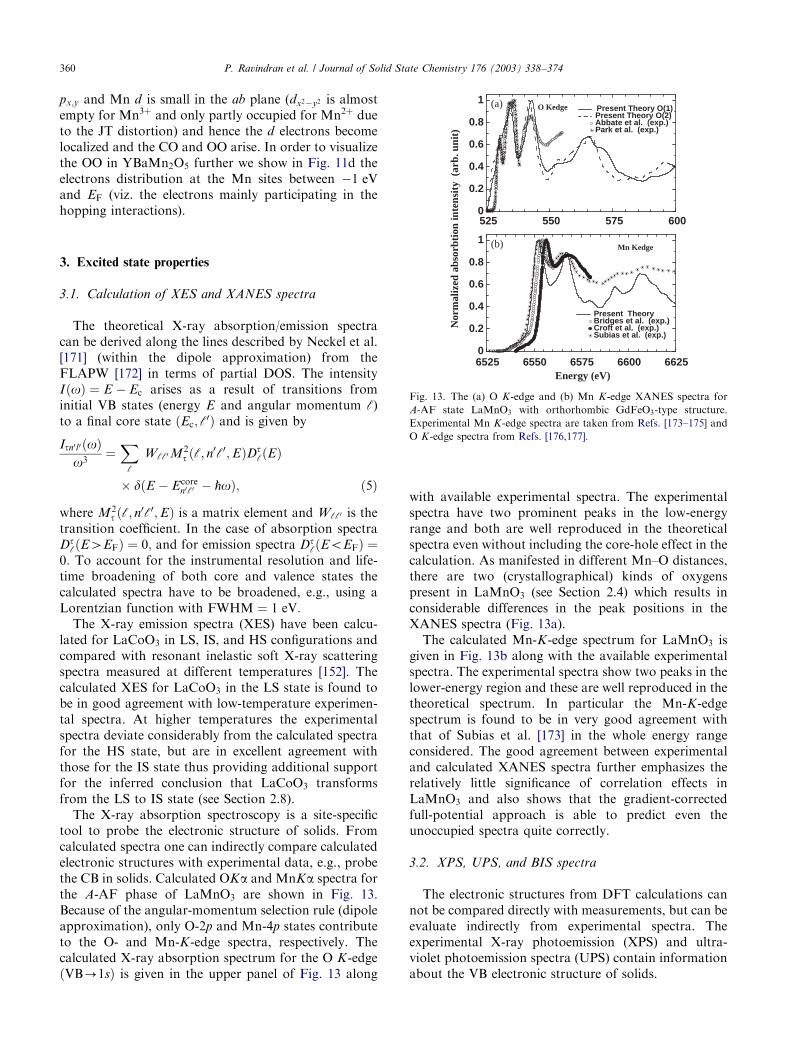
px;y and Mn d is small in the ab plane (dx2�y2 is almostempty for Mn3þ and only partly occupied for Mn2þ dueto the JT distortion) and hence the d electrons becomelocalized and the CO and OO arise. In order to visualizethe OO in YBaMn2O5 further we show in Fig. 11d theelectrons distribution at the Mn sites between �1 eVand EF (viz. the electrons mainly participating in thehopping interactions).
3. Excited state properties
3.1. Calculation of XES and XANES spectra
The theoretical X-ray absorption/emission spectracan be derived along the lines described by Neckel et al.[171] (within the dipole approximation) from theFLAPW [172] in terms of partial DOS. The intensityIðoÞ ¼ E � Ec arises as a result of transitions frominitial VB states (energy E and angular momentum c)to a final core state ðEc; c0Þ and is given by
Itn0l0 ðoÞo3
¼Xc
Wcc0M2t ðc; n0c0;EÞDt
cðEÞ
� dðE � Ecoren0c0 � _oÞ; ð5Þ
where M2t ðc; n0c0;EÞ is a matrix element and Wcc0 is the
transition coefficient. In the case of absorption spectraDt
cðE4EFÞ ¼ 0; and for emission spectra DtcðEoEFÞ ¼
0: To account for the instrumental resolution and life-time broadening of both core and valence states thecalculated spectra have to be broadened, e.g., using aLorentzian function with FWHM ¼ 1 eV:
The X-ray emission spectra (XES) have been calcu-lated for LaCoO3 in LS, IS, and HS configurations andcompared with resonant inelastic soft X-ray scatteringspectra measured at different temperatures [152]. Thecalculated XES for LaCoO3 in the LS state is found tobe in good agreement with low-temperature experimen-tal spectra. At higher temperatures the experimentalspectra deviate considerably from the calculated spectrafor the HS state, but are in excellent agreement withthose for the IS state thus providing additional supportfor the inferred conclusion that LaCoO3 transformsfrom the LS to IS state (see Section 2.8).
The X-ray absorption spectroscopy is a site-specifictool to probe the electronic structure of solids. Fromcalculated spectra one can indirectly compare calculatedelectronic structures with experimental data, e.g., probethe CB in solids. Calculated OKa and MnKa spectra forthe A-AF phase of LaMnO3 are shown in Fig. 13.Because of the angular-momentum selection rule (dipoleapproximation), only O-2p and Mn-4p states contributeto the O- and Mn-K-edge spectra, respectively. Thecalculated X-ray absorption spectrum for the O K-edgeðVB-1sÞ is given in the upper panel of Fig. 13 along
with available experimental spectra. The experimentalspectra have two prominent peaks in the low-energyrange and both are well reproduced in the theoreticalspectra even without including the core-hole effect in thecalculation. As manifested in different Mn–O distances,there are two (crystallographical) kinds of oxygenspresent in LaMnO3 (see Section 2.4) which results inconsiderable differences in the peak positions in theXANES spectra (Fig. 13a).
The calculated Mn-K-edge spectrum for LaMnO3 isgiven in Fig. 13b along with the available experimentalspectra. The experimental spectra show two peaks in thelower-energy region and these are well reproduced in thetheoretical spectrum. In particular the Mn-K-edgespectrum is found to be in very good agreement withthat of Subias et al. [173] in the whole energy rangeconsidered. The good agreement between experimentaland calculated XANES spectra further emphasizes therelatively little significance of correlation effects inLaMnO3 and also shows that the gradient-correctedfull-potential approach is able to predict even theunoccupied spectra quite correctly.
3.2. XPS, UPS, and BIS spectra
The electronic structures from DFT calculations cannot be compared directly with measurements, but can beevaluate indirectly from experimental spectra. Theexperimental X-ray photoemission (XPS) and ultra-violet photoemission spectra (UPS) contain informationabout the VB electronic structure of solids.
ARTICLE IN PRESS
6525 6550 6575 6600 66250
0.2
0.4
0.6
0.8
1
Present TheoryBridges et al. (exp.)Croft et al. (exp.)Subias et al. (exp.)
525 550 575 6000
0.2
0.4
0.6
0.8
1Present Theory O(1)Present Theory O(2)Abbate et al. (exp.)Park et al. (exp.)
Mn Kedge
O Kedge
Energy (eV)
Nor
mal
ized
abs
orbt
ion
inte
nsit
y (
arb.
uni
t)
(b)
(a)
Fig. 13. The (a) O K-edge and (b) Mn K-edge XANES spectra for
A-AF state LaMnO3 with orthorhombic GdFeO3-type structure.
Experimental Mn K-edge spectra are taken from Refs. [173–175] and
O K-edge spectra from Refs. [176,177].
P. Ravindran et al. / Journal of Solid State Chemistry 176 (2003) 338–374360
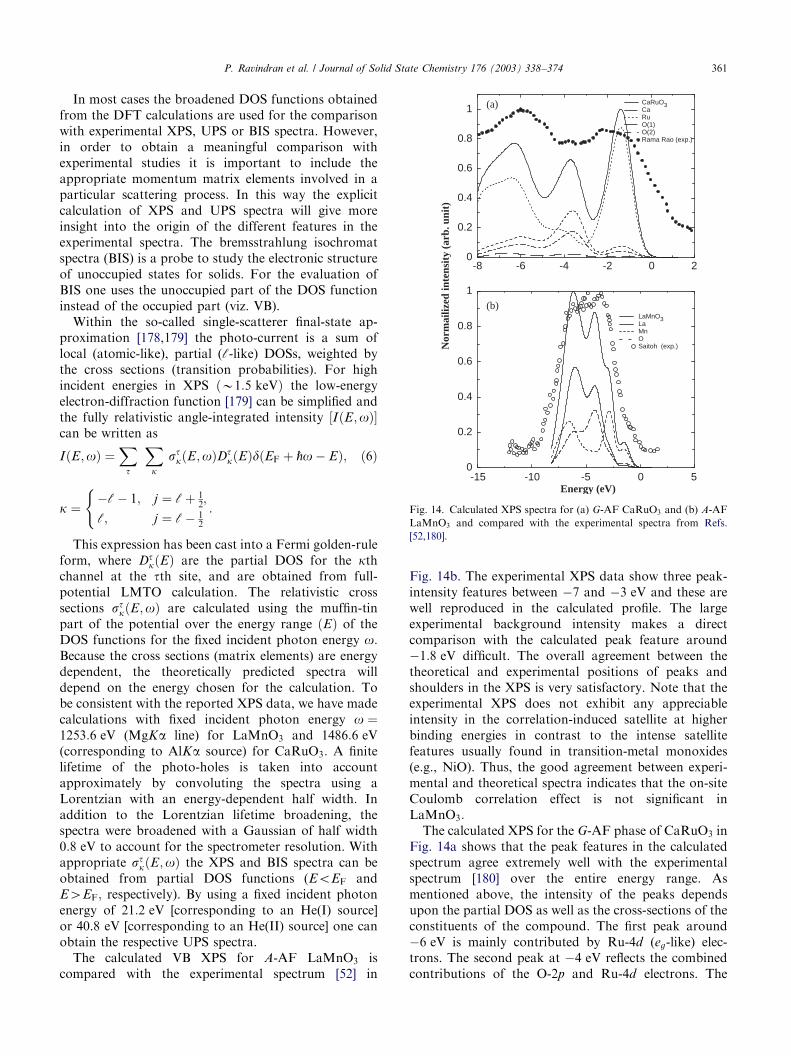
In most cases the broadened DOS functions obtainedfrom the DFT calculations are used for the comparisonwith experimental XPS, UPS or BIS spectra. However,in order to obtain a meaningful comparison withexperimental studies it is important to include theappropriate momentum matrix elements involved in aparticular scattering process. In this way the explicitcalculation of XPS and UPS spectra will give moreinsight into the origin of the different features in theexperimental spectra. The bremsstrahlung isochromatspectra (BIS) is a probe to study the electronic structureof unoccupied states for solids. For the evaluation ofBIS one uses the unoccupied part of the DOS functioninstead of the occupied part (viz. VB).
Within the so-called single-scatterer final-state ap-proximation [178,179] the photo-current is a sum oflocal (atomic-like), partial (c-like) DOSs, weighted bythe cross sections (transition probabilities). For highincident energies in XPS ðB1:5 keVÞ the low-energyelectron-diffraction function [179] can be simplified andthe fully relativistic angle-integrated intensity ½IðE;oÞ can be written as
IðE;oÞ ¼Xt
Xk
stkðE;oÞDtkðEÞdðEF þ _o� EÞ; ð6Þ
k ¼�c� 1; j ¼ cþ 1
2;
c; j ¼ c� 12
(:
This expression has been cast into a Fermi golden-ruleform, where Dt
kðEÞ are the partial DOS for the kthchannel at the tth site, and are obtained from full-potential LMTO calculation. The relativistic crosssections stkðE;oÞ are calculated using the muffin-tinpart of the potential over the energy range ðEÞ of theDOS functions for the fixed incident photon energy o:Because the cross sections (matrix elements) are energydependent, the theoretically predicted spectra willdepend on the energy chosen for the calculation. Tobe consistent with the reported XPS data, we have madecalculations with fixed incident photon energy o ¼1253:6 eV (MgKa line) for LaMnO3 and 1486:6 eV(corresponding to AlKa source) for CaRuO3: A finitelifetime of the photo-holes is taken into accountapproximately by convoluting the spectra using aLorentzian with an energy-dependent half width. Inaddition to the Lorentzian lifetime broadening, thespectra were broadened with a Gaussian of half width0:8 eV to account for the spectrometer resolution. Withappropriate stkðE;oÞ the XPS and BIS spectra can beobtained from partial DOS functions (EoEF andE4EF; respectively). By using a fixed incident photonenergy of 21:2 eV [corresponding to an He(I) source]or 40.8 eV [corresponding to an He(II) source] one canobtain the respective UPS spectra.
The calculated VB XPS for A-AF LaMnO3 iscompared with the experimental spectrum [52] in
Fig. 14b. The experimental XPS data show three peak-intensity features between �7 and �3 eV and these arewell reproduced in the calculated profile. The largeexperimental background intensity makes a directcomparison with the calculated peak feature around�1:8 eV difficult. The overall agreement between thetheoretical and experimental positions of peaks andshoulders in the XPS is very satisfactory. Note that theexperimental XPS does not exhibit any appreciableintensity in the correlation-induced satellite at higherbinding energies in contrast to the intense satellitefeatures usually found in transition-metal monoxides(e.g., NiO). Thus, the good agreement between experi-mental and theoretical spectra indicates that the on-siteCoulomb correlation effect is not significant inLaMnO3:
The calculated XPS for the G-AF phase of CaRuO3 inFig. 14a shows that the peak features in the calculatedspectrum agree extremely well with the experimentalspectrum [180] over the entire energy range. Asmentioned above, the intensity of the peaks dependsupon the partial DOS as well as the cross-sections of theconstituents of the compound. The first peak around�6 eV is mainly contributed by Ru-4d (eg-like) elec-trons. The second peak at �4 eV reflects the combinedcontributions of the O-2p and Ru-4d electrons. The
ARTICLE IN PRESS
-15 -10 -5 0 50
0.2
0.4
0.6
0.8
1
LaMnO3LaMnOSaitoh (exp.)
-8 -6 -4 -2 0 20
0.2
0.4
0.6
0.8
1CaRuO3CaRuO(1)O(2)Rama Rao (exp.)
Energy (eV)
Nor
mai
lized
inte
nsit
y (a
rb. u
nit)
(b)
(a)
Fig. 14. Calculated XPS spectra for (a) G-AF CaRuO3 and (b) A-AF
LaMnO3 and compared with the experimental spectra from Refs.
[52,180].
P. Ravindran et al. / Journal of Solid State Chemistry 176 (2003) 338–374 361
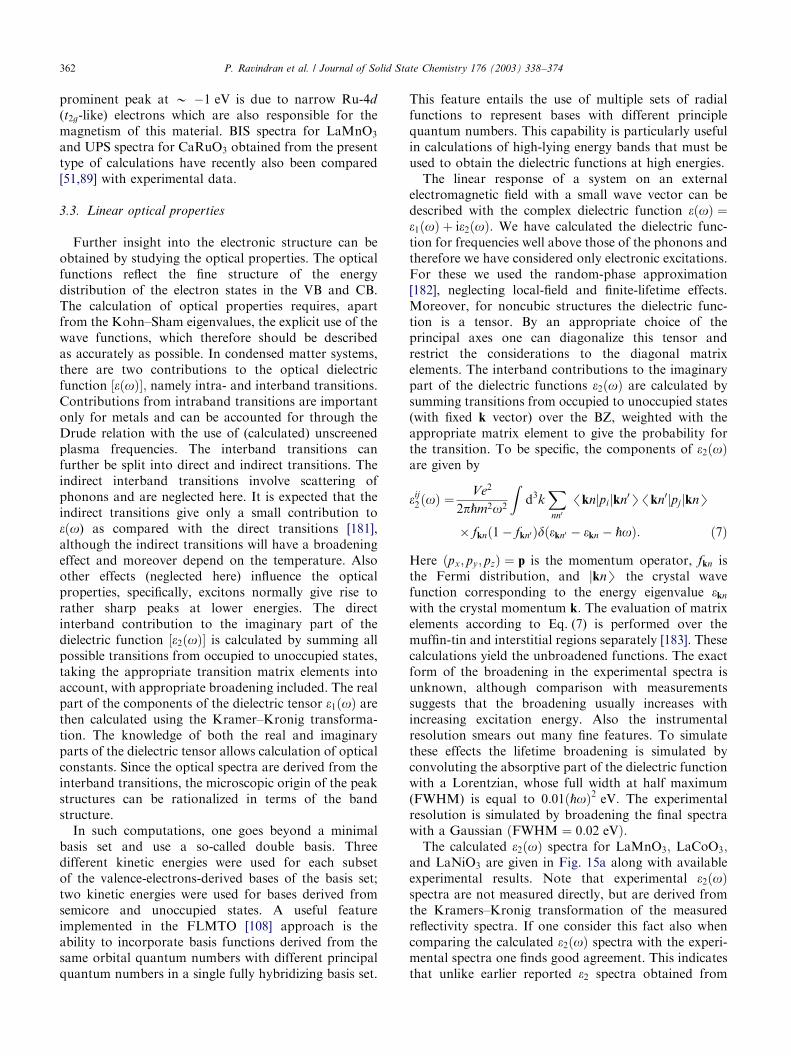
prominent peak at B �1 eV is due to narrow Ru-4d
(t2g-like) electrons which are also responsible for themagnetism of this material. BIS spectra for LaMnO3
and UPS spectra for CaRuO3 obtained from the presenttype of calculations have recently also been compared[51,89] with experimental data.
3.3. Linear optical properties
Further insight into the electronic structure can beobtained by studying the optical properties. The opticalfunctions reflect the fine structure of the energydistribution of the electron states in the VB and CB.The calculation of optical properties requires, apartfrom the Kohn–Sham eigenvalues, the explicit use of thewave functions, which therefore should be describedas accurately as possible. In condensed matter systems,there are two contributions to the optical dielectricfunction ½eðoÞ ; namely intra- and interband transitions.Contributions from intraband transitions are importantonly for metals and can be accounted for through theDrude relation with the use of (calculated) unscreenedplasma frequencies. The interband transitions canfurther be split into direct and indirect transitions. Theindirect interband transitions involve scattering ofphonons and are neglected here. It is expected that theindirect transitions give only a small contribution toeðo) as compared with the direct transitions [181],although the indirect transitions will have a broadeningeffect and moreover depend on the temperature. Alsoother effects (neglected here) influence the opticalproperties, specifically, excitons normally give rise torather sharp peaks at lower energies. The directinterband contribution to the imaginary part of thedielectric function ½e2ðoÞ is calculated by summing allpossible transitions from occupied to unoccupied states,taking the appropriate transition matrix elements intoaccount, with appropriate broadening included. The realpart of the components of the dielectric tensor e1ðoÞ arethen calculated using the Kramer–Kronig transforma-tion. The knowledge of both the real and imaginaryparts of the dielectric tensor allows calculation of opticalconstants. Since the optical spectra are derived from theinterband transitions, the microscopic origin of the peakstructures can be rationalized in terms of the bandstructure.
In such computations, one goes beyond a minimalbasis set and use a so-called double basis. Threedifferent kinetic energies were used for each subsetof the valence-electrons-derived bases of the basis set;two kinetic energies were used for bases derived fromsemicore and unoccupied states. A useful featureimplemented in the FLMTO [108] approach is theability to incorporate basis functions derived from thesame orbital quantum numbers with different principalquantum numbers in a single fully hybridizing basis set.
This feature entails the use of multiple sets of radialfunctions to represent bases with different principlequantum numbers. This capability is particularly usefulin calculations of high-lying energy bands that must beused to obtain the dielectric functions at high energies.
The linear response of a system on an externalelectromagnetic field with a small wave vector can bedescribed with the complex dielectric function eðoÞ ¼e1ðoÞ þ ie2ðoÞ: We have calculated the dielectric func-tion for frequencies well above those of the phonons andtherefore we have considered only electronic excitations.For these we used the random-phase approximation[182], neglecting local-field and finite-lifetime effects.Moreover, for noncubic structures the dielectric func-tion is a tensor. By an appropriate choice of theprincipal axes one can diagonalize this tensor andrestrict the considerations to the diagonal matrixelements. The interband contributions to the imaginarypart of the dielectric functions e2ðoÞ are calculated bysumming transitions from occupied to unoccupied states(with fixed k vector) over the BZ, weighted with theappropriate matrix element to give the probability forthe transition. To be specific, the components of e2ðoÞare given by
eij2ðoÞ ¼
Ve2
2p_m2o2
Zd3k
Xnn0
/knjpijkn0S/kn0jpjjknS
� fknð1 � fkn0 Þdðekn0 � ekn � _oÞ: ð7Þ
Here ðpx; py; pzÞ ¼ p is the momentum operator, fkn isthe Fermi distribution, and jknS the crystal wavefunction corresponding to the energy eigenvalue ekn
with the crystal momentum k: The evaluation of matrixelements according to Eq. (7) is performed over themuffin-tin and interstitial regions separately [183]. Thesecalculations yield the unbroadened functions. The exactform of the broadening in the experimental spectra isunknown, although comparison with measurementssuggests that the broadening usually increases withincreasing excitation energy. Also the instrumentalresolution smears out many fine features. To simulatethese effects the lifetime broadening is simulated byconvoluting the absorptive part of the dielectric functionwith a Lorentzian, whose full width at half maximum(FWHM) is equal to 0:01ð_oÞ2 eV: The experimentalresolution is simulated by broadening the final spectrawith a Gaussian ðFWHM ¼ 0:02 eVÞ:
The calculated e2ðoÞ spectra for LaMnO3; LaCoO3;and LaNiO3 are given in Fig. 15a along with availableexperimental results. Note that experimental e2ðoÞspectra are not measured directly, but are derived fromthe Kramers–Kronig transformation of the measuredreflectivity spectra. If one consider this fact also whencomparing the calculated e2ðoÞ spectra with the experi-mental spectra one finds good agreement. This indicatesthat unlike earlier reported e2 spectra obtained from
ARTICLE IN PRESSP. Ravindran et al. / Journal of Solid State Chemistry 176 (2003) 338–374362
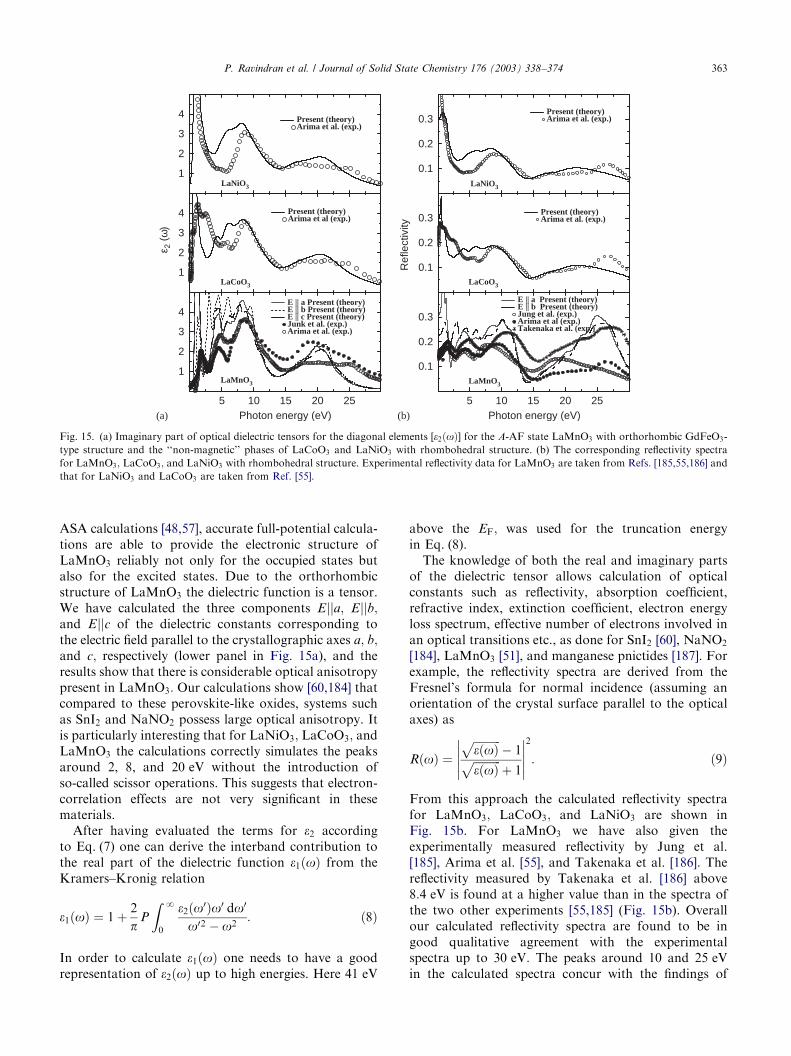
ASA calculations [48,57], accurate full-potential calcula-tions are able to provide the electronic structure ofLaMnO3 reliably not only for the occupied states butalso for the excited states. Due to the orthorhombicstructure of LaMnO3 the dielectric function is a tensor.We have calculated the three components Ejja; Ejjb;and Ejjc of the dielectric constants corresponding tothe electric field parallel to the crystallographic axes a; b;and c; respectively (lower panel in Fig. 15a), and theresults show that there is considerable optical anisotropypresent in LaMnO3: Our calculations show [60,184] thatcompared to these perovskite-like oxides, systems suchas SnI2 and NaNO2 possess large optical anisotropy. Itis particularly interesting that for LaNiO3; LaCoO3; andLaMnO3 the calculations correctly simulates the peaksaround 2, 8, and 20 eV without the introduction ofso-called scissor operations. This suggests that electron-correlation effects are not very significant in thesematerials.
After having evaluated the terms for e2 accordingto Eq. (7) one can derive the interband contribution tothe real part of the dielectric function e1ðoÞ from theKramers–Kronig relation
e1ðoÞ ¼ 1 þ 2
pP
ZN
0
e2ðo0Þo0 do0
o02 � o2: ð8Þ
In order to calculate e1ðoÞ one needs to have a goodrepresentation of e2ðoÞ up to high energies. Here 41 eV
above the EF; was used for the truncation energyin Eq. (8).
The knowledge of both the real and imaginary partsof the dielectric tensor allows calculation of opticalconstants such as reflectivity, absorption coefficient,refractive index, extinction coefficient, electron energyloss spectrum, effective number of electrons involved inan optical transitions etc., as done for SnI2 [60], NaNO2
[184], LaMnO3 [51], and manganese pnictides [187]. Forexample, the reflectivity spectra are derived from theFresnel’s formula for normal incidence (assuming anorientation of the crystal surface parallel to the opticalaxes) as
RðoÞ ¼ffiffiffiffiffiffiffiffiffiffieðoÞ
p� 1ffiffiffiffiffiffiffiffiffiffi
eðoÞp
þ 1
����������2
: ð9Þ
From this approach the calculated reflectivity spectrafor LaMnO3; LaCoO3; and LaNiO3 are shown inFig. 15b. For LaMnO3 we have also given theexperimentally measured reflectivity by Jung et al.[185], Arima et al. [55], and Takenaka et al. [186]. Thereflectivity measured by Takenaka et al. [186] above8:4 eV is found at a higher value than in the spectra ofthe two other experiments [55,185] (Fig. 15b). Overallour calculated reflectivity spectra are found to be ingood qualitative agreement with the experimentalspectra up to 30 eV: The peaks around 10 and 25 eVin the calculated spectra concur with the findings of
ARTICLE IN PRESS
5 10 15 20 25 5 10 15 20 25
1
2
3
4E || a Present (theory)E || b Present (theory)E || c Present (theory)Junk et al. (exp.)Arima et al. (exp.)
1
2
3
4 Present (theory)Arima et al (exp.)
1
2
3
4 Present (theory)Arima et al. (exp.)
0.1
0.2
0.3
E || a Present (theory)E || b Present (theory)Jung et al. (exp.)Arima et al (exp.)Takenaka et al. (exp.)
0.1
0.2
0.3Present (theory)Arima et al. (exp.)
0.1
0.2
0.3Present (theory)Arima et al. (exp.)
ε 2 (
ω)
Ref
lect
ivity
Photon energy (eV) Photon energy (eV)
LaMnO3
LaCoO3
LaNiO3
LaMnO3
LaCoO3
LaNiO3
(a) (b)
Fig. 15. (a) Imaginary part of optical dielectric tensors for the diagonal elements [e2ðoÞ] for the A-AF state LaMnO3 with orthorhombic GdFeO3-
type structure and the ‘‘non-magnetic’’ phases of LaCoO3 and LaNiO3 with rhombohedral structure. (b) The corresponding reflectivity spectra
for LaMnO3; LaCoO3; and LaNiO3 with rhombohedral structure. Experimental reflectivity data for LaMnO3 are taken from Refs. [185,55,186] and
that for LaNiO3 and LaCoO3 are taken from Ref. [55].
P. Ravindran et al. / Journal of Solid State Chemistry 176 (2003) 338–374 363
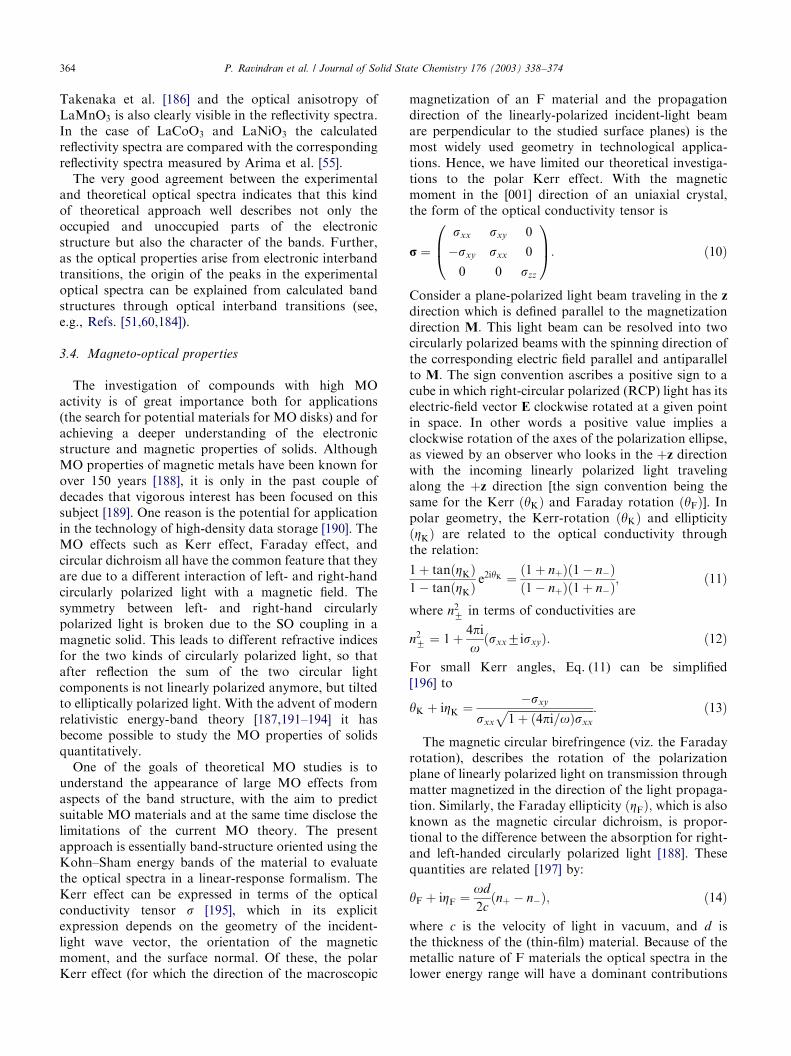
Takenaka et al. [186] and the optical anisotropy ofLaMnO3 is also clearly visible in the reflectivity spectra.In the case of LaCoO3 and LaNiO3 the calculatedreflectivity spectra are compared with the correspondingreflectivity spectra measured by Arima et al. [55].
The very good agreement between the experimentaland theoretical optical spectra indicates that this kindof theoretical approach well describes not only theoccupied and unoccupied parts of the electronicstructure but also the character of the bands. Further,as the optical properties arise from electronic interbandtransitions, the origin of the peaks in the experimentaloptical spectra can be explained from calculated bandstructures through optical interband transitions (see,e.g., Refs. [51,60,184]).
3.4. Magneto-optical properties
The investigation of compounds with high MOactivity is of great importance both for applications(the search for potential materials for MO disks) and forachieving a deeper understanding of the electronicstructure and magnetic properties of solids. AlthoughMO properties of magnetic metals have been known forover 150 years [188], it is only in the past couple ofdecades that vigorous interest has been focused on thissubject [189]. One reason is the potential for applicationin the technology of high-density data storage [190]. TheMO effects such as Kerr effect, Faraday effect, andcircular dichroism all have the common feature that theyare due to a different interaction of left- and right-handcircularly polarized light with a magnetic field. Thesymmetry between left- and right-hand circularlypolarized light is broken due to the SO coupling in amagnetic solid. This leads to different refractive indicesfor the two kinds of circularly polarized light, so thatafter reflection the sum of the two circular lightcomponents is not linearly polarized anymore, but tiltedto elliptically polarized light. With the advent of modernrelativistic energy-band theory [187,191–194] it hasbecome possible to study the MO properties of solidsquantitatively.
One of the goals of theoretical MO studies is tounderstand the appearance of large MO effects fromaspects of the band structure, with the aim to predictsuitable MO materials and at the same time disclose thelimitations of the current MO theory. The presentapproach is essentially band-structure oriented using theKohn–Sham energy bands of the material to evaluatethe optical spectra in a linear-response formalism. TheKerr effect can be expressed in terms of the opticalconductivity tensor s [195], which in its explicitexpression depends on the geometry of the incident-light wave vector, the orientation of the magneticmoment, and the surface normal. Of these, the polarKerr effect (for which the direction of the macroscopic
magnetization of an F material and the propagationdirection of the linearly-polarized incident-light beamare perpendicular to the studied surface planes) is themost widely used geometry in technological applica-tions. Hence, we have limited our theoretical investiga-tions to the polar Kerr effect. With the magneticmoment in the [001] direction of an uniaxial crystal,the form of the optical conductivity tensor is
r ¼sxx sxy 0
�sxy sxx 0
0 0 szz
0B@
1CA: ð10Þ
Consider a plane-polarized light beam traveling in the z
direction which is defined parallel to the magnetizationdirection M: This light beam can be resolved into twocircularly polarized beams with the spinning direction ofthe corresponding electric field parallel and antiparallelto M: The sign convention ascribes a positive sign to acube in which right-circular polarized (RCP) light has itselectric-field vector E clockwise rotated at a given pointin space. In other words a positive value implies aclockwise rotation of the axes of the polarization ellipse,as viewed by an observer who looks in the þz directionwith the incoming linearly polarized light travelingalong the þz direction [the sign convention being thesame for the Kerr ðyKÞ and Faraday rotation ðyFÞ]. Inpolar geometry, the Kerr-rotation ðyKÞ and ellipticityðZKÞ are related to the optical conductivity throughthe relation:
1 þ tanðZKÞ1 � tanðZKÞ
e2iyK ¼ ð1 þ nþÞð1 � n�Þð1 � nþÞð1 þ n�Þ
; ð11Þ
where n27 in terms of conductivities are
n27 ¼ 1 þ 4pi
oðsxx7isxyÞ: ð12Þ
For small Kerr angles, Eq. (11) can be simplified[196] to
yK þ iZK ¼ �sxy
sxx
ffiffiffiffiffiffiffiffiffiffiffiffiffiffiffiffiffiffiffiffiffiffiffiffiffiffiffiffiffiffiffi1 þ ð4pi=oÞsxx
p : ð13Þ
The magnetic circular birefringence (viz. the Faradayrotation), describes the rotation of the polarizationplane of linearly polarized light on transmission throughmatter magnetized in the direction of the light propaga-tion. Similarly, the Faraday ellipticity ðZFÞ; which is alsoknown as the magnetic circular dichroism, is propor-tional to the difference between the absorption for right-and left-handed circularly polarized light [188]. Thesequantities are related [197] by:
yF þ iZF ¼ od
2cðnþ � n�Þ; ð14Þ
where c is the velocity of light in vacuum, and d isthe thickness of the (thin-film) material. Because of themetallic nature of F materials the optical spectra in thelower energy range will have a dominant contributions
ARTICLE IN PRESSP. Ravindran et al. / Journal of Solid State Chemistry 176 (2003) 338–374364
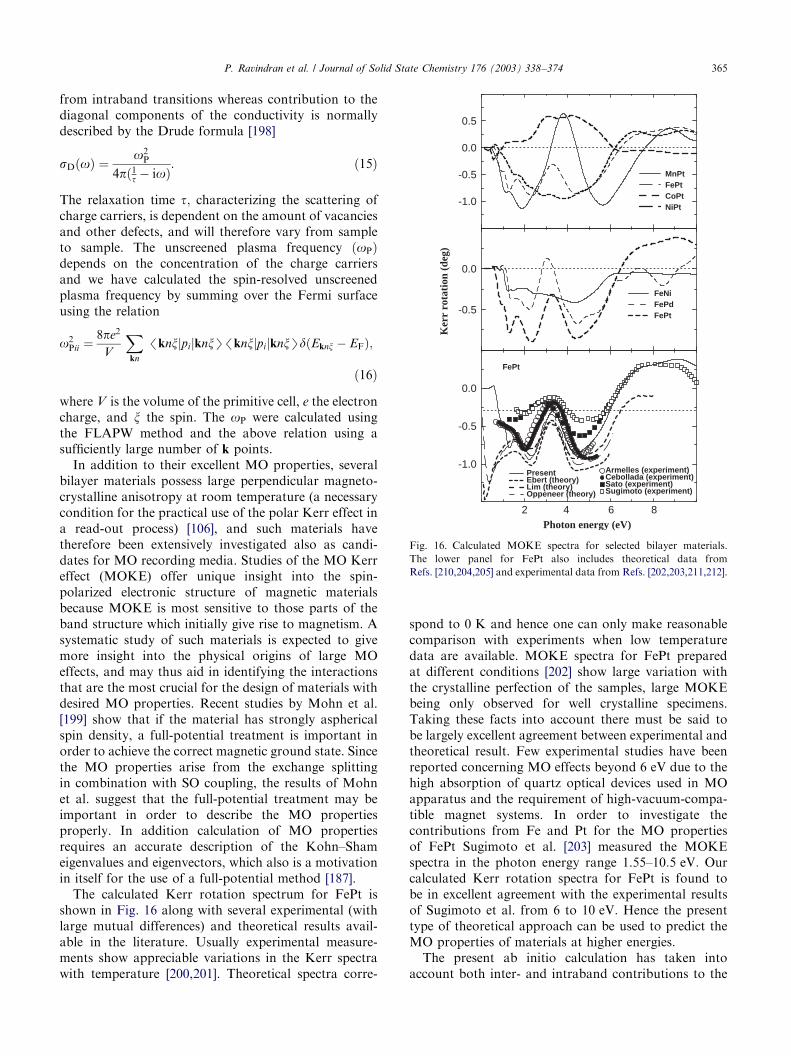
from intraband transitions whereas contribution to thediagonal components of the conductivity is normallydescribed by the Drude formula [198]
sDðoÞ ¼o2
P
4pð1t � ioÞ: ð15Þ
The relaxation time t; characterizing the scattering ofcharge carriers, is dependent on the amount of vacanciesand other defects, and will therefore vary from sampleto sample. The unscreened plasma frequency ðoPÞdepends on the concentration of the charge carriersand we have calculated the spin-resolved unscreenedplasma frequency by summing over the Fermi surfaceusing the relation
o2Pii ¼
8pe2
V
Xkn
/knxjpijknxS/knxjpijknxSdðEknx � EFÞ;
ð16Þ
where V is the volume of the primitive cell, e the electroncharge, and x the spin. The oP were calculated usingthe FLAPW method and the above relation using asufficiently large number of k points.
In addition to their excellent MO properties, severalbilayer materials possess large perpendicular magneto-crystalline anisotropy at room temperature (a necessarycondition for the practical use of the polar Kerr effect ina read-out process) [106], and such materials havetherefore been extensively investigated also as candi-dates for MO recording media. Studies of the MO Kerreffect (MOKE) offer unique insight into the spin-polarized electronic structure of magnetic materialsbecause MOKE is most sensitive to those parts of theband structure which initially give rise to magnetism. Asystematic study of such materials is expected to givemore insight into the physical origins of large MOeffects, and may thus aid in identifying the interactionsthat are the most crucial for the design of materials withdesired MO properties. Recent studies by Mohn et al.[199] show that if the material has strongly asphericalspin density, a full-potential treatment is important inorder to achieve the correct magnetic ground state. Sincethe MO properties arise from the exchange splittingin combination with SO coupling, the results of Mohnet al. suggest that the full-potential treatment may beimportant in order to describe the MO propertiesproperly. In addition calculation of MO propertiesrequires an accurate description of the Kohn–Shameigenvalues and eigenvectors, which also is a motivationin itself for the use of a full-potential method [187].
The calculated Kerr rotation spectrum for FePt isshown in Fig. 16 along with several experimental (withlarge mutual differences) and theoretical results avail-able in the literature. Usually experimental measure-ments show appreciable variations in the Kerr spectrawith temperature [200,201]. Theoretical spectra corre-
spond to 0 K and hence one can only make reasonablecomparison with experiments when low temperaturedata are available. MOKE spectra for FePt preparedat different conditions [202] show large variation withthe crystalline perfection of the samples, large MOKEbeing only observed for well crystalline specimens.Taking these facts into account there must be said tobe largely excellent agreement between experimental andtheoretical result. Few experimental studies have beenreported concerning MO effects beyond 6 eV due to thehigh absorption of quartz optical devices used in MOapparatus and the requirement of high-vacuum-compa-tible magnet systems. In order to investigate thecontributions from Fe and Pt for the MO propertiesof FePt Sugimoto et al. [203] measured the MOKEspectra in the photon energy range 1.55–10:5 eV: Ourcalculated Kerr rotation spectra for FePt is found tobe in excellent agreement with the experimental resultsof Sugimoto et al. from 6 to 10 eV: Hence the presenttype of theoretical approach can be used to predict theMO properties of materials at higher energies.
The present ab initio calculation has taken intoaccount both inter- and intraband contributions to the
ARTICLE IN PRESS
2Photon energy (eV)
-1.0
-0.5
0.0
PresentEbert (theory)Lim (theory)Oppeneer (theory)
Armelles (experiment)Cebollada (experiment)Sato (experiment)Sugimoto (experiment)
-0.5
0.0
FeNiFePdFePt
-1.0
-0.5
0.0
0.5
MnPtFePtCoPtNiPt
Ker
r ro
tati
on (
deg)
FePt
4 6 8
Fig. 16. Calculated MOKE spectra for selected bilayer materials.
The lower panel for FePt also includes theoretical data from
Refs. [210,204,205] and experimental data from Refs. [202,203,211,212].
P. Ravindran et al. / Journal of Solid State Chemistry 176 (2003) 338–374 365
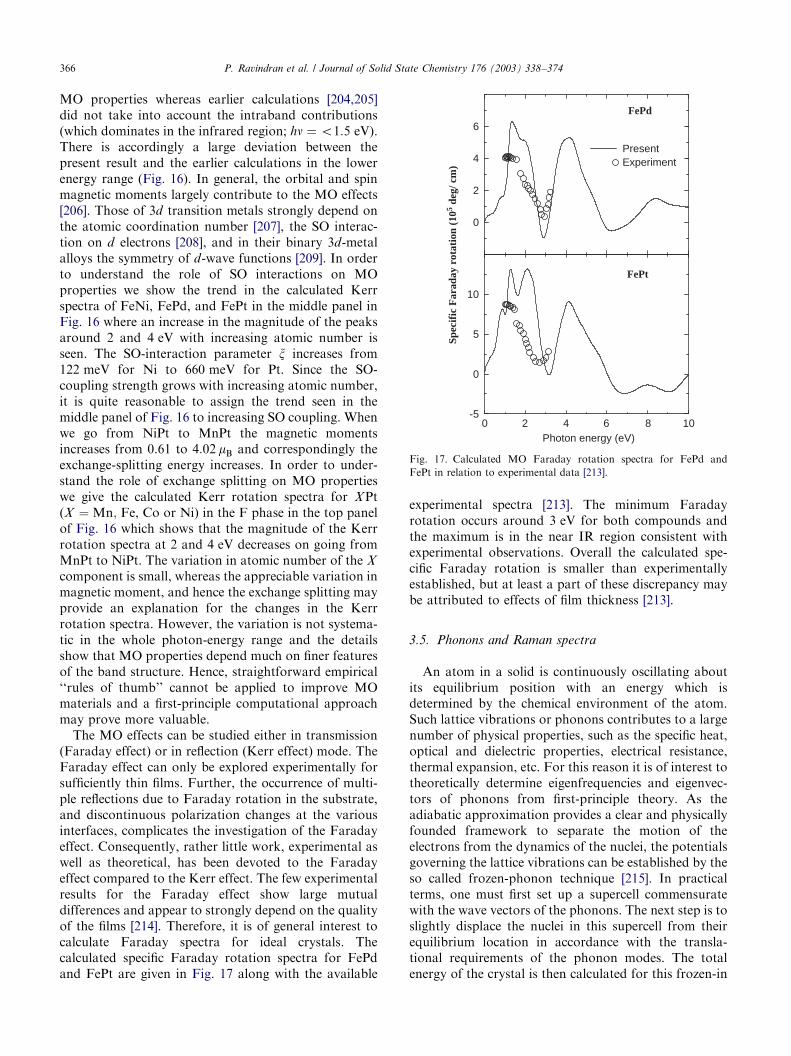
MO properties whereas earlier calculations [204,205]did not take into account the intraband contributions(which dominates in the infrared region; hn ¼ o1:5 eV).There is accordingly a large deviation between thepresent result and the earlier calculations in the lowerenergy range (Fig. 16). In general, the orbital and spinmagnetic moments largely contribute to the MO effects[206]. Those of 3d transition metals strongly depend onthe atomic coordination number [207], the SO interac-tion on d electrons [208], and in their binary 3d-metalalloys the symmetry of d-wave functions [209]. In orderto understand the role of SO interactions on MOproperties we show the trend in the calculated Kerrspectra of FeNi, FePd, and FePt in the middle panel inFig. 16 where an increase in the magnitude of the peaksaround 2 and 4 eV with increasing atomic number isseen. The SO-interaction parameter x increases from122 meV for Ni to 660 meV for Pt. Since the SO-coupling strength grows with increasing atomic number,it is quite reasonable to assign the trend seen in themiddle panel of Fig. 16 to increasing SO coupling. Whenwe go from NiPt to MnPt the magnetic momentsincreases from 0.61 to 4:02 mB and correspondingly theexchange-splitting energy increases. In order to under-stand the role of exchange splitting on MO propertieswe give the calculated Kerr rotation spectra for XPt(X ¼ Mn; Fe, Co or Ni) in the F phase in the top panelof Fig. 16 which shows that the magnitude of the Kerrrotation spectra at 2 and 4 eV decreases on going fromMnPt to NiPt. The variation in atomic number of the X
component is small, whereas the appreciable variation inmagnetic moment, and hence the exchange splitting mayprovide an explanation for the changes in the Kerrrotation spectra. However, the variation is not systema-tic in the whole photon-energy range and the detailsshow that MO properties depend much on finer featuresof the band structure. Hence, straightforward empirical‘‘rules of thumb’’ cannot be applied to improve MOmaterials and a first-principle computational approachmay prove more valuable.
The MO effects can be studied either in transmission(Faraday effect) or in reflection (Kerr effect) mode. TheFaraday effect can only be explored experimentally forsufficiently thin films. Further, the occurrence of multi-ple reflections due to Faraday rotation in the substrate,and discontinuous polarization changes at the variousinterfaces, complicates the investigation of the Faradayeffect. Consequently, rather little work, experimental aswell as theoretical, has been devoted to the Faradayeffect compared to the Kerr effect. The few experimentalresults for the Faraday effect show large mutualdifferences and appear to strongly depend on the qualityof the films [214]. Therefore, it is of general interest tocalculate Faraday spectra for ideal crystals. Thecalculated specific Faraday rotation spectra for FePdand FePt are given in Fig. 17 along with the available
experimental spectra [213]. The minimum Faradayrotation occurs around 3 eV for both compounds andthe maximum is in the near IR region consistent withexperimental observations. Overall the calculated spe-cific Faraday rotation is smaller than experimentallyestablished, but at least a part of these discrepancy maybe attributed to effects of film thickness [213].
3.5. Phonons and Raman spectra
An atom in a solid is continuously oscillating aboutits equilibrium position with an energy which isdetermined by the chemical environment of the atom.Such lattice vibrations or phonons contributes to a largenumber of physical properties, such as the specific heat,optical and dielectric properties, electrical resistance,thermal expansion, etc. For this reason it is of interest totheoretically determine eigenfrequencies and eigenvec-tors of phonons from first-principle theory. As theadiabatic approximation provides a clear and physicallyfounded framework to separate the motion of theelectrons from the dynamics of the nuclei, the potentialsgoverning the lattice vibrations can be established by theso called frozen-phonon technique [215]. In practicalterms, one must first set up a supercell commensuratewith the wave vectors of the phonons. The next step is toslightly displace the nuclei in this supercell from theirequilibrium location in accordance with the transla-tional requirements of the phonon modes. The totalenergy of the crystal is then calculated for this frozen-in
ARTICLE IN PRESS
0 2 4 6 8 10Photon energy (eV)
-5
0
5
10
0
2
4
6
PresentExperiment
FePt
FePd
Spec
ific
Far
aday
rot
atio
n (1
05 deg
/ cm
)Fig. 17. Calculated MO Faraday rotation spectra for FePd and
FePt in relation to experimental data [213].
P. Ravindran et al. / Journal of Solid State Chemistry 176 (2003) 338–374366
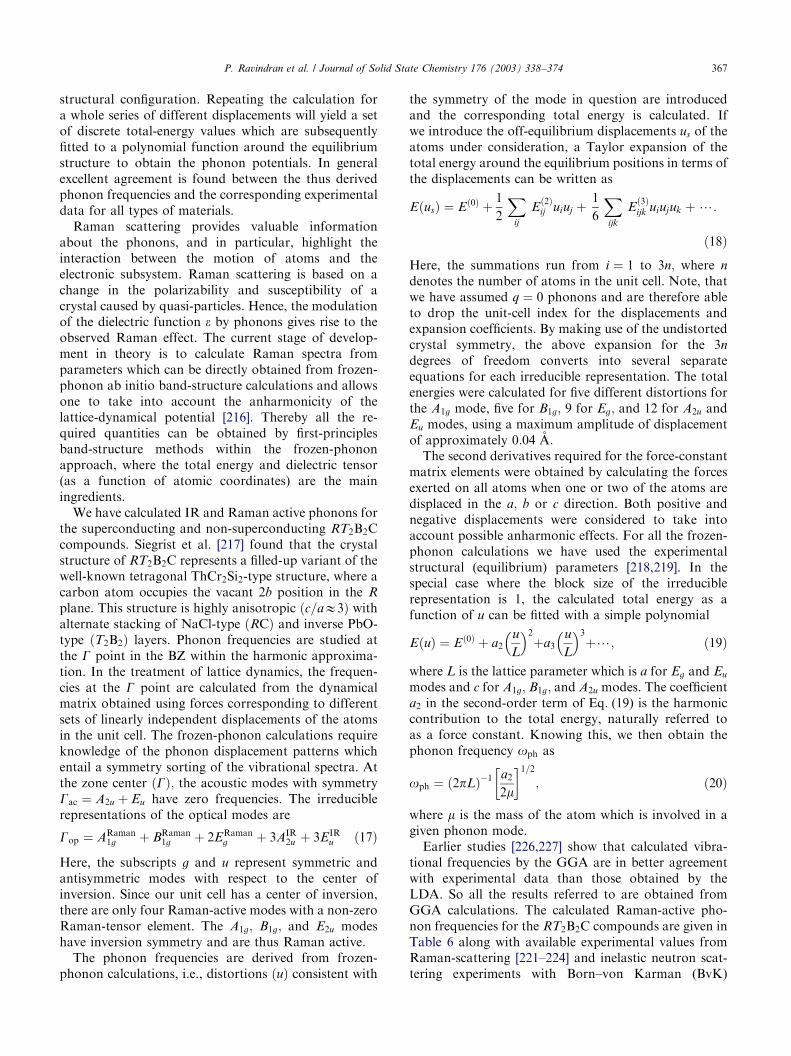
structural configuration. Repeating the calculation fora whole series of different displacements will yield a setof discrete total-energy values which are subsequentlyfitted to a polynomial function around the equilibriumstructure to obtain the phonon potentials. In generalexcellent agreement is found between the thus derivedphonon frequencies and the corresponding experimentaldata for all types of materials.
Raman scattering provides valuable informationabout the phonons, and in particular, highlight theinteraction between the motion of atoms and theelectronic subsystem. Raman scattering is based on achange in the polarizability and susceptibility of acrystal caused by quasi-particles. Hence, the modulationof the dielectric function e by phonons gives rise to theobserved Raman effect. The current stage of develop-ment in theory is to calculate Raman spectra fromparameters which can be directly obtained from frozen-phonon ab initio band-structure calculations and allowsone to take into account the anharmonicity of thelattice-dynamical potential [216]. Thereby all the re-quired quantities can be obtained by first-principlesband-structure methods within the frozen-phononapproach, where the total energy and dielectric tensor(as a function of atomic coordinates) are the mainingredients.
We have calculated IR and Raman active phonons forthe superconducting and non-superconducting RT2B2Ccompounds. Siegrist et al. [217] found that the crystalstructure of RT2B2C represents a filled-up variant of thewell-known tetragonal ThCr2Si2-type structure, where acarbon atom occupies the vacant 2b position in the R
plane. This structure is highly anisotropic ðc=aE3Þ withalternate stacking of NaCl-type ðRCÞ and inverse PbO-type ðT2B2Þ layers. Phonon frequencies are studied atthe G point in the BZ within the harmonic approxima-tion. In the treatment of lattice dynamics, the frequen-cies at the G point are calculated from the dynamicalmatrix obtained using forces corresponding to differentsets of linearly independent displacements of the atomsin the unit cell. The frozen-phonon calculations requireknowledge of the phonon displacement patterns whichentail a symmetry sorting of the vibrational spectra. Atthe zone center ðGÞ; the acoustic modes with symmetryGac ¼ A2u þ Eu have zero frequencies. The irreduciblerepresentations of the optical modes are
Gop ¼ ARaman1g þ BRaman
1g þ 2ERamang þ 3AIR
2u þ 3EIRu ð17Þ
Here, the subscripts g and u represent symmetric andantisymmetric modes with respect to the center ofinversion. Since our unit cell has a center of inversion,there are only four Raman-active modes with a non-zeroRaman-tensor element. The A1g; B1g; and E2u modeshave inversion symmetry and are thus Raman active.
The phonon frequencies are derived from frozen-phonon calculations, i.e., distortions ðuÞ consistent with
the symmetry of the mode in question are introducedand the corresponding total energy is calculated. Ifwe introduce the off-equilibrium displacements us of theatoms under consideration, a Taylor expansion of thetotal energy around the equilibrium positions in terms ofthe displacements can be written as
EðusÞ ¼ Eð0Þ þ 1
2
Xij
Eð2Þij uiuj þ
1
6
Xijk
Eð3Þijk uiujuk þ?:
ð18Þ
Here, the summations run from i ¼ 1 to 3n; where n
denotes the number of atoms in the unit cell. Note, thatwe have assumed q ¼ 0 phonons and are therefore ableto drop the unit-cell index for the displacements andexpansion coefficients. By making use of the undistortedcrystal symmetry, the above expansion for the 3n
degrees of freedom converts into several separateequations for each irreducible representation. The totalenergies were calculated for five different distortions forthe A1g mode, five for B1g; 9 for Eg; and 12 for A2u andEu modes, using a maximum amplitude of displacementof approximately 0:04 A:
The second derivatives required for the force-constantmatrix elements were obtained by calculating the forcesexerted on all atoms when one or two of the atoms aredisplaced in the a; b or c direction. Both positive andnegative displacements were considered to take intoaccount possible anharmonic effects. For all the frozen-phonon calculations we have used the experimentalstructural (equilibrium) parameters [218,219]. In thespecial case where the block size of the irreduciblerepresentation is 1, the calculated total energy as afunction of u can be fitted with a simple polynomial
EðuÞ ¼ Eð0Þ þ a2u
L
� �2
þa3u
L
� �3
þ?; ð19Þ
where L is the lattice parameter which is a for Eg and Eu
modes and c for A1g; B1g; and A2u modes. The coefficienta2 in the second-order term of Eq. (19) is the harmoniccontribution to the total energy, naturally referred toas a force constant. Knowing this, we then obtain thephonon frequency oph as
oph ¼ ð2pLÞ�1 a2
2m
� 1=2
; ð20Þ
where m is the mass of the atom which is involved in agiven phonon mode.
Earlier studies [226,227] show that calculated vibra-tional frequencies by the GGA are in better agreementwith experimental data than those obtained by theLDA. So all the results referred to are obtained fromGGA calculations. The calculated Raman-active pho-non frequencies for the RT2B2C compounds are given inTable 6 along with available experimental values fromRaman-scattering [221–224] and inelastic neutron scat-tering experiments with Born–von Karman (BvK)
ARTICLE IN PRESSP. Ravindran et al. / Journal of Solid State Chemistry 176 (2003) 338–374 367
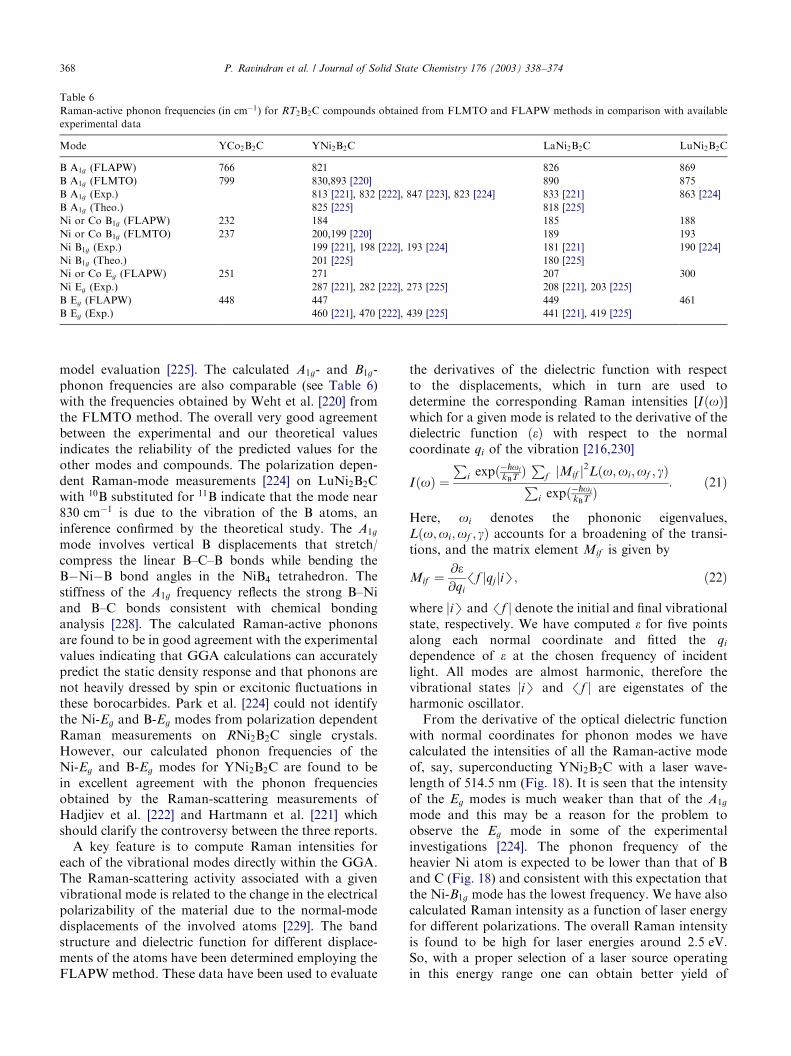
model evaluation [225]. The calculated A1g- and B1g-phonon frequencies are also comparable (see Table 6)with the frequencies obtained by Weht et al. [220] fromthe FLMTO method. The overall very good agreementbetween the experimental and our theoretical valuesindicates the reliability of the predicted values for theother modes and compounds. The polarization depen-dent Raman-mode measurements [224] on LuNi2B2Cwith 10B substituted for 11B indicate that the mode near830 cm�1 is due to the vibration of the B atoms, aninference confirmed by the theoretical study. The A1g
mode involves vertical B displacements that stretch/compress the linear B–C–B bonds while bending theB�Ni�B bond angles in the NiB4 tetrahedron. Thestiffness of the A1g frequency reflects the strong B–Niand B–C bonds consistent with chemical bondinganalysis [228]. The calculated Raman-active phononsare found to be in good agreement with the experimentalvalues indicating that GGA calculations can accuratelypredict the static density response and that phonons arenot heavily dressed by spin or excitonic fluctuations inthese borocarbides. Park et al. [224] could not identifythe Ni-Eg and B-Eg modes from polarization dependentRaman measurements on RNi2B2C single crystals.However, our calculated phonon frequencies of theNi-Eg and B-Eg modes for YNi2B2C are found to bein excellent agreement with the phonon frequenciesobtained by the Raman-scattering measurements ofHadjiev et al. [222] and Hartmann et al. [221] whichshould clarify the controversy between the three reports.
A key feature is to compute Raman intensities foreach of the vibrational modes directly within the GGA.The Raman-scattering activity associated with a givenvibrational mode is related to the change in the electricalpolarizability of the material due to the normal-modedisplacements of the involved atoms [229]. The bandstructure and dielectric function for different displace-ments of the atoms have been determined employing theFLAPW method. These data have been used to evaluate
the derivatives of the dielectric function with respectto the displacements, which in turn are used todetermine the corresponding Raman intensities [IðoÞ]which for a given mode is related to the derivative of thedielectric function ðeÞ with respect to the normalcoordinate qi of the vibration [216,230]
IðoÞ ¼P
i expð�_oi
kBTÞP
f jMif j2Lðo;oi;of ; gÞPi expð�_oi
kBTÞ
: ð21Þ
Here, oi denotes the phononic eigenvalues,Lðo;oi;of ; gÞ accounts for a broadening of the transi-tions, and the matrix element Mif is given by
Mif ¼ @e@qi
/f jqjjiS; ð22Þ
where jiS and /f j denote the initial and final vibrationalstate, respectively. We have computed e for five pointsalong each normal coordinate and fitted the qi
dependence of e at the chosen frequency of incidentlight. All modes are almost harmonic, therefore thevibrational states jiS and /f j are eigenstates of theharmonic oscillator.
From the derivative of the optical dielectric functionwith normal coordinates for phonon modes we havecalculated the intensities of all the Raman-active modeof, say, superconducting YNi2B2C with a laser wave-length of 514:5 nm (Fig. 18). It is seen that the intensityof the Eg modes is much weaker than that of the A1g
mode and this may be a reason for the problem toobserve the Eg mode in some of the experimentalinvestigations [224]. The phonon frequency of theheavier Ni atom is expected to be lower than that of Band C (Fig. 18) and consistent with this expectation thatthe Ni-B1g mode has the lowest frequency. We have alsocalculated Raman intensity as a function of laser energyfor different polarizations. The overall Raman intensityis found to be high for laser energies around 2:5 eV:So, with a proper selection of a laser source operatingin this energy range one can obtain better yield of
ARTICLE IN PRESS
Table 6
Raman-active phonon frequencies (in cm�1) for RT2B2C compounds obtained from FLMTO and FLAPW methods in comparison with available
experimental data
Mode YCo2B2C YNi2B2C LaNi2B2C LuNi2B2C
B A1g (FLAPW) 766 821 826 869
B A1g (FLMTO) 799 830,893 [220] 890 875
B A1g (Exp.) 813 [221], 832 [222], 847 [223], 823 [224] 833 [221] 863 [224]
B A1g (Theo.) 825 [225] 818 [225]
Ni or Co B1g (FLAPW) 232 184 185 188
Ni or Co B1g (FLMTO) 237 200,199 [220] 189 193
Ni B1g (Exp.) 199 [221], 198 [222], 193 [224] 181 [221] 190 [224]
Ni B1g (Theo.) 201 [225] 180 [225]
Ni or Co Eg (FLAPW) 251 271 207 300
Ni Eg (Exp.) 287 [221], 282 [222], 273 [225] 208 [221], 203 [225]
B Eg (FLAPW) 448 447 449 461
B Eg (Exp.) 460 [221], 470 [222], 439 [225] 441 [221], 419 [225]
P. Ravindran et al. / Journal of Solid State Chemistry 176 (2003) 338–374368
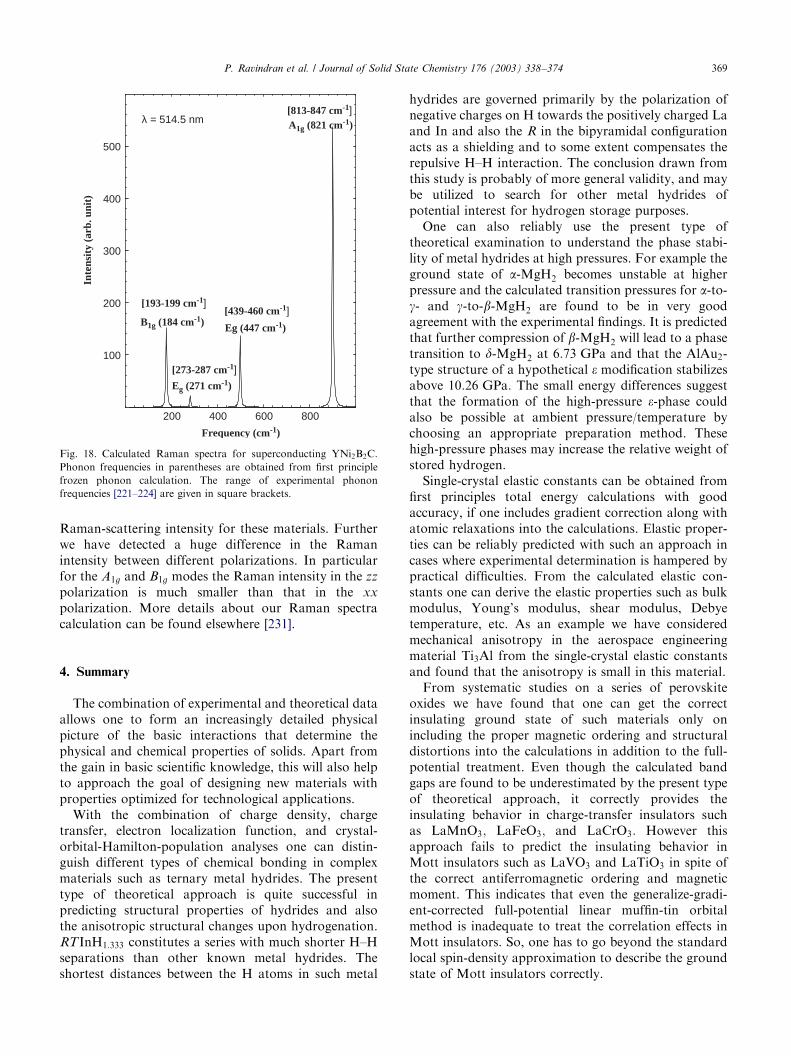
Raman-scattering intensity for these materials. Furtherwe have detected a huge difference in the Ramanintensity between different polarizations. In particularfor the A1g and B1g modes the Raman intensity in the zz
polarization is much smaller than that in the xx
polarization. More details about our Raman spectracalculation can be found elsewhere [231].
4. Summary
The combination of experimental and theoretical dataallows one to form an increasingly detailed physicalpicture of the basic interactions that determine thephysical and chemical properties of solids. Apart fromthe gain in basic scientific knowledge, this will also helpto approach the goal of designing new materials withproperties optimized for technological applications.
With the combination of charge density, chargetransfer, electron localization function, and crystal-orbital-Hamilton-population analyses one can distin-guish different types of chemical bonding in complexmaterials such as ternary metal hydrides. The presenttype of theoretical approach is quite successful inpredicting structural properties of hydrides and alsothe anisotropic structural changes upon hydrogenation.RTInH1:333 constitutes a series with much shorter H–Hseparations than other known metal hydrides. Theshortest distances between the H atoms in such metal
hydrides are governed primarily by the polarization ofnegative charges on H towards the positively charged Laand In and also the R in the bipyramidal configurationacts as a shielding and to some extent compensates therepulsive H–H interaction. The conclusion drawn fromthis study is probably of more general validity, and maybe utilized to search for other metal hydrides ofpotential interest for hydrogen storage purposes.
One can also reliably use the present type oftheoretical examination to understand the phase stabi-lity of metal hydrides at high pressures. For example theground state of a-MgH2 becomes unstable at higherpressure and the calculated transition pressures for a-to-g- and g-to-b-MgH2 are found to be in very goodagreement with the experimental findings. It is predictedthat further compression of b-MgH2 will lead to a phasetransition to d-MgH2 at 6:73 GPa and that the AlAu2-type structure of a hypothetical e modification stabilizesabove 10:26 GPa: The small energy differences suggestthat the formation of the high-pressure e-phase couldalso be possible at ambient pressure/temperature bychoosing an appropriate preparation method. Thesehigh-pressure phases may increase the relative weight ofstored hydrogen.
Single-crystal elastic constants can be obtained fromfirst principles total energy calculations with goodaccuracy, if one includes gradient correction along withatomic relaxations into the calculations. Elastic proper-ties can be reliably predicted with such an approach incases where experimental determination is hampered bypractical difficulties. From the calculated elastic con-stants one can derive the elastic properties such as bulkmodulus, Young’s modulus, shear modulus, Debyetemperature, etc. As an example we have consideredmechanical anisotropy in the aerospace engineeringmaterial Ti3Al from the single-crystal elastic constantsand found that the anisotropy is small in this material.
From systematic studies on a series of perovskiteoxides we have found that one can get the correctinsulating ground state of such materials only onincluding the proper magnetic ordering and structuraldistortions into the calculations in addition to the full-potential treatment. Even though the calculated bandgaps are found to be underestimated by the present typeof theoretical approach, it correctly provides theinsulating behavior in charge-transfer insulators suchas LaMnO3; LaFeO3; and LaCrO3: However thisapproach fails to predict the insulating behavior inMott insulators such as LaVO3 and LaTiO3 in spite ofthe correct antiferromagnetic ordering and magneticmoment. This indicates that even the generalize-gradi-ent-corrected full-potential linear muffin-tin orbitalmethod is inadequate to treat the correlation effects inMott insulators. So, one has to go beyond the standardlocal spin-density approximation to describe the groundstate of Mott insulators correctly.
ARTICLE IN PRESS
200 400 600 800
100
200
300
400
500
A1g (821 cm-1)
B1g (184 cm-1)
Eg (271 cm-1)
Eg (447 cm-1)
λ = 514.5 nm
Frequency (cm-1)
Inte
nsit
y (a
rb. u
nit)
[813-847 cm-1]
[439-460 cm-1]
[273-287 cm-1]
[193-199 cm-1]
Fig. 18. Calculated Raman spectra for superconducting YNi2B2C:
Phonon frequencies in parentheses are obtained from first principle
frozen phonon calculation. The range of experimental phonon
frequencies [221–224] are given in square brackets.
P. Ravindran et al. / Journal of Solid State Chemistry 176 (2003) 338–374 369
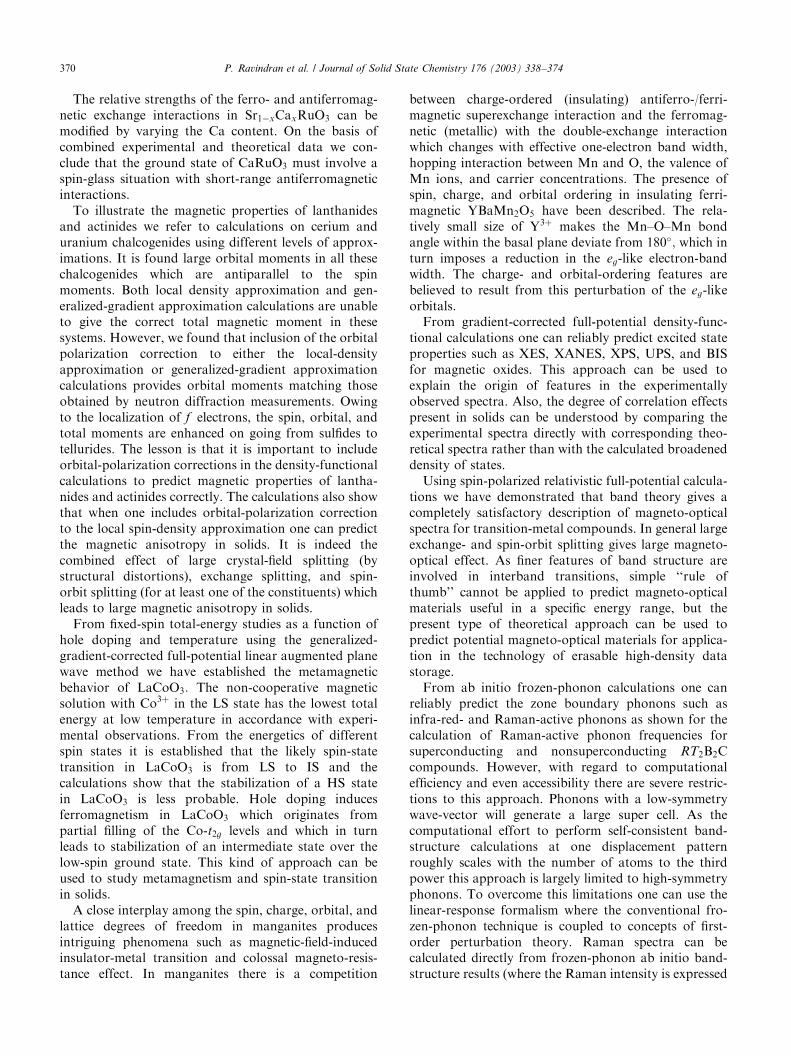
The relative strengths of the ferro- and antiferromag-netic exchange interactions in Sr1�xCaxRuO3 can bemodified by varying the Ca content. On the basis ofcombined experimental and theoretical data we con-clude that the ground state of CaRuO3 must involve aspin-glass situation with short-range antiferromagneticinteractions.
To illustrate the magnetic properties of lanthanidesand actinides we refer to calculations on cerium anduranium chalcogenides using different levels of approx-imations. It is found large orbital moments in all thesechalcogenides which are antiparallel to the spinmoments. Both local density approximation and gen-eralized-gradient approximation calculations are unableto give the correct total magnetic moment in thesesystems. However, we found that inclusion of the orbitalpolarization correction to either the local-densityapproximation or generalized-gradient approximationcalculations provides orbital moments matching thoseobtained by neutron diffraction measurements. Owingto the localization of f electrons, the spin, orbital, andtotal moments are enhanced on going from sulfides totellurides. The lesson is that it is important to includeorbital-polarization corrections in the density-functionalcalculations to predict magnetic properties of lantha-nides and actinides correctly. The calculations also showthat when one includes orbital-polarization correctionto the local spin-density approximation one can predictthe magnetic anisotropy in solids. It is indeed thecombined effect of large crystal-field splitting (bystructural distortions), exchange splitting, and spin-orbit splitting (for at least one of the constituents) whichleads to large magnetic anisotropy in solids.
From fixed-spin total-energy studies as a function ofhole doping and temperature using the generalized-gradient-corrected full-potential linear augmented planewave method we have established the metamagneticbehavior of LaCoO3: The non-cooperative magneticsolution with Co3þ in the LS state has the lowest totalenergy at low temperature in accordance with experi-mental observations. From the energetics of differentspin states it is established that the likely spin-statetransition in LaCoO3 is from LS to IS and thecalculations show that the stabilization of a HS statein LaCoO3 is less probable. Hole doping inducesferromagnetism in LaCoO3 which originates frompartial filling of the Co-t2g levels and which in turnleads to stabilization of an intermediate state over thelow-spin ground state. This kind of approach can beused to study metamagnetism and spin-state transitionin solids.
A close interplay among the spin, charge, orbital, andlattice degrees of freedom in manganites producesintriguing phenomena such as magnetic-field-inducedinsulator-metal transition and colossal magneto-resis-tance effect. In manganites there is a competition
between charge-ordered (insulating) antiferro-/ferri-magnetic superexchange interaction and the ferromag-netic (metallic) with the double-exchange interactionwhich changes with effective one-electron band width,hopping interaction between Mn and O, the valence ofMn ions, and carrier concentrations. The presence ofspin, charge, and orbital ordering in insulating ferri-magnetic YBaMn2O5 have been described. The rela-tively small size of Y3þ makes the Mn–O–Mn bondangle within the basal plane deviate from 180; which inturn imposes a reduction in the eg-like electron-bandwidth. The charge- and orbital-ordering features arebelieved to result from this perturbation of the eg-likeorbitals.
From gradient-corrected full-potential density-func-tional calculations one can reliably predict excited stateproperties such as XES, XANES, XPS, UPS, and BISfor magnetic oxides. This approach can be used toexplain the origin of features in the experimentallyobserved spectra. Also, the degree of correlation effectspresent in solids can be understood by comparing theexperimental spectra directly with corresponding theo-retical spectra rather than with the calculated broadeneddensity of states.
Using spin-polarized relativistic full-potential calcula-tions we have demonstrated that band theory gives acompletely satisfactory description of magneto-opticalspectra for transition-metal compounds. In general largeexchange- and spin-orbit splitting gives large magneto-optical effect. As finer features of band structure areinvolved in interband transitions, simple ‘‘rule ofthumb’’ cannot be applied to predict magneto-opticalmaterials useful in a specific energy range, but thepresent type of theoretical approach can be used topredict potential magneto-optical materials for applica-tion in the technology of erasable high-density datastorage.
From ab initio frozen-phonon calculations one canreliably predict the zone boundary phonons such asinfra-red- and Raman-active phonons as shown for thecalculation of Raman-active phonon frequencies forsuperconducting and nonsuperconducting RT2B2Ccompounds. However, with regard to computationalefficiency and even accessibility there are severe restric-tions to this approach. Phonons with a low-symmetrywave-vector will generate a large super cell. As thecomputational effort to perform self-consistent band-structure calculations at one displacement patternroughly scales with the number of atoms to the thirdpower this approach is largely limited to high-symmetryphonons. To overcome this limitations one can use thelinear-response formalism where the conventional fro-zen-phonon technique is coupled to concepts of first-order perturbation theory. Raman spectra can becalculated directly from frozen-phonon ab initio band-structure results (where the Raman intensity is expressed
ARTICLE IN PRESSP. Ravindran et al. / Journal of Solid State Chemistry 176 (2003) 338–374370
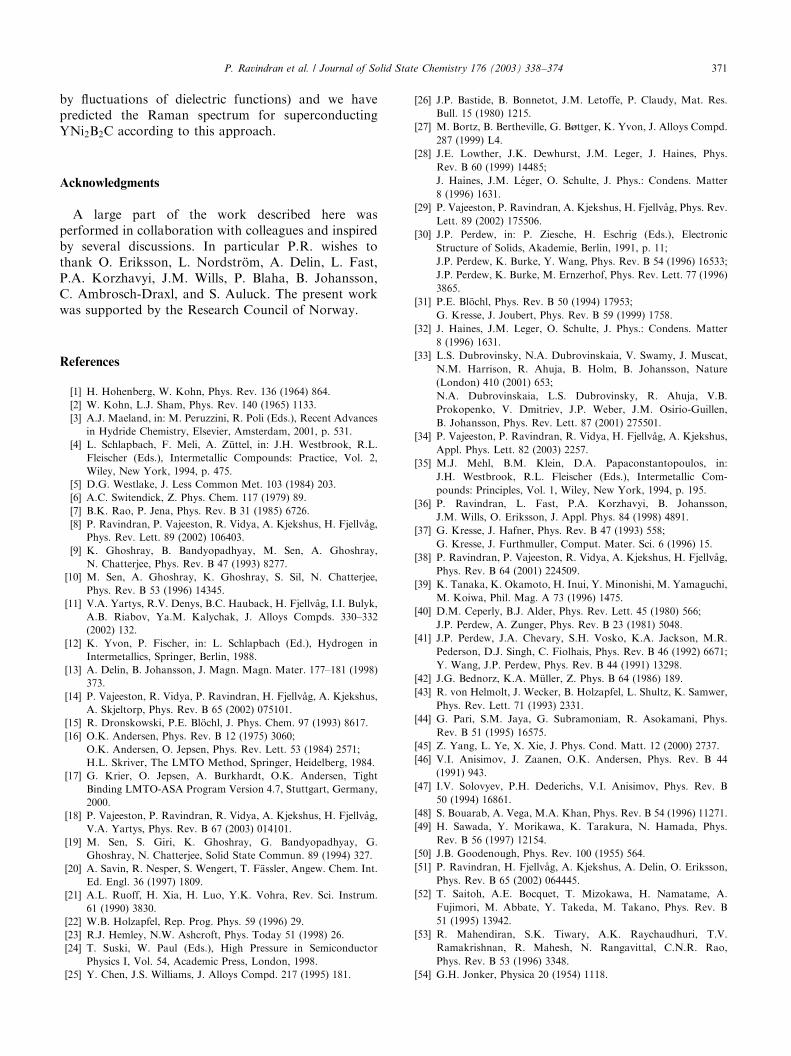
by fluctuations of dielectric functions) and we havepredicted the Raman spectrum for superconductingYNi2B2C according to this approach.
Acknowledgments
A large part of the work described here wasperformed in collaboration with colleagues and inspiredby several discussions. In particular P.R. wishes tothank O. Eriksson, L. Nordstrom, A. Delin, L. Fast,P.A. Korzhavyi, J.M. Wills, P. Blaha, B. Johansson,C. Ambrosch-Draxl, and S. Auluck. The present workwas supported by the Research Council of Norway.
References
[1] H. Hohenberg, W. Kohn, Phys. Rev. 136 (1964) 864.
[2] W. Kohn, L.J. Sham, Phys. Rev. 140 (1965) 1133.
[3] A.J. Maeland, in: M. Peruzzini, R. Poli (Eds.), Recent Advances
in Hydride Chemistry, Elsevier, Amsterdam, 2001, p. 531.
[4] L. Schlapbach, F. Meli, A. Zuttel, in: J.H. Westbrook, R.L.
Fleischer (Eds.), Intermetallic Compounds: Practice, Vol. 2,
Wiley, New York, 1994, p. 475.
[5] D.G. Westlake, J. Less Common Met. 103 (1984) 203.
[6] A.C. Switendick, Z. Phys. Chem. 117 (1979) 89.
[7] B.K. Rao, P. Jena, Phys. Rev. B 31 (1985) 6726.
[8] P. Ravindran, P. Vajeeston, R. Vidya, A. Kjekshus, H. Fjellvag,
Phys. Rev. Lett. 89 (2002) 106403.
[9] K. Ghoshray, B. Bandyopadhyay, M. Sen, A. Ghoshray,
N. Chatterjee, Phys. Rev. B 47 (1993) 8277.
[10] M. Sen, A. Ghoshray, K. Ghoshray, S. Sil, N. Chatterjee,
Phys. Rev. B 53 (1996) 14345.
[11] V.A. Yartys, R.V. Denys, B.C. Hauback, H. Fjellvag, I.I. Bulyk,
A.B. Riabov, Ya.M. Kalychak, J. Alloys Compds. 330–332
(2002) 132.
[12] K. Yvon, P. Fischer, in: L. Schlapbach (Ed.), Hydrogen in
Intermetallics, Springer, Berlin, 1988.
[13] A. Delin, B. Johansson, J. Magn. Magn. Mater. 177–181 (1998)
373.
[14] P. Vajeeston, R. Vidya, P. Ravindran, H. Fjellvag, A. Kjekshus,
A. Skjeltorp, Phys. Rev. B 65 (2002) 075101.
[15] R. Dronskowski, P.E. Blochl, J. Phys. Chem. 97 (1993) 8617.
[16] O.K. Andersen, Phys. Rev. B 12 (1975) 3060;
O.K. Andersen, O. Jepsen, Phys. Rev. Lett. 53 (1984) 2571;
H.L. Skriver, The LMTO Method, Springer, Heidelberg, 1984.
[17] G. Krier, O. Jepsen, A. Burkhardt, O.K. Andersen, Tight
Binding LMTO-ASA Program Version 4.7, Stuttgart, Germany,
2000.
[18] P. Vajeeston, P. Ravindran, R. Vidya, A. Kjekshus, H. Fjellvag,
V.A. Yartys, Phys. Rev. B 67 (2003) 014101.
[19] M. Sen, S. Giri, K. Ghoshray, G. Bandyopadhyay, G.
Ghoshray, N. Chatterjee, Solid State Commun. 89 (1994) 327.
[20] A. Savin, R. Nesper, S. Wengert, T. Fassler, Angew. Chem. Int.
Ed. Engl. 36 (1997) 1809.
[21] A.L. Ruoff, H. Xia, H. Luo, Y.K. Vohra, Rev. Sci. Instrum.
61 (1990) 3830.
[22] W.B. Holzapfel, Rep. Prog. Phys. 59 (1996) 29.
[23] R.J. Hemley, N.W. Ashcroft, Phys. Today 51 (1998) 26.
[24] T. Suski, W. Paul (Eds.), High Pressure in Semiconductor
Physics I, Vol. 54, Academic Press, London, 1998.
[25] Y. Chen, J.S. Williams, J. Alloys Compd. 217 (1995) 181.
[26] J.P. Bastide, B. Bonnetot, J.M. Letoffe, P. Claudy, Mat. Res.
Bull. 15 (1980) 1215.
[27] M. Bortz, B. Bertheville, G. B^ttger, K. Yvon, J. Alloys Compd.
287 (1999) L4.
[28] J.E. Lowther, J.K. Dewhurst, J.M. Leger, J. Haines, Phys.
Rev. B 60 (1999) 14485;
J. Haines, J.M. Leger, O. Schulte, J. Phys.: Condens. Matter
8 (1996) 1631.
[29] P. Vajeeston, P. Ravindran, A. Kjekshus, H. Fjellvag, Phys. Rev.
Lett. 89 (2002) 175506.
[30] J.P. Perdew, in: P. Ziesche, H. Eschrig (Eds.), Electronic
Structure of Solids, Akademie, Berlin, 1991, p. 11;
J.P. Perdew, K. Burke, Y. Wang, Phys. Rev. B 54 (1996) 16533;
J.P. Perdew, K. Burke, M. Ernzerhof, Phys. Rev. Lett. 77 (1996)
3865.
[31] P.E. Blochl, Phys. Rev. B 50 (1994) 17953;
G. Kresse, J. Joubert, Phys. Rev. B 59 (1999) 1758.
[32] J. Haines, J.M. Leger, O. Schulte, J. Phys.: Condens. Matter
8 (1996) 1631.
[33] L.S. Dubrovinsky, N.A. Dubrovinskaia, V. Swamy, J. Muscat,
N.M. Harrison, R. Ahuja, B. Holm, B. Johansson, Nature
(London) 410 (2001) 653;
N.A. Dubrovinskaia, L.S. Dubrovinsky, R. Ahuja, V.B.
Prokopenko, V. Dmitriev, J.P. Weber, J.M. Osirio-Guillen,
B. Johansson, Phys. Rev. Lett. 87 (2001) 275501.
[34] P. Vajeeston, P. Ravindran, R. Vidya, H. Fjellvag, A. Kjekshus,
Appl. Phys. Lett. 82 (2003) 2257.
[35] M.J. Mehl, B.M. Klein, D.A. Papaconstantopoulos, in:
J.H. Westbrook, R.L. Fleischer (Eds.), Intermetallic Com-
pounds: Principles, Vol. 1, Wiley, New York, 1994, p. 195.
[36] P. Ravindran, L. Fast, P.A. Korzhavyi, B. Johansson,
J.M. Wills, O. Eriksson, J. Appl. Phys. 84 (1998) 4891.
[37] G. Kresse, J. Hafner, Phys. Rev. B 47 (1993) 558;
G. Kresse, J. Furthmuller, Comput. Mater. Sci. 6 (1996) 15.
[38] P. Ravindran, P. Vajeeston, R. Vidya, A. Kjekshus, H. Fjellvag,
Phys. Rev. B 64 (2001) 224509.
[39] K. Tanaka, K. Okamoto, H. Inui, Y. Minonishi, M. Yamaguchi,
M. Koiwa, Phil. Mag. A 73 (1996) 1475.
[40] D.M. Ceperly, B.J. Alder, Phys. Rev. Lett. 45 (1980) 566;
J.P. Perdew, A. Zunger, Phys. Rev. B 23 (1981) 5048.
[41] J.P. Perdew, J.A. Chevary, S.H. Vosko, K.A. Jackson, M.R.
Pederson, D.J. Singh, C. Fiolhais, Phys. Rev. B 46 (1992) 6671;
Y. Wang, J.P. Perdew, Phys. Rev. B 44 (1991) 13298.
[42] J.G. Bednorz, K.A. Muller, Z. Phys. B 64 (1986) 189.
[43] R. von Helmolt, J. Wecker, B. Holzapfel, L. Shultz, K. Samwer,
Phys. Rev. Lett. 71 (1993) 2331.
[44] G. Pari, S.M. Jaya, G. Subramoniam, R. Asokamani, Phys.
Rev. B 51 (1995) 16575.
[45] Z. Yang, L. Ye, X. Xie, J. Phys. Cond. Matt. 12 (2000) 2737.
[46] V.I. Anisimov, J. Zaanen, O.K. Andersen, Phys. Rev. B 44
(1991) 943.
[47] I.V. Solovyev, P.H. Dederichs, V.I. Anisimov, Phys. Rev. B
50 (1994) 16861.
[48] S. Bouarab, A. Vega, M.A. Khan, Phys. Rev. B 54 (1996) 11271.
[49] H. Sawada, Y. Morikawa, K. Tarakura, N. Hamada, Phys.
Rev. B 56 (1997) 12154.
[50] J.B. Goodenough, Phys. Rev. 100 (1955) 564.
[51] P. Ravindran, H. Fjellvag, A. Kjekshus, A. Delin, O. Eriksson,
Phys. Rev. B 65 (2002) 064445.
[52] T. Saitoh, A.E. Bocquet, T. Mizokawa, H. Namatame, A.
Fujimori, M. Abbate, Y. Takeda, M. Takano, Phys. Rev. B
51 (1995) 13942.
[53] R. Mahendiran, S.K. Tiwary, A.K. Raychaudhuri, T.V.
Ramakrishnan, R. Mahesh, N. Rangavittal, C.N.R. Rao,
Phys. Rev. B 53 (1996) 3348.
[54] G.H. Jonker, Physica 20 (1954) 1118.
ARTICLE IN PRESSP. Ravindran et al. / Journal of Solid State Chemistry 176 (2003) 338–374 371
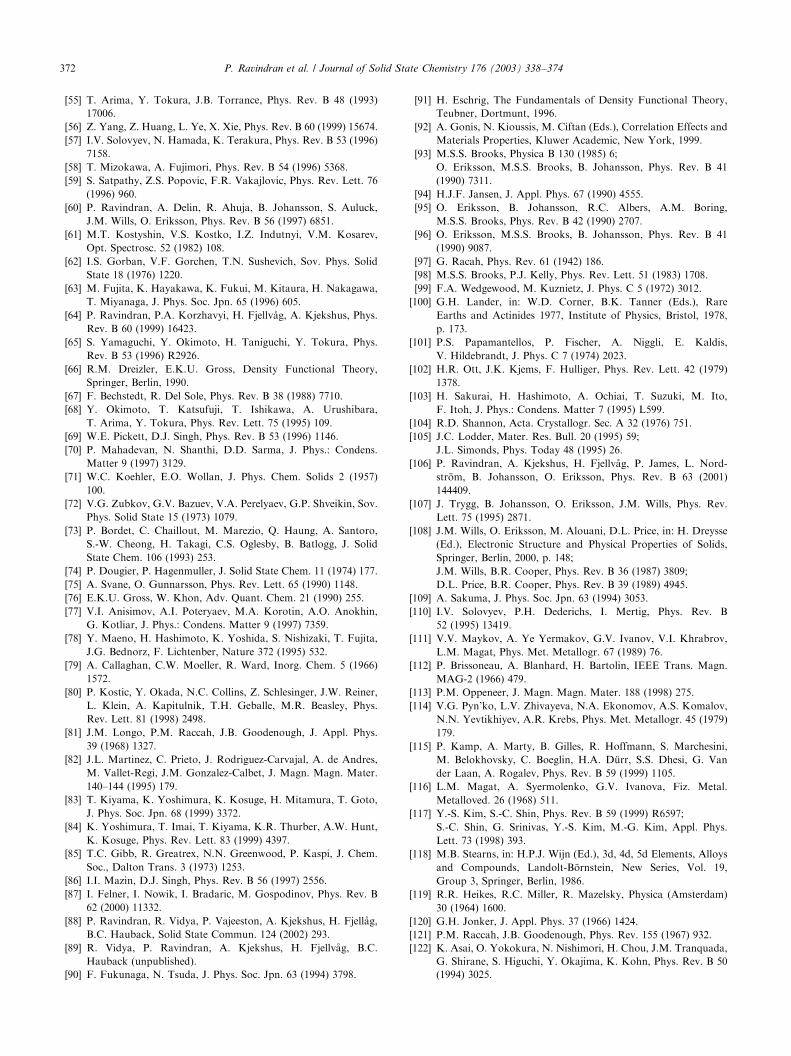
[55] T. Arima, Y. Tokura, J.B. Torrance, Phys. Rev. B 48 (1993)
17006.
[56] Z. Yang, Z. Huang, L. Ye, X. Xie, Phys. Rev. B 60 (1999) 15674.
[57] I.V. Solovyev, N. Hamada, K. Terakura, Phys. Rev. B 53 (1996)
7158.
[58] T. Mizokawa, A. Fujimori, Phys. Rev. B 54 (1996) 5368.
[59] S. Satpathy, Z.S. Popovic, F.R. Vakajlovic, Phys. Rev. Lett. 76
(1996) 960.
[60] P. Ravindran, A. Delin, R. Ahuja, B. Johansson, S. Auluck,
J.M. Wills, O. Eriksson, Phys. Rev. B 56 (1997) 6851.
[61] M.T. Kostyshin, V.S. Kostko, I.Z. Indutnyi, V.M. Kosarev,
Opt. Spectrosc. 52 (1982) 108.
[62] I.S. Gorban, V.F. Gorchen, T.N. Sushevich, Sov. Phys. Solid
State 18 (1976) 1220.
[63] M. Fujita, K. Hayakawa, K. Fukui, M. Kitaura, H. Nakagawa,
T. Miyanaga, J. Phys. Soc. Jpn. 65 (1996) 605.
[64] P. Ravindran, P.A. Korzhavyi, H. Fjellvag, A. Kjekshus, Phys.
Rev. B 60 (1999) 16423.
[65] S. Yamaguchi, Y. Okimoto, H. Taniguchi, Y. Tokura, Phys.
Rev. B 53 (1996) R2926.
[66] R.M. Dreizler, E.K.U. Gross, Density Functional Theory,
Springer, Berlin, 1990.
[67] F. Bechstedt, R. Del Sole, Phys. Rev. B 38 (1988) 7710.
[68] Y. Okimoto, T. Katsufuji, T. Ishikawa, A. Urushibara,
T. Arima, Y. Tokura, Phys. Rev. Lett. 75 (1995) 109.
[69] W.E. Pickett, D.J. Singh, Phys. Rev. B 53 (1996) 1146.
[70] P. Mahadevan, N. Shanthi, D.D. Sarma, J. Phys.: Condens.
Matter 9 (1997) 3129.
[71] W.C. Koehler, E.O. Wollan, J. Phys. Chem. Solids 2 (1957)
100.
[72] V.G. Zubkov, G.V. Bazuev, V.A. Perelyaev, G.P. Shveikin, Sov.
Phys. Solid State 15 (1973) 1079.
[73] P. Bordet, C. Chaillout, M. Marezio, Q. Haung, A. Santoro,
S.-W. Cheong, H. Takagi, C.S. Oglesby, B. Batlogg, J. Solid
State Chem. 106 (1993) 253.
[74] P. Dougier, P. Hagenmuller, J. Solid State Chem. 11 (1974) 177.
[75] A. Svane, O. Gunnarsson, Phys. Rev. Lett. 65 (1990) 1148.
[76] E.K.U. Gross, W. Khon, Adv. Quant. Chem. 21 (1990) 255.
[77] V.I. Anisimov, A.I. Poteryaev, M.A. Korotin, A.O. Anokhin,
G. Kotliar, J. Phys.: Condens. Matter 9 (1997) 7359.
[78] Y. Maeno, H. Hashimoto, K. Yoshida, S. Nishizaki, T. Fujita,
J.G. Bednorz, F. Lichtenber, Nature 372 (1995) 532.
[79] A. Callaghan, C.W. Moeller, R. Ward, Inorg. Chem. 5 (1966)
1572.
[80] P. Kostic, Y. Okada, N.C. Collins, Z. Schlesinger, J.W. Reiner,
L. Klein, A. Kapitulnik, T.H. Geballe, M.R. Beasley, Phys.
Rev. Lett. 81 (1998) 2498.
[81] J.M. Longo, P.M. Raccah, J.B. Goodenough, J. Appl. Phys.
39 (1968) 1327.
[82] J.L. Martinez, C. Prieto, J. Rodriguez-Carvajal, A. de Andres,
M. Vallet-Regi, J.M. Gonzalez-Calbet, J. Magn. Magn. Mater.
140–144 (1995) 179.
[83] T. Kiyama, K. Yoshimura, K. Kosuge, H. Mitamura, T. Goto,
J. Phys. Soc. Jpn. 68 (1999) 3372.
[84] K. Yoshimura, T. Imai, T. Kiyama, K.R. Thurber, A.W. Hunt,
K. Kosuge, Phys. Rev. Lett. 83 (1999) 4397.
[85] T.C. Gibb, R. Greatrex, N.N. Greenwood, P. Kaspi, J. Chem.
Soc., Dalton Trans. 3 (1973) 1253.
[86] I.I. Mazin, D.J. Singh, Phys. Rev. B 56 (1997) 2556.
[87] I. Felner, I. Nowik, I. Bradaric, M. Gospodinov, Phys. Rev. B
62 (2000) 11332.
[88] P. Ravindran, R. Vidya, P. Vajeeston, A. Kjekshus, H. Fjellag,
B.C. Hauback, Solid State Commun. 124 (2002) 293.
[89] R. Vidya, P. Ravindran, A. Kjekshus, H. Fjellvag, B.C.
Hauback (unpublished).
[90] F. Fukunaga, N. Tsuda, J. Phys. Soc. Jpn. 63 (1994) 3798.
[91] H. Eschrig, The Fundamentals of Density Functional Theory,
Teubner, Dortmunt, 1996.
[92] A. Gonis, N. Kioussis, M. Ciftan (Eds.), Correlation Effects and
Materials Properties, Kluwer Academic, New York, 1999.
[93] M.S.S. Brooks, Physica B 130 (1985) 6;
O. Eriksson, M.S.S. Brooks, B. Johansson, Phys. Rev. B 41
(1990) 7311.
[94] H.J.F. Jansen, J. Appl. Phys. 67 (1990) 4555.
[95] O. Eriksson, B. Johansson, R.C. Albers, A.M. Boring,
M.S.S. Brooks, Phys. Rev. B 42 (1990) 2707.
[96] O. Eriksson, M.S.S. Brooks, B. Johansson, Phys. Rev. B 41
(1990) 9087.
[97] G. Racah, Phys. Rev. 61 (1942) 186.
[98] M.S.S. Brooks, P.J. Kelly, Phys. Rev. Lett. 51 (1983) 1708.
[99] F.A. Wedgewood, M. Kuznietz, J. Phys. C 5 (1972) 3012.
[100] G.H. Lander, in: W.D. Corner, B.K. Tanner (Eds.), Rare
Earths and Actinides 1977, Institute of Physics, Bristol, 1978,
p. 173.
[101] P.S. Papamantellos, P. Fischer, A. Niggli, E. Kaldis,
V. Hildebrandt, J. Phys. C 7 (1974) 2023.
[102] H.R. Ott, J.K. Kjems, F. Hulliger, Phys. Rev. Lett. 42 (1979)
1378.
[103] H. Sakurai, H. Hashimoto, A. Ochiai, T. Suzuki, M. Ito,
F. Itoh, J. Phys.: Condens. Matter 7 (1995) L599.
[104] R.D. Shannon, Acta. Crystallogr. Sec. A 32 (1976) 751.
[105] J.C. Lodder, Mater. Res. Bull. 20 (1995) 59;
J.L. Simonds, Phys. Today 48 (1995) 26.
[106] P. Ravindran, A. Kjekshus, H. Fjellvag, P. James, L. Nord-
strom, B. Johansson, O. Eriksson, Phys. Rev. B 63 (2001)
144409.
[107] J. Trygg, B. Johansson, O. Eriksson, J.M. Wills, Phys. Rev.
Lett. 75 (1995) 2871.
[108] J.M. Wills, O. Eriksson, M. Alouani, D.L. Price, in: H. Dreysse
(Ed.), Electronic Structure and Physical Properties of Solids,
Springer, Berlin, 2000, p. 148;
J.M. Wills, B.R. Cooper, Phys. Rev. B 36 (1987) 3809;
D.L. Price, B.R. Cooper, Phys. Rev. B 39 (1989) 4945.
[109] A. Sakuma, J. Phys. Soc. Jpn. 63 (1994) 3053.
[110] I.V. Solovyev, P.H. Dederichs, I. Mertig, Phys. Rev. B
52 (1995) 13419.
[111] V.V. Maykov, A. Ye Yermakov, G.V. Ivanov, V.I. Khrabrov,
L.M. Magat, Phys. Met. Metallogr. 67 (1989) 76.
[112] P. Brissoneau, A. Blanhard, H. Bartolin, IEEE Trans. Magn.
MAG-2 (1966) 479.
[113] P.M. Oppeneer, J. Magn. Magn. Mater. 188 (1998) 275.
[114] V.G. Pyn’ko, L.V. Zhivayeva, N.A. Ekonomov, A.S. Komalov,
N.N. Yevtikhiyev, A.R. Krebs, Phys. Met. Metallogr. 45 (1979)
179.
[115] P. Kamp, A. Marty, B. Gilles, R. Hoffmann, S. Marchesini,
M. Belokhovsky, C. Boeglin, H.A. Durr, S.S. Dhesi, G. Van
der Laan, A. Rogalev, Phys. Rev. B 59 (1999) 1105.
[116] L.M. Magat, A. Syermolenko, G.V. Ivanova, Fiz. Metal.
Metalloved. 26 (1968) 511.
[117] Y.-S. Kim, S.-C. Shin, Phys. Rev. B 59 (1999) R6597;
S.-C. Shin, G. Srinivas, Y.-S. Kim, M.-G. Kim, Appl. Phys.
Lett. 73 (1998) 393.
[118] M.B. Stearns, in: H.P.J. Wijn (Ed.), 3d, 4d, 5d Elements, Alloys
and Compounds, Landolt-Bornstein, New Series, Vol. 19,
Group 3, Springer, Berlin, 1986.
[119] R.R. Heikes, R.C. Miller, R. Mazelsky, Physica (Amsterdam)
30 (1964) 1600.
[120] G.H. Jonker, J. Appl. Phys. 37 (1966) 1424.
[121] P.M. Raccah, J.B. Goodenough, Phys. Rev. 155 (1967) 932.
[122] K. Asai, O. Yokokura, N. Nishimori, H. Chou, J.M. Tranquada,
G. Shirane, S. Higuchi, Y. Okajima, K. Kohn, Phys. Rev. B 50
(1994) 3025.
ARTICLE IN PRESSP. Ravindran et al. / Journal of Solid State Chemistry 176 (2003) 338–374372
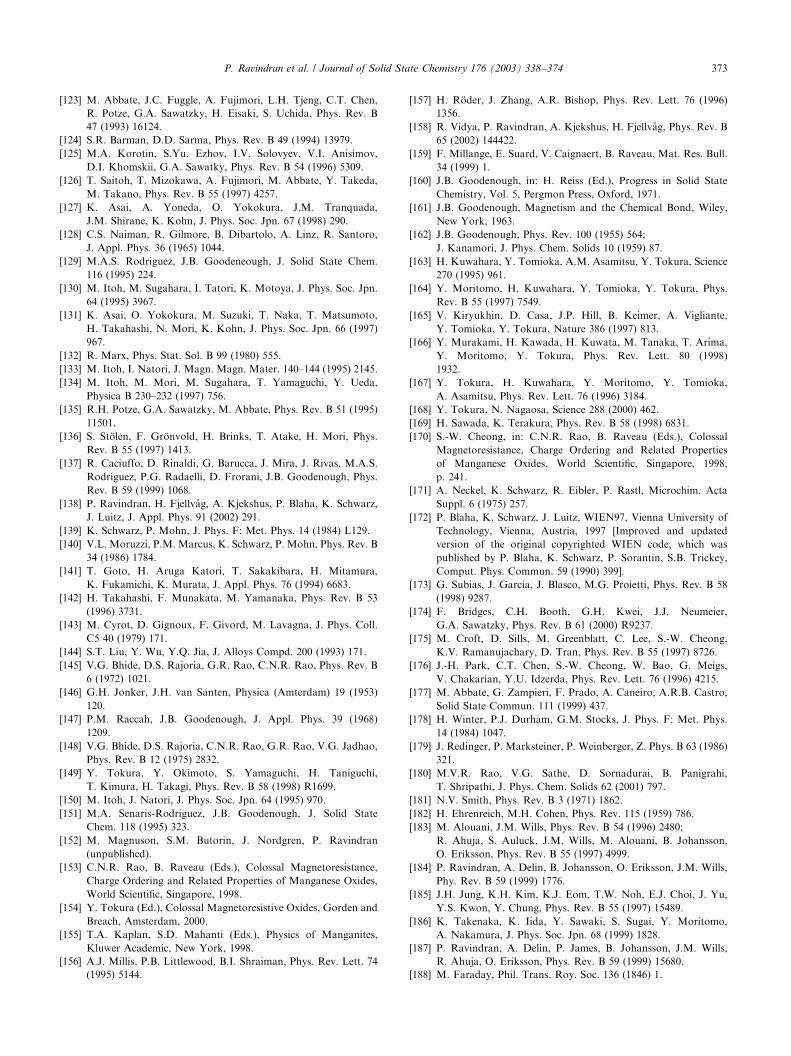
[123] M. Abbate, J.C. Fuggle, A. Fujimori, L.H. Tjeng, C.T. Chen,
R. Potze, G.A. Sawatzky, H. Eisaki, S. Uchida, Phys. Rev. B
47 (1993) 16124.
[124] S.R. Barman, D.D. Sarma, Phys. Rev. B 49 (1994) 13979.
[125] M.A. Korotin, S.Yu. Ezhov, I.V. Solovyev, V.I. Anisimov,
D.I. Khomskii, G.A. Sawatky, Phys. Rev. B 54 (1996) 5309.
[126] T. Saitoh, T. Mizokawa, A. Fujimori, M. Abbate, Y. Takeda,
M. Takano, Phys. Rev. B 55 (1997) 4257.
[127] K. Asai, A. Yoneda, O. Yokokura, J.M. Tranquada,
J.M. Shirane, K. Kohn, J. Phys. Soc. Jpn. 67 (1998) 290.
[128] C.S. Naiman, R. Gilmore, B. Dibartolo, A. Linz, R. Santoro,
J. Appl. Phys. 36 (1965) 1044.
[129] M.A.S. Rodriguez, J.B. Goodeneough, J. Solid State Chem.
116 (1995) 224.
[130] M. Itoh, M. Sugahara, I. Tatori, K. Motoya, J. Phys. Soc. Jpn.
64 (1995) 3967.
[131] K. Asai, O. Yokokura, M. Suzuki, T. Naka, T. Matsumoto,
H. Takahashi, N. Mori, K. Kohn, J. Phys. Soc. Jpn. 66 (1997)
967.
[132] R. Marx, Phys. Stat. Sol. B 99 (1980) 555.
[133] M. Itoh, I. Natori, J. Magn. Magn. Mater. 140–144 (1995) 2145.
[134] M. Itoh, M. Mori, M. Sugahara, T. Yamaguchi, Y. Ueda,
Physica B 230–232 (1997) 756.
[135] R.H. Potze, G.A. Sawatzky, M. Abbate, Phys. Rev. B 51 (1995)
11501.
[136] S. Stolen, F. Gronvold, H. Brinks, T. Atake, H. Mori, Phys.
Rev. B 55 (1997) 1413.
[137] R. Caciuffo, D. Rinaldi, G. Barucca, J. Mira, J. Rivas, M.A.S.
Rodriguez, P.G. Radaelli, D. Frorani, J.B. Goodenough, Phys.
Rev. B 59 (1999) 1068.
[138] P. Ravindran, H. Fjellvag, A. Kjekshus, P. Blaha, K. Schwarz,
J. Luitz, J. Appl. Phys. 91 (2002) 291.
[139] K. Schwarz, P. Mohn, J. Phys. F: Met. Phys. 14 (1984) L129.
[140] V.L. Moruzzi, P.M. Marcus, K. Schwarz, P. Mohn, Phys. Rev. B
34 (1986) 1784.
[141] T. Goto, H. Aruga Katori, T. Sakakibara, H. Mitamura,
K. Fukamichi, K. Murata, J. Appl. Phys. 76 (1994) 6683.
[142] H. Takahashi, F. Munakata, M. Yamanaka, Phys. Rev. B 53
(1996) 3731.
[143] M. Cyrot, D. Gignoux, F. Givord, M. Lavagna, J. Phys. Coll.
C5 40 (1979) 171.
[144] S.T. Liu, Y. Wu, Y.Q. Jia, J. Alloys Compd. 200 (1993) 171.
[145] V.G. Bhide, D.S. Rajoria, G.R. Rao, C.N.R. Rao, Phys. Rev. B
6 (1972) 1021.
[146] G.H. Jonker, J.H. van Santen, Physica (Amterdam) 19 (1953)
120.
[147] P.M. Raccah, J.B. Goodenough, J. Appl. Phys. 39 (1968)
1209.
[148] V.G. Bhide, D.S. Rajoria, C.N.R. Rao, G.R. Rao, V.G. Jadhao,
Phys. Rev. B 12 (1975) 2832.
[149] Y. Tokura, Y. Okimoto, S. Yamaguchi, H. Taniguchi,
T. Kimura, H. Takagi, Phys. Rev. B 58 (1998) R1699.
[150] M. Itoh, J. Natori, J. Phys. Soc. Jpn. 64 (1995) 970.
[151] M.A. Senaris-Rodriguez, J.B. Goodenough, J. Solid State
Chem. 118 (1995) 323.
[152] M. Magnuson, S.M. Butorin, J. Nordgren, P. Ravindran
(unpublished).
[153] C.N.R. Rao, B. Raveau (Eds.), Colossal Magnetoresistance,
Charge Ordering and Related Properties of Manganese Oxides,
World Scientific, Singapore, 1998.
[154] Y. Tokura (Ed.), Colossal Magnetoresistive Oxides, Gorden and
Breach, Amsterdam, 2000.
[155] T.A. Kaplan, S.D. Mahanti (Eds.), Physics of Manganites,
Kluwer Academic, New York, 1998.
[156] A.J. Millis, P.B. Littlewood, B.I. Shraiman, Phys. Rev. Lett. 74
(1995) 5144.
[157] H. Roder, J. Zhang, A.R. Bishop, Phys. Rev. Lett. 76 (1996)
1356.
[158] R. Vidya, P. Ravindran, A. Kjekshus, H. Fjellvag, Phys. Rev. B
65 (2002) 144422.
[159] F. Millange, E. Suard, V. Caignaert, B. Raveau, Mat. Res. Bull.
34 (1999) 1.
[160] J.B. Goodenough, in: H. Reiss (Ed.), Progress in Solid State
Chemistry, Vol. 5, Pergmon Press, Oxford, 1971.
[161] J.B. Goodenough, Magnetism and the Chemical Bond, Wiley,
New York, 1963.
[162] J.B. Goodenough, Phys. Rev. 100 (1955) 564;
J. Kanamori, J. Phys. Chem. Solids 10 (1959) 87.
[163] H. Kuwahara, Y. Tomioka, A.M. Asamitsu, Y. Tokura, Science
270 (1995) 961.
[164] Y. Moritomo, H. Kuwahara, Y. Tomioka, Y. Tokura, Phys.
Rev. B 55 (1997) 7549.
[165] V. Kiryukhin, D. Casa, J.P. Hill, B. Keimer, A. Vigliante,
Y. Tomioka, Y. Tokura, Nature 386 (1997) 813.
[166] Y. Murakami, H. Kawada, H. Kuwata, M. Tanaka, T. Arima,
Y. Moritomo, Y. Tokura, Phys. Rev. Lett. 80 (1998)
1932.
[167] Y. Tokura, H. Kuwahara, Y. Moritomo, Y. Tomioka,
A. Asamitsu, Phys. Rev. Lett. 76 (1996) 3184.
[168] Y. Tokura, N. Nagaosa, Science 288 (2000) 462.
[169] H. Sawada, K. Terakura, Phys. Rev. B 58 (1998) 6831.
[170] S.-W. Cheong, in: C.N.R. Rao, B. Raveau (Eds.), Colossal
Magnetoresistance, Charge Ordering and Related Properties
of Manganese Oxides, World Scientific, Singapore, 1998,
p. 241.
[171] A. Neckel, K. Schwarz, R. Eibler, P. Rastl, Microchim. Acta
Suppl. 6 (1975) 257.
[172] P. Blaha, K. Schwarz, J. Luitz, WIEN97, Vienna University of
Technology, Vienna, Austria, 1997 [Improved and updated
version of the original copyrighted WIEN code, which was
published by P. Blaha, K. Schwarz, P. Sorantin, S.B. Trickey,
Comput. Phys. Commun. 59 (1990) 399].
[173] G. Subias, J. Garcia, J. Blasco, M.G. Proietti, Phys. Rev. B 58
(1998) 9287.
[174] F. Bridges, C.H. Booth, G.H. Kwei, J.J. Neumeier,
G.A. Sawatzky, Phys. Rev. B 61 (2000) R9237.
[175] M. Croft, D. Sills, M. Greenblatt, C. Lee, S.-W. Cheong,
K.V. Ramanujachary, D. Tran, Phys. Rev. B 55 (1997) 8726.
[176] J.-H. Park, C.T. Chen, S.-W. Cheong, W. Bao, G. Meigs,
V. Chakarian, Y.U. Idzerda, Phys. Rev. Lett. 76 (1996) 4215.
[177] M. Abbate, G. Zampieri, F. Prado, A. Caneiro, A.R.B. Castro,
Solid State Commun. 111 (1999) 437.
[178] H. Winter, P.J. Durham, G.M. Stocks, J. Phys. F: Met. Phys.
14 (1984) 1047.
[179] J. Redinger, P. Marksteiner, P. Weinberger, Z. Phys. B 63 (1986)
321.
[180] M.V.R. Rao, V.G. Sathe, D. Sornadurai, B. Panigrahi,
T. Shripathi, J. Phys. Chem. Solids 62 (2001) 797.
[181] N.V. Smith, Phys. Rev. B 3 (1971) 1862.
[182] H. Ehrenreich, M.H. Cohen, Phys. Rev. 115 (1959) 786.
[183] M. Alouani, J.M. Wills, Phys. Rev. B 54 (1996) 2480;
R. Ahuja, S. Auluck, J.M. Wills, M. Alouani, B. Johansson,
O. Eriksson, Phys. Rev. B 55 (1997) 4999.
[184] P. Ravindran, A. Delin, B. Johansson, O. Eriksson, J.M. Wills,
Phy. Rev. B 59 (1999) 1776.
[185] J.H. Jung, K.H. Kim, K.J. Eom, T.W. Noh, E.J. Choi, J. Yu,
Y.S. Kwon, Y. Chung, Phys. Rev. B 55 (1997) 15489.
[186] K. Takenaka, K. Iida, Y. Sawaki, S. Sugai, Y. Moritomo,
A. Nakamura, J. Phys. Soc. Jpn. 68 (1999) 1828.
[187] P. Ravindran, A. Delin, P. James, B. Johansson, J.M. Wills,
R. Ahuja, O. Eriksson, Phys. Rev. B 59 (1999) 15680.
[188] M. Faraday, Phil. Trans. Roy. Soc. 136 (1846) 1.
ARTICLE IN PRESSP. Ravindran et al. / Journal of Solid State Chemistry 176 (2003) 338–374 373
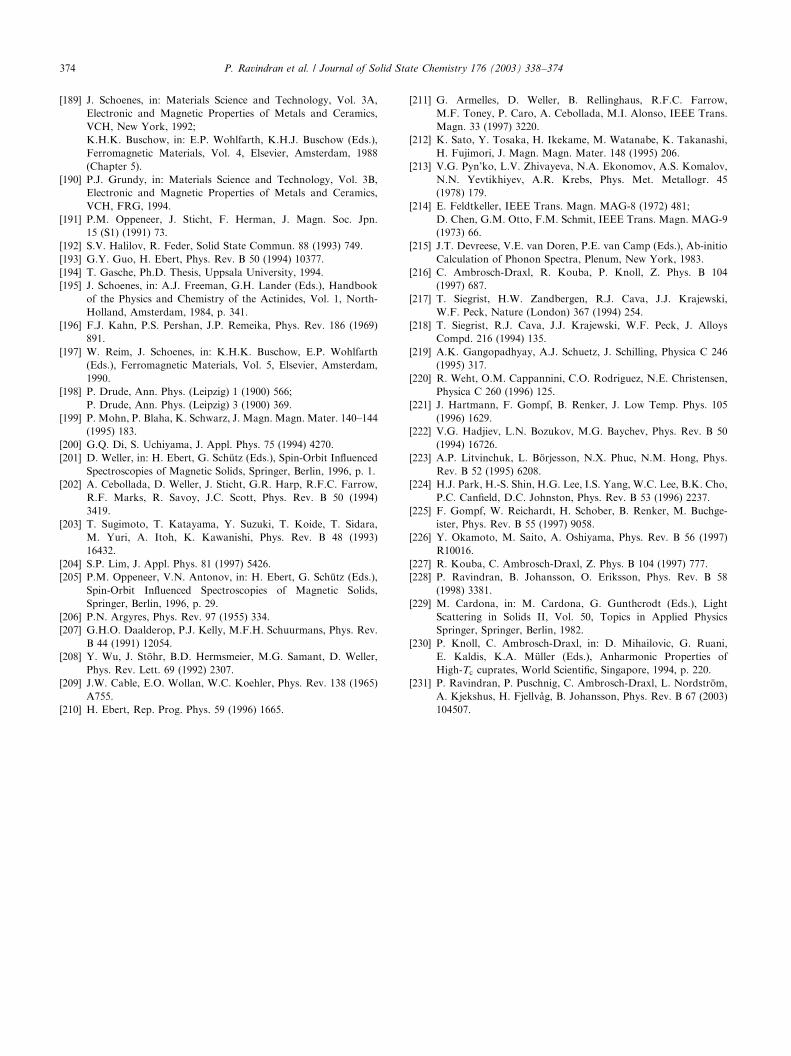
[189] J. Schoenes, in: Materials Science and Technology, Vol. 3A,
Electronic and Magnetic Properties of Metals and Ceramics,
VCH, New York, 1992;
K.H.K. Buschow, in: E.P. Wohlfarth, K.H.J. Buschow (Eds.),
Ferromagnetic Materials, Vol. 4, Elsevier, Amsterdam, 1988
(Chapter 5).
[190] P.J. Grundy, in: Materials Science and Technology, Vol. 3B,
Electronic and Magnetic Properties of Metals and Ceramics,
VCH, FRG, 1994.
[191] P.M. Oppeneer, J. Sticht, F. Herman, J. Magn. Soc. Jpn.
15 (S1) (1991) 73.
[192] S.V. Halilov, R. Feder, Solid State Commun. 88 (1993) 749.
[193] G.Y. Guo, H. Ebert, Phys. Rev. B 50 (1994) 10377.
[194] T. Gasche, Ph.D. Thesis, Uppsala University, 1994.
[195] J. Schoenes, in: A.J. Freeman, G.H. Lander (Eds.), Handbook
of the Physics and Chemistry of the Actinides, Vol. 1, North-
Holland, Amsterdam, 1984, p. 341.
[196] F.J. Kahn, P.S. Pershan, J.P. Remeika, Phys. Rev. 186 (1969)
891.
[197] W. Reim, J. Schoenes, in: K.H.K. Buschow, E.P. Wohlfarth
(Eds.), Ferromagnetic Materials, Vol. 5, Elsevier, Amsterdam,
1990.
[198] P. Drude, Ann. Phys. (Leipzig) 1 (1900) 566;
P. Drude, Ann. Phys. (Leipzig) 3 (1900) 369.
[199] P. Mohn, P. Blaha, K. Schwarz, J. Magn. Magn. Mater. 140–144
(1995) 183.
[200] G.Q. Di, S. Uchiyama, J. Appl. Phys. 75 (1994) 4270.
[201] D. Weller, in: H. Ebert, G. Schutz (Eds.), Spin-Orbit Influenced
Spectroscopies of Magnetic Solids, Springer, Berlin, 1996, p. 1.
[202] A. Cebollada, D. Weller, J. Sticht, G.R. Harp, R.F.C. Farrow,
R.F. Marks, R. Savoy, J.C. Scott, Phys. Rev. B 50 (1994)
3419.
[203] T. Sugimoto, T. Katayama, Y. Suzuki, T. Koide, T. Sidara,
M. Yuri, A. Itoh, K. Kawanishi, Phys. Rev. B 48 (1993)
16432.
[204] S.P. Lim, J. Appl. Phys. 81 (1997) 5426.
[205] P.M. Oppeneer, V.N. Antonov, in: H. Ebert, G. Schutz (Eds.),
Spin-Orbit Influenced Spectroscopies of Magnetic Solids,
Springer, Berlin, 1996, p. 29.
[206] P.N. Argyres, Phys. Rev. 97 (1955) 334.
[207] G.H.O. Daalderop, P.J. Kelly, M.F.H. Schuurmans, Phys. Rev.
B 44 (1991) 12054.
[208] Y. Wu, J. Stohr, B.D. Hermsmeier, M.G. Samant, D. Weller,
Phys. Rev. Lett. 69 (1992) 2307.
[209] J.W. Cable, E.O. Wollan, W.C. Koehler, Phys. Rev. 138 (1965)
A755.
[210] H. Ebert, Rep. Prog. Phys. 59 (1996) 1665.
[211] G. Armelles, D. Weller, B. Rellinghaus, R.F.C. Farrow,
M.F. Toney, P. Caro, A. Cebollada, M.I. Alonso, IEEE Trans.
Magn. 33 (1997) 3220.
[212] K. Sato, Y. Tosaka, H. Ikekame, M. Watanabe, K. Takanashi,
H. Fujimori, J. Magn. Magn. Mater. 148 (1995) 206.
[213] V.G. Pyn’ko, L.V. Zhivayeva, N.A. Ekonomov, A.S. Komalov,
N.N. Yevtikhiyev, A.R. Krebs, Phys. Met. Metallogr. 45
(1978) 179.
[214] E. Feldtkeller, IEEE Trans. Magn. MAG-8 (1972) 481;
D. Chen, G.M. Otto, F.M. Schmit, IEEE Trans. Magn. MAG-9
(1973) 66.
[215] J.T. Devreese, V.E. van Doren, P.E. van Camp (Eds.), Ab-initio
Calculation of Phonon Spectra, Plenum, New York, 1983.
[216] C. Ambrosch-Draxl, R. Kouba, P. Knoll, Z. Phys. B 104
(1997) 687.
[217] T. Siegrist, H.W. Zandbergen, R.J. Cava, J.J. Krajewski,
W.F. Peck, Nature (London) 367 (1994) 254.
[218] T. Siegrist, R.J. Cava, J.J. Krajewski, W.F. Peck, J. Alloys
Compd. 216 (1994) 135.
[219] A.K. Gangopadhyay, A.J. Schuetz, J. Schilling, Physica C 246
(1995) 317.
[220] R. Weht, O.M. Cappannini, C.O. Rodriguez, N.E. Christensen,
Physica C 260 (1996) 125.
[221] J. Hartmann, F. Gompf, B. Renker, J. Low Temp. Phys. 105
(1996) 1629.
[222] V.G. Hadjiev, L.N. Bozukov, M.G. Baychev, Phys. Rev. B 50
(1994) 16726.
[223] A.P. Litvinchuk, L. Borjesson, N.X. Phuc, N.M. Hong, Phys.
Rev. B 52 (1995) 6208.
[224] H.J. Park, H.-S. Shin, H.G. Lee, I.S. Yang, W.C. Lee, B.K. Cho,
P.C. Canfield, D.C. Johnston, Phys. Rev. B 53 (1996) 2237.
[225] F. Gompf, W. Reichardt, H. Schober, B. Renker, M. Buchge-
ister, Phys. Rev. B 55 (1997) 9058.
[226] Y. Okamoto, M. Saito, A. Oshiyama, Phys. Rev. B 56 (1997)
R10016.
[227] R. Kouba, C. Ambrosch-Draxl, Z. Phys. B 104 (1997) 777.
[228] P. Ravindran, B. Johansson, O. Eriksson, Phys. Rev. B 58
(1998) 3381.
[229] M. Cardona, in: M. Cardona, G. Gunthcrodt (Eds.), Light
Scattering in Solids II, Vol. 50, Topics in Applied Physics
Springer, Springer, Berlin, 1982.
[230] P. Knoll, C. Ambrosch-Draxl, in: D. Mihailovic, G. Ruani,
E. Kaldis, K.A. Muller (Eds.), Anharmonic Properties of
High-Tc cuprates, World Scientific, Singapore, 1994, p. 220.
[231] P. Ravindran, P. Puschnig, C. Ambrosch-Draxl, L. Nordstrom,
A. Kjekshus, H. Fjellvag, B. Johansson, Phys. Rev. B 67 (2003)
104507.
ARTICLE IN PRESSP. Ravindran et al. / Journal of Solid State Chemistry 176 (2003) 338–374374