ground-breaking events of the year - absl mutual fund · ground-breaking events of the year brexit...
TRANSCRIPT

Monthly Factsheet | January 2017
Ground-breakingevents of the year
BREXITUnited Kingdom's withdrawal
from the European Union
GOODS AND SERVICE TAX BILL101st Amendment to the
Constitution of India
US ELECTIONDonald Trump wins the
United States Presidential race
THAT HAS GONE DOWN IN HISTORY!A YEAR THAT HAS GONE DOWN IN HISTORY!
DEMONETISATION500 and 1000 rupee
notes banned

CEO Perspective
I
Year 2016 started on a good note. Continuing the momentum that started in 2015, broad economy was looking for direction of growth. Monsoon was relatively better, despite it doing a catch up game on and off. Finally it turned out to be good for the broad economy.
Pulse prices remained extremely volatile. However, Government was successful in keeping the inflation under control. Low commodity and oil price continued to favor India. In fact, metal commodity sector was so bad in the first quarter of year 2016, everyone almost believed that the sector has gone for a toss. It not only reflected in the demand supply equation of this sector more tilted towards supply, it also got reflected in the Dollar Bond Yield going up substantially in the overseas market. Luckily it did not last for long, as the supply demand equation moved to equilibrium due to supply reduction. Consequently, it led to upward movement in prices of metal commodities.
From the financial sector point of view, there were lots of tough moments in predicting various events. This was from BREXIT TO REXIT.
One thing didn’t work in 2016 was the so called analytics or predictions. All the intellects and intellectual discussion and debate did not yield any result as it was expected. It also ended in the same way with two major big outcome in November – the US presidential election and demonitisation
announcement in India. These things have made me believe strongly that unexpected outcome should be taken as a new normal in order to avoid any disappointment.
Indian Mutual Fund industry, during this period did exceptionally well and Indian money managers too did very well. The industry stayed focused on growing the pie. This is visible from the growth of the mutual fund industry. MF industry crossed an all-time AUM high of ̀ 16 lakh crores with an approximate growth of 23 per cent over the previous year. Systematic Investment Plan (SIP) registration not only moved up significantly, outstanding SIP of the industry crossed one-crore mark to touch 1.20 crore customers in monthly SIP subscription . Alongside, SIP per ticket average value too moved close to ` 4000 range from ` 2000 range few years back. In fact, monthly contribution of SIP book now constitutes close to 50% of the industry’s monthly inflow into equity mutual fund schemes. As a result, total gross-inflow into equity mutual fund schemes surpassed ` 2 lakh Crores and net-inflow being 65,516 crores this calendar year.
It is a well-known fact that Indian Mutual fund industry penetration is low and it has a long way to go in garnering more investors and their wallet shares across the country. Having said that, various types of education initiative undertaken by the industry players have resulted in increasing the customer base as well as increasing the share of B15 cities i.e. cities below Top 15 cities. In fact, B15 cities grew faster than the industry growth at about
29 per cent, compared with the industry growth of 22%.
As a result of significant inflow into the mutual fund schemes, the Mutual funds remained a net buyer in both equity and debt market. First time ever, during the period of the year when Foreign Institutional Investors(FIIs) remained net sellers. Mutual funds remained net buyers in the market along with other institutions.
In fact, in the year 2016, Indian Mutual fund industry emerged as one of the strongest force in the Indian capital market, playing an important role both in increasing penetration into Indian Households as well as increasing the mind share though educational activities. Financial literacy drives are becoming part and parcel of the MF industry and it will only gain more and more prominence in the coming years.
I would assume it is the beginning of the bigger leap forward for the industry and therefore I would say year 2016 was the year of creating a strong growth foundation for MF industry. The best will keep coming each year hereafter. Happy investing in mutual funds in the years to come, and I wish all the readers a Happy New year.
Investment Outlook-Equity
2016 was a phenomenal year! More things happened that never happened before. Brexit and Trump triumph were low probability outcomes until the voting day. The results gave voice to the powerful majority that was unheard before. The central banks of ECB and Japan set policy rates below zero which took over a third of the developed bonds to sub-zero levels. The fall in oil prices prompted the OPEC and other oil producing nations to collectively agree on production cuts for the first time in eight years. Closer home, a decade old effort to simplify indirect taxes found absolute consensus among all political parties to pass the GST bill. The government was bold enough to get the long standing bills like Real Estate (Regulation & Development) and Insolvency & Bankruptcy bills passed. It was bolder enough, in its continued effort to fight black money, to demonetize 86% of the currency in circulation – which no country in the world did in the past. Source: Publicly available information
What to expect in India?Due to demonetization consumption has taken a setback for next 2-3 quarters,likely to impact GDP to the tune of 100-150 bps in H2-FY17. Based on dependence on cash transactions and operating leverage, different sectors would be impacted in varying proportions. Some export oriented sectors or the ones in B2B segment are not affected at all. Just to quantify, among the Nifty companies, 43% (by weight) of companies in sectors like IT, pharma, oil & gas and Power are not impacted. 53% of companies in FMCG, autos, financials etc. may be impacted for less than two quarters. Only 4% of companies in cement & paints may see an impact for more than two quarters. Following the effect of Demonetization will be the implementation of GST. The businesses have to further readjust to the new indirect regime resulting in destocking and change in current operations. Though we see impact on growth in the short
term, both Demonetization and GST are immensely beneficial in the long run. The tax net would widen, tax compliance would improve, more banking services would be accessed and more businesses move into organized segment.Development is not only an economic necessity but also a political one. Elections now-a-days are won and lost based on development. As government is aware of it and it is also aware that there has been a set back in the near term, it is imperative for it to prop it up. Cutting direct taxes, subsidized housing, rural development and building infrastructure could be the key focus areas for the government. Source: Publicly available information
What to expect globally?Trump has three main agenda items – to cut corporate taxes from the current level of 35% to 15%; to spend USD 1 trillion on infrastructure
and to facilitate companies to repatriate capital from abroad. As these measures are US growth positive, the dollar index rallied to breach the 100 mark decisively, the 10 year US treasury pulled back 75 bps to breach the yield of 2.5% which was tested earlier and the US equity indices have been touching new lifetime highs. The reality could be entirely different from expectations as Trump would have to build political equity for all the three agenda items. Source: Publicly available information
China could continue to support investments in the economy through the quasi fiscal stimulus as it did last year. The weaker currency (depreciated 12% in 17 months), would help in exports. The soft landing is a work in progress for China. The comments and actions of Trump on China have to be closely watched. Source: Bloomberg
Eurozone will have a politically heavy year with a possibility that far right parties could win in France and Netherlands. As these parties initiate process to exit Eurozone and European
Monetary Union, markets could correct globally. Since this would be a multi year process, markets could overcome the uncertainty. The base case is EM outflows in the near term. This is based on the view that USD could be strong in the near term. The reversal could happen if market expectation on Trump are different from reality. Also EMs could see inflows if valuations become attractive. We expect the brent crude to trade in the band of 55-65 USD/bbl as it is difficult to enforce production cuts and shale gas production becomes viable at the lower end of the price band. This is good for Indian macro.
http://mutualfund.birlasunlife.com https://twitter.com/bslmf
https://www.facebook.com/bslmf https://www.linkedin.com/company/bslmfII

Investment Outlook-Equity
III
World economic growth looks good with a strong US, a stable China and a stimulating Japan. The outflows from EM markets may continue in the near term due to strong USD. As valuations become attractive, the flows into EMs would reverse. Source: Publicly available information
What to expect from the markets?In the next two to three quarters, macro data and companies’ results could be volatile. However, as things stabilize in H2-FY18, earnings could recover. We expect the earnings of Nifty companies to grow at 19% in FY18 led by financials and autos.The year 2017 will see lower bond yields and fixed deposit rates. It will see falling real estate and gold prices. It is equities that is providing a good alternative for investment with a medium term horizon. The valuations are reasonable & the base for sustained earnings growth is being set up. What are the action items?The Indian markets are in a consolidation phase due to two major reforms in the form of Demonetization and GST. One may go with a base case estimate of 10-15% returns from Nifty Index in the year 2017. The next six months would be a good time to build the portfolio in a staggered manner. The large cap, multi cap and balanced funds should be considered for investment. Incase of investors following SIPs – keep them going in which ever fund and category you have chosen. Source: Publicly available information
“In retrospect and in the line of sight, everything is obvious; it is looking beyond the obvious prospectively and over the line of sight is where the valuable insights are”
Wishing you all a very happy and prosperous 2017! Happy investing!
Source - BSLAMC

Rates have been falling over the past three years. Current 10-year bond is 1 standard deviation below mean over the previous two decades. As rates are mean reverting, conventional wisdom would suggest that one should start to realign their portfolio to the shorter end of the curve by exploiting carry instead of relying on duration strategies. But current macro-economic conditions suggest that there may be some more steam left in the rate markets. We expect bonds to rally further in the coming months. Many market participants have presented the case for an end of the rate easing cycle and pared their bond positions. But we think otherwise.
Generally, rate rally ends when there are signs of growth recovery. Monetary policy may still remain in an accommodative mode but bonds sell off as they sight a turn in the growth cycle. Yield curves steepen. Banking system is generally in stress but begins to see some improvement. Credit is generally slow, but there too, one starts to see pickup in activity levels.
Until the beginning of Nov, India was seeing mixed signs with respect to the advancement of the business cycle. There were hints that business cycle may be just beginning to turn around. But the gloomy mood amongst
investors, weak credit demand, low capacity utilization and inflation near decadal lows pointed at a sluggish recovery.
So what was it? Cycle reaching the peak or just a long due turnaround. We started to recalibrate our duration positions across the funds as odds of an end of the rate easing cycle rose over the past 3-6 months. We also seeded more carry across our funds to benefit from higher liquidity premia available in reasonable credits. But then came Nov 8th 2016 marked a historic event in India’s socio-economic history.
Here comes demonetization-
The overall impact of withdrawing such a large amount of high denomination currency notes from circulation is likely to be large and long lasting. We are all trying to ascertain the long term repercussions of this move. In our assessment, there is a threefold impact of this on growth- on account of the cash crunch, the dampening of the sentiments and the wealth destruction effect.
For a strangulated economy, there are many standard templates to rely upon. One can depreciate the currency to export-away the problem, increase the deficit funding to take up the slack or ease rates to help participants leverage. Given that exports aren’t the pivot of our growth, the options for us are either fiscal or monetary ones.
In fact, policy makers in India are seen protecting our currency quite zealously even in the last 2-3 months, which saw confluence of factors such as the Emerging Market (EM) sell off, USD appreciation, unabated outflows in both local bonds and equity markets and most importantly large Foreign Currency Non-Repatriable (FCNR) redemptions. Our currency remained well behaved and depreciated a lot less than many of our EM counterparts because the RBI remained a continuous supplier of USD in times of stress.
So will there be a Fiscal binge?
Since budget will be presented in just about a month, it is unlikely that enough data would be available to hint at any significant slowdown. More importantly, thus far, policy makers have shown very little worry of durable slowdown due to demonetization. Fiscal response, though a better one is generally used after lots of deliberation especially for a fiscal rule bound economy. Given our recent adherence to such a framework and the
orthodoxy surrounding it, it’s quite unlikely that budget would pave way for deficit financing led boost to growth I assign a low probability of any significant fiscal impulse in the upcoming budget.
And Monetary policy?
So the only option left for our policy makers is to use monetary policy to floor the problem. Our base case is that Consumer Price index (CPI) inflation (excluding allowance impact) is likely to average between 4-4.5% for FY18. Most of the recent inflation decline has been due to fall in the prices of perishables and pulses. I think the disinflationary process rolls over to FY18 as more durable impact of demonetization on housing sector and services economy may start to nudge core inflation lower. While local conditions remain apt to deliver substantial rate easing,
risks emanating from global economy are substantial. Most widely sighted risk is that of Fed tightening. Market’s consensus is of 2 hikes in 2017 (against Fed’s own dot plots of 3) and if the Fed delivers per expectations, we see little risk of big sell-off in treasuries. But as animal spirit rise in the USA, labor markets tighten and wage pressures accelerate, bond yields can harden further. (Source: Bloomberg)
Though most of the deflationary fears are behind us, markets haven’t moved on to expect meaningful rise in inflation in the USA. Sustained rise in USD would tame US inflation as well and will likely keep a lid on the risk of more than expected Fed tightening. But I am cognizant of the risk that tight dollar presents to the domestic rate cycle, though our reaction function isn’t as clearly established as it was in 2011-13 when we ran a substantial Current Account Deficit (CAD). Fed tightening is a bad omen for both rate and risk assets in emerging markets.
Investment Outlook-Debt
IVhttp://mutualfund.birlasunlife.com https://twitter.com/bslmf
https://www.facebook.com/bslmf https://www.linkedin.com/company/bslmf

Investment Outlook-Debt
V
So in such circumstances, when the Fed is tightening and China & other central bankers aren’t in a loosening mode, could India deliver substantial rate easing? I am certain that rate cuts could have been easy and aggressive in India had this risk not been there. But even with this risk, I think, outside the times of rapid EM sell off and consequent rise in USD, the policy room will be used up by our policy makers. But investors must know that the ongoing sell off in global bonds and USD tightness remains the single biggest risk to India’s bond bulls.
As our growth slowdown extends, aggressive rate response may come in. This would benefit the owners of duration in the fixed income markets. Markets may remain extremely volatile and investors should be patient in responding to such markets. Carry bets remain relatively less risky as they seem unaffected by global flows and are likely to behave like liquidity trades.
For the past three years, duration funds haven’t got money though they have been the best performers. It may very well be the fourth year of a similar trend. While deciding asset allocation in such volatile time investors should look at fixed income funds. Both carry and duration are likely to deliver superior returns versus fixed deposits and Fixed Maturity Period (FMP) like products. Volatility fearing investors should hide behind carry but some allocation to duration would yield alpha to one’s returns
Source- Bloomberg

Good to remember
http://mutualfund.birlasunlife.com https://twitter.com/bslmf
https://www.facebook.com/bslmf https://www.linkedin.com/company/bslmfVI
Hi, I am Mani Bachhan and I am here to share with you the financial plan of my life. I
hope it encourages you to plan your finances not just for your secure future but the
future of your loved ones too.
The SmartCub
When I was a kid,my aunt Mrs. Ameera Bachhan would give me 100 rupees.
I would immediately put 50 rupees in my piggy bank and the balance I would spend on sweets.
After a few years, I bought a bicycle for myself, thanks to my savings habit.
The NewRecruit
I have just secured my first job and am earning for the first time.
I now spend my income on some of my hobbies like photography and also contribute towards house expenses.
My mother Punji Bachhan encouraged me to save 10% of my income for my future, an advice I feel every youth should follow.
The idealPartner
I met a nice girl called Ms. Achhi and within a short time she became Mrs. Achhi Bachhan.
Since we planned to have children in the
very near future,
my wife and I decided to save 35% of our income towards our
future needs.
A FamilyMan
My wife and I had 2 kids, our boy we called Bada Bachhan and our daughter Chhoti Bachhan. Combining our household expenses with
their schooling fees, it amounted up to 50% of our incomes.
Of course to keep Bada, Chhoti and the wife happy I reserved another 30% of my income for expenses like movies, shopping, etc., which left
20% for savings, which was good enough.
+30% 20%+
Healthy financial habits to follow at every age
Mr. Fourwheels
We decided to invest in a car because as a family there were a lot of birthday parties, events and outings to attend.
When buying a car we followed
the 20-4-10 rule: 20% towards our down payment,
4 years in terms of financing
and Max 10% of our income towards our EMIs. This ensured
we never felt financially constrained.
20%
10%
4Years

Good to remember
VII
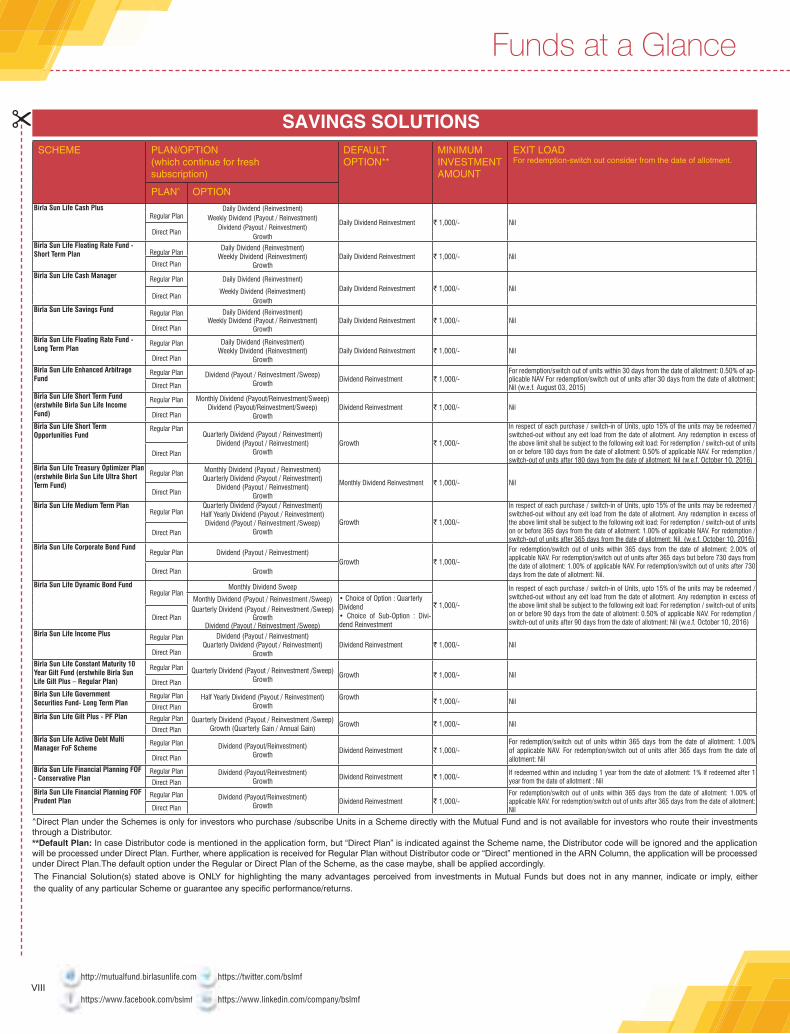
The Financial Solution(s) stated above is ONLY for highlighting the many advantages perceived from investments in Mutual Funds but does not in any manner, indicate or imply, either the quality of any particular Scheme or guarantee any specific performance/returns.
^Direct Plan under the Schemes is only for investors who purchase /subscribe Units in a Scheme directly with the Mutual Fund and is not available for investors who route their investments through a Distributor.**Default Plan: In case Distributor code is mentioned in the application form, but “Direct Plan” is indicated against the Scheme name, the Distributor code will be ignored and the application will be processed under Direct Plan. Further, where application is received for Regular Plan without Distributor code or “Direct” mentioned in the ARN Column, the application will be processed under Direct Plan.The default option under the Regular or Direct Plan of the Scheme, as the case maybe, shall be applied accordingly.
SCHEME PLAN/OPTION(which continue for fresh subscription)
DEFAULT OPTION**
MINIMUMINVESTMENTAMOUNT
EXIT LOADFor redemption-switch out consider from the date of allotment.
PLAN^ OPTION
Birla Sun Life Cash PlusRegular Plan
Daily Dividend (Reinvestment)
Daily Dividend Reinvestment ` 1,000/- NilWeekly Dividend (Payout / Reinvestment)
Direct PlanDividend (Payout / Reinvestment)
GrowthBirla Sun Life Floating Rate Fund - Short Term Plan Regular Plan
Daily Dividend (Reinvestment)Weekly Dividend (Reinvestment)
GrowthDaily Dividend Reinvestment ` 1,000/- Nil
Direct Plan
Birla Sun Life Cash Manager Regular Plan Daily Dividend (Reinvestment)Daily Dividend Reinvestment ` 1,000/- Nil
Direct PlanWeekly Dividend (Reinvestment)
GrowthBirla Sun Life Savings Fund Regular Plan Daily Dividend (Reinvestment)
Weekly Dividend (Payout / Reinvestment)Growth
Daily Dividend Reinvestment ` 1,000/- NilDirect Plan
Birla Sun Life Floating Rate Fund - Long Term Plan
Regular Plan Daily Dividend (Reinvestment)Weekly Dividend (Reinvestment)
GrowthDaily Dividend Reinvestment ` 1,000/- Nil
Direct Plan
Birla Sun Life Enhanced Arbitrage Fund
Regular Plan Dividend (Payout / Reinvestment /Sweep)Growth
Dividend Reinvestment ` 1,000/-For redemption/switch out of units within 30 days from the date of allotment: 0.50% of ap-plicable NAV For redemption/switch out of units after 30 days from the date of allotment: Nil (w.e.f. August 03, 2015)Direct Plan
Birla Sun Life Short Term Fund(erstwhile Birla Sun Life Income Fund)
Regular Plan Monthly Dividend (Payout/Reinvestment/Sweep)Dividend (Payout/Reinvestment/Sweep)
GrowthDividend Reinvestment ` 1,000/- Nil
Direct Plan
Birla Sun Life Short Term Opportunities Fund
Regular PlanQuarterly Dividend (Payout / Reinvestment)
Dividend (Payout / Reinvestment)Growth
Growth ` 1,000/-
In respect of each purchase / switch-in of Units, upto 15% of the units may be redeemed / switched-out without any exit load from the date of allotment. Any redemption in excess of the above limit shall be subject to the following exit load: For redemption / switch-out of units on or before 180 days from the date of allotment: 0.50% of applicable NAV. For redemption / switch-out of units after 180 days from the date of allotment: Nil (w.e.f. October 10, 2016)
Direct Plan
Birla Sun Life Treasury Optimizer Plan (erstwhile Birla Sun Life Ultra Short Term Fund)
Regular Plan Monthly Dividend (Payout / Reinvestment)Quarterly Dividend (Payout / Reinvestment)
Dividend (Payout / Reinvestment)Growth
Monthly Dividend Reinvestment ` 1,000/- Nil Direct Plan
Birla Sun Life Medium Term PlanRegular Plan
Quarterly Dividend (Payout / Reinvestment)Half Yearly Dividend (Payout / Reinvestment)
Dividend (Payout / Reinvestment /Sweep)Growth
Growth ` 1,000/-
In respect of each purchase / switch-in of Units, upto 15% of the units may be redeemed / switched-out without any exit load from the date of allotment. Any redemption in excess of the above limit shall be subject to the following exit load: For redemption / switch-out of units on or before 365 days from the date of allotment: 1.00% of applicable NAV. For redemption / switch-out of units after 365 days from the date of allotment: Nil. (w.e.f. October 10, 2016)
Direct Plan
Birla Sun Life Corporate Bond FundRegular Plan Dividend (Payout / Reinvestment)
Growth ` 1,000/-
For redemption/switch out of units within 365 days from the date of allotment: 2.00% of applicable NAV. For redemption/switch out of units after 365 days but before 730 days from the date of allotment: 1.00% of applicable NAV. For redemption/switch out of units after 730 days from the date of allotment: Nil.Direct Plan Growth
Birla Sun Life Dynamic Bond FundRegular Plan
Monthly Dividend Sweep
` 1,000/-
In respect of each purchase / switch-in of Units, upto 15% of the units may be redeemed / switched-out without any exit load from the date of allotment. Any redemption in excess of the above limit shall be subject to the following exit load: For redemption / switch-out of units on or before 90 days from the date of allotment: 0.50% of applicable NAV. For redemption / switch-out of units after 90 days from the date of allotment: Nil (w.e.f. October 10, 2016)
Monthly Dividend (Payout / Reinvestment /Sweep) • Choice of Option : Quarterly Dividend• Choice of Sub-Option : Divi-dend Reinvestment
Direct PlanQuarterly Dividend (Payout / Reinvestment /Sweep)
Growth Dividend (Payout / Reinvestment /Sweep)
Birla Sun Life Income Plus Regular Plan Dividend (Payout / Reinvestment) Quarterly Dividend (Payout / Reinvestment)
GrowthDividend Reinvestment ` 1,000/- Nil
Direct Plan
Birla Sun Life Constant Maturity 10 Year Gilt Fund (erstwhile Birla Sun Life Gilt Plus – Regular Plan)
Regular Plan Quarterly Dividend (Payout / Reinvestment /Sweep)Growth
Growth ` 1,000/- NilDirect Plan
Birla Sun Life Government Securities Fund- Long Term Plan
Regular Plan Half Yearly Dividend (Payout / Reinvestment)Growth
Growth` 1,000/- Nil
Direct PlanBirla Sun Life Gilt Plus - PF Plan Regular Plan Quarterly Dividend (Payout / Reinvestment /Sweep)
Growth (Quarterly Gain / Annual Gain)Growth ` 1,000/- Nil
Direct PlanBirla Sun Life Active Debt Multi Manager FoF Scheme
Regular Plan Dividend (Payout/Reinvestment)Growth
Dividend Reinvestment ` 1,000/-For redemption/switch out of units within 365 days from the date of allotment: 1.00% of applicable NAV. For redemption/switch out of units after 365 days from the date of allotment: NilDirect Plan
Birla Sun Life Financial Planning FOF - Conservative Plan
Regular Plan Dividend (Payout/Reinvestment)Growth
Dividend Reinvestment ` 1,000/- If redeemed within and including 1 year from the date of allotment: 1% If redeemed after 1 year from the date of allotment : NilDirect Plan
Birla Sun Life Financial Planning FOF Prudent Plan
Regular Plan Dividend (Payout/Reinvestment)Growth
Dividend Reinvestment ` 1,000/-For redemption/switch out of units within 365 days from the date of allotment: 1.00% of applicable NAV. For redemption/switch out of units after 365 days from the date of allotment: NilDirect Plan
SAVINGS SOLUTIONS
Funds at a Glance
http://mutualfund.birlasunlife.com https://twitter.com/bslmf
https://www.facebook.com/bslmf https://www.linkedin.com/company/bslmfVIII

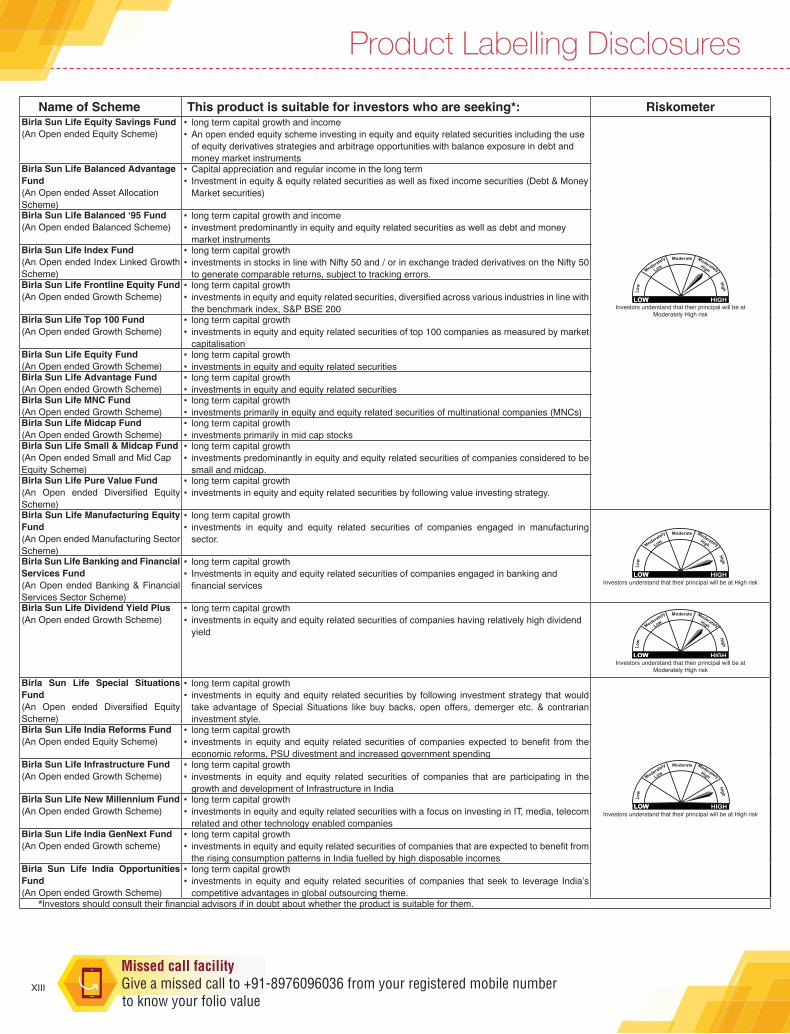
Product Labelling Disclosures
Name of Scheme This product is suitable for investors who are seeking*: RiskometerBirla Sun Life Cash Plus(An Open ended Liquid Scheme)
reasonable returns with high levels of safety and convenience of liquidity over short term•investments in high quality debt and money market instruments with maturity of upto 91 days •only
Investors understand that their principal will be at Low risk
Birla Sun Life Floating Rate Fund - Short Term Plan(An Open ended Income Scheme)
reasonable returns with convenience of liquidity over short term•investments in debt and money market instruments with maturity of upto 91 days only•
Birla Sun Life Cash Manager(An Open ended Income Scheme)
reasonable returns with convenience of liquidity over short term•investments in a basket of debt and money market instruments of very short maturities•
Investors understand that their principal will be at Moderately Low risk
Birla Sun Life Savings Fund(An Open ended Short Term Income Scheme)
reasonable returns with convenience of liquidity over short term•investments in debt and money market instruments•
Birla Sun Life Floating Rate Fund - Long Term Plan(An Open ended Income Scheme)
income with capital growth over short term•investments in a mix of fixed and floating rate debt and money market instruments•
Birla Sun Life Enhanced Arbitrage Fund(An Open ended Equity Scheme)
income over short term•investments in equity and equity related securities including derivatives for taking advantage •from the price differentials/mis-pricing prevailing for stock/index in various segments (Cash & Futures)
Investors understand that their principal will be at Moderate risk
Birla Sun Life Short Term Fund(An Open ended Income Scheme)
income with capital growth over short term•investments in debt and money market instruments•
Investors understand that their principal will be at Moderately Low risk
Birla Sun Life Short Term Opportunities Fund(An Open ended Income Scheme)
income with capital growth over short to medium term•investments in debt and money market instruments with short to medium term maturities across •the credit spectrum within the investment grade
Investors understand that their principal will be at Moderate risk
Birla Sun Life Treasury OptimizerPlan (erstwhile Birla Sun Life UltraShort Term Fund)(An Open ended Short Term Income Scheme)
reasonable returns with convenience of liquidity over short term•investments in debt and money market securities with relatively low levels of interest rate risk•
Birla Sun Life Medium Term Plan(An Open ended Income Scheme)
income with capital growth over medium to long term•investments in debt and money market instruments•
Birla Sun Life Corporate Bond Fund (An Open ended Income Scheme)
Income with capital growth over short to medium term•Investment in portfolio of corporate debt securities with short to medium term maturities across •the credit spectrum within the investment grade.
Birla Sun Life Dynamic Bond Fund(An Open ended Income Scheme)
income with capital growth over short term•investments in actively managed portfolio of high quality debt and money market instruments •including government securities
Birla Sun Life Income Plus(An Open ended Income Scheme)
income with capital growth over medium to long term•investments in a combination of debt and money market instruments including government •securities of varying maturities
Birla Sun Life Constant Maturity 10 Year Gilt Fund (erstwhile Birla Sun Life Gilt Plus – Regular Plan) (An Open ended Government Securities Scheme)
credit risk-free returns based on their own view on interest rate scenario over short to medium •terminvestments in a portfolio of Central Government securities of around 10 year average maturity.•
Birla Sun Life Government Securities Fund - Long TermPlan (An Open ended Gilt Scheme)
income with capital growth over medium to long term•investments exclusively in Government Securities•
Birla Sun Life Gilt Plus - PF Plan(An Open ended GovernmentSecurities Scheme)
income with capital growth over medium to long term•investments exclusively in Government Securities•
Birla Sun Life Active Debt Multi Manager FoF Scheme(An Open ended Fund of Funds Scheme)
Capital appreciation in the long term•Investment in a dynamically managed portfolio of debt funds•
Birla Sun Life Financial Planning FOF - Conservative Plan(An Open ended Fund of FundsScheme)
Capital appreciation through strategic asset allocation which is based on satisfying the needs to a •specific risk-return profile (Conservative) of investors in the long termInvestment in portfolio of mutual fund schemes (predominantly in liquid / money market funds & •debt funds)
Birla Sun Life Financial Planning FOF - Prudent Plan(An Open ended Fund of FundsScheme)
Capital appreciation through strategic asset allocation which is based on satisfying the needs to a •specific risk-return profile (Prudent) of investors in the long termInvestment in portfolio of mutual fund schemes (predominantly in a combination of equity funds, •liquid / money market funds & debt funds)
Investors understand that their principal will be at Moderately High risk
*Investors should consult their financial advisors if in doubt about whether the product is suitable for them.
IX

Funds at a Glance
^Direct Plan under the Schemes is only for investors who purchase /subscribe Units in a Scheme directly with the Mutual Fund and is not available for investors who route their investments through a Distributor.
The Financial Solution(s) stated above is ONLY for highlighting the many advantages perceived from investments in Mutual Funds but does not in any manner, indicate or imply, either the quality of any particular Scheme or guarantee any specific performance/returns.
**Default Plan: In case Distributor code is mentioned in the application form, but “Direct Plan” is indicated against the Scheme name, the Distributor code will be ignored and the application will be processed under Direct Plan. Further, where application is received for Regular Plan without Distributor code or “Direct” mentioned in the ARN Column, the application will be processed under Direct Plan.The default option under the Regular or Direct Plan of the Scheme, as the case maybe, shall be applied accordingly.
SCHEME PLAN/ OPTION DEFAULT OPTION** MINIMUMINVESTMENTAMOUNT
EXIT LOADFor redemption-switch out consider from the date of allotment.PLAN^ OPTION
Birla Sun Life MIP II - Savings 5 Plan Regular PlanMonthly Dividend (Payout / Reinvestment /Sweep)
Monthly PaymentGrowth
• Choice of Option : Growth• Choice of Sub-Option within Monthly DividendOption : Dividend Reinvestment
` 1,000/-For redemption/switch out of units within 540 days from the date of allotment: 1.00% of the applicable NAV.For redemption/switch out of units after 540 days from the date of allotment: Nil.Direct Plan
Birla Sun Life MIP Regular PlanMonthly Dividend (Payout/Reinvestment/Sweep)
Monthly Payment (Instant / Deferred)Growth
• Choice of Option within Monthly Dividend : Dividend Reinvestment• Choice of Option within Monthly Payment Plan : Instant
` 1,000/-For redemption/switch out of units within 1095 days from the date of allotment: 1.00% of the applicable NAV.For redemption/switch out of units after 1095 days from the date of allotment: Nil. Direct Plan
Birla Sun Life Monthly IncomeRegular Plan
Monthly Dividend (Payout/Reinvestment/Sweep)Quarterly Dividend (Payout/Reinvestment/Sweep)
• Choice of Plan : Growth• Choice of Option within Monthly Dividend : Dividend Reinvestment• Choice of Plan within Quarterly Dividend : Dividend Reinvestment
` 1,000/-For redemption/switch out of units within 540 days from the date of allotment: 1.00% of the applicable NAV.For redemption/switch out of units after 540 days from the date of allotment: Nil. Direct Plan Growth
Birla Sun Life MIP II - Wealth 25 Plan
Regular PlanMonthly Dividend (Payout / Reinvestment /Sweep)
Monthly PaymentGrowth
• Choice of Option : Growth• Choice of Sub-Option within Monthly DividendOption : Dividend Reinvestment
` 1,000/-
In respect of each purchase / switch-in of Units, upto 15% of the units may be redeemed / switched-out without any exit load from the date of allotment.Any redemption in excess of the above limit shall be subject to the following exit load: For redemption / switch-out of units on or before 365 days from the date of allotment: 1.00% ofapplicable NAV. For redemption / switch-out of units after 365 days from the date of allotment: Nil. (w.e.f. October 10, 2016)
Direct Plan
REGULAR INCOME SOLUTIONS
SCHEME PLAN/ OPTION DEFAULT OPTION** MINIMUMINVESTMENTAMOUNT
EXIT LOADFor redemption-switch out consider from the date of allotment.PLAN^ OPTION
Birla Sun Life Tax Relief ‘96# Regular Plan Dividend (Payout/Sweep)Dividend Payout ` 500/- Nil
Direct Plan Growth
Birla Sun Life Tax Plan# Regular Plan Dividend (Payout/Sweep)Dividend Payout ` 500/- Nil
Direct Plan Growth
Birla Sun Life Tax Savings Fund Regular Plan Dividend (Payout)GrowthBonus
N.A as the scheme does not accept fresh subscriptions / Switch-in NilDirect Plan
TAX SAVINGS SOLUTIONS
The Financial Solution(s) stated above is ONLY for highlighting the many advantages perceived from investments in Mutual Funds but does not in any manner, indicate or imply, either the quality of any particular Scheme or guarantee any specific performance/returns.
^Direct Plan under the Schemes is only for investors who purchase /subscribe Units in a Scheme directly with the Mutual Fund and is not available for investors who route their investments through a Distributor.**Default Plan: In case Distributor code is mentioned in the application form, but “Direct Plan” is indicated against the Scheme name, the Distributor code will be ignored and the application will be processed under Direct Plan. Further, where application is received for Regular Plan without Distributor code or “Direct” mentioned in the ARN Column, the application will be processed under Direct Plan.The default option under the Regular or Direct Plan of the Scheme, as the case maybe, shall be applied accordingly.
#The Dividend Reinvestment Facility under the scheme have been discontinued w.e.f. February 12, 2015. Please refer addendum no. 07/2015 dated February 09, 2015 for further details.
http://mutualfund.birlasunlife.com https://twitter.com/bslmf
https://www.facebook.com/bslmf https://www.linkedin.com/company/bslmfX

Product Labelling Disclosures
Name of Scheme This product is suitable for investors who are seeking*: RiskometerBirla Sun Life MIP II - Savings 5Plan(An Open ended Income Scheme.Monthly income is not assured and issubject to availability of distributablesurplus)
regular income with capital growth over medium to long term•investments in debt and money market instruments as well as equity and equity related •securities [0-10%]
Investors understand that their principal will be at Moderate risk
Birla Sun Life MIP(An Open ended Income Scheme.Monthly income is not assured and is subject to availability of distributablesurplus)
regular income with capital growth over medium to long term.•investments in debt and money market instruments as well as equity and equity related •securities [upto 15%]
Birla Sun Life Monthly Income (An Open ended Income Scheme.Monthly income is not assured and issubject to availability of distributablesurplus)
regular income with capital growth over medium to long term•investments in debt and money market instruments as well as equity and equity related •securities [upto 15%]
Birla Sun Life MIP II - Wealth 25Plan(An Open ended Income Scheme.Monthly income is not assured and issubject to availability of distributablesurplus)
regular income with capital growth over medium to long term•investments in debt and money market instruments as well as equity and equity related •securities [20-30%]
Investors understand that their principal will be at Moderately High risk
Birla Sun Life Tax Relief ‘96(An Open Ended Equity Linked Savings Scheme (ELSS) with a lock-in of 3 years)
long term capital growth•investments in equity and equity related securities, with tax benefit under section 80C, subject to •eligibility
Investors understand that their principal will be at Moderately High risk
Birla Sun Life Tax Plan(An Open ended Equity Linked Savings Scheme (ELSS) with a lock-in of 3 years)
long term capital growth•investments in equity and equity related securities, with tax benefit under section 80C, subject to •eligibility
Birla Sun Life Tax SavingsFund(An Open ended Equity Linked Savings Scheme (ELSS) with a lock-in of 3 years
Investment in equity linked savings scheme (lock in period of 3 years) which aims to provide •medium to long term capital appreciation along with income tax rebateInvestment predominantly in equity and equity related securities•
Birla Sun Life Capital Protection Oriented Fund - Series 18, 19, 20, 21, 22 & 23(A Close ended Capital Protection Oriented Scheme)
capital protection and capital appreciation linked to equity market at the end of medium / long •term tenureinvestments in highest rates debt and money market instruments maturing on or before the •tenure of the scheme and equity and equity related securities
Investors understand that their principal will be at Moderately Low risk
Birla Sun Life Capital Protection Oriented Fund - Series 25 & 26 (A Close ended Capital Protection Oriented Scheme)
capital protection and capital appreciation linked to equity market at the end of medium / long •term tenureinvestments in highest rated debt and money market instruments maturing on or before the •tenure of the scheme and exposure to derivative instruments (long call options)
Birla Sun Life Emerging Leaders Fund - Series 1 to Series 6 (A Close ended Equity Scheme)
long term capital growth•investments in equity and equity related securities predominantly in small & midcap companies.•
Investors understand that their principal will be at Moderately High risk
Birla Sun Life Focused Equity Fund- Series 1 to Series 6(A Close ended Equity Scheme investing in Eligible Securities as per Rajiv Gandhi Equity Savings Scheme, 2013)
long term capital growth•investments in equity securities specified as Eligible Securities as per Rajiv Gandhi Equity Savings •Scheme, 2013, as amended from time to time
*Investors should consult their financial advisors if in doubt about whether the product is suitable for them.
XI
Funds at a Glance
http://mutualfund.birlasunlife.com https://twitter.com/bslmf
https://www.facebook.com/bslmf https://www.linkedin.com/company/bslmf
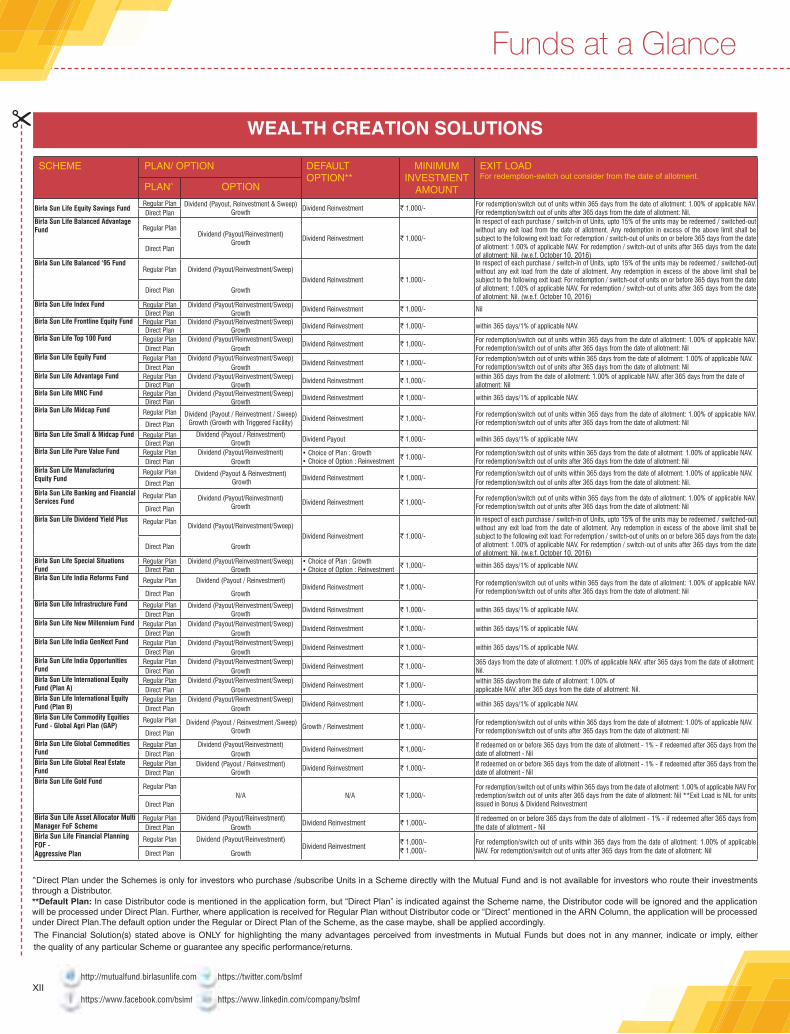
WEALTH CREATION SOLUTIONS
SCHEME PLAN/ OPTION DEFAULT OPTION**
MINIMUM INVESTMENT
AMOUNT
EXIT LOADFor redemption-switch out consider from the date of allotment.
PLAN^ OPTION
Birla Sun Life Equity Savings FundRegular Plan Dividend (Payout, Reinvestment & Sweep)
GrowthDividend Reinvestment ` 1,000/-
For redemption/switch out of units within 365 days from the date of allotment: 1.00% of applicable NAV. For redemption/switch out of units after 365 days from the date of allotment: Nil.Direct Plan
Birla Sun Life Balanced Advantage Fund Regular Plan
Dividend (Payout/Reinvestment)Growth
Dividend Reinvestment ` 1,000/-
In respect of each purchase / switch-in of Units, upto 15% of the units may be redeemed / switched-out without any exit load from the date of allotment. Any redemption in excess of the above limit shall be subject to the following exit load: For redemption / switch-out of units on or before 365 days from the date of allotment: 1.00% of applicable NAV. For redemption / switch-out of units after 365 days from the date of allotment: Nil. (w.e.f. October 10, 2016)
Direct Plan
Birla Sun Life Balanced ‘95 FundRegular Plan Dividend (Payout/Reinvestment/Sweep)
Dividend Reinvestment ` 1,000/-
In respect of each purchase / switch-in of Units, upto 15% of the units may be redeemed / switched-out without any exit load from the date of allotment. Any redemption in excess of the above limit shall be subject to the following exit load: For redemption / switch-out of units on or before 365 days from the date of allotment: 1.00% of applicable NAV. For redemption / switch-out of units after 365 days from the date of allotment: Nil. (w.e.f. October 10, 2016)
Direct Plan Growth
Birla Sun Life Index Fund Regular Plan Dividend (Payout/Reinvestment/Sweep)Dividend Reinvestment ` 1,000/- Nil
Direct Plan GrowthBirla Sun Life Frontline Equity Fund Regular Plan Dividend (Payout/Reinvestment/Sweep)
GrowthDividend Reinvestment ` 1,000/- within 365 days/1% of applicable NAV.
Direct PlanBirla Sun Life Top 100 Fund Regular Plan Dividend (Payout/Reinvestment/Sweep)
Dividend Reinvestment ` 1,000/-For redemption/switch out of units within 365 days from the date of allotment: 1.00% of applicable NAV. For redemption/switch out of units after 365 days from the date of allotment: NilDirect Plan Growth
Birla Sun Life Equity Fund Regular Plan Dividend (Payout/Reinvestment/Sweep)Dividend Reinvestment ` 1,000/- For redemption/switch out of units within 365 days from the date of allotment: 1.00% of applicable NAV.
For redemption/switch out of units after 365 days from the date of allotment: NilDirect Plan GrowthBirla Sun Life Advantage Fund Regular Plan Dividend (Payout/Reinvestment/Sweep)
Dividend Reinvestment ` 1,000/-within 365 days from the date of allotment: 1.00% of applicable NAV. after 365 days from the date of allotment: NilDirect Plan Growth
Birla Sun Life MNC Fund Regular Plan Dividend (Payout/Reinvestment/Sweep)Dividend Reinvestment ` 1,000/- within 365 days/1% of applicable NAV.
Direct Plan GrowthBirla Sun Life Midcap Fund Regular Plan Dividend (Payout / Reinvestment / Sweep)
Growth (Growth with Triggered Facility)Dividend Reinvestment ` 1,000/- For redemption/switch out of units within 365 days from the date of allotment: 1.00% of applicable NAV.
For redemption/switch out of units after 365 days from the date of allotment: NilDirect PlanBirla Sun Life Small & Midcap Fund Regular Plan Dividend (Payout / Reinvestment)
Dividend Payout ` 1,000/- within 365 days/1% of applicable NAV.Direct Plan Growth
Birla Sun Life Pure Value Fund Regular Plan Dividend (Payout/Reinvestment) • Choice of Plan : Growth• Choice of Option : Reinvestment
` 1,000/-For redemption/switch out of units within 365 days from the date of allotment: 1.00% of applicable NAV. For redemption/switch out of units after 365 days from the date of allotment: NilDirect Plan Growth
Birla Sun Life Manufacturing Equity Fund
Regular Plan Dividend (Payout & Reinvestment) Growth
Dividend Reinvestment ` 1,000/-For redemption/switch out of units within 365 days from the date of allotment: 1.00% of applicable NAV.For redemption/switch out of units after 365 days from the date of allotment: Nil.Direct Plan
Birla Sun Life Banking and Financial Services Fund
Regular Plan Dividend (Payout/Reinvestment)Growth
Dividend Reinvestment ` 1,000/-For redemption/switch out of units within 365 days from the date of allotment: 1.00% of applicable NAV. For redemption/switch out of units after 365 days from the date of allotment: NilDirect Plan
Birla Sun Life Dividend Yield Plus Regular PlanDividend (Payout/Reinvestment/Sweep)
Dividend Reinvestment ` 1,000/-
In respect of each purchase / switch-in of Units, upto 15% of the units may be redeemed / switched-out without any exit load from the date of allotment. Any redemption in excess of the above limit shall be subject to the following exit load: For redemption / switch-out of units on or before 365 days from the date of allotment: 1.00% of applicable NAV. For redemption / switch-out of units after 365 days from the date of allotment: Nil. (w.e.f. October 10, 2016)
Direct Plan Growth
Birla Sun Life Special Situations Fund
Regular Plan Dividend (Payout/Reinvestment/Sweep) • Choice of Plan : Growth• Choice of Option : Reinvestment
` 1,000/- within 365 days/1% of applicable NAV.Direct Plan Growth
Birla Sun Life India Reforms Fund Regular Plan Dividend (Payout / Reinvestment)Dividend Reinvestment ` 1,000/-
For redemption/switch out of units within 365 days from the date of allotment: 1.00% of applicable NAV. For redemption/switch out of units after 365 days from the date of allotment: NilDirect Plan Growth
Birla Sun Life Infrastructure Fund Regular Plan Dividend (Payout/Reinvestment/Sweep)Growth
Dividend Reinvestment ` 1,000/- within 365 days/1% of applicable NAV.Direct Plan
Birla Sun Life New Millennium Fund Regular Plan Dividend (Payout/Reinvestment/Sweep)Dividend Reinvestment ` 1,000/- within 365 days/1% of applicable NAV.
Direct Plan GrowthBirla Sun Life India GenNext Fund Regular Plan Dividend (Payout/Reinvestment/Sweep)
Dividend Reinvestment ` 1,000/- within 365 days/1% of applicable NAV.Direct Plan Growth
Birla Sun Life India Opportunities Fund
Regular Plan Dividend (Payout/Reinvestment/Sweep)Dividend Reinvestment ` 1,000/-
365 days from the date of allotment: 1.00% of applicable NAV. after 365 days from the date of allotment: Nil.Direct Plan Growth
Birla Sun Life International Equity Fund (Plan A)
Regular Plan Dividend (Payout/Reinvestment/Sweep)Dividend Reinvestment ` 1,000/-
within 365 daysfrom the date of allotment: 1.00% ofapplicable NAV. after 365 days from the date of allotment: Nil.Direct Plan Growth
Birla Sun Life International Equity Fund (Plan B)
Regular Plan Dividend (Payout/Reinvestment/Sweep)Dividend Reinvestment ` 1,000/- within 365 days/1% of applicable NAV.
Direct Plan GrowthBirla Sun Life Commodity Equities Fund - Global Agri Plan (GAP)
Regular Plan Dividend (Payout / Reinvestment /Sweep)Growth
Growth / Reinvestment ` 1,000/-For redemption/switch out of units within 365 days from the date of allotment: 1.00% of applicable NAV. For redemption/switch out of units after 365 days from the date of allotment: NilDirect Plan
Birla Sun Life Global Commodities Fund
Regular Plan Dividend (Payout/Reinvestment)Dividend Reinvestment ` 1,000/-
If redeemed on or before 365 days from the date of allotment - 1% - if redeemed after 365 days from the date of allotment - NilDirect Plan Growth
Birla Sun Life Global Real Estate Fund
Regular Plan Dividend (Payout / Reinvestment)Growth
Dividend Reinvestment ` 1,000/- If redeemed on or before 365 days from the date of allotment - 1% - if redeemed after 365 days from the date of allotment - NilDirect Plan
Birla Sun Life Gold FundRegular Plan
N/A N/A ` 1,000/-For redemption/switch out of units within 365 days from the date of allotment: 1.00% of applicable NAV For redemption/switch out of units after 365 days from the date of allotment: Nil **Exit Load is NIL for units issued in Bonus & Dividend ReinvestmentDirect Plan
Birla Sun Life Asset Allocator Multi Manager FoF Scheme
Regular Plan Dividend (Payout/Reinvestment)Dividend Reinvestment ` 1,000/-
If redeemed on or before 365 days from the date of allotment - 1% - if redeemed after 365 days from the date of allotment - NilDirect Plan Growth
Birla Sun Life Financial Planning FOF - Aggressive Plan
Regular Plan Dividend (Payout/Reinvestment)Dividend Reinvestment
` 1,000/-` 1,000/-
For redemption/switch out of units within 365 days from the date of allotment: 1.00% of applicable NAV. For redemption/switch out of units after 365 days from the date of allotment: NilDirect Plan Growth
The Financial Solution(s) stated above is ONLY for highlighting the many advantages perceived from investments in Mutual Funds but does not in any manner, indicate or imply, either the quality of any particular Scheme or guarantee any specific performance/returns.
^Direct Plan under the Schemes is only for investors who purchase /subscribe Units in a Scheme directly with the Mutual Fund and is not available for investors who route their investments through a Distributor.**Default Plan: In case Distributor code is mentioned in the application form, but “Direct Plan” is indicated against the Scheme name, the Distributor code will be ignored and the application will be processed under Direct Plan. Further, where application is received for Regular Plan without Distributor code or “Direct” mentioned in the ARN Column, the application will be processed under Direct Plan.The default option under the Regular or Direct Plan of the Scheme, as the case maybe, shall be applied accordingly.
XII
Product Labelling Disclosures
Name of Scheme This product is suitable for investors who are seeking*: RiskometerBirla Sun Life Equity Savings Fund(An Open ended Equity Scheme)
long term capital growth and income•An open ended equity scheme investing in equity and equity related securities including the use •of equity derivatives strategies and arbitrage opportunities with balance exposure in debt and money market instruments
Investors understand that their principal will be at Moderately High risk
Birla Sun Life Balanced AdvantageFund(An Open ended Asset AllocationScheme)
Capital appreciation and regular income in the long term•Investment in equity & equity related securities as well as fixed income securities (Debt & Money •Market securities)
Birla Sun Life Balanced ‘95 Fund(An Open ended Balanced Scheme)
long term capital growth and income•investment predominantly in equity and equity related securities as well as debt and money •market instruments
Birla Sun Life Index Fund(An Open ended Index Linked Growth Scheme)
long term capital growth•investments in stocks in line with Nifty 50 and / or in exchange traded derivatives on the Nifty 50 •to generate comparable returns, subject to tracking errors.
Birla Sun Life Frontline Equity Fund(An Open ended Growth Scheme)
long term capital growth•investments in equity and equity related securities, diversified across various industries in line with •the benchmark index, S&P BSE 200
Birla Sun Life Top 100 Fund(An Open ended Growth Scheme)
long term capital growth•investments in equity and equity related securities of top 100 companies as measured by market •capitalisation
Birla Sun Life Equity Fund(An Open ended Growth Scheme)
long term capital growth•investments in equity and equity related securities•
Birla Sun Life Advantage Fund(An Open ended Growth Scheme)
long term capital growth•investments in equity and equity related securities•
Birla Sun Life MNC Fund(An Open ended Growth Scheme)
long term capital growth•investments primarily in equity and equity related securities of multinational companies (MNCs)•
Birla Sun Life Midcap Fund(An Open ended Growth Scheme)
long term capital growth•investments primarily in mid cap stocks•
Birla Sun Life Small & Midcap Fund(An Open ended Small and Mid CapEquity Scheme)
long term capital growth•investments predominantly in equity and equity related securities of companies considered to be •small and midcap.
Birla Sun Life Pure Value Fund(An Open ended Diversified Equity Scheme)
long term capital growth•investments in equity and equity related securities by following value investing strategy.•
Birla Sun Life Manufacturing Equity Fund(An Open ended Manufacturing Sector Scheme)
long term capital growth•investments in equity and equity related securities of companies engaged in manufacturing •sector.
Investors understand that their principal will be at High risk
Birla Sun Life Banking and Financial Services Fund(An Open ended Banking & Financial Services Sector Scheme)
long term capital growth•Investments in equity and equity related securities of companies engaged in banking and •financial services
Birla Sun Life Dividend Yield Plus(An Open ended Growth Scheme)
long term capital growth•investments in equity and equity related securities of companies having relatively high dividend •yield
Investors understand that their principal will be at Moderately High risk
Birla Sun Life Special Situations Fund(An Open ended Diversified Equity Scheme)
long term capital growth•investments in equity and equity related securities by following investment strategy that would •take advantage of Special Situations like buy backs, open offers, demerger etc. & contrarian investment style.
Investors understand that their principal will be at High risk
Birla Sun Life India Reforms Fund(An Open ended Equity Scheme)
long term capital growth•investments in equity and equity related securities of companies expected to benefit from the •economic reforms, PSU divestment and increased government spending
Birla Sun Life Infrastructure Fund(An Open ended Growth Scheme)
long term capital growth•investments in equity and equity related securities of companies that are participating in the •growth and development of Infrastructure in India
Birla Sun Life New Millennium Fund(An Open ended Growth Scheme)
long term capital growth•investments in equity and equity related securities with a focus on investing in IT, media, telecom •related and other technology enabled companies
Birla Sun Life India GenNext Fund(An Open ended Growth scheme)
long term capital growth•investments in equity and equity related securities of companies that are expected to benefit from •the rising consumption patterns in India fuelled by high disposable incomes
Birla Sun Life India Opportunities Fund(An Open ended Growth Scheme)
long term capital growth•investments in equity and equity related securities of companies that seek to leverage India’s •competitive advantages in global outsourcing theme.
*Investors should consult their financial advisors if in doubt about whether the product is suitable for them.
XIII
Product Labelling Disclosures
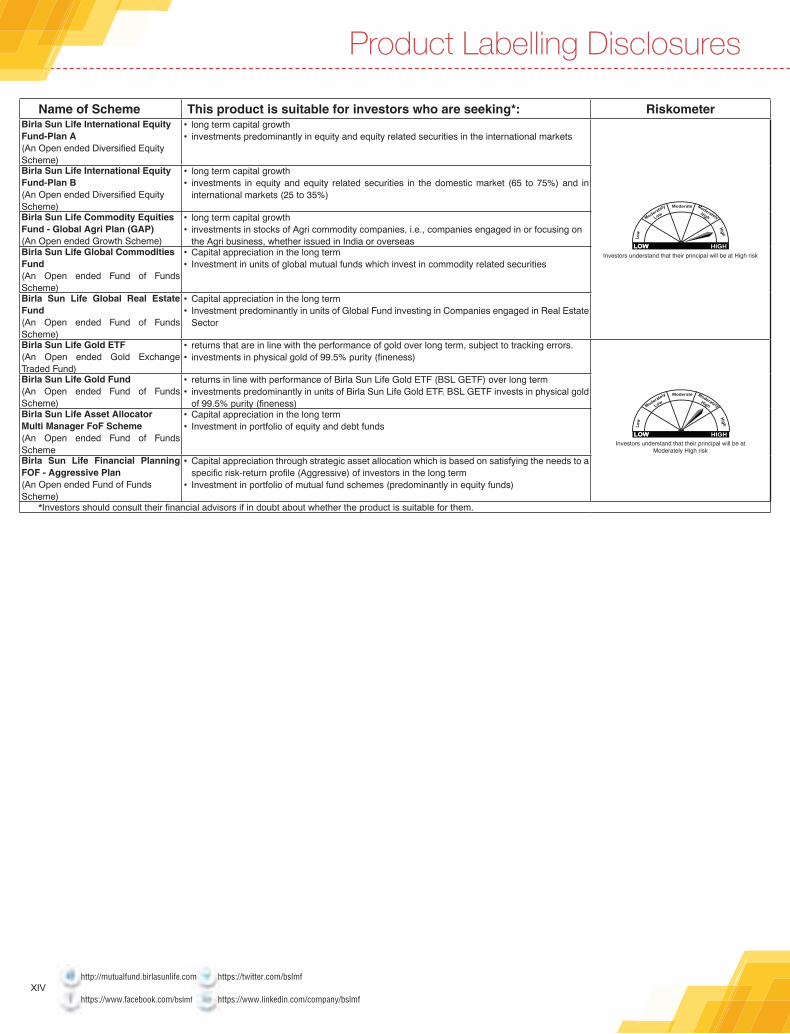
Name of Scheme This product is suitable for investors who are seeking*: RiskometerBirla Sun Life International EquityFund-Plan A(An Open ended Diversified EquityScheme)
long term capital growth•investments predominantly in equity and equity related securities in the international markets•
Investors understand that their principal will be at High risk
Birla Sun Life International EquityFund-Plan B(An Open ended Diversified EquityScheme)
long term capital growth•investments in equity and equity related securities in the domestic market (65 to 75%) and in •international markets (25 to 35%)
Birla Sun Life Commodity EquitiesFund - Global Agri Plan (GAP)(An Open ended Growth Scheme)
long term capital growth•investments in stocks of Agri commodity companies, i.e., companies engaged in or focusing on •the Agri business, whether issued in India or overseas
Birla Sun Life Global CommoditiesFund(An Open ended Fund of Funds Scheme)
Capital appreciation in the long term•Investment in units of global mutual funds which invest in commodity related securities•
Birla Sun Life Global Real Estate Fund(An Open ended Fund of Funds Scheme)
Capital appreciation in the long term•Investment predominantly in units of Global Fund investing in Companies engaged in Real Estate •Sector
Birla Sun Life Gold ETF(An Open ended Gold Exchange Traded Fund)
returns that are in line with the performance of gold over long term, subject to tracking errors.•investments in physical gold of 99.5% purity (fineness)•
Investors understand that their principal will be at Moderately High risk
Birla Sun Life Gold Fund(An Open ended Fund of Funds Scheme)
returns in line with performance of Birla Sun Life Gold ETF (BSL GETF) over long term•investments predominantly in units of Birla Sun Life Gold ETF. BSL GETF invests in physical gold •of 99.5% purity (fineness)
Birla Sun Life Asset AllocatorMulti Manager FoF Scheme(An Open ended Fund of Funds Scheme
Capital appreciation in the long term•Investment in portfolio of equity and debt funds•
Birla Sun Life Financial Planning FOF - Aggressive Plan(An Open ended Fund of FundsScheme)
Capital appreciation through strategic asset allocation which is based on satisfying the needs to a •specific risk-return profile (Aggressive) of investors in the long termInvestment in portfolio of mutual fund schemes (predominantly in equity funds)•
*Investors should consult their financial advisors if in doubt about whether the product is suitable for them.
http://mutualfund.birlasunlife.com https://twitter.com/bslmf
https://www.facebook.com/bslmf https://www.linkedin.com/company/bslmfXIV
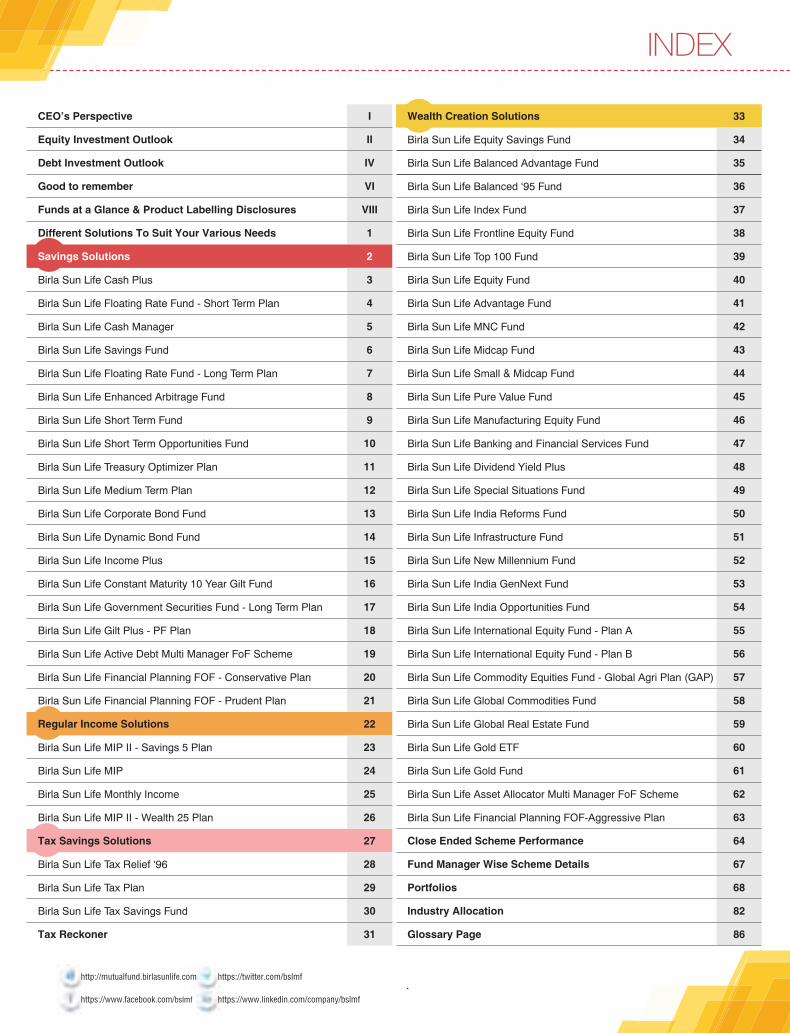
CEO’s Perspective I
Equity Investment Outlook II
Debt Investment Outlook IV
Good to remember VI
Funds at a Glance & Product Labelling Disclosures VIII
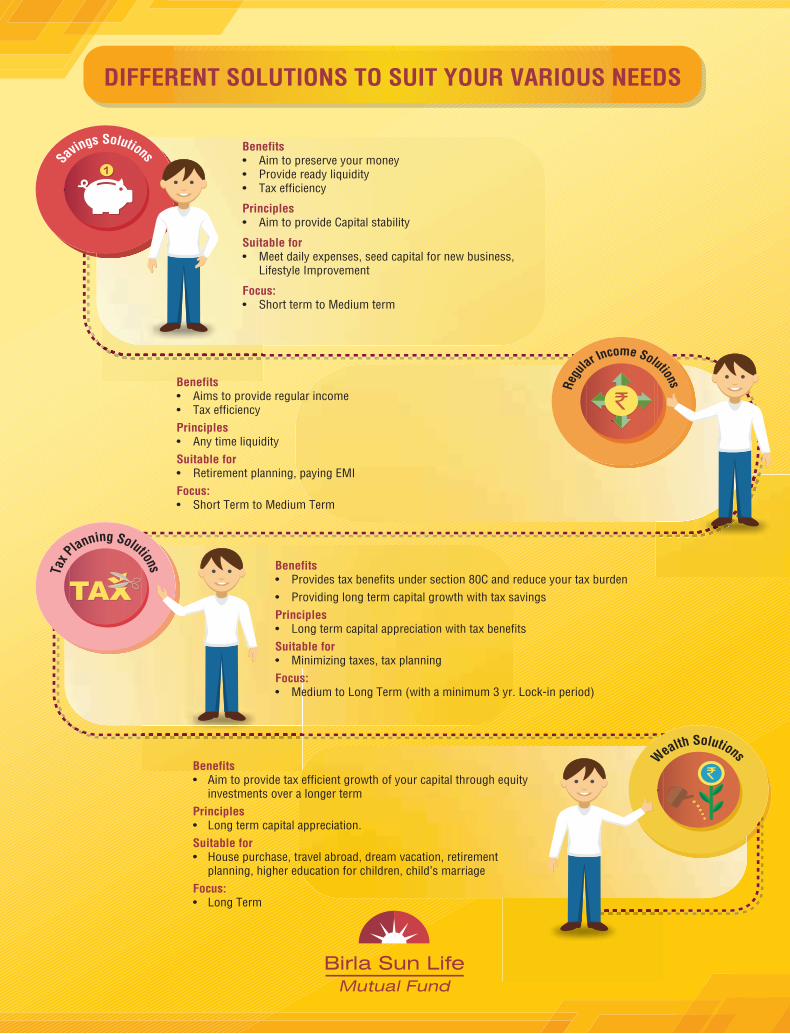
Different Solutions To Suit Your Various Needs 1
Savings Solutions 2
Birla Sun Life Cash Plus 3
Birla Sun Life Floating Rate Fund - Short Term Plan 4
Birla Sun Life Cash Manager 5
Birla Sun Life Savings Fund 6
Birla Sun Life Floating Rate Fund - Long Term Plan 7
Birla Sun Life Enhanced Arbitrage Fund 8
Birla Sun Life Short Term Fund 9
Birla Sun Life Short Term Opportunities Fund 10
Birla Sun Life Treasury Optimizer Plan 11
Birla Sun Life Medium Term Plan 12
Birla Sun Life Corporate Bond Fund 13
Birla Sun Life Dynamic Bond Fund 14
Birla Sun Life Income Plus 15
Birla Sun Life Constant Maturity 10 Year Gilt Fund 16
Birla Sun Life Government Securities Fund - Long Term Plan 17
Birla Sun Life Gilt Plus - PF Plan 18
Birla Sun Life Active Debt Multi Manager FoF Scheme 19
Birla Sun Life Financial Planning FOF - Conservative Plan 20
Birla Sun Life Financial Planning FOF - Prudent Plan 21
Regular Income Solutions 22
Birla Sun Life MIP II - Savings 5 Plan 23
Birla Sun Life MIP 24
Birla Sun Life Monthly Income 25
Birla Sun Life MIP II - Wealth 25 Plan 26
Tax Savings Solutions 27
Birla Sun Life Tax Relief ‘96 28
Birla Sun Life Tax Plan 29
Birla Sun Life Tax Savings Fund 30
Tax Reckoner 31
Wealth Creation Solutions 33
Birla Sun Life Equity Savings Fund 34
Birla Sun Life Balanced Advantage Fund 35
Birla Sun Life Balanced ‘95 Fund 36
Birla Sun Life Index Fund 37
Birla Sun Life Frontline Equity Fund 38
Birla Sun Life Top 100 Fund 39
Birla Sun Life Equity Fund 40
Birla Sun Life Advantage Fund 41
Birla Sun Life MNC Fund 42
Birla Sun Life Midcap Fund 43
Birla Sun Life Small & Midcap Fund 44
Birla Sun Life Pure Value Fund 45
Birla Sun Life Manufacturing Equity Fund 46
Birla Sun Life Banking and Financial Services Fund 47
Birla Sun Life Dividend Yield Plus 48
Birla Sun Life Special Situations Fund 49
Birla Sun Life India Reforms Fund 50
Birla Sun Life Infrastructure Fund 51
Birla Sun Life New Millennium Fund 52
Birla Sun Life India GenNext Fund 53
Birla Sun Life India Opportunities Fund 54
Birla Sun Life International Equity Fund - Plan A 55
Birla Sun Life International Equity Fund - Plan B 56
Birla Sun Life Commodity Equities Fund - Global Agri Plan (GAP) 57
Birla Sun Life Global Commodities Fund 58
Birla Sun Life Global Real Estate Fund 59
Birla Sun Life Gold ETF 60
Birla Sun Life Gold Fund 61
Birla Sun Life Asset Allocator Multi Manager FoF Scheme 62
Birla Sun Life Financial Planning FOF-Aggressive Plan 63
Close Ended Scheme Performance 64
Fund Manager Wise Scheme Details 67
Portfolios 68
Industry Allocation 82
Glossary Page 86
INDEX
http://mutualfund.birlasunlife.com https://twitter.com/bslmf
https://www.facebook.com/bslmf https://www.linkedin.com/company/bslmf

http://mutualfund.birlasunlife.com https://twitter.com/bslmf
https://www.facebook.com/bslmf https://www.linkedin.com/company/bslmf2
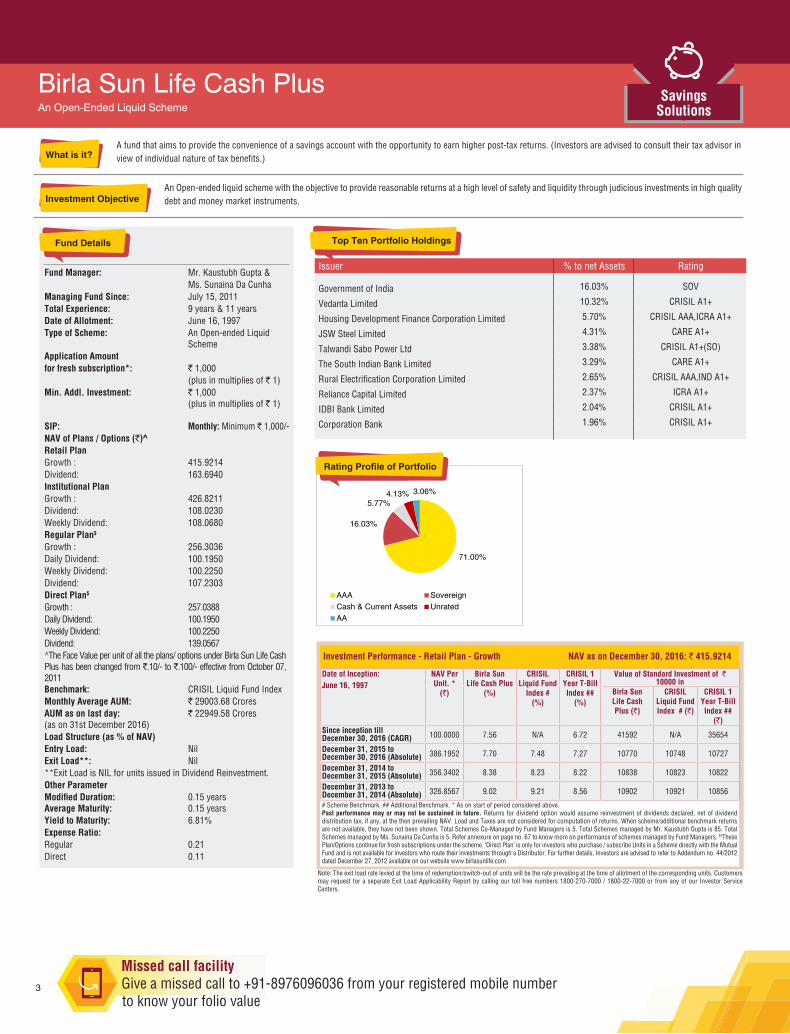
71.00%
16.03%
5.77%4.13% 3.06%
AAA SovereignCash & Current Assets UnratedAA
A fund that aims to provide the convenience of a savings account with the opportunity to earn higher post-tax returns. (Investors are advised to consult their tax advisor in view of individual nature of tax benefits.)
An Open-ended liquid scheme with the objective to provide reasonable returns at a high level of safety and liquidity through judicious investments in high quality debt and money market instruments.
Fund Manager: Mr. Kaustubh Gupta & Ms. Sunaina Da CunhaManaging Fund Since: July 15, 2011Total Experience: 9 years & 11 yearsDate of Allotment: June 16, 1997Type of Scheme: An Open-ended Liquid SchemeApplication Amount for fresh subscription*: ` 1,000 (plus in multiplies of ` 1)Min. Addl. Investment: ` 1,000 (plus in multiplies of ` 1)
SIP: Monthly: Minimum ` 1,000/-NAV of Plans / Options (`)^Retail Plan Growth : 415.9214Dividend: 163.6940Institutional Plan Growth : 426.8211Dividend: 108.0230Weekly Dividend: 108.0680Regular Plan$ Growth : 256.3036Daily Dividend: 100.1950Weekly Dividend: 100.2250Dividend: 107.2303Direct Plan$ Growth : 257.0388Daily Dividend: 100.1950Weekly Dividend: 100.2250Dividend: 139.0567^The Face Value per unit of all the plans/ options under Birla Sun Life Cash Plus has been changed from .̀10/- to .̀100/- effective from October 07, 2011Benchmark: CRISIL Liquid Fund IndexMonthly Average AUM: ` 29003.68 CroresAUM as on last day: ` 22949.58 Crores(as on 31st December 2016)Load Structure (as % of NAV) Entry Load: NilExit Load**: Nil**Exit Load is NIL for units issued in Dividend Reinvestment.Other ParameterModified Duration: 0.15 yearsAverage Maturity: 0.15 yearsYield to Maturity: 6.81%Expense Ratio:Regular 0.21Direct 0.11
Birla Sun Life Cash PlusAn Open-Ended Liquid Scheme
Issuer % to net Assets Rating
Government of India 16.03% SOV
Vedanta Limited 10.32% CRISIL A1+
Housing Development Finance Corporation Limited 5.70% CRISIL AAA,ICRA A1+
JSW Steel Limited 4.31% CARE A1+
Talwandi Sabo Power Ltd 3.38% CRISIL A1+(SO)
The South Indian Bank Limited 3.29% CARE A1+
Rural Electrification Corporation Limited 2.65% CRISIL AAA,IND A1+
Reliance Capital Limited 2.37% ICRA A1+
IDBI Bank Limited 2.04% CRISIL A1+
Corporation Bank 1.96% CRISIL A1+
Top Ten Portfolio Holdings
Note: The exit load rate levied at the time of redemption/switch-out of units will be the rate prevailing at the time of allotment of the corresponding units. Customers may request for a separate Exit Load Applicability Report by calling our toll free numbers 1800-270-7000 / 1800-22-7000 or from any of our Investor Service Centers.
Investment Performance - Retail Plan - Growth NAV as on December 30, 2016: ` 415.9214
Date of Inception: June 16, 1997
NAV Per Unit. *
(`)
Birla Sun Life Cash Plus
(%)
CRISIL Liquid Fund
Index # (%)
CRISIL 1Year T-BillIndex ##
(%)
Value of Standard Investment of ` 10000 in
Birla Sun Life Cash Plus (`)
CRISIL Liquid Fund Index # (`)
CRISIL 1Year T-BillIndex ##
(`)Since inception till December 30, 2016 (CAGR) 100.0000 7.56 N/A 6.72 41592 N/A 35654
December 31, 2015 to December 30, 2016 (Absolute) 386.1952 7.70 7.48 7.27 10770 10748 10727
December 31, 2014 toDecember 31, 2015 (Absolute) 356.3402 8.38 8.23 8.22 10838 10823 10822
December 31, 2013 toDecember 31, 2014 (Absolute) 326.8567 9.02 9.21 8.56 10902 10921 10856
# Scheme Benchmark, ## Additional Benchmark, * As on start of period considered above.Past performance may or may not be sustained in future. Returns for dividend option would assume reinvestment of dividends declared, net of dividend distribution tax, if any, at the then prevailing NAV. Load and Taxes are not considered for computation of returns. When scheme/additional benchmark returns are not available, they have not been shown. Total Schemes Co-Managed by Fund Managers is 5. Total Schemes managed by Mr. Kaustubh Gupta is 85. Total Schemes managed by Ms. Sunaina Da Cunha is 5. Refer annexure on page no. 67 to know more on performance of schemes managed by Fund Managers. $‘These Plan/Options continue for fresh subscriptions under the scheme. ‘Direct Plan’ is only for investors who purchase / subscribe Units in a Scheme directly with the Mutual Fund and is not available for investors who route their investments through a Distributor. For further details, Investors are advised to refer to Addendum no. 44/2012 dated December 27, 2012 available on our website www.birlasunlife.com
3
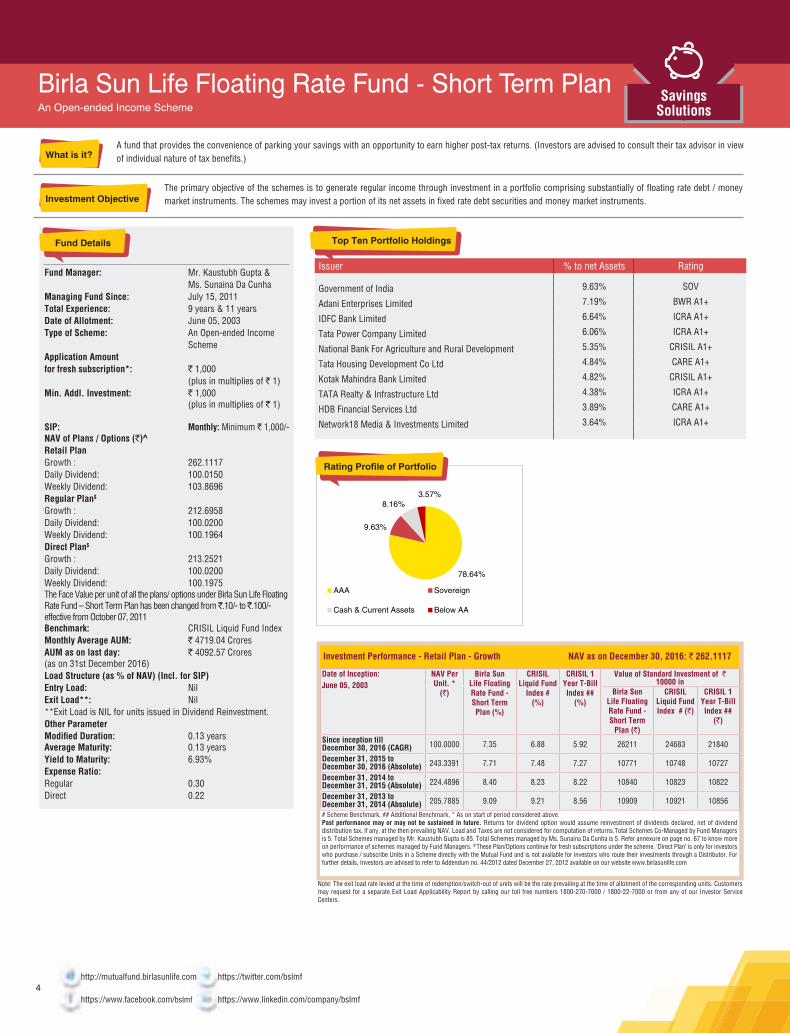
78.64%
9.63%
8.16%3.57%
AAA Sovereign
Cash & Current Assets Below AA
A fund that provides the convenience of parking your savings with an opportunity to earn higher post-tax returns. (Investors are advised to consult their tax advisor in view of individual nature of tax benefits.)
The primary objective of the schemes is to generate regular income through investment in a portfolio comprising substantially of floating rate debt / money market instruments. The schemes may invest a portion of its net assets in fixed rate debt securities and money market instruments.
Fund Manager: Mr. Kaustubh Gupta & Ms. Sunaina Da CunhaManaging Fund Since: July 15, 2011Total Experience: 9 years & 11 yearsDate of Allotment: June 05, 2003Type of Scheme: An Open-ended Income SchemeApplication Amount for fresh subscription*: ` 1,000 (plus in multiplies of ` 1)Min. Addl. Investment: ` 1,000 (plus in multiplies of ` 1)
SIP: Monthly: Minimum ` 1,000/-NAV of Plans / Options (`)^Retail Plan Growth : 262.1117Daily Dividend: 100.0150Weekly Dividend: 103.8696Regular Plan$ Growth : 212.6958Daily Dividend: 100.0200Weekly Dividend: 100.1964Direct Plan$ Growth : 213.2521Daily Dividend: 100.0200Weekly Dividend: 100.1975The Face Value per unit of all the plans/ options under Birla Sun Life Floating Rate Fund – Short Term Plan has been changed from ̀ .10/- to ̀ .100/- effective from October 07, 2011Benchmark: CRISIL Liquid Fund IndexMonthly Average AUM: ` 4719.04 CroresAUM as on last day: ` 4092.57 Crores(as on 31st December 2016)Load Structure (as % of NAV) (Incl. for SIP)Entry Load: NilExit Load**: Nil**Exit Load is NIL for units issued in Dividend Reinvestment.Other ParameterModified Duration: 0.13 yearsAverage Maturity: 0.13 yearsYield to Maturity: 6.93%Expense Ratio:Regular 0.30Direct 0.22
Birla Sun Life Floating Rate Fund - Short Term PlanAn Open-ended Income Scheme
Issuer % to net Assets Rating
Government of India 9.63% SOV
Adani Enterprises Limited 7.19% BWR A1+
IDFC Bank Limited 6.64% ICRA A1+
Tata Power Company Limited 6.06% ICRA A1+
National Bank For Agriculture and Rural Development 5.35% CRISIL A1+
Tata Housing Development Co Ltd 4.84% CARE A1+
Kotak Mahindra Bank Limited 4.82% CRISIL A1+
TATA Realty & Infrastructure Ltd 4.38% ICRA A1+
HDB Financial Services Ltd 3.89% CARE A1+
Network18 Media & Investments Limited 3.64% ICRA A1+
Top Ten Portfolio Holdings
Note: The exit load rate levied at the time of redemption/switch-out of units will be the rate prevailing at the time of allotment of the corresponding units. Customers may request for a separate Exit Load Applicability Report by calling our toll free numbers 1800-270-7000 / 1800-22-7000 or from any of our Investor Service Centers.
Investment Performance - Retail Plan - Growth NAV as on December 30, 2016: ` 262.1117
Date of Inception: June 05, 2003
NAV Per Unit. *
(`)
Birla SunLife FloatingRate Fund -Short TermPlan (%)
CRISIL Liquid Fund
Index # (%)
CRISIL 1Year T-BillIndex ##
(%)
Value of Standard Investment of ` 10000 in
Birla SunLife FloatingRate Fund -Short Term
Plan (`)
CRISIL Liquid Fund Index # (`)
CRISIL 1Year T-BillIndex ##
(`)
Since inception till December 30, 2016 (CAGR) 100.0000 7.35 6.88 5.92 26211 24683 21840
December 31, 2015 to December 30, 2016 (Absolute) 243.3391 7.71 7.48 7.27 10771 10748 10727
December 31, 2014 toDecember 31, 2015 (Absolute) 224.4896 8.40 8.23 8.22 10840 10823 10822
December 31, 2013 toDecember 31, 2014 (Absolute) 205.7885 9.09 9.21 8.56 10909 10921 10856
# Scheme Benchmark, ## Additional Benchmark, * As on start of period considered above.Past performance may or may not be sustained in future. Returns for dividend option would assume reinvestment of dividends declared, net of dividend distribution tax, if any, at the then prevailing NAV. Load and Taxes are not considered for computation of returns.Total Schemes Co-Managed by Fund Managers is 5. Total Schemes managed by Mr. Kaustubh Gupta is 85. Total Schemes managed by Ms. Sunaina Da Cunha is 5. Refer annexure on page no. 67 to know more on performance of schemes managed by Fund Managers. $‘These Plan/Options continue for fresh subscriptions under the scheme. ‘Direct Plan’ is only for investors who purchase / subscribe Units in a Scheme directly with the Mutual Fund and is not available for investors who route their investments through a Distributor. For further details, Investors are advised to refer to Addendum no. 44/2012 dated December 27, 2012 available on our website www.birlasunlife.com
http://mutualfund.birlasunlife.com https://twitter.com/bslmf
https://www.facebook.com/bslmf https://www.linkedin.com/company/bslmf4
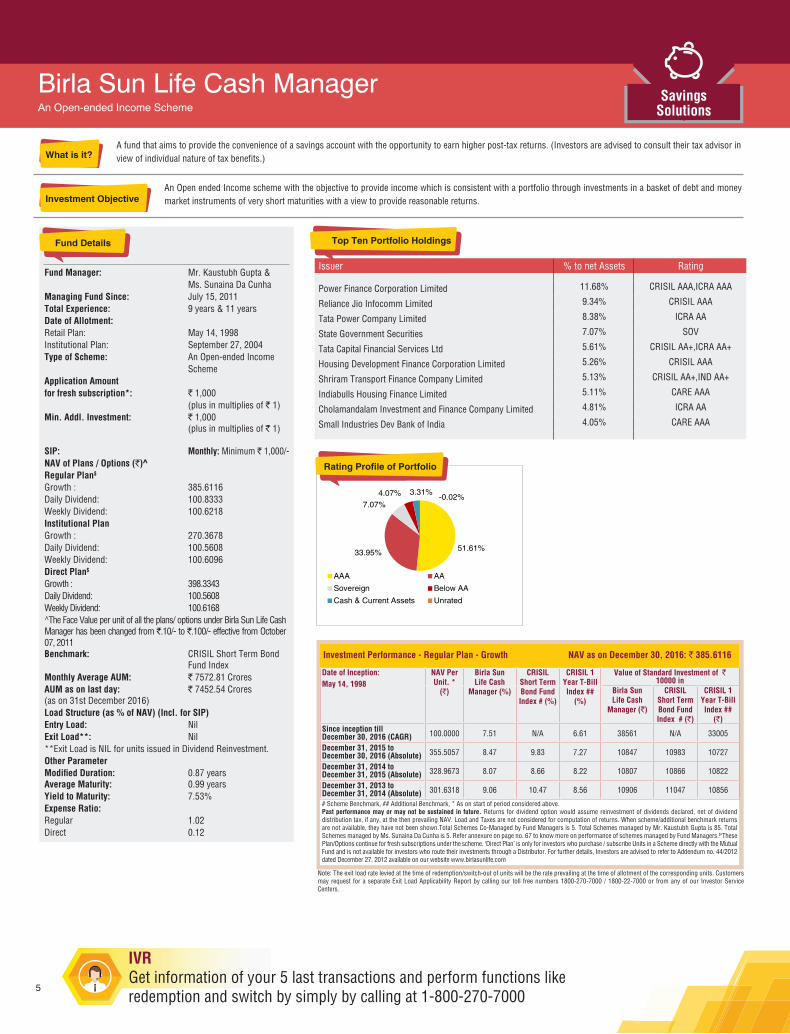
51.61%33.95%
7.07%4.07% 3.31%
-0.02%
AAA AA
Sovereign Below AA
Cash & Current Assets Unrated
A fund that aims to provide the convenience of a savings account with the opportunity to earn higher post-tax returns. (Investors are advised to consult their tax advisor in view of individual nature of tax benefits.)
An Open ended Income scheme with the objective to provide income which is consistent with a portfolio through investments in a basket of debt and money market instruments of very short maturities with a view to provide reasonable returns.
Fund Manager: Mr. Kaustubh Gupta & Ms. Sunaina Da CunhaManaging Fund Since: July 15, 2011Total Experience: 9 years & 11 yearsDate of Allotment:Retail Plan: May 14, 1998Institutional Plan: September 27, 2004Type of Scheme: An Open-ended Income SchemeApplication Amount for fresh subscription*: ` 1,000 (plus in multiplies of ` 1)Min. Addl. Investment: ` 1,000 (plus in multiplies of ` 1)
SIP: Monthly: Minimum ` 1,000/-NAV of Plans / Options (`)^Regular Plan$ Growth : 385.6116Daily Dividend: 100.8333Weekly Dividend: 100.6218Institutional Plan Growth : 270.3678Daily Dividend: 100.5608Weekly Dividend: 100.6096Direct Plan$ Growth : 398.3343Daily Dividend: 100.5608Weekly Dividend: 100.6168^The Face Value per unit of all the plans/ options under Birla Sun Life Cash Manager has been changed from .̀10/- to .̀100/- effective from October 07, 2011Benchmark: CRISIL Short Term Bond Fund IndexMonthly Average AUM: ` 7572.81 CroresAUM as on last day: ` 7452.54 Crores(as on 31st December 2016)Load Structure (as % of NAV) (Incl. for SIP)Entry Load: NilExit Load**: Nil**Exit Load is NIL for units issued in Dividend Reinvestment.Other ParameterModified Duration: 0.87 yearsAverage Maturity: 0.99 yearsYield to Maturity: 7.53%Expense Ratio:Regular 1.02Direct 0.12
Birla Sun Life Cash ManagerAn Open-ended Income Scheme
Issuer % to net Assets Rating
Power Finance Corporation Limited 11.68% CRISIL AAA,ICRA AAA
Reliance Jio Infocomm Limited 9.34% CRISIL AAA
Tata Power Company Limited 8.38% ICRA AA
State Government Securities 7.07% SOV
Tata Capital Financial Services Ltd 5.61% CRISIL AA+,ICRA AA+
Housing Development Finance Corporation Limited 5.26% CRISIL AAA
Shriram Transport Finance Company Limited 5.13% CRISIL AA+,IND AA+
Indiabulls Housing Finance Limited 5.11% CARE AAA
Cholamandalam Investment and Finance Company Limited 4.81% ICRA AA
Small Industries Dev Bank of India 4.05% CARE AAA
Top Ten Portfolio Holdings
Note: The exit load rate levied at the time of redemption/switch-out of units will be the rate prevailing at the time of allotment of the corresponding units. Customers may request for a separate Exit Load Applicability Report by calling our toll free numbers 1800-270-7000 / 1800-22-7000 or from any of our Investor Service Centers.
Investment Performance - Regular Plan - Growth NAV as on December 30, 2016: ` 385.6116
Date of Inception: May 14, 1998
NAV Per Unit. *
(`)
Birla SunLife Cash
Manager (%)
CRISILShort TermBond FundIndex # (%)
CRISIL 1Year T-BillIndex ##
(%)
Value of Standard Investment of ` 10000 in
Birla SunLife Cash
Manager (`)
CRISILShort TermBond FundIndex # (`)
CRISIL 1Year T-BillIndex ##
(`)Since inception till December 30, 2016 (CAGR) 100.0000 7.51 N/A 6.61 38561 N/A 33005
December 31, 2015 to December 30, 2016 (Absolute) 355.5057 8.47 9.83 7.27 10847 10983 10727
December 31, 2014 toDecember 31, 2015 (Absolute) 328.9673 8.07 8.66 8.22 10807 10866 10822
December 31, 2013 toDecember 31, 2014 (Absolute) 301.6318 9.06 10.47 8.56 10906 11047 10856
# Scheme Benchmark, ## Additional Benchmark, * As on start of period considered above.Past performance may or may not be sustained in future. Returns for dividend option would assume reinvestment of dividends declared, net of dividend distribution tax, if any, at the then prevailing NAV. Load and Taxes are not considered for computation of returns. When scheme/additional benchmark returns are not available, they have not been shown.Total Schemes Co-Managed by Fund Managers is 5. Total Schemes managed by Mr. Kaustubh Gupta is 85. Total Schemes managed by Ms. Sunaina Da Cunha is 5. Refer annexure on page no. 67 to know more on performance of schemes managed by Fund Managers.$‘These Plan/Options continue for fresh subscriptions under the scheme. ‘Direct Plan’ is only for investors who purchase / subscribe Units in a Scheme directly with the Mutual Fund and is not available for investors who route their investments through a Distributor. For further details, Investors are advised to refer to Addendum no. 44/2012 dated December 27, 2012 available on our website www.birlasunlife.com
5

59.75%17.85%
13.41%
5.53%3.47%
-0.02%
AAA AA
Sovereign Below AA
Cash & Current Assets Unrated
A fund that aims to provide the convenience of a savings account with the opportunity to earn higher post-tax returns. (Investors are advised to consult their tax advisor in view of individual nature of tax benefits.)
The primary objective of the schemes is to generate regular income through investments in debt and money market instruments. Income maybe generated through the receipt of coupon payments or the purchase and sale of securities in the underlying portfolio. The schemes will under normal market conditions, invest its net assets in fixed income securities, money market instruments, cash and cash equivalents.
Fund Manager: Mr. Kaustubh Gupta & Ms. Sunaina Da CunhaManaging Fund Since: July 15, 2011 & June 20, 2014Total Experience: 9 years & 11 yearsDate of Allotment: Retail Plan: November 27, 2001Institutional Plan: April 16, 2003Type of Scheme: An Open-ended Short Term Income SchemeApplication Amount for fresh subscription*: ` 1,000 (plus in multiplies of ` 1)Min. Addl. Investment: ` 1,000 (plus in multiplies of ` 1)
SIP: Monthly: Minimum ` 1,000/-NAV of Plans / Options (`)^Retail Plan Growth : 302.8346Daily Dividend: 100.5409Weekly Dividend: 100.7017Regular Plan$ Growth : 312.9700Daily Dividend: 100.7448Weekly Dividend: 100.7017Direct Plan$ Growth : 314.2828Daily Dividend: 100.5526Weekly Dividend: 100.7043^The Face Value per unit of all the plans/ options under Birla Sun Life Savings Fund has been changed from .̀10/- to .̀100/- effective from October 07, 2011Benchmark: CRISIL Short Term Bond Fund IndexMonthly Average AUM: ` 17646.02 CroresAUM as on last day: ` 17231.43 Crores(as on 31st December 2016)Load Structure (as % of NAV) (Incl. for SIP)Entry Load: NilExit Load**: Nil**Exit Load is NIL for units issued in Dividend Reinvestment.Other ParameterModified Duration: 1.42 yearsAverage Maturity: 1.66 yearsYield to Maturity: 7.52%Expense Ratio:Regular 0.28Direct 0.15
Birla Sun Life Savings FundAn Open-ended Short Term Income Scheme
Issuer % to net Assets Rating
State Government Securities 12.52% SOV
Power Finance Corporation Limited 12.45% CARE AAA,CRISIL AAA
Reliance Jio Infocomm Limited 6.98% CRISIL AAA,CRISIL AAA (SO)
Indiabulls Housing Finance Limited 5.10% CARE AAA
Shriram Transport Finance Company Limited 4.93% CRISIL AA+,IND AA+
National Bank For Agriculture and Rural Development 3.89% CRISIL AAA
Housing Development Finance Corporation Limited 3.87% CRISIL AAA
Dewan Housing Finance Corporation Limited 3.58% CARE AAA
Tata Motors Finance Ltd 2.47% CRISIL AA,ICRA A1+
Vodafone Mobile Services Ltd 2.44% IND AAA
Top Ten Portfolio Holdings
Note: The exit load rate levied at the time of redemption/switch-out of units will be the rate prevailing at the time of allotment of the corresponding units. Customers may request for a separate Exit Load Applicability Report by calling our toll free numbers 1800-270-7000 / 1800-22-7000 or from any of our Investor Service Centers.
Investment Performance - Retail Plan - Growth NAV as on December 30, 2016: ` 302.8346
Date of Inception: Nov 27, 2001
NAV Per Unit. *
(`)
Birla SunLife Savings
Fund (%)
CRISILShort TermBond FundIndex # (%)
CRISIL 1Year T-BillIndex ##
(%)
Value of Standard Investment of ` 10000 in
BirlaSun LifeSavingsFund (`)
CRISILShort TermBond FundIndex # (`)
CRISIL 1Year T-BillIndex ##
(`)Since inception till December 30, 2016 (CAGR) 100.0000 7.61 N/A 6.01 30283 N/A 24127
December 31, 2015 to December 30, 2016 (Absolute) 277.2297 9.24 9.83 7.27 10924 10983 10727
December 31, 2014 toDecember 31, 2015 (Absolute) 254.5845 8.89 8.66 8.22 10889 10866 10822
December 31, 2013 toDecember 31, 2014 (Absolute) 232.3047 9.59 10.47 8.56 10959 11047 10856
# Scheme Benchmark, ## Additional Benchmark, * As on start of period considered above.Past performance may or may not be sustained in future. Returns for dividend option would assume reinvestment of dividends declared, net of dividend distribution tax, if any, at the then prevailing NAV. Load and Taxes are not considered for computation of returns. When scheme/additional benchmark returns are not available, they have not been shown. Total Schemes Co-Managed by Fund Managers is 5. Total Schemes managed by Mr. Kaustubh Gupta is 85. Total Schemes managed by Ms. Sunaina Da Cunha is 5. Refer annexure on page no. 67 to know more on performance of schemes managed by Fund Managers. $‘These Plan/Options continue for fresh subscriptions under the scheme. ‘Direct Plan’ is only for investors who purchase / subscribe Units in a Scheme directly with the Mutual Fund and is not available for investors who route their investments through a Distributor. For further details, Investors are advised to refer to Addendum no. 44/2012 dated December 27, 2012 available on our website www.birlasunlife.com
Declared on date 11-Feb-11 28-Jan-11 31-Dec-10Dividend Yield (Regular Plan) 0.34% 0.45% 0.51%Dividend (`) Per Unit 0.0350 0.0469 0.0529Cum Dividend NAV 10.2848 10.3108 10.3105
Note: The NAV of the scheme, pursuant to pay out of dividend would fall to the extent of the payout and statutory levy (if applicable). Past performance may or may not be sustained in future.The Face Value - 10.00 Per UnitThe Financial Solution(s) stated above is ONLY for highlighting the many advantages perceived from investments in Mutual Funds but does not in any manner, indicate or imply, either the quality of any particular Scheme or guarantee any specific performance/returns.For more details on dividends declared please refer to the online empower on www.mutualfund.birlasunlife.com
http://mutualfund.birlasunlife.com https://twitter.com/bslmf
https://www.facebook.com/bslmf https://www.linkedin.com/company/bslmf6

64.35%
15.78%
13.62%
6.33% -0.08%
AAA AA
Sovereign Cash & Current Assets
Unrated
A fund that aims to generate income by investing substantially into floating rate debt/ money market instruments.
The primary objective of the schemes is to generate regular income through investment in a portfolio comprising substantially of floating rate debt / money market instruments. The schemes may invest a portion of its net assets in fixed rate debt securities and money market instruments.
Fund Manager: Mr. Prasad Dhonde & Mr. Kaustubh GuptaManaging Fund Since: July 15, 2011 & June 20, 2014Total Experience: 16 years & 9 yearsDate of Allotment: June 05, 2003Type of Scheme: An Open-ended Income SchemeApplication Amount for fresh subscription*: ` 1,000 (plus in multiplies of ` 1)Min. Addl. Investment: ` 1,000 (plus in multiplies of ` 1)
SIP: Monthly: Minimum ` 1,000/-NAV of Plans / Options (`)^Retail Plan Growth : 282.7308Weekly Dividend: 100.3399Regular Plan$ Growth : 195.4784Daily Dividend: 100.9976Weekly Dividend: 100.3399Direct Plan$ Growth : 197.2198Daily Dividend: 100.4470Weekly Dividend: 100.3420^The Face Value per unit of all the plans/ options under Birla Sun Life Floating Rate Fund – Long Term Plan has been changed from ̀ .10/- to ̀ .100/- effective from October 07, 2011Benchmark: CRISIL Liquid Fund IndexMonthly Average AUM: ` 5798.28 CroresAUM as on last day: ` 6295.51 Crores(as on 31st December 2016)Load Structure (as % of NAV) (Incl. for SIP)Entry Load: NilExit Load**: Nil**Exit Load is NIL for units issued in Dividend Reinvestment.Other ParameterModified Duration: 1.59 yearsAverage Maturity: 1.87 yearsYield to Maturity: 7.30%Expense Ratio:Regular 0.43Direct 0.18
Birla Sun Life Floating Rate Fund - Long Term PlanAn Open-ended Income Scheme
Issuer % to net Assets Rating
Power Finance Corporation Limited 11.28% CRISIL AAA
Axis Bank Limited 7.20% CRISIL A1+
State Government Securities 7.01% SOV
Rural Electrification Corporation Limited 6.81% CRISIL AAA
Government of India 6.60% SOV
Shriram Transport Finance Company Limited 6.39% CRISIL AA+,IND AA+
Housing Development Finance Corporation Limited 5.93% CRISIL AAA,ICRA A1+
National Bank For Agriculture and Rural Development 4.42% CRISIL AAA
Reliance Jio Infocomm Limited 3.87% CRISIL AAA
LIC Housing Finance Limited 3.81% CARE AAA,CRISIL AAA
Top Ten Portfolio Holdings
Note: The exit load rate levied at the time of redemption/switch-out of units will be the rate prevailing at the time of allotment of the corresponding units. Customers may request for a separate Exit Load Applicability Report by calling our toll free numbers 1800-270-7000 / 1800-22-7000 or from any of our Investor Service Centers.
Investment Performance - Retail Plan - Growth NAV as on December 30, 2016: ` 282.7308
Date of Inception: June 05, 2003
NAV Per Unit. *
(`)
Birla SunLife FloatingRate Fund -Long TermPlan (%)
CRISIL Liquid Fund
Index # (%)
CRISIL 1Year T-BillIndex ##
(%)
Value of Standard Investment of ` 10000 in
BirlaSun LifeFloating
Rate Fund- Long
Term Plan (`)
CRISIL Liquid Fund Index # (`)
CRISIL 1Year T-BillIndex ##
(`)
Since inception till December 30, 2016 (CAGR) 100.0000 7.95 6.88 5.92 28273 24683 21840
December 31, 2015 to December 30, 2016 (Absolute) 258.1322 9.53 7.48 7.27 10953 10748 10727
December 31, 2014 toDecember 31, 2015 (Absolute) 237.0108 8.91 8.23 8.22 10891 10823 10822
December 31, 2013 toDecember 31, 2014 (Absolute) 216.4335 9.51 9.21 8.56 10951 10921 10856
# Scheme Benchmark, ## Additional Benchmark, * As on start of period considered above.Past performance may or may not be sustained in future. Returns for dividend option would assume reinvestment of dividends declared, net of dividend distribution tax, if any, at the then prevailing NAV. Load and Taxes are not considered for computation of returns. Total Schemes Co-Managed by Fund Managers is 5. Total Schemes managed by Mr. Prasad Dhonde is 23. Total Schemes managed by Mr. Kaustubh Gupta is 85. Refer annexure on page no. 67 to know more on performance of schemes managed by Fund Managers.$‘These Plan/Options continue for fresh subscriptions under the scheme. ‘Direct Plan’ is only for investors who purchase / subscribe Units in a Scheme directly with the Mutual Fund and is not available for investors who route their investments through a Distributor. For further details, Investors are advised to refer to Addendum no. 44/2012 dated December 27, 2012 available on our website www.birlasunlife.com
7
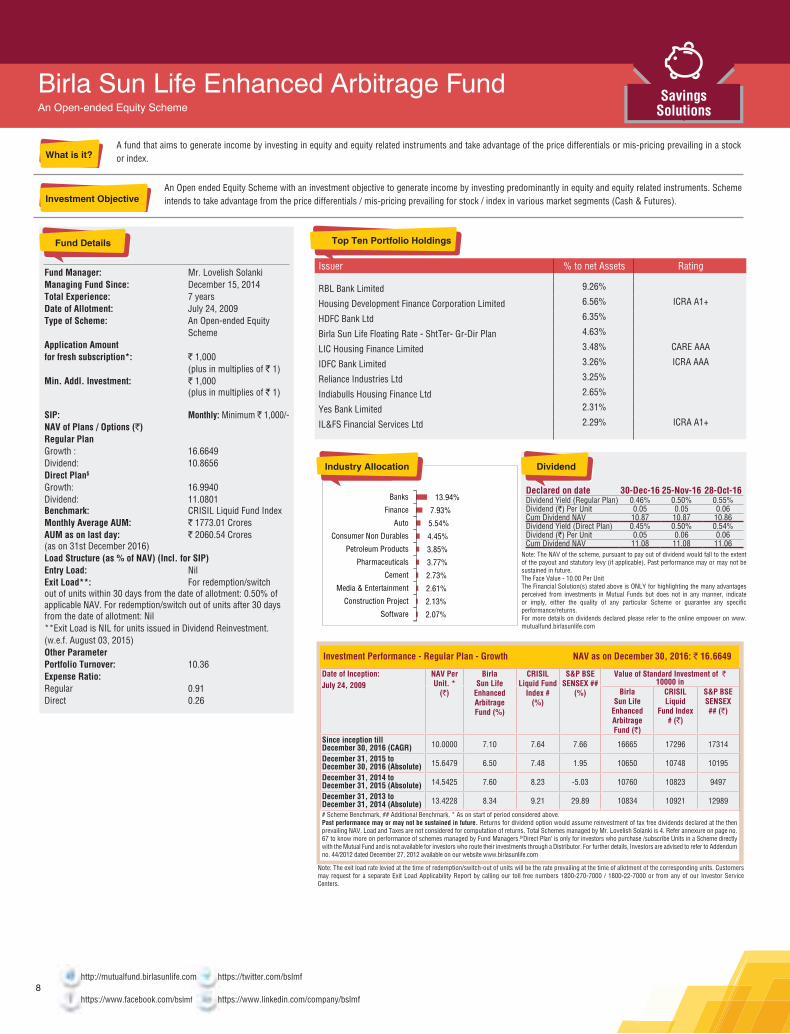
A fund that aims to generate income by investing in equity and equity related instruments and take advantage of the price differentials or mis-pricing prevailing in a stock or index.
An Open ended Equity Scheme with an investment objective to generate income by investing predominantly in equity and equity related instruments. Scheme intends to take advantage from the price differentials / mis-pricing prevailing for stock / index in various market segments (Cash & Futures).
Fund Manager: Mr. Lovelish SolankiManaging Fund Since: December 15, 2014Total Experience: 7 yearsDate of Allotment: July 24, 2009Type of Scheme: An Open-ended Equity SchemeApplication Amount for fresh subscription*: ` 1,000 (plus in multiplies of ` 1)Min. Addl. Investment: ` 1,000 (plus in multiplies of ` 1)
SIP: Monthly: Minimum ` 1,000/-NAV of Plans / Options (`)Regular Plan Growth : 16.6649Dividend: 10.8656Direct Plan$ Growth: 16.9940Dividend: 11.0801Benchmark: CRISIL Liquid Fund IndexMonthly Average AUM: ` 1773.01 CroresAUM as on last day: ` 2060.54 Crores(as on 31st December 2016)Load Structure (as % of NAV) (Incl. for SIP)Entry Load: NilExit Load**: For redemption/switch out of units within 30 days from the date of allotment: 0.50% of applicable NAV. For redemption/switch out of units after 30 days from the date of allotment: Nil **Exit Load is NIL for units issued in Dividend Reinvestment.(w.e.f. August 03, 2015)Other ParameterPortfolio Turnover: 10.36Expense Ratio:Regular 0.91Direct 0.26
Birla Sun Life Enhanced Arbitrage FundAn Open-ended Equity Scheme
Issuer % to net Assets Rating
RBL Bank Limited 9.26%
Housing Development Finance Corporation Limited 6.56% ICRA A1+
HDFC Bank Ltd 6.35%
Birla Sun Life Floating Rate - ShtTer- Gr-Dir Plan 4.63%
LIC Housing Finance Limited 3.48% CARE AAA
IDFC Bank Limited 3.26% ICRA AAA
Reliance Industries Ltd 3.25%
Indiabulls Housing Finance Ltd 2.65%
Yes Bank Limited 2.31%
IL&FS Financial Services Ltd 2.29% ICRA A1+
Top Ten Portfolio Holdings
Note: The exit load rate levied at the time of redemption/switch-out of units will be the rate prevailing at the time of allotment of the corresponding units. Customers may request for a separate Exit Load Applicability Report by calling our toll free numbers 1800-270-7000 / 1800-22-7000 or from any of our Investor Service Centers.
Investment Performance - Regular Plan - Growth NAV as on December 30, 2016: ` 16.6649
Date of Inception: July 24, 2009
NAV Per Unit. *
(`)
BirlaSun Life
EnhancedArbitrageFund (%)
CRISIL Liquid Fund
Index # (%)
S&P BSESENSEX ##
(%)
Value of Standard Investment of ` 10000 in
BirlaSun Life
EnhancedArbitrageFund (`)
CRISILLiquid
Fund Index # (`)
S&P BSESENSEX ## (`)
Since inception till December 30, 2016 (CAGR) 10.0000 7.10 7.64 7.66 16665 17296 17314
December 31, 2015 to December 30, 2016 (Absolute) 15.6479 6.50 7.48 1.95 10650 10748 10195
December 31, 2014 toDecember 31, 2015 (Absolute) 14.5425 7.60 8.23 -5.03 10760 10823 9497
December 31, 2013 toDecember 31, 2014 (Absolute) 13.4228 8.34 9.21 29.89 10834 10921 12989
# Scheme Benchmark, ## Additional Benchmark, * As on start of period considered above.Past performance may or may not be sustained in future. Returns for dividend option would assume reinvestment of tax free dividends declared at the then prevailing NAV. Load and Taxes are not considered for computation of returns. Total Schemes managed by Mr. Lovelish Solanki is 4. Refer annexure on page no. 67 to know more on performance of schemes managed by Fund Managers.$‘Direct Plan’ is only for investors who purchase /subscribe Units in a Scheme directly with the Mutual Fund and is not available for investors who route their investments through a Distributor. For further details, Investors are advised to refer to Addendum no. 44/2012 dated December 27, 2012 available on our website www.birlasunlife.com
2.07%
2.13%
2.61%
2.73%
3.77%
3.85%
4.45%
5.54%
7.93%
13.94%
Software
Construction Project
Media & Entertainment
Cement
Pharmaceuticals
Petroleum Products
Consumer Non Durables
Auto
Finance
Banks
http://mutualfund.birlasunlife.com https://twitter.com/bslmf
https://www.facebook.com/bslmf https://www.linkedin.com/company/bslmf
Declared on date 30-Dec-16 25-Nov-16 28-Oct-16Dividend Yield (Regular Plan) 0.46% 0.50% 0.55%Dividend (`) Per Unit 0.05 0.05 0.06Cum Dividend NAV 10.87 10.87 10.86Dividend Yield (Direct Plan) 0.45% 0.50% 0.54%Dividend (`) Per Unit 0.05 0.06 0.06Cum Dividend NAV 11.08 11.08 11.06
Note: The NAV of the scheme, pursuant to pay out of dividend would fall to the extent of the payout and statutory levy (if applicable). Past performance may or may not be sustained in future.The Face Value - 10.00 Per UnitThe Financial Solution(s) stated above is ONLY for highlighting the many advantages perceived from investments in Mutual Funds but does not in any manner, indicate or imply, either the quality of any particular Scheme or guarantee any specific performance/returns.For more details on dividends declared please refer to the online empower on www.mutualfund.birlasunlife.com
8

59.14%
25.46%
11.22%
4.19% -0.01%
AAA SovereignAA Cash & Current AssetsUnrated
A moderate income scheme that invests in diversified portfolio of debt and money market instruments of short to medium term maturity which can offer superior levels of yields at relatively lower levels of risk.
An Open-ended income scheme with the objective to generate income and capital appreciation by investing 100% of the corpus in a diversified portfolio of debt and money market securities.
Fund Manager: Mr. Prasad DhondeManaging Fund Since: July 01, 2011Total Experience: 16 yearsDate of Allotment: March 3, 1997Type of Scheme: An Open-ended Income SchemeApplication Amount for fresh subscription*: ` 1,000 (plus in multiplies of ` 1)Min. Addl. Investment: ` 1,000 (plus in multiplies of ` 1)
SIP: Monthly: Minimum ` 1,000/-NAV of Plans / Options (`)Regular Plan Growth : 61.3032Dividend: 11.4840Monthly Dividend: 11.8431Direct Plan$ Growth : 61.5550Dividend: 11.4666Monthly Dividend: 11.8711Benchmark: CRISIL Short Term Bond Fund Index (w.e.f May 27, 2013)Monthly Average AUM: ` 16434.08 CroresAUM as on last day: ` 15594.94 Crores(as on 31st December 2016)Load Structure (as % of NAV) (Incl. for SIP)Entry Load: NilExit Load**: Nil**Exit Load is NIL for units issued in Dividend Reinvestment.Other ParameterModified Duration: 2.42 yearsAverage Maturity: 2.95 yearsYield to Maturity: 7.36%Expense Ratio:Regular 0.30Direct 0.20
Birla Sun Life Short Term Fund(erstwhile Birla Sun Life Income Fund. Name changed w.e.f February 01, 2012)An Open-ended Income Scheme
Issuer % to net Assets Rating
Government of India 14.18% SOV
State Government Securities 11.28% SOV
Power Finance Corporation Limited 9.92% CRISIL AAA
Housing Development Finance Corporation Limited 8.79% CRISIL AAA
Reliance Jio Infocomm Limited 5.34% CRISIL AAA
Tata Capital Financial Services Ltd 4.43% CRISIL AA+,ICRA AA+
LIC Housing Finance Limited 4.36% CARE AAA,CRISIL AAA
Rural Electrification Corporation Limited 3.37% CRISIL AAA
Small Industries Dev Bank of India 3.29% CARE AAA
Indiabulls Housing Finance Limited 3.17% CARE AAA
Top Ten Portfolio Holdings
Note: The exit load rate levied at the time of redemption/switch-out of units will be the rate prevailing at the time of allotment of the corresponding units. Customers may request for a separate Exit Load Applicability Report by calling our toll free numbers 1800-270-7000 / 1800-22-7000 or from any of our Investor Service Centers.
Investment Performance - Regular Plan - Growth NAV as on December 30, 2016: ` 61.3032
Date of Inception: March 3, 1997
NAV Per Unit. *
(`)
Birla SunLife Short
Term Fund (%)
CRISILShort TermBond FundIndex # (%)
CRISIL 10Year GiltIndex ##
(%)
Value of Standard Investment of ` 10000 in
Birla SunLife Short
Term Fund (`)
CRISILShort TermBond FundIndex # (`)
CRISIL 10Year GiltIndex ##
(`)Since inception till December 30, 2016 (CAGR) 10.0000 9.57 N/A N/A 61303 N/A N/A
December 31, 2015 to December 30, 2016 (Absolute) 55.6069 10.24 9.83 14.97 11024 10983 11497
December 31, 2014 toDecember 31, 2015 (Absolute) 51.0673 8.89 8.66 7.39 10889 10866 10739
December 31, 2013 toDecember 31, 2014 (Absolute) 46.0453 10.91 10.47 14.14 11091 11047 11414
# Scheme Benchmark, ## Additional Benchmark, * As on start of period considered above.Past performance may or may not be sustained in future. Returns for dividend option would assume reinvestment of dividends declared, net of dividend distribution tax, if any, at the then prevailing NAV. Load and Taxes are not considered for computation of returns. When scheme/additional benchmark returns are not available, they have not been shown.Total Schemes managed by Mr. Prasad Dhonde is 23. Refer annexure on page no. 67 to know more on performance of schemes managed by Fund Managers. $‘Direct Plan’ is only for investors who purchase /subscribe Units in a Scheme directly with the Mutual Fund and is not available for investors who route their investments through a Distributor. For further details, Investors are advised to refer to Addendum no. 44/2012 dated December 27, 2012 available on our website www.birlasunlife.com
Declared on date 15-Dec-16 15-Nov-16 17-Oct-16Dividend Yield (Regular Plan) 0.53% 0.51% 0.56%Dividend (`) Per Unit 0.0634 0.0612 0.0672Cum Dividend NAV 11.9161 11.9549 11.9322Dividend Yield (Direct Plan) 0.53% 0.51% 0.56%Dividend (`) Per Unit 0.0636 0.0612 0.0674Cum Dividend NAV 11.9435 11.9812 11.9576
Note: The NAV of the scheme, pursuant to pay out of dividend would fall to the extent of the payout and statutory levy (if applicable). Past performance may or may not be sustained in future.The Face Value - 10.00 Per UnitThe Financial Solution(s) stated above is ONLY for highlighting the many advantages perceived from investments in Mutual Funds but does not in any manner, indicate or imply, either the quality of any particular Scheme or guarantee any specific performance/returns.For more details on dividends declared please refer to the online empower on www.mutualfund.birlasunlife.com
9
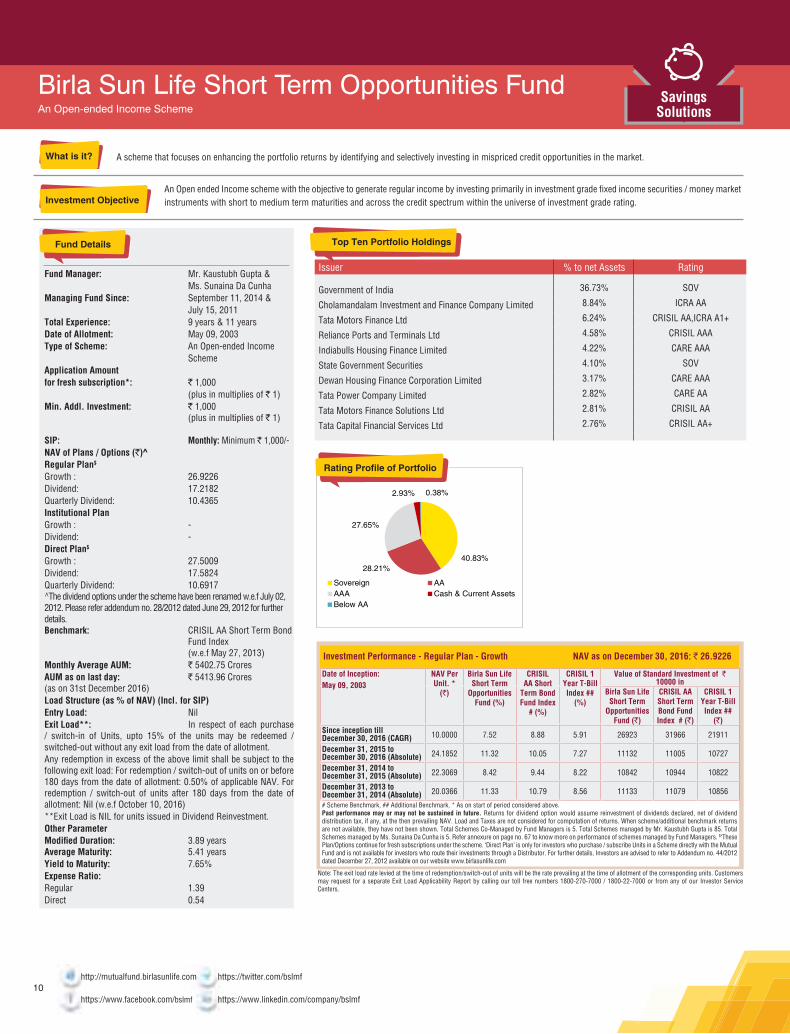
40.83%28.21%
27.65%
2.93% 0.38%
Sovereign AAAAA Cash & Current AssetsBelow AA
A scheme that focuses on enhancing the portfolio returns by identifying and selectively investing in mispriced credit opportunities in the market.
An Open ended Income scheme with the objective to generate regular income by investing primarily in investment grade fixed income securities / money market instruments with short to medium term maturities and across the credit spectrum within the universe of investment grade rating.
Fund Manager: Mr. Kaustubh Gupta & Ms. Sunaina Da CunhaManaging Fund Since: September 11, 2014 & July 15, 2011Total Experience: 9 years & 11 yearsDate of Allotment: May 09, 2003Type of Scheme: An Open-ended Income SchemeApplication Amount for fresh subscription*: ` 1,000 (plus in multiplies of ` 1)Min. Addl. Investment: ` 1,000 (plus in multiplies of ` 1)
SIP: Monthly: Minimum ` 1,000/-NAV of Plans / Options (`)^Regular Plan$ Growth : 26.9226Dividend: 17.2182Quarterly Dividend: 10.4365Institutional Plan Growth : -Dividend: -Direct Plan$ Growth : 27.5009Dividend: 17.5824Quarterly Dividend: 10.6917^The dividend options under the scheme have been renamed w.e.f July 02, 2012. Please refer addendum no. 28/2012 dated June 29, 2012 for further details.Benchmark: CRISIL AA Short Term Bond Fund Index (w.e.f May 27, 2013)Monthly Average AUM: ` 5402.75 CroresAUM as on last day: ` 5413.96 Crores(as on 31st December 2016)Load Structure (as % of NAV) (Incl. for SIP)Entry Load: NilExit Load**: In respect of each purchase / switch-in of Units, upto 15% of the units may be redeemed / switched-out without any exit load from the date of allotment.Any redemption in excess of the above limit shall be subject to the following exit load: For redemption / switch-out of units on or before 180 days from the date of allotment: 0.50% of applicable NAV. For redemption / switch-out of units after 180 days from the date of allotment: Nil (w.e.f October 10, 2016)**Exit Load is NIL for units issued in Dividend Reinvestment.Other ParameterModified Duration: 3.89 yearsAverage Maturity: 5.41 yearsYield to Maturity: 7.65%Expense Ratio:Regular 1.39Direct 0.54
Birla Sun Life Short Term Opportunities FundAn Open-ended Income Scheme
Issuer % to net Assets Rating
Government of India 36.73% SOV
Cholamandalam Investment and Finance Company Limited 8.84% ICRA AA
Tata Motors Finance Ltd 6.24% CRISIL AA,ICRA A1+
Reliance Ports and Terminals Ltd 4.58% CRISIL AAA
Indiabulls Housing Finance Limited 4.22% CARE AAA
State Government Securities 4.10% SOV
Dewan Housing Finance Corporation Limited 3.17% CARE AAA
Tata Power Company Limited 2.82% CARE AA
Tata Motors Finance Solutions Ltd 2.81% CRISIL AA
Tata Capital Financial Services Ltd 2.76% CRISIL AA+
Top Ten Portfolio Holdings
Note: The exit load rate levied at the time of redemption/switch-out of units will be the rate prevailing at the time of allotment of the corresponding units. Customers may request for a separate Exit Load Applicability Report by calling our toll free numbers 1800-270-7000 / 1800-22-7000 or from any of our Investor Service Centers.
Investment Performance - Regular Plan - Growth NAV as on December 30, 2016: ` 26.9226
Date of Inception: May 09, 2003
NAV Per Unit. *
(`)
Birla Sun LifeShort Term
OpportunitiesFund (%)
CRISILAA Short
Term BondFund Index
# (%)
CRISIL 1Year T-BillIndex ##
(%)
Value of Standard Investment of ` 10000 in
Birla Sun LifeShort Term
OpportunitiesFund (`)
CRISIL AAShort TermBond FundIndex # (`)
CRISIL 1Year T-BillIndex ##
(`)Since inception till December 30, 2016 (CAGR) 10.0000 7.52 8.88 5.91 26923 31966 21911
December 31, 2015 to December 30, 2016 (Absolute) 24.1852 11.32 10.05 7.27 11132 11005 10727
December 31, 2014 toDecember 31, 2015 (Absolute) 22.3069 8.42 9.44 8.22 10842 10944 10822
December 31, 2013 toDecember 31, 2014 (Absolute) 20.0366 11.33 10.79 8.56 11133 11079 10856
# Scheme Benchmark, ## Additional Benchmark, * As on start of period considered above.Past performance may or may not be sustained in future. Returns for dividend option would assume reinvestment of dividends declared, net of dividend distribution tax, if any, at the then prevailing NAV. Load and Taxes are not considered for computation of returns. When scheme/additional benchmark returns are not available, they have not been shown. Total Schemes Co-Managed by Fund Managers is 5. Total Schemes managed by Mr. Kaustubh Gupta is 85. Total Schemes managed by Ms. Sunaina Da Cunha is 5. Refer annexure on page no. 67 to know more on performance of schemes managed by Fund Managers. $‘These Plan/Options continue for fresh subscriptions under the scheme. ‘Direct Plan’ is only for investors who purchase / subscribe Units in a Scheme directly with the Mutual Fund and is not available for investors who route their investments through a Distributor. For further details, Investors are advised to refer to Addendum no. 44/2012 dated December 27, 2012 available on our website www.birlasunlife.com
http://mutualfund.birlasunlife.com https://twitter.com/bslmf
https://www.facebook.com/bslmf https://www.linkedin.com/company/bslmf10
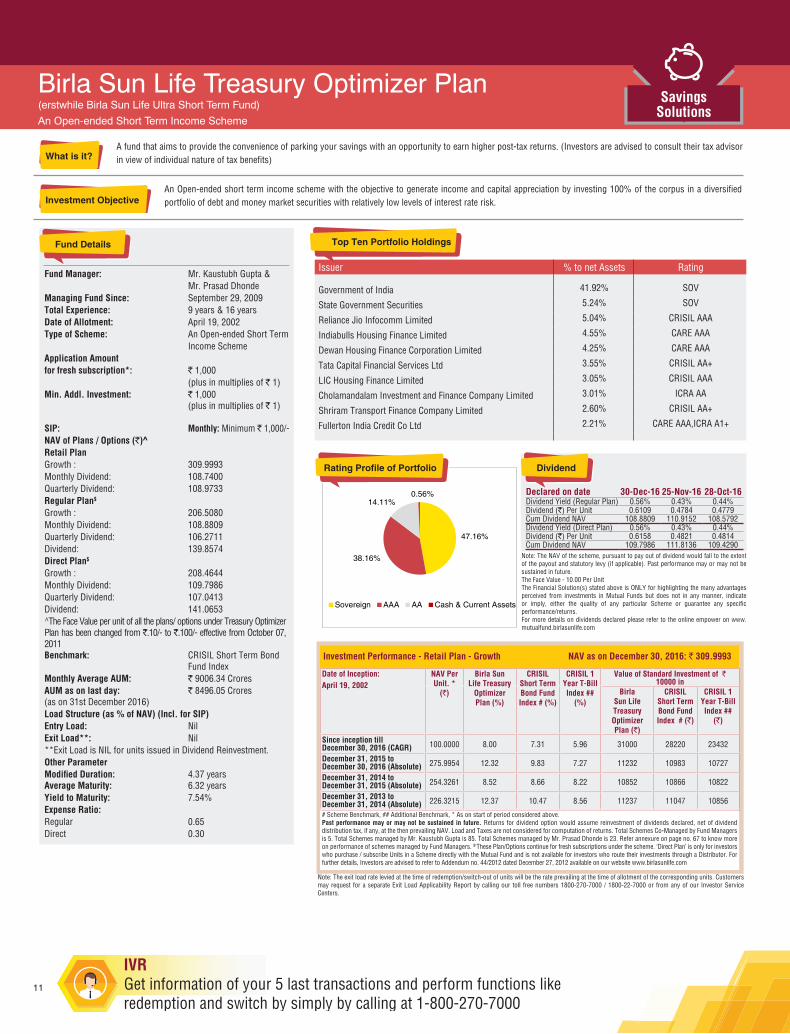
47.16%
38.16%
14.11%0.56%
Sovereign AAA AA Cash & Current Assets
A fund that aims to provide the convenience of parking your savings with an opportunity to earn higher post-tax returns. (Investors are advised to consult their tax advisor in view of individual nature of tax benefits)
An Open-ended short term income scheme with the objective to generate income and capital appreciation by investing 100% of the corpus in a diversified portfolio of debt and money market securities with relatively low levels of interest rate risk.
Fund Manager: Mr. Kaustubh Gupta & Mr. Prasad DhondeManaging Fund Since: September 29, 2009Total Experience: 9 years & 16 yearsDate of Allotment: April 19, 2002Type of Scheme: An Open-ended Short Term Income SchemeApplication Amount for fresh subscription*: ` 1,000 (plus in multiplies of ` 1)Min. Addl. Investment: ` 1,000 (plus in multiplies of ` 1)
SIP: Monthly: Minimum ` 1,000/-NAV of Plans / Options (`)^Retail Plan Growth : 309.9993Monthly Dividend: 108.7400Quarterly Dividend: 108.9733Regular Plan$ Growth : 206.5080Monthly Dividend: 108.8809Quarterly Dividend: 106.2711Dividend: 139.8574Direct Plan$ Growth : 208.4644Monthly Dividend: 109.7986Quarterly Dividend: 107.0413Dividend: 141.0653^The Face Value per unit of all the plans/ options under Treasury Optimizer Plan has been changed from .̀10/- to .̀100/- effective from October 07, 2011Benchmark: CRISIL Short Term Bond Fund IndexMonthly Average AUM: ` 9006.34 CroresAUM as on last day: ` 8496.05 Crores(as on 31st December 2016)Load Structure (as % of NAV) (Incl. for SIP)Entry Load: NilExit Load**: Nil**Exit Load is NIL for units issued in Dividend Reinvestment.Other ParameterModified Duration: 4.37 yearsAverage Maturity: 6.32 yearsYield to Maturity: 7.54%Expense Ratio:Regular 0.65Direct 0.30
Birla Sun Life Treasury Optimizer Plan(erstwhile Birla Sun Life Ultra Short Term Fund) An Open-ended Short Term Income Scheme
Issuer % to net Assets Rating
Government of India 41.92% SOV
State Government Securities 5.24% SOV
Reliance Jio Infocomm Limited 5.04% CRISIL AAA
Indiabulls Housing Finance Limited 4.55% CARE AAA
Dewan Housing Finance Corporation Limited 4.25% CARE AAA
Tata Capital Financial Services Ltd 3.55% CRISIL AA+
LIC Housing Finance Limited 3.05% CRISIL AAA
Cholamandalam Investment and Finance Company Limited 3.01% ICRA AA
Shriram Transport Finance Company Limited 2.60% CRISIL AA+
Fullerton India Credit Co Ltd 2.21% CARE AAA,ICRA A1+
Top Ten Portfolio Holdings
Note: The exit load rate levied at the time of redemption/switch-out of units will be the rate prevailing at the time of allotment of the corresponding units. Customers may request for a separate Exit Load Applicability Report by calling our toll free numbers 1800-270-7000 / 1800-22-7000 or from any of our Investor Service Centers.
Investment Performance - Retail Plan - Growth NAV as on December 30, 2016: ` 309.9993
Date of Inception: April 19, 2002
NAV Per Unit. *
(`)
Birla SunLife Treasury
OptimizerPlan (%)
CRISILShort TermBond FundIndex # (%)
CRISIL 1Year T-BillIndex ##
(%)
Value of Standard Investment of ` 10000 in
BirlaSun LifeTreasuryOptimizerPlan (`)
CRISILShort TermBond FundIndex # (`)
CRISIL 1Year T-BillIndex ##
(`)
Since inception till December 30, 2016 (CAGR) 100.0000 8.00 7.31 5.96 31000 28220 23432
December 31, 2015 to December 30, 2016 (Absolute) 275.9954 12.32 9.83 7.27 11232 10983 10727
December 31, 2014 toDecember 31, 2015 (Absolute) 254.3261 8.52 8.66 8.22 10852 10866 10822
December 31, 2013 toDecember 31, 2014 (Absolute) 226.3215 12.37 10.47 8.56 11237 11047 10856
# Scheme Benchmark, ## Additional Benchmark, * As on start of period considered above.Past performance may or may not be sustained in future. Returns for dividend option would assume reinvestment of dividends declared, net of dividend distribution tax, if any, at the then prevailing NAV. Load and Taxes are not considered for computation of returns. Total Schemes Co-Managed by Fund Managers is 5. Total Schemes managed by Mr. Kaustubh Gupta is 85. Total Schemes managed by Mr. Prasad Dhonde is 23. Refer annexure on page no. 67 to know more on performance of schemes managed by Fund Managers. $‘These Plan/Options continue for fresh subscriptions under the scheme. ‘Direct Plan’ is only for investors who purchase / subscribe Units in a Scheme directly with the Mutual Fund and is not available for investors who route their investments through a Distributor. For further details, Investors are advised to refer to Addendum no. 44/2012 dated December 27, 2012 available on our website www.birlasunlife.com
Declared on date 30-Dec-16 25-Nov-16 28-Oct-16Dividend Yield (Regular Plan) 0.56% 0.43% 0.44%Dividend (`) Per Unit 0.6109 0.4784 0.4779Cum Dividend NAV 108.8809 110.9152 108.5792Dividend Yield (Direct Plan) 0.56% 0.43% 0.44%Dividend (`) Per Unit 0.6158 0.4821 0.4814Cum Dividend NAV 109.7986 111.8136 109.4290
Note: The NAV of the scheme, pursuant to pay out of dividend would fall to the extent of the payout and statutory levy (if applicable). Past performance may or may not be sustained in future.The Face Value - 10.00 Per UnitThe Financial Solution(s) stated above is ONLY for highlighting the many advantages perceived from investments in Mutual Funds but does not in any manner, indicate or imply, either the quality of any particular Scheme or guarantee any specific performance/returns.For more details on dividends declared please refer to the online empower on www.mutualfund.birlasunlife.com
11
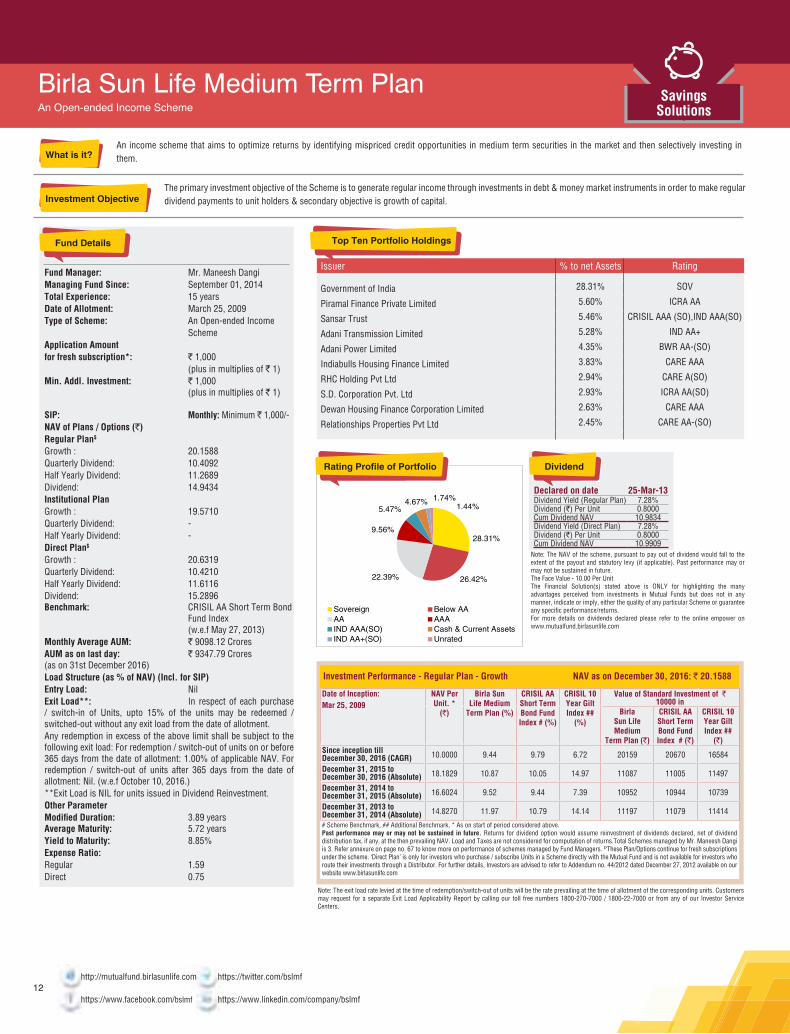
28.31%
26.42%22.39%
9.56%
5.47%4.67% 1.74%
1.44%
Sovereign Below AAAA AAAIND AAA(SO) Cash & Current AssetsIND AA+(SO) Unrated
An income scheme that aims to optimize returns by identifying mispriced credit opportunities in medium term securities in the market and then selectively investing in them.
The primary investment objective of the Scheme is to generate regular income through investments in debt & money market instruments in order to make regular dividend payments to unit holders & secondary objective is growth of capital.
Fund Manager: Mr. Maneesh DangiManaging Fund Since: September 01, 2014Total Experience: 15 yearsDate of Allotment: March 25, 2009Type of Scheme: An Open-ended Income SchemeApplication Amount for fresh subscription*: ` 1,000 (plus in multiplies of ` 1)Min. Addl. Investment: ` 1,000 (plus in multiplies of ` 1)
SIP: Monthly: Minimum ` 1,000/-NAV of Plans / Options (`)Regular Plan$ Growth : 20.1588Quarterly Dividend: 10.4092Half Yearly Dividend: 11.2689Dividend: 14.9434Institutional Plan Growth : 19.5710Quarterly Dividend: -Half Yearly Dividend: -Direct Plan$ Growth : 20.6319Quarterly Dividend: 10.4210Half Yearly Dividend: 11.6116Dividend: 15.2896Benchmark: CRISIL AA Short Term Bond Fund Index (w.e.f May 27, 2013)Monthly Average AUM: ` 9098.12 CroresAUM as on last day: ` 9347.79 Crores(as on 31st December 2016)Load Structure (as % of NAV) (Incl. for SIP)Entry Load: NilExit Load**: In respect of each purchase / switch-in of Units, upto 15% of the units may be redeemed / switched-out without any exit load from the date of allotment.Any redemption in excess of the above limit shall be subject to the following exit load: For redemption / switch-out of units on or before 365 days from the date of allotment: 1.00% of applicable NAV. For redemption / switch-out of units after 365 days from the date of allotment: Nil. (w.e.f October 10, 2016.)**Exit Load is NIL for units issued in Dividend Reinvestment.Other ParameterModified Duration: 3.89 yearsAverage Maturity: 5.72 yearsYield to Maturity: 8.85%Expense Ratio:Regular 1.59Direct 0.75
Birla Sun Life Medium Term PlanAn Open-ended Income Scheme
Issuer % to net Assets Rating
Government of India 28.31% SOV
Piramal Finance Private Limited 5.60% ICRA AA
Sansar Trust 5.46% CRISIL AAA (SO),IND AAA(SO)
Adani Transmission Limited 5.28% IND AA+
Adani Power Limited 4.35% BWR AA-(SO)
Indiabulls Housing Finance Limited 3.83% CARE AAA
RHC Holding Pvt Ltd 2.94% CARE A(SO)
S.D. Corporation Pvt. Ltd 2.93% ICRA AA(SO)
Dewan Housing Finance Corporation Limited 2.63% CARE AAA
Relationships Properties Pvt Ltd 2.45% CARE AA-(SO)
Top Ten Portfolio Holdings
Note: The exit load rate levied at the time of redemption/switch-out of units will be the rate prevailing at the time of allotment of the corresponding units. Customers may request for a separate Exit Load Applicability Report by calling our toll free numbers 1800-270-7000 / 1800-22-7000 or from any of our Investor Service Centers.
Investment Performance - Regular Plan - Growth NAV as on December 30, 2016: ` 20.1588
Date of Inception: Mar 25, 2009
NAV Per Unit. *
(`)
Birla SunLife Medium
Term Plan (%)
CRISIL AAShort TermBond FundIndex # (%)
CRISIL 10Year GiltIndex ##
(%)
Value of Standard Investment of ` 10000 in
BirlaSun LifeMedium
Term Plan (`)
CRISIL AAShort TermBond FundIndex # (`)
CRISIL 10Year GiltIndex ##
(`)Since inception till December 30, 2016 (CAGR) 10.0000 9.44 9.79 6.72 20159 20670 16584
December 31, 2015 to December 30, 2016 (Absolute) 18.1829 10.87 10.05 14.97 11087 11005 11497
December 31, 2014 toDecember 31, 2015 (Absolute) 16.6024 9.52 9.44 7.39 10952 10944 10739
December 31, 2013 toDecember 31, 2014 (Absolute) 14.8270 11.97 10.79 14.14 11197 11079 11414
# Scheme Benchmark, ## Additional Benchmark, * As on start of period considered above.Past performance may or may not be sustained in future. Returns for dividend option would assume reinvestment of dividends declared, net of dividend distribution tax, if any, at the then prevailing NAV. Load and Taxes are not considered for computation of returns.Total Schemes managed by Mr. Maneesh Dangi is 3. Refer annexure on page no. 67 to know more on performance of schemes managed by Fund Managers. $‘These Plan/Options continue for fresh subscriptions under the scheme. ‘Direct Plan’ is only for investors who purchase / subscribe Units in a Scheme directly with the Mutual Fund and is not available for investors who route their investments through a Distributor. For further details, Investors are advised to refer to Addendum no. 44/2012 dated December 27, 2012 available on our website www.birlasunlife.com
Declared on date 25-Mar-13Dividend Yield (Regular Plan) 7.28%Dividend (`) Per Unit 0.8000Cum Dividend NAV 10.9834Dividend Yield (Direct Plan) 7.28%Dividend (`) Per Unit 0.8000Cum Dividend NAV 10.9909
Note: The NAV of the scheme, pursuant to pay out of dividend would fall to the extent of the payout and statutory levy (if applicable). Past performance may or may not be sustained in future.The Face Value - 10.00 Per UnitThe Financial Solution(s) stated above is ONLY for highlighting the many advantages perceived from investments in Mutual Funds but does not in any manner, indicate or imply, either the quality of any particular Scheme or guarantee any specific performance/returns.For more details on dividends declared please refer to the online empower on www.mutualfund.birlasunlife.com
http://mutualfund.birlasunlife.com https://twitter.com/bslmf
https://www.facebook.com/bslmf https://www.linkedin.com/company/bslmf12

13
41.15%
28.62%
20.68%
5.18%4.38%
AAA Below AA
AA Cash & Current Assets
Unrated
An income scheme that intends to generate returns by investing in corporate debt securities with short to medium term maturities across the credit curve and would endeavour to take benefit from mispriced credit opportunities.
The investment objective of the Scheme is to generate returns by predominantly investing in a portfolio of corporate debt securities with short to medium term maturities across the credit spectrum within the investment grade. The Scheme does not guarantee/indicate any returns. There can be no assurance that the schemes’ objectives will be achieved.
Fund Manager: Mr. Maneesh DangiManaging Fund Since: Since InceptionTotal Experience: 15 yearsDate of Allotment: April 17, 2015Type of Scheme: An Open ended Income SchemeApplication Amount for fresh subscription*: ` 1,000 (plus in multiplies of ` 1)Min. Addl. Investment: ` 1,000 (plus in multiplies of ` 1)
SIP: Monthly: Minimum ` 1,000/-NAV of Plans / Options (`)Regular Plan$ Growth : 11.7138Dividend: 11.4789Bonus: 11.7280Direct Plan$ Growth : 11.8726Dividend: 11.6371Bonus: 11.8724Benchmark: CRISIL AA Short Term Bond Fund IndexMonthly Average AUM: ` 1425.16 CroresAUM as on last day: ` 1483.49 Crores(as on 31st December 2016)Load Structure (as % of NAV) (Incl. for SIP)Entry Load: NilExit Load**: For redemption/switch out of units within 365 days from the date of allotment: 2.00% of applicable NAV. For redemption/switch out of units after 365 days but before 730 days from the date of allotment: 1.00% of applicable NAV. For redemption/switch out of units after 730 days from the date of allotment: Nil.**Exit Load is NIL for units issued in Dividend Reinvestment.Other ParameterModified Duration: 3.06 yearsAverage Maturity: 4.21 yearsYield to Maturity: 9.15%Expense Ratio:Regular 1.77Direct 0.94
Birla Sun Life Corporate Bond FundAn Open ended Income Scheme
Issuer % to net Assets Rating
Power Finance Corporation Limited 7.28% CRISIL AAA
Adani Transmission Limited 5.89% IND AA+
Systemtrac Traders Private Limited 4.40% ICRA AA-(SO)
Wadhawan Global Capital Pvt Ltd 4.27% CARE AAA(SO)
NTPC Limited 4.06% CRISIL AAA
Piramal Finance Private Limited 3.53% ICRA AA
Adani Power Limited 3.51% BWR AA-(SO)
HDFC Bank Limited 3.43% CRISIL AAA
High Point Properties Private Limited 3.40% ICRA AA(SO)
Power Grid Corporation of India Limited 3.39% CRISIL AAA
Top Ten Portfolio Holdings
Note: The exit load rate levied at the time of redemption/switch-out of units will be the rate prevailing at the time of allotment of the corresponding units. Customers may request for a separate Exit Load Applicability Report by calling our toll free numbers 1800-270-7000 / 1800-22-7000 or from any of our Investor Service Centers.
Investment Performance - Regular Plan - Growth NAV as on December 30, 2016: ` 11.7138
Date of Inception: Apr 17, 2015
NAV Per Unit. *
(`)
BirlaSun Life
CorporateBond Fund (%)
CRISIL AAShort TermBond FundIndex # (%)
Crisil 10Year GiltIndex ##
(%)
Value of Standard Investment of ` 10000 in
BirlaSun Life
CorporateBond
Fund (`)
CRISIL AAShort TermBond FundIndex # (`)
Crisil 10Year GiltIndex ##
(`)
Since inception till December 30, 2016 (CAGR) 10.0000 9.71 9.59 11.40 11714 11693 12023
December 31, 2015 to December 30, 2016 (Absolute) 10.6204 10.30 10.05 14.97 11030 11005 11497
# Scheme Benchmark, ## Additional Benchmark, * As on start of period considered above.Past performance may or may not be sustained in future. Returns for dividend option would assume reinvestment of dividends declared, net of dividend distribution tax, if any, at the then prevailing NAV. Load and Taxes are not considered for computation of returns.Total Schemes managed by Mr. Maneesh Dangi is 3. Refer annexure on page no. 67 to know more on performance of schemes managed by Fund Managers. $‘These Plan/Options continue for fresh subscriptions under the scheme. ‘Direct Plan’ is only for investors who purchase / subscribe Units in a Scheme directly with the Mutual Fund and is not available for investors who route their investments through a Distributor. For further details, Investors are advised to refer to Addendum no. 44/2012 dated December 27, 2012 available on our website www.birlasunlife.com
Declared on date 30-Dec-16 30-Sep-16Dividend Yield (Regular Plan) 1.45% 1.45%Dividend (`) Per Unit 0.1661 0.1661Cum Dividend NAV 11.4789 11.4749Dividend Yield (Direct Plan) 1.43% 1.43%Dividend (`) Per Unit 0.1661 0.1661Cum Dividend NAV 11.6371 11.6065
Note: The NAV of the scheme, pursuant to pay out of dividend would fall to the extent of the payout and statutory levy (if applicable). Past performance may or may not be sustained in future.The Face Value - 10.00 Per UnitThe Financial Solution(s) stated above is ONLY for highlighting the many advantages perceived from investments in Mutual Funds but does not in any manner, indicate or imply, either the quality of any particular Scheme or guarantee any specific performance/returns.For more details on dividends declared please refer to the online empower on www.mutualfund.birlasunlife.com

67.99%16.83%
8.04%
4.38%2.39%
0.37%
Sovereign AA
AAA Below AA
Cash & Current Assets IND AAA(SO)
An income solution that aims to generate optimal returns through active management by capturing positive price and credit spread movements.
An Open-ended income scheme with the objective to generate optimal returns with high liquidity through active management of the portfolio by investing in high quality debt and money market instruments.
Fund Manager: Mr. Maneesh DangiManaging Fund Since: September 12, 2007Total Experience: 15 yearsDate of Allotment: September 27, 2004Type of Scheme: An Open-ended Income SchemeApplication Amount for fresh subscription*: ` 1,000 (plus in multiplies of ` 1)Min. Addl. Investment: ` 1,000 (plus in multiplies of ` 1)
SIP: Monthly: Minimum ` 1,000/-NAV of Plans / Options (`)^Regular Plan Growth : 29.1497Monthly Dividend: 11.4085Quarterly Dividend: 11.0453Dividend: 12.6637Direct Plan$ Growth : 29.7861Monthly Dividend: 11.5460Quarterly Dividend: 11.3216Dividend: 12.8416 ^The dividend option under the scheme have been introduced w.e.f October 29 2014. Please refer addendum no 44/2014 dated October 12, 2014 for further details.Benchmark: CRISIL Short Term Bond Fund Index (w.e.f 27 May, 2013)Monthly Average AUM: ` 15316.70 CroresAUM as on last day: ` 15461.92 Crores(as on 31st December 2016)Load Structure (as % of NAV) (Incl. for SIP)Entry Load: NilExit Load**: In respect of each purchase / switch-in of Units, upto 15% of the units may be redeemed / switched-out without any exit load from the date of allotment.Any redemption in excess of the above limit shall be subject to the following exit load: For redemption / switch-out of units on or before 90 days from the date of allotment: 0.50% of applicable NAV. For redemption / switch-out of units after 90 days from the date of allotment: Nil (w.e.f October 10, 2016)**Exit Load is NIL for units issued in Dividend Reinvestment.Other ParameterModified Duration: 8.14 yearsAverage Maturity: 18.24 yearsYield to Maturity: 7.75%Expense Ratio:Regular 1.50Direct 0.87
Birla Sun Life Dynamic Bond FundAn Open-ended Income Scheme
Issuer % to net Assets Rating
Government of India 67.60% SOV
Indiabulls Housing Finance Limited 3.87% CARE AAA
Shriram Transport Finance Company Limited 3.26% CRISIL AA+
Piramal Finance Private Limited 3.05% ICRA AA
Tata Motors Finance Ltd 2.45% CRISIL AA
Adani Power Limited 2.09% BWR AA-(SO)
Edelweiss Commodities Services Ltd 1.97% ICRA AA
Dewan Housing Finance Corporation Limited 1.82% CARE AAA
Sansar Trust 1.46% CRISIL AAA (SO),IND AAA(SO)
JM Financial Credit Solution Limited 1.20% ICRA AA
Top Ten Portfolio Holdings
Note: The exit load rate levied at the time of redemption/switch-out of units will be the rate prevailing at the time of allotment of the corresponding units. Customers may request for a separate Exit Load Applicability Report by calling our toll free numbers 1800-270-7000 / 1800-22-7000 or from any of our Investor Service Centers.
Investment Performance - Regular Plan - Growth NAV as on December 30, 2016: ` 29.1497
Date of Inception: Sept 27, 2004
NAV Per Unit. *
(`)
Birla SunLife Dynamic
Bond Fund (%)
CRISILShort TermBond FundIndex # (%)
CRISIL 10Year GiltIndex ##
(%)
Value of Standard Investment of ` 10000 in
BirlaSun LifeDynamic
Bond Fund (`)
CRISILShort TermBond FundIndex # (`)
CRISIL 10Year GiltIndex ##
(`)Since inception till December 30, 2016 (CAGR) 10.0000 9.11 7.63 6.45 29150 24645 21517
December 31, 2015 to December 30, 2016 (Absolute) 25.5607 14.04 9.83 14.97 11404 10983 11497
December 31, 2014 toDecember 31, 2015 (Absolute) 23.7909 7.44 8.66 7.39 10744 10866 10739
December 31, 2013 toDecember 31, 2014 (Absolute) 20.7154 14.85 10.47 14.14 11485 11047 11414
# Scheme Benchmark, ## Additional Benchmark, * As on start of period considered above.Past performance may or may not be sustained in future. Returns for dividend option would assume reinvestment of dividends declared, net of dividend distribution tax, if any, at the then prevailing NAV. Load and Taxes are not considered for computation of returns. Total Schemes managed by Mr. Maneesh Dangi is 3. Refer annexure on page no. 67 to know more on performance of schemes managed by Fund Managers. $‘Direct Plan’ is only for investors who purchase /subscribe Units in a Scheme directly with the Mutual Fund and is not available for investors who route their investments through a Distributor. For further details, Investors are advised to refer to Addendum no. 44/2012 dated December 27, 2012 available on our website www.birlasunlife.com
Declared on date 30-Dec-16 25-Nov-16 28-Oct-16Dividend Yield (Regular Plan) 0.58% 0.42% 0.44%Dividend (`) Per Unit 0.0657 0.0504 0.0506Cum Dividend NAV 11.4085 11.9128 11.4399Dividend Yield (Direct Plan) 0.58% 0.42% 0.44%Dividend (`) Per Unit 0.0664 0.0509 0.0511Cum Dividend NAV 11.5460 12.0489 11.5649
Note: The NAV of the scheme, pursuant to pay out of dividend would fall to the extent of the payout and statutory levy (if applicable). Past performance may or may not be sustained in future.The Face Value - 10.00 Per UnitThe Financial Solution(s) stated above is ONLY for highlighting the many advantages perceived from investments in Mutual Funds but does not in any manner, indicate or imply, either the quality of any particular Scheme or guarantee any specific performance/returns.For more details on dividends declared please refer to the online empower on www.mutualfund.birlasunlife.com
http://mutualfund.birlasunlife.com https://twitter.com/bslmf
https://www.facebook.com/bslmf https://www.linkedin.com/company/bslmf14
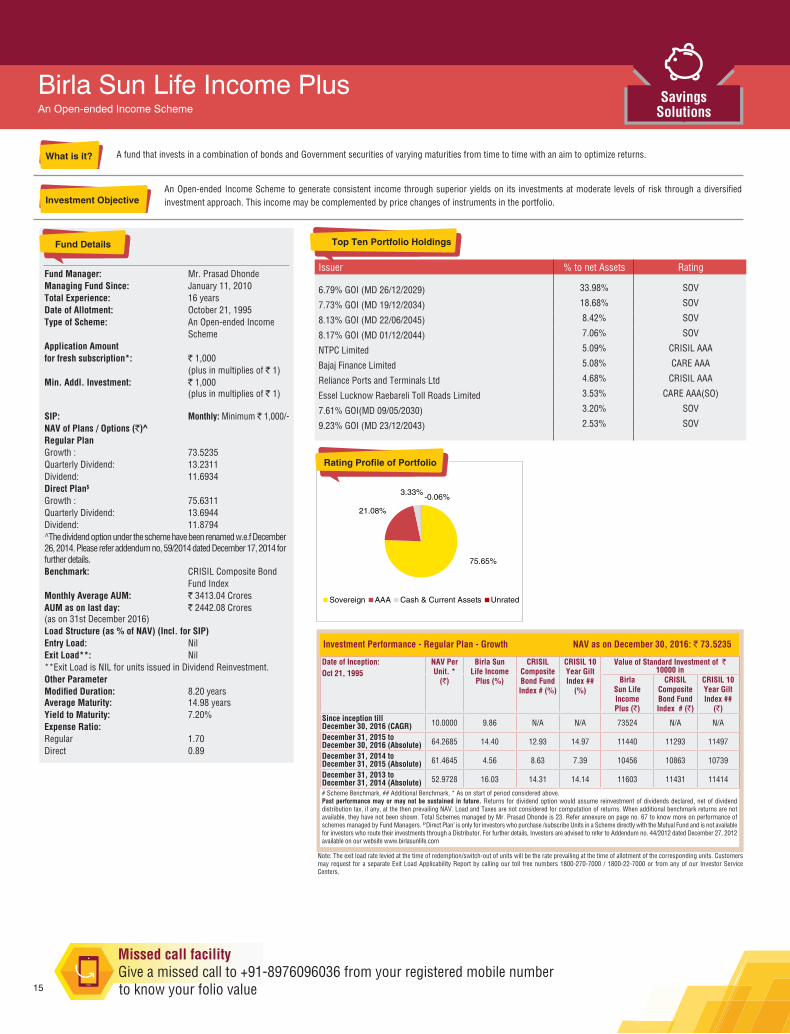
A fund that invests in a combination of bonds and Government securities of varying maturities from time to time with an aim to optimize returns.
An Open-ended Income Scheme to generate consistent income through superior yields on its investments at moderate levels of risk through a diversified investment approach. This income may be complemented by price changes of instruments in the portfolio.
Fund Manager: Mr. Prasad DhondeManaging Fund Since: January 11, 2010Total Experience: 16 yearsDate of Allotment: October 21, 1995Type of Scheme: An Open-ended Income SchemeApplication Amount for fresh subscription*: ` 1,000 (plus in multiplies of ` 1)Min. Addl. Investment: ` 1,000 (plus in multiplies of ` 1)
SIP: Monthly: Minimum ` 1,000/-NAV of Plans / Options (`)^Regular Plan Growth : 73.5235Quarterly Dividend: 13.2311Dividend: 11.6934Direct Plan$ Growth : 75.6311Quarterly Dividend: 13.6944Dividend: 11.8794^The dividend option under the scheme have been renamed w.e.f December 26, 2014. Please refer addendum no, 59/2014 dated December 17, 2014 for further details.Benchmark: CRISIL Composite Bond Fund IndexMonthly Average AUM: ` 3413.04 CroresAUM as on last day: ` 2442.08 Crores(as on 31st December 2016)Load Structure (as % of NAV) (Incl. for SIP)Entry Load: NilExit Load**: Nil**Exit Load is NIL for units issued in Dividend Reinvestment.Other ParameterModified Duration: 8.20 yearsAverage Maturity: 14.98 yearsYield to Maturity: 7.20%Expense Ratio:Regular 1.70Direct 0.89
75.65%
21.08%
3.33%-0.06%
Sovereign AAA Cash & Current Assets Unrated
Birla Sun Life Income PlusAn Open-ended Income Scheme
Issuer % to net Assets Rating
6.79% GOI (MD 26/12/2029) 33.98% SOV
7.73% GOI (MD 19/12/2034) 18.68% SOV
8.13% GOI (MD 22/06/2045) 8.42% SOV
8.17% GOI (MD 01/12/2044) 7.06% SOV
NTPC Limited 5.09% CRISIL AAA
Bajaj Finance Limited 5.08% CARE AAA
Reliance Ports and Terminals Ltd 4.68% CRISIL AAA
Essel Lucknow Raebareli Toll Roads Limited 3.53% CARE AAA(SO)
7.61% GOI(MD 09/05/2030) 3.20% SOV
9.23% GOI (MD 23/12/2043) 2.53% SOV
Top Ten Portfolio Holdings
Note: The exit load rate levied at the time of redemption/switch-out of units will be the rate prevailing at the time of allotment of the corresponding units. Customers may request for a separate Exit Load Applicability Report by calling our toll free numbers 1800-270-7000 / 1800-22-7000 or from any of our Investor Service Centers.
Investment Performance - Regular Plan - Growth NAV as on December 30, 2016: ` 73.5235
Date of Inception: Oct 21, 1995
NAV Per Unit. *
(`)
Birla SunLife Income
Plus (%)
CRISILCompositeBond FundIndex # (%)
CRISIL 10Year GiltIndex ##
(%)
Value of Standard Investment of ` 10000 in
BirlaSun LifeIncomePlus (`)
CRISILCompositeBond FundIndex # (`)
CRISIL 10Year GiltIndex ##
(`)Since inception till December 30, 2016 (CAGR) 10.0000 9.86 N/A N/A 73524 N/A N/A
December 31, 2015 to December 30, 2016 (Absolute) 64.2685 14.40 12.93 14.97 11440 11293 11497
December 31, 2014 toDecember 31, 2015 (Absolute) 61.4645 4.56 8.63 7.39 10456 10863 10739
December 31, 2013 toDecember 31, 2014 (Absolute) 52.9728 16.03 14.31 14.14 11603 11431 11414
# Scheme Benchmark, ## Additional Benchmark, * As on start of period considered above.Past performance may or may not be sustained in future. Returns for dividend option would assume reinvestment of dividends declared, net of dividend distribution tax, if any, at the then prevailing NAV. Load and Taxes are not considered for computation of returns. When additional benchmark returns are not available, they have not been shown. Total Schemes managed by Mr. Prasad Dhonde is 23. Refer annexure on page no. 67 to know more on performance of schemes managed by Fund Managers. $‘Direct Plan’ is only for investors who purchase /subscribe Units in a Scheme directly with the Mutual Fund and is not available for investors who route their investments through a Distributor. For further details, Investors are advised to refer to Addendum no. 44/2012 dated December 27, 2012 available on our website www.birlasunlife.com
15

Note: The exit load rate levied at the time of redemption/switch-out of units will be the rate prevailing at the time of allotment of the corresponding units. Customers may request for a separate Exit Load Applicability Report by calling our toll free numbers 1800-270-7000 / 1800-22-7000 or from any of our Investor Service Centers.
A fund that aims to generate income and capital appreciation by investing exclusively in Government Securities.
The investment objective of the scheme is to enable investors to invest in Central Government Securities, based on their own view on the interest rate scenario & generate credit risk-free returns.
Fund Manager: Mr. Prasad Dhonde & Mr. Kaustubh GuptaManaging Fund Since: July 01, 2011 & June 20, 2014Total Experience: 16 years & 9 yearsDate of Allotment: October 12, 1999Type of Scheme: An Open-ended Government Securities SchemeApplication Amount for fresh subscription*: ` 1,000 (plus in multiplies of ` 1)Min. Addl. Investment: ` 1,000 (plus in multiplies of ` 1)
SIP: Monthly: Minimum ` 1,000/-NAV of Plans / Options (`)Regular Plan Growth : 49.5551Quarterly Dividend: 12.6878Direct Plan$ Growth: 49.9064Quarterly Dividend: 11.1680Benchmark: I-Sec LI-BEXMonthly Average AUM: ` 35.35 CroresAUM as on last day: ` 35.32 Crores(as on 31st December 2016)Load Structure (as % of NAV) (Incl. for SIP)Entry Load: NilExit Load**: Nil **Exit Load is NIL for units issued in Dividend Reinvestment.
Other ParameterModified Duration: 6.10 yearsAverage Maturity: 8.61 yearsYield to Maturity: 6.55%Expense Ratio:Regular 0.47Direct 0.27
89.25%
10.75%
Sovereign Cash & Current Assets
Birla Sun Life Constant Maturity 10 Year Gilt Fund(erstwhile Birla Sun Life Gilt Plus – Regular Plan. Name changed w.e.f August 06, 2015)An Open-ended Government Securities Scheme
Issuer % to net Assets Rating
6.97% GOI (MD 06/09/2026) 87.70% SOV
8.40% GOI (MD 28/07/2024) 1.55% SOV
Cash & Current Assets 10.75%
Top Portfolio Holdings
Investment Performance - Regular Plan - Growth NAV as on December 30, 2016: ` 49.5551
Date of Inception: Oct 12, 1999
NAV Per Unit. *
(`)
Birla SunLife ConstantMaturity 10
Year Gilt Fund (%)
I-Sec LI-BEX # (%)
CRISIL 10Year
Gilt Index ## (%)
Value of Standard Investment of ` 10000 in
BirlaSun LifeConstant
Maturity 10Year GiltFund (`)
I-Sec LI-BEX # (`)
CRISIL 10Year
Gilt Index ## (`)
Since inception till December 30, 2016 (CAGR) 10.0000 9.73 N/A N/A 49555 N/A N/A
December 31, 2015 to December 30, 2016 (Absolute) 43.4787 13.98 16.76 14.97 11398 11676 11497
December 31, 2014 toDecember 31, 2015 (Absolute) 40.6554 6.94 7.48 7.39 10694 10748 10739
December 31, 2013 toDecember 31, 2014 (Absolute) 36.0600 12.74 19.74 14.14 11274 11974 11414
# Scheme Benchmark, ## Additional Benchmark, * As on start of period considered above.Past performance may or may not be sustained in future. Returns for dividend option would assume reinvestment of dividends declared, net of dividend distribution tax, if any, at the then prevailing NAV. Load and Taxes are not considered for computation of returns. When scheme/additional benchmark returns are not available, they have not been shown. Total Schemes Co-Managed by Fund Managers is 5. Total Schemes managed by Mr. Prasad Dhonde is 23. Total Schemes managed by Mr. Kaustubh Gupta is 85. Refer annexure on page no. 67 to know more on performance of schemes managed by Fund Managers. $‘Direct Plan’ is only for investors who purchase /subscribe Units in a Scheme directly with the Mutual Fund and is not available for investors who route their investments through a Distributor. For further details, Investors are advised to refer to Addendum no. 44/2012 dated December 27, 2012 available on our website www.birlasunlife.com
http://mutualfund.birlasunlife.com https://twitter.com/bslmf
https://www.facebook.com/bslmf https://www.linkedin.com/company/bslmf16
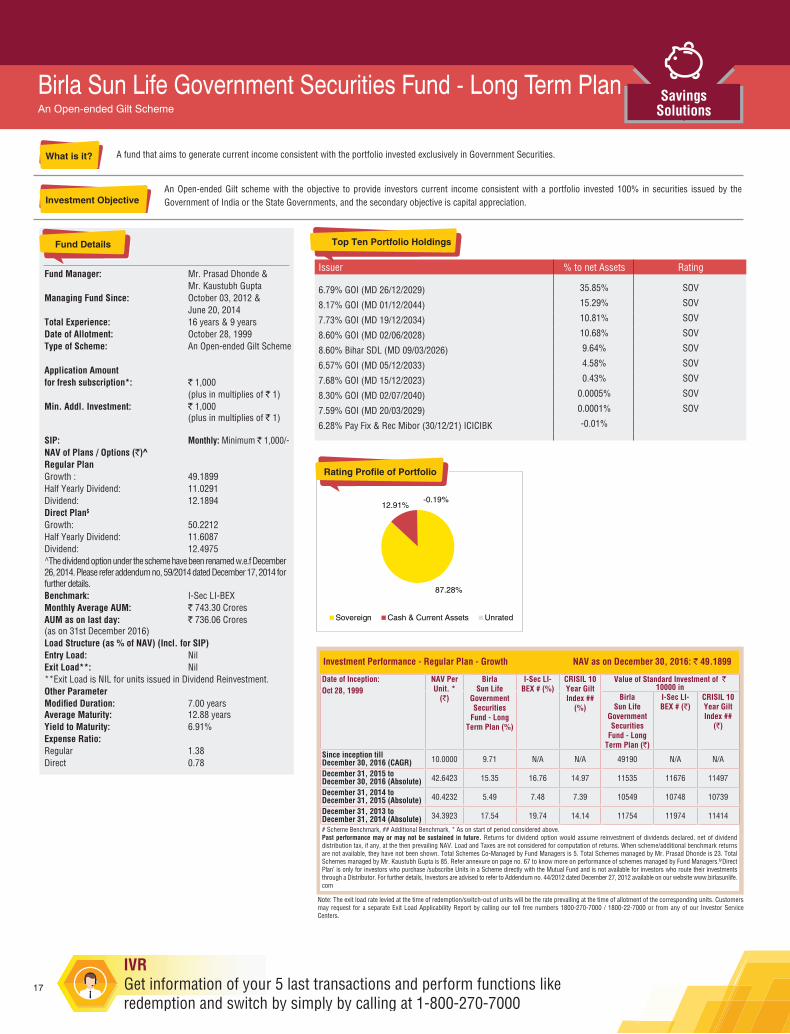
A fund that aims to generate current income consistent with the portfolio invested exclusively in Government Securities.
An Open-ended Gilt scheme with the objective to provide investors current income consistent with a portfolio invested 100% in securities issued by the Government of India or the State Governments, and the secondary objective is capital appreciation.
Fund Manager: Mr. Prasad Dhonde & Mr. Kaustubh GuptaManaging Fund Since: October 03, 2012 & June 20, 2014Total Experience: 16 years & 9 yearsDate of Allotment: October 28, 1999Type of Scheme: An Open-ended Gilt Scheme
Application Amount for fresh subscription*: ` 1,000 (plus in multiplies of ` 1)Min. Addl. Investment: ` 1,000 (plus in multiplies of ` 1)
SIP: Monthly: Minimum ` 1,000/-NAV of Plans / Options (`)^Regular Plan Growth : 49.1899Half Yearly Dividend: 11.0291Dividend: 12.1894Direct Plan$ Growth: 50.2212Half Yearly Dividend: 11.6087Dividend: 12.4975^The dividend option under the scheme have been renamed w.e.f December 26, 2014. Please refer addendum no, 59/2014 dated December 17, 2014 for further details.Benchmark: I-Sec LI-BEXMonthly Average AUM: ` 743.30 CroresAUM as on last day: ` 736.06 Crores(as on 31st December 2016)Load Structure (as % of NAV) (Incl. for SIP)Entry Load: NilExit Load**: Nil**Exit Load is NIL for units issued in Dividend Reinvestment.Other ParameterModified Duration: 7.00 yearsAverage Maturity: 12.88 yearsYield to Maturity: 6.91%Expense Ratio:Regular 1.38Direct 0.78
87.28%
12.91%-0.19%
Sovereign Cash & Current Assets Unrated
Birla Sun Life Government Securities Fund - Long Term PlanAn Open-ended Gilt Scheme
Issuer % to net Assets Rating
6.79% GOI (MD 26/12/2029) 35.85% SOV
8.17% GOI (MD 01/12/2044) 15.29% SOV
7.73% GOI (MD 19/12/2034) 10.81% SOV
8.60% GOI (MD 02/06/2028) 10.68% SOV
8.60% Bihar SDL (MD 09/03/2026) 9.64% SOV
6.57% GOI (MD 05/12/2033) 4.58% SOV
7.68% GOI (MD 15/12/2023) 0.43% SOV
8.30% GOI (MD 02/07/2040) 0.0005% SOV
7.59% GOI (MD 20/03/2029) 0.0001% SOV
6.28% Pay Fix & Rec Mibor (30/12/21) ICICIBK -0.01%
Top Ten Portfolio Holdings
Note: The exit load rate levied at the time of redemption/switch-out of units will be the rate prevailing at the time of allotment of the corresponding units. Customers may request for a separate Exit Load Applicability Report by calling our toll free numbers 1800-270-7000 / 1800-22-7000 or from any of our Investor Service Centers.
Investment Performance - Regular Plan - Growth NAV as on December 30, 2016: ` 49.1899
Date of Inception: Oct 28, 1999
NAV Per Unit. *
(`)
BirlaSun Life
GovernmentSecurities
Fund - LongTerm Plan (%)
I-Sec LI-BEX # (%)
CRISIL 10Year GiltIndex ##
(%)
Value of Standard Investment of ` 10000 in
BirlaSun Life
GovernmentSecurities
Fund - LongTerm Plan (`)
I-Sec LI-BEX # (`)
CRISIL 10Year GiltIndex ##
(`)
Since inception till December 30, 2016 (CAGR) 10.0000 9.71 N/A N/A 49190 N/A N/A
December 31, 2015 to December 30, 2016 (Absolute) 42.6423 15.35 16.76 14.97 11535 11676 11497
December 31, 2014 toDecember 31, 2015 (Absolute) 40.4232 5.49 7.48 7.39 10549 10748 10739
December 31, 2013 toDecember 31, 2014 (Absolute) 34.3923 17.54 19.74 14.14 11754 11974 11414
# Scheme Benchmark, ## Additional Benchmark, * As on start of period considered above.Past performance may or may not be sustained in future. Returns for dividend option would assume reinvestment of dividends declared, net of dividend distribution tax, if any, at the then prevailing NAV. Load and Taxes are not considered for computation of returns. When scheme/additional benchmark returns are not available, they have not been shown. Total Schemes Co-Managed by Fund Managers is 5. Total Schemes managed by Mr. Prasad Dhonde is 23. Total Schemes managed by Mr. Kaustubh Gupta is 85. Refer annexure on page no. 67 to know more on performance of schemes managed by Fund Managers.$‘Direct Plan’ is only for investors who purchase /subscribe Units in a Scheme directly with the Mutual Fund and is not available for investors who route their investments through a Distributor. For further details, Investors are advised to refer to Addendum no. 44/2012 dated December 27, 2012 available on our website www.birlasunlife.com
17
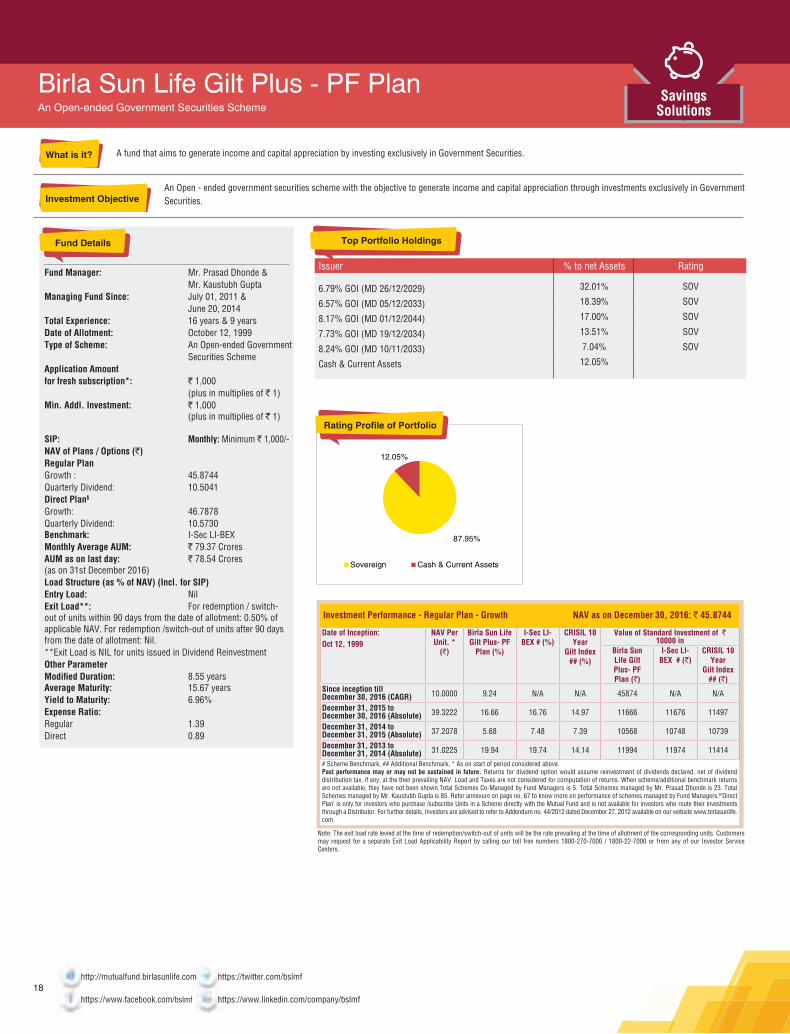
A fund that aims to generate income and capital appreciation by investing exclusively in Government Securities.
An Open - ended government securities scheme with the objective to generate income and capital appreciation through investments exclusively in Government Securities.
Fund Manager: Mr. Prasad Dhonde & Mr. Kaustubh GuptaManaging Fund Since: July 01, 2011 & June 20, 2014Total Experience: 16 years & 9 yearsDate of Allotment: October 12, 1999Type of Scheme: An Open-ended Government Securities SchemeApplication Amount for fresh subscription*: ` 1,000 (plus in multiplies of ` 1)Min. Addl. Investment: ` 1,000 (plus in multiplies of ` 1)
SIP: Monthly: Minimum ` 1,000/-NAV of Plans / Options (`)Regular Plan Growth : 45.8744Quarterly Dividend: 10.5041Direct Plan$ Growth: 46.7878Quarterly Dividend: 10.5730Benchmark: I-Sec LI-BEXMonthly Average AUM: ` 79.37 CroresAUM as on last day: ` 78.54 Crores(as on 31st December 2016)Load Structure (as % of NAV) (Incl. for SIP)Entry Load: NilExit Load**: For redemption / switch-out of units within 90 days from the date of allotment: 0.50% of applicable NAV. For redemption /switch-out of units after 90 days from the date of allotment: Nil.**Exit Load is NIL for units issued in Dividend ReinvestmentOther ParameterModified Duration: 8.55 yearsAverage Maturity: 15.67 yearsYield to Maturity: 6.96%Expense Ratio:Regular 1.39Direct 0.89
87.95%
12.05%
Sovereign Cash & Current Assets
Birla Sun Life Gilt Plus - PF PlanAn Open-ended Government Securities Scheme
Issuer % to net Assets Rating
6.79% GOI (MD 26/12/2029) 32.01% SOV
6.57% GOI (MD 05/12/2033) 18.39% SOV
8.17% GOI (MD 01/12/2044) 17.00% SOV
7.73% GOI (MD 19/12/2034) 13.51% SOV
8.24% GOI (MD 10/11/2033) 7.04% SOV
Cash & Current Assets 12.05%
Top Portfolio Holdings
Note: The exit load rate levied at the time of redemption/switch-out of units will be the rate prevailing at the time of allotment of the corresponding units. Customers may request for a separate Exit Load Applicability Report by calling our toll free numbers 1800-270-7000 / 1800-22-7000 or from any of our Investor Service Centers.
Investment Performance - Regular Plan - Growth NAV as on December 30, 2016: ` 45.8744
Date of Inception: Oct 12, 1999
NAV Per Unit. *
(`)
Birla Sun LifeGilt Plus- PF
Plan (%)
I-Sec LI-BEX # (%)
CRISIL 10Year
Gilt Index ## (%)
Value of Standard Investment of ` 10000 in
Birla SunLife GiltPlus- PFPlan (`)
I-Sec LI-BEX # (`)
CRISIL 10Year
Gilt Index ## (`)
Since inception till December 30, 2016 (CAGR) 10.0000 9.24 N/A N/A 45874 N/A N/A
December 31, 2015 to December 30, 2016 (Absolute) 39.3222 16.66 16.76 14.97 11666 11676 11497
December 31, 2014 toDecember 31, 2015 (Absolute) 37.2078 5.68 7.48 7.39 10568 10748 10739
December 31, 2013 toDecember 31, 2014 (Absolute) 31.0225 19.94 19.74 14.14 11994 11974 11414
# Scheme Benchmark, ## Additional Benchmark, * As on start of period considered above.Past performance may or may not be sustained in future. Returns for dividend option would assume reinvestment of dividends declared, net of dividend distribution tax, if any, at the then prevailing NAV. Load and Taxes are not considered for computation of returns. When scheme/additional benchmark returns are not available, they have not been shown.Total Schemes Co-Managed by Fund Managers is 5. Total Schemes managed by Mr. Prasad Dhonde is 23. Total Schemes managed by Mr. Kaustubh Gupta is 85. Refer annexure on page no. 67 to know more on performance of schemes managed by Fund Managers.$‘Direct Plan’ is only for investors who purchase /subscribe Units in a Scheme directly with the Mutual Fund and is not available for investors who route their investments through a Distributor. For further details, Investors are advised to refer to Addendum no. 44/2012 dated December 27, 2012 available on our website www.birlasunlife.com
http://mutualfund.birlasunlife.com https://twitter.com/bslmf
https://www.facebook.com/bslmf https://www.linkedin.com/company/bslmf18

An open ended fund-of-funds Scheme that invests in debt funds having diverse investment styles. These funds are selected using the BSLAMC process. It is actively managed to capture duration and credit opportunities.
The primary objective of the Scheme is to generate returns from a portfolio of pure debt oriented funds accessed through the diverse investment styles of underlying schemes selected in accordance with the BSLAMC process. There can be no assurance that the investment objective of the Scheme will be realized.
Fund Manager: Mr. Shravan SreenivasulaManaging Fund Since: December 15, 2014Total Experience: 14 yearsDate of Allotment: December 29, 2006Type of Scheme: An Open ended Fund of Funds SchemeApplication Amount for fresh subscription*: ` 1,000 (plus in multiplies of ` 1)Min. Addl. Investment: ` 1,000 (plus in multiplies of ` 1)
SIP: Monthly: Minimum ` 1,000/-NAV of Plans / Options (`)Regular PlanGrowth: 22.4712Dividend: 14.0910Direct Plan$ Growth: 22.8608Dividend: 14.3216Benchmark: CRISIL Composite Bond Fund IndexMonthly Average AUM: ` 86.29 CroresAUM as on last day: ` 85.83 Crores(as on 31st December 2016)Load Structure (as % of NAV) (Incl. for SIP)Entry Load: NilExit Load**: For redemption/switch out of units within 365 days from the date of allotment: 1.00% of applicable NAV. For redemption/switch out of units after 365 days from the date of allotment: Nil**Exit Load is NIL for units issued in Dividend Reinvestment.Other ParameterExpense Ratio:Regular 1.11Direct 0.61
Birla Sun Life Active Debt Multi Manager FoF Scheme(erstwhile ING Active Debt Multi Manager FoF Scheme . Name changed w.e.f October 11, 2014)An Open ended Fund of Funds Scheme
Issuer % to net Assets
IDFC Dynamic Bond Fund-Direct Plan-Growth 21.17%
SBI Magnum Gilt Fund - Long Term-Dir Pl - Growth 20.87%
Birla Sun Life MediumTerm Plan -Gr - Direct Plan 20.66%
Birla Sun Life Govt Sec. Long Term Grwth Direct 19.55%
ICICI Prude Gilt Fund Inv Plan PF Opt-Dir Plan-Grw 17.20%
Cash & Current Assets 0.87%
Net receivables / payables -0.32%
Top Portfolio Holdings
Note: The exit load rate levied at the time of redemption/switch-out of units will be the rate prevailing at the time of allotment of the corresponding units. Customers may request for a separate Exit Load Applicability Report by calling our toll free numbers 1800-270-7000 / 1800-22-7000 or from any of our Investor Service Centers. “The investors are bearing the recurring expenses of the scheme, in addition to the expenses of other schemes in which the Fund of Funds Scheme makes investments.”
Investment Performance - Regular Plan - Growth NAV as on December 30, 2016: ` 22.4712
Date of Inception: Dec 29, 2006
NAV Per Unit. *
(`)
Birla SunLife ActiveDebt Multi
Manager FoFScheme (%)
CRISILCompositeBond FundIndex # (%)
CRISIL 10Year GiltIndex ##
(%)
Value of Standard Investment of ` 10000 in
Birla SunLife ActiveDebt MultiManager
FoFScheme (`)
CRISILCompositeBond FundIndex # (`)
CRISIL 10Year GiltIndex ##
(`)
Since inception till December 30, 2016 (CAGR) 10.0000 8.42 7.98 7.26 22471 21567 20177
December 31, 2015 to December 30, 2016 (Absolute) 19.5890 14.71 12.93 14.97 11471 11293 11497
December 31, 2014 toDecember 31, 2015 (Absolute) 18.6057 5.28 8.63 7.39 10528 10863 10739
December 31, 2013 toDecember 31, 2014 (Absolute) 16.3797 13.59 14.31 14.14 11359 11431 11414
# Scheme Benchmark, ## Additional Benchmark, * As on start of period considered above.Past performance may or may not be sustained in future. Returns for dividend option would assume reinvestment of tax free dividends declared at the then prevailing NAV. Load and Taxes are not considered for computation of returns. Total Schemes managed by Mr. Shravan Sreenivasula is 6. Refer annexure on page no. 67 to know more on performance of schemes managed by Fund Managers. $‘Direct Plan’ is only for investors who purchase /subscribe Units in a Scheme directly with the Mutual Fund and is not available for investors who route their investments through a Distributor. For further details, Investors are advised to refer to Addendum no. 44/2012 dated December 27, 2012 available on our website www.birlasunlife.com
Declared on date 25-Sep-14 25-Jun-14 20-Mar-14Dividend Yield (Regular Plan) 1.40% 0.28% 0.58%Dividend (`) Per Unit 0.1559 0.0312 0.0623Cum Dividend NAV 11.1669 11.0097 10.7957
Note: The NAV of the scheme, pursuant to pay out of dividend would fall to the extent of the payout and statutory levy (if applicable). Past performance may or may not be sustained in future.The Face Value - 10.00 Per UnitThe Financial Solution(s) stated above is ONLY for highlighting the many advantages perceived from investments in Mutual Funds but does not in any manner, indicate or imply, either the quality of any particular Scheme or guarantee any specific performance/returns.For more details on dividends declared please refer to the online empower on www.mutualfund.birlasunlife.com
19
0.87%
Net receivables / payables
Cash & Current Assets
Mutual Fund Units 99.45%
-0.32%

An open ended fund-of-funds Scheme following the financial planning discipline with exposure to equity, debt and gold funds. It is suitable for investors with conservative risk profile. It aims to provide income through limited exposure to equity. (Please consult your financial advisor for your risk profile)
Fund Manager: Mr. Shravan SreenivasulaManaging Fund Since: December 15, 2014Total Experience: 14 yearsDate of Allotment: May 09, 2011Type of Scheme: An Open ended Fund of Funds SchemeApplication Amount for fresh subscription*: ` 1,000 (plus in multiplies of ` 1)Min. Addl. Investment: ` 1,000 (plus in multiplies of ` 1)
SIP: Monthly: Minimum ` 1,000/-NAV of Plans / Options (`)Regular Plan Growth: 15.6962Dividend: 14.2820Direct Plan$ Growth: 16.0173Dividend: 10.8670Benchmark: 20% Nifty 50 + 44% CRISILLiquid Fund index + 24% CRISIL Composite Bond Fund index + 12% INR price of GoldMonthly Average AUM: ` 5.45 CroresAUM as on last day: ` 5.42 Crores(as on 31st December 2016)Load Structure (as % of NAV) (Incl. for SIP)Entry Load: NilExit Load**: For redemption/ switchoutof units within and including 1 year from the date of allotment: 1% of applicable NAV. For redemption/ switch-out of units after 1 year from the date of allotment: Nil**Exit Load is NIL for units issued in Dividend Reinvestment.Other ParameterExpense Ratio:Regular 1.25Direct 0.72
Birla Sun Life Financial Planning FOF - Conservative Plan(erstwhile ING Financial Planning Fund - Conservative Plan. Name changed w.e.f October 11, 2014)An Open ended Fund of Funds Scheme
Issuer % to net Assets
Birla Sun Life Cash Plus - Growth - Direct Plan 40.33%Birla Sun Life MediumTerm Plan -Gr - Direct Plan 14.39%IDFC Dynamic Bond Fund-Direct Plan-Growth 6.81%SBI Magnum Gilt Fund - Long Term-Dir Pl - Growth 6.19%Kotak MF Gold ETF 5.78%R*Shares Gold BeES 5.27%MOSt Focused Multicap 35-Direct Plan-Growth Option 5.07%Birla Sun Life Advantage Fund - Gr - Dir Pl 5.05%Birla Sun Life Frontline Eq Fd - Gr - Direct Plan 4.11%SBI Blue Chip Fund-Direct Plan -Growth 3.84%
Top Ten Portfolio Holdings
Note: The exit load rate levied at the time of redemption/switch-out of units will be the rate prevailing at the time of allotment of the corresponding units. Customers may request for a separate Exit Load Applicability Report by calling our toll free numbers 1800-270-7000 / 1800-22-7000 or from any of our Investor Service Centers.“The investors are bearing the recurring expenses of the scheme, in addition to the expenses of other schemes in which the Fund of Funds Scheme makes investments.”
# Scheme Benchmark, ## Additional Benchmark, * As on start of period considered above.For SIP calculations above, the data assumes the investment of ` 10000/- on 1st day of every month or the subsequent working day. Load & Taxes are not considered for computation of returns. Performance for dividend option would assume reinvestment of tax free dividends declared at the then prevailing NAV. CAGR returns are computed after accounting for the cash flow by using XIRR method (investment internal rate of return).Where Benchmark returns are not available, they have not been shown. Past performance may or may not be sustained in future. Returns greater than 1 year period are compounded annualized. Dividends are assumed to be reinvested and bonus is adjusted. Load is not taken into consideration. For SIP returns, monthly investment of equal amounts invested on the 1st day of every month has been considered.
The Scheme aims to generate returns by investing in mutual fund schemes selected in accordance with the BSLAMC process, as per the risk-return profile of investors. Each of the 3 plans under the Scheme has a strategic asset allocation which is based on satisfying the needs to a specific risk-return profile of investors. There can be no assurance that the investment objective of the Scheme will be realized.
2.03%
11.05%
87.11%
Net receivables / payables
Cash & Current Assets
Exchange Traded Fund
Mutual Fund Units
-0.19%
Investment Performance - Regular Plan - Growth NAV as on December 30, 2016: ` 15.6962Date of Inception: May 09, 2011
NAV Per Unit. *
(`)
BirlaSun LifeFinancialPlanning
FOFConservative
Plan (%)
20% Nifty50 + 44%
CRISILLiquid Fundindex + 24%
CRISILCompositeBond Fund
index +12% INRprice of
Gold # (%)
CRISIL10
YearGilt
Index ## (%)
S&PBSE
SENSEX ## (%)
Value of Standard Investment of ` 10000 inBirla Sun
Life FinancialPlanning
FOFConservative
Plan (`)
20% Nifty 50 +
44% CRISILLiquid Fundindex + 24%
CRISILCompositeBond Fund
index +12% INR priceof Gold # (`)
CRISIL10
YearGilt
Index ## (`)
S&PBSE
SENSEX ## (`)
Since inception till December 30, 2016 (CAGR) 10.0000 8.31 8.03 8.50 6.63 15696 15468 15852 14370December 31, 2015 to December 30, 2016 (Absolute) 14.5192 8.11 8.34 14.97 1.95 10811 10834 11497 10195December 31, 2014 toDecember 31, 2015 (Absolute) 13.8776 4.62 3.98 7.39 -5.03 10462 10398 10739 9497December 31, 2013 toDecember 31, 2014 (Absolute) 12.0144 15.51 13.33 14.14 29.89 11551 11333 11414 12989# Scheme Benchmark, ## Additional Benchmark, * As on start of period considered above.Past performance may or may not be sustained in future. Returns for dividend option would assume reinvestment of tax free dividends declared at the then prevailing NAV. Load and Taxes are not considered for computation of returns. Total Schemes managed by Mr. Shravan Sreenivasula is 6. Refer annexure on page no. 67 to know more on performance of schemes managed by Fund Managers. $‘Direct Plan’ is only for investors who purchase /subscribe Units in a Scheme directly with the Mutual Fund and is not available for investors who route their investments through a Distributor. For further details, Investors are advised to refer to Addendum no. 44/2012 dated December 27, 2012 available on our website www.birlasunlife.com
SIP Performance - Regular Plan - Growth (assuming SIP of ` 10000 per month)Particulars Since Inception last 5 years last 3 years last 1 yearTotal Amount Invested (`) 680000 600000 360000 120000Market Value of amount Invested 859560 736778 402037 123531Scheme Returns (CAGR) 8.19 8.15 7.31 5.5220% Nifty 50 + 44% CRISIL Liquid Fund index + 24% CRISIL Composite Bond Fund index + 12% INR price of Gold returns# (CAGR)
7.68 7.58 6.89 5.75
CRISIL 10 Year Gilt Index returns# (CAGR) 9.87 10.21 12.60 15.90S&P BSE SENSEX returns## (CAGR) 7.23 6.97 1.68 1.10
Date of First Installment: June 01, 2011 & Scheme Inception Date: May 09, 2011 . Past Performance may or may not be sustained in future.
http://mutualfund.birlasunlife.com https://twitter.com/bslmf
https://www.facebook.com/bslmf https://www.linkedin.com/company/bslmf20

An open ended fund-of-funds Scheme following the financial planning discipline with exposure to equity, debt and gold funds. It is suitable for investors with prudent riskprofile. It aims to provide long term capital appreciation. (Please consult your financial advisor for your risk profile)
Fund Manager: Mr. Shravan SreenivasulaManaging Fund Since: December 15, 2014Total Experience: 14 yearsDate of Allotment: May 09, 2011Type of Scheme: An Open ended Fund of Funds SchemeApplication Amount for fresh subscription*: ` 1,000 (plus in multiplies of ` 1)Min. Addl. Investment: ` 1,000 (plus in multiplies of ` 1)
SIP: Monthly: Minimum ` 1,000/-NAV of Plans / Options (`)Regular Plan Growth: 16.5162Dividend: 14.8134Direct Plan$ Growth: 16.8295Dividend: 15.2451Benchmark: 40% Nifty 50 + 30% CRISILLiquid Fund index + 20% CRISIL Composite Bond Fund index + 10% INR price of GoldMonthly Average AUM: ` 16.68 CroresAUM as on last day: ` 16.75 Crores(as on 31st December 2016)Load Structure (as % of NAV) (Incl. for SIP)Entry Load: NilExit Load**: For redemption/switch outof units within 365 days from the date of allotment: 1.00% of applicable NAV. For redemption/switch out of units after 365 days from the date of allotment: Nil**Exit Load is NIL for units issued in Dividend Reinvestment.Other ParameterExpense Ratio:Regular 1.34Direct 0.81
Birla Sun Life Financial Planning FOF - Prudent Plan(erstwhile ING Financial Planning Fund - Prudent Plan. Name changed w.e.f October 11, 2014)An Open ended Fund of Funds Scheme
Issuer % to net Assets
Birla Sun Life Cash Plus - Growth - Direct Plan 25.77%Birla Sun Life MediumTerm Plan -Gr - Direct Plan 12.51%MOSt Focused Multicap 35-Direct Plan-Growth Option 9.15%Birla Sun Life Advantage Fund - Gr - Dir Pl 9.00%Birla Sun Life Frontline Eq Fd - Gr - Direct Plan 8.23%SBI Blue Chip Fund-Direct Plan -Growth 7.06%Mirae Asset India Opp'ties Fund-Direct Plan-Growth 6.23%SBI Magnum Gilt Fund - Long Term-Dir Pl - Growth 6.01%IDFC Dynamic Bond Fund-Direct Plan-Growth 5.59%R*Shares Gold BeES 4.58%
Top Ten Portfolio Holdings
Note: The exit load rate levied at the time of redemption/switch-out of units will be the rate prevailing at the time of allotment of the corresponding units. Customers may request for a separate Exit Load Applicability Report by calling our toll free numbers 1800-270-7000 / 1800-22-7000 or from any of our Investor Service Centers.“The investors are bearing the recurring expenses of the scheme, in addition to the expenses of other schemes in which the Fund of Funds Scheme makes investments.”
# Scheme Benchmark, ## Additional Benchmark, * As on start of period considered above.For SIP calculations above, the data assumes the investment of ` 10000/- on 1st day of every month or the subsequent working day. Load & Taxes are not considered for computation of returns. Performance for dividend option would assume reinvestment of tax free dividends declared at the then prevailing NAV. CAGR returns are computed after accounting for the cash flow by using XIRR method (investment internal rate of return).Where Benchmark returns are not available, they have not been shown. Past performance may or may not be sustained in future. Returns greater than 1 year period are compounded annualized. Dividends are assumed to be reinvested and bonus is adjusted. Load is not taken into consideration. For SIP returns, monthly investment of equal amounts invested on the 1st day of every month has been considered.
The Scheme aims to generate returns by investing in mutual fund schemes selected in accordance with the BSLAMC process, as per the risk-return profile of investors. Each of the 3 plans under the Scheme has a strategic asset allocation which is based on satisfying the needs to a specific risk-return profile of investors. There can be no assurance that the investment objective of the Scheme will be realized.
1.91%
8.77%
89.56%
Net receivables / payables
Cash & Current Assets
Exchange Traded Fund
Mutual Fund Units
-0.24%
Investment Performance - Regular Plan - Growth NAV as on December 30, 2016: ` 16.5162Date of Inception: May 09, 2011
NAV Per Unit. *
(`)
BirlaSun LifeFinancialPlanning
FOF Prudent
(%)
40% Nifty50 + 30%
CRISILLiquid Fundindex + 20%
CRISILCompositeBond Fund
index +10% INRprice of
Gold # (%)
CRISIL10
YearGilt
Index ## (%)
S&PBSE
SENSEX ## (%)
Value of Standard Investment of ` 10000 in
BirlaSun LifeFinancialPlanning
FOFPrudentPlan (`)
40% Nifty50 + 30%
CRISILLiquid Fundindex + 20%
CRISILCompositeBond Fund
index +10% INRprice of
Gold # (`)
CRISIL10
YearGilt
Index ## (`)
S&PBSE
SENSEX ## (`)
Since inception till December 30, 2016 (CAGR) 10.0000 9.29 7.79 8.50 6.63 16516 15275 15852 14370December 31, 2015 to December 30, 2016 (Absolute) 15.3410 7.66 7.15 14.97 1.95 10766 10715 11497 10195December 31, 2014 toDecember 31, 2015 (Absolute) 14.7146 4.26 1.70 7.39 -5.03 10426 10170 10739 9497December 31, 2013 toDecember 31, 2014 (Absolute) 11.8685 23.98 17.63 14.14 29.89 12398 11763 11414 12989# Scheme Benchmark, ## Additional Benchmark, * As on start of period considered above.Past performance may or may not be sustained in future. Returns for dividend option would assume reinvestment of tax free dividends declared at the then prevailing NAV. Load and Taxes are not considered for computation of returns. Total Schemes managed by Mr. Shravan Sreenivasula is 6. Refer annexure on page no. 67 to know more on performance of schemes managed by Fund Managers. $‘Direct Plan’ is only for investors who purchase /subscribe Units in a Scheme directly with the Mutual Fund and is not available for investors who route their investments through a Distributor. For further details, Investors are advised to refer to Addendum no. 44/2012 dated December 27, 2012 available on our website www.birlasunlife.com
SIP Performance - Regular Plan - Growth (assuming SIP of ` 10000 per month)Particulars Since Inception last 5 years last 3 years last 1 yearTotal Amount Invested (`) 680000 600000 360000 120000Market Value of amount Invested 897323 766312 405197 123268Scheme Returns (CAGR) 9.70 9.73 7.84 5.1140% Nifty 50 Index + 30% CRISIL Liquid Fund Index +20% CRISILComposite Bond Fund Index + 10% INR price of Gold returns# (CAGR)
7.64 7.50 5.82 4.66
CRISIL 10 Year Gilt Index returns# (CAGR) 9.87 10.21 12.60 15.90S&P BSE SENSEX returns## (CAGR) 7.23 6.97 1.68 1.10
Date of First Installment: June 01, 2011 & Scheme Inception Date: May 09, 2011 . Past Performance may or may not be sustained in future.
21

http://mutualfund.birlasunlife.com https://twitter.com/bslmf
https://www.facebook.com/bslmf https://www.linkedin.com/company/bslmf22

A fund that seeks to provide you regular income with an opportunity to grow your money through fixed income investments and a limited exposure to the equity markets.
An Open-ended income scheme with the objective to generate regular income so as to make monthly payment or distribution to unit holders with the secondary objective being growth of capital. Monthly Income is not assured and is subject to availability of distributable surplus.
Fund Manager: Mr. Satyabrata Mohanty, Mr. Pranay Sinha & Mr. Vineet MalooManaging Fund Since: June 18, 2009, August 26, 2015 & August 26, 2015 respectivelyTotal Experience: 16 years, 10 years & 11 years respectivelyDate of Allotment: May 22, 2004Type of Scheme: An Open-ended Income SchemeApplication Amount for fresh subscription*: ` 1,000 (plus in multiplies of ` 1)Min. Addl. Investment: ` 1,000 (plus in multiplies of ` 1)
SIP: Monthly: Minimum ` 1,000/-NAV of Plans / Options (`)Regular Plan Growth : 30.9903Monthly Dividend: 13.3541Direct Plan$ Growth : 31.4995Monthly Dividend: 14.0393Benchmark: CRISIL MIP Blended IndexMonthly Average AUM: ` 283.89 CroresAUM as on last day: ` 283.67 Crores(as on 31st December 2016)Load Structure (as % of NAV) (Incl. for SIP)Entry Load: NilExit Load**: For redemption/switch out of units within 540 days from the date of allotment: 1.00% of the applicable NAV.For redemption/switch out of units after 540 days from the date of allotment: Nil.**Exit Load is NIL for units issued in Dividend Reinvestment.Other ParameterModified Duration: 6.99 yearsAverage Maturity: 12.79 yearsYield to Maturity: 7.39% (for Debt Component)Portfolio Turnover: 1.66(for Equity Component)Expense Ratio:Regular 1.30Direct 0.90
68.43%
9.52%
7.39%
7.21%6.30% 1.15%
Sovereign EquityBelow AA AAACash & Current Assets AA
Birla Sun Life MIP II - Savings 5 Plan(Monthly income is not assured and is subject to availability of distributable surplus.)An Open-ended Income Scheme
Issuer % to net Assets Rating
Government of India 67.01% SOV
IDBI Bank Limited 7.39% CRISIL A
Power Finance Corporation Limited 7.21% CRISIL AAA
State Government Securities 1.43% SOV
Yes Bank Limited 1.15% ICRA AA+
Eicher Motors Limited 0.69%
Repco Home Finance Limited 0.62%
HDFC Bank Limited 0.55%
Bajaj Finance Limited 0.50%
Hindustan Zinc Limited 0.47%
Top Ten Portfolio Holdings
Note: The exit load rate levied at the time of redemption/switch-out of units will be the rate prevailing at the time of allotment of the corresponding units. Customers may request for a separate Exit Load Applicability Report by calling our toll free numbers 1800-270-7000 / 1800-22-7000 or from any of our Investor Service Centers.
Investment Performance - Regular Plan - Growth NAV as on December 30, 2016: ` 30.9903
Date of Inception: May 22, 2004
NAV Per Unit. *
(`)
Birla SunLife MIP
II - Savings 5Plan (%)
CRISIL MIPBlended
Index # (%)
CRISIL 10Year GiltIndex ##
(%)
Value of Standard Investment of ` 10000 in
Birla SunLife MIP
II - Savings 5Plan (`)
CRISIL MIPBlended
Index # (`)
CRISIL 10Year GiltIndex ##
(`)Since inception till December 30, 2016 (CAGR) 10.0000 9.38 8.27 5.87 30990 27261 20542
December 31, 2015 to December 30, 2016 (Absolute) 27.6141 12.23 11.55 14.97 11223 11155 11497
December 31, 2014 toDecember 31, 2015 (Absolute) 26.0124 6.16 6.79 7.39 10616 10679 10739
December 31, 2013 toDecember 31, 2014 (Absolute) 21.8964 18.80 16.83 14.14 11880 11683 11414
# Scheme Benchmark, ## Additional Benchmark, * As on start of period considered above.Past performance may or may not be sustained in future. Returns for dividend option would assume reinvestment of dividends declared, net of dividend distribution tax, if any, at the then prevailing NAV. Load and Taxes are not considered for computation of returns.Performance of scheme may or may not be strictly comparable with that of its additional benchmark in view of hybrid nature of scheme. Total Schemes Co-Managed by Fund Managers is 2. Total Schemes managed by Mr. Satyabrata Mohanty is 11. Total Schemes managed by Mr. Pranay Sinha is 6. Total Schemes managed by Mr. Vineet Maloo is 18. Refer annexure on page no. 67 to know more on performance of schemes managed by Fund Managers. $‘Direct Plan’ is only for investors who purchase /subscribe Units in a Scheme directly with the Mutual Fund and is not available for investors who route their investments through a Distributor. For further details, Investors are advised to refer to Addendum no. 44/2012 dated December 27, 2012 available on our website www.birlasunlife.com
Declared on date 30-Dec-16 25-Nov-16 28-Oct-16Dividend Yield (Regular Plan) 0.50% 0.38% 0.38%Dividend (`) Per Unit 0.0664 0.0521 0.0519Cum Dividend NAV 13.3541 13.7668 13.4909Dividend Yield (Direct Plan) 0.50% 0.38% 0.38%Dividend (`) Per Unit 0.0698 0.0547 0.0545Cum Dividend NAV 14.0393 14.4676 14.1732
Note: The NAV of the scheme, pursuant to pay out of dividend would fall to the extent of the payout and statutory levy (if applicable). Past performance may or may not be sustained in future.The Face Value - 10.00 Per UnitThe Financial Solution(s) stated above is ONLY for highlighting the many advantages perceived from investments in Mutual Funds but does not in any manner, indicate or imply, either the quality of any particular Scheme or guarantee any specific performance/returns.For more details on dividends declared please refer to the online empower on www.mutualfund.birlasunlife.com
23
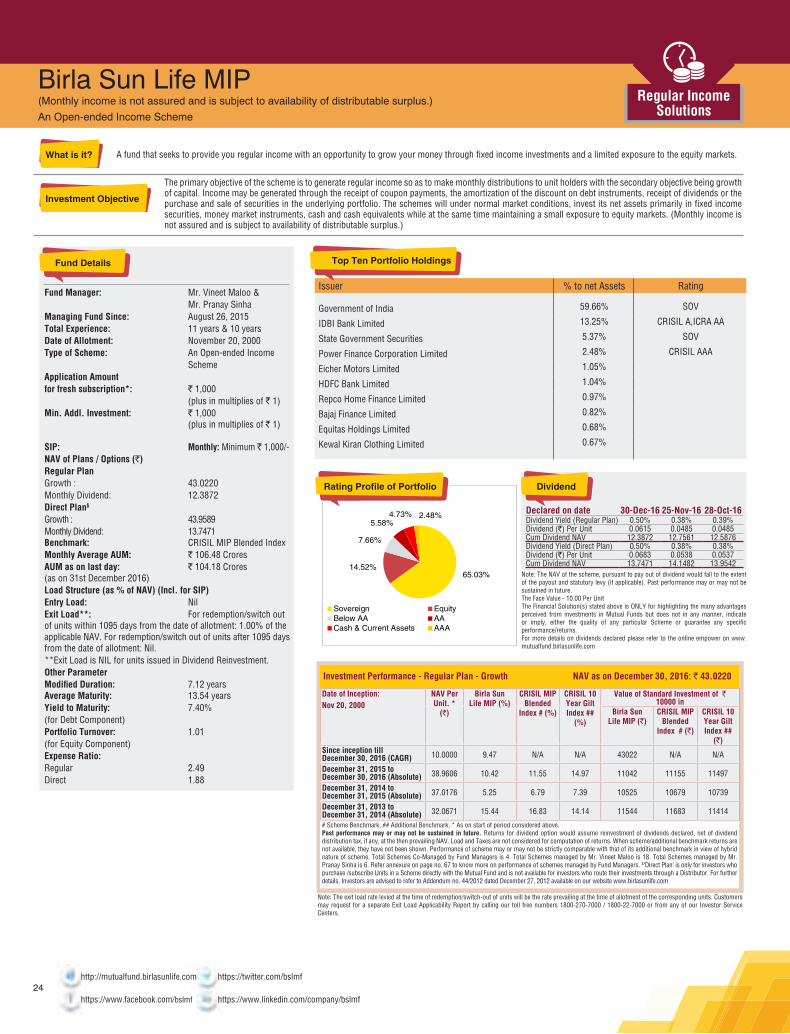
A fund that seeks to provide you regular income with an opportunity to grow your money through fixed income investments and a limited exposure to the equity markets.
The primary objective of the scheme is to generate regular income so as to make monthly distributions to unit holders with the secondary objective being growth of capital. Income may be generated through the receipt of coupon payments, the amortization of the discount on debt instruments, receipt of dividends or the purchase and sale of securities in the underlying portfolio. The schemes will under normal market conditions, invest its net assets primarily in fixed income securities, money market instruments, cash and cash equivalents while at the same time maintaining a small exposure to equity markets. (Monthly income is not assured and is subject to availability of distributable surplus.)
Fund Manager: Mr. Vineet Maloo & Mr. Pranay SinhaManaging Fund Since: August 26, 2015Total Experience: 11 years & 10 yearsDate of Allotment: November 20, 2000Type of Scheme: An Open-ended Income SchemeApplication Amount for fresh subscription*: ` 1,000 (plus in multiplies of ` 1)Min. Addl. Investment: ` 1,000 (plus in multiplies of ` 1)
SIP: Monthly: Minimum ` 1,000/-NAV of Plans / Options (`)Regular Plan Growth : 43.0220Monthly Dividend: 12.3872Direct Plan$ Growth : 43.9589Monthly Dividend: 13.7471Benchmark: CRISIL MIP Blended IndexMonthly Average AUM: ` 106.48 CroresAUM as on last day: ` 104.18 Crores(as on 31st December 2016)Load Structure (as % of NAV) (Incl. for SIP)Entry Load: NilExit Load**: For redemption/switch out of units within 1095 days from the date of allotment: 1.00% of the applicable NAV. For redemption/switch out of units after 1095 days from the date of allotment: Nil.**Exit Load is NIL for units issued in Dividend Reinvestment.Other ParameterModified Duration: 7.12 yearsAverage Maturity: 13.54 yearsYield to Maturity: 7.40% (for Debt Component)Portfolio Turnover: 1.01(for Equity Component)Expense Ratio:Regular 2.49Direct 1.88
65.03%14.52%
7.66%
5.58%4.73% 2.48%
Sovereign EquityBelow AA AACash & Current Assets AAA
Birla Sun Life MIP(Monthly income is not assured and is subject to availability of distributable surplus.) An Open-ended Income Scheme
Issuer % to net Assets Rating
Government of India 59.66% SOV
IDBI Bank Limited 13.25% CRISIL A,ICRA AA
State Government Securities 5.37% SOV
Power Finance Corporation Limited 2.48% CRISIL AAA
Eicher Motors Limited 1.05%
HDFC Bank Limited 1.04%
Repco Home Finance Limited 0.97%
Bajaj Finance Limited 0.82%
Equitas Holdings Limited 0.68%
Kewal Kiran Clothing Limited 0.67%
Top Ten Portfolio Holdings
Note: The exit load rate levied at the time of redemption/switch-out of units will be the rate prevailing at the time of allotment of the corresponding units. Customers may request for a separate Exit Load Applicability Report by calling our toll free numbers 1800-270-7000 / 1800-22-7000 or from any of our Investor Service Centers.
Investment Performance - Regular Plan - Growth NAV as on December 30, 2016: ` 43.0220
Date of Inception: Nov 20, 2000
NAV Per Unit. *
(`)
Birla SunLife MIP (%)
CRISIL MIPBlended
Index # (%)
CRISIL 10Year GiltIndex ##
(%)
Value of Standard Investment of ` 10000 in
Birla SunLife MIP (`)
CRISIL MIPBlended
Index # (`)
CRISIL 10Year GiltIndex ##
(`)Since inception till December 30, 2016 (CAGR) 10.0000 9.47 N/A N/A 43022 N/A N/A
December 31, 2015 to December 30, 2016 (Absolute) 38.9606 10.42 11.55 14.97 11042 11155 11497
December 31, 2014 toDecember 31, 2015 (Absolute) 37.0176 5.25 6.79 7.39 10525 10679 10739
December 31, 2013 toDecember 31, 2014 (Absolute) 32.0671 15.44 16.83 14.14 11544 11683 11414
# Scheme Benchmark, ## Additional Benchmark, * As on start of period considered above.Past performance may or may not be sustained in future. Returns for dividend option would assume reinvestment of dividends declared, net of dividend distribution tax, if any, at the then prevailing NAV. Load and Taxes are not considered for computation of returns. When scheme/additional benchmark returns are not available, they have not been shown. Performance of scheme may or may not be strictly comparable with that of its additional benchmark in view of hybrid nature of scheme. Total Schemes Co-Managed by Fund Managers is 4. Total Schemes managed by Mr. Vineet Maloo is 18. Total Schemes managed by Mr. Pranay Sinha is 6. Refer annexure on page no. 67 to know more on performance of schemes managed by Fund Managers. $‘Direct Plan’ is only for investors who purchase /subscribe Units in a Scheme directly with the Mutual Fund and is not available for investors who route their investments through a Distributor. For further details, Investors are advised to refer to Addendum no. 44/2012 dated December 27, 2012 available on our website www.birlasunlife.com
Declared on date 30-Dec-16 25-Nov-16 28-Oct-16Dividend Yield (Regular Plan) 0.50% 0.38% 0.39%Dividend (`) Per Unit 0.0615 0.0485 0.0485Cum Dividend NAV 12.3872 12.7561 12.5876Dividend Yield (Direct Plan) 0.50% 0.38% 0.38%Dividend (`) Per Unit 0.0683 0.0538 0.0537Cum Dividend NAV 13.7471 14.1482 13.9542
Note: The NAV of the scheme, pursuant to pay out of dividend would fall to the extent of the payout and statutory levy (if applicable). Past performance may or may not be sustained in future.The Face Value - 10.00 Per UnitThe Financial Solution(s) stated above is ONLY for highlighting the many advantages perceived from investments in Mutual Funds but does not in any manner, indicate or imply, either the quality of any particular Scheme or guarantee any specific performance/returns.For more details on dividends declared please refer to the online empower on www.mutualfund.birlasunlife.com
http://mutualfund.birlasunlife.com https://twitter.com/bslmf
https://www.facebook.com/bslmf https://www.linkedin.com/company/bslmf24

A fund that seeks to provide you regular income with an opportunity to grow your money through fixed income investments and a limited exposure to the equity markets.
An Open-ended income scheme with the primary investment objective to generate regular income so as to make monthly and quarterly distributions to Unit holders and the secondary objective as growth of capital. Monthly income is not assured and is subject to availability of distributable surplus.
Fund Manager: Mr. Vineet Maloo & Mr. Pranay SinhaManaging Fund Since: August 26, 2015Total Experience: 11 years & 10 yearsDate of Allotment: July 14, 1999Type of Scheme: An Open-ended Income SchemeApplication Amount for fresh subscription*: ` 1,000 (plus in multiplies of ` 1)Min. Addl. Investment: ` 1,000 (plus in multiplies of ` 1)
SIP: Monthly: Minimum ` 1,000/-NAV of Plans / Options (`)Regular Plan Growth : 60.9669Dividend: 12.6915Quarterly Dividend: 12.6498Direct Plan$ Growth : 62.6483Dividend: 13.7653Quarterly Dividend: 13.1821Benchmark: CRISIL MIP Blended IndexMonthly Average AUM: ` 260.75 CroresAUM as on last day: ` 259.76 Crores(as on 31st December 2016)Load Structure (as % of NAV) (Incl. for SIP)Entry Load: NilExit Load**: For redemption/switch out of units within 540 days from the date of allotment: 1.00% of the applicable NAV.For redemption/switch out of units after 540 days from the date of allotment: Nil.**Exit Load is NIL for units issued in Dividend Reinvestment.Other ParameterModified Duration: 6.89 yearsAverage Maturity: 11.41 yearsYield to Maturity: 7.15% (for Debt Component)Portfolio Turnover: 1.62(for Equity Component)Expense Ratio:Regular 2.38Direct 1.64
69.58%
14.02%
8.37%
4.96% 3.07%
Sovereign EquityAAA Cash & Current AssetsBelow AA
Birla Sun Life Monthly Income(Monthly income is not assured and is subject to availability of distributable surplus.)An Open-ended Income Scheme
Issuer % to net Assets Rating
Government of India 68.72% SOV
Power Finance Corporation Limited 7.38% CRISIL AAA
IDBI Bank Limited 3.07% CRISIL A
Eicher Motors Limited 1.09%
Repco Home Finance Limited 1.05%
Power Grid Corporation of India Limited 0.98% CRISIL AAA
HDFC Bank Limited 0.93%
State Government Securities 0.86% SOV
Bajaj Finance Limited 0.79%
V-Mart Retail Limited 0.69%
Top Ten Portfolio Holdings
Note: The exit load rate levied at the time of redemption/switch-out of units will be the rate prevailing at the time of allotment of the corresponding units. Customers may request for a separate Exit Load Applicability Report by calling our toll free numbers 1800-270-7000 / 1800-22-7000 or from any of our Investor Service Centers.
Investment Performance - Regular Plan - Growth NAV as on December 30, 2016: ` 60.9669
Date of Inception: July 14, 1999
NAV Per Unit. *
(`)
Birla SunLife MonthlyIncome (%)
CRISIL MIPBlended
Index # (%)
CRISIL 10Year GiltIndex ##
(%)
Value of Standard Investment of ` 10000 in
BirlaSun LifeMonthly
Income (`)
CRISIL MIPBlended
Index # (`)
CRISIL 10Year GiltIndex ##
(`)Since inception till December 30, 2016 (CAGR) 10.0000 10.90 N/A N/A 60967 N/A N/A
December 31, 2015 to December 30, 2016 (Absolute) 55.1537 10.54 11.55 14.97 11054 11155 11497
December 31, 2014 toDecember 31, 2015 (Absolute) 52.1865 5.69 6.79 7.39 10569 10679 10739
December 31, 2013 toDecember 31, 2014 (Absolute) 43.7454 19.30 16.83 14.14 11930 11683 11414
# Scheme Benchmark, ## Additional Benchmark, * As on start of period considered above.Past performance may or may not be sustained in future. Returns for dividend option would assume reinvestment of dividends declared, net of dividend distribution tax, if any, at the then prevailing NAV. Load and Taxes are not considered for computation of returns. When scheme/additional benchmark returns are not available, they have not been shown. Performance of scheme may or may not be strictly comparable with that of its additional benchmark in view of hybrid nature of scheme. Total Schemes Co-Managed by Fund Managers is 4. Total Schemes managed by Mr. Vineet Maloo is 18. Total Schemes managed by Mr. Pranay Sinha is 6. Refer annexure on page no. 67 to know more on performance of schemes managed by Fund Managers. $‘Direct Plan’ is only for investors who purchase /subscribe Units in a Scheme directly with the Mutual Fund and is not available for investors who route their investments through a Distributor. For further details, Investors are advised to refer to Addendum no. 44/2012 dated December 27, 2012 available on our website www.birlasunlife.com
Declared on date 30-Dec-16 30-Nov-16 28-Oct-16Dividend Yield (Regular Plan) 0.43% 0.45% 0.39%Dividend (`) Per Unit 0.0542 0.0587 0.0498Cum Dividend NAV 12.6915 13.1097 12.9159Dividend Yield (Direct Plan) 0.43% 0.45% 0.39%Dividend (`) Per Unit 0.0587 0.0636 0.0539Cum Dividend NAV 13.7653 14.2102 13.9905
Note: The NAV of the scheme, pursuant to pay out of dividend would fall to the extent of the payout and statutory levy (if applicable). Past performance may or may not be sustained in future.The Face Value - 10.00 Per UnitThe Financial Solution(s) stated above is ONLY for highlighting the many advantages perceived from investments in Mutual Funds but does not in any manner, indicate or imply, either the quality of any particular Scheme or guarantee any specific performance/returns.For more details on dividends declared please refer to the online empower on www.mutualfund.birlasunlife.com
25
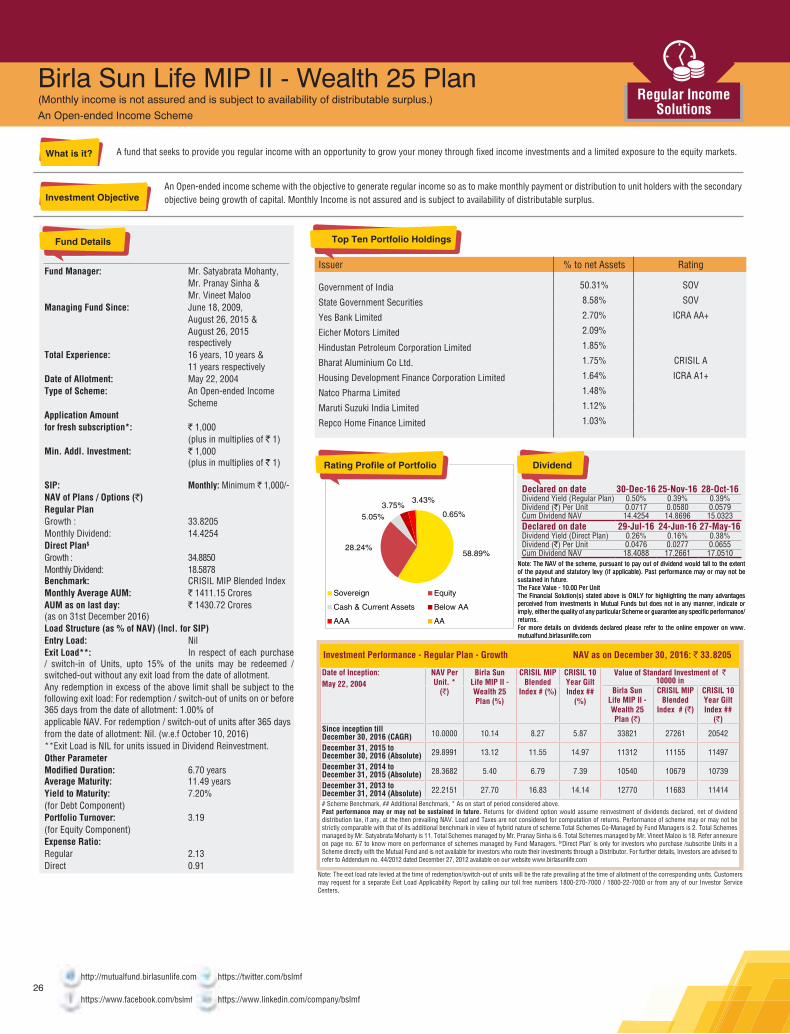
A fund that seeks to provide you regular income with an opportunity to grow your money through fixed income investments and a limited exposure to the equity markets.
An Open-ended income scheme with the objective to generate regular income so as to make monthly payment or distribution to unit holders with the secondary objective being growth of capital. Monthly Income is not assured and is subject to availability of distributable surplus.
Fund Manager: Mr. Satyabrata Mohanty, Mr. Pranay Sinha & Mr. Vineet MalooManaging Fund Since: June 18, 2009, August 26, 2015 & August 26, 2015 respectivelyTotal Experience: 16 years, 10 years & 11 years respectivelyDate of Allotment: May 22, 2004Type of Scheme: An Open-ended Income SchemeApplication Amount for fresh subscription*: ` 1,000 (plus in multiplies of ` 1)Min. Addl. Investment: ` 1,000 (plus in multiplies of ` 1)
SIP: Monthly: Minimum ` 1,000/-NAV of Plans / Options (`)Regular Plan Growth : 33.8205Monthly Dividend: 14.4254Direct Plan$ Growth : 34.8850Monthly Dividend: 18.5878Benchmark: CRISIL MIP Blended IndexMonthly Average AUM: ` 1411.15 CroresAUM as on last day: ` 1430.72 Crores(as on 31st December 2016)Load Structure (as % of NAV) (Incl. for SIP)Entry Load: NilExit Load**: In respect of each purchase / switch-in of Units, upto 15% of the units may be redeemed / switched-out without any exit load from the date of allotment.Any redemption in excess of the above limit shall be subject to the following exit load: For redemption / switch-out of units on or before 365 days from the date of allotment: 1.00% ofapplicable NAV. For redemption / switch-out of units after 365 daysfrom the date of allotment: Nil. (w.e.f October 10, 2016)**Exit Load is NIL for units issued in Dividend Reinvestment.Other ParameterModified Duration: 6.70 yearsAverage Maturity: 11.49 yearsYield to Maturity: 7.20% (for Debt Component)Portfolio Turnover: 3.19(for Equity Component)Expense Ratio:Regular 2.13Direct 0.91
58.89%28.24%
5.05%3.75%
3.43%
0.65%
Sovereign Equity
Cash & Current Assets Below AA
AAA AA
Birla Sun Life MIP II - Wealth 25 Plan(Monthly income is not assured and is subject to availability of distributable surplus.)An Open-ended Income Scheme
Issuer % to net Assets Rating
Government of India 50.31% SOV
State Government Securities 8.58% SOV
Yes Bank Limited 2.70% ICRA AA+
Eicher Motors Limited 2.09%
Hindustan Petroleum Corporation Limited 1.85%
Bharat Aluminium Co Ltd. 1.75% CRISIL A
Housing Development Finance Corporation Limited 1.64% ICRA A1+
Natco Pharma Limited 1.48%
Maruti Suzuki India Limited 1.12%
Repco Home Finance Limited 1.03%
Top Ten Portfolio Holdings
Note: The exit load rate levied at the time of redemption/switch-out of units will be the rate prevailing at the time of allotment of the corresponding units. Customers may request for a separate Exit Load Applicability Report by calling our toll free numbers 1800-270-7000 / 1800-22-7000 or from any of our Investor Service Centers.
Investment Performance - Regular Plan - Growth NAV as on December 30, 2016: ` 33.8205
Date of Inception: May 22, 2004
NAV Per Unit. *
(`)
Birla SunLife MIP II -Wealth 25Plan (%)
CRISIL MIPBlended
Index # (%)
CRISIL 10Year GiltIndex ##
(%)
Value of Standard Investment of ` 10000 in
Birla SunLife MIP II -Wealth 25Plan (`)
CRISIL MIPBlended
Index # (`)
CRISIL 10Year GiltIndex ##
(`)Since inception till December 30, 2016 (CAGR) 10.0000 10.14 8.27 5.87 33821 27261 20542
December 31, 2015 to December 30, 2016 (Absolute) 29.8991 13.12 11.55 14.97 11312 11155 11497
December 31, 2014 toDecember 31, 2015 (Absolute) 28.3682 5.40 6.79 7.39 10540 10679 10739
December 31, 2013 toDecember 31, 2014 (Absolute) 22.2151 27.70 16.83 14.14 12770 11683 11414
# Scheme Benchmark, ## Additional Benchmark, * As on start of period considered above.Past performance may or may not be sustained in future. Returns for dividend option would assume reinvestment of dividends declared, net of dividend distribution tax, if any, at the then prevailing NAV. Load and Taxes are not considered for computation of returns. Performance of scheme may or may not be strictly comparable with that of its additional benchmark in view of hybrid nature of scheme.Total Schemes Co-Managed by Fund Managers is 2. Total Schemes managed by Mr. Satyabrata Mohanty is 11. Total Schemes managed by Mr. Pranay Sinha is 6. Total Schemes managed by Mr. Vineet Maloo is 18. Refer annexure on page no. 67 to know more on performance of schemes managed by Fund Managers. $‘Direct Plan’ is only for investors who purchase /subscribe Units in a Scheme directly with the Mutual Fund and is not available for investors who route their investments through a Distributor. For further details, Investors are advised to refer to Addendum no. 44/2012 dated December 27, 2012 available on our website www.birlasunlife.com
Declared on date 30-Sep-16 26-Aug-16 29-Jul-16Dividend Yield (Regular Plan) 0.47% 0.38% 0.45%Dividend (`) Per Unit 0.0713 0.0568 0.0669Cum Dividend NAV 15.0204 14.7764 14.7239Declared on date 29-Jul-16 24-Jun-16 27-May-16Dividend Yield (Direct Plan) 0.26% 0.16% 0.38%Dividend (`) Per Unit 0.0476 0.0277 0.0655Cum Dividend NAV 18.4088 17.2661 17.0510
Note: The NAV of the scheme, pursuant to pay out of dividend would fall to the extent of the payout and statutory levy (if applicable). Past performance may or may not be sustained in future.The Face Value - 10.00 Per UnitThe Financial Solution(s) stated above is ONLY for highlighting the many advantages perceived from investments in Mutual Funds but does not in any manner, indicate or imply, either the quality of any particular Scheme or guarantee any specific performance/returns.For more details on dividends declared please refer to the online empower on www.mutualfund.birlasunlife.com
Declared on date 30-Dec-16 25-Nov-16 28-Oct-16Dividend Yield (Regular Plan) 0.50% 0.39% 0.39%Dividend (`) Per Unit 0.0717 0.0580 0.0579Cum Dividend NAV 14.4254 14.8696 15.0323Declared on date 29-Jul-16 24-Jun-16 27-May-16Dividend Yield (Direct Plan) 0.26% 0.16% 0.38%Dividend (`) Per Unit 0.0476 0.0277 0.0655Cum Dividend NAV 18.4088 17.2661 17.0510
Note: The NAV of the scheme, pursuant to pay out of dividend would fall to the extent of the payout and statutory levy (if applicable). Past performance may or may not be sustained in future.The Face Value - 10.00 Per UnitThe Financial Solution(s) stated above is ONLY for highlighting the many advantages perceived from investments in Mutual Funds but does not in any manner, indicate or imply, either the quality of any particular Scheme or guarantee any specific performance/returns.For more details on dividends declared please refer to the online empower on www.mutualfund.birlasunlife.com
http://mutualfund.birlasunlife.com https://twitter.com/bslmf
https://www.facebook.com/bslmf https://www.linkedin.com/company/bslmf26

http://mutualfund.birlasunlife.com https://twitter.com/bslmf
https://www.facebook.com/bslmf https://www.linkedin.com/company/bslmf27
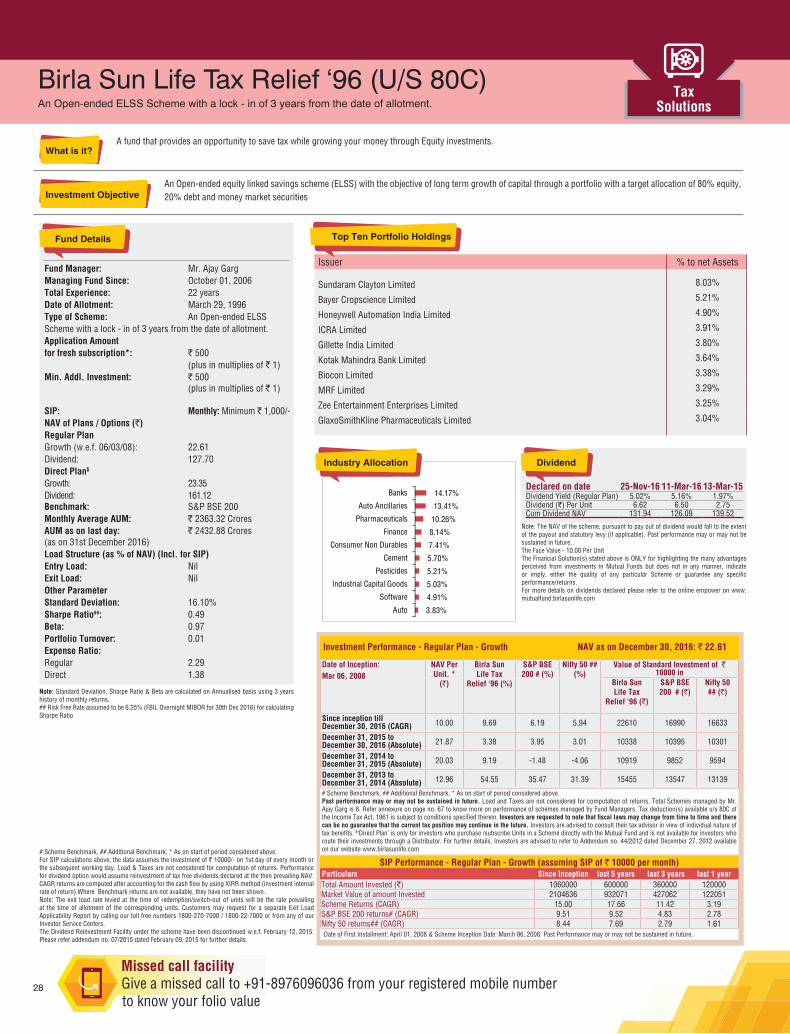
A fund that provides an opportunity to save tax while growing your money through Equity investments.
An Open-ended equity linked savings scheme (ELSS) with the objective of long term growth of capital through a portfolio with a target allocation of 80% equity, 20% debt and money market securities
Fund Manager: Mr. Ajay GargManaging Fund Since: October 01, 2006Total Experience: 22 yearsDate of Allotment: March 29, 1996Type of Scheme: An Open-ended ELSSScheme with a lock - in of 3 years from the date of allotment.Application Amount for fresh subscription*: ` 500 (plus in multiplies of ` 1)Min. Addl. Investment: ` 500 (plus in multiplies of ` 1)
SIP: Monthly: Minimum ` 1,000/-NAV of Plans / Options (`)Regular Plan Growth (w.e.f. 06/03/08): 22.61Dividend: 127.70Direct Plan$ Growth: 23.35Dividend: 161.12Benchmark: S&P BSE 200Monthly Average AUM: ` 2363.32 CroresAUM as on last day: ` 2432.88 Crores(as on 31st December 2016)Load Structure (as % of NAV) (Incl. for SIP)Entry Load: NilExit Load: NilOther ParameterStandard Deviation: 16.10%Sharpe Ratio##: 0.49Beta: 0.97Portfolio Turnover: 0.01Expense Ratio:Regular 2.29Direct 1.38
Birla Sun Life Tax Relief ‘96 (U/S 80C) An Open-ended ELSS Scheme with a lock - in of 3 years from the date of allotment.
Issuer % to net Assets
Sundaram Clayton Limited 8.03%
Bayer Cropscience Limited 5.21%
Honeywell Automation India Limited 4.90%
ICRA Limited 3.91%
Gillette India Limited 3.80%
Kotak Mahindra Bank Limited 3.64%
Biocon Limited 3.38%
MRF Limited 3.29%
Zee Entertainment Enterprises Limited 3.25%
GlaxoSmithKline Pharmaceuticals Limited 3.04%
Top Ten Portfolio Holdings
Investment Performance - Regular Plan - Growth NAV as on December 30, 2016: ` 22.61
Date of Inception: Mar 06, 2008
NAV Per Unit. *
(`)
Birla SunLife Tax
Relief ‘96 (%)
S&P BSE200 # (%)
Nifty 50 ## (%)
Value of Standard Investment of ` 10000 in
Birla SunLife Tax
Relief ‘96 (`)
S&P BSE200 # (`)
Nifty 50 ## (`)
Since inception till December 30, 2016 (CAGR) 10.00 9.69 6.19 5.94 22610 16990 16633
December 31, 2015 to December 30, 2016 (Absolute) 21.87 3.38 3.95 3.01 10338 10395 10301
December 31, 2014 toDecember 31, 2015 (Absolute) 20.03 9.19 -1.48 -4.06 10919 9852 9594
December 31, 2013 toDecember 31, 2014 (Absolute) 12.96 54.55 35.47 31.39 15455 13547 13139
# Scheme Benchmark, ## Additional Benchmark, * As on start of period considered above.Past performance may or may not be sustained in future. Load and Taxes are not considered for computation of returns. Total Schemes managed by Mr. Ajay Garg is 8. Refer annexure on page no. 67 to know more on performance of schemes managed by Fund Managers. Tax deduction(s) available u/s 80C of the Income Tax Act, 1961 is subject to conditions specified therein. Investors are requested to note that fiscal laws may change from time to time and there can be no guarantee that the current tax position may continue in the future. Investors are advised to consult their tax advisor in view of individual nature of tax benefits. $‘Direct Plan’ is only for investors who purchase /subscribe Units in a Scheme directly with the Mutual Fund and is not available for investors who route their investments through a Distributor. For further details, Investors are advised to refer to Addendum no. 44/2012 dated December 27, 2012 available on our website www.birlasunlife.com
SIP Performance - Regular Plan - Growth (assuming SIP of ` 10000 per month)Particulars Since Inception last 5 years last 3 years last 1 yearTotal Amount Invested (`) 1060000 600000 360000 120000Market Value of amount Invested 2104636 932071 427062 122051Scheme Returns (CAGR) 15.00 17.66 11.42 3.19S&P BSE 200 returns# (CAGR) 9.51 9.52 4.83 2.78Nifty 50 returns## (CAGR) 8.44 7.69 2.79 1.61Date of First Installment: April 01, 2008 & Scheme Inception Date: March 06, 2008. Past Performance may or may not be sustained in future.
Note: The exit load rate levied at the time of redemption/switch-out of units will be the rate prevailing at the time of allotment of the corresponding units. Customers may request for a separate Exit Load Applicability Report by calling our toll free numbers 1800-270-7000 / 1800-22-7000 or from any of our Investor Service Centers.The Dividend Reinvestment Facility under the scheme have been discontinued w.e.f. February 12, 2015. Please refer addendum no. 07/2015 dated February 09, 2015 for further details.
# Scheme Benchmark, ## Additional Benchmark, * As on start of period considered above.For SIP calculations above, the data assumes the investment of ` 10000/- on 1st day of every month or the subsequent working day. Load & Taxes are not considered for computation of returns. Performance for dividend option would assume reinvestment of tax free dividends declared at the then prevailing NAV. CAGR returns are computed after accounting for the cash flow by using XIRR method (investment internal rate of return).Where Benchmark returns are not available, they have not been shown.
3.83%
4.91%
5.03%
5.21%
5.70%
7.41%
8.14%
10.26%
13.41%
14.17%
Auto
Software
Industrial Capital Goods
Pesticides
Cement
Consumer Non Durables
Finance
Pharmaceuticals
Auto Ancillaries
Banks
Note: Standard Deviation, Sharpe Ratio & Beta are calculated on Annualised basis using 3 years history of monthly returns.## Risk Free Rate assumed to be 6.25% (FBIL Overnight MIBOR for 30th Dec 2016) for calculating Sharpe Ratio
Declared on date 25-Nov-16 11-Mar-16 13-Mar-15Dividend Yield (Regular Plan) 5.02% 5.16% 1.97%Dividend (`) Per Unit 6.62 6.50 2.75Cum Dividend NAV 131.94 126.09 139.52
Note: The NAV of the scheme, pursuant to pay out of dividend would fall to the extent of the payout and statutory levy (if applicable). Past performance may or may not be sustained in future.The Face Value - 10.00 Per UnitThe Financial Solution(s) stated above is ONLY for highlighting the many advantages perceived from investments in Mutual Funds but does not in any manner, indicate or imply, either the quality of any particular Scheme or guarantee any specific performance/returns.For more details on dividends declared please refer to the online empower on www.mutualfund.birlasunlife.com
28
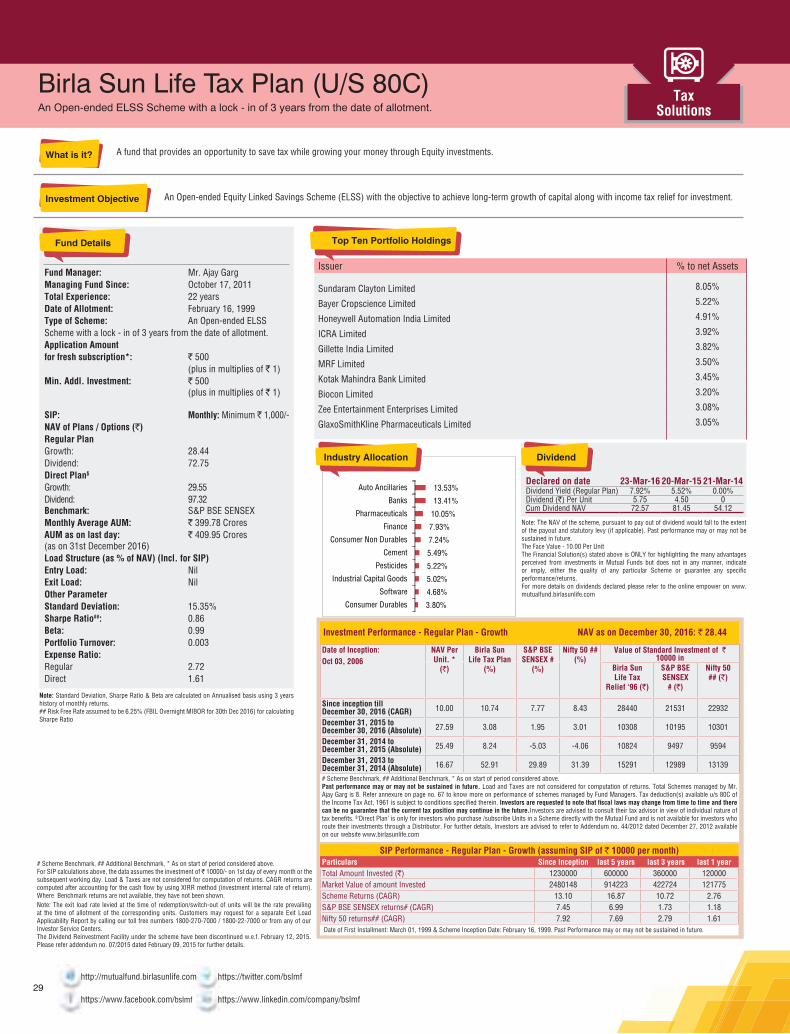
A fund that provides an opportunity to save tax while growing your money through Equity investments.
An Open-ended Equity Linked Savings Scheme (ELSS) with the objective to achieve long-term growth of capital along with income tax relief for investment.
Fund Manager: Mr. Ajay GargManaging Fund Since: October 17, 2011Total Experience: 22 yearsDate of Allotment: February 16, 1999Type of Scheme: An Open-ended ELSSScheme with a lock - in of 3 years from the date of allotment.Application Amount for fresh subscription*: ` 500 (plus in multiplies of ` 1)Min. Addl. Investment: ` 500 (plus in multiplies of ` 1)
SIP: Monthly: Minimum ` 1,000/-NAV of Plans / Options (`)Regular Plan Growth: 28.44Dividend: 72.75Direct Plan$ Growth: 29.55Dividend: 97.32Benchmark: S&P BSE SENSEXMonthly Average AUM: ` 399.78 CroresAUM as on last day: ` 409.95 Crores(as on 31st December 2016)Load Structure (as % of NAV) (Incl. for SIP)Entry Load: NilExit Load: NilOther ParameterStandard Deviation: 15.35%Sharpe Ratio##: 0.86Beta: 0.99Portfolio Turnover: 0.003Expense Ratio:Regular 2.72Direct 1.61
Birla Sun Life Tax Plan (U/S 80C)An Open-ended ELSS Scheme with a lock - in of 3 years from the date of allotment.
Issuer % to net Assets
Sundaram Clayton Limited 8.05%
Bayer Cropscience Limited 5.22%
Honeywell Automation India Limited 4.91%
ICRA Limited 3.92%
Gillette India Limited 3.82%
MRF Limited 3.50%
Kotak Mahindra Bank Limited 3.45%
Biocon Limited 3.20%
Zee Entertainment Enterprises Limited 3.08%
GlaxoSmithKline Pharmaceuticals Limited 3.05%
Top Ten Portfolio Holdings
Investment Performance - Regular Plan - Growth NAV as on December 30, 2016: ` 28.44
Date of Inception: Oct 03, 2006
NAV Per Unit. *
(`)
Birla SunLife Tax Plan
(%)
S&P BSESENSEX #
(%)
Nifty 50 ## (%)
Value of Standard Investment of ` 10000 in
Birla SunLife Tax
Relief ‘96 (`)
S&P BSESENSEX
# (`)
Nifty 50 ## (`)
Since inception till December 30, 2016 (CAGR) 10.00 10.74 7.77 8.43 28440 21531 22932
December 31, 2015 to December 30, 2016 (Absolute) 27.59 3.08 1.95 3.01 10308 10195 10301
December 31, 2014 toDecember 31, 2015 (Absolute) 25.49 8.24 -5.03 -4.06 10824 9497 9594
December 31, 2013 toDecember 31, 2014 (Absolute) 16.67 52.91 29.89 31.39 15291 12989 13139
# Scheme Benchmark, ## Additional Benchmark, * As on start of period considered above.Past performance may or may not be sustained in future. Load and Taxes are not considered for computation of returns. Total Schemes managed by Mr. Ajay Garg is 8. Refer annexure on page no. 67 to know more on performance of schemes managed by Fund Managers. Tax deduction(s) available u/s 80C of the Income Tax Act, 1961 is subject to conditions specified therein. Investors are requested to note that fiscal laws may change from time to time and there can be no guarantee that the current tax position may continue in the future.Investors are advised to consult their tax advisor in view of individual nature of tax benefits. $‘Direct Plan’ is only for investors who purchase /subscribe Units in a Scheme directly with the Mutual Fund and is not available for investors who route their investments through a Distributor. For further details, Investors are advised to refer to Addendum no. 44/2012 dated December 27, 2012 available on our website www.birlasunlife.com
SIP Performance - Regular Plan - Growth (assuming SIP of ` 10000 per month)Particulars Since Inception last 5 years last 3 years last 1 yearTotal Amount Invested (`) 1230000 600000 360000 120000Market Value of amount Invested 2480148 914223 422724 121775Scheme Returns (CAGR) 13.10 16.87 10.72 2.76S&P BSE SENSEX returns# (CAGR) 7.45 6.99 1.73 1.18Nifty 50 returns## (CAGR) 7.92 7.69 2.79 1.61Date of First Installment: March 01, 1999 & Scheme Inception Date: February 16, 1999. Past Performance may or may not be sustained in future.
Note: The exit load rate levied at the time of redemption/switch-out of units will be the rate prevailing at the time of allotment of the corresponding units. Customers may request for a separate Exit Load Applicability Report by calling our toll free numbers 1800-270-7000 / 1800-22-7000 or from any of our Investor Service Centers.The Dividend Reinvestment Facility under the scheme have been discontinued w.e.f. February 12, 2015. Please refer addendum no. 07/2015 dated February 09, 2015 for further details.
# Scheme Benchmark, ## Additional Benchmark, * As on start of period considered above.For SIP calculations above, the data assumes the investment of ` 10000/- on 1st day of every month or the subsequent working day. Load & Taxes are not considered for computation of returns. CAGR returns are computed after accounting for the cash flow by using XIRR method (investment internal rate of return).Where Benchmark returns are not available, they have not been shown.
Note: Standard Deviation, Sharpe Ratio & Beta are calculated on Annualised basis using 3 years history of monthly returns.## Risk Free Rate assumed to be 6.25% (FBIL Overnight MIBOR for 30th Dec 2016) for calculating Sharpe Ratio
3.80%
4.68%
5.02%
5.22%
5.49%
7.24%
7.93%
10.05%
13.41%
13.53%
Consumer Durables
Software
Industrial Capital Goods
Pesticides
Cement
Consumer Non Durables
Finance
Pharmaceuticals
Banks
Auto Ancillaries
Declared on date 23-Mar-16 20-Mar-15 21-Mar-14Dividend Yield (Regular Plan) 7.92% 5.52% 0.00%Dividend (`) Per Unit 5.75 4.50 0Cum Dividend NAV 72.57 81.45 54.12
Note: The NAV of the scheme, pursuant to pay out of dividend would fall to the extent of the payout and statutory levy (if applicable). Past performance may or may not be sustained in future.The Face Value - 10.00 Per UnitThe Financial Solution(s) stated above is ONLY for highlighting the many advantages perceived from investments in Mutual Funds but does not in any manner, indicate or imply, either the quality of any particular Scheme or guarantee any specific performance/returns.For more details on dividends declared please refer to the online empower on www.mutualfund.birlasunlife.com
http://mutualfund.birlasunlife.com https://twitter.com/bslmf
https://www.facebook.com/bslmf https://www.linkedin.com/company/bslmf29

A fund that provides an opportunity to save tax and aims to create wealth through Equity investments.
Birla Sun Life Tax Savings Fund is an open ended equity linked savings scheme which aims to provide medium to long term growth of capital along with income tax rebate.
Fund Manager: Mr. Ajay GargManaging Fund Since: October 11, 2014Total Experience: 22 yearsDate of Allotment: March 28, 2004Type of Scheme: An Open-ended Equity Linked Savings SchemeNAV of Plans / Options (`)Regular Plan Growth: 51.70Dividend: 25.50Bonus: 51.78Direct Plan$ Growth: 53.23Dividend: 26.16Bonus: 53.27Application Amount for fresh subscription*: NA as the scheme does not accept fresh subscriptions /Switch-inMin. Addl. Investment: NA as the scheme does not accept fresh subscriptions /Switch-in
Benchmark: S&P BSE 100Monthly Average AUM: ` 22.91 CroresAUM as on last day: ` 23.16 Crores(as on 31st December 2016)Load Structure (as % of NAV) (Incl. for SIP)Entry Load: NilExit Load: NilOther ParameterStandard Deviation: 14.94%Sharpe Ratio##: 0.80Beta: 0.96Portfolio Turnover: 0.09Expense Ratio:Regular 2.70Direct 2.40
Birla Sun Life Tax Savings Fund (U/S 80C)An Open-ended Equity Linked Savings Scheme
Issuer % to net Assets
Sundaram Clayton Limited 8.41%
Bayer Cropscience Limited 5.30%
Honeywell Automation India Limited 4.95%
ICRA Limited 3.83%
MRF Limited 3.74%
Kotak Mahindra Bank Limited 3.68%
Biocon Limited 3.43%
Zee Entertainment Enterprises Limited 3.29%
Gillette India Limited 3.17%
Pfizer Limited 2.68%
Top Ten Portfolio Holdings
Investment Performance - Regular Plan - Growth NAV as on December 30, 2016: ` 51.70
Date of Inception: Mar 28, 2004
NAV Per Unit. *
(`)
Birla SunLife TaxSavings
Fund (%)
S&P BSE100 # (%)
S&P BSESENSEX ##
(%)
Value of Standard Investment of ` 10000 in
Birla SunLife TaxSavingsFund (`)
S&P BSE100 # (`)
S&P BSESENSEX ## (`)
Since inception till December 30, 2016 (CAGR) 10.00 13.73 13.35 13.10 51700 49540 48158
December 31, 2015 to December 30, 2016 (Absolute) 50.12 3.15 3.57 1.95 10315 10357 10195
December 31, 2014 toDecember 31, 2015 (Absolute) 46.30 8.25 -3.25 -5.03 10825 9675 9497
December 31, 2013 toDecember 31, 2014 (Absolute) 31.26 48.11 32.28 29.89 14811 13228 12989
# Scheme Benchmark, ## Additional Benchmark, * As on start of period considered above.Past performance may or may not be sustained in future. Returns for dividend option would assume reinvestment of tax free dividends declared at the then prevailing NAV. Load and Taxes are not considered for computation of returns. Total Schemes managed by Mr. Ajay Garg is 8. Refer annexure on page no. 67 to know more on performance of schemes managed by Fund Managers. $‘Direct Plan’ is only for investors who purchase /subscribe Units in a Scheme directly with the Mutual Fund and is not available for investors who route their investments through a Distributor. For further details, Investors are advised to refer to Addendum no. 44/2012 dated December 27, 2012 available on our website www.birlasunlife.com
SIP Performance - Regular Plan - Growth (assuming SIP of ` 10000 per month)Particulars Since Inception last 5 years last 3 years last 1 yearTotal Amount Invested (`) 1540000 600000 360000 120000Market Value of amount Invested 3397212 855329 417803 121991Scheme Returns (CAGR) 11.61 14.16 9.92 3.10S&P BSE 100 returns# (CAGR) 10.24 8.37 3.51 2.31S&P BSE SENSEX returns## (CAGR) 9.76 6.99 1.73 1.18Date of First Installment: April 01, 2004 & Scheme Inception Date: March 28, 2004 . Past Performance may or may not be sustained in future.
Note: The exit load rate levied at the time of redemption/switch-out of units will be the rate prevailing at the time of allotment of the corresponding units. Customers may request for a separate Exit Load Applicability Report by calling our toll free numbers 1800-270-7000 / 1800-22-7000 or from any of our Investor Service Centers.
# Scheme Benchmark, ## Additional Benchmark, * As on start of period considered above.For SIP calculations above, the data assumes the investment of ` 10000/- on 1st day of every month or the subsequent working day. Load & Taxes are not considered for computation of returns. Performance for dividend option would assume reinvestment of tax free dividends declared at the then prevailing NAV. CAGR returns are computed after accounting for the cash flow by using XIRR method (investment internal rate of return).Where Benchmark returns are not available, they have not been shown.
3.78%
5.00%
5.06%
5.30%
5.79%
6.84%
8.13%
9.50%
14.27%
14.34%
Auto
Software
Industrial Capital Goods
Pesticides
Cement
Consumer Non Durables
Finance
Pharmaceuticals
Auto Ancillaries
Banks
Note: Standard Deviation, Sharpe Ratio & Beta are calculated on Annualised basis using 3 years history of monthly returns.## Risk Free Rate assumed to be 6.25% (FBIL Overnight MIBOR for 30th Dec 2016) for calculating Sharpe Ratio
30

31
http://mutualfund.birlasunlife.com https://twitter.com/bslmf
https://www.facebook.com/bslmf https://www.linkedin.com/company/bslmf
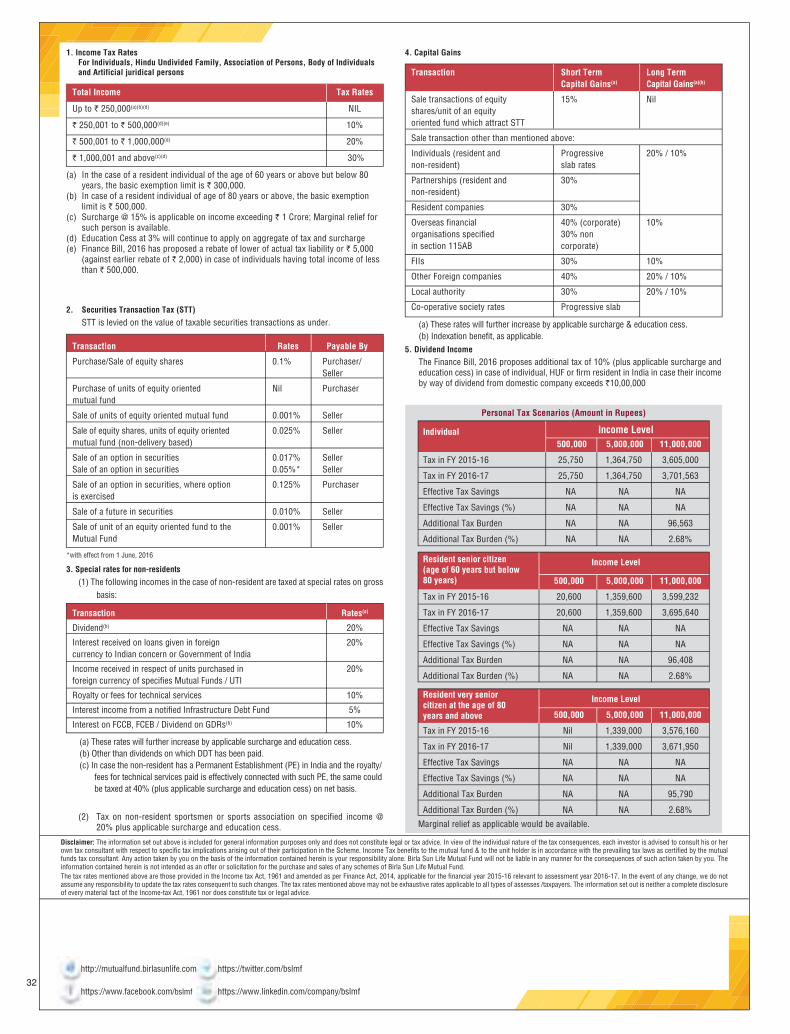
32http://mutualfund.birlasunlife.com https://twitter.com/bslmf
https://www.facebook.com/bslmf https://www.linkedin.com/company/bslmf

http://mutualfund.birlasunlife.com https://twitter.com/bslmf
https://www.facebook.com/bslmf https://www.linkedin.com/company/bslmf33
What are Wealth Solutions?
Our Wealth Creation Solutions seek to provide superior tax efficient growth of your capital through equity investments over a longer term.
Who can benefit from Wealth Creation Solutions?
These solutions can be ideal for investors who are planning for future expenses, like higher education of children, marriage, buying a home etc.These solutions are available in the range of aggressive to conservative options to suit the needs of the investor.
Benefits of Wealth Creation Solutions:
Tax Free Returns: No capital gains tax (on withdrawal) if you stay invested for over a year as per current tax laws. Invest in the long-term to overcome short-term ups and downs.
Risk is lowered: Mutual funds invest in many companies and funds are managed by experts; which can be considered as an alternative to direct investment in shares.
Investors are requested to consult their tax advisor before investing for individual nature of tax benefit. The Financial Solution (Wealth Creation Solution) stated above is ONLY for highlighting the many advantages perceived from investments in Mutual Funds but does not in any manner, indicate or imply, either the quality of any particular Scheme or guarantee any specific performance/returns.
Benefits of Wealth Creation solutions:

Birla Sun Life Equity Savings Fund uses a unique combination of equity derivative strategies, arbitrage opportunities, pure equity investments, debt & money market instruments which together intends to deliver Tax Efficient Growth with Low Volatility.
To provide capital appreciation and income distribution to the investors by using a blend of equity derivatives strategies, arbitrage opportunities and pure equity investments. The Scheme does not guarantee/indicate any returns. There can be no assurance that the schemes’ objectives will be achieved.
Fund Manager: Mr. Satyabrata Mohanty, Mr. Pranay Sinha & Mr. Lovelish SolankiManaging Fund Since: Since Inception, August 26, 2015 & August 26, 2015 respectivelyTotal Experience: 16 years, 10 Years & 7 yearsDate of Allotment: November 28, 2014Type of Scheme: An Open ended Equity SchemeApplication Amount for fresh subscription*: ` 1,000 (plus in multiplies of ` 1)Min. Addl. Investment: ` 1,000 (plus in multiplies of ` 1)
SIP: Monthly: Minimum ` 1,000/-NAV of Plans / Options (`)Regular Plan Growth: 11.28Dividend: 10.84Direct Plan$ Growth: 11.54Dividend: 11.10Benchmark: 30% S&P BSE 200 + 30%Crisil Short Term Bond Fund Index + 40% Crisil Liquid Fund IndexMonthly Average AUM: ` 361.43 CroresAUM as on last day: ` 366.11 Crores(as on 31st December 2016)Load Structure (as % of NAV) (Incl. for SIP)Entry Load: NilExit Load**: For redemption/switch out of units within 365 days from the date of allotment: 1.00% of applicable NAV. For redemption/switch out of units after 365 days from the date of allotment: Nil.**Exit Load is NIL for units issued in Dividend Reinvestment.Other ParameterModified Duration: 0.99 yearsAverage Maturity: 1.70 yearsYield to Maturity: 6.21%Portfolio Turnover: 4.46Expense Ratio:Regular 2.36Direct 1.17
Birla Sun Life Equity Savings FundAn Open ended Equity Scheme
Issuer % to net Assets Rating
Government of India 12.32% SOV
Tata Capital Housing Finance Ltd 9.41% CRISIL A1+
Yes Bank Limited 3.63%
Eicher Motors Limited 2.29%
Natco Pharma Limited 1.96%
Repco Home Finance Limited 1.89%
State Bank of India 1.78%
Hindalco Industries Limited 1.48%
Dalmia Bharat Limited 1.42%
Berger Paints (I) Limited 1.40%
Top Ten Portfolio Holdings
Investment Performance - Regular Plan - Growth NAV as on December 30, 2016: ` 11.28
Date of Inception: Nov 28, 2014
NAV Per
Unit. *(`)
BirlaSunLife
EquitySavings
Fund (%)
30% S&PBSE 200 +30% CrisilShort TermBond Fund
Index +40% Crisil
LiquidFund Index
# (%)
CRISIL10
YearGilt
Index # (%)
Nifty 50 ## (%)
Value of Standard Investment of ` 10000 inBirla
Sun LifeEquity
SavingsFund (`)
30% S&PBSE 200 +30% CrisilShort TermBond Fund
Index + 40%Crisil LiquidFund Index
# (`)
CRISIL10 Year
GiltIndex #
(`)
Nifty 50 ## (`)
Since inception till December 30, 2016 (CAGR) 10.00 5.93 6.14 11.77 -2.27 11280 11327 12618 9531
December 31, 2015 to December 30, 2016 (Absolute) 10.48 7.63 7.40 14.97 3.01 10763 10740 11497 10301
December 31, 2014 toDecember 31, 2015 (Absolute) 10.10 3.76 5.63 7.39 -4.06 10376 10563 10739 9594
# Scheme Benchmark, ## Additional Benchmark, * As on start of period considered above.Past performance may or may not be sustained in future. Returns for dividend option would assume reinvestment of tax free dividends declared at the then prevailing NAV. Load and Taxes are not considered for computation of returns. Total Schemes Co-Managed by Fund Managers is 1. Total Schemes managed by Mr. Satyabrata Mohanty is 11. Total Schemes managed by Mr. Pranay Sinha is 6. Total Schemes managed by Mr. Lovelish Solanki is 4. Refer annexure on page no. 67 to know more on performance of schemes managed by Fund Managers $‘Direct Plan’ is only for investors who purchase /subscribe Units in a Scheme directly with the Mutual Fund and is not available for investors who route their investments through a Distributor. For further details, Investors are advised to refer to Addendum no. 44/2012 dated December 27, 2012 available on our website www.birlasunlife.com
SIP Performance - Regular Plan - Growth (assuming SIP of ` 10000 per month)Particulars Since Inception last 1 yearTotal Amount Invested (`) 260000 120000Market Value of amount Invested 275846 123097Scheme Returns (CAGR) 5.38 4.8330% S&P BSE 200 + 30% Crisil Short Term Bond Fund Index + 40% Crisil Liquid Fund Index returns# (CAGR) 6.45 7.51CRISIL 10 Year Gilt Index returns# (CAGR) 12.73 15.95Nifty 50 returns## (CAGR) -0.67 1.61Date of First Installment: December 01, 2014 & Scheme Inception Date: November 28, 2014. Past Performance may or may not be sustained in future.
1.67%
1.98%
2.06%
3.14%
3.20%
4.86%
5.59%
7.35%
12.69%
13.00%
Industrial Products
Cement
Petroleum Products
Oil
Construction Project
Auto
Pharmaceuticals
Consumer Non Durables
Banks
Finance
Declared on date 30-Dec-16 30-Sep-16Dividend Yield (Regular Plan) 1.75% 1.98%Dividend (`) Per Unit 0.19 0.23Cum Dividend NAV 10.84 11.59Dividend Yield (Direct Plan) 1.80% 1.94%Dividend (`) Per Unit 0.20 0.23Cum Dividend NAV 11.10 11.83
Note: The NAV of the scheme, pursuant to pay out of dividend would fall to the extent of the payout and statutory levy (if applicable). Past performance may or may not be sustained in future.The Face Value - 10.00 Per UnitThe Financial Solution(s) stated above is ONLY for highlighting the many advantages perceived from investments in Mutual Funds but does not in any manner, indicate or imply, either the quality of any particular Scheme or guarantee any specific performance/returns.For more details on dividends declared please refer to the online empower on www.mutualfund.birlasunlife.com
Note: The exit load rate levied at the time of redemption/switch-out of units will be the rate prevailing at the time of allotment of the corresponding units. Customers may request for a separate Exit Load Applicability Report by calling our toll free numbers 1800-270-7000 / 1800-22-7000 or from any of our Investor Service Centers.
# Scheme Benchmark, ## Additional Benchmark, * As on start of period considered above.For SIP calculations above, the data assumes the investment of ` 10000/- on 1st day of every month or the subsequent working day. Load & Taxes are not considered for computation of returns. Performance for dividend option would assume reinvestment of tax free dividends declared at the then prevailing NAV. CAGR returns are computed after accounting for the cash flow by using XIRR method (investment internal rate of return).Where Benchmark returns are not available, they have not been shown. Past performance may or may not be sustained in future. Returns greater than 1 year period are compounded annualized. Dividends are assumed to be reinvested and bonus is adjusted. Load is not taken into consideration. For SIP returns, monthly investment of equal amounts invested on the 1st day of every month has been considered.
34

An open ended Asset allocation scheme which balances the portfolio between Equity and Fixed income securities based on market valuations to generate long term wealth at a relatively low volatility.
The primary objective of the Scheme is to generate long term growth of capital and income distribution with relatively lower volatility by investing in a dynamically balanced portfolio of Equity & Equity linked investments and fixed-income securities.
Fund Manager: Mr. Prasad Dhonde & Mr. Vineet MalooManaging Fund Since: October 11, 2014 & August 26, 2015Total Experience: 16 years & 11 yearsDate of Allotment: April 25, 2000Type of Scheme: An Open ended Asset Allocation SchemeApplication Amount for fresh subscription*: ` 1,000 (plus in multiplies of ` 1)Min. Addl. Investment: ` 1,000 (plus in multiplies of ` 1)
SIP: Monthly: Minimum ` 1,000/-NAV of Plans / Options (`)Regular Plan Growth: 44.35Dividend: 20.92Direct Plan$ Growth: 45.56Dividend: 21.54Benchmark: CRISIL Balanced Fund - Aggressive IndexMonthly Average AUM: ` 100.23 CroresAUM as on last day: ` 135.78 Crores(as on 31st December 2016)Load Structure (as % of NAV) (Incl. for SIP)Entry Load: NilExit Load**: In respect of each purchase / switch-in of Units, upto 15% of the units may be redeemed / switched-out without any exit load from the date of allotment.Any redemption in excess of the above limit shall be subject to the following exit load: For redemption / switch-out of units on or before 365 days from the date of allotment: 1.00% of applicable NAV. For redemption / switch-out of units after 365 days from the date of allotment: Nil. (w.e.f October 10, 2016)**Exit Load is NIL for units issued in Dividend Reinvestment.Other ParameterStandard Deviation: 11.58%Sharpe Ratio##: 0.80Beta: 1.13Portfolio Turnover: 4.90Expense Ratio:Regular 2.82Direct 2.01
Birla Sun Life Balanced Advantage Fund(erstwhile Birla Sun Life Dynamic Asset Allocation Fund. Name changed w.e.f September 30, 2016)An Open ended Asset Allocation Scheme
Issuer % to net Assets
HDFC Bank Limited 8.88%
Power Grid Corporation of India Limited 4.93%
Zee Entertainment Enterprises Limited 2.85%
Shree Cements Limited 2.17%
Coal India Limited 2.10%
Indraprastha Gas Limited 2.03%
Tech Mahindra Limited 2.02%
ITC Limited 1.95%
NTPC Limited 1.94%
Infosys Limited 1.91%
Top Ten Portfolio Holdings
Investment Performance - Regular Plan - Growth NAV as on December 30, 2016: ` 44.35
Date of Inception: Apr 25, 2000
NAV Per Unit. *
(`)
BirlaSun LifeBalancedAdvantageFund (%)
CRISILBalanced
Fund -AggressiveIndex # (%)
S&P BSESENSEX ##
(%)
Value of Standard Investment of ` 10000 in
BirlaSun LifeBalancedAdvantageFund (`)
CRISILBalanced
Fund -AggressiveIndex # (`)
S&P BSESENSEX ## (`)
Since inception till December 30, 2016 (CAGR) 10.00 9.33 N/A 11.19 44350 N/A 58726
December 31, 2015 to December 30, 2016 (Absolute) 38.13 16.31 6.66 1.95 11631 10666 10195
December 31, 2014 toDecember 31, 2015 (Absolute) 36.80 3.61 0.48 -5.03 10361 10048 9497
December 31, 2013 toDecember 31, 2014 (Absolute) 28.81 27.73 25.34 29.89 12773 12534 12989
# Scheme Benchmark, ## Additional Benchmark, * As on start of period considered above.Past performance may or may not be sustained in future. Returns for dividend option would assume reinvestment of tax free dividends declared at the then prevailing NAV. Load and Taxes are not considered for computation of returns. When scheme benchmark returns are not available, they have not been shown. Total Schemes Co-Managed by Fund Managers is 11. Total Schemes managed by Mr. Prasad Dhonde is 23. Total Schemes managed by Mr. Vineet Maloo is 18. Refer annexure on page no. 67 to know more on performance of schemes managed by Fund Managers $‘Direct Plan’ is only for investors who purchase /subscribe Units in a Scheme directly with the Mutual Fund and is not available for investors who route their investments through a Distributor. For further details, Investors are advised to refer to Addendum no. 44/2012 dated December 27, 2012 available on our website www.birlasunlife.com
SIP Performance - Regular Plan - Growth (assuming SIP of ` 10000 per month)Particulars Since Inception last 5 years last 3 years last 1 yearTotal Amount Invested (`) 2000000 600000 360000 120000Market Value of amount Invested 6228169 848343 439356 131920Scheme Returns (CAGR) 12.43 13.83 13.38 18.97CRISIL Balanced Fund - Aggressive Index returns# (CAGR) NA 8.92 6.09 5.77S&P BSE SENSEX returns## (CAGR) 12.64 6.99 1.73 1.18Date of First Installment: May 01, 2000 & Scheme Inception Date: April 25, 2000 . Past Performance may or may not be sustained in future.
Note: Standard Deviation, Sharpe Ratio & Beta are calculated on Annualised basis using 3 years history of monthly returns.## Risk Free Rate assumed to be 6.25% (FBIL Overnight MIBOR for 30th Dec 2016) for calculating Sharpe Ratio
2.73%
2.85%
2.86%
3.14%
3.41%
3.57%
5.27%
5.66%
8.21%
15.09%
Petroleum Products
Media & Entertainment
Cement
Auto
Industrial Products
Pharmaceuticals
Software
Gas
Power
Banks
Declared on date 22-Mar-13 26-Dec-05Dividend Yield (Regular Plan) 32.50% 30.00%Dividend (`) Per Unit 6.00 4.50Cum Dividend NAV 18.46 15.00Dividend Yield (Direct Plan) 32.41% -Dividend (`) Per Unit 6.00 -Cum Dividend NAV 18.51 -
Note: The NAV of the scheme, pursuant to pay out of dividend would fall to the extent of the payout and statutory levy (if applicable). Past performance may or may not be sustained in future.The Face Value - 10.00 Per UnitThe Financial Solution(s) stated above is ONLY for highlighting the many advantages perceived from investments in Mutual Funds but does not in any manner, indicate or imply, either the quality of any particular Scheme or guarantee any specific performance/returns.For more details on dividends declared please refer to the online empower on www.mutualfund.birlasunlife.com
Note: The exit load rate levied at the time of redemption/switch-out of units will be the rate prevailing at the time of allotment of the corresponding units. Customers may request for a separate Exit Load Applicability Report by calling our toll free numbers 1800-270-7000 / 1800-22-7000 or from any of our Investor Service Centers.
# Scheme Benchmark, ## Additional Benchmark, * As on start of period considered above.For SIP calculations above, the data assumes the investment of ` 10000/- on 1st day of every month or the subsequent working day. Load & Taxes are not considered for computation of returns. Performance for dividend option would assume reinvestment of tax free dividends declared at the then prevailing NAV. CAGR returns are computed after accounting for the cash flow by using XIRR method (investment internal rate of return).Where Benchmark returns are not available, they have not been shown. Past performance may or may not be sustained in future. Returns greater than 1 year period are compounded annualized. Dividends are assumed to be reinvested and bonus is adjusted. Load is not taken into consideration. For SIP returns, monthly investment of equal amounts invested on the 1st day of every month has been considered.
http://mutualfund.birlasunlife.com https://twitter.com/bslmf
https://www.facebook.com/bslmf https://www.linkedin.com/company/bslmf35

A fund that seeks to achieve long-term growth of your investment at moderate levels of risk by striking a balance between potential growth of equity and relative safety of debt.
An Open ended Balanced Scheme with the objective to generate long term growth of capital and current income, through a portfolio with a target allocation of 60% equity and 40% debt and money market securities. The secondary objective is income generation and distribution of dividend.
Fund Manager: Mr. Mahesh Patil, Mr. Pranay Sinha & Mr. Dhaval ShahManaging Fund Since: January 16, 2014, August 26, 2015 & November 23, 2016Total Experience: 24 years, 10 years & 12 yearsDate of Allotment: February 10, 1995Type of Scheme: An Open-ended Balanced SchemeApplication Amount for fresh subscription*: ` 1,000 (plus in multiplies of ` 1)Min. Addl. Investment: ` 1,000 (plus in multiplies of ` 1)
SIP: Monthly: Minimum ` 1,000/-NAV of Plans / Options (`)Regular Plan Growth: 613.78Dividend: 135.36Direct Plan$ Growth: 637.56Dividend: 185.94Benchmark: CRISIL Balanced Fund - Aggressive IndexMonthly Average AUM: ` 5013.66 CroresAUM as on last day: ` 5149.91 Crores(as on 31st December 2016)Load Structure (as % of NAV) (Incl. for SIP)Entry Load: NilExit Load**: In respect of each purchase / switch-in of Units, upto 15% of the units may be redeemed / switched-out without any exit load from the date of allotment.Any redemption in excess of the above limit shall be subject to the following exit load: For redemption / switch-out of units on or before 365 days from the date of allotment: 1.00% of applicable NAV. For redemption / switch-out of units after 365 days from the date of allotment: Nil. (w.e.f October 10, 2016)**Exit Load is NIL for units issued in Dividend Reinvestment.Other ParameterModified Duration: 7.19 yearsAverage Maturity: 11.44 yearsYield to Maturity: 7.37%Standard Deviation: 12.32%Sharpe Ratio##: 1.01Beta: 1.23Portfolio Turnover: 1.75Expense Ratio:Regular 2.27Direct 1.00
67.90%
18.55%
6.36%5.54% 1.63%
0.02%
Equity SovereignAAA Cash & Current AssetsBelow AA AA
2.12%
2.27%
2.77%
3.44%
4.28%
5.77%
5.93%
6.18%
7.68%
13.55%
Industrial Products
Consumer Durables
Media & Entertainment
Petroleum Products
Consumer Non Durables
Auto
Software
Finance
Pharmaceuticals
Banks
Birla Sun Life Balanced ‘95 Fund(erstwhile Birla Sun Life ‘95 Fund. Name changed w.e.f January 01, 2016)An Open-ended Balanced Scheme
Issuer % to net Assets Rating
Government of India 16.53% SOVHDFC Bank Limited 4.46%Infosys Limited 3.79%Tata Motors Limited 2.34%ICICI Bank Limited 2.21%State Government Securities 2.02% SOVHousing Development Finance Corporation Limited 1.98%Birla Sun Life Mutual Fund 1.91%Power Finance Corporation Limited 1.61% CRISIL AAANTPC Limited 1.56%
Top Ten Portfolio Holdings
Investment Performance - Regular Plan - Growth NAV as on December 30, 2016: ` 613.78
Date of Inception: Feb 10, 1995
NAV Per Unit. *
(`)
BirlaSun Life
Balanced ‘95Fund (%)
CRISILBalanced
Fund -AggressiveIndex # (%)
Nifty 50 ## (%)
Value of Standard Investment of ` 10000 in
BirlaSun Life
Balanced ‘95Fund (`)
CRISILBalanced
Fund -AggressiveIndex # (`)
Nifty 50 ## (`)
Since inception till December 30, 2016 (CAGR) 10.00 20.68 N/A 9.89 613780 N/A 78925
December 31, 2015 to December 30, 2016 (Absolute) 563.81 8.86 6.66 3.01 10886 10666 10301
December 31, 2014 toDecember 31, 2015 (Absolute) 545.50 3.36 0.48 -4.06 10336 10048 9594
December 31, 2013 toDecember 31, 2014 (Absolute) 367.19 48.56 25.34 31.39 14856 12534 13139
# Scheme Benchmark, ## Additional Benchmark, * As on start of period considered above.Past performance may or may not be sustained in future. Returns for dividend option would assume reinvestment of tax free dividends declared at the then prevailing NAV. Load and Taxes are not considered for computation of returns. When scheme benchmark returns are not available, they have not been shown. Total Schemes Co-Managed by Fund Managers is 1. Total Schemes managed by Mr. Mahesh Patil is 8. Total Schemes managed by Mr. Pranay Sinha is 6. Total Schemes managed by Mr. Dhaval Shah is 1. Refer annexure on page no. 67 to know more on performance of schemes managed by Fund Managers. $‘Direct Plan’ is only for investors who purchase /subscribe Units in a Scheme directly with the Mutual Fund and is not available for investors who route their investments through a Distributor. For further details, Investors are advised to refer to Addendum no. 44/2012 dated December 27, 2012 available on our website www.birlasunlife.com
SIP Performance - Regular Plan - Growth (assuming SIP of ` 10000 per month)Particulars Since Inception last 5 years last 3 years last 1 yearTotal Amount Invested (`) 2620000 600000 360000 120000Market Value of amount Invested 37561202 880741 426279 124631Scheme Returns (CAGR) 20.52 15.35 11.30 7.25CRISIL Balanced Fund - Aggressive Index returns# (CAGR) NA 8.92 6.09 5.77Nifty 50 returns## (CAGR) 11.70 7.69 2.79 1.61Date of First Installment: March 01, 1995 & Scheme Inception Date: February 10, 1995 . Past Performance may or may not be sustained in future.
# Scheme Benchmark, ## Additional Benchmark, * As on start of period considered above.For SIP calculations above, the data assumes the investment of ` 10000/- on 1st day of every month or the subsequent working day. Load & Taxes are not considered for computation of returns. Performance for dividend option would assume reinvestment of tax free dividends declared at the then prevailing NAV. CAGR returns are computed after accounting for the cash flow by using XIRR method (investment internal rate of return).Where Benchmark returns are not available, they have not been shown. Past performance may or may not be sustained in future. Returns greater than 1 year period are compounded annualized. Dividends are assumed to be reinvested and bonus is adjusted. Load is not taken into consideration. For SIP returns, monthly investment of equal amounts invested on the 1st day of every month has been considered.
Note: Standard Deviation, Sharpe Ratio & Beta are calculated on Annualised basis using 3 years history of monthly returns.## Risk Free Rate assumed to be 6.25% (FBIL Overnight MIBOR for 30th Dec 2016) for calculating Sharpe Ratio
Declared on date 26-Dec-16 30-Sep-16 30-Jun-16Dividend Yield (Regular Plan) 2.58% 2.56% 1.74%Dividend (`) Per Unit 3.50 3.80 2.46Cum Dividend NAV 135.43 148.62 141.55Declared on date 30-Sep-16 23-Dec-15 01-Oct-14Dividend Yield (Direct Plan) 2.03% 2.07% 4.40%Dividend (`) Per Unit 4.00 3.60 7.00Cum Dividend NAV 197.27 174.23 159.03
Note: The NAV of the scheme, pursuant to pay out of dividend would fall to the extent of the payout and statutory levy (if applicable). Past performance may or may not be sustained in future.The Face Value - 10.00 Per UnitThe Financial Solution(s) stated above is ONLY for highlighting the many advantages perceived from investments in Mutual Funds but does not in any manner, indicate or imply, either the quality of any particular Scheme or guarantee any specific performance/returns.For more details on dividends declared please refer to the online empower on www.mutualfund.birlasunlife.com
36

A fund that is designed to mirror the market performance of the 50 companies in the Nifty Index.
An Open-ended index-linked growth scheme with the objective to generate returns commensurate with the performance of Nifty subject to tracking errors.
Fund Manager: Mr. Ajay GargManaging Fund Since: October 01, 2006Total Experience: 22 yearsDate of Allotment: September 18, 2002Type of Scheme: An Open-ended Index Linked Growth SchemeApplication Amount for fresh subscription*: ` 1,000 (plus in multiplies of ` 1)Min. Addl. Investment: ` 1,000 (plus in multiplies of ` 1)
SIP: Monthly: Minimum ` 1,000/-NAV of Plans / Options (`)Regular Plan Growth: 80.2096Dividend: 11.2910Direct Plan$ Growth: 80.2451Dividend: 11.4073Benchmark: Nifty 50Monthly Average AUM: ` 142.58 CroresAUM as on last day: ` 144.90 Crores(as on 31st December 2016)Load Structure (as % of NAV) (Incl. for SIP)Entry Load: NilExit Load**: Nil**Exit Load is NIL for units issued in Dividend Reinvestment.Other ParameterStandard Deviation: 14.14%Sharpe Ratio##: 0.20Beta: 0.99Portfolio Turnover: 3.58Expense Ratio:Regular 0.75Direct 0.45Tracking Error: 0.52%
Birla Sun Life Index FundAn Open-ended Index Linked Growth Scheme
Issuer % to net Assets
Nifty Index 25.55%
HDFC Bank Limited 5.87%
ITC Limited 5.04%
Infosys Limited 4.99%
Housing Development Finance Corporation Limited 4.92%
Reliance Industries Limited 4.41%
ICICI Bank Limited 3.66%
Tata Consultancy Services Limited 3.11%
Larsen & Toubro Limited 2.73%
Tata Motors Limited 2.63%
Top Ten Portfolio Holdings
Investment Performance - Regular Plan - Growth NAV as on December 30, 2016: ` 80.2096
Date of Inception: Sept 18, 2002
NAV Per Unit. *
(`)
Birla SunLife IndexFund (%)
Nifty 50 # (%)
S&P BSESENSEX ##
(%)
Value of Standard Investment of ` 10000 in
Birla SunLife IndexFund (`)
Nifty 50 # (`)
S&P BSESENSEX ## (`)
Since inception till December 30, 2016 (CAGR) 10.0000 15.68 15.98 16.32 80210 83223 86737
December 31, 2015 to December 30, 2016 (Absolute) 77.8352 3.05 3.01 1.95 10305 10301 10195
December 31, 2014 toDecember 31, 2015 (Absolute) 80.9141 -3.81 -4.06 -5.03 9619 9594 9497
December 31, 2013 toDecember 31, 2014 (Absolute) 61.9024 30.71 31.39 29.89 13071 13139 12989
# Scheme Benchmark, ## Additional Benchmark, * As on start of period considered above.Past performance may or may not be sustained in future. Returns for dividend option would assume reinvestment of tax free dividends declared at the then prevailing NAV. Load and Taxes are not considered for computation of returns. Total Schemes managed by Mr. Ajay Garg is 8. Refer annexure on page no. 67 to know more on performance of schemes managed by Fund Managers. $‘Direct Plan’ is only for investors who purchase /subscribe Units in a Scheme directly with the Mutual Fund and is not available for investors who route their investments through a Distributor. For further details, Investors are advised to refer to Addendum no. 44/2012 dated December 27, 2012 available on our website www.birlasunlife.com
SIP Performance - Regular Plan - Growth (assuming SIP of ` 10000 per month)Particulars Since Inception last 5 years last 3 years last 1 yearTotal Amount Invested (`) 1720000 600000 360000 120000Market Value of amount Invested 4136951 728173 375482 120759Scheme Returns (CAGR) 11.42 7.68 2.76 1.18Nifty 50 returns# (CAGR) 11.84 7.69 2.79 1.61S&P BSE SENSEX returns## (CAGR) 11.86 6.99 1.73 1.18Date of First Installment: October 01, 2002, & Scheme Inception Date: September 18, 2002. Past Performance may or may not be sustained in future.
2.20%
2.35%
2.73%
4.67%
4.92%
5.22%
7.48%
8.23%
10.75%
17.76%
Cement
Power
Construction Project
Pharmaceuticals
Finance
Petroleum Products
Consumer Non Durables
Auto
Software
Banks
Note: Standard Deviation, Sharpe Ratio & Beta are calculated on Annualised basis using 3 years history of monthly returns.## Risk Free Rate assumed to be 6.25% (FBIL Overnight MIBOR for 30th Dec 2016) for calculating Sharpe RatioTracking Ratio for BSL Index Fund is computed based on Nifty TR Index
Declared on date 28-Mar-16 02-Nov-15 25-Feb-15Dividend Yield (Regular Plan) 9.84% 20.62% 23.57%Dividend (`) Per Unit 1.15 3.20 5.20Cum Dividend NAV 11.69 15.52 22.06Dividend Yield (Direct Plan) 10.52% 20.37% 23.39%Dividend (`) Per Unit 1.25 3.20 5.20Cum Dividend NAV 11.88 15.71 22.23
Note: The NAV of the scheme, pursuant to pay out of dividend would fall to the extent of the payout and statutory levy (if applicable). Past performance may or may not be sustained in future.The Face Value - 10.00 Per UnitThe Financial Solution(s) stated above is ONLY for highlighting the many advantages perceived from investments in Mutual Funds but does not in any manner, indicate or imply, either the quality of any particular Scheme or guarantee any specific performance/returns.For more details on dividends declared please refer to the online empower on www.mutualfund.birlasunlife.com
Note: The exit load rate levied at the time of redemption/switch-out of units will be the rate prevailing at the time of allotment of the corresponding units. Customers may request for a separate Exit Load Applicability Report by calling our toll free numbers 1800-270-7000 / 1800-22-7000 or from any of our Investor Service Centers.
# Scheme Benchmark, ## Additional Benchmark, * As on start of period considered above.For SIP calculations above, the data assumes the investment of ` 10000/- on 1st day of every month or the subsequent working day. Load & Taxes are not considered for computation of returns. Performance for dividend option would assume reinvestment of tax free dividends declared at the then prevailing NAV. CAGR returns are computed after accounting for the cash flow by using XIRR method (investment internal rate of return).Where Benchmark returns are not available, they have not been shown. Past performance may or may not be sustained in future. Returns greater than 1 year period are compounded annualized. Dividends are assumed to be reinvested and bonus is adjusted. Load is not taken into consideration. For SIP returns, monthly investment of equal amounts invested on the 1st day of every month has been considered.
http://mutualfund.birlasunlife.com https://twitter.com/bslmf
https://www.facebook.com/bslmf https://www.linkedin.com/company/bslmf37
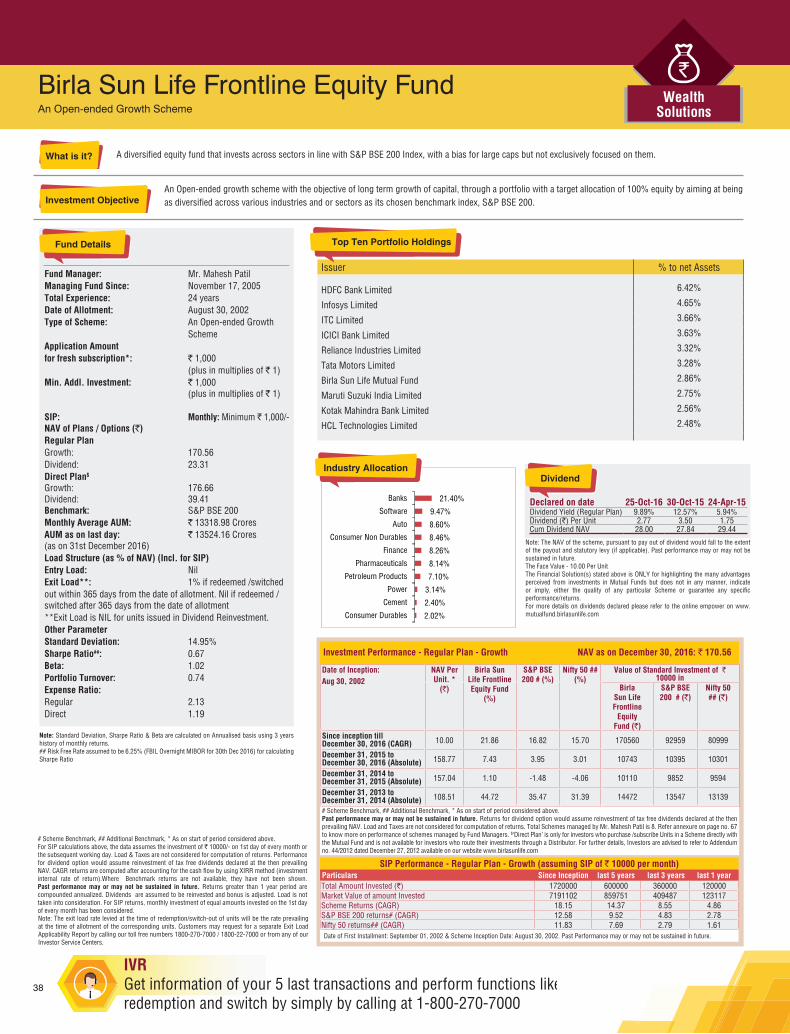
A diversified equity fund that invests across sectors in line with S&P BSE 200 Index, with a bias for large caps but not exclusively focused on them.
An Open-ended growth scheme with the objective of long term growth of capital, through a portfolio with a target allocation of 100% equity by aiming at being as diversified across various industries and or sectors as its chosen benchmark index, S&P BSE 200.
Fund Manager: Mr. Mahesh PatilManaging Fund Since: November 17, 2005Total Experience: 24 yearsDate of Allotment: August 30, 2002Type of Scheme: An Open-ended Growth SchemeApplication Amount for fresh subscription*: ` 1,000 (plus in multiplies of ` 1)Min. Addl. Investment: ` 1,000 (plus in multiplies of ` 1)
SIP: Monthly: Minimum ` 1,000/-NAV of Plans / Options (`)Regular Plan Growth: 170.56Dividend: 23.31Direct Plan$ Growth: 176.66Dividend: 39.41Benchmark: S&P BSE 200Monthly Average AUM: ` 13318.98 CroresAUM as on last day: ` 13524.16 Crores(as on 31st December 2016)Load Structure (as % of NAV) (Incl. for SIP)Entry Load: NilExit Load**: 1% if redeemed /switchedout within 365 days from the date of allotment. Nil if redeemed /switched after 365 days from the date of allotment **Exit Load is NIL for units issued in Dividend Reinvestment.Other ParameterStandard Deviation: 14.95%Sharpe Ratio##: 0.67Beta: 1.02Portfolio Turnover: 0.74Expense Ratio:Regular 2.13Direct 1.19
2.02%
2.40%
3.14%
7.10%
8.14%
8.26%
8.46%
8.60%
9.47%
21.40%
Consumer Durables
Cement
Power
Petroleum Products
Pharmaceuticals
Finance
Consumer Non Durables
Auto
Software
Banks
Birla Sun Life Frontline Equity FundAn Open-ended Growth Scheme
Issuer % to net Assets
HDFC Bank Limited 6.42%
Infosys Limited 4.65%
ITC Limited 3.66%
ICICI Bank Limited 3.63%
Reliance Industries Limited 3.32%
Tata Motors Limited 3.28%
Birla Sun Life Mutual Fund 2.86%
Maruti Suzuki India Limited 2.75%
Kotak Mahindra Bank Limited 2.56%
HCL Technologies Limited 2.48%
Top Ten Portfolio Holdings
Investment Performance - Regular Plan - Growth NAV as on December 30, 2016: ` 170.56
Date of Inception: Aug 30, 2002
NAV Per Unit. *
(`)
Birla SunLife FrontlineEquity Fund
(%)
S&P BSE200 # (%)
Nifty 50 ## (%)
Value of Standard Investment of ` 10000 in
BirlaSun LifeFrontline
EquityFund (`)
S&P BSE200 # (`)
Nifty 50 ## (`)
Since inception till December 30, 2016 (CAGR) 10.00 21.86 16.82 15.70 170560 92959 80999
December 31, 2015 to December 30, 2016 (Absolute) 158.77 7.43 3.95 3.01 10743 10395 10301
December 31, 2014 toDecember 31, 2015 (Absolute) 157.04 1.10 -1.48 -4.06 10110 9852 9594
December 31, 2013 toDecember 31, 2014 (Absolute) 108.51 44.72 35.47 31.39 14472 13547 13139
# Scheme Benchmark, ## Additional Benchmark, * As on start of period considered above.Past performance may or may not be sustained in future. Returns for dividend option would assume reinvestment of tax free dividends declared at the then prevailing NAV. Load and Taxes are not considered for computation of returns. Total Schemes managed by Mr. Mahesh Patil is 8. Refer annexure on page no. 67 to know more on performance of schemes managed by Fund Managers. $‘Direct Plan’ is only for investors who purchase /subscribe Units in a Scheme directly with the Mutual Fund and is not available for investors who route their investments through a Distributor. For further details, Investors are advised to refer to Addendum no. 44/2012 dated December 27, 2012 available on our website www.birlasunlife.com
SIP Performance - Regular Plan - Growth (assuming SIP of ` 10000 per month)Particulars Since Inception last 5 years last 3 years last 1 yearTotal Amount Invested (`) 1720000 600000 360000 120000Market Value of amount Invested 7191102 859751 409487 123117Scheme Returns (CAGR) 18.15 14.37 8.55 4.86S&P BSE 200 returns# (CAGR) 12.58 9.52 4.83 2.78Nifty 50 returns## (CAGR) 11.83 7.69 2.79 1.61Date of First Installment: September 01, 2002 & Scheme Inception Date: August 30, 2002. Past Performance may or may not be sustained in future.
Note: Standard Deviation, Sharpe Ratio & Beta are calculated on Annualised basis using 3 years history of monthly returns.## Risk Free Rate assumed to be 6.25% (FBIL Overnight MIBOR for 30th Dec 2016) for calculating Sharpe Ratio
Note: The exit load rate levied at the time of redemption/switch-out of units will be the rate prevailing at the time of allotment of the corresponding units. Customers may request for a separate Exit Load Applicability Report by calling our toll free numbers 1800-270-7000 / 1800-22-7000 or from any of our Investor Service Centers.
# Scheme Benchmark, ## Additional Benchmark, * As on start of period considered above.For SIP calculations above, the data assumes the investment of ` 10000/- on 1st day of every month or the subsequent working day. Load & Taxes are not considered for computation of returns. Performance for dividend option would assume reinvestment of tax free dividends declared at the then prevailing NAV. CAGR returns are computed after accounting for the cash flow by using XIRR method (investment internal rate of return).Where Benchmark returns are not available, they have not been shown. Past performance may or may not be sustained in future. Returns greater than 1 year period are compounded annualized. Dividends are assumed to be reinvested and bonus is adjusted. Load is not taken into consideration. For SIP returns, monthly investment of equal amounts invested on the 1st day of every month has been considered.
Declared on date 25-Oct-16 30-Oct-15 24-Apr-15Dividend Yield (Regular Plan) 9.89% 12.57% 5.94%Dividend (`) Per Unit 2.77 3.50 1.75Cum Dividend NAV 28.00 27.84 29.44
Note: The NAV of the scheme, pursuant to pay out of dividend would fall to the extent of the payout and statutory levy (if applicable). Past performance may or may not be sustained in future.The Face Value - 10.00 Per UnitThe Financial Solution(s) stated above is ONLY for highlighting the many advantages perceived from investments in Mutual Funds but does not in any manner, indicate or imply, either the quality of any particular Scheme or guarantee any specific performance/returns.For more details on dividends declared please refer to the online empower on www.mutualfund.birlasunlife.com
38

A large cap focused fund that invests in equity and equity related securities of top 100 companies in India as measured by market capitalization.
An Open-ended growth scheme with the objective to provide medium to long term capital appreciation, by investing predominantly in a diversified portfolio of equity and equity related securities of top 100 companies as measured by market capitalization.
Fund Manager: Mr. Mahesh PatilManaging Fund Since: July 29, 2010Total Experience: 24 yearsDate of Allotment: October 24, 2005Type of Scheme: An Open-ended Growth SchemeApplication Amount for fresh subscription*: ` 1,000 (plus in multiplies of ` 1)Min. Addl. Investment: ` 1,000 (plus in multiplies of ` 1)
SIP: Monthly: Minimum ` 1,000/-NAV of Plans / Options (`)Regular Plan Growth: 44.9958Dividend: 15.5505Direct Plan$ Growth: 46.6075Dividend: 26.5510Benchmark: Nifty 50Monthly Average AUM: ` 2162.74 CroresAUM as on last day: ` 2209.22 Crores(as on 31st December 2016)Load Structure (as % of NAV) (Incl. for SIP)Entry Load: NilExit Load**: For redemption/switch out of units within 365 days from the date of allotment: 1.00% of applicable NAV. For redemption/switch out of units after 365 days from the date of allotment: Nil**Exit Load is NIL for units issued in Dividend Reinvestment.Other ParameterStandard Deviation: 15.27%Sharpe Ratio##: 0.68Beta: 1.04Portfolio Turnover: 0.93Expense Ratio:Regular 2.27Direct 1.08
Birla Sun Life Top 100 FundAn Open-ended Growth Scheme
Issuer % to net Assets
HDFC Bank Limited 7.36%
Infosys Limited 4.46%
Tata Motors Limited 4.06%
ICICI Bank Limited 4.01%
ITC Limited 3.63%
Grasim Industries Limited 2.88%
Kotak Mahindra Bank Limited 2.86%
HCL Technologies Limited 2.82%
Maruti Suzuki India Limited 2.79%
Reliance Industries Limited 2.75%
Top Ten Portfolio Holdings
Investment Performance - Regular Plan - Growth NAV as on December 30, 2016: ` 44.9958
Date of Inception: Oct 24, 2005
NAV Per Unit. *
(`)
Birla SunLife Top 100
Fund (%)
Nifty 50 # (%)
S&P BSESENSEX ##
(%)
Value of Standard Investment of ` 10000 in
Birla SunLife Top
100 Fund (`)
Nifty 50 # (`)
S&P BSESENSEX ## (`)
Since inception till December 30, 2016 (CAGR) 10.0000 14.38 11.61 11.44 44996 34181 33616
December 31, 2015 to December 30, 2016 (Absolute) 42.1734 6.69 3.01 1.95 10669 10301 10195
December 31, 2014 toDecember 31, 2015 (Absolute) 42.1924 -0.05 -4.06 -5.03 9995 9594 9497
December 31, 2013 toDecember 31, 2014 (Absolute) 28.3342 48.91 31.39 29.89 14891 13139 12989
# Scheme Benchmark, ## Additional Benchmark, * As on start of period considered above.Past performance may or may not be sustained in future. Returns for dividend option would assume reinvestment of tax free dividends declared at the then prevailing NAV. Load and Taxes are not considered for computation of returns. Total Schemes managed by Mr. Mahesh Patil is 8. Refer annexure on page no. 67 to know more on performance of schemes managed by Fund Managers.$‘Direct Plan’ is only for investors who purchase /subscribe Units in a Scheme directly with the Mutual Fund and is not available for investors who route their investments through a Distributor. For further details, Investors are advised to refer to Addendum no. 44/2012 dated December 27, 2012 available on our website www.birlasunlife.com
SIP Performance - Regular Plan - Growth (assuming SIP of ` 10000 per month)Particulars Since Inception last 5 years last 3 years last 1 yearTotal Amount Invested (`) 1350000 600000 360000 120000Market Value of amount Invested 2916365 863987 408726 123400Scheme Returns (CAGR) 13.00 14.57 8.43 5.31Nifty 50 returns# (CAGR) 8.36 7.69 2.79 1.61S&P BSE SENSEX returns## (CAGR) 7.93 6.99 1.73 1.18Date of First Installment: November 01, 2005 & Scheme Inception Date: October 24, 2005. Past Performance may or may not be sustained in future.
Note: The exit load rate levied at the time of redemption/switch-out of units will be the rate prevailing at the time of allotment of the corresponding units. Customers may request for a separate Exit Load Applicability Report by calling our toll free numbers 1800-270-7000 / 1800-22-7000 or from any of our Investor Service Centers.
# Scheme Benchmark, ## Additional Benchmark, * As on start of period considered above.For SIP calculations above, the data assumes the investment of ` 10000/- on 1st day of every month or the subsequent working day. Load & Taxes are not considered for computation of returns. Performance for dividend option would assume reinvestment of tax free dividends declared at the then prevailing NAV. CAGR returns are computed after accounting for the cash flow by using XIRR method (investment internal rate of return).Where Benchmark returns are not available, they have not been shown. Past performance may or may not be sustained in future. Returns greater than 1 year period are compounded annualized. Dividends are assumed to be reinvested and bonus is adjusted. Load is not taken into consideration. For SIP returns, monthly investment of equal amounts invested on the 1st day of every month has been considered.
2.07%
3.82%
3.96%
5.62%
6.45%
6.78%
8.22%
9.12%
9.35%
23.06%
Consumer Durables
Cement
Power
Finance
Petroleum Products
Consumer Non Durables
Auto
Pharmaceuticals
Software
Banks
Note: Standard Deviation, Sharpe Ratio & Beta are calculated on Annualised basis using 3 years history of monthly returns.## Risk Free Rate assumed to be 6.25% (FBIL Overnight MIBOR for 30th Dec 2016) for calculating Sharpe Ratio
Declared on date 22-Jul-16 24-Jul-15 22-Jan-15Dividend Yield (Regular Plan) 8.13% 12.10% 4.31%Dividend (`) Per Unit 1.41 2.30 0.85Cum Dividend NAV 17.34 19.01 19.73
Note: The NAV of the scheme, pursuant to pay out of dividend would fall to the extent of the payout and statutory levy (if applicable). Past performance may or may not be sustained in future.The Face Value - 10.00 Per UnitThe Financial Solution(s) stated above is ONLY for highlighting the many advantages perceived from investments in Mutual Funds but does not in any manner, indicate or imply, either the quality of any particular Scheme or guarantee any specific performance/returns.For more details on dividends declared please refer to the online empower on www.mutualfund.birlasunlife.com
http://mutualfund.birlasunlife.com https://twitter.com/bslmf
https://www.facebook.com/bslmf https://www.linkedin.com/company/bslmf39

A Diversified Equity Fund that looks for opportunities without any sectoral or market cap bias with the aim to give you long term growth of capital.
An Open-ended growth scheme with the objective of long term growth of capital, through a portfolio with a target allocation of 90% equity and 10% debt and money market securities.
Fund Manager: Mr. Anil ShahManaging Fund Since: October 03, 2012Total Experience: 26 yearsDate of Allotment: August 27, 1998Type of Scheme: An Open-ended Growth SchemeApplication Amount for fresh subscription*: ` 1,000 (plus in multiplies of ` 1)Min. Addl. Investment: ` 1,000 (plus in multiplies of ` 1)
SIP: Monthly: Minimum ` 1,000/-NAV of Plans / Options (`)Regular Plan Growth: 548.79Dividend: 88.75Direct Plan$ Growth: 567.18Dividend: 109.64Benchmark: S&P BSE 200Monthly Average AUM: ` 3200.64 CroresAUM as on last day: ` 3294.57 Crores(as on 31st December 2016)Load Structure (as % of NAV) (Incl. for SIP)Entry Load: NilExit Load**: For redemption/switch out of units within 365 days from the date of allotment: 1.00% of applicable NAV. For redemption/switch out of units after 365 days from the date of allotment: Nil**Exit Load is NIL for units issued in Dividend Reinvestment.Other ParameterStandard Deviation: 17.42%Sharpe Ratio##: 0.96Beta: 1.13Portfolio Turnover: 0.93Expense Ratio:Regular 2.18Direct 1.24
Birla Sun Life Equity FundAn Open-ended Growth Scheme
Issuer % to net Assets
HDFC Bank Limited 5.49%
Cairn India Limited 3.84%
HCL Technologies Limited 3.63%
Maruti Suzuki India Limited 3.37%
Kotak Mahindra Bank Limited 3.33%
Yes Bank Limited 3.27%
IndusInd Bank Limited 3.26%
Dr. Reddy's Laboratories Limited 3.25%
Tata Chemicals Limited 3.13%
ITC Limited 3.01%
Top Ten Portfolio Holdings
Investment Performance - Regular Plan - Growth NAV as on December 30, 2016: ` 548.79
Date of Inception: Aug 27,1998
NAV Per Unit. *
(`)
Birla SunLife EquityFund (%)
S&P BSE200 # (%)
Nifty 50 ## (%)
Value of Standard Investment of ` 10000 in
Birla SunLife EquityFund (`)
S&P BSE200 # (`)
Nifty 50 ## (`)
Since inception till December 30, 2016 (CAGR) 10.00 24.38 14.12 12.94 548790 113041 93291
December 31, 2015 to December 30, 2016 (Absolute) 476.32 15.21 3.95 3.01 11521 10395 10301
December 31, 2014 toDecember 31, 2015 (Absolute) 462.75 2.93 -1.48 -4.06 10293 9852 9594
December 31, 2013 toDecember 31, 2014 (Absolute) 295.48 56.61 35.47 31.39 15661 13547 13139
# Scheme Benchmark, ## Additional Benchmark, * As on start of period considered above.Past performance may or may not be sustained in future. Returns for dividend option would assume reinvestment of tax free dividends declared at the then prevailing NAV. Load and Taxes are not considered for computation of returns. Total Schemes managed by Anil Shah is 8. Refer annexure on page no. 67 to know more on performance of schemes managed by Fund Managers. $‘Direct Plan’ is only for investors who purchase /subscribe Units in a Scheme directly with the Mutual Fund and is not available for investors who route their investments through a Distributor. For further details, Investors are advised to refer to Addendum no. 44/2012 dated December 27, 2012 available on our website www.birlasunlife.com
SIP Performance - Regular Plan - Growth (assuming SIP of ` 10000 per month)Particulars Since Inception last 5 years last 3 years last 1 yearTotal Amount Invested (`) 2210000 600000 360000 120000Market Value of amount Invested 20454457 976597 447038 129500Scheme Returns (CAGR) 20.93 19.58 14.59 15.03S&P BSE 200 returns# (CAGR) 13.54 9.52 4.83 2.78Nifty 50 returns## (CAGR) 12.35 7.69 2.79 1.61Date of First Installment: September 01, 1998 & Scheme Inception Date: August 27, 1998. Past Performance may or may not be sustained in future.
2.91%
3.73%
3.84%
4.95%
5.20%
6.52%
6.83%
9.60%
9.61%
19.49%
Telecom - Services
Chemicals
Oil
Auto
Cement
Consumer Non Durables
Software
Finance
Pharmaceuticals
Banks
Note: Standard Deviation, Sharpe Ratio & Beta are calculated on Annualised basis using 3 years history of monthly returns.## Risk Free Rate assumed to be 6.25% (FBIL Overnight MIBOR for 30th Dec 2016) for calculating Sharpe Ratio
Declared on date 30-Nov-16 30-Nov-15 17-Mar-15Dividend Yield (Regular Plan) 7.81% 10.74% 3.76%Dividend (`) Per Unit 7.70 10.00 3.80Cum Dividend NAV 98.57 93.15 101.16Dividend Yield (Direct Plan) - 8.76% 1.84%Dividend (`) Per Unit - 9.00 2.00Cum Dividend NAV - 102.77 108.75
Note: The NAV of the scheme, pursuant to pay out of dividend would fall to the extent of the payout and statutory levy (if applicable). Past performance may or may not be sustained in future.The Face Value - 10.00 Per UnitThe Financial Solution(s) stated above is ONLY for highlighting the many advantages perceived from investments in Mutual Funds but does not in any manner, indicate or imply, either the quality of any particular Scheme or guarantee any specific performance/returns.For more details on dividends declared please refer to the online empower on www.mutualfund.birlasunlife.com
Note: The exit load rate levied at the time of redemption/switch-out of units will be the rate prevailing at the time of allotment of the corresponding units. Customers may request for a separate Exit Load Applicability Report by calling our toll free numbers 1800-270-7000 / 1800-22-7000 or from any of our Investor Service Centers.
# Scheme Benchmark, ## Additional Benchmark, * As on start of period considered above.For SIP calculations above, the data assumes the investment of ` 10000/- on 1st day of every month or the subsequent working day. Load & Taxes are not considered for computation of returns. Performance for dividend option would assume reinvestment of tax free dividends declared at the then prevailing NAV. CAGR returns are computed after accounting for the cash flow by using XIRR method (investment internal rate of return).Where Benchmark returns are not available, they have not been shown. Past performance may or may not be sustained in future. Returns greater than 1 year period are compounded annualized. Dividends are assumed to be reinvested and bonus is adjusted. Load is not taken into consideration. For SIP returns, monthly investment of equal amounts invested on the 1st day of every month has been considered.
40
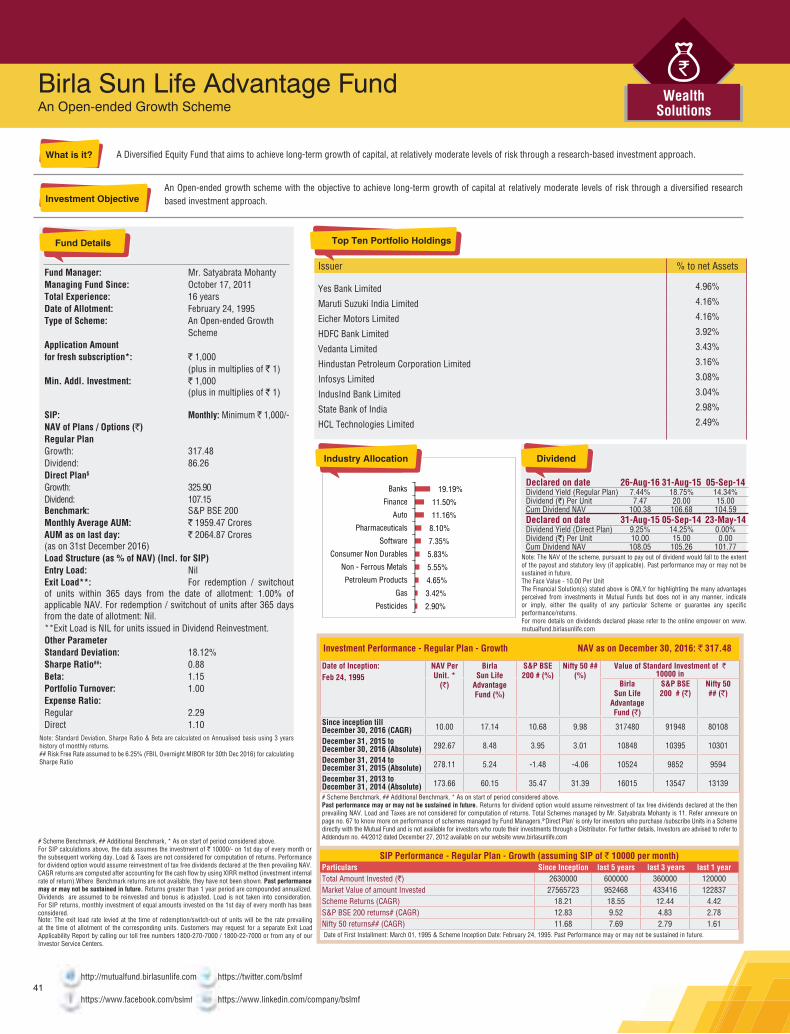
A Diversified Equity Fund that aims to achieve long-term growth of capital, at relatively moderate levels of risk through a research-based investment approach.
An Open-ended growth scheme with the objective to achieve long-term growth of capital at relatively moderate levels of risk through a diversified research based investment approach.
Fund Manager: Mr. Satyabrata MohantyManaging Fund Since: October 17, 2011Total Experience: 16 yearsDate of Allotment: February 24, 1995Type of Scheme: An Open-ended Growth SchemeApplication Amount for fresh subscription*: ` 1,000 (plus in multiplies of ` 1)Min. Addl. Investment: ` 1,000 (plus in multiplies of ` 1)
SIP: Monthly: Minimum ` 1,000/-NAV of Plans / Options (`)Regular Plan Growth: 317.48Dividend: 86.26Direct Plan$ Growth: 325.90Dividend: 107.15Benchmark: S&P BSE 200Monthly Average AUM: ` 1959.47 CroresAUM as on last day: ` 2064.87 Crores(as on 31st December 2016)Load Structure (as % of NAV) (Incl. for SIP)Entry Load: NilExit Load**: For redemption / switchout of units within 365 days from the date of allotment: 1.00% of applicable NAV. For redemption / switchout of units after 365 days from the date of allotment: Nil.**Exit Load is NIL for units issued in Dividend Reinvestment.Other ParameterStandard Deviation: 18.12%Sharpe Ratio##: 0.88Beta: 1.15Portfolio Turnover: 1.00Expense Ratio:Regular 2.29Direct 1.10
Birla Sun Life Advantage FundAn Open-ended Growth Scheme
Issuer % to net Assets
Yes Bank Limited 4.96%
Maruti Suzuki India Limited 4.16%
Eicher Motors Limited 4.16%
HDFC Bank Limited 3.92%
Vedanta Limited 3.43%
Hindustan Petroleum Corporation Limited 3.16%
Infosys Limited 3.08%
IndusInd Bank Limited 3.04%
State Bank of India 2.98%
HCL Technologies Limited 2.49%
Top Ten Portfolio Holdings
Investment Performance - Regular Plan - Growth NAV as on December 30, 2016: ` 317.48
Date of Inception: Feb 24, 1995
NAV Per Unit. *
(`)
BirlaSun Life
AdvantageFund (%)
S&P BSE200 # (%)
Nifty 50 ## (%)
Value of Standard Investment of ` 10000 in
BirlaSun Life
AdvantageFund (`)
S&P BSE200 # (`)
Nifty 50 ## (`)
Since inception till December 30, 2016 (CAGR) 10.00 17.14 10.68 9.98 317480 91948 80108
December 31, 2015 to December 30, 2016 (Absolute) 292.67 8.48 3.95 3.01 10848 10395 10301
December 31, 2014 toDecember 31, 2015 (Absolute) 278.11 5.24 -1.48 -4.06 10524 9852 9594
December 31, 2013 toDecember 31, 2014 (Absolute) 173.66 60.15 35.47 31.39 16015 13547 13139
# Scheme Benchmark, ## Additional Benchmark, * As on start of period considered above.Past performance may or may not be sustained in future. Returns for dividend option would assume reinvestment of tax free dividends declared at the then prevailing NAV. Load and Taxes are not considered for computation of returns. Total Schemes managed by Mr. Satyabrata Mohanty is 11. Refer annexure on page no. 67 to know more on performance of schemes managed by Fund Managers.$‘Direct Plan’ is only for investors who purchase /subscribe Units in a Scheme directly with the Mutual Fund and is not available for investors who route their investments through a Distributor. For further details, Investors are advised to refer to Addendum no. 44/2012 dated December 27, 2012 available on our website www.birlasunlife.com
SIP Performance - Regular Plan - Growth (assuming SIP of ` 10000 per month)Particulars Since Inception last 5 years last 3 years last 1 yearTotal Amount Invested (`) 2630000 600000 360000 120000Market Value of amount Invested 27565723 952468 433416 122837Scheme Returns (CAGR) 18.21 18.55 12.44 4.42S&P BSE 200 returns# (CAGR) 12.83 9.52 4.83 2.78Nifty 50 returns## (CAGR) 11.68 7.69 2.79 1.61Date of First Installment: March 01, 1995 & Scheme Inception Date: February 24, 1995. Past Performance may or may not be sustained in future.
Note: Standard Deviation, Sharpe Ratio & Beta are calculated on Annualised basis using 3 years history of monthly returns.## Risk Free Rate assumed to be 6.25% (FBIL Overnight MIBOR for 30th Dec 2016) for calculating Sharpe Ratio
2.90%
3.42%
4.65%
5.55%
5.83%
7.35%
8.10%
11.16%
11.50%
19.19%
Pesticides
Gas
Petroleum Products
Non - Ferrous Metals
Consumer Non Durables
Software
Pharmaceuticals
Auto
Finance
Banks
Declared on date 26-Aug-16 31-Aug-15 05-Sep-14Dividend Yield (Regular Plan) 7.44% 18.75% 14.34%Dividend (`) Per Unit 7.47 20.00 15.00Cum Dividend NAV 100.38 106.68 104.59Declared on date 31-Aug-15 05-Sep-14 23-May-14Dividend Yield (Direct Plan) 9.25% 14.25% 0.00%Dividend (`) Per Unit 10.00 15.00 0.00Cum Dividend NAV 108.05 105.26 101.77
Note: The NAV of the scheme, pursuant to pay out of dividend would fall to the extent of the payout and statutory levy (if applicable). Past performance may or may not be sustained in future.The Face Value - 10.00 Per UnitThe Financial Solution(s) stated above is ONLY for highlighting the many advantages perceived from investments in Mutual Funds but does not in any manner, indicate or imply, either the quality of any particular Scheme or guarantee any specific performance/returns.For more details on dividends declared please refer to the online empower on www.mutualfund.birlasunlife.com
Note: The exit load rate levied at the time of redemption/switch-out of units will be the rate prevailing at the time of allotment of the corresponding units. Customers may request for a separate Exit Load Applicability Report by calling our toll free numbers 1800-270-7000 / 1800-22-7000 or from any of our Investor Service Centers.
# Scheme Benchmark, ## Additional Benchmark, * As on start of period considered above.For SIP calculations above, the data assumes the investment of ` 10000/- on 1st day of every month or the subsequent working day. Load & Taxes are not considered for computation of returns. Performance for dividend option would assume reinvestment of tax free dividends declared at the then prevailing NAV. CAGR returns are computed after accounting for the cash flow by using XIRR method (investment internal rate of return).Where Benchmark returns are not available, they have not been shown. Past performance may or may not be sustained in future. Returns greater than 1 year period are compounded annualized. Dividends are assumed to be reinvested and bonus is adjusted. Load is not taken into consideration. For SIP returns, monthly investment of equal amounts invested on the 1st day of every month has been considered.
http://mutualfund.birlasunlife.com https://twitter.com/bslmf
https://www.facebook.com/bslmf https://www.linkedin.com/company/bslmf41

The fund that invests in securities of multinational companies in order to achieve long-term growth of capital with relatively moderate levels of risk.
An Open-ended growth scheme with the objective to achieve long-term growth of capital at relatively moderate levels of risk by making investments in securities of multi-national companies through a research based investment approach.
Fund Manager: Mr. Ajay GargManaging Fund Since: June 18, 2009Total Experience: 22 yearsDate of Allotment: December 27, 1999Type of Scheme: An Open-ended Growth SchemeApplication Amount for fresh subscription*: ` 1,000 (plus in multiplies of ` 1)Min. Addl. Investment: ` 1,000 (plus in multiplies of ` 1)
SIP: Monthly: Minimum ` 1,000/-NAV of Plans / Options (`)Regular Plan Growth: 569.91Dividend: 142.27Direct Plan$ Growth: 590.35Dividend: 200.22Benchmark: Nifty MNCMonthly Average AUM: ` 3093.39 CroresAUM as on last day: ` 3128.48 Crores(as on 31st December 2016)Load Structure (as % of NAV) (Incl. for SIP)Entry Load: NilExit Load**: 1% if redeemed /switchedout within 365 days from the date of allotment. Nil if redeemed /switched after 365 days from the date of allotment.**Exit Load is NIL for units issued in Dividend Reinvestment.Other ParameterStandard Deviation: 17.72%Sharpe Ratio##: 1.04Beta: 0.91Portfolio Turnover: 0.08Expense Ratio:Regular 2.21Direct 1.05
Birla Sun Life MNC FundAn Open-ended Growth Scheme
Issuer % to net Assets
Bayer Cropscience Limited 8.36%
Bosch Limited 7.89%
Gillette India Limited 7.62%
ICRA Limited 7.11%
Pfizer Limited 6.60%
Honeywell Automation India Limited 6.50%
Maruti Suzuki India Limited 6.46%
GlaxoSmithKline Pharmaceuticals Limited 5.95%
Kotak Mahindra Bank Limited 4.83%
Johnson Controls – Hitachi Air Conditioning India Limited 4.60%
Top Ten Portfolio Holdings
Investment Performance - Regular Plan - Growth NAV as on December 30, 2016: ` 569.91
Date of Inception: Dec 27, 1999
NAV Per Unit. *
(`)
Birla SunLife MNCFund (%)
Nifty MNC # (%)
Nifty 50 ## (%)
Value of Standard Investment of ` 10000 in
Birla SunLife MNCFund (`)
Nifty MNC # (`)
Nifty 50 ## (`)
Since inception till December 30, 2016 (CAGR) 36.11 17.60 10.58 10.78 157826 55354 57159
December 31, 2015 to December 30, 2016 (Absolute) 591.40 -3.63 1.15 3.01 9637 10115 10301
December 31, 2014 toDecember 31, 2015 (Absolute) 502.89 17.60 7.45 -4.06 11760 10745 9594
December 31, 2013 toDecember 31, 2014 (Absolute) 294.26 70.90 42.47 31.39 17090 14247 13139
# Scheme Benchmark, ## Additional Benchmark, * As on start of period considered above.Past performance may or may not be sustained in future. Returns for dividend option would assume reinvestment of tax free dividends declared at the then prevailing NAV. Load and Taxes are not considered for computation of returns. Total Schemes managed by Mr. Ajay Garg is 8. Refer annexure on page no. 67 to know more on performance of schemes managed by Fund Managers. $‘Direct Plan’ is only for investors who purchase /subscribe Units in a Scheme directly with the Mutual Fund and is not available for investors who route their investments through a Distributor. For further details, Investors are advised to refer to Addendum no. 44/2012 dated December 27, 2012 available on our website www.birlasunlife.com
SIP Performance - Regular Plan - Growth (assuming SIP of ` 10000 per month)Particulars Since Inception last 5 years last 3 years last 1 yearTotal Amount Invested (`) 2050000 600000 360000 120000Market Value of amount Invested 15662855 999640 433562 117169Scheme Returns (CAGR) 20.89 20.54 12.46 -4.35Nifty MNC returns# (CAGR) 13.90 12.96 7.60 3.34Nifty 50 returns## (CAGR) 12.33 7.69 2.79 1.61Date of First Installment: January 01, 2000 & Scheme Inception Date: December 27, 1999 . Past Performance may or may not be sustained in future.
3.95%
4.83%
6.32%
6.96%
7.41%
8.36%
9.25%
12.24%
12.79%
17.91%
Services
Banks
Consumer Durables
Auto
Industrial Capital Goods
Pesticides
Auto Ancillaries
Finance
Pharmaceuticals
Consumer Non Durables
Note: Standard Deviation, Sharpe Ratio & Beta are calculated on Annualised basis using 3 years history of monthly returns.## Risk Free Rate assumed to be 6.25% (FBIL Overnight MIBOR for 30th Dec 2016) for calculating Sharpe Ratio
Declared on date 09-Oct-15 22-Apr-15 20-Nov-14Dividend Yield (Regular Plan) 6.33% 6.02% 3.89%Dividend (`) Per Unit 10.00 10.00 5.50Cum Dividend NAV 158.07 166.22 141.24
Note: The NAV of the scheme, pursuant to pay out of dividend would fall to the extent of the payout and statutory levy (if applicable). Past performance may or may not be sustained in future.The Face Value - 10.00 Per UnitThe Financial Solution(s) stated above is ONLY for highlighting the many advantages perceived from investments in Mutual Funds but does not in any manner, indicate or imply, either the quality of any particular Scheme or guarantee any specific performance/returns.For more details on dividends declared please refer to the online empower on www.mutualfund.birlasunlife.com
Note: The exit load rate levied at the time of redemption/switch-out of units will be the rate prevailing at the time of allotment of the corresponding units. Customers may request for a separate Exit Load Applicability Report by calling our toll free numbers 1800-270-7000 / 1800-22-7000 or from any of our Investor Service Centers.
# Scheme Benchmark, ## Additional Benchmark, * As on start of period considered above.For SIP calculations above, the data assumes the investment of ` 10000/- on 1st day of every month or the subsequent working day. Load & Taxes are not considered for computation of returns. Performance for dividend option would assume reinvestment of tax free dividends declared at the then prevailing NAV. CAGR returns are computed after accounting for the cash flow by using XIRR method (investment internal rate of return).Where Benchmark returns are not available, they have not been shown. Past performance may or may not be sustained in future. Returns greater than 1 year period are compounded annualized. Dividends are assumed to be reinvested and bonus is adjusted. Load is not taken into consideration. For SIP returns, monthly investment of equal amounts invested on the 1st day of every month has been considered.
42

A fund that provides an opportunity to invest in midsized companies which can be potential leaders of tomorrow.
An Open ended Growth Scheme with the objective to achieve long term growth of capital at controlled level of risk by investing primarily in ‘Mid-Cap’ Stocks. The level of risk is somewhat higher than a fund focused on large and liquid stocks. Concomitantly, the aim is to generate higher returns than a fund focused on large and liquid stocks.
Fund Manager: Mr. Jayesh GandhiManaging Fund Since: January 01, 2015Total Experience: 15 yearsDate of Allotment: October 03, 2002Type of Scheme: An Open-ended Growth SchemeApplication Amount for fresh subscription*: ` 1,000 (plus in multiplies of ` 1)Min. Addl. Investment: ` 1,000 (plus in multiplies of ` 1)
SIP: Monthly: Minimum ` 1,000/-NAV of Plans / Options (`)Regular Plan Growth: 234.55Dividend: 30.43Direct Plan$ Growth: 242.01Dividend: 45.50Benchmark: Nifty Free Float Midcap 100Monthly Average AUM: ` 1711.04 CroresAUM as on last day: ` 1707.74 Crores(as on 31st December 2016)Load Structure (as % of NAV) (Incl. for SIP)Entry Load: NilExit Load**: For redemption/switch outof units within 365 days from the date of allotment:1.00% of applicable NAV. For redemption/switch out of units after 365 days from the date of allotment: Nil**Exit Load is NIL for units issued in Dividend Reinvestment.Other ParameterStandard Deviation: 18.15%Sharpe Ratio##: 1.10Beta: 0.99Portfolio Turnover: 0.61Expense Ratio:Regular 2.31Direct 1.38
Birla Sun Life Midcap FundAn Open-ended Growth Scheme
Issuer % to net Assets
Tube Investments of India Limited 2.98%
Mahindra CIE Automotive Limited 2.69%
KEC International Limited 2.61%
Gujarat State Petronet Limited 2.60%
The Federal Bank Limited 2.43%
Bajaj Finserv Limited 2.36%
Aurobindo Pharma Limited 2.35%
Hindustan Petroleum Corporation Limited 2.33%
LIC Housing Finance Limited 2.29%
MRF Limited 2.18%
Top Ten Portfolio Holdings
Investment Performance - Regular Plan - Growth NAV as on December 30, 2016: ` 234.55
Date of Inception: Oct 03, 2002
NAV Per Unit. *
(`)
Birla SunLife Midcap
Fund (%)
Nifty FreeFloat
Midcap 100 # (%)
Nifty 50 ## (%)
Value of Standard Investment of ` 10000 in
BirlaSun LifeMidcapFund (`)
Nifty FreeFloat
Midcap 100 # (`)
Nifty 50 ## (`)
Since inception till December 30, 2016 (CAGR) 10.00 24.78 21.45 16.33 234550 159519 86330
December 31, 2015 to December 30, 2016 (Absolute) 221.98 5.66 7.13 3.01 10566 10713 10301
December 31, 2014 toDecember 31, 2015 (Absolute) 201.13 10.37 6.46 -4.06 11037 10646 9594
December 31, 2013 toDecember 31, 2014 (Absolute) 116.54 72.58 55.91 31.39 17258 15591 13139
# Scheme Benchmark, ## Additional Benchmark, * As on start of period considered above.Past performance may or may not be sustained in future. Returns for dividend option would assume reinvestment of tax free dividends declared at the then prevailing NAV. Load and Taxes are not considered for computation of returns. Total Schemes managed by Mr. Jayesh Gandhi is 5. Refer annexure on page no. 67 to know more on performance of schemes managed by Fund Managers.$‘Direct Plan’ is only for investors who purchase /subscribe Units in a Scheme directly with the Mutual Fund and is not available for investors who route their investments through a Distributor. For further details, Investors are advised to refer to Addendum no. 44/2012 dated December 27, 2012 available on our website www.birlasunlife.com
SIP Performance - Regular Plan - Growth (assuming SIP of ` 10000 per month)Particulars Since Inception last 5 years last 3 years last 1 yearTotal Amount Invested (`) 1710000 600000 360000 120000Market Value of amount Invested 8188772 983941 447071 123603Scheme Returns (CAGR) 19.91 19.89 14.60 5.63Nifty Free Float Midcap 100 returns# (CAGR) 15.86 15.99 12.28 6.42Nifty 50 returns## (CAGR) 11.74 7.69 2.79 1.61Date of First Installment: November 01, 2002 & Scheme Inception Date: October 03, 2002 . Past Performance may or may not be sustained in future.
4.42%
4.45%
4.60%
4.74%
5.07%
5.16%
7.48%
7.63%
8.10%
14.78%
Petroleum Products
Consumer Durables
Construction
Cement
Consumer Non Durables
Auto Ancillaries
Industrial Products
Banks
Pharmaceuticals
Finance
Note: Standard Deviation, Sharpe Ratio & Beta are calculated on Annualised basis using 3 years history of monthly returns.## Risk Free Rate assumed to be 6.25% (FBIL Overnight MIBOR for 30th Dec 2016) for calculating Sharpe Ratio
Declared on date 31-Aug-16 28-Aug-15 24-Jul-14Dividend Yield (Regular Plan) 7.82% 10.94% 8.72%Dividend (`) Per Unit 2.80 3.75 2.50Cum Dividend NAV 35.79 34.29 28.67
Note: The NAV of the scheme, pursuant to pay out of dividend would fall to the extent of the payout and statutory levy (if applicable). Past performance may or may not be sustained in future.The Face Value - 10.00 Per UnitThe Financial Solution(s) stated above is ONLY for highlighting the many advantages perceived from investments in Mutual Funds but does not in any manner, indicate or imply, either the quality of any particular Scheme or guarantee any specific performance/returns.For more details on dividends declared please refer to the online empower on www.mutualfund.birlasunlife.com
Note: The exit load rate levied at the time of redemption/switch-out of units will be the rate prevailing at the time of allotment of the corresponding units. Customers may request for a separate Exit Load Applicability Report by calling our toll free numbers 1800-270-7000 / 1800-22-7000 or from any of our Investor Service Centers.
# Scheme Benchmark, ## Additional Benchmark, * As on start of period considered above.For SIP calculations above, the data assumes the investment of ` 10000/- on 1st day of every month or the subsequent working day. Load & Taxes are not considered for computation of returns. Performance for dividend option would assume reinvestment of tax free dividends declared at the then prevailing NAV. CAGR returns are computed after accounting for the cash flow by using XIRR method (investment internal rate of return).Where Benchmark returns are not available, they have not been shown. Past performance may or may not be sustained in future. Returns greater than 1 year period are compounded annualized. Dividends are assumed to be reinvested and bonus is adjusted. Load is not taken into consideration. For SIP returns, monthly investment of equal amounts invested on the 1st day of every month has been considered.
http://mutualfund.birlasunlife.com https://twitter.com/bslmf
https://www.facebook.com/bslmf https://www.linkedin.com/company/bslmf43
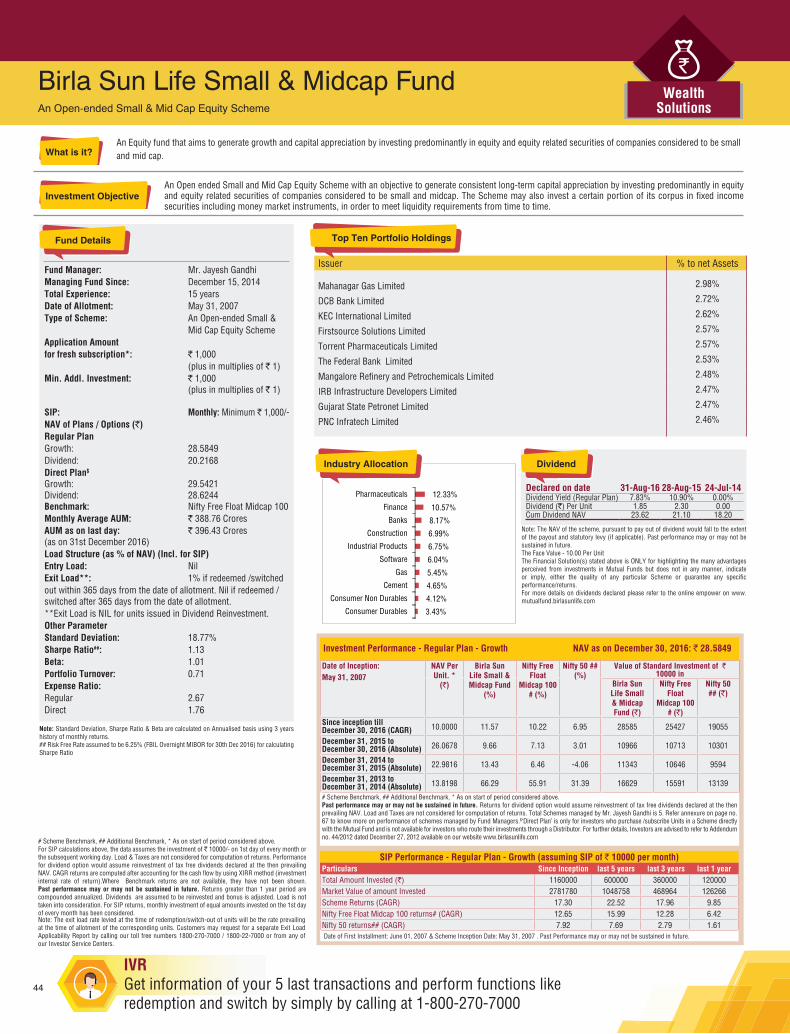
An Equity fund that aims to generate growth and capital appreciation by investing predominantly in equity and equity related securities of companies considered to be small and mid cap.
An Open ended Small and Mid Cap Equity Scheme with an objective to generate consistent long-term capital appreciation by investing predominantly in equity and equity related securities of companies considered to be small and midcap. The Scheme may also invest a certain portion of its corpus in fixed income securities including money market instruments, in order to meet liquidity requirements from time to time.
Fund Manager: Mr. Jayesh GandhiManaging Fund Since: December 15, 2014Total Experience: 15 yearsDate of Allotment: May 31, 2007Type of Scheme: An Open-ended Small & Mid Cap Equity SchemeApplication Amount for fresh subscription*: ` 1,000 (plus in multiplies of ` 1)Min. Addl. Investment: ` 1,000 (plus in multiplies of ` 1)
SIP: Monthly: Minimum ` 1,000/-NAV of Plans / Options (`)Regular Plan Growth: 28.5849Dividend: 20.2168Direct Plan$ Growth: 29.5421Dividend: 28.6244Benchmark: Nifty Free Float Midcap 100Monthly Average AUM: ` 388.76 CroresAUM as on last day: ` 396.43 Crores(as on 31st December 2016)Load Structure (as % of NAV) (Incl. for SIP)Entry Load: NilExit Load**: 1% if redeemed /switchedout within 365 days from the date of allotment. Nil if redeemed /switched after 365 days from the date of allotment.**Exit Load is NIL for units issued in Dividend Reinvestment.Other ParameterStandard Deviation: 18.77%Sharpe Ratio##: 1.13Beta: 1.01Portfolio Turnover: 0.71Expense Ratio:Regular 2.67Direct 1.76
Birla Sun Life Small & Midcap FundAn Open-ended Small & Mid Cap Equity Scheme
Issuer % to net Assets
Mahanagar Gas Limited 2.98%
DCB Bank Limited 2.72%
KEC International Limited 2.62%
Firstsource Solutions Limited 2.57%
Torrent Pharmaceuticals Limited 2.57%
The Federal Bank Limited 2.53%
Mangalore Refinery and Petrochemicals Limited 2.48%
IRB Infrastructure Developers Limited 2.47%
Gujarat State Petronet Limited 2.47%
PNC Infratech Limited 2.46%
Top Ten Portfolio Holdings
Investment Performance - Regular Plan - Growth NAV as on December 30, 2016: ` 28.5849
Date of Inception: May 31, 2007
NAV Per Unit. *
(`)
Birla SunLife Small &Midcap Fund
(%)
Nifty FreeFloat
Midcap 100 # (%)
Nifty 50 ## (%)
Value of Standard Investment of ` 10000 in
Birla SunLife Small& MidcapFund (`)
Nifty FreeFloat
Midcap 100 # (`)
Nifty 50 ## (`)
Since inception till December 30, 2016 (CAGR) 10.0000 11.57 10.22 6.95 28585 25427 19055
December 31, 2015 to December 30, 2016 (Absolute) 26.0678 9.66 7.13 3.01 10966 10713 10301
December 31, 2014 toDecember 31, 2015 (Absolute) 22.9816 13.43 6.46 -4.06 11343 10646 9594
December 31, 2013 toDecember 31, 2014 (Absolute) 13.8198 66.29 55.91 31.39 16629 15591 13139
# Scheme Benchmark, ## Additional Benchmark, * As on start of period considered above.Past performance may or may not be sustained in future. Returns for dividend option would assume reinvestment of tax free dividends declared at the then prevailing NAV. Load and Taxes are not considered for computation of returns. Total Schemes managed by Mr. Jayesh Gandhi is 5. Refer annexure on page no. 67 to know more on performance of schemes managed by Fund Managers.$‘Direct Plan’ is only for investors who purchase /subscribe Units in a Scheme directly with the Mutual Fund and is not available for investors who route their investments through a Distributor. For further details, Investors are advised to refer to Addendum no. 44/2012 dated December 27, 2012 available on our website www.birlasunlife.com
SIP Performance - Regular Plan - Growth (assuming SIP of ` 10000 per month)Particulars Since Inception last 5 years last 3 years last 1 yearTotal Amount Invested (`) 1160000 600000 360000 120000Market Value of amount Invested 2781780 1048758 468964 126266Scheme Returns (CAGR) 17.30 22.52 17.96 9.85Nifty Free Float Midcap 100 returns# (CAGR) 12.65 15.99 12.28 6.42Nifty 50 returns## (CAGR) 7.92 7.69 2.79 1.61Date of First Installment: June 01, 2007 & Scheme Inception Date: May 31, 2007 . Past Performance may or may not be sustained in future.
3.43%
4.12%
4.65%
5.45%
6.04%
6.75%
6.99%
8.17%
10.57%
12.33%
Consumer Durables
Consumer Non Durables
Cement
Gas
Software
Industrial Products
Construction
Banks
Finance
Pharmaceuticals
Note: Standard Deviation, Sharpe Ratio & Beta are calculated on Annualised basis using 3 years history of monthly returns.## Risk Free Rate assumed to be 6.25% (FBIL Overnight MIBOR for 30th Dec 2016) for calculating Sharpe Ratio
Declared on date 31-Aug-16 28-Aug-15 24-Jul-14Dividend Yield (Regular Plan) 7.83% 10.90% 0.00%Dividend (`) Per Unit 1.85 2.30 0.00Cum Dividend NAV 23.62 21.10 18.20
Note: The NAV of the scheme, pursuant to pay out of dividend would fall to the extent of the payout and statutory levy (if applicable). Past performance may or may not be sustained in future.The Face Value - 10.00 Per UnitThe Financial Solution(s) stated above is ONLY for highlighting the many advantages perceived from investments in Mutual Funds but does not in any manner, indicate or imply, either the quality of any particular Scheme or guarantee any specific performance/returns.For more details on dividends declared please refer to the online empower on www.mutualfund.birlasunlife.com
Note: The exit load rate levied at the time of redemption/switch-out of units will be the rate prevailing at the time of allotment of the corresponding units. Customers may request for a separate Exit Load Applicability Report by calling our toll free numbers 1800-270-7000 / 1800-22-7000 or from any of our Investor Service Centers.
# Scheme Benchmark, ## Additional Benchmark, * As on start of period considered above.For SIP calculations above, the data assumes the investment of ` 10000/- on 1st day of every month or the subsequent working day. Load & Taxes are not considered for computation of returns. Performance for dividend option would assume reinvestment of tax free dividends declared at the then prevailing NAV. CAGR returns are computed after accounting for the cash flow by using XIRR method (investment internal rate of return).Where Benchmark returns are not available, they have not been shown. Past performance may or may not be sustained in future. Returns greater than 1 year period are compounded annualized. Dividends are assumed to be reinvested and bonus is adjusted. Load is not taken into consideration. For SIP returns, monthly investment of equal amounts invested on the 1st day of every month has been considered.
44

An Open ended Diversified Equity fund that follows value investing strategy to generate consistent long-term capital appreciation.
An Open ended Diversified Equity Scheme with the objective to generate consistent long-term capital appreciation by investing predominantly in equity and equity related securities by following value investing strategy.
Fund Manager: Mr. Mahesh Patil & Mr. Milind BafnaManaging Fund Since: January 16, 2014Total Experience: 24 years & 15 yearsDate of Allotment: March 27, 2008Type of Scheme: An Open-ended Diversified Equity SchemeApplication Amount for fresh subscription*: ` 1,000 (plus in multiplies of ` 1)Min. Addl. Investment: ` 1,000 (plus in multiplies of ` 1)
SIP: Monthly: Minimum ` 1,000/-NAV of Plans / Options (`)Regular Plan Growth: 43.4218Dividend: 25.8758Direct Plan$ Growth: 44.8244Dividend: 39.2331Benchmark: S&P BSE 200Monthly Average AUM: ` 674.91 CroresAUM as on last day: ` 692.67 Crores(as on 31st December 2016)Load Structure (as % of NAV) (Incl. for SIP)Entry Load: NilExit Load**: For redemption/switch out of units within 365 days from the date of allotment: 1.00% of applicable NAV. For redemption/switch out of units after 365 days from the date of allotment: Nil**Exit Load is NIL for units issued in Dividend Reinvestment.Other ParameterStandard Deviation: 24.13%Sharpe Ratio##: 1.03Beta: 1.40Portfolio Turnover: 2.22Expense Ratio:Regular 2.59Direct 1.63
Birla Sun Life Pure Value FundAn Open-ended Diversified Equity Scheme
Issuer % to net Assets
Atul Limited 4.02%
GAIL (India) Limited 3.74%
UPL Limited 3.74%
Sintex Industries Limited 3.44%
Hindustan Petroleum Corporation Limited 3.44%
Indraprastha Gas Limited 3.31%
Kaveri Seed Company Limited 3.16%
Gulf Oil Lubricants India Limited 3.15%
Glenmark Pharmaceuticals Limited 3.12%
Gujarat Fluorochemicals Limited 2.76%
Top Ten Portfolio Holdings
Investment Performance - Regular Plan - Growth NAV as on December 30, 2016: ` 43.4218
Date of Inception: Mar 27, 2008
NAV Per Unit. *
(`)
Birla SunLife Pure
Value Fund (%)
S&P BSE200 # (%)
Nifty 50 ## (%)
Value of Standard Investment of ` 10000 in
Birla SunLife Pure
Value Fund (`)
S&P BSE200 # (`)
Nifty 50 ## (`)
Since inception till December 30, 2016 (CAGR) 10.0000 18.23 6.89 6.20 43422 17930 16947
December 31, 2015 to December 30, 2016 (Absolute) 39.8389 8.99 3.95 3.01 10899 10395 10301
December 31, 2014 toDecember 31, 2015 (Absolute) 38.2510 4.15 -1.48 -4.06 10415 9852 9594
December 31, 2013 toDecember 31, 2014 (Absolute) 19.2215 99.00 35.47 31.39 19900 13547 13139
# Scheme Benchmark, ## Additional Benchmark, * As on start of period considered above.Past performance may or may not be sustained in future. Returns for dividend option would assume reinvestment of tax free dividends declared at the then prevailing NAV. Load and Taxes are not considered for computation of returns. Total Schemes Co-Managed by Fund Managers is 3. Total Schemes managed by Mr. Mahesh Patil is 8. Total Schemes managed by Mr. Milind Bafna is 4. Refer annexure on page no. 67 to know more on performance of schemes managed by Fund Managers. $‘Direct Plan’ is only for investors who purchase /subscribe Units in a Scheme directly with the Mutual Fund and is not available for investors who route their investments through a Distributor. For further details, Investors are advised to refer to Addendum no. 44/2012 dated December 27, 2012 available on our website www.birlasunlife.com
SIP Performance - Regular Plan - Growth (assuming SIP of ` 10000 per month)Particulars Since Inception last 5 years last 3 years last 1 yearTotal Amount Invested (`) 1060000 600000 360000 120000Market Value of amount Invested 2750013 1088795 456950 125730Scheme Returns (CAGR) 20.75 24.08 16.13 8.99S&P BSE 200 returns# (CAGR) 9.52 9.52 4.83 2.78Nifty 50 returns## (CAGR) 8.44 7.69 2.79 1.61Date of First Installment: April 01, 2008 & Scheme Inception Date: March 27, 2008. Past Performance may or may not be sustained in future.This scheme is jointly managed with Mr. Milind Bafna.
3.57%
3.71%
3.74%
4.44%
5.33%
8.02%
9.43%
9.64%
10.31%
16.02%
Finance
Power
Pesticides
Software
Consumer Non Durables
Textile Products
Petroleum Products
Gas
Chemicals
Pharmaceuticals
Note: Standard Deviation, Sharpe Ratio & Beta are calculated on Annualised basis using 3 years history of monthly returns.## Risk Free Rate assumed to be 6.25% (FBIL Overnight MIBOR for 30th Dec 2016) for calculating Sharpe Ratio
Declared on date 22-Jul-16 24-Jul-15 31-Jul-14Dividend Yield (Regular Plan) 7.87% 10.43% 10.69%Dividend (`) Per Unit 2.20 3.00 2.80Cum Dividend NAV 27.94 28.75 26.19
Note: The NAV of the scheme, pursuant to pay out of dividend would fall to the extent of the payout and statutory levy (if applicable). Past performance may or may not be sustained in future.The Face Value - 10.00 Per UnitThe Financial Solution(s) stated above is ONLY for highlighting the many advantages perceived from investments in Mutual Funds but does not in any manner, indicate or imply, either the quality of any particular Scheme or guarantee any specific performance/returns.For more details on dividends declared please refer to the online empower on www.mutualfund.birlasunlife.com
Note: The exit load rate levied at the time of redemption/switch-out of units will be the rate prevailing at the time of allotment of the corresponding units. Customers may request for a separate Exit Load Applicability Report by calling our toll free numbers 1800-270-7000 / 1800-22-7000 or from any of our Investor Service Centers.
# Scheme Benchmark, ## Additional Benchmark, * As on start of period considered above.For SIP calculations above, the data assumes the investment of ` 10000/- on 1st day of every month or the subsequent working day. Load & Taxes are not considered for computation of returns. Performance for dividend option would assume reinvestment of tax free dividends declared at the then prevailing NAV. CAGR returns are computed after accounting for the cash flow by using XIRR method (investment internal rate of return).Where Benchmark returns are not available, they have not been shown. Past performance may or may not be sustained in future. Returns greater than 1 year period are compounded annualized. Dividends are assumed to be reinvested and bonus is adjusted. Load is not taken into consideration. For SIP returns, monthly investment of equal amounts invested on the 1st day of every month has been considered.
http://mutualfund.birlasunlife.com https://twitter.com/bslmf
https://www.facebook.com/bslmf https://www.linkedin.com/company/bslmf45

India’s first Manufacturing Oriented Fund, it is a thematic strategy geared to benefit from Indian economy’s next big leap – Resurgence of the Indian manufacturing sector.
The primary investment objective of the Schemes is to generate long-term capital appreciation to unit holders from a portfolio that is invested predominantly in equity and equity related securities of companies engaged in Manufacturing activity. The Scheme does not guarantee/indicate any returns. There can be no assurance that the schemes’ objectives will be achieved.
Fund Manager: Mr. Anil ShahManaging Fund Since: Since InceptionTotal Experience: 26 yearsDate of Allotment: January 31, 2015Type of Scheme: An Open ended Manufacturing Sector SchemeApplication Amount for fresh subscription*: ` 1,000 (plus in multiplies of ` 1)Min. Addl. Investment: ` 1,000 (plus in multiplies of ` 1)
SIP: Monthly: Minimum ` 1,000/-NAV of Plans / Options (`)Regular Plan Growth: 10.82Dividend: 10.82Direct Plan$ Growth: 11.02Dividend: 11.05Benchmark: S&P BSE 500Monthly Average AUM: ` 749.45 CroresAUM as on last day: ` 744.74 Crores(as on 31st December 2016)Load Structure (as % of NAV) (Incl. for SIP)Entry Load: NilExit Load**: For redemption/switch outof units within 365 days from the date of allotment: 1.00% of applicable NAV. For redemption/switch out of units after 365 days from the date of allotment: Nil.**Exit Load is NIL for units issued in Dividend Reinvestment.Other ParameterPortfolio Turnover: 0.22Expense Ratio:Regular 2.43Direct 1.35
Birla Sun Life Manufacturing Equity FundAn Open ended Manufacturing Sector Scheme
Issuer % to net Assets
Maruti Suzuki India Limited 7.50%
Tata Chemicals Limited 6.60%
Vedanta Limited 3.77%
ITC Limited 3.76%
Hindustan Zinc Limited 3.57%
Bharat Electronics Limited 3.01%
MRF Limited 2.96%
Sun Pharmaceuticals Industries Limited 2.94%
Eicher Motors Limited 2.93%
Dishman Pharmaceuticals and Chemicals Limited 2.91%
Top Ten Portfolio Holdings
Investment Performance - Regular Plan - Growth NAV as on December 30, 2016: ` 10.82
Date of Inception: Jan 31, 2015
NAV Per Unit. *
(`)
Birla Sun LifeManufacturing
Equity Fund (%)
S&P BSE500 # (%)
Nifty 50 ## (%)
Value of Standard Investment of ` 10000 in
Birla Sun LifeManufacturingEquity Fund (`)
S&P BSE500 # (`)
Nifty 50 ## (`)
Since inception till December 30, 2016 (CAGR) 10.00 4.20 -1.44 -3.76 10820 9727 9293
December 31, 2015 to December 30, 2016 (Absolute) 9.91 9.18 3.78 3.01 10918 10378 10301
# Scheme Benchmark, ## Additional Benchmark, * As on start of period considered above.Past performance may or may not be sustained in future. Returns for dividend option would assume reinvestment of tax free dividends declared at the then prevailing NAV. Load and Taxes are not considered for computation of returns. Total Schemes managed by Anil Shah is 8. Refer annexure on page no. 67 to know more on performance of schemes managed by Fund Managers. $‘Direct Plan’ is only for investors who purchase /subscribe Units in a Scheme directly with the Mutual Fund and is not available for investors who route their investments through a Distributor. For further details, Investors are advised to refer to Addendum no. 44/2012 dated December 27, 2012 available on our website www.birlasunlife.com
SIP Performance - Regular Plan - Growth (assuming SIP of ` 10000 per month)Particulars Since Inception last 1 yearTotal Amount Invested (`) 230000 120000Market Value of amount Invested 244644 125922Scheme Returns (CAGR) 6.33 9.30S&P BSE 500 returns# (CAGR) 1.34 3.05Nifty 50 returns## (CAGR) -0.38 1.61Date of First Installment: February 01, 2015 & Scheme Inception Date: January 31, 2015 . Past Performance may or may not be sustained in future.
3.67%
3.72%
5.52%
5.80%
7.23%
7.35%
9.37%
10.85%
15.80%
18.39%
Industrial Capital Goods
Construction Project
Industrial Products
Auto Ancillaries
Chemicals
Non - Ferrous Metals
Cement
Pharmaceuticals
Auto
Consumer Non Durables
Note: The exit load rate levied at the time of redemption/switch-out of units will be the rate prevailing at the time of allotment of the corresponding units. Customers may request for a separate Exit Load Applicability Report by calling our toll free numbers 1800-270-7000 / 1800-22-7000 or from any of our Investor Service Centers.
# Scheme Benchmark, ## Additional Benchmark, * As on start of period considered above.For SIP calculations above, the data assumes the investment of ` 10000/- on 1st day of every month or the subsequent working day. Load & Taxes are not considered for computation of returns. Performance for dividend option would assume reinvestment of tax free dividends declared at the then prevailing NAV. CAGR returns are computed after accounting for the cash flow by using XIRR method (investment internal rate of return).Where Benchmark returns are not available, they have not been shown. Past performance may or may not be sustained in future. Returns greater than 1 year period are compounded annualized. Dividends are assumed to be reinvested and bonus is adjusted. Load is not taken into consideration. For SIP returns, monthly investment of equal amounts invested on the 1st day of every month has been considered.
46

A fund that aims to generate growth and capital appreciation by building a portfolio that predominantly invest in the Banking and Financial Services related companies in India.
The primary investment objective of the Scheme is to generate long-term capital appreciation to unit holders from a portfolio that is invested predominantly in equity and equity related securities of companies engaged in banking and financial services. The Scheme does not guarantee/indicate any returns. There can be no assurance that the schemes’ objectives will be achieved.
Fund Manager: Mr. Satyabrata Mohanty & Mr. Dhaval GalaManaging Fund Since: Since Inception & August 26, 2015Total Experience: 16 years & 9 yearsDate of Allotment: December 14, 2013Type of Scheme: An Open ended Banking & Financial Services Sector SchemeApplication Amount for fresh subscription*: ` 1,000 (plus in multiplies of ` 1)Min. Addl. Investment: ` 1,000 (plus in multiplies of ` 1)
SIP: Monthly: Minimum ` 1,000/-NAV of Plans / Options (`)Regular Plan Growth: 19.00Dividend: 14.81Direct Plan$ Growth: 19.49Dividend: 16.51Benchmark: Nifty Financial ServicesMonthly Average AUM: ` 764.49 CroresAUM as on last day: ` 770.09 Crores(as on 31st December 2016)Load Structure (as % of NAV) (Incl. for SIP)Entry Load: NilExit Load**: For redemption/switch outof units within 365 days from the date of allotment: 1.00% of applicable NAV. For redemption/switch out of units after 365 daysfrom the date of allotment: Nil**Exit Load is NIL for units issued in Dividend Reinvestment.Other ParameterStandard Deviation: 23.00%Sharpe Ratio##: 0.77Beta: 1.06Portfolio Turnover: 0.28Expense Ratio:Regular 2.57Direct 1.69
Birla Sun Life Banking and Financial Services FundAn Open ended Banking & Financial Services Sector Scheme
Issuer % to net Assets
HDFC Bank Limited 10.96%
Yes Bank Limited 10.46%
ICICI Bank Limited 8.33%
Bajaj Finance Limited 6.83%
IndusInd Bank Limited 6.41%
State Bank of India 6.17%
Equitas Holdings Limited 4.99%
Repco Home Finance Limited 4.35%
Bank of Baroda 4.25%
L&T Finance Holdings Limited 4.23%
Top Ten Portfolio Holdings
Investment Performance - Regular Plan - Growth NAV as on December 30, 2016: ` 19.00
Date of Inception: Dec 14, 2013
NAV Per Unit. *
(`)
Birla SunLife Bankingand Financial
ServicesFund (%)
NiftyFinancialServices #
(%)
Nifty 50 ## (%)
Value of Standard Investment of ` 10000 in
Birla SunLife Bankingand Financial
ServicesFund (`)
NiftyFinancialServices
# (`)
Nifty 50 ## (`)
Since inception till December 30, 2016 (CAGR) 10.00 23.45 15.91 9.73 19000 15682 13271
December 31, 2015 to December 30, 2016 (Absolute) 16.42 15.71 4.93 3.01 11571 10493 10301
December 31, 2014 toDecember 31, 2015 (Absolute) 16.51 -0.55 -5.41 -4.06 9945 9459 9594
December 31, 2013 toDecember 31, 2014 (Absolute) 9.96 65.76 57.34 31.39 16576 15734 13139
# Scheme Benchmark, ## Additional Benchmark, * As on start of period considered above.Past performance may or may not be sustained in future. Returns for dividend option would assume reinvestment of tax free dividends declared at the then prevailing NAV. Load and Taxes are not considered for computation of returns. Total Schemes Co-Managed by Fund Managers is 1. Total Schemes managed by Mr. Satyabrata Mohanty is 11. Total Scheme managed by Mr. Dhaval Gala is 1. Refer annexure on page no. 67 to know more on performance of schemes managed by Fund Managers. $‘Direct Plan’ is only for investors who purchase /subscribe Units in a Scheme directly with the Mutual Fund and is not available for investors who route their investments through a Distributor. For further details, Investors are advised to refer to Addendum no. 44/2012 dated December 27, 2012 available on our website www.birlasunlife.com
SIP Performance - Regular Plan - Growth (assuming SIP of ` 10000 per month)Particulars Since Inception last 3 years last 1 yearTotal Amount Invested (`) 370000 360000 120000Market Value of amount Invested 466496 447496 124027Scheme Returns (CAGR) 15.22 14.66 6.30Nifty Financial Services returns# (CAGR) 7.49 6.94 6.04Nifty 50 returns## (CAGR) 3.19 2.79 1.61Date of First Installment: January 01, 2014 & Scheme Inception Date: December 14, 2013. Past Performance may or may not be sustained in future
0.09%
8.03%
39.88%
52.00%
Net receivables / payables
Cash & Current Assets
Finance
Banks
Declared on date 29-Dec-15Dividend Yield (Regular Plan) 7.93%Dividend (`) Per Unit 1.10Cum Dividend NAV 13.87
Note: The NAV of the scheme, pursuant to pay out of dividend would fall to the extent of the payout and statutory levy (if applicable). Past performance may or may not be sustained in future.The Face Value - 10.00 Per UnitThe Financial Solution(s) stated above is ONLY for highlighting the many advantages perceived from investments in Mutual Funds but does not in any manner, indicate or imply, either the quality of any particular Scheme or guarantee any specific performance/returns.For more details on dividends declared please refer to the online empower on www.mutualfund.birlasunlife.com
Note: The exit load rate levied at the time of redemption/switch-out of units will be the rate prevailing at the time of allotment of the corresponding units. Customers may request for a separate Exit Load Applicability Report by calling our toll free numbers 1800-270-7000 / 1800-22-7000 or from any of our Investor Service Centers.
# Scheme Benchmark, ## Additional Benchmark, * As on start of period considered above.For SIP calculations above, the data assumes the investment of ` 10000/- on 1st day of every month or the subsequent working day. Load & Taxes are not considered for computation of returns. Performance for dividend option would assume reinvestment of tax free dividends declared at the then prevailing NAV. CAGR returns are computed after accounting for the cash flow by using XIRR method (investment internal rate of return).Where Benchmark returns are not available, they have not been shown. Past performance may or may not be sustained in future. Returns greater than 1 year period are compounded annualized. Dividends are assumed to be reinvested and bonus is adjusted. Load is not taken into consideration. For SIP returns, monthly investment of equal amounts invested on the 1st day of every month has been considered.
http://mutualfund.birlasunlife.com https://twitter.com/bslmf
https://www.facebook.com/bslmf https://www.linkedin.com/company/bslmf47
Note: Standard Deviation, Sharpe Ratio & Beta are calculated on Annualised basis using 3 years history of monthly returns.## Risk Free Rate assumed to be 6.25% (FBIL Overnight MIBOR for 30th Dec 2016) for calculating Sharpe Ratio

A fund that invests in high dividend paying companies across market cap which typically have steady cash flow generation.
An Open-ended growth scheme with the objective to provide capital growth and income by investing primarily in a well-diversified portfolio of dividend paying companies that have a relatively high dividend yield.
Fund Manager: Mr. Satyabrata Mohanty & Mr. Vineet MalooManaging Fund Since: July 16, 2015 & January 16, 2014Total Experience: 16 years & 11 yearsDate of Allotment: February 26, 2003Type of Scheme: An Open-ended Growth SchemeApplication Amount for fresh subscription*: ` 1,000 (plus in multiplies of ` 1)Min. Addl. Investment: ` 1,000 (plus in multiplies of ` 1)
SIP: Monthly: Minimum ` 1,000/-NAV of Plans / Options (`)Regular Plan Growth: 138.64Dividend: 14.63Direct Plan$ Growth: 143.00Dividend: 20.57Benchmark: Nifty 500Monthly Average AUM: ` 976.48 CroresAUM as on last day: ` 966.19 Crores(as on 31st December 2016)Load Structure (as % of NAV) (Incl. for SIP)Entry Load: NilExit Load**: In respect of each purchase / switch-in of Units, upto 15% of the units may be redeemed / switched-out without any exit load from the date of allotment.Any redemption in excess of the above limit shall be subject to the following exit load: For redemption / switch-out of units on or before 365 days from the date of allotment: 1.00% of applicable NAV. For redemption / switch-out of units after 365 daysfrom the date of allotment: Nil. (w.e.f October 10, 2016)**Exit Load is NIL for units issued in Dividend Reinvestment.Other ParameterStandard Deviation: 16.38%Sharpe Ratio##: 0.52Beta: 1.05Portfolio Turnover: 0.82Expense Ratio:Regular 2.31Direct 1.51
Birla Sun Life Dividend Yield PlusAn Open-ended Growth Scheme
Issuer % to net Assets
ICICI Bank Limited 5.76%
Vedanta Limited 4.07%
Hindustan Petroleum Corporation Limited 4.02%
Sanofi India Limited 3.56%
State Bank of India 3.37%
Axis Bank Limited 2.72%
Orient Cement Limited 2.61%
Hindustan Zinc Limited 2.59%
Tech Mahindra Limited 2.53%
Dhanuka Agritech Limited 2.48%
Top Ten Portfolio Holdings
Investment Performance - Regular Plan - Growth NAV as on December 30, 2016: ` 138.64
Date of Inception: Feb 26, 2003
NAV Per Unit. *
(`)
Birla SunLife DividendYield Plus (%)
Nifty 500 # (%)
Nifty 50 ## (%)
Value of Standard Investment of ` 10000 in
BirlaSun LifeDividend
Yield Plus (`)
Nifty 500 # (`)
Nifty 50 ## (`)
Since inception till December 30, 2016 (CAGR) 10.00 20.90 17.44 15.98 138640 92745 77986
December 31, 2015 to December 30, 2016 (Absolute) 135.12 2.61 3.84 3.01 10261 10384 10301
December 31, 2014 toDecember 31, 2015 (Absolute) 142.99 -5.50 -0.72 -4.06 9450 9928 9594
December 31, 2013 toDecember 31, 2014 (Absolute) 91.76 55.83 37.82 31.39 15583 13782 13139
# Scheme Benchmark, ## Additional Benchmark, * As on start of period considered above.Past performance may or may not be sustained in future. Returns for dividend option would assume reinvestment of tax free dividends declared at the then prevailing NAV. Load and Taxes are not considered for computation of returns. Total Schemes Co-Managed by Fund Managers is 3. Total Schemes managed by Mr. Satyabrata Mohanty is 11. Total Schemes managed by Mr. Vineet Maloo is 18. Refer annexure on page no. 67 to know more on performance of schemes managed by Fund Managers. $‘Direct Plan’ is only for investors who purchase /subscribe Units in a Scheme directly with the Mutual Fund and is not available for investors who route their investments through a Distributor. For further details, Investors are advised to refer to Addendum no. 44/2012 dated December 27, 2012 available on our website www.birlasunlife.com
SIP Performance - Regular Plan - Growth (assuming SIP of ` 10000 per month)Particulars Since Inception last 5 years last 3 years last 1 yearTotal Amount Invested (`) 1670000 600000 360000 120000Market Value of amount Invested 5210618 783545 391967 122674Scheme Returns (CAGR) 15.08 10.62 5.61 4.17Nifty 500 returns# (CAGR) 11.97 10.12 5.36 3.01Nifty 50 returns## (CAGR) 11.31 7.69 2.79 1.61Date of First Installment: March 01, 2003 & Scheme Inception Date: February 26, 2003 . Past Performance may or may not be sustained in future.This scheme is jointly managed with Mr. Vineet Maloo.
Note: Standard Deviation, Sharpe Ratio & Beta are calculated on Annualised basis using 3 years history of monthly returns.## Risk Free Rate assumed to be 6.25% (FBIL Overnight MIBOR for 30th Dec 2016) for calculating Sharpe Ratio
4.50%
4.51%
4.95%
5.78%
6.48%
6.66%
6.74%
8.69%
9.49%
15.96%
Cement
Media & Entertainment
Consumer Non Durables
Finance
Software
Non - Ferrous Metals
Industrial Products
Pharmaceuticals
Petroleum Products
Banks
Declared on date 30-Dec-16 26-Sep-16 24-Jun-16Dividend Yield (Regular Plan) 1.50% 1.59% 1.27%Dividend (`) Per Unit 0.22 0.25 0.18Cum Dividend NAV 14.63 15.73 14.15
Note: The NAV of the scheme, pursuant to pay out of dividend would fall to the extent of the payout and statutory levy (if applicable). Past performance may or may not be sustained in future.The Face Value - 10.00 Per UnitThe Financial Solution(s) stated above is ONLY for highlighting the many advantages perceived from investments in Mutual Funds but does not in any manner, indicate or imply, either the quality of any particular Scheme or guarantee any specific performance/returns.For more details on dividends declared please refer to the online empower on www.mutualfund.birlasunlife.com
Note: The exit load rate levied at the time of redemption/switch-out of units will be the rate prevailing at the time of allotment of the corresponding units. Customers may request for a separate Exit Load Applicability Report by calling our toll free numbers 1800-270-7000 / 1800-22-7000 or from any of our Investor Service Centers.
# Scheme Benchmark, ## Additional Benchmark, * As on start of period considered above.For SIP calculations above, the data assumes the investment of ` 10000/- on 1st day of every month or the subsequent working day. Load & Taxes are not considered for computation of returns. Performance for dividend option would assume reinvestment of tax free dividends declared at the then prevailing NAV. CAGR returns are computed after accounting for the cash flow by using XIRR method (investment internal rate of return).Where Benchmark returns are not available, they have not been shown. Past performance may or may not be sustained in future. Returns greater than 1 year period are compounded annualized. Dividends are assumed to be reinvested and bonus is adjusted. Load is not taken into consideration. For SIP returns, monthly investment of equal amounts invested on the 1st day of every month has been considered.
48

A Fund that endeavors to generate long term growth by identifying stocks that may have the potential for special situation like buy backs, open offers, demerger, etc. and a contrarian investment style.
An Open-ended diversified equity scheme with an objective of the scheme is to generate long-term growth of capital by investing in a portfolio of equity and equity related securities. The Scheme would follow an investment strategy that would take advantage of Special Situations & Contrarian investment style.
Fund Manager: Mr. Satyabrata MohantyManaging Fund Since: October 05, 2016Total Experience: 16 yearsDate of Allotment: January 31, 2008Type of Scheme: An Open-ended Diversified Equity SchemeApplication Amount for fresh subscription*: ` 1,000 (plus in multiplies of ` 1)Min. Addl. Investment: ` 1,000 (plus in multiplies of ` 1)
SIP: Monthly: Minimum ` 1,000/-NAV of Plans / Options (`)Regular Plan Growth: 19.1236Dividend: 14.7526Direct Plan$ Growth: 19.5935Dividend: 19.5796Benchmark: S&P BSE 200Monthly Average AUM: ` 136.33 CroresAUM as on last day: ` 136.15 Crores(as on 31st December 2016)Load Structure (as % of NAV) (Incl. for SIP)Entry Load: NilExit Load**: 1% if redeemed /switchedout within 365 days from the date of allotment. Nil if redeemed /switched after 365 days from the date of allotment.**Exit Load is NIL for units issued in Dividend Reinvestment.Other ParameterStandard Deviation: 19.86%Sharpe Ratio##: 0.86Beta: 1.25Portfolio Turnover: 1.11Expense Ratio:Regular 2.73Direct 2.03
Birla Sun Life Special Situations FundAn Open-ended Diversified Equity Scheme
Issuer % to net Assets
HDFC Bank Limited 4.43%
IndusInd Bank Limited 4.39%
Infosys Limited 4.08%
ITC Limited 4.08%
Yes Bank Limited 3.82%
Tech Mahindra Limited 3.77%
UPL Limited 3.68%
HCL Technologies Limited 3.32%
Tata Motors Limited 2.60%
Maruti Suzuki India Limited 2.54%
Top Ten Portfolio Holdings
Investment Performance - Regular Plan - Growth NAV as on December 30, 2016: ` 19.1236
Date of Inception: Jan 31, 2008
NAV Per Unit. *
(`)
Birla SunLife SpecialSituationsFund (%)
S&P BSE200 # (%)
Nifty 50 ## (%)
Value of Standard Investment of ` 10000 in
Birla SunLife SpecialSituationsFund (`)
S&P BSE200 # (`)
Nifty 50 ## (`)
Since inception till December 30, 2016 (CAGR) 10.0000 7.54 5.22 5.36 19124 15742 15934
December 31, 2015 to December 30, 2016 (Absolute) 17.8267 7.28 3.95 3.01 10728 10395 10301
December 31, 2014 toDecember 31, 2015 (Absolute) 16.5266 7.87 -1.48 -4.06 10787 9852 9594
December 31, 2013 toDecember 31, 2014 (Absolute) 10.2102 61.86 35.47 31.39 16186 13547 13139
# Scheme Benchmark, ## Additional Benchmark, * As on start of period considered above.Past performance may or may not be sustained in future. Returns for dividend option would assume reinvestment of tax free dividends declared at the then prevailing NAV. Load and Taxes are not considered for computation of returns. Total Schemes managed by Mr. Satyabrata Mohanty is 11. Refer annexure on page no. 67 to know more on performance of schemes managed by Fund Managers. $‘Direct Plan’ is only for investors who purchase /subscribe Units in a Scheme directly with the Mutual Fund and is not available for investors who route their investments through a Distributor. For further details, Investors are advised to refer to Addendum no. 44/2012 dated December 27, 2012 available on our website www.birlasunlife.com
SIP Performance - Regular Plan - Growth (assuming SIP of ` 10000 per month)Particulars Since Inception last 5 years last 3 years last 1 yearTotal Amount Invested (`) 1080000 600000 360000 120000Market Value of amount Invested 2050469 944826 440070 126289Scheme Returns (CAGR) 13.77 18.22 13.50 9.88S&P BSE 200 returns# (CAGR) 9.32 9.52 4.83 2.78Nifty 50 returns## (CAGR) 8.30 7.69 2.79 1.61Date of First Installment: February 01, 2008 & Scheme Inception Date: January 31, 2008. Past Performance may or may not be sustained in future.
3.25%
3.66%
3.68%
6.12%
6.13%
6.58%
6.94%
8.81%
12.02%
20.42%
Gas
Petroleum Products
Pesticides
Chemicals
Pharmaceuticals
Auto
Finance
Consumer Non Durables
Software
Banks
Note: Standard Deviation, Sharpe Ratio & Beta are calculated on Annualised basis using 3 years history of monthly returns.## Risk Free Rate assumed to be 6.25% (FBIL Overnight MIBOR for 30th Dec 2016) for calculating Sharpe Ratio
Declared on date 26-Sep-16 29-Sep-15 28-Aug-14Dividend Yield (Regular Plan) 7.87% 8.17% 8.92%Dividend (`) Per Unit 1.37 1.30 1.30Cum Dividend NAV 17.41 15.91 14.57
Note: The NAV of the scheme, pursuant to pay out of dividend would fall to the extent of the payout and statutory levy (if applicable). Past performance may or may not be sustained in future.The Face Value - 10.00 Per UnitThe Financial Solution(s) stated above is ONLY for highlighting the many advantages perceived from investments in Mutual Funds but does not in any manner, indicate or imply, either the quality of any particular Scheme or guarantee any specific performance/returns.For more details on dividends declared please refer to the online empower on www.mutualfund.birlasunlife.com
Note: The exit load rate levied at the time of redemption/switch-out of units will be the rate prevailing at the time of allotment of the corresponding units. Customers may request for a separate Exit Load Applicability Report by calling our toll free numbers 1800-270-7000 / 1800-22-7000 or from any of our Investor Service Centers.
# Scheme Benchmark, ## Additional Benchmark, * As on start of period considered above.For SIP calculations above, the data assumes the investment of ` 10000/- on 1st day of every month or the subsequent working day. Load & Taxes are not considered for computation of returns. Performance for dividend option would assume reinvestment of tax free dividends declared at the then prevailing NAV. CAGR returns are computed after accounting for the cash flow by using XIRR method (investment internal rate of return).Where Benchmark returns are not available, they have not been shown. Past performance may or may not be sustained in future. Returns greater than 1 year period are compounded annualized. Dividends are assumed to be reinvested and bonus is adjusted. Load is not taken into consideration. For SIP returns, monthly investment of equal amounts invested on the 1st day of every month has been considered.
http://mutualfund.birlasunlife.com https://twitter.com/bslmf
https://www.facebook.com/bslmf https://www.linkedin.com/company/bslmf49
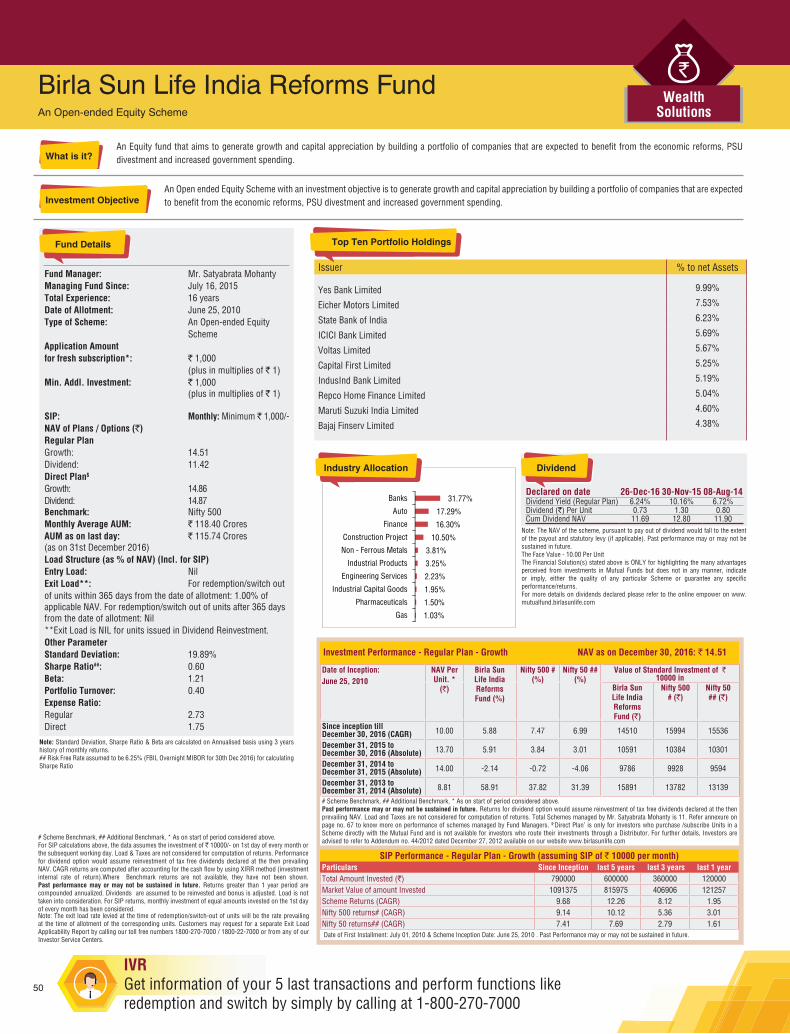
An Equity fund that aims to generate growth and capital appreciation by building a portfolio of companies that are expected to benefit from the economic reforms, PSU divestment and increased government spending.
An Open ended Equity Scheme with an investment objective is to generate growth and capital appreciation by building a portfolio of companies that are expected to benefit from the economic reforms, PSU divestment and increased government spending.
Fund Manager: Mr. Satyabrata MohantyManaging Fund Since: July 16, 2015Total Experience: 16 yearsDate of Allotment: June 25, 2010Type of Scheme: An Open-ended Equity SchemeApplication Amount for fresh subscription*: ` 1,000 (plus in multiplies of ` 1)Min. Addl. Investment: ` 1,000 (plus in multiplies of ` 1)
SIP: Monthly: Minimum ` 1,000/-NAV of Plans / Options (`)Regular Plan Growth: 14.51Dividend: 11.42Direct Plan$ Growth: 14.86Dividend: 14.87Benchmark: Nifty 500Monthly Average AUM: ` 118.40 CroresAUM as on last day: ` 115.74 Crores(as on 31st December 2016)Load Structure (as % of NAV) (Incl. for SIP)Entry Load: NilExit Load**: For redemption/switch outof units within 365 days from the date of allotment: 1.00% of applicable NAV. For redemption/switch out of units after 365 days from the date of allotment: Nil**Exit Load is NIL for units issued in Dividend Reinvestment.Other ParameterStandard Deviation: 19.89%Sharpe Ratio##: 0.60Beta: 1.21Portfolio Turnover: 0.40Expense Ratio:Regular 2.73Direct 1.75
Birla Sun Life India Reforms FundAn Open-ended Equity Scheme
Issuer % to net Assets
Yes Bank Limited 9.99%
Eicher Motors Limited 7.53%
State Bank of India 6.23%
ICICI Bank Limited 5.69%
Voltas Limited 5.67%
Capital First Limited 5.25%
IndusInd Bank Limited 5.19%
Repco Home Finance Limited 5.04%
Maruti Suzuki India Limited 4.60%
Bajaj Finserv Limited 4.38%
Top Ten Portfolio Holdings
Investment Performance - Regular Plan - Growth NAV as on December 30, 2016: ` 14.51
Date of Inception: June 25, 2010
NAV Per Unit. *
(`)
Birla SunLife IndiaReformsFund (%)
Nifty 500 # (%)
Nifty 50 ## (%)
Value of Standard Investment of ` 10000 in
Birla SunLife IndiaReformsFund (`)
Nifty 500 # (`)
Nifty 50 ## (`)
Since inception till December 30, 2016 (CAGR) 10.00 5.88 7.47 6.99 14510 15994 15536
December 31, 2015 to December 30, 2016 (Absolute) 13.70 5.91 3.84 3.01 10591 10384 10301
December 31, 2014 toDecember 31, 2015 (Absolute) 14.00 -2.14 -0.72 -4.06 9786 9928 9594
December 31, 2013 toDecember 31, 2014 (Absolute) 8.81 58.91 37.82 31.39 15891 13782 13139
# Scheme Benchmark, ## Additional Benchmark, * As on start of period considered above.Past performance may or may not be sustained in future. Returns for dividend option would assume reinvestment of tax free dividends declared at the then prevailing NAV. Load and Taxes are not considered for computation of returns. Total Schemes managed by Mr. Satyabrata Mohanty is 11. Refer annexure on page no. 67 to know more on performance of schemes managed by Fund Managers. $‘Direct Plan’ is only for investors who purchase /subscribe Units in a Scheme directly with the Mutual Fund and is not available for investors who route their investments through a Distributor. For further details, Investors are advised to refer to Addendum no. 44/2012 dated December 27, 2012 available on our website www.birlasunlife.com
SIP Performance - Regular Plan - Growth (assuming SIP of ` 10000 per month)Particulars Since Inception last 5 years last 3 years last 1 yearTotal Amount Invested (`) 790000 600000 360000 120000Market Value of amount Invested 1091375 815975 406906 121257Scheme Returns (CAGR) 9.68 12.26 8.12 1.95Nifty 500 returns# (CAGR) 9.14 10.12 5.36 3.01Nifty 50 returns## (CAGR) 7.41 7.69 2.79 1.61Date of First Installment: July 01, 2010 & Scheme Inception Date: June 25, 2010 . Past Performance may or may not be sustained in future.
1.03%
1.50%
1.95%
2.23%
3.25%
3.81%
10.50%
16.30%
17.29%
31.77%
Gas
Pharmaceuticals
Industrial Capital Goods
Engineering Services
Industrial Products
Non - Ferrous Metals
Construction Project
Finance
Auto
Banks
Note: Standard Deviation, Sharpe Ratio & Beta are calculated on Annualised basis using 3 years history of monthly returns.## Risk Free Rate assumed to be 6.25% (FBIL Overnight MIBOR for 30th Dec 2016) for calculating Sharpe Ratio
Declared on date 26-Dec-16 30-Nov-15 08-Aug-14Dividend Yield (Regular Plan) 6.24% 10.16% 6.72%Dividend (`) Per Unit 0.73 1.30 0.80Cum Dividend NAV 11.69 12.80 11.90
Note: The NAV of the scheme, pursuant to pay out of dividend would fall to the extent of the payout and statutory levy (if applicable). Past performance may or may not be sustained in future.The Face Value - 10.00 Per UnitThe Financial Solution(s) stated above is ONLY for highlighting the many advantages perceived from investments in Mutual Funds but does not in any manner, indicate or imply, either the quality of any particular Scheme or guarantee any specific performance/returns.For more details on dividends declared please refer to the online empower on www.mutualfund.birlasunlife.com
Note: The exit load rate levied at the time of redemption/switch-out of units will be the rate prevailing at the time of allotment of the corresponding units. Customers may request for a separate Exit Load Applicability Report by calling our toll free numbers 1800-270-7000 / 1800-22-7000 or from any of our Investor Service Centers.
# Scheme Benchmark, ## Additional Benchmark, * As on start of period considered above.For SIP calculations above, the data assumes the investment of ` 10000/- on 1st day of every month or the subsequent working day. Load & Taxes are not considered for computation of returns. Performance for dividend option would assume reinvestment of tax free dividends declared at the then prevailing NAV. CAGR returns are computed after accounting for the cash flow by using XIRR method (investment internal rate of return).Where Benchmark returns are not available, they have not been shown. Past performance may or may not be sustained in future. Returns greater than 1 year period are compounded annualized. Dividends are assumed to be reinvested and bonus is adjusted. Load is not taken into consideration. For SIP returns, monthly investment of equal amounts invested on the 1st day of every month has been considered.
50
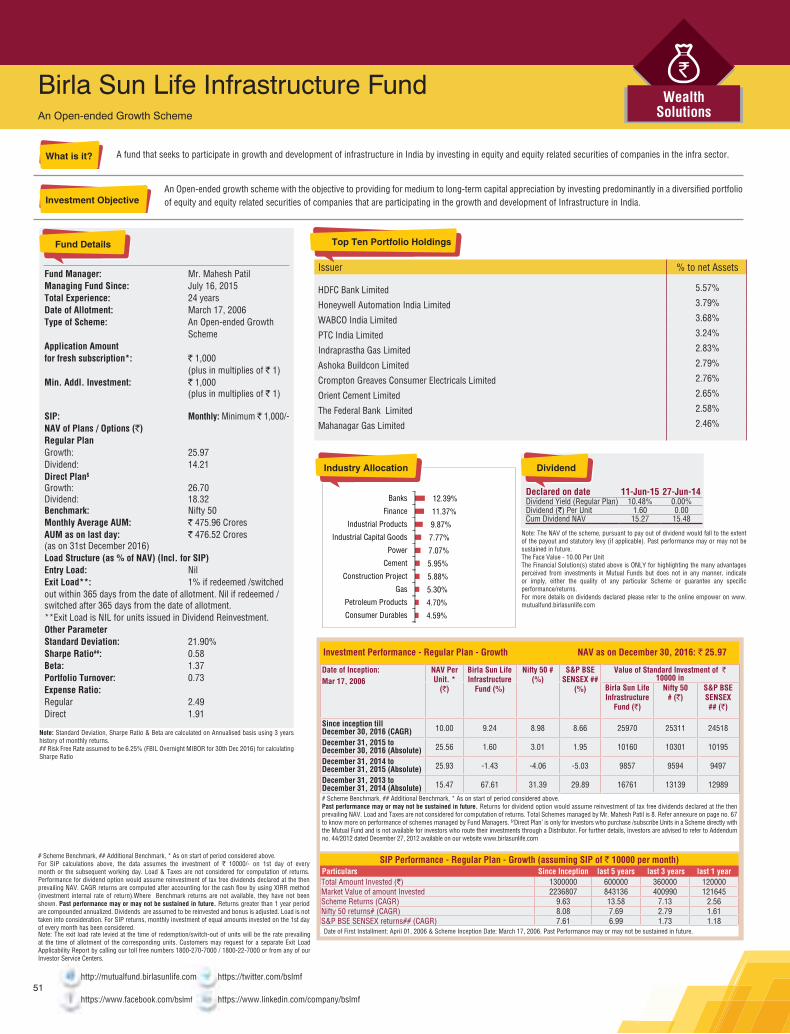
A fund that seeks to participate in growth and development of infrastructure in India by investing in equity and equity related securities of companies in the infra sector.
An Open-ended growth scheme with the objective to providing for medium to long-term capital appreciation by investing predominantly in a diversified portfolio of equity and equity related securities of companies that are participating in the growth and development of Infrastructure in India.
Fund Manager: Mr. Mahesh PatilManaging Fund Since: July 16, 2015Total Experience: 24 yearsDate of Allotment: March 17, 2006Type of Scheme: An Open-ended Growth SchemeApplication Amount for fresh subscription*: ` 1,000 (plus in multiplies of ` 1)Min. Addl. Investment: ` 1,000 (plus in multiplies of ` 1)
SIP: Monthly: Minimum ` 1,000/-NAV of Plans / Options (`)Regular Plan Growth: 25.97Dividend: 14.21Direct Plan$ Growth: 26.70Dividend: 18.32Benchmark: Nifty 50Monthly Average AUM: ` 475.96 CroresAUM as on last day: ` 476.52 Crores(as on 31st December 2016)Load Structure (as % of NAV) (Incl. for SIP)Entry Load: NilExit Load**: 1% if redeemed /switchedout within 365 days from the date of allotment. Nil if redeemed /switched after 365 days from the date of allotment.**Exit Load is NIL for units issued in Dividend Reinvestment.Other ParameterStandard Deviation: 21.90%Sharpe Ratio##: 0.58Beta: 1.37Portfolio Turnover: 0.73Expense Ratio:Regular 2.49Direct 1.91
Birla Sun Life Infrastructure FundAn Open-ended Growth Scheme
Issuer % to net Assets
HDFC Bank Limited 5.57%
Honeywell Automation India Limited 3.79%
WABCO India Limited 3.68%
PTC India Limited 3.24%
Indraprastha Gas Limited 2.83%
Ashoka Buildcon Limited 2.79%
Crompton Greaves Consumer Electricals Limited 2.76%
Orient Cement Limited 2.65%
The Federal Bank Limited 2.58%
Mahanagar Gas Limited 2.46%
Top Ten Portfolio Holdings
Investment Performance - Regular Plan - Growth NAV as on December 30, 2016: ` 25.97
Date of Inception: Mar 17, 2006
NAV Per Unit. *
(`)
Birla Sun LifeInfrastructure
Fund (%)
Nifty 50 # (%)
S&P BSESENSEX ##
(%)
Value of Standard Investment of ` 10000 in
Birla Sun LifeInfrastructure
Fund (`)
Nifty 50 # (`)
S&P BSESENSEX ## (`)
Since inception till December 30, 2016 (CAGR) 10.00 9.24 8.98 8.66 25970 25311 24518
December 31, 2015 to December 30, 2016 (Absolute) 25.56 1.60 3.01 1.95 10160 10301 10195
December 31, 2014 toDecember 31, 2015 (Absolute) 25.93 -1.43 -4.06 -5.03 9857 9594 9497
December 31, 2013 toDecember 31, 2014 (Absolute) 15.47 67.61 31.39 29.89 16761 13139 12989
# Scheme Benchmark, ## Additional Benchmark, * As on start of period considered above.Past performance may or may not be sustained in future. Returns for dividend option would assume reinvestment of tax free dividends declared at the then prevailing NAV. Load and Taxes are not considered for computation of returns. Total Schemes managed by Mr. Mahesh Patil is 8. Refer annexure on page no. 67 to know more on performance of schemes managed by Fund Managers. $‘Direct Plan’ is only for investors who purchase /subscribe Units in a Scheme directly with the Mutual Fund and is not available for investors who route their investments through a Distributor. For further details, Investors are advised to refer to Addendum no. 44/2012 dated December 27, 2012 available on our website www.birlasunlife.com
SIP Performance - Regular Plan - Growth (assuming SIP of ` 10000 per month)Particulars Since Inception last 5 years last 3 years last 1 yearTotal Amount Invested (`) 1300000 600000 360000 120000Market Value of amount Invested 2236807 843136 400990 121645Scheme Returns (CAGR) 9.63 13.58 7.13 2.56Nifty 50 returns# (CAGR) 8.08 7.69 2.79 1.61S&P BSE SENSEX returns## (CAGR) 7.61 6.99 1.73 1.18Date of First Installment: April 01, 2006 & Scheme Inception Date: March 17, 2006. Past Performance may or may not be sustained in future.
4.59%
4.70%
5.30%
5.88%
5.95%
7.07%
7.77%
9.87%
11.37%
12.39%
Consumer Durables
Petroleum Products
Gas
Construction Project
Cement
Power
Industrial Capital Goods
Industrial Products
Finance
Banks
Note: Standard Deviation, Sharpe Ratio & Beta are calculated on Annualised basis using 3 years history of monthly returns.## Risk Free Rate assumed to be 6.25% (FBIL Overnight MIBOR for 30th Dec 2016) for calculating Sharpe Ratio
Declared on date 11-Jun-15 27-Jun-14Dividend Yield (Regular Plan) 10.48% 0.00%Dividend (`) Per Unit 1.60 0.00Cum Dividend NAV 15.27 15.48
Note: The NAV of the scheme, pursuant to pay out of dividend would fall to the extent of the payout and statutory levy (if applicable). Past performance may or may not be sustained in future.The Face Value - 10.00 Per UnitThe Financial Solution(s) stated above is ONLY for highlighting the many advantages perceived from investments in Mutual Funds but does not in any manner, indicate or imply, either the quality of any particular Scheme or guarantee any specific performance/returns.For more details on dividends declared please refer to the online empower on www.mutualfund.birlasunlife.com
Note: The exit load rate levied at the time of redemption/switch-out of units will be the rate prevailing at the time of allotment of the corresponding units. Customers may request for a separate Exit Load Applicability Report by calling our toll free numbers 1800-270-7000 / 1800-22-7000 or from any of our Investor Service Centers.
# Scheme Benchmark, ## Additional Benchmark, * As on start of period considered above.For SIP calculations above, the data assumes the investment of ` 10000/- on 1st day of every month or the subsequent working day. Load & Taxes are not considered for computation of returns. Performance for dividend option would assume reinvestment of tax free dividends declared at the then prevailing NAV. CAGR returns are computed after accounting for the cash flow by using XIRR method (investment internal rate of return).Where Benchmark returns are not available, they have not been shown. Past performance may or may not be sustained in future. Returns greater than 1 year period are compounded annualized. Dividends are assumed to be reinvested and bonus is adjusted. Load is not taken into consideration. For SIP returns, monthly investment of equal amounts invested on the 1st day of every month has been considered.
http://mutualfund.birlasunlife.com https://twitter.com/bslmf
https://www.facebook.com/bslmf https://www.linkedin.com/company/bslmf51

A thematic fund that invests in companies related to the IT sector like hardware, peripherals and components, software, telecom, media, internet and e-commerce and other technology enabled companies.
A multi-sector open-ended growth scheme with the objective of long term growth of capital, through a portfolio with a target allocation of 100% equity, focusing on investing in technology and technology dependent companies, hardware, peripherals and components, software, telecom, media, internet and e-commerce and other technology enabled companies. The secondary objective is income generation and distribution of dividend.
Fund Manager: Mr. Kunal SangoiManaging Fund Since: January 16, 2014Total Experience: 8 yearsDate of Allotment: January 15, 2000Type of Scheme: An Open-ended Growth SchemeApplication Amount for fresh subscription*: ` 1,000 (plus in multiplies of ` 1)Min. Addl. Investment: ` 1,000 (plus in multiplies of ` 1)
SIP: Monthly: Minimum ` 1,000/-NAV of Plans / Options (`)Regular Plan Growth: 35.30Dividend: 16.75Direct Plan$ Growth: 36.31Dividend: 18.61Benchmark: S&P BSE TeckMonthly Average AUM: ` 64.62 CroresAUM as on last day: ` 65.94 Crores(as on 31st December 2016)Load Structure (as % of NAV) (Incl. for SIP)Entry Load: NilExit Load**: 1% if redeemed /switched out within 365 days from the date of allotment. Nil if redeemed /switched after 365 days from the date of allotment.**Exit Load is NIL for units issued in Dividend Reinvestment.Other ParameterStandard Deviation: 17.31%Sharpe Ratio##: 0.17Beta: 1.12Portfolio Turnover: 0.57Expense Ratio:Regular 2.74Direct 1.94
Birla Sun Life New Millennium FundAn Open-ended Growth Scheme
Issuer % to net Assets
Infosys Limited 32.18%
Tech Mahindra Limited 10.97%
HCL Technologies Limited 9.67%
NIIT Technologies Limited 6.96%
Sonata Software Limited 6.45%
Cyient Limited 6.32%
Tata Consultancy Services Limited 4.66%
INOX Leisure Limited 4.56%
Persistent Systems Limited 4.11%
KPIT Technologies Limited 3.67%
Top Ten Portfolio Holdings
Investment Performance - Regular Plan - Growth NAV as on December 30, 2016: ` 35.30
Date of Inception: Jan 15, 2000
NAV Per Unit. *
(`)
Birla SunLife New
MillenniumFund (%)
S&P BSETeck # (%)
Nifty 50 ## (%)
Value of Standard Investment of ` 10000 in
Birla SunLife New
MillenniumFund (`)
S&P BSETeck # (`)
Nifty 50 ## (`)
Since inception till December 30, 2016 (CAGR) 10.00 7.72 N/A 10.01 35300 N/A 50444
December 31, 2015 to December 30, 2016 (Absolute) 36.57 -3.47 -9.16 3.01 9653 9084 10301
December 31, 2014 toDecember 31, 2015 (Absolute) 32.88 11.22 3.61 -4.06 11122 10361 9594
December 31, 2013 toDecember 31, 2014 (Absolute) 27.15 21.10 15.65 31.39 12110 11565 13139
# Scheme Benchmark, ## Additional Benchmark, * As on start of period considered above.Past performance may or may not be sustained in future. Returns for dividend option would assume reinvestment of tax free dividends declared at the then prevailing NAV. Load and Taxes are not considered for computation of returns. When scheme benchmark returns are not available, they have not been shown.Total Schemes managed by Mr. Kunal Sangoi is 2. Refer annexure on page no. 67 to know more on performance of schemes managed by Fund Managers. $‘Direct Plan’ is only for investors who purchase /subscribe Units in a Scheme directly with the Mutual Fund and is not available for investors who route their investments through a Distributor. For further details, Investors are advised to refer to Addendum no. 44/2012 dated December 27, 2012 available on our website www.birlasunlife.com
SIP Performance - Regular Plan - Growth (assuming SIP of ` 10000 per month)Particulars Since Inception last 5 years last 3 years last 1 yearTotal Amount Invested (`) 2040000 600000 360000 120000Market Value of amount Invested 6838638 824241 386514 119913Scheme Returns (CAGR) 12.92 12.66 4.67 -0.13S&P BSE Teck returns# (CAGR) NA 6.32 -2.87 -11.20Nifty 50 returns## (CAGR) 12.34 7.69 2.79 1.61Date of First Installment: February 01, 2000 & Scheme Inception Date: January 15, 2000. Past Performance may or may not be sustained in future.
1.68%
9.01%
89.85%
Net receivables / payables
Cash & Current Assets
Media & Entertainment
Software
-0.55%
Note: Standard Deviation, Sharpe Ratio & Beta are calculated on Annualised basis using 3 years history of monthly returns.## Risk Free Rate assumed to be 6.25% (FBIL Overnight MIBOR for 30th Dec 2016) for calculating Sharpe Ratio
Declared on date 29-Jul-16 31-Jul-15 11-Sep-14Dividend Yield (Regular Plan) 7.00% 10.02% 8.04%Dividend (`) Per Unit 1.27 2.00 1.60Cum Dividend NAV 18.14 19.96 19.90
Note: The NAV of the scheme, pursuant to pay out of dividend would fall to the extent of the payout and statutory levy (if applicable). Past performance may or may not be sustained in future.The Face Value - 10.00 Per UnitThe Financial Solution(s) stated above is ONLY for highlighting the many advantages perceived from investments in Mutual Funds but does not in any manner, indicate or imply, either the quality of any particular Scheme or guarantee any specific performance/returns.For more details on dividends declared please refer to the online empower on www.mutualfund.birlasunlife.com
Note: The exit load rate levied at the time of redemption/switch-out of units will be the rate prevailing at the time of allotment of the corresponding units. Customers may request for a separate Exit Load Applicability Report by calling our toll free numbers 1800-270-7000 / 1800-22-7000 or from any of our Investor Service Centers.
# Scheme Benchmark, ## Additional Benchmark, * As on start of period considered above.For SIP calculations above, the data assumes the investment of ` 10000/- on 1st day of every month or the subsequent working day. Load & Taxes are not considered for computation of returns. Performance for dividend option would assume reinvestment of tax free dividends declared at the then prevailing NAV. CAGR returns are computed after accounting for the cash flow by using XIRR method (investment internal rate of return).Where Benchmark returns are not available, they have not been shown. Past performance may or may not be sustained in future. Returns greater than 1 year period are compounded annualized. Dividends are assumed to be reinvested and bonus is adjusted. Load is not taken into consideration. For SIP returns, monthly investment of equal amounts invested on the 1st day of every month has been considered.
52

A Fund that strives to benefit from the rising consumption pattern in India, fuelled by high disposable incomes of the young generation (Generation Next).
An Open-ended growth scheme with the objective to target growth of capital by investing in equity/equity related instruments of companies that are expected to benefit from the rising consumption patterns in India, which in turn is getting fuelled by high disposable incomes of the young generation (Generation Next). The scheme will invest in companies that have the following characteristics: 1. Companies that seek growth in revenues arising out of demand from the younger generation (GenNext) for their products or services. 2. They should be engaged in manufacturing of products or rendering of services that go directly to the consumer. 3. The products and services should have distinct brand identity, thereby enabling choice.
Birla Sun Life India GenNext FundAn Open-ended Growth Scheme
Fund Manager: Mr. Anil Shah & Mr. Chanchal KhandelwalManaging Fund Since: September 23, 2013 & August 26, 2015Total Experience: 26 years & 10 yearsDate of Allotment: August 05, 2005Type of Scheme: An Open-ended Growth SchemeApplication Amount for fresh subscription*: ` 1,000 (plus in multiplies of ` 1)Min. Addl. Investment: ` 1,000 (plus in multiplies of ` 1)
SIP: Monthly: Minimum ` 1,000/-NAV of Plans / Options (`)Regular Plan Growth: 58.25Dividend: 20.99Direct Plan$ Growth: 60.40Dividend: 23.60Benchmark: Nifty 50Monthly Average AUM: ` 448.76 CroresAUM as on last day: ` 455.21 Crores(as on 31st December 2016)Load Structure (as % of NAV) (Incl. for SIP)Entry Load: NilExit Load**: 1% if redeemed /switchedout within 365 days from the date of allotment. Nil if redeemed /switched after 365 days from the date of allotment.**Exit Load is NIL for units issued in Dividend Reinvestment.Other ParameterStandard Deviation: 15.03%Sharpe Ratio##: 0.94Beta: 0.94Portfolio Turnover: 0.40Expense Ratio:Regular 2.64Direct 1.48
Issuer % to net Assets
HDFC Bank Limited 5.30%
Maruti Suzuki India Limited 4.69%
ITC Limited 4.24%
Eicher Motors Limited 3.83%
IndusInd Bank Limited 3.68%
Kotak Mahindra Bank Limited 2.95%
Housing Development Finance Corporation Limited 2.84%
Yes Bank Limited 2.54%
Sun Pharmaceuticals Industries Limited 2.08%
Tata Motors Limited 2.07%
Top Ten Portfolio Holdings
Investment Performance - Regular Plan - Growth NAV as on December 30, 2016: ` 58.25
Date of Inception: Aug 05, 2005
NAV Per Unit. *
(`)
Birla SunLife IndiaGenNextFund (%)
Nifty 50 # (%)
S&P BSESENSEX ##
(%)
Value of Standard Investment of ` 10000 in
Birla SunLife IndiaGenNextFund (`)
Nifty 50 # (`)
S&P BSESENSEX ## (`)
Since inception till December 30, 2016 (CAGR) 10.00 16.70 11.51 11.42 58250 34668 34339
December 31, 2015 to December 30, 2016 (Absolute) 54.22 7.43 3.01 1.95 10743 10301 10195
December 31, 2014 toDecember 31, 2015 (Absolute) 50.43 7.52 -4.06 -5.03 10752 9594 9497
December 31, 2013 toDecember 31, 2014 (Absolute) 33.40 50.99 31.39 29.89 15099 13139 12989
# Scheme Benchmark, ## Additional Benchmark, * As on start of period considered above.Past performance may or may not be sustained in future. Returns for dividend option would assume reinvestment of tax free dividends declared at the then prevailing NAV. Load and Taxes are not considered for computation of returns. Total Schemes Co-Managed by Fund Managers is 1. Total Schemes managed by Mr. Anil Shah is 8. Total Schemes managed by Mr. Chanchal Khandelwal is 1. Refer annexure on page no. 67 to know more on performance of schemes managed by Fund Managers. $‘Direct Plan’ is only for investors who purchase /subscribe Units in a Scheme directly with the Mutual Fund and is not available for investors who route their investments through a Distributor. For further details, Investors are advised to refer to Addendum no. 44/2012 dated December 27, 2012 available on our website www.birlasunlife.com
SIP Performance - Regular Plan - Growth (assuming SIP of ` 10000 per month)Particulars Since Inception last 5 years last 3 years last 1 yearTotal Amount Invested (`) 1370000 600000 360000 120000Market Value of amount Invested 3637610 929379 435437 122930Scheme Returns (CAGR) 16.10 17.55 12.76 4.57Nifty 50 returns# (CAGR) 8.47 7.69 2.79 1.61S&P BSE SENSEX returns## (CAGR) 8.06 6.99 1.73 1.18Date of First Installment: September 01, 2005 & Scheme Inception Date: August 05, 2005. Past Performance may or may not be sustained in future.
1.88%
2.93%
3.31%
3.67%
6.79%
6.94%
10.59%
13.34%
15.41%
19.50%
Healthcare Services
Petroleum Products
Media & Entertainment
Cement
Consumer Durables
Pharmaceuticals
Auto
Finance
Banks
Consumer Non Durables
Note: Standard Deviation, Sharpe Ratio & Beta are calculated on Annualised basis using 3 years history of monthly returns.## Risk Free Rate assumed to be 6.25% (FBIL Overnight MIBOR for 30th Dec 2016) for calculating Sharpe Ratio
Declared on date 27-May-16 18-Jun-15 27-Jun-14Dividend Yield (Regular Plan) 8.26% 11.10% 0.00%Dividend (`) Per Unit 1.80 2.60 0.00Cum Dividend NAV 21.80 23.42 19.57Dividend Yield (Direct Plan) 8.22% 10.14% 0.00%Dividend (`) Per Unit 2.00 2.60 0.00Cum Dividend NAV 24.33 25.63 21.07
Note: The NAV of the scheme, pursuant to pay out of dividend would fall to the extent of the payout and statutory levy (if applicable). Past performance may or may not be sustained in future.The Face Value - 10.00 Per UnitThe Financial Solution(s) stated above is ONLY for highlighting the many advantages perceived from investments in Mutual Funds but does not in any manner, indicate or imply, either the quality of any particular Scheme or guarantee any specific performance/returns.For more details on dividends declared please refer to the online empower on www.mutualfund.birlasunlife.com
Note: The exit load rate levied at the time of redemption/switch-out of units will be the rate prevailing at the time of allotment of the corresponding units. Customers may request for a separate Exit Load Applicability Report by calling our toll free numbers 1800-270-7000 / 1800-22-7000 or from any of our Investor Service Centers.
# Scheme Benchmark, ## Additional Benchmark, * As on start of period considered above.For SIP calculations above, the data assumes the investment of ` 10000/- on 1st day of every month or the subsequent working day. Load & Taxes are not considered for computation of returns. Performance for dividend option would assume reinvestment of tax free dividends declared at the then prevailing NAV. CAGR returns are computed after accounting for the cash flow by using XIRR method (investment internal rate of return).Where Benchmark returns are not available, they have not been shown. Past performance may or may not be sustained in future. Returns greater than 1 year period are compounded annualized. Dividends are assumed to be reinvested and bonus is adjusted. Load is not taken into consideration. For SIP returns, monthly investment of equal amounts invested on the 1st day of every month has been considered.
http://mutualfund.birlasunlife.com https://twitter.com/bslmf
https://www.facebook.com/bslmf https://www.linkedin.com/company/bslmf53
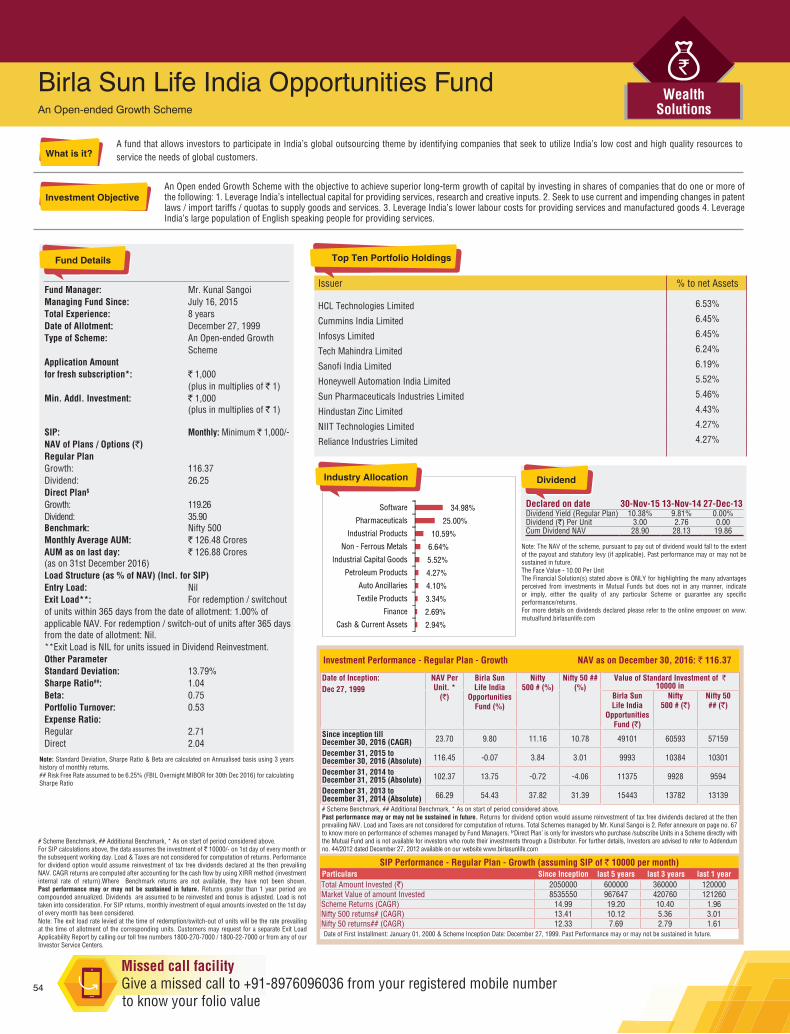
A fund that allows investors to participate in India’s global outsourcing theme by identifying companies that seek to utilize India’s low cost and high quality resources to service the needs of global customers.
An Open ended Growth Scheme with the objective to achieve superior long-term growth of capital by investing in shares of companies that do one or more of the following: 1. Leverage India’s intellectual capital for providing services, research and creative inputs. 2. Seek to use current and impending changes in patent laws / import tariffs / quotas to supply goods and services. 3. Leverage India’s lower labour costs for providing services and manufactured goods 4. Leverage India’s large population of English speaking people for providing services.
Birla Sun Life India Opportunities FundAn Open-ended Growth Scheme
Fund Manager: Mr. Kunal SangoiManaging Fund Since: July 16, 2015Total Experience: 8 yearsDate of Allotment: December 27, 1999Type of Scheme: An Open-ended Growth SchemeApplication Amount for fresh subscription*: ` 1,000 (plus in multiplies of ` 1)Min. Addl. Investment: ` 1,000 (plus in multiplies of ` 1)
SIP: Monthly: Minimum ` 1,000/-NAV of Plans / Options (`)Regular Plan Growth: 116.37Dividend: 26.25Direct Plan$ Growth: 119.26Dividend: 35.90Benchmark: Nifty 500Monthly Average AUM: ` 126.48 CroresAUM as on last day: ` 126.88 Crores(as on 31st December 2016)Load Structure (as % of NAV) (Incl. for SIP)Entry Load: NilExit Load**: For redemption / switchoutof units within 365 days from the date of allotment: 1.00% ofapplicable NAV. For redemption / switch-out of units after 365 days from the date of allotment: Nil.**Exit Load is NIL for units issued in Dividend Reinvestment.Other ParameterStandard Deviation: 13.79%Sharpe Ratio##: 1.04Beta: 0.75Portfolio Turnover: 0.53Expense Ratio:Regular 2.71Direct 2.04
Issuer % to net Assets
HCL Technologies Limited 6.53%
Cummins India Limited 6.45%
Infosys Limited 6.45%
Tech Mahindra Limited 6.24%
Sanofi India Limited 6.19%
Honeywell Automation India Limited 5.52%
Sun Pharmaceuticals Industries Limited 5.46%
Hindustan Zinc Limited 4.43%
NIIT Technologies Limited 4.27%
Reliance Industries Limited 4.27%
Top Ten Portfolio Holdings
Investment Performance - Regular Plan - Growth NAV as on December 30, 2016: ` 116.37
Date of Inception: Dec 27, 1999
NAV Per Unit. *
(`)
Birla SunLife India
OpportunitiesFund (%)
Nifty500 # (%)
Nifty 50 ## (%)
Value of Standard Investment of ` 10000 in
Birla SunLife India
OpportunitiesFund (`)
Nifty500 # (`)
Nifty 50 ## (`)
Since inception till December 30, 2016 (CAGR) 23.70 9.80 11.16 10.78 49101 60593 57159
December 31, 2015 to December 30, 2016 (Absolute) 116.45 -0.07 3.84 3.01 9993 10384 10301
December 31, 2014 toDecember 31, 2015 (Absolute) 102.37 13.75 -0.72 -4.06 11375 9928 9594
December 31, 2013 toDecember 31, 2014 (Absolute) 66.29 54.43 37.82 31.39 15443 13782 13139
# Scheme Benchmark, ## Additional Benchmark, * As on start of period considered above.Past performance may or may not be sustained in future. Returns for dividend option would assume reinvestment of tax free dividends declared at the then prevailing NAV. Load and Taxes are not considered for computation of returns. Total Schemes managed by Mr. Kunal Sangoi is 2. Refer annexure on page no. 67 to know more on performance of schemes managed by Fund Managers. $‘Direct Plan’ is only for investors who purchase /subscribe Units in a Scheme directly with the Mutual Fund and is not available for investors who route their investments through a Distributor. For further details, Investors are advised to refer to Addendum no. 44/2012 dated December 27, 2012 available on our website www.birlasunlife.com
SIP Performance - Regular Plan - Growth (assuming SIP of ` 10000 per month)Particulars Since Inception last 5 years last 3 years last 1 yearTotal Amount Invested (`) 2050000 600000 360000 120000Market Value of amount Invested 8535550 967647 420760 121260Scheme Returns (CAGR) 14.99 19.20 10.40 1.96Nifty 500 returns# (CAGR) 13.41 10.12 5.36 3.01Nifty 50 returns## (CAGR) 12.33 7.69 2.79 1.61Date of First Installment: January 01, 2000 & Scheme Inception Date: December 27, 1999. Past Performance may or may not be sustained in future.
2.94%
2.69%
3.34%
4.10%
4.27%
5.52%
6.64%
10.59%
25.00%
34.98%
Cash & Current Assets
Finance
Textile Products
Auto Ancillaries
Petroleum Products
Industrial Capital Goods
Non - Ferrous Metals
Industrial Products
Pharmaceuticals
Software
Note: Standard Deviation, Sharpe Ratio & Beta are calculated on Annualised basis using 3 years history of monthly returns.## Risk Free Rate assumed to be 6.25% (FBIL Overnight MIBOR for 30th Dec 2016) for calculating Sharpe Ratio
Declared on date 30-Nov-15 13-Nov-14 27-Dec-13Dividend Yield (Regular Plan) 10.38% 9.81% 0.00%Dividend (`) Per Unit 3.00 2.76 0.00Cum Dividend NAV 28.90 28.13 19.86
Note: The NAV of the scheme, pursuant to pay out of dividend would fall to the extent of the payout and statutory levy (if applicable). Past performance may or may not be sustained in future.The Face Value - 10.00 Per UnitThe Financial Solution(s) stated above is ONLY for highlighting the many advantages perceived from investments in Mutual Funds but does not in any manner, indicate or imply, either the quality of any particular Scheme or guarantee any specific performance/returns.For more details on dividends declared please refer to the online empower on www.mutualfund.birlasunlife.com
Note: The exit load rate levied at the time of redemption/switch-out of units will be the rate prevailing at the time of allotment of the corresponding units. Customers may request for a separate Exit Load Applicability Report by calling our toll free numbers 1800-270-7000 / 1800-22-7000 or from any of our Investor Service Centers.
# Scheme Benchmark, ## Additional Benchmark, * As on start of period considered above.For SIP calculations above, the data assumes the investment of ` 10000/- on 1st day of every month or the subsequent working day. Load & Taxes are not considered for computation of returns. Performance for dividend option would assume reinvestment of tax free dividends declared at the then prevailing NAV. CAGR returns are computed after accounting for the cash flow by using XIRR method (investment internal rate of return).Where Benchmark returns are not available, they have not been shown. Past performance may or may not be sustained in future. Returns greater than 1 year period are compounded annualized. Dividends are assumed to be reinvested and bonus is adjusted. Load is not taken into consideration. For SIP returns, monthly investment of equal amounts invested on the 1st day of every month has been considered.
54

A fund that provides an opportunity to grow your money by investing in world class companies across the globe.
An Open-ended diversified equity scheme with an objective to generate long-term growth of capital, by investing predominantly in a diversified portfolio of equity and equity related securities in the international markets
Fund Manager: Mr. Vineet MalooManaging Fund Since: Since InceptionTotal Experience: 11 yearsDate of Allotment: October 31, 2007Type of Scheme: An Open-ended Diversified Equity SchemeApplication Amount for fresh subscription*: ` 1,000 (plus in multiplies of ` 1)Min. Addl. Investment: ` 1,000 (plus in multiplies of ` 1)
SIP: Monthly: Minimum ` 1,000/-NAV of Plans / Options (`)Regular Plan Growth: 16.0348Dividend: 14.7530Direct Plan$ Growth: 16.3764Dividend: 16.3883Benchmark: S&P Global 1200Monthly Average AUM: ` 50.28 CroresAUM as on last day: ` 50.14 Crores(as on 31st December 2016)Load Structure (as % of NAV) (Incl. for SIP)Entry Load: NilExit Load**: For redemption / switch-outof units within 365 days from the date of allotment:1.00% of applicable NAV. For redemption / switchout of units after 365 daysfrom the date of allotment: Nil.**Exit Load is NIL for units issued in Dividend Reinvestment.Other ParameterPortfolio Turnover: 0.33Expense Ratio:Regular 2.69Direct 2.18
Birla Sun Life International Equity Fund - Plan AAn Open-ended Diversified Equity Scheme
Issuer % to net Assets
Aetna Inc New 4.72%
Apple Inc. 4.11%
AXA SA 3.71%
Valero Energy Corporation Ltd 3.63%
THE BOEING CO 3.48%
Fedex Corp 3.42%
SWISS RE AG 3.21%
NORDEA BANK AB 3.03%
Delta Air Lines Inc 2.94%
Harman International Industries Inc 2.86%
Top Ten Portfolio Holdings
Investment Performance - Regular Plan - Growth NAV as on December 30, 2016: ` 16.0348
Date of Inception: Oct 31, 2007
NAV Per Unit. *
(`)
BirlaSun Life
InternationalEquity Fund -Plan A (%)
S&PGlobal
1200 # (%)
Nifty 50 ## (%)
Value of Standard Investment of ` 10000 in
BirlaSun Life
InternationalEquity Fund -
Plan A (`)
S&PGlobal
1200 # (`)
Nifty 50 ## (`)
Since inception till December 30, 2016 (CAGR) 10.0000 5.28 6.53 3.63 16035 17869 13873
December 31, 2015 to December 30, 2016 (Absolute) 16.3724 -2.06 8.78 3.01 9794 10878 10301
December 31, 2014 toDecember 31, 2015 (Absolute) 16.3751 -0.02 1.28 -4.06 9998 10128 9594
December 31, 2013 toDecember 31, 2014 (Absolute) 16.1069 1.67 5.12 31.39 10167 10512 13139
# Scheme Benchmark, ## Additional Benchmark, * As on start of period considered above.Past performance may or may not be sustained in future. Returns for dividend option would assume reinvestment of tax free dividends declared at the then prevailing NAV. Load and Taxes are not considered for computation of returns. Total Schemes managed by Mr. Vineet Maloo is 18. Refer annexure on page no. 67 to know more on performance of schemes managed by Fund Managers. $‘Direct Plan’ is only for investors who purchase /subscribe Units in a Scheme directly with the Mutual Fund and is not available for investors who route their investments through a Distributor. For further details, Investors are advised to refer to Addendum no. 44/2012 dated December 27, 2012 available on our website www.birlasunlife.com
SIP Performance - Regular Plan - Growth (assuming SIP of ` 10000 per month)Particulars Since Inception last 5 years last 3 years last 1 yearTotal Amount Invested (`) 1110000 600000 360000 120000Market Value of amount Invested 1618007 680911 362468 123249Scheme Returns (CAGR) 7.93 5.01 0.44 5.07S&P Global 1200 returns# (CAGR) 11.22 10.11 6.53 13.16Nifty 50 returns## (CAGR) 8.01 7.69 2.79 1.61Date of First Installment: November 01, 2007 & Scheme Inception Date: October 31, 2007 . Past Performance may or may not be sustained in future.
1.68%2.28%2.50%2.51%3.03%3.21%4.14%4.80%5.05%
60.84%
SwitzerlandNetherlands
NorwayHong Kong
SwedenSwazilandGermany
FranceAustralia
United States
Country Allocation
Declared on date 27-Nov-14Dividend Yield (Regular Plan) 8.05%Dividend (`) Per Unit 1.30Cum Dividend NAV 16.15
Note: The NAV of the scheme, pursuant to pay out of dividend would fall to the extent of the payout and statutory levy (if applicable). Past performance may or may not be sustained in future.The Face Value - 10.00 Per UnitThe Financial Solution(s) stated above is ONLY for highlighting the many advantages perceived from investments in Mutual Funds but does not in any manner, indicate or imply, either the quality of any particular Scheme or guarantee any specific performance/returns.For more details on dividends declared please refer to the online empower on www.mutualfund.birlasunlife.com
Note: The exit load rate levied at the time of redemption/switch-out of units will be the rate prevailing at the time of allotment of the corresponding units. Customers may request for a separate Exit Load Applicability Report by calling our toll free numbers 1800-270-7000 / 1800-22-7000 or from any of our Investor Service Centers.
# Scheme Benchmark, ## Additional Benchmark, * As on start of period considered above.For SIP calculations above, the data assumes the investment of ` 10000/- on 1st day of every month or the subsequent working day. Load & Taxes are not considered for computation of returns. Performance for dividend option would assume reinvestment of tax free dividends declared at the then prevailing NAV. CAGR returns are computed after accounting for the cash flow by using XIRR method (investment internal rate of return).Where Benchmark returns are not available, they have not been shown. Past performance may or may not be sustained in future. Returns greater than 1 year period are compounded annualized. Dividends are assumed to be reinvested and bonus is adjusted. Load is not taken into consideration. For SIP returns, monthly investment of equal amounts invested on the 1st day of every month has been considered.
http://mutualfund.birlasunlife.com https://twitter.com/bslmf
https://www.facebook.com/bslmf https://www.linkedin.com/company/bslmf55
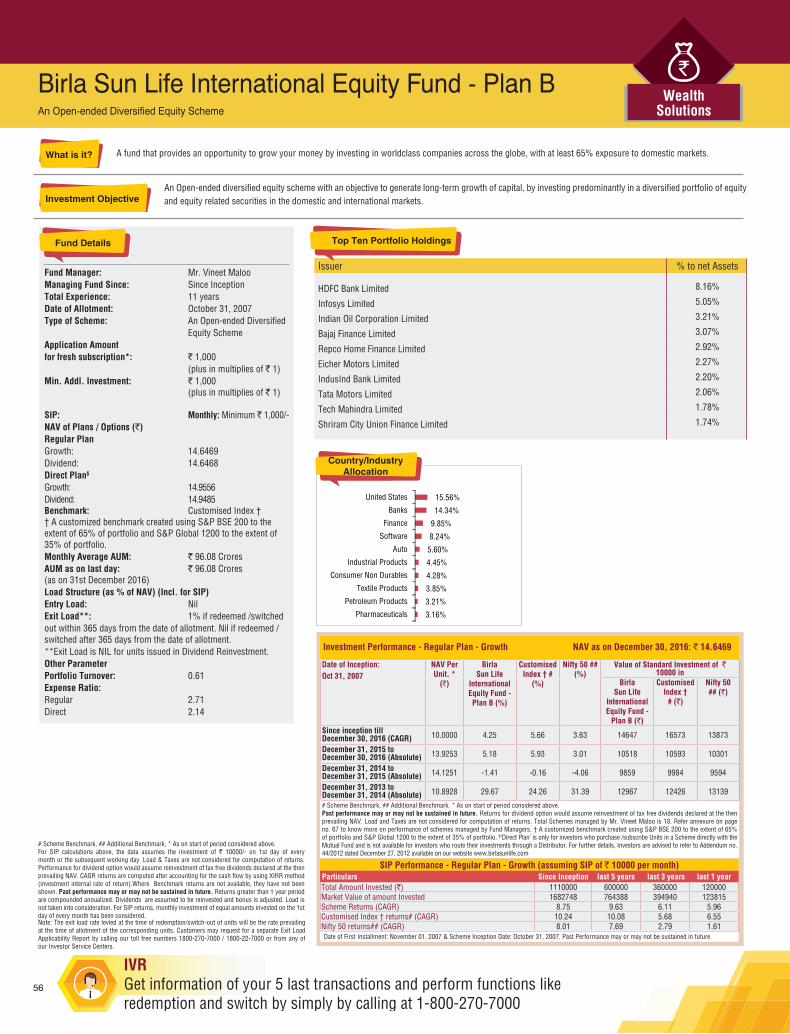
A fund that provides an opportunity to grow your money by investing in worldclass companies across the globe, with at least 65% exposure to domestic markets.
An Open-ended diversified equity scheme with an objective to generate long-term growth of capital, by investing predominantly in a diversified portfolio of equity and equity related securities in the domestic and international markets.
Fund Manager: Mr. Vineet MalooManaging Fund Since: Since InceptionTotal Experience: 11 yearsDate of Allotment: October 31, 2007Type of Scheme: An Open-ended Diversified Equity SchemeApplication Amount for fresh subscription*: ` 1,000 (plus in multiplies of ` 1)Min. Addl. Investment: ` 1,000 (plus in multiplies of ` 1)
SIP: Monthly: Minimum ` 1,000/-NAV of Plans / Options (`)Regular Plan Growth: 14.6469Dividend: 14.6468Direct Plan$ Growth: 14.9556Dividend: 14.9485Benchmark: Customised Index †† A customized benchmark created using S&P BSE 200 to the extent of 65% of portfolio and S&P Global 1200 to the extent of 35% of portfolio.Monthly Average AUM: ` 96.08 CroresAUM as on last day: ` 96.08 Crores(as on 31st December 2016)Load Structure (as % of NAV) (Incl. for SIP)Entry Load: NilExit Load**: 1% if redeemed /switchedout within 365 days from the date of allotment. Nil if redeemed /switched after 365 days from the date of allotment.**Exit Load is NIL for units issued in Dividend Reinvestment.Other ParameterPortfolio Turnover: 0.61Expense Ratio:Regular 2.71Direct 2.14
Birla Sun Life International Equity Fund - Plan BAn Open-ended Diversified Equity Scheme
Issuer % to net Assets
HDFC Bank Limited 8.16%
Infosys Limited 5.05%
Indian Oil Corporation Limited 3.21%
Bajaj Finance Limited 3.07%
Repco Home Finance Limited 2.92%
Eicher Motors Limited 2.27%
IndusInd Bank Limited 2.20%
Tata Motors Limited 2.06%
Tech Mahindra Limited 1.78%
Shriram City Union Finance Limited 1.74%
Top Ten Portfolio Holdings
Investment Performance - Regular Plan - Growth NAV as on December 30, 2016: ` 14.6469
Date of Inception: Oct 31, 2007
NAV Per Unit. *
(`)
BirlaSun Life
InternationalEquity Fund -Plan B (%)
CustomisedIndex † #
(%)
Nifty 50 ## (%)
Value of Standard Investment of ` 10000 in
BirlaSun Life
InternationalEquity Fund -
Plan B (`)
CustomisedIndex †
# (`)
Nifty 50 ## (`)
Since inception till December 30, 2016 (CAGR) 10.0000 4.25 5.66 3.63 14647 16573 13873
December 31, 2015 to December 30, 2016 (Absolute) 13.9253 5.18 5.93 3.01 10518 10593 10301
December 31, 2014 toDecember 31, 2015 (Absolute) 14.1251 -1.41 -0.16 -4.06 9859 9984 9594
December 31, 2013 toDecember 31, 2014 (Absolute) 10.8928 29.67 24.26 31.39 12967 12426 13139
# Scheme Benchmark, ## Additional Benchmark, * As on start of period considered above.Past performance may or may not be sustained in future. Returns for dividend option would assume reinvestment of tax free dividends declared at the then prevailing NAV. Load and Taxes are not considered for computation of returns. Total Schemes managed by Mr. Vineet Maloo is 18. Refer annexure on page no. 67 to know more on performance of schemes managed by Fund Managers. † A customized benchmark created using S&P BSE 200 to the extent of 65% of portfolio and S&P Global 1200 to the extent of 35% of portfolio. $‘Direct Plan’ is only for investors who purchase /subscribe Units in a Scheme directly with the Mutual Fund and is not available for investors who route their investments through a Distributor. For further details, Investors are advised to refer to Addendum no. 44/2012 dated December 27, 2012 available on our website www.birlasunlife.com
SIP Performance - Regular Plan - Growth (assuming SIP of ` 10000 per month)Particulars Since Inception last 5 years last 3 years last 1 yearTotal Amount Invested (`) 1110000 600000 360000 120000Market Value of amount Invested 1682748 764388 394940 123815Scheme Returns (CAGR) 8.75 9.63 6.11 5.96Customised Index † returns# (CAGR) 10.24 10.08 5.68 6.55Nifty 50 returns## (CAGR) 8.01 7.69 2.79 1.61Date of First Installment: November 01, 2007 & Scheme Inception Date: October 31, 2007. Past Performance may or may not be sustained in future.
3.16%
3.21%
3.85%
4.28%
4.45%
5.60%
8.24%
9.85%
14.34%
15.56%
Pharmaceuticals
Petroleum Products
Textile Products
Consumer Non Durables
Industrial Products
Auto
Software
Finance
Banks
United States
Country/Industry Allocation
Note: The exit load rate levied at the time of redemption/switch-out of units will be the rate prevailing at the time of allotment of the corresponding units. Customers may request for a separate Exit Load Applicability Report by calling our toll free numbers 1800-270-7000 / 1800-22-7000 or from any of our Investor Service Centers.
# Scheme Benchmark, ## Additional Benchmark, * As on start of period considered above.For SIP calculations above, the data assumes the investment of ` 10000/- on 1st day of every month or the subsequent working day. Load & Taxes are not considered for computation of returns. Performance for dividend option would assume reinvestment of tax free dividends declared at the then prevailing NAV. CAGR returns are computed after accounting for the cash flow by using XIRR method (investment internal rate of return).Where Benchmark returns are not available, they have not been shown. Past performance may or may not be sustained in future. Returns greater than 1 year period are compounded annualized. Dividends are assumed to be reinvested and bonus is adjusted. Load is not taken into consideration. For SIP returns, monthly investment of equal amounts invested on the 1st day of every month has been considered.
56
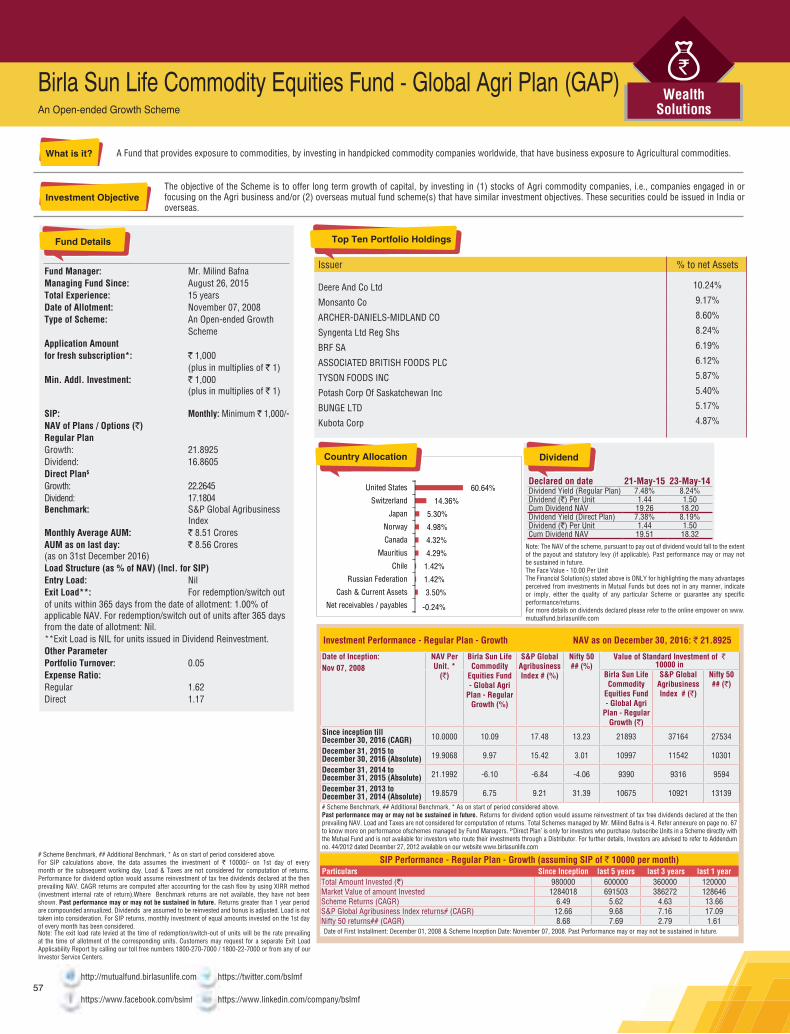
A Fund that provides exposure to commodities, by investing in handpicked commodity companies worldwide, that have business exposure to Agricultural commodities.
The objective of the Scheme is to offer long term growth of capital, by investing in (1) stocks of Agri commodity companies, i.e., companies engaged in or focusing on the Agri business and/or (2) overseas mutual fund scheme(s) that have similar investment objectives. These securities could be issued in India or overseas.
Fund Manager: Mr. Milind BafnaManaging Fund Since: August 26, 2015Total Experience: 15 yearsDate of Allotment: November 07, 2008Type of Scheme: An Open-ended Growth SchemeApplication Amount for fresh subscription*: ` 1,000 (plus in multiplies of ` 1)Min. Addl. Investment: ` 1,000 (plus in multiplies of ` 1)
SIP: Monthly: Minimum ` 1,000/-NAV of Plans / Options (`)Regular Plan Growth: 21.8925Dividend: 16.8605Direct Plan$ Growth: 22.2645Dividend: 17.1804Benchmark: S&P Global Agribusiness IndexMonthly Average AUM: ` 8.51 CroresAUM as on last day: ` 8.56 Crores(as on 31st December 2016)Load Structure (as % of NAV) (Incl. for SIP)Entry Load: NilExit Load**: For redemption/switch outof units within 365 days from the date of allotment: 1.00% of applicable NAV. For redemption/switch out of units after 365 days from the date of allotment: Nil.**Exit Load is NIL for units issued in Dividend Reinvestment.Other ParameterPortfolio Turnover: 0.05Expense Ratio:Regular 1.62Direct 1.17
Birla Sun Life Commodity Equities Fund - Global Agri Plan (GAP)An Open-ended Growth Scheme
Issuer % to net Assets
Deere And Co Ltd 10.24%
Monsanto Co 9.17%
ARCHER-DANIELS-MIDLAND CO 8.60%
Syngenta Ltd Reg Shs 8.24%
BRF SA 6.19%
ASSOCIATED BRITISH FOODS PLC 6.12%
TYSON FOODS INC 5.87%
Potash Corp Of Saskatchewan Inc 5.40%
BUNGE LTD 5.17%
Kubota Corp 4.87%
Top Ten Portfolio Holdings
Investment Performance - Regular Plan - Growth NAV as on December 30, 2016: ` 21.8925
Date of Inception: Nov 07, 2008
NAV Per Unit. *
(`)
Birla Sun LifeCommodity
Equities Fund- Global Agri
Plan - RegularGrowth (%)
S&P GlobalAgribusinessIndex # (%)
Nifty 50 ## (%)
Value of Standard Investment of ` 10000 in
Birla Sun LifeCommodity
Equities Fund- Global Agri
Plan - RegularGrowth (`)
S&P GlobalAgribusinessIndex # (`)
Nifty 50 ## (`)
Since inception till December 30, 2016 (CAGR) 10.0000 10.09 17.48 13.23 21893 37164 27534
December 31, 2015 to December 30, 2016 (Absolute) 19.9068 9.97 15.42 3.01 10997 11542 10301
December 31, 2014 toDecember 31, 2015 (Absolute) 21.1992 -6.10 -6.84 -4.06 9390 9316 9594
December 31, 2013 toDecember 31, 2014 (Absolute) 19.8579 6.75 9.21 31.39 10675 10921 13139
# Scheme Benchmark, ## Additional Benchmark, * As on start of period considered above.Past performance may or may not be sustained in future. Returns for dividend option would assume reinvestment of tax free dividends declared at the then prevailing NAV. Load and Taxes are not considered for computation of returns. Total Schemes managed by Mr. Milind Bafna is 4. Refer annexure on page no. 67 to know more on performance ofschemes managed by Fund Managers. $‘Direct Plan’ is only for investors who purchase /subscribe Units in a Scheme directly with the Mutual Fund and is not available for investors who route their investments through a Distributor. For further details, Investors are advised to refer to Addendum no. 44/2012 dated December 27, 2012 available on our website www.birlasunlife.com
SIP Performance - Regular Plan - Growth (assuming SIP of ` 10000 per month)Particulars Since Inception last 5 years last 3 years last 1 yearTotal Amount Invested (`) 980000 600000 360000 120000Market Value of amount Invested 1284018 691503 386272 128646Scheme Returns (CAGR) 6.49 5.62 4.63 13.66S&P Global Agribusiness Index returns# (CAGR) 12.66 9.68 7.16 17.09Nifty 50 returns## (CAGR) 8.68 7.69 2.79 1.61Date of First Installment: December 01, 2008 & Scheme Inception Date: November 07, 2008. Past Performance may or may not be sustained in future.
3.50%
1.42%
1.42%
4.29%
4.32%
4.98%
5.30%
14.36%
60.64%
Net receivables / payables
Cash & Current Assets
Russian Federation
Chile
Mauritius
Canada
Norway
Japan
Switzerland
United States
-0.24%
Country Allocation
Declared on date 21-May-15 23-May-14Dividend Yield (Regular Plan) 7.48% 8.24%Dividend (`) Per Unit 1.44 1.50Cum Dividend NAV 19.26 18.20Dividend Yield (Direct Plan) 7.38% 8.19%Dividend (`) Per Unit 1.44 1.50Cum Dividend NAV 19.51 18.32
Note: The NAV of the scheme, pursuant to pay out of dividend would fall to the extent of the payout and statutory levy (if applicable). Past performance may or may not be sustained in future.The Face Value - 10.00 Per UnitThe Financial Solution(s) stated above is ONLY for highlighting the many advantages perceived from investments in Mutual Funds but does not in any manner, indicate or imply, either the quality of any particular Scheme or guarantee any specific performance/returns.For more details on dividends declared please refer to the online empower on www.mutualfund.birlasunlife.com
Note: The exit load rate levied at the time of redemption/switch-out of units will be the rate prevailing at the time of allotment of the corresponding units. Customers may request for a separate Exit Load Applicability Report by calling our toll free numbers 1800-270-7000 / 1800-22-7000 or from any of our Investor Service Centers.
# Scheme Benchmark, ## Additional Benchmark, * As on start of period considered above.For SIP calculations above, the data assumes the investment of ` 10000/- on 1st day of every month or the subsequent working day. Load & Taxes are not considered for computation of returns. Performance for dividend option would assume reinvestment of tax free dividends declared at the then prevailing NAV. CAGR returns are computed after accounting for the cash flow by using XIRR method (investment internal rate of return).Where Benchmark returns are not available, they have not been shown. Past performance may or may not be sustained in future. Returns greater than 1 year period are compounded annualized. Dividends are assumed to be reinvested and bonus is adjusted. Load is not taken into consideration. For SIP returns, monthly investment of equal amounts invested on the 1st day of every month has been considered.
http://mutualfund.birlasunlife.com https://twitter.com/bslmf
https://www.facebook.com/bslmf https://www.linkedin.com/company/bslmf57
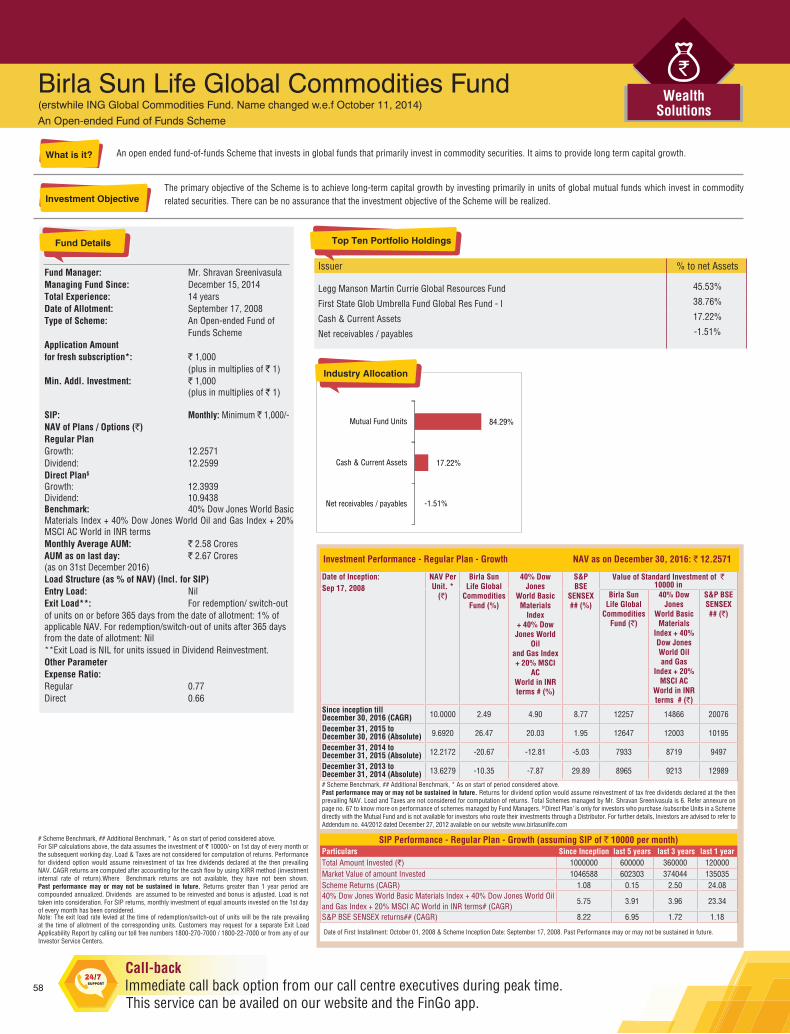
An open ended fund-of-funds Scheme that invests in global funds that primarily invest in commodity securities. It aims to provide long term capital growth.
The primary objective of the Scheme is to achieve long-term capital growth by investing primarily in units of global mutual funds which invest in commodity related securities. There can be no assurance that the investment objective of the Scheme will be realized.
Fund Manager: Mr. Shravan SreenivasulaManaging Fund Since: December 15, 2014Total Experience: 14 yearsDate of Allotment: September 17, 2008Type of Scheme: An Open-ended Fund of Funds SchemeApplication Amount for fresh subscription*: ` 1,000 (plus in multiplies of ` 1)Min. Addl. Investment: ` 1,000 (plus in multiplies of ` 1)
SIP: Monthly: Minimum ` 1,000/-NAV of Plans / Options (`)Regular Plan Growth: 12.2571Dividend: 12.2599Direct Plan$ Growth: 12.3939Dividend: 10.9438Benchmark: 40% Dow Jones World Basic Materials Index + 40% Dow Jones World Oil and Gas Index + 20% MSCI AC World in INR termsMonthly Average AUM: ` 2.58 CroresAUM as on last day: ` 2.67 Crores(as on 31st December 2016)Load Structure (as % of NAV) (Incl. for SIP)Entry Load: NilExit Load**: For redemption/ switch-outof units on or before 365 days from the date of allotment: 1% of applicable NAV. For redemption/switch-out of units after 365 days from the date of allotment: Nil**Exit Load is NIL for units issued in Dividend Reinvestment.Other ParameterExpense Ratio:Regular 0.77Direct 0.66
Birla Sun Life Global Commodities Fund(erstwhile ING Global Commodities Fund. Name changed w.e.f October 11, 2014)An Open-ended Fund of Funds Scheme
Issuer % to net Assets
Legg Manson Martin Currie Global Resources Fund 45.53%
First State Glob Umbrella Fund Global Res Fund - I 38.76%
Cash & Current Assets 17.22%
Net receivables / payables -1.51%
Top Ten Portfolio Holdings
Investment Performance - Regular Plan - Growth NAV as on December 30, 2016: ` 12.2571
Date of Inception: Sep 17, 2008
NAV Per Unit. *
(`)
Birla SunLife Global
CommoditiesFund (%)
40% Dow Jones
World BasicMaterials
Index+ 40% DowJones World
Oiland Gas Index+ 20% MSCI
ACWorld in INRterms # (%)
S&PBSE
SENSEX ## (%)
Value of Standard Investment of ` 10000 in
Birla SunLife Global
CommoditiesFund (`)
40% DowJones
World BasicMaterials
Index + 40%Dow JonesWorld Oiland Gas
Index + 20%MSCI AC
World in INRterms # (`)
S&P BSESENSEX ## (`)
Since inception till December 30, 2016 (CAGR) 10.0000 2.49 4.90 8.77 12257 14866 20076
December 31, 2015 to December 30, 2016 (Absolute) 9.6920 26.47 20.03 1.95 12647 12003 10195
December 31, 2014 toDecember 31, 2015 (Absolute) 12.2172 -20.67 -12.81 -5.03 7933 8719 9497
December 31, 2013 toDecember 31, 2014 (Absolute) 13.6279 -10.35 -7.87 29.89 8965 9213 12989
# Scheme Benchmark, ## Additional Benchmark, * As on start of period considered above.Past performance may or may not be sustained in future. Returns for dividend option would assume reinvestment of tax free dividends declared at the then prevailing NAV. Load and Taxes are not considered for computation of returns. Total Schemes managed by Mr. Shravan Sreenivasula is 6. Refer annexure on page no. 67 to know more on performance of schemes managed by Fund Managers. $‘Direct Plan’ is only for investors who purchase /subscribe Units in a Scheme directly with the Mutual Fund and is not available for investors who route their investments through a Distributor. For further details, Investors are advised to refer to Addendum no. 44/2012 dated December 27, 2012 available on our website www.birlasunlife.com
SIP Performance - Regular Plan - Growth (assuming SIP of ` 10000 per month)Particulars Since Inception last 5 years last 3 years last 1 yearTotal Amount Invested (`) 1000000 600000 360000 120000Market Value of amount Invested 1046588 602303 374044 135035Scheme Returns (CAGR) 1.08 0.15 2.50 24.0840% Dow Jones World Basic Materials Index + 40% Dow Jones World Oil and Gas Index + 20% MSCI AC World in INR terms# (CAGR)
5.75 3.91 3.96 23.34
S&P BSE SENSEX returns## (CAGR) 8.22 6.95 1.72 1.18
Date of First Installment: October 01, 2008 & Scheme Inception Date: September 17, 2008. Past Performance may or may not be sustained in future.
17.22%
84.29%
Net receivables / payables
Cash & Current Assets
Mutual Fund Units
-1.51%
Note: The exit load rate levied at the time of redemption/switch-out of units will be the rate prevailing at the time of allotment of the corresponding units. Customers may request for a separate Exit Load Applicability Report by calling our toll free numbers 1800-270-7000 / 1800-22-7000 or from any of our Investor Service Centers.
# Scheme Benchmark, ## Additional Benchmark, * As on start of period considered above.For SIP calculations above, the data assumes the investment of ` 10000/- on 1st day of every month or the subsequent working day. Load & Taxes are not considered for computation of returns. Performance for dividend option would assume reinvestment of tax free dividends declared at the then prevailing NAV. CAGR returns are computed after accounting for the cash flow by using XIRR method (investment internal rate of return).Where Benchmark returns are not available, they have not been shown. Past performance may or may not be sustained in future. Returns greater than 1 year period are compounded annualized. Dividends are assumed to be reinvested and bonus is adjusted. Load is not taken into consideration. For SIP returns, monthly investment of equal amounts invested on the 1st day of every month has been considered.
58

An open ended fund-of-funds Scheme that predominantly invests in “ING (L) Invest Global Real Estate Fund”, a global real estate fund that has flexibility to invest in real estate securities across the world. It aims to provide capital appreciation.
The primary investment objective of the Scheme is to seek capital appreciation by investing predominantly in ING (L) Invest Global Real Estate. The Scheme may also invest a certain portion of its corpus in Money Market Instruments / liquid funds / money market mutual funds, in order to meet liquidity requirements from time to time. There can be no assurance that the investment objective of the Scheme will be realized.
Fund Manager: Mr. Shravan SreenivasulaManaging Fund Since: December 15, 2014Total Experience: 14 yearsDate of Allotment: December 31, 2007Type of Scheme: An Open-ended Fund of Funds SchemeApplication Amount for fresh subscription*: ` 1,000 (plus in multiplies of ` 1)Min. Addl. Investment: ` 1,000 (plus in multiplies of ` 1)
SIP: Monthly: Minimum ` 1,000/-NAV of Plans / Options (`)Regular Plan Growth: 17.4820Dividend: 17.4931Direct Plan$ Growth: 17.8069Dividend: 17.8174Benchmark: 10/40 GPR 250 Global Net IndexMonthly Average AUM: ` 19.28 CroresAUM as on last day: ` 19.54 Crores(as on 31st December 2016)Load Structure (as % of NAV) (Incl. for SIP)Entry Load: NilExit Load**: For redemption/ switch-outof units on or before 365 days from the date of allotment: 1% of applicable NAV. For redemption/switch-out of units after 365 days from the date of allotment: Nil**Exit Load is NIL for units issued in Dividend Reinvestment.Other ParameterExpense Ratio:Regular 1.74Direct 1.28
Issuer % to net Assets
ING (L) Invest Global Real Estate - I Cap USD 97.38%
Cash & Current Assets 2.97%
Net receivables / payables -0.35%
Top Portfolio Holdings
Investment Performance - Regular Plan - Growth NAV as on December 30, 2016: ` 17.4820
Date of Inception: Dec 31, 2007
NAV Per Unit. *
(`)
Birla SunLife GlobalReal EstateFund (%)
10/40 GPR250 GlobalNet Index
# (%)
S&PBSE
SENSEX ## (%)
Value of Standard Investment of ` 10000 in
Birla SunLife Global
RealEstate
Fund (`)
10/40 GPR250 GlobalNet Index
# (`)
S&P BSESENSEX ## (`)
Since inception till December 30, 2016 (CAGR) 10.0000 6.40 N/A 3.07 17482 N/A 13125
December 31, 2015 to December 30, 2016 (Absolute) 17.7200 -1.34 6.92 1.95 9866 10692 10195
December 31, 2014 toDecember 31, 2015 (Absolute) 17.2600 2.67 4.90 -5.03 10267 10490 9497
December 31, 2013 toDecember 31, 2014 (Absolute) 15.4800 11.50 16.71 29.89 11150 11671 12989
# Scheme Benchmark, ## Additional Benchmark, * As on start of period considered above.Past performance may or may not be sustained in future. Returns for dividend option would assume reinvestment of tax free dividends declared at the then prevailing NAV. Load and Taxes are not considered for computation of returns. Total Schemes managed by Mr. Shravan Sreenivasula is 6. Refer annexure on page no. 67 to know more on performance of schemes managed by Fund Managers. $‘Direct Plan’ is only for investors who purchase /subscribe Units in a Scheme directly with the Mutual Fund and is not available for investors who route their investments through a Distributor. For further details, Investors are advised to refer to Addendum no. 44/2012 dated December 27, 2012 available on our website www.birlasunlife.com
SIP Performance - Regular Plan - Growth (assuming SIP of ` 10000 per month)Particulars Since Inception last 5 years last 3 years last 1 yearTotal Amount Invested (`) 1090000 600000 360000 120000Market Value of amount Invested 1629349 679020 366969 115984Scheme Returns (CAGR) 8.62 4.90 1.25 -6.1610/40 GPR 250 Global Net Index returns# (CAGR) NA 10.21 7.18 1.73S&P BSE SENSEX returns## (CAGR) 7.74 6.96 1.75 1.18Date of First Installment: January 01, 2008 & Scheme Inception Date: December 31, 2007. Past Performance may or may not be sustained in future.
Birla Sun Life Global Real Estate Fund(erstwhile ING Global Real Estate Fund. Name changed w.e.f October 11, 2014)An Open-ended Fund of Funds Scheme
2.97%
97.38%
Net receivables / payables
Cash & Current Assets
I_Mutual_Fund_Units
-0.35%
Note: The exit load rate levied at the time of redemption/switch-out of units will be the rate prevailing at the time of allotment of the corresponding units. Customers may request for a separate Exit Load Applicability Report by calling our toll free numbers 1800-270-7000 / 1800-22-7000 or from any of our Investor Service Centers.
# Scheme Benchmark, ## Additional Benchmark, * As on start of period considered above.For SIP calculations above, the data assumes the investment of ` 10000/- on 1st day of every month or the subsequent working day. Load & Taxes are not considered for computation of returns. Performance for dividend option would assume reinvestment of tax free dividends declared at the then prevailing NAV. CAGR returns are computed after accounting for the cash flow by using XIRR method (investment internal rate of return).Where Benchmark returns are not available, they have not been shown. Past performance may or may not be sustained in future. Returns greater than 1 year period are compounded annualized. Dividends are assumed to be reinvested and bonus is adjusted. Load is not taken into consideration. For SIP returns, monthly investment of equal amounts invested on the 1st day of every month has been considered.
http://mutualfund.birlasunlife.com https://twitter.com/bslmf
https://www.facebook.com/bslmf https://www.linkedin.com/company/bslmf59

An ETF that invests in physical gold of 99.5% purity to generate returns in line with performance of gold, subject to tracking errors.
An Open ended Gold Exchange Traded Fund with the investment objective to generate returns that are in line with the performance of gold, subject to tracking errors.
Fund Manager: Mr. Prasad DhondeManaging Fund Since: October 03, 2012Total Experience: 16 yearsDate of Allotment: May 13, 2011Type of Scheme: An Open ended Gold Exchange Traded FundAddl. Purchase: The Creation Unit size in case of Birla Sun Life Gold ETF shall be 1,000 units and in multiples thereof. To know the exact value of the units please refer our website.NAV (`): 2681.6017Benchmark: Domestic price of physical goldMonthly Average AUM: ` 71.53 CroresAUM as on last day: ` 71.33 Crores(as on 31st December 2016)Load Structure (as % of NAV)Entry Load: NilExit Load** (Includingfractional units, if any): Nil; ++The units of the scheme are compulsorily traded in dematerialized form, and hence, there shall be no entry/exit load for the units purchased or sold through stock exchanges. However,the investor shall have to bear costs in form of bid/ask spread and brokerage or such other cost as charged by his broker for transacting in units of the scheme through secondary market.**Exit Load is NIL for units issued in Dividend Reinvestment.Other ParameterStandard Deviation: 16.33%Sharpe Ratio##: -0.39Beta: 0.96Expense Ratio:Regular 0.92Tracking Error: 7.55%
Birla Sun Life Gold ETFAn Open ended Gold Exchange Traded Fund
Issuer % to net Assets
Gold 99.83%
Cash & Current Assets 0.13%
Net receivables / payables 0.04%
Top Ten Portfolio Holdings
Note: The exit load rate levied at the time of redemption/switch-out of units will be the rate prevailing at the time of allotment of the corresponding units. Customers may request for a separate Exit Load Applicability Report by calling our toll free numbers 1800-270-7000 / 1800-22-7000 or from any of our Investor Service Centers.
Investment Performance NAV as on December 30, 2016: ` 2681.6017
Date of Inception: May 13, 2011
NAV Per Unit. *(`)
Birla Sun LifeGold ETF (%)
Domestic priceof physicalgold # (%)
Value of Standard Investment of ` 10000 in
Birla Sun LifeGold ETF (`)
Domestic priceof physicalgold # (`)
Since inception till December 30, 2016 (CAGR) 2227.8530 3.35 4.42 12037 12756
December 31, 2015 to December 30, 2016 (Absolute) 2428.9528 10.40 11.58 11040 11158
December 31, 2014 toDecember 31, 2015 (Absolute) 2641.2988 -8.04 -7.25 9196 9275
December 31, 2013 toDecember 31, 2014 (Absolute) 2688.4249 -1.75 -0.80 9825 9920
# Scheme Benchmark, ## Additional Benchmark, * As on start of period considered above.Past performance may or may not be sustained in future. Load and Taxes are not considered for computation of returns. Total Schemes managed by Mr. Prasad Dhonde is 23. Refer annexure on page no. 67 to know more on performance of schemes managed by Fund Managers.
Note: Standard Deviation, Sharpe Ratio & Beta are calculated on Annualised basis using 3 years history of monthly returns.## Risk Free Rate assumed to be 6.25% (FBIL Overnight MIBOR for 30th Dec 2016) for calculating Sharpe Ratio
0.04%
0.13%
Net receivables / payables
Cash & Current Assets
GOLD 99.83%
60

An open ended Fund of Funds scheme that predominantly invests in units of Birla Sun Life Gold ETF (underlying scheme) and one doesn’t require a Demat Account to invest in it.
An Open ended Fund of Funds Scheme with the investment objective to provide returns that tracks returns provided by Birla Sun Life Gold ETF (BSL Gold ETF).
Fund Manager: Mr. Shravan SreenivasulaManaging Fund Since: December 15, 2014Total Experience: 14 yearsDate of Allotment: March 20, 2012Type of Scheme: An Open ended Fund of Funds SchemeApplication Amount for fresh subscription*: ` 1,000 (plus in multiplies of ` 1)Min. Addl. Investment: ` 1,000 (plus in multiplies of ` 1)
SIP: Monthly: Minimum ` 1,000/-NAV of Plans / Options (`)Regular Plan Growth: 9.3533Dividend: 9.3519Direct Plan$ Growth: 9.4465Dividend: 9.4433Benchmark: Domestic price of physical goldMonthly Average AUM: ` 51.36 CroresAUM as on last day: ` 51.00 Crores(as on 31st December 2016)Load Structure (as % of NAV) (Incl. for SIP)Entry Load: NilExit Load**: For redemption/switch outof units within 365 days from the date of allotment: 1.00% of applicable NAV. For redemption/switch out of units after 365 days from the date of allotment: Nil**Exit Load is NIL for units issued in Dividend Reinvestment.Other ParameterStandard Deviation: 16.87%Sharpe Ratio##: -0.50Beta: 0.99Expense Ratio:Regular 0.50Direct 0.23Tracking Error: 7.95%
Birla Sun Life Gold FundAn Open ended Fund of Funds Scheme
Issuer % to net Assets
Birla Sun Life Gold ETF 98.78%
Cash & Current Assets 1.47%
Net receivables / payables -0.25%
Top Portfolio Holdings
Note: The exit load rate levied at the time of redemption/switch-out of units will be the rate prevailing at the time of allotment of the corresponding units. Customers may request for a separate Exit Load Applicability Report by calling our toll free numbers 1800-270-7000 / 1800-22-7000 or from any of our Investor Service Centers.“The investors are bearing the recurring expenses of the scheme, in addition to the expenses of other schemes in which the Fund of Funds Scheme makes investments.”
Investment Performance - Regular Plan - Growth NAV as on December 30, 2016: ` 9.3533
Date of Inception: Mar 20, 2012
NAV Per Unit. *(`)
Birla Sun LifeGold Fund (%)
Domestic priceof physicalgold # (%)
Value of Standard Investment of ` 10000 in
Birla Sun LifeGold Fund (`)
Domestic priceof physicalgold # (`)
Since inception till December 30, 2016 (CAGR) 10.0000 -1.39 0.23 9353 10110
December 31, 2015 to December 30, 2016 (Absolute) 8.3878 11.51 11.58 11151 11158
December 31, 2014 toDecember 31, 2015 (Absolute) 9.0401 -7.22 -7.25 9278 9275
December 31, 2013 toDecember 31, 2014 (Absolute) 9.9787 -9.41 -0.80 9059 9920
# Scheme Benchmark, ## Additional Benchmark, * As on start of period considered above.Past performance may or may not be sustained in future. Load and Taxes are not considered for computation of returns. Total Schemes managed by Mr. Shravan Sreenivasula is 6. Refer annexure on page no. 67 to know more on performance of schemes managed by Fund Managers. Investors should note that, Birla Sun Life Gold Fund being an open ended Fund of Funds scheme invests in Birla Sun Life Gold ETF which invests in physical gold of 99.5% purity and they shall bear the recurring expenses of the underlying scheme (i.e. Birla Sun Life Gold ETF) in addition to the recurring expenses of the Scheme. $‘Direct Plan’ is only for investors who purchase /subscribe Units in a Scheme directly with the Mutual Fund and is not available for investors who route their investments through a Distributor. For further details, Investors are advised to refer to Addendum no. 44/2012 dated December 27, 2012 available on our website www.birlasunlife.com
Note: Standard Deviation, Sharpe Ratio & Beta are calculated on Annualised basis using 3 years history of monthly returns.## Risk Free Rate assumed to be 6.25% (FBIL Overnight MIBOR for 30th Dec 2016) for calculating Sharpe Ratio
1.47%
98.78%
Net receivables / payables
Cash & Current Assets
Exchange Traded Fund
-0.25%
http://mutualfund.birlasunlife.com https://twitter.com/bslmf
https://www.facebook.com/bslmf https://www.linkedin.com/company/bslmf61
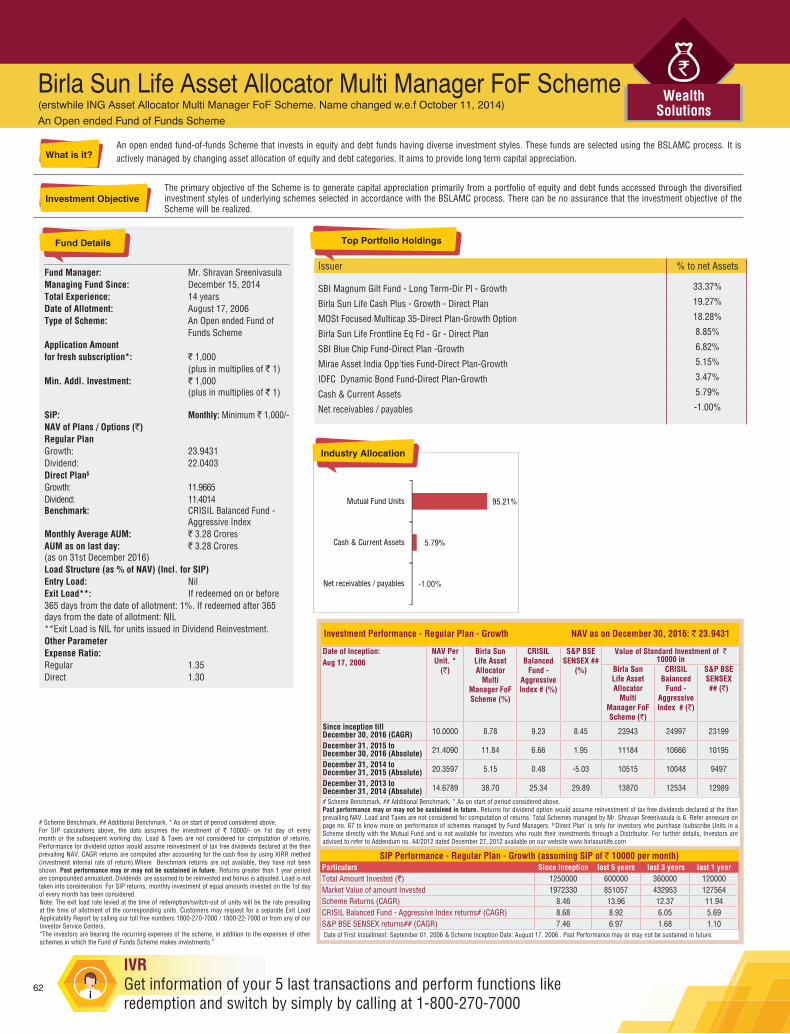
An open ended fund-of-funds Scheme that invests in equity and debt funds having diverse investment styles. These funds are selected using the BSLAMC process. It is actively managed by changing asset allocation of equity and debt categories. It aims to provide long term capital appreciation.
The primary objective of the Scheme is to generate capital appreciation primarily from a portfolio of equity and debt funds accessed through the diversified investment styles of underlying schemes selected in accordance with the BSLAMC process. There can be no assurance that the investment objective of the Scheme will be realized.
Fund Manager: Mr. Shravan SreenivasulaManaging Fund Since: December 15, 2014Total Experience: 14 yearsDate of Allotment: August 17, 2006Type of Scheme: An Open ended Fund of Funds SchemeApplication Amount for fresh subscription*: ` 1,000 (plus in multiplies of ` 1)Min. Addl. Investment: ` 1,000 (plus in multiplies of ` 1)
SIP: Monthly: Minimum ` 1,000/-NAV of Plans / Options (`)Regular Plan Growth: 23.9431Dividend: 22.0403Direct Plan$ Growth: 11.9665Dividend: 11.4014Benchmark: CRISIL Balanced Fund - Aggressive IndexMonthly Average AUM: ` 3.28 CroresAUM as on last day: ` 3.28 Crores(as on 31st December 2016)Load Structure (as % of NAV) (Incl. for SIP)Entry Load: NilExit Load**: If redeemed on or before365 days from the date of allotment: 1%. If redeemed after 365 days from the date of allotment: NIL**Exit Load is NIL for units issued in Dividend Reinvestment.Other ParameterExpense Ratio:Regular 1.35Direct 1.30
Birla Sun Life Asset Allocator Multi Manager FoF Scheme(erstwhile ING Asset Allocator Multi Manager FoF Scheme. Name changed w.e.f October 11, 2014)An Open ended Fund of Funds Scheme
Issuer % to net Assets
SBI Magnum Gilt Fund - Long Term-Dir Pl - Growth 33.37%
Birla Sun Life Cash Plus - Growth - Direct Plan 19.27%
MOSt Focused Multicap 35-Direct Plan-Growth Option 18.28%
Birla Sun Life Frontline Eq Fd - Gr - Direct Plan 8.85%
SBI Blue Chip Fund-Direct Plan -Growth 6.82%
Mirae Asset India Opp'ties Fund-Direct Plan-Growth 5.15%
IDFC Dynamic Bond Fund-Direct Plan-Growth 3.47%
Cash & Current Assets 5.79%
Net receivables / payables -1.00%
Top Portfolio Holdings
Investment Performance - Regular Plan - Growth NAV as on December 30, 2016: ` 23.9431
Date of Inception: Aug 17, 2006
NAV Per Unit. *
(`)
Birla SunLife AssetAllocator
MultiManager FoFScheme (%)
CRISILBalanced
Fund -AggressiveIndex # (%)
S&P BSESENSEX ##
(%)
Value of Standard Investment of ` 10000 in
Birla SunLife AssetAllocator
MultiManager FoFScheme (`)
CRISILBalanced
Fund -AggressiveIndex # (`)
S&P BSESENSEX ## (`)
Since inception till December 30, 2016 (CAGR) 10.0000 8.78 9.23 8.45 23943 24997 23199
December 31, 2015 to December 30, 2016 (Absolute) 21.4090 11.84 6.66 1.95 11184 10666 10195
December 31, 2014 toDecember 31, 2015 (Absolute) 20.3597 5.15 0.48 -5.03 10515 10048 9497
December 31, 2013 toDecember 31, 2014 (Absolute) 14.6789 38.70 25.34 29.89 13870 12534 12989
# Scheme Benchmark, ## Additional Benchmark, * As on start of period considered above.Past performance may or may not be sustained in future. Returns for dividend option would assume reinvestment of tax free dividends declared at the then prevailing NAV. Load and Taxes are not considered for computation of returns. Total Schemes managed by Mr. Shravan Sreenivasula is 6. Refer annexure on page no. 67 to know more on performance of schemes managed by Fund Managers. $‘Direct Plan’ is only for investors who purchase /subscribe Units in a Scheme directly with the Mutual Fund and is not available for investors who route their investments through a Distributor. For further details, Investors are advised to refer to Addendum no. 44/2012 dated December 27, 2012 available on our website www.birlasunlife.com
SIP Performance - Regular Plan - Growth (assuming SIP of ` 10000 per month)Particulars Since Inception last 5 years last 3 years last 1 yearTotal Amount Invested (`) 1250000 600000 360000 120000Market Value of amount Invested 1972330 851057 432953 127564Scheme Returns (CAGR) 8.46 13.96 12.37 11.94CRISIL Balanced Fund - Aggressive Index returns# (CAGR) 8.68 8.92 6.05 5.69S&P BSE SENSEX returns## (CAGR) 7.46 6.97 1.68 1.10Date of First Installment: September 01, 2006 & Scheme Inception Date: August 17, 2006 . Past Performance may or may not be sustained in future.
Note: The exit load rate levied at the time of redemption/switch-out of units will be the rate prevailing at the time of allotment of the corresponding units. Customers may request for a separate Exit Load Applicability Report by calling our toll free numbers 1800-270-7000 / 1800-22-7000 or from any of our Investor Service Centers.“The investors are bearing the recurring expenses of the scheme, in addition to the expenses of other schemes in which the Fund of Funds Scheme makes investments.”
# Scheme Benchmark, ## Additional Benchmark, * As on start of period considered above.For SIP calculations above, the data assumes the investment of ` 10000/- on 1st day of every month or the subsequent working day. Load & Taxes are not considered for computation of returns. Performance for dividend option would assume reinvestment of tax free dividends declared at the then prevailing NAV. CAGR returns are computed after accounting for the cash flow by using XIRR method (investment internal rate of return).Where Benchmark returns are not available, they have not been shown. Past performance may or may not be sustained in future. Returns greater than 1 year period are compounded annualized. Dividends are assumed to be reinvested and bonus is adjusted. Load is not taken into consideration. For SIP returns, monthly investment of equal amounts invested on the 1st day of every month has been considered.
5.79%
95.21%
Net receivables / payables
Cash & Current Assets
Mutual Fund Units
-1.00%
62

An open ended fund-of-funds Scheme following the financial planning discipline with exposure to equity, debt and gold funds. It is suitable for investors with aggressive risk profile. It aims to provide long term capital appreciation. (Please consult your financial advisor for your risk profile)
The Scheme aims to generate returns by investing in mutual fund schemes selected in accordance with the BSLAMC process, as per the risk-return profile of investors. Each of the 3 plans under the Scheme has a strategic asset allocation which is based on satisfying the needs to a specific risk-return profile of investors. There can be no assurance that the investment objective of the Scheme will be realized.
Fund Manager: Mr. Shravan SreenivasulaManaging Fund Since: December 15, 2014Total Experience: 14 yearsDate of Allotment: May 09, 2011Type of Scheme: An Open ended Fund of Funds SchemeApplication Amount for fresh subscription*: ` 1,000 (plus in multiplies of ` 1)Min. Addl. Investment: ` 1,000 (plus in multiplies of ` 1)
SIP: Monthly: Minimum ` 1,000/-NAV of Plans / Options (`)Regular Plan Growth: 17.7787Dividend: 16.2717Direct Plan$ Growth: 18.2019Dividend: 16.6729Benchmark: 70% Nifty 50 + 15% CRISILLiquid Fund index + 10% CRISIL Composite Bond Fund index + 5% INR price of GoldMonthly Average AUM: ` 112.12 CroresAUM as on last day: ` 112.58 Crores(as on 31st December 2016)Load Structure (as % of NAV) (Incl. for SIP)Entry Load: NilExit Load**: For redemption/switch outof units within 365 days from the date of allotment: 1.00% of applicable NAV. For redemption/switch out of units after 365 days from the date of allotment: Nil**Exit Load is NIL for units issued in Dividend Reinvestment.Other ParameterExpense Ratio:Regular 1.33Direct 0.58
Birla Sun Life Financial Planning FOF - Aggressive Plan(erstwhile ING Financial Planning Fund - Aggressive Plan. Name changed w.e.f October 11, 2014)An Open ended Fund of Funds Scheme
Issuer % to net Assets
MOSt Focused Multicap 35-Direct Plan-Growth Option 15.36%Birla Sun Life Advantage Fund - Gr - Dir Pl 15.24%Birla Sun Life Frontline Eq Fd - Gr - Direct Plan 14.08%Birla Sun Life Cash Plus - Growth - Direct Plan 13.38%SBI Blue Chip Fund-Direct Plan -Growth 13.16%Mirae Asset India Opp'ties Fund-Direct Plan-Growth 12.39%Birla Sun Life MediumTerm Plan -Gr - Direct Plan 6.37%R*Shares Gold BeES 2.63%SBI Magnum Gilt Fund - Long Term-Dir Pl - Growth 2.40%IDFC Dynamic Bond Fund-Direct Plan-Growth 2.30%
Top Ten Portfolio Holdings
Note: The exit load rate levied at the time of redemption/switch-out of units will be the rate prevailing at the time of allotment of the corresponding units. Customers may request for a separate Exit Load Applicability Report by calling our toll free numbers 1800-270-7000 / 1800-22-7000 or from any of our Investor Service Centers.“The investors are bearing the recurring expenses of the scheme, in addition to the expenses of other schemes in which the Fund of Funds Scheme makes investments.”
Investment Performance - Regular Plan - Growth NAV as on December 30, 2016: ` 17.7787Date of Inception: May 09, 2011
NAV Per Unit. *
(`)
BirlaSun LifeFinancialPlanning
FOFAggressivePlan (%)
70% Nifty50 + 15%
CRISILLiquid Fundindex + 10%
CRISILCompositeBond Fund
index +5% INRprice of
Gold # (%)
CRISIL10
YearGilt
Index ## (%)
S&PBSE
SENSEX ## (%)
Value of Standard Investment of ` 10000 inBirla
Sun LifeFinancialPlanning
FOFAggressive
Plan (`)
70% Nifty 50 +15% CRISILLiquid Fundindex + 10%
CRISILCompositeBond Fund
index +5% INR priceof Gold # (`)
CRISIL10 Year
GiltIndex ## (`)
S&PBSE
SENSEX ## (`)
Since inception till December 30, 2016 (CAGR) 10.0000 10.72 7.45 8.50 6.63 17779 15011 15852 14370December 31, 2015 to December 30, 2016 (Absolute) 16.5392 7.49 5.08 14.97 1.95 10749 10508 11497 10195December 31, 2014 toDecember 31, 2015 (Absolute) 15.8352 4.45 -1.27 7.39 -5.03 10445 9873 10739 9497December 31, 2013 toDecember 31, 2014 (Absolute) 11.5498 37.10 24.35 14.14 29.89 13710 12435 11414 12989# Scheme Benchmark, ## Additional Benchmark, * As on start of period considered above.Past performance may or may not be sustained in future. Returns for dividend option would assume reinvestment of tax free dividends declared at the then prevailing NAV. Load and Taxes are not considered for computation of returns. Total Schemes managed by Mr. Shravan Sreenivasula is 6. Refer annexure on page no. 67 to know more on performance of schemes managed by Fund Managers. $‘Direct Plan’ is only for investors who purchase /subscribe Units in a Scheme directly with the Mutual Fund and is not available for investors who route their investments through a Distributor. For further details, Investors are advised to refer to Addendum no. 44/2012 dated December 27, 2012 available on our website www.birlasunlife.com
SIP Performance - Regular Plan - Growth (assuming SIP of ` 10000 per month)Particulars Since Inception last 5 years last 3 years last 1 yearTotal Amount Invested (`) 680000 600000 360000 120000Market Value of amount Invested 963635 819348 413004 123199Scheme Returns (CAGR) 12.21 12.43 9.14 5.0070% Nifty 50 + 15% CRISIL Liquid Fund index + 10% CRISIL Composite Bond Fund index + 5% INR price of Gold returns# (CAGR)
7.71 7.55 4.26 3.12
CRISIL 10 Year Gilt Index returns# (CAGR) 9.87 10.21 12.60 15.90S&P BSE SENSEX returns## (CAGR) 7.23 6.97 1.68 1.10Date of First Installment: June 01, 2011 & Scheme Inception Date: May 09, 2011 . Past Performance may or may not be sustained in future.
# Scheme Benchmark, ## Additional Benchmark, * As on start of period considered above.For SIP calculations above, the data assumes the investment of ` 10000/- on 1st day of every month or the subsequent working day. Load & Taxes are not considered for computation of returns. Performance for dividend option would assume reinvestment of tax free dividends declared at the then prevailing NAV. CAGR returns are computed after accounting for the cash flow by using XIRR method (investment internal rate of return).Where Benchmark returns are not available, they have not been shown. Past performance may or may not be sustained in future. Returns greater than 1 year period are compounded annualized. Dividends are assumed to be reinvested and bonus is adjusted. Load is not taken into consideration. For SIP returns, monthly investment of equal amounts invested on the 1st day of every month has been considered.
1.20%
4.31%
94.67%
Net receivables / payables
Cash & Current Assets
Exchange Traded Fund
Mutual Fund Units
http://mutualfund.birlasunlife.com https://twitter.com/bslmf
https://www.facebook.com/bslmf https://www.linkedin.com/company/bslmf63
-0.17%

Birla Sun Life Capital Protection Oriented Fund - Series 18 - Regular Plan
Date of Inception: Feb 03, 2014Fund Manager: Mr. Prasad Dhonde / Mr. Vineet MalooNAV (as on 30th December 2016): ` 12.6912
NAV Per Unit. *
(`)
Birla Sunlife CapitalProtectionOriented- Series 18 (%)
CRISIL MIP Blended
Index # (%)
CRISIL 1Year T-BillIndex ##
(%)
Value of Standard Investment of ` 10000 in
Birla Sunlife CapitalProtectionOriented
- Series 18 (`)
CRISIL MIP Blended
Index # (`)
CRISIL 1Year T-BillIndex ## (`)
Since inception till December 30, 2016 (CAGR) 10.0000 8.54 12.03 8.03 12691 13912 12518
December 31, 2015 to December 30, 2016 (Absolute) 12.0478 5.34 11.55 7.27 10534 11155 10727
December 31, 2014 toDecember 31, 2015 (Absolute) 11.4743 5.00 6.79 8.22 10500 10679 10822
# Scheme Benchmark, ## Additional Benchmark, * As on start of period considered above.Past performance may or may not be sustained in future. Load and Taxes are not considered for computation of returns.Total Schemes Co-Managed by Fund Managers is 11. Total Schemes managed by Mr. Prasad Dhonde is 23. Total Schemes managed by Mr. Vineet Maloo is 18. Refer annexure on page no. 67 to know more on performance of schemes managed by Fund Managers.The Scheme offered is “oriented towards protection of capital” and “not with guaranteed returns”. The orientation towards protection of the capital originates from the portfolio structure of the scheme and not from any bank guarantee, insurance cover, etc.
Birla Sun Life Capital Protection Oriented Fund - Series 19 - Regular Plan
Date of Inception: Mar 06, 2014Fund Manager: Mr. Prasad Dhonde / Mr. Vineet MalooNAV (as on 30th December 2016): ` 12.3763
NAV Per Unit. *
(`)
Birla Sunlife CapitalProtectionOriented- Series 19 (%)
CRISIL MIP Blended
Index # (%)
CRISIL 1Year T-BillIndex ##
(%)
Value of Standard Investment of ` 10000 in
Birla Sunlife CapitalProtectionOriented
- Series 19 (`)
CRISIL MIP Blended
Index # (`)
CRISIL 1Year T-BillIndex ## (`)
Since inception till December 30, 2016 (CAGR) 10.0000 7.85 11.87 8.06 12376 13722 12446
December 31, 2015 to December 30, 2016 (Absolute) 11.7378 5.44 11.55 7.27 10544 11155 10727
December 31, 2014 toDecember 31, 2015 (Absolute) 11.2205 4.61 6.79 8.22 10461 10679 10822
# Scheme Benchmark, ## Additional Benchmark, * As on start of period considered above.Past performance may or may not be sustained in future. Load and Taxes are not considered for computation of returns.Total Schemes Co-Managed by Fund Managers is 11. Total Schemes managed by Mr. Prasad Dhonde is 23. Total Schemes managed by Mr. Vineet Maloo is 18. Refer annexure on page no. 67 to know more on performance of schemes managed by Fund Managers.The Scheme offered is “oriented towards protection of capital” and “not with guaranteed returns”. The orientation towards protection of the capital originates from the portfolio structure of the scheme and not from any bank guarantee, insurance cover, etc.
Birla Sun Life Capital Protection Oriented Fund - Series 20 - Regular Plan
Date of Inception: Apr 30, 2014Fund Manager: Mr. Prasad Dhonde / Mr. Vineet MalooNAV (as on 30th December 2016): ` 12.1662
NAV Per Unit. *
(`)
Birla Sunlife CapitalProtectionOriented- Series 20 (%)
CRISIL MIP Blended
Index # (%)
CRISIL 1Year T-BillIndex ##
(%)
Value of Standard Investment of ` 10000 in
Birla Sunlife CapitalProtectionOriented
- Series 20 (`)
CRISIL MIP Blended
Index # (`)
CRISIL 1Year T-BillIndex ## (`)
Since inception till December 30, 2016 (CAGR) 10.0000 7.62 11.51 8.02 12166 13378 12288
December 31, 2015 to December 30, 2016 (Absolute) 11.5344 5.48 11.55 7.27 10548 11155 10727
December 31, 2014 toDecember 31, 2015 (Absolute) 10.9886 4.97 6.79 8.22 10497 10679 10822
# Scheme Benchmark, ## Additional Benchmark, * As on start of period considered above.Past performance may or may not be sustained in future. Load and Taxes are not considered for computation of returns.Total Schemes Co-Managed by Fund Managers is 11. Total Schemes managed by Mr. Prasad Dhonde is 23. Total Schemes managed by Mr. Vineet Maloo is 18. Refer annexure on page no. 67 to know more on performance of schemes managed by Fund Managers.The Scheme offered is “oriented towards protection of capital” and “not with guaranteed returns”. The orientation towards protection of the capital originates from the portfolio structure of the scheme and not from any bank guarantee, insurance cover, etc.
Birla Sun Life Capital Protection Oriented Fund - Series 21 - Regular Plan
Date of Inception: Jun 09, 2014Fund Manager: Mr. Prasad Dhonde / Mr. Vineet MalooNAV (as on 30th December 2016): ` 11.7729
NAV Per Unit. *
(`)
Birla Sunlife CapitalProtectionOriented- Series 21 (%)
CRISIL MIP Blended
Index # (%)
CRISIL 1Year T-BillIndex ##
(%)
Value of Standard Investment of ` 10000 in
Birla Sunlife CapitalProtectionOriented
- Series 21 (`)
CRISIL MIP Blended
Index # (`)
CRISIL 1Year T-BillIndex ## (`)
Since inception till December 30, 2016 (CAGR) 10.0000 6.58 10.11 7.89 11773 12798 12147
December 31, 2015 to December 30, 2016 (Absolute) 11.1197 5.87 11.55 7.27 10587 11155 10727
December 31, 2014 toDecember 31, 2015 (Absolute) 10.5952 4.95 6.79 8.22 10495 10679 10822
# Scheme Benchmark, ## Additional Benchmark, * As on start of period considered above.Past performance may or may not be sustained in future. Load and Taxes are not considered for computation of returns.Total Schemes Co-Managed by Fund Managers is 11. Total Schemes managed by Mr. Prasad Dhonde is 23. Total Schemes managed by Mr. Vineet Maloo is 18. Refer annexure on page no. 67 to know more on performance of schemes managed by Fund Managers.The Scheme offered is “oriented towards protection of capital” and “not with guaranteed returns”. The orientation towards protection of the capital originates from the portfolio structure of the scheme and not from any bank guarantee, insurance cover, etc.
Birla Sun Life Capital Protection Oriented Fund - Series 22 - Regular Plan
Date of Inception: Aug 13, 2014Fund Manager: Mr. Prasad Dhonde / Mr. Vineet MalooNAV (as on 30th December 2016): ` 11.6919
NAV Per Unit. *
(`)
Birla Sunlife CapitalProtectionOriented- Series 22 (%)
CRISIL MIP Blended
Index # (%)
CRISIL 1Year T-BillIndex ##
(%)
Value of Standard Investment of ` 10000 in
Birla Sunlife CapitalProtectionOriented
- Series 22 (`)
CRISIL MIP Blended
Index # (`)
CRISIL 1Year T-BillIndex ## (`)
Since inception till December 30, 2016 (CAGR) 10.0000 6.78 10.59 7.95 11692 12711 12000
December 31, 2015 to December 30, 2016 (Absolute) 11.0286 6.01 11.55 7.27 10601 11155 10727
December 31, 2014 toDecember 31, 2015 (Absolute) 10.4945 5.09 6.79 8.22 10509 10679 10822
# Scheme Benchmark, ## Additional Benchmark, * As on start of period considered above.Past performance may or may not be sustained in future. Load and Taxes are not considered for computation of returns.Total Schemes Co-Managed by Fund Managers is 11. Total Schemes managed by Mr. Prasad Dhonde is 23. Total Schemes managed by Mr. Vineet Maloo is 18. Refer annexure on page no. 67 to know more on performance of schemes managed by Fund Managers.The Scheme offered is “oriented towards protection of capital” and “not with guaranteed returns”. The orientation towards protection of the capital originates from the portfolio structure of the scheme and not from any bank guarantee, insurance cover, etc.
Birla Sun Life Capital Protection Oriented Fund - Series 23 - Regular Plan
Date of Inception: Sep 18, 2014Fund Manager: Mr. Prasad Dhonde / Mr. Vineet MalooNAV (as on 30th December 2016): ` 11.4812
NAV Per Unit. *
(`)
Birla Sunlife CapitalProtectionOriented- Series 23 (%)
CRISIL MIP Blended
Index # (%)
CRISIL 1Year T-BillIndex ##
(%)
Value of Standard Investment of ` 10000 in
Birla Sunlife CapitalProtectionOriented
- Series 23 (`)
CRISIL MIP Blended
Index # (`)
CRISIL 1Year T-BillIndex ## (`)
Since inception till December 30, 2016 (CAGR) 10.0000 6.23 10.18 7.92 11481 12479 11903
December 31, 2015 to December 30, 2016 (Absolute) 10.8778 5.55 11.55 7.27 10555 11155 10727
December 31, 2014 toDecember 31, 2015 (Absolute) 10.3728 4.87 6.79 8.22 10487 10679 10822
# Scheme Benchmark, ## Additional Benchmark, * As on start of period considered above.Past performance may or may not be sustained in future. Load and Taxes are not considered for computation of returns.Total Schemes Co-Managed by Fund Managers is 11. Total Schemes managed by Mr. Prasad Dhonde is 23. Total Schemes managed by Mr. Vineet Maloo is 18. Refer annexure on page no. 67 to know more on performance of schemes managed by Fund Managers.The Scheme offered is “oriented towards protection of capital” and “not with guaranteed returns”. The orientation towards protection of the capital originates from the portfolio structure of the scheme and not from any bank guarantee, insurance cover, etc.
Close Ended Scheme Performance
64
Birla Sun Life Capital Protection Oriented Fund - Series 25 - Regular Plan
Date of Inception: Nov 26, 2014Fund Manager: Mr. Prasad Dhonde / Mr. Ajay GargNAV (as on 30th December 2016): ` 10.0825
NAV Per Unit. *
(`)
Birla Sunlife CapitalProtectionOriented- Series 25 (%)
CRISIL MIP Blended
Index # (%)
CRISIL 1Year T-BillIndex ##
(%)
Value of Standard Investment of ` 10000 in
Birla Sunlife CapitalProtectionOriented
- Series 25 (`)
CRISIL MIP Blended
Index # (`)
CRISIL 1Year T-BillIndex ## (`)
Since inception till December 30, 2016 (CAGR) 10.0000 0.39 9.18 7.80 10083 12020 11705
December 31, 2015 to December 30, 2016 (Absolute) 9.8715 2.14 11.55 7.27 10214 11155 10727
December 31, 2014 to December 30, 2015 (Absolute) 9.8327 0.39 6.79 8.22 10039 10679 10822
# Scheme Benchmark, ## Additional Benchmark, * As on start of period considered above.Past performance may or may not be sustained in future. Load and Taxes are not considered for computation of returns.Total Schemes Co-Managed by Fund Managers is 3. Total Schemes managed by Mr. Prasad Dhonde is 23. TotalSchemes managed by Mr. Ajay Garg is 8. Refer annexure on page no. 67 to know more on performance of schemesmanaged by Fund Managers.The Scheme offered is “oriented towards protection of capital” and “not with guaranteed returns”. The orientation towards protection of the capital originates from the portfolio structure of the scheme and not from any bank guarantee, insurance cover, etc.
Birla Sun Life Capital Protection Oriented Fund - Series 26 - Regular Plan
Date of Inception: Mar 30, 2015Fund Manager: Mr. Prasad Dhonde / Mr. Ajay GargNAV (as on 30th December 2016): ` 9.9996
NAV Per Unit. *
(`)
Birla Sunlife CapitalProtectionOriented- Series 26 (%)
CRISIL MIP Blended
Index # (%)
CRISIL 1Year T-BillIndex ##
(%)
Value of Standard Investment of ` 10000 in
Birla Sunlife CapitalProtectionOriented
- Series 26 (`)
CRISIL MIP Blended
Index # (`)
CRISIL 1Year T-BillIndex ## (`)
Since inception till December 30, 2016 (CAGR) 10.0000 0.00 8.84 7.64 10000 11604 11379
December 31, 2015 to December 30, 2016 (Absolute) 9.4736 5.55 11.55 7.27 10555 11155 10727
# Scheme Benchmark, ## Additional Benchmark, * As on start of period considered above.Past performance may or may not be sustained in future. Load and Taxes are not considered for computation of returns.Total Schemes Co-Managed by Fund Managers is 3. Total Schemes managed by Mr. Prasad Dhonde is 23. TotalSchemes managed by Mr. Ajay Garg is 8. Refer annexure on page no. 67 to know more on performance of schemesmanaged by Fund Managers.The Scheme offered is “oriented towards protection of capital” and “not with guaranteed returns”. The orientation towards protection of the capital originates from the portfolio structure of the scheme and not from any bank guarantee, insurance cover, etc.

Birla Sun Life Capital Protection Oriented Fund - Series 29 - Regular Plan
Date of Inception: Dec 10, 2015Fund Manager: Mr. Prasad Dhonde / Mr. Vineet MalooNAV (as on 30th December 2016): ` 10.8709
NAV Per Unit. *
(`)
Birla Sunlife CapitalProtectionOriented- Series 29 (%)
CRISIL MIP Blended
Index # (%)
CRISIL 1Year T-BillIndex ##
(%)
Value of Standard Investment of ` 10000 in
Birla Sunlife CapitalProtectionOriented
- Series 29 (`)
CRISIL MIP Blended
Index # (`)
CRISIL 1Year T-BillIndex ## (`)
Since inception till December 30, 2016 (CAGR) 10.0000 8.22 11.75 7.24 10871 11246 10767
December 31, 2015 to December 30, 2016 (Absolute) 10.0407 8.27 11.55 7.27 10827 11155 10727
# Scheme Benchmark, ## Additional Benchmark, * As on start of period considered above.Past performance may or may not be sustained in future. Load and Taxes are not considered for computation of returns.Total Schemes Co-Managed by Fund Managers is 11. Total Schemes managed by Mr. Prasad Dhonde is 23. Total Schemes managed by Mr. Vineet Maloo is 18. Refer annexure on page no. 67 to know more on performance of schemes managed by Fund Managers.The Scheme offered is “oriented towards protection of capital” and “not with guaranteed returns”. The orientation towards protection of the capital originates from the portfolio structure of the scheme and not from any bank guarantee, insurance cover, etc.
Birla Sun Life Emerging Leaders Fund - Series 1 - Regular Plan - Growth
Date of Inception: May 09, 2014Fund Manager: Mr. Jayesh GandhiNAV (as on 30th December 2016): ` 17.1900
NAV Per Unit. *
(`)
Birla Sun Life Emerging
Leaders Fund - Series 1 (%)
S&P BSE MidCap # (%)
Nifty 50 ##(%)
Value of Standard Investment of ` 10000 in
Birla Sun Life Emerging
Leaders Fund - Series 1 (`)
S&P BSE MidCap
# (`)
Nifty 50 ## (`)
Since inception till December 30, 2016 (CAGR) 10.0000 22.72 19.82 6.91 17190 16136 11935
December 31, 2015 to December 30, 2016 (Absolute) 16.1900 6.18 7.97 3.01 10618 10797 10301
December 31, 2014 toDecember 31, 2015 (Absolute) 14.9200 8.51 7.43 -4.06 10851 10743 9594
# Scheme Benchmark, ## Additional Benchmark, * As on start of period considered above.Past performance may or may not be sustained in future. Load and Taxes are not considered for computation of returns.Total Schemes managed by Mr. Jayesh Gandhi is 5. Refer annexure on page no. 67 to know more on performance ofschemes managed by Fund Managers.
Birla Sun Life Emerging Leaders Fund - Series 3 - Regular Plan - Growth
Date of Inception: Jul 08, 2014Fund Manager: Mr. Mahesh Patil & Mr. Milind BafnaNAV (as on 30th December 2016): ` 10.6900
NAV Per Unit. *
(`)
Birla Sun Life Emerging
Leaders Fund - Series 3 (%)
S&P BSE MidCap # (%)
Nifty 50 ##(%)
Value of Standard Investment of ` 10000 in
Birla Sun Life Emerging
Leaders Fund - Series 3 (`)
S&P BSE MidCap
# (`)
Nifty 50 ## (`)
Since inception till December 30, 2016 (CAGR) 10.0000 2.72 11.37 2.91 10690 13063 10738
December 31, 2015 to December 30, 2016 (Absolute) 11.3000 -5.40 7.97 3.01 9460 10797 10301
December 31, 2014 toDecember 31, 2015 (Absolute) 11.0400 2.36 7.43 -4.06 10236 10743 9594
# Scheme Benchmark, ## Additional Benchmark, * As on start of period considered above.Past performance may or may not be sustained in future. Load and Taxes are not considered for computation of returns.Total Schemes Co-Managed by Fund Managers is 3. Total Schemes managed by Mr. Mahesh Patil is 8. Total Schemesmanaged by Mr. Milind Bafna is 4. Refer annexure on page no. 67 to know more on performance of schemes managedby Fund Managers.
Birla Sun Life Emerging Leaders Fund - Series 4 - Regular Plan - Growth
Date of Inception: Aug 06, 2014Fund Manager: Mr. Mahesh Patil & Mr. Milind BafnaNAV (as on 30th December 2016): ` 13.1900
NAV Per Unit. *
(`)
Birla Sun Life Emerging
Leaders Fund - Series 4 (%)
S&P BSE MidCap # (%)
Nifty 50 ##(%)
Value of Standard Investment of ` 10000 in
Birla Sun Life Emerging
Leaders Fund - Series 4 (`)
S&P BSE MidCap
# (`)
Nifty 50 ## (`)
Since inception till December 30, 2016 (CAGR) 10.0000 12.21 11.81 2.73 13190 13076 10670
December 31, 2015 to December 30, 2016 (Absolute) 11.7300 12.45 7.97 3.01 11245 10797 10301
December 31, 2014 toDecember 31, 2015 (Absolute) 11.6400 0.77 7.43 -4.06 10077 10743 9594
# Scheme Benchmark, ## Additional Benchmark, * As on start of period considered above.Past performance may or may not be sustained in future. Load and Taxes are not considered for computation of returns.Total Schemes Co-Managed by Fund Managers is 3. Total Schemes managed by Mr. Mahesh Patil is 8. Total Schemesmanaged by Mr. Milind Bafna is 4. Refer annexure on page no. 67 to know more on performance of schemes managedby Fund Managers.
Birla Sun Life Emerging Leaders Fund - Series 5 - Regular Plan - Growth
Date of Inception: Jan 01, 2015Fund Manager: Mr. Jayesh GandhiNAV (as on 30th December 2016): ` 11.6000
NAV Per Unit. *
(`)
Birla Sun Life Emerging
Leaders Fund - Series 5 (%)
S&P BSE MidCap # (%)
Nifty 50 ##(%)
Value of Standard Investment of ` 10000 in
Birla Sun Life Emerging
Leaders Fund - Series 5 (`)
S&P BSE MidCap
# (`)
Nifty 50 ## (`)
Since inception till December 30, 2016 (CAGR) 10.0000 7.71 7.36 -0.60 11600 11524 9881
December 31, 2015 to December 30, 2016 (Absolute) 10.4600 10.90 7.97 3.01 11090 10797 10301
# Scheme Benchmark, ## Additional Benchmark, * As on start of period considered above.Past performance may or may not be sustained in future. Load and Taxes are not considered for computation of returns.Total Schemes managed by Mr. Jayesh Gandhi is 5. Refer annexure on page no. 67 to know more on performance ofschemes managed by Fund Managers.
Birla Sun Life Emerging Leaders Fund - Series 6 - Regular Plan - Growth
Date of Inception: Apr 17, 2015Fund Manager: Mr. Satyabrata MohantyNAV (as on 30th December 2016): ` 10.8100
NAV Per Unit. *
(`)
Birla Sun Life Emerging
Leaders Fund - Series 6 (%)
S&P BSE MidCap # (%)
Nifty 50 ##(%)
Value of Standard Investment of ` 10000 in
Birla Sun Life Emerging
Leaders Fund - Series 6 (`)
S&P BSE MidCap
# (`)
Nifty 50 ## (`)
Since inception till December 30, 2016 (CAGR) 10.0000 4.67 6.69 -2.89 10810 11169 9512
December 31, 2015 to December 30, 2016 (Absolute) 10.0700 7.35 7.97 3.01 10735 10797 10301
# Scheme Benchmark, ## Additional Benchmark, * As on start of period considered above.Past performance may or may not be sustained in future. Load and Taxes are not considered for computation of returns.Total Schemes managed by Mr. Satyabrata Mohanty is 11. Refer annexure on page no. 67 to know more on performance of schemes managed by Fund Managers.
Close Ended Scheme Performance
http://mutualfund.birlasunlife.com https://twitter.com/bslmf
https://www.facebook.com/bslmf https://www.linkedin.com/company/bslmf65
Birla Sun Life Emerging Leaders Fund - Series 2 - Regular Plan - Growth
Date of Inception: Jun 05, 2014Fund Manager: Mr. Mahesh PatilNAV (as on 30th December 2016): ` 13.5600
NAV Per Unit. *
(`)
Birla Sun Life Emerging
Leaders Fund - Series 2 (%)
S&P BSE MidCap # (%)
Nifty 50 ##(%)
Value of Standard Investment of ` 10000 in
Birla Sun Life Emerging
Leaders Fund - Series 2 (`)
S&P BSE MidCap
# (`)
Nifty 50 ## (`)
Since inception till December 30, 2016 (CAGR) 10.0000 12.57 12.16 3.60 13560 13434 10952
December 31, 2015 to December 30, 2016 (Absolute) 12.9800 4.47 7.97 3.01 10447 10797 10301
December 31, 2014 toDecember 31, 2015 (Absolute) 11.9600 8.53 7.43 -4.06 10853 10743 9594
# Scheme Benchmark, ## Additional Benchmark, * As on start of period considered above.Past performance may or may not be sustained in future. Load and Taxes are not considered for computation of returns.Total Schemes managed by Mr. Mahesh Patil is 8. Refer annexure on page no. 67 to know more on performance of schemes managed by Fund Managers.
Birla Sun Life Focused Equity Fund - Series 1 - Regular Plan - Growth
Date of Inception: Feb 24, 2014Fund Manager: Mr. Anil ShahNAV (as on 30th December 2016): ` 14.8500
NAV Per Unit. *
(`)
Birla Sun Life Focused Equity Fund -
Series 1 (%)
Nifty 100 # (%)
Nifty 50 ##(%)
Value of Standard Investment of ` 10000 in
Birla Sun Life Focused Equity Fund - Series
1 (`)
Nifty 100 # (`)
Nifty 50 ## (`)
Since inception till December 30, 2016 (CAGR) 10.0000 14.89 12.07 10.33 14850 13835 13233
December 31, 2015 to December 30, 2016 (Absolute) 14.3800 3.27 3.60 3.01 10327 10360 10301
December 31, 2014 toDecember 31, 2015 (Absolute) 14.3600 0.14 -2.41 -4.06 10014 9759 9594
# Scheme Benchmark, ## Additional Benchmark, * As on start of period considered above.Past performance may or may not be sustained in future. Load and Taxes are not considered for computation of returns.Total Schemes managed by Anil Shah is 8. Refer annexure on page no. 67 to know more on performance of schemes managed by Fund Managers.

Performance details for close ended Capital Protection Oriented Schemes with less than 1 year of existence have not been disclosed.Schemes mentioned in order of performance for the period December 31, 2015 - December 30, 2016. Due to inherent difference in nature of schemes above (i.e. equity, hybrid, debt schemes) as may be managed by Fund Manager, performance of such schemes may not be strictly comparable. Further, for the schemes in existence for less than a year, the past performance details have not been provided. Further, performance of Fixed Term Plans (FTPs) / Fixed Maturity Plans (FMP) / Interval Income Schemes are not considered above, as FMPs / FTPs / Interval Income Schemes are close ended / interval schemes of varying maturities and performance of such schemes may not be strictly comparable with open ended schemes managed by Fund Managers.
Birla Sun Life Focused Equity Fund - Series 4 - Regular Plan - Growth
Date of Inception: Dec 19, 2014Fund Manager: Mr. Anil ShahNAV (as on 30th December 2016): ` 10.3700
NAV Per Unit. *
(`)
Birla Sun Life Focused Equity Fund -
Series 4 (%)
Nifty 100 # (%)
Nifty 50 ##(%)
Value of Standard Investment of ` 10000 in
Birla Sun Life Focused Equity Fund - Series
4 (`)
Nifty 100 # (`)
Nifty 50 ## (`)
Since inception till December 30, 2016 (CAGR) 10.0000 1.80 1.06 -0.24 10370 10218 9952
December 31, 2015 to December 30, 2016 (Absolute) 10.0500 3.18 3.60 3.01 10318 10360 10301
December 31, 2014 to December 31, 2015 (Absolute) 10.0100 0.40 -2.41 -4.06 10040 9759 9594
# Scheme Benchmark, ## Additional Benchmark, * As on start of period considered above.Past performance may or may not be sustained in future. Load and Taxes are not considered for computation of returns.Total Schemes managed by Anil Shah is 8. Refer annexure on page no. 67 to know more on performance of schemes managed by Fund Managers.
Birla Sun Life Focused Equity Fund - Series 5 - Regular Plan - Growth
Date of Inception: Mar 25, 2015Fund Manager: Mr. Anil ShahNAV (as on 30th December 2016): ` 9.9200
NAV Per Unit. *
(`)
Birla Sun Life Focused Equity Fund -
Series 5 (%)
Nifty 100 # (%)
Nifty 50 ##(%)
Value of Standard Investment of ` 10000 in
Birla Sun Life Focused Equity Fund - Series
5 (`)
Nifty 100 # (`)
Nifty 50 ## (`)
Since inception till December 30, 2016 (CAGR) 10.0000 -0.45 -1.09 -2.31 9920 9808 9596
December 31, 2015 to December 30, 2016 (Absolute) 9.5500 3.87 3.60 3.01 10387 10360 10301
# Scheme Benchmark, ## Additional Benchmark, * As on start of period considered above.Past performance may or may not be sustained in future. Load and Taxes are not considered for computation of returns.Total Schemes managed by Anil Shah is 8. Refer annexure on page no. 67 to know more on performance of schemes managed by Fund Managers.
Birla Sun Life Focused Equity Fund - Series 3 - Regular Plan - Growth
Date of Inception: Oct 30, 2014Fund Manager: Mr. Anil ShahNAV (as on 30th December 2016): ` 10.7700
NAV Per Unit. *
(`)
Birla Sun Life Focused Equity Fund -
Series 3 (%)
Nifty 100 # (%)
Nifty 50 ##(%)
Value of Standard Investment of ` 10000 in
Birla Sun Life Focused Equity Fund - Series
3 (`)
Nifty 100 # (`)
Nifty 50 ## (`)
Since inception till December 30, 2016 (CAGR) 10.0000 3.48 1.55 0.09 10770 10339 10020
December 31, 2015 to December 30, 2016 (Absolute) 10.4300 3.26 3.60 3.01 10326 10360 10301
December 31, 2014 to December 31, 2015 (Absolute) 10.3800 0.48 -2.41 -4.06 10048 9759 9594
# Scheme Benchmark, ## Additional Benchmark, * As on start of period considered above.Past performance may or may not be sustained in future. Load and Taxes are not considered for computation of returns.Total Schemes managed by Anil Shah is 8. Refer annexure on page no. 67 to know more on performance of schemes managed by Fund Managers.
Close Ended Scheme Performance
66
Birla Sun Life Focused Equity Fund - Series 2 - Regular Plan - Growth
Date of Inception: Mar 26, 2014Fund Manager: Mr. Anil ShahNAV (as on 30th December 2016): ` 14.3300
NAV Per Unit. *
(`)
Birla Sun Life Focused Equity Fund -
Series 2 (%)
Nifty 100 # (%)
Nifty 50 ##(%)
Value of Standard Investment of ` 10000 in
Birla Sun Life Focused Equity Fund - Series
2 (`)
Nifty 100 # (`)
Nifty 50 ## (`)
Since inception till December 30, 2016 (CAGR) 10.0000 13.88 9.78 8.08 14330 12947 12400
December 31, 2015 to December 30, 2016 (Absolute) 13.8900 3.17 3.60 3.01 10317 10360 10301
December 31, 2014 toDecember 31, 2015 (Absolute) 13.8800 0.07 -2.41 -4.06 10007 9759 9594
# Scheme Benchmark, ## Additional Benchmark, * As on start of period considered above.Past performance may or may not be sustained in future. Load and Taxes are not considered for computation of returns.Total Schemes managed by Anil Shah is 8. Refer annexure on page no. 67 to know more on performance of schemes managed by Fund Managers.
Birla Sun Life Focused Equity Fund - Series 6 - Regular Plan - Growth
Date of Inception: Oct 16, 2015Fund Manager: Mr. Satyabrata MohantyNAV (as on 30th December 2016): ` 10.7000
NAV Per Unit. *
(`)
Birla Sun Life Focused Equity Fund -
Series 6 (%)
Nifty 100 # (%)
Nifty 50 ##(%)
Value of Standard Investment of ` 10000 in
Birla Sun Life Focused Equity Fund - Series
6 (`)
Nifty 100 # (`)
Nifty 50 ## (`)
Since inception till December 30, 2016 (CAGR) 10.0000 5.76 0.42 -0.53 10700 10051 9936
December 31, 2015 to December 30, 2016 (Absolute) 9.8900 8.19 3.60 3.01 10819 10360 10301
# Scheme Benchmark, ## Additional Benchmark, * As on start of period considered above.Past performance may or may not be sustained in future. Load and Taxes are not considered for computation of returns.Total Schemes managed by Mr. Satyabrata Mohanty is 11. Refer annexure on page no. 67 to know more on performance of schemes managed by Fund Managers.

The Fund Manager-wise Scheme Details appearing above are As on December 30, 2016.
Fund Manager-wise Scheme Details
Sr.no Funds Managed By Mr. Prasad Dhonde Refer
page No1 Birla Sun Life Capital Protection Oriented Fund - Series 18$ 642 Birla Sun Life Capital Protection Oriented Fund - Series 19$ 643 Birla Sun Life Capital Protection Oriented Fund - Series 20$ 644 Birla Sun Life Capital Protection Oriented Fund - Series 21$ 645 Birla Sun Life Capital Protection Oriented Fund - Series 22$ 646 Birla Sun Life Capital Protection Oriented Fund - Series 23$ 647 Birla Sun Life Capital Protection Oriented Fund - Series 25# 648 Birla Sun Life Capital Protection Oriented Fund - Series 26# 649 Birla Sun Life Capital Protection Oriented Fund - Series 29# 65
10 Birla Sun Life Constant Maturity 10 Year Gilt Fund@
(erstwhile Birla Sun Life Gilt Plus – Regular Plan)16
11 Birla Sun Life Balanced Advantage Fund$ 3512 Birla Sun Life Floating Rate Fund - Long Term Plan@ 713 Birla Sun Life Gilt Plus - PF Plan@ 1814 Birla Sun Life Gold ETF 60
15 Birla Sun Life Government Securities Fund - Long Term Plan@
17
16 Birla Sun Life Income Plus 1517 Birla Sun Life Short Term Fund 9
18 Birla Sun Life Treasury Optimizer Plan@
(erstwhile Birla Sun Life Ultra Short Term Fund) 11# Funds co-managed by Mr. Ajay Garg$ Funds co-managed by Mr. Vineet Maloo@ Funds co-managed by Mr. Kaustubh Gupta$ Funds co-managed by Mr. Dhaval Shah
Sr.no Funds Managed By Mr. Chanchal Khandelwal Refer
page No1 Birla Sun Life India GenNext Fund* 53
*Funds co-managed by Mr. Anil Shah
Sr.no Funds Managed By Mr. Kunal Sangoi Refer
page No1 Birla Sun Life India Opportunities Fund 542 Birla Sun Life New Millennium Fund 52
Sr.no Funds Managed By Mr. Dhaval Gala Refer
page No1 Birla Sun Life Banking and Financial Services Fund@ 47
@ Funds co-managed by Mr. Satyabrata Mohanty
Sr.no Funds Managed By Mr. Kaustubh Gupta Refer
page No1 Birla Sun Life Cash Manager# 52 Birla Sun Life Cash Plus# 3
3 Birla Sun Life Constant Maturity 10 Year Gilt Fund$
(erstwhile Birla Sun Life Gilt Plus – Regular Plan) 16
4 Birla Sun Life Floating Rate Fund - Long Term Plan$ 75 Birla Sun Life Floating Rate Fund - Short Term Plan# 46 Birla Sun Life Gilt Plus - PF Plan$ 187 Birla Sun Life Government Securities Fund -Long Term Plan$ 178 Birla Sun Life Savings Fund# 69 Birla Sun Life Short Term Opportunities Fund# 10
10 Birla Sun Life Treasury Optimizer Plan$
(erstwhile Birla Sun Life Ultra Short Term Fund) 11# Funds co-managed by Ms. Sunaina Da Cunha $ Funds co-managed by Mr. Prasad Dhonde
Sr.no Funds Managed By Mr. Ajay Garg Refer
page No1 Birla Sun Life Capital Protection Oriented Fund - Series 25# 642 Birla Sun Life Capital Protection Oriented Fund - Series 26# 643 Birla Sun Life Index Fund 374 Birla Sun Life MNC Fund 425 Birla Sun Life Tax Plan 296 Birla Sun Life Tax Relief ‘96 287 Birla Sun Life Tax Savings Fund 30
# Funds co-managed by Mr. Prasad Dhonde
Sr.no Funds Managed By Mr. Mahesh Patil Refer
page No1 Birla Sun Life Balanced ‘95 Fund#^ 362 Birla Sun Life Emerging Leaders Fund - Series 2 653 Birla Sun Life Emerging Leaders Fund - Series 3@ 654 Birla Sun Life Emerging Leaders Fund - Series 4@ 655 Birla Sun Life Frontline Equity Fund 386 Birla Sun Life Infrastructure Fund 517 Birla Sun Life Pure Value Fund@ 458 Birla Sun Life Top 100 Fund 39
# Funds co-managed by Mr. Pranay Sinha@ Funds co-managed by Mr. Milind Bafna^ Funds co-managed by Mr. Dhaval Shah Sr.
no Funds Managed By Mr. Satyabrata Mohanty Refer page No
1 Birla Sun Life Advantage Fund 412 Birla Sun Life Banking and Financial Services Fund@ 473 Birla Sun Life Dividend Yield Plus# 484 Birla Sun Life Emerging Leaders Fund - Series 6 655 Birla Sun Life Equity Savings Fund*^ 346 Birla Sun Life Focused Equity Fund - Series 6 667 Birla Sun Life India Reforms Fund 508 Birla Sun Life MIP II - Savings 5 Plan*# 239 Birla Sun Life MIP II - Wealth 25 Plan*# 2610 Birla Sun Life Special Situations Fund 49
* Funds co-managed by Mr. Pranay Sinha # Funds co-managed by Mr. Vineet Maloo^ Funds co-managed by Mr. Lovelish Solanki@ Funds co-managed by Mr. Dhaval Gala
Sr.no Funds Managed By Mr. Jayesh Gandhi Refer
page No1 Birla Sun Life Emerging Leaders Fund - Series 1 652 Birla Sun Life Emerging Leaders Fund - Series 5 653 Birla Sun Life Midcap Fund 434 Birla Sun Life Small & Midcap Fund 44
Sr.no Funds Managed By Mr. Vineet Maloo Refer
page No1 Birla Sun Life Capital Protection Oriented Fund - Series 18# 642 Birla Sun Life Capital Protection Oriented Fund - Series 19# 643 Birla Sun Life Capital Protection Oriented Fund - Series 20# 644 Birla Sun Life Capital Protection Oriented Fund - Series 21# 645 Birla Sun Life Capital Protection Oriented Fund - Series 22# 646 Birla Sun Life Capital Protection Oriented Fund - Series 23# 647 Birla Sun Life Capital Protection Oriented Fund - Series 29# 658 Birla Sun Life Dividend Yield Plus* 489 Birla Sun Life Balanced Advantage Fund# 35
10 Birla Sun Life International Equity Fund - Plan A 5511 Birla Sun Life International Equity Fund - Plan B 56
Sr.no Funds Managed By Mr. Milind Bafna Refer
page No1 Birla Sun Life Commodity Equities Fund - Global Agri Plan
(GAP) 57
2 Birla Sun Life Emerging Leaders Fund - Series 3* 653 Birla Sun Life Emerging Leaders Fund - Series 4* 654 Birla Sun Life Pure Value Fund* 45
* Funds co-managed by Mr. Mahesh Patil
Sr.no Funds Managed By Ms. Sunaina Da Cunha Refer
page No1 Birla Sun Life Cash Manager* 52 Birla Sun Life Cash Plus* 33 Birla Sun Life Floating Rate Fund - Short Term Plan* 44 Birla Sun Life Savings Fund* 65 Birla Sun Life Short Term Opportunities Fund* 10
* Funds co-managed by Mr. Kaustubh Gupta
Sr.no Funds Managed By Mr. Lovelish Solanki Refer
page No1 Birla Sun Life Enhanced Arbitrage Fund 82 Birla Sun Life Equity Savings Fund*@ 34
* Funds co-managed by Mr. Satyabrata Mohanty@ Funds co-managed by Mr. Pranay Sinha
Sr.no Funds Managed By Mr. Pranay Sinha Refer
page No1 Birla Sun Life Balanced ‘95 Fund@$ 362 Birla Sun Life Equity Savings Fund#^ 343 Birla Sun Life MIP* 244 Birla Sun Life MIP II - Savings 5 Plan*# 235 Birla Sun Life MIP II - Wealth 25 Plan*# 266 Birla Sun Life Monthly Income* 25
* Funds co-managed by Mr. Vineet Maloo @ Funds co-managed by Mr. Mahesh Patil# Funds co-managed by Mr. Satyabrata Mohanty^ Funds co-managed by Mr. Lovelish Solanki$ Funds co-managed by Mr. Dhaval Shah
Sr.no Funds Managed By Mr. Anil Shah Refer
page No1 Birla Sun Life Equity Fund 402 Birla Sun Life Focused Equity Fund - Series 1 653 Birla Sun Life Focused Equity Fund - Series 2 664 Birla Sun Life Focused Equity Fund - Series 3 665 Birla Sun Life Focused Equity Fund - Series 4 666 Birla Sun Life Focused Equity Fund - Series 5 667 Birla Sun Life India GenNext Fund* 538 Birla Sun Life Manufacturing Equity Fund 46
* Funds co-managed by Mr. Chanchal Khandelwal
Sr.no Funds Managed By Mr. Maneesh Dangi Refer
page No1 Birla Sun Life Corporate Bond Fund 132 Birla Sun Life Dynamic Bond Fund 143 Birla Sun Life Medium Term Plan 12
Sr.no Funds Managed By Mr. Shravan Sreenivasula Refer
page No1 Birla Sun Life Active Debt Multi Manager FoF Scheme 192 Birla Sun Life Asset Allocator Multi Manager FoF Scheme 623 Birla Sun Life Financial Planning FOF - Aggressive Plan 634 Birla Sun Life Financial Planning FOF - Conservative Plan 205 Birla Sun Life Financial Planning FOF - Prudent Plan 216 Birla Sun Life Global Commodities Fund 587 Birla Sun Life Global Real Estate Fund 598 Birla Sun Life Gold Fund 61
Sr.no Funds Managed By Mr. Vineet Maloo Refer
page No12 Birla Sun Life MIP@ 2413 Birla Sun Life MIP II - Savings 5 Plan*@ 2314 Birla Sun Life MIP II - Wealth 25 Plan*@ 2615 Birla Sun Life Monthly Income@ 25
* Funds co-managed by Mr. Satyabrata Mohanty# Funds co-managed by Mr. Prasad Dhonde@ Funds co-managed by Mr. Pranay Sinha
http://mutualfund.birlasunlife.com https://twitter.com/bslmf
https://www.facebook.com/bslmf https://www.linkedin.com/company/bslmf67
Sr.no Funds Managed By Mr. Dhaval Shah Refer
page No1 Birla Sun Life Balanced ‘95 Fund@$ 36
@ Funds co-managed by Mr. Mahesh Patil$ Funds co-managed by Mr. Pranay Sinha

Portfolio
Savings Solutions
Birla Sun Life Cash PlusAllocation as a % of Net Assets Rating %8.07% GOI 2017 (M/D. 15.01.2017) SOV 9.74%Vedanta Limited CRISIL A1+ 3.35%Vedanta Limited CRISIL A1+ 2.58%91 Days Tbill (MD 16/03/2017) SOV 2.33%Rural Electrification Corporation Limited IND A1+ 1.89%The South Indian Bank Limited CARE A1+ 1.80%Kotak Mahindra Bank Limited 1.73%JSW Steel Limited CARE A1+ 1.51%JSW Steel Limited CARE A1+ 1.51%The South Indian Bank Limited CARE A1+ 1.49%Cholamandalam Investment and Finance Company Limited ICRA A1+ 1.40%Vedanta Limited CRISIL A1+ 1.38%Deutsche Bank AG 1.32%ECL Finance Ltd ICRA AA 1.31%Hero Fincorp Limited CRISIL A1+ 1.30%India Infoline Finance Ltd ICRA A1+ 1.29%Shriram Transport Finance Company Limited CRISIL A1+ 1.29%Talwandi Sabo Power Ltd CRISIL A1+(SO) 1.29%JSW Steel Limited CARE A1+ 1.29%National Fertilizers Limited ICRA A1+ 1.28%Housing Development Finance Corporation Limited ICRA A1+ 1.25%Corporation Bank CRISIL A1+ 1.24%Talwandi Sabo Power Ltd CRISIL A1+(SO) 1.22%91 Days Tbill (MD 23/03/2017) SOV 1.20%42 Days CMB MD 24 Jan 2017 SOV 1.13%Citibank N.A. 1.08%Housing Development Finance Corporation Limited ICRA A1+ 1.08%Nabha Power Ltd ICRA A1+ 1.08%Tata Power Company Limited ICRA A1+ 1.08%Kotak Securities Ltd ICRA A1+ 1.08%Reliance Capital Limited ICRA A1+ 1.07%Small Industries Dev Bank of India CARE A1+ 1.06%Vedanta Limited CRISIL A1+ 0.97%Housing Development Finance Corporation Limited ICRA A1+ 0.93%Tata Capital Financial Services Ltd CRISIL AA+ 0.90%Reliance Capital Limited ICRA A1+ 0.87%Abu Dhabi Commercial Bank (ADCB) CRISIL A1+ 0.86%91 Days Tbill (MD 09/03/2017) SOV 0.86%Tata Power Company Limited ICRA A1+ 0.86%Vedanta Limited CRISIL A1+ 0.86%RBL Bank Limited ICRA A1+ 0.85%Housing Development Finance Corporation Limited CRISIL AAA 0.83%IL&FS Financial Services Ltd CARE A1+ 0.75%Rural Electrification Corporation Limited CRISIL AAA 0.66%Housing Development Finance Corporation Limited ICRA A1+ 0.65%IL&FS Financial Services Ltd ICRA A1+ 0.65%GIC Housing Finance Limited ICRA A1+ 0.65%Deutsche Investments India Pvt Ltd CRISIL A1+ 0.64%Tata Power Renewable Energy Ltd CRISIL A1+(SO) 0.62%STCI Finance Limited CRISIL A1+ 0.60%IDBI Bank Limited CRISIL A1+ 0.55%IL&FS Financial Services Ltd ICRA A1+ 0.55%L&T Vrindavan Properties Ltd CARE AA+(SO) 0.55%Vedanta Limited CRISIL A1+ 0.54%Reliance Jio Infocomm Limited CARE A1+ 0.54%Housing Development Finance Corporation Limited ICRA A1+ 0.52%Edelweiss Commodities Services Ltd CRISIL A1+ 0.52%91 Days Tbill (MD 19/01/2017) SOV 0.51%LIC Housing Finance Limited CRISIL AAA 0.51%Indian Railway Finance Corp Ltd CRISIL AAA 0.44%Citicorp Finance India Ltd ICRA A1+ 0.43%IDBI Bank Limited CRISIL A1+ 0.43%Vedanta Limited CRISIL A1+ 0.43%Adani Ports and Special Economic Zone Limited ICRA A1+ 0.43%Housing Development Finance Corporation Limited ICRA A1+ 0.43%IDBI Bank Limited CRISIL A1+ 0.43%Reliance Capital Limited ICRA A1+ 0.43%Tata Housing Development Co Ltd CARE A1+ 0.43%Tata Motors Finance Ltd ICRA A1+ 0.43%Tata Housing Development Co Ltd CARE A1+ 0.43%Tata Capital Housing Finance Ltd CRISIL A1+ 0.43%Abu Dhabi Commercial Bank (ADCB) CRISIL A1+ 0.43%Talwandi Sabo Power Ltd CRISIL A1+(SO) 0.43%Shapoorji Pallonji and Company Private Ltd ICRA A1+ 0.43%Piramal Finance Private Limited ICRA A1+ 0.43%Talwandi Sabo Power Ltd CRISIL A1+(SO) 0.43%Piramal Finance Private Limited ICRA A1+ 0.43%Export Import Bank of India CRISIL A1+ 0.41%Indiabulls Housing Finance Limited CARE AAA 0.39%HDB Financial Services Ltd CARE A1+ 0.37%Godrej Properties Limited ICRA A1+ 0.37%ICICI Home Finance Company Ltd ICRA A1+ 0.35%Sterlite Technologies Limited ICRA A1+ 0.32%Export Import Bank of India CRISIL A1+ 0.32%IDBI Bank Limited CRISIL A1+ 0.32%
Barclays Invest & Loans India Ltd ICRA A1+ 0.32%Mahindra & Mahindra Financial Services Limited IND A1+ 0.32%Godrej Properties Limited ICRA A1+ 0.32%Edelweiss Commodities Services Ltd CRISIL A1+ 0.32%Magma Fincorp Limited CARE A1+ 0.32%Reliance Jio Infocomm Limited CARE A1+ 0.28%Fedbank Financial Services Ltd CRISIL A1+ 0.28%Kotak Mahindra Prime Ltd CRISIL A1+ 0.26%91 Days Tbill (MD 30/03/2017) SOV 0.25%IL & FS Education and Technology Services Ltd CARE A1+ 0.22%Tata Housing Development Co Ltd CARE A1+ 0.22%National Bank For Agriculture and Rural Development CRISIL A1+ 0.22%Standard Chartered Invest & Loans Ltd. CRISIL A1+ 0.22%Godrej Properties Limited ICRA A1+ 0.22%IL & FS Education and Technology Services Ltd CARE A1+ 0.22%Corporation Bank CRISIL A1+ 0.22%Corporation Bank CRISIL A1+ 0.22%Vedanta Limited CRISIL A1+ 0.22%Dalmia Bharat Limited CARE A1+ 0.22%Network18 Media & Investments Limited ICRA A1+ 0.22%JM Financial Products Ltd ICRA A1+ 0.22%Fedbank Financial Services Ltd CRISIL A1+ 0.22%Sadbhav Engineering Limited CARE A1+ 0.22%Barclays Invest & Loans India Ltd ICRA A1+ 0.21%Magma Fincorp Limited CARE A1+ 0.21%Piramal Finance Private Limited ICRA A1+ 0.21%ICICI Securities Ltd CRISIL A1+ 0.21%Credila Financial Services Pvt Ltd ICRA A1+ 0.21%Dalmia Bharat Limited CARE A1+ 0.21%Shriram Transport Finance Company Limited IND AA+ 0.20%IDBI Bank Limited CRISIL A1+ 0.20%National Bank For Agriculture and Rural Development CRISIL A1+ 0.19%Corporation Bank CRISIL A1+ 0.19%National Bank For Agriculture and Rural Development CRISIL A1+ 0.17%Godrej Properties Limited ICRA A1+ 0.17%Standard Chartered Invest & Loans Ltd. CRISIL A1+ 0.15%Axis Bank Limited CRISIL A1+ 0.13%Rural Electrification Corporation Limited CRISIL AAA 0.11%Tata Capital Financial Services Ltd CRISIL AA+ 0.11%LIC Housing Finance Limited CARE AAA 0.11%IndusInd Bank Limited CRISIL A1+ 0.11%Axis Bank Limited CRISIL A1+ 0.11%Punjab & Sind Bank ICRA A1+ 0.11%IDBI Bank Limited CRISIL A1+ 0.11%Small Industries Dev Bank of India CARE A1+ 0.11%Mahindra & Mahindra Financial Services Limited IND A1+ 0.11%JM Financial Limited ICRA A1+ 0.11%Corporation Bank CRISIL A1+ 0.11%IL & FS Education and Technology Services Ltd CARE A1+ 0.11%Magma Housing Finance CRISIL A1+ 0.11%Kotak Mahindra Investments Ltd CRISIL AAA 0.09%Dena Bank CRISIL A1+ 0.08%JM Financial Services Ltd ICRA A1+ 0.06%Yes Bank Limited ICRA A1+ 0.05%Godrej Properties Limited ICRA A1+ 0.04%LIC Housing Finance Limited CRISIL AAA 0.01%Tata Sons Ltd CRISIL AAA 0.01%Cash & Current Assets 5.77%Total 100.00%
Birla Sun Life Floating Rate Fund - Short Term Plan
Allocation as a % of Net Assets Rating %28 Days CMB (MD 30/01/2017) SOV 9.57%Tata Power Company Limited ICRA A1+ 6.06%National Bank For Agriculture and Rural Development CRISIL A1+ 4.86%IDFC Bank Limited ICRA A1+ 4.83%Kotak Mahindra Bank Limited CRISIL A1+ 4.82%TATA Realty & Infrastructure Ltd ICRA A1+ 4.38%HDB Financial Services Ltd CARE A1+ 3.89%Punjab & Sind Bank ICRA A1+ 3.62%STCI Finance Limited ICRA AA- 3.57%Family Credit Ltd CARE A1+ 2.43%Tata Housing Development Co Ltd CARE A1+ 2.43%Housing Development Finance Corporation Limited ICRA A1+ 2.43%Tata Motors Finance Ltd ICRA A1+ 2.42%Tata Housing Development Co Ltd CARE A1+ 2.41%IL&FS Financial Services Ltd CARE A1+ 2.41%Adani Enterprises Limited BWR A1+ 2.40%Adani Enterprises Limited BWR A1+ 2.40%Adani Enterprises Limited BWR A1+ 2.40%GIC Housing Finance Limited ICRA A1+ 2.31%IDBI Bank Limited CRISIL A1+ 2.19%The South Indian Bank Limited CARE A1+ 1.82%Network18 Media & Investments Limited ICRA A1+ 1.82%Network18 Media & Investments Limited ICRA A1+ 1.82%Bajaj Finance Limited CRISIL A1+ 1.82%ICICI Bank Limited ICRA A1+ 1.81%IDFC Bank Limited ICRA A1+ 1.81%
Magma Housing Finance CRISIL A1+ 1.81%ICICI Home Finance Company Ltd ICRA A1+ 1.22%IL&FS Financial Services Ltd ICRA A1+ 1.16%Small Industries Dev Bank of India CARE AAA 0.91%Power Finance Corporation Limited CRISIL AAA 0.61%Can Fin Homes Limited CARE AAA 0.61%Power Finance Corporation Limited CRISIL A1+ 0.61%ICICI Securities Ltd CRISIL A1+ 0.60%JM Financial Limited ICRA A1+ 0.60%National Bank For Agriculture and Rural Development CRISIL A1+ 0.49%Housing Development Finance Corporation Limited CRISIL AAA 0.19%LIC Housing Finance Limited CRISIL AAA 0.12%Housing Development Finance Corporation Limited CRISIL AAA 0.12%91 Days Tbill (MD 12/01/2017) SOV 0.06%Cash & Current Assets 8.16%Total 100.00%
Birla Sun Life Cash ManagerAllocation as a % of Net Assets Rating %Tata Power Company Limited ICRA AA 8.38%Reliance Jio Infocomm Limited CRISIL AAA 7.98%RKN RETAIL PVT. LTD BWR A-(SO) 3.28%S.D. Corporation Pvt. Ltd ICRA AA+(SO) 2.84%Small Industries Dev Bank of India CARE AAA 2.74%Tata Capital Financial Services Ltd CRISIL AA+ 2.70%Power Finance Corporation Limited CRISIL AAA 2.62%Shriram Transport Finance Company Limited CRISIL AA+ 2.23%Indiabulls Housing Finance Limited CARE AAA 2.22%8.46% Maharashtra SDL (MD 12/03/2019) SOV 2.08%Housing Development Finance Corporation Limited CRISIL AAA 1.88%Export Import Bank of India CRISIL AAA 1.77%Power Finance Corporation Limited CRISIL AAA 1.70%Tata Capital Financial Services Ltd CRISIL AA+ 1.69%Power Finance Corporation Limited CRISIL AAA 1.69%ONGC Petro Additions Ltd CARE AAA(SO) 1.58%Indiabulls Housing Finance Limited CARE AAA 1.55%Cholamandalam Investment and Finance Company Limited ICRA AA 1.47%8.85% Punjab SDL (MD 09/07/2019) SOV 1.41%8.46% Rajashthan SDL (18/03/2019) SOV 1.39%8.39% Rajasthan UDAY Bond SDL (MD 15/03/2019) SOV 1.38%National Bank For Agriculture and Rural Development CRISIL AAA 1.37%Housing Development Finance Corporation Limited CRISIL AAA 1.36%Shriram Transport Finance Company Limited CRISIL AA+ 1.35%Power Finance Corporation Limited ICRA AAA 1.35%Cholamandalam Investment and Finance Company Limited ICRA AA 1.35%Piramal Enterprises Limited ICRA AA 1.35%Fullerton India Credit Co Ltd ICRA AA+ 1.35%Piramal Enterprises Limited ICRA AA 1.35%Indiabulls Housing Finance Limited CARE AAA 1.33%Power Finance Corporation Limited CRISIL AAA 1.23%Tata Motors Finance Ltd CRISIL AA 1.22%Export Import Bank of India CRISIL AAA 1.21%Small Industries Dev Bank of India CARE AAA 1.17%Reliance Jio Infocomm Limited CRISIL AAA 1.02%Cholamandalam Investment and Finance Company Limited ICRA AA 1.01%Housing Development Finance Corporation Limited CRISIL AAA 1.01%Tata Sons Ltd CRISIL AAA 1.00%Shapoorji Pallonji and Company Private Ltd ICRA A1+ 0.98%Cholamandalam Investment and Finance Company Limited ICRA AA 0.98%Power Finance Corporation Limited CRISIL AAA 0.96%Tata Capital Financial Services Ltd CRISIL AA+ 0.94%Grand View Estates Pvt Ltd ICRA AA(SO) 0.88%Talwandi Sabo Power Ltd CRISIL AA- (SO) 0.79%Power Finance Corporation Limited CRISIL AAA 0.75%National Bank For Agriculture and Rural Development CRISIL AAA 0.68%Rural Electrification Corporation Limited CRISIL AAA 0.68%National Bank For Agriculture and Rural Development CRISIL AAA 0.68%IDFC Bank Limited ICRA AAA 0.68%Shriram Transport Finance Company Limited IND AA+ 0.67%Housing Development Finance Corporation Limited CRISIL AAA 0.67%8.21% RAJASTHAN SDL SPL ( MD 31/03/2018) SOV 0.67%Barclays Invest & Loans India Ltd ICRA A1+ 0.65%Tata Motors Finance Ltd ICRA A1+ 0.64%Satin Creditcare Network Limited ICRA A1+(SO) 0.63%Power Finance Corporation Limited CRISIL AAA 0.56%Rural Electrification Corporation Limited CRISIL AAA 0.56%Shriram Transport Finance Company Limited CRISIL AA+ 0.47%Dewan Housing Finance Corporation Limited CARE AAA 0.47%Nabha Power Ltd ICRA AAA(SO) 0.41%Power Finance Corporation Limited CRISIL AAA 0.41%SP Jammu Udhampur Highway Ltd ICRA AAA(SO) 0.38%Hero Fincorp Limited ICRA AA+ 0.36%
68
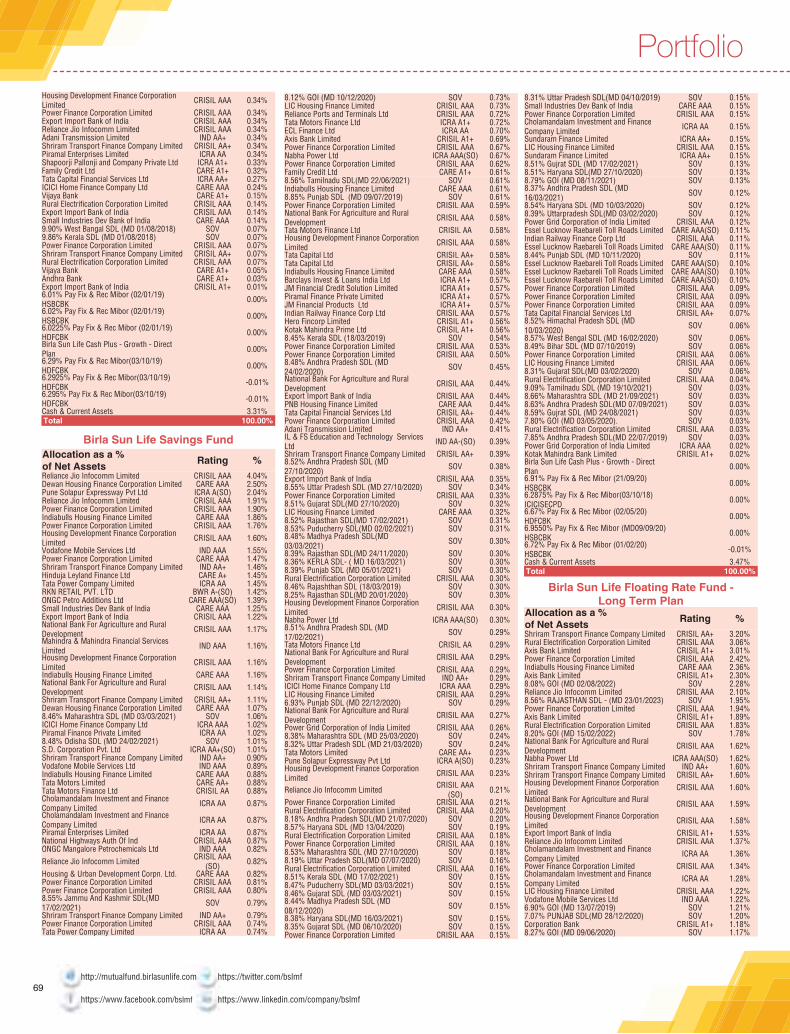
Housing Development Finance Corporation Limited CRISIL AAA 0.34%Power Finance Corporation Limited CRISIL AAA 0.34%Export Import Bank of India CRISIL AAA 0.34%Reliance Jio Infocomm Limited CRISIL AAA 0.34%Adani Transmission Limited IND AA+ 0.34%Shriram Transport Finance Company Limited CRISIL AA+ 0.34%Piramal Enterprises Limited ICRA AA 0.34%Shapoorji Pallonji and Company Private Ltd ICRA A1+ 0.33%Family Credit Ltd CARE A1+ 0.32%Tata Capital Financial Services Ltd ICRA AA+ 0.27%ICICI Home Finance Company Ltd CARE AAA 0.24%Vijaya Bank CARE A1+ 0.15%Rural Electrification Corporation Limited CRISIL AAA 0.14%Export Import Bank of India CRISIL AAA 0.14%Small Industries Dev Bank of India CARE AAA 0.14%9.90% West Bangal SDL (MD 01/08/2018) SOV 0.07%9.86% Kerala SDL (MD 01/08/2018) SOV 0.07%Power Finance Corporation Limited CRISIL AAA 0.07%Shriram Transport Finance Company Limited CRISIL AA+ 0.07%Rural Electrification Corporation Limited CRISIL AAA 0.07%Vijaya Bank CARE A1+ 0.05%Andhra Bank CARE A1+ 0.03%Export Import Bank of India CRISIL A1+ 0.01%6.01% Pay Fix & Rec Mibor (02/01/19) HSBCBK 0.00%6.02% Pay Fix & Rec Mibor (02/01/19) HSBCBK 0.00%6.0225% Pay Fix & Rec Mibor (02/01/19) HDFCBK 0.00%Birla Sun Life Cash Plus - Growth - Direct Plan 0.00%6.29% Pay Fix & Rec Mibor(03/10/19) HDFCBK 0.00%6.2925% Pay Fix & Rec Mibor(03/10/19) HDFCBK -0.01%6.295% Pay Fix & Rec Mibor(03/10/19) HDFCBK -0.01%Cash & Current Assets 3.31%Total 100.00%
Birla Sun Life Savings FundAllocation as a % of Net Assets Rating %Reliance Jio Infocomm Limited CRISIL AAA 4.04%Dewan Housing Finance Corporation Limited CARE AAA 2.50%Pune Solapur Expressway Pvt Ltd ICRA A(SO) 2.04%Reliance Jio Infocomm Limited CRISIL AAA 1.91%Power Finance Corporation Limited CRISIL AAA 1.90%Indiabulls Housing Finance Limited CARE AAA 1.86%Power Finance Corporation Limited CRISIL AAA 1.76%Housing Development Finance Corporation Limited CRISIL AAA 1.60%Vodafone Mobile Services Ltd IND AAA 1.55%Power Finance Corporation Limited CARE AAA 1.47%Shriram Transport Finance Company Limited IND AA+ 1.46%Hinduja Leyland Finance Ltd CARE A+ 1.45%Tata Power Company Limited ICRA AA 1.45%RKN RETAIL PVT. LTD BWR A-(SO) 1.42%ONGC Petro Additions Ltd CARE AAA(SO) 1.39%Small Industries Dev Bank of India CARE AAA 1.25%Export Import Bank of India CRISIL AAA 1.22%National Bank For Agriculture and Rural Development CRISIL AAA 1.17%Mahindra & Mahindra Financial Services Limited IND AAA 1.16%Housing Development Finance Corporation Limited CRISIL AAA 1.16%Indiabulls Housing Finance Limited CARE AAA 1.16%National Bank For Agriculture and Rural Development CRISIL AAA 1.14%Shriram Transport Finance Company Limited CRISIL AA+ 1.11%Dewan Housing Finance Corporation Limited CARE AAA 1.07%8.46% Maharashtra SDL (MD 03/03/2021) SOV 1.06%ICICI Home Finance Company Ltd ICRA AAA 1.02%Piramal Finance Private Limited ICRA AA 1.02%8.48% Odisha SDL (MD 24/02/2021) SOV 1.01%S.D. Corporation Pvt. Ltd ICRA AA+(SO) 1.01%Shriram Transport Finance Company Limited IND AA+ 0.90%Vodafone Mobile Services Ltd IND AAA 0.89%Indiabulls Housing Finance Limited CARE AAA 0.88%Tata Motors Limited CARE AA+ 0.88%Tata Motors Finance Ltd CRISIL AA 0.88%Cholamandalam Investment and Finance Company Limited ICRA AA 0.87%Cholamandalam Investment and Finance Company Limited ICRA AA 0.87%Piramal Enterprises Limited ICRA AA 0.87%National Highways Auth Of Ind CRISIL AAA 0.87%ONGC Mangalore Petrochemicals Ltd IND AAA 0.82%Reliance Jio Infocomm Limited CRISIL AAA
(SO) 0.82%Housing & Urban Development Corpn. Ltd. CARE AAA 0.82%Power Finance Corporation Limited CRISIL AAA 0.81%Power Finance Corporation Limited CRISIL AAA 0.80%8.55% Jammu And Kashmir SDL(MD 17/02/2021) SOV 0.79%Shriram Transport Finance Company Limited IND AA+ 0.79%Power Finance Corporation Limited CRISIL AAA 0.74%Tata Power Company Limited ICRA AA 0.74%
8.12% GOI (MD 10/12/2020) SOV 0.73%LIC Housing Finance Limited CRISIL AAA 0.73%Reliance Ports and Terminals Ltd CRISIL AAA 0.72%Tata Motors Finance Ltd ICRA A1+ 0.72%ECL Finance Ltd ICRA AA 0.70%Axis Bank Limited CRISIL A1+ 0.69%Power Finance Corporation Limited CRISIL AAA 0.67%Nabha Power Ltd ICRA AAA(SO) 0.67%Power Finance Corporation Limited CRISIL AAA 0.62%Family Credit Ltd CARE A1+ 0.61%8.56% Tamilnadu SDL(MD 22/06/2021) SOV 0.61%Indiabulls Housing Finance Limited CARE AAA 0.61%8.85% Punjab SDL (MD 09/07/2019) SOV 0.61%Power Finance Corporation Limited CRISIL AAA 0.59%National Bank For Agriculture and Rural Development CRISIL AAA 0.58%Tata Motors Finance Ltd CRISIL AA 0.58%Housing Development Finance Corporation Limited CRISIL AAA 0.58%Tata Capital Ltd CRISIL AA+ 0.58%Tata Capital Ltd CRISIL AA+ 0.58%Indiabulls Housing Finance Limited CARE AAA 0.58%Barclays Invest & Loans India Ltd ICRA A1+ 0.57%JM Financial Credit Solution Limited ICRA A1+ 0.57%Piramal Finance Private Limited ICRA A1+ 0.57%JM Financial Products Ltd ICRA A1+ 0.57%Indian Railway Finance Corp Ltd CRISIL AAA 0.57%Hero Fincorp Limited CRISIL A1+ 0.56%Kotak Mahindra Prime Ltd CRISIL A1+ 0.56%8.45% Kerala SDL (18/03/2019) SOV 0.54%Power Finance Corporation Limited CRISIL AAA 0.53%Power Finance Corporation Limited CRISIL AAA 0.50%8.48% Andhra Pradesh SDL (MD 24/02/2020) SOV 0.45%National Bank For Agriculture and Rural Development CRISIL AAA 0.44%Export Import Bank of India CRISIL AAA 0.44%PNB Housing Finance Limited CARE AAA 0.44%Tata Capital Financial Services Ltd CRISIL AA+ 0.44%Power Finance Corporation Limited CRISIL AAA 0.42%Adani Transmission Limited IND AA+ 0.41%IL & FS Education and Technology Services Ltd IND AA-(SO) 0.39%Shriram Transport Finance Company Limited CRISIL AA+ 0.39%8.52% Andhra Pradesh SDL (MD 27/10/2020) SOV 0.38%Export Import Bank of India CRISIL AAA 0.35%8.55% Uttar Pradesh SDL (MD 27/10/2020) SOV 0.34%Power Finance Corporation Limited CRISIL AAA 0.33%8.51% Gujarat SDL(MD 27/10/2020) SOV 0.32%LIC Housing Finance Limited CARE AAA 0.32%8.52% Rajasthan SDL(MD 17/02/2021) SOV 0.31%8.53% Puducherry SDL(MD 02/02/2021) SOV 0.31%8.48% Madhya Pradesh SDL(MD 03/03/2021) SOV 0.30%8.39% Rajasthan SDL(MD 24/11/2020) SOV 0.30%8.36% KERLA SDL- ( MD 16/03/2021) SOV 0.30%8.39% Punjab SDL (MD 05/01/2021) SOV 0.30%Rural Electrification Corporation Limited CRISIL AAA 0.30%8.46% Rajashthan SDL (18/03/2019) SOV 0.30%8.25% Rajasthan SDL(MD 20/01/2020) SOV 0.30%Housing Development Finance Corporation Limited CRISIL AAA 0.30%Nabha Power Ltd ICRA AAA(SO) 0.30%8.51% Andhra Pradesh SDL (MD 17/02/2021) SOV 0.29%Tata Motors Finance Ltd CRISIL AA 0.29%National Bank For Agriculture and Rural Development CRISIL AAA 0.29%Power Finance Corporation Limited CRISIL AAA 0.29%Shriram Transport Finance Company Limited IND AA+ 0.29%ICICI Home Finance Company Ltd ICRA AAA 0.29%LIC Housing Finance Limited CRISIL AAA 0.29%6.93% Punjab SDL (MD 22/12/2020) SOV 0.29%National Bank For Agriculture and Rural Development CRISIL AAA 0.27%Power Grid Corporation of India Limited CRISIL AAA 0.26%8.38% Maharashtra SDL (MD 25/03/2020) SOV 0.24%8.32% Uttar Pradesh SDL (MD 21/03/2020) SOV 0.24%Tata Motors Limited CARE AA+ 0.23%Pune Solapur Expressway Pvt Ltd ICRA A(SO) 0.23%Housing Development Finance Corporation Limited CRISIL AAA 0.23%
Reliance Jio Infocomm Limited CRISIL AAA (SO) 0.21%
Power Finance Corporation Limited CRISIL AAA 0.21%Rural Electrification Corporation Limited CRISIL AAA 0.20%8.18% Andhra Pradesh SDL(MD 21/07/2020) SOV 0.20%8.57% Haryana SDL (MD 13/04/2020) SOV 0.19%Rural Electrification Corporation Limited CRISIL AAA 0.18%Power Finance Corporation Limited CRISIL AAA 0.18%8.53% Maharashtra SDL (MD 27/10/2020) SOV 0.18%8.19% Uttar Pradesh SDL(MD 07/07/2020) SOV 0.16%Rural Electrification Corporation Limited CRISIL AAA 0.16%8.51% Kerala SDL (MD 17/02/2021) SOV 0.15%8.47% Puducherry SDL(MD 03/03/2021) SOV 0.15%8.46% Gujarat SDL (MD 03/03/2021) SOV 0.15%8.44% Madhya Pradesh SDL (MD 08/12/2020) SOV 0.15%8.38% Haryana SDL(MD 16/03/2021) SOV 0.15%8.35% Gujarat SDL (MD 06/10/2020) SOV 0.15%Power Finance Corporation Limited CRISIL AAA 0.15%
8.31% Uttar Pradesh SDL(MD 04/10/2019) SOV 0.15%Small Industries Dev Bank of India CARE AAA 0.15%Power Finance Corporation Limited CRISIL AAA 0.15%Cholamandalam Investment and Finance Company Limited ICRA AA 0.15%Sundaram Finance Limited ICRA AA+ 0.15%LIC Housing Finance Limited CRISIL AAA 0.15%Sundaram Finance Limited ICRA AA+ 0.15%8.51% Gujrat SDL (MD 17/02/2021) SOV 0.13%8.51% Haryana SDL(MD 27/10/2020) SOV 0.13%8.79% GOI (MD 08/11/2021) SOV 0.13%8.37% Andhra Pradesh SDL (MD 16/03/2021) SOV 0.12%8.54% Haryana SDL (MD 10/03/2020) SOV 0.12%8.39% Uttarpradesh SDL(MD 03/02/2020) SOV 0.12%Power Grid Corporation of India Limited CRISIL AAA 0.12%Essel Lucknow Raebareli Toll Roads Limited CARE AAA(SO) 0.11%Indian Railway Finance Corp Ltd CRISIL AAA 0.11%Essel Lucknow Raebareli Toll Roads Limited CARE AAA(SO) 0.11%8.44% Punjab SDL (MD 10/11/2020) SOV 0.11%Essel Lucknow Raebareli Toll Roads Limited CARE AAA(SO) 0.10%Essel Lucknow Raebareli Toll Roads Limited CARE AAA(SO) 0.10%Essel Lucknow Raebareli Toll Roads Limited CARE AAA(SO) 0.10%Power Finance Corporation Limited CRISIL AAA 0.09%Power Finance Corporation Limited CRISIL AAA 0.09%Power Finance Corporation Limited CRISIL AAA 0.09%Tata Capital Financial Services Ltd CRISIL AA+ 0.07%8.52% Himachal Pradesh SDL (MD 10/03/2020) SOV 0.06%8.57% West Bengal SDL (MD 16/02/2020) SOV 0.06%8.49% Bihar SDL (MD 07/10/2019) SOV 0.06%Power Finance Corporation Limited CRISIL AAA 0.06%LIC Housing Finance Limited CRISIL AAA 0.06%8.31% Gujarat SDL(MD 03/02/2020) SOV 0.06%Rural Electrification Corporation Limited CRISIL AAA 0.04%9.09% Tamilnadu SDL (MD 19/10/2021) SOV 0.03%8.66% Maharashtra SDL (MD 21/09/2021) SOV 0.03%8.63% Andhra Pradesh SDL(MD 07/09/2021) SOV 0.03%8.59% Gujrat SDL (MD 24/08/2021) SOV 0.03%7.80% GOI (MD 03/05/2020). SOV 0.03%Rural Electrification Corporation Limited CRISIL AAA 0.03%7.85% Andhra Pradesh SDL(MD 22/07/2019) SOV 0.03%Power Grid Corporation of India Limited ICRA AAA 0.02%Kotak Mahindra Bank Limited CRISIL A1+ 0.02%Birla Sun Life Cash Plus - Growth - Direct Plan 0.00%6.91% Pay Fix & Rec Mibor (21/09/20) HSBCBK 0.00%6.2875% Pay Fix & Rec Mibor(03/10/18) ICICISECPD 0.00%6.67% Pay Fix & Rec Mibor (02/05/20) HDFCBK 0.00%6.9550% Pay Fix & Rec Mibor (MD09/09/20) HSBCBK 0.00%6.72% Pay Fix & Rec Mibor (01/02/20) HSBCBK -0.01%Cash & Current Assets 3.47%Total 100.00%
Birla Sun Life Floating Rate Fund - Long Term Plan
Allocation as a % of Net Assets Rating %Shriram Transport Finance Company Limited CRISIL AA+ 3.20%Rural Electrification Corporation Limited CRISIL AAA 3.06%Axis Bank Limited CRISIL A1+ 3.01%Power Finance Corporation Limited CRISIL AAA 2.42%Indiabulls Housing Finance Limited CARE AAA 2.36%Axis Bank Limited CRISIL A1+ 2.30%8.08% GOI (MD 02/08/2022) SOV 2.28%Reliance Jio Infocomm Limited CRISIL AAA 2.10%8.56% RAJASTHAN SDL - (MD 23/01/2023) SOV 1.95%Power Finance Corporation Limited CRISIL AAA 1.94%Axis Bank Limited CRISIL A1+ 1.89%Rural Electrification Corporation Limited CRISIL AAA 1.83%8.20% GOI (MD 15/02/2022) SOV 1.78%National Bank For Agriculture and Rural Development CRISIL AAA 1.62%Nabha Power Ltd ICRA AAA(SO) 1.62%Shriram Transport Finance Company Limited IND AA+ 1.60%Shriram Transport Finance Company Limited CRISIL AA+ 1.60%Housing Development Finance Corporation Limited CRISIL AAA 1.60%National Bank For Agriculture and Rural Development CRISIL AAA 1.59%Housing Development Finance Corporation Limited CRISIL AAA 1.58%Export Import Bank of India CRISIL A1+ 1.53%Reliance Jio Infocomm Limited CRISIL AAA 1.37%Cholamandalam Investment and Finance Company Limited ICRA AA 1.36%Power Finance Corporation Limited CRISIL AAA 1.34%Cholamandalam Investment and Finance Company Limited ICRA AA 1.28%LIC Housing Finance Limited CRISIL AAA 1.22%Vodafone Mobile Services Ltd IND AAA 1.22%6.90% GOI (MD 13/07/2019) SOV 1.21%7.07% PUNJAB SDL(MD 28/12/2020) SOV 1.20%Corporation Bank CRISIL A1+ 1.18%8.27% GOI (MD 09/06/2020) SOV 1.17%
http://mutualfund.birlasunlife.com https://twitter.com/bslmf
https://www.facebook.com/bslmf https://www.linkedin.com/company/bslmf69
Portfolio

Sundaram Finance Limited CRISIL AA+ 1.12%Fullerton India Credit Co Ltd ICRA A1+ 1.11%Power Finance Corporation Limited CRISIL AAA 0.97%Vodafone Mobile Services Ltd IND AAA 0.96%UltraTech Cement Limited CRISIL AAA 0.94%Indiabulls Housing Finance Limited CARE AAA 0.92%ONGC Mangalore Petrochemicals Ltd IND AAA 0.84%8.40% Gujarat SDL (MD 24/11/2020) SOV 0.83%LIC Housing Finance Limited CRISIL AAA 0.82%8.39% Rajasthan UDAY Bond SDL (MD 15/03/2019) SOV 0.82%ONGC Petro Additions Ltd CARE AAA(SO) 0.81%National Bank For Agriculture and Rural Development CRISIL AAA 0.81%Power Finance Corporation Limited CRISIL AAA 0.81%Power Finance Corporation Limited CRISIL AAA 0.81%Tata Capital Financial Services Ltd CRISIL AA+ 0.80%Tata Capital Financial Services Ltd CRISIL AA+ 0.80%Tata Capital Ltd CRISIL AA+ 0.80%Fullerton India Credit Co Ltd ICRA AA+ 0.80%National Highways Auth Of Ind CRISIL AAA 0.79%Power Grid Corporation of India Limited CRISIL AAA 0.79%6.93% Punjab SDL (MD 22/12/2020) SOV 0.79%Power Finance Corporation Limited CRISIL AAA 0.79%HDB Financial Services Ltd CRISIL AAA 0.79%Sundaram Finance Limited ICRA AA+ 0.79%Vijaya Bank CARE A1+ 0.76%Housing Development Finance Corporation Limited ICRA A1+ 0.74%Rural Electrification Corporation Limited CRISIL AAA 0.50%8.41% Andhra Pradesh SDL (MD 27/03/2018) SOV 0.49%Export Import Bank of India CRISIL AAA 0.48%Tata Motors Finance Ltd CRISIL AA 0.43%Hero Fincorp Limited ICRA AA+ 0.42%Kotak Mahindra Prime Ltd CRISIL AAA 0.42%Power Finance Corporation Limited CRISIL AAA 0.42%Rural Electrification Corporation Limited CRISIL AAA 0.42%Power Finance Corporation Limited CRISIL AAA 0.42%Export Import Bank of India CRISIL AAA 0.41%LIC Housing Finance Limited CRISIL AAA 0.41%Housing Development Finance Corporation Limited CRISIL AAA 0.40%Housing Development Finance Corporation Limited CRISIL AAA 0.40%8.39% Rajasthan UDAY Bond SDL (MD 15/03/2018) SOV 0.40%Nabha Power Ltd ICRA AAA(SO) 0.40%Housing Development Finance Corporation Limited CRISIL AAA 0.40%LIC Housing Finance Limited CARE AAA 0.40%Power Finance Corporation Limited CRISIL AAA 0.40%Reliance Jio Infocomm Limited CRISIL AAA 0.40%Housing Development Finance Corporation Limited CRISIL AAA 0.40%National Bank For Agriculture and Rural Development CRISIL AAA 0.40%Kotak Mahindra Prime Ltd CRISIL AAA 0.40%LIC Housing Finance Limited CARE AAA 0.40%Power Finance Corporation Limited CRISIL AAA 0.40%Tata Capital Financial Services Ltd ICRA AA+ 0.40%Housing Development Finance Corporation Limited CRISIL AAA 0.40%LIC Housing Finance Limited CRISIL AAA 0.40%PNB Housing Finance Limited CARE AAA 0.40%Tata Capital Financial Services Ltd ICRA AA+ 0.39%IndusInd Bank Limited CRISIL A1+ 0.37%Fullerton India Credit Co Ltd ICRA A1+ 0.37%Power Finance Corporation Limited CRISIL AAA 0.32%Rural Electrification Corporation Limited CRISIL AAA 0.25%Rural Electrification Corporation Limited CRISIL AAA 0.25%Power Grid Corporation of India Limited CRISIL AAA 0.25%Rural Electrification Corporation Limited CRISIL AAA 0.24%Power Finance Corporation Limited CRISIL AAA 0.24%Power Grid Corporation of India Limited CRISIL AAA 0.24%Tata Sons Ltd CRISIL AAA 0.24%9.23% Rajasthan SDL (MD 23/11/2021) SOV 0.17%Rural Electrification Corporation Limited CRISIL AAA 0.17%8.65% Kerala SDL (MD 09/01/2023) SOV 0.17%7.8% GOI (MD 11/04/2021) SOV 0.17%LIC Housing Finance Limited CRISIL AAA 0.16%Small Industries Dev Bank of India CARE AAA 0.16%HDB Financial Services Ltd CARE AAA 0.16%8.21% Rajasthan SDL(MD 31/03/2020) SOV 0.11%Rural Electrification Corporation Limited CRISIL AAA 0.09%8.39% Rajasthan SDL(MD 15/03/2020) SOV 0.08%HDB Financial Services Ltd CRISIL AAA 0.08%Birla Sun Life Cash Plus - Growth - Direct Plan 0.00%6.1675% Pay Fix & Rec Mibor(27/10/18) HDFCBK 0.00%6.3550% Pay Fix & Rec Mibor (10/07/19) HDFCBK 0.00%6.5425% Pay Fix & Rec Mibor (04/07/20) HDFCBK -0.01%6.66% Pay Fix & Rec Mibor (11/05/20) HSBCBK -0.01%6.66% Pay Fix & Rec Mibor (12/05/20) HSBCBK -0.01%6.6675% Pay Fix & Rec Mibor (13/05/20) ICICIBK -0.01%
6.67 Pay Fix & Rec Mibor (12/05/20) ICICISECPD -0.01%6.6725% Pay Fix & Rec Mibor (03/05/20) HDFCBK -0.01%6.69% Pay Fix & Rec Mibor (18/05/20) HSBCBK -0.01%6.70% Pay Fix & Rec Mibor (17/05/20) HDFCBK -0.01%6.4350% Pay Fix & Rec Mibor (15/07/20) ICICISECPD -0.01%6.66% Pay Fix & Rec Mibor (26/05/19) HSBCBK -0.01%Cash & Current Assets 6.33%Total 100.00%
Birla Sun Life Enhanced Arbitrage FundAllocation as a % of Net Assets Rating %RBL Bank Limited 9.26%HDFC Bank Ltd 6.35%Birla Sun Life Floating Rate - ShtTer- Gr-Dir Plan 4.63%Housing Development Finance Corporation Limited ICRA A1+ 4.32%LIC Housing Finance Limited CARE AAA 3.48%IDFC Bank Limited ICRA AAA 3.26%Reliance Industries Ltd 3.25%Indiabulls Housing Finance Ltd 2.65%Yes Bank Limited 2.31%IL&FS Financial Services Ltd ICRA A1+ 2.29%Hero Fincorp Limited CRISIL A1+ 2.21%Housing Development Finance Corporation Ltd 2.19%ITC Ltd 1.91%Sun Pharmaceuticals Industries Ltd 1.83%Mahindra & Mahindra Ltd 1.68%Maruti Suzuki India Ltd 1.57%ICICI Bank Ltd 1.30%Hindalco Industries Ltd 1.26%Federal Bank Ltd 1.22%Axis Bank Ltd 1.22%LIC Housing Finance Limited CRISIL AAA 1.17%Grasim Industries Ltd 1.15%Housing Development Finance Corporation Limited ICRA A1+ 1.12%Housing Development Finance Corporation Limited ICRA A1+ 1.12%Yes Bank Ltd 1.12%Tata Motors Finance Ltd ICRA A1+ 1.12%Tata Consultancy Services Ltd 1.11%Dish TV India Ltd 1.00%Sun TV Network Ltd 0.99%Tata Motors Ltd DVR Shares 0.99%Aurobindo Pharma Ltd 0.95%Kotak Mahindra Bank Ltd 0.93%IDFC Bank Ltd 0.90%Cairn India Ltd 0.90%Aditya Birla Nuvo Ltd 0.88%Bharat Financial Inclusion Ltd 0.86%Century Textiles & Industries Ltd 0.85%IDFC Ltd 0.79%Infosys Ltd 0.73%Tata Steel Ltd 0.71%Indusind Bank Ltd 0.71%GMR Infrastructure Ltd 0.71%Tata Capital Housing Finance Ltd CRISIL A1+ 0.68%JSW Steel Ltd 0.66%Asian Paints Ltd 0.66%India Cements Ltd 0.65%Larsen & Toubro Ltd 0.65%Reliance Capital Ltd 0.63%UPL Limited 0.62%Zee Entertainment Enterprises Ltd 0.61%Lupin Ltd 0.60%Castrol India Ltd 0.59%Reliance Infrastructure Ltd 0.59%United Spirits Ltd 0.58%NCC Ltd 0.58%Hindustan Unilever Ltd 0.55%Oil & Natural Gas Corporation Ltd 0.52%Bajaj Auto Ltd 0.52%Britannia Industries Ltd 0.50%Jindal Steel and Power Ltd 0.47%Ashok Leyland Ltd 0.34%Tata Motors Ltd 0.32%Shriram Transport Finance Company Ltd 0.30%Reliance Power Ltd 0.27%Power Grid Corporation of India Ltd 0.27%Dewan Housing Finance Corporation Ltd 0.26%Tata Global Beverages Ltd 0.25%Bharat Forge Ltd 0.22%IFCI Ltd 0.22%Engineers India Ltd 0.21%Reliance Communications Ltd 0.19%Adani Ports and Special Economic Zone Ltd 0.18%IDBI Bank Ltd 0.17%Pidilite Industries Ltd 0.16%Tech Mahindra Ltd 0.16%Bharat Heavy Electricals Ltd 0.15%Dr Reddys Laboratories Ltd 0.15%
Cipla Ltd 0.15%Bosch Ltd 0.15%Petronet LNG Ltd 0.14%Housing Development and Infrastructure Ltd 0.10%IRB Infrastructure Developers Ltd 0.10%Arvind Ltd 0.09%Divis Laboratories Ltd 0.08%Eicher Motors Ltd 0.08%Jaiprakash Associates Ltd 0.07%Wipro Ltd 0.07%Tata Power Co Ltd 0.05%Jet Airways India Ltd 0.05%NMDC Ltd 0.05%Hero MotoCorp Ltd 0.05%Indiabulls Real Estate Ltd 0.04%Indraprastha Gas Ltd 0.04%Bank Of Baroda 0.02%L and T Finance Holdings Ltd 0.01%LIC Housing Finance Ltd 0.01%ACC Ltd 0.00%ACC_25/01/2017 0.00%LICHSGFIN_25/01/2017 -0.01%L&TFH_25/01/2017 -0.01%BANKBARODA_25/01/2017 -0.02%IGL_25/01/2017 -0.04%IBREALEST_25/01/2017 -0.04%HEROMOTOCO_25/01/2017 -0.05%NMDC_25/01/2017 -0.05%JETAIRWAYS_25/01/2017 -0.05%TATAPOWER_25/01/2017 -0.05%WIPRO_25/01/2017 -0.07%JPASSOCIAT_25/01/2017 -0.07%EICHERMOT_25/01/2017 -0.08%DIVISLAB_25/01/2017 -0.08%ARVIND_25/01/2017 -0.09%IRB_25/01/2017 -0.10%HDIL_25/01/2017 -0.10%PETRONET_25/01/2017 -0.14%BOSCHLTD_25/01/2017 -0.15%CIPLA_25/01/2017 -0.15%DRREDDY_25/01/2017 -0.15%BHEL_25/01/2017 -0.15%TECHM_25/01/2017 -0.16%PIDILITIND_25/01/2017 -0.16%IDBI_25/01/2017 -0.17%ADANIPORTS_25/01/2017 -0.18%RCOM_25/01/2017 -0.19%ENGINERSIN_25/01/2017 -0.21%IFCI_25/01/2017 -0.22%BHARATFORG_25/01/2017 -0.22%TATAGLOBAL_25/01/2017 -0.26%DHFL_25/01/2017 -0.26%POWERGRID_25/01/2017 -0.27%RPOWER_25/01/2017 -0.27%SRTRANSFIN_25/01/2017 -0.30%TATAMOTORS_25/01/2017 -0.32%ASHOKLEY_25/01/2017 -0.34%JINDALSTEL_25/01/2017 -0.47%BRITANNIA_25/01/2017 -0.51%BAJAJ-AUTO_25/01/2017 -0.52%ONGC_25/01/2017 -0.52%HINDUNILVR_25/01/2017 -0.55%NCC_25/01/2017 -0.58%MCDOWELL-N_25/01/2017 -0.58%RELINFRA_25/01/2017 -0.59%CASTROLIND_25/01/2017 -0.60%LUPIN_25/01/2017 -0.60%ZEEL_25/01/2017 -0.61%UPL_25/01/2017 -0.62%RELCAPITAL_25/01/2017 -0.63%LT_25/01/2017 -0.65%INDIACEM_25/01/2017 -0.65%ASIANPAINT_25/01/2017 -0.66%JSWSTEEL_25/01/2017 -0.66%INDUSINDBK_25/01/2017 -0.71%TATASTEEL_25/01/2017 -0.71%GMRINFRA_25/01/2017 -0.71%INFY_25/01/2017 -0.73%IDFC_25/01/2017 -0.80%CENTURYTEX_25/01/2017 -0.85%BHARATFIN_25/01/2017 -0.86%ABIRLANUVO_25/01/2017 -0.88%CAIRN_25/01/2017 -0.90%IDFCBANK_25/01/2017 -0.90%KOTAKBANK_25/01/2017 -0.93%AUROPHARMA_25/01/2017 -0.95%TATAMTRDVR_25/01/2017 -0.99%SUNTV_25/01/2017 -1.00%DISHTV_25/01/2017 -1.00%TCS_25/01/2017 -1.11%YESBANK_25/01/2017 -1.12%GRASIM_25/01/2017 -1.15%AXISBANK_25/01/2017 -1.22%FEDERALBNK_25/01/2017 -1.23%HINDALCO_25/01/2017 -1.26%ICICIBANK_25/01/2017 -1.31%MARUTI_25/01/2017 -1.57%M&M_25/01/2017 -1.68%SUNPHARMA_25/01/2017 -1.84%ITC_25/01/2017 -1.91%HDFC_25/01/2017 -2.20%IBULHSGFIN_25/01/2017 -2.66%
70
Portfolio
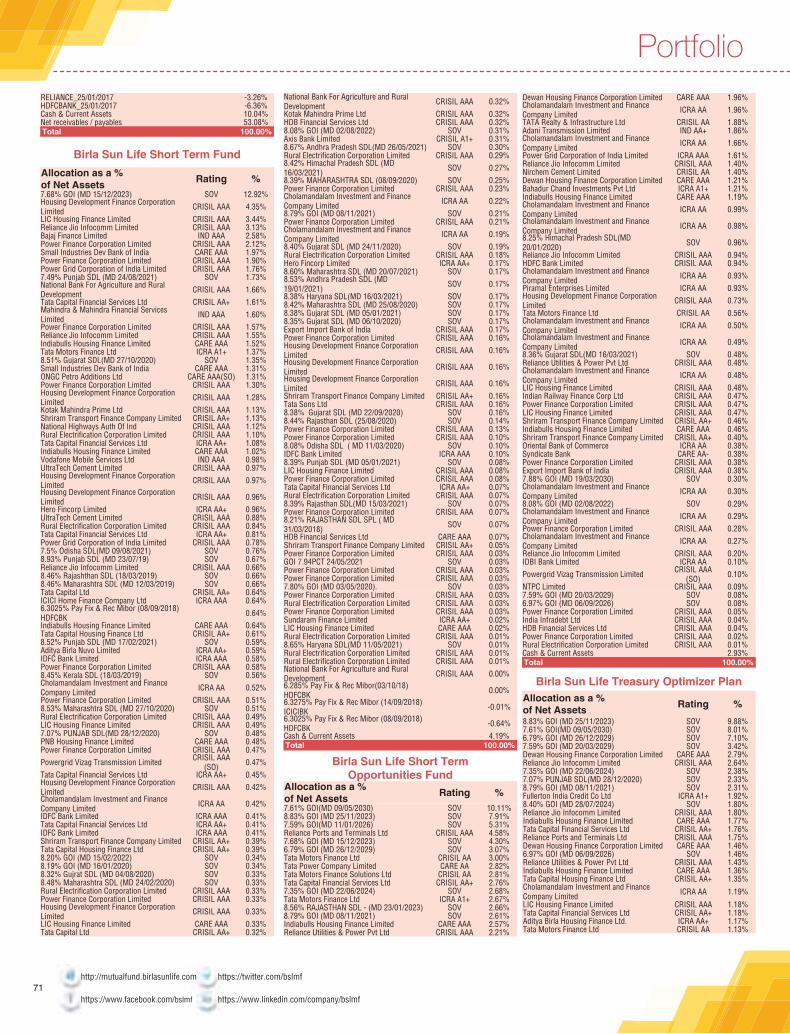
RELIANCE_25/01/2017 -3.26%HDFCBANK_25/01/2017 -6.36%Cash & Current Assets 10.04%Net receivables / payables 53.08%Total 100.00%
Birla Sun Life Short Term FundAllocation as a % of Net Assets Rating %7.68% GOI (MD 15/12/2023) SOV 12.92%Housing Development Finance Corporation Limited CRISIL AAA 4.35%LIC Housing Finance Limited CRISIL AAA 3.44%Reliance Jio Infocomm Limited CRISIL AAA 3.13%Bajaj Finance Limited IND AAA 2.58%Power Finance Corporation Limited CRISIL AAA 2.12%Small Industries Dev Bank of India CARE AAA 1.97%Power Finance Corporation Limited CRISIL AAA 1.90%Power Grid Corporation of India Limited CRISIL AAA 1.76%7.49% Punjab SDL (MD 24/08/2021) SOV 1.73%National Bank For Agriculture and Rural Development CRISIL AAA 1.66%Tata Capital Financial Services Ltd CRISIL AA+ 1.61%Mahindra & Mahindra Financial Services Limited IND AAA 1.60%Power Finance Corporation Limited CRISIL AAA 1.57%Reliance Jio Infocomm Limited CRISIL AAA 1.55%Indiabulls Housing Finance Limited CARE AAA 1.52%Tata Motors Finance Ltd ICRA A1+ 1.37%8.51% Gujarat SDL(MD 27/10/2020) SOV 1.35%Small Industries Dev Bank of India CARE AAA 1.31%ONGC Petro Additions Ltd CARE AAA(SO) 1.31%Power Finance Corporation Limited CRISIL AAA 1.30%Housing Development Finance Corporation Limited CRISIL AAA 1.28%Kotak Mahindra Prime Ltd CRISIL AAA 1.13%Shriram Transport Finance Company Limited CRISIL AA+ 1.13%National Highways Auth Of Ind CRISIL AAA 1.12%Rural Electrification Corporation Limited CRISIL AAA 1.10%Tata Capital Financial Services Ltd ICRA AA+ 1.08%Indiabulls Housing Finance Limited CARE AAA 1.02%Vodafone Mobile Services Ltd IND AAA 0.98%UltraTech Cement Limited CRISIL AAA 0.97%Housing Development Finance Corporation Limited CRISIL AAA 0.97%Housing Development Finance Corporation Limited CRISIL AAA 0.96%Hero Fincorp Limited ICRA AA+ 0.96%UltraTech Cement Limited CRISIL AAA 0.88%Rural Electrification Corporation Limited CRISIL AAA 0.84%Tata Capital Financial Services Ltd ICRA AA+ 0.81%Power Grid Corporation of India Limited CRISIL AAA 0.78%7.5% Odisha SDL(MD 09/08/2021) SOV 0.76%8.93% Punjab SDL (MD 23/07/19) SOV 0.67%Reliance Jio Infocomm Limited CRISIL AAA 0.66%8.46% Rajashthan SDL (18/03/2019) SOV 0.66%8.46% Maharashtra SDL (MD 12/03/2019) SOV 0.66%Tata Capital Ltd CRISIL AA+ 0.64%ICICI Home Finance Company Ltd ICRA AAA 0.64%6.3025% Pay Fix & Rec Mibor (08/09/2018) HDFCBK 0.64%Indiabulls Housing Finance Limited CARE AAA 0.64%Tata Capital Housing Finance Ltd CRISIL AA+ 0.61%8.52% Punjab SDL (MD 17/02/2021) SOV 0.59%Aditya Birla Nuvo Limited ICRA AA+ 0.59%IDFC Bank Limited ICRA AAA 0.58%Power Finance Corporation Limited CRISIL AAA 0.58%8.45% Kerala SDL (18/03/2019) SOV 0.56%Cholamandalam Investment and Finance Company Limited ICRA AA 0.52%Power Finance Corporation Limited CRISIL AAA 0.51%8.53% Maharashtra SDL (MD 27/10/2020) SOV 0.51%Rural Electrification Corporation Limited CRISIL AAA 0.49%LIC Housing Finance Limited CRISIL AAA 0.49%7.07% PUNJAB SDL(MD 28/12/2020) SOV 0.48%PNB Housing Finance Limited CARE AAA 0.48%Power Finance Corporation Limited CRISIL AAA 0.47%Powergrid Vizag Transmission Limited CRISIL AAA
(SO) 0.47%Tata Capital Financial Services Ltd ICRA AA+ 0.45%Housing Development Finance Corporation Limited CRISIL AAA 0.42%Cholamandalam Investment and Finance Company Limited ICRA AA 0.42%IDFC Bank Limited ICRA AAA 0.41%Tata Capital Financial Services Ltd ICRA AA+ 0.41%IDFC Bank Limited ICRA AAA 0.41%Shriram Transport Finance Company Limited CRISIL AA+ 0.39%Tata Capital Housing Finance Ltd CRISIL AA+ 0.39%8.20% GOI (MD 15/02/2022) SOV 0.34%8.19% GOI (MD 16/01/2020) SOV 0.34%8.32% Gujrat SDL (MD 04/08/2020) SOV 0.33%8.48% Maharashtra SDL (MD 24/02/2020) SOV 0.33%Rural Electrification Corporation Limited CRISIL AAA 0.33%Power Finance Corporation Limited CRISIL AAA 0.33%Housing Development Finance Corporation Limited CRISIL AAA 0.33%LIC Housing Finance Limited CARE AAA 0.33%Tata Capital Ltd CRISIL AA+ 0.32%
National Bank For Agriculture and Rural Development CRISIL AAA 0.32%Kotak Mahindra Prime Ltd CRISIL AAA 0.32%HDB Financial Services Ltd CRISIL AAA 0.32%8.08% GOI (MD 02/08/2022) SOV 0.31%Axis Bank Limited CRISIL A1+ 0.31%8.67% Andhra Pradesh SDL(MD 26/05/2021) SOV 0.30%Rural Electrification Corporation Limited CRISIL AAA 0.29%8.42% Himachal Pradesh SDL (MD 16/03/2021) SOV 0.27%8.39% MAHARASHTRA SDL (08/09/2020) SOV 0.25%Power Finance Corporation Limited CRISIL AAA 0.23%Cholamandalam Investment and Finance Company Limited ICRA AA 0.22%8.79% GOI (MD 08/11/2021) SOV 0.21%Power Finance Corporation Limited CRISIL AAA 0.21%Cholamandalam Investment and Finance Company Limited ICRA AA 0.19%8.40% Gujarat SDL (MD 24/11/2020) SOV 0.19%Rural Electrification Corporation Limited CRISIL AAA 0.18%Hero Fincorp Limited ICRA AA+ 0.17%8.60% Maharashtra SDL (MD 20/07/2021) SOV 0.17%8.53% Andhra Pradesh SDL (MD 19/01/2021) SOV 0.17%8.38% Haryana SDL(MD 16/03/2021) SOV 0.17%8.42% Maharashtra SDL (MD 25/08/2020) SOV 0.17%8.38% Gujarat SDL (MD 05/01/2021) SOV 0.17%8.35% Gujarat SDL (MD 06/10/2020) SOV 0.17%Export Import Bank of India CRISIL AAA 0.17%Power Finance Corporation Limited CRISIL AAA 0.16%Housing Development Finance Corporation Limited CRISIL AAA 0.16%Housing Development Finance Corporation Limited CRISIL AAA 0.16%Housing Development Finance Corporation Limited CRISIL AAA 0.16%Shriram Transport Finance Company Limited CRISIL AA+ 0.16%Tata Sons Ltd CRISIL AAA 0.16%8.38% Gujarat SDL (MD 22/09/2020) SOV 0.16%8.44% Rajasthan SDL (25/08/2020) SOV 0.14%Power Finance Corporation Limited CRISIL AAA 0.13%Power Finance Corporation Limited CRISIL AAA 0.10%8.08% Odisha SDL ( MD 11/03/2020) SOV 0.10%IDFC Bank Limited ICRA AAA 0.10%8.39% Punjab SDL (MD 05/01/2021) SOV 0.08%LIC Housing Finance Limited CRISIL AAA 0.08%Power Finance Corporation Limited CRISIL AAA 0.08%Tata Capital Financial Services Ltd ICRA AA+ 0.07%Rural Electrification Corporation Limited CRISIL AAA 0.07%8.39% Rajasthan SDL(MD 15/03/2021) SOV 0.07%Power Finance Corporation Limited CRISIL AAA 0.07%8.21% RAJASTHAN SDL SPL ( MD 31/03/2018) SOV 0.07%HDB Financial Services Ltd CARE AAA 0.07%Shriram Transport Finance Company Limited CRISIL AA+ 0.05%Power Finance Corporation Limited CRISIL AAA 0.03%GOI 7.94PCT 24/05/2021 SOV 0.03%Power Finance Corporation Limited CRISIL AAA 0.03%Power Finance Corporation Limited CRISIL AAA 0.03%7.80% GOI (MD 03/05/2020). SOV 0.03%Power Finance Corporation Limited CRISIL AAA 0.03%Rural Electrification Corporation Limited CRISIL AAA 0.03%Power Finance Corporation Limited CRISIL AAA 0.03%Sundaram Finance Limited ICRA AA+ 0.02%LIC Housing Finance Limited CARE AAA 0.02%Rural Electrification Corporation Limited CRISIL AAA 0.01%8.65% Haryana SDL(MD 11/05/2021) SOV 0.01%Rural Electrification Corporation Limited CRISIL AAA 0.01%Rural Electrification Corporation Limited CRISIL AAA 0.01%National Bank For Agriculture and Rural Development CRISIL AAA 0.00%6.285% Pay Fix & Rec Mibor(03/10/18) HDFCBK 0.00%6.3275% Pay Fix & Rec Mibor (14/09/2018) ICICIBK -0.01%6.3025% Pay Fix & Rec Mibor (08/09/2018)HDFCBK -0.64%Cash & Current Assets 4.19%Total 100.00%
Birla Sun Life Short Term Opportunities Fund
Allocation as a % of Net Assets Rating %7.61% GOI(MD 09/05/2030) SOV 10.11%8.83% GOI (MD 25/11/2023) SOV 7.91%7.59% GOI(MD 11/01/2026) SOV 5.31%Reliance Ports and Terminals Ltd CRISIL AAA 4.58%7.68% GOI (MD 15/12/2023) SOV 4.30%6.79% GOI (MD 26/12/2029) SOV 3.07%Tata Motors Finance Ltd CRISIL AA 3.00%Tata Power Company Limited CARE AA 2.82%Tata Motors Finance Solutions Ltd CRISIL AA 2.81%Tata Capital Financial Services Ltd CRISIL AA+ 2.76%7.35% GOI (MD 22/06/2024) SOV 2.68%Tata Motors Finance Ltd ICRA A1+ 2.67%8.56% RAJASTHAN SDL - (MD 23/01/2023) SOV 2.66%8.79% GOI (MD 08/11/2021) SOV 2.61%Indiabulls Housing Finance Limited CARE AAA 2.57%Reliance Utilities & Power Pvt Ltd CRISIL AAA 2.21%
Dewan Housing Finance Corporation Limited CARE AAA 1.96%Cholamandalam Investment and Finance Company Limited ICRA AA 1.96%TATA Realty & Infrastructure Ltd CRISIL AA 1.88%Adani Transmission Limited IND AA+ 1.86%Cholamandalam Investment and Finance Company Limited ICRA AA 1.66%Power Grid Corporation of India Limited ICRA AAA 1.61%Reliance Jio Infocomm Limited CRISIL AAA 1.40%Nirchem Cement Limited CRISIL AA 1.40%Dewan Housing Finance Corporation Limited CARE AAA 1.21%Bahadur Chand Investments Pvt Ltd ICRA A1+ 1.21%Indiabulls Housing Finance Limited CARE AAA 1.19%Cholamandalam Investment and Finance Company Limited ICRA AA 0.99%Cholamandalam Investment and Finance Company Limited ICRA AA 0.98%8.25% Himachal Pradesh SDL(MD 20/01/2020) SOV 0.96%Reliance Jio Infocomm Limited CRISIL AAA 0.94%HDFC Bank Limited CRISIL AAA 0.94%Cholamandalam Investment and Finance Company Limited ICRA AA 0.93%Piramal Enterprises Limited ICRA AA 0.93%Housing Development Finance Corporation Limited CRISIL AAA 0.73%Tata Motors Finance Ltd CRISIL AA 0.56%Cholamandalam Investment and Finance Company Limited ICRA AA 0.50%Cholamandalam Investment and Finance Company Limited ICRA AA 0.49%8.36% Gujarat SDL(MD 16/03/2021) SOV 0.48%Reliance Utilities & Power Pvt Ltd CRISIL AAA 0.48%Cholamandalam Investment and Finance Company Limited ICRA AA 0.48%LIC Housing Finance Limited CRISIL AAA 0.48%Indian Railway Finance Corp Ltd CRISIL AAA 0.47%Power Finance Corporation Limited CRISIL AAA 0.47%LIC Housing Finance Limited CRISIL AAA 0.47%Shriram Transport Finance Company Limited CRISIL AA+ 0.46%Indiabulls Housing Finance Limited CARE AAA 0.46%Shriram Transport Finance Company Limited CRISIL AA+ 0.40%Oriental Bank of Commerce ICRA AA 0.38%Syndicate Bank CARE AA- 0.38%Power Finance Corporation Limited CRISIL AAA 0.38%Export Import Bank of India CRISIL AAA 0.38%7.88% GOI (MD 19/03/2030) SOV 0.30%Cholamandalam Investment and Finance Company Limited ICRA AA 0.30%8.08% GOI (MD 02/08/2022) SOV 0.29%Cholamandalam Investment and Finance Company Limited ICRA AA 0.29%Power Finance Corporation Limited CRISIL AAA 0.28%Cholamandalam Investment and Finance Company Limited ICRA AA 0.27%Reliance Jio Infocomm Limited CRISIL AAA 0.20%IDBI Bank Limited ICRA AA 0.10%Powergrid Vizag Transmission Limited CRISIL AAA
(SO) 0.10%NTPC Limited CRISIL AAA 0.09%7.59% GOI (MD 20/03/2029) SOV 0.08%6.97% GOI (MD 06/09/2026) SOV 0.08%Power Finance Corporation Limited CRISIL AAA 0.05%India Infradebt Ltd CRISIL AAA 0.04%HDB Financial Services Ltd CRISIL AAA 0.04%Power Finance Corporation Limited CRISIL AAA 0.02%Rural Electrification Corporation Limited CRISIL AAA 0.01%Cash & Current Assets 2.93%Total 100.00%
Birla Sun Life Treasury Optimizer PlanAllocation as a % of Net Assets Rating %
8.83% GOI (MD 25/11/2023) SOV 9.88%7.61% GOI(MD 09/05/2030) SOV 8.01%6.79% GOI (MD 26/12/2029) SOV 7.10%7.59% GOI (MD 20/03/2029) SOV 3.42%Dewan Housing Finance Corporation Limited CARE AAA 2.79%Reliance Jio Infocomm Limited CRISIL AAA 2.64%7.35% GOI (MD 22/06/2024) SOV 2.38%7.07% PUNJAB SDL(MD 28/12/2020) SOV 2.33%8.79% GOI (MD 08/11/2021) SOV 2.31%Fullerton India Credit Co Ltd ICRA A1+ 1.92%8.40% GOI (MD 28/07/2024) SOV 1.80%Reliance Jio Infocomm Limited CRISIL AAA 1.80%Indiabulls Housing Finance Limited CARE AAA 1.77%Tata Capital Financial Services Ltd CRISIL AA+ 1.76%Reliance Ports and Terminals Ltd CRISIL AAA 1.75%Dewan Housing Finance Corporation Limited CARE AAA 1.46%6.97% GOI (MD 06/09/2026) SOV 1.46%Reliance Utilities & Power Pvt Ltd CRISIL AAA 1.43%Indiabulls Housing Finance Limited CARE AAA 1.36%Tata Capital Housing Finance Ltd CRISIL AA+ 1.35%Cholamandalam Investment and Finance Company Limited ICRA AA 1.19%
LIC Housing Finance Limited CRISIL AAA 1.18%Tata Capital Financial Services Ltd CRISIL AA+ 1.18%Aditya Birla Housing Finance Ltd. ICRA AA+ 1.17%Tata Motors Finance Ltd CRISIL AA 1.13%
http://mutualfund.birlasunlife.com https://twitter.com/bslmf
https://www.facebook.com/bslmf https://www.linkedin.com/company/bslmf71
Portfolio

Hero Fincorp Limited ICRA AA+ 0.94%Cholamandalam Investment and Finance Company Limited ICRA AA 0.91%
HDFC Bank Limited CRISIL AAA 0.90%Shriram Transport Finance Company Limited CRISIL AA+ 0.89%Rural Electrification Corporation Limited CRISIL AAA 0.87%8.51% Haryana SDL(MD 27/10/2020) SOV 0.81%LIC Housing Finance Limited CRISIL AAA 0.79%7.88% GOI (MD 19/03/2030) SOV 0.76%Rural Electrification Corporation Limited CRISIL AAA 0.73%9.23% GOI (MD 23/12/2043) SOV 0.73%8.17% GOI (MD 01/12/2044) SOV 0.72%Shriram Transport Finance Company Limited CRISIL AA+ 0.71%Shriram Transport Finance Company Limited CRISIL AA+ 0.71%Housing Development Finance Corporation Limited CRISIL AAA 0.70%
8.97% GOI (MD 05/12/2030) SOV 0.62%8.50% Punjab SDL(MD 27/10/2020) SOV 0.62%Tata Capital Financial Services Ltd CRISIL AA+ 0.61%LIC Housing Finance Limited CRISIL AAA 0.60%Reliance Jio Infocomm Limited CRISIL AAA 0.60%Cholamandalam Investment and Finance Company Limited ICRA AA 0.60%
PNB Housing Finance Limited CARE AAA 0.59%Indiabulls Housing Finance Limited CARE AAA 0.59%National Highways Auth Of Ind CRISIL AAA 0.59%Power Grid Corporation of India Limited CRISIL AAA 0.59%Kotak Mahindra Prime Ltd CRISIL AAA 0.59%NTPC Limited CRISIL AAA 0.58%HDB Financial Services Ltd CRISIL AAA 0.56%
Powergrid Vizag Transmission Limited CRISIL AAA (SO) 0.55%
NTPC Limited CRISIL AAA 0.52%8.20% GOI (MD 15/02/2022) SOV 0.50%LIC Housing Finance Limited CRISIL AAA 0.47%8.60% GOI (MD 02/06/2028) SOV 0.46%Housing Development Finance Corporation Limited CRISIL AAA 0.43%
Nabha Power Ltd ICRA AAA(SO) 0.42%Indiabulls Housing Finance Limited CARE AAA 0.41%Indiabulls Housing Finance Limited CARE AAA 0.41%SP Jammu Udhampur Highway Ltd ICRA AAA(SO) 0.40%IDFC Bank Limited ICRA AAA 0.38%SP Jammu Udhampur Highway Ltd ICRA AAA(SO) 0.38%SP Jammu Udhampur Highway Ltd ICRA AAA(SO) 0.37%8.35% Gujarat SDL (MD 06/10/2020) SOV 0.37%SP Jammu Udhampur Highway Ltd ICRA AAA(SO) 0.35%SP Jammu Udhampur Highway Ltd ICRA AAA(SO) 0.35%SP Jammu Udhampur Highway Ltd ICRA AAA(SO) 0.33%8.27% GOI (MD 09/06/2020) SOV 0.31%8.12% GOI (MD 10/12/2020) SOV 0.31%8.70% Uttar Pradesh SDL (MD 04/10/2020) SOV 0.31%Cholamandalam Investment and Finance Company Limited ICRA AA 0.31%
Power Finance Corporation Limited CRISIL AAA 0.31%8.37% Punjab SDL (MD 22/09/2020) SOV 0.31%8.53% Maharashtra SDL (MD 27/10/2020) SOV 0.30%Power Finance Corporation Limited CRISIL AAA 0.30%Shriram Transport Finance Company Limited CRISIL AA+ 0.30%L & T Infrastructure Finance Co Ltd CARE AA+ 0.30%Fullerton India Credit Co Ltd CARE AAA 0.29%Essel Lucknow Raebareli Toll Roads Limited CARE AAA(SO) 0.27%Essel Lucknow Raebareli Toll Roads Limited CARE AAA(SO) 0.27%9.15% GOI (MD 14/11/2024) SOV 0.27%Essel Lucknow Raebareli Toll Roads Limited CARE AAA(SO) 0.26%8.15% GOI (MD 11/06/2022) SOV 0.25%Essel Lucknow Raebareli Toll Roads Limited CARE AAA(SO) 0.25%Essel Lucknow Raebareli Toll Roads Limited CARE AAA(SO) 0.25%Power Finance Corporation Limited CARE AAA 0.24%Essel Lucknow Raebareli Toll Roads Limited CARE AAA(SO) 0.24%7.73% GOI (MD 19/12/2034) SOV 0.19%Essel Lucknow Raebareli Toll Roads Limited CARE AAA(SO) 0.18%Power Grid Corporation of India Limited ICRA AAA 0.18%Power Finance Corporation Limited CRISIL AAA 0.18%IDFC Bank Limited ICRA AAA 0.17%India Infradebt Ltd CRISIL AAA 0.16%8.13% GOI (MD 22/06/2045) SOV 0.13%8.08% GOI (MD 02/08/2022) SOV 0.13%Power Finance Corporation Limited CRISIL AAA 0.12%Bahadur Chand Investments Pvt Ltd ICRA A1+ 0.11%
IOT Utkal Energy Services Limited CRISIL AAA (SO) 0.07%
8.33% GOI 2026 (M/D 09/07/2026) SOV 0.06%8.56% RAJASTHAN SDL - (MD 23/01/2023) SOV 0.06%Tata Motors Finance Ltd CRISIL AA 0.06%8.39% Rajasthan Special SDL(MD 15/03/2022) SOV 0.06%
8.19% GOI (MD 16/01/2020) SOV 0.06%8.56% Punjab SDL(MD 13/04/2020) SOV 0.06%Power Finance Corporation Limited CRISIL AAA 0.06%Export Import Bank of India CRISIL AAA 0.06%6.84% GOI (MD 19/12/2022) SOV 0.06%
IOT Utkal Energy Services Limited CRISIL AAA (SO) 0.05%
IOT Utkal Energy Services Limited CRISIL AAA (SO) 0.05%
IOT Utkal Energy Services Limited CRISIL AAA (SO) 0.05%
IOT Utkal Energy Services Limited CRISIL AAA (SO) 0.05%
IOT Utkal Energy Services Limited CRISIL AAA (SO) 0.05%
IOT Utkal Energy Services Limited CRISIL AAA (SO) 0.05%
IOT Utkal Energy Services Limited CRISIL AAA (SO) 0.05%
IOT Utkal Energy Services Limited CRISIL AAA (SO) 0.05%
IOT Utkal Energy Services Limited CRISIL AAA (SO) 0.05%
IOT Utkal Energy Services Limited CRISIL AAA (SO) 0.05%
IOT Utkal Energy Services Limited CRISIL AAA (SO) 0.05%
IOT Utkal Energy Services Limited CRISIL AAA (SO) 0.05%
IOT Utkal Energy Services Limited CRISIL AAA (SO) 0.05%
IOT Utkal Energy Services Limited CRISIL AAA (SO) 0.05%
IOT Utkal Energy Services Limited CRISIL AAA (SO) 0.05%
IOT Utkal Energy Services Limited CRISIL AAA (SO) 0.05%
IOT Utkal Energy Services Limited CRISIL AAA (SO) 0.05%
IOT Utkal Energy Services Limited CRISIL AAA (SO) 0.04%
IOT Utkal Energy Services Limited CRISIL AAA (SO) 0.04%
IOT Utkal Energy Services Limited CRISIL AAA (SO) 0.04%
Rural Electrification Corporation Limited CRISIL AAA 0.03%Nabha Power Ltd ICRA AAA(SO) 0.02%
IOT Utkal Energy Services Limited CRISIL AAA (SO) 0.02%
7.59% GOI(MD 11/01/2026) SOV 0.00%Cash & Current Assets 0.56%Total 100.00%
Birla Sun Life Medium Term PlanAllocation as a % of Net Assets Rating %7.61% GOI(MD 09/05/2030) SOV 9.25%7.59% GOI (MD 20/03/2029) SOV 6.04%Piramal Finance Private Limited ICRA AA 5.60%Adani Transmission Limited IND AA+ 5.28%6.79% GOI (MD 26/12/2029) SOV 5.00%Sansar Trust IND AAA(SO) 3.83%6.97% GOI (MD 06/09/2026) SOV 3.11%RHC Holding Pvt Ltd CARE A(SO) 2.94%S.D. Corporation Pvt. Ltd ICRA AA(SO) 2.93%Relationships Properties Pvt Ltd CARE AA-(SO) 2.45%Adani Power Limited BWR AA-(SO) 2.23%Systemtrac Traders Private Limited ICRA AA-(SO) 2.20%Tata Motors Finance Solutions Ltd CRISIL AA 2.17%Adani Power Limited BWR AA-(SO) 2.12%Indiabulls Properties Private Limited CARE AA-(SO) 2.00%8.13% GOI (MD 22/06/2045) SOV 1.96%ECL Finance Ltd ICRA AA 1.93%IL & FS Education and Technology Services Ltd IND AA-(SO) 1.91%Indiabulls Housing Finance Limited CARE AAA 1.86%ISTD Loan Trust IND AA+(SO) 1.74%MFL Securitisation Trust IND AAA(SO) 1.64%Writers & Publishers Pvt Ltd BWR AA-(SO) 1.61%L&T Vadodara Bharuch Tollway Limited IND A 1.59%TATA Realty & Infrastructure Ltd CRISIL AA 1.55%Dewan Housing Finance Corporation Limited CARE AAA 1.34%Dewan Housing Finance Corporation Limited CARE AAA 1.29%Hero Realty Ltd ICRA A+(SO) 1.08%Indiabulls Housing Finance Limited CARE AAA 1.06%Bank of India BWR AA- 1.05%Wadhawan Global Capital Pvt Ltd CARE AAA(SO) 1.02%Tanglin Development Limited BWR A-(SO) 0.96%Sansar Trust CRISIL AAA
(SO) 0.95%Indiabulls Housing Finance Limited CARE AAA 0.91%High Point Properties Private Limited ICRA AA(SO) 0.81%Millenia Realtors Private Limited UNRATED 0.80%7.59% GOI(MD 11/01/2026) SOV 0.80%Tata Power Renewable Energy Ltd CARE AA 0.76%Syndicate Bank CARE AA- 0.72%9.23% GOI (MD 23/12/2043) SOV 0.66%Coffee Day Enterprises Limited BWR AA-(SO) 0.65%Hero Realty Ltd UNRATED 0.64%Hinduja Leyland Finance Ltd CARE A+ 0.64%Oriental Bank of Commerce IND A+ 0.60%Pune Solapur Expressway Pvt Ltd ICRA A(SO) 0.59%7.73% GOI (MD 19/12/2034) SOV 0.57%Grand View Estates Pvt Ltd ICRA AA(SO) 0.54%Syndicate Bank CARE AA- 0.53%Coffee Day Enterprises Limited BWR AA-(SO) 0.38%Sansar Trust CRISIL AAA
(SO) 0.35%
Sansar Trust CRISIL AAA (SO) 0.33%
Edelweiss Finance & Investments LTD ICRA AA 0.33%
Edelweiss Retail Finance Ltd ICRA AA 0.32%8.24% GOI (MD 10/11/2033) SOV 0.30%7.88% GOI (MD 19/03/2030) SOV 0.29%7.68% GOI (MD 15/12/2023) SOV 0.28%Housing Development Finance Corporation Limited CRISIL AAA 0.27%Rural Electrification Corporation Limited CRISIL AAA 0.17%Shriram Transport Finance Company Limited IND AA+ 0.16%Vedanta Limited CRISIL AA- 0.11%Pune Solapur Expressway Pvt Ltd ICRA A(SO) 0.06%8.20% GOI (MD 15/02/2022) SOV 0.06%Kotak Mahindra Prime Ltd CRISIL AAA 0.01%LIC Housing Finance Limited CRISIL AAA 0.00%Birla Sun Life Cash Plus - Growth - Direct Plan 0.00%Cash & Current Assets 4.67%Total 100.00%
Birla Sun Life Corporate Bond FundAllocation as a % of Net Assets Rating %Adani Transmission Limited IND AA+ 5.89%Systemtrac Traders Private Limited ICRA AA-(SO) 4.40%Wadhawan Global Capital Pvt Ltd CARE AAA(SO) 4.27%Piramal Finance Private Limited ICRA AA 3.53%Adani Power Limited BWR AA-(SO) 3.51%HDFC Bank Limited CRISIL AAA 3.43%High Point Properties Private Limited ICRA AA(SO) 3.40%NTPC Limited CRISIL AAA 3.39%Writers & Publishers Pvt Ltd BWR AA-(SO) 3.39%Pune Solapur Expressway Pvt Ltd ICRA A(SO) 3.38%L&T Vadodara Bharuch Tollway Limited IND A 3.37%National Highways Auth Of Ind CRISIL AAA 3.37%Grand View Estates Pvt Ltd ICRA AA(SO) 2.73%Hero Realty Ltd UNRATED 2.70%Reliance Ports and Terminals Ltd CRISIL AAA 2.68%Indiabulls Housing Finance Limited CARE AAA 2.34%Dewan Housing Finance Corporation Limited CARE AAA 2.17%Tata Power Renewable Energy Ltd CARE AA 2.06%S.D. Corporation Pvt. Ltd ICRA AA(SO) 2.05%Tanglin Development Limited BWR A-(SO) 2.02%Export Import Bank of India CRISIL AAA 1.81%Power Finance Corporation Limited CRISIL AAA 1.80%Housing Development Finance Corporation Limited CRISIL AAA 1.76%Power Finance Corporation Limited CRISIL AAA 1.74%IL & FS Education and Technology Services Ltd IND AA-(SO) 1.73%Coffee Day Enterprises Limited BWR AA-(SO) 1.71%Power Grid Corporation of India Limited CRISIL AAA 1.70%Power Finance Corporation Limited CRISIL AAA 1.70%Power Grid Corporation of India Limited CRISIL AAA 1.69%Power Finance Corporation Limited CRISIL AAA 1.68%Millenia Realtors Private Limited UNRATED 1.68%Oriental Bank of Commerce IND A+ 1.37%Nabha Power Ltd ICRA AAA(SO) 1.14%Bank of India BWR AA- 1.13%Rural Electrification Corporation Limited CRISIL AAA 1.06%Syndicate Bank CARE AA- 1.05%Dewan Housing Finance Corporation Limited CARE AAA 1.02%JM Financial Credit Solution Limited ICRA AA 1.02%Indiabulls Housing Finance Limited CARE AAA 1.00%IL & FS Education and Technology Services Ltd IND AA-(SO) 0.86%Syndicate Bank CARE AA- 0.70%NTPC Limited CRISIL AAA 0.67%Food Corporation Of India CRISIL AAA
(SO) 0.37%Power Finance Corporation Limited CRISIL AAA 0.36%NTPC Limited CRISIL AAA 0.00%Birla Sun Life Cash Plus - Growth - Direct Plan 0.00%Cash & Current Assets 5.18%Total 100.00%
Birla Sun Life Dynamic Bond FundAllocation as a % of Net Assets Rating %8.13% GOI (MD 22/06/2045) SOV 44.81%8.17% GOI (MD 01/12/2044) SOV 8.85%6.79% GOI (MD 26/12/2029) SOV 4.59%7.61% GOI(MD 09/05/2030) SOV 3.98%Piramal Finance Private Limited ICRA AA 3.05%Tata Motors Finance Ltd CRISIL AA 2.45%Shriram Transport Finance Company Limited CRISIL AA+ 2.45%Indiabulls Housing Finance Limited CARE AAA 2.09%Edelweiss Commodities Services Ltd ICRA AA 1.97%Dewan Housing Finance Corporation Limited CARE AAA 1.82%8.60% GOI (MD 02/06/2028) SOV 1.78%7.72% GOI (MD 26/10/2055) SOV 1.43%Adani Power Limited BWR AA-(SO) 1.35%Reliance Ports and Terminals Ltd CRISIL AAA 1.19%Sansar Trust CRISIL AAA
(SO) 1.09%Tata Motors Finance Solutions Ltd CRISIL AA 0.98%Edelweiss Finance & Investments LTD ICRA AA 0.98%Indiabulls Housing Finance Limited CARE AAA 0.96%Indiabulls Properties Private Limited CARE AA-(SO) 0.94%
72
Portfolio

Hinduja Leyland Finance Ltd CARE A+ 0.91%Shriram Transport Finance Company Limited CRISIL AA+ 0.81%Adani Power Limited BWR AA-(SO) 0.74%JM Financial Credit Solution Limited ICRA AA 0.65%9.23% GOI (MD 23/12/2043) SOV 0.64%Adani Transmission Limited IND AA+ 0.57%JM Financial Credit Solution Limited ICRA AA 0.55%ECL Finance Ltd ICRA AA 0.55%Indiabulls Housing Finance Limited CARE AAA 0.49%Nirchem Cement Limited CRISIL AA 0.49%Bahadur Chand Investments Pvt Ltd ICRA AA 0.48%Syndicate Bank CARE AA- 0.45%7.06% GOI (MD10/10/2046) SOV 0.39%8.97% GOI (MD 05/12/2030) SOV 0.38%Sansar Trust IND AAA(SO) 0.37%Adani Transmission Limited IND AA+ 0.36%Indiabulls Housing Finance Limited CARE AAA 0.33%Cholamandalam Investment and Finance Company Limited ICRA AA 0.33%7.07% PUNJAB SDL(MD 28/12/2020) SOV 0.32%7.88% GOI (MD 19/03/2030) SOV 0.31%7.59% GOI(MD 11/01/2026) SOV 0.31%Tata Capital Financial Services Ltd CRISIL AA+ 0.16%Power Grid Corporation of India Limited CRISIL AAA 0.03%7.29% West Bengal SDL (MD 28/12/2026) SOV 0.03%7.96% Gujarat SDL (14/10/2025) SOV 0.03%6.97% GOI (MD 06/09/2026) SOV 0.03%Tata Sons Ltd CRISIL AAA 0.03%8.08% GOI (MD 02/08/2022) SOV 0.02%8.15% GOI (MD 24/11/2026) SOV 0.02%7.59% GOI (MD 20/03/2029) SOV 0.02%8.35% GOI (MD 14/05/2022) SOV 0.01%7.68% GOI (MD 15/12/2023) SOV 0.01%9.20% GOI (MD 30/09/2030) SOV 0.01%Rural Electrification Corporation Limited CRISIL AAA 0.01%9.40% Madhya Pradesh SDL (MD 30/01/2024) SOV 0.00%7.35% GOI (MD 22/06/2024) SOV 0.00%8.33% GOI 2036 (07/06/2036) SOV 0.00%7.96% Maharashtra SDL (14/10/2025) SOV 0.00%Birla Sun Life Cash Plus - Growth - Direct Plan 0.00%Cash & Current Assets 2.39%Total 100.00%
Birla Sun Life Income PlusAllocation as a % of Net Assets Rating %6.79% GOI (MD 26/12/2029) SOV 33.98%7.73% GOI (MD 19/12/2034) SOV 18.68%8.13% GOI (MD 22/06/2045) SOV 8.42%8.17% GOI (MD 01/12/2044) SOV 7.06%NTPC Limited CRISIL AAA 5.09%Bajaj Finance Limited CARE AAA 5.08%Reliance Ports and Terminals Ltd CRISIL AAA 4.68%7.61% GOI(MD 09/05/2030) SOV 3.20%9.23% GOI (MD 23/12/2043) SOV 2.53%HDFC Bank Limited CRISIL AAA 2.08%8.79% GOI (MD 08/11/2021) SOV 1.11%Essel Lucknow Raebareli Toll Roads Limited CARE AAA(SO) 1.09%Essel Lucknow Raebareli Toll Roads Limited CARE AAA(SO) 1.06%Essel Lucknow Raebareli Toll Roads Limited CARE AAA(SO) 1.03%Power Finance Corporation Limited CRISIL AAA 0.62%Essel Lucknow Raebareli Toll Roads Limited CARE AAA(SO) 0.35%8.21% Haryana Special SDL(MD 31/03/2023) SOV 0.34%7.59% GOI (MD 20/03/2029) SOV 0.09%9.56% Maharashtra SDL (MD 28/08/2023) SOV 0.05%7.68% GOI (MD 15/12/2023) SOV 0.04%9.45% Rahasthan SDL (MD 26/03/2024) SOV 0.04%7.59% GOI(MD 11/01/2026) SOV 0.03%6.62% GOI (MD 28/11/2051) SOV 0.03%6.57% GOI (MD 05/12/2033) SOV 0.02%8.24% GOI (MD 10/11/2033) SOV 0.02%8.51% Punjab SDL (MD 10/04/2023) SOV 0.01%8.64% Jharkhand SDL (MD 06/03/2023) SOV 0.01%6.28% Pay Fix & Rec Mibor (30/12/21) HSBCBK 0.00%6.4225% Pay Fix & Rec Mibor (12/07/19) ICICIBK -0.02%6.5075% Pay Fix & Rec Mibor (29/06/19) HDFCBK -0.04%
Cash & Current Assets 3.33%Total Net Assets 100.00%
Birla Sun Life Constant Maturity 10 Year Gilt Fund (erstwhile Birla Sun Life Gilt
Plus – Regular Plan) Allocation as a % of Net Assets Rating %6.97% GOI (MD 06/09/2026) SOV 87.70%8.40% GOI (MD 28/07/2024) SOV 1.55%Cash & Current Assets 10.75%
Total 100.00%
Birla Sun Life Government Securities Fund - Long Term Plan
Allocation as a % of Net Assets Rating %6.79% GOI (MD 26/12/2029) SOV 35.85%8.17% GOI (MD 01/12/2044) SOV 15.29%7.73% GOI (MD 19/12/2034) SOV 10.81%8.60% GOI (MD 02/06/2028) SOV 10.68%8.60% Bihar SDL (MD 09/03/2026) SOV 9.64%6.57% GOI (MD 05/12/2033) SOV 4.58%7.68% GOI (MD 15/12/2023) SOV 0.43%8.30% GOI (MD 02/07/2040) SOV 0.00%7.59% GOI (MD 20/03/2029) SOV 0.00%6.28% Pay Fix & Rec Mibor (30/12/21) ICICIBK -0.01%
6.3825% Pay Fix & Rec Mibor (01/08/19) HDFCBK -0.03%
6.38% Pay Fix & Rec Mibor (01/08/19) HSBCBK -0.05%
6.58% Pay Fix & Rec Mibor (06/04/21) ICICISEC -0.10%
Cash & Current Assets 12.91%Total 100.00%
Birla Sun Life Gilt Plus - PF PlanAllocation as a % of Net Assets Rating %6.79% GOI (MD 26/12/2029) SOV 32.01%6.57% GOI (MD 05/12/2033) SOV 18.39%8.17% GOI (MD 01/12/2044) SOV 17.00%7.73% GOI (MD 19/12/2034) SOV 13.51%8.24% GOI (MD 10/11/2033) SOV 7.04%Cash & Current Assets 12.05%Total 100.00%
Birla Sun Life Active Debt Multi Manager FoF Scheme
Allocation as a % of Net Assets %IDFC Dynamic Bond Fund-Direct Plan-Growth 21.17%SBI Magnum Gilt Fund - Long Term-Dir Pl - Growth 20.87%Birla Sun Life MediumTerm Plan -Gr - Direct Plan 20.66%Birla Sun Life Govt Sec. Long Term Grwth Direct 19.55%ICICI Prude Gilt Fund Inv Plan PF Opt-Dir Plan-Grw 17.20%Cash & Current Assets 0.87%Net receivables / payables -0.32%Total 100.00%
Birla Sun Life Financial Planning FOF - Conservative Plan
Birla Sun Life Cash Plus - Growth - Direct Plan 40.33%Birla Sun Life MediumTerm Plan -Gr - Direct Plan 14.39%IDFC Dynamic Bond Fund-Direct Plan-Growth 6.81%SBI Magnum Gilt Fund - Long Term-Dir Pl - Growth 6.19%Kotak MF Gold ETF 5.78%R*Shares Gold BeES 5.27%MOSt Focused Multicap 35-Direct Plan-Growth Option 5.07%Birla Sun Life Advantage Fund - Gr - Dir Pl 5.05%Birla Sun Life Frontline Eq Fd - Gr - Direct Plan 4.11%SBI Blue Chip Fund-Direct Plan -Growth 3.84%Mirae Asset India Opp'ties Fund-Direct Plan-Growth 1.33%Cash & Current Assets 2.03%Net receivables / payables -0.19%Total 100.00%
Birla Sun Life Financial Planning FOF - Prudent Plan
Birla Sun Life Cash Plus - Growth - Direct Plan 25.77%
Birla Sun Life MediumTerm Plan -Gr - Direct Plan 12.51%
MOSt Focused Multicap 35-Direct Plan-Growth Option 9.15%
Birla Sun Life Advantage Fund - Gr - Dir Pl 9.00%
Birla Sun Life Frontline Eq Fd - Gr - Direct Plan 8.23%
SBI Blue Chip Fund-Direct Plan -Growth 7.06%Mirae Asset India Opp'ties Fund-Direct Plan-Growth 6.23%
SBI Magnum Gilt Fund - Long Term-Dir Pl - Growth 6.01%
IDFC Dynamic Bond Fund-Direct Plan-Growth 5.59%
R*Shares Gold BeES 4.58%Kotak MF Gold ETF 4.18%Cash & Current Assets 1.91%Net receivables / payables -0.24%Total 100.00%
http://mutualfund.birlasunlife.com https://twitter.com/bslmf
https://www.facebook.com/bslmf https://www.linkedin.com/company/bslmf73
Portfolio

Regular Income Solutions
Birla Sun Life MIP II - Savings 5 PlanAllocation as a % of Net Assets Rating %7.61% GOI(MD 09/05/2030) SOV 29.96%8.13% GOI (MD 22/06/2045) SOV 9.40%7.59% GOI(MD 11/01/2026) SOV 7.50%7.68% GOI (MD 15/12/2023) SOV 7.46%IDBI Bank Limited CRISIL A 7.39%Power Finance Corporation Limited CRISIL AAA 7.21%8.17% GOI (MD 01/12/2044) SOV 5.10%8.08% GOI (MD 02/08/2022) SOV 3.75%8.60% GOI (MD 02/06/2028) SOV 1.98%7.59% GOI (MD 20/03/2029) SOV 1.86%9.40% Andhra Pradesh SDL (MD 30/01/2024) SOV 1.18%Yes Bank Limited ICRA AA+ 1.15%Eicher Motors Ltd 0.69%Repco Home Finance Ltd 0.62%HDFC Bank Ltd 0.55%Bajaj Finance Ltd 0.50%Hindustan Zinc Ltd 0.47%V-Mart Retail Limited 0.44%Equitas Holdings Limited 0.41%PNB Housing Finance Limited 0.37%Kewal Kiran Clothing Limited 0.36%Dr. Lal Pathlabs Limited 0.34%City Union Bank Ltd 0.33%K.P.R. Mill Limited 0.29%Advanced Enzyme Technologies Limited 0.28%Endurance Technologies Limited 0.27%Tata Motors Ltd 0.25%Indusind Bank Ltd 0.25%ICICI Bank Ltd 0.22%Hindustan Petroleum Corporation Ltd 0.21%Mahanagar Gas Limited 0.21%Indian Oil Corporation Ltd 0.21%Dhanuka Agritech Ltd 0.20%9.41% Kerala SDL (MD 30/01/2024) SOV 0.20%Aurobindo Pharma Ltd 0.19%Shriram City Union Finance Limited 0.19%Cairn India Ltd 0.15%Grasim Industries Ltd 0.15%Vedanta Ltd 0.14%RBL Bank Limited 0.14%Thyrocare Technologies Ltd 0.14%Crompton Greaves Consumer Electricals Limited 0.13%
ITC Ltd 0.13%Ashoka Buildcon Ltd 0.11%VRL Logistic Ltd 0.11%Monte Carlo Fashions Ltd 0.11%Orbit Exports Ltd 0.08%Emami Ltd 0.08%Oriental Hotels Ltd 0.07%TeamLease Services Limited 0.07%8.62% Tamil Nadu SDL (MD 20/02/2023) SOV 0.05%Atul Auto Limited 0.04%HEIDELBERGCEMENT INDIA LIMITED 0.01%Cash & Current Assets 6.30%Total 100.00%
Birla Sun Life MIPAllocation as a % of Net Assets Rating %8.13% GOI (MD 22/06/2045) SOV 16.00%7.61% GOI(MD 09/05/2030) SOV 15.30%7.68% GOI (MD 15/12/2023) SOV 10.15%6.97% GOI (MD 06/09/2026) SOV 9.91%IDBI Bank Limited CRISIL A 7.66%IDBI Bank Limited ICRA AA 5.58%9.40% Andhra Pradesh SDL (MD 30/01/2024) SOV 5.37%8.17% GOI (MD 01/12/2044) SOV 5.34%6.90% GOI (MD 13/07/2019) SOV 2.96%Power Finance Corporation Limited CRISIL AAA 1.96%Eicher Motors Ltd 1.05%HDFC Bank Ltd 1.04%Repco Home Finance Ltd 0.97%Bajaj Finance Ltd 0.82%Equitas Holdings Limited 0.68%Kewal Kiran Clothing Limited 0.67%Indian Oil Corporation Ltd 0.66%V-Mart Retail Limited 0.64%Indusind Bank Ltd 0.54%Power Finance Corporation Limited CRISIL AAA 0.52%K.P.R. Mill Limited 0.51%ICICI Bank Ltd 0.43%Tata Motors Ltd 0.43%PNB Housing Finance Limited 0.40%Dr. Lal Pathlabs Limited 0.38%City Union Bank Ltd 0.37%Hindustan Petroleum Corporation Ltd 0.36%Dhanuka Agritech Ltd 0.34%Shriram City Union Finance Limited 0.33%Advanced Enzyme Technologies Limited 0.31%Hindustan Zinc Ltd 0.30%Endurance Technologies Limited 0.29%
Aurobindo Pharma Ltd 0.25%Grasim Industries Ltd 0.25%Crompton Greaves Consumer Electricals Limited 0.24%
Mahanagar Gas Limited 0.24%Cairn India Ltd 0.23%ITC Ltd 0.23%TeamLease Services Limited 0.23%Vedanta Ltd 0.23%VRL Logistic Ltd 0.20%Ashoka Buildcon Ltd 0.19%Thyrocare Technologies Ltd 0.16%RBL Bank Limited 0.16%Emami Ltd 0.14%Monte Carlo Fashions Ltd 0.10%Atul Auto Limited 0.08%Orbit Exports Ltd 0.05%HEIDELBERGCEMENT INDIA LIMITED 0.01%NTPC Limited CRISIL AAA 0.00%Cash & Current Assets 4.73%Total 100.00%
Birla Sun Life Monthly IncomeAllocation as a % of Net Assets Rating %7.59% GOI (MD 20/03/2029) SOV 26.41%7.61% GOI(MD 09/05/2030) SOV 10.22%7.68% GOI (MD 15/12/2023) SOV 8.14%6.97% GOI (MD 06/09/2026) SOV 7.95%Power Finance Corporation Limited CRISIL AAA 7.09%8.60% GOI (MD 02/06/2028) SOV 4.32%8.13% GOI (MD 22/06/2045) SOV 3.85%IDBI Bank Limited CRISIL A 3.07%8.17% GOI (MD 01/12/2044) SOV 2.14%7.73% GOI (MD 19/12/2034) SOV 2.04%8.15% GOI (MD 24/11/2026) SOV 1.94%8.28% GOI (M/D 21/09/2027) SOV 1.69%Eicher Motors Ltd 1.09%Repco Home Finance Ltd 1.05%Power Grid Corporation of India Limited CRISIL AAA 0.98%HDFC Bank Ltd 0.93%9.40% Andhra Pradesh SDL (MD 30/01/2024) SOV 0.86%Bajaj Finance Ltd 0.79%V-Mart Retail Limited 0.69%Equitas Holdings Limited 0.65%Kewal Kiran Clothing Limited 0.61%Indusind Bank Ltd 0.51%K.P.R. Mill Limited 0.48%Tata Motors Ltd 0.42%ICICI Bank Ltd 0.39%City Union Bank Ltd 0.39%PNB Housing Finance Limited 0.39%Dr. Lal Pathlabs Limited 0.38%Hindustan Petroleum Corporation Ltd 0.36%Indian Oil Corporation Ltd 0.35%Dhanuka Agritech Ltd 0.34%Shriram City Union Finance Limited 0.32%Advanced Enzyme Technologies Limited 0.31%Hindustan Zinc Ltd 0.30%Power Finance Corporation Limited CRISIL AAA 0.29%Endurance Technologies Limited 0.28%Grasim Industries Ltd 0.27%Cairn India Ltd 0.23%Mahanagar Gas Limited 0.23%Vedanta Ltd 0.22%Crompton Greaves Consumer Electricals Limited 0.22%Orbit Exports Ltd 0.22%ITC Ltd 0.20%Monte Carlo Fashions Ltd 0.20%Ashoka Buildcon Ltd 0.19%VRL Logistic Ltd 0.19%TeamLease Services Limited 0.17%Thyrocare Technologies Ltd 0.15%RBL Bank Limited 0.15%Oriental Hotels Ltd 0.14%Emami Ltd 0.13%Atul Auto Limited 0.07%HEIDELBERGCEMENT INDIA LIMITED 0.01%Magnasound (I) Ltd 0.00%Cash & Current Assets 4.96%Total 100.00%
Birla Sun Life MIP II - Wealth 25 PlanAllocation as a % of Net Assets Rating %7.59% GOI(MD 11/01/2026) SOV 14.50%7.61% GOI(MD 09/05/2030) SOV 11.09%8.13% GOI (MD 22/06/2045) SOV 6.76%6.79% GOI (MD 26/12/2029) SOV 6.33%8.56% RAJASTHAN SDL - (MD 23/01/2023) SOV 4.10%8.08% GOI (MD 02/08/2022) SOV 3.72%Yes Bank Ltd 2.12%Eicher Motors Ltd 2.09%8.26% Maharashtra SDL(MD 23/12/2025) SOV 1.87%8.27% Karnataka SDL(MD 23/12/2025) SOV 1.87%Hindustan Petroleum Corporation Ltd 1.85%Bharat Aluminium Co Ltd. CRISIL A 1.75%
8.17% GOI (MD 01/12/2044) SOV 1.71%Housing Development Finance Corporation Limited ICRA A1+ 1.64%7.59% GOI (MD 20/03/2029) SOV 1.57%Natco Pharma Ltd 1.48%7.68% GOI (MD 15/12/2023) SOV 1.38%8.79% GOI (MD 08/11/2021) SOV 1.14%Maruti Suzuki India Ltd 1.12%Repco Home Finance Ltd 1.03%Vedanta Ltd 0.96%Bajaj Finance Ltd 0.94%Dalmia Bharat Limited 0.87%Bajaj Finserv Ltd 0.80%Berger Paints India Ltd 0.76%L and T Finance Holdings Ltd 0.75%8.59% Andhra pradesh SDL (MD 23/01/2023) SOV 0.75%Rural Electrification Corporation Limited CRISIL AAA 0.73%Bank of India BWR AA- 0.73%Oriental Bank of Commerce IND A+ 0.71%Tata Sons Ltd CRISIL AAA 0.69%Capital First Limited 0.65%K.P.R. Mill Limited 0.65%Bharat Financial Inclusion Ltd 0.58%PNB Housing Finance Limited 0.57%IDBI Bank Limited CRISIL A 0.56%Yes Bank Limited ICRA AA+ 0.53%State Bank of India 0.52%Equitas Holdings Limited 0.51%Voltas Ltd 0.49%V-Guard Industries Limited 0.46%Bharat Electronics Ltd 0.46%Orient Cement Ltd 0.44%Hindalco Industries Ltd 0.43%Wabco India Ltd 0.43%9.20% GOI (MD 30/09/2030) SOV 0.41%Narayana Hrudayalaya Limited 0.40%8.15% GOI (MD 24/11/2026) SOV 0.38%8.35% GOI (MD 14/05/2022) SOV 0.38%AIA Engineering Ltd 0.38%Bayer Cropscience Ltd 0.37%8.12% GOI (MD 10/12/2020) SOV 0.37%PI Industries Ltd 0.37%Emami Ltd 0.36%Indraprastha Gas Ltd 0.36%Power Finance Corporation Limited CRISIL AAA 0.36%Hindustan Zinc Ltd 0.36%9.23% GOI (MD 23/12/2043) SOV 0.35%Kalpataru Power Transmission Ltd 0.30%VA Tech Wabag Ltd 0.26%Advanced Enzyme Technologies Limited 0.25%8.24% GOI (MD 10/11/2033) SOV 0.24%Kaveri Seed Company Ltd 0.23%V-Mart Retail Limited 0.23%Bosch Ltd 0.22%Cummins India Ltd 0.22%Godrej Consumer Products Ltd 0.21%Gujarat Fluorochemicals Ltd 0.20%Cholamandalam Investment and Finance Company Ltd 0.20%MRF Ltd 0.20%GE T&D India Limited 0.19%Mahanagar Gas Limited 0.19%Endurance Technologies Limited 0.18%Pidilite Industries Ltd 0.16%Johnson Controls–Hitachi Air Conditioning India Lt 0.16%Atul Auto Limited 0.16%TeamLease Services Limited 0.15%ICICI Prudential Life Insurance Company Limited 0.13%Oracle Financial Services Software Ltd 0.13%VRL Logistic Ltd 0.13%Thyrocare Technologies Ltd 0.12%J.Kumar Infraprojects Ltd 0.10%Astra Microwave Products Ltd 0.10%Whirlpool of India Ltd 0.09%Monte Carlo Fashions Ltd 0.09%Ramkrishna Forgings Ltd 0.07%IDBI Bank Limited ICRA AA 0.07%Yes Bank Limited ICRA AA+ 0.05%Cash & Current Assets 5.05%Total 100.00%
74
Portfolio
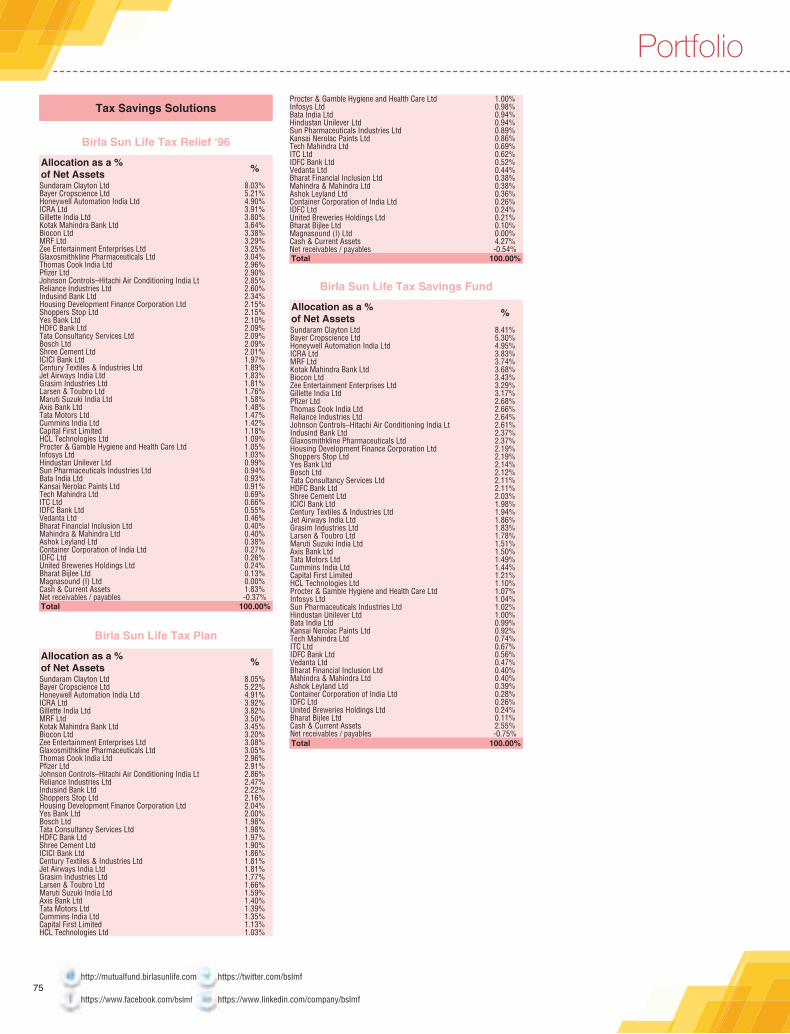
Tax Savings Solutions
Birla Sun Life Tax Relief ‘96
Allocation as a % of Net Assets %
Sundaram Clayton Ltd 8.03%Bayer Cropscience Ltd 5.21%Honeywell Automation India Ltd 4.90%ICRA Ltd 3.91%Gillette India Ltd 3.80%Kotak Mahindra Bank Ltd 3.64%Biocon Ltd 3.38%MRF Ltd 3.29%Zee Entertainment Enterprises Ltd 3.25%Glaxosmithkline Pharmaceuticals Ltd 3.04%Thomas Cook India Ltd 2.96%Pfizer Ltd 2.90%Johnson Controls–Hitachi Air Conditioning India Lt 2.85%Reliance Industries Ltd 2.60%Indusind Bank Ltd 2.34%Housing Development Finance Corporation Ltd 2.15%Shoppers Stop Ltd 2.15%Yes Bank Ltd 2.10%HDFC Bank Ltd 2.09%Tata Consultancy Services Ltd 2.09%Bosch Ltd 2.09%Shree Cement Ltd 2.01%ICICI Bank Ltd 1.97%Century Textiles & Industries Ltd 1.89%Jet Airways India Ltd 1.83%Grasim Industries Ltd 1.81%Larsen & Toubro Ltd 1.76%Maruti Suzuki India Ltd 1.58%Axis Bank Ltd 1.48%Tata Motors Ltd 1.47%Cummins India Ltd 1.42%Capital First Limited 1.18%HCL Technologies Ltd 1.09%Procter & Gamble Hygiene and Health Care Ltd 1.05%Infosys Ltd 1.03%Hindustan Unilever Ltd 0.99%Sun Pharmaceuticals Industries Ltd 0.94%Bata India Ltd 0.93%Kansai Nerolac Paints Ltd 0.91%Tech Mahindra Ltd 0.69%ITC Ltd 0.66%IDFC Bank Ltd 0.55%Vedanta Ltd 0.46%Bharat Financial Inclusion Ltd 0.40%Mahindra & Mahindra Ltd 0.40%Ashok Leyland Ltd 0.38%Container Corporation of India Ltd 0.27%IDFC Ltd 0.26%United Breweries Holdings Ltd 0.24%Bharat Bijlee Ltd 0.13%Magnasound (I) Ltd 0.00%Cash & Current Assets 1.83%Net receivables / payables -0.37%Total 100.00%
Birla Sun Life Tax Plan
Allocation as a % of Net Assets %
Sundaram Clayton Ltd 8.05%Bayer Cropscience Ltd 5.22%Honeywell Automation India Ltd 4.91%ICRA Ltd 3.92%Gillette India Ltd 3.82%MRF Ltd 3.50%Kotak Mahindra Bank Ltd 3.45%Biocon Ltd 3.20%Zee Entertainment Enterprises Ltd 3.08%Glaxosmithkline Pharmaceuticals Ltd 3.05%Thomas Cook India Ltd 2.96%Pfizer Ltd 2.91%Johnson Controls–Hitachi Air Conditioning India Lt 2.86%Reliance Industries Ltd 2.47%Indusind Bank Ltd 2.22%Shoppers Stop Ltd 2.16%Housing Development Finance Corporation Ltd 2.04%Yes Bank Ltd 2.00%Bosch Ltd 1.98%Tata Consultancy Services Ltd 1.98%HDFC Bank Ltd 1.97%Shree Cement Ltd 1.90%ICICI Bank Ltd 1.86%Century Textiles & Industries Ltd 1.81%Jet Airways India Ltd 1.81%Grasim Industries Ltd 1.77%Larsen & Toubro Ltd 1.66%Maruti Suzuki India Ltd 1.59%Axis Bank Ltd 1.40%Tata Motors Ltd 1.39%Cummins India Ltd 1.35%Capital First Limited 1.13%HCL Technologies Ltd 1.03%
Procter & Gamble Hygiene and Health Care Ltd 1.00%Infosys Ltd 0.98%Bata India Ltd 0.94%Hindustan Unilever Ltd 0.94%Sun Pharmaceuticals Industries Ltd 0.89%Kansai Nerolac Paints Ltd 0.86%Tech Mahindra Ltd 0.69%ITC Ltd 0.62%IDFC Bank Ltd 0.52%Vedanta Ltd 0.44%Bharat Financial Inclusion Ltd 0.38%Mahindra & Mahindra Ltd 0.38%Ashok Leyland Ltd 0.36%Container Corporation of India Ltd 0.26%IDFC Ltd 0.24%United Breweries Holdings Ltd 0.21%Bharat Bijlee Ltd 0.10%Magnasound (I) Ltd 0.00%Cash & Current Assets 4.27%Net receivables / payables -0.54%Total 100.00%
Birla Sun Life Tax Savings Fund
Allocation as a % of Net Assets %
Sundaram Clayton Ltd 8.41%Bayer Cropscience Ltd 5.30%Honeywell Automation India Ltd 4.95%ICRA Ltd 3.83%MRF Ltd 3.74%Kotak Mahindra Bank Ltd 3.68%Biocon Ltd 3.43%Zee Entertainment Enterprises Ltd 3.29%Gillette India Ltd 3.17%Pfizer Ltd 2.68%Thomas Cook India Ltd 2.66%Reliance Industries Ltd 2.64%Johnson Controls–Hitachi Air Conditioning India Lt 2.61%Indusind Bank Ltd 2.37%Glaxosmithkline Pharmaceuticals Ltd 2.37%Housing Development Finance Corporation Ltd 2.19%Shoppers Stop Ltd 2.19%Yes Bank Ltd 2.14%Bosch Ltd 2.12%Tata Consultancy Services Ltd 2.11%HDFC Bank Ltd 2.11%Shree Cement Ltd 2.03%ICICI Bank Ltd 1.98%Century Textiles & Industries Ltd 1.94%Jet Airways India Ltd 1.86%Grasim Industries Ltd 1.83%Larsen & Toubro Ltd 1.78%Maruti Suzuki India Ltd 1.51%Axis Bank Ltd 1.50%Tata Motors Ltd 1.49%Cummins India Ltd 1.44%Capital First Limited 1.21%HCL Technologies Ltd 1.10%Procter & Gamble Hygiene and Health Care Ltd 1.07%Infosys Ltd 1.04%Sun Pharmaceuticals Industries Ltd 1.02%Hindustan Unilever Ltd 1.00%Bata India Ltd 0.99%Kansai Nerolac Paints Ltd 0.92%Tech Mahindra Ltd 0.74%ITC Ltd 0.67%IDFC Bank Ltd 0.56%Vedanta Ltd 0.47%Bharat Financial Inclusion Ltd 0.40%Mahindra & Mahindra Ltd 0.40%Ashok Leyland Ltd 0.39%Container Corporation of India Ltd 0.28%IDFC Ltd 0.26%United Breweries Holdings Ltd 0.24%Bharat Bijlee Ltd 0.11%Cash & Current Assets 2.55%Net receivables / payables -0.75%Total 100.00%
75
Portfolio
http://mutualfund.birlasunlife.com https://twitter.com/bslmf
https://www.facebook.com/bslmf https://www.linkedin.com/company/bslmf
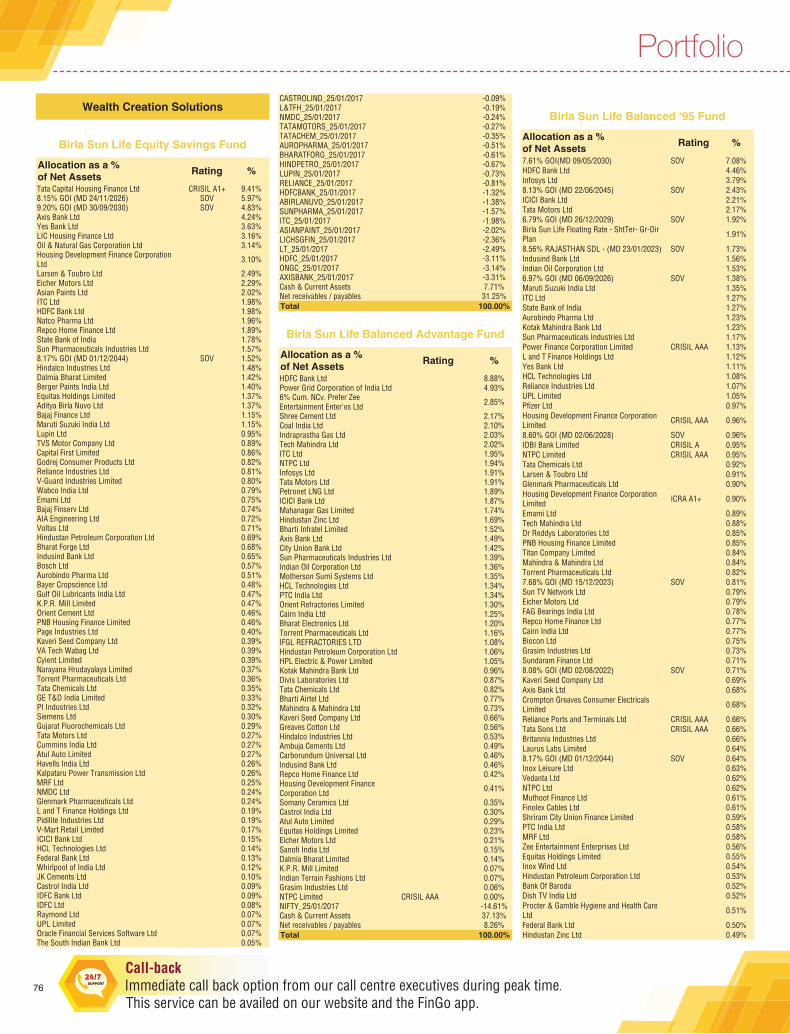
Wealth Creation Solutions
Birla Sun Life Equity Savings Fund
Allocation as a % of Net Assets Rating %
Tata Capital Housing Finance Ltd CRISIL A1+ 9.41%8.15% GOI (MD 24/11/2026) SOV 5.97%9.20% GOI (MD 30/09/2030) SOV 4.83%Axis Bank Ltd 4.24%Yes Bank Ltd 3.63%LIC Housing Finance Ltd 3.16%Oil & Natural Gas Corporation Ltd 3.14%Housing Development Finance Corporation Ltd 3.10%
Larsen & Toubro Ltd 2.49%Eicher Motors Ltd 2.29%Asian Paints Ltd 2.02%ITC Ltd 1.98%HDFC Bank Ltd 1.98%Natco Pharma Ltd 1.96%Repco Home Finance Ltd 1.89%State Bank of India 1.78%Sun Pharmaceuticals Industries Ltd 1.57%8.17% GOI (MD 01/12/2044) SOV 1.52%Hindalco Industries Ltd 1.48%Dalmia Bharat Limited 1.42%Berger Paints India Ltd 1.40%Equitas Holdings Limited 1.37%Aditya Birla Nuvo Ltd 1.37%Bajaj Finance Ltd 1.15%Maruti Suzuki India Ltd 1.15%Lupin Ltd 0.95%TVS Motor Company Ltd 0.89%Capital First Limited 0.86%Godrej Consumer Products Ltd 0.82%Reliance Industries Ltd 0.81%V-Guard Industries Limited 0.80%Wabco India Ltd 0.79%Emami Ltd 0.75%Bajaj Finserv Ltd 0.74%AIA Engineering Ltd 0.72%Voltas Ltd 0.71%Hindustan Petroleum Corporation Ltd 0.69%Bharat Forge Ltd 0.68%Indusind Bank Ltd 0.65%Bosch Ltd 0.57%Aurobindo Pharma Ltd 0.51%Bayer Cropscience Ltd 0.48%Gulf Oil Lubricants India Ltd 0.47%K.P.R. Mill Limited 0.47%Orient Cement Ltd 0.46%PNB Housing Finance Limited 0.46%Page Industries Ltd 0.40%Kaveri Seed Company Ltd 0.39%VA Tech Wabag Ltd 0.39%Cyient Limited 0.39%Narayana Hrudayalaya Limited 0.37%Torrent Pharmaceuticals Ltd 0.36%Tata Chemicals Ltd 0.35%GE T&D India Limited 0.33%PI Industries Ltd 0.32%Siemens Ltd 0.30%Gujarat Fluorochemicals Ltd 0.29%Tata Motors Ltd 0.27%Cummins India Ltd 0.27%Atul Auto Limited 0.27%Havells India Ltd 0.26%Kalpataru Power Transmission Ltd 0.26%MRF Ltd 0.25%NMDC Ltd 0.24%Glenmark Pharmaceuticals Ltd 0.24%L and T Finance Holdings Ltd 0.19%Pidilite Industries Ltd 0.19%V-Mart Retail Limited 0.17%ICICI Bank Ltd 0.15%HCL Technologies Ltd 0.14%Federal Bank Ltd 0.13%Whirlpool of India Ltd 0.12%JK Cements Ltd 0.10%Castrol India Ltd 0.09%IDFC Bank Ltd 0.09%IDFC Ltd 0.08%Raymond Ltd 0.07%UPL Limited 0.07%Oracle Financial Services Software Ltd 0.07%The South Indian Bank Ltd 0.05%
CASTROLIND_25/01/2017 -0.09%L&TFH_25/01/2017 -0.19%NMDC_25/01/2017 -0.24%TATAMOTORS_25/01/2017 -0.27%TATACHEM_25/01/2017 -0.35%AUROPHARMA_25/01/2017 -0.51%BHARATFORG_25/01/2017 -0.61%HINDPETRO_25/01/2017 -0.67%LUPIN_25/01/2017 -0.73%RELIANCE_25/01/2017 -0.81%HDFCBANK_25/01/2017 -1.32%ABIRLANUVO_25/01/2017 -1.38%SUNPHARMA_25/01/2017 -1.57%ITC_25/01/2017 -1.98%ASIANPAINT_25/01/2017 -2.02%LICHSGFIN_25/01/2017 -2.36%LT_25/01/2017 -2.49%HDFC_25/01/2017 -3.11%ONGC_25/01/2017 -3.14%AXISBANK_25/01/2017 -3.31%Cash & Current Assets 7.71%Net receivables / payables 31.25%Total 100.00%
Birla Sun Life Balanced Advantage Fund
Allocation as a % of Net Assets Rating %
HDFC Bank Ltd 8.88%Power Grid Corporation of India Ltd 4.93%6% Cum. NCv. Prefer Zee Entertainment Enter'es Ltd 2.85%
Shree Cement Ltd 2.17%Coal India Ltd 2.10%Indraprastha Gas Ltd 2.03%Tech Mahindra Ltd 2.02%ITC Ltd 1.95%NTPC Ltd 1.94%Infosys Ltd 1.91%Tata Motors Ltd 1.91%Petronet LNG Ltd 1.89%ICICI Bank Ltd 1.87%Mahanagar Gas Limited 1.74%Hindustan Zinc Ltd 1.69%Bharti Infratel Limited 1.52%Axis Bank Ltd 1.49%City Union Bank Ltd 1.42%Sun Pharmaceuticals Industries Ltd 1.39%Indian Oil Corporation Ltd 1.36%Motherson Sumi Systems Ltd 1.35%HCL Technologies Ltd 1.34%PTC India Ltd 1.34%Orient Refractories Limited 1.30%Cairn India Ltd 1.25%Bharat Electronics Ltd 1.20%Torrent Pharmaceuticals Ltd 1.16%IFGL REFRACTORIES LTD 1.08%Hindustan Petroleum Corporation Ltd 1.06%HPL Electric & Power Limited 1.05%Kotak Mahindra Bank Ltd 0.96%Divis Laboratories Ltd 0.87%Tata Chemicals Ltd 0.82%Bharti Airtel Ltd 0.77%Mahindra & Mahindra Ltd 0.73%Kaveri Seed Company Ltd 0.66%Greaves Cotton Ltd 0.56%Hindalco Industries Ltd 0.53%Ambuja Cements Ltd 0.49%Carborundum Universal Ltd 0.46%Indusind Bank Ltd 0.46%Repco Home Finance Ltd 0.42%Housing Development Finance Corporation Ltd 0.41%
Somany Ceramics Ltd 0.35%Castrol India Ltd 0.30%Atul Auto Limited 0.29%Equitas Holdings Limited 0.23%Eicher Motors Ltd 0.21%Sanofi India Ltd 0.15%Dalmia Bharat Limited 0.14%K.P.R. Mill Limited 0.07%Indian Terrain Fashions Ltd 0.07%Grasim Industries Ltd 0.06%NTPC Limited CRISIL AAA 0.00%NIFTY_25/01/2017 -14.61%Cash & Current Assets 37.13%Net receivables / payables 8.26%Total 100.00%
Birla Sun Life Balanced ‘95 Fund
Allocation as a % of Net Assets Rating %
7.61% GOI(MD 09/05/2030) SOV 7.08%HDFC Bank Ltd 4.46%Infosys Ltd 3.79%8.13% GOI (MD 22/06/2045) SOV 2.43%ICICI Bank Ltd 2.21%Tata Motors Ltd 2.17%6.79% GOI (MD 26/12/2029) SOV 1.92%Birla Sun Life Floating Rate - ShtTer- Gr-Dir Plan 1.91%
8.56% RAJASTHAN SDL - (MD 23/01/2023) SOV 1.73%Indusind Bank Ltd 1.56%Indian Oil Corporation Ltd 1.53%6.97% GOI (MD 06/09/2026) SOV 1.38%Maruti Suzuki India Ltd 1.35%ITC Ltd 1.27%State Bank of India 1.27%Aurobindo Pharma Ltd 1.23%Kotak Mahindra Bank Ltd 1.23%Sun Pharmaceuticals Industries Ltd 1.17%Power Finance Corporation Limited CRISIL AAA 1.13%L and T Finance Holdings Ltd 1.12%Yes Bank Ltd 1.11%HCL Technologies Ltd 1.08%Reliance Industries Ltd 1.07%UPL Limited 1.05%Pfizer Ltd 0.97%Housing Development Finance Corporation Limited CRISIL AAA 0.96%
8.60% GOI (MD 02/06/2028) SOV 0.96%IDBI Bank Limited CRISIL A 0.95%NTPC Limited CRISIL AAA 0.95%Tata Chemicals Ltd 0.92%Larsen & Toubro Ltd 0.91%Glenmark Pharmaceuticals Ltd 0.90%Housing Development Finance Corporation Limited ICRA A1+ 0.90%
Emami Ltd 0.89%Tech Mahindra Ltd 0.88%Dr Reddys Laboratories Ltd 0.85%PNB Housing Finance Limited 0.85%Titan Company Limited 0.84%Mahindra & Mahindra Ltd 0.84%Torrent Pharmaceuticals Ltd 0.82%7.68% GOI (MD 15/12/2023) SOV 0.81%Sun TV Network Ltd 0.79%Eicher Motors Ltd 0.79%FAG Bearings India Ltd 0.78%Repco Home Finance Ltd 0.77%Cairn India Ltd 0.77%Biocon Ltd 0.75%Grasim Industries Ltd 0.73%Sundaram Finance Ltd 0.71%8.08% GOI (MD 02/08/2022) SOV 0.71%Kaveri Seed Company Ltd 0.69%Axis Bank Ltd 0.68%Crompton Greaves Consumer Electricals Limited 0.68%
Reliance Ports and Terminals Ltd CRISIL AAA 0.66%Tata Sons Ltd CRISIL AAA 0.66%Britannia Industries Ltd 0.66%Laurus Labs Limited 0.64%8.17% GOI (MD 01/12/2044) SOV 0.64%Inox Leisure Ltd 0.63%Vedanta Ltd 0.62%NTPC Ltd 0.62%Muthoot Finance Ltd 0.61%Finolex Cables Ltd 0.61%Shriram City Union Finance Limited 0.59%PTC India Ltd 0.58%MRF Ltd 0.58%Zee Entertainment Enterprises Ltd 0.56%Equitas Holdings Limited 0.55%Inox Wind Ltd 0.54%Hindustan Petroleum Corporation Ltd 0.53%Bank Of Baroda 0.52%Dish TV India Ltd 0.52%Procter & Gamble Hygiene and Health Care Ltd 0.51%
Federal Bank Ltd 0.50%Hindustan Zinc Ltd 0.49%
76
Portfolio
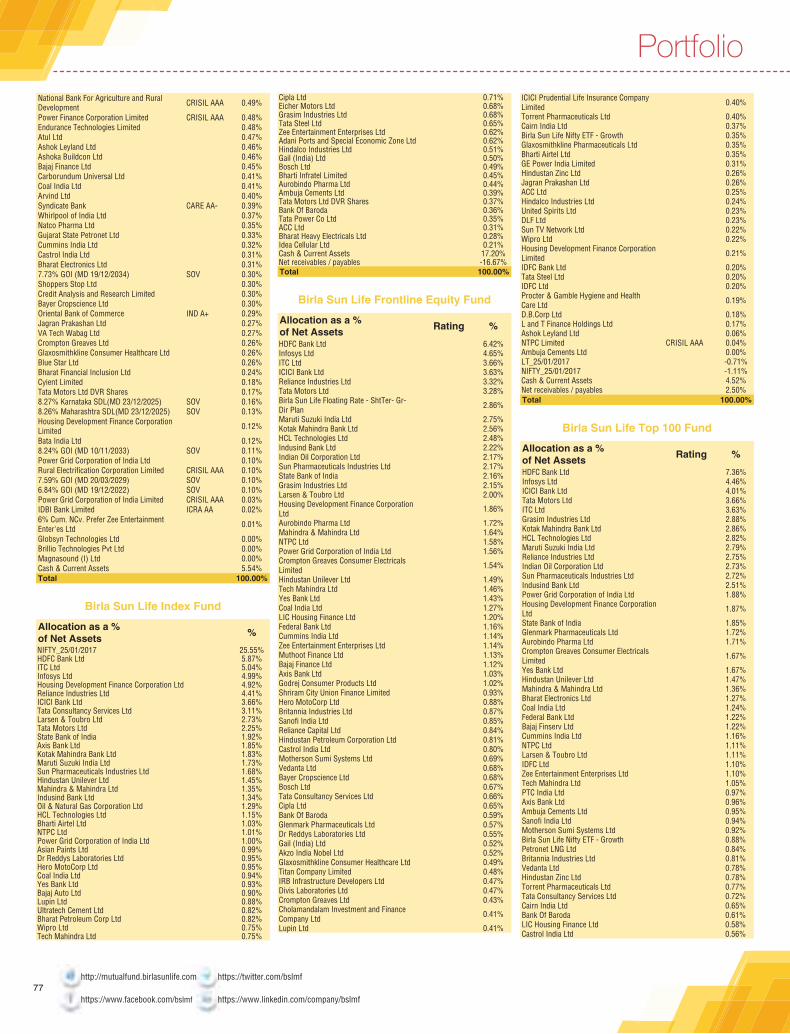
National Bank For Agriculture and Rural Development CRISIL AAA 0.49%
Power Finance Corporation Limited CRISIL AAA 0.48%Endurance Technologies Limited 0.48%Atul Ltd 0.47%Ashok Leyland Ltd 0.46%Ashoka Buildcon Ltd 0.46%Bajaj Finance Ltd 0.45%Carborundum Universal Ltd 0.41%Coal India Ltd 0.41%Arvind Ltd 0.40%Syndicate Bank CARE AA- 0.39%Whirlpool of India Ltd 0.37%Natco Pharma Ltd 0.35%Gujarat State Petronet Ltd 0.33%Cummins India Ltd 0.32%Castrol India Ltd 0.31%Bharat Electronics Ltd 0.31%7.73% GOI (MD 19/12/2034) SOV 0.30%Shoppers Stop Ltd 0.30%Credit Analysis and Research Limited 0.30%Bayer Cropscience Ltd 0.30%Oriental Bank of Commerce IND A+ 0.29%Jagran Prakashan Ltd 0.27%VA Tech Wabag Ltd 0.27%Crompton Greaves Ltd 0.26%Glaxosmithkline Consumer Healthcare Ltd 0.26%Blue Star Ltd 0.26%Bharat Financial Inclusion Ltd 0.24%Cyient Limited 0.18%Tata Motors Ltd DVR Shares 0.17%8.27% Karnataka SDL(MD 23/12/2025) SOV 0.16%8.26% Maharashtra SDL(MD 23/12/2025) SOV 0.13%Housing Development Finance Corporation Limited 0.12%
Bata India Ltd 0.12%8.24% GOI (MD 10/11/2033) SOV 0.11%Power Grid Corporation of India Ltd 0.10%Rural Electrification Corporation Limited CRISIL AAA 0.10%7.59% GOI (MD 20/03/2029) SOV 0.10%6.84% GOI (MD 19/12/2022) SOV 0.10%Power Grid Corporation of India Limited CRISIL AAA 0.03%IDBI Bank Limited ICRA AA 0.02%6% Cum. NCv. Prefer Zee Entertainment Enter'es Ltd 0.01%
Globsyn Technologies Ltd 0.00%Brillio Technologies Pvt Ltd 0.00%Magnasound (I) Ltd 0.00%Cash & Current Assets 5.54%Total 100.00%
Birla Sun Life Index Fund
Allocation as a % of Net Assets %
NIFTY_25/01/2017 25.55%HDFC Bank Ltd 5.87%ITC Ltd 5.04%Infosys Ltd 4.99%Housing Development Finance Corporation Ltd 4.92%Reliance Industries Ltd 4.41%ICICI Bank Ltd 3.66%Tata Consultancy Services Ltd 3.11%Larsen & Toubro Ltd 2.73%Tata Motors Ltd 2.25%State Bank of India 1.92%Axis Bank Ltd 1.85%Kotak Mahindra Bank Ltd 1.83%Maruti Suzuki India Ltd 1.73%Sun Pharmaceuticals Industries Ltd 1.68%Hindustan Unilever Ltd 1.45%Mahindra & Mahindra Ltd 1.35%Indusind Bank Ltd 1.34%Oil & Natural Gas Corporation Ltd 1.29%HCL Technologies Ltd 1.15%Bharti Airtel Ltd 1.03%NTPC Ltd 1.01%Power Grid Corporation of India Ltd 1.00%Asian Paints Ltd 0.99%Dr Reddys Laboratories Ltd 0.95%Hero MotoCorp Ltd 0.95%Coal India Ltd 0.94%Yes Bank Ltd 0.93%Bajaj Auto Ltd 0.90%Lupin Ltd 0.88%Ultratech Cement Ltd 0.82%Bharat Petroleum Corp Ltd 0.82%Wipro Ltd 0.75%Tech Mahindra Ltd 0.75%
Cipla Ltd 0.71%Eicher Motors Ltd 0.68%Grasim Industries Ltd 0.68%Tata Steel Ltd 0.65%Zee Entertainment Enterprises Ltd 0.62%Adani Ports and Special Economic Zone Ltd 0.62%Hindalco Industries Ltd 0.51%Gail (India) Ltd 0.50%Bosch Ltd 0.49%Bharti Infratel Limited 0.45%Aurobindo Pharma Ltd 0.44%Ambuja Cements Ltd 0.39%Tata Motors Ltd DVR Shares 0.37%Bank Of Baroda 0.36%Tata Power Co Ltd 0.35%ACC Ltd 0.31%Bharat Heavy Electricals Ltd 0.28%Idea Cellular Ltd 0.21%Cash & Current Assets 17.20%Net receivables / payables -16.67%Total 100.00%
Birla Sun Life Frontline Equity Fund
Allocation as a % of Net Assets Rating %
HDFC Bank Ltd 6.42%Infosys Ltd 4.65%ITC Ltd 3.66%ICICI Bank Ltd 3.63%Reliance Industries Ltd 3.32%Tata Motors Ltd 3.28%Birla Sun Life Floating Rate - ShtTer- Gr-Dir Plan 2.86%
Maruti Suzuki India Ltd 2.75%Kotak Mahindra Bank Ltd 2.56%HCL Technologies Ltd 2.48%Indusind Bank Ltd 2.22%Indian Oil Corporation Ltd 2.17%Sun Pharmaceuticals Industries Ltd 2.17%State Bank of India 2.16%Grasim Industries Ltd 2.15%Larsen & Toubro Ltd 2.00%Housing Development Finance Corporation Ltd 1.86%
Aurobindo Pharma Ltd 1.72%Mahindra & Mahindra Ltd 1.64%NTPC Ltd 1.58%Power Grid Corporation of India Ltd 1.56%Crompton Greaves Consumer Electricals Limited 1.54%
Hindustan Unilever Ltd 1.49%Tech Mahindra Ltd 1.46%Yes Bank Ltd 1.43%Coal India Ltd 1.27%LIC Housing Finance Ltd 1.20%Federal Bank Ltd 1.16%Cummins India Ltd 1.14%Zee Entertainment Enterprises Ltd 1.14%Muthoot Finance Ltd 1.13%Bajaj Finance Ltd 1.12%Axis Bank Ltd 1.03%Godrej Consumer Products Ltd 1.02%Shriram City Union Finance Limited 0.93%Hero MotoCorp Ltd 0.88%Britannia Industries Ltd 0.87%Sanofi India Ltd 0.85%Reliance Capital Ltd 0.84%Hindustan Petroleum Corporation Ltd 0.81%Castrol India Ltd 0.80%Motherson Sumi Systems Ltd 0.69%Vedanta Ltd 0.68%Bayer Cropscience Ltd 0.68%Bosch Ltd 0.67%Tata Consultancy Services Ltd 0.66%Cipla Ltd 0.65%Bank Of Baroda 0.59%Glenmark Pharmaceuticals Ltd 0.57%Dr Reddys Laboratories Ltd 0.55%Gail (India) Ltd 0.52%Akzo India Nobel Ltd 0.52%Glaxosmithkline Consumer Healthcare Ltd 0.49%Titan Company Limited 0.48%IRB Infrastructure Developers Ltd 0.47%Divis Laboratories Ltd 0.47%Crompton Greaves Ltd 0.43%Cholamandalam Investment and Finance Company Ltd 0.41%
Lupin Ltd 0.41%
ICICI Prudential Life Insurance Company Limited 0.40%
Torrent Pharmaceuticals Ltd 0.40%Cairn India Ltd 0.37%Birla Sun Life Nifty ETF - Growth 0.35%Glaxosmithkline Pharmaceuticals Ltd 0.35%Bharti Airtel Ltd 0.35%GE Power India Limited 0.31%Hindustan Zinc Ltd 0.26%Jagran Prakashan Ltd 0.26%ACC Ltd 0.25%Hindalco Industries Ltd 0.24%United Spirits Ltd 0.23%DLF Ltd 0.23%Sun TV Network Ltd 0.22%Wipro Ltd 0.22%Housing Development Finance Corporation Limited 0.21%
IDFC Bank Ltd 0.20%Tata Steel Ltd 0.20%IDFC Ltd 0.20%Procter & Gamble Hygiene and Health Care Ltd 0.19%
D.B.Corp Ltd 0.18%L and T Finance Holdings Ltd 0.17%Ashok Leyland Ltd 0.06%NTPC Limited CRISIL AAA 0.04%Ambuja Cements Ltd 0.00%LT_25/01/2017 -0.71%NIFTY_25/01/2017 -1.11%Cash & Current Assets 4.52%Net receivables / payables 2.50%Total 100.00%
Birla Sun Life Top 100 Fund
Allocation as a % of Net Assets Rating %
HDFC Bank Ltd 7.36%Infosys Ltd 4.46%ICICI Bank Ltd 4.01%Tata Motors Ltd 3.66%ITC Ltd 3.63%Grasim Industries Ltd 2.88%Kotak Mahindra Bank Ltd 2.86%HCL Technologies Ltd 2.82%Maruti Suzuki India Ltd 2.79%Reliance Industries Ltd 2.75%Indian Oil Corporation Ltd 2.73%Sun Pharmaceuticals Industries Ltd 2.72%Indusind Bank Ltd 2.51%Power Grid Corporation of India Ltd 1.88%Housing Development Finance Corporation Ltd 1.87%
State Bank of India 1.85%Glenmark Pharmaceuticals Ltd 1.72%Aurobindo Pharma Ltd 1.71%Crompton Greaves Consumer Electricals Limited 1.67%
Yes Bank Ltd 1.67%Hindustan Unilever Ltd 1.47%Mahindra & Mahindra Ltd 1.36%Bharat Electronics Ltd 1.27%Coal India Ltd 1.24%Federal Bank Ltd 1.22%Bajaj Finserv Ltd 1.22%Cummins India Ltd 1.16%NTPC Ltd 1.11%Larsen & Toubro Ltd 1.11%IDFC Ltd 1.10%Zee Entertainment Enterprises Ltd 1.10%Tech Mahindra Ltd 1.05%PTC India Ltd 0.97%Axis Bank Ltd 0.96%Ambuja Cements Ltd 0.95%Sanofi India Ltd 0.94%Motherson Sumi Systems Ltd 0.92%Birla Sun Life Nifty ETF - Growth 0.88%Petronet LNG Ltd 0.84%Britannia Industries Ltd 0.81%Vedanta Ltd 0.78%Hindustan Zinc Ltd 0.78%Torrent Pharmaceuticals Ltd 0.77%Tata Consultancy Services Ltd 0.72%Cairn India Ltd 0.65%Bank Of Baroda 0.61%LIC Housing Finance Ltd 0.58%Castrol India Ltd 0.56%
77
Portfolio
http://mutualfund.birlasunlife.com https://twitter.com/bslmf
https://www.facebook.com/bslmf https://www.linkedin.com/company/bslmf
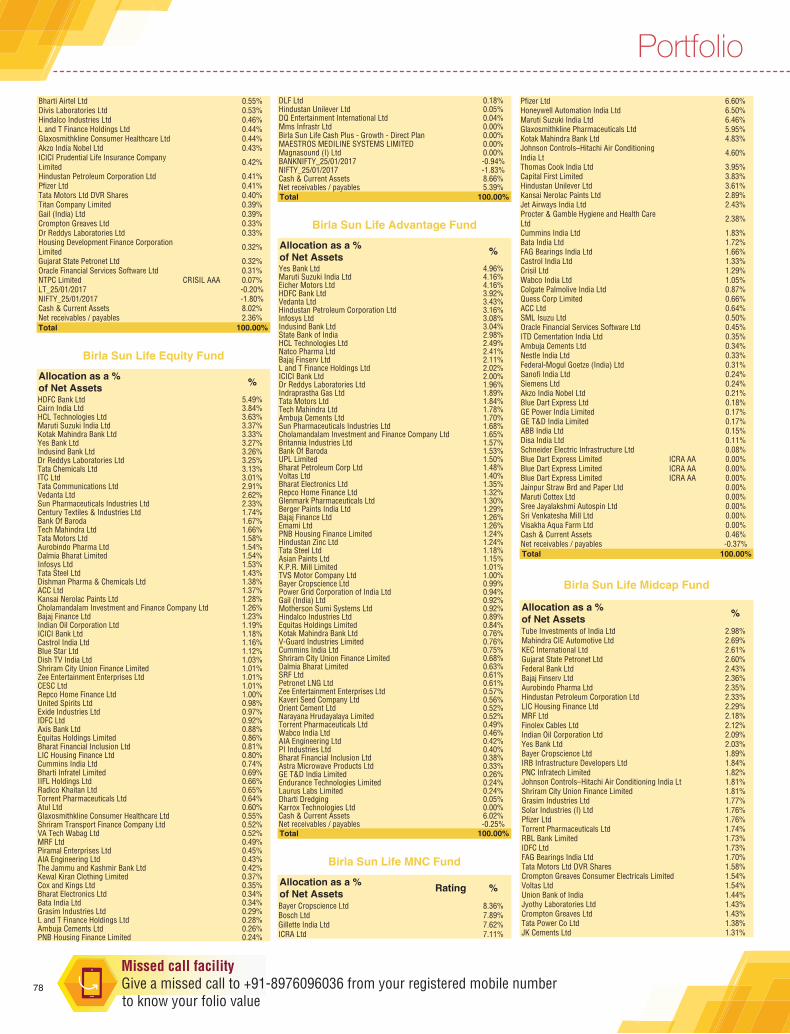
Bharti Airtel Ltd 0.55%Divis Laboratories Ltd 0.53%Hindalco Industries Ltd 0.46%L and T Finance Holdings Ltd 0.44%Glaxosmithkline Consumer Healthcare Ltd 0.44%Akzo India Nobel Ltd 0.43%ICICI Prudential Life Insurance Company Limited 0.42%
Hindustan Petroleum Corporation Ltd 0.41%Pfizer Ltd 0.41%Tata Motors Ltd DVR Shares 0.40%Titan Company Limited 0.39%Gail (India) Ltd 0.39%Crompton Greaves Ltd 0.33%Dr Reddys Laboratories Ltd 0.33%Housing Development Finance Corporation Limited 0.32%
Gujarat State Petronet Ltd 0.32%Oracle Financial Services Software Ltd 0.31%NTPC Limited CRISIL AAA 0.07%LT_25/01/2017 -0.20%NIFTY_25/01/2017 -1.80%Cash & Current Assets 8.02%Net receivables / payables 2.36%Total 100.00%
Birla Sun Life Equity Fund
Allocation as a % of Net Assets %
HDFC Bank Ltd 5.49%Cairn India Ltd 3.84%HCL Technologies Ltd 3.63%Maruti Suzuki India Ltd 3.37%Kotak Mahindra Bank Ltd 3.33%Yes Bank Ltd 3.27%Indusind Bank Ltd 3.26%Dr Reddys Laboratories Ltd 3.25%Tata Chemicals Ltd 3.13%ITC Ltd 3.01%Tata Communications Ltd 2.91%Vedanta Ltd 2.62%Sun Pharmaceuticals Industries Ltd 2.33%Century Textiles & Industries Ltd 1.74%Bank Of Baroda 1.67%Tech Mahindra Ltd 1.66%Tata Motors Ltd 1.58%Aurobindo Pharma Ltd 1.54%Dalmia Bharat Limited 1.54%Infosys Ltd 1.53%Tata Steel Ltd 1.43%Dishman Pharma & Chemicals Ltd 1.38%ACC Ltd 1.37%Kansai Nerolac Paints Ltd 1.28%Cholamandalam Investment and Finance Company Ltd 1.26%Bajaj Finance Ltd 1.23%Indian Oil Corporation Ltd 1.19%ICICI Bank Ltd 1.18%Castrol India Ltd 1.16%Blue Star Ltd 1.12%Dish TV India Ltd 1.03%Shriram City Union Finance Limited 1.01%Zee Entertainment Enterprises Ltd 1.01%CESC Ltd 1.01%Repco Home Finance Ltd 1.00%United Spirits Ltd 0.98%Exide Industries Ltd 0.97%IDFC Ltd 0.92%Axis Bank Ltd 0.88%Equitas Holdings Limited 0.86%Bharat Financial Inclusion Ltd 0.81%LIC Housing Finance Ltd 0.80%Cummins India Ltd 0.74%Bharti Infratel Limited 0.69%IIFL Holdings Ltd 0.66%Radico Khaitan Ltd 0.65%Torrent Pharmaceuticals Ltd 0.64%Atul Ltd 0.60%Glaxosmithkline Consumer Healthcare Ltd 0.55%Shriram Transport Finance Company Ltd 0.52%VA Tech Wabag Ltd 0.52%MRF Ltd 0.49%Piramal Enterprises Ltd 0.45%AIA Engineering Ltd 0.43%The Jammu and Kashmir Bank Ltd 0.42%Kewal Kiran Clothing Limited 0.37%Cox and Kings Ltd 0.35%Bharat Electronics Ltd 0.34%Bata India Ltd 0.34%Grasim Industries Ltd 0.29%L and T Finance Holdings Ltd 0.28%Ambuja Cements Ltd 0.26%PNB Housing Finance Limited 0.24%
DLF Ltd 0.18%Hindustan Unilever Ltd 0.05%DQ Entertainment International Ltd 0.04%Mms Infrastr Ltd 0.00%Birla Sun Life Cash Plus - Growth - Direct Plan 0.00%MAESTROS MEDILINE SYSTEMS LIMITED 0.00%Magnasound (I) Ltd 0.00%BANKNIFTY_25/01/2017 -0.94%NIFTY_25/01/2017 -1.83%Cash & Current Assets 8.66%Net receivables / payables 5.39%Total 100.00%
Birla Sun Life Advantage Fund
Allocation as a % of Net Assets %
Yes Bank Ltd 4.96%Maruti Suzuki India Ltd 4.16%Eicher Motors Ltd 4.16%HDFC Bank Ltd 3.92%Vedanta Ltd 3.43%Hindustan Petroleum Corporation Ltd 3.16%Infosys Ltd 3.08%Indusind Bank Ltd 3.04%State Bank of India 2.98%HCL Technologies Ltd 2.49%Natco Pharma Ltd 2.41%Bajaj Finserv Ltd 2.11%L and T Finance Holdings Ltd 2.02%ICICI Bank Ltd 2.00%Dr Reddys Laboratories Ltd 1.96%Indraprastha Gas Ltd 1.89%Tata Motors Ltd 1.84%Tech Mahindra Ltd 1.78%Ambuja Cements Ltd 1.70%Sun Pharmaceuticals Industries Ltd 1.68%Cholamandalam Investment and Finance Company Ltd 1.65%Britannia Industries Ltd 1.57%Bank Of Baroda 1.53%UPL Limited 1.50%Bharat Petroleum Corp Ltd 1.48%Voltas Ltd 1.40%Bharat Electronics Ltd 1.35%Repco Home Finance Ltd 1.32%Glenmark Pharmaceuticals Ltd 1.30%Berger Paints India Ltd 1.29%Bajaj Finance Ltd 1.26%Emami Ltd 1.26%PNB Housing Finance Limited 1.24%Hindustan Zinc Ltd 1.24%Tata Steel Ltd 1.18%Asian Paints Ltd 1.15%K.P.R. Mill Limited 1.01%TVS Motor Company Ltd 1.00%Bayer Cropscience Ltd 0.99%Power Grid Corporation of India Ltd 0.94%Gail (India) Ltd 0.92%Motherson Sumi Systems Ltd 0.92%Hindalco Industries Ltd 0.89%Equitas Holdings Limited 0.84%Kotak Mahindra Bank Ltd 0.76%V-Guard Industries Limited 0.76%Cummins India Ltd 0.75%Shriram City Union Finance Limited 0.68%Dalmia Bharat Limited 0.63%SRF Ltd 0.61%Petronet LNG Ltd 0.61%Zee Entertainment Enterprises Ltd 0.57%Kaveri Seed Company Ltd 0.56%Orient Cement Ltd 0.52%Narayana Hrudayalaya Limited 0.52%Torrent Pharmaceuticals Ltd 0.49%Wabco India Ltd 0.46%AIA Engineering Ltd 0.42%PI Industries Ltd 0.40%Bharat Financial Inclusion Ltd 0.38%Astra Microwave Products Ltd 0.33%GE T&D India Limited 0.26%Endurance Technologies Limited 0.24%Laurus Labs Limited 0.24%Dharti Dredging 0.05%Karrox Technologies Ltd 0.00%Cash & Current Assets 6.02%Net receivables / payables -0.25%Total 100.00%
Birla Sun Life MNC Fund
Allocation as a % of Net Assets Rating %
Bayer Cropscience Ltd 8.36%Bosch Ltd 7.89%Gillette India Ltd 7.62%ICRA Ltd 7.11%
Pfizer Ltd 6.60%Honeywell Automation India Ltd 6.50%Maruti Suzuki India Ltd 6.46%Glaxosmithkline Pharmaceuticals Ltd 5.95%Kotak Mahindra Bank Ltd 4.83%Johnson Controls–Hitachi Air Conditioning India Lt 4.60%
Thomas Cook India Ltd 3.95%Capital First Limited 3.83%Hindustan Unilever Ltd 3.61%Kansai Nerolac Paints Ltd 2.89%Jet Airways India Ltd 2.43%Procter & Gamble Hygiene and Health Care Ltd 2.38%
Cummins India Ltd 1.83%Bata India Ltd 1.72%FAG Bearings India Ltd 1.66%Castrol India Ltd 1.33%Crisil Ltd 1.29%Wabco India Ltd 1.05%Colgate Palmolive India Ltd 0.87%Quess Corp Limited 0.66%ACC Ltd 0.64%SML Isuzu Ltd 0.50%Oracle Financial Services Software Ltd 0.45%ITD Cementation India Ltd 0.35%Ambuja Cements Ltd 0.34%Nestle India Ltd 0.33%Federal-Mogul Goetze (India) Ltd 0.31%Sanofi India Ltd 0.24%Siemens Ltd 0.24%Akzo India Nobel Ltd 0.21%Blue Dart Express Ltd 0.18%GE Power India Limited 0.17%GE T&D India Limited 0.17%ABB India Ltd 0.15%Disa India Ltd 0.11%Schneider Electric Infrastructure Ltd 0.08%Blue Dart Express Limited ICRA AA 0.00%Blue Dart Express Limited ICRA AA 0.00%Blue Dart Express Limited ICRA AA 0.00%Jainpur Straw Brd and Paper Ltd 0.00%Maruti Cottex Ltd 0.00%Sree Jayalakshmi Autospin Ltd 0.00%Sri Venkatesha Mill Ltd 0.00%Visakha Aqua Farm Ltd 0.00%Cash & Current Assets 0.46%Net receivables / payables -0.37%Total 100.00%
Birla Sun Life Midcap Fund
Allocation as a % of Net Assets %
Tube Investments of India Ltd 2.98%Mahindra CIE Automotive Ltd 2.69%KEC International Ltd 2.61%Gujarat State Petronet Ltd 2.60%Federal Bank Ltd 2.43%Bajaj Finserv Ltd 2.36%Aurobindo Pharma Ltd 2.35%Hindustan Petroleum Corporation Ltd 2.33%LIC Housing Finance Ltd 2.29%MRF Ltd 2.18%Finolex Cables Ltd 2.12%Indian Oil Corporation Ltd 2.09%Yes Bank Ltd 2.03%Bayer Cropscience Ltd 1.89%IRB Infrastructure Developers Ltd 1.84%PNC Infratech Limited 1.82%Johnson Controls–Hitachi Air Conditioning India Lt 1.81%Shriram City Union Finance Limited 1.81%Grasim Industries Ltd 1.77%Solar Industries (I) Ltd 1.76%Pfizer Ltd 1.76%Torrent Pharmaceuticals Ltd 1.74%RBL Bank Limited 1.73%IDFC Ltd 1.73%FAG Bearings India Ltd 1.70%Tata Motors Ltd DVR Shares 1.58%Crompton Greaves Consumer Electricals Limited 1.54%Voltas Ltd 1.54%Union Bank of India 1.44%Jyothy Laboratories Ltd 1.43%Crompton Greaves Ltd 1.43%Tata Power Co Ltd 1.38%JK Cements Ltd 1.31%
78
Portfolio

Hindustan Zinc Ltd 1.28%Arvind Ltd 1.24%Capital First Limited 1.15%Divis Laboratories Ltd 1.15%Edelweiss Financial Services Ltd 1.14%Hindalco Industries Ltd 1.14%Aditya Birla Nuvo Ltd 1.13%Emami Ltd 1.11%Natco Pharma Ltd 1.10%HSIL Ltd 1.10%Mindtree Ltd 1.08%Petronet LNG Ltd 1.08%Firstsource Solutions Ltd 1.05%Equitas Holdings Limited 1.03%Cyient Limited 0.99%PNB Housing Finance Limited 0.98%Carborundum Universal Ltd 0.98%Gujarat Fluorochemicals Ltd 0.95%Simplex Infrastructures Ltd 0.95%Century Textiles & Industries Ltd 0.93%Colgate Palmolive India Ltd 0.92%TeamLease Services Limited 0.92%L and T Finance Holdings Ltd 0.85%Britannia Industries Ltd 0.85%Welspun India Ltd 0.82%Bharat Financial Inclusion Ltd 0.77%Glaxosmithkline Consumer Healthcare Ltd 0.76%SANGHI INDUSTRIES LTD 0.73%Monte Carlo Fashions Ltd 0.72%Inox Leisure Ltd 0.68%Satin Creditcare Network Limited 0.67%Cash & Current Assets 6.40%Net receivables / payables -0.67%Total 100.00%
Birla Sun Life Small & Midcap Fund
Allocation as a % of Net Assets %
Mahanagar Gas Limited 2.98%DCB Bank Limited 2.72%KEC International Ltd 2.62%Firstsource Solutions Ltd 2.57%Torrent Pharmaceuticals Ltd 2.57%Federal Bank Ltd 2.53%Mangalore Refinery & Petrochemicals Ltd 2.48%IRB Infrastructure Developers Ltd 2.47%Gujarat State Petronet Ltd 2.47%PNC Infratech Limited 2.46%Mahindra CIE Automotive Ltd 2.45%Repco Home Finance Ltd 2.44%Sterlite Technologies Ltd 2.43%Cyient Limited 2.40%Solar Industries (I) Ltd 2.38%Jyothy Laboratories Ltd 2.35%SUVEN LIFE SCIENCES LIMITED 2.33%Inox Leisure Ltd 2.33%Endurance Technologies Limited 2.32%Sanofi India Ltd 2.20%Capital First Limited 2.17%Bharat Financial Inclusion Ltd 2.08%J.Kumar Infraprojects Ltd 2.06%IDFC Ltd 2.03%Laurus Labs Limited 1.98%Carborundum Universal Ltd 1.87%K.P.R. Mill Limited 1.87%Indo Count Industries Limited 1.87%Dalmia Bharat Limited 1.86%Dewan Housing Finance Corporation Ltd 1.84%Akzo India Nobel Ltd 1.77%India Cements Ltd 1.76%Indian Bank 1.67%Biocon Ltd 1.63%Natco Pharma Ltd 1.61%V-Guard Industries Limited 1.57%VIP Industries Ltd 1.48%Pennar Engineered Building Systems Ltd 1.46%Crompton Greaves Ltd 1.32%Union Bank of India 1.24%Relaxo Footwears Limited 1.15%Hinduja Global Solutions Ltd 1.06%Monte Carlo Fashions Ltd 1.06%
Orient Cement Ltd 1.03%HPL Electric & Power Limited 0.80%Cash & Current Assets 10.48%Net receivables / payables -0.24%Total 100.00%
Birla Sun Life Pure Value Fund
Allocation as a % of Net Assets %
Atul Ltd 4.02%Gail (India) Ltd 3.74%UPL Limited 3.74%Sintex Industries Ltd 3.44%Hindustan Petroleum Corporation Ltd 3.44%Indraprastha Gas Ltd 3.31%Kaveri Seed Company Ltd 3.16%Gulf Oil Lubricants India Ltd 3.15%Glenmark Pharmaceuticals Ltd 3.12%Gujarat Fluorochemicals Ltd 2.76%Bharat Petroleum Corp Ltd 2.75%Power Grid Corporation of India Ltd 2.72%Tech Mahindra Ltd 2.72%Mahanagar Gas Limited 2.58%Arvind Ltd 2.57%Tata Steel Ltd 2.54%K.P.R. Mill Limited 2.51%L and T Finance Holdings Ltd 2.50%Biocon Ltd 2.47%Gujarat Narmada Valley Fertilizers & Chemicals Ltd 2.26%Tata Coffee Limited 2.18%Federal Bank Ltd 2.07%Inox Wind Ltd 1.89%Vedanta Ltd 1.87%Blue Star Ltd 1.73%Torrent Pharmaceuticals Ltd 1.62%Neuland Laboratories Ltd 1.51%Dishman Pharma & Chemicals Ltd 1.44%Ashok Leyland Ltd 1.39%Unichem Laboratories Ltd 1.38%Orient Cement Ltd 1.38%NIIT Technologies Ltd 1.33%Omkar Speciality Chemicals Limited 1.26%Sanofi India Ltd 1.24%SRF Ltd 1.23%Pfizer Ltd 1.22%Indian Terrain Fashions Ltd 1.21%Sun Pharmaceuticals Industries Ltd 1.08%Astra Microwave Products Ltd 1.04%Kalpataru Power Transmission Ltd 1.00%SUVEN LIFE SCIENCES LIMITED 0.95%Equitas Holdings Limited 0.86%HPL Electric & Power Limited 0.72%KEC International Ltd 0.61%Monte Carlo Fashions Ltd 0.50%Sonata Software Ltd 0.39%The Jammu and Kashmir Bank Ltd 0.37%Shriram City Union Finance Limited 0.21%Chennai Petroleum Corporation Ltd 0.09%Cash & Current Assets 7.06%Net receivables / payables -0.33%Total 100.00%
Birla Sun Life Manufacturing Equity Fund
Allocation as a % of Net Assets %
Maruti Suzuki India Ltd 7.50%Tata Chemicals Ltd 6.60%Vedanta Ltd 3.77%ITC Ltd 3.76%Hindustan Zinc Ltd 3.57%Bharat Electronics Ltd 3.01%MRF Ltd 2.96%Sun Pharmaceuticals Industries Ltd 2.94%Eicher Motors Ltd 2.93%Dishman Pharma & Chemicals Ltd 2.91%Glaxosmithkline Consumer Healthcare Ltd 2.82%Tata Motors Ltd 2.67%Grasim Industries Ltd 2.61%Century Textiles & Industries Ltd 2.42%Ultratech Cement Ltd 2.40%Asian Paints Ltd 2.39%Kansai Nerolac Paints Ltd 2.27%Larsen & Toubro Ltd 2.26%AIA Engineering Ltd 2.26%Rallis India Ltd 2.16%Tata Steel Ltd 2.10%Dr Reddys Laboratories Ltd 2.00%Tata Coffee Limited 1.83%Hero MotoCorp Ltd 1.82%Torrent Pharmaceuticals Ltd 1.77%Bata India Ltd 1.73%Greaves Cotton Ltd 1.68%
S H Kelkar & Company Ltd 1.60%United Spirits Ltd 1.57%Cummins India Ltd 1.54%Voltas Ltd 1.45%HEIDELBERGCEMENT INDIA LIMITED 1.24%Piramal Enterprises Ltd 1.23%Exide Industries Ltd 1.16%Hindustan Unilever Ltd 1.11%Wabco India Ltd 1.11%United Breweries Ltd 1.05%HSIL Ltd 0.92%Raymond Ltd 0.91%Kewal Kiran Clothing Limited 0.91%Bajaj Auto Ltd 0.88%Birla Corporation Ltd 0.71%Clariant Chemicals India Ltd 0.63%Endurance Technologies Limited 0.57%Inox Wind Ltd 0.46%Texmaco Rail & Engineering Ltd 0.20%IFGL REFRACTORIES LTD 0.04%Cash & Current Assets 3.64%Net receivables / payables -0.08%Total 100.00%
Birla Sun Life Banking and Financial Services Fund
Allocation as a % of Net Assets %
HDFC Bank Ltd 10.96%Yes Bank Ltd 10.46%ICICI Bank Ltd 8.33%Bajaj Finance Ltd 6.83%Indusind Bank Ltd 6.41%State Bank of India 6.17%Equitas Holdings Limited 4.99%Repco Home Finance Ltd 4.35%Bank Of Baroda 4.25%L and T Finance Holdings Ltd 4.23%Cholamandalam Investment and Finance Company Ltd 4.17%Bharat Financial Inclusion Ltd 3.35%DCB Bank Limited 2.52%PNB Housing Finance Limited 2.42%Capital First Limited 2.20%Federal Bank Ltd 2.16%Bajaj Finserv Ltd 2.07%Shriram City Union Finance Limited 1.81%ICRA Ltd 1.29%Dewan Housing Finance Corporation Ltd 1.20%ICICI Prudential Life Insurance Company Limited 0.82%City Union Bank Ltd 0.73%Tourism Finance Corporation of India Ltd 0.14%Cash & Current Assets 8.03%Net receivables / payables 0.09%Total 100.00%
Birla Sun Life Dividend Yield Plus
Allocation as a % of Net Assets %
ICICI Bank Ltd 5.76%Vedanta Ltd 4.07%Hindustan Petroleum Corporation Ltd 4.02%Sanofi India Ltd 3.56%State Bank of India 3.37%Axis Bank Ltd 2.72%Orient Cement Ltd 2.61%Hindustan Zinc Ltd 2.59%Tech Mahindra Ltd 2.53%Dhanuka Agritech Ltd 2.48%Mahanagar Gas Limited 2.46%Kaveri Seed Company Ltd 2.42%Oracle Financial Services Software Ltd 2.34%Greaves Cotton Ltd 2.25%Bharat Petroleum Corp Ltd 2.22%Kewal Kiran Clothing Limited 2.21%Pfizer Ltd 2.18%Jagran Prakashan Ltd 2.02%Indian Oil Corporation Ltd 2.02%Federal Bank Ltd 1.87%Procter & Gamble Hygiene and Health Care Ltd 1.83%Cummins India Ltd 1.78%Dalmia Bharat Limited 1.72%Torrent Pharmaceuticals Ltd 1.71%Multi Commodity Exchange of India Ltd 1.52%ICICI Prudential Life Insurance Company Limited 1.40%Orient Refractories Limited 1.33%D.B.Corp Ltd 1.26%IIFL Holdings Ltd 1.26%Castrol India Ltd 1.24%Unichem Laboratories Ltd 1.23%Sun TV Network Ltd 1.23%
79
Portfolio
http://mutualfund.birlasunlife.com https://twitter.com/bslmf
https://www.facebook.com/bslmf https://www.linkedin.com/company/bslmf

GE Power India Limited 1.20%Welspun India Ltd 1.17%NTPC Ltd 1.13%Atul Auto Limited 1.12%Sintex Industries Ltd 1.06%City Union Bank Ltd 1.04%INDUSTRIA DE DISENO TEXTIL SA 1.01%PTC India Ltd 1.01%Tata Chemicals Ltd 0.92%Oil & Natural Gas Corporation Ltd 0.91%Crompton Greaves Consumer Electricals Limited 0.91%Gateway Distriparks Ltd 0.90%Interglobe Aviation Ltd 0.89%Housing Development Finance Corporation Ltd 0.85%Infosys Ltd 0.84%Power Grid Corporation of India Ltd 0.83%Crompton Greaves Ltd 0.82%Cairn India Ltd 0.78%Dewan Housing Finance Corporation Ltd 0.75%Jyothy Laboratories Ltd 0.70%Oriental Hotels Ltd 0.66%The Jammu and Kashmir Bank Ltd 0.60%Punjab National Bank 0.60%Coal India Ltd 0.56%Automotive Axles Ltd 0.56%VRL Logistic Ltd 0.46%Orbit Exports Ltd 0.45%Sonata Software Ltd 0.44%Fortis Healthcare Ltd 0.43%Gujarat Mineral Development Ltd 0.39%K.P.R. Mill Limited 0.39%NIIT Technologies Ltd 0.33%Swaraj Engines Ltd 0.33%ACC Ltd 0.17%Apar Industries Ltd 0.08%Cash & Current Assets 2.60%Net receivables / payables -1.05%Total 100.00%
Birla Sun Life Special Situations Fund
Allocation as a % of Net Assets %
HDFC Bank Ltd 4.43%Indusind Bank Ltd 4.39%Infosys Ltd 4.08%ITC Ltd 4.08%Yes Bank Ltd 3.82%Tech Mahindra Ltd 3.77%UPL Limited 3.68%HCL Technologies Ltd 3.32%Tata Motors Ltd 2.60%Maruti Suzuki India Ltd 2.54%SRF Ltd 2.36%State Bank of India 2.30%Hindalco Industries Ltd 2.29%Atul Ltd 2.27%Gujarat Fluorochemicals Ltd 2.19%Gail (India) Ltd 2.10%ICICI Bank Ltd 1.88%Sun Pharmaceuticals Industries Ltd 1.85%Kotak Mahindra Bank Ltd 1.85%Ambuja Cements Ltd 1.67%Tata Chemicals Ltd 1.66%Dr Reddys Laboratories Ltd 1.59%Larsen & Toubro Ltd 1.56%J.Kumar Infraprojects Ltd 1.50%Gulf Oil Lubricants India Ltd 1.46%Eicher Motors Ltd 1.44%Equitas Holdings Limited 1.36%Crompton Greaves Consumer Electricals Limited 1.34%Shriram City Union Finance Limited 1.33%Bharat Petroleum Corp Ltd 1.17%Cummins India Ltd 1.17%Mahanagar Gas Limited 1.16%Motherson Sumi Systems Ltd 1.13%Glaxosmithkline Consumer Healthcare Ltd 1.10%Lupin Ltd 1.05%Emami Ltd 1.05%Kaveri Seed Company Ltd 1.05%Hindustan Petroleum Corporation Ltd 1.04%LIC Housing Finance Ltd 1.03%L and T Finance Holdings Ltd 1.00%Zee Entertainment Enterprises Ltd 1.00%The Jammu and Kashmir Bank Ltd 0.96%Muthoot Finance Ltd 0.96%United Spirits Ltd 0.93%Dish TV India Ltd 0.92%Inox Leisure Ltd 0.89%IRB Infrastructure Developers Ltd 0.86%Cyient Limited 0.85%Divis Laboratories Ltd 0.83%Aurobindo Pharma Ltd 0.81%City Union Bank Ltd 0.79%Hindustan Zinc Ltd 0.72%Satin Creditcare Network Limited 0.66%
Hindustan Unilever Ltd 0.61%United Breweries Holdings Ltd 0.60%Blue Star Ltd 0.52%GE Power India Limited 0.50%Cash & Current Assets 4.13%Net receivables / payables -0.19%Total 100.00%
Birla Sun Life India Reforms Fund
Allocation as a % of Net Assets %
Yes Bank Ltd 9.99%Eicher Motors Ltd 7.53%State Bank of India 6.23%ICICI Bank Ltd 5.69%Voltas Ltd 5.67%Capital First Limited 5.25%Indusind Bank Ltd 5.19%Repco Home Finance Ltd 5.04%Maruti Suzuki India Ltd 4.60%Bajaj Finserv Ltd 4.38%Atul Auto Limited 3.64%Cummins India Ltd 3.25%HDFC Bank Ltd 3.13%Larsen & Toubro Ltd 2.91%VA Tech Wabag Ltd 2.23%Hindustan Zinc Ltd 2.21%Ashoka Buildcon Ltd 1.91%Equitas Holdings Limited 1.63%Hindalco Industries Ltd 1.61%Kotak Mahindra Bank Ltd 1.55%Tata Motors Ltd DVR Shares 1.52%Natco Pharma Ltd 1.50%Bharat Electronics Ltd 1.07%Indraprastha Gas Ltd 1.03%GE Power India Limited 0.88%Bayer Cropscience Ltd 0.55%6% Cum. NCv. Prefer Zee Entertainment Enter'es Ltd 0.11%Cash & Current Assets 11.96%Net receivables / payables -2.26%Total 100.00%
Birla Sun Life Infrastructure Fund
Allocation as a % of Net Assets %HDFC Bank Ltd 5.57%Honeywell Automation India Ltd 3.79%Wabco India Ltd 3.68%PTC India Ltd 3.24%Indraprastha Gas Ltd 2.83%Ashoka Buildcon Ltd 2.79%Crompton Greaves Consumer Electricals Limited 2.76%Orient Cement Ltd 2.65%Federal Bank Ltd 2.58%Mahanagar Gas Limited 2.46%VA Tech Wabag Ltd 2.40%Tata Motors Ltd 2.38%ICICI Bank Ltd 2.38%NTPC Ltd 2.28%Grasim Industries Ltd 2.26%Multi Commodity Exchange of India Ltd 2.19%Indian Oil Corporation Ltd 2.15%J.Kumar Infraprojects Ltd 2.14%Inox Wind Ltd 2.04%Cairn India Ltd 2.03%Greaves Cotton Ltd 2.02%Finolex Cables Ltd 1.94%Capital First Limited 1.94%Blue Star Ltd 1.76%Cummins India Ltd 1.76%Orient Refractories Limited 1.69%Kaveri Seed Company Ltd 1.63%Muthoot Finance Ltd 1.60%Hindustan Zinc Ltd 1.57%NCC Ltd 1.56%Carborundum Universal Ltd 1.56%Kalpataru Power Transmission Ltd 1.55%Equitas Holdings Limited 1.53%KEC International Ltd 1.53%L and T Finance Holdings Ltd 1.51%Hindustan Petroleum Corporation Ltd 1.30%Indusind Bank Ltd 1.30%Astra Microwave Products Ltd 1.28%ICRA Ltd 1.25%Bajaj Finance Ltd 1.21%Ambuja Cements Ltd 1.04%Hindalco Industries Ltd 1.04%IRB Infrastructure Developers Ltd 1.03%Vedanta Ltd 1.00%TD Power Systems Ltd 0.95%Somany Ceramics Ltd 0.94%Oil & Natural Gas Corporation Ltd 0.87%Sintex Industries Ltd 0.86%Castrol India Ltd 0.72%Tata Steel Ltd 0.69%GE Power India Limited 0.66%Axis Bank Ltd 0.57%Bharat Petroleum Corp Ltd 0.53%Housing Development Finance Corporation Limited 0.44%Crompton Greaves Ltd 0.32%PNB Housing Finance Limited 0.14%Jet Airways India Ltd 0.14%HPL Electric & Power Limited 0.08%FAG Bearings India Ltd 0.04%
Cash & Current Assets 1.13%Net receivables / payables 0.71%Total 100.00%
Birla Sun Life New Millennium Fund
Allocation as a % of Net Assets %
Infosys Ltd 32.18%Tech Mahindra Ltd 10.97%HCL Technologies Ltd 9.67%NIIT Technologies Ltd 6.96%Sonata Software Ltd 6.45%Cyient Limited 6.32%Tata Consultancy Services Ltd 4.66%Inox Leisure Ltd 4.56%Persistent Systems Ltd 4.11%KPIT Technologies Limited 3.67%Mindtree Ltd 2.37%Sasken Communication Technologies Ltd 1.62%Shemaroo Entertainment Ltd 1.52%Zee Entertainment Enterprises Ltd 1.03%Dish TV India Ltd 0.90%Firstsource Solutions Ltd 0.86%Sun TV Network Ltd 0.75%6% Cum. NCv. Prefer Zee Entertainment Enter'es Ltd 0.26%Magnasound (I) Ltd 0.00%Cash & Current Assets 1.68%Net receivables / payables -0.55%Total 100.00%
Birla Sun Life India GenNext Fund
Allocation as a % of Net Assets %
HDFC Bank Ltd 5.30%Maruti Suzuki India Ltd 4.69%ITC Ltd 4.24%Eicher Motors Ltd 3.83%Indusind Bank Ltd 3.68%Kotak Mahindra Bank Ltd 2.95%Housing Development Finance Corporation Ltd 2.84%Yes Bank Ltd 2.54%Sun Pharmaceuticals Industries Ltd 2.08%Tata Motors Ltd 2.07%ICICI Prudential Life Insurance Company Limited 1.99%Britannia Industries Ltd 1.90%Century Textiles & Industries Ltd 1.75%Jyothy Laboratories Ltd 1.75%Asian Paints Ltd 1.74%Zee Entertainment Enterprises Ltd 1.69%Bharat Financial Inclusion Ltd 1.61%Whirlpool of India Ltd 1.58%Emami Ltd 1.55%Colgate Palmolive India Ltd 1.55%LIC Housing Finance Ltd 1.54%Castrol India Ltd 1.51%Voltas Ltd 1.44%Indian Oil Corporation Ltd 1.43%Repco Home Finance Ltd 1.35%Nestle India Ltd 1.34%Blue Star Ltd 1.30%Hindustan Unilever Ltd 1.27%Thyrocare Technologies Ltd 1.17%Arvind Ltd 1.16%Titan Company Limited 1.15%Laurus Labs Limited 1.09%Dr Reddys Laboratories Ltd 1.07%United Spirits Ltd 1.07%HEIDELBERGCEMENT INDIA LIMITED 1.06%Havells India Ltd 1.05%Aditya Birla Nuvo Ltd 1.02%Cholamandalam Investment and Finance Company Ltd 1.00%Torrent Pharmaceuticals Ltd 1.00%Aurobindo Pharma Ltd 0.96%City Union Bank Ltd 0.95%Phoenix Mills Ltd 0.94%Glaxosmithkline Consumer Healthcare Ltd 0.93%Bata India Ltd 0.93%Bajaj Finance Ltd 0.93%Marico Ltd 0.91%Exide Industries Ltd 0.87%ACC Ltd 0.85%Inox Leisure Ltd 0.82%Cox and Kings Ltd 0.79%Relaxo Footwears Limited 0.78%Capital First Limited 0.76%Sanofi India Ltd 0.76%Dr. Lal Pathlabs Limited 0.71%Equitas Holdings Limited 0.70%Jubilant Foodworks Ltd 0.66%Dish TV India Ltd 0.65%Muthoot Finance Ltd 0.62%Radico Khaitan Ltd 0.60%
80
Portfolio
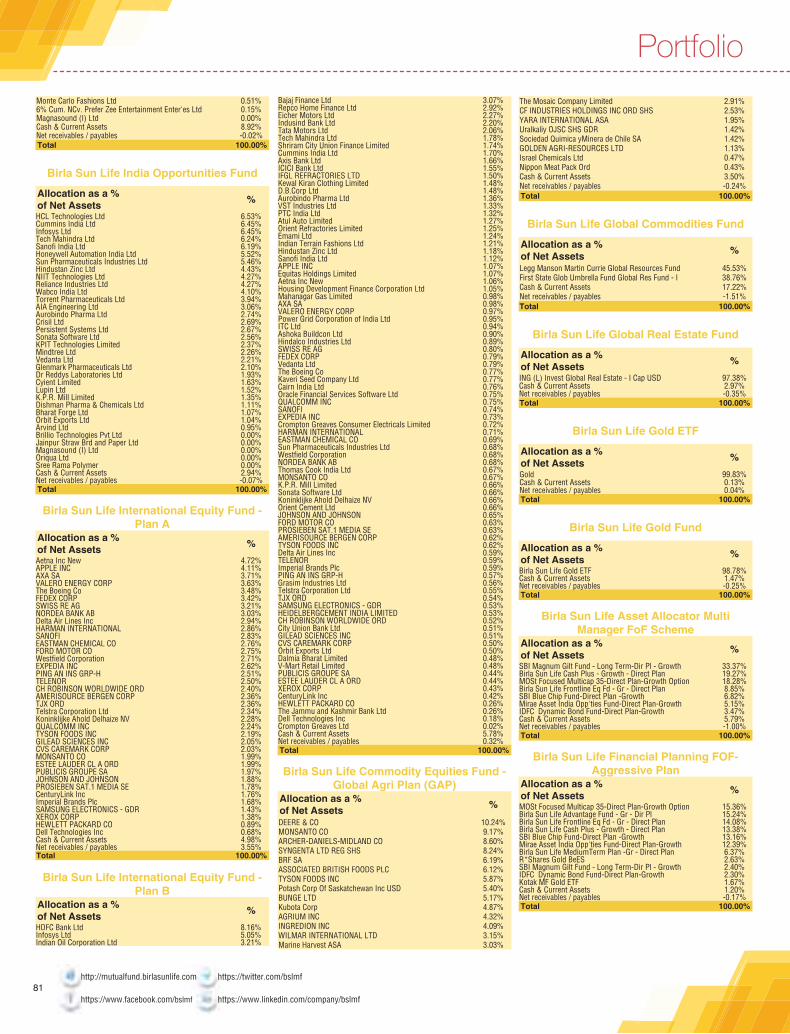
Monte Carlo Fashions Ltd 0.51%6% Cum. NCv. Prefer Zee Entertainment Enter'es Ltd 0.15%Magnasound (I) Ltd 0.00%Cash & Current Assets 8.92%Net receivables / payables -0.02%Total 100.00%
Birla Sun Life India Opportunities Fund
Allocation as a % of Net Assets %HCL Technologies Ltd 6.53%Cummins India Ltd 6.45%Infosys Ltd 6.45%Tech Mahindra Ltd 6.24%Sanofi India Ltd 6.19%Honeywell Automation India Ltd 5.52%Sun Pharmaceuticals Industries Ltd 5.46%Hindustan Zinc Ltd 4.43%NIIT Technologies Ltd 4.27%Reliance Industries Ltd 4.27%Wabco India Ltd 4.10%Torrent Pharmaceuticals Ltd 3.94%AIA Engineering Ltd 3.06%Aurobindo Pharma Ltd 2.74%Crisil Ltd 2.69%Persistent Systems Ltd 2.67%Sonata Software Ltd 2.56%KPIT Technologies Limited 2.37%Mindtree Ltd 2.26%Vedanta Ltd 2.21%Glenmark Pharmaceuticals Ltd 2.10%Dr Reddys Laboratories Ltd 1.93%Cyient Limited 1.63%Lupin Ltd 1.52%K.P.R. Mill Limited 1.35%Dishman Pharma & Chemicals Ltd 1.11%Bharat Forge Ltd 1.07%Orbit Exports Ltd 1.04%Arvind Ltd 0.95%Brillio Technologies Pvt Ltd 0.00%Jainpur Straw Brd and Paper Ltd 0.00%Magnasound (I) Ltd 0.00%Oriqua Ltd 0.00%Sree Rama Polymer 0.00%Cash & Current Assets 2.94%Net receivables / payables -0.07%Total 100.00%
Birla Sun Life International Equity Fund - Plan A
Allocation as a % of Net Assets %Aetna Inc New 4.72%APPLE INC 4.11%AXA SA 3.71%VALERO ENERGY CORP 3.63%The Boeing Co 3.48%FEDEX CORP 3.42%SWISS RE AG 3.21%NORDEA BANK AB 3.03%Delta Air Lines Inc 2.94%HARMAN INTERNATIONAL 2.86%SANOFI 2.83%EASTMAN CHEMICAL CO 2.76%FORD MOTOR CO 2.75%Westfield Corporation 2.71%EXPEDIA INC 2.62%PING AN INS GRP-H 2.51%TELENOR 2.50%CH ROBINSON WORLDWIDE ORD 2.40%AMERISOURCE BERGEN CORP 2.36%TJX ORD 2.36%Telstra Corporation Ltd 2.34%Koninklijke Ahold Delhaize NV 2.28%QUALCOMM INC 2.24%TYSON FOODS INC 2.19%GILEAD SCIENCES INC 2.05%CVS CAREMARK CORP 2.03%MONSANTO CO 1.99%ESTEE LAUDER CL A ORD 1.99%PUBLICIS GROUPE SA 1.97%JOHNSON AND JOHNSON 1.88%PROSIEBEN SAT.1 MEDIA SE 1.78%CenturyLink Inc 1.76%Imperial Brands Plc 1.68%SAMSUNG ELECTRONICS - GDR 1.43%XEROX CORP 1.38%HEWLETT PACKARD CO 0.89%Dell Technologies Inc 0.68%Cash & Current Assets 4.98%Net receivables / payables 3.55%Total 100.00%
Birla Sun Life International Equity Fund - Plan B
Allocation as a % of Net Assets %HDFC Bank Ltd 8.16%Infosys Ltd 5.05%Indian Oil Corporation Ltd 3.21%
Bajaj Finance Ltd 3.07%Repco Home Finance Ltd 2.92%Eicher Motors Ltd 2.27%Indusind Bank Ltd 2.20%Tata Motors Ltd 2.06%Tech Mahindra Ltd 1.78%Shriram City Union Finance Limited 1.74%Cummins India Ltd 1.70%Axis Bank Ltd 1.66%ICICI Bank Ltd 1.55%IFGL REFRACTORIES LTD 1.50%Kewal Kiran Clothing Limited 1.48%D.B.Corp Ltd 1.48%Aurobindo Pharma Ltd 1.36%VST Industries Ltd 1.33%PTC India Ltd 1.32%Atul Auto Limited 1.27%Orient Refractories Limited 1.25%Emami Ltd 1.24%Indian Terrain Fashions Ltd 1.21%Hindustan Zinc Ltd 1.18%Sanofi India Ltd 1.12%APPLE INC 1.07%Equitas Holdings Limited 1.07%Aetna Inc New 1.06%Housing Development Finance Corporation Ltd 1.05%Mahanagar Gas Limited 0.98%AXA SA 0.98%VALERO ENERGY CORP 0.97%Power Grid Corporation of India Ltd 0.95%ITC Ltd 0.94%Ashoka Buildcon Ltd 0.90%Hindalco Industries Ltd 0.89%SWISS RE AG 0.80%FEDEX CORP 0.79%Vedanta Ltd 0.79%The Boeing Co 0.77%Kaveri Seed Company Ltd 0.77%Cairn India Ltd 0.76%Oracle Financial Services Software Ltd 0.75%QUALCOMM INC 0.75%SANOFI 0.74%EXPEDIA INC 0.73%Crompton Greaves Consumer Electricals Limited 0.72%HARMAN INTERNATIONAL 0.71%EASTMAN CHEMICAL CO 0.69%Sun Pharmaceuticals Industries Ltd 0.68%Westfield Corporation 0.68%NORDEA BANK AB 0.68%Thomas Cook India Ltd 0.67%MONSANTO CO 0.67%K.P.R. Mill Limited 0.66%Sonata Software Ltd 0.66%Koninklijke Ahold Delhaize NV 0.66%Orient Cement Ltd 0.66%JOHNSON AND JOHNSON 0.65%FORD MOTOR CO 0.63%PROSIEBEN SAT.1 MEDIA SE 0.63%AMERISOURCE BERGEN CORP 0.62%TYSON FOODS INC 0.62%Delta Air Lines Inc 0.59%TELENOR 0.59%Imperial Brands Plc 0.59%PING AN INS GRP-H 0.57%Grasim Industries Ltd 0.56%Telstra Corporation Ltd 0.55%TJX ORD 0.54%SAMSUNG ELECTRONICS - GDR 0.53%HEIDELBERGCEMENT INDIA LIMITED 0.53%CH ROBINSON WORLDWIDE ORD 0.52%City Union Bank Ltd 0.51%GILEAD SCIENCES INC 0.51%CVS CAREMARK CORP 0.50%Orbit Exports Ltd 0.50%Dalmia Bharat Limited 0.48%V-Mart Retail Limited 0.48%PUBLICIS GROUPE SA 0.44%ESTEE LAUDER CL A ORD 0.44%XEROX CORP 0.43%CenturyLink Inc 0.42%HEWLETT PACKARD CO 0.26%The Jammu and Kashmir Bank Ltd 0.26%Dell Technologies Inc 0.18%Crompton Greaves Ltd 0.02%Cash & Current Assets 5.78%Net receivables / payables 0.32%Total 100.00%
Birla Sun Life Commodity Equities Fund - Global Agri Plan (GAP)
Allocation as a % of Net Assets %
DEERE & CO 10.24%MONSANTO CO 9.17%ARCHER-DANIELS-MIDLAND CO 8.60%SYNGENTA LTD REG SHS 8.24%BRF SA 6.19%ASSOCIATED BRITISH FOODS PLC 6.12%TYSON FOODS INC 5.87%Potash Corp Of Saskatchewan Inc USD 5.40%BUNGE LTD 5.17%Kubota Corp 4.87%AGRIUM INC 4.32%INGREDION INC 4.09%WILMAR INTERNATIONAL LTD 3.15%Marine Harvest ASA 3.03%
The Mosaic Company Limited 2.91%CF INDUSTRIES HOLDINGS INC ORD SHS 2.53%YARA INTERNATIONAL ASA 1.95%Uralkaliy OJSC SHS GDR 1.42%Sociedad Quimica yMinera de Chile SA 1.42%GOLDEN AGRI-RESOURCES LTD 1.13%Israel Chemicals Ltd 0.47%Nippon Meat Pack Ord 0.43%Cash & Current Assets 3.50%Net receivables / payables -0.24%Total 100.00%
Birla Sun Life Global Commodities Fund
Allocation as a % of Net Assets %
Legg Manson Martin Currie Global Resources Fund 45.53%First State Glob Umbrella Fund Global Res Fund - I 38.76%Cash & Current Assets 17.22%Net receivables / payables -1.51%Total 100.00%
Birla Sun Life Global Real Estate Fund
Allocation as a % of Net Assets %
ING (L) Invest Global Real Estate - I Cap USD 97.38%Cash & Current Assets 2.97%Net receivables / payables -0.35%Total 100.00%
Birla Sun Life Gold ETF
Allocation as a % of Net Assets %
Gold 99.83%Cash & Current Assets 0.13%Net receivables / payables 0.04%Total 100.00%
Birla Sun Life Gold Fund
Allocation as a % of Net Assets %Birla Sun Life Gold ETF 98.78%Cash & Current Assets 1.47%Net receivables / payables -0.25%Total 100.00%
Birla Sun Life Asset Allocator Multi Manager FoF Scheme
Allocation as a % of Net Assets %SBI Magnum Gilt Fund - Long Term-Dir Pl - Growth 33.37%Birla Sun Life Cash Plus - Growth - Direct Plan 19.27%MOSt Focused Multicap 35-Direct Plan-Growth Option 18.28%Birla Sun Life Frontline Eq Fd - Gr - Direct Plan 8.85%SBI Blue Chip Fund-Direct Plan -Growth 6.82%Mirae Asset India Opp'ties Fund-Direct Plan-Growth 5.15%IDFC Dynamic Bond Fund-Direct Plan-Growth 3.47%Cash & Current Assets 5.79%Net receivables / payables -1.00%Total 100.00%
Birla Sun Life Financial Planning FOF-Aggressive Plan
Allocation as a % of Net Assets %MOSt Focused Multicap 35-Direct Plan-Growth Option 15.36%Birla Sun Life Advantage Fund - Gr - Dir Pl 15.24%Birla Sun Life Frontline Eq Fd - Gr - Direct Plan 14.08%Birla Sun Life Cash Plus - Growth - Direct Plan 13.38%SBI Blue Chip Fund-Direct Plan -Growth 13.16%Mirae Asset India Opp'ties Fund-Direct Plan-Growth 12.39%Birla Sun Life MediumTerm Plan -Gr - Direct Plan 6.37%R*Shares Gold BeES 2.63%SBI Magnum Gilt Fund - Long Term-Dir Pl - Growth 2.40%IDFC Dynamic Bond Fund-Direct Plan-Growth 2.30%Kotak MF Gold ETF 1.67%Cash & Current Assets 1.20%Net receivables / payables -0.17%Total 100.00%
81
Portfolio
http://mutualfund.birlasunlife.com https://twitter.com/bslmf
https://www.facebook.com/bslmf https://www.linkedin.com/company/bslmf
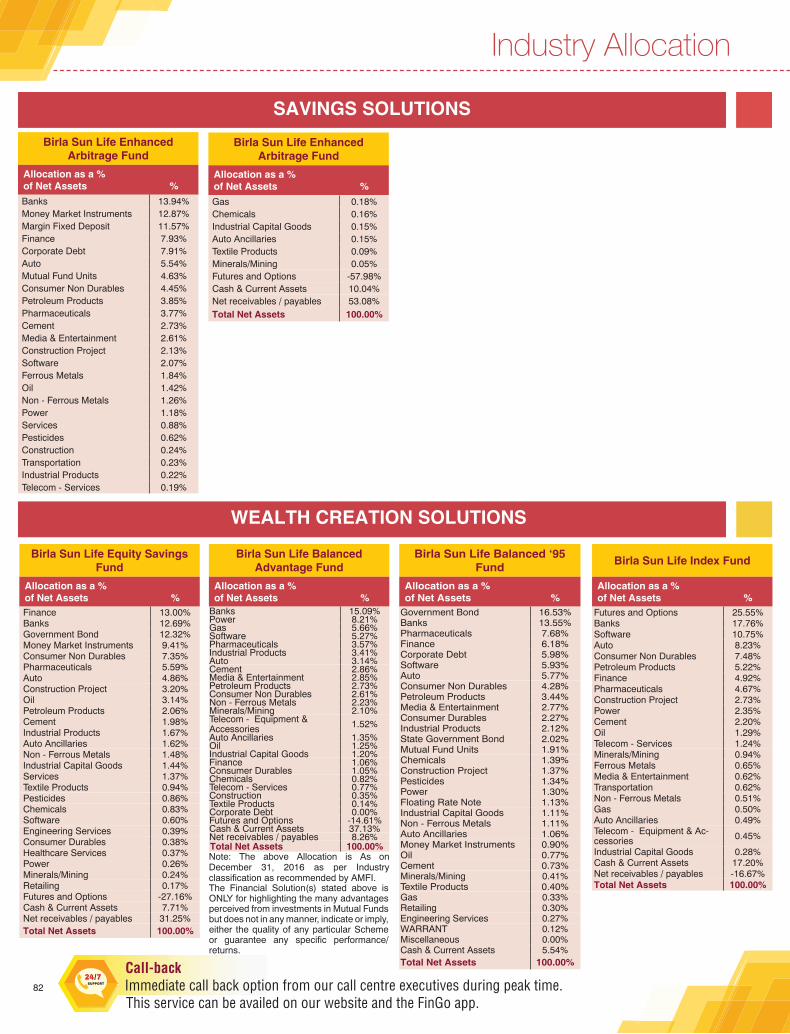
Note: The above Allocation is As on December 31, 2016 as per Industry classification as recommended by AMFI.
Birla Sun Life EnhancedArbitrage Fund
Allocation as a % of Net Assets %Banks 13.94%Money Market Instruments 12.87%Margin Fixed Deposit 11.57%Finance 7.93%Corporate Debt 7.91%Auto 5.54%Mutual Fund Units 4.63%Consumer Non Durables 4.45%Petroleum Products 3.85%Pharmaceuticals 3.77%Cement 2.73%Media & Entertainment 2.61%Construction Project 2.13%Software 2.07%Ferrous Metals 1.84%Oil 1.42%Non - Ferrous Metals 1.26%Power 1.18%Services 0.88%Pesticides 0.62%Construction 0.24%Transportation 0.23%Industrial Products 0.22%Telecom - Services 0.19%
Birla Sun Life EnhancedArbitrage Fund
Allocation as a % of Net Assets %Gas 0.18%Chemicals 0.16%Industrial Capital Goods 0.15%Auto Ancillaries 0.15%Textile Products 0.09%Minerals/Mining 0.05%Futures and Options -57.98%Cash & Current Assets 10.04%Net receivables / payables 53.08%Total Net Assets 100.00%
WEALTH CREATION SOLUTIONS
Birla Sun Life Balanced ‘95 Fund
Allocation as a % of Net Assets %
Government Bond 16.53%Banks 13.55%Pharmaceuticals 7.68%Finance 6.18%Corporate Debt 5.98%Software 5.93%Auto 5.77%Consumer Non Durables 4.28%Petroleum Products 3.44%Media & Entertainment 2.77%Consumer Durables 2.27%Industrial Products 2.12%State Government Bond 2.02%Mutual Fund Units 1.91%Chemicals 1.39%Construction Project 1.37%Pesticides 1.34%Power 1.30%Floating Rate Note 1.13%Industrial Capital Goods 1.11%Non - Ferrous Metals 1.11%Auto Ancillaries 1.06%Money Market Instruments 0.90%Oil 0.77%Cement 0.73%Minerals/Mining 0.41%Textile Products 0.40%Gas 0.33%Retailing 0.30%Engineering Services 0.27%WARRANT 0.12%Miscellaneous 0.00%Cash & Current Assets 5.54%Total Net Assets 100.00%
Birla Sun Life Balanced Advantage Fund
Allocation as a % of Net Assets %
Banks 15.09%Power 8.21%Gas 5.66%Software 5.27%Pharmaceuticals 3.57%Industrial Products 3.41%Auto 3.14%Cement 2.86%Media & Entertainment 2.85%Petroleum Products 2.73%Consumer Non Durables 2.61%Non - Ferrous Metals 2.23%Minerals/Mining 2.10%Telecom - Equipment & Accessories 1.52%Auto Ancillaries 1.35%Oil 1.25%Industrial Capital Goods 1.20%Finance 1.06%Consumer Durables 1.05%Chemicals 0.82%Telecom - Services 0.77%Construction 0.35%Textile Products 0.14%Corporate Debt 0.00%Futures and Options -14.61%Cash & Current Assets 37.13%Net receivables / payables 8.26%Total Net Assets 100.00%
Industry Allocation
SAVINGS SOLUTIONS
Birla Sun Life Equity Savings Fund
Allocation as a % of Net Assets %Finance 13.00%Banks 12.69%Government Bond 12.32%Money Market Instruments 9.41%Consumer Non Durables 7.35%Pharmaceuticals 5.59%Auto 4.86%Construction Project 3.20%Oil 3.14%Petroleum Products 2.06%Cement 1.98%Industrial Products 1.67%Auto Ancillaries 1.62%Non - Ferrous Metals 1.48%Industrial Capital Goods 1.44%Services 1.37%Textile Products 0.94%Pesticides 0.86%Chemicals 0.83%Software 0.60%Engineering Services 0.39%Consumer Durables 0.38%Healthcare Services 0.37%Power 0.26%Minerals/Mining 0.24%Retailing 0.17%Futures and Options -27.16%Cash & Current Assets 7.71%Net receivables / payables 31.25%Total Net Assets 100.00%
Birla Sun Life Index Fund
Allocation as a % of Net Assets %
Futures and Options 25.55%Banks 17.76%Software 10.75%Auto 8.23%Consumer Non Durables 7.48%Petroleum Products 5.22%Finance 4.92%Pharmaceuticals 4.67%Construction Project 2.73%Power 2.35%Cement 2.20%Oil 1.29%Telecom - Services 1.24%Minerals/Mining 0.94%Ferrous Metals 0.65%Media & Entertainment 0.62%Transportation 0.62%Non - Ferrous Metals 0.51%Gas 0.50%Auto Ancillaries 0.49%Telecom - Equipment & Ac-cessories 0.45%
Industrial Capital Goods 0.28%Cash & Current Assets 17.20%Net receivables / payables -16.67%Total Net Assets 100.00%The Financial Solution(s) stated above is
ONLY for highlighting the many advantages perceived from investments in Mutual Funds but does not in any manner, indicate or imply, either the quality of any particular Scheme or guarantee any specific performance/returns.
82

The Financial Solution(s) stated above is ONLY for highlighting the many advantages perceived from investments in Mutual Funds but does not in any manner, indicate or imply, either the quality of any particular Scheme or guarantee any specific performance/returns.
Note: The above Allocation is As on December 31, 2016 as per Industry classification as recommended by AMFI.
Birla Sun Life Equity Fund
Allocation as a % of Net Assets %Banks 19.49%Pharmaceuticals 9.61%Finance 9.60%Software 6.83%Consumer Non Durables 6.52%Cement 5.20%Auto 4.95%Oil 3.84%Chemicals 3.73%Telecom - Services 2.91%Non - Ferrous Metals 2.62%Petroleum Products 2.34%Media & Entertainment 2.08%Auto Ancillaries 1.46%Consumer Durables 1.46%Ferrous Metals 1.43%Industrial Products 1.17%Power 1.01%Telecom - Equipment & Ac-cessories 0.69%
Engineering Services 0.52%Textile Products 0.37%Transportation 0.35%Industrial Capital Goods 0.34%Construction 0.18%Miscellaneous 0.00%Mutual Fund Units 0.00%Futures and Options -2.77%Cash & Current Assets 8.66%Net receivables / payables 5.39%Total Net Assets 100.00%
Birla Sun Life Frontline Equity Fund
Allocation as a % of Net Assets %Banks 21.40%Software 9.47%Auto 8.60%Consumer Non Durables 8.46%Finance 8.26%Pharmaceuticals 8.14%Petroleum Products 7.10%Power 3.14%Mutual Fund Units 2.86%Cement 2.40%Consumer Durables 2.02%Construction Project 2.00%Media & Entertainment 1.81%Auto Ancillaries 1.36%Minerals/Mining 1.27%Non - Ferrous Metals 1.19%Industrial Products 1.14%Industrial Capital Goods 0.74%Construction 0.70%Pesticides 0.68%Gas 0.52%Oil 0.37%Exchange Traded Fund 0.35%Telecom - Services 0.35%WARRANT 0.21%Ferrous Metals 0.20%Corporate Debt 0.04%Futures and Options -1.82%Cash & Current Assets 4.52%Net receivables / payables 2.50%Total Net Assets 100.00%
Birla Sun Life Top 100 Fund
Allocation as a % of Net Assets %Banks 23.06%Software 9.35%Pharmaceuticals 9.12%Auto 8.22%Consumer Non Durables 6.78%Petroleum Products 6.45%Finance 5.62%Power 3.96%Cement 3.82%Consumer Durables 2.07%Non - Ferrous Metals 2.02%Industrial Capital Goods 1.60%Gas 1.55%Minerals/Mining 1.24%Industrial Products 1.16%Construction Project 1.11%Media & Entertainment 1.10%Auto Ancillaries 0.92%Exchange Traded Fund 0.88%Oil 0.65%Telecom - Services 0.55%WARRANT 0.32%Corporate Debt 0.07%Futures and Options -2.00%Cash & Current Assets 8.02%Net receivables / payables 2.36%Total Net Assets 100.00%
Birla Sun Life Advantage Fund
Allocation as a % of Net Assets %
Banks 19.19%Finance 11.50%Auto 11.16%Pharmaceuticals 8.10%Software 7.35%Consumer Non Durables 5.83%Non - Ferrous Metals 5.55%Petroleum Products 4.65%Gas 3.42%Pesticides 2.90%Cement 2.86%Industrial Capital Goods 2.36%Auto Ancillaries 1.62%Textile Products 1.62%Construction Project 1.40%Ferrous Metals 1.18%Industrial Products 1.16%Power 0.94%Media & Entertainment 0.57%Healthcare Services 0.52%Telecom - Equipment & Ac-cessories 0.33%
Miscellaneous 0.05%Cash & Current Assets 6.02%Net receivables / payables -0.25%Total Net Assets 100.00%
Birla Sun Life MNC Fund
Allocation as a % of Net Assets %Consumer Non Durables 17.91%Pharmaceuticals 12.79%Finance 12.24%Auto Ancillaries 9.25%Pesticides 8.36%Industrial Capital Goods 7.41%Auto 6.96%Consumer Durables 6.32%Banks 4.83%Services 3.95%Industrial Products 3.49%Transportation 2.61%Petroleum Products 1.33%Cement 0.98%Commercial Services 0.66%Software 0.45%Construction 0.35%Corporate Debt 0.01%Miscellaneous 0.00%Cash & Current Assets 0.46%Net receivables / payables -0.37%Total Net Assets 100.00%
Birla Sun Life Midcap Fund
Allocation as a % of Net Assets %Finance 14.78%Pharmaceuticals 8.10%Banks 7.63%Industrial Products 7.48%Auto Ancillaries 5.16%Consumer Non Durables 5.07%Cement 4.74%Construction 4.60%Consumer Durables 4.45%Petroleum Products 4.42%Construction Project 4.14%Gas 3.67%Software 3.12%Textile Products 2.77%Chemicals 2.72%Non - Ferrous Metals 2.41%Pesticides 1.89%Auto 1.58%Industrial Capital Goods 1.43%Power 1.38%Services 1.13%Commercial Services 0.92%Media & Entertainment 0.68%Cash & Current Assets 6.40%Net receivables / payables -0.67%Total Net Assets 100.00%
Birla Sun Life Small & Midcap Fund
Allocation as a % of Net Assets %Pharmaceuticals 12.33%Finance 10.57%Banks 8.17%Construction 6.99%Industrial Products 6.75%Software 6.04%Gas 5.45%Cement 4.65%Consumer Non Durables 4.12%Consumer Durables 3.43%Textile Products 2.93%Industrial Capital Goods 2.88%Construction Project 2.62%Petroleum Products 2.48%Chemicals 2.38%Media & Entertainment 2.33%Auto Ancillaries 2.32%Textiles - Cotton 1.87%Ferrous Metals 1.46%Cash & Current Assets 10.48%Net receivables / payables -0.24%Total Net Assets 100.00%
Birla Sun Life Pure Value Fund
Allocation as a % of Net Assets %Pharmaceuticals 16.02%Chemicals 10.31%Gas 9.64%Petroleum Products 9.43%Textile Products 8.02%Consumer Non Durables 5.33%Software 4.44%Pesticides 3.74%Power 3.71%Finance 3.57%Industrial Products 3.44%Ferrous Metals 2.54%Consumer Durables 2.45%Banks 2.44%Industrial Capital Goods 1.89%Non - Ferrous Metals 1.87%Auto 1.39%Cement 1.38%Telecom - Equipment & Ac-cessories 1.04%
Construction Project 0.61%Cash & Current Assets 7.06%Net receivables / payables -0.33%Total Net Assets 100.00%
83
Industry Allocation
http://mutualfund.birlasunlife.com https://twitter.com/bslmf
https://www.facebook.com/bslmf https://www.linkedin.com/company/bslmf
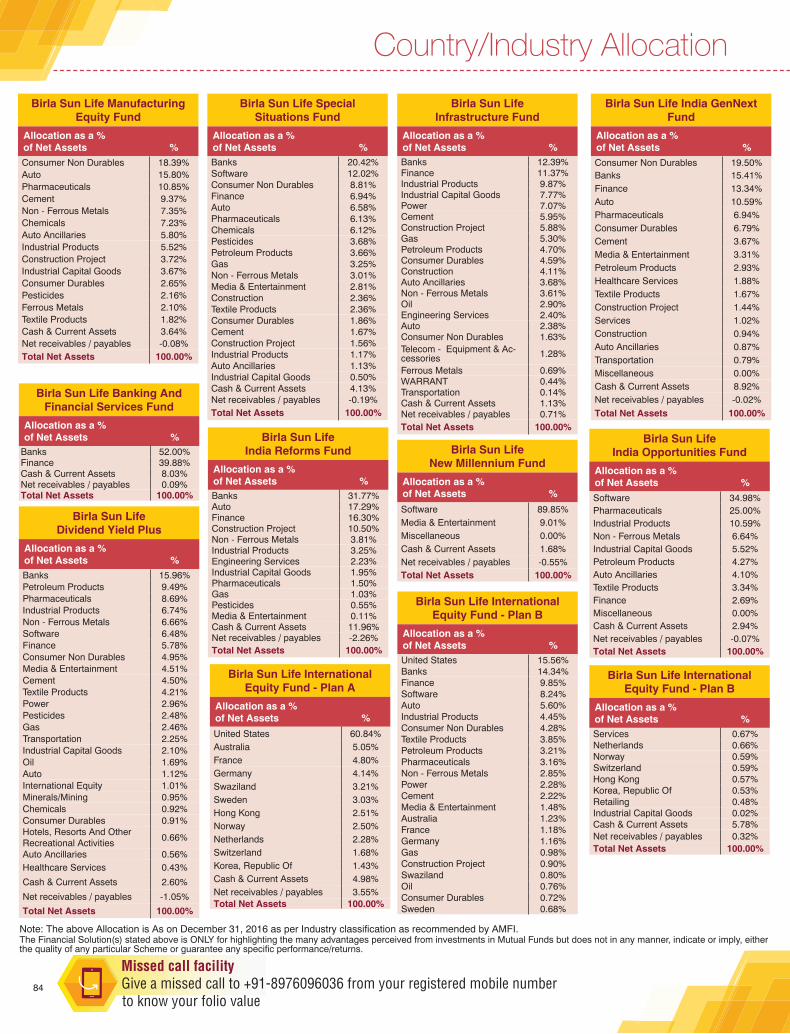
The Financial Solution(s) stated above is ONLY for highlighting the many advantages perceived from investments in Mutual Funds but does not in any manner, indicate or imply, either the quality of any particular Scheme or guarantee any specific performance/returns.
Note: The above Allocation is As on December 31, 2016 as per Industry classification as recommended by AMFI.
Birla Sun Life Manufacturing Equity Fund
Allocation as a % of Net Assets %Consumer Non Durables 18.39%Auto 15.80%Pharmaceuticals 10.85%Cement 9.37%Non - Ferrous Metals 7.35%Chemicals 7.23%Auto Ancillaries 5.80%Industrial Products 5.52%Construction Project 3.72%Industrial Capital Goods 3.67%Consumer Durables 2.65%Pesticides 2.16%Ferrous Metals 2.10%Textile Products 1.82%Cash & Current Assets 3.64%Net receivables / payables -0.08%Total Net Assets 100.00%
Birla Sun Life India Reforms Fund
Allocation as a % of Net Assets %Banks 31.77%Auto 17.29%Finance 16.30%Construction Project 10.50%Non - Ferrous Metals 3.81%Industrial Products 3.25%Engineering Services 2.23%Industrial Capital Goods 1.95%Pharmaceuticals 1.50%Gas 1.03%Pesticides 0.55%Media & Entertainment 0.11%Cash & Current Assets 11.96%Net receivables / payables -2.26%Total Net Assets 100.00%
Birla Sun Life Infrastructure Fund
Allocation as a % of Net Assets %Banks 12.39%Finance 11.37%Industrial Products 9.87%Industrial Capital Goods 7.77%Power 7.07%Cement 5.95%Construction Project 5.88%Gas 5.30%Petroleum Products 4.70%Consumer Durables 4.59%Construction 4.11%Auto Ancillaries 3.68%Non - Ferrous Metals 3.61%Oil 2.90%Engineering Services 2.40%Auto 2.38%Consumer Non Durables 1.63%Telecom - Equipment & Ac-cessories 1.28%
Ferrous Metals 0.69%WARRANT 0.44%Transportation 0.14%Cash & Current Assets 1.13%Net receivables / payables 0.71%Total Net Assets 100.00%
Birla Sun Life International Equity Fund - Plan A
Allocation as a % of Net Assets %United States 60.84%Australia 5.05%France 4.80%Germany 4.14%Swaziland 3.21%Sweden 3.03%Hong Kong 2.51%Norway 2.50%Netherlands 2.28%Switzerland 1.68%Korea, Republic Of 1.43%Cash & Current Assets 4.98%Net receivables / payables 3.55%Total Net Assets 100.00%
Birla Sun Life International Equity Fund - Plan B
Allocation as a % of Net Assets %United States 15.56%Banks 14.34%Finance 9.85%Software 8.24%Auto 5.60%Industrial Products 4.45%Consumer Non Durables 4.28%Textile Products 3.85%Petroleum Products 3.21%Pharmaceuticals 3.16%Non - Ferrous Metals 2.85%Power 2.28%Cement 2.22%Media & Entertainment 1.48%Australia 1.23%France 1.18%Germany 1.16%Gas 0.98%Construction Project 0.90%Swaziland 0.80%Oil 0.76%Consumer Durables 0.72%Sweden 0.68%
Birla Sun Life New Millennium Fund
Allocation as a % of Net Assets %Software 89.85%Media & Entertainment 9.01%Miscellaneous 0.00%Cash & Current Assets 1.68%Net receivables / payables -0.55%Total Net Assets 100.00%
Country/Industry Allocation
Birla Sun Life India Opportunities Fund
Allocation as a % of Net Assets %Software 34.98%Pharmaceuticals 25.00%Industrial Products 10.59%Non - Ferrous Metals 6.64%Industrial Capital Goods 5.52%Petroleum Products 4.27%Auto Ancillaries 4.10%Textile Products 3.34%Finance 2.69%Miscellaneous 0.00%Cash & Current Assets 2.94%Net receivables / payables -0.07%Total Net Assets 100.00%
Birla Sun Life Banking And Financial Services Fund
Allocation as a % of Net Assets %
Banks 52.00%Finance 39.88%Cash & Current Assets 8.03%Net receivables / payables 0.09%Total Net Assets 100.00%
Birla Sun Life Dividend Yield Plus
Allocation as a % of Net Assets %Banks 15.96%Petroleum Products 9.49%Pharmaceuticals 8.69%Industrial Products 6.74%Non - Ferrous Metals 6.66%Software 6.48%Finance 5.78%Consumer Non Durables 4.95%Media & Entertainment 4.51%Cement 4.50%Textile Products 4.21%Power 2.96%Pesticides 2.48%Gas 2.46%Transportation 2.25%Industrial Capital Goods 2.10%Oil 1.69%Auto 1.12%International Equity 1.01%Minerals/Mining 0.95%Chemicals 0.92%Consumer Durables 0.91%Hotels, Resorts And Other Recreational Activities 0.66%
Auto Ancillaries 0.56%Healthcare Services 0.43%
Cash & Current Assets 2.60%
Net receivables / payables -1.05%
Total Net Assets 100.00%
Birla Sun Life Special Situations Fund
Allocation as a % of Net Assets %Banks 20.42%Software 12.02%Consumer Non Durables 8.81%Finance 6.94%Auto 6.58%Pharmaceuticals 6.13%Chemicals 6.12%Pesticides 3.68%Petroleum Products 3.66%Gas 3.25%Non - Ferrous Metals 3.01%Media & Entertainment 2.81%Construction 2.36%Textile Products 2.36%Consumer Durables 1.86%Cement 1.67%Construction Project 1.56%Industrial Products 1.17%Auto Ancillaries 1.13%Industrial Capital Goods 0.50%Cash & Current Assets 4.13%Net receivables / payables -0.19%Total Net Assets 100.00%
Birla Sun Life India GenNext Fund
Allocation as a % of Net Assets %Consumer Non Durables 19.50%Banks 15.41%Finance 13.34%Auto 10.59%Pharmaceuticals 6.94%Consumer Durables 6.79%Cement 3.67%Media & Entertainment 3.31%Petroleum Products 2.93%Healthcare Services 1.88%Textile Products 1.67%Construction Project 1.44%Services 1.02%Construction 0.94%Auto Ancillaries 0.87%Transportation 0.79%Miscellaneous 0.00%Cash & Current Assets 8.92%Net receivables / payables -0.02%Total Net Assets 100.00%
Birla Sun Life International Equity Fund - Plan B
Allocation as a % of Net Assets %Services 0.67%Netherlands 0.66%Norway 0.59%Switzerland 0.59%Hong Kong 0.57%Korea, Republic Of 0.53%Retailing 0.48%Industrial Capital Goods 0.02%Cash & Current Assets 5.78%Net receivables / payables 0.32%Total Net Assets 100.00%
84
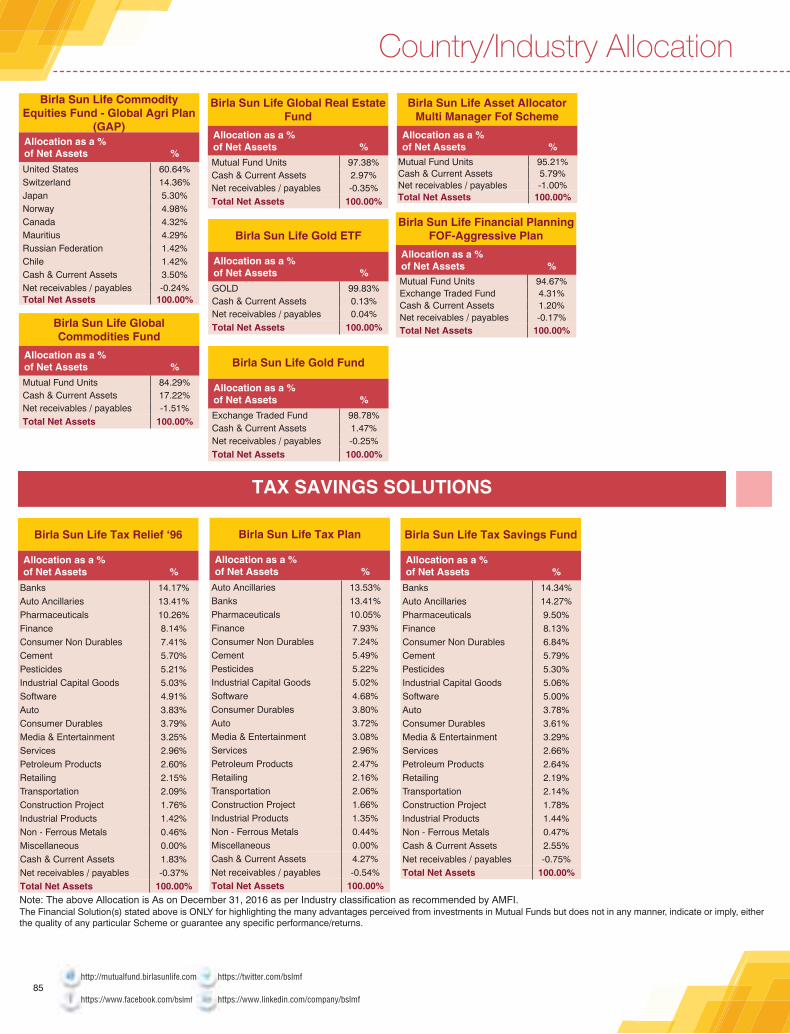
The Financial Solution(s) stated above is ONLY for highlighting the many advantages perceived from investments in Mutual Funds but does not in any manner, indicate or imply, either the quality of any particular Scheme or guarantee any specific performance/returns.
Note: The above Allocation is As on December 31, 2016 as per Industry classification as recommended by AMFI.
Country/Industry AllocationBirla Sun Life Commodity
Equities Fund - Global Agri Plan (GAP)
Allocation as a % of Net Assets %United States 60.64%Switzerland 14.36%Japan 5.30%Norway 4.98%Canada 4.32%Mauritius 4.29%Russian Federation 1.42%Chile 1.42%Cash & Current Assets 3.50%Net receivables / payables -0.24%Total Net Assets 100.00%
Birla Sun Life Global Commodities Fund
Allocation as a % of Net Assets %Mutual Fund Units 84.29%Cash & Current Assets 17.22%Net receivables / payables -1.51%Total Net Assets 100.00%
Birla Sun Life Global Real Estate Fund
Allocation as a % of Net Assets %Mutual Fund Units 97.38%Cash & Current Assets 2.97%Net receivables / payables -0.35%Total Net Assets 100.00%
Birla Sun Life Gold ETF
Allocation as a % of Net Assets %GOLD 99.83%Cash & Current Assets 0.13%Net receivables / payables 0.04%Total Net Assets 100.00%
Birla Sun Life Gold Fund
Allocation as a % of Net Assets %Exchange Traded Fund 98.78%Cash & Current Assets 1.47%Net receivables / payables -0.25%Total Net Assets 100.00%
Birla Sun Life Asset Allocator Multi Manager Fof Scheme
Allocation as a % of Net Assets %
Mutual Fund Units 95.21%Cash & Current Assets 5.79%Net receivables / payables -1.00%Total Net Assets 100.00%
Birla Sun Life Financial Planning FOF-Aggressive Plan
Allocation as a % of Net Assets %Mutual Fund Units 94.67%Exchange Traded Fund 4.31%Cash & Current Assets 1.20%Net receivables / payables -0.17%Total Net Assets 100.00%
Birla Sun Life Tax Plan
Allocation as a % of Net Assets %
Auto Ancillaries 13.53%Banks 13.41%Pharmaceuticals 10.05%Finance 7.93%Consumer Non Durables 7.24%Cement 5.49%Pesticides 5.22%Industrial Capital Goods 5.02%Software 4.68%Consumer Durables 3.80%Auto 3.72%Media & Entertainment 3.08%Services 2.96%Petroleum Products 2.47%Retailing 2.16%Transportation 2.06%Construction Project 1.66%Industrial Products 1.35%Non - Ferrous Metals 0.44%Miscellaneous 0.00%Cash & Current Assets 4.27%Net receivables / payables -0.54%Total Net Assets 100.00%
TAX SAVINGS SOLUTIONS
Birla Sun Life Tax Savings Fund
Allocation as a % of Net Assets %
Banks 14.34%Auto Ancillaries 14.27%Pharmaceuticals 9.50%Finance 8.13%Consumer Non Durables 6.84%Cement 5.79%Pesticides 5.30%Industrial Capital Goods 5.06%Software 5.00%Auto 3.78%Consumer Durables 3.61%Media & Entertainment 3.29%Services 2.66%Petroleum Products 2.64%Retailing 2.19%Transportation 2.14%Construction Project 1.78%Industrial Products 1.44%Non - Ferrous Metals 0.47%Cash & Current Assets 2.55%Net receivables / payables -0.75%Total Net Assets 100.00%
Birla Sun Life Tax Relief ‘96
Allocation as a % of Net Assets %
Banks 14.17%Auto Ancillaries 13.41%Pharmaceuticals 10.26%Finance 8.14%Consumer Non Durables 7.41%Cement 5.70%Pesticides 5.21%Industrial Capital Goods 5.03%Software 4.91%Auto 3.83%Consumer Durables 3.79%Media & Entertainment 3.25%Services 2.96%Petroleum Products 2.60%Retailing 2.15%Transportation 2.09%Construction Project 1.76%Industrial Products 1.42%Non - Ferrous Metals 0.46%Miscellaneous 0.00%Cash & Current Assets 1.83%Net receivables / payables -0.37%Total Net Assets 100.00%
85http://mutualfund.birlasunlife.com https://twitter.com/bslmf
https://www.facebook.com/bslmf https://www.linkedin.com/company/bslmf
Fund Manager : An employee of the asset management company such as a mutual fund or life insurer, who manages investments of the scheme. He is usually part of a larger team of fund managers and research analysts.Application Amount for Fresh Subscription : This is the minimum investment amount for a new investor in a mutual fund scheme.Minimum Additional Amount : This is the minimum investment amount for an existing investor in a mutual fund scheme.Yield to Maturity : The Yield to Maturity or the YTM is the rate of return anticipated on a bond if held until maturity. YTM is expressed as an annual rate. The YTM factors in the bond’s current market price, par value, coupon interest rate and time to maturity.SIP : SIP or systematic investment plan works on the principle of making periodic investments of a fixed sum. It works similar to a recurring bank deposit. For instance, an investor may opt for an SIP that invests ` 500 every 15th of the month in an equity fund for a period of three years.NAV : The NAV or the net asset value is the total asset value per unit of the mutual fund after deducting all related and permissible expenses. The NAV is calculated at the end of every business day. It is the value at which the investor enters or exits the mutual fund.Benchmark : A group of securities, usually a market index, whose performance is used as a standard or benchmark to measure investment performance of mutual funds, among other investments. Some typical benchmarks include the Nifty, Sensex, BSE200, BSE500, 10-Year Gsec.Entry Load : A mutual fund may have a sales charge or load at the time of entry and/or exit to compensate the distributor/agent. Entry load is charged at the time an investor purchases the units of a mutual fund. The entry load is added to the prevailing NAV at the time of investment. For instance, if the NAV is ` 100 and the entry load is 1%, the investor will enter the fund at ` 101.Note: SEBI, vide circular dated June 30, 2009 has abolished entry load and mandated that the upfront commission to distributors will be paid by the investor directly to the distributor, based on his assessment of various factors including the service rendered by the distributor.Exit Load : Exit load is charged at the time an investor redeems the units of a mutual fund. The exit load is reduced from the prevailing NAV at the time of redemption. The investor will receive redemption proceed at net value of NAV less Exit load. For instance if the NAV is ` 100 and the exit load is 1%, the investor will receive ` 99.Modified Duration : Modified duration is the price sensitivity and the percentage change in price for a unit change in yieldStandard Deviation : Standard deviation is a statistical measure of the range of an investment’s performance. When a mutual fund has a high standard deviation, its means its range of performance is wide, implying greater volatility.Sharpe Ratio : The Sharpe Ratio, named after its founder, the Nobel Laureate William Sharpe, is a measure of risk-adjusted returns. It is calculated using standard deviation and excess return to determine reward per unit of risk.Beta : Beta is a measure of an investment’s volatility vis-à-vis the market. Beta of less than 1 means that the security will be less volatile than the market. A beta of greater than 1 implies that the security’s price will be more volatile than the market.AUM : AUM or assets under management refers to the recent / updated cumulative market value of investments managed by a mutual fund or any investment firm.Holdings : The holdings or the portfolio is a mutual fund’s latest or updated reported statement of investments/securities. These are usually displayed in terms of percentage to net assets or the rupee value or both. The objective is to give investors an idea of where their money is being invested by the fund manager.Nature of Scheme : The investment objective and underlying investments determine the nature of the mutual fund scheme. For instance, a mutual fund that aims at generating capital appreciation by investing in stock markets is an equity fund or growth fund. Likewise, a mutual fund that aims at capital preservation by investing in debt markets is a debt fund or income fund. Each of these categories may have sub-categories.Rating Profile : Mutual funds invest in securities after evaluating their creditworthiness as disclosed by the ratings. A depiction of the mutual fund in various investments based on their ratings becomes the rating profile of the fund. Typically, this is a feature of debt funds.
Glossary Page
86

mutualfund.birlasunlife.com
You can access our services anywhere by simply registering yourself on our website, mutualfund.birlasunlife.com
Convenience, now at your service.
Here’s all that we offer:
SMS/e-mail alertInstant account statements and NAV information on your registered e-mail ID/mobile number.
Missed callGive a missed call to +91-8976096036 from your registered mobile number
to know your folio value at zero charges.
OnlineRegister on our website and gain access to your folio online anytime, anywhere.
IVRGet information on your last five transactions and perform functions
like redemption and switch simply by calling at 1-800-270-7000
e-KYCWith the help of your PAN/Aadhar Card, you can complete your KYC online.
Call-backImmediate call back option from our call centre executives during peak time.
This service could be availed on our website and via the FinGo App.

Birla Sun Life Asset Management Company Limited (Investment Manager for Birla Sun Life Mutual Fund)One IndiaBull Centre, Tower 1, 17th Floor, Jupiter Mill Compound, 841, Senapati Bapat Marg, Elphinstone ROad, Mumbai - 400 013. CIN: U65991 MH1994PLC080811.
Mutual Fund investments are subject to market risks, read all scheme related documents carefully.