ground line moment analysis of single circuit by phillip …
TRANSCRIPT

GROUND LINE MOMENT ANALYSIS OF SINGLE CIRCUIT
BODY EXTENDED 161KV TRANSMISSION TOWERS
By
Phillip W. York
Weidong Wu Joseph Owino
Assistant Professor UC Foundation Professor
(Major Advisor) (Committee Member)
Ignatius Fomunung Mbakisya A. Onyango
UC Foundation Professor UC Foundation Associate Professor
(Committee Member) (Committee Member)

ii
GROUND LINE MOMENT ANALYSIS OF SINGLE CIRCUIT
BODY EXTENDED 161KV TRANSMISSION TOWERS
By
Phillip W. York
A Thesis Submitted to the Faculty of the University of
Tennessee at Chattanooga in Partial
Fulfillment of the Requirements of the Degree
of Master of Science: Engineering
The University of Tennessee at Chattanooga
Chattanooga, Tennessee
December 2018

iii
ABSTRACT
This study simplified the analysis required for the extension of a single circuit tangent 161kV
transmission tower. The parameters were modified and modern criteria used to evaluate the tangent
tower with various body extensions. The basis of analysis for the extended lattice towers compared the
ground-line moment of the tallest tower in each class to the ground-line moment of various tower
heights. This study analyzed 62,640 design input combinations for the tower using modern NESC
loadings and determined which combinations fall below the maximum design ground-line forces. The
ground-line force analysis was modernized by lowering the overload factors from their original design
values of to modern NESC Medium Loading Zone values. This decrease in overload factors resulted in a
decrease of compression and tension ground-line forces. These decreases in ground-line forces result in
an increase of 25% for compression capacity and 33% for tension capacity.

iv
TABLE OF CONTENTS
ABSTRACT ..................................................................................................................................................... iii
LIST OF TABLES ............................................................................................................................................. vi
LIST OF FIGURES .......................................................................................................................................... vii
LIST OF EQUATIONS ..................................................................................................................................... ix
LIST OF SYMBOLS .......................................................................................................................................... x
CHAPTER
1. INTRODUCTION .................................................................................................................................... 1
Background ........................................................................................................................................... 1 Statement of the Problem .................................................................................................................... 4 Objective of the Study .......................................................................................................................... 4 Scope and Limitations of the Study ...................................................................................................... 5 Significance of the Study ...................................................................................................................... 5
2. LITERATURE REVIEW ............................................................................................................................. 6
Introduction .......................................................................................................................................... 6 Analysis and Design of Transmission Tower ......................................................................................... 6 Structural Behavior of Lattice Transmission Towers Subjected to Wind Load .................................... 7 Analysis and Design of Double Circuit Tower with Extension .............................................................. 8 Summary............................................................................................................................................... 8
3. METHODOLOGY .................................................................................................................................... 9
Introduction .......................................................................................................................................... 9 Ground Line Analysis .......................................................................................................................... 10 Calculation Procedure ........................................................................................................................ 12 Original Tower Design ........................................................................................................................ 13
Design Inputs ...................................................................................................................................... 15

v
4. RESULTS AND ANALYSIS ..................................................................................................................... 17
Results ................................................................................................................................................ 17 General Analysis ................................................................................................................................. 17 Constant Single Design Input .............................................................................................................. 19
Conductor Height ............................................................................................................................ 19 Conductor Type ............................................................................................................................... 22
Shield Wire Type ............................................................................................................................. 24 Conductor Tension .......................................................................................................................... 27 Shield Wire Tension ........................................................................................................................ 29 Horizontal Span ............................................................................................................................... 32 Vertical Span ................................................................................................................................... 34
Usage Percentage Per Design Input ................................................................................................... 38 Failure Analysis ................................................................................................................................... 45
5. DISCUSSION AND CONCLUSION ......................................................................................................... 50
Introduction ........................................................................................................................................ 50 Objectives of the Study ...................................................................................................................... 50 Summary of the Findings .................................................................................................................... 51 Conclusions ......................................................................................................................................... 52 Recommendations for Further Study ................................................................................................. 53
REFERENCES ................................................................................................................................................ 54
APPENDIX
A. SUPPLEMENTAL DATA ACCESS INFORMATION .................................................................................. 55
B. TRANSMISSION LINE DESIGN GLOSSARY ............................................................................................ 57
VITA ............................................................................................................................................................. 60

vi
LIST OF TABLES
1 2017 NESC Clearance Requirements ........................................................................................................ 3
2 Ground to Conductor Design Heights .................................................................................................... 10
3 A Tower Design Input ............................................................................................................................. 16
4 Usage Percentage per Conductor Type .................................................................................................. 39
5 Usage Percentage per Shield Wire Type ................................................................................................ 40
6 Usage Percentage per Conductor Tension ............................................................................................. 41
7 Usage Percentage per Shield Wire Tension ........................................................................................... 42
8 Usage Percentage per Horizontal Span .................................................................................................. 43
9 Usage Percentage per Vertical Span ...................................................................................................... 44

vii
LIST OF FIGURES
1 Sags of electrical conductors ................................................................................................................... 4
2 A map of NESC loading zones (IEEE, 2016) ............................................................................................ 11
3 A-Tower load tree.................................................................................................................................. 14
4 Application output showing the passing rates per design input ........................................................... 18
5 Application output showing the passing rates for a 68' tower ............................................................. 20
6 Application output showing the passing rates for a 124' tower ........................................................... 21
7 Application output showing the passing rates for a 636 kCmil conductor ........................................... 22
8 Application output showing the passing rates for a 1590 kCmil conductor ......................................... 23
9 Application output showing the passing rates for a 7/16 steel shield wire .......................................... 24
10 Application output showing the passing rates for a 7 No. 9 Alumoweld shield wire ........................... 25
11 Application output showing the passing rates for a 48 fiber Alumocore shield wire .......................... 26
12 Application output showing the passing rates for a 7000 lb. conductor tension ................................. 27
13 Application output showing the passing rates for a 10000 lb. conductor tension ............................... 28
14 Application output showing the passing rates for a 4000 lb. shield wire tension ................................ 29
15 Application output showing the passing rates for a 4500 lb. shield wire tension ................................ 30
16 Application output showing the passing rates for a 5000 lb. shield wire tension ................................ 31
17 Application output showing the passing rates for a 1200’ horizontal span ......................................... 32
18 Application output showing the passing rates for a 1300’ horizontal span ......................................... 33
19 Application output showing the passing rates for a 1400’ horizontal span ......................................... 34
20 Application output showing the passing rates for a 1700’ vertical span .............................................. 35
viii
21 Application output showing the passing rates for a 1800’ vertical span .............................................. 36
22 Application output showing the passing rates for a 1900’ vertical span .............................................. 37
23 Application output showing the passing rates for a 2000’ vertical span .............................................. 38
24 Application output showing the number of failures per design input ................................................. 45
25 A pie chart showing conductor type failure percentages ..................................................................... 46
26 A pie chart showing chield wire type failure percentages .................................................................... 47
27 A pie chart showing conductor tension failure percentages ................................................................ 47
28 A pie chart showing shield wire tension failure percentages ............................................................... 48
29 A pie chart showing horizontal span failure percentages ..................................................................... 48
30 A pie chart showing vertical span failure percentages ......................................................................... 49

ix
LIST OF EQUATIONS
1 Bernoulli’s Equation ................................................................................................................................... 7
2 Ice Load .................................................................................................................................................... 12
3 Wind Load ................................................................................................................................................ 12
4 Total Load ................................................................................................................................................. 12
5 Horizontal Unit Load ................................................................................................................................ 12
6 Vertical Unit Load ..................................................................................................................................... 12
7 Horizontal Ultimate Load ......................................................................................................................... 12
8 LongitudinalUltimate Load ....................................................................................................................... 12
9 Vertical Ultimate Load ............................................................................................................................. 12
10 Horizontal Ground Line Moment ........................................................................................................... 13
11 Longitudinal Ground Line Moment ........................................................................................................ 13
12 Vertical Ground Line Moment ............................................................................................................... 13

x
LIST OF SYMBOLS
ρice, Density of ice
Att, Attachment Height
dice, Diameter of Ring of Ice
dwire, Diameter of Wire
H, Horizontal Load
Hult, Ultimate Horizontal Load
HU, Horizontal Unit Load
K, Adjustment Factor
Lice, Load due to Ice
Lwind, Load due to Wind
Lult, Ultimate Longitudinal Load
MH, Horizontal Moment
ML, Longitudinal Moment
MV, Vertical Moment
OLFw, Wind Overload Factor
OLFt, Tension Overload Factor
T, Tension Load
tice, Thickness of Ring of Ice
TL, Total Load
V, Vertical Load

xi
Vult, Ultimate Vertical Load
VU, Vertical Unit Load
W, Wind Load
WC, Weight of Conductor

1
CHAPTER 1
INTRODUCTION
Background
On August 14, 2003, the Stuart-Atlanta 345kV Transmission Line, owned by Dayton Power and
Light, came into direct contact with a tree that had encroached into the cleared right-of-way. This
contact caused a short circuit to ground and tripped the circuit breakers on each end of the line.
Although this short circuit was not the immediate cause the United States Northeast Blackout of 2003,
it, paired with an inadequate understanding of the greater bulk power system in the general area, was a
major contributing factor. In the four days that followed, more than 45 million individuals were affected
in the United States and Canada with the estimated total cost of the outages exceeding $10 billion. As a
direct result of this blackout, many recommendations were made by a joint US-Canadian Task Force to
support and strengthen the North American Reliability Corporation. The North American Electric
Reliability Corporation (NERC) is an international regulatory authority whose task is to reduce risks to
and increase reliability of the bulk electric grid. One of these recommendations was to ‘establish
enforceable standards for maintenance of electrical clearances in right-of-way areas.’ (U.S.-Canada
Power System Outage Task Force, 2004)
In the Energy Policy Act of 2005, the United States Congress addressed this recommendation by
empowering the Federal Energy Regulatory Commission (FERC) to establish an electric reliability
organization (ERO). (Energy Policy Act of 2005, 16 USC § 824o, 2005) On July 20, 2006, FERC selected
NERC as the national ERO, effective January 1, 2007. (North American Electric Reliability Corporation,
2017) On October 7, 2010, NERC issued a Recommendation to Industry with the following statement:

2
NERC has become aware of discrepancies between the design and actual field conditions of
transmission facilities, including transmission conductors. These discrepancies may be both
significant and widespread, with the potential to result in discrepancies in line ratings. (Adamski,
2010)
After this recommendation, guidance on a method to maintain transmission line ratings was
also issued by NERC. The suggested method is outlined below.
• Acquire aerial survey data based on 3D laser scanning (LiDAR)
• Use LiDAR survey data to build right-of-way computer models in PLS-CADD
• Use PLS-CADD to perform sag-tension analysis to identify ratings discrepancies
o Discrepancies are defined as areas where conductors do not meet NESC
clearance requirements
• Document and track ratings discrepancies using various software tools
• Implement permanent remediation measures including some of the following;
o Raising, modifying, or replacing transmission structures
o Installing new mid-span transmission structures
o Installing floating dead-ends
o Installing dead-ends on towers or cross-arms
o Re-sagging line sections
o Installing new conductors
Based on this recommendation and guidance, a review of every high-voltage transmission line in
the United States for NESC clearance criteria was initiated to ensure safety and reliability. (North
American Electric Reliability Corporation, 2015)
The first enforceable code for transmission line design in the United States, named the National
Bureau of Standards (NBS) Circular 49, was published by the NBS in 1916. The circular was updated
multiple times between 1916 and 1948, when the final NBS code was issued. This final 1948 code was
revised many times over the next twenty five years. In 1973, the Institute of Electrical and Electronic
Engineers (IEEE) assumed the functions performed by the NBS and issued the first edition of the modern
National Electrical Safety Code (NESC) in 1981. The most recent edition of the NESC was published in
2017. (Institute of Electrical and Electronics Engineers, 2016)

3
Per the NERC guidance previously described, NESC vertical clearance requirements are to be
used to evaluate transmission line clearances to ensure the electrical ratings of each line. A list of the
most common clearance requirements are listed below.
Table 1 2017 NESC Clearance Requirements
Neutral 12.5kV 25kV 35kV
Fields and Forests 15.5'
Railroads 23.5'
Trucks 15.5'
Water - No Sailboats 14.0'
Swimming Pools 22.0'
Signs/Billboards 10.5'
Buildings 10.5'
25.0'
13.5'
13.5'
18.5'
26.5'
18.5'
17.0'
The 2017 NESC also gives guidance on calculating the maximum sag curves that should be used
for the overhead conductor to determine the minimum line clearance. The maximum sag of an electrical
conductor can be affected by many different factors including ambient temperature, ice and wind loads,
and operating temperatures. (Institute of Electrical and Electronics Engineers, 2016) Figure 1 illustrates a
conductor between two lattice steel towers with minimum cold and maximum full load conditions
shown.

4
Figure 1 Sags of electrical conductors
Statement of the Problem
Due to evolving electrical codes and environmental conditions, transmission line operators
continually evaluate their systems for changing services needs and reliability concerns. These
evaluations often require structural modifications to existing transmission line structures. These
modifications involve costly structural analysis and design calculations, especially modifications that
involve the extension of older steel lattice transmission towers based on outdated and rarely used
structural codes.
Objective of the Study
This study simplified the analysis required for the extension of a single circuit tangent 161kV
transmission tower using original design criteria, environmental conditions, and overload factors to
calculate a maximum allowable ground-line moment. The design parameters were modified and
modern environmental conditions and overload factors applied to evaluate the tangent tower with
various body extensions. The new ground-line moment was compared to the original design value to
determine if the tower will withstand the modified design parameters. Pass and fail rates were

5
calculated and any noticeable trends were recognized and documented. Conclusions were made on the
effect the differing design parameters have on the overall effectiveness of the structure.
Scope and Limitations of the Study
For this study, only a single circuit tangent lattice tower was analyzed. Angle, dead end, and
double circuit towers were not considered. The design inputs that were selected represent commonly
used values as site-specific inputs for real-life application were not available for this study. The ground-
line moments found during the course of this study were assumed to be the controlling factor in the
original tower design. It is assumed that member failure will not occur if the ground-line moment
remains less than the maximum allowed ground-line moment from the original tower design.
Significance of the Study
The resulting calculation from this study was used to evaluate any single circuit tangent tower to
model anticipated vertical, horizontal, and longitudinal forces and predict the resulting ground-line
moments. The trends that recognized during this study helped simplify the process for tangent tower
analysis and enabled the design engineer to make better engineering assumptions when extending
lattice transmission towers.

6
CHAPTER 2
LITERATURE REVIEW
Introduction
Many high voltage transmission lines built in the early-to-mid 20th century use hot-formed steel
lattice towers to elevate the conductor and achieve required clearances. Similar modern day lines are
often built with steel monopoles, H-frames, or various other structure types due to the increased price
of steel and the high labor cost of assembling lattice towers. (Wilhoite, 1985) When a previously
discussed NESC rating discrepancy is found on a steel lattice tower transmission line, a simple and cost
effective form of mitigation consists of extending the body of the tower to elevate the conductor further
than the original tower design. These extended lattice towers require various and unique analysis to
ensure they can sustain increased conductor loading and modern environmental conditions after the
required height increase for NESC compliance. This chapter will use existing studies to present
background information on the analysis and design of transmission towers, their common
environmental loadings, and existing studies on lattice tower extensions.
Analysis and Design of Transmission Tower
The goal of this study was to present a method of analysis for a double circuit transmission line
tower. Environmental details for this study included wind speeds, maximum and minimum
temperatures, and varying factors from the applicable codes used. The tower was a 54 meter (177’)
with twelve conductor and one shield wire attachment. The tower face was divided into various panels

7
and the calculated wind load applied to each panel to id in the design the individual tower members.
STAAD.Pro is used to verify the results that were found. The study concluded by analyzing a standard
tower foundation design that is checked for uplift forces and bearing pressure. (Punsi, 2014)
Structural Behavior of Lattice Transmission Towers Subjected to Wind Load
This paper compared the wind loading of two 400kV transmission line towers analyzed with four
different international codes. The codes that were used are the North American ASCE SEI 7, the
Australian/New Zealand 1170.2, the Wind Design Chapter of the Civil Engineering Manual of the
Mexican Federal Electricity Commission, and the Guidelines of Mexico’s Federal District Code. The
towers were 53 meter double circuit structures, made with A-572 steel and ASTM A394 bolts, and had
maximum line angles of 10 and 60 degrees. A 400 meter span was considered in the analysis with
Bluejay ASCR 1113 Conductor tensioned to 9.32 kN. The calculations considered surrounding terrain,
structure height and shape, and wind and gust factors under three load cases: wind acting parallel to the
conductor, wind acting perpendicular to the conductors, and a broken conductor case.
In the subject study, SAP2000 was used to model the two towers with a linear static analysis
that considered the self-weight and tension of the conductors and the wind acting on the tower body.
The loading patterns of all four international codes used Bernoulli’s Equation of non-aerodynamic
bodies to calculate the wind load.
𝐅 =𝟏
𝟐𝝆𝑽(𝒛)𝟐𝑮𝑪𝒅𝑨𝒇 (1) Equation 1 Bernoulli’s Equation
These forces were used to find a solidarity ratio, which was defined as the effective solid area on which
the winds act divided by the total area of the exposed surface. It was found during this study that the
solidarity ratio did not vary along the height of each tower. The final objective of this paper was a non-

8
linear, pushover analysis based on the horizontal forces from the four structural codes. This analysis
also provided a seismic evaluation for the two lattice towers. (Rajalakshmi, 2018)
Analysis and Design of Double Circuit Tower with Extension
This study used an 110kV transmission line with a 9 meter tower extension to achieve the
required vertical clearance over the centerline of a railway. The specific tower analyzed is a large angle,
32 meter double circuit structure with a vertical conductor configuration. The environmental conditions
used for this study assume a maximum temperature of 36 and a minimum temperature of 30 degrees
Celsius. ASCR Panther conductor was used with a 200 meter span. STAAD.Pro V8i is used for modeling
the tower and analysis of the load conditions, resulting in calculating the axial forces of each member.
The member was then economically sized for the loads that were calculated. This study concluded the
bottom tier members of the tower have a large role in withstanding axial forces while the upper tier
members are more responsible for lateral and transverse tower deformation. The twisting moment on
the tower was found to be insignificant. (Edgar, 2017)
Summary
From the research performed, studies to further the analysis and economical design of lattice
towers were commonplace. No studies were found analyzing and comparing the ground-line moment
of an existing lattice tower design to an extended tower with similar design parameters.

9
CHAPTER 3
METHODOLOGY
Introduction
There are four common single circuit lattice towers currently in use by transmission line
operators. These tower types include:
• A Tower – Single Circuit Tangent Suspension Tower
• B Tower – Single Circuit Small Angle Suspension Tower
• C Tower – Single Circuit Large Angle Suspension Tower
• D Tower – Single Circuit Dead End Tower
A tangent structure has no line angle as the wires pass the structure. A small angle tower is used for a
line angle of up to 4°, while a large angle tower can accommodate a maximum line angle of 17°. These
four tower types all support a horizontal configuration of wire, which provides the lowest geometric
profile while accommodating necessary phase-to-phase spacing. (Task Committee on Updating Manual
52 of the Structural Division of ASCE, 1988) Of these four tower types, only the dead end tower cannot
be extended to meet NESC vertical clearance criteria.
The following table gives the minimum and maximum ground-to-conductor heights for the three
extendable towers, with intermediate height intervals of 4 ft, and the available tower extension that can
be used with each type.

10
Table 2 Ground to Conductor Design Heights
Type Minimum Maximum Ext.
A 56 108 12 & 16
B 56 124 14
C 56 124 8
The basis of analysis for the extended lattice towers compared the ground-line moment of the
tallest tower in each class under maximum design conditions to the ground-line moment of various
tower heights with a variety of design inputs for each design condition. The design inputs used for this
analysis are listed below:
• Conductor Selection
o Weight per Linear Foot (WC)
o Diameter of Conductor (dwire)
o Conductor Tension (T)
• Ground Wire Selection
o Weight per Linear Foot (WC)
o Diameter of Wire (dwire)
o Ground Wire Tension (T)
• Design Span
o Horizontal (Weight) Span
o Vertical (Wind) Span
• Line Angle
Information for conductor and ground wire selection was found in the Southwire Overhead Conductor
Manual, 2nd Edition. (Thrash, 2007)
Ground Line Analysis
To begin the tower analysis, determine the type of conductor and shield wire, the installed
tensions of the conductor and shield wire, the horizontal and vertical spans, the wire attachment
heights, and the line angle at the subject tower. Conductor and shield wire type and tensions are
11
section dependent and should not change along a line segment. The horizontal and vertical spans, wire
attachment heights, and the line angle at the subject tower are structure dependent.
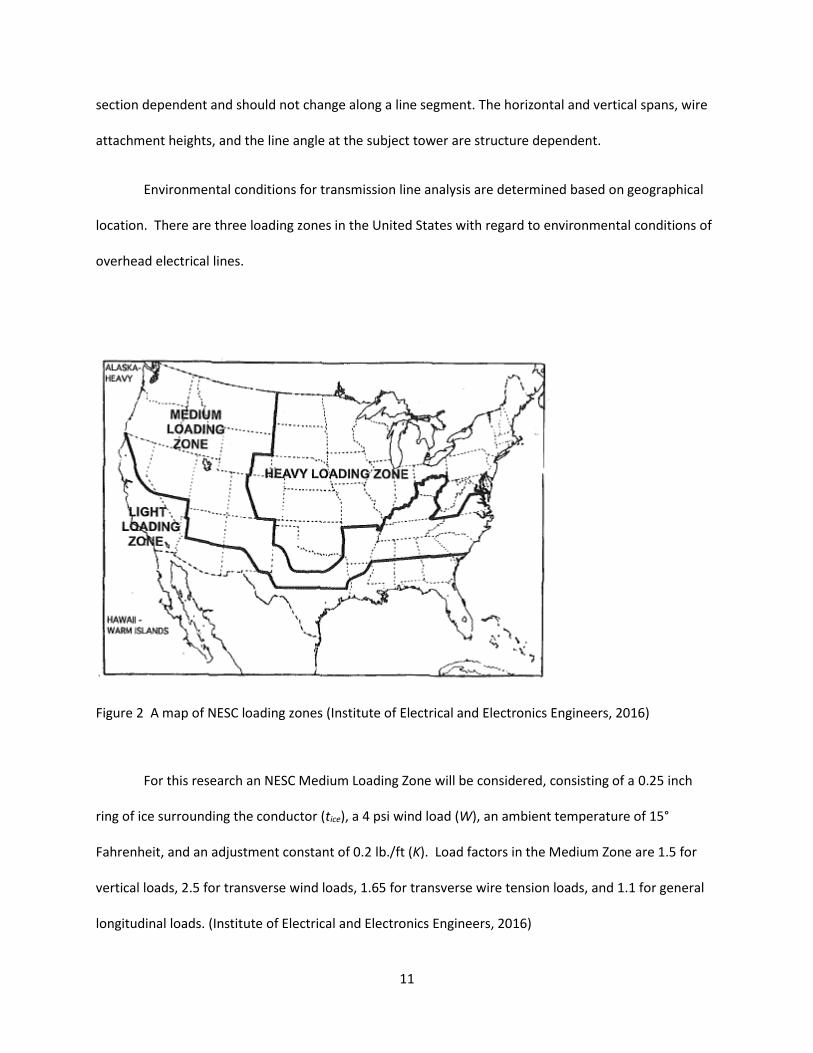
Environmental conditions for transmission line analysis are determined based on geographical
location. There are three loading zones in the United States with regard to environmental conditions of
overhead electrical lines.
Figure 2 A map of NESC loading zones (Institute of Electrical and Electronics Engineers, 2016)
For this research an NESC Medium Loading Zone will be considered, consisting of a 0.25 inch
ring of ice surrounding the conductor (tice), a 4 psi wind load (W), an ambient temperature of 15°
Fahrenheit, and an adjustment constant of 0.2 lb./ft (K). Load factors in the Medium Zone are 1.5 for
vertical loads, 2.5 for transverse wind loads, 1.65 for transverse wire tension loads, and 1.1 for general
longitudinal loads. (Institute of Electrical and Electronics Engineers, 2016)

12
Calculation Procedure
The calculation procedure for the lattice tower analysis described above uses simple statics to
determine the ground-line moment. Calculating the total load due to cable properties, weight, and
environmental conditions is the first step of the calculation procedure. The load due to the wire weight
and the ring of ice that is assumed to form in the NESC Medium Load case is calculated by the equation:
𝐋𝐢𝐜𝐞 = 𝐖𝐂 + 𝛒𝐢𝐜𝐞𝛑
𝟒[(𝐝𝐰𝐢𝐫𝐞 + 𝟐𝐭𝐢𝐜𝐞)
𝟐 − 𝐝𝐰𝐢𝐫𝐞𝟐 ] (2) Equation 2 Ice Load
The load due to the wind on the wire is calculated by the equation:
𝐋𝐰𝐢𝐧𝐝 = 𝑾𝑪 × (𝐝𝐰𝐢𝐫𝐞 + 𝟐𝐭𝐢𝐜𝐞) (3) Equation 3 Wind Load
The total load is then calculated by the equation:
𝐓𝐋 = √𝐋𝐢𝐜𝐞𝟐 + 𝐋𝐰𝐢𝐧𝐝
𝟐 (4) Equation 4 Total Load
The second step is to determine what percentage of the span will be maintained in a broken
wire case. This percentage can be any value between 10% and 90%.
The horizontal and vertical unit loads, the load per linear foot of wire are then calculated by the
equations:
HU =TL×[W(dwire+2tice)]
TL−K (5) Equation 5 Horizontal Unit Load
VU =TL×(W+ρice
π
4[(dwire+2tice)
2−dwire2 ])
TL−K (6) Equation 6 Vertical Unit Load
Overload factors are then used to calculate the Ultimate Loads:
Hult = OLFwindH(HU) + 2(OLFt)T sin θ (7) Equation 7 Horizontal Ulti mate Loa d
Lult = OLFt(T) (8) Equation 8 Longitudinal Ultimate Load
Vult = OLFt(V)VU (9) Equation 9 Vertical Ultimate Load

13
The moment created by each cable set is the calculated by multiplying the ultimate loads by
their respective attachment heights:
MH = Hult × Att (10)Equation 10 Horizontal Ground Line M oment
ML = Lult × Att (11)Equation 11 Longitudi nal Ground Line Mome nt
MV = Vult × Att (12)Equation 12 Vertical Ground Line Mome nt
The moments are summed for each load case in all three directions; longitudinal (along the line),
transverse (orthogonal to the line), and vertical. The compression and tension ground forces are then
derived by decoupling the summed moments based on the width of the tower base.
Original Tower Design
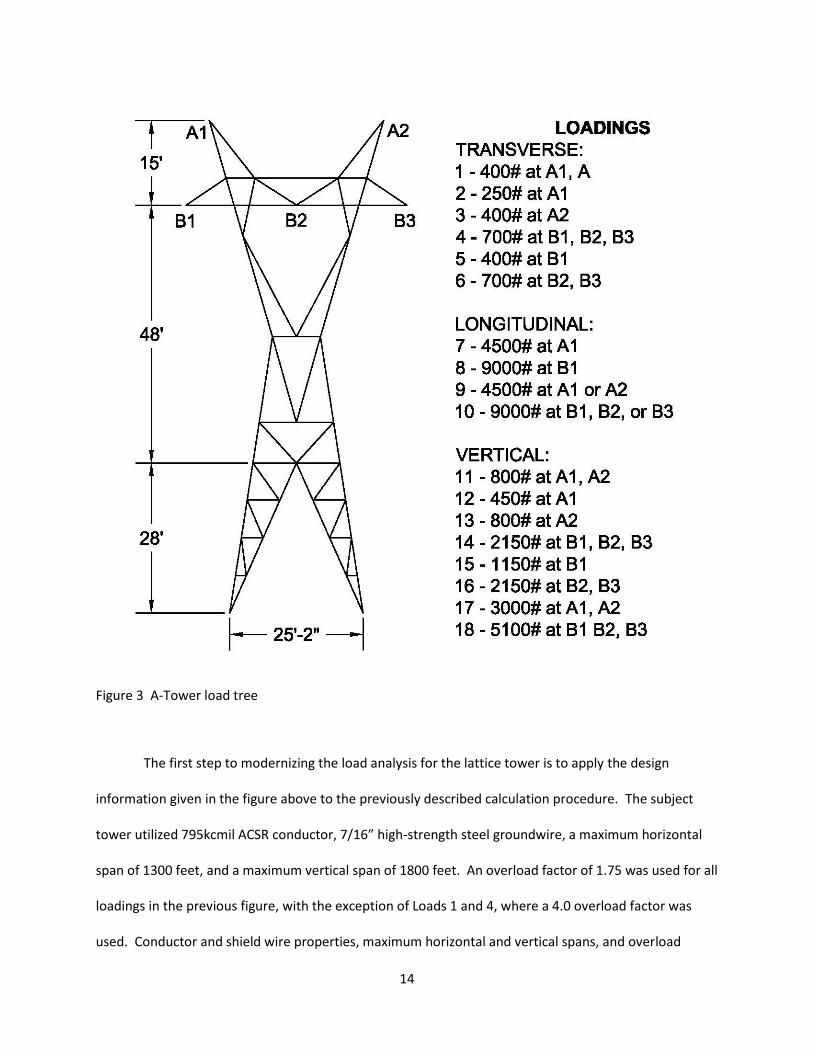
Transmission tower loads are often presented based on combinations of vertical, longitudinal,
and transverse loads at defined load points with specific overload factors. The geometric properties and
design loadings of the single circuit tangent tower that will be used in this study is shown in Figure 3
below. Any single circuit tangent tower could be analyzed using this method and the result would
remain valid.
14
Figure 3 A-Tower load tree
The first step to modernizing the load analysis for the lattice tower is to apply the design
information given in the figure above to the previously described calculation procedure. The subject
tower utilized 795kcmil ACSR conductor, 7/16” high-strength steel groundwire, a maximum horizontal
span of 1300 feet, and a maximum vertical span of 1800 feet. An overload factor of 1.75 was used for all
loadings in the previous figure, with the exception of Loads 1 and 4, where a 4.0 overload factor was
used. Conductor and shield wire properties, maximum horizontal and vertical spans, and overload

15
factors are combined with the NESC Loading Zone to calculate ultimate loads. This study also assumes
multiple load cases or combinations to simulate various real-life situations. These cases include:
• Case I - All wires intact (conductor and shield wire)
o Loads 1, 4, 11, 14
• Case II - One broken conductor (All other wires intact)
o Loads 2, 3, 4, 7, 12, 13, 14
• Case III - One broken shield wire (All other wires intact)
o Loads 1, 5, 6, 8, 11, 15, 16
• Case IV - Heavy Vertical (Icy conditions)
o Loads 17, 18
Once the ultimate loads are obtained, the remainder of the steps can be applied to the lattice
tower geometry, including multiple leg heights, to calculate the maximum moment, compression, and
tensile forces at the ground-line for that specific tower type. The complete As-Designed Calculation for
the A-Tower can be seen in Supplement 1.
Once the as-designed calculation is complete, modern NESC overload factors can then be
applied to calculate the ground-line compression and tension force for any desired combination of
design inputs. These forces can then be compared to the as-designed ground-line forces to determine if
the tower is structurally adequate for a specific load combination.
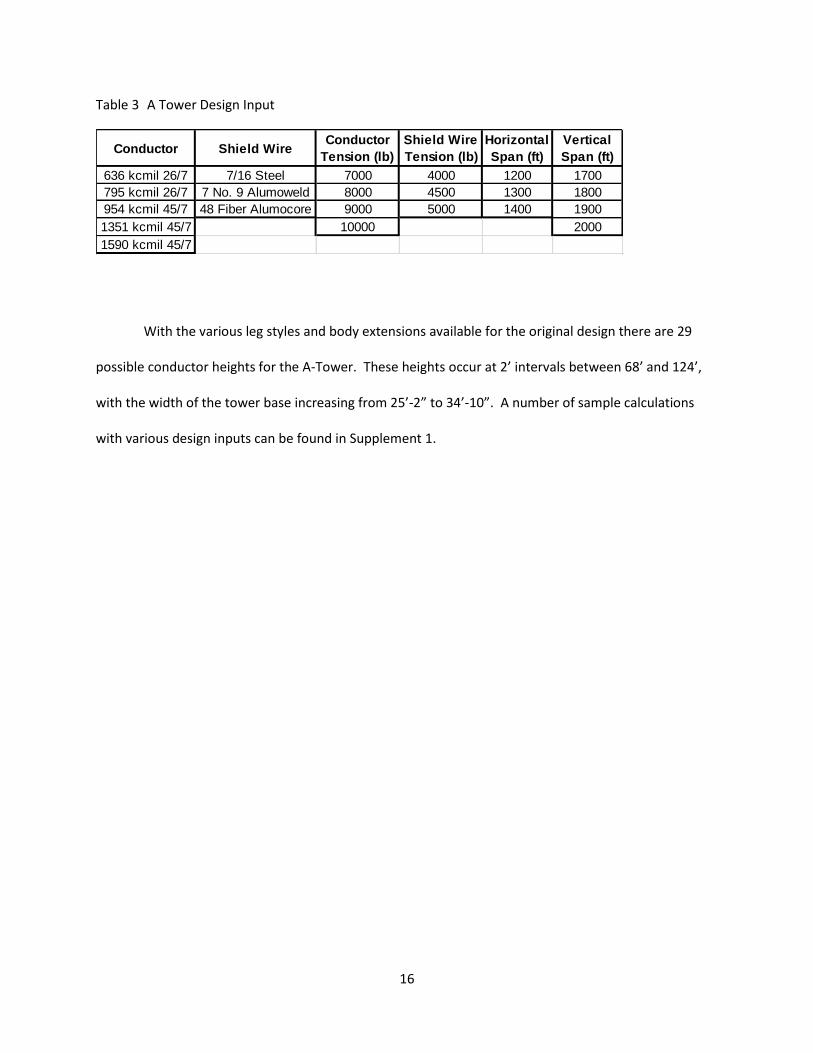
Design Inputs
For the A-Tower the following design inputs were used to create loading combinations for the
modified tower analysis.
16
Table 3 A Tower Design Input
Conductor Shield WireConductor
Tension (lb)
Shield Wire
Tension (lb)
Horizontal
Span (ft)
Vertical
Span (ft)
636 kcmil 26/7 7/16 Steel 7000 4000 1200 1700
795 kcmil 26/7 7 No. 9 Alumoweld 8000 4500 1300 1800
954 kcmil 45/7 48 Fiber Alumocore 9000 5000 1400 1900
1351 kcmil 45/7 10000 2000
1590 kcmil 45/7
With the various leg styles and body extensions available for the original design there are 29
possible conductor heights for the A-Tower. These heights occur at 2’ intervals between 68’ and 124’,
with the width of the tower base increasing from 25’-2” to 34’-10”. A number of sample calculations
with various design inputs can be found in Supplement 1.

17
CHAPTER 4
RESULTS AND ANALYSIS
Results
In total there are 51 design inputs and 62,640 possible design input combinations for the A
Tower. All possible combinations, passing or failing determination, ground-line forces, and controlling
load case can be found in Supplement 2.
General Analysis
The following table shows the number of passing and failing load combinations and the pass
rate when each design input is held constant. The passing rates for each tower height ranged from
90.3% to 96%, increasing from the 68’ tower to the 120’ tower. The highest pass rates, 100%, occurred
when the 636 kCmil conductor input and the 7000 lb. conductor tension input remained constant. The
lowest pass rate, 78.6%, occurred with the heaviest 1590 kCmil conductor. Other low pass rates
included the 10000 lb. conductor tension at 79.9%, the 48 Fiber Alumocore at 88.9%, and the 1400 ft
horizontal span at 89.2%. All other design inputs resulted in passing rates in the 90th percentile when
compared to design ground-line forces.

18
Figure 4 Application output showing the passing rates per design input
Cond Height # Pass # Fail % Pass Conductor Type # Pass # Fail % Pass
68 1950 210 90.28% 636 kcmil 26/7 12528 0 100.00%
70 1965 195 90.97% 795 kcmil 26/7 12522 6 99.95%
72 1974 186 91.39% 954 kcmil 45/7 12492 36 99.71%
74 1983 177 91.81% 1351 kcmil 45/7 11415 1113 91.12%
76 1983 177 91.81% 1590 kcmil 45/7 9849 2679 78.62%
78 1995 165 92.36%
80 2001 159 92.64% Shield Wire Type # Pass # Fail % Pass
82 2007 153 92.92% 7 No. 9 Alumoweld 20355 525 97.49%
84 2010 150 93.06% 7/16 Steel 19881 999 95.22%
86 2016 144 93.33% 48 Fiber Alumocore 18570 2310 88.94%
88 2022 138 93.61%
90 2034 126 94.17% Conductor Tension # Pass # Fail % Pass
92 2043 117 94.58% 7000 15660 0 100.00%
94 2049 111 94.86% 8000 15642 18 99.89%
96 2049 111 94.86% 9000 15000 660 95.79%
98 2049 111 94.86% 10000 12504 3156 79.85%
100 2052 108 95.00%
102 2052 108 95.00% Shield Wire Tension # Pass # Fail % Pass
104 2055 105 95.14% 4000 19602 1278 93.88%
106 2064 96 95.56% 4500 19602 1278 93.88%
108 2064 96 95.56% 5000 19602 1278 93.88%
110 2067 93 95.69%
112 2070 90 95.83% Horizontal Span # Pass # Fail % Pass
114 2073 87 95.97% 1200 20481 399 98.09%
116 2073 87 95.97% 1300 19701 1179 94.35%
118 2073 87 95.97% 1400 18624 2256 89.20%
120 2073 87 95.97%
122 1977 183 91.53% Vertical Span # Pass # Fail % Pass
124 1983 177 91.81% 1700 14997 663 95.77%
1800 14808 852 94.56%
1900 14598 1062 93.22%
2000 14403 1257 91.97%

19
Constant Single Design Input
The next several pages contain pass/fail tables where one of the fifty one design inputs remains
constant while evaluating the design calculation for all combinations of the remaining inputs. Maximum
and minimum design values are presented in this section. Other design values can be found in
Supplement 3.
Conductor Height
For Tables 5 and 6 the conductor height remains constant and pass rates are evaluated and
displayed for all possible design combinations for the 68’ and 124’ Tower. Passing rates for conductor
heights had a tendency to increase as the tower increased in height. This was counter to the result that
was expected and is further discussed later in this study. All conductor heights had multiple 100%
passing combinations with the 636 kCmil conductor input and the 7000 lb. conductor tension input
always passing as described in the previous section. The 795 kCmil conductor and the 954 kCmil
conductor result in a 100% passing rate beginning at the 72’ and the 82’ tower, respectively. The 8000
lb. design tension results in a 100% passing rate starting at the 78’ tower. The shield wire tension
passing rates remain constant for each conductor height, while the passing rates for the horizontal and
vertical spans gradually increase with conductor height.

20
H 68
Conductor Type # Pass # Fail % Pass
636 kCmil 26/7 432 0 100%
795 kCmil 26/7 429 3 99%
954 kCmil 45/7 426 6 99%
1351 kCmil 45/7 360 72 83%
1590 kCmil 45/7 303 129 70%
Shield Wire Type # Pass # Fail % Pass
7 No. 9 Alumoweld 684 36 95%
7/16 Steel 663 57 92%
48 Fiber Alumocore 603 117 84%
Conductor Tension # Pass # Fail % Pass
7000 540 0 100%
8000 537 3 99%
9000 492 48 91%
10000 381 159 71%
Shield Wire Tension # Pass # Fail % Pass
4000 650 70 90%
4500 650 70 90%
5000 650 70 90%
Horizontal Span # Pass # Fail % Pass
1200 693 27 96%
1300 654 66 91%
1400 603 117 84%
Vertical Span # Pass # Fail % Pass
1700 501 39 93%
1800 492 48 91%
1900 483 57 89%
2000 474 66 88%
Figure 5 Application output showing the passing rates for a 68' tower

21
H 124
Conductor Type # Pass # Fail % Pass
636 kCmil 26/7 432 0 100%
795 kCmil 26/7 432 0 100%
954 kCmil 45/7 429 3 99%
1351 kCmil 45/7 372 60 86%
1590 kCmil 45/7 318 114 74%
Shield Wire # Pass # Fail % Pass
7 No. 9 Alumoweld 693 27 96%
7/16 Steel 669 51 93%
48 Fiber Alumocore 621 99 86%
Conductor Tension # Pass # Fail % Pass
7000 540 0 100%
8000 540 0 100%
9000 504 36 93%
10000 399 141 74%
Shield Wire Tension # Pass # Fail % Pass
4000 661 59 92%
4500 661 59 92%
5000 661 59 92%
Horizontal Span # Pass # Fail % Pass
1200 696 24 97%
1300 663 57 92%
1400 624 96 87%
Vertical Span # Pass # Fail % Pass
1700 510 30 94%
1800 501 39 93%
1900 489 51 91%
2000 483 57 89%
Figure 6 Application output showing the passing rates for a 124' tower

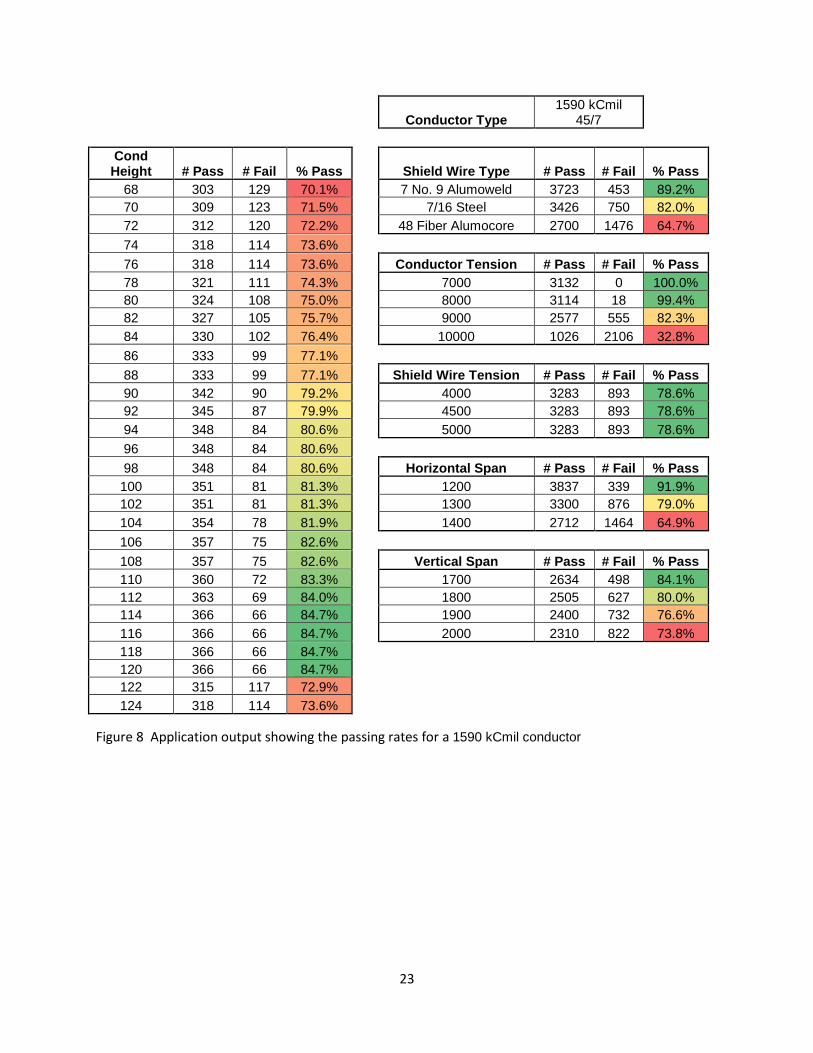
22
Conductor Type
For Figures 7 and 8 the conductor type remains constant and pass rates are evaluated and
displayed for all possible design combinations. As expected, passing rates start at 100% for the lightest
conductor and drop steadily. Except for the combinations where a 7000 lb. conductor tension input is
used, there are no input combinations that give a 100% passing rate with the heaviest conductor.
Conductor Type 636 kCmil 26/7
Cond Height # Pass # Fail % Pass Shield Wire Type # Pass # Fail % Pass
68 432 0 100.0% 7 No. 9 Alumoweld 4176 0 100.0%
70 432 0 100.0% 7/16 Steel 4176 0 100.0%
72 432 0 100.0% 48 Fiber Alumocore 4176 0 100.0%
74 432 0 100.0%
76 432 0 100.0% Conductor Tension # Pass # Fail % Pass
78 432 0 100.0% 7000 3132 0 100.0%
80 432 0 100.0% 8000 3132 0 100.0%
82 432 0 100.0% 9000 3132 0 100.0%
84 432 0 100.0% 10000 3132 0 100.0%
86 432 0 100.0%
88 432 0 100.0% Shield Wire Tension # Pass # Fail % Pass
90 432 0 100.0% 4000 4176 0 100.0%
92 432 0 100.0% 4500 4176 0 100.0%
94 432 0 100.0% 5000 4176 0 100.0%
96 432 0 100.0%
98 432 0 100.0% Horizontal Span # Pass # Fail % Pass
100 432 0 100.0% 1200 4176 0 100.0%
102 432 0 100.0% 1300 4176 0 100.0%
104 432 0 100.0% 1400 4176 0 100.0%
106 432 0 100.0%
108 432 0 100.0% Vertical Span # Pass # Fail % Pass
110 432 0 100.0% 1700 3132 0 100.0%
112 432 0 100.0% 1800 3132 0 100.0%
114 432 0 100.0% 1900 3132 0 100.0%
116 432 0 100.0% 2000 3132 0 100.0%
118 432 0 100.0%
120 432 0 100.0%
122 432 0 100.0%
124 432 0 100.0%
Figure 7 Application output showing the passing rates for a 636 kCmil conductor
23
Conductor Type 1590 kCmil
45/7
Cond Height # Pass # Fail % Pass Shield Wire Type # Pass # Fail % Pass
68 303 129 70.1% 7 No. 9 Alumoweld 3723 453 89.2%
70 309 123 71.5% 7/16 Steel 3426 750 82.0%
72 312 120 72.2% 48 Fiber Alumocore 2700 1476 64.7%
74 318 114 73.6%
76 318 114 73.6% Conductor Tension # Pass # Fail % Pass
78 321 111 74.3% 7000 3132 0 100.0%
80 324 108 75.0% 8000 3114 18 99.4%
82 327 105 75.7% 9000 2577 555 82.3%
84 330 102 76.4% 10000 1026 2106 32.8%
86 333 99 77.1%
88 333 99 77.1% Shield Wire Tension # Pass # Fail % Pass
90 342 90 79.2% 4000 3283 893 78.6%
92 345 87 79.9% 4500 3283 893 78.6%
94 348 84 80.6% 5000 3283 893 78.6%
96 348 84 80.6%
98 348 84 80.6% Horizontal Span # Pass # Fail % Pass
100 351 81 81.3% 1200 3837 339 91.9%
102 351 81 81.3% 1300 3300 876 79.0%
104 354 78 81.9% 1400 2712 1464 64.9%
106 357 75 82.6%
108 357 75 82.6% Vertical Span # Pass # Fail % Pass
110 360 72 83.3% 1700 2634 498 84.1%
112 363 69 84.0% 1800 2505 627 80.0%
114 366 66 84.7% 1900 2400 732 76.6%
116 366 66 84.7% 2000 2310 822 73.8%
118 366 66 84.7%
120 366 66 84.7%
122 315 117 72.9%
124 318 114 73.6%
Figure 8 Application output showing the passing rates for a 1590 kCmil conductor

24
Shield Wire Type
For Figures 9 through 11 the shield wire type remains constant and pass rates are evaluated and
displayed for all possible design combinations. As with the conductor types, the shield wire type passing
rates decrease as the shield wire increases in weight. The fiber optic shield wire results in the lowest
passing rates for this analysis.
Shield Wire Type 7/16 Steel
Cond Height # Pass # Fail % Pass Conductor Type # Pass # Fail % Pass
68 663 57 92.1% 636 kCmil 26/7 4176 0 100.0%
70 666 54 92.5% 795 kCmil 26/7 4176 0 100.0%
72 666 54 92.5% 954 kCmil 45/7 4176 0 100.0%
74 672 48 93.3% 1351 kCmil 45/7 3927 249 94.0%
76 672 48 93.3% 1590 kCmil 45/7 3426 750 82.0%
78 675 45 93.8%
80 675 45 93.8% Conductor Tension # Pass # Fail % Pass
82 675 45 93.8% 7000 5220 0 100.0%
84 678 42 94.2% 8000 5220 0 100.0%
86 684 36 95.0% 9000 5139 81 98.4%
88 684 36 95.0% 10000 4302 918 82.4%
90 687 33 95.4%
92 693 27 96.3% Shield Wire Tension # Pass # Fail % Pass
94 693 27 96.3% 4000 6627 333 95.2%
96 693 27 96.3% 4500 6627 333 95.2%
98 693 27 96.3% 5000 6627 333 95.2%
100 693 27 96.3%
102 693 27 96.3% Horizontal Span # Pass # Fail % Pass
104 696 24 96.7% 1200 6912 48 99.3%
106 699 21 97.1% 1300 6663 297 95.7%
108 699 21 97.1% 1400 6306 654 90.6%
110 699 21 97.1%
112 699 21 97.1% Vertical Span # Pass # Fail % Pass
114 699 21 97.1% 1700 5061 159 97.0%
116 699 21 97.1% 1800 5022 198 96.2%
118 699 21 97.1% 1900 4935 285 94.5%
120 699 21 97.1% 2000 4863 357 93.2%
122 669 51 92.9%
124 669 51 92.9%
Figure 9 Application output showing the passing rates for a 7/16 steel shield wire

25
Shield Wire Type 7 No. 9
Alumoweld
Cond Height # Pass # Fail % Pass Conductor Type # Pass # Fail % Pass
68 684 36 95.0% 636 kCmil 26/7 4176 0 100.0%
70 690 30 95.8% 795 kCmil 26/7 4176 0 100.0%
72 693 27 96.3% 954 kCmil 45/7 4176 0 100.0%
74 693 27 96.3% 1351 kCmil 45/7 4104 72 98.3%
76 693 27 96.3% 1590 kCmil 45/7 3723 453 89.2%
78 693 27 96.3%
80 699 21 97.1% Conductor Tension # Pass # Fail % Pass
82 699 21 97.1% 7000 5220 0 100.0%
84 699 21 97.1% 8000 5220 0 100.0%
86 699 21 97.1% 9000 5217 3 99.9%
88 699 21 97.1% 10000 4698 522 90.0%
90 705 15 97.9%
92 705 15 97.9% Shield Wire Tension # Pass # Fail % Pass
94 705 15 97.9% 4000 6785 175 97.5%
96 705 15 97.9% 4500 6785 175 97.5%
98 705 15 97.9% 5000 6785 175 97.5%
100 708 12 98.3%
102 708 12 98.3% Horizontal Span # Pass # Fail % Pass
104 708 12 98.3% 1200 6960 0 100.0%
106 708 12 98.3% 1300 6840 120 98.3%
108 708 12 98.3% 1400 6555 405 94.2%
110 711 9 98.8%
112 711 9 98.8% Vertical Span # Pass # Fail % Pass
114 711 9 98.8% 1700 5148 72 98.6%
116 711 9 98.8% 1800 5100 120 97.7%
118 711 9 98.8% 1900 5070 150 97.1%
120 711 9 98.8% 2000 5037 183 96.5%
122 690 30 95.8%
124 693 27 96.3%
Figure 10 Application output showing the passing rates for a 7 No. 9 Alumoweld shield wire

26
Shield Wire Type 48 Fiber
Alumocore
Cond Height # Pass # Fail % Pass Conductor Type # Pass # Fail % Pass
68 603 117 83.8% 636 kCmil 26/7 4176 0 100.0%
70 609 111 84.6% 795 kCmil 26/7 4170 6 99.9%
72 615 105 85.4% 954 kCmil 45/7 4140 36 99.1%
74 618 102 85.8% 1351 kCmil 45/7 3384 792 81.0%
76 618 102 85.8% 1590 kCmil 45/7 2700 1476 64.7%
78 627 93 87.1%
80 627 93 87.1% Conductor Tension # Pass # Fail % Pass
82 633 87 87.9% 7000 5220 0 100.0%
84 633 87 87.9% 8000 5202 18 99.7%
86 633 87 87.9% 9000 4644 576 89.0%
88 639 81 88.8% 10000 3504 1716 67.1%
90 642 78 89.2%
92 645 75 89.6% Shield Wire Tension # Pass # Fail % Pass
94 651 69 90.4% 4000 6190 770 88.9%
96 651 69 90.4% 4500 6190 770 88.9%
98 651 69 90.4% 5000 6190 770 88.9%
100 651 69 90.4%
102 651 69 90.4% Horizontal Span # Pass # Fail % Pass
104 651 69 90.4% 1200 6609 351 95.0%
106 657 63 91.3% 1300 6198 762 89.1%
108 657 63 91.3% 1400 5763 1197 82.8%
110 657 63 91.3%
112 660 60 91.7% Vertical Span # Pass # Fail % Pass
114 663 57 92.1% 1700 4788 432 91.7%
116 663 57 92.1% 1800 4686 534 89.8%
118 663 57 92.1% 1900 4593 627 88.0%
120 663 57 92.1% 2000 4503 717 86.3%
122 618 102 85.8%
124 621 99 86.3%
Figure 11 Application output showing the passing rates for a 48 fiber Alumocore shield wire

27
Conductor Tension
For Figures 12 and 13 the conductor tension remains constant and pass rates are evaluated and
displayed for all possible design combinations. As with the previous inputs, the passing rates decrease as
the conductor tension increases. Other than the 636 kCmil conductor, there are no 100% passing rates
with the highest conductor tension.
Conductor Tension 7000
Cond Height # Pass # Fail % Pass Conductor Type # Pass # Fail % Pass
68 540 0 100.0% 636 kCmil 26/7 3132 0 100.0%
70 540 0 100.0% 795 kCmil 26/7 3132 0 100.0%
72 540 0 100.0% 954 kCmil 45/7 3132 0 100.0%
74 540 0 100.0% 1351 kCmil 45/7 3132 0 100.0%
76 540 0 100.0% 1590 kCmil 45/7 3132 0 100.0%
78 540 0 100.0%
80 540 0 100.0% Shield Wire Type # Pass # Fail % Pass
82 540 0 100.0% 7 No. 9 Alumoweld 5220 0 100.0%
84 540 0 100.0% 7/16 Steel 5220 0 100.0%
86 540 0 100.0% 48 Fiber Alumocore 5220 0 100.0%
88 540 0 100.0%
90 540 0 100.0% Shield Wire Tension # Pass # Fail % Pass
92 540 0 100.0% 4000 5220 0 100.0%
94 540 0 100.0% 4500 5220 0 100.0%
96 540 0 100.0% 5000 5220 0 100.0%
98 540 0 100.0%
100 540 0 100.0% Horizontal Span # Pass # Fail % Pass
102 540 0 100.0% 1200 5220 0 100.0%
104 540 0 100.0% 1300 5220 0 100.0%
106 540 0 100.0% 1400 5220 0 100.0%
108 540 0 100.0%
110 540 0 100.0% Vertical Span # Pass # Fail % Pass
112 540 0 100.0% 1700 3915 0 100.0%
114 540 0 100.0% 1800 3915 0 100.0%
116 540 0 100.0% 1900 3915 0 100.0%
118 540 0 100.0% 2000 3915 0 100.0%
120 540 0 100.0%
122 540 0 100.0%
124 540 0 100.0%
Figure 12 Application output showing the passing rates for a 7000 lb. conductor tension

28
Conductor Tension 10000
Cond Height # Pass # Fail % Pass Conductor Type # Pass # Fail % Pass
68 381 159 70.6% 636 kCmil 26/7 3132 0 100.0%
70 390 150 72.2% 795 kCmil 26/7 3126 6 99.8%
72 396 144 73.3% 954 kCmil 45/7 3096 36 98.9%
74 402 138 74.4% 1351 kCmil 45/7 2124 1008 67.8%
76 402 138 74.4% 1590 kCmil 45/7 1026 2106 32.8%
78 408 132 75.6%
80 414 126 76.7% Shield Wire Type # Pass # Fail % Pass
82 417 123 77.2% 7 No. 9 Alumoweld 4698 522 90.0%
84 417 123 77.2% 7/16 Steel 4302 918 82.4%
86 423 117 78.3% 48 Fiber Alumocore 3504 1716 67.1%
88 426 114 78.9%
90 435 105 80.6% Shield Wire Tension # Pass # Fail % Pass
92 441 99 81.7% 4000 4168 1052 79.8%
94 444 96 82.2% 4500 4168 1052 79.8%
96 444 96 82.2% 5000 4168 1052 79.8%
98 444 96 82.2%
100 447 93 82.8% Horizontal Span # Pass # Fail % Pass
102 447 93 82.8% 1200 4821 399 92.4%
104 450 90 83.3% 1300 4176 1044 80.0%
106 456 84 84.4% 1400 3507 1713 67.2%
108 456 84 84.4%
110 459 81 85.0% Vertical Span # Pass # Fail % Pass
112 462 78 85.6% 1700 3336 579 85.2%
114 462 78 85.6% 1800 3207 708 81.9%
116 462 78 85.6% 1900 3045 870 77.8%
118 462 78 85.6% 2000 2916 999 74.5%
120 462 78 85.6%
122 396 144 73.3%
124 399 141 73.9%
Figure 13 Application output showing the passing rates for a 10000 lb. conductor tension

29
Shield Wire Tension
For Figures 14 through 16 the shield wire tension remains constant and pass rates are evaluated
and displayed for all possible design combinations. As with the conductor tension, the passing rates
decrease as the shield wire tension increases. At the highest tension, only the 636 and 795 kCmil
conductor have a 100% pass rate.
Shield Wire Tension 4000
Cond Height # Pass # Fail % Pass Conductor Type # Pass # Fail % Pass
68 650 70 90% 636 kCmil 26/7 4176 0 100%
70 655 65 91% 795 kCmil 26/7 4174 2 100%
72 658 62 91% 954 kCmil 45/7 4164 12 100%
74 661 59 92% 1351 kCmil 45/7 3805 371 91%
76 661 59 92% 1590 kCmil 45/7 3283 893 79%
78 665 55 92%
80 667 53 93% Shield Wire Type # Pass # Fail % Pass
82 669 51 93% 7 No. 9 Alumoweld 6785 175 97%
84 670 50 93% 7/16 Steel 6627 333 95%
86 672 48 93% 48 Fiber Alumocore 6190 770 89%
88 674 46 94%
90 678 42 94% Conductor Tension # Pass # Fail % Pass
92 681 39 95% 7000 5220 0 100%
94 683 37 95% 8000 5214 6 100%
96 683 37 95% 9000 5000 220 96%
98 683 37 95% 10000 4168 1052 80%
100 684 36 95%
102 684 36 95% Horizontal Span # Pass # Fail % Pass
104 685 35 95% 1200 6827 133 98%
106 688 32 96% 1300 6567 393 94%
108 688 32 96% 1400 6208 752 89%
110 689 31 96%
112 690 30 96% Vertical Span # Pass # Fail % Pass
114 691 29 96% 1700 4999 221 96%
116 691 29 96% 1800 4936 284 95%
118 691 29 96% 1900 4866 354 93%
120 691 29 96% 2000 4801 419 92%
122 659 61 92%
124 661 59 92%
Figure 14 Application output showing the passing rates for a 4000 lb. shield wire tension

30
Shield Wire Tension 4500
Cond Height # Pass # Fail % Pass Conductor Type # Pass # Fail % Pass
68 650 70 90% 636 kCmil 26/7 4176 0 100%
70 655 65 91% 795 kCmil 26/7 4174 2 100%
72 658 62 91% 954 kCmil 45/7 4164 12 100%
74 661 59 92% 1351 kCmil 45/7 3805 371 91%
76 661 59 92% 1590 kCmil 45/7 3283 893 79%
78 665 55 92%
80 667 53 93% Shield Wire Type # Pass # Fail % Pass
82 669 51 93% 7 No. 9 Alumoweld 6785 175 97%
84 670 50 93% 7/16 Steel 6627 333 95%
86 672 48 93% 48 Fiber Alumocore 6190 770 89%
88 674 46 94%
90 678 42 94% Conductor Tension # Pass # Fail % Pass
92 681 39 95% 7000 5220 0 100%
94 683 37 95% 8000 5214 6 100%
96 683 37 95% 9000 5000 220 96%
98 683 37 95% 10000 4168 1052 80%
100 684 36 95%
102 684 36 95% Horizontal Span # Pass # Fail % Pass
104 685 35 95% 1200 6827 133 98%
106 688 32 96% 1300 6567 393 94%
108 688 32 96% 1400 6208 752 89%
110 689 31 96%
112 690 30 96% Vertical Span # Pass # Fail % Pass
114 691 29 96% 1700 4999 221 96%
116 691 29 96% 1800 4936 284 95%
118 691 29 96% 1900 4866 354 93%
120 691 29 96% 2000 4801 419 92%
122 659 61 92%
124 661 59 92%
Figure 15 Application output showing the passing rates for a 4500 lb. shield wire tension

31
Shield Wire Tension 5000
Cond Height # Pass # Fail % Pass Conductor Type # Pass # Fail % Pass
68 650 70 90% 636 kCmil 26/7 4176 0 100%
70 655 65 91% 795 kCmil 26/7 4174 2 100%
72 658 62 91% 954 kCmil 45/7 4164 12 100%
74 661 59 92% 1351 kCmil 45/7 3805 371 91%
76 661 59 92% 1590 kCmil 45/7 3283 893 79%
78 665 55 92%
80 667 53 93% Shield Wire Type # Pass # Fail % Pass
82 669 51 93% 7 No. 9 Alumoweld 6785 175 97%
84 670 50 93% 7/16 Steel 6627 333 95%
86 672 48 93% 48 Fiber Alumocore 6190 770 89%
88 674 46 94%
90 678 42 94% Conductor Tension # Pass # Fail % Pass
92 681 39 95% 7000 5220 0 100%
94 683 37 95% 8000 5214 6 100%
96 683 37 95% 9000 5000 220 96%
98 683 37 95% 10000 4168 1052 80%
100 684 36 95%
102 684 36 95% Horizontal Span # Pass # Fail % Pass
104 685 35 95% 1200 6827 133 98%
106 688 32 96% 1300 6567 393 94%
108 688 32 96% 1400 6208 752 89%
110 689 31 96%
112 690 30 96% Vertical Span # Pass # Fail % Pass
114 691 29 96% 1700 4999 221 96%
116 691 29 96% 1800 4936 284 95%
118 691 29 96% 1900 4866 354 93%
120 691 29 96% 2000 4801 419 92%
122 659 61 92%
124 661 59 92%
Figure 16 Application output showing the passing rates for a 5000 lb. shield wire tension

32
Horizontal Span
For Figures 17 through 19 the horizontal span remains constant and pass rates are evaluated
and displayed for all possible design combinations. The horizontal span has a large effect on the passing
rates of each design input, decreasing the rate by a considerable percentage when increased. At the
longest horizontal span, only the 636 kCmil conductor has a 100% pass rate.
Horizontal Span 1200
Cond Height # Pass # Fail % Pass Conductor Type # Pass # Fail % Pass
68 693 27 96.3% 636 kCmil 26/7 4176 0 100.0%
70 696 24 96.7% 795 kCmil 26/7 4176 0 100.0%
72 696 24 96.7% 954 kCmil 45/7 4176 0 100.0%
74 699 21 97.1% 1351 kCmil 45/7 4116 60 98.6%
76 699 21 97.1% 1590 kCmil 45/7 3837 339 91.9%
78 702 18 97.5%
80 702 18 97.5% Shield Wire Type # Pass # Fail % Pass
82 702 18 97.5% 7 No. 9 Alumoweld 6960 0 100.0%
84 702 18 97.5% 7/16 Steel 6912 48 99.3%
86 705 15 97.9% 48 Fiber Alumocore 6609 351 95.0%
88 708 12 98.3%
90 708 12 98.3% Conductor Tension # Pass # Fail % Pass
92 708 12 98.3% 7000 5220 0 100.0%
94 711 9 98.8% 8000 5220 0 100.0%
96 711 9 98.8% 9000 5220 0 100.0%
98 711 9 98.8% 10000 4821 399 92.4%
100 711 9 98.8%
102 711 9 98.8% Shield Wire Tension # Pass # Fail % Pass
104 711 9 98.8% 4000 6827 133 98.1%
106 711 9 98.8% 4500 6827 133 98.1%
108 711 9 98.8% 5000 6827 133 98.1%
110 711 9 98.8%
112 714 6 99.2% Vertical Span # Pass # Fail % Pass
114 714 6 99.2% 1700 5175 45 99.1%
116 714 6 99.2% 1800 5145 75 98.6%
118 714 6 99.2% 1900 5097 123 97.6%
120 714 6 99.2% 2000 5064 156 97.0%
122 696 24 96.7%
124 696 24 96.7%
Figure 17 Application output showing the passing rates for a 1200’ horizontal span

33
Horizontal Span 1300
Cond Height # Pass # Fail % Pass Conductor Type # Pass # Fail % Pass
68 654 66 90.8% 636 kCmil 26/7 4176 0 100.0%
70 660 60 91.7% 795 kCmil 26/7 4176 0 100.0%
72 663 57 92.1% 954 kCmil 45/7 4176 0 100.0%
74 663 57 92.1% 1351 kCmil 45/7 3873 303 92.7%
76 663 57 92.1% 1590 kCmil 45/7 3300 876 79.0%
78 666 54 92.5%
80 669 51 92.9% Shield Wire Type # Pass # Fail % Pass
82 672 48 93.3% 7 No. 9 Alumoweld 6840 120 98.3%
84 672 48 93.3% 7/16 Steel 6663 297 95.7%
86 672 48 93.3% 48 Fiber Alumocore 6198 762 89.1%
88 672 48 93.3%
90 681 39 94.6% Conductor Tension # Pass # Fail % Pass
92 684 36 95.0% 7000 5220 0 100.0%
94 684 36 95.0% 8000 5220 0 100.0%
96 684 36 95.0% 9000 5085 135 97.4%
98 684 36 95.0% 10000 4176 1044 80.0%
100 687 33 95.4%
102 687 33 95.4% Shield Wire Tension # Pass # Fail % Pass
104 690 30 95.8% 4000 6567 393 94.4%
106 696 24 96.7% 4500 6567 393 94.4%
108 696 24 96.7% 5000 6567 393 94.4%
110 696 24 96.7%
112 696 24 96.7% Vertical Span # Pass # Fail % Pass
114 696 24 96.7% 1700 5043 177 96.6%
116 696 24 96.7% 1800 4959 261 95.0%
118 696 24 96.7% 1900 4878 342 93.4%
120 696 24 96.7% 2000 4821 399 92.4%
122 663 57 92.1%
124 663 57 92.1%
Figure 18 Application output showing the passing rates for a 1300’ horizontal span

34
Horizontal Span 1400
Cond Height # Pass # Fail % Pass Conductor Type # Pass # Fail % Pass
68 603 117 83.8% 636 kCmil 26/7 4176 0 100.0%
70 609 111 84.6% 795 kCmil 26/7 4170 6 99.9%
72 615 105 85.4% 954 kCmil 45/7 4140 36 99.1%
74 621 99 86.3% 1351 kCmil 45/7 3426 750 82.0%
76 621 99 86.3% 1590 kCmil 45/7 2712 1464 64.9%
78 627 93 87.1%
80 630 90 87.5% Shield Wire Type # Pass # Fail % Pass
82 633 87 87.9% 7 No. 9 Alumoweld 6555 405 94.2%
84 636 84 88.3% 7/16 Steel 6306 654 90.6%
86 639 81 88.8% 48 Fiber Alumocore 5763 1197 82.8%
88 642 78 89.2%
90 645 75 89.6% Conductor Tension # Pass # Fail % Pass
92 651 69 90.4% 7000 5220 0 100.0%
94 654 66 90.8% 8000 5202 18 99.7%
96 654 66 90.8% 9000 4695 525 89.9%
98 654 66 90.8% 10000 3507 1713 67.2%
100 654 66 90.8%
102 654 66 90.8% Shield Wire Tension # Pass # Fail % Pass
104 654 66 90.8% 4000 6208 752 89.2%
106 657 63 91.3% 4500 6208 752 89.2%
108 657 63 91.3% 5000 6208 752 89.2%
110 660 60 91.7%
112 660 60 91.7% Vertical Span # Pass # Fail % Pass
114 663 57 92.1% 1700 4779 441 91.6%
116 663 57 92.1% 1800 4704 516 90.1%
118 663 57 92.1% 1900 4623 597 88.6%
120 663 57 92.1% 2000 4518 702 86.6%
122 618 102 85.8%
124 624 96 86.7%
Figure 19 Application output showing the passing rates for a 1400’ horizontal span
Vertical Span
For Figures 20 through 23 the horizontal span remains constant and pass rates are evaluated
and displayed for all possible design combinations. Vertical span has less of an effect on the passing
rates when compared to horizontal span. At the longest span, only the 636 kCmil conductor has a 100%
pass rate.

35
Vertical Span 1700
Cond Height # Pass # Fail % Pass Conductor Type # Pass # Fail % Pass
68 501 39 92.8% 636 kCmil 26/7 3132 0 100.0%
70 507 33 93.9% 795 kCmil 26/7 3132 0 100.0%
72 510 30 94.4% 954 kCmil 45/7 3132 0 100.0%
74 510 30 94.4% 1351 kCmil 45/7 2967 165 94.7%
76 510 30 94.4% 1590 kCmil 45/7 2634 498 84.1%
78 510 30 94.4%
80 510 30 94.4% Shield Wire Type # Pass # Fail % Pass
82 510 30 94.4% 7 No. 9 Alumoweld 5148 72 98.6%
84 510 30 94.4% 7/16 Steel 5061 159 97.0%
86 513 27 95.0% 48 Fiber Alumocore 4788 432 91.7%
88 513 27 95.0%
90 516 24 95.6% Conductor Tension # Pass # Fail % Pass
92 519 21 96.1% 7000 3915 0 100.0%
94 522 18 96.7% 8000 3915 0 100.0%
96 522 18 96.7% 9000 3831 84 97.9%
98 522 18 96.7% 10000 3336 579 85.2%
100 522 18 96.7%
102 522 18 96.7% Shield Wire Tension # Pass # Fail % Pass
104 522 18 96.7% 4000 4999 221 95.8%
106 522 18 96.7% 4500 4999 221 95.8%
108 522 18 96.7% 5000 4999 221 95.8%
110 525 15 97.2%
112 525 15 97.2% Horizontal Span # Pass # Fail % Pass
114 528 12 97.8% 1200 5175 45 99.1%
116 528 12 97.8% 1300 5043 177 96.6%
118 528 12 97.8% 1400 4779 441 91.6%
120 528 12 97.8%
122 510 30 94.4%
124 510 30 94.4%
Figure 20 Application output showing the passing rates for a 1700’ vertical span

36
Vertical Span 1800
Cond Height # Pass # Fail % Pass Conductor Type # Pass # Fail % Pass
68 492 48 91.1% 636 kCmil 26/7 3132 0 100.0%
70 495 45 91.7% 795 kCmil 26/7 3132 0 100.0%
72 498 42 92.2% 954 kCmil 45/7 3132 0 100.0%
74 501 39 92.8% 1351 kCmil 45/7 2907 225 92.8%
76 501 39 92.8% 1590 kCmil 45/7 2505 627 80.0%
78 504 36 93.3%
80 507 33 93.9% Shield Wire Type # Pass # Fail % Pass
82 510 30 94.4% 7 No. 9 Alumoweld 5100 120 97.7%
84 510 30 94.4% 7/16 Steel 5022 198 96.2%
86 510 30 94.4% 48 Fiber Alumocore 4686 534 89.8%
88 510 30 94.4%
90 510 30 94.4% Conductor Tension # Pass # Fail % Pass
92 513 27 95.0% 7000 3915 0 100.0%
94 513 27 95.0% 8000 3915 0 100.0%
96 513 27 95.0% 9000 3771 144 96.3%
98 513 27 95.0% 10000 3207 708 81.9%
100 513 27 95.0%
102 513 27 95.0% Shield Wire Tension # Pass # Fail % Pass
104 516 24 95.6% 4000 4936 284 94.6%
106 519 21 96.1% 4500 4936 284 94.6%
108 519 21 96.1% 5000 4936 284 94.6%
110 519 21 96.1%
112 522 18 96.7% Horizontal Span # Pass # Fail % Pass
114 522 18 96.7% 1200 5145 75 98.6%
116 522 18 96.7% 1300 4959 261 95.0%
118 522 18 96.7% 1400 4704 516 90.1%
120 522 18 96.7%
122 498 42 92.2%
124 501 39 92.8%
Figure 21 Application output showing the passing rates for a 1800’ vertical span

37
Vertical Span 1900
Cond Height # Pass # Fail % Pass Conductor Type # Pass # Fail % Pass
68 483 57 89.4% 636 kCmil 26/7 3132 0 100.0%
70 486 54 90.0% 795 kCmil 26/7 3132 0 100.0%
72 486 54 90.0% 954 kCmil 45/7 3123 9 99.7%
74 492 48 91.1% 1351 kCmil 45/7 2811 321 89.8%
76 492 48 91.1% 1590 kCmil 45/7 2400 732 76.6%
78 495 45 91.7%
80 498 42 92.2% Shield Wire Type # Pass # Fail % Pass
82 498 42 92.2% 7 No. 9 Alumoweld 5070 150 97.1%
84 501 39 92.8% 7/16 Steel 4935 285 94.5%
86 501 39 92.8% 48 Fiber Alumocore 4593 627 88.0%
88 504 36 93.3%
90 510 30 94.4% Conductor Tension # Pass # Fail % Pass
92 510 30 94.4% 7000 3915 0 100.0%
94 510 30 94.4% 8000 3915 0 100.0%
96 510 30 94.4% 9000 3723 192 95.1%
98 510 30 94.4% 10000 3045 870 77.8%
100 510 30 94.4%
102 510 30 94.4% Shield Wire Tension # Pass # Fail % Pass
104 510 30 94.4% 4000 4866 354 93.2%
106 513 27 95.0% 4500 4866 354 93.2%
108 513 27 95.0% 5000 4866 354 93.2%
110 513 27 95.0%
112 513 27 95.0% Horizontal Span # Pass # Fail % Pass
114 513 27 95.0% 1200 5097 123 97.6%
116 513 27 95.0% 1300 4878 342 93.4%
118 513 27 95.0% 1400 4623 597 88.6%
120 513 27 95.0%
122 489 51 90.6%
124 489 51 90.6%
Figure 22 Application output showing the passing rates for a 1900’ vertical span

38
Vertical Span 2000
Cond Height # Pass # Fail % Pass Conductor Type # Pass # Fail % Pass
68 474 66 87.8% 636 kCmil 26/7 3132 0 100.0%
70 477 63 88.3% 795 kCmil 26/7 3126 6 99.8%
72 480 60 88.9% 954 kCmil 45/7 3105 27 99.1%
74 480 60 88.9% 1351 kCmil 45/7 2730 402 87.2%
76 480 60 88.9% 1590 kCmil 45/7 2310 822 73.8%
78 486 54 90.0%
80 486 54 90.0% Shield Wire Type # Pass # Fail % Pass
82 489 51 90.6% 7 No. 9 Alumoweld 5037 183 96.5%
84 489 51 90.6% 7/16 Steel 4863 357 93.2%
86 492 48 91.1% 48 Fiber Alumocore 4503 717 86.3%
88 495 45 91.7%
90 498 42 92.2% Conductor Tension # Pass # Fail % Pass
92 501 39 92.8% 7000 3915 0 100.0%
94 504 36 93.3% 8000 3897 18 99.5%
96 504 36 93.3% 9000 3675 240 93.9%
98 504 36 93.3% 10000 2916 999 74.5%
100 507 33 93.9%
102 507 33 93.9% Shield Wire Tension # Pass # Fail % Pass
104 507 33 93.9% 4000 4801 419 92.0%
106 510 30 94.4% 4500 4801 419 92.0%
108 510 30 94.4% 5000 4801 419 92.0%
110 510 30 94.4%
112 510 30 94.4% Horizontal Span # Pass # Fail % Pass
114 510 30 94.4% 1200 5064 156 97.0%
116 510 30 94.4% 1300 4821 399 92.4%
118 510 30 94.4% 1400 4518 702 86.6%
120 510 30 94.4%
122 480 60 88.9%
124 483 57 89.4%
Figure 23 Application output showing the passing rates for a 2000’ vertical span

39
Usage Percentage Per Design Input
The following data illustrate the percent of allowable ground-line usage for all conductor heights
with a single variable design input while all other design inputs remain constant. Unless otherwise
noted, the following standard design inputs values were used for this analysis.
• 1351 kCmil 45/7 ACSR Conductor
• 10,000 lb. Conductor Tension
• 7/16” Steel Shield Wire
• 4,500 lb. Shield Wire Tension
• 1300 ft Horizontal Span
• 1800 ft Vertical Span
Table 4 Usage Percentage per Conductor Type
H 636 kCmil 26/7 795 kCmil 26/7 954 kCmil 45/7 1351 kCmil 45/7 1590 kCmil 45/7
68 89.87% 92.82% 93.64% 99.41% 102.65%
70 89.68% 92.62% 93.45% 99.22% 102.45%
72 89.50% 92.44% 93.27% 99.03% 102.26%
74 89.33% 92.27% 93.10% 98.85% 102.08%
76 89.17% 92.11% 92.93% 98.69% 101.91%
78 89.02% 91.96% 92.78% 98.53% 101.75%
80 88.88% 91.82% 92.64% 98.38% 101.60%
82 88.75% 91.68% 92.50% 98.24% 101.45%
84 88.62% 91.55% 92.37% 98.10% 101.32%
86 88.50% 91.43% 92.24% 97.97% 101.19%
88 88.38% 91.31% 92.12% 97.85% 101.06%
90 87.98% 90.90% 91.71% 97.43% 100.63%
92 87.88% 90.80% 91.61% 97.32% 100.52%
94 87.79% 90.71% 91.52% 97.22% 100.42%
96 87.70% 90.61% 91.42% 97.13% 100.33%
98 87.61% 90.53% 91.34% 97.04% 100.23%
100 87.53% 90.44% 91.25% 96.95% 100.15%
102 87.45% 90.36% 91.17% 96.87% 100.06%
104 87.37% 90.29% 91.09% 96.79% 99.98%
106 87.20% 90.11% 90.91% 96.60% 99.79%
108 87.13% 90.04% 90.84% 96.53% 99.72%
110 87.07% 89.97% 90.77% 96.46% 99.65%
112 87.00% 89.91% 90.71% 96.39% 99.58%
114 86.94% 89.84% 90.65% 96.33% 99.51%
116 86.88% 89.78% 90.59% 96.27% 99.45%
118 86.83% 89.73% 90.53% 96.21% 99.39%
120 86.77% 89.67% 90.47% 96.15% 99.33%
122 89.44% 92.40% 93.23% 99.01% 102.25%
124 89.34% 92.30% 93.13% 98.90% 102.14%

40
Table 5 Usage Percentage per Shield Wire Type
H 7/16 Steel 7 No. 9
Alumoweld 48 Fiber
Alumocore
68 99.41% 97.69% 103.00%
70 99.22% 97.50% 102.78%
72 99.03% 97.32% 102.57%
74 98.85% 97.15% 102.38%
76 98.69% 96.99% 102.20%
78 98.53% 96.83% 102.02%
80 98.38% 96.69% 101.86%
82 98.24% 96.55% 101.71%
84 98.10% 96.42% 101.56%
86 97.97% 96.30% 101.42%
88 97.85% 96.18% 101.28%
90 97.43% 95.76% 100.84%
92 97.32% 95.66% 100.72%
94 97.22% 95.56% 100.62%
96 97.13% 95.47% 100.51%
98 97.04% 95.38% 100.41%
100 96.95% 95.30% 100.32%
102 96.87% 95.22% 100.22%
104 96.79% 95.14% 100.14%
106 96.60% 94.96% 99.94%
108 96.53% 94.89% 99.86%
110 96.46% 94.82% 99.78%
112 96.39% 94.76% 99.71%
114 96.33% 94.69% 99.64%
116 96.27% 94.63% 99.57%
118 96.21% 94.58% 99.51%
120 96.15% 94.52% 99.44%
122 99.01% 97.36% 102.38%
124 98.90% 97.25% 102.27%

41
Table 6 Usage Percentage per Conductor Tension
H 7000 8000 9000 10000
68 87.37% 92.46% 97.56% 102.65%
70 87.19% 92.28% 97.36% 102.45%
72 87.03% 92.10% 97.18% 102.26%
74 86.87% 91.94% 97.01% 102.08%
76 86.73% 91.79% 96.85% 101.91%
78 86.59% 91.64% 96.69% 101.75%
80 86.46% 91.50% 96.55% 101.60%
82 86.33% 91.37% 96.41% 101.45%
84 86.21% 91.25% 96.28% 101.32%
86 86.10% 91.13% 96.16% 101.19%
88 85.99% 91.02% 96.04% 101.06%
90 85.63% 90.63% 95.63% 100.63%
92 85.54% 90.53% 95.53% 100.52%
94 85.45% 90.44% 95.43% 100.42%
96 85.37% 90.35% 95.34% 100.33%
98 85.29% 90.27% 95.25% 100.23%
100 85.21% 90.19% 95.17% 100.15%
102 85.14% 90.11% 95.09% 100.06%
104 85.07% 90.04% 95.01% 99.98%
106 84.91% 89.87% 94.83% 99.79%
108 84.84% 89.80% 94.76% 99.72%
110 84.78% 89.74% 94.69% 99.65%
112 84.72% 89.68% 94.63% 99.58%
114 84.67% 89.62% 94.57% 99.51%
116 84.61% 89.56% 94.51% 99.45%
118 84.56% 89.50% 94.45% 99.39%
120 84.51% 89.45% 94.39% 99.33%
122 86.92% 92.03% 97.14% 102.25%
124 86.83% 91.93% 97.04% 102.14%
For this analysis, a 1590 kCmil 45/7 ACSR Conductor was used.

42
Table 7 Usage Percentage per Shield Wire Tension
H 4000 4500 5000
68 87.72% 87.72% 87.72%
70 87.54% 87.54% 87.54%
72 87.37% 87.37% 87.37%
74 87.21% 87.21% 87.21%
76 87.05% 87.05% 87.05%
78 86.91% 86.91% 86.91%
80 86.77% 86.77% 86.77%
82 86.64% 86.64% 86.64%
84 86.52% 86.52% 86.52%
86 86.40% 86.40% 86.40%
88 86.29% 86.29% 86.29%
90 85.90% 85.90% 85.90%
92 85.81% 85.81% 85.81%
94 85.72% 85.72% 85.72%
96 85.63% 85.63% 85.63%
98 85.54% 85.54% 85.54%
100 85.46% 85.46% 85.46%
102 85.39% 85.39% 85.39%
104 85.31% 85.31% 85.31%
106 85.15% 85.15% 85.15%
108 85.08% 85.08% 85.08%
110 85.02% 85.02% 85.02%
112 84.95% 84.95% 84.95%
114 84.89% 84.89% 84.89%
116 84.84% 84.84% 84.84%
118 84.78% 84.78% 84.78%
120 84.73% 84.73% 84.73%
122 87.29% 87.29% 87.29%
124 87.19% 87.19% 87.19%
For this analysis, a 795 kCmil 45/7 ACSR Conductor with a 9000 lb. design tension was used.

43
Table 8 Usage Percentage per Horizontal Span
H 1200 1300 1400
68 96.66% 99.41% 102.17%
70 96.46% 99.22% 101.97%
72 96.29% 99.03% 101.77%
74 96.12% 98.85% 101.59%
76 95.96% 98.69% 101.41%
78 95.81% 98.53% 101.25%
80 95.66% 98.38% 101.09%
82 95.53% 98.24% 100.95%
84 95.40% 98.10% 100.81%
86 95.27% 97.97% 100.67%
88 95.16% 97.85% 100.55%
90 94.75% 97.43% 100.10%
92 94.65% 97.32% 100.00%
94 94.55% 97.22% 99.89%
96 94.46% 97.13% 99.79%
98 94.37% 97.04% 99.70%
100 94.29% 96.95% 99.61%
102 94.21% 96.87% 99.52%
104 94.13% 96.79% 99.44%
106 93.96% 96.60% 99.24%
108 93.89% 96.53% 99.17%
110 93.82% 96.46% 99.10%
112 93.76% 96.39% 99.03%
114 93.69% 96.33% 98.96%
116 93.64% 96.27% 98.90%
118 93.58% 96.21% 98.83%
120 93.52% 96.15% 98.77%
122 96.30% 99.01% 101.72%
124 96.19% 98.90% 101.62%

44
Table 9 Usage Percentage per Vertical Span
H 1700 1800 1900 2000
68 98.71% 99.41% 100.11% 100.82%
70 98.52% 99.22% 99.92% 100.62%
72 98.33% 99.03% 99.73% 100.43%
74 98.15% 98.85% 99.55% 100.25%
76 97.98% 98.69% 99.39% 100.09%
78 97.83% 98.53% 99.23% 99.93%
80 97.68% 98.38% 99.08% 99.78%
82 97.54% 98.24% 98.94% 99.64%
84 97.40% 98.10% 98.80% 99.50%
86 97.27% 97.97% 98.67% 99.37%
88 97.15% 97.85% 98.55% 99.25%
90 96.73% 97.43% 98.13% 98.83%
92 96.62% 97.32% 98.02% 98.72%
94 96.52% 97.22% 97.92% 98.62%
96 96.43% 97.13% 97.83% 98.53%
98 96.34% 97.04% 97.74% 98.44%
100 96.25% 96.95% 97.65% 98.35%
102 96.17% 96.87% 97.57% 98.27%
104 96.09% 96.79% 97.49% 98.19%
106 95.90% 96.60% 97.30% 98.00%
108 95.83% 96.53% 97.23% 97.93%
110 95.76% 96.46% 97.16% 97.86%
112 95.69% 96.39% 97.09% 97.79%
114 95.63% 96.33% 97.03% 97.73%
116 95.57% 96.27% 96.97% 97.67%
118 95.51% 96.21% 96.91% 97.61%
120 95.45% 96.15% 96.85% 97.55%
122 98.31% 99.01% 99.71% 100.41%
124 98.20% 98.90% 99.60% 100.31%

45
Failure Analysis
The following data show the number of failed combinations per each design input.
H # Fail Conductor Type # Fail
68 210 636 kCmil 26/7 0
70 195 795 kCmil 26/7 6
72 186 954 kCmil 45/7 36
74 177 1351 kCmil 45/7 1113
76 177 1590 kCmil 45/7 2679
78 165
80 159 Shield Wire Type # Fail
82 153 7 No. 9 Alumoweld 525
84 150 7/16 Steel 999
86 144 48 Fiber Alumocore 2310
88 138
90 126 Conductor Tension # Fail
92 117 7000 0
94 111 8000 18
96 111 9000 660
98 111 10000 3156
100 108
102 108 Shield Wire Tension # Fail
104 105 4000 1278
106 96 4500 1278
108 96 5000 1278
110 93
112 90 Horizontal Span # Fail
114 87 1200 399
116 87 1300 1179
118 87 1400 2256
120 87
122 183 Vertical Span # Fail
124 177 1700 663
1800 852
1900 1062
2000 1257
Figure 24 Application output showing the number of failures per design input

46
The charts below illustrate the distribution of failed combinations for each design input. Due to the
large number of conductor heights and the relatively even distribution of failures, it is not included in
these results.
Figure 25 A pie chart showing conductor type failure percentages
0% 1%
29%
70%
636 kcmil 26/7
795 kcmil 26/7
954 kcmil 45/7
1351 kcmil 45/7
1590 kcmil 45/7

47
Figure 26 A pie chart showing shield wire type failure percentages
Figure 27 A pie chart showing conductor tension failure percentages
14%
26%
60%
7 No. 9 Alumoweld
7/16 Steel
48 Fiber Alumocore
1%
17%
82%
7000
8000
9000
10000

48
]
Figure 28 A pie chart showing shield wire tension failure percentages
Figure 29 A pie chart showing horizontal span failure percentages
34%
33%
33%
4000
4500
5000
10%
31%
59%
1200
1300
1400

49
Figure 30 A pie chart showing vertical span failure percentages
17%
22%
28%
33%
1700
1800
1900
2000

50
CHAPTER 5
DISCUSSION AND CONCLUSION
Introduction
In this study the ground-line force analysis was modernized by lowering the overload factors
from their original design values of 4.0 and 1.75 to the modern NESC Medium Loading Zone values of 1.5
for vertical loads, 2.5 for transverse wind loads, 1.65 for transverse wire tension loads, and 1.1 for
general longitudinal loads. This decrease in overload factors resulted in a decrease of compression
ground-line force from 34.8 kips to 26.2 kips and a decrease of tension ground-line force from 28.6 kips
to 19.2kips. These decreases in ground-line forces result in an increase of 25% for compression capacity
and 33% for tension capacity.
Objectives of the Study
The objectives of this study were met as described in Chapter 1. The design calculation
spreadsheet found in Supplement 1 can be used to evaluate any single circuit tangent lattice tower for
vertical, horizontal, and longitudinal loadings and ground-line moments. Multiple trends and significant
findings were found and evaluated for simplifying future engineering assumptions and analysis of
tangent towers.

51
Summary of the Findings
This study analyzed 62,640 design input combinations for the A Tower using the modern NESC
loading calculation. Of these combinations 58,806 (94%) fell below the maximum ground-line forces
that were found using the original design calculation. These combinations were assigned passing criteria
with adequate structural capacity. Of the passing combinations, 96% are controlled by the Broken
Conductor load case while the remaining 4% are controlled by the Broken Shield Wire load case. Cases I
and IV never controlled the failure state for the A Tower.
The minimum ground-line compression was found to be 23.58 kips (32% understress) and
occurred with the following design input combination:
• 120’ Conductor Height
• 636 kCmil 26/7 ACSR Conductor @ 7,000lb tension
• 7 No. 9 Alumoweld Shield Wire @ all tensions
• 1200 ft Horizontal Span
• 1700 ft Vertical Span
The minimum ground-line tension was found to be 17.87 kips (29% understress) and occurred
with the following design input combination:
• 120’ Conductor Height
• 636 kCmil 26/7 ACSR Conductor @ 7,000lb tension
• 7/16” Steel Shield Wire @ all tensions
• 1200 ft Horizontal Span
• 2000 ft Vertical Span
Only 3,834 (6%) of the researched combinations were found to fail the comparison to the
original structural capacity. All failures in this study occur in the Broken Conductor load case with the
compression leg always controlling the failure.

52
The maximum ground-line compression was found to be 38.64 kips (11% overstress) and
occurred with the following design input combination:
• 68’ Conductor Height
• 1590 kCmil 45/7 ACSR Conductor @ 10,000lb tension
• 48 Fiber Alumocore Shield Wire @ all tensions
• 1400 ft Horizontal Span
• 2000 ft Vertical Span
The maximum ground-line tension was found to be 27.90 kips (8% overstress) and occurred with
the following design input combination:
• 68’ Conductor Height
• 1590 kCmil 45/7 ACSR Conductor @ 10,000lb tension
• 48 Fiber Alumocore Shield Wire @ all tensions
• 1400 ft Horizontal Span
• 1700 ft Vertical Span
Conclusions
The pass/fail rate of any particular combination was found to most heavily depend on, in order,
Conductor Type and Tension, Shield Wire Type, Vertical Span, and Horizontal Span. As expected, larger
wires, higher tensions, and longer spans result in an increase of failures against the original calculated
capacity. In all researched combinations, the Shield Wire Tension had no effect on the pass/fail rate of
the A Tower due to the fact that all Broken Shield Wire Case controlled combinations pass the original
structural capacity check.
Conductor Height did not play a major role in determining the pass/fail rate of any specific
design criteria combination. Due to the increased distance between tower legs in the taller
configurations, the failure rate actually decreased as the conductor height increased. The only
exception to this rule occurs in the tallest conductor heights of 122’ and 124’. The failure rate for these

53
combinations increase due to the original, non-extended tower design reaching a maximum leg spacing
at a 108’conductor height.
Of the failed combinations 82% contained a 10,000 lb. conductor tension, 70% contained the
heaviest conductor (1590 kCmil 48/7 ASCR), 60% contained the heaviest ground wire (48 Fiber
Alumocore), 59% has a horizontal span on 1400 ft, and 33% had a vertical span on 2000 ft. There were
no failures for combinations containing the lightest conductor (636 kCmil 26/7 ASCR) or a 7,000 lb.
conductor tension. As stated previously shield wire tension had no effect the pass/fail rate, so each
shield wire tension design value is equally represented in the pool of failed combinations.
Recommendations for Further Study
Further study on this topic is recommended with emphasis placed on small and large angle
transmission line towers. The added design criteria of the line angle would greatly increase the scope of
the calculation and the usefulness of the findings in a wider variety of real world applications. Computer
modeling of the subject towers in PLS Pole and STAAD.Pro can be used to verify the ground-line
moments that were found during the course of this study. Further study could be performed on the
member and joint capacity of the subject tower to validate the assumption that the maximum ground-
line moment controls the strength of the tower.

54
REFERENCES
Adamski, G. (2010). Recommendation to industry: Consideration of actual field conditions in
determination of facility ratings. Princeton, NJ: North American Electric Reliability Corporation.
Edgar, T.-H. (2017). Structural behaviour of lattice transmission towers subjected to wind load. Structure
and Infrastructure Engineering, 13(11), 1462-1475.
Energy Policy Act of 2005, 16 USC § 824o. (2005).
Institute of Electrical and Electronics Engineers. (2016). National electrical safety code. New York, NY:
IEEE.
North American Electric Reliability Corporation. (2015). Maintaining transmission line ratings consistent
with as-built conditions. Atlanta, GA: NERC.
North American Electric Reliability Corporation. (2017). NERC history. Retrieved from
https://www.nerc.com/AboutNERC/exec/Pages/History.aspx
Punsi, G. S. (2014). Analysis and design of transmission tower. International Journal of Modern
Engineering Research, 4(1), 116-138.
Rajalakshmi, G. (2018). Analysis and design of angle/tension type double circuit tower for 110kV
transmission line with extension for railway line crossing to achieve vertical clearance using
STAAD Pro V81. International Journal of Innovative Research and Science, Engineering and
Technology, 7(4), 3566-3580.
Task Committee on Updating Manual 52 of the Structural Division of ASCE. (1988). Guide for design of
steel transmission towers. New York, NY: American Society of Civil Engineers.
Thrash, R. (2007). Overhead conductor manual. Carrollton, GA: Southwire.
U.S.-Canada Power System Outage Task Force. (2004). Final report on the August 14, 2003 blackout in
the United States and Canada: Causes and recommendations. U.S.-Canada Power System
Outage Task Force.
Wilhoite, G. M. (1985). Innovations in the design of electrical transmission structures. New York, NY:
American Society of Civil Engineers.

55
APPENDIX A
SUPPLEMENTAL DATA ACCESS INFORMATION

56
SUPPLEMENT 1 – A TOWER DESIGN: CALCULATIONS
Supplement 1 contains the example design calculations that provide the as-designed groundline
forces, as well as the maximum and minimum groundline forces. This data can be downloaded from
http://scholar.utc.edu.
SUPPLEMENT 2 – A TOWER FULL RESULTS
Supplement 2 contains the entire results set of all possible design input combinations,
groundline forces, pass/fail criteria, and controlling load case. This data can be downloaded from
http://scholar.utc.edu.
SUPPLEMENT 3 – CONSTANT DESIGN INPUT PASS RATES
Supplement 3 contain pass/fail tables where one of the 51 design inputs remains constant while
evaluating the design calculation for all combinations of the remaining inputs. This data can be
downloaded from http://scholar.utc.edu.

57
APPENDIX B
TRANSMISSION LINE DESIGN GLOSSARY

58
ACSR – Aluminium conductor steel-reinforced cable is a type of high-capacity, high-strength conductor
typically used in overhead power lines.
Alumoweld – A high-strength steel rod with a high-purity aluminum powder compacted around it.
Angle Structure – Angle structures are used where transmission line conductors change direction.
These types of structures are designed to withstand the forces placed on them by the change in
direction.
Conductor – A material, usually in the form of a wire or cable, suitable for carrying electric current.
Dead End Structure – A dead-end structure is typically used where transmission line conductors turn
at a wide angle or end. Compared to tangent structures, a dead-end structure is designed to be
stronger and often is a larger structure.
Double Circuit – A double-circuit transmission line carries conductors for two electrical circuits. For a
three-phase system, this implies that each tower supports six conductors.
Ground Line Moment – The moment experienced at the ground line as loads are applied to the
structure. Common loads include wind pressure on conductors and the structure, ice load on
conductors, conductor weight, and tension imbalance at the structure due to uneven spans, and line
angles.
Ground Wire – Bare conductors supported at the top of transmission towers. They serve to shield the
line and intercept lighting stroke before it hits the current carrying conductors below. Ground wires
normally do not carry current.
Ground Wire Peak – The top portion of the lattice transmission line tower. The ground wires will
attach at the peak of this area.
Horizontal Span – The sum of half the span lengths on either side of the supporting structure. Also
known as wind span. Used to calculated conductor wind area supported by structure.
Kcmil - A circular mil is a unit of area, equal to the area of a circle with a diameter of one mil (one
thousandth of an inch). It corresponds to 5.067×10⁻⁴ mm².
Line angle – The projected angle at which the transmission line changes direction at a struture.
OPGW – An optical ground wire that combines the functions of grounding and communications. An
OPGW cable contains a tubular structure with one or more optical fibers in it, surrounded by layers of
steel and aluminum wire.
Overtension – The practice of installing an overhead conductor at a tension higher than its intended
design tension. This results in less sag in a span.

59
Sag – The difference in level between points of supports and the lowest point on the conductor in a
span.
Single Circuit – A single-circuit transmission line carries conductors for only one electrical circuit. For a
three-phase system, this implies that each tower supports three conductors.
Span – The distance between two subsequent transmission structures.
Special Extension – A steel lattice extension that can be added to a lattice transmission tower after the
transmission line is constructed and in operation.
Standard Extension – A steel lattice extension that is installed in a lattice transmission tower when the
transmission line is initially constructed.
Stranding - A stranded conductor consists of several wires of small cross-sectional area called strands
combined to create a conductor with a larger cross section. ACSR stranding is given in
(Aluminium/Steel) strands.
Suspension Structure – A structure where the conductors are simply suspended from the tower with
the mechanical tension being the same on each side. In this case, the tower is supposed to carry a
downward force, and a lateral force, but not a longitudinal force.
Tangent Structure – Tangent structures are the type most commonly used on a transmission line and
are used on relatively straight portions of the transmission line. Because the conductors are in a
relatively straight line passing through them, tangent structures are designed only to handle small line
angles (changes in direction) of 0 to 2 degrees.
Tension – The axial force in the conductor cause by pulling the conductor up from the ground
elevation.
Tower Body – The main trunk of a lattice transmission line tower. The conductors will attach in this
area.
Tower Leg – The bottom portion of a lattice transmission line tower. Different leg heights can be used
to elevate the conductor above ground or other aerial obstacles.
Undertension – The practice of installing an overhead conductor at a tension lower than its intended
design tension. This results in more sag in a span.
Vertical Span – The sum of the horizontal distances from the structure to the low point of the
conductor in each supported span. Also known as weight span. Used to calculate the conductor
weight supported by the structure.

60
VITA
Phillip York is a Master of Science in Engineering candidate at the University of Tennessee at
Chattanooga in Chattanooga, Tennessee. He received his B.S. in Engineering degree from UTC in 2008
and graduated from Dade County High School in Trenton, Georgia in 2003. He has been employed in the
power delivery and power services industry for more than ten years and is currently a Senior Civil and
Transmission Line Engineer with Sargent & Lundy Engineering in Chattanooga. He is a Licensed
Professional Engineer in Tennessee, Alabama, and Kentucky.