ground motion attenuation relationship for shallow …
TRANSCRIPT

GROUND MOTION ATTENUATION RELATIONSHIP FOR SHALLOW STRIKE-SLIP
EARTHQUAKES IN NORTHERN VIETNAM BASED ON STRONG MOTION RECORDS FROM JAPAN, VIETNAM AND ADJACENT REGIONS
Tran Viet HUNG1 and Osamu KIYOMIYA2
1Member of JSCE, Res. Ass., Dept. of Civil & Envi. Eng., Waseda University (Okubo 3-4-1, Shinjuku-ku, Tokyo 169-8555, Japan)
E-mail: [email protected] 2Member of JSCE, Professor, Dept. of Civil & Envi. Eng., Waseda University
(Okubo 3-4-1, Shinjuku-ku, Tokyo 169-8555, Japan) E-mail: [email protected]
Given the different geology and earthquake activity, establishing a regional attenuation relationship is deemed important for the seismic design of structures. This paper presents a new equation in place of the relationship currently used in Vietnam for horizontal ground motion based on database sets compiled from strike-slip and shallow crustal earthquakes with magnitudes ranging from 3.0 ≤ Mw ≤ 6.9 and source distances of up to 300 km for northern Vietnam. This new equation estimates the ground motion in terms of moment magnitude, distance and site conditions for strike-slip earthquakes. The equation is derived based on a regression analysis of earthquake records; in this study, the database consists of earthquake records from Japan, Vietnam and adjacent areas. We also assume a few simple relationships, such as the relation- ship between Mw and Ms, the closest distance to the fault and the effects of shallow site conditions on the average shear-wave velocity in the upper 30 m to develop a comparison with existing relationships. The new equation for northern Vietnam corresponds better with other equations for near- and far-field distances than the equations currently used for seismic design in Vietnam. Key Words: ground motion, peak ground acceleration, attenuation relationship, northern Vietnam
1. INTRODUCTION
Peak ground acceleration has been used to quantify ground motion in probabilistic seismic hazard analysis (PSHA). The ground motion attenuation relationship, which is used to estimate the ground maximum acceleration values for a design earthquake, is very important for PSHA. Thus, the attenuation of ground motion is represented and modeled using the empirical attenuation equations of peak ground acceleration (PGA). These equations are related to the source/site parameters, including source magnitude, source dis- tance and site conditions. Most of the relationships are developed based on widely distributed magnitudes, peak ground motions, distances and source mecha- nisms acquired from many earthquakes.
Ground motion attenuation relationships have previously been developed for many countries and
regions. For example, empirical attenuation relation- ships have been proposed by Joyner and Boore1); Fukushima and Tanaka2); Si and Midorikawa3); Abrahamson and Silva4); Campbell5); Youngs et al.6); Kanno et al.7); Boore and Atkinson8); Lin and Lee9); and Ghasemi et al.10). Attenuation relationships have also been studied in regions adjacent to Vietnam11),12), including Yunnan, China, which is near northern Vietnam. An attenuation relationship equation has also been presented by Xuyen and Thanh13) and used for earthquake prediction in Vietnam14). However, Vietnamese seismologists selected an attenuation function developed by foreign seismologists for other regions, such as Yunnan, China and the United States. Thus, the current ground motion attenuation relationship is not appropriate for seismic hazard analyses in Vietnam because it does not reflect local conditions. In particular, the relationship currently
23s
Structural Eng./Earthquake Eng., JSCE, Vol.29, No.2, 23s-39s, 2012(Copy of Journal of Japan Society of Civil Engineers, Ser. A1 Vol.68 No.3, 509-525, 2012.9)

used does not consider any earthquake records obtained in Vietnam. Thus, this study constructed a new attenuation relationship that considers Viet- namese conditions. Tectonically, northern Vietnam is located in the most seismically active region at the boundary between the Indochina and South China plates15). Most of the main faults in northern Vietnam are strike-slip faults16). This region is tectonically active, as demonstrated by the occurrence of mode- rate earthquakes in the countryside and adjacent areas. Earthquakes with magnitudes of 5.0 to 6.8 on the Richter scale were recorded during the 20th century, including the Dien Bien earthquake (1935, M = 6.8 and 2001, M = 5.3), the Luc Yen earthquake (1953, 1954, M = 5.4) and the Tuan Giao earthquake (1983, M = 6.7). These earthquakes caused a signi- ficant amount of structural damage to buildings and other structures.
Several large earthquakes with magnitudes of greater than 6.0 on the Richter scale have been recorded in locations in northern Vietnam. However, there is a lack of strong ground motion data for these earthquakes. Thus, earthquake studies in Vietnam are challenging due to the lack of data for the region. In 2005, a seismic network consisting of 24 broadband seismographs was deployed in Vietnam in a cooperative effort between the Vietnam Institute of Geophysics and the Institute of Earth Sciences at Academia Sinica in Taiwan17). However, there are a limited number of ground motion records for strong earthquake events in Vietnam. Thus, it is difficult to obtain the appropriate attenuation equations for PGA from the seismic records of strong earthquakes in the region. Many researchers have used strong ground motion data from other regions to compensate for the lack of available local records in obtaining a predictive attenuation relationship. For example, Campbell18) used eight records from areas outside the United States; Fukushima and Tanaka2) used records from Japan, the United States and other countries; Xiang and Gao11) used records from Yunnan and the United States. The prediction results are analyzed to investigate the fluctuations of attenuation relation- ships with magnitude, distance and regional site effects. In the same manner, we attempt to establish a new set of appropriate attenuation relationships using data from shallow and strike-slip earthquakes in northern Vietnam and other countries for engineering application purposes. The correlation between the proposed relationship in northern Vietnam and other regions in the world is then discussed.
2. DATA AND ANALYSIS
Ground motion attenuation relationships can be
obtained as functions of simple parameters that characterize the earthquake source, the propagation path between the earthquake source and the site and the geologic conditions beneath the site. Obtaining a reliable empirical relationship for peak ground acceleration with insufficient data is challenging. Following the research project of the Vietnam Institute of Geophysics (VIG) entitled “Research and forecasting earthquakes and foundation fluctuations in Vietnam,”19) recently concluded that Vietnam is classified as a low-moderate seismicity region and the maximum magnitude of earthquakes does not exceed 7.0 on the Richter scale in Vietnam20),21),22). According to the earthquake catalogue compiled by VIG, 90% of earthquakes were located in north- western Vietnam. Many researchers have reported a number of obvious faults in northern Vietnam, including those in Cao Bang-Tien Yen, Dong Trieu, the Lo River, the Chay River, the Red River, Son La, the Ma River, the Da River, Muong La, the Ca River and Lai Chau-Dien Bien20),21),23).
The longest fault is the Red River fault, which is probably active as a right-lateral strike slip fault. The Red River strike-slip fault plays an important role in recent tectonic activity in North Vietnam. This fault is divided into two parts. The northern segment of the Red River fault is located in China and the southern segment crosses into northern Vietnam. The two segments show contrasting seismic activities; the northern segment exhibits a higher level of vigorous earthquake activity, whereas the southern segment gives less vigorous activity and is influenced by the tectonic evolution of the northern Vietnam zone, which has the highest seismic activity in the Indochina Peninsula16). Furthermore, the activities of earthquakes along the fault zone are inconsistent. For example, a part of the Son La fault from Tuan Giao to Thuan Chau generates strong earthquakes, such as the Tuan Giao earthquakes (1983). For the Dien Bien-Sam Nua fault, Phi Cao-Nam Khun had strong earthquake activity as exemplified by the Dien Bien earthquake (1935). In contrast, earthquake activity generated by the Chay River fault has been con- centrated in the area of Luc Yen, Yen Bai24).
No strong earthquake ground motion was ob- served before 2000. The first earthquake ground motion was recorded during the Dien Bien earth- quake (Feb. 19, 2001; 21.33 N, 103.85 E), but only a few earthquake stations obtained earthquake records as shown in Table 1. This earthquake recorded a main shock of M = 5.3 and five other events ranging from M = 4.0 – 4.9. Since 2005, 24 broadband seis- mographs have been installed in northern Vietnam, but strong ground motion data have not been recorded. The epicenters of typical earthquakes in northern Vietnam and adjacent areas with
24s

magnitudes of M > 4 are shown in Fig. 1.
(1) Database To compensate for the lack of ground acceleration
data in Vietnam, datasets are collected from different source earthquakes in northern Vietnam and other areas. It is important to note that the main faults of regions adjacent to northern Vietnam, such as northern Thailand, Myanmar, Laos and southern China, are also strike-slip faults25),26),27),28). Therefore, earthquake activities in this region may be similar. Thus, strong motion data from Yunnan, China is selected. The relevant earthquake parameters used in this analysis are listed in Table 2. However, these parameters are not sufficient for precise regression analysis for northern Vietnam and adjacent areas. For this reason, foreign ground motion data for shallow and strike-slip earthquakes in Japan have been added from Kyoshin Net (K-NET), which is operated by the National Research Institute for Earth Science and Disaster Prevention in Japan (NIED).
Additional criteria for deciding whether an earth- quake should be included are as follows: (1) strike- slip earthquakes; (2) inland-type earthquakes; (3)
wM is not smaller than 3.5 and not larger than 7.0;
(4) data were recorded on the ground surface; and (5) data were truncated at a magnitude-dependent source distance2),29) such that data from sites without high site amplification factors were also collected. A total of 737 strong motion records are selected from strike-slip earthquakes in Japan, Vietnam and Yunnan. However, after applying criteria (5), 469 records are used in this study. The details of these records will be discussed in the following sections.
(2) The selected data set
In this study, we adopted moment magnitude wM
and source distance X as the parameters for the base model. The surface wave magnitudes and moment magnitudes have been taken from the CMT catalogue for events occurring in Vietnam and adjacent areas between latitudes 18oN and 25oN and between longitudes 100oE and 108oE from 1977–2011 as shown in Table 2. Fig. 2 shows the relation between the moment magnitude ( wM ) and surface wave
magnitudes ( sM ) based on earthquake records with
sM = 4.7 to 6.8 and wM = 4.8 to 7.0 in Vietnam and
adjacent regions. The relationship between wM and
sM is expressed by Equation (1). Thus, for the earth-
quake records recorded with a surface wave mag- nitude of sM , this magnitude was converted to wM
according to empirical equation (1).
1.0899 – 0.5332w sM M (1)
Numerous records are collected from K-NET35), but records with significant distances must be truncated because the signal-to-noise ratios are very small. Thus, we ignored the signal-to-noise ratio, as suggested by Fukushima and Tanaka2) and Fukushima29). The data used in this analysis represent main shocks; a few records from the aftershocks of the Dien Bien earthquake (2001) in Vietnam were included as shown in Table 3. The original data were obtained from the Vietnam Institute of Geophysics.
The distance limitation is characterized by the following relationship between the moment mag- nitude and source distance:
– log – log10wa M X b X c (2)
where wM is the moment magnitude, X is the source
distance. Variables a , b and c are regression coeffi- cients. The values of the coefficients are shown in Table 4.
Fig. 1 Earthquake epicenters and major faults in northern Vietnam and adjacent areas.
MW = 1.0899 MS ‐ 0.5332R² = 0.9015
4
4.5
5
5.5
6
6.5
7
7.5
4 4.5 5 5.5 6 6.5 7 7.5
MW
MS
Fig. 2 The relationship between sM and wM .
25s

Tab
le 1
The
eve
nts
used
to d
evel
op th
e at
tenu
atio
n re
lati
onsh
ip.
No.
D
ate
(yyy
y/m
m/d
d)
Loc
atio
n E
pice
nter
Coo
rdin
ates
M
agni
tude
D
epth
(k
m)
Dis
tanc
e R
ange
(k
m)
Num
ber
of D
ata
PG
A R
ange
(cm
/s2 )
Lat
itud
e L
ongi
tude
JM
AM
s
M
wM
N
-S
E-W
U
-D
1 (8
) 19
97/0
3/26
K
agos
him
a P
ref.
32
.00
130.
40
6.3
6.
1 (1
) 8
11 ~
381
12
2 1
~ 72
7 2
~ 54
2 1
~ 24
6
2 (8
) 19
97/0
5/13
K
agos
him
a P
ref.
32
.00
130.
30
6.2
6.
0 (2
) 8
11 ~
333
10
9 2
~ 90
2 2
~ 90
1 1
~ 18
8
3 (8
) 19
97/0
6/25
Y
amag
uchi
Pre
f.
34.5
0 13
1.70
6.
1
5.8
(2,3
) 12
9
~ 42
0 17
4 2
~ 42
1 2
~ 29
9 1
~ 14
5
4 (8
) 19
97/0
6/26
Y
amag
uchi
Pre
f.
34.4
0 13
1.70
3.
7
3.9
(3)
8 11
~ 4
5 7
3 ~
29
2 ~
7 1
~ 8
5 (8
) 20
00/1
0/06
T
otto
ri P
ref.
35
.30
133.
30
7.3
6.
9 (4
) 11
14
~ 5
92
303
2 ~
528
2 ~
817
1 ~
171
6 20
01/0
2/19
L
aos-
Vie
tnam
bor
der
21.3
7 10
2.89
5.3
5.1
(5)
12
19 ~
66
2 6
~ 10
9 4
~ 10
6.8
3 ~
89.9
7
7 (7
) 20
07/0
6/03
Y
unna
n 23
.00
101.
06
6.
4 6.
4 (6
) 5
13 ~
294
4
58 ~
431
49
~ 2
67
23 ~
157
N
ote:
(1
) Har
vard
Glo
bal C
MT
(2
) F-n
et30
) (3
) Izu
tani
and
Kan
amor
i31)
(4) U
SS
G
(5) V
an32
) (6
) Xu
et a
l.33)
(7) Z
hong
et a
l.34)
(8) K
-NE
T35
)
26s

Table 2 Earthquakes used in calculating Equation (1).
No. Events Location Lat. Lon. wM sM References
1 2001/02/19 Dien Bien, Vietnam 21.34 102.85 5.3 Trieu36)
5.1 Van32)
2 1983/06/24 Tuan Giao, Vietnam 21.71 103.43 6.8 6.7 Thuc22)
3 1978/08/02 Southeast Asia 20.26 100.51 5.2 5.2
Glo
bal C
MT
Cat
alog
4 1979/03/15 Yunnan 23.24 101.61 6.0 6.2
5 1981/09/19 Yunnan 22.84 101.54 5.3 5.2
6 1982/06/01 Burma-China border region 21.97 102.36 5.5 5.2
7 1982/10/27 Yunnan 23.97 105.85 5.2 5.1
8 1983/06/24 Southeast Asia 21.85 103.67 6.2 6.5
9 1983/07/15 Southeast Asia 21.93 103.29 5.3 5.0
10 1988/11/27 Burma-China border region 22.70 100.17 5.5 5.2
11 1989/06/16 Southeast Asia 20.61 102.61 5.6 5.5
12 1993/01/26 Yunnan 22.86 100.88 5.6 5.6
13 1995/04/24 Yunnan 22.88 103.16 5.2 4.9
14 2000/01/19 Southeast Asia 19.92 101.33 5.4 5.1
15 2001/07/09 Yunnan 24.89 101.25 5.1 4.7
16 2007/05/16 Laos 20.52 100.89 6.3 6.4
17 2007/06/02 Yunnan 23.02 101.13 6.1 6.3
18 2007/06/23 Myanmar-China border region 21.49 100.00 5.6 5.6
19 2010/12/30 Laos 20.86 103.42 4.8 4.7
20 2011/03/24 Myanmar 20.65 100.06 6.8 7.0
The distribution of the magnitudes with both hypo-central distances ( hypoR ) and Joyner-Boore
distances1) ( JBR ) in this data set are shown in Fig. 3. “▲-type” points are events in Vietnam and adjacent areas, “♦-type” points are events in Japan, “□-type” points are full records in Japan and “○-type” points are full records in Vietnam and adjacent areas. Finally, records with earthquake magnitudes wM ranging from 3.0 to 6.9 and source distances up to 300 km were used as a data set in this study.
(3) Distance correction
Different researchers use different source-to-site distance measures. Herein, the hypo-central distance is taken by the epicentral distance and focal depth to represent the source-to-site distance. The closest dis- tance to the rupture zone JBR is also used because this distance is smaller than the epicentral distance ( JBR < epiR ) and recent attenuation relations use JBR
to consider source size37),38),39). In this study, we con- verted epiR to JBR based on the relationship sug-
gested by Montaldo et al.40) as shown in Equation (3). This relationship is based on European data and has an extremely high correlation coefficient ( 2R = 0.95).
3.5525 0.8845 JB epiR R (3)
(4) Site geology
Ground motion models typically contain a scaling parameter based on site classification41) or include different models for “rock” and “soil” sites42),43). The widely accepted method for reflecting the effects of geological conditions on ground motion is to classify the recording stations according to their average shear-wave velocity in the upper 30 m44). Boore45) presented a relationship between 30sV and shallower velocities that significantly reduced the bias for shallow models compared to the simple method, which assumed that the lowermost velocity extends to 30 m as presented in Equation (4). These relation- ships will be used to convert the shallower velocities to 30sV according to Boore45).
30log logs sV a b V d (4)
where sV d is the shear-wave velocity (m/s) at
depth d . a and b are the regression coefficients (referring to those of Boore45)).
27s

The shear-wave velocity profiles available at each K-NET recording site35) were used to classify the sites according to their NEHRP class46). The NEHRP site class is based on the shear-wave velocity time averaged over the top 30 m of the soil profile (shown in Figs. 4 and 5 and Table 5). For the K-NET sites35), soil profiles are typically only available for the top 10 or 20 m. Thus, we used Boore’s relationships45) to extrapolate the velocity profiles from 10 or 20 m down to 30 m to obtain the appropriate average velocity over 30 m.
3. ATTENUATION MODEL AND REGRE- SSION METHOD
Since the 1970s, peak ground motion attenuation relations have typically been represented by log- arithmic empirical equations. In general, a term for the saturation of acceleration amplitude at the short distances must be described as a function of magnitude for shallow earthquake events2),4),6),18),42),43),47). Recent attenuation relationships have been developed for shallow and non-shallow earthquake events that consider focal depth7) and strike-slip faults44),48),49),50). Several of the available attenuation relations con- sider the different source categories. These relation- ships can typically be separated into three categories, i.e., shallow and crustal earthquakes, subduction interface events and subduction intraplate events,
based on their tectonic locations3). Kanno et al.7) also divided regression models into shallow (a focal depth of 30 km or less) and deep (a focal depth of greater than 30 km) events because the ground motion amplitudes from earthquakes with focal depths greater than 30 km were considerably different from those of shallower events. This model may cover a wide data distribution range and is thus selected in this study as presented in Equation (5).
log( ') - log( 10 )weMwA a M b X X d c
(5)
where 'A is the ground motion parameter (peak ground acceleration [PGA] in cm/s2), wM is the mo- ment magnitude, X is the closest distance to the fault projection in km. In this study, we have used approximate values, which were converted into JBR
from epiR according to Equation (3) from the so-
called “closest distance”. a , b , c and d are the reg- ression coefficients to be determined. is the error between the observed and predicted values. To perform a regression analysis on the corrected PGA, an e -value of 0.5 was set according to Si and Midorikawa3), Takahashi et al.51) and Kanno et al.7). The type of fault scaling was not considered in Equation (5) because all of the earthquake records in this study were of the strike-slip earthquake type.
Table 3 Aftershocks of the Dien Bien earthquake (2001).
No. Date
(yyyy/mm/dd) Magnitude PGA Range (cm/s2)
Distance (km)sM wM N-S E-W U-D
1 2001/02/19 3.0 2.7 5.31 7.27 6.76 10
2 2001/02/19 3.1 2.8 5.92 8.68 6.77 10
3 2001/02/19 3.3 3.1 8.31 12.26 11.66 10
4 2001/02/19 4.2 4.0 14.82 21.76 19.70 11
5 2001/02/19 4.8 4.7 61.68 74.59 42.45 14
6 2001/02/19 3.0 2.7 3.26 4.16 3.01 11
7 2001/02/21 3.8 3.6 7.31 10.49 9.13 11
8 2001/02/22 3.4 3.2 18.37 22.09 17.21 10
9 2001/02/23 3.2 3.0 6.73 10.28 13.76 11
10 2001/02/23 3.1 2.8 3.78 7.19 8.66 11
11 2001/02/24 4.2 4.0 28.26 27.15 21.26 10
12 2001/03/04 4.7 4.6 21.14 42.60 30.95 14
13 2001/03/04 3.4 3.2 5.26 6.13 5.26 10
14 2001/03/04 3.2 3.0 7.37 12.44 12.83 9
15 2001/03/04 3.7 3.5 5.16 5.84 5.27 13
16 2001/03/05 3.5 3.3 4.88 6.89 5.36 10
28s

4. RESULTS AND EVALUATIONS (1) Results of the regression analysis
To clearly see the influence of the earthquake data on the results of the regression analysis, three cases are selected for consideration in this study. Case 1 uses the entire ground motion data, including those from Japan, Vietnam and Yunnan. Case 2 only uses ground motion data from Japan and Case 3 uses
ground motion data from Vietnam and Yunnan. The most suitable formula and dataset for predicting PGA in northern Vietnam will then be discussed. In this study, two stage regressions are used. In the first stage, the dependency of magnitude and source dis- tance on the attenuation characteristics were eval- uated; in the second stage, site effects were incorpo- rated. The coefficients used in the median attenuation equation in the first stage were determined via
3.5
4.0
4.5
5.0
5.5
6.0
6.5
7.0
7.5
1 10 100 1000
Moment Magnitude, M
w
Hypocentral Distance, Rhypo (km)
1
10
100
1000
1 10 100 1000
Peak Ground Acceleration (cm
/s2)
Hypocentral Distance, Rhypo (km)
3.5
4.0
4.5
5.0
5.5
6.0
6.5
7.0
7.5
1 10 100 1000
Moment Magnitude, M
w
Joyner & Boore Distance, RJB (km)
1
10
100
1000
1 10 100 1000
Peak Ground Acceleration (cm
/s2)
Joyner & Boore Distance, RJB (km)
Fig. 3 Distributions of magnitude with hypocentral (left figure) and Joyner-Boore distances (right figure).
Table 4 Criterion coefficient in Equation (2).
Type of distance a b c
Hypocentral distance hypoR 0.401 0.002 1.1
Joyner-Boore distance JBR 0.379 0.001 1.1
Table 5. 30sV values with the NEHRP site classification46).
Site class A B C D E
Number of records 8 114 253 83 9
Median category velocities (m/s) 1944 946 525 280 147
29s

0
500
1000
1500
2000
2500
3000
1 10 100 1000
Vs30(m
/s)
Joyner & Boore Distance, RJB (km)
(E)(D)
(C)
(B)
(A)
0180
760
1500
3000
360
Soft claysStiff Soils
Firm to Hard Rock
Hard Rock
Dense SoilSoft Rock
NEHRPSite classes
Vs30 (m/s)
Fig. 4 Earthquake data distribution with respect to 30sV and its comparison with the NEHRP site classes46).
1
10
100
1000
0 1000 2000 3000
PGA (cm
/s2)
Vs30 (m/s)
A‐ClassB‐ClassC‐ClassD‐ClassE‐Class
E D C B A
1
10
100
1000
1 10 100 1000
PGA (cm
/s2)
Closest to distance (km)
A‐ClassB‐ClassC‐ClassD‐ClassE‐Class
Fig. 5 Destination of the NEHRP site classes46) for the dataset used in this study.
nonlinear regression analysis. Table 6 lists coeffi- cients a , b , c and d from the regression analysis. Figs. 6, 7 and 8 illustrate PGA attenuation curves corresponding to the first stage. The solid and dashed lines correspond to the new attenuation relationship and the standard error of the relationship, respec- tively. These plots illustrate that the predicted values are found with respect to the closest distances and magnitudes. No significantly different trends are observed. This result may indicate that these para- meters are independent of the total residuals.
In this section, we attempted to calculate the attenuation relationships for three cases with the smallest standard error based on the available data- base. The aim of these cases is to consider the influence of the database on the attenuation models, especially due to the insufficient data for Vietnam. It is interesting to note that the regression errors obtained in the three cases are not significantly different as shown in Table 6. The error for case 3 is smaller than those for cases 1 and 2. These regression errors indicate the level of uncertainty related to the
database. However, in all three cases, the influence of the variance is small in comparison to the regression error.
This conclusion is confirmed in Fig. 9, where the prediction ranges for the three cases are compared. Fig. 9 also shows that the predicted PGA of case 3 is smaller than those of cases 1 and 2. All of the relations show stable low residuals, which indicate the strength of our relationships because different relationships are based on different datasets. The consequence of this observation is that the un- certainties related to the strong earthquake data in other regions have a negligible contribution to the errors in the derived relationships. This result demonstrates the validity of the selection assumption made in section 2(1).
With the data currently available from Vietnam and adjacent regions, the proposed attenuation relationship in northern Vietnam can be predicted; however, this relationship will not be particularly reliable. Thus, adding strong motion data from Japan is very important for predicting approximate
30s

attenuation relations. In this respect, we see that the relationship obtained from the regressions for Vietnam and adjacent regions and Japan for strike- slip earthquakes are similar.
(2) Effect of shallow site conditions Recent attenuation models for shallow crustal
earthquakes use the effects of shallow site conditions based on the shear-wave velocity time averaged over
1
10
100
1000
1 10 100
PGA (cm
/s2)
Closest to distance (km)
A‐Class B‐ClassC‐Class D‐ClassE‐Class Ext. PGA
300
Mw=5
Mw=6
Mw=7 (a)
1
10
100
1000
1 10 100
PGA (cm
/s2)
Closest to distance (km)
Mw=6.5
A‐Class B‐ClassC‐Class D‐ClassE‐Class Ext. PGA
300
2000(b)
‐1
‐0.5
0
0.5
1
1 10 100
log(obs/pre)
Closest to distance, R (km)
Error=0.263
‐1
‐0.5
0
0.5
1
2.5 3.5 4.5 5.5 6.5 7.5
log(obs/pre)
Magnitude(Mw)300
Fig. 6 Attenuation curves of PGA for Case 1: a) wM = 5, 6 and 7 and b) wM = 6.5.
1
10
100
1000
1 10 100
PGA (cm
/s2)
Closest to distance (km)
Database
Ext. PGA
300
Mw=5
Mw=6Mw=7 (a)
1
10
100
1000
1 10 100
PGA (cm
/s2)
Closest to distance (km)
Mw = 6.5
Database
Pre. PGA
Ext. PGA
300
(b)2000
‐1
‐0.5
0
0.5
1
1 10 100
log(obs/pre)
Closest to distance, R (km)
Error=0.263
‐1
‐0.5
0
0.5
1
3 4 5 6 7
log(obs/pre)
Magnitude(Mw)300
Fig. 7 Attenuation curves of PGA for Case 2: a) wM = 5, 6 and 7 and b) wM = 6.5.
31s

1
10
100
1000
1 10 100
PGA (cm
/s2)
Closest to distance (km)
Database
Ext. PGA
300
Mw=5
Mw=6
Mw=7 (a)
1
10
100
1000
1 10 100
PGA (cm
/s2)
Closest to distance (km)
Mw = 6.5
DatabasePre. PGAExt. PGA
300
(b)
‐1
‐0.5
0
0.5
1
1 10 100
log(obs/pre)
Closest to distance, R (km)
Error=0.25‐1
‐0.5
0
0.5
1
2.5 3.5 4.5 5.5 6.5 7.5
log(obs/pre)
Magnitude(Mw)300
Fig. 8 Attenuation curves of PGA for Case 3: a) wM = 5, 6 and 7 and b) wM = 6.5.
1
10
100
1000
1 10 100
Closest to distance (km)
PGA (cm
/s/s)
300
2000Mw=6.5
AllJP
VN&YN
Pre. range (JP)Pre. range (All)Pre. range (VN&YN)
1
10
100
1000
1 10 100
Closest to distance (km)
PGA (cm
/s/s)
300
2000Mw=6.5
AllJP
VN&YN
Fig. 9 Comparison of the attenuation curves for the three cases (left figure) and comparison of the prediction ranges for the standard errors (right figure). “All” refers to the data from Japan, Vietnam and Yunnan, “JP” refers to the data from Japan, and “VN&YN” refers to the data from Vietnam and Yunnan.
Table 6 Regression coefficients for Equation (5).
Database a b d e c
All 0.588 -0.003 0.005 0.5 0.01 0.263 Japan 0.590 -0.003 0.005 0.5 0.01 0.263
Vietnam and Yunnan 0.565 -0.002 0.005 0.5 0.01 0.250
the top 30 m ( 30sV ) using predictive equati-
ons7),37),41),44),49),52) based on an empirical geotechnical model with linear or nonlinear site effects. In this study, the database consists of five site categories corresponding to classes E, D, C, B and A in the NEHRP site categories46). Choi and Stewart53)
indicated that the nonlinearity of amplification factors was significant for 30sV < 180 m/s and
relatively small for 30sV > 300 m/s. Less than 2% of
the stations in our database have 30sV < 180 m/s;
thus, the nonlinearity of the amplification factors on
PGA (cm
/s2)
PGA (cm
/s2)
32s

the resultant attenuation model would be minimal44). To calculate the effective site conditions, we decided to use linear scaling for site correction. In this study, we used 30sV to characterize the site effects using the
following correction formula:
30 log / log sG obs pre p V q (6)
Equation (6) can be rewritten as follows:
30 log /s refG p V V (7)
where G is the equivalent form of the linear site correction expression provided by Boore et al.41) and coefficients p and q are derived using a regression analysis on the residuals averaged at 100-m/s inter-
vals in 30sV 7). Coefficient refV is equal to ( / )10 q p .
We determined that the coefficients p and q in Equation (6) were -0.209 and 0.559, respectively, as shown in Fig. 10. This figure shows the relationship between the averaged residuals and 30sV . In the linear site amplification formula suggested by Boore et al.41), coefficient p is similar to vb , and refV is similar to
AV , as shown below.
30 ln /site v s AF b V V (8)
where vb = -0.371 and AV = 1,396.
We estimated coefficients of -0.209 and 472.8
(= ( 0.559/ 0.209)10 ); these values are quite similar to the values of -0.24 and 484.5 obtained by Graizer and Kalkan44), possibly because their study used a data- base with shallow earthquakes occurring in strike- slip faults.
Fig. 11 shows the coefficients of p (or vb ) ob- tained in some previous studies. The coefficient of p (or vb ) in this study is generally lower than those
determined by Boore et al.41) and Kanno et al.7) (see Fig. 11). This difference is due to the use of different databases or different methods for estimating the site effects through 30sV . The influence of site effects on the resultant attenuation curves is demonstrated in Fig. 12. This figure also compares the predicted PGA attenuations to wM for 30sV = 360 m/s.
The predicted PGA values after applying the site correction can be simply interpreted as follows:
log log( ') A A G (9)
(3) Final attenuation equation
The final attenuation model is rewritten in Equa-
y = ‐0.209 logVs30 + 0.559
‐0.5
0
0.5
100 1000
log (obs/pre)
Vs30 (m/s)2000
Fig. 10 The relationship between the residuals and 30sV .
‐0.209
‐0.55
‐0.371
‐0.24‐0.6
‐0.4
‐0.2
0This study
Kanno et al.
Boore et al.
Graizer andKalkan
7)
41)
44)
Fig. 11 Comparison of p (or vb ) coefficients in the site correction.
tion (10) as a form of Equation (9). Its estimator para- meters were found using two stages of regression on a compiled data set.
The standard error of the relationship was calcu- lated to be 0.26.
0.5
30
log 0.59 - 0.003 - log( 0.005 10 )
0.01 - 0.209log 0.26 472.8
wMw
s
A M X X
V
(10)
The symbols used in Equation (10) have been explained in previous sections. The resulting PGA attenuation relationships are plotted in Fig. 13 for the horizontal component with average shear velocities of approximately 300 m/s and 600 m/s. These 30sV values may correspond with site conditions in northern Vietnam. The performance of the relation- ship is also presented in terms of residuals. Residual plots of PGA in this stage for the full data set as functions of closest distance, magnitude and 30sV are presented in Fig. 14; the same remarks apply as for the first stage.
(4) Comparison with previous studies and the re-
corded data The estimated PGA attenuation curves from the
equation derived in this study were compared with the commonly used attenuation relationships of Boore et al.41), Campbell5), Sadigh et al.43), Si and
2000
33s

Midorikawa3) and Ambraseys et al.48). The available equations of Xuyen and Thanh13) for Vietnam and Xiang and Gao11) for Yunnan, China, which is close to northern Vietnam, are also used for comparison.
Similar to this study, these relationships represent a seismically active and shallow crustal tectonic environment. All of the aforementioned relationships are applicable to soil and stiff sites. Some of the
1
10
100
1000
1 10 100
PGA (cm
/s2)
Closest to distance (km)
Mw=6.5
Vs30=180 m/s
Vs30=360 m/s
Vs30=760 m/s
Vs30=1500 m/s
300
1
10
100
1000
1 10 100
PGA (cm
/s2)
Closest to distance (km)
Vs30 = 360 m/s
Mw=7
Mw=6
Mw=5
300
Fig. 12 Plots of the PGA attenuation characteristics for various 30sV with wM = 6.5 (left figure); comparison of the predicted PGA
attenuations for 30sV = 360 m/s (right figure).
1
10
100
1000
1 10 100
PGA (cm
/s2)
Closest to distance (km)
Mw=6.5Vs30=300m/s
A‐Class B‐Class C‐ClassD‐Class E‐Class
2000
1
10
100
1000
1 10 100
PGA (cm
/s2)
Closest to distance (km)
Mw=6.5Vs30=600m/s
A‐Class B‐Class C‐ClassD‐Class E‐Class
2000
Fig. 13 Comparison of the PGA attenuation curves for wM = 6.5 corresponding to 30sV = 300 m/s and 30sV = 600 m/s. Solid line: new
attenuation relationship. Dashed line: standard error of the relationship.
‐1
‐0.5
0
0.5
1
1 10 100
log(obs/pre)
Closest to distance, R (km)
Error=0.26
‐1
‐0.5
0
0.5
1
2.5 3.5 4.5 5.5 6.5 7.5
log(obs/pre)
Magnitude(Mw)
‐1
‐0.5
0
0.5
1
0 1000 2000 3000
log(obs/pre)
Vs30(m/s)
300
Fig. 14 Residual plots of PGA in the final equation.
34s
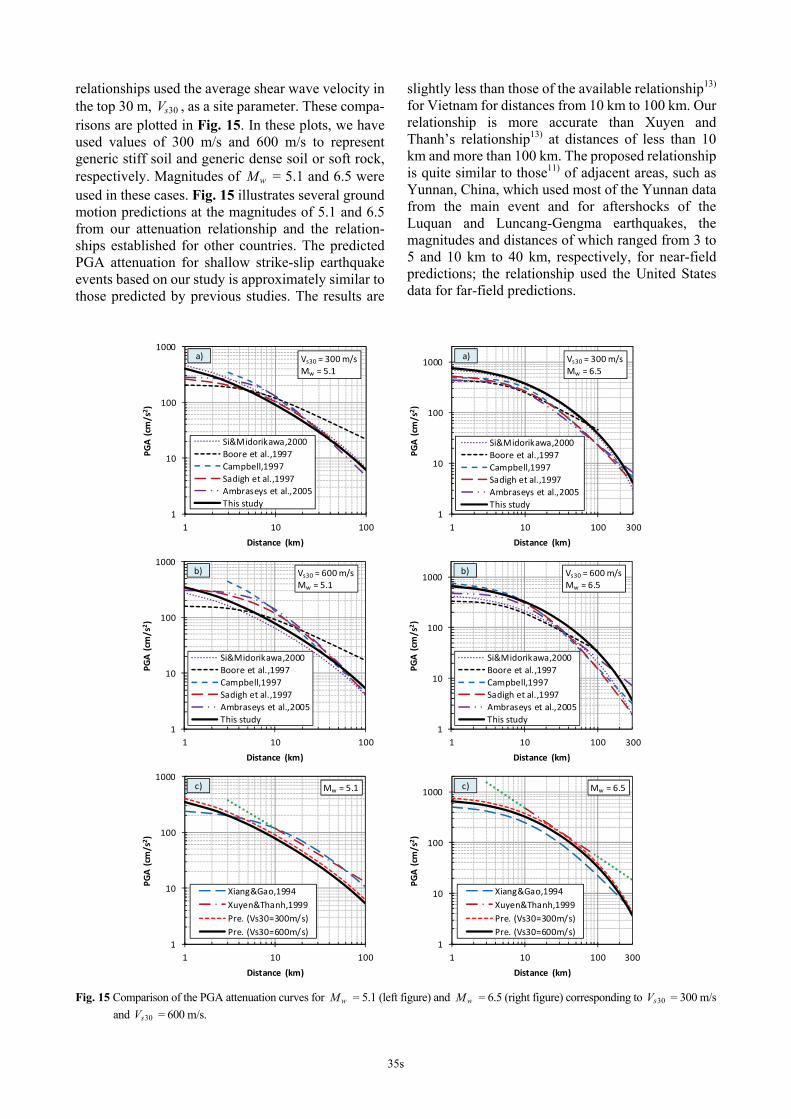
relationships used the average shear wave velocity in the top 30 m, 30sV , as a site parameter. These compa- risons are plotted in Fig. 15. In these plots, we have used values of 300 m/s and 600 m/s to represent generic stiff soil and generic dense soil or soft rock, respectively. Magnitudes of wM = 5.1 and 6.5 were used in these cases. Fig. 15 illustrates several ground motion predictions at the magnitudes of 5.1 and 6.5 from our attenuation relationship and the relation- ships established for other countries. The predicted PGA attenuation for shallow strike-slip earthquake events based on our study is approximately similar to those predicted by previous studies. The results are
slightly less than those of the available relationship13) for Vietnam for distances from 10 km to 100 km. Our relationship is more accurate than Xuyen and Thanh’s relationship13) at distances of less than 10 km and more than 100 km. The proposed relationship is quite similar to those11) of adjacent areas, such as Yunnan, China, which used most of the Yunnan data from the main event and for aftershocks of the Luquan and Luncang-Gengma earthquakes, the magnitudes and distances of which ranged from 3 to 5 and 10 km to 40 km, respectively, for near-field predictions; the relationship used the United States data for far-field predictions.
1
10
100
1000
1 10 100
PGA (cm
/s2)
Distance (km)
Vs30 = 300 m/sMw = 5.1
Si&Midorikawa,2000
Boore et al.,1997
Campbell,1997
Sadigh et al.,1997
Ambraseys et al.,2005
This study
a)
1
10
100
1000
1 10 100
PGA (cm
/s2)
Distance (km)
Vs30 = 300 m/sMw = 6.5
Si&Midorikawa,2000
Boore et al.,1997
Campbell,1997
Sadigh et al.,1997
Ambraseys et al.,2005
This study
a)
300
1
10
100
1000
1 10 100
PGA (cm
/s2)
Distance (km)
Vs30 = 600 m/sMw = 5.1
Si&Midorikawa,2000
Boore et al.,1997
Campbell,1997
Sadigh et al.,1997
Ambraseys et al.,2005
This study
b)
1
10
100
1000
1 10 100
PGA (cm
/s2)
Distance (km)
Vs30 = 600 m/sMw = 6.5
Si&Midorikawa,2000
Boore et al.,1997
Campbell,1997
Sadigh et al.,1997
Ambraseys et al.,2005
This study
300
b)
1
10
100
1000
1 10 100
PGA (cm
/s2)
Distance (km)
Mw = 5.1
Xiang&Gao,1994
Xuyen&Thanh,1999
Pre. (Vs30=300m/s)
Pre. (Vs30=600m/s)
c)
1
10
100
1000
1 10 100
PGA (cm
/s2)
Distance (km)
Mw = 6.5
Xiang&Gao,1994
Xuyen&Thanh,1999
Pre. (Vs30=300m/s)
Pre. (Vs30=600m/s)
c)
300
Fig. 15 Comparison of the PGA attenuation curves for wM = 5.1 (left figure) and wM = 6.5 (right figure) corresponding to 30sV = 300 m/s
and 30sV = 600 m/s.
35s

In comparing our attenuation relationship with those of previous studies, Si and Midorikawa3)’s form is very close to ours at 30sV = 300 m/s and smaller than our relationship at 30sV = 600 m/s. The opposite tendencies occurred for the relationship of Ambraseys et al.48) (see Figs. 15a and 15b). However, these relationships have features that are similar to the predictions made using our relationship. Comparisons with the relationships of Boore et al.41), Campbell5) and Sadigh et al.43) also reveal that they show similar features. Our relationship is different from the other relationships within the distance range of 10 to 100 km for both stiff soil and dense soil conditions, possibly due to the use of different databases, which is expected due to the site effects in our dataset or the different forms of those relationships.
Fig. 15 also shows that the influence of site effects in our relationship is lower than those in other relationships, such as those of Si and Midorikawa3), Campbell5) and Sadigh et al.43), because the site cate- gory mainly referred to stiff and dense soils. The relationship of Ambraseys et al.48) used stiff soil (180 < 30sV ≤ 360 m/s) and dense soil or soft rock (360 <
30sV ≤ 750 m/s). The relationships of Xuyen and Thanh13) and Xiang and Gao11) did not have defined site conditions. The conversion faulting coefficient between faulting types43),49) may also cause differ- rences in the relationships because we only con- sidered the strike-slip fault type. In this comparison, the predicted PGA signifi- cantly differs with others, especially in the range of the near-source regions with wM = 5.1 (see Fig. 15) because the dataset is insufficient at that magnitude. Thus, the number of data for small earthquakes should be increased, although the prediction of ground motion is less important in these instances. Furthermore, the performance of the proposed attenuation relationship
is examined through comparisons with actual recorded data.
Fig. 16 shows comparisons of our predictions with actual recorded PGA data from events in Vietnam and Yunnan. The left figure represents the Dien Bien earthquake (2001) in Vietnam. DBV and TGV are seismology stations at Dien Bien and Tuan Giao, respectively. The right figure represents the Ninger earthquake (2007) in Yunnan. AJ001, AM003 and AT001 are seismology stations at Dehue, Zhengxing and Mengxian, respectively. The figure also shows that our prediction is fairly consistent. The proposed relationship shows that the expected trend for rock amplitudes is smaller than that for soil amplitudes because ground motions at rock sites are smaller than those at soil sites. The site amplification in soil is higher than that in rock (see Figs. 12 and 16). This trend is also shown by Sadigh et al.43), Graizer and Kalkan44) and Ambraseys et al.48).
We also compare our relationship to those of others in terms of residuals averaged at approxi- mately 5-km bins vs. the closest distance in Fig. 17. The left figures represent stiff soil conditions and the right figures represent dense soil or soft rock conditions. The solid and dashed lines are the trends for our predictions and those of previous studies, respectively. Those residuals are then grouped into two categories, one corresponding to dense soil or soft rock conditions ( 30sV = 600 m/s) and the other corresponding to stiff soil condition ( 30sV = 300 m/s). We illustrate the trends in the results with linear fitted lines for the data in each category. The trend lines of our relation and those of previous studies are compared. Fig. 17 shows that almost all of the relationships are within the median residual range of ± 0.5. The slopes of our relationship differ from those of previous studies because our dataset contains only a small number of earthquake records below wM = 5.5.
1
10
100
1000
1 10 100
PGA (cm
/s2)
Distance (km)
Mw = 5.1
2001 Dien Bien EQ
Pre. (Vs30=300m/s)
Pre. (Vs30=600m/s)
a)
DBV
TGV
1
10
100
1000
1 10 100
PGA (cm
/s2)
Distance (km)
Mw = 6.4
2007 Yunnan EQ
Pre. (Vs30=300m/s)
Pre. (Vs30=600m/s)
b)
300
AT001
AM003
AJ001
Fig. 16 Comparison of the actual recorded data with our predictions.
36s

‐1.5
‐1
‐0.5
0
0.5
1
1.5
1 10 100
log(obs/pre)
Closest to distance, R (km)
Boore et al., 1997Pre. Vs30=300m/s
300
‐1.5
‐1
‐0.5
0
0.5
1
1.5
1 10 100
log(obs/pre)
Closest to distance, R (km)
Boore et al., 1997Pre. Vs30=600m/s
300
‐1.5
‐1
‐0.5
0
0.5
1
1.5
1 10 100
log(obs/pre)
Closest to distance, R (km)
Campbell, 1997Pre. Vs30=300m/s
300
‐1.5
‐1
‐0.5
0
0.5
1
1.5
1 10 100
log(obs/pre)
Closest to distance, R (km)
Campbell, 1997Pre. Vs30=600m/s
300
‐1.5
‐1
‐0.5
0
0.5
1
1.5
1 10 100
log(obs/pre)
Closest to distance, R (km)
Sadigh, 1997Pre. Vs30=300m/s
300
‐1.5
‐1
‐0.5
0
0.5
1
1.5
1 10 100
log(obs/pre)
Closest to distance, R (km)
Sadigh, 1997Pre. Vs30=600m/s
300
‐1.5
‐1
‐0.5
0
0.5
1
1.5
1 10 100
log(obs/pre)
Closest to distance, R (km)
S&M, 2000Pre. Vs30=300m/s
300
‐1.5
‐1
‐0.5
0
0.5
1
1.5
1 10 100
log(obs/pre)
Closest to distance, R (km)
S&M, 2000Pre. Vs30=600m/s
300
‐1.5
‐1
‐0.5
0
0.5
1
1.5
1 10 100
log(obs/pre)
Closest to distance, R (km)
Ambraseys et al, 2005Pre. Vs30=300m/s
300
‐1.5
‐1
‐0.5
0
0.5
1
1.5
1 10 100
log(obs/pre)
Closest to distance, R (km)
Ambraseys et al, 2005Pre. Vs30=600m/s
300
‐1.5
‐1
‐0.5
0
0.5
1
1.5
1 10 100
log(obs/pre)
Closest to distance, R (km)
Xiang et al., 1994Pre. Vs30=300m/s
300
‐1.5
‐1
‐0.5
0
0.5
1
1.5
1 10 100
log(obs/pre)
Closest to distance, R (km)
Xuyen et al., 1999Pre. Vs30=300m/s
300
Fig. 17 Comparison of the residuals averaged over 5-km bins corresponding to 30sV = 300 m/s and 30sV = 600 m/s.
5. CONCLUSIONS
(1) In this study, we have derived a new PGA attenuation relationship for northern Vietnam to
replace the one currently used for Vietnam. The new relationship is developed for shallow strike-slip earthquakes using a regression technique for earthquakes within a magnitude range of
37s

3.0 ≤ wM ≤ 6.9 and with source distances up to 300 km.
0.5
30
log 0.59 - 0.003 - log( 0.005 10 )
0.01 - 0.209log 0.26 472.8
wMw
s
A M X X
V
The properties of this new relationship are
significantly different from those of the current relationship proposed for Vietnam by Xuyen and Thanh13) at near-field (less than 10 km) and far-field (more than 100 km) distances.
(2) In this relationship, 30sV is adopted to estimate ground motion with linear site effects. Our relation is significantly different from the relationships of Boore et al.41) and Kanno et al.7) in terms of the coefficients for site correction but similar to the relationship of Graizer and Kalkan44).
(3) The standard error calculated with insufficient data from Vietnam and adjacent regions is close to that obtained using the data from Japan; the standard errors obtained before and after adding the effect of shallow site conditions are similar. Thus, the source parameters obtained using regressions for Vietnam, adjacent regions and Japan are similar for strike-slip earthquakes.
(4) An analysis of the residuals shows that the distributions of the total residuals with respect to distance and magnitude are not biased. The analysis of the residuals within each site condition indicates that site conditions significantly affect ground motion amplitude.
ACKNOWLEDGMENTS: We would like to thank Prof. Cao Dinh Trieu and Prof. Nguyen Hong Phuong of the Vietnam Institute of Geophysics for their support regarding the Vietnam earthquake data and the completion of this study. We also would like to acknowledge the National Research Institute for Earth Science and Disaster Prevention (NIED, Japan) for providing the strong ground motion data.
REFERENCES 1) Joyner, W. B. and Boore, D. M.: Peak horizontal
acceleration and velocity from strong-motion records including records from the 1979 Imperial Valley, California, earthquake, Bull. Seism. Soc. Am., Vol. 71, No. 6, pp. 2011- 2038, 1981.
2) Fukushima, Y. and Tanaka, T.: A new attenuation relation for peak horizontal acceleration of strong earthquake ground motion in Japan, Bull. Seism. Soc. Am., Vol. 80, No. 4, pp. 757- 783, 1990.
3) Si, H. and Midorikawa, S.: New attenuation relations for peak ground acceleration and velocity considering effects of fault type and site condition, Paper No. 0532. Proc. of 12th World Conference on Earthquake Engineering, Auckland, New Zealand, Jan. 30 to Feb. 4, 2000.
4) Abrahamson, N. A. and Silva, W. J.: Empirical response spectral attenuation relations for shallow crustal earthquakes, Seismol. Res. Lett., Vol. 68, No. 1, pp. 94-127, 1997.
5) Campbell, K. W.: Empirical near-source attenuation relationships for horizontal and vertical components of peak ground acceleration, peak ground velocity, and pseudo- absolute acceleration response spectra, Seismol. Res. Lett., Vol. 68, No. 1, pp. 154-179, 1997.
6) Youngs, R. R., Chiou, S. J., Silva, W. J. and Humphrey, J. R.: Strong ground motion attenuation relationships for subduction zone earthquakes, Seismol. Res. Lett., Vol. 68, No. 1, pp. 58-73, 1997.
7) Kanno, T., Narita, A., Morikawa, N., Fujiwara, H. and Fukushima, Y.: A new attenuation relation for strong ground motion in Japan based on recorded data, Bull. Seism. Soc. Am., Vol. 96, No. 3, pp. 879-897, 2006.
8) Boore, D. M. and Atkinson, G. M.: Ground-motion prediction equations for the average horizontal component of PGA, PGV, and 5%-damped PSA at spectral periods bet- ween 0.01 s and 10.0 s, Earth. Spec., Vol. 24, No. 1, pp. 99-138, 2008.
9) Lin, P. S. and Lee, C. T.: Ground-motion attenuation rela- tionships for subduction-zone earthquakes in northeastern Taiwan, Bull. Seism. Soc. Am., Vol. 98, No. 1, pp. 220- 240, 2008.
10) Ghasemi, H., Fukushima, Y., Koketsu, K. and Miyake, H.: Ground motion simulation for the 2008 Wenchuan, China, earthquake using the stochastic finite-fault method, Bull. Seism. Soc. Am., Vol. 100, No. 5B, pp. 2476-2490, 2010.
11) Xiang, J. and Gao, D.: The attenuation law of horizontal peak acceleration on the rock site in Yunnan area, Earth. Res. in China, Vol. 8, No. 4, pp. 509-516, 1994.
12) Koketsu, K., Yokota, Y., Ghasemi, H., Hikima, K., Miyake, H. and Wang, Z.: Source process and ground motions of the 2008 Wenchuan earthquake, No. 804, Proc. of the interna- tional conference on earthquake engineering for the 1st anniversary of Wenchuan earthquake, Chengdu, China, May, 2009.
13) Xuyen, N. D. and Thanh, T. T. M.: A formula for estimation of seismic peek ground acceleration in Vietnam, Vietnamese J. of Earth Sci., Vol. 21, No. 3, pp. 207-213, 1999.
14) Xuyen, N. D., Thanh, T. T. M. and Son, L. T.: Potential earthquake disasters in Vietnam and seismic hazard in Hanoi city area, Session 2, Group 3-3, Proc. of the 4th EqTAP multilateral workshop, Kamakura, Japan, 2001.
15) Findlay, R. H. and Trinh, P. T.: The structural setting of the Song Ma region, Vietnam and the Indochina-South China plate boundary problem, Gondwana Res., Vol. 1, No. 1, pp. 11-33, 1997.
16) Lap, N. K.: The seismotectonics of the Indochina peninsula, J. of Southeast Asian Earth Sci., Vol. 6, No. 2, pp. 55-61, 1991.
17) Huang, B. S., Son, L. T., Liu, C. C., Toan, D. V., Huang, W. G., Wu, Y. M., Chen, Y. G. and Chang, W. Y.: Portable broadband seismic network in Vietnam for investigating tectonic deformation, the Earth’s interior, and early-warning systems for earthquakes and tsunamis, J. of Asian Earth Sci., Vol. 36, No. 1, pp.110-118, 2009.
18) Campbell, K. W.: Near-source attenuation of peak horizontal acceleration, Bull. Seism. Soc. Am., Vol. 71, No. 6, pp. 2039- 2070, 1981.
19) VIG.: Research and Forecasting Earthquakes and Ground Movements in Vietnam, A report conducted by Vietnam Institute of Geophysics (VIG), Hanoi, Vietnam, 2005 (In Vietnamese).
20) Phuong, N. H.: Probabilistic assessment of earthquake hazard in Vietnam based on seismotectonic regionalization,
38s

Tectonophysics, Vol. 198, No. 1, pp. 81-93, 1991. 21) Trieu, C. D.: The strong seismogenic zones in Vietnam,
Vietnamese J. of Geology, Vol. (9-10), pp. 47-62, 1997. 22) Thuc, P. V.: Seismology and Earthquake in Vietnam,
Natural Science and Technology Publisher, Hanoi, Vietnam, 2007 (In Vietnamese).
23) Trieu, C. D., Xuan, N. T., Thang, N. C., Dung, L. V. and Tuyen, N. H.: Seismic hazard assessment in North West Vietnam, Vietnamese J. of Geology, Vol. (13-14), pp. 163- 173, 1999.
24) Trieu, C. D.: Earthquake, Science and Technology Pub- lisher, Hanoi, Vietnam, 2008 (In Vietnamese).
25) Lacassin, R., Replumaz, A. and Leloup, P. H.: Hairpin river loops and slip-sense inversion on Southeast Asian strike-slip faults, Geology, Vol. 26, No. 8, pp. 703-706, 1998.
26) Fenton, C. H., Charusiri, P. and Wood, S. H.: Recent paleoseismic investigations in northern and western Thailand, Anna. Geophys., Vol. 46, pp. 957-981, 2009.
27) Nielsen, C., Chamot-Rookea, N. and Rangin, C.: (The ANDAMAN Cruise Team). From partial to full strain partitioning along the Indo-Burmese hyper-oblique sub- duction, Marine Geology, Vol. 209, pp. 303-327, 2004.
28) Socquet, A. and Pubellier, M.: Cenozoic deformation in western Yunnan (China-Myanmar border), J. of Asian Earth Sci., Vol. 24, pp. 495-515, 2005.
29) Fukushima, Y.: Comment on “Ground motion attenuation relations for subduction zones,” Seismol. Res. Lett., Vol. 68, pp. 947-949, 1997.
30) F-net: www.fnet.bosai.go.jp. 31) Izutani, Y. and Kanamori, H.: Scale dependence of seismic
energy to moment ratio for strike-slip earthquakes in Japan, Geophysical Res. Lett., Vol. 26, No. 20, pp. 4007-4010, 2001.
32) Van, P. T. K.: The Lai chau-Dien bien neotectonic fault zone and its acting manifestations by moderate local earthquakes, Vietnamese J. of Geology, Vol. 27, pp. 30-39, 2006.
33) Xu, L. S., Chen, U. T., Feng, W. P. and Du, H. L.: Source process of Ms 6.4 earthquake in Ning’er, Yunnan in 2007, Science in China. Series D, Earth sciences (Internet), Vol. 52, pp. 180-188, 2009.
34) Zhong, T., Wen, P. and Cong, Z.: Seismic damage analysis on buildings of the Ning’er earthquake with Ms 6.4, Paper No. 01-1089, Proc. of the 14th World Conference on Earthquake Engineering, Beijing, China, 2008.
35) K-NET: www.kyoshin.bosai.go.jp. 36) Trieu, C. D.: Thintoc earthquake (Vietnam-Laos border) Ms
= 5.4 on Feb. 19, 2001, Vietnamese J. of Geology, Vol. 264, No. 5-6, pp. 1-14, 2001.
37) Boore, D. M. and Atkinson, G. M.: Boore-Atkinson NGA Ground Motion Relations for the Geometric Mean Horizontal Component of Peak and Spectral Ground Motion Parameters, PEER Report 2007/01, Pacific Earthquake Engineering Research Center, Berkeley, California, 2007.
38) Mandal, P., Kumar, N., Satyamurthy, C. and Raju, I. P.: Ground-motion attenuation relation from strong-motion records of the 2001 Mw 7.7 Bhuj earthquake sequence (2001-2006), Gujarat, India, Pure and Applied Geophysics, Vol. 166, No. 3, pp. 451-469, 2009.
39) Sharma, M. L., Douglas, J., Bungum, H. and Kotadia, J.: Ground-motion prediction equations based on data from the Himalayan and Zagros regions, J. of Earth. Eng., Vol. 13, No. 8, pp. 1191-1210, 2009.
40) Montaldo, V., Faccioli, E., Zonno, G., Akinci, A. and Malagnini, L.: Treatment of ground-motion predictive relationships for the reference seismic hazard map of Italy, J. Seismology, Vol. 9, pp. 295-316, 2005.
41) Boore, D. M., Joyner, W. B. and Fumal, T. E.: Equations for estimating horizontal response spectra and peak acceleration from western North American earthquakes: A summary of recent work, Seismol. Res. Lett., Vol. 68, pp. 128-153, 1997.
42) Campbell, K. W.: Strong motion attenuation relationships, in International Handbook of Earthquake and Engineering Seismology. W. H. K. Lee, H. Kanamori, P. C. Jennings, and C. Kisslinger (Editors), Vol. 2, Chapter 60, 2003.
43) Sadigh, K., Chang, C. Y., Egan, J. A., Makdisi, F. and Youngs, R. R.: Attenuation relationships for shallow crustal earthquakes based on California strong motion data, Seismol. Res. Lett., Vol. 68, No. 1, pp. 180-189, 1997.
44) Graizer, V. and Kalkan, E.: Ground motion attenuation model for peak horizontal acceleration from shallow crustal earthquakes, Earth. Spec., Vol. 23, No. 3, pp. 585-613, 2007.
45) Boore, D. M.: Estimating Vs(30) (or NEHRP site classes) from shallow velocity models (depths < 30 m), Bull. Seism. Soc. Am., Vol. 94, pp. 591-597, 2004.
46) FEMA 450: Building Seismic Safety Council, 2003, NEHRP Recommended Provisions for seismic regulations for new buildings and Other Structures, Part 1: Provisions, 2003 edition.
47) Trifunac, M. D.: Preliminary analysis of the peaks of strong earthquake ground motion dependence of peaks on earth- quake magnitude, epicentral distance, and recording site conditions, Bull. Seism. Soc. Am., Vol. 66, No. 1, pp. 189-219, 1976.
48) Ambraseys, N. N., Douglas, J., Sarma, S. K. and Smit, P. M.: Equations for the estimation of strong ground motions from shallow crustal earthquakes using data from Europe and the Middle East: Horizontal peak ground acceleration and spectral acceleration, Bull. of Earth. Eng., Vol. 3, No. 1, pp. 1-53, 2005.
49) Campbell, K. W. and Bozorgnia, Y.: Campbell-Bozorgnia NGA ground motion relations for the geometric mean horizontal component of peak and spectral ground motion parameters, PEER Report 2007/02, Pacific Earthquake Engineering Research Center, Berkeley, California, 2007.
50) Zhao, J. X., Zhang, J., Asano, A., Ohno, Y., Oouchi, T., Takahashi, T., Ogawa, H., Irikura, K., Thio, H. K., Somerville, P. G. and Fukushima, Y.: Attenuation relations of strong ground motion in Japan using site classification based on predominant period, Bull. Seism. Soc. Am., Vol. 96, No. 3, pp. 898-913, 2006.
51) Takahashi, T., Asano, A., Okada, H., Saiki, T., Irukura, K., Zhao, J. X., Zang, J., Thio, H. K., Somerville, P. G. and Fukushima, Y.: Attenuation relations of strong motion in Japan using site classification based on predominant period, Workshop on seismic input motions, incorporating recent geological studies, Committee on the Safety of Nuclear Installations (CSNI), OECD/NEA, 2004.
52) Chiou, B. S. J. and Youngs, R. R.: An NGA model for the average horizontal component of peak ground motion and response spectra, Earth. Spec., Vol. 24, No. 1, pp. 173-215, 2008.
53) Choi, Y. and Stewart, J. P.: Nonlinear site amplification as function of 30m shear-wave velocity, Earth. Spec., Vol. 21, No. 1, pp. 1-30, 2005.
(Received July 15, 2011)
39s