ground-motion characteristics estimated from spectral
TRANSCRIPT

Bulletin of the Seismological Society of America, Vol. 88, No. 1, pp. 228-241, February 1998
Ground-Motion Characteristics Estimated from Spectral Ratio
between Horizontal and Vertical Components of Microtremor
by Katsuaki Konno and Tatsuo Ohmachi
Abstract The spectral ratio between horizontal and vertical components (H/V ra- tio) of microtremors measured at the ground surface has been used to estimate fun- damental periods and amplification factors of a site, although this technique lacks theoretical background. The aim of this article is to formulate the H/V technique in terms of the characteristics of Rayleigh and Love waves, and to contribute to improve the technique. The improvement includes use of not only peaks but also troughs in the H/V ratio for reliable estimation of the period and use of a newly proposed smoothing function for better estimation of the amplification factor. The formulation leads to a simple formula for the amplification factor expressed with the H/V ratio. With microtremor data measured at 546 junior high schools in 23 wards of Tokyo, the improved technique is applied to mapping site periods and amplification factors in the area.
Introduction
Near-surface sedimentary deposits significantly amplify earthquake ground motion, which is often referred to as site effects. Among present approaches to the site-effect evalu- ation, an empirical one introduced by Kanai (1957) involves microtremors at periods shorter than about 1 sec. The pri- mary assumption of the Kanai method is that the source spectra are white over the period range of interest. However, the spectra of observed microtremors usually show a re- markable daily and weekly change, indicating that the spec- tra reflect the nature of the source as well as the site effects (Udwadia and Trifunac, 1973).
A technique using horizontal-to-vertical spectral ratios (H/V ratios) of the microtremors, which was first applied by Nogoshi and Igarashi (1970, 1971) and popularized by Nak- amura (1989), has sometimes been used to estimate the site effects. Several recent applications of this technique have proved to be effective in estimating fundamental periods (e.g., Field and Jacob, 1993; Ohmachi et al., 1994) as well as relative amplification factors (e.g., Lermo and Chavez- Garcia, 1994; Konno and Ohmachi, 1995). However, in the authors' opinion, the technique lacks a rigorous theoretical background still now.
Microtremors observed at the ground surface are thought to consist of body and surface waves with their pro- portion unclarified. However, there is a fact that the H/V ratios of observed microtremors and those of fundamental- mode Rayleigh waves estimated from geological date appear very similar at many sites (e.g., Tokimatsu and Miyadera, 1992; Ohmachi et al., 1994). In addition, Lachet and Bard (1994) indicated with numerical simulation that the H/V ra- tios at the longer periods were governed by fundamental-
mode Rayleigh waves. Mainly based on these facts, in this study, a large proportion of microtremors are thought to con- sist of surface waves, mainly of their fundamental modes.
This article first deals with the peak period in the H/V ratio of microtremors and its relation to the fundamental pe- riod of the response to vertically incident S waves. Next, peak values in the H/V ratio are related to the amplification factors for the S waves. In this process, a new smoothing function is proposed for getting a better correlation between them. A simple relation between the amplification factor and the H/V ratio, which is similar to a so-called Nakamura's method, is also formulated. Finally, the periods and the am- plification factors estimated from microtremor measurement at 546 stations in Tokyo are mapped as a demonstration of practicality of the present study.
Estimation of Fundamental Period from H/V Ratio
H/V Ratio of Fundamental-Mode Rayleigh Waves
Single-Layered System. Let us consider fundamental-mode Rayleigh waves in a single-layered model made up of an elastic layer over an elastic half-space, as shown in Figure 1, and neglect damping properties for both elastic media. S- wave velocity of the half-space is fixed at 500 m/sec, while the velocity of the surface layer is changed from 50 to 400 rrdsec. Thickness of a surface layer, H, is determined so as to give fundamental periods of 1 sec as follows:
H = Vs,Ts/4, (1)
228

Ground-Motion Characteristics Estimated from Spectral Ratio between Horizontal and Vertical Components of Microtremor 229
O
Vs,= 5 0 ~ 4 0 0 m/sec v= p t = 1900 kg/m 3 H = Vs,/4
Vs2 = 500m/sec v 2 p 2 = 1 9 0 0 k g / m 3 oo
Figure 1. Model of an elastic layer over a half- space. Poisson's ratios, v, were determined from Vs as follows: v = 0.499, for Vs < 150 m/sec; v = 0 . 4 9 9 - 1 . 1 6 . 1 0 - 4 ( V S - 150) , for V s >-- 150 rrdsec.
where Vsl is S-wave velocity of a surface layer and Ts is the fundamental period of S waves. At the ground surface, hor- izontal and vertical amplitudes of the jth-mode Rayleigh waves excited by a vertical point force L(co) applied at the surface are expressed as (Harkrider, 1964)
u/co, r) = [L(co)/2] [t~/v~]:Aj H(12) (k:r).co, (2a)
v~/co, r) = [L(co)12]A: H(0Z)(k:) - co, (2b)
where ai(co, r) and w/co, r) are radial and vertical velocity amplitudes at the surface, respectively, co is circular fre- quency, r is distance between the point force and an obser- vation station, [tih+]j is H/V ratio at a large distance r as defined by Haskell (1953), Aj is medium response, and kj is wavenumber. As for L(co), the following is to be used here, because it was found to give a good fitting for observed spectra of microtremors, especially at the longer periods:
L(CO) ~ co -2. (3)
Figure 2 shows three types of particle orbits during propagation of fundamental-mode Rayleigh waves in the models shown in Figure 1. Type 1 appears when a velocity contrast between the two layers is low (Vs2/Vsl <-_ 2.5), in which the particle motion is retrograde at any period. Type 2 appears when the contrast is fairly high (VsJVs~ -~ 2.5). With an increase in the period, the motion changes in a va- riety, such as retrograde, vertical only, prograde, vertical only, and retrograde. Thus, at both periods T 1 and T2 shown in Figure 2, the H/V ratio becomes 0, although T 1 and T2 in type 2 are very close to each other. Type 3 appears when the velocity contrast is very high (Vs2/Vsl >= 2.5). With the in- creasing period, the particle motion is, in order, retrograde, vertical only, prograde, horizontal only, and retrograde. Therefore, the H/V ratio becomes 0 at/ '1 and infinite at T 2. It should be noticed in type 3 that Tj is nearly half of T2, which will be discussed in detail later.
Figure 3 illustrates the three types of the H/V ratio men- tioned above, which are identical to Haskell's ratio [u/wJ0 in equation (2a). The curves for type 1 (thin solid line), type 2 (dotted line), and type 3 (thick solid line) correspond to S-
Retrograde Type 1 ~ o
Direction - of Wave
T y p e _ ~ ~ H/V=O
Prograde H/V=O H/V=oo Type ~ . _ _ ~ _ f ~
short< -- : > long T~ Period T2
o}
C o
O
o
>
r "
r -
Figure 2. Particle orbit of three types of funda- mental-mode Rayleigh waves for the models in Fig- ure 1.
1J- ZIZ ~-- 6
r e
~5 (D
o _
161 1(31
Figure 3.
j l ....... _
- Type 2
i l l i f l T1o °
Period (sec)
Three types of H/V ratio of fundamental- mode Rayleigh waves. Downward arrows show peak periods, and upward arrows show trough periods: type 1, Vsl = 250 m/sec, type 2, Vs~ = 200 rrdsec; type 3, Vs~ = 50 m/sec.
wave velocities of the surface layer of 250, 200, and 50 rrdsec, respectively. Downward arrows indicate peak pe- riods, while upward arrows trough periods. Sharp peaks do not appear in type 1 and type 2, while two deep troughs appear in type 2. Type 3 shows a sharp peak and a sharp trough, and the trough period is nearly half of the peak period.

230 K. Konno and T. Ohmachi
Figure 4 shows a comparison of four kinds of period for ground models whose fundamental period for the vertically incident S wave is set to be exactly 1.0 sec. Filled and open circles represent, respectively, peak and trough periods in the H/V ratio for the fundamental-mode Rayleigh waves, while filled and open squares represent peak periods of the H/V ratio for the first higher-mode Rayleigh waves and Airy phase periods for the fundamental-mode Love waves, re- spectively. When Vsl = 200 m/sec, the H/V ratio has two troughs (type 2), as shown in Figure 3 with two trough pe- riods very close to each other. It should be noted that Airy phase periods for fundamental-mode Rayleigh waves are the same as the trough periods in the H/V ratio of the modes.
In Figure 4, when S-wave velocity of the surface layer is smaller than 150 m/sec, both the peak periods for funda- mental-mode Rayleigh waves and Airy phase periods for fundamental Love waves are almost identical with the fun- damental periods of the S waves. Moreover, in this velocity range, the trough periods are nearly half of the peak periods. Note that peak periods of the HfV ratios of first higher-mode Rayleigh waves are slightly shorter than the trough periods, which implies that the trough of fundamental-mode Ray- leigh waves may disappear from the microtremor H/V ratios, when higher-mode Rayleigh waves significantly contribute to microtremors. Otherwise, the fundamental periods are es- timable from either the peak periods or the trough periods.
Multi-layered System. Now, let us consider realistic multi- layered systems. The downhole method was applied to mea- sure P- and S-wave velocities at 14 sites shown in Figure 5a, with results shown in Figure 5b. In Figure 6, thick dotted, thin dotted, and thin solid lines indicate, respectively, the H/V ratios of fundamental-mode Rayleigh waves, those of the first higher one, and transfer functions for vertically in- cident S waves, calculated for the ground models shown in Figure 5b. The transfer functions were calculated with the quality factor Q set to 20 for all the layers. Thick solid lines indicate the H/V ratios of observed microtremors, which will be described in detail in the following section. As can be seen in Figure 6, longest peak periods of the H/V ratios of first higher-mode Rayleigh waves are slightly shorter than the trough periods of those of fundamental-mode Rayleigh waves. It would imply that troughs might not be seen in H/V ratio of measured microtremors, if microtremors also include higher-mode Rayleigh waves. Otherwise, the fundamental periods are estimable from either the peak periods or the trough periods. In this article, the longest period among peak periods in the H/V ratio is called a peak period, and, among peak periods in a transfer function, the longest one is called a fundamental period, hereafter.
Simple ground models with high velocity contrast, such as numbers 1, 2, 3, 4, 6, and 9 in Figure 5b, tend to give the HfV ratios of fundamental-mode Rayleigh waves somewhat similar to that of type 3 shown in Figure 3. Complex ground models such as numbers 7 and 8 seem to give the H/V ratios similar to type 1 at the longer periods and type 3 at the
Type 3 Type 2 Type 1
I I .-. 2 . 0
' ' O ' I
1 . 5
n © 0 . 5 - @ - o - ~ - ~ - ~ - ~ - - - I - - , r - . , - m . . . . . c r • • •
0 I I , I I t r I 50 100 200 300 400
S-wave Velocity of Surface Layer (m/s)
Figure 4. Comparison of four kinds of period. Filled and open circles show peak and trough periods of I-I/V ratios of fundamental-mode Rayleigh waves, respectively. Filled squares show peak periods of H/V ratios of first higher-mode Rayleigh waves. Open squares show Airy phase periods of fundamental- mode Love waves. Fundamental periods of transfer function for vertically incident S waves are 1.0 sec.
shorter periods. Accordingly, with regard to the complex models, the H/V ratio of fundamental-mode Rayleigh waves is likely to show two peaks or more.
Figure 7 shows a comparison between the peak periods in the HfV ratio of fundamental-mode Rayleigh waves and the fundamental periods of S-wave transfer function, dem- onstrating a good correlation between these two kinds of period.
Figure 8 shows a comparison of Airy phase periods of fundamental-mode Love waves and the fundamental periods of the S-wave transfer function. There is a fairly good cor- relation between these periods, except numbers 8, 10, and 12 sites. For numbers 8 and 10 sites, Airy phase periods correspond to higher-mode fundamental periods of S waves. For number 12 site, there is no Airy phase over the period range of interest. The correlation suggests that the funda- mental periods are estimable from the HN ratios of observed microtremor, even when the Love waves consist of the main portion of the microtremors.
From the above discussions on Figures 4, 6, 7, and 8, it can be said that the fundamental periods of the S-wave trans- fer functions are in a good correlation with the HN peak periods of fundmnental-mode Rayleigh waves and Airy phase periods of fundamental-mode Love waves, as long as the ground structure has high velocity contrast.
H/V Ratios of Microtremors
Microtremor measurement was conducted at the ground surface of the 14 sites mentioned previously. A series of three-component time histories was simultaneously ob- served at a sampling rate of 1/50 sec for 40.96 sec, and the observation was repeated four times to secure its accuracy. As the Fourier spectra of the two horizontal components looked similar, their horizontally combined spectrum was

(a)
J
-
i#
139*T0 , 139020' 139"30' 139"40'
Ground-Motion Characteristics Estimated from Spectral Ratio between Horizontal and Vertical Components of Microtremor 231
~ ~Okm
Vs (m/s) 200 400 600 800
, ~ , e , i i I
i . . . . 10-
g ~ -
" " i O
Figure 5. (a) Location of 14 sites where soil profiles are available and microtremor mea- surements were carried out. (b) Soil profiles at 14 sites.
(b~ 0
o
10-
C 3 ~ 3 -
Vs (m/s) Vs (m/e) 200 400 600 800 200 400 600 800
30
' I ' 1 ' I 3 0 - , , ~ 4 0 r '1 [ ' I 60" '~o ',& '~& ,~o 1 6 0 0 2 4 ~ 800 1 6 0 0 2 ~ 0 800 1 6 0 0 2 4 ~
vs (m/s) 2 O 0 4 ( ; O 6 O O 8 O 0
0 1 m t . l m l , i 0
L~O
" ; C ~ e o -
8 o -
"' l , i , i I00
BOO 1600 2400 O
Vs (m/s) 2~O 400 600 800 0
I , I I i # 0
2 0
~4o-
0
IO-
EO- g
a
50
........ Vp (m/s) ........ Vp (m/s] ........ Vp (m/s) (a) No.1 (b) No .2 (c) No .3
. . . . . . . . Vp (m/s) ........ Vp (m/s) (d) No .4 (e) No .5
V s ( m / s )
2(73 4Go ~ o 8oo , I , I I = J 0
10-
4O
° li ' i , i ' I l~l , , i
,~ 2,00 o o& ,& 2& ........ Vp (m/s) ........ Vp (m/s]
(f) No .6 (g) No .7
vs (m/s) 2OO 400 6¢77 800 :i.'. ~'..'., "
20
~,° 121
60.
vs (m/s) 2 0 0 4 0 0 6 0 0 8 0 0
, I ! I , ' m 0
L I .... ! 1o-
f lO ' I ' ! , ! 40 0 800 1600 2400
V s ( m / s ) - - V s ( m / s ) V s (m/s) 0 200 400 600 8c0 0 ~ 4.oo~ ~ 0 200 400 600 800
, i , i q i L J 0 I ' I ' I ' # ¢ I 0 I i I , i , I
: ~2o "~, : 8 c
' • 2 4 1 0 0 ' I , I , ! 8 0 , , 800 11300 2400 I~O 1600 24~10
- - Vs (m/s) 20040 600800 C
I t I I i I * I
• f , i i 8 0 . 800 16002400 t . . . . . . . . Vp (rots) . . . . . . . . Vp (m/s) . . . . . . . . Vp (m/s)
(h) No .8 (i) No .9 (j) N o . 1 0
Vs (m/s) 2OO4OO6OO8OO
. . . . . . . . Vp (m/s) . . . . . . . . Vp (m/s) (k) N o . l l (I) No.12
Vs (m/s) 2 0 0 4 0 0 6 0 0 8 3 0 ?
,,. ~__. l . . i ~ , J o l i ,o ! : £ ~ -
-1 ~0 , [ , f ' | 4 0 , I ' I ' I
800 1600 2400 0 800 1 6 ~ 2400 . . . . . . . . Vp (m/s) . . . . . . . . Vp (m/s)
(m) N o . 1 3 (n) N o . 1 4
calculated first. The horizontally combined spectrum is de- fined as the maximum Fourier amplitude in a horizontal plane at an angular frequency, co. The combined and vertical spectra were then smoothed separately with Parzen window with a band width of 0.5 Hz before taking the H/V ratio.
After calculating four sets of the H/V ratios at a site, the ratios were averaged to obtain a site-specific H/V ratio.
Thick solid lines in Figure 6 indicate the averaged I-I/V ratios of microtremors, and shaded bands indicate their stan- dard deviations. Apparently, most of the H/V ratios of mi-

232 K. Konno and T. Ohmachi
101
.o_
rr"
• "~ lO 0
(9
O3
10-1
101
o
"~10
O3
10 -1
101
. o
n,,, "~ 10 0
(9 o .
O3
1o - I
101
.o_
n- • ~ 10 0
"6 (9 Q.
O3
10-1
' " '1 ' t
!--., •
- - i final ',; ,
10 -1
' " ~ ' t ' ', --___
iiii,,,,, 1 0 0
Period (sec)
(a) No.1 '"'l ' ' "y"~ .~'
- : i Ill iJ'". ' i ','., i I , ~ ] !
10 -1 10 0
Period (sec)
(e) No.5 -,-~q-- . " r - , - r p ' r r ~
- ~ •
10-1 10 0
Period (sec)
(i) No.9
10 -1 10 0 Period (sec)
(m) No.13
: . ,, , o 14 "=:- ' ' 11 . , . .
w IDI . v #~l
am ~ l
10-1 10 0
Period (sec) (b) No.2
-=-= ~ | . . -- : ', :1 :
10 -1 10 0
Period (sec)
(f) No.6
1 0 -1 10 0 Period (sec)
(j) No. lO
m
: . . . . . :.:,: . . . . . . . . .
:: _
,,,
I I I I J t~
10 -1 10 0 Period (see) (c) No.3
i ' I'"'I.;.: ' ' ' ' " " I ' , ; w
•
-I , ; : . - - 't,: " -
,i~,l , , , , , , , , I , 10 - I 10 0
Period (sec)
(g) No.7 ' " ' 1 ' ' ' " ' " 1 '
~ . , : . . . . ;%. ;
i t m~
1 0 -1 1 0 0
Period (see)
(k) No.11
I ' ° " 1 ' ' ' , ~ ° ° " 1 ~' ' I
10 -1 10 0 Period (see)
(d) No.4 ,~, . .
i/i 10 -1
: , " -= o: ~ .
• w ° ' - ~
I I I I I I l i I
10 o
Period (sec)
(h ) N o . 8
10 -1 10 0 Period (sec)
(I) No. 12
10 -1 10 0 Period (sec)
(n) No. 14
Figure 6. Comparison of H/V ratios of microtremors (thick solid line), transfer func- tions of S waves (thin solid line), and H/V ratios of fundamental (thick dotted line) and first higher (thin dotted line) modes of Rayleigh waves. H/V ratios of Rayleigh waves and transfer functions were calculated for the ground models shown in Figure 5. The shaded regions represent ± one standard deviations for H/V ratios of microtremors.

Ground-Motion Characteristics Estimated from Spectral Ratio between Horizontal and Vertical Components of Microtremor 233
crotremors show eminent peaks and troughs similar to those of fundamental-mode Rayleigh waves (thick dotted lines). At number 4, for example, the periods of the peak and the trough of the microtremors are the same as those of funda- mental-mode Rayleigh waves, and the peak period 1.2 sec is equal to twice the trough period 0.6 sec.
"o o
"o i-
u.
to
>
v
.~ .5 r "
-_~
n.-
.1
I I I I I
_ _
/
. 0 5 ( , , , I . 0 5 .1
' ' ' 1 ' " ' 1 ' '." /
/ • 1 3 ~ 5
• 7 e ' 3 4
1 0 • • e " e 6 / l ~ j
. " ; 1 2 / " 14
, , , l , , , , l , , ,
.5 1 5
Fundamental Period of S Waves (sec)
Figure 7. Comparison of H/V peak periods of fun- damental-model Rayleigh waves and peak periods of transfer function for vertically incident S waves. Each number in this figure corresponds to site number shown in Figure 6.
Figure 9 shows a comparison of trough period to peak period ratios of both microtremors and fundamental-mode Rayleigh waves at 14 sites indicated by open and filled cir- cles, respectively. At number 11 site, the H/V ratio of fun- damental-mode Rayleigh waves appears similar to type 2, which has two troughs as shown in Figure 3. Therefore, two filled circles are plotted for number 11. The period ratios for microtremors vary between 0.14 and 0.62 with a mean of 0.41, while the mean for the Rayleigh waves is 0.54. Note that these values are close to the period ratio 0.5 of a single- layered system. This fact gives us a basis to estimate fun- damental periods by means of not only peak periods but also trough periods in the H/V ratios of microtremors.
Figure 10 shows a comparison between the H/V peak periods of microtremors and fundamental periods of S-wave
. 0 - " I " I I I I' ' l I I I I I I I I
°+I" + i + . . . . . . . . . . . ,,, ,, o . - - ' ; ~- ©
0 ~ , l I 1 I i i I I I I "~" r i 1 2 3 4 5 6 7 8 9 1 0 1 1 1 2 1 3 1 4
Site Number
Figure 9. Comparison of ratios between trough periods and peak periods of H/V ratios for 14 sites. Filled and open circles show the ratios of fundamen- tal-mode Rayleigh waves and those of microtremors, respectively.
"t3
t'- @ .,--. E ~
1:3 "--," c" LL > 0
• 8 >= I~. _j
u~
0. .a-
I I I I
_
. 5 -
. 1 - - . "
.05 . 05 .1
.e.04 5 .~ 3
. e 6 • 1 3 1 9 • 7
..'i~ 2 /114
/
• 8
1 0 •
.5 1 5
Fundamental Period of S Waves (sec)
Figure 8. Comparison of Airy phase periods of fundamental-mode Love waves and peak periods of transfer function for vertically incident S waves. Each number in this figure corresponds to site number shown in Figure 6.
A to
o E
0
o
.8 13_
"1-
i i i 1 I
1 -
. 5 -
. 05 ~;''' ~1 . 0 , = .1
I i I I l ' l i l I I i,.
• 7 o . 5
12 6 01°1.~'~ 3"e'~'
e e e , , ~ l 1 3 Z g , /
. e ] 4
e l O
,J ,I ,,,I , I ,-
.5 1 5
Fundamental Period of S Waves (sec)
Figure 10. Comparison of H/V peak periods of microtremors and fundamental periods derived from transfer functions for vertically incident S waves. Each number in this figure corresponds to site number shown in Figure 6.

234 K. Konno and T. Ohmachi
transfer functions. A fairly good correlation can be seen be- tween the two kinds of period, except for numbers 7, 10, and 12. As can be seen in Figure 6, at these ttiree sites, the I-I/V ratios do not exhibit eminent peaks at around the fun- darnental periods, which seems to cause the low correlation. Among others, the transfer function for number 12 has nei- ther eminent peaks nor troughs because of low velocity con- trast. In such cases, it is difficult to estimate a fundamental period from microtremors.
Est imat ion of Amplif icat ion Factor f rom H/V Ratio
H/V Peak Value of Fundamental-Mode Rayleigh Waves
Smoothing Function. As mentioned earlier, the H/V ratios of fundamental-mode Rayleigh waves become infinite at some peak periods, from which one may think it difficult to find a correlation between amplification factors for S waves and the I-I/V ratios of Rayleigh waves. The difficulty rising from the infinity can be avoided when a smoothing process is introduced before calculating the H/V ratio of the Rayleigh waves, just like in the process of microtremor data analysis. As for the smoothing, however, attention should be paid to a smoothing function appropriate for the present purposes.
Let us consider and compare two smoothing functions. One is a Parzen window function, and the other is a newly proposed logarithmic one expressed as
WB(f, fi) = [sin (loglo(f/fc)b)/loglo(flfJ] 4, (4)
where b, f andfc are a coefficient for band width, frequency, and a center frequency, respectively. Dotted and solid lines in Figure 11 illustrate respectively Parzen windows with band width of 0.5 Hz and the logarithmic ones with b = 20, for several center periods. Periods are taken on a horizontal axis on a log scale. Due to the log scale of the axis, with an increase in the period, width of the bell-shaped Parzen win- dow increases while that of the logarithmic one keeps con- stant. Moreover, bell shapes of the Parzen window are un- symmetrical with respect to each center period, while those for the logarithmic one are symmetric. Effects of these dif- ferences become apparent when these two functions are ap- plied to H/V ratios.
Thick and thin solid lines in Figure 12 show the HN ratios of fundamental-mode Rayleigh waves in two single- layered models having different thicknesses of surface layers but the same velocity contrast with a fundamental period of 0.2 or 1.0 sec. Dotted lines in Figure 12a represent the HUV ratios smoothed with Parzen window with a band width of 0.5 Hz, and those in Figure 12b, smoothed with the loga- rithmic one with b = 10, 20, and 30. The smoothing was performed for horizontal and vertical amplitudes separately before taking these ratios, which caused a shift in a peak period, as can be seen in Figure 12.
As illustrated in Figure 12a, the peaks in the H/V ratio
09
1.0 0.8 0.61- 0.41-
°2Ij 0.10 1 I I t 1
10 0 Period (see)
Figure 11. Shapes of two types of smoothing function at center frequencies of 0.5, 1.0, 2.0, and 5.0 Hz. Dotted line: Parzen window with bandwidth of 0.5 Hz. Solid line: newly proposed window, W B, with b = 20.
smoothed by Parzen window show a difference in height whenever their peak periods are different, even for the ground models with identical velocity contrast. Tiffs must be an essential disadvantage for our present purpose of cor- relating an amplification factor with a peak value in the H/V ratios. Meanwhile, those smoothed by the logarithmic one illustrated in Figure 12b show the same height irrespective of the period as long as the b-values are the same. For this reason, the logarithmic function in equation (4) is used for the smoothing, and a correlation between amplification fac- tors and H/V ratios is sought in the following sections.
Single-Layered System. Single-layered ground models listed in Table 1 are considered here. S-wave velocity of the half-space is fixed at 500 m/sec, while the velocity Vs2/Vsl of the surface layer varies from 67 to 400 m/sec. Thickness of each surface layer is changed by equation (1), depending upon fundamental periods T s varied as 0.2, 0.4, 0.6, 0.8, 1.0, and 1.2 sec. Poisson's ratios, v, are determined from V s as follows:
v = 0.499 for Vs < 150rrdsec, v = 0.499 - 1.16.10-4(Vs - 150) for Vs >- 150m/sec.
The above relationship was obtained from Vs and Vp profiles determined by the downhole method at 85 sites in and
around Tokyo. Figure 13a shows the peak value RB of the H/V ratio of
fundamental-mode Rayleigh waves plotted against the ve- locity contrast Vs2/Vsl. Triangles indicate those for the pa- rameter b = 10 in equation (4), squares for b = 20, and

Ground-Motion Characteristics Estimated from Spectral Ratio between Horizontal and Vertical Components of Microtremor 235
Table 1 Geological Structure for the Simple Simulation Models
Layer Thickness (m) Vs (m/see) Density (kg/m 3)
~.~ 1 U ~ oo[ ] I ] ] ] I oo I su~fface ~ 67 ,0 40"--"-"~ ' .9X 103
" 1 . .i t I r t Half-space oo 500 1.9 X 10 3
of a was Thickness surface layer, H, determined from equation (1) so as to give fundamental periods, T s of 0.2, 0.4, 0.6, 0.8, 1.0, an d 1.2 sec.
1 Poisson's ratios, v, were determined from V s.
1 0 0 ¢ , , , , , , ,
| 6 [- .... o.
.,,~1 L I 1 I I l l l l l l I J t o ...... o ...... ~ ....... e-- l o 0 4
(a) Per iod (see) /
~" 0 ' ' ' '
~' ~ ~ 1 , = 1 o ~ ~ / ~:oo~ ~ (a) VdVs~ • . 0 = 1 0
o O ~ / ~ - " ' \ k , . ~ Q : I O , , , , ~ ' ~ . . . ~ . 1 .
e,, ..... G ..... Case-2 /" ....... 0 ~ C a s e - 3 ./.,P" __.... ,~-
..... ,~----- Case-4 . / . : ~ - 1 0 ~ L t I I It I l i l t I I 6 .--e--c~se-s / ~ ...~,...--%
1 O' 1 0 0 ..... e ..... Case-6 / / .-~""
(b) Pedod (see) ' * Case-7 . . . . ~ " - .... " ..... "
Figure 12. Smoothed and not smoothed H/V ratios ~ ~ - of fundamental-mode Rayleigh waves for two cases of ground model, which have a different thickness of a surface layer, while Vsl are commonly 67 m/see for each model. The thickness was determined to give a fundamental period of 0.2 and 1.0 sec. Thick solid and thick dotted lines showing peaks at about 1.0 sec represent H/V ratios for models having a fundamental period of 1.0 sec. Thin solid and thin dotted lines showing peaks at about 0.2 sec represent H/V ratios for models having a fundamental period of 0.2 sec. Solid lines represent [u/r9]0 as in equation (2). (a) The dotted lines represent H/V ratios using Parzen window with bandwidth of 0.5 Hz. (b) The dotted lines rep- resent H/V ratios using smoothing function, We, for b = 10, 20, and 30.
0 i I ~ I , I
0 2 4 6 v~lv~ (b)
8
Figure 13. Relation between H/V peak values, RB, of fundamental-mode Rayleigh waves and velocity contrast, Vs2/Vsl. (a) Triangles indicate results for b = 10, squares for b = 20, and circles for b = 30. (b) Each line indicates results for Poisson's ratio mod- els in Table 2 and for b = 20.

236 K. Konno and T. Ohmachi
3
2
1
0
i I i I i I I
i I ~ I i I i
0 2 4 6 8 vdv
Figure 14. Relation between the normalized pe- riod, Tn/Ts, and velocity contrast, Vsz/Vsl. TB: H/V peak periods of fundamental-mode Rayleigh waves. Ts: Fundamental period of transfer function for ver- tically incident S waves. Triangles indicate results for b = I0, squares for b ~ 20, and circles for b -- 30.
Table 2 Poisson's Ratio for the Simple Simulation Models
Case Surface Layer Half-space
1 0.499 for Vsl < 150 m/sec 0.458 0.499-1.16' 10-4(Vsl - 150) for Vsl ~= 150 m/sec
2 0.499 for Vsl < 150 m/sec 0.300 0.49%1.16- 10-4(Vsl - 150) for Vsl >~ 150 rrdsec
3 0.450 0.458 4 0.400 0.458 5 0.350 0.458 6 0.300 0.458 7 0.300 0.300
circles for b = 30. Evidently, the higher the velocity contrast is, the larger the peak ratio R B is. For b = 10, the peak ratio Ro is almost linearly correlated with the velocity contrast, but the lineafity disappears for a larger b-value.
The b-value has a considerable influence not only on the peak ratio but also on the peak period, as can be seen in Figure 12b. Ratios of peak periods To of fundamental-mode Rayleigh waves calculated from the smoothed H/V ratios to fundamental periods Ts of the S-wave transfer function are plotted against velocity contrasts Vs2/Vsl in Figure 14, in which triangles indicate those smoothed with b = 10, squares with b = 20, and circles with b = 30. The period ratios from b-values 20 and 30 are almost unity for the ve- locity contrast larger than 2.5.
Thus, in selection of an appropriate b-value, there seems to be a kind of trade-off between the two factors; a smaller
# 1 5
P 0
10 ° -
5
0 0 5 10 15
R,,
Figure 15. Relation between H/V peak value, RB, of fundamental-mode Rayleigh waves and amplifi- cation factors, As, for vertically incident S waves for 85 models obtained from soil data measured by the downhole method. For the amplification factors, two types of quality factor Q are taken into consideration. Circles and squares indicate results for the Q = 20 model and for the Q = Vs/lO model, respectively. Solid line shows A s = 2.5Ra. In addition, filled cir- cles represent the results for models with a single layer over a half-space (Q = 20 model).
b-value is preferable for obtaining a linear relation between peak ratios and velocity contrasts, while a larger b-value is preferable for reducing elongation in the peak period. Con- sidering these factors, b = 20 has been selected for use in the present study.
As the peak ratio R o was thought to depend on Poisson's ratio, those for several Poisson' s ratios listed in Table 2 were calculated with b = 20 and plotted in Figure 13b. Obvi- ously, the peak ratio R8 tends to increase with a decrease in Poisson's ratio, especially of a surface layer. However, the relations between R o and Vs2/Vsl are similar when the Pois- son's ratio of a surface layer is over 0.45 (cases 1, 2, and 3 in Fig. 13b). As Poisson's ratio is known approximately to be equal to 0.5 for soft saturated soils but to decrease with increasing stiffness of soils (Ishihara, 1996), it seems rea- sonable to try to formulate for case 1 as long as our primary interest is toward such ground conditions.
Multi-layered System. Realistic ground models were ob- tained by applying the downhole method at 85 sites in and around Tokyo. When the H/V ratio of fundamental-mode Rayleigh waves has two peaks or more, the peak at a longer period was found usually to correspond to the fundamental one of the S-wave transfer function (Fig. 7).
For the transfer functions, two types of quality factor Q are taken into consideration. One is a constant Q set to

Ground-Motion Characteristics Estimated from Spectral Ratio between Horizontal and Vertical Components of Microtremor 237
101
.0_
r r "~ 10 0 4--= o (u EL
GO
10" 1
101
0
n" -~ lO 0
63 EL GO
10-1
101
. o
r r 10 0
"6 (9 EL
GO
10-1
101
0
rr" "~ 10 0
63 EL
GO
10 -1
. . . . . . . . . . \ :
"v"
, , , i , , , , , , , , I I 10-1 10 0
Period (sec) (a) No.1
' " " 1 ' ' ' ° " " 1 ° i i
,. : - i -
I , , 1 " I f , ~ , t , , I I 10-1 10 0
Period (sec) (e) No.5
1 , , I l I , , , , 1 1 1 1 I
! . . . . ..% /
~11,1 i , , l l t l l l , 10- I 10 0
Period (sec) (i) No.9
"-" -5--
' " " I "' ' " I ' ' ' " I '
, , , , I , , , , , , , , I , 10- I 10 0
Period (sec) (b) No,2
i , r , l - i J I I ' l i , q l
\ -
, , i , l ' ' , " , I l l , 10- I 10 0
Period (sec) (f) No.6
' " ' 1 ' ' ' " ' " 1 °
j . . . .---. . . . . . . . .
10-1 10 0 Period (sec)
(i) No.lO
10 -f 10 0 10-1 10 0 Period (sec) Period (sec) (m) No. 13 (n) No. 14
l , , I " - i ' ' ' " " I '
I l l l I l I I l l l | i I
10 -1 10 0 Period (sec) (c) No.3
10- ! 10 0 Period (sec) (g) No.7
'" '1 ' ' " ' " ' 1 ° i - m
\ ,
! l l l l l I I I I I I I I I I
10 -1 10 0 Period (sec)
(k) No .11
'" '1 ' ' " ' " '1
i , , , , l i , , , , , , d
10 -1 10 o Period (sec) (d) No.4
7,, ' , I , ', , , , , , , ~ .... ,
. . . . \ /
: j
,,,I , , , , , , , , l , ] 10-1 10 0
Period (sec) (h) No.8
~ " l ' ' ' ' " " l '
, , , I , I , , , , , , [ I 10 -I 10 0
Period (sec) (I) No. 12
Figure 16. Comparison of H/V ratios of microtremors (thick solid line) and fun- damental-mode Rayleigh waves (dotted line) used by smoothing function We, and transfer functions for vertically incident S waves (thin solid line) at 14 sites shown in Figure 5.

238 K. Konno and T. Ohmachi
Q = 20 for all the soils, and the other is a velocity-dependent Q given by Q = Vs/lO. The peak ratios R B of fundamental- mode Rayleigh waves at the longest period are plotted against the amplification factor A s at the fundamental period of the S-wave transfer functions in Figure 15, in which cir- cles are for the Q = 20 model and squares for Q = Vs/lO. As can be seen in Figure 15, there are two main groups of data, one with Re = 1 to 3 corresponds to type 1 or 2 as shown in Figure 3, another one with R e = 4 to 7 corresponds to type 3. The amplification factor As tends to increase with an increase in the peak ratio Re. These results are contradic- tory with the poor correlation found by Lachet and Bard (1994). At least two reasons for these differences might be considered. One is that fundamental-mode Rayleigh waves alone are taken into account here, while Lachet and Bard (1994) took surface and body waves into account. The other is their soil profiles with Poisson's ratios different from those used here.
Filled circles in Figure 15 represent the results for mod- els with a single layer over a half-space (Q = 20 model). The relations between A s and RB are not linear for single- or multi-layered media. However, for simplicity, if we use the following relation shown by the solid line in Figure 15, we can get a simple formula proposed by Nakamura (1989), as follows:
As = 2.5Re. (5)
If microtremors consist of fundamental-mode Rayleigh waves alone, amplification factors are estimable from the As versus Re relation shown in Figure 15 or equation (5). When microtremors consist of fundamental-mode Rayleigh and Love waves, the H/V ratio of the microtremors can be de- composed as
Ru(T) = [HR(T) + HL(T)]IVR(T), (6)
where T is period, HR(T) and HL(T) are horizontal compo- nents of the Rayleigh and Love waves, respectively, and VR(T) is a vertical component of the Rayleigh waves. The proportion of the Rayleigh waves in horizontal components of microtremors is expressed as
fl(T) = He(T)/[HR(T) + HL(T)]. (7)
Combining equations (6) and (7) leads to
RM(T) = HR(T)/[/~(T)" V~(T)] (8)
in which HR(T)/VR(T) denotes the H/V ratio of the Rayleigh waves. After smoothing with the function We, H/V ratios of microtremors are expressed as
RMB(T ) = Rz~(T)/~(T) (9)
in which RMB(T ) and RB(T) are the HIV ratios of microtre-
15
10
5
0
: U - ,
0 5 10 15 As
Figure 17. Comparison of H/V peak value, RM~, of measured microtremors and amplitude factors, As, derived from transfer function of vertically incident S waves. Solid line shows RM8 = As. Each number in this figure corresponds to site number shown in Fig- ure 16.
mors and the Rayleigh waves, respectively. Substituting equation (5) into equation (9) leads to
As = 2.5 fl RMB (10)
in which Rue and As are the values of RMe(T) and As(T) at their peak periods. If the value of fl at each site is given, amplification factors can be estimated by using equation (10). However, there has been little knowledge available about in situ fl(T). According to a spatial autocorrelation study by Miyadera and Tokimatsu (1992), fl in the field tends to vary from site to site but lies between 0.3 and 0.5. Thus, even if it is a very strong assumption, fl = 0.4 is tentatively assumed irrespective of site in this article. Then, substituting fl = 0.4 in equation (10) leads to a very simple formula for A s, which is equivalent to Nakamura's method.
A s ~ RUB. (11)
Figure 16 shows a comparison of HN ratios of measured microtremors plotted by thick solid lines, fundamental-mode Rayleigh waves plotted by dotted lines, and transfer func- tions for vertically incident S waves plotted by thin solid lines. Numbers of the sites are identical to those mentioned for Figure 5, and the transfer functions were calculated with Q = 20. Note that the two troughs in Figure 6k are unified in Figure 16k by smoothing the H/V ratio of fundamental- mode Rayleigh waves. The peak ratios RuB of measured microtremors and amplification factors As that were read from Figure 16 are compared in Figure 17, in which a solid line indicates RMB = As. As a whole, there appears a fairly

Ground-Motion Characteristics Estimated from Spectral Ratio between Horizontal and Vertical Components of Microtremor 239
0 5 10 km
1 3 9 0 4 0 , 1 3 9 % 0 '
Figure 18. Distribution of 546 fundamental periods estimated from I-I/V ratios of microtremor. Size of circles shows fundamental periods. Patterns of hachure show subsurface geology.
good correlation between RuB and A s . However, although the values of RMB and A s are almost the same, there is a considerable difference between peak periods and funda- mental periods at numbers 7, 10, and 12, as can be seen in Figures 6 and 16. Thus, this is a limitation of the present technique that needs to be solved.
Applicat ion to Mapping of Periods and Amplif icat ion Factors
As a practical application, the present technique was applied to mapping fundamental periods and amplification factors after estimating them from microtremor data at 546 junior high schools in 23 wards in Tokyo.
Figure 18 shows a map of the estimated fundamental periods. In the period estimation, peaks in the H/V ratios of the microtremors were used in most cases, but troughs were sometimes used depending upon which was clearer. Size of a circle is proportional to the periods. Hatched square pat- terns indicate the subsurface geology. Apparently, the esti-
mated fundamental periods are shorter at loam sites and longer at clay sites, which is consistent with the existing map by Tajime et al. (1977).
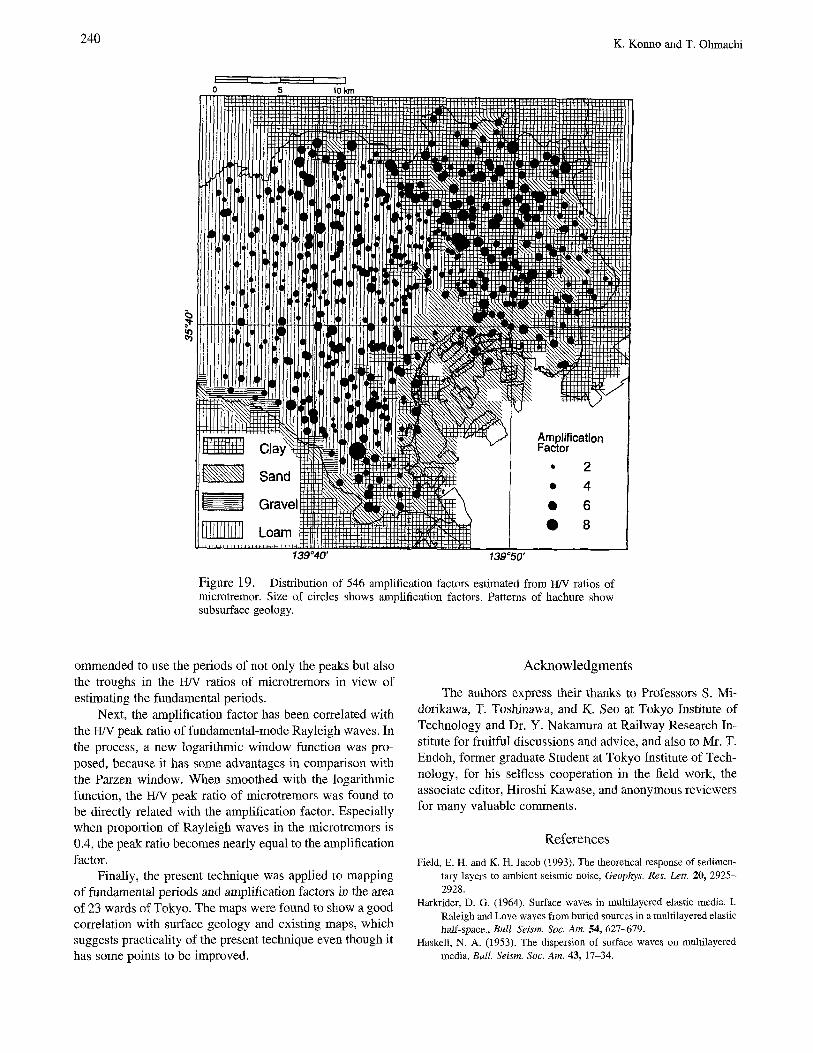
Figure 19 shows a map of the estimated amplification factors, which was also found to be consistent with the ex- isting map by Shima (1987). It is interesting to note that the distribution of the amplification factors seems to be corre- lated with the surface geology to some extent but that the correlation is not as high as that of the fundamental periods.
Conclusions
In this study, assuming that microtremors consist of sur- face waves, the H/V technique has been formulated in terms of Rayleigh and Love waves in layered soils.
First, peak periods in the H/V ratios of fundamental- mode Rayleigh waves agree well with fundamental periods of transfer functions for vertically incident S waves, and the H/V ratio tends to show a trough at half of the peak period when a site has soft surface soils. Based on these, it is rec-
240 K. Konno and T. Ohmachi
I ...... I I ' I - I
0 5 10 k r n
139040 ' 139"50'
Figure 19. Distribution of 546 amplification factors estimated from tt/V ratios of microtremor. Size of circles shows amplification factors. Patterns of hachure show subsurface geology.
ommended to use the periods of not only the peaks but also the troughs in the H/V ratios of microtremors in view of estimating the fundamental periods.
Next, the amplification factor has been correlated with the H/V peak ratio of fundamental-mode Rayleigh waves. In the process, a new logarithmic window function was pro- posed, because it has some advantages in comparison with the Parzen window. When smoothed with the logarithmic function, the H/V peak ratio of microtremors was found to be directly related with the amplification factor. Especially when proportion of Rayleigh waves in the microtremors is 0.4, the peak ratio becomes nearly equal to the amplification factor.
Finally, the present technique was applied to mapping of fundamental periods and amplification factors in the area of 23 wards of Tokyo. The maps were found to show a good correlation with surface geology and existing maps, which suggests practicality of the present technique even though it has some points to be improved.
Acknowledgments
The authors express their thanks to Professors S. Mi- dorikawa, T. Toshinawa, and K. Seo at Tokyo Institute of Technology and Dr. Y. Nakamura at Railway Research In- stitute for fruitful discussions and advice, and also to Mr. T. Endoh, former graduate Student at Tokyo Institute of Tech- nology, for his selfless cooperation in the field work, the associate editor, Hiroshi Kawase, and anonymous reviewers for many valuable comments.
R e f e r e n c e s
Field, E. H. and K. H. Jacob (1993). The theoretical response of sedimen- tary layers to ambient seismic noise, Geophys. Res. Lett. 20, 2925- 2928.
Harkrider, D. G. (1964). Surface waves in multilayered elastic media. L Raleigh and Love waves from buried sources in a multilayered elastic half-space., Bull. Seism. Soc. Am. 54, 627-679.
Haskell, N. A. (1953). The dispersion of surface waves on multilayered media, Bull. Seism. Soc. Am. 43, 17-34.

Ground-Motion Characteristics Estimated from Spectral Ratio between Horizontal and Vertical Components of Microtremor 241
Ishihara, K. (1996). Soil Behaviour in Earthquake Geotechnics, Oxford Engineering Science Series 46, Oxford Science Publications, 120- 123.
Kanai, K. (1957) The requisite conditions for predominant vibration of ground, Bull. Earthquake Res. Inst. Tokyo Univ. 31, 457.
Kanai, K. and T. Tanaka (1961). On mierotremors VIII, Bull. Earthquake Res. Inst. Tokyo Univ. 39, 97-114.
Konno, K. and T. Ohmachi (1995). A smoothing function suitable for es- timation of amplification factor of the surface ground from microtre- mor and its application, J. JSCE, 525, 1-33, 247-259 (in Japanese with English abstract).
Lachet, C. and P. Y. Bard (1994). Numerical and theoretical investigations on the possibilities and limitations of Nakamura's technique, J. Phys. Earth 42, 377-397.
Lermo, J. and F. J. Chavez-Garcia (1994). Are microtremors useful in site response evaluation? Bull. Seism. Soc. Am. 84, 1350-1364.
Miyadera, Y. and K. Tokimatsu (1992). Sampling of surface waves in short- period microtremors, Proc., Ann. Meet. JSSMFE, 965-966 (in Japa- nese).
Nakamura, Y. (1989). A method for dynamic characteristics estimation of subsurface using microtremor on the ground surface, QR ofRTR130, 25-33.
Nogoshi, M. and T. Igarashi (1970). On the propagation characteristics of microtremors, J. Seism. Soc. Japan 23, 264-280 (in Japanese with English abstract).
Nogoshi, M. and T. Igarashi (1971). On the amplitude characteristics of microtremors, J. Seism. Soc. Japan 24, 24--40 (in Japanese with En- glish abstract).
Ohmachi, T., K. Konno, T. Endoh, and T. Toshinawa (1994). Refinement and application of an estimation procedure for site natural periods using microtremor, J. JSCE 489, 1-27, 251-261 (in Japanese with English abstract).
Shima, E. (1987). Seismic microzoning map of Tokyo, Proc. 2nd Intern. Conf. Microzonation 1, 433-443.
Tajime, T., T. Mochizuki, and I. Matsuda (1977). Ground conditions and earthquake damage, Maki Publisher, 65-69 (in Japanese).
Tokimatsu, K. and Y. Miyadera (1992). Characteristics of Rayleigh waves in microtremors and their relation to underground structures, J. Struct. Constr. Eng. AIJ 439, 81-87 (in Japanese with English abstract).
Udwadia, F. E. and M. D. Trifunac (1973). Comparison of earthquake and microtremor ground motions in E1 Centro, California, Bull Seism. Soc. Am. 63, 1227-1253.
Department of Civil Engineering Shibaura Institute of Technology 3-9-14 Shibaura, Minato-Ku, Tokyo 108 Japan E-mail: konno @ sic.shibaura-it.ac.jp
(K.K.)
Interdisciplinary Graduate School of Science and Engineering Tokyo Institute of Technology 4259 Nagatsuta, Midori-Ku, Yokohama 226 Japan
(T.O.)
Manuscript received 1 May 1996.