ground subsidence: infrastructure impact, …€¦ · 2 subsidence is a consequence of withdrawing...
TRANSCRIPT

1
Ground Subsidence: Infrastructure Impact, Ground Subsidence: Infrastructure Impact, Investigations, Solutions and MonitoringInvestigations, Solutions and MonitoringMike Rucker, P.E.Mike Rucker, P.E.AMEC Earth & Environmental, IncAMEC Earth & Environmental, IncTempe, AZ [email protected], AZ [email protected]
2010 NACE Western Region 2010 NACE Western Region County Engineers SymposiumCounty Engineers Symposium

2
Subsidence is a Consequence of WithdrawingSubsidence is a Consequence of WithdrawingGroundwater Faster than it can be RechargedGroundwater Faster than it can be Recharged
Areas of subsidence attributed to groundwater overdraftGalloway et al, 1999
Subsidence at Mendota, CAUSGS
“Subsidence causes permanent inundation of land, aggravates flooding, changes topographic gradients, ruptures the land surface, and reduces the capacity of aquifers to store water” (T.L. Holzer and D.L. Galloway, 2005)
2010 NACE Western Region County Engineers Symposium

3
Ground Subsidence Ground Subsidence –– Infrastructure ImpactsInfrastructure Impacts
Extruded well casing south of Cochise, AZ
Irrigation canal grade change,
west of Glendale,
AZ
Impact infrastructure sensitive to differential elevations & graImpact infrastructure sensitive to differential elevations & gradesdes-- Gravity water conveyanceGravity water conveyance-- sewerssewers-- collapse of deep well casingscollapse of deep well casings
Rail spur grade change south of Cochise, AZ2010 NACE Western Region County Engineers Symposium

4
Ground Subsidence Ground Subsidence –– Floodplain ImpactsFloodplain Impacts
Images from ADWR, 2010
Relative ground elevation changes lead to floodplain changes Relative ground elevation changes lead to floodplain changes ––-- Luke AFB closed 3 days in 1992; flooding caused by 18 ft differLuke AFB closed 3 days in 1992; flooding caused by 18 ft differential ential
subsidence & reversal of Dysart Drainsubsidence & reversal of Dysart Drain-- Wenden AZ 2010 flooding influenced by subsidenceWenden AZ 2010 flooding influenced by subsidence
2010 NACE Western Region County Engineers Symposium

5
Basic Subsidence mechanismsBasic Subsidence mechanisms
2010 NACE Western Region County Engineers Symposium

6
Subsidence can lead to another class of problem Subsidence can lead to another class of problem ––Earth FissuresEarth Fissures
2010 NACE Western Region County Engineers Symposium

7
Earth Fissures can Impact Linear Infrastructure suchEarth Fissures can Impact Linear Infrastructure suchas Canals, Highways & Flood Control Structuresas Canals, Highways & Flood Control Structures
I-70, Northern NevadaMcMicken Dam, AZ
2010 NACE Western Region County Engineers Symposium

8
Typical Sequence of Earth Fissuring Typical Sequence of Earth Fissuring Shallow ImpactsShallow Impacts
Adapted from Bell, 19812010 NACE Western Region County Engineers Symposium

9
Waterlinebreak -developedovernight
Example Earth Fissure Problem Example Earth Fissure Problem ––Mine Dewatering in Northern NevadaMine Dewatering in Northern Nevada
2010 NACE Western Region County Engineers Symposium

10
Detecting & Monitoring SubsidenceDetecting & Monitoring Subsidence
Repeat GPS & Level Surveys
Satellite-based Interferometry bySynthetic Aperture Radar (InSAR)
2010 NACE Western Region County Engineers Symposium
11
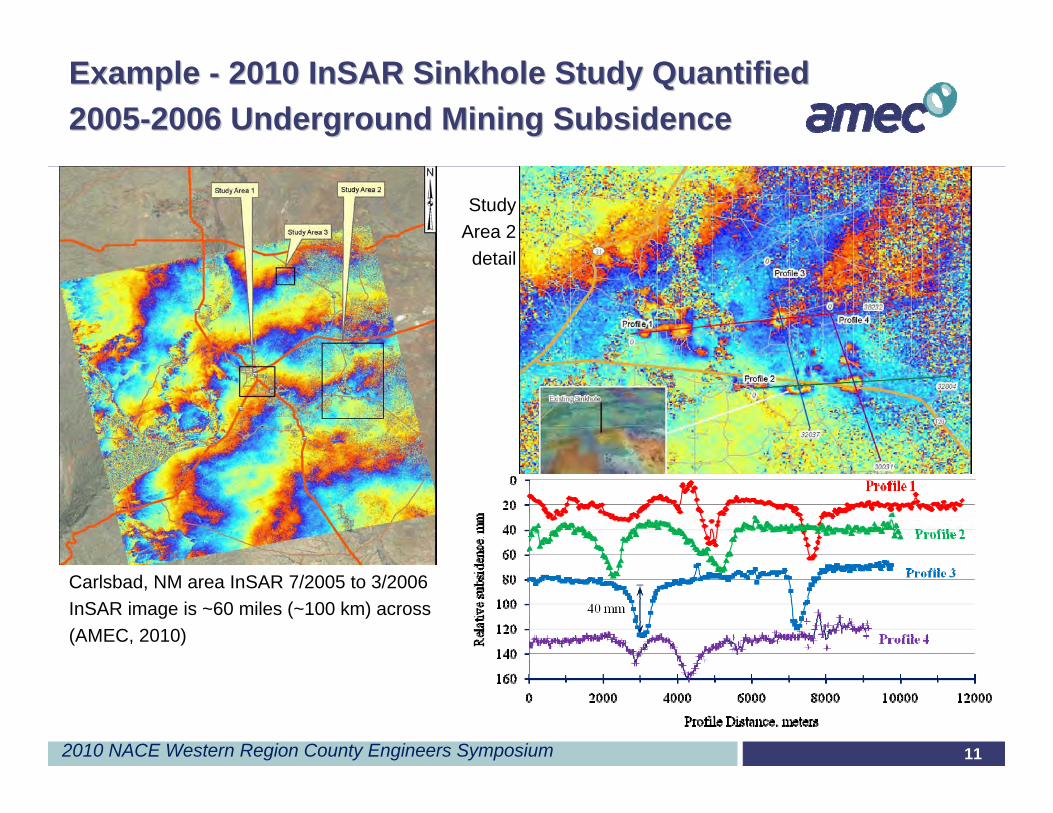
Example Example -- 2010 InSAR Sinkhole Study Quantified2010 InSAR Sinkhole Study Quantified20052005--2006 Underground Mining Subsidence2006 Underground Mining Subsidence
Carlsbad, NM area InSAR 7/2005 to 3/2006InSAR image is ~60 miles (~100 km) across(AMEC, 2010)
StudyArea 2
detail
2010 NACE Western Region County Engineers Symposium

12
Recent InSAR for Willcox AZ
area
Results of GPS monitoring atPower plant ash pond facility1996 – 2008, part of continuingAPP monitoring work
Survey requires Historic & Continuing Effort Survey requires Historic & Continuing Effort ––InSAR can be used to obtain Past History! InSAR can be used to obtain Past History!
Relative Settlements (feet) & Apparent Strains Between GPS Survey Monuments/Benchmarks - October 1996 to December 2008
8400
8600
8800
9000
9200
9400
9600
9800
7000 7200 7400 7600 7800 8000 8200 8400 8600 8800 9000
AZ Coordinate System East, 23xxxx meters
AZ
Coo
rdin
ate
Syst
em N
orth
, 11x
xxx
met
ers
Strain %>0.01
0.008 - 0.01
0.005 - 0.008
-0.01 - 0.005<-0.01
error not addressed
1.541.94
1.74
1.72
1.80
1.09
1.26
1.29
1.621.74
1.54
1.51 2.27 2.041.14 2.13 2.43 1.83
1.291.50 .91 1.72 2.04
1.92
1.15 1.86 1.05 1.39.85 1.76
0.043%
0.033%
0.028%
0.030%
0.021%
0.029% 0.043% 0.050% 0.044%1.5
2
1.5
11.5
2
10/2008 -10/200910/1996 – 12/2008
Where archived data is available, InSAR data exists as far back as 1992.
2010 NACE Western Region County Engineers Symposium

13
2008 – with trash
2003 2004
2006post-flood
Subsidence and Earth Fissuring are Dynamic,Subsidence and Earth Fissuring are Dynamic,TimeTime--related Phenomenarelated Phenomena
Earth fissure gully developmentNorth of Dragoon Rd, Cochise County, AZ
2010 NACE Western Region County Engineers Symposium

14
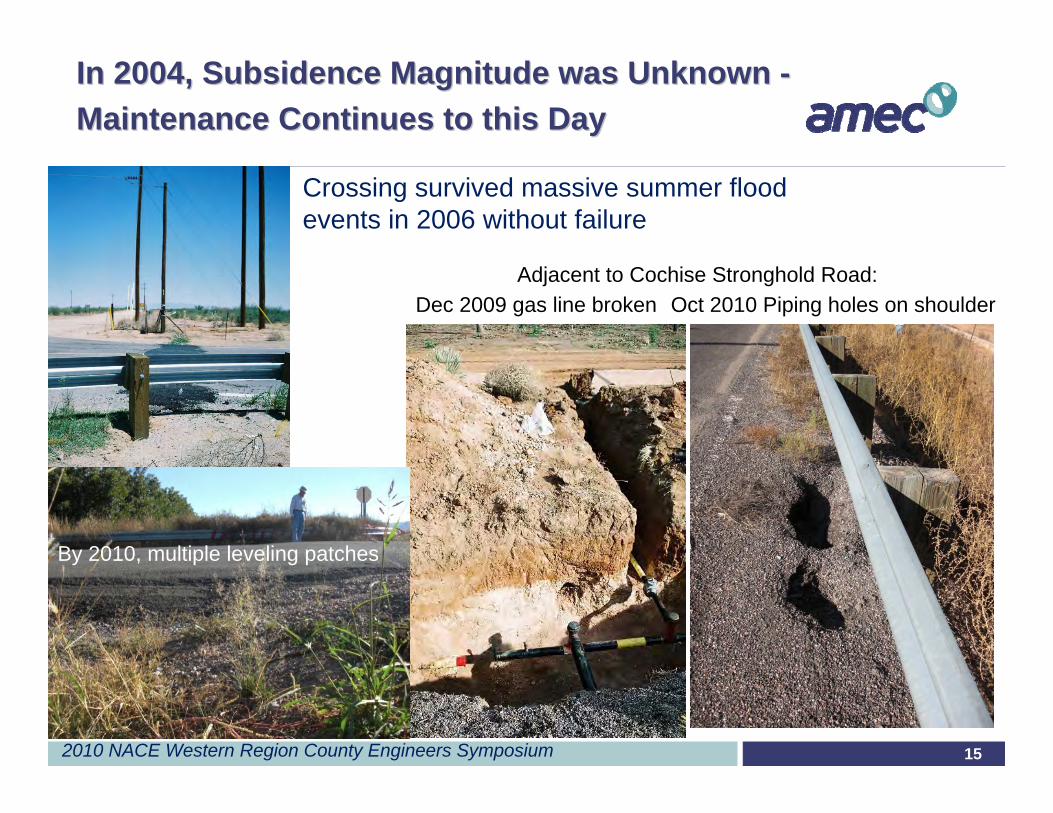
Meanwhile, at Dragoon Road Meanwhile, at Dragoon Road ––Local Mitigation to Prevent Catastrophic FailureLocal Mitigation to Prevent Catastrophic Failure
Earth fissure crossed Dragoon Road &Cochise Stronghold Road –Crossing reinforced to prevent piping failure(2004)
2010 NACE Western Region County Engineers Symposium
15
In 2004, Subsidence Magnitude was Unknown In 2004, Subsidence Magnitude was Unknown --Maintenance Continues to this DayMaintenance Continues to this Day
Crossing survived massive summer flood events in 2006 without failure
By 2010, multiple leveling patches
Dec 2009 gas line brokenAdjacent to Cochise Stronghold Road:
Oct 2010 Piping holes on shoulder
2010 NACE Western Region County Engineers Symposium
16
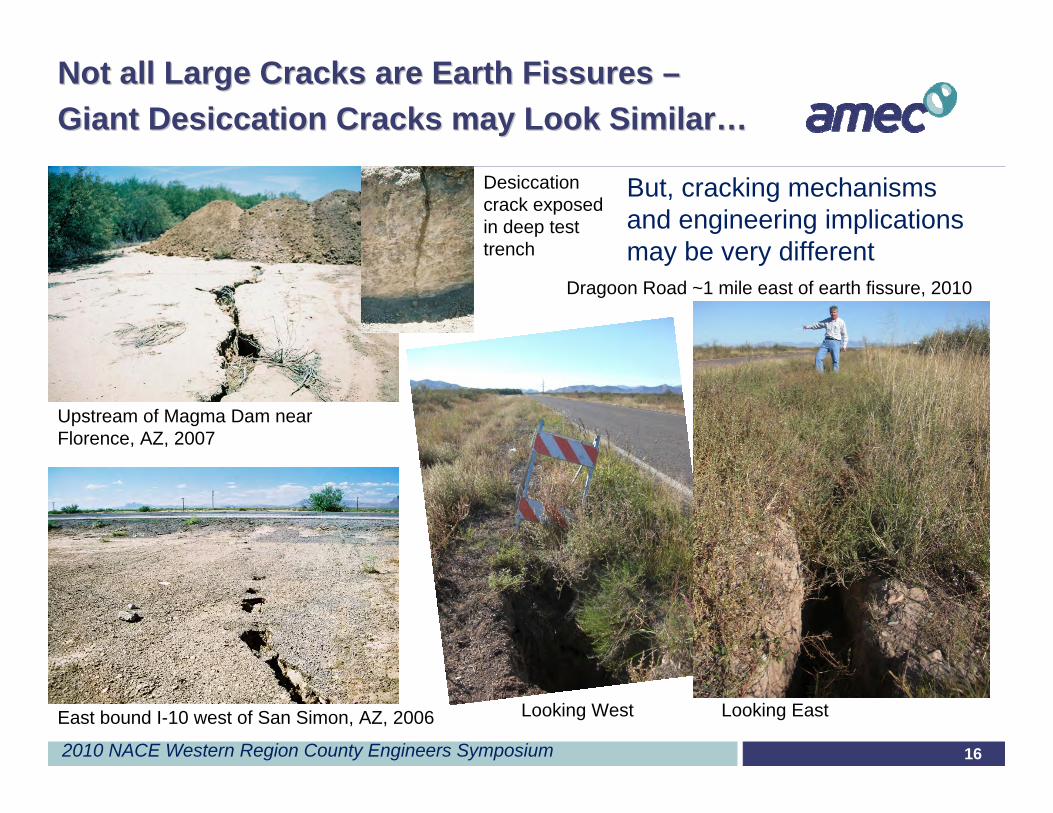
Not all Large Cracks are Earth Fissures Not all Large Cracks are Earth Fissures ––Giant Desiccation Cracks may Look SimilarGiant Desiccation Cracks may Look Similar……
Dragoon Road ~1 mile east of earth fissure, 2010
Upstream of Magma Dam near Florence, AZ, 2007
Desiccation crack exposed in deep test trench
East bound I-10 west of San Simon, AZ, 2006
But, cracking mechanisms and engineering implications may be very different
Looking West Looking East
2010 NACE Western Region County Engineers Symposium

17
Soil Cement Core Upstream Soil Cement Apron
Keys to Understanding Subsidence: Geometry, Keys to Understanding Subsidence: Geometry, Material Properties, Pore Pressure ChangeMaterial Properties, Pore Pressure Change
Basin Alluvium Characterization Based on Deep Well Geophysical Results
100200300400500600700800900
10001100120013001400150016001700180019002000
1 10 100 1000 10000 1E+05 1E+06 1E+07 1E+08 1E+09 1E+10 1E+11 1E+12 1E+13 1E+14 1E+15
Short Normal (SN) Resistivity, ohm-mCaliper (cal) and gamma density (G-G) results at SG-6 are relative
Dep
th, f
t
SG-18 Short Normal SG-1 Short Normal SG-2 Short Normal
SG-21 Short Normal SG-4 Short Normal SG-6 caliper
SG-6 relative density SG-10 Short Normal SG-12 Short Normal
Bedrock low-perm clay hi-perm alluvium
approx water table (1978)
SG-18 SG-1,-2 SG-21 SG-4 SG-10 SG-12
2 10 30
SG-6
2 10 30 2 10 30 2 10 30
2 10 30 2 10 30
Northwest SoutheastVineyard FRSPowerlineUS 60
relative scale
East Salt River Valley CAP deep basin well data &
corresponding InSAR 1992-2000
Note extensive InSAR subsidence
signatures correlating to low resistivities
(<10 ohm-m)
2010 NACE Western Region County Engineers Symposium

CASE STUDY CASE STUDY ––Characterization, Remediation, and Characterization, Remediation, and Monitoring of a SubsidenceMonitoring of a Subsidence--Impacted Dam: Impacted Dam: McMicken Dam, ArizonaMcMicken Dam, Arizona
Subsidence up to ~5 ft at dam from groundwater withdrawal.
Mountain front
Earth fissure zone
Earth fissures were originally identified nearby in 1980 and were found to be threatening the dam in 2002.
Mitigated southern end
~18 ft subsidence1957-1992
earthfissuresInSAR 1996-1999 (ADWR)
2010 NACE Western Region County Engineers Symposium

19
General Subsidence History in West General Subsidence History in West Salt River Valley Salt River Valley --
Period of rapid groundwater decline with associated
Rapid subsidence
Followed by
Period of groundwater stability / rise with associated
Reduced subsidence
Figure 8 - Water Level Data Trends near Sarival Ave. and Northern Ave.With Measured Subsidence along Reems Road at Peoria Ave. and Olive Ave.
500
550
600
650
700
750
800
850
900
950
1000
May-27 May-37 May-47 May-57 May-67 May-77 May-87 Apr-97 Apr-07
Date
Wat
er T
able
Ele
vatio
n (fe
et)
0
2
4
6
8
10
12
14
16
18
20
Mea
sure
d Su
bsid
ence
(fee
t)
B-02-01 06DBB3 water level B-02-01 06DBB2 water level B-03-02 25DBB water level B-03-01 29BCC water levelB-02-02 02BAD water level B-03-01 30NE subsidence Peoria Ave B-03-01 31NE subsidence Olive Ave
InSAR trend
roadway plans & profile 1965
wellelev
1100
elev0
elev-900
0 10 20 ohm-m
(B-3-1)32ddaResistivityWell Log
water conductivity (1986) ~500-600 umho/cmwater resistivity ~2000-1600 ohm-cm (20-16 ohm-m)
UAU
MAU
2010 NACE Western Region County Engineers Symposium

20
General Subsidence History in West General Subsidence History in West Salt River Valley Salt River Valley --
5 Ft
10 Ft
15 Ft
Subsidence 1957 – 1991 (Schumann, 1992))Percent Fines Above 700 ft. and Earth Fissures
Stulik and Twenter, 1964 and AZGS 2010 NACE Western Region County Engineers Symposium

21
Earth Fissure Threatening McMicken Dam Earth Fissure Threatening McMicken Dam ––Initial Earth Fissure Tracing Effort (2002)Initial Earth Fissure Tracing Effort (2002)
2010 NACE Western Region County Engineers Symposium

22
Earth Fissure Features Traced Using Earth Fissure Features Traced Using Conventional Seismic RefractionConventional Seismic Refraction
2010 NACE Western Region County Engineers Symposium

23
Gravity Survey(bedrock depth)& InSAR(alluvium lithology)
There were no logged deep wells in the area to provide useful data for depth to bedrock or subsurface characterization
Begin Deep Basin Characterization withBegin Deep Basin Characterization withGravity Survey & InSAR InterpretationGravity Survey & InSAR Interpretation
2010 NACE Western Region County Engineers Symposium

24
Refraction Microtremor (ReMi) for shallower bedrock Refraction Microtremor (ReMi) for shallower bedrock spot depths to calibrate gravity interpretationsspot depths to calibrate gravity interpretations
ReMi uses surface waves (Rayleigh waves) to investigate and interpret a vertical 1-D s-wave profile to depths potentially greater than 100 meters
Equipment here included a 12 channel seismograph, 240-m cable, 4.5 Hertz low frequency geophones
Energy source is typically ambient noise; at quiet site, a vehicle driven alongside or beyond the array was energy source
South End McMicken Dam Dispersion Curve
1000
10000
0 0.1 0.2 0.3 0.4 0.5 0.6
1 / Frequency (Hz)
S-w
ave
Vel
ocit
y, fe
et/s
econ
d
0
50
100
150
200
250
300
Inte
rpre
ted
Dep
ths,
feet
s-wave =2000 f/s
s-wave =6200 f/s
s-wave =8500 f/s
2010 NACE Western Region County Engineers Symposium

25
Resistivity Profile - Wenner MethodMcMicken Dam at INSAR Subsidence Bowl MS-40
100
1000
10000
100000
1 10 100 1000
Spacing, feet
Res
istiv
ity, o
hm-c
m
Measured Rshallow estimatedeep estimateintermediate estimate
Shallow Interpretation:R shallow = 20,000
Interface depth = 4 feetR deep = 12,000
Q2 = -.25
Deep Interpretation:R shallow = 700
Interface depth = 460 feetR deep = 10,000
Q2 = .87
Intermediate Intepretation:R shallow = 12,000
Interface depth = 140 feetR deep = 630
Q2 = -.90
Resistivity Soundings to Resistivity Soundings to Characterize Basin Alluvium Characterize Basin Alluvium
Confirmed presence & approximate depth to extensive localized clay bodies with resistivity < 1,000 ohm-cm (<10 ohm-m), whose presence was inferred by InSAR subsidence bowls
4-point Wenner array method with electrode spacings of 5, 10, 20, 50, 100, 200, 333, 500, 750 and 1000 ft was used.
2010 NACE Western Region County Engineers Symposium

26
Clay Thickness Contour Map from InSAR Data;Clay Thickness Contour Map from InSAR Data;Clay confirmed by Deep ResistivityClay confirmed by Deep Resistivity
Depth to top of clay body could be inferred at an historic well that penetrated into the body, and from approximate interpreted depths to a low resistivity layer from deep resistivity soundings.
For model development purposes, a representative ‘clay body’ with significant time-delay consolidation behavior was assumed to be present and scale in thickness to the magnitude of local subsidence as inferred from InSAR
2010 NACE Western Region County Engineers Symposium

27
Synthesis of Geophysical Results into Coherent Synthesis of Geophysical Results into Coherent Geologic and Finite Element Model Profiles Geologic and Finite Element Model Profiles
ClayeyUAU
Bedrock
Section A-A
x-distance (feet) (x 1000)0.0 0.5 1.0 1.5 2.0 2.5 3.0 3.5 4.0 4.5 5.0 5.5 6.0 6.5 7.0 7.5 8.0 8.5 9.0 9.5
Ele
vatio
n (fe
et) (
x 1
000)
0.50.70.91.11.31.5
2010 NACE Western Region County Engineers Symposium

28
600
700
800
900
1000
1100
1200
Jan-30 Jan-40 Jan-50 Jan-60 Jan-70 Jan-80 Jan-90 Jan-00 Jan-10 Dec-19 Dec-29
Date
Wat
er L
evel
Ele
vatio
n, fe
et
Model (A-A, C-C, D-D)
Model (B-B)
612984 1000 ft
612978 1000 ft612957 1000 ft
612989 1533 ft
503408 West of Dam!
612958 500 ft WT#3
Ground Elevation @ McMicken Dam ~ 1340 ft
StressStress--Strain ModelStrain Model
Measured Ground Subsidence InSAR Data to Further
Quantify Actual Subsidence Realistic Bedrock Geometry Characterization of Fine
Sediments Actual Well Hydrographs Internal Pore Pressure
Distributions Calibration of Input
Parameters Prediction
A 2-D linked seepage and elastic Finite Element model was developed that incorporated and honored these parameters -
Horizontal Strain
-0.06-0.04-0.020.000.020.040.060.08
0 1000 2000 3000 4000 5000 6000
Distance (feet)
Hor
izon
tal s
train
% 1981 1999
Earth fissure risk
2010 NACE Western Region County Engineers Symposium

29
Based on the results of the full geotechnical investigation, including InSAR and finite element model results, fissure risk zonation was accomplished.
The dam section in the high risk zone was abandoned. A relocated dam section was designed and constructed.
Earth Fissure Risk ZonationEarth Fissure Risk Zonation
2010 NACE Western Region County Engineers Symposium

30
A Dam Well FoundedA Dam Well Founded
New section
Abandoned section
Fissure zone
2010 NACE Western Region County Engineers Symposium

31
Going Forward: MonitoringGoing Forward: Monitoring
•Visual Inspection•Aerial Imagery•InSAR•Groundwater Trends•Vertical Survey•Horizontal (GPS) Survey•Experimental TDR (Time-Domain Reflectometry) abandoned•Tape Extensometer•Experimental Rod Extensometer
2010 NACE Western Region County Engineers Symposium

32
Tape ExtensometerTape Extensometer
90-foot sections located in areas of modeled and anticipated ground strain along new alignment, existing alignment, and within the earth fissure field.
2010 NACE Western Region County Engineers Symposium

33
Recent & Current InSAR Images as Part of Recent & Current InSAR Images as Part of Continuing Monitoring ProgramContinuing Monitoring Program
November 2002 to October 2005 November 2002 to January 2006 October 2003 to September 2007InSAR provided by Arizona Department of Water Resources
2010 NACE Western Region County Engineers Symposium

34
ProtoProto--type Rod Extensometertype Rod Extensometer
2010 NACE Western Region County Engineers Symposium

35
GPS GPS –– Horizontal & Vertical MeasurementHorizontal & Vertical Measurement
2010 NACE Western Region County Engineers Symposium

36
Case Study Case Study -- Some Lessons LearnedSome Lessons Learned
Washes often remove cemented soil horizons that are good for dam foundation Previous investigation disturbs ground, making visual inspection and
any subsequent investigations difficult TDR system is very sensitive – numerous breaks due to curing of
CLSM material it is encased in. Redundancy is necessary All instrumentation requires armor against vandalization Telemetric warning system was a challenge from the start. Sensitivity
of the TDR system rendered it essentially useless Survey costs quickly become unsustainable We still have much to learn – whole system needs to be re-evaluated
for effectiveness
2010 NACE Western Region County Engineers Symposium

37
ClosureClosure
Available Resources in Arizona includeADWR for Subsidence, andAzGS for Earth Fissure Maps
“…public agencies that formerly were trying to stop subsidence are now adopting policies that promote it. Subsidence is returning...”(B.E. Lofgren, 1998)
2010 NACE Western Region County Engineers Symposium

38
Questions?Questions?
Thank You for Thank You for Your Attention!Your Attention!
2010 NACE Western Region County Engineers Symposium