ground-truth validation of viirs nightfire for gas flaring
TRANSCRIPT
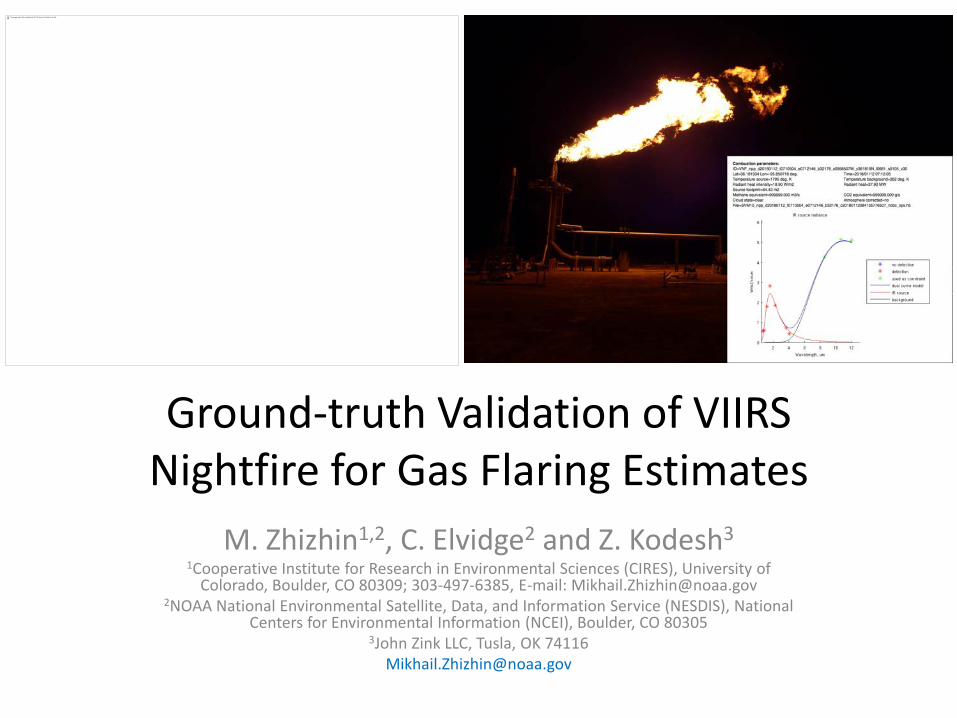
Ground-truth Validation of VIIRS Nightfire for Gas Flaring Estimates
M. Zhizhin1,2, C. Elvidge2 and Z. Kodesh31Cooperative Institute for Research in Environmental Sciences (CIRES), University of
Colorado, Boulder, CO 80309; 303-497-6385, E-mail: [email protected] National Environmental Satellite, Data, and Information Service (NESDIS), National
Centers for Environmental Information (NCEI), Boulder, CO 803053John Zink LLC, Tusla, OK 74116
The image part with relationship ID rId2 was not found in the file.

0
0.2
0.4
0.6
0.8
1
0
0.2
0.4
0.6
0.8
1
0 2 4 6 8 10 12 14
Blac
k Bo
dy S
pect
rum
VIIR
S Re
lativ
e Sp
ectr
al R
espo
nse
Wavelength (μm)
M13 M14 M15 M16M12M11DNBM7 M8
Hotpsot1600 K
Hotpsot800 K
M10
VIIRS M-band spatial resolution is 742m at nadirNighttime collection of channel M11 began in Dec 2017
Suomi NPP / VIIRS data is available from March 2012 – presentNOAA-20 (JPSS-1) / VIIRS data collected from June 2018
VIIRS Nightfire (VNF) A global fire product created from nighttime multispectral satellite data

Flare in Algeria: VNF 2019-05-19T = 1674 K, S = 8.4 m2, RH = 3.7 mW
The image part with relationship ID rId3 was not found in the file.

M10 radiance – peak of flaring radiant emissions
Temperature
Cloud state
Radiant heat (watts)Startup on Feb. 7, 2013Shutdown from Oct. 20-Nov. 19 2018
Radiance, Temperature, Heat versus satellite overpass time from March 2012 until May 2019
Single flare in Algeria

Temperature versus source area for VNF from January 2018Overlayed are detection limit lines for VIIRS spectral bands
The image part with relationship ID rId2 was not found in the file.

Tulsa flare experiment tasks
• A major part of the project is to improve the accuracy of the flared gas volume estimates
• Collect and analyze VIIRS data of variable size flares with the same natural gas composition, no wind, no clouds
• The test flare data will be used to develop an improved calibration for calculating flared gas volumes from individual flaring sites
• Apply calibration to produce new estimates of annual flared gas volumes back 2012

Tulsa flare experiment plan
Satellite zenith angleFlare size Flow rate lb/hr Flared volume BCM/yr Nadir Medium Side
Small 750, later 1500 0.004, later 0.008 1 2 1Medium 7500 0.04 1 2 1
Large 75000 0.4 1 2 1
Stage 1, Jan.-Feb. 2018, 12 single flares
Stage 2, Oct. 2018, 12 double flaresSatellite zenith angle
Flare size Flow rate lb/hr Flared volume BCM/yr Nadir Medium SideSmall + Small 1500 + 1500 0.016 1 2 1
Small + Medium 1500 + 7500 0.05 1 2 1Medium + Medium 7500 + 7500 0.08 1 2 1
Stage 3, Aug. 2019 or later, Larger single flares
TBD

Tulsa flare experiment setup
Natural GasSupply
VolumeTank
Fuel pressure,temperature andflow rate meter
Flare tipNear field multipoint photo, videoradiometer and spectrometer
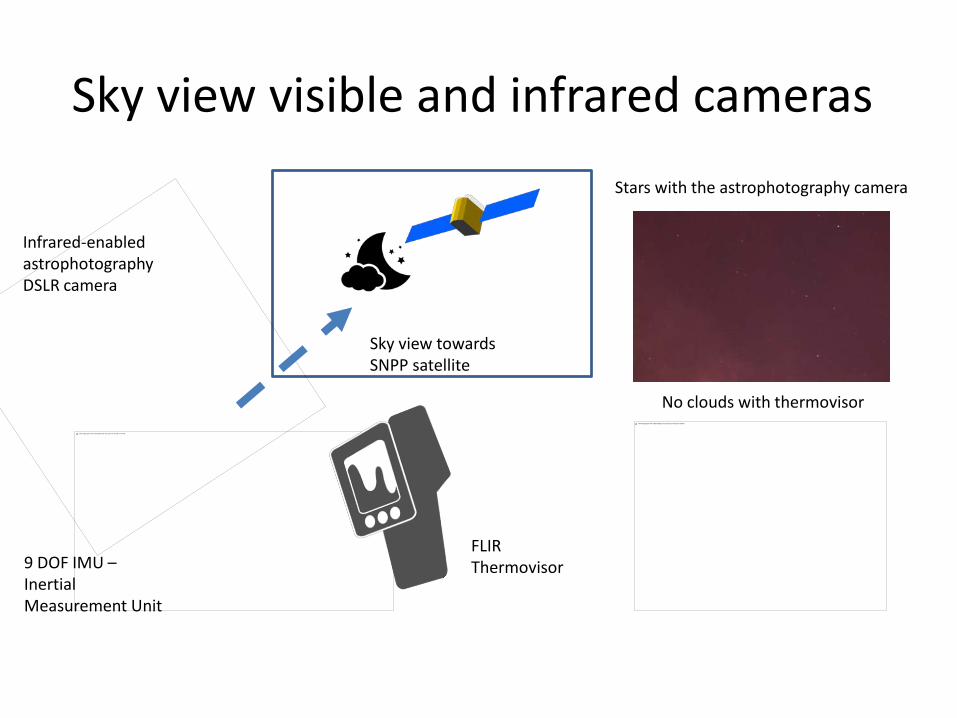
Sky view visible and infrared cameras
Ambient pressure,temperature and
wind meter
VIIRS satellite

The image part with relationship ID rId2 was not found in the file.
Flare
Volumetank
50m
Testpost
John Zink LLC, Tulsa OK

Near field ASD FieldSpec radiometer0.4 – 2.5 um VIS / SWIR spectral range
200’ fromflare to reflector
The image part with relationship ID rId2 was not found in the file.
Sky view visible and infrared cameras
9 DOF IMU –Inertial Measurement Unit
Infrared-enabledastrophotographyDSLR camera
FLIR Thermovisor
Sky view towardsSNPP satellite
The image part with relationship ID rId2 was not found in the file.
Stars with the astrophotography camera
No clouds with thermovisor

The image part with relationship ID rId2 was not found in the file.
45 pixels with VNF detections
1500 m
1500 m

Large flare 2018-01-12 07:12 UTC VNF: T = 1795 K, S = 64 m2, RH = 38 mW
The image part with relationship ID rId3 was not found in the file.
Flowrate 77766.9 lb/hour ~ 0.43 BCM/yearSatellite zenith angle 66.76 deg (side view)

Flare 2018-01-12 T(ASD) = 1695 K The image part with relationship ID rId2 was not found in the file.

Flare 3D shape from satellite
• Assuming the shape does not change much with flow rate, we “normalize” the radiative heat (from VIIRS) by flow rate (measured at site)
• To derive the shape, we model flare as 3D ellipsoid
• Ellipsoid axes ratio should explain statistical scatter of RH/Flow and the satellite zenith angle

Ellipsoid model for flare 3D shape
The image part with relationship ID rId2 was not found in the file.
View from satellite
Source area projectionS(SATZ)
Flare tip
Flare ellipsoidshape model
a axis
b axis
SATZ satellitezenith angle
Single flare axes ratiofrom VNF= 3:1
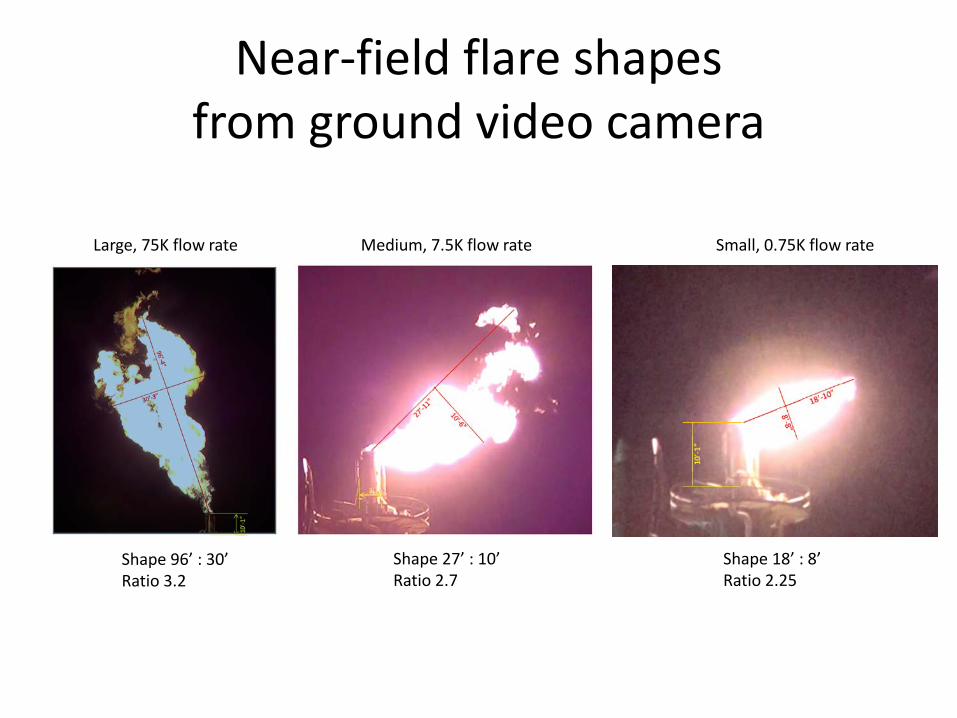
Near-field flare shapes from ground video camera
Large, 75K flow rate Medium, 7.5K flow rate Small, 0.75K flow rate
Shape 96’ : 30’Ratio 3.2
Shape 27’ : 10’Ratio 2.7
Shape 18’ : 8’Ratio 2.25

Multiple pixel detections for subpixel size source ?
The image part with relationship ID rId2 was not found in the file.
For 2/3 of the test flares VNF detects multiple pixels
“Old” strategy: use pixel with maximum heat RH
”New” strategy: sum pixels with RH > 0.75 max(RH)

Flowrate vs Radiant Heat correlation
The image part with relationship ID rId2 was not found in the file. The image part with relationship ID rId2 was not found in the file.
Sum [ RH > 0.75 max(RH) ]without 3D correctionR2 = 0.99
max(RH)with 3D correction R2 = 0.96

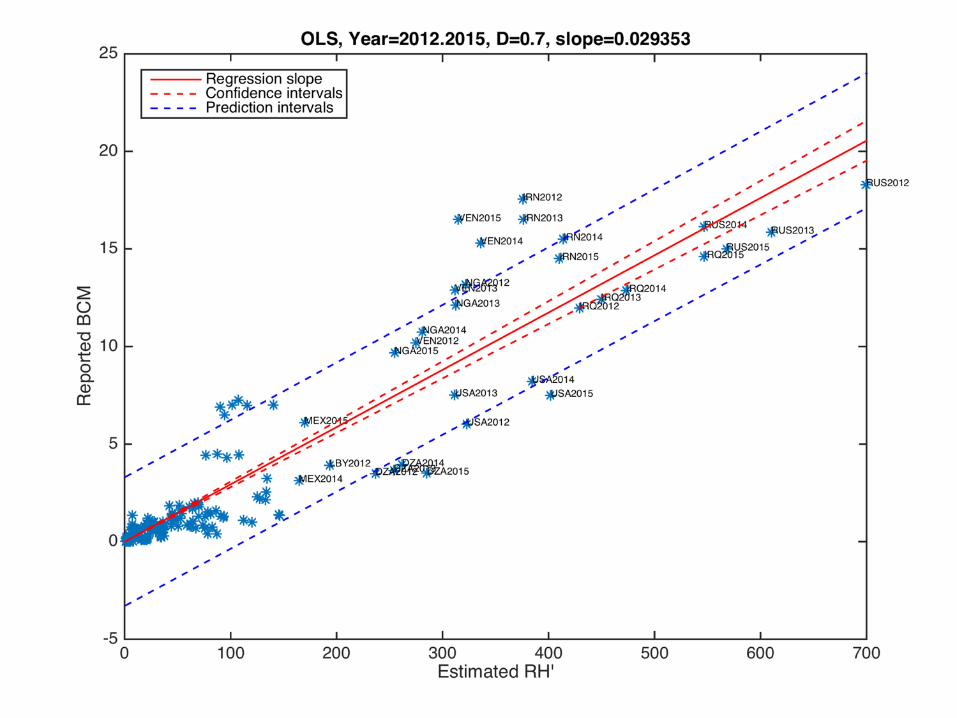
CEDIGAZ CalibrationSum of flare “radiant heat “ RH’ = T4 x SD (no clouds) in proportion to the percent of detections (PCT). Here D is nonlinear correction factor, S is surface area.
Flared volume is given by the Regression Through the Origin (RTO) relating the CEDIGAZ reported country level BCM and RH’
Flared Volume = Slope × RH’.
The 95 % confidence interval for the RTO slope are
Slope = 0.0294 ± 0.0017
For RTO the prediction interval varies in a narrow range 3 - 3.5 BCM for the full range of the observed RH’ from 0 to 700.CEDIGAZ, http://www.cedigaz.org/
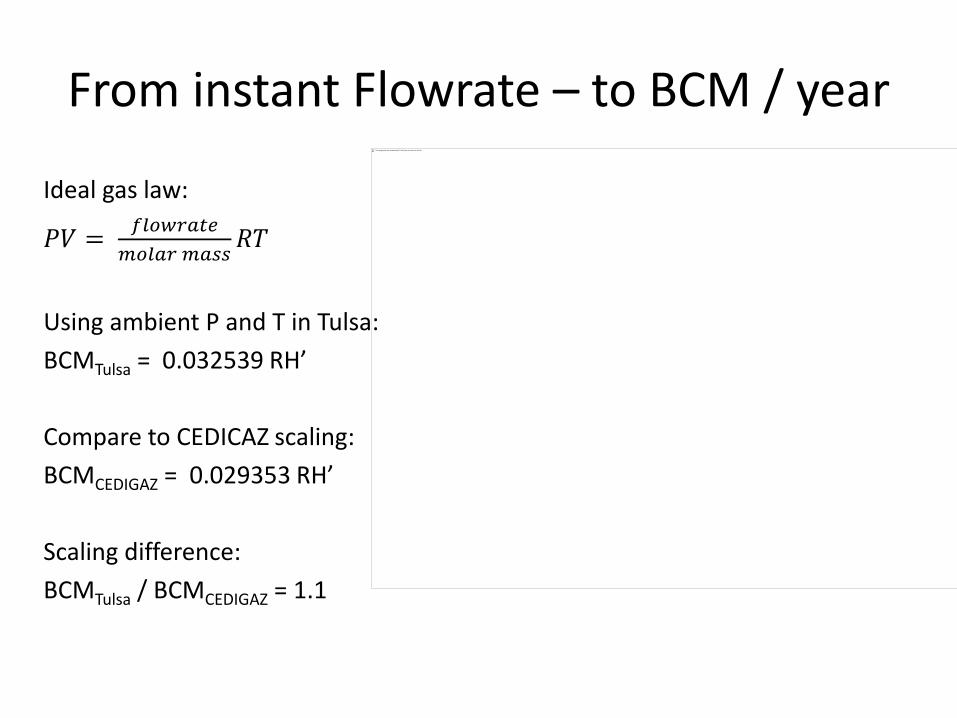
From instant Flowrate – to BCM / year
Ideal gas law:
𝑃𝑃𝑃𝑃 = 𝑓𝑓𝑓𝑓𝑓𝑓𝑓𝑓𝑓𝑓𝑓𝑓𝑓𝑓𝑓𝑓𝑚𝑚𝑓𝑓𝑓𝑓𝑓𝑓𝑓𝑓 𝑚𝑚𝑓𝑓𝑚𝑚𝑚𝑚
𝑅𝑅𝑅𝑅
Using ambient P and T in Tulsa:BCMTulsa = 0.032539 RH’
Compare to CEDICAZ scaling:BCMCEDIGAZ = 0.029353 RH’
Scaling difference:BCMTulsa / BCMCEDIGAZ = 1.1
The image part with relationship ID rId3 was not found in the file.

140 137141 144 147
138142
15.114.4
14.113.3
13.4
12.912.7
125
130
135
140
145
150
155
160
165
2012 2013 2014 2015 2016 2017 2018
BCM
World gas flaring by year (pre-release)
Upstream Downstream
0
1000
2000
3000
4000
5000
6000
Num
ber o
f fla
res
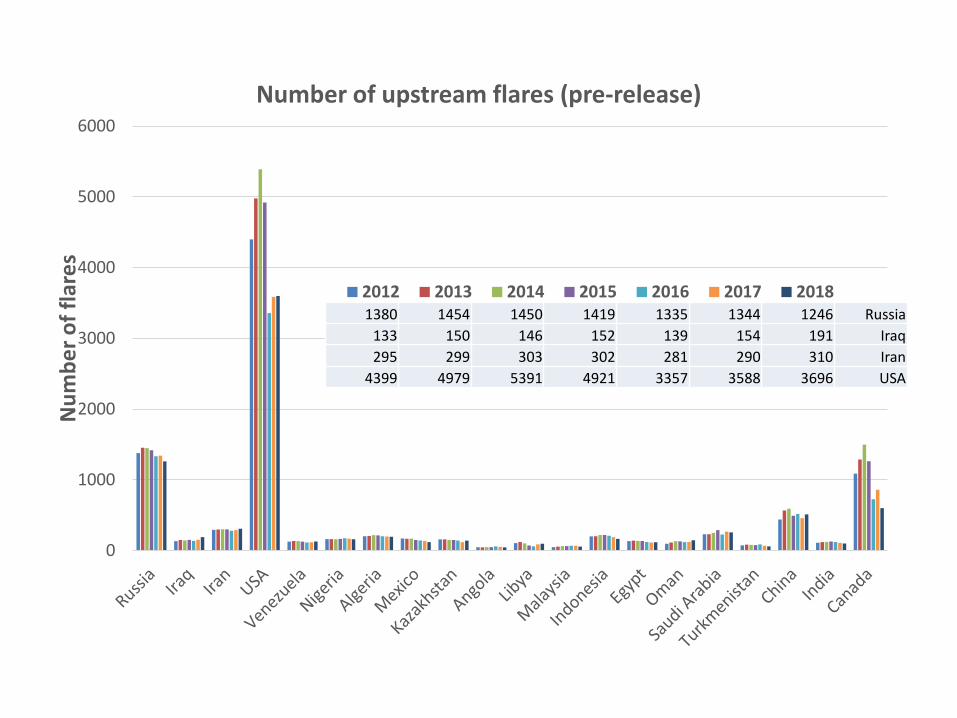
Number of upstream flares (pre-release)
2012 2013 2014 2015 2016 2017 20181380 1454 1450 1419 1335 1344 1246 Russia
133 150 146 152 139 154 191 Iraq295 299 303 302 281 290 310 Iran
4399 4979 5391 4921 3357 3588 3696 USA

0
5
10
15
20
25
Flar
ing,
BCM
Upstream Flaring in billions of cubic meters (pre-release)
2012 2013 2014 2015 2016 2017 201823.7 21.0 19.6 21.1 24.1 21.5 20.4 Russia12.6 13.2 13.9 16.1 17.7 17.8 17.8 Iraq11.0 11.0 12.1 12.0 16.4 17.7 17.3 Iran
9.5 9.1 11.3 11.8 8.8 9.5 14.0 USA

Conclusions• VNF sensitivity is sufficient to detect 0.005 BCM flares
• “Black body” flare spectrum for SWIR VIIRS bands was confirmed by the ground truth radiometer
• 3D flare shape can be detected from orbit with multiple angle detections
• Both Max(RH) and Sum [ RH > 0.75 max(RH) ] are strongly correlated with flow rate
• CEDIGAZ country-level RH to BCM scaling is confirmedwith the test flares within 10% error