ground vibration monitoring instrumentation and...
TRANSCRIPT
24 TRANSPORTATION RESEARCH RECORD 1169
Ground Vibration Monitoring Instrumentation and Computerized Surveillance
CHARLES H. DOWDING AND .DALE }ESSEN
Computerized surveillance Is the high ground to wbJch this paper leads. Data acquisition and processing now possible with "watch dog" computers In the field linked by telephone to monitoring engineers In the office are best appreciated by an lnvestlgntton of the components of that Instrumentation syst.em. This paper presents the details of the likely Input, critical components of such a system, proper placement or sensing transducers, development history or these Instruments, and the new considerations necessary with computerized digitization of analog signals.
During construction, grmmd-moticm-induced relative displacement of structures causes strains that can lead to cracking. These strains can be measured directly or they can be estimated from measurements of the motion of the structure or the ground and air adjacent to the structure. These motions also elicit human response, which normally manifests itself in annoyance and complaints. This annoyance can be assessed with the same instruments used to monitor and control the possibility of cracking.
This paper describes the characteristics of the instruments that measure the motions (acceleration, velocity, and displacement). Since there are many excellent sources for information on instruments, the principal characteristics of available systems will be summarized rather than exhaustively reviewed. The most complete single reference for detailed instrumentation information is the Siwek and Vibration Handbook (1). Specific information on construction and blast vibration monitors is contained in specific publications by the Bureau of Mines (2) and the Office of Surface Mining (3).
Blasting and pile driving are the two principal sources of ground motion and noise associated with construction. To a lesser extent the motions from equipment can be important but usually only at very small distances. The short duration of a blast event and single-pile-driving impact, as well as the relatively high frequencies associated with the resulting ground motion, restrict the types of appropriate instruments.
Significant construction blast motions last less than a second and, therefore, they must first be permanently recorded in order to be analyzed at a later date. Furthermore, the measuring and recording system may have to sense motion with frequencies as
C. I~ . Dowding, Department of Civil Engineering, Nor1hwes1em University, Evanston, Ill. 60201 . D. Jessen, Digital Vibration, Inc., 4088 Commercial Drive, Northbrook. Ill. 60093.
high as 500 Hz. However, typical blast motions involve dominant frequencies below 200 Hz and usually below 100 Hz. Because the natural frequency of a two-story house could be as low as 4 Hz, the system of measurement must be able to record accurately motions at frequencies as low as 3 Hz. Larger structures have still lower natural frequencies and may require special instrumentation.
Pile driving can be continuous (vibratory drivers) or intermittent (impact drivers), but generally the motions occur at frequencies between 10 and 30 Hz. The motion from any one impact may last less than 1/• sec. Thus, these motions are 11imilar to a short, 20-H:z., blast-induced ground motion and can be monitored with the same instrumentation.
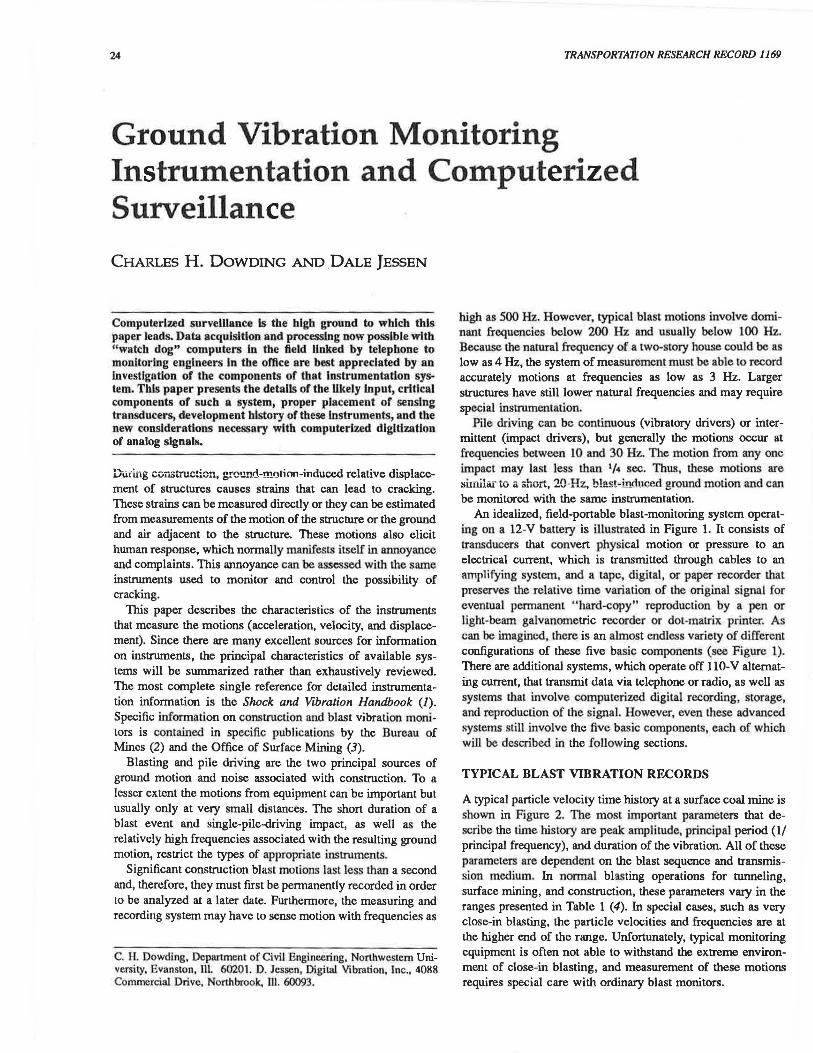
An idealized, field-portable blast-monitoring system operating on a 12-V battery is illustrated in Figure 1. It consists of transducers that convert physical motion or pressure to an electrical current, which is transmitted through cables to an amplifying system, and a tape, digital, or paper recorder that preserves the relative Lime variation of the original signal for eventual pennanent "hard-copy" reproduction by a pen or light-beam galvanometric recorder or dot-matrix printer. As can be imagined, there is an almost endless variety of different configurations of these five basic components (see Figure 1). There are additional systems, which operate off 110-V alternating current, that transmit data via telephone or radio, as well as systems that involve computerized digital recording, storage, and reproduction of the signal. However, even these advanced systems still involve the five basic components, each of which will be described in the following sections.
TYPICAL BLAST VIBRATION RECORDS
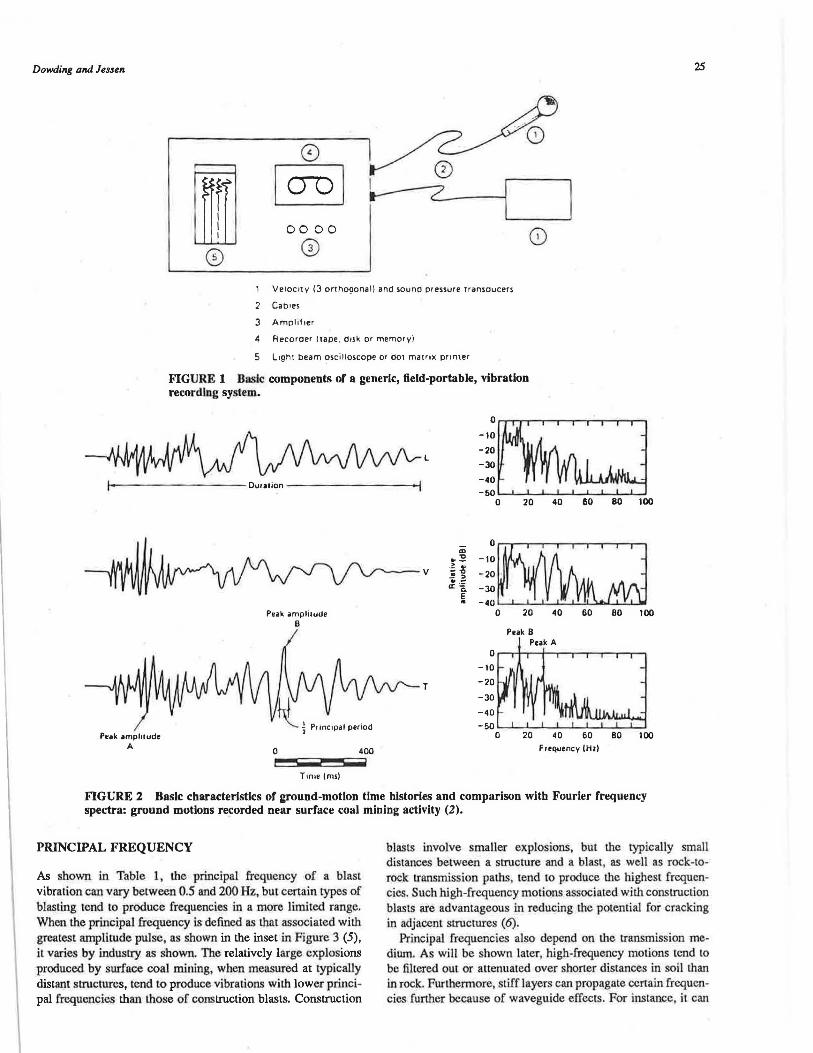
A typical particle velocity time history at a surface coal mine is shown in Figure 2. The most important parameters that describe the time history are peak amplitude, principal period (11 principal frequency), and duration of the vibration. All of these parameters are dependent on the blast sequence and transmission medium. In normal blasting operations for tunneling, surface mining, and construction, these parameters vary in the ranges presented in Table 1 (4). In special cases, such as very close-in blasting, the particle velocities and frequencies are at the higher end of the range. Unfortunately, typical monitoring equipment is often not able to withstand the extreme environment of close-in blasting, and measurement of these motions requires special care with ordinary blast monitors.
Dowding and Jessen 25
I ©
00 0 0
0 Ve1oc11y (3 or1ho9onal) and sound pressure transoucers
2 Cab1es
3 Amplifier
4 Recoroer !tape, duk or memory)
5 Light beam oscilloscope or Clot ma1r1x printer
FIGURE 1 Basic components of a generic, field-portable, vibration recording system.
Puk amphlude A
Ptak ampli1ude B
0
Time (ms)
l
T
400
0
-10 .
-20
-JO
-40 -50
0 20 40 60 80 100
Peak 8 Peak A
o.--...+...--+--.--.--.-........ --. ...................
-10
-20
-JO
-40
-so~~~~~ ....... ~~---~~ 0 20 40 60
Frequency IHz) ilO 100
FIGURE 2 Basic characteristics of ground-motion time histories and comparison with Fourier frequency spectra: ground motions re~orded near surface coal mining activity (2).
PRINCIPAL FREQUENCY
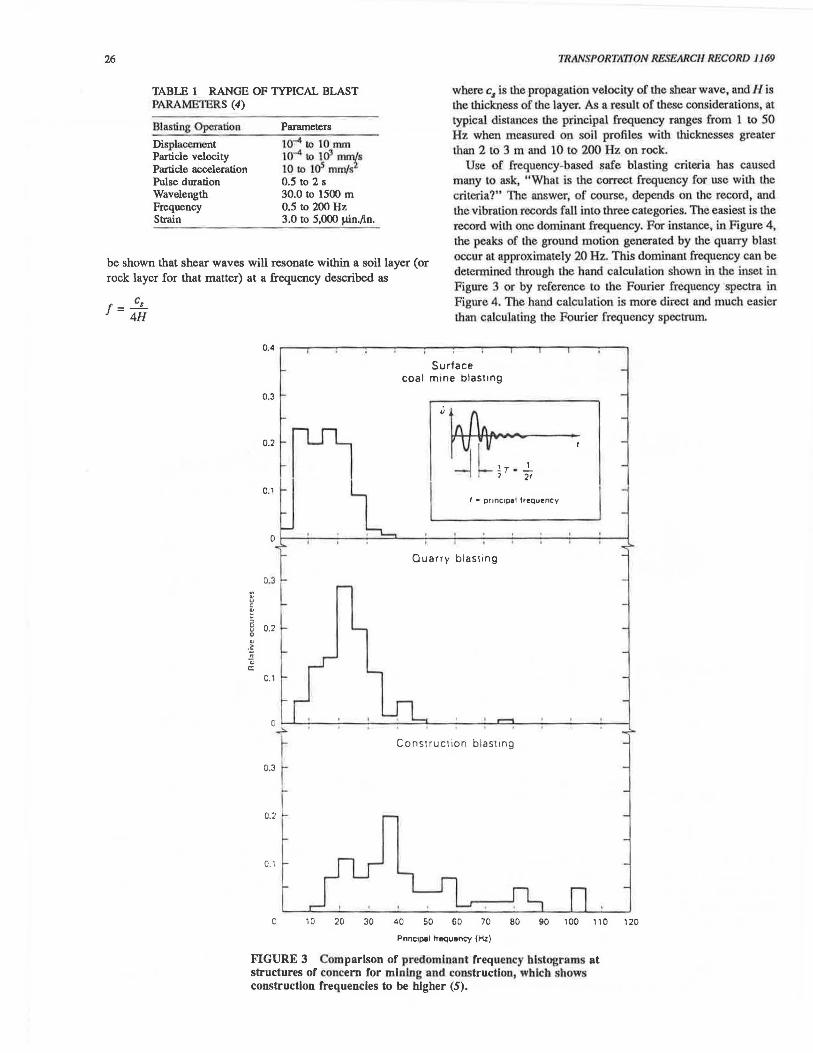
As shown in Table l , the principal frequency of a blast vibration can vary between 0.5 and 200 Hz, but cenain types of blasting tend to produce frequencies in a more limited range. When the principal frequency is deftned as that associated with greatest amplitude pulse, as shown in the inset in Figure 3 (5), it varies by industry as shown. The relatively large explosions produced by surface coal mining, when measured at typically distant structures, tend to produce vibrations with lower principal frequencies than those of construction blasts. Construction
blasts involve smaller explosions, but the typically small distances between a structure and a blast, as well as rock-torock transmission paths, 1end to produce the highest frequencies. Such high-frequency motions associated with construction blasts are advantageous in reducing the potential for cracking in adjacent structures (6).
Principal frequencies also depend on the transmission mediwn. As will be shown later, high-frequency motions tend to be tillered out or attenuated over shorter distances in soil than in rock. Furthermore, stiff layers can propagate certain frequencies further because of waveguide effects. For instance, it can
26
TABLE 1 RANGE OF TYPICAL BLAST PARAME1ERS (4)
Blasting Operation
Disp.lacement Particle velocity Particle acceleration Pulse duration Wavelength Frequency Strain
Parameters
10-4 to 10 mm 10-4 to 1 a1 ~s 10 to Hf mm/s 0.5 to 2 s 30.0 to 1500 m 0.5 to 200 Hz 3.0 to 5,000 µin.Jin,
TRANSPORTATION RESEARCH RECORD 1169
where cs is I.he propagation velocity of I.he shear wave, and His I.he thickness of I.he layer. As a result of lhese considerations, at typical distances the principal frequency ranges from 1 to 50 Hz when measured on soil profiles with thicknesses greater than 2 to 3 m and 10 to 200 Hz on rock.
be shown that shear waves will resonate within a soil layer (or rock layer for that matter) at a frequency described as
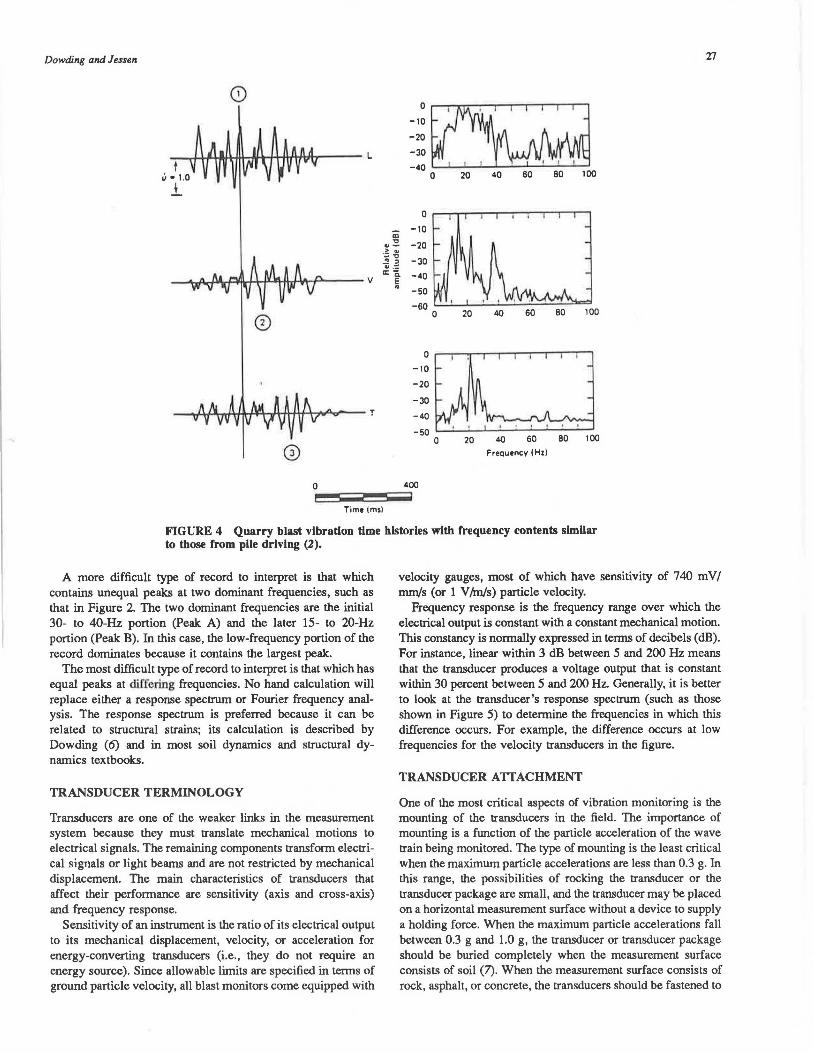
Use of frequency-based safe blasting criteria has caused many to ask, "What is the correct frequency for use wilh I.he criteria?" The answer, of course, depends on the record, and the vibration records fall inco three categories. Th.e easiest is I.he record wilh one dominant frequency. For instance, in Figure 4, the peaks of I.he groW1d motion generated by I.he quarry blast occur at approximately 20 Hz. This dominant frequency can be determined through I.he hand calculation hown in the inset in Figure 3 or by reference to the Fourier frequency spectra in Figure 4. The hand calculation is more direct and much easier than calculating the Fourier frequency spccuum.
cs f=-4H
o.~ .---...---------------.---.---.----.------.
Surface coal mine blasting
0.3
0.2
0.1 f -= princ1p1! freQuency
0
Quarry blasting
0.3
::; ~ a 0.2 " 0
" .?
" ;; c::
0.1
0
0~1 Construction blasting
0.2
c. 1
0 10 20 30 40 50 60 70 80 90 100 110 120
Pnnc1pal lrequency (Kz)
FIGURE 3 Comparison of predominant frequency histograms at structures of concern for mining and construction, which shows construction frequencies to be higher (5).
Dowding and Jessen 27
=J~ -40 '----'----'-'----~-........ ----
0 20 40 60 80 100
0 r--r-r-r-"""T""--r---r---:---i.----r--r-"1
-10
-20
-30
-40
-so
40 60 80 100
0 --~~~--...---.-,.----.....--,--,
-10
-20
-JO -40
20 40 60 80 100
FreQuencv (Hz)
0 400 ----Time (m'I
FIGURE 4 Quarry blast vibration time histories with frequency contents similar to those from pile driving (2).
A more difficult type of record to interpret is that which contains unequal peaks at two dominant frequencies, such as that in Figure 2. The two dominant frequencies are the initial 30- to 40-Hz portion (Peak A) and the later 15- to 20-Hz portion (Peale B). In this case, the low-frequency portion of the record dominates because it contains the largest peak.
The most difficult type of record to interpret is that which has equal peaks at clllfering frequencies. No hand calculation will replace either a response spectrum or Fourier frequency analysis. The response spectrum is preferred because it can be related to structural strains; its calculation is described by Dowding (6) and in most soil dynamics and structural dynamics textbooks.
TRANSDUCER TERMINOLOGY
Transducers are one of the weaker links in the measurement system because they must translate mechanical motions to electrical signals. The remaining components transform electrical signals or light beams and are not restricted by mechanical displacement. The main characteristics of transducers that affect their performance are sensitivity (axis and cross-axis) and frequency response.
Sensitivity of an instrument is the ratio of its electrical output to its mechanical displacement, velocity, or acceleration for energy-converting transducers (i.e., they do not require an energy source). Since allowable limits are specified in terms of ground particle velocity, all blast monitors come equipped with
velocity gauges, most of which have sensitivity of 740 mV/ mm/s (or 1 V/m/s) particle velocity.
Frequency response is the frequency range over which the electrical output is constant with a constant mechanical motion. This constancy is normally expressed in terms of decibels (dB). For instance, linear within 3 dB between 5 and 200 Hz means that the transducer produces a voltage output that is constant within 30 percent between 5 and 200 Hz. Generally, it is better to look at the transducer's response spectrum (such as those shown in Figure 5) to determine the frequencies in which this difference occurs. For example, the difference occurs at low frequencies for the velocity transducers in the figure.
TRANSDUCER ATTACHMENT
One of the most critical aspects of vibration monitoring is the mounting of the transducers in the field. The importance of mounting is a function of the particle acceleration of the wave train being monitored. The type of mounting is the least critical when the maximum particle accelerations are less than 0.3 g. Jn this range, the possibilities of rocking the transducer or the transducer package are small, and the transducer may be placed on a horizontal measurement surface without a device to supply a holding force. When the maximum particle accelerations fall between 0.3 g and 1.0 g, the transducer or transducer package should be buried completely when the measurement surface consists of soil (7). When the measurement surface consists of rock, asphalt, or concrete, the transducers should be fastened to

28 TRANSPORTATION RESEARCH RECORD 1169
I I ' I I '
I ' ' '
... -
I I l ~. 0.6 -
4.0
3.0
2.0
1.4
- ,,,,,-1 I I I -
/ , ~- 0.7
I/ I _,,....- . ' I I
1.2 v
1.0 51
~ i ,c . ' ' j ,._ __ -- r ----,---,---1- -----= .... ...
0.8 > ; 0.6 c.
0.5 ~ 0.4
I- V/ I -I
-l
-.... -
I I I I I I 1 I I I
0.3
0.2
0.16
0.10 25 JO 40 50 75 100 150 200 JOO 400 750 1000 2590
Frequency I Hz)
(1)
40
30
20
15
10
1 1
1 1
u a ~ 6 i
P • o.2a I ~~~+.-::_;_"'?"'"-7===~===:=======; ~
~ ;; c. ;; 3 0
2
, ....._____.~--''---~~~~~~~~~~~~~~~~~~~ 0.2 0.3 0.4 0.6 O.B 1 2 3 ~ 6 B 10 20 40
Frequency I Hz)
lb)
FIGURES Frequency response of 70 percent critically damped(~ = 0.7) velocity transducers related to the -3 dB criterion: (a) -3 dB at 100 Hz; (b) -3 dB at 0.9 Hz.
the measurement surface with double-sided tape, epoxy, or quick-setting cement (the authors found Hydrocal to be a good, quick-setting cement). If these methods are unsatisfactory or accelerations exceed 1.0 g, only cement or bolts are sufficient to hold the transducer to a hard surface.
VELOCITY TRANSDUCERS
There are relatively few velocity transducers on the market compared with accelerometers and strain gauges. In most industries, velocity is normally found through integration of acceleration time histories. Even though the velocity transducers are a minority, they are the principal type of transducer used for blast monitoring because allowable vibration limits are specified in terms of particle velocity.
The components of the most common seismic transducer, the geophone, are shown in Figure 6 (8). The output from a velocity transducer is generated by a coil moving through a magnetic field. The voltage induced in the coil is directly proportional to the relative velocity between the coil and the magnetic field Either the coil or the magnet can be part of the vibrating mass, with the other component attached to the transducer frame.
The velocity transducer is convenient for field use because its output is usually high enough (in the range 4 to 8 m V /mm/s) so that amplification is not required. Furthermore, its output impedance is easily matched by other standard components.
Velocity transducer response becomes nonlinear at low frequencies, as shown in Figure 5. Typically, the transducer frequency range is broadened by many manufacturers of blast

Dowding and Jessen
FIGURE 6 Schematic diagram of the components of a velocity transducer (8).
monitoring systems with a low-frequency amplifier (2), as shown in Figure 7. In this case the amplifier and the velocity transducer must be matched closely to provide the correct compensation in the desired frequency range.
TAPE, DIGITAL, AND HARD-COPY RECORDERS
Of those blast monitoring systems with tape recorders, most use compact FM cassettes. Many of the systems involve separate record and reproduction modules to reduce the complexity of recording modules. Care should be exercised to determine the exact details of the system before purchasing, as tape recorder performance varies at low temperature.
Digital recording systems now dominate technical recording because of the ease of computer linkage. The signal is sampled at a certain rate, say, 1,000 times per sec, and each sample is converted to a single magnitude. This magnitude and its associated time are then stored in computer memory. Such a system has several advantages. It is very accurate because
.,.
~·
" "' >
29
variation in the speed of the tape, if it is used, has no effect, and the system can be directly accessed by a computer. Details of the digitization process are discussed in later sections.
A permanent record or "hard copy" of the vibration time history is usually made on photographic film or paper. Almost all present film-based recorders use special field-developable, ultraviolet-light-sensitive paper in combination with light beam galvanometers to record high-frequency motions. The newest generation recorder uses dot-matrix printers with microcomputers. Unfortunately, those monitors that print after a vibration event may not be recording another while printing. If multiple shots are likely, this reset time should be determined. Furthermore, printer behavior in cold weather is variable and should also be investigated. Paper hard-copy recorders that use a mechanical lever system to move a pen or a heated stylus over the advancing paper, while reasonably priced, cannot faithfully record large amplitude signals at frequencies above 25 Hz. This restriction greatly diminishes their usefulness for analyzing blast vibrations, whose dominant frequencies often exceed 50 Hz.
Most recorders can be bought as either single-channel or multichannel units. A four-channel unit is necessary in blast monitoring to simultaneously record the three components of the ground motion (longitudinal, vertical, and transverse) and the air blast. The present trend in vibration equipment is to include a signal-conditioning amplifier in the recorder to allow flexible amplification of the signals.
CALIBRATION
It is obvious that the entire vibration measurement system should be calibrated, because it is futile to record data if they cannot be exploited because of a lack of reference. Manufacturers supply calibration curves with their instruments that are similar to the response spectra for transducers shown in Figure 5. Recalibration or checking requires special vibrating platforms where frequency and displacement are controlled and, in the field, a calibrating circuit to pulse the magnetic core of the geophone.
BLAST MONITORS
Blast monitors are complete instrumentation systems like the one shown in Figure 1 and consist of transducers, amplifiers, power supply, and recorder. The user merely plugs the trans-
Analog record
e e Dtscre1e-po1nt record
FIGURE 7 Comparison of digitized (or discrete) points and analog (or continuous) records.
30
ducer cables into the recorder box. Because of the ease of operating these systems and their typically robust design, they should be used in all but the most sophisticated monitoring situations.
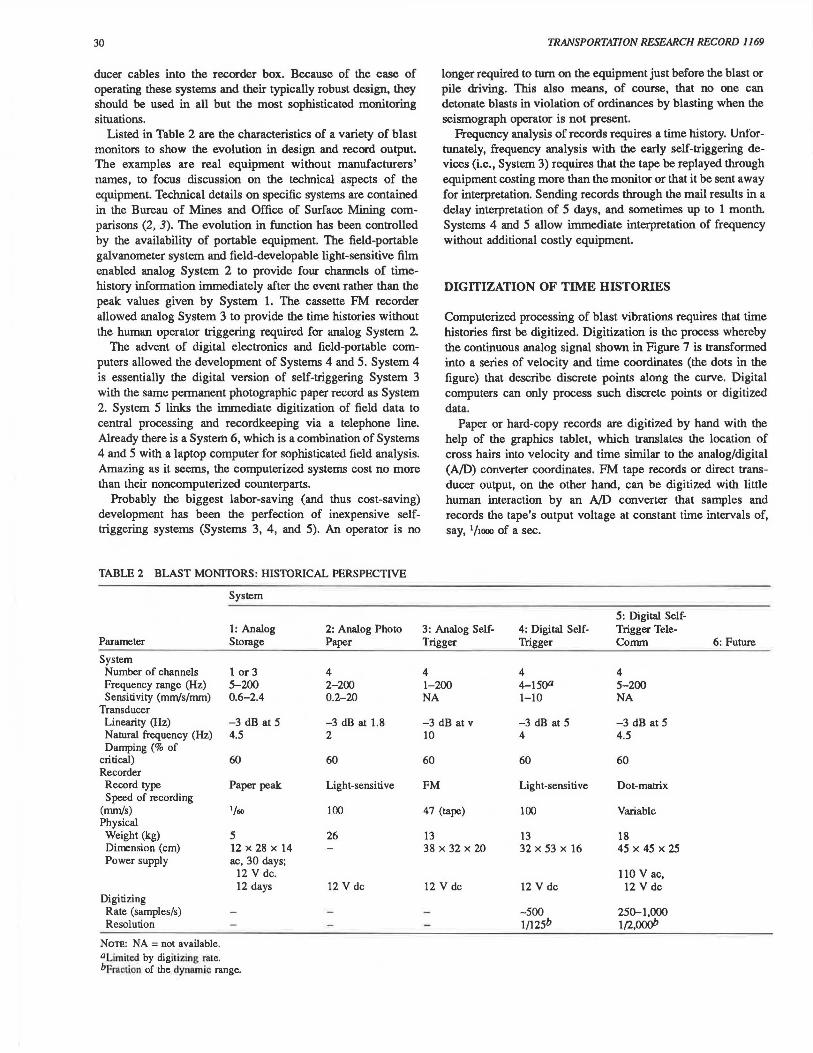
Listed in Table 2 are the characteristics of a variety of blast monitors to show the evolution in design and record output. The examples are real equipment without manufacturers' names, to focus discussion on the technical aspects of the equipment. Technical details on specific systems are contained in the Bureau of Mines and Office of Surface Mining comparisons (2, 3). The evolution in fim.ction has been controlled by the availability of portable equipment. The field-portable galvanometer system and field-developable light-sensitive film enabled analog System 2 to provide four channels of timehistory information immediately after the event rather than the peak values given by System 1. The cassette FM recorder allowed analog System 3 to provide the time histories without the human operator triggering required for analog System 2.
The advent of digital electronics and field-portable computers allowed the development of Systems 4 and 5. System 4 is essentially the digital version of self-triggering System 3 with the same permanent photographic paper record as System 2. System 5 links the immediate digitization of field data to central processing and recordkeeping via a telephone line. Already there is a System 6, which is a combination of Systems 4 and 5 with a laptop computer for sophisticated field analysis. Amazing as it seems, the computerized systems cost no more than their noncomputerized counterparts.
Probably the biggest labor-saving (and thus cost-saving) development has been the perfection of inexpensive selftriggering systems (Systems 3, 4, and 5). An operator is no
TABLE 2 BLAST MONITORS: HISTORICAL PERSPECTIVE
System
1: Analog 2: Analog Photo Parameter Storage Paper
System Number of channels 1 or 3 4 Frequency range (Hz) 5-200 2-200 Sensitivity (mm/s/mm) 0.6-2.4 0.2-20
Transducer Linearity (Hz) -3 dB at 5 -3 dB at 1.8 Natural frequency (Hz) 4.5 2 Damping (% of
critical) 60 60 Recorder Record type Paper peak Light-sensitive Speed of recording
(mm/s) 1/oo 100 Physical Weight (kg) 5 26 Dimension (cm) 12 x 28 x 14 Power supply ac, 30 days;
12 V de. 12 days 12 V de
Digitizing Rate (samples/s) Resolution
NoTB: NA = not available. aLimited by digitizing rate. bFraction of the dynamic range.
TRANSPORTATION RESEARCH RECORD 1169
longer required to tum on the equipment just before the blast or pile driving. This also means, of course, that no one can detonate blasts in violation of ordinances by blasting when the seismograph operator is not present.
Frequency analysis of records requires a time history. Unfortunately, frequency analysis with the early self-triggering devices (i.e., System 3) requires that the tape be replayed through equipment costing more than the monitor or that it be sent away for interpretation. Sending records through the mail results in a delay interpretation of 5 days, and sometimes up to 1 month. Systems 4 and 5 allow immediate interpretation of frequency without additional costly equipment.
DIGITIZATION OF TIME HISTORIES
Computerized processing of blast vibrations requires that time histories first be digitized. Digitization is the process whereby the continuous analog signal shown in Figure 7 is transformed into a series of velocity and time coordinates (the dots in the figure) that describe discrete points along the curve. Digital computers can only process such discrete points or digitized data.
Paper or hard-copy records are digitized by hand with the help of the graphics tablet, which translates the location of cross hairs into velocity and time similar to the analog/digital (AID) converter coordinates. FM tape records or direct transducer output, on the other hand, can be digitized with little human interaction by an AID converter that samples and records the tape's output voltage at constant time intervals of, say, 1/!ooo of a sec.
5: Digital Self-3: Analog Self- 4: Digital Self- Trigger Tele-Trigger Trigger Comm 6:Future
4 4 4 l-200 4-15()ll 5-200 NA 1-10 NA
-3 dB at v -3 dB at 5 -3 dB at 5 10 4 4.5
60 60 60
FM Light-sensitive Dot-matrix
47 (tape) 100 Variable
13 13 18 38 x 32 x 20 32 x 53 x 16 45 x 45 x 25
110 V ac, 12 V de 12 V de 12 V de
-500 250-1,000 l/125b 1(2,ooob

Dowding and Jessen
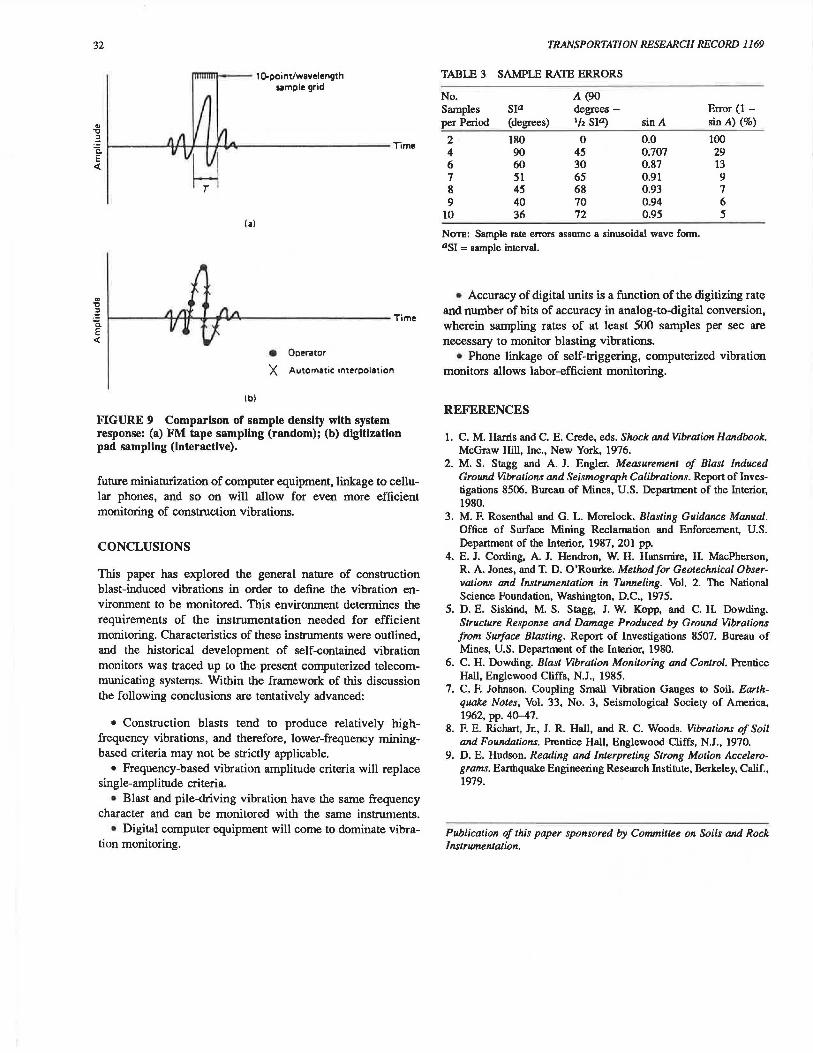
It is useful at this point to define proper sampling or digitization density. This discussion is a simplification of the concepts presented by Hudson (9) in his in-depth treatment of reading earthquake accelerograrns. There are two basic requirements. First and most obviously, the peak velocity must be sampled and, second, the time between samples or data points (dots) must be small enough to allow proper calculation of single-degree-of-freedom response for systems with high natural frequencies (i.e., greater than 40 Hz) (6).
The difficulty of sampling the peak velocity depends on the source of the velocity time history. If the source is a paper record, as shown in Figure 8, five points per cycle chosen by a human at a digitizing pad will adequately define the pulse. If the source is an FM tape or voltage output of the transient event itself, the peak is not seen by an operator and the samples are obtained regardless of peak location. Thus the sampling must be rapid enough (approximately 7 to 10 points per period, T, in Figure 9) so that a sample is assured near the peak (error less than 10 and 5 percent, respectively). For a 100-Hz vibration, proper digitization corresponds to a rate of 7 to 10 samples per cycle times 100 cycles per sec, or 700 to 1,000 samples per sec. Table 3 contains the percentage of error possible with differing rates of sampling.
The rate of digitization has an important impact on blast monitoring equipment. Consider System 4 in Table 2. Even though its transducer response is linear past 200 Hz, the system has a 30 percent or 3-dB error at 150 Hz because data are digitized at only 500 samples per sec. Table 3 shows the maximum errors associated with various rates of sampling. For System 4 the number of samples per period of a 150-Hz signal is the sampling rate (500 per sec) multiplied by the period, T = 1//:
~ I
31
500 c;o) = 3.3
When the sample rate drops below 4 per period, the error increases above 30 percent or 3 dB.
COMPUTERIZED SURVEILLANCE
Linkage of computerized vibration monitoring by phone with a system such as the TELE-BLAST shown in Figure 8 has a number of advantages. The most important in terms of cost is the elimination of on-site technical support. Once several vibration monitors are installed around a construction site, all vibration events will be automatically recorded. Details of these events can be accessed from any phone to obtain either an immediate telephone report (a summary of the event times, peak motions, and dominant frequencies) or time history to be processed by the central computer. The central computer automatically polls all instruments once a day and produces a monthly summary of activity.
This TELE-BLAST system has been used by Digital Vibration, Inc. for performance monitoring of a wide variety of blasting projects. A 14-channel version has been combined with crack width monitoring of a test house to compare weather- and blast-induced crack movements. Presently the system is monitoring construction adjacent to a historic structure in New York City to allow analysis of response in Chicago. Six monitors are being placed above a long-wall mining site to locate vibration sources.
All of this monitoring is conducted automatically via phone without any vibration specialists in the field. Repair work such as board replacement can be undertaken by nontechnical personnel with guidance via the telephone line. Obviously
T£l£·8LAST
IELF·TlllOOEllED
CENTRAL COMPUTER ANALYSIS & STORAGE
FIGURE 8 TELE-BLAST system continuously monitors wall response and allows instantaneous on-site and remote analysis of data. TELE-BLAST Instrument showing computer (middle shelf), teletype access (lower shelt), and transducers for response (on wall) and excitation (on floor) (left); TELE-BLAST operation allows access from any telephone for Immediate reporting or detailed analysis (right).
32
.. "O
mmmm--- 1 Q.point/wavelength sample grid
(a)
-~ 1-----~-14-.._~------------ Time c. E
<{
• Operator
X Automatic interpolation
lb)
FIGURE 9 Comparison of sample density with system response: (a) FM tape sampling (random); (b) digitization pad sampling (Interactive).
future miniaturization of computer equipment, linkage to cellular phones, and so on will allow for even more efficient monitoring of construction vibrations.
CONCLUSIONS
This paper has explored the general nature of construction blast-induced vibrations in order to define the vibration environment to be monitored. This environment determines the requirements of the instrumentation needed for efficient monitoring. Characteristics of these instruments were outlined, and the historical development of self-contained vibration monitors was traced up to the present computerized telecommunicating systems. Within the framework of this discussion the following conclusions are tentatively advanced:
• Construction blasts tend to produce relatively highfrequency vibrations, and therefore, lower-frequency miningbased criteria may not be strictly applicable.
• Frequency-based vibration amplitude criteria will replace single-amplitude criteria.
• Blast and pile-driving vibration have the same frequency character and can be monitored with the same instruments.
• Digital computer equipment will come to dominate vibration monitoring.
TRANSPORTATION RESEARCH RECORD 1169
TABLE 3 SAMPLE RATE ERRORS
No. Samples per Period
2 4 6 7 8 9
10
s1a (degrees)
180 90 60 51 45 40 36
A (90 degrees -1/2 Sill)
0 45 30 65 68 70 72
sin A
0.0 0.707 0.87 0.91 0.93 0.94 0.95
NoTE: Sample rate errors assume a sinusoidal wave form. as1 = sample interval.
Error (1 -sin A) (%)
100 29 13 9 7 6 5
• Accuracy of digital units is a function of the digitizing rate and number of bits of accuracy in analog-to-digital conversion, wherein sampling rates of at least 500 samples per sec are necessary to monitor blasting vibrations.
• Phone linkage of self-triggering, computerized vibration monitors allows labor-efficient monitoring.
REFERENCES
1. C. M. Harris and C. E. Crede, eds. Shock and Vibration Handbook. McGraw Hill, Inc., New York, 1976.
2. M. S. Stagg and A. J. Engler. Measurement of Blast Induced Ground Vibrations and Seismograph Calibrations. Report of Investigations 8506. Bureau of Mines, U.S. Department of the Interior, 1980.
3. M. F. Rosenthal and G. L. Morelock. Blasting Guidance Manual. Office of Surface Mining Reclamation and Enforcement, U.S. Department of the Interior, 1987, 201 pp.
4. E. J. Cording, A. J. Hendron, W. H. Hansmire, H. MacPherson, R. A. Jones, and T. D. O'Rourke. Method for Geotechnical Observations and Instrumentation in Tunneling. Vol. 2. The National Science Foundation, Washington, D.C., 1975.
5. D. E. Siskind, M. S. Stagg, J. W. Kopp, and C.H. Dowding. Structure Response and Damage Produced by Ground Vibrations from Surface Blasting. Report of Investigations 8507. Bureau of Mines, U.S. Department of the Interior, 1980.
6. C. H. Dowding. Blasl Vibration Monitoring and Control. Prentice Hall, Englewood Cliffs, N.J., 1985.
7. C. F. Johnson. Coupling Small Vibration Gauges t.o Soil. Earthquake Notes, Vol. 33, No. 3, Seismological Society of America, 1962, pp. 40-47.
8. F. E. Richart, Jr., J. R. Hall, and R. C. Woods. Vibrations of Soil and Foundations. Prentice Hall, Englewood Cliffs, N.J., 1970.
9. D. E. Hudson. Reading and Interpreting Strong Motion Accelerograms. Earthquake Engineering Research Institute, Berkeley, Calif., 1979.
Publication of this paper sponsored Uy Committee on Soils and Rock Instrumentation.