ground-water levels and directions of flow near the
TRANSCRIPT
Ground-Water Levels and Directions of Flow near the
Industrial Excess Landfill, Uniontown, Ohio, March 1994
By Denise H. Dumouchelle and E. Scott Bair
U.S. GEOLOGICAL SURVEY
Water-Resources Investigations Report 94-4136
Prepared in cooperation with
U.S. ENVIRONMENTAL PROTECTION AGENCY
Columbus, Ohio
1994

U. S. DEPARTMENT OF THE INTERIOR BRUCE BABBIT, Secretary
U.S. GEOLOGICAL SURVEY GORDON P. EATON, Director
For additional information Copies of this report maywrite to: be purchased from:
District Chief U.S. Geological SurveyWater Resources Division Earth Science Information CenterU.S. Geological Survey Open-File Reports Section975 West Third Avenue Box 25286, MS 517Columbus, OH 43212-3192 Denver Federal Center
Denver, CO 80225

CONTENTS
Abstract....................................................................................................................................................... 1Introduction.............................................^ 1
Purpose and scope............................................................................................................................ 1Description of study area.................................................................................................................. 3Acknowledgments............................................................................................................................ 3
Methods of investigation............................................................................................................................. 4Ground-water levels and directions of flow................................................................................................ 4Summary..................................................................................................................................................... 16Selected references...................................................................................................................................... 16
PLATES
[Plates are in pocket]
1. Ground-water levels at Industrial Excess Landfill and vicinity based on March 1994 water- level data
2. Potentiometric contours for the horizon from 1,100 to 1,112 feet above sea level near the Industrial Excess Landfill, Uniontown, Ohio, based on March 1994 water-level data
3. Diagram showing vectors of horizontal hydraulic gradient in the horizon from 1,100 to1,112 feet above sea level near the Industrial Excess Landfill site, Uniontown, Ohio, based on March 1994 water-level data
FIGURES
1. Regional ground-water levels near Uniontown, Ohio, based on March 1994 water-leveldata...................................................._ 2
2. Hydrologic section along A-A', Uniontown, Ohio, based on March 1994 water-level data................. 14
TABLES
1. Well and water-level data for private wells near Uniontown, Ohio, measured by theU.S. Geological Survey, March 14-17, 1994.................................................................................... 5
2. Well and water-level data for monitoring wells at Industrial Excess Landfill, nearUniontown, Ohio, March 17-18,1994.............................................................................................. 8
3. Water-level altitudes in piezometers and at staff gages near Uniontown, Ohio,March 14,1994................................................................................................................................. 10
4. Horizontal hydraulic gradient and flow velocities near the Industrial Excess Landfill,near Uniontown, Ohio, March 1994 ................................................................................................. 13
Contents III

CONVERSION FACTORS AND VERTICAL DATUM
Multiply
foot (ft)
mile (mi)
acre
By
0.3048
1.609
0.4047
To obtain
meter
kilometer
hectare
foot per day (ft/d) 0.3048 meter per day
Temperature is given in degrees Celsius ( C), which can be converted to degrees Fahrenheit ( F) by use of the following equation:
F= 1.8(C) + 32
Sea level: In this report "sea level" refers to the National Geodetic Vertical Datum of 1929 (NGVD of 1929) a geodetic datum derived from a general adjustment of the first-order level nets of both the United States and Canada, formerly called Sea Level Datum of 1929.
IV Ground-Water Levels and Directions of Flow near the Industrial Excess Landfill, Uniontown, Ohio, March 1994

Ground-Water Levels and Directions of Flow near the Industrial Excess Landfill, Uniontown, Ohio, March 1994
By Denise H. Dumouchelle andE. Scott Bair
Abstract
Industrial Excess Landfill (IEL), a U.S. Environmental Protection Agency Super- fund site, is a closed landfill in northeastern Ohio. In March 1994, personnel from the U.S. Geological Survey, Ohio Environmental Protection Agency, and PRC Environmental Management, Inc., measured water levels in 149 wells in the area. Surface-water altitudes were measured at 13 staff gages, and water levels were measured in 9 piezometers associ ated with the gages. The data show that the regional pattern of ground-water flow gener ally is from east to west, but it is locally altered by ground-water mounds that reflect the hum- mocky terrain. At the landfill, regional flow is altered by two ground-water mounds one in the southeastern corner of the site and one just to the north. The relatively small ground-water mound at the landfill causes ground water to flow radially away from the southeastern cor ner of the landfill. Ground water that flows to the east and south flows toward Metzger Ditch, whereas flow to the west is consistent with the regional direction of ground-water flow. Ground-water flow northward from IEL is diverted east or west by the southerly compo nent of flow from the larger ground-water mound north of IEL.
INTRODUCTION
Industrial Excess Landfill (IEL), a Super- fund site, is a closed landfill located in a former sand and gravel quarry south of Union- town, in northeastern Ohio (fig. 1) (U.S. Envi
ronmental Protection Agency, 1988b). The IEL site encompasses about 30 acres in a mixed rural/residential area. During operation from 1966 to 1980, the landfill accepted vari ous municipal, commercial, and industrial wastes, including substantial quantities of chemical and liquid wastes (U.S. Environ mental Protection Agency, 1988b).
In 1989, the U.S. Geological Survey (USGS), by use of data reported in well drill ers' logs, examined ground-water levels and flow around Uniontown (Bair and Norris, 1989). The composite potentiometric-surface maps in the 1989 report are based on water- level data that spans 26 years and, thus, include temporal variations in water levels. A recent study investigated conditions only in the immediate vicinity of IEL (U.S. Environmen tal Protection Agency, 1993). Discrepancies between the 1989 and 1993 reports indicated a need for a synoptic (short time span) water- level study of IEL and the Uniontown area. In March 1994, in cooperation with the U.S. Environmental Protection Agency (USEPA), the USGS and others measured water levels at the site and in the adjacent resi dential area.
Purpose and Scope
The purpose of this report is to describe ground-water levels and directions of flow at and around the IEL site. These descriptions are based on synoptic water-level measurements made from March 14-18, 1994. This approach is designed to integrate an interpretation of the local flow system at IEL with that of the
Introduction

81°25' 81°22'30"
40°59' m
40°57'30"
^77"^ l&i-r-t-tzssfr U SZ/^1_ <^h/wo^ 'O* fl C I: V/ ^i 1- - y^> f//MiH
Base from U.S. Geological Survey North Canton. 1967, photorevised as of 1984
1MILE
1 KILOMETER
Study Area
1120-
EXPLANATION
INDUSTRIAL EXCESS LANDFILL
GROUND-WATER LEVEL CONTOUR Contour interval 10 feet. Dashed where approximately located. Datum is sea level
Figure 1. Regional ground-water levels near Uniontown, Ohio, based on March 1994 water-level data
2 Ground-Water Levels and Directions of Flow near the Industrial Excess Landfill. Uniontown, Ohio, March 1994

regional ground-water-flow system so that potential offsite migration of wastes can be evaluated. The USGS measured water levels in 85 private wells within a 1.75-mi radius of the site. The USGS also measured surface-water levels at 13 staff gages and measured water levels in nine piezometers adjacent to the staff gages to ascertain flow gradients at that time between surface water and ground water. Water levels also were measured in four pie zometers that were drilled in March 1994, north and northwest of IEL, to help locate a potential ground-water divide. Personnel from PRC Environmental Management, Inc., and the Ohio Environmental Protection Agency (OEPA) measured water levels in 60 monitor ing wells on and adjacent to the site.
The water-level measurements were used to construct a series of water-level maps and a plot of horizontal-hydraulic-gradient vectors in the unconsolidated aquifer. These maps show the altitude and configuration of water levels in the regional ground-water-flow system at a scale of 1:24,000 by use of water-level con tours with a 10-ft interval; the flow system in the immediate area of IEL is shown at a scale of 1:3,200 by use of water-level contours with a 5-ft interval and at a scale of 1:2,400 by use of a water-level contour with a 2-ft interval. The plot of horizontal-hydraulic-gradient vec tors was constructed to help assess offsite flow directions and to locate a potential ground- water divide north of IEL. A potentiometric profile was constructed to aid in visualizing the three-dimensional character of the ground- water-flow system at IEL.
Description of Study Area
The study area (fig. 1) is in the northwest ern corner of Lake Township in Stark County but includes a small area of eastern Summit County. Land-surface altitudes in the area range from about 1,090 to 1,220 ft above sea level. The topography of the area is the result
of Wisconsinan glaciation. The rolling terrain includes areas of marked, hummocky topogra phy. The tops of these irregularly-shaped knolls may be more than 80 ft higher than the floors of adjacent valleys. Most of the study area is drained by Metzger Ditch (fig. 1). Ponds and poorly drained depressions are common.
The study area is in the glaciated part of the Appalachian Plateaus Physiographic Prov ince. The glacial deposits consist of sands and gravels with some silts and clays. Most private wells obtain water from the sand and gravel deposits or from permeable layers in the underlying bedrock. The bedrock that under lies the glacial deposits in the area consists of the Pottsville Formation of Pennsylvanian age, which is an interbedded sequence of sand stone, siltstone, limestone, and coal. The bed rock surface is irregular because of erosion prior to and during Wisconsinan glaciation. In the study area, relief on the bedrock surface is more than 100 ft (Bair and Norris, 1989, fig. 4; U.S. Environmental Protection Agency, 1993, fig. 3-15). The presence of buried bedrock val leys causes large variations in the saturated thickness of the overlying glacial deposits. Detailed descriptions of the geology in the area can be found in DeLong and White (1963) and White (1984).
Acknowledgments
The authors thank all the property owners who allowed access to their wells. The authors also thank the Concerned Citizens of Lake Township and Bill Cunningham of the Stark County Health Department for providing maps and information on well abandonments in the area. In addition, the authors thank the person nel from OEPA and PRC Environmental Management, Inc., for their efforts during the installation of the four piezometers and for col lecting water-level data.
Introduction

METHODS OF INVESTIGATION
Only wells completed in the glacial depos its were used to define directions of ground- water flow. Drillers' logs on file at the Ohio Department of Natural Resources (ODNR) were reviewed to locate private wells for potential use in the study. During the synoptic measurement period, the drillers' logs were used to locate the property; if the resident gave permission, the water level in the well was measured.
The water levels were measured by use of either an electric tape or a chalked steel tape. The depth to water was measured from the top of the well casing with an accuracy of +0.01 ft. After a water-level measurement, the land- surface correction (the distance from the land surface to the top of the well casing) was mea sured. The land-surface correction was sub tracted from the water-level measurement to correct the water-level measurement to depth below land surface. Land-surf ace altitudes were determined either from a USGS 7.5-minute topographic map of the North Canton Quadrangle, from the Stark County Engineer's topographic maps, or from survey ing the altitude of the top of the well casing. The accuracy of the land-surf ace altitudes is discussed later in the report.
Surface-water altitudes were measured by use of nine staff gages on Metzger Ditch and four staff gages on local ponds. As an aid in understanding the relation between the ground-water and surface-water systems, field personnel measured the depth to water in nine piezometers adjacent to the staff gages. The staff gages and piezometers had been installed during a previous USEPA study (U.S. Environ mental Protection Agency, 1993). The alti tudes of the staff gages and piezometers were surveyed by USGS personnel.
Four piezometers were installed north and northwest of IEL to help delineate a local ground-water mound that affects patterns of ground-water flow near IEL. The piezometers
were installed by USEPA in accordance with location and depth criteria provided by the USGS. The altitudes of the top of casings of these piezometers were surveyed by USGS personnel, and the depth to water was mea sured. Water levels in monitoring wells at the IEL site were measured by personnel from PRC Environmental Management, Inc., and OEPA. The altitudes of the top of casing of these wells also were surveyed by USGS personnel.
GROUND-WATER LEVELS AND DIRECTIONS OF FLOW
Water levels measured in private wells are listed in table 1. The table column "Well/Land Altitude" provides information on the source of the altitude data used. Land-surface alti tudes estimated from the 7.5-minute USGS topographic map, which has a 10-ft contour interval, are accurate to ±5 ft. Land-surface altitudes estimated from the Stark County Engineer's topographic map, which has a 2-ft contour interval, are accurate to ±3 ft (Joe Bandy, Stark County Engineer's office, oral commun., 1994). The altitude of the well casing of selected wells was surveyed. These altitudes are accurate to ±0.05 ft. Water levels measured in the four piezometers and IEL monitoring wells are listed in table 2. Data from the piezometer/staff-gage pairs are listed in table 3.
Figure 1 is a water-level contour map of the entire study area constructed at a scale of 1:34,300. Plates 1 and 2 (back of report) also are water-level contour maps, but they cover a smaller area, which focuses on the IEL site, at scales of 1:3,200 and 1:2,400, respectively. Because of the increase in scale, one can use a smaller contour interval for the larger- scale maps than for the 1:34,300-scale map.
Ground-Water Levels and Directions of Flow near the Industrial Excess Landfill, Uniontown, Ohio, March 1994
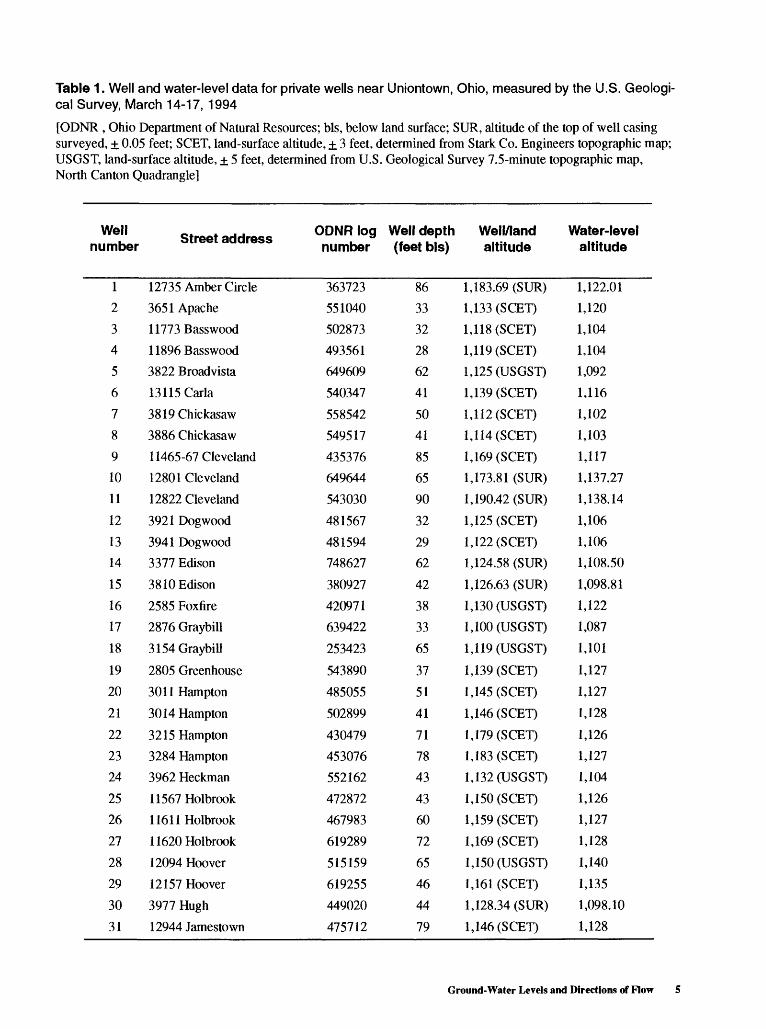
Table 1 . Well and water-level data for private wells near Uniontown, Ohio, measured by the U.S. Geologi cal Survey, March 14-17, 1994
[ODNR, Ohio Department of Natural Resources; bis, below land surface; SUR, altitude of the top of well casing surveyed, + 0.05 feet; SCET, land-surface altitude, + 3 feet, determined from Stark Co. Engineers topographic map; USGST, land-surface altitude, ± 5 feet, determined from U.S. Geological Survey 7.5-minute topographic map, North Canton Quadrangle]
Well number Street address ODNR log Well depth Well/land Water-level
number (feet bis) altitude altitude
12
3
4
5
6
7
8
9
10
11
12
13
14
15
16
17
18
19
20
21
22
23
24
25
26
27
28
29
30
31
12735 Amber Circle
3651 Apache
11773Basswood
11896Basswood
3822 Broadvista
13115 Carla
3819Chickasaw
3886 Chickasaw
11465-67 Cleveland
12801 Cleveland
12822 Cleveland
3921 Dogwood
3941 Dogwood
3377 Edison
38 10 Edison
2585 Foxfire
2876 Graybill
3154Graybill
2805 Greenhouse
3011 Hampton
30 14 Hampton
3215 Hampton
3284 Hampton
3962 Heckman
11567Holbrook
11611Holbrook
11620Holbrook
12094 Hoover
12157 Hoover
3977 Hugh
12944 Jamestown
363723
551040
502873
493561
649609
540347
558542
549517
435376
649644
543030
481567
481594
748627
380927
420971
639422
253423
543890
485055
502899
430479
453076
552162
472872
467983
619289
515159
619255
449020
475712
86
33
32
28
62
41
50
41
85
65
90
32
29
62
42
38
33
65
37
51
41
71
78
43
43
60
72
65
46
44
79
1,183.69 (SUR)
1,133 (SCET)
1,1 18 (SCET)
1,1 19 (SCET)
1,125 (USGST)
1,139 (SCET)
1,1 12 (SCET)
1,1 14 (SCET)
1,169 (SCET)
1,173.81 (SUR)
1,190.42 (SUR)
1,125 (SCET)
1,122 (SCET)
1,124.58 (SUR)
1,126.63 (SUR)
1,130 (USGST)
1,100 (USGST)
1,1 19 (USGST)
1,139 (SCET)
1,145 (SCET)
1,146 (SCET)
1,179 (SCET)
1,183 (SCET)
1,132 (USGST)
1,150 (SCET)
1,159 (SCET)
1,169 (SCET)
1,150 (USGST)
1,161 (SCET)
1,128.34 (SUR)
1,146 (SCET)
1,122.01
1,120
1,104
1,104
1,092
1,116
1,102
1,103
1,117
1,137.27
1,138.14
1,106
1,106
1,108.50
1,098.81
1,122
1,087
1,101
1,127
1,127
1,128
1,126
1,127
1,104
1,126
1,127
1,128
1,140
1,135
1,098.10
1,128
Ground-Water Levels and Directions of Flow
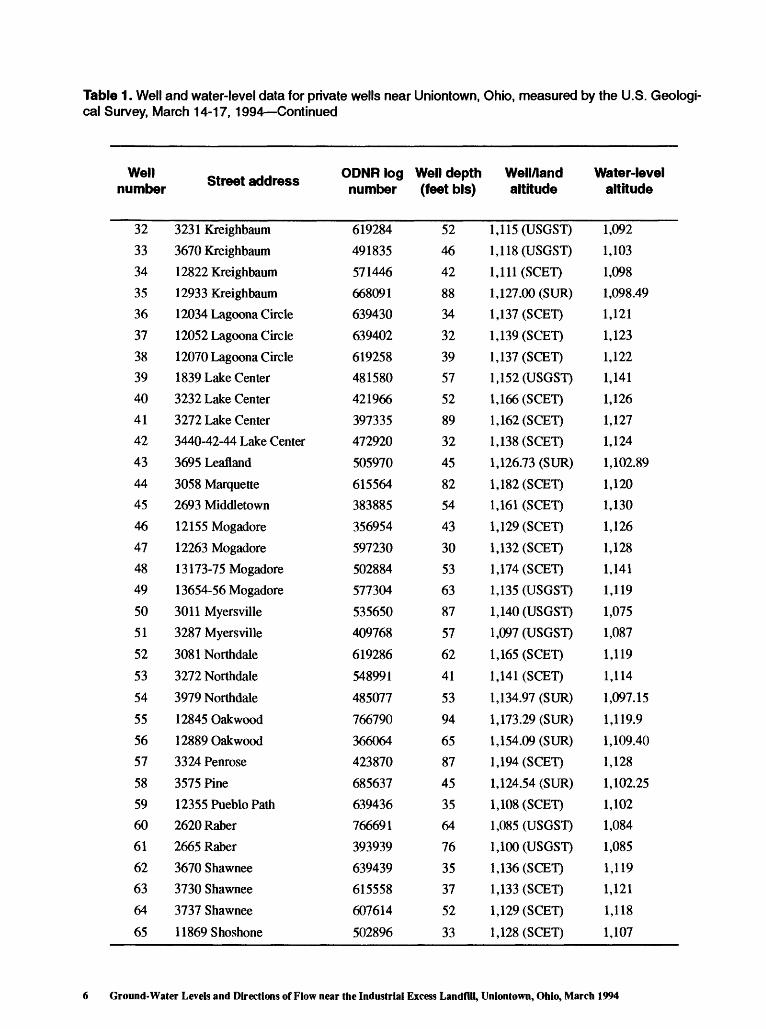
Table 1. Well and water-level data for private wells near Uniontown, Ohio, measured by the U.S. Geologi cal Survey, March 14-17,1994 Continued
Well number Street address ODNRlog Well depth Well/land Water-level
number (feet bis) altitude altitude
32
33
34
35
36
37
38
39
40
41
42
43
44
45
46
47
48
49
50
51
52
53
54
55
56
57
58
59
60
61
62
63
64
65
3231 Kreighbaum
3670 Kreighbaum
12822 Kreighbaum
12933 Kreighbaum
12034 Lagoona Circle
1 2052 Lagoona Circle
12070 Lagoona Circle
1839 Lake Center
3232 Lake Center
3272 Lake Center
3440-42-44 Lake Center
3695 Leafland
3058 Marquette
2693 Middletown
12155 Mogadore
12263 Mogadore
13173-75 Mogadore
13654-56 Mogadore
3011 Myersville
3287 Myersville
3081Northdale
3272 Northdale
3979 Northdale
12845 Oakwood
12889Oakwood
3324 Penrose
3575 Pine
12355 Pueblo Path
2620 Raber
2665 Raber
3670 Shawnee
3730 Shawnee
3737 Shawnee
11869Shoshone
619284
491835
571446
668091
639430
639402
619258
481580
421966
397335
472920
505970
615564
383885
356954
597230
502884
577304
535650
409768
619286
548991
485077
766790
366064
423870
685637
639436
766691
393939
639439
615558
607614
502896
52
46
42
88
34
32
39
57
52
89
32
45
82
54
43
30
53
63
87
57
62
41
53
94
65
87
45
35
64
76
35
37
52
33
1,115 (USGST)
1,118 (USGST)
1,111 (SCET)
1,127.00 (SUR)
1,137 (SCET)
1,139 (SCET)
1,137 (SCET)
1,152 (USGST)
1,166 (SCET)
1,162 (SCET)
1,138 (SCET)
1,126.73 (SUR)
1,182 (SCET)
1,161 (SCET)
1,129 (SCET)
1,132 (SCET)
1,174 (SCET)
1,135 (USGST)
1,140 (USGST)
1,097 (USGST)
1,165 (SCET)
1,141 (SCET)
1,134.97 (SUR)
1,173.29 (SUR)
1,154.09 (SUR)
1,194 (SCET)
1,124.54 (SUR)
1,108 (SCET)
1,085 (USGST)
1,100 (USGST)
1,136 (SCET)
1,133 (SCET)
1,129 (SCET)
1,128 (SCET)
1,092
1,103
1,098
1,098.49
1,121
1,123
1,122
1,141
1,126
1,127
1,124
1,102.89
1,120
1,130
1,126
1,128
1,141
1,119
1,075
1,087
1,119
1,114
1,097.15
1,119.9
1,109.40
1,128
1,102.25
1,102
1,084
1,085
1,119
1,121
1,118
1,107
Ground-Water Levels and Directions of Flow near the Industrial Excess Landfill, Uniontown, Ohio, March 1994

Table 1. Well and water-level data for private wells near Uniontown, Ohio, measured by the U.S. Geologi cal Survey, March 14-17,1994 Continued
Well number Street address ODNRlog Well depth Well/land Water-level
number (feet bis) altitude altitude
66
67
68
69
70
71
72
7374
75
76
77
78
79
80
81
82
83
84
85
12284 Shoshone
12294 Shoshone
2673 Spade
13238 Summerfield
12896 Sunset Circle
3177Sweitzer
3574 Sweitzer
3165Townsend
3236 Townsend
3301 Townsend
12826 Troyer
3060 Twin Hills
3280 Twin Hills
3300-02 Twin Hills
3360 Twin Hills
11558 Whitehall
11600 Whitehall
11611 Whitehall
11670 Whitehall
2535 Woodview
607610
615557
686915
684804
481613
280999
472938
438567
419802
413609
551038
393773
379359
379358
414487
438562
430477
419849
426831
441428
51
35
55
78
43
42
41
65
62
84
42
56
80
83
92
61
52
62
62
38
1,135 (SCET)
1,138 (SCET)
1,093(USGST)
1,175 (SCET)
1,123.37 (SUR)
1,119(USGST)
1,122 (USGST)
1,171 (SCET)
1,175 (SCET)
1,186 (SCET)
1,138 (SCET)
1,170 (SCET)
1,192 (SCET)
1,195 (SCET)
1,188 (SCET)
1,159 (SCET)
1,163 (SCET)
1,172 (SCET)
1,174 (SCET)
1,129 (USGST)
1,121
1,121
1,069
1,116
1,099.90
1,111
1,095
1,127
1,125
1,125
1,129
1,128
1,123
1,127
1,127
1,128
1,126
1,127
1,127
1,102
Ground-Water Levels and Directions of Flow
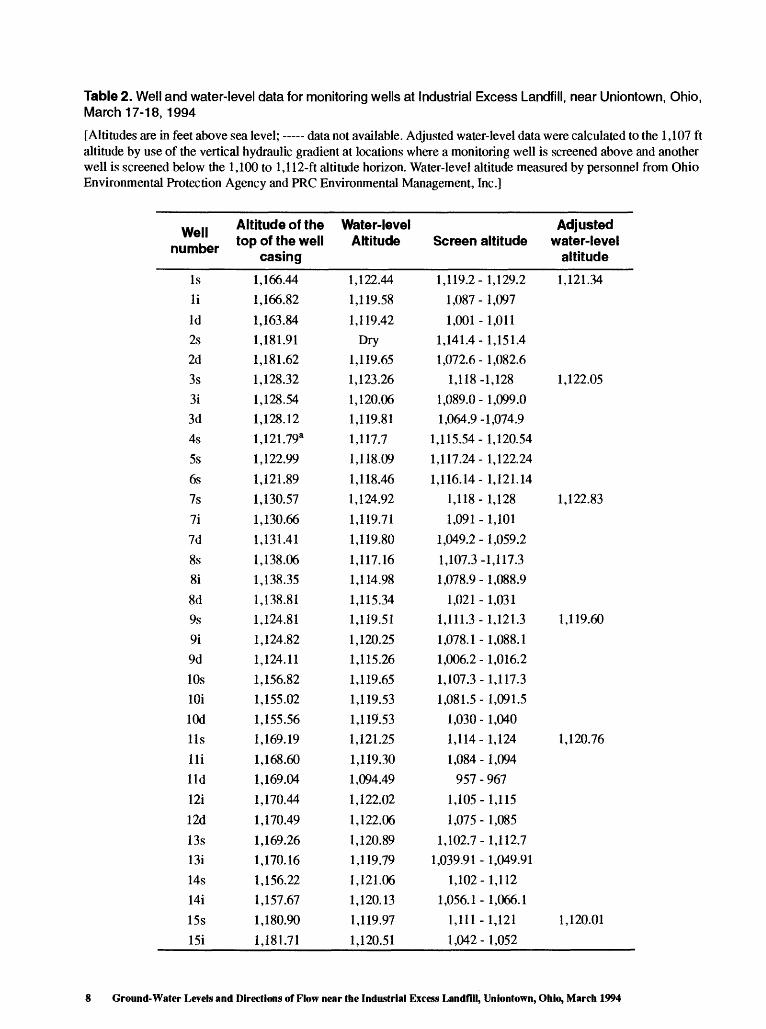
Table 2. Well and water-level data for monitoring wells at Industrial Excess Landfill, near Uniontown, Ohio, March 17-18, 1994
[Altitudes are in feet above sea level; data not available. Adjusted water-level data were calculated to the 1,107 ft altitude by use of the vertical hydraulic gradient at locations where a monitoring well is screened above and another well is screened below the 1,100 to 1,112-ft altitude horizon. Water-level altitude measured by personnel from Ohio Environmental Protection Agency and PRC Environmental Management, Inc.]
Well number
Altitude of thetop of the well
casing
Water-level Altitude Screen altitude
Adjustedwater-level
altitude
Isli
Id2s2d3s3i3d4s5s6s7s7i7d8s8i
8d9s9i9d10slOilOd11sHilid12i12d13s13i14s14i15s15i
1,166.441,166.82
1,163.841,181.911,181.621,128.321,128.541,128.12l,121.79a1,122.991,121.891,130.571,130.661,131.41
1,138.061,138.351,138.811,124.811,124.821,124.111,156.821,155.021,155.561,169.191,168.601,169.041,170.441,170.491,169.261,170.161,156.221,157.671,180.901,181.71
1,122.441,119.58
1,119.42Dry
1,119.651,123.261,120.061,119.811,117.71,118.091,118.461,124.921,119.711,119.801,117.161,114.981,115.341,119.511,120.251,115.261,119.651,119.531,119.531,121.251,119.301,094.491,122.021,122.061,120.891,119.791,121.061,120.131,119.971,120.51
1,119.2- 1,129.21,087-1,0971,001-1,011
1,141.4-1,151.41,072.6-1,082.6
1,118-1,1281,089.0-1,099.01,064.9-1,074.9
1,115.54-1,120.541,117.24- 1,122.241,116.14- 1,121.14
1,118-1,1281,091-1,101
1,049.2-1,059.21,107.3-1,117.31,078.9-1,088.9
1,021 - 1,0311,111.3-1,121.31,078.1-1,088.11,006.2 - 1,016.21,107.3-1,117.31,081.5-1,091.5
1,030-1,0401,114-1,1241,084 - 1,094
957 - 9671,105-1,115
1,075 - 1,0851,102.7-1,112.7
1,039.91 - 1,049.911,102-1,112
1,056.1-1,066.11,111-1,1211,042-1,052
1,121.34
1,122.05
1,122.83
1,119.60
1,120.76
1,120.01
8 Ground-Water Levels and Directions of Flow near the Industrial Excess Landfill, Uniontown, Ohio, March 1994

Table 2. Well and water-level data for monitoring wells at Industrial Excess Landfill, near Uniontown, Ohio, March 17-18, 1994 Continued
Well numberAltitude of the top of the well
casing
Water-level Altitude Screen
altitude
Adjusted water-level
altitude
14i15s15i16i17s17d18s18i19s20s20i
20d21s21i22i23s23i23d24s24i25s25i26s26i27s27i27d28d
OW-5P14b
P15b'cP16b'c
P17b,c
1,157.671,180.901,181.711,169.361,148.011,149.311,177.371,177.481,121.54l,125.09a1,124.02
l,124.08a1,167.501,166.791,184.391,126.681,125.67l,126.44a1,185.461,185.941,145.951,145.261,164.141,164.211,155.181,154.731,154.081,126.381,169.291,179.871,183.781,145.291,153.10
1,120.131,119.971,120.511,120.401,120.921,121.141,122.141,119.561,119.481,119.501,119.911,118.101,119.421,119.541,119.841,119.571,117.72
1,093.331,111.511,114.401,119.341,119.391,114.891,114.881,118.571,117.911,111.011,110.191 119 421 5 1 1,7.*T^
1,119.531,127.64
1,134.501,136.05
1,056.11,1111,0421,069
1,109.61,0521,115
1,0551,0781,0941,045
9771,0771,0531,0601,1041,002
9541,0951,0811,0991,0101,0541,0221,107
1,003939
988-
1,1061,101.81,102.61,101.1
- 1,066.1- 1,121 1,120.01- 1,052- 1,079- 1,119.6 1,121-1,062- 1,125 1,121.82-1,065- 1,088-1,104- 1,050-997
- 1,087-1,063- 1,070-1,114- 1,012-984
- 1,105-1,091- 1,109-1,020-1,064- 1,032-1,117- 1,013-969
1,013
-1,111- 1,106.8- 1,107.6- 1,106.1
aAltitude is the top of the protective casing, not the top of the well casing. The top of the protective casing is above the top of the well casing; thus, for calculations, the elevation of the top of the well casing was assumed
to be 0.5 ft lower.
bPiezometer installed in March 1994 north of the site for use in the water-level synoptic.
°Water level measured March 14 by U.S. Geological Survey personnel.
Ground-Water Levels and Directions of Flow

Table 3. Water-level altitudes in piezometers and at staff gages near Uniontown, Ohio, March 14,1994
iniuiuuvo oiv in iwi auvrv at/a K/vt/i, , waivi it/vt/i in jsiviAJiiitsitsi IIVH nuxiduivu. TTCUVI-
level altitudes measured by personnel from the U.S. Geological Survey]
Piezometer/ staff gage number
PS1
PS 2
PS 3
PS 4
PS 5
PS 6
PS 7
PS 8
PS 9
PS 10
PS 11
PS 12
PS 13
Location Water-level altitude Location piezometer Staff gage
Metzger Ditch
Metzger Ditch 1,118.49
Metzger Ditch 1,118.03
Metzger Ditch 1,120.04
Metzger Ditch 1,118.78
Metzger Ditch
Metzger Ditch > 1 , 1 1 5.02
Metzger Ditch 1,109.65
Metzger Ditch
Pond 1,132.54
Pond 1,108.98
Pond 1,119.84
Ponrl ____J7 V/IIV1
1,122.06
1,118.43
1,117.93
1,117.70
1,116.93
1,115.09
1,112.94
1,109.55
1,109.43
1,131.63
1,113.27
Dry
1,124.75
Comments
Piezometer frozen
Piezometer missing
Piezometer overflowing
Piezometer frozen
10 Ground-Water Levels and Directions of Flow near the Industrial Excess Landfill, Uniontown, Ohio, March 1994

In addition to the water-level data, topography was considered in determining the water-level contours on figure 1 and plates 1 and 2.
A water-level contour map is different from a water-table contour map. The water table is the surface in an unconfined aquifer at which the pore-water pressure is equal to atmospheric pressure. A water-table contour map shows lines of equal altitude of the water table and is based on measurements made in wells that penetrate the aquifer just far enough to hold standing water. A water-level contour map is based on measurements made in wells whose screens penetrate to different depths within an aquifer. As a result, in areas where vertical hydraulic gradients are present, a water-level contour map may not represent actual flow conditions at the water table or at any specific horizon within the aquifer (Saines, 1981).
The water-level contours on figure 1 repre sent the regional ground-water-flow system and are believed to closely approximate the configuration of the regional water table, par ticularly at distance from recharge areas. Gen erally, regional ground-water flow is from east to west; however, the hummocky topography results in numerous local ground-water mounds and depressions, which represent areas of recharge and discharge, respectively. The ground-water mounds locally alter the regional east-to-west direction of ground- water flow. An example of such a ground- water mound can be seen along Mogadore Avenue, north of State Route 619, in the north eastern section of figure 1. The regional east- to-west ground-water flow around IEL is altered by a ground-water mound north of the IEL site and a smaller mound in the southeast ern corner of the site. The ground-water mound, shown in the eastern part of figure 1 by the estimated (dashed) 1,130- and 1,140-ft ground-water contours, is interpreted partly on the basis of topographic contours.
Plate 1 is a large scale map that focuses on water levels at IEL and the immediate vicinity. At most of the IEL monitoring-well locations, multiple wells are present at a single location but are completed at different depths. North of IEL is a topographic ridge that extends from Cleveland Avenue northeast for about 1 mi. This ridge is roughly delineated by the 1,150-ft topographic contour (fig. 1). IEL is on the southeastern flank of this ridge. The regional topographic setting indicates that this ridge is a local ground-water-recharge area; therefore, the highest water-level altitudes near IEL were expected to be found near this ridge. Private well 11 had the highest water-level altitude at or adjacent to IEL. Water-level altitudes at private well 10 and IEL wells PI5, PI6, and P17 help to define the ground-water mound underlying this ridge. North of IEL, the 1,120-ft ground-water contour closely approxi mates the trend of this topographic ridge.
A ground-water divide is a plane that sepa rates two distinct areas of flow and can be defined by ridges in the ground-water surface. Because of the radial pattern of flow away from ground-water mounds, a ground-water divide at a mound can be drawn in almost any direction to emphasize different parts of the flow system. North of IEL, the 1,120-ft water- level contour represents the edge of a ridge in the ground-water surface. On plate 1, the dashed line marking the ground-water divide extends west through the ground-water mound to emphasize the effect of the ridge and mound on ground-water flow near IEL. At the ground- water ridge, water north of the divide flows northward, and water south of the divide flows southward. On the mound, ground water flows radially away from the highest point.
Ground water flows radially away from the local mound in the southeastern corner of the IEL site; however, ground water flowing north from the IEL mound is diverted east or west, in part, by a zone of relatively higher transmis- sivity in glacial deposits that fill a preglacial bedrock valley (Bair and Norris, 1989, fig. 4;
Ground-Water Levels and Directions of Flow 11

U.S. Environmental Protection Agency, 1993, fig. 3-15). Ground water flowing westward from the IEL mound is consistent with the east-to-west regional ground-water flow. Much of the eastern and southern components of ground-water flow from IEL are towards Metzger Ditch. A comparison of water-level altitudes at the piezometers/staff gage pairs installed along Metzger Ditch (table 3) indi cate that the ditch is a gaining stream. The small mound southwest of IEL and the larger mound due south of Lake Center Street also directs some of the ground-water flow toward Metzger Ditch (fig. 1).
As stated before, water-level maps based on data from wells completed at different depths may not realistically represent the ground-water-flow patterns in areas where there are vertical hydraulic gradients. In these areas, a more representative map can be drawn by use of water levels from wells that are com pleted within a specific horizon in the aquifer. The thickness of a selected horizon must be narrow enough to minimize the effects of the vertical gradient while thick enough to provide sufficient information for interpretation. The altitudes of the top and bottom of a selected horizon are arbitrary. In this report, a horizon from 1,100 to 1,112 ft above sea level was selected for study.
Plate 2 is a potentiometric contour map for this horizon. This horizon was selected because it is beneath the landfill and compara ble to the one used in a previous study (U.S. Environmental Protection Agency, 1993). Water levels from wells whose screens are at least 50 percent within this horizon, or water-level data that were adjusted to the 1,107-ft altitude (the middle of the horizon) (table 2), were selected for use on plate 2.
l ln this discussion and hereafter in the report, the term horizon refers to a zone having a defined top and bottom in an aquifer.
The adjusted water-level data were calcu lated by use of the vertical hydraulic gradient at locations where a monitoring well is screened above the horizon and another well is screened below it. Of the three contour maps in this report, plate 2 is the most accurate por trayal of the ground-water-flow system near IEL. The dashed arrows on plate 2 represent apparent (two-dimensional) directions of flow. As can also be seen on plate 1, ground water flowing northward from IEL is diverted west or east by water flowing southward from the ground-water mound north of IEL.
The hydrologic effect of the large ground- water mound north of IEL can also be shown by use of a map that shows vectors of horizon tal hydraulic gradient constructed by the three- point method. In this method, three points of known water level are used to define a triangu lar cell in which the vector of horizontal hydraulic gradient for the cell is determined from the known values (Pinder and others, 1981). Plate 3 (back of report) shows vectors of hydraulic gradient for a part of the area shown in plate 2. Because only water-level data from the 1,100- to 1,112-ft horizon were used to resolve the vectors, the arrows repre sent vectors of horizontal hydraulic gradient. The orientation of each arrowhead indicates the direction of ground-water flow, and the size of the arrow indicates the relative magnitude of the horizontal hydraulic gradient, as listed in table 4. The cells numbered 3, 4, 5, 6, and 7 show the southerly flow direction off the large ground-water mound north of IEL. Cell 9 shows the northerly ground-water-flow direc tion from the northern part of the ground-water mound at IEL. The magnitude of the horizon tal hydraulic gradients in cells 5, 6, and 7 is greater than that in cell 9 and is directly pro portional to the rate of ground-water flow, assuming that the hydraulic conductivity is spatially constant.
12 Ground-Water Levels and Directions of Flow near the Industrial Excess Landfill, Uniontown, Ohio, March 1994

Table 4. Horizontal hydraulic gradient and flow velocities near the Industrial Excess Landfill, near Uniontown, Ohio, March 1994
Cell
1
2
3
4
5
6
7
8
9
10
11
12
Wells
10, 11,P17
10, P17, P16
10, 11,P15
P15, 10,P16
24s, 27s, P16
27s, P16, P15
P14, P15, 27s
24s, 11,27s
ll,P14,27s
11, 24s, 25s
1,11,25s
11,1,P14
Horizontal hydraulic gradient
(feet per feet)
0.0047
.016
.023
.022
.037
.037
.020
.023
.0039
.014
.0043
.0025
Flow direction (degrees)
N. 14° W.
S. 18° W.
E. 19° S.
E.25°S.
W. 16° S.
E. 12° S.
W. 11° S.
S.20°W.
W. 19° N.
N.20°W.
S.3°W.
W.50°S.
Horizontal flow velocity (feet per day)
0.76
2.6
3.7
3.7
6.3
6.0
3.3
3.7
.63
2.3
.70
.43
Ground-Water Levels and Directions of Flow 13
C
FEE
T g,
1
.20
0-,
V) o
97
5
PIE
ZO
ME
TE
R
ST
AF
F^
GE
3!
1118
.0(P
) 1117.9
(8)
Indu
stria
l Exc
ess
Land
fill
95
0D
ATU
M I
S S
EA
LE
VE
LV
ER
TIC
AL
SC
AL
E G
RE
ATL
Y E
XA
GG
ER
ATE
D

0 20
0 40
0 60
0 80
0 FE
ET
I I
I I
I i
1 I
II
I I
0 20
0 M
ETE
RS
B
O. i O
i o o. I I 2, 3 i
EX
PLA
NA
TIO
N
CLA
Y
SA
ND
CLA
Y W
ITH
SA
ND
, G
RA
VEL,
AN
D S
ILT
SA
ND
AN
D G
RA
VEL
LAN
DFI
LL W
AS
TE
SO
IL C
OV
ER
EQU
IPO
TEN
TIA
L U
NE
Co
nto
ur
inte
rval
5 fe
et.
Das
hed
whe
re a
ppro
xim
atel
y lo
cate
d.
(Con
tour
s at
111
9 an
d 11
21 w
ere
adde
d to
hel
p ill
ustr
ate
the
flow
sys
tem
)
WE
LL
Ho
rizo
nta
l lin
es in
dica
te s
cree
ned
inte
rval
. N
umbe
r is
wel
l id
entif
ier.
Low
er n
umbe
r sh
ows
wat
er-le
vel
elev
atio
n m
easu
red
Mar
ch 1
4-18
, 19
94
5
AP
PR
OX
IMA
TE A
LTIT
UD
E O
F TH
E W
ATE
R T
AB
LE
<
AP
PA
RE
NT
FLO
W D
IRE
CTI
ON
IIII
I II
I B
EDR
OC
K S
UR
FAC
E B
ased
on
Bai
r an
d N
orris
, 19
89 a
nd U
.S.
Envi
ronm
enta
l Pro
tect
ion
Age
ncy,
199
3.
Das
hed
whe
re a
ppro
xim
atel
y lo
cate
d
(fi)
FL
OW
OU
T O
F P
LAN
E O
F D
IAG
RA
M,
TOW
AR
D V
IEW
ER
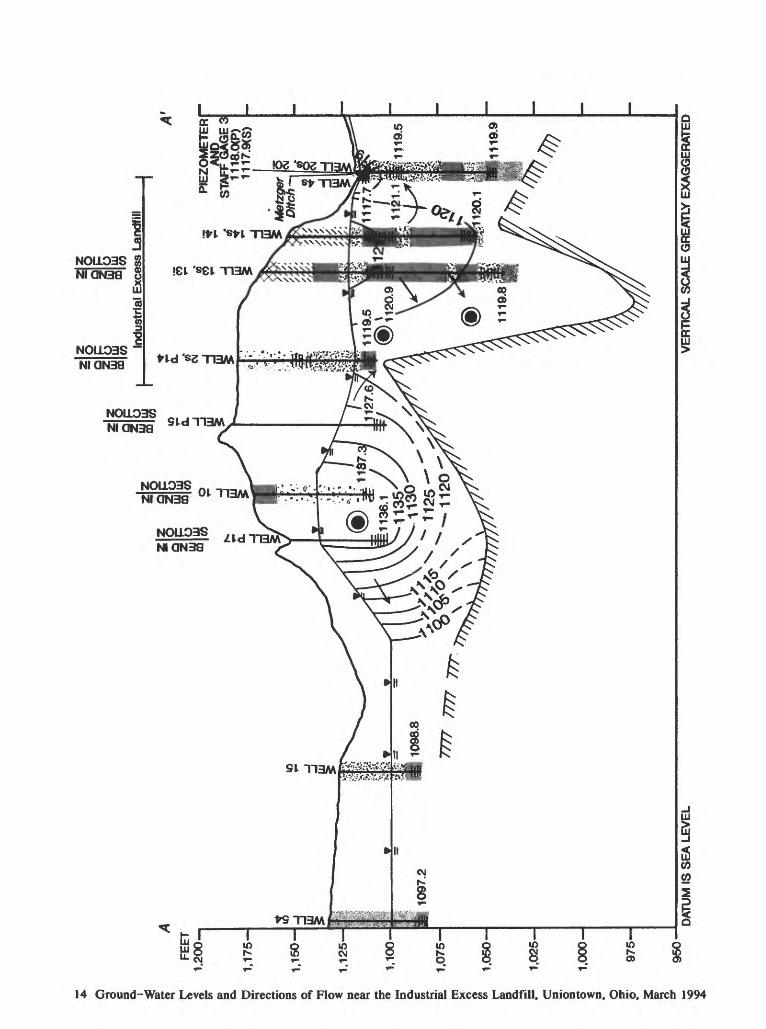
Figu
re 2
. H
ydro
logi
c se
ctio
n al
ong
A-A
', U
nion
tow
n, O
hio,
bas
ed o
n M
arch
199
4 w
ater
-leve
l dat
a.
(Lin
e of
sec
tion
show
n on
pi.
1.)

In table 4, the average linear horizontal flow velocities for each cell in plate 3 are based on an assumed hydraulic gradient of 50 ft/d, estimated from results of slug tests performed at IEL(U.S. Environmental Protection Agency, 1993), and an assumed porosity of 0.3. The velocities range from 0.43 to 6.3 ft/d. The largest velocities are in
cells 5 and 6, where flow is southward off the ground-water mound north of IEL. The smallest velocities are in cells 9,11, and 12, on the western edge of IEL property. Actual flow velocities will be slightly higher because vertical hydraulic gradients have not been included in the velocity calculations.
The various water-level maps show the ground-water system in two dimensions only. The three-dimensional character of the flow system is shown by the construction of a potentiometric profile (fig. 2). The line of profile A-A' is shown in plate 1. The profile was constructed from water levels measured at various depths in the glacial deposits to show the vertical-flow components. The relative size of the two ground-water mounds can be seen in figure 2. The mound north of IEL is the larger and controls the flow system north of the site. Flow north from the IEL mound is diverted to the west (out of the profile toward the viewer, fig. 2) by the larger mound. The potentiometric profile also shows the upward hydraulic gradient and ground-water discharge to Metzger Ditch.
Within the glacial materials, a zone of rela tively high transmissivity underlies the IEL site and extends to the west. The high transmissivity of this zone is a function of the comparatively greater thickness of permeable sand and gravel that fill part of a preglacial bedrock valley that extends westward (Bair and Norris, 1989, fig. 4; U.S. Environmental Protection Agency, 1993, fig. 3-15). It is this zone of relatively high transmissivity that con veys converging ground-water flow from the large ground-water mound to the north of IEL and from the smaller mound at IEL to the west.
This effect also can be seen on plates 1 and 2 as a zone of convergent flow (indicated by the converging ground-water-flow arrows on plate 2) in which ground water flows offsite to the west.
SUMMARY
Synoptic ground-water-level data collected near the Industrial Excess Landfill, Union- town, Ohio, in March 1994 indicate that regional ground-water flow is from east to west. This regional flow pattern is altered by local ground-water mounds, which underlie recharge areas beneath ridges and knolls in the hummocky terrain of the area.
Ground-water flow in the vicinity of IEL is affected by a large ground-water mound north of the site and a smaller ground-water mound in the southeastern corner of IEL. The ground- water mound at IEL causes ground water to flow radially away from the site. Ground-water flowing to the east and south flows toward Metzger Ditch, whereas flow to the west joins the regional ground-water-flow system. Ground-water flow north from IEL is diverted east or west by the southerly component of ground-water flow from the mound north of IEL.
SELECTED REFERENCES
Bair, E.S., and Norris, S.E., 1989, Ground-water levels and flow near the Industrial Excess Landfill, Uniontown, Ohio: U.S. Geological Survey Open- File Report 89-272,11 p.
Delong, R.M., and White, G.M., 1963, Geology of Stark County: Ohio Geological Survey, Bulletin 61, 209 p.
Finder, G.F.; Celia, Michael; and Gray, W.G., 1981, Velocity calculation from randomly located hydraulic heads: Ground Water, v. 19, no. 3, p. 262-264.
16 Ground-Water Levels and Directions of Flow near the Industrial Excess Landfill, Uniontown, Ohio, March 1994
Saines, Marvin, 1981, Errors in interpretation of ground- water level data: Ground Water Monitoring Review, v. l,no. l,p. 56-61.
Schaefer, E.J., White, G.W., and Van Tuyl, D.W., 1946, The ground-water resources of the glacial deposits in the vicinity of Canton, Ohio: Ohio Water Resources Board Bulletin 3,60 p.
U.S. Environmental Protection Agency, 1988a, Draft Remedial Investigation Report for Industrial Excess Landfill, Uniontown, Ohio: U.S. Environmental Protection Agency Performance of Remedial Response Activities at Uncontrolled Hazardous Waste Sites (REMII), prepared by C.C. Johnson & Malhotra, Inc. [various pagination].
U.S. Environmental Protection Agency, 1988b, Final Remedial Investigation Report for Industrial Excess Landfill, Uniontown, Ohio: U.S. Environmental Protection Agency Performance of Remedial Response Activities at Uncontrolled Hazardous Waste Sites (REMII), prepared by C.C. Johnson & Malhotra, Inc. [various pagination].
U.S. Environmental Protection Agency, 1993,Preliminary Remedial Design Industrial Excess Landfill, site, Uniontown, Ohio, Draft report, volume 1, chapters 1 through 10 and appendix A: Remedial Planning Activities at Selected Hazardous Waste Sites-Region V, prepared for U.S. Environmental Protection Agency Waste Management Division, Contract No. 68-0084, by PRC Environmental Management, Inc. [various pagination].
White, G.W., 1984, Glacial geology of Summit County, Ohio: Ohio Geological Survey Report of Investigations 123, 25 p.
*U.S. GOVERNMENT PRINTING OFFICE: 1994-0-552-973 Selected References 17