ground-water levels in the united states, 1973-74 states ... ground-water levels in the united...
TRANSCRIPT

Ground-Water Levels in the United States, 1973-74
Northeastern States
GEOLOGICAL SURVEY WATER-SUPPLY PAPER 2164
Prepared in cooperation with the States of Connecticut, Delaware, Indiana, Maine, Massachusetts, Michigan, New Hampshire, New Jersey, New York, Ohio, Pennsylvania, Rhode Island, and Vermont, and with other agencies
UNITED STATES GOVERNMENT PRINTING OFFICE, WASHINGTON : 1977

UNITED STATES DEPARTMENT OF THE INTERIOR
CECIL D. ANDRUS, Secretary
GEOLOGICAL SURVEY
V. E. McKelvey, Director
Library of Congress catalog-card No. GS 63-294
For sale by the Branch of Distribution, U.S. Geological Survey, 1200 South Eads Street, Arlington, VA 22202

PREFACE
This report was prepared by the U.S. Geological Survey in cooperation with the States of Connecticut, Delaware, Indiana, Maine, Massachusetts, Michigan, New Hampshire, New Jersey, New York, Ohio, Pennsylvania, Rhode Island, and Vermont, and with other agencies, by personnel of the Water Resources Division, J. S. Cragwall, Jr., chief hydrologist, G. W. Whetstone, assistant chief hydrologist for Scientific Publications and Data Management, under the general direction of G. A. Billingsley, chief, Reports Section, and C. B. Ham, chief, Data Reports Unit.
The data were collected under the supervision of district chiefs, Water Resources Division, as follows:
J. A. Baker.........................Boston, Mass.N. H. Beamer......................Harrisburg, Pa.J. F. Blakey.......................Columbus, OhioJ. L. Cook.....................Indianapolis, Ind.T. R. Cummings.....................Lansing, Mich.R. J. Dingman........................Albany, N.Y.Harold Meisler......................Trenton, N.J.F. H. Ruggles, Jr.................Hartford, Conn.W. F. White, Jr.......................Towson, Md.
Ill

CONTENTS
Page
Introduction............................................... 1Connecticut................................................ 4Delaware................................................... 10Indiana.................................................... 15Maine...................................................... 23Massachusetts.............................................. 29Michigan................................................... 36New Hampshire.............................................. 50New Jersey................................................. 53New York................................................... 62Ohio....................................................... 76Pennsylvania............................................... 91Rhode Island............................................... 118Vermont.................................................... 123
ILLUSTRATIONS
Figure 1. Outline map of the United States showing Statesincluded in this volume.......................... 3
2-14. Location of observation wells, 1973-74 in-2. Connecticut.................................. 53. Delaware..................................... 114. Indiana...................................... 165. Maine........................................ 246. Massachusetts................................ 307. Michigan..................................... 388. New Hampshire................................ 519. New Jersey................................... 54
10. New York..................................... 6411. Ohio......................................... 7712. Pennsylvania................................. 9213. Rhode Island................................. 11914. Vermont...................................... 124

GROUND-WATER LEVELS IN THE UNITED STATES, 1973-74
NORTHEASTERN STATES
INTRODUCTION
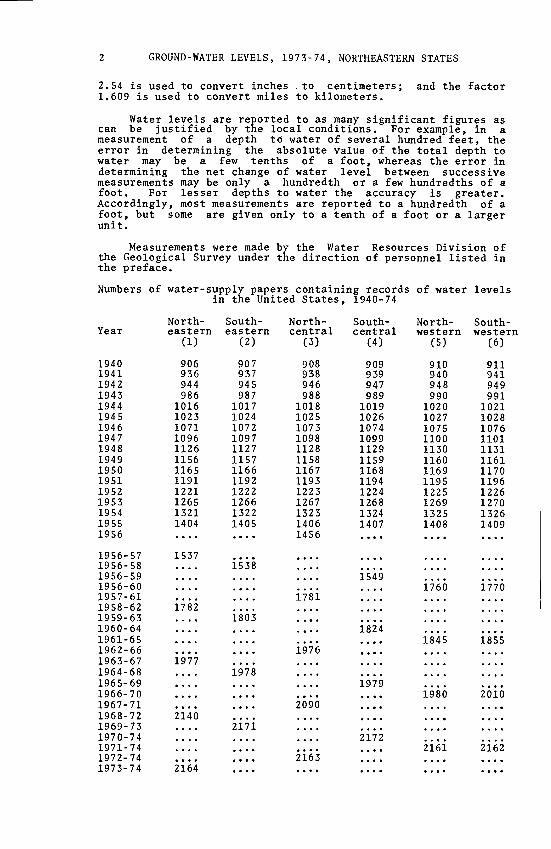
Publication of ground-water level data for the United States in water-supply papers was begun by the Geological Survey in 1935. From 1935 through 1939, a single water-supply paper for each year covering the entire nation was issued (Water-Supply Papers 777, 817, 840, 845, and 886). Since then water-supply papers have been issued covering 6 separate sections of the United States as shown in figure 1. See table on page 2 for the number of the water-supply paper containing records by year and section.
Beginning in 1956, only water-level data from a basic network of observation wells have been published. This basic network contains observation wells so located that the most significant data are obtained from the fewest wells in the most important aquifers. In some States the basic network forms the skeletal index of a more comprehensive observation-well program. Publications that contain substantial additional water-level data are listed at the end of each State report in this volume.
Each well is identified by (1) a 15-digit number based on latitude and longitude, and (2) a local number that is provided for continuity with older reports and for other use as dictated by local needs. The first 6 digits of the 15-digit number are degrees, minutes, and seconds of north latitude; the next 7 digits are degrees (including a leading zero for those less than 100), minutes, and seconds of west longitude; and the final 2 digits are sequential numbers assigned in the order in which the wells (or other hydrologic sites) are established in that 1-second quadrangle. This system provides both the geographic location and a unique number for each well.
Measurements are made in many types of wells, under varying conditions of access and at different temperatures, hence, neither the method of measurement nor the equipment can be standardized. At each observation well, however, the equipment and techniques used are those that will insure that measurements at each well are consistent.
Water-level measurements in this report are given in feet with reference to either mean sea level (msl) or land-surface datum (Isd). Mean sea level is the datum plane on which the national network of precise levels is based; land-surface datum is a. datum plane that is approximately at land surface at each well. If known, the altitude of the land-surface datum above mean sea level is given in the well description. The height of the measuring point (MP) above or below land-surface datum is given in each well description. Water levels in wells equipped with recording gages are reported for every fifth day and the end of each month (com).
In the well description, dimensions are given in International System Units (SI) as well as in English units. The factor 0.3048 is used to convert feet to meters; the factor
GROUND-WATER LEVELS, 1973-74, NORTHEASTERN STATES
2.54 is used to convert inches .to centimeters; 1.609 is used to convert miles to kilometers.
and the factor
Water levels are reported to as many significant figures as can be justified by the local conditions. For example, in a measurement of a depth to water of several hundred feet, the error in determining the absolute value of the total depth to water may be a few tenths of a foot, whereas the error in determining the net change of water level between successive measurements may be only a hundredth or a few hundredths of a foot. For lesser depths to water the accuracy is greater. Accordingly, most measurements are reported to a hundredth of a foot, but some are given only to a tenth of a foot or a larger unit.
Measurements were made by the Water Resources Division of the Geological Survey under the direction of personnel listed in the preface.
Numbers of water-supply papers containing records of water levels in the United States, 1940-74
Year
19401941194219431944194519461947194819491950195119521953195419551956
1956-57 1956-58 1956-591956-601957-611958-621959-631960-641961-651962-661963-671964-681965-691966-701967-711968-721969-731970-741971-741972-741973-74
North eastern CD
906936944986
101610231071109611261156116511911221126513211404
1537
1782
1977
2140
2164
South eastern
(2)
907937945987
101710241072109711271157116611921222126613221405
1538
1803
1978
2171
North- central
(3)
908938946988
1018102510731098112811581167119312231267132314061456
1781
1976
2090
2163
South- central
(4)
909939947989
101910261074109911291159116811941224126813241407
1549
1824
1979
2172
North western
(5)
910940948990
102010271075110011301160116911951225126913251408
1760
1845
1980
2161
South western
(6)
911941949991
102110281076110111311161117011961226127013261409
1770
1855
2010
2162

INTRODUCTION
Figure 1. Map of the United States showing States for which records of water levels are published in this volume

CONNECTICUT
e observation-well program in Connecticut was continued during the period 1973 throu ration with the State Department of Environmental Protection. Figure 2 shows the loc included in this report.
Well-Numbering System
Well Descriptions and Water-Level Measurements
Water levels are reported in feet below land-surface datum, except for wells NHN 170, NHN 175, NHN 179, and NHN 235 where they are above and below mean sea level.
Falrfield County
113007073250501. Local number BD 8. U.S. Seol. Survey. Rte. 7, Brookfield. Bored unused water-table well in sand and gravel of Pleistocene age, diam 1*1 in (3.2 cm), depth 53 ft (16 m), cased, well point 50-53 ft (15-16 m). Lsd about 255 ft (78 m) above msl. HP top of casing, 0.10 ft (0.12 m) above Isd. Highest water level 26.89 ft (8.20 m) below Isd, June 26, 1972; lowest 33.05 ft (10.07 m) below Isd, Jan. 1, 1967. Records available: 1967-71.
Water Water Water Wat level Date level Date level Date lev
Jan. 22, 1973 27.80 July 21, 1973 29.13 Jan. 23, 1971 29.18 July 22, 1971 30.89Feb. 23 27.55 Aug. 21 30.10 Feb. 22 28.66 Aug. 23 31.88Mar. 23 28.05 Sept.21 31.55 Mar. 21 29.07 Sept.23 32.10Apr. 21 27.86 Oct. 23 32.31 Apr. 21 27-81 Oct. 22 31.71May 23 28.06 Nov. 19 32.56 May 23 28.58 Nov. 22 31.96June 22 29.36 Dec. 28 30.60 June 21 29.82 Dec. 26 30.70
111256073153101. Local number FF 23. U.S. Seol. Survey. Merritt Parkway near Rte. 59, Pairfield. Bored unused water-table well in glacial gravel of Pleistocene age, diam 1% in (3.2 cm), depth 12 ft (13 m), cased with steel, screened 39-12 ft (12-13 m). Lsd 130 ft (10 m) above msl. MP top of casing, 2.10 ft (0.73 m) above Isd. Highest water level 1.78 ft (1.16 m) below Isd, June 23, 1972; lowest 8.79 ft (2.68 m) below Isd, Sept. 25, 1967. Records available: 1966-71.
Jan. 22, 1973 7-93 July 23, 1973 8.66 Mar. 21, 1971 7-86 Aug. 23, 1971 8.57Feb. 22 7.98 Aug. 22 8.30 Apr. 21 7.75 Sept.25 8.27Mar. 23 7.78 Oct. 23 8.53 May 23 8.21 Oct. 25 8.13Apr. 23 7-71 Nov. 20 8.38 June 21 8.21 Nov. 21 8.12May 22 7,25 Jan. 21, 1971 6.70 July 26 8.60 Dec. 23 7.71June 21 8.26 Feb. 22 7.90
112129073165101. Local number NT 15. U.S. Geol. Survey. Near Fairfield State Hospital, Newtown. Bored unused water-table well in glacial sand and gravel of Pleistocene age, diam l*t in (3-2 cm), depth 33 ft (10 m), cased with plastic, well point 31-33 ft (9-10 m). Lsd about 265 ft (81 m) above msl. MP lowest inside edge of plastic pipe, 2.10 ft (0.73 m) above Isd. Highest water level 0.6l ft (0.19 m) below Isd, June 26, 1972; lowest 10.50 ft (3.20 m) below Isd, Oct. 23, 1970. Records available: 1967-71.
Jan. 22, 1973 2.93 July 21, 1973 3-93 Jan. 23, 1971 1.85 July 23, 1971 7.78Feb. 23 3.02 Aug. 21 5-93 Feb. 22 2.15 Aug. 23 8.13Mar. 23 3.00 Sept.21 7-75 Mar. 21 2.13 Sept.23 1.71Apr. 21 2.20 Oct. 23 8.91 Apr. 21 1.95 Oct. 25 3.56May 23 2.21 Nov. 20 9.12 May 23 3.98 Nov. 22 1.13June 22 1.33 Dec. 28 2.26 June 21 6.08 Dec. 26 2.32

CONNECTICUT

GROUND-WATER LEVELS, 1973-71, NORTHEASTERN STATES
Hartford County
1H6l507258l6oi. Local number BU 2. Snow Realty. Formerly John Copjec. Junction of State Rtes. It a and 69, Burlington. Dug domestic water-table well in glacial till of Pleistocene age, diam 36 in (91 cm), depth 38 ft (12 m), lined with stone. Lsd about 880 ft (268 m) above msl. HP top of curb, 3-00 ft (0.91 m) above Isd. Highest water level 12.70 ft (3.87 m) below Isd, Aug. 19, 1955; lowest 37.11 ft (11.10 m) below Isd, Dec. 22, 1918. Records available: 1916-71.
,-, . Water nn<._ Water n t Water .. . Water Date level Date level Date level Date level
Jan. 22, 1973 17.70 July 21, 1973 17-58 Jan. 23, 1971 18.16 July 21, 1971 23.15Feb. 23 17.60 Aug. 21 19.08 Feb. 22 17.80 Aug. 23 26.93Mar. 23 17.83 Sept.21 21.91 Mar. 21 18.33 Sept.23 30.70Apr. 21 16.60 Oct. 23 23.89 Apr. 21 16.69 Oct. 25 26.73May 23 16.85 Nov. 20 21.81 May 23 18.00 Nov. 22 21.02June 22 17.71 Dec. 21 21.98 June 21 19.98 Dec. 26 19.91
111910072372101. Local number SW 61. Frank Pierce, Jr. Formerly Robert S. Starr, Jr. Main St., South Windsor. Dug unused water-table well in glacial sand of Pleistocene age, diam 21 in (61 cm), depth 18 ft (5 m), lined with brick. Lsd about 10 ft (12 m) above msl. MP top edge of hole in flagstone cover, 0.50 ft (0.15 m) above Isd. Highest water level 7.15 ft (2.18 m) below Isd, Mar. 30, 1936; lowest 15.22 ft (4.61 m) below Isd, Jan. 26, 1966. Records available: 1931-39, 1918-71.
Jan. 22, 1973 9-37 July 21, 1973 9-77 Jan. 22, 1971 9.71 July 21, 1971 11.15Feb. 22 8.77 Aug. 22 10.58 Feb. 20 9.37 Aug. 27 11.87Mar. 23 8.10 Sept.25 10.53 Mar. 22 9.13 Sept.23 11.37Apr. 23 8.57 Oct. 23 11.28 Apr. 21 8.57 Oct. 21 11.08May 22 8.18 Nov. 26 11.58 May 20 9-53 Nov. 22 11.08June 21 9.67 Dec. 26 9.13 June 20 10.61 Dec. 26 10.55
Lltchfleld County
Jan. 22, 1973 Feb. 22 Mar. 23 Apr. 21 May 23 June 22
111910073072301 unused art 31 ft (105-02 ft (!. ., .... _ Records available:

CONNECTICUT, NEW HAVEN COUNTY
tl3202073122l!01 Continued.
Jan. 22, 1973 Feb. 23 Mar. 23 Apr. 21 May 23 June 22
Water level
20.7620.5621.1820.7121.2122.01
Sept.21 Oct. 23 Nov. 20 Dec. 21
Water level
July 21, 1973 21.80 23.1226.3829.3129.3728.60
Date
Jan. 23, 1971 Feb. 22 Mar. 21 Apr. 21 May 23 June 21
21.3321.0221.7121.0121.8122.80
Date
July 23, 1971Aug. 23Sept. 23Oct. 25Nov. 22Dec. 26
Water level
21.8828.2029.1726.7125.1622.23
Middlesex County
113033072132001. Local number MF 1. Lyman Gun Sight Corp. Near Baileyville, Middle fieId. Dug unused water-table well in glacial till of Pleistocene age, diam 21 in (61 cm), depth 22 ft (7 m), lined with stone. Lsd about 260 ft (79 m) above msl. MP top of north side of flagstone curb, at Isd. Highest water level 3.02 ft (0.92 m) below Isd, Mar. 22, 1974; lowest 16.92 ft (5.16 m) below Isd, Nov. 21, 1961. Records available: 1916-71.
Jan. 23, 1973 6.92Feb. 21 6.66Mar. 26 5-70Apr. 23 6.12May 23 3-30June 21 8.55
113251072335501.table well in glaciallined with stone. Lswater level (revised)
JulyAug.Sept.Oct.Nov.Dec.
Local numbsand and
d about 11, 17.86 ft
21, 19732225232026
er MT 261gravel of5 ft (11(5-11 m)
10.2111.6113.5813.8811.153-91
. UnitedPleistoce
m) above mbelow Isd
Jan.Feb.Mar.Apr.MayJune
21,2222212321
1971
Aircraft Corp.ne age,si. MP
JuneRecords available: 1956-71.
Jan. 23, 1973 19-23Feb. 23 18.90Mar. 22 19.21Apr. 23 19.20May 23 18.75June 21 20.39
JulyAug.Sept.Oct.Nov.Dec.
21, 19732128232021
20.8821.6123-3321.6721.8719-95
Jan.Feb.Mar.Apr.MayJune
diatop
2b,
21,2121212321
m 36of s1972;
1971
3.055.003.025.977-76
10.33
Middletown.in (91 cm),tone cover,lowest dry
18.1919.1818.9319.0819.8020.90
JulyAug.SeptOct.Nov.Dec.
Dugdepthat Is
, Dec.
JulyAug.Oct.Nov.Dec.
2623.26252123
unu2B
d.2,
?623252123
, 1971 12.13.12.11.8.5.
sed water-ft (9 m),Highest1957-
, 1971 22.23.23.23.19.
.02
.11
.52
.00
.ii
.57
,10,6290.28,10
New Haven County
111157072521501. Local number EHV 70. P. Federico. Formerly H. A. Doolittle. Silver Sands Rd., East Haven. Dug unused water-table well in glacial till of Pleistocene age, diam 21 in (6l cm), depth 16 ft (5 m), cased with cement tile. Lsd about 25 ft (8 m) above msl. MP top of concrete curb, 2.10 ft (0.61 m) above Isd. Highest water level 6.11 ft (1.96 m) below Isd, June 21, 1972; lowest 16.03 ft (1.89 m) below Isd, Nov. 22, 1935. Records available: 1935-39, 1951-71.
Jan. 22, 1973 Feb. 22 Mar. 23 Apr. 23 May 22 June 21
9-51 9.23 9.21 9.16 9-51
10.92
July 21, 1973 Aug. 22 Sept.25 Oct. 23 Nov. 20 Dec. 26
11.7012.1011.3011.5011.659.10
Jan. Feb. Mar. Apr. May
21, 197122222123
8.629.708.019-1510.7511.60
July 26, 1971 Aug. 23 Sept.25 Oct. 25 Nov. 22 Dec. 23
12.2011.6511.1213.1013.5010.33
111812072553601. Local number NHN 170. Yale University. Grove and College Sts., New Haven. Driven unused water-table well in glacial sand of Pleistocene age, diam 2 in (5.1 cm), depth 11 ft (1 m), cased. Lsd 11.09 ft (12.52 m) above msl. MP top of casing, 23.39 ft (7.13 m) above msl. Highest water level 19-31 ft (5.89 m) above msl, July 21, 1972; lowest 15.61 ft (1.77 m) above msl, Jan. 11, 1912. Records available: 1939-71.
Jan. 22, 1973 +18.37Feb. 22 18.83Mar. 23 18.56Apr. 23 18.80
May 22, 1973 +18.73June 21 18.57July 21 18.33Aug. 22 18.20
Oct. 23, 1973 +17.79Nov. 20 17.79Dec. 26 17.59Jan. 21, 1971 18.03
Feb. 22, 1971 +18.35Mar. 22 18.26Apr. 21 18.63Aug. 23 17.89
111838072570701. Local number NHN 175. Monarch Laundry. Derby Ave. and Ellsworth St., New Haven. Drilled unused water-table well in glacial sand of Pleistocene age, diam 6 in (15 cm), depth 51 ft (16 m), casing information not available. Lsd 32.81 ft (10.01 m) above msl. MP top of shelf, 33.81 ft (10.31 m) above msl. Highest water level 5.12 ft (1.65 m) above msl, May 28, 1953; lowest 2.27 ft (0.69 m) above msl, Dec. 17, 1911. Records available: 1939-71.
Jan.Feb.Mar.Apr.May
22, 197322232322
+ 5-115-135-135.165.20
June 21, 1973 +5.25July 21 5.38Aug. 22 5.21Oct. 23 5.03Nov. 20 1.77
Dec.Jan.Feb.Mar.Apr.
26,21,222221
19731971
+1.611.581.561.571.60
MayJune 21 July 26 Aug. 23 Sept.25
23, 1971 +1.67 5 It It fin
.1.69 1.67 1.65
111829072512001. Local number NHN 179. Porto Construction Co. Grand Ave. and Haven St., New Haven. Driven unused water-table well in glacial sand of Pleistocene age, diam 3 in (7.6 cm), depth 65 ft (20 m), cased. Lsd 13.76 ft (1.19 m) above msl. MP top of casing, 11.36 ft (1.38 m) above msl. Highest water level 0.79 ft (0.21 m) below msl, Mar. 22, 1971; lowest 7.57 ft (2.31 m) below msl, July 26, 1971. Records available: 1960-71.

GROUND-WATER LEVELS, 1973-74, NORTHEASTERN STATES
'4118290725'! 2001--Continued.
Date
Jan. 22, 1973Feb. 22Mar. 23Apr. 23May 22
Water level Date
June 21, 1973July 24Aug. 22Oct. 23Nov. 20
Water level
1.641.121.742.372.67
Date
Dec. 26, 1973Jan. 24, 1974Feb. 22Mar. 22Apr. 24
Water level
2.44 1.66 1.64
79 1.44
Date
May 23, 1974 June 24 July 26 Aug. 23 Sept.25
Water level
1.761.721.142.102.24
411805072545801. Local number NHN 235. C. Cowles and Co. Chestnut and Water Sts., New Haven.Drilled unused water-table well in glacial sand or Pleistocene age, diara 8 in (20 cm), depth 39 ft(12 m), screened 28-38 ft (9-12 m). Lsd 14.80 ft (4.51 ra) above msl. MP seat of manhole cover,
2.30 ft (0.70 m) below pumping.
> it \y-Ld m;. ijsu xt.ou it ^H.pi ra; aoove msi. ror seat 01 raannoie cover, e msl. Highest water level 5.95 ft (1.8l ra) above msl, Mar. 22, 1974; lowest ' msl, Aug. 31, 1944. Records available: 1940-74. Water levels affected by
Mar. Apr. May
22, 197322232322
+3.26 3.42 3.23 3.38 3.20
June 21, 1973 July 24 Aug. 22 Oct. 23 Nov. 20
+3.00 3.20 3.20 2.81 2.72
Dec. Jan. Feb. Mar. Apr.
26, 197324, 1974
+4.67 4.04 4.40 5.95 4.02
May 23, 1974 June 24 July 26 Aug. 23 Sept.25
+3-48 3-97 2.83 2.77 2.68
413134073021701. Local number WB 93. Mrs. Simeon W. Nichols. 131 Pearl Lake Rd., Waterbury. Dug unused water-table well in glacial gravel of Pleistocene age, diam 32 in (81 era), depth 33 ft (10 m), lined with stone. Lsd about 320 ft (98 ra) above msl. MP bottom edge of flagstone at northwest corner of well, at Isd. Highest water level 23.99 ft (7.31 ra) below Isd, Apr. 1, 1953; lowest 29.68 ft (9-05 m) below Isd, Sept. 27, 1962. Records available: 1944-74.
Jan. 22, Feb. 23 Mar. 23 Apr. 24 May 23 June 22
1973 26.5826.4726.6026.2826.7127.28
July 24, 1973 Aug. 21 Sept.21 Oct. 23 Nov. 20 Dec. 21
26.4328.1028.1128.1827.9026.80
Jan. 23, 1974Feb. 22Mar. 21Apr. 24May 23June 24
26.8226.7426.7925-9727-1527.75
July 24, 1974 Aug. 21 Sept.23 Oct. 25 Nov. 21 Dec. 26
28.0028,1027.4827.2027.3725.10
Local number WB 198. A. A. Baker. 185 Pierpont Rd., Waterbury. Dug domestic well in glacial till of Pleistocene age, diam 30 in (76 cm), depth 31 ft (9 m), lined
413245072584201. water-tablwith stone. Lsd about 540 ft (165 m) above msl. MP top of flagstone at southeast corner of well, at Isd. Highest water level 5.49 ft (1.67 ra) below Isd, Jan. 10, 1946; lowest 21.00 ft (6.40 ra) below Isd, Nov. 26, 194g. Records available: 1944-74.
Jan. 22, 1973 Feb. 23 Mar. 23 Apr. 24 May 23 June 22
11.7611.3611.5511.2411.3812.42
July 24, 1973 Aug. 21 Sept.21 Oct. 23 Nov. 20 Dec. 21
12.9414.3416.4918.1218.5515.97
Jan. 23, 1974 12.17Feb. 22 Mar. 21 Apr. 24 May 23 June 24
12.1612.1910.7912.7014.33
July 24, 1974 Aug. 21 Sept.23 Oct. 25Nov 22Dec. 26
16.0217.2315.9815.5015.5512.39
New London County
412013072030601. Local number GT 19. John E. Ackley, Jr. Poquonock Plains, Groton. Dug un used water-table well in glacial sand and gravel of Pleistocene age, diam 24 in (61 cm), depth 18 ft (5 m), lined with stone. Lsd about 22 ft (7 m) above msl. MP bottom of fieldstone on west side of well, at Isd. Highest water level 9.98 ft (3.04 ra) below Isd, Apr. 6, 1970; lowest 17.97 ft (5-48 ra) below Isd, Oct. 6, 1963. Records available: 1958-74.
Jan.
Feb.
Mar.
Apr.
May
June
1, 19739
1420284
1220265
12202629
1520307
1320284
112025
12.8113.1813.7514.3514.2612.2812.8013.5314.1214.5614.4814.3814.3814.2611.9412.3513.1813.7814.2014.4614.7313.8814.2914.8215-3915.63
July
Aug.
Sept.
Oct.
Nov.
Dec.
2, 1973101620306
131924
, 19
16202417
1520295
1220263
1020
15,16.15,15,15.15,15,15.15.16.16,16.16,16,16.16,16.16.16.16.16.16.16.16.16.13,
.85
.03
.95
.68
.28
.67
.94
.44
.55
.02
.24
.42
.43
.49
.49
.60
.71
.88
.05
.55
.58
.76
.82
.39,22.79
Jan.
Feb.
Mar.
Apr.
May
June
7, 19741420285
1120254
11202729
1520285
1320283
102024
13.4414.0314.2013.1713.4213.8214.3914.2214.2614.5814.1612.8613.0013.5012.9713.5314.1514.6515.0115.2515.4915.5715.6315-9915.97
July
Aug.
Sept,
Oct.
Nov.
Dec.
2, 19741015203025
122027
. 9162023301320284
1120297
1420
16.1016.3016.4016.5016.7017.3216.8816.9717.1617.3016.9216.8817.0016.9816.9616.8916.5916.6616.8016.9017.1917.0216.5215.6214.78
CONNECTICUT, WINDHAH COUNTY
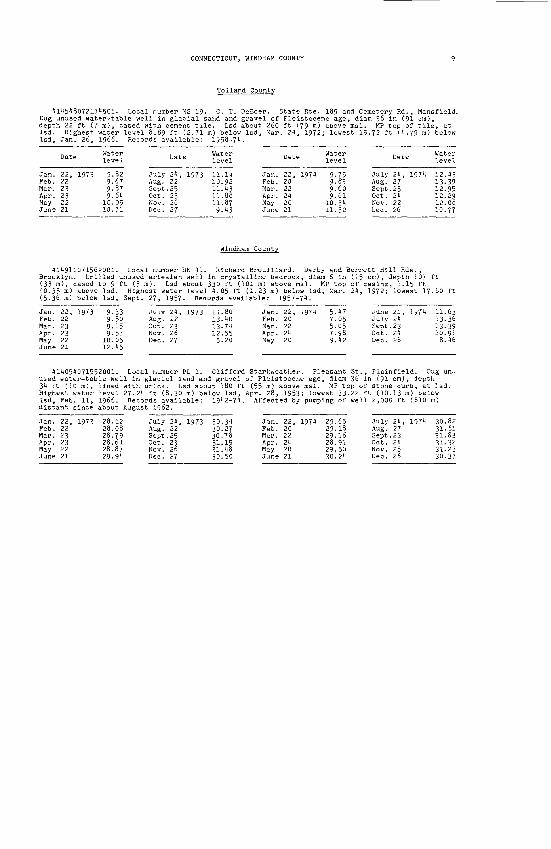
Tolland County
Hlt5lt807211lt501. Local number MS 19- C. T. DeBoer. State Rte. 189 and Cemetery Rd., Mansfield. Dug unused water-table well in glacial sand and gravel of Pleistocene age, diam 36 in (91 cm), depth 22 ft (7 m), cased with cement tile. Lsd about 260 ft (79 m) above msl. MP top of tile, at Isd. Highest water level 8.89 ft (2.71 m) below Isd, Mar. 21, 1972; lowest 15-72 ft (1.79 m) below Isd, Jan. 26, 1966. Records available: 1958-71).
Water Water » Water » Water level Date level Date level Date level
Jan. 22, 1973 9.82 July 21, 1973 11.Ill Jan. 22, 1971) 9.75 July 21, 19711 12.1)3Feb. 22 9.67 Aug. 22 10.92 Feb. 20 9.83 Aug. 27 13-39Mar. 23 9.87 Sept.25 11.13 Mar. 22 9-60 Sept.23 12.95Apr. 23 9.61) Oct. 23 11.88 Apr. 21 9.61 Oct. 21 12.29May 22 10.05 Nov. 26 11.87 May 20 10.31) Nov. 22 12.08June 21 10.71 Dec. 27 9.1)3 June 21 11.32 Dec. 26 10.77
Wlndham County
1)11)911071562001. Local number BK 11. Richard Broulllard. Darby and Barrett Hill Rds., Brooklyn. Drilled unused artesian well in crystalline bedrock, diam 6 in (15 cm), depth 107 ft (33 m), cased to 9 ft (3 m). Lsd about 330 ft (101 m) above msl. MP top of casing, 1.15 ft (0.35 m) above Isd. Highest water level H.05 ft (1.23 m) below Isd, Mar. 21), 1972; lowest 17.60 ft (5-36 m) below Isd, Sept. 27, 1957. Records available: 1957-71.
Jan. 22, 1973 9-33 July 21, 1973 11.80 Jan. 22, 1971 5.17 June 21, 1971 11.63Feb. 22 9.50 Aug. 22 13.10 Feb. 20 7.05 July 21 13.36Mar. 23 9.15 Oct. 23 13-71 Mar. 22 5.05 Sept.23 13-39Apr. 23 9.57 Nov. 26 12.55 Apr. 21 7.98 Oct. 21 10.91May 22 10.05 Dec. 27 5-20 May 20 9.12 Dec. 26 8.16June 21 12.15
111051071552001. Local number PL 1. Clifford Starkweather. Pleasant St., Plainfield. Dug un used water-table well in glacial sand and gravel of Pleistocene age, diam 36 in (91 cm), depth 31 ft (10 m), lined with brick. Lsd about 180 ft (55 m) above msl. HP top of stone curb, at Isd. Highest water level 27.21 ft (8.30 m) below Isd, Apr. 28, 1953; lowest 33-22 ft (10.13 m) below Isd, Feb. 11, 1966. Records available: 1912-71. Affected by pumping of well 2,000 ft (610 m) distant since about August 1962.
Jan. 22, 1973 28.12 July 21, 1973 30.31 Jan. 22, 1971 29.65 July 21, 1971 30.82Feb. 22 28.08 Aug. 22 30.27 Feb. 20 29.18 Aug. 27 31-61Mar. 23 28.79 Sept.25 30.78 Mar. 22 29.16 Sept.23 31.83Apr. 23 28.61 Oct. 23 31.15 Apr. 21 28.91 Oct. 21 31-32May 22 28.87 Nov. 26 31.18 May 20 29.50 Nov. 25 31.23June 21 29-91 Dec. 27 30.50 June 21 30.21 Dec. 26 30.37
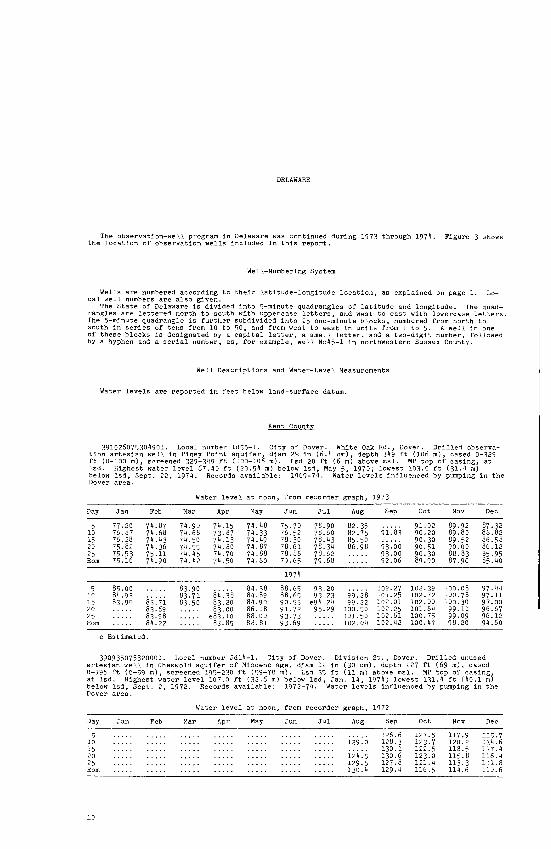
The observation-well program in Delaware was continued during 1973 through 1974. Figu the location of observation wells included in this report.
ire 3 shows
Well-Numbering System
Wells are numbered according to their latitude-longitude location, as explained on page 1. Lo cal well numbers are also given.
The State of Delaware is divided into 5-minute quadrangles of latitude and longitude. The quad rangles are lettered north to south with uppercase letters, and west to east with lowercase letters. The 5-minute quadrangle is further subdivided into 25 one-minute blocks, numbered from north to south in series of tens from 10 to 50, and from west to east in units from 1 to 5. A well in one of these blocks is designated by a capital letter, a small letter, and a two-digit number, followed by a hyphen and a serial number, as, for example, well Nc45-l in northwestern Sussex County.
Well Descriptions and Water-Level Measurements
Water levels are reported in feet below land-surface datum.
391026075304901. Local number Id55-l. City of Dover. White Oak Rd., Dover. Drilled observa tion artesian well in Piney Point aquifer, diam 2\ in (6.4 cm), depth 349 ft (106 m), cased 0-329 ft (0-100 m), screened 329-349 ft (100-106 m). Lsd 20 ft (6 m) above msl. MP top of casing, at Isd. Highest water level 67.40 ft (20.54 m) below Isd, May 5, 1970; lowest 103.0 ft (31.4 m) below Isd, Sept. 22, 1974. Records available: 1969-74. Water levels influenced by pumping in the Dover area.
Water level at noon, from recorder graph, 1973
Day
5 10 15 20 25 Eom
Jan
77-20 76.87 76.28 75-82 75.53 75.16
P
74 74 74 74 75 74
eb
.87
.68
.43
.36
.11 -90
Mar
74.90 74.68 74.50 74-55 74.45 74.42
Apr
74.15 73.87 74.13 74.80 74.70 74.50
May
74.48 74.33 74.49 74.87 74.88 74.60
Jun
75-70 76.52 78.30 78.61 78.86 79-65
Jul
78. 78. 78. 78. 78. 79.
.90 ,60 ,43 ,34 ,62 .68
Aug
82, 82. 85. 86,
.35
.75
.50
.98
Sep
91-83
93'o6 93.00 92.06
Oct
91.02 90.20 90.30 90.51 90-30 89.90
No
89. 89. 89. 90. 88. 87.
v
92 80 52 00 83 90
Dec
87.32 86.82 86.58 86.12 85.95 85.40
1974
5 10 15 20 25 Eom
85.00 84.93 83.95 83
83 83 84
71 .69 .98.22
83.90 83-71 83-50 83.20
83-00 e83.10 83.85
84.38 84.89 84.90 86.18 88.00 88.81
88.65 88.65 90.53 91.72 93-73 93.69
93 93
e94, 95.
.20
.23
.24
.29
99. 99.
100, 101, 102
[28 .22 .50 .50 .04
102.27 101.25 102.01 102.25 102.61 102.42
102-39 102.72 102.00 101.64 100.75 100.47
100. 100. 100. 99. 99. 98.
08 78 30 11 09 20
97.44 97-11 97.00 96.67 96.12 94.60
e Estimated.
Water level at no recorder graph, 1972
Day May Aug Sep Oct Nov De
124.5 129-5 130.4
126.6128.3130.1130.6127.8129.4
127-5 123.7 122.5 123.0 121.4 116.5
117-9 120.2 118.5 115.8 113.3 114.6
115-7 114.6 117-4 116.4 111.8 110.6

Figure 3. Location of observation wells in Delaware, 1973-7 1*.

GROUND-WATER LEVELS, 1973-74, NORTHEASTERN STATES
390935075320001 Continued.
1973
Day Jan
5 112 10 113 15 111 20 116 25 116 Eom 115
.8
.4
.0
.0
.5
.3
Feb
113.9 117.4 116.6 114.4 114.2 120.7
Mar
118.0 120.2 119.1
Apr May
123! 122. 122.
124,9 126.5 125-2
1 122.6 7 126.2 1 124.4
Jun
127.3 127.2 131.0 130.1 128.4 127.1
Jul
125. 123. 122. 125. 125. 128.
29
4 8 0
Aug
126.0 128.8 128.6 125.5 125.2 128.9
Sep Oct Nov
126.5 130.0 121.4 125.1 128.9 122.5 126.3 122.8 121.5 127.4 126.7 ..... 127.0 125-8 ..... 127.1 125.0 122.2
Dec
121.5 120.3 122.5 123.2 114.9 114.5
1974
5 117 10 119 15 111 20 114 25 119 Eom 119
390607 Highway D IH in (3. msl. MP lowest 9.
Date
Jan. 23, Feb. 22 Mar. 23 Apr. 24 May 24 June 24
.4
.8
.6
.0 9 .7
118.7 117.1 119-5 120.2 116.0 119.3
075331501. ept. Near C 2 cm), depth
16 ft
1973
(2.79
Water level
4.22 3.80 4.51 4.47 5.05 5-07
119-5 118.2 121.3 120.8 119.0 117.6
123. 120. 115. 120. 121. 119.
9 118.5 9 122.2 5 121.6 5 116.7 0 116.8 6 119-3
120.8 119.5 121.6 122.8 120.4 118.4
117. 116. 114. 118. 119. 123.
Local number Jd42-3. Dept. of Highwa amden. Bored observation water-table 11 ft (3 m), well point 9-11 ft (2.7
m) below
July Aug. Sept Oct. Nov. Dec.
Isd, Oct. 30,
Dat
25, 23
.24 24 23 26
Wat e lev
1973 5. 5. 4. 6. 6. 5.
1951.
el
35 60 76 55 72 83
Records
Jan. Feb. Mar. Apr. May June
9 2 3 2 6 0
122.0 123.3 122.2 120.1 118.2 120.1
ys and Tr well in -3.4 m). ft (0.94 availabl
Dat
24, 22 22 23 23 24
1974
118.4 119.4 117.2 ..... 119-5 116.1 ..... 117.9 118.8 ..... 118.0 117.8 ..... 119-2 115.6 ..... 116.7 113.6
115.0 114.5 115.2 117.6 110.0 109.0
ansportation. Formerly State sand of Pleistocene age, diam Lsd about 44 ft (13 m) above
m) below Isd, June 2, 1952; e: 1950-61, 1971-74.
lllllWater level
5-33 July 24, 1974 5.87 5-45 Aug. 23 6.19 5.46 Sept. 24 6.50 5-11 Oct. 24 6.98 5-50 Nov. 25 7.*1 5-23 Dec. 23 7.25
385041075395601. Local number Mc51-l. Dept. of Highways and Transportation. Formerly State Highway Dept. Near Adamsville. Bored observation water-table well in sand of Pleistocene age, diam 1 in (2.5 cm), depth 18 ft (5 m), well point 16-18 ft (4.9-5.5 m). Lsd about 55 ft (17 m) above msl. MP top of casing, at Isd. Highest water level 5.47 ft (1.67 m) below Isd, Aug. 6, 1967; lowest 15.24 ft (4.65 m) below Isd, Jan. 24, 1969. Records available: 1958-74. Measurement dis continued; well destroyed Aug. 26, 1974.
Jan. 10, 1973 8.21 May 10, 1973 10.47 Oct. 19, 1973 12.56 29 8.64 June 6 11.17 Nov. 12 13.03
Feb. 8 6.47 July 19 12.33 Dec. 21 12.97 Mar. 7 9.24 Aug. 13 11.79 Jan. 11, 1974 10.80 Apr. 6 10.18 Sept. 4 11.11 Feb. 7 10.64
385310075331301. Local number Md22-l. Dept. of Highways and Transportatio Highway Dept. Near Williamsville. Bored observation water-table well in sand diam 1 in (2.5 cm), depth 17 ft (5 m), well point 14-17 ft (4-5 m). Lsd about msl. MP top of casing, at Isd. Highest water level 1.57 ft (0.48 m) below Is lowest 11.14 ft (3.40 m) below Isd, Jan. 6, 1966. Records available: 1958-74
Jan. 12, 1973 2.66 May 7, 1973 3-56 Nov. 12, 1973 7-97 29 1.57 June 6 4.20 Dec. 26 4.10
Feb. 8 1.83 July 19 6.54 Jan. 7, 197t 3-16 9 1.81 Aug. 13 7.30 Feb. 6 3.41
Mar. 7 2.69 Sept. 6 6.62 Mar. 15 4.02 Apr. 6 2.24 Oct. 19 7.69 Apr. 22 3.45
Mar. 15, 1974 11.14 Apr. 22 9.83 June 7 10.01 July 19 11.27
n. Formerly State of Pleistocene age, 58 ft (18 m) above
d, Jan. 29, 1973;
June 10, 1974 3.08 July 16 6.38 Aug. 27 7.93 Oct. 5 8.70 Nov. 8 9.36 Dec. 26 5-75
New Castle County

DELAWARE, SUSSEX COUNTY
391949075410701--Continued.
Date
Jan. 9, 1973Feb. 8Mar. 6Apr. 5May 7June 5
Hater level
3.221.693.001.513.723.84
Date
July 19, 1973Aug. 9Sept. 4Oct. 11Nov. 7Dec. 13
Water level
5.616.397-258.068.538.72
Date
Jan. 10, 1974Feb. 14Mar. 14Apr. 18May 30
Water level Date
July 18, 1974 Aug. 21 Oct. 7 Dec. 4
30
Water level
6.53 7.19 7-35 7.74 7.08
Sussex County
384930075370201. Local number Ncl3-3. University of Delaware, College of Agricultural Sciences. Near Greenwood. Drilled observation artesian well in Piney Point aquifer, diam 6 in (15 cm), depth 630 ft (192 m), cased 0-620 ft (0-189 m), screened 620-630 ft (189-192 m). Lsd 62.5 ft (19.1 m) above msl. MP top of casing, 3.00 ft (0.91 m) above Isd. Highest water level 69.70 ft (21.24 m) below Isd, Jan. 1, 1971; lowest 73.91 ft (22.53 m) below Isd, Nov. 30, 1974. Records available: 1970-74.
Water level at from recorder graph, 1970
Day
5 10 15 20 25 Eom
Jan Feb Mar Apr May Jun Ju 1 Aug Sep Oct Nov Dec
e70.00
70.00
1971
5 10 15 20 25
69.90 70.01 70.02 70.17 70.15 70.10
70.22 70.14 70.29 70.31
70.35 70.80 70.13 70.75 70.30 70.75 70.25 70.65 70.68 70.71 70.61 70.67
70.70 70.82
71.20
71. 71. 71. 71. 71- 71.
23 71-50 29 71.15 27 71-52 36 71.56 1l 71.67 48 71.57
71.62 71.58 71.55 71.65 71-77 71.70
71.70 71.40 71.70 71.93 71.56 71.75
71.85 71.70 71.82 71.63 71.73 71.65
72.08 71.79 71.79 71.80 72.03 71-96
1972
5 10 15 20 25
71.82 71.83 72.05 72.00 72.05 72.07
72.17 72.22 71.83 71-99 72.04 72.00
71.97 72.27 72.25 72.27 72.08 72.15 72.29 72.08 72.10 72.20 72.13 72.11
72.32 72.32 72.15 72.16 72.34 72.24
72.32 72.35 72.43 72.36 72.24 72.15
72. 72. 72. 72. 72. 72.
37 72.59 50 72.69 39 72-70 50 72.72 42 72.75 58 72.86
72.70 72.90 72.80 72.95 72-93 72.65
72.93 73.10
72.85 72.75 72.67 72.62 72.70 72.65
72.80 72.66 72.65 72.69 72.75 72.77
1973
5 10 15 20 25 Eora
72.73 72.87 72.76 72.69 72.86 73.00
72.86 72.85 72.65 72.87 73.05 73.00
72.94 72.66 72.96 72.60 72.73 73-06 72.82 72.99 72.83 72.85 72.91 72.95
72.83 72.77 72.87 72.75 72.76 72.85
72.91 72.90 72.99 72.96 72.92 72.88
72. 72. 72.73. 73- 73-
81 72.95 92 72-90 96 72.82 03 72.87 10 72.9010 72.92
72.89 72.90 72.82 72.92 73.08 72.98
72.88 72.95 72.82 72.91 72.97 72.79
72.92 73.06 72.83 73.10 72.75 72.97
72.85 72.88 72.93 72.79
1974
5 10 15 20 25
h
3 wate ft ( High Nov.
Jan. Feb. Mar. Apr. May June
72.90 72.82 72.78 72.85 72.85 72.61
72.85 72.75 72.90 72.75 72.74 72.82
Estimated. Tape measureraen
81639075353101. r-table well in 4-5 m). Lsd abo
18, 1974
Date
5, 1973 9
13 3
10 12
. Reco
Water level
11.31 11.40 12.63 12.89 12.96 13-11
72-72 72.67 72.88 72.86 72.97 72.68 72.85 73.05 73-05 72.95 72.52 72.85
t.
Local number Nc sand of Pleistoc ut 13 ft (13 ra) 6.67 ft (2.03 ra) rds available:
Date
72.95 72.85 72.85 73-05 72.90 72.92
72.98 72.81 72.99 73.01 72.92 73.02
73. 73. 73- 73- 73. 73.
45-1. P. H. Cannon, ene age, diam 1 in (2 above msl. MP top of below isd, Jan. 30, 1950-71.
Water level
July 19, 1973 13-96 Aug. 13 11.20 Sept. 7 13.70 Oct. 19 11.23 Nov. 12 11.30 Dec. 18 11.17
Jan. Feb. Mar. Apr. June
10 73-35 03 73.24 10 73-35 25 73-37 31 73-39 35 73-38
73.47 73.37 73.11 73.47 73.45 73.44
73.69 73.58 73.58 73.58 73.51 73-67
73.19 73-67 73-68 73.36 73.63 73.88
Near Greenwood. Driven observation 5 cm), depth 15 ft (5 m), screened casing, 1.00 ft (0.30 m) above Isd.
1952; lowest 14.48 ft (4.4l ra) below
Date
7, 1974 6
15 22 10
Water level
13.16 12.87 13-17 12.72 13.21
July Aug. Oct. Nov. Dec.
Date
19, 1971 19 2
18 18
73.78 73.63 73-70 73.58 73.10 73.75
11-15
Isd,
Water level
13.80 11.12 11.35 11.18 11.05

14 GROUND-WATER LEVELS, 1973-71, NORTHEASTERN STATES
384955075192801. Local number Ngll-1. Dept. of Highways and Transportation. Formerly State Highway Dept. Near Jefferson Crossroads. Bored observation water-table well In sand of Pleisto cene age, diam 1 in (2.5 cm), depth 19 ft (6 m), well point 16-19 ft (5-6 m). Lsd 24 ft (7 m) above msl. MP top of casing, at Isd. Highest water level 9.03 ft (2.75 m) below Isd, Feb. 6, 1973; lowest 14.64 ft (1.16 m) below Isd, Jan. 7, 1966. Records available: 1959-71.1973
Date ? a.^ Date "'t^ Date DateWate el "e"": level " CTl"= level
Jan. 9, 1973 9.38 June 11, 1973 11.21 Dec. 19, 1973 13.01 July 17, 1974 11.9129 9.92 July 17 11.96 Jan. 8, 1974 12.04 Aug. 20 12-51
Feb. 6 9.03 Aug. 8 12.37 Feb. 13 11.61 Oct. 3 13-02Mar. 5 9.80 Sept. 4 12.18 Mar. 12 11.60 Nov. 14 13.48Apr. 1 10.46 Oct. 16 12.81 Apr. 19 11.48 Dec. 26 13.48May 8 10.65 Nov. 7 13-06 June 4 11.49
Records avail
Day
5 10 15 20 25 Eom
Jan
7.62 7-90 8.10 8.30 8.18 8.36
able: 1970-74.
Wat
Feb
7-35 7.49 7-71 7-92 8.16 8.28
Mar
8.12 8.56 8.65 8.79 8.87 8.99
er level
Apr
8.90 8.11 8.45 8.57 8.69 8.78
at noon
May
8.83 8.95 9.05 9.15 9-22 9-30
, from recorder
Jun
9.40 9-53 9-70 9-62 9.67 9.75
Jul
9. 9.
10. 10. 10. 10.
83 97 03 03 18 34
graph, 1973
Ai
10. 10. 10. 10. 8. 9.
ig
38 ,50 ,27 ,31 ,82 ,00
Sep
9.17 9.37 9.18 9.61 9.80 9.95
Oct
10. 10, 10. 10. 10. 10,
,02 ,19 ,29 ,40 .49 .51
Nov
10-57 10-58 10.60 10.67 10.69 10.70
Dec
10.72 10.50 10.35 9-77 8.61 8.63
1971
5 10 15 20 25 Eom
8.04 7-95 8.01 8.27 8.45 8.57
8.77 8.87 8.93 9.20
9.00 8.92 8.63
8.18 8.50 8.53 8.75 8.82 8.90
8.86 8.95 9.01 9-17 9-30 9-32
9-25 9.35 9.55 9.68 9.78 9.86
10. 10. 10. 10. 10. 10.
.00 12 32 53 .70 85
10. 10. 10. 10. 10. 10.
,96 ,12 10 ,50 ,27 31
10.27 10.21 10. 34 10.45 10.55 10.66
elO. elO. elO. elO, elO. 10.
,70 ,80 ,80 .80 ,90 91
10.91 10.95 10.97 10.96 11.03 11.06
10.65 10.27 10.06 9.51 9.31
e Estimated.
383138075260201. Local number Qe44-l. Dept. of Highways and Transportation. Formerly State Highway Dept. Near Whaleys Crossroads. Bored observation water-table well in sand of Pleistocene age, diam 1 in (2.5 cm), depth 25 ft (8 m), well point 22-25 ft (7-8 m). Lsd about 50 ft (15 m) above msl. MP top of casing, at Isd. Highest water level 1.92 ft (1.50 m) below Isd, Feb. 6, 1973; lowest 12.18 ft (3.71 m) below Isd, Oct. 6, 1962. Records available: 1959-71.
Water Water .. Water n v Water level Date level Date level Date level
Jan. 9, 1973 5-70 July 17, 1973 8-91 Jan. 8, 1971 5-52 July 17, 1974 9.29Feb. 6 1.92 Aug. 8 9-76 Feb. 13 6.22 Aug. 20 7.74Mar. 5 6.02 Sept. 4 7-31 Mar. 12 6-99 Oct. 3 8.14Apr. 1 5.69 Oct. 16 9.06 Apr. 23 6.55 Nov. 18 9.14May 8 6.60 Nov. 7 9-30 June 4 5-91 Dec. 27 6.42June 11 8.26 Dec. 19 6.55
Johnston, R. H., 1973, Hydrology of the Columbia (Pleistocene) deposits of Delaware: An appraisal of a regional water-table aquifer: Delaware Geological Survey Bull. 14, 78 p.

The observation-well program In Indiana was continued during the period 1973 through 1971 in cooperation with the State of Indiana, Department of Natural Resources. Figure 1 shows the loca tion of observation wells included in this report.
Well-Numbering System
Wells are numbered according to their latitude-longitude location, as explained on page 1. Local well numbers are also given.
The local well numbers are designated by abbreviations derived from county names anu by serial numbers. For example, Ma 10 is observation well 10 in Marion County.
Well Descriptions and Water-Level Measurements
Water levels are reported in feet below land-surface datum, unless otherwise indicated.
Alien County
1*10817081570301. Local number Al 6. U.S. Geol. Survey. Drilled observation artesian well in sand and gravel, diam 6 in (15 cm), depth 81 ft (26 m), cased to 83 ft (25 m), screened. Lsd about 760 ft (232 m) above msl. MP top of casing, 2.50 ft (0.76 m) above Isd. Highest water level 8.20 ft (2.50 m) below Isd, May 1, 1970; lowest 11.52 ft (1.13 m) below Isd, Oct. 26, 1971. Records available: 1966-71.
Highest water level for the day, from recorder graph, 1973
Day
5 10 15 20 25 Eom
Jan
8.80 9.15 9.80
10.15 10.15 9.85
Peb
9.05 9.10 9.80
10.15 10.20 10.35
Mar
9-90 9.10 8.15 8.25 8.70 9.20
Apr
9.25 9.60 9.75 9.55 9-25 9.80
May
10.25 10.50
Jun
io!io10.55 10.80 10.80 10.15
Jul
10.00 10.35 10.70 10.95 11.25 11.15
Aug
11.75 12.05 12.15
Sep
12.95 13.10 13.25 13.10 13. 15
Oct
13.10 13.15 13.15 13.15 13.50 13.1*0
Nov
13.55 13.60 13.50 13.60 13-50 13.20
Dec
13.00 13.10 13.15 13.10 13.05 12.05
1971
5 10 15 20 25 Eom
11.90 11.85 11.90 11.00 8.95 8,70
9.10 9.90
10.30 10.15 9-25 9.50
8.80 8-70 9.15 9-35 9.80
10.05
9.25 9.55 9.80
10.35 10.65 10.75
10.90 10.55
9.1*5 9-10 9.85
10.30
10.85 10.90 11.00 11.20 10.85 11.05
11.35 11.60 11.90 12.15 12.25 12.60
12.75 13.05 13.25 13-15 13.65 13.80
13-90 13.95 13.95 11.00 11.00 11.10
11.15 11.20 11.20 11.20 11.30 11.30
11.15 11.15 11.15 11.15 11.20 11.20
11.20 11.10 13-75 13.35 13.15 12.68
Bartholomew County
391627085531101. Local number Ba 1. City of Columbus. North side of Bakalar Air Force Base by cemetery. Drilled observation artesian well in sand and gravel, diam 6 in (15 cm), depth 93 ft (28 m), cased to 90 ft (27 m), screened. Lsd about 656 ft (200 m) above msl. MP top of shelter floor at rear of recorder, 2.55 ft (0.78 m) above Isd. Highest water level 15.11 ft (1.6l m) below Isd, June 11, 1968; lowest 21.50 ft (6.55 m) below Isd, Dec. 15, 1971. Records available: 1965-71.
Highest water level for the day, from recorder graph, 1973
Day
5 10 15 20 25 Eom
5
20
Eom
Jan
18.19 18.10 18.05 18.03 18.05 18.06
18.70
18.43
17.62
Feb
18.03 18.02 18.01 18.01 18.05 18.05
17.26
16.89
16.96
Mar
18.01 18.05 17.91 17.56 17.02 16.57
16.98
17.02
16.88
Apr
16.12 16.29 16.23 16.18 16.09 15.90
16.86
16.60
16.16
May
15.62 15.18 15.53 15.59 15.73 15.92
16.50
16.72
16.52
Jun
16.08 16.09 16.12 16.19 16.25 16.29
1971
16.15 16.13
16.53
16.53
Jul
16.32 16.38 16.1*5 16.58 16.30 16.01
16.53
Aug
15.99 15.99 16.10 16.22 16.35 16.50
17.86
Sep
16.63 16.77 16.91 17-06 17.21 17-31
17.86
17-71
17.78
Oct
17-19 17.62 17-75 17.86 17.98 18.12
17.78
17.92
18.05
Nov
18.25 18.36 18.1*5 18.56 18.61 18.72
18.09
17.98
17.95
Dec
18.67 18.67 18.72 18.75 18.79 18.80
17.97
17-85
17.60

GROUND-WATER LEVELS, 1973-71, NORTHEASTERN STATES
Figure l|. Location of observation wells in Indiana, 1973-7 1!.

INDIANA, FULTON COUNTY
103107086175701. Local number Cs 3. U.S. Qeol. Survey. Drilled observation artesian well dolomltic limestone, diam 6 in (15 cm), depth 130 ft (10 m), eased to 78 ft (21) m) . Lsd about 780 ft (238 m) above msl. HP top of shelter floor, 2.65 ft (0.81 m) above Isd. Highest water level 3.85 ft (1.17 m) below Isd, Feb. 2, 1968; lowest (revised), 7.17 ft (2.19 m) below Isd, Sept. 10, 1972. Records available: 1967-7 1).
Day
5 10 15 20 25
5 10 15 20 25
Jan
5.75 5.80 5.75 5.90 5.95 5.85
5.65 5.60 5.70 5.00 5-15 5.30
Feb
5.75 5.85 5.75 5.35 5.95 6.00
5.20 5.15 5.35 5.35 5-15 5.30
Highest
Mar
5.95 5.95 5.755.70 5.10 5.50
1.70 1.90 5.05 5.05 5.25 D.75
Apr
5.65 5.65 5-75 5.8o 5.8o 5.8o
4.90 4.90 D.85 4.95 5.10 5.15
May
5.90 5.85 6.05 6.00 6.10 5-75
5.15 5.00 5.20 5.10 5.50 5.15
Jun
1.75 5.55 5.50 5.15 5.55 5.55
1971
5.65 5.65 5.70 5.75 5.15 5.25
Jul
5.65 5.75 6.00 6.10 6.05 6.00
5.25 5.10 5.10 5.75 5.70
Aug
6.10 6.10 6.00 6.10 6.10 6.15
6.05 6.30 6.20 6.20
raph, 19
Sep
6.20 6.20 6.25 6.30 6.30 6.35
6. to 6.40 6.30 6.1)5 6.35 6.45
73
Dot
6.15 6.10 6.35 6.30 6.30 6.25
6.55 6.65 6.70 6.80 6.75 6.70
!Jov
6.15 6.50 6.35
6.55 6.90 6.90 6.85 7.00 6.85
Dec
e!665.85 5.30 5.70
6.90 6.75 6.65 6.50 6.15 6.30
Elkhart County
113121085181301. Local number Eh 1. U.S. Geol. Survey. Goshen Municipal Airport. Drilled observation water-table well in sand and gravel, diam 6 in (15 cm), depth 62 ft (19 m), cased to 61 ft (19 m), screened. Lsd about 815 ft (218 m) above msl. HP top of shelter floor, 2.60 ft (0.79 m) above Isd. Highest water level 12.30 ft (3-75 m) below Isd, Apr. 16, 1973; lowest 16.18 ft (1.93 m) below Isd, Dec. 1-5, 1971. Records available: 1966-71.
Highest
Day
510152025Eom
Jan
12.60h!2.1312.1512.5512.6012.65
Peb
12.7012.7512.8012.8512.95
h!2.9l
Mar
e!2.e!2.e!2.e!2.e!2,12.
90,8580,75,75,60
water level
Apr
12.1)512.3512.3512.3512.1)012.10
for
May
1212
e!2e!2e!2e!2
.10
.50
.50
.55
.60
.60
the
Ji
12.1212
e!2e!2e!2
day
an
.65
.60
.65
.70
.75
.85
, fro
Ji
e!2,e!2.13.13.13.13.
m recorder j
a.90.95.05.30.35.55
Aug
13.7013.9013.95
ell. 10ell). 15ell). 20
jraph
S<
ellellell.ellell11
, 1973
5P
.25
.30
.35
.10
.15
.15
Oct
11). 5011.5511). 60ID. 6511). 70
Nov
ellell)ell)e!5e!515
.80
.85
.95
.00
.05
.10
Dec
15.1015.1015.1515.2015.2515.00
1971
510152025Eom
eh
11.9511.8511.8511.6011.3011). 10
EstlmatTape me
11). 0013.9513.9513.9513-9013.80
ed.asuremer
13.13.13.12.12.12.
it.
7560.10,95,9595
13.0513.1013-1013.2013.2013.20
13.13.13.13.13.13.
.25
.25
.25
.25
.25
.20
13.13.13.13.1313
.20
.15
.20
.25
.30
.35
13.13.13.11.11.ID.
,15,55,80,00,15.ID
11.6011). 7011.8011.9015.0515.15
15.15.15.15.
h!5.15.
.15
.15
.15
.15
.25
.25
15.3015.3015-3515.1015. D515. D5
15.15.15.
his.1515.
.50
.50
.50
.55
.55
.55
15.6015.6015-6515.6515.6515.65
Fulton County
105829086175801. Local number Pu 7. U.S. Qeol. Survey. Drilled observation artesian well Ir medium-grained sand and gravel, diam 6 in (15 cm), depth 102 ft (31 m), cased to 100 ft (30 m), screened 100-102 ft (30-31 m). Lsd about 780 ft (238 m) above msl. HP top of shelter floor, 2.50 ft (0.76 m) above Isd. Highest water level 6.35 ft (1.91) m) below Isd, Apr. 23-27, 1973; lowest 11.70 ft (3.57 m) below Isd, Oct. 21, 25, 31, Nov. 3, 1971. Records available: 1967-71.
Highest water level for the day, from recorder graph, 1973
Day
5 10 15 20 25 Eora
Jan
7-55 7.30 7.15 7.20 7.20 7.25
Peb
7.20 7-20 7.15 7.60 7.80 7.90
Mar
7-95 7.15 7.00 6.65 6.60 6.65
Apr
6.60 6.85 6.85 6.85 6.35 6.70
May
7.05 7-35 7.70 7-85 8.05 8.25
Jun
8.30 8.25 8.10 8.20 8.35 8.50
Jul
8.75 8.95 9.15 9-35 9-50 9-55
Aug
9.65 9.80 9.65 9.60 9.75 9.95
Sep
10.10 10.25 10.30 10.1)5 10.55 10.60
Oct
10.65 10.70 10.70 10.75 10.80 10.75
Nov
10.85 10.90 10.85 10.95 10.90
hlO.67
Dec
10.35 10.35 10.30 10.25 10.15 8.95
197D
5 10 15 20 25 Eom
8.90 8.95 9.10 8.60 7-70 7-30
7.55 7.85 8.10 8.10 7.75 7-75
7.1)5 7.25 7-25 7.30 7.60 7.60
7-30 7-15 7.20 7.55 7.85 7-95
8.00 8.00 7.55 7.00 6.90 7.25
7.70 7.75 8.00 8.25 8.10 8.50
8.75 8.95 9.15 9.35 9.55 9.80
9.9510.15 10.35 10.50 10.70 10.85
11.05 11.15 11.20 11.30 11.10 11.15
11.55 11.55 11.55 11.60 11.70 11.70
11.63 11.60 11.51 11.1)5 11.15 11.15
11.17 11.35 11.20 11.10 10.90 10.51
h Tape measurement.

18 GROUND-WATER LEVELS, 1973-71, NORTHEASTERN STATES
Harrlson County
382323086011501. Local number Hr 8. U.S. Geol. Survey. Drilled observation artesian well in limestone, diam 6 in (15 cm), depth 93 ft (28 ra), cased to 57 ft (17 m), open end. Lsd about 821 ft (251 m) above msl. MP top of recorder shelter floor at front of recorder, 3.08 ft (0.91 m) above Isd. Highest water level (revised), 1.30 ft (0.1(0 ra) below Isd, Apr. 22, 1972; lowest 19.71 ft (6.01 m) below Isd, Nov. 5, 1966. Records available: 1966-711.
Highest water lev
Day
510152025Eom
Jan
ei!go5.556.154.501.25
Feb
1.001.801.35
h6 .' 52
Mar
1.853.353.303.152.802.60
Apr
h3.l62.153.651.752.003.55
rel for the day,
May
1.351.955-656.107.257.00
Jun
6.957-158.058.859.608.85
from recorder graph, 1973
Jul
8.908.558.008.801.651.95
Aug
5.106.157.358.309.10
10.00
Sep
10.5511.1011.5512.0512.5513.00
Oct
13.1513.8011.2011.5511.9015.30
Nov
15.6516.0016.2516.6015.9013.15
Dec
12.1012.0512.1011.8010.708.10
1971
510152025Eom
eh
8.006.001.102.152.853.10
Estimated
1.251.905.605.703-811.15
1.85it. 152.803.651.101.50
3.553.103.155.606.507.25
8.008.189.30
10.0510.6010.18
10.208.858.909-559.8o
10.35
10.9011.1511.9012.1012.9013.10
13.8011.1511.1011.1511.9015.20
15.5015-7015.2515.3015.6015.50
15-1015.6515.8515.8016.0016.30
11.8013.9513.6013.5013.1013-05
11.9010.109.308.307-756.30
Tape measurement .
111038087281701. Local number Lk 12. U.S. Geol. Survey. Kankakee River State Park. Drilled observation artesian well in dolomite, diam 6 in (15 cm), depth 82 ft (25 m), cased to 51 ft (16 m), open end. Lsd about 630 ft (192 m) above msl. HP top of casing, 2.50 ft (0.76 m) above Isd. Highest water level 0.15 ft (0.05 m) below Isd, Jan. 12, 1973; lowest 11.35 ft (1.37 m) belo Isd, Sept. 9, 1971. Records available: 1967-71.
Highest water level for the day, from recorder graph, 1973
Day
5 10 15 20 25 Eom
5 10
20
Eom
e h
Jan
o.io 55 .10 .10 .10
95 .95 .90.65
.10
Estimated Tape meas
Feb
0.45 e.75 e.85 e.90 1.00 1.05
1.20 1.30
1.50
1.30
urement.
Mar
1.00 .90 .75 .80 .80 .65
1.25 1.15 .85
h.8l
95
Apr
0.50 55 70 75 .15 .55
O.go 90
1.00
1.25
May
0.75 .90
1.20 1.25 1.30 1.10
1.30 1.20
.50
.15
Jun
1.05 1.051.25 1.101.15 1.30
1974
0.80.90
1.051.25
1.35
Jul
.40
.60
.75 95 55 .65
1.60
h9.21
A
1 1 1 2 2 2
10 11
12
13
ig Sep
65 ..... 80 ..... 90 ..... 00 ..... 15 ..... 30 .....
40 13.55 35 11-25
75 .....
85 8.75
Oct Nov
.... e2.65
.... e2.65
.... 2.55
.... 2.60 2.70 2.60 2.65 2.60
7.75 6.10 .... 5.30
5.05.... 4.80
4.55
Dec
2.45 2.40 2.35 2.30 2.15 1.90
4.30 4.10
3.75 3.653.45
Montgomery County
100217086182101. Local number My 7. U.S. Geol. Survey. Drilled observation artesian well in sand and gravel of Pleistocene age, diam 6 in (15 cm), depth 111 ft (31 m), screened 107-109 ft (32.6-33.2 m). Lsd 801 ft (215 m) above msl. MP top of recorder platform, 2.38 ft (0.73 m) above Isd. Highest water level 26.10 ft (7.96 m) below Isd, Apr. 13, 1971; lowest 31.79 ft (9.69 m) below Isd, Nov. 28, 1967. Records available: 1967-71.
Day
5 101520 25 Eom
Jan
27.55 27.10 27.35 27.15 27.50 27.60
Feb
27-55 27.60 27.50 27.70 27.85 27.95
Highest
Mar
28.05 28.10 27.80 27.15 26.95 26.80
water level for
Apr
26.60 26.60 26.90 27.00 27.00 27.10
May
27.30 27.30 27.65 27.75 27.95 28.30
the day,
Jun
28.10
28i55
from recorder graph, 1973
Jul
28.55 28.70 28.90 29.05 29.00
Aug
29.15 29.20 29.20 29.30 29.10 29.55
Sep
29.70 29.75 29.70 29.80 29.85 30.00
Oct
30.00 30.05 30.05 30.15 30.10 30.00
Nov
30.25 30.10 30.15 30.30 30.10 29.95
Dec
29-55
29il5 29.10 29.30 28.95
1971
5 10 15 20 25 Eom
28.65 28.35 28.35 28.00 27.55 26.85
26.60 26.50 26.75 26.75 26.65 26.65
26.70 26.35 26.20 26.35 26.50 26.65
26.80 27.00 27.15 26.95 26.15 26.20
26.20 26.10 26.10 26.10
26.70
27.60 27.85 28.80
28.80 28.85 29.15 29.10 29.60 29.80
29.75 29-70 29.70 29-80 29.80 29.90
30.00 30.05 30.10 30.35 30.30 30.30
30.20 30.20 30.30 30.20 30.35 30.25
30.10 30.25 30.00 29.95 29.95 29.80
INDIANA, RANDOLPH COUNTY
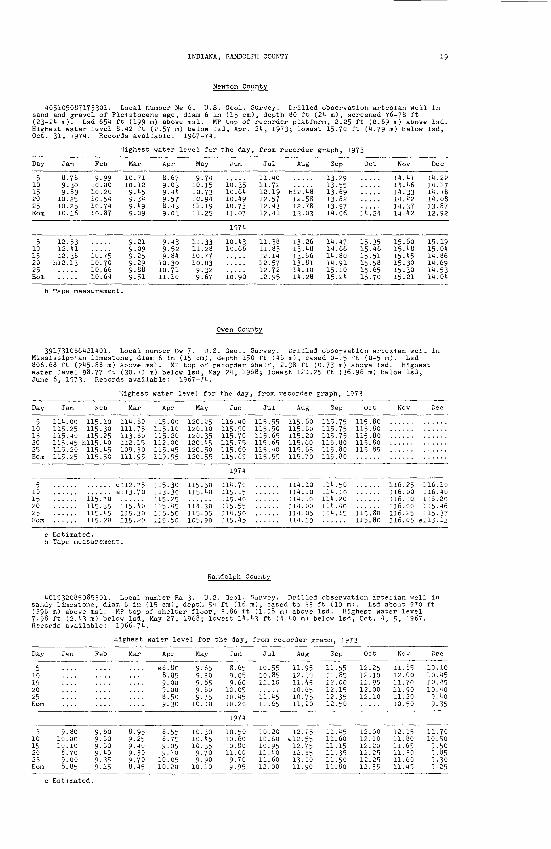
Newton County
405105087173301. Local number Ne 6. U.S. Geol. Survey. Drilled observation artesian well in sand and gravel of Pleistocene age, diam 6 in (15 cm), depth 80 ft (24 m), screened 76-78 ft (23-24 m). Lsd 654 ft (199 m) above rasl. HP top of recorder platform, 2.25 ft (0.69 ra) above Isd. Highest water level 8.42 ft (2.57 m) below Isd, Apr. 24, 1973; lowest 15.70 ft (4.79 m) below Isd, Oct. 31, 1974. Records available: 1967-74.
Day
5 10 15 20 25 Eom
5 10 15 20 25 Eom
Jan
8.78 9-30 9.89
10.25 10.25 10.16
12.53 12.41 12.38
h!2.13
Peb
9-99 10.00 10.20 10.54 10.74 10.87
1CK75 10.70 10.66 10.64
Highest
Mar
10.71 10.12 9.45 9-34 9.49 9-09
9.21 9.09 9-25 9.29 9.88 9-51
Apr
8.67 9-03 9.44 9.57 8.43 9-01
9.43 9-52 9.84
10.30 10.71 11.10
May
9-74 10.15 10.73 10-94 11.19 11.25
11.33 11.28 10.77 10.03 9.32 9-67
the day.
Jun
io!s510.64 10.49 10.73 11.07
1974
10.43 10.66
10.90
Jul
11.40 11.72 12.19 12.57 12.13 12.41
11.38 11.83 12.14 12.57 12.72 12.95
Aug
h!2.48 12.58 12.78 13-03
13.26 13.48 13.66 13.81 14.10 14.28
jraph, 1!
Sep
13-29 13.55 13.69 13-82 13-97 11.06
14.47 14.66 14.80 14-91 15-10 15.24
)73
Oct
14 ^24
15-35 15.16 15.51 15.58 15.65 15.70
Nov
14.41 14.46 14.33 14.42 14.37 14.12
15.60 15.48 15-45 15-30 15-30 15-21
Dec
14.22 14.17 14.18 14.08 13.87 12-92
15.19 15.04 14.86 14.69 14.53 14.04
h Tape measurement.
391731086421401. Local number Ow 7- U.S. Geol. Survey. Drilled observation artesian well i Mississippian limestone, diam 6 in (15 cm), depth 150 ft (46 m), cased 0-15 ft (0-5 m). Lsd 806.68 ft (245-88 m) above msl. HP top of recorder shelf, 2.38 ft (0.73 m) above Isd. Highest water level 98.77 ft (30.11 m) below Isd, May 24, 1968; lowest 121.25 ft (36.96 m) below Isd, June 6, 1973. Records available: 1967-74.
Highest water level for
Day
5 10 15 20 25 Eom
Jan
114.00 115.25 115.40 115-45 115.20 115.25
Feb
115 115 115
H115 115 115
.10
.30
.25
.40
.45
.50
Mar
114 111. 113. 112. 109 111,
.80
.75
.80
.15 ,30 .95
Apr
115. 115- 115. 112. 115. 119.
00 10 20 00 45 95
May
120.25 120.10 120.35 120,45 120.50 120.55
the day
Jun
116.40 115.90 115.70 115.75 115.60 115-65
, from recorder graph, 1973
Jul A\
115-55 115,115-50 115 115-65 115 115.65 115. 115.40 115. 115-55 115
jg Sep
.60
.60
.20
.60
.65
.70
115 115 115115 115 115
.75
.75
.75
.80
.80
.80
Oct
115.80 115.80 115.80 115.80 115-85
Nov Dec
1974
5 10 15 20 25 Eom
e h
115 115 115 115
70 .35.45 .20
Estimated. Tape measureme:
ell2. e!13.
iis.115.115
it.
.75 ,70
.40
.30
.20
115. 113. 115. 115. 115. 115.
30 30 .25 45 50 .50
115-50 115.40
114.30 115.05 105.90
114.70 115.15 115.40 115-55 114.90 115.45
...... 114114
...... 114
...... 114
...... 114
...... 114
.10
.10
.00
.05
.10
111
114 114 114,
.50
.20
.40
.15 115.80 115-80
116.25 116.00 116.10 116.00 116.25 116.05
116.10 116.40 116.20 115-46 115.37
ell3.13
Randolph County
401532085085301. Local number Ra 3. U.S. Geol. Survey. Drilled observation artesian well ir sandy limestone, diam 6 in (15 cm), depth 54 ft (16 m), cased to 33 ft (10 m). Lsd about 970 ft (296 m) above msl. HP top of shelter floor, 3.86 ft (1.18 m) above Isd. Highest water level 7.98 ft (2.43 m) below Isd, May 27, 1968; lowest 14.43 ft (4.40 m) below Isd, Oct. 4, 5, 1967. Records available: 1966-74.
Highest water level for the day, from recorder graph, 1973
Day
5 10 15 20 25 Eom
Jan
9.8010.00 10.10
8.70 9.00 8.85
Feb
9. 60 9.60 9.60 9.40 9-35 9.15
Mar
8.95 9.25 9.40 9.30 9-70 8.45
Apr
8.55 8.75 9.05 9-70
10.05 10.20
May
9-65
9.65
10.30 10.45 10.35 9.70 9.90
10.10
Jun
8.65
1974
10.50 10.60 10.80 11.00 9.70 9-95
Jul
10.20 10.60 10.95 11.40 11.60 12.00
Aug
12.25 e!2.55
12.75 12.85 13-00 11.90
Sep
11.45 11.60 11.15 11.35 11.50 11.80
Oct
12.00 12.10 12.20 12.25 12.25 12.35
Nov
11.85
12.15 11.80 11.65 11.30 11.60 11.45
Dec
10.1010.45
9.35
11.70 10.50
9-50 9.85 9-30 9.25
e Estimated.

GROUND-WATER LEVELS, 1973-71, NORTHEASTERN STATES
Shelby County
393913085190901. Local number Sh 2. U.S. Geol. Survey. Drilled observation artesian well i limestone, diam 6 in (15 cm), depth 150 ft (16 m), cased to 131 ft (to m), open end. Lsd about 818 ft (219 m) above rasl. MP top of collar welded on casing at round hole drilled in recorder shelter floor, 3.00 ft (0.91 m) above Isd. Highest water level 15.90 ft (1.85 m) below Isd, May 27, 1968; lowest 22.20 ft (6.77 m) below Isd, Nov. 30, 1967. Records available: 1966-71*.
Highest water level for the day, from recorder graph, 1973
Day
5 10 15 20 25 Eom
5
20 25Eom
Jan
17.15 17.60 18.00 18.35 17.75 17.50
18.05
16.70 16.70 16.80
Feb
17.10 17.40 17.50 17.50 17.90 18.10
17.50
18.00 17.60 17.55
Mar
18.15 17-30 16.55 16.10 16.85 16.15
17. 15
17-1517.50 17.85 17.20
Apr
16.70 17.00 17. A5 16.55 16.00 16-95
16.90
17.60 18.05 18.25
May
17-55 17.80 18.20 18.30 18.55 18.85
18.K5
16.95 17-30 17-75
Jun
17-70 17.10 17.90 17.50 17.95
1971
18.05
18.20 17.25 17.65
Jul
17i75
18.25
19-15 19-10 19.70
Aug
18.10 18.65 18.70 18.95 19.25
19-85
20.20 20.35 19-75
Sep
2o!35
19.20
19.95 20.00 19.75
Oct
20.35 20.15 20.15 20.55 20.65 20.60
19.61
20.03 20.08 20.20
Nov
20.75 20-90 20.75 20.85 20.10 19-05
i'a'.tf
18-37
Dec
18.95 19.20 19-15 19- A5 18-95 17.60
18.37
is!io
Switzerland County
385113081511501. Local number Sw 1. Walker Estate. Dug observation water-table well in sandy clay, diaro 1 ft (1 ra), depth 21 ft (7 IB), cribbed with brick to 21 ft (7 ro). Lsd about 870 ft (265 m) above rasl. MP counter-weight hole in instrument shelf, 3.50 ft (1.07 m) above Isd.Highe Dec.
Day
5 10 15 20 25 Eom
2, 15, 1911. Records available:
Highest water lev
Jan
5.90 8-95
12.00 13.80 10.85 9-30
Feb
6.15 9.20 7-95 8-90
11-70 12.95
Mar
10.10 5-90 6.70 3.80 1.95 1.15
Apr
3.95
h3.'35 1.65
ig1lt_71. Measurement
May
8.80 11-30 13-15 11.25 15-10 12.10
Jun
12.65 12.00 13-70 13-25 11.30 7.20
Jul
6.85 9-65
12-70 11.60 5-6o 8.30
discontinued July 1971.
order graph, 1973
Aug
12.35 11-35 13.50 13.10 13.15 15.15
Sep
15.95 h!5. 92 16.10 16.50 16.80 17.10
Oct
13.10 13-85 11.70 15-70 16.25 16.60
Nov
16.75 17-00 17.20 17.10 11. Ao 3.65
Dec
7.75 10.95 13.00 12.15 10.20 7.10
1971
5 10 15 20 25 Eom
10.15 9-90 8.15 7.10 5.50 5.35
9-35 11.55 13.15 13.65 10.30 10.95
10.30 8.10 1.15 5-25 8.70 9-85
3.65 3.50 7.55
11.60 13.25 11.65
13.20 13-80 11.75
12.65
10.15 13-05 11.80 15-8515-35 15-90
h Tape measurement.
Tippeeanoe County
102600086552801. Local number Tc 7. Purdue University. State of Indiana. Drilled unused artesian well in sand and gravel of Pleistocene age, diam 8 in (20 cm), depth 207 ft (63 m) cased, screen setting unknown. Lsd about 679 ft (207 m) above msl. MP chiseled "x» on lip of manhole, 0.35 ft (0.11 m) above Isd. Highest water level 159-57 ft (18.61 m) below Isd, May 5, lA, 1950; lowest 173.6 ft (52.9 m) below Isd, Sept. 23, 21, Oct. 11, 1971. Records available: 1915-7A. Measurement discontinued July 1971.
Highest water level for the day, from recorder graph, 1973
Day
5 10 15 20 25 Eom
5 10
2025 Eom
Jan
169.8 169.8 169.7 169.9 169.9 169.8
168.2 168.3
168.0
Feb
169.7 169.8 169.6 169.6 169-6 169.6
167-9 167.7 167-6167.7 167.7 167.1
Mar
169.5 169.2 169.1 169.6 169.2 169.2
167.3 167-5 167.1167-1 167.2 167.1
Apr
169.5 169.3 169.3 169.6 169-6 169.6
167.2 167.2 167.1167.0 167.0 167.0
May
169-7 169.3 169.3 169.2 168.9 169.0
166.8 166.6 166.1166.1 166.5
Jun
168.8 168.8 168.9 169.0 168.8 168.9
1971
166.0 166.0 166.0166.0 166.2 166.1
Jul
169.0 169.1 169.2 169.1
hl6g.l
Aug
169.3 169.2 169.3 169.3 169-3 169.5
Sep
169.7 169.7 169-9 169.9 169.9 170.1
Oct
170.3 170-3 170.3 170.2 170.2 169.9
Nov
170.1 169-9 169.5 169.1 169.2 169.5
Dec
169.2 169.3 169.3 169.1 168.6 168.5
h Tape measurement.

INDIANA, WAYNE COUNTY
VanderburKh County
380608087395901. Local number Va 6. U.S. Geol. Survey. Drilled observation artesian well ir the Patoka Formation (of local usage) of Late Pennsylvanian age, diam 6 in (15 cm), depth 125 ft (38 m), cased to 80 ft (24 m). Lsd 446.58 ft (136.12 m) above msl. MP top of platform, 3.47 ft (1.06 m) above Isd. Highest water level 24.88 ft (7-58 m) below Isd, Apr. 3, 4, 1968; lowest 30.55 ft (9.31 m) below Isd, Oct. 21, 22, 1974. Records available: 1965-74.
Day
510 15 20 25 Eom
Jan
28.25 28.30 28.10 28.05 28.05 27.85
Feb
27.75 28.10
Highest
Mar
27-50 27-35 27.10 27.00
water 1
Apr
27.15 27.00 27.25 27.00 27.00 27.05
evel for
May
627^05 27.10 27.20
the day
Jun
27.25 27.40 27.35 27.50 27.55 27.50
, from r<
Jul
27.65 27.90 28.00 28.05 28.10 28.25
reorder j
Aug
28.50 28.45 28.50 28.70 28.75 29.00
graph, 1973
Sep
29.15 29.25 29.25 29.60 29.75 29.65
Oct
29.60 29.60 29.70 29.70 29-65 29.45
Nov
29.85 30.05 29-85 29.95 29.55 29.85
Dec
29.65 29.70 29-70 29.65 29.55 29.45
1974
5 10 15 20 25 Eom
29.55 29.30 29.30 29.10 29.25 29.00
29.00 28.90 28.85 28.75 28.85 28.65
28.65 28.65 28.45 28.45 28.50 28.20
28.60 28.70 28.80 28.85 28.90 29.00
28.90 28.75 28.90 28.95 29.00 28.80
29.05 28.90 28.80 29-00 28.90 29.00
29-2529-45 29-55 29-70 29.90 30.10
30.05 30.05 30.05 30.15 30.35 30.05
30.20 30.20 30.20 30.25 30.25 30.20
30.35 30.40 30.40 30.40 30.45 30.45
30.25 30.35 30.25 30.10 30.10 29.85
29.90 29.80 29.55 29-55 29-55 29.65
392818087243301. Local number VI 7. Indiana State University. Terre Haute. Drilled observa tion water-table well in sand and gravel, diam 6 in (15 cm), depth 70 ft (21 m), cased to 70 ft (21 m), screened. Lsd about 502 ft (153 m) above msl. MP top of recorder platform, 3.00 ft (0.91 m) above Isd. Highest water level 41.80 ft (12.714 m) below Isd, June 7, 19/1; lowest (revised), 51.90 ft (15.82 m) below Isd, Sept. 29, 30, Oct. 1, 1972. Records available: 1970-74.
Highest water level for the day, from recorder graph, 1973
Day
510152025Eom
Jan
48.0547.6047.4047.4547-5047.60
F
4747474747
h48
eb
.65
.60
.60
.80
.90
.02
Mar
48.1548.3048.3048.1047.6047.10
Apr
4646,46,46,46,45.
.75
.35
.25
. ?5
.15
.85
May
45.7045.6045.8045-9046.20
Ji
e46,e46.h46.46.46,46.
m
.65,65.69.55.30,25
Ji
46.46.
e46.h46.46.46.
a,25.30,45,72,6055
Aug
46.6046.6046.7046.7546.6546.90
Sep
e47,e47.e47,e47.e47,e47.
.00
.15
.25
.35
.50
.60
Oct
h47e47,e47,e47e47e47,
.73
.85
.85
.90
.95
.95
Nov
e48.f>47.e47.e47.e47.e47.
,00,95,90, HO,75.70
Dec
e47.60e47-55e47.50e47-20e46-90e46.65
1974
510152025Eom
eh
46.3046.1045-7545.5045.2545.00
EstimatTape me
434343434343
ed.asur
.75 95.85.80.85.65
ement
43-5043-5043-3043-15
43-15
434242,4242
.00
.80
.65
.70
.85
43.1543.3543.5543.5542.9042.25
41 ,41 ,4242,42,42,
.85
.90
.00
.25
.40
.15
42.42.42.42.43.43.
,10,35.65.90.15.50
43.7043.9044.1544.3544.5044.75
44,44,4445.45,45.
.85
.95
.90
.15
.20
.30
45454545
45
.30
.35
.50
.55
.50
.75
45.45.
45.45.45.
,85.80
,75,85,95
46.1046.2046.2546.3046.2546.25
Wayr
394426085080601. Local number We 6. U.S. Geol. Survey. Drilled observation water-table well In sand and gravel, diam 6 in (15 cm), depth 49 ft (15 m), cased to 47 ft (14 m), screened. Lsd about 888 ft (271 m) above msl. MP top of collar, 3.25 ft (0.99 m) above Isd. Highest water level 10.85 ft (3-31 m) below Isd, May 16-18, 1967, May 31, 1968, Mar. 28-31, Apr. 1, 1973; lowest 20.74 ft (6.32 m) below Isd, Nov. 7, 8, 1966. Records available: 1966-74.
Day
5 10 15 20 25
5 10 15 20 25 Eom
Jan
13-40 13.50 13.60 13.80 13.80 13.80
16.35 16.20 16.20 15.60 14.55 13.60
Feb
13.65 13.60 13.65 13.70 13.85 13.95
13.60 13.80 14.00 14.25 14.30 14.35
Highest
Mar
14.05 13.40 11.40 10.95 11.25 10.85
14.40 14.40 14.40 14.50 14.60 14.60
water 1<
Apr
11.15 11.40 11.70 11.70 11.40 11.55
14.35 13.70 13.05 13.15 13.40 13.65
May
11.90 12.20 12.55 12.85 13.10 13.40
13.95 14.15 14.35 14.15 14.10 14.25
Jun
13.40 13.00 13.15 13.35 13.50 13.35
1974
14.45 14.15 14.85 15.10 13-95 13-85
Jul
13.50 13.65 13.85 14.05 12.75 12.45
14.00 14.20 14.45 14.70 15.00 15.35
Aug
12.7513.05 13.25 13.50 13.80 14.10
15.60 15.65 15.70 15.75 15-85 16.00
;raph, IS
Sep
14.35 14.60 14.85 15.15 15.40 15.65
16.05 16.05 16.05 16.10 16.20 16.00
)73
Oct
15.90 16.15 16.30 16.50 16.70 16.95
15.80 15.80 15.90 16.05 16.15 16.35
Nov
17.10 17.20 17.35 17.45 17.45 17.10
16.45 16.50 16.55 16.60 16.70 16.80
Dec
16.95 16.85 16.85 16.9017.00 16.55
16.85 16.70 16.45 16.25 16.10 15-90

GROUND-WATER LEVELS, 1973-71, NORTHEASTERN STATES
Cable, L. W., and Roblson, T. M., 1973, Hydrogeology of the Principal Aquifers in Sullivan andGreene Counties, Indiana: Indiana Dept. of Natural Resources Bull. 35, 26 p.
Cable, L. W., and Robison, T. M., 1971, Ground-water Resources of Montgomery County, Indiana:Indiana Dept. of Natural Resources Bull. 36, 20 p.
Heisel, J. E., 1973, Electric-analog Simulation Network of Unconsolidated Aquifers in the UpperWabash River Basin, Indiana: U.S. Geol. Survey Water Resources Investigations 29-73, 31 p.
Marie, J. R., and Davis, L. G., 1971, Water Resources of the middle Wabash River Basin: U.S. Geol.Survey Hydologic Atlas 508, 3 sheets.
Pettijohn, R. A., and Davis, L. G., 197^, Water Resources of the Maumee River Basin, northeasternIndiana: U.S. Geol. Survey Hydrologic Atlas ^93, 3 sheets.
Shampine, W. J., 1971, U.S. Geol. Survey Water-Quality Program, Indiana District: U.S. Geol.Survey open-file rept., 26 p.
Tate, C. H., Davis, L. G., Johnson, L. E., and Pettijohn, R. A., 1973, Water Resources of the UpperWabash River Basin, Northeastern Indiana: U.S. Geol. Survey Hydrologic Investigations AtlasHA-1433, 3 sheets.
Wilson, M. J., 1973, Bibliography of Reports on the Water Resources of Indiana Prepared by theU.S. Geol. Survey, 1886-1972: U.S. Geol. Survey open-file rept., 35 p.

The observation-well program in Maine was continued during the period 1973 through 1971 In co operation with the Maine Public Utilities Commission. Figure 5 shows the location of observation wells Included In this report.
Well-Numbering System
Wells are numbered according to their latitude-longitude location, as explained on page 1. Local well numbers are also given.
The local number, which was used In previous reports, consists of an abbreviation of the county name and a serial number assigned within each county.
Well Descriptions and Water-Level Measurements
Water levels are reported In feet below land-surface datum, unless otherwise Indicated.
Androscoggln County
It'10227070121101. Local number An 1. Ernest L. Libby. Auburn. Dug unused water-table well in marine deposits, diam 1 ft (1 m), depth 15 ft (5 m), cased with rock to 15 ft (5 m). Lsd about 220 ft (67 m) above msl. MP top of granite well curb, at Isd. Highest water level 3.30 ft (1.01 m) below Isd, June 16, I960; lowest 10.23 ft (3.12 m) below Isd, Nov. 16, 1965. Records available: 1959-71.
Water n . Water _ , Water Water level Date level Date level Date level
Jan. 27, 1973 1.31 July 28, 1973 1-33 Feb. 26, 1971 1.28 Aug. 16, 1971 1.57Feb. 15 1.38 Aug. 15 l.ll Mar. 16 1.31 28 1.82
28 1.28 29 1.29 29 1.31 Sept.15 1.76Mar. 28 1.35 Sept.28 1.79 Apr. 16 1.31 28 1.63Apr. 15 1.10 Oct. 15 1.93 28 1.30 Oct. 15 1.15
28 1.12 Nov. 27 1.28 May 15 1.25 28 1.18May 15 1.13 Dec. 15 1.21 28 3.91 Nov. 15 1.08
28 1.11 28 1.20 June 15 3.78 25 1.11June 15 1.50 Jan. 15, 1971 1.15 28 3-96 Dec. 16 3-99
28 1.22 28 1.31 July 15 3.88 29 1.10July 15 1.20 Feb. 15 1.30 29 3.92
161619068280101. Local number Ar 1. H. L. Stevens. Portage Lake. Driven unused water-table well in sand, diam 1% in (3.8 cm), depth 8 ft (2 m), screened 8-11 ft (2-3 m). Lsd about 930 ft (283 m) above msl. MP top of pipe, 2.00 ft (0.6l m) above Isd. Highest water level flowing, Dec. 21, 1957; lowest dry, many times, 1917-18, 1950, 1952-53, 1955, 1957, I960, 1961-65, 1967-68 1970-71, 1973-71. Records available: 1912-71.
Jan. 15, 1973 7-00 July 13, 1973 2.88 Jan. 25, 197129 1.80 27 1.33 Feb. 13
Feb. 13 2.50 Aug. 11 6.25 2626 1.61 30 (f) Mar. 11
Mar. 11 1.90 Sept.13 (f) 26 3.0030 2.09 30 (f) Apr. 12 2.80
Apr. 12 2.10 Oct. 12 (f) 26 1.2027 1.57 30 (f) May 15 1.60
May 11 1.90 Nov. 13 (f) 29 2.3722 .81 27 (f) June 1 1.2128 1.31 Dec. 11 2.50 11 1.81
June 15 1.92 Jan. 2, 1971 2.12 29 3.9028 6.12 11 2.50
f Dry.
160657067512201. Local number Ar 3. J. Edward Goodin. Houlton. Drilled unused artesian wellin bedrock, diam 6 in (15 cm), depth 90 ft (27 m), cased with steel. Lsd about 370 ft (113 m)above msl. MP hole in top of pumpbase, at Isd. Highest water level 10.72 ft (3.27 m) below Isd,Mar. 31, 1973; lowest 25.91 ft (7.90 m) below Isd, Oct. 15, 1960. Records available: 1958-71.

GROUND-WATER LEVELS, 1973-7"), NORTHEASTERN STATES
Figure 5- Location of observation wells in Maine, 1973-74.

MAINE, KENNEBEC COUNTY
160657067512201 Continued.
Water n ,. Water n Water n ,. Water level Date level Date level Date level
Mar. 31, 1973 10.72 July 12, 1973 13.19 Oct. 12, 1973 11.17 Oct. 26, 1971 16.93Apr. 15 12.01 21 11.13 27 16.82 Nov. 15 16.87May 17 12.71 27 11.57 Mar. 21, 1971 11.96 Dec. 1 17.13
22 12.18 Aug. 17 15-52 May 23 13.29 15 13.0128 12.53 28 16.01 Oct. 16 16.91 26 11.05
June 30 13.12 Sept.30 eiy.10
e Estimated.
Cumberland County
135153070013601. Local number C 26. Brunswick and Topsham Water District. Brunswick. Drilled unused artesian well in stratified glacial drift, diam 12 in (30 cm), depth 101 ft (31 ra), screened 81-101 ft (25-31 ra). Lsd 139 ft (12 m) above msl. MP base of water-level recorder, at Isd. High est water level 27-79 ft (8.17 m) below Isd, July 10, 1971; lowest 36.11 ft (11.10 m) below Isd, Feb. 10, 1966. Records available: 1958-71.
Mean water level for the day, from recorder graph, 1973
Day
5 10 15 20 25 Eom
Eom
e
Jan
31-50 31.58 31-58 31.56 31.17 31.58
28.31
Estimati
Feb
si. 19
28.39
28.69
sd.
Mar
31.21 31.13 30.91 30.81 30.72 30.70
28.65
Apr
30.10 30.22 30.20 30.18 30.13 30.02
e28.15
May
29.89 29.81 29.76 29.68 29.19 29.31
28.02
Jun
29.22 29.18 29.11 29.09
1971
27.90
Jul
28.88 28.73 28.65 28.61 28.62 28.69
28.01
Aug
28.63 28.62 28.72 28.71 28.81 28.88
28.19
Sep
28.93 28.93 28.99 29.08 29.20 29.25
28.78
Oct
29.13 29-36 29.31 29.13 29.52 29.12
29.11
Nov
29.51 29.60 29.51 29.71 29.61 29.69
28.97
Dec
29.68 29.65 29.11 29.12 28.72 28.38
28.65
Hancock County
111950068220601. Local number H 1. Norman Salisbury. Amherst. Dug unused water-table well in glacial drift, diam 18 in (16 cm), depth 11 ft (1 m), cased with field stone to 11 ft (1 m). Lsd about 330 ft (101 m) above msl. MP top of 2- x 1-in (5-1- x 10-cm) timber driven into bottom of well, at Isd. Highest water level 2.10 ft (0.61 m) below Isd, May 29, 1961; lowest dry, several times, 1911, 1918, 1919, 1952, 1955, 1957, 1960, 1961-66. Records available: 1913-71.
Date Water _ . Water _ . Water _ Water Date level Date level Date level Date level
Jan. 12, 1973 ( J ) July 13, 1973 7-20 Jan. 12, 1971 e6.80 July 11, 1971 7-9027 1.70 27 7.00 31 e7.20 28 7.10
Feb. 12 (j) Aug. 12 7.10 Feb. 21 7.30 Aug. 11 9.0026 6.20 26 9.00 27 6.60 28 10.70
Mar. 11 1.10 Sept. 13 9-30 Mar. 12 6.80 Sept. 12 11.3027 5.20 27 9.10 27 6.00 27 12.00
Apr. 11 1.70 Oct. 12 9.10 Apr. 11 e6.60 Oct. 12 8.1026 5-90 21 9.81 30 1.90 27 8.60
May 12 5-30 Nov. 11 6.10 May 12 5.00 Nov. 11 7.5029 5-30 30 6.20 28 6.10 Dec. 2 6.00
June 11 6.60 Dec. 13 1.60 June 11 7.00 12 1.6028 6.70 27 1.30 28 6.90 27 1.20
e Estimated (well frozen). J Well frozen.
Kennebec County
111819069112001. Local number K 52. Walter Panek. Augusta. Dug unused water-table well in glacial till, diam 36 in (91 cm), depth 22 ft (7 m), stone casing. Lsd about 220 ft (67 m) above msl. MP top of floor of shelter house, at Isd. Highest water level 3.16 ft (1.05 m) below Isd, Nov. 30, 1963; lowest 11.29 ft (1.36 m) below Isd, Oct. 31, 1963. Records available: 1960-71.

GROUND-WATER LEVELS, 1973-74, NORTHEASTERN STATES
44184906941(2001 Continued.
Mean water level for the day, from recorder graph, 1973
Day
5
Eom
Eom
Jan
hi). 38
6.315.414.37
Peb
6.29
5.345.82
Mar
5.68
4.85
5.63
6.15
5.14
Apr
4.05 4.57
5.34
4.23
4.57
4.57
May
4.95
5- It
4.35
5.01
Jun
5-72
4.69
1974
5-75
Ji
3.
h7.
6
al Aug Sep
.92 .... ....
.10 h7.17 8.72
.95 8.52 h5.84
Oot
8.94 8.95
8.35
h5.66
Nov
5-25
4.34
h4.51
Dec
4.72
4.41
5-92
h Tape measurement.
l|l|2023069553801. Local number K 88. A. Alien Stackpole. Wlnthrop. Drilled unused artesian well in bedrock, diam 6 in (15 cm), depth 298 ft (91 m), cased with steel. Lsd about 350 ft (107 m) above msl. MP top of pipe, at Isd. Highest water level 35.26 ft (10.75 m) below Isd, Apr. 17, 1972; lowest 59.86 ft (18.25 m) below Isd, Oct. 31, 1962. Records available: 1962-74.
Jan.Peb.Mar.Apr.MayJune
Date
26, 19732628262928
Water level
45.57(J)
43.3743.0440.7843.05
J Top frozen.
July Aug. Sept Oct. Nov.
Date
30, 1973 27 .27 29 23
Water level
44.43 47.04 46.06 49.88 45.18
Oxford Co
Mar. Apr. May June July
unty
Date
28, 1974 29 30 27 26
Water level
45-95 43.10 43.80 50.24 49.86
Date
Aug. 27, 1974 Sept.30 Oct. 29 Nov. 27 Dec. 23
52.5853.6256.5952.8153.50
444637070552301. Local number 0 400. Union Water Power Co. Middle Dam, Lower Richardson Lake. Dug unused (domestic until Aug. 19, 1973) water-table well in glacial till, diam 24 in (61 cm), depth 15 ft (5 m), casing information not available. Lsd about 1,450 ft (442 m) above msl. MP top of casing, 2.00 ft (0.6l m) above Isd. Highest water level 0.2 ft (0.1 m) below Isd, May 20, 1945, Apr. 30, 1961, Apr. 16, 1967; lowest 12.2 ft (3.7 m) below Isd, Oct. 9, 16, 23, 1966. Records available: 1944-74.
Jan.
Peb.
Mar.
Apr.
May
June
July
7, 1973142128H
1118254
11182518
1522296
13273
1017241
5.45.66.24.34.14.24.76.05.54.51.6.7.7
1.02.0.9.8
1.93.13.22.22.8.8
1.9.8
July
Aug.
Sept.
Oct.
Nov.
Dec .
8, 19731522295
121926
. 21623306
1421284
11182529
162330
2.0 Jan. 6, 19743.5 134.8 206.7 276.2 Feb. 37.0 116.6 177-3 247.8 Mar . 38.0 108.0 178.0 247-1 315.6 Apr. 76.2 146.4 215.2 285 - 0 May 53.9 123.8 193.8 263.2 June 21.4 161.2 231.4 30
2.83-64.13.84.24.24.85.25.73.21.22.73.0.9.7-7.8.8
1.12.21.22.54.95.45.9
Somerset County
July
Aug.
Sept
Oct.
Nov.
Dec.
7, 19741421284
111825
. 18
1522296
1320273
10172418
2229
3.84.25-36.16.87-78.28.89.29.19.09.08.88.58.27-97.87-97-97.46.05.34.63.74.2
4111)219069545801. Local number 3m 1. J. Harrison Parrand. Mercer. Dug unused water-table well in sand, diam 5 ft (2 m), depth 14 ft (4 m), cased with field stone to 14 ft (4 m). Lsd about 270 ft (82 m) above msl. MP top of horizontal 2- x 4-in (5.1- x 10-cm) timber at northeast corner of well cover, 0.40 ft (0.12 m) above Isd. Highest water level 3.75 ft (1.14 m) below Isd, Apr. 13, I960; lowest dry, several times, 1952-53. Records available: 1942-74. Recording gage installed each spring in June and removed each fall in October or November.
Jan. 26, 1973 4.79 Peb. 26 5.34
Ma 4.254.87
May 31, 1973 5.315.25

MAINE, YORK COUNTY
It It 1*21906951*5801 Continued.
Mean water level for the day, from recorder graph, 1973
Day
Oct . Nov. Dec. Jan.
Day
Jan Feb Mar Apr
Date 16*61 Date
21, 1973 6.06 Jan. 25, 23 5.98 Feb. 10 21 4.45 27 11, 1974 5.70 Mar. 12
Mean water lev
Jan Feb Mar Apr
May Jun
Waterlevel
1971 5.21 5.58 5.68 6.30
el for the day,
May Jun
Ju
4.
Mar. Apr.
from r
Ju
h6.
Ll
36
Date
27, 9
26
ecord
il
443496
38
Ai
6
19 r
er
Av
6
ig
( 1
gr
ig
fio
Sep
6.75
Water level
1.81 1.82 1.37
aph, 1971
Sep
h6.3l6.31
Oct Nov De
6.356.15
le
May 12, 1971 1 26 1
June 1 5
Oct Nov D
6.12 .... hi
h7.15 hi. 72
c
vel
.12
.36
.03
ec
.87?8
.17
h Tape measurement.
111210067283501. Local number W 1. Julian A. Johnson. Machias. Drilled stock artesian well in bedrock, diam 6 in (15 cm), depth 51 ft (16 m), cased with steel. Lsd about 110 ft (13 m) abov rasl. MP top of steel casing, at Isd. Highest water level 5.29 ft (1.61 m) below Isd, Apr. 16, 1961; lowest 13.95 ft (1.25 m) below Isd, Feb. 2, 1959. Records available: 1958-71.
Dat
Jan. 26,Feb . 26Mar. 26May 1
Water e level
1973 9.9611.309.326.60
111955067000501. LOGin glacial sand and grav
HighestNov. 12,
Jan. 29,Feb. 26Mar. 27Apr. 29May 30June 29
water level 9.311965. Records
1973 11.8011.0210.5011.2011.0510.50
Da
May 1529
June 26July 25
al number
Wa" le
, 1973 97
1011
ter vel
.00
.60
.55
.30
W 2. Lubecel, diam 2% in (6.1
ft (2.81 m) belowavailable
July 29Aug. 31Sept .30Oct. 24Nov. 25Dec. 23
: 1958-71
, 1973 11e!214141516
cm
Isd
.60
.qo
.20
.90
.90
.20
Aug.Oct.
Nov.
Water Dlstr
Dat
27,16,2815
let.
e
19731971
Lubec) , depth 52 ft (16 m),
, June 14, I960; lowes
Jan.Feb.Mar.Apr.MayJune
28,?725252629
1971
Water level
12.0010.2810.6310.57
. Dri-cased i
t 19.8'
16.1015.7015.8015-3015.2015.30
Nov.Dec.
iren unused»ith iron
3 ft (6.06
JulyAug.Oct.
Nov.Dec.
Date
25, 19711725
artesianpipe 0-12
m) below
30, 19712616262626
Waterlevel
9.019.29
10.05
wellft
Isd,
15.1015.6018.2118.3618.2918.21
131822070182501. Local number Y 1. James P. Small. Cornish. Dug unused water-table well in glacial outwash, diam 36 in (91 cm), depth 24 ft (7 m), curbed with brick to 24 ft (7 m). Lsd about 370 ft (113 m) above msl. MP mark chiseled on top of concrete well curb, at Isd. Highest water level 7.90 ft (2.11 m) below Isd, Apr. 6, 1952; lowest 18.40 ft (5.61 m) below Isd, Nov. 11, 1918. Records available: 1913-71.
Mean water level for the day, from recorder graph, 1973
Day
101520
Jan
11.2711.7011.999.109.77
Feb
8.909.13
10.2011.02
hll.6211.92
Mar
12.1611.00
8.708.61
hg.Ol9.09
Apr
8.198.839.269.50
hlO.ll9.50
May
9.3910.0010.169.738.799.52
Jun
9.9210.3010.7910.51
hlO.8511.37
Jul
9.359.22
10.1311.0311.6312.23
Aug
10.9811.1511.8812.25
h!2.8413.50
Sep
14.0314.1314.8015.15
h!5.2215.27
Oct
15-1815.6115.6715.94
hl6.2516.32
Nov
13-3511.7512.0512.67
h!3.0213.41
Dec
13.1211.75
8.61h8.89

GROUND-WATER LEVELS, 1973-71, NORTHEASTERN STATES
1348220704 82501 Continued.
1971
Day
5 10 1520 25Eom
h
Jan Feb Mar
9.10 9.19 10.21 10.20 .... 10.81 11.25 11.12 11.83 11.01 nil. 99 h9.60 8.76 ell. 80 9.97
Estimated. Tape measurement.
Apr
9.05 9.12 9.62 9.12
h9.l8 9.2l<
May
9.65 9.96 8.95 9.50 9.85 9.92
Ji
10. 10. 11. 11.
nil. 11.
in
.15
.96
.58
.16
.04
.00
Jul
11.15 11.U6 11.99 12.35
H12.76 13.31
Aug
13.81 11.35 11.77 15.20
hl5. 50 15.86
Sep
15.51 13.91 13.33 13.76
hi*. 02 11.13
Dot
11.13 11.51 11.83 15.11
h!5.23 15-58
Nov
15.88 16.06 16.01 15.71
nil. 99 ell. 50
Dec
11.28 10.90 10.18 10.88
nil. 10 12.05

MASSACHUSETTS
The observation-well program in Massachusetts was continued during 1973 through 1971 in coopera^ tlon with the Massachusetts Department of Public Works. Figure 6 shows the location of the obser vation wells included in this report.
Well-llumbering System
The first number shown is the new national well-numbering system represented by the latitude and longitude coordinates of the well location, as explained on page 1. Local well numbers, designated by town or city name and serial numbers assigned within each city or town, have been continued in this report for the convenience of local users and for easy reference to previously published data.
Well Descriptions and Water-Level Measurements
Water levels are reported in feet below land surface datum, unless otherwise indicated.
Barnstable County
113956070161301. Local number Barnstable 230. U.S. Oeol. Survey. Mary Dunn Rd. at Hyannls Airport. Augered observation water-table well in sand and gravel, diam 1H in (3.2 cm), depth 36 ft (11 m), well point 33-36 ft (10-11 m). Lsd about 10 ft (12 m) above rasl. MP top of casing, 0.70 ft (0.21 m) above Isd. Highest water level 21.05 ft (6.112 m) below Isd, May 12, 1973; lowest 26.22 ft (7.99 m) below Isd, Oct. 25, 1966. Records available: 1958-71.
Highest water level for the day, from recorder graph, 1973
Day
510 15 20 25 Horn
Jan
21.20 21.27 21.10 21.11 21.56 21.67
Feb
21.71 21.81 21.81 21.88 21.89 21.93
Mar
21.98 22.08 22.12 22.20 22.28 22.19
Apr
21.71 21.22 21.09 21.11 21.21 21.20
MJ
21, 21.
e21.621.
21.21,
iy
.12
.09
.06
.09
.11
.23
Jun
21.35 21.16 21.55 21.67 21.80 21.82
Jul
21 21 21 21 21 21
.80
.90
.97
.95
.78
.73
Aug
21.76 21.87 22.01 22.05 22.12 22.21
Sep
22.37 e22.18 e22.59 e22.66 e22.73 22.80
Oct
22.60 22.52 22.56 22.69 22.78 22.79
Nov
22.81 22.92 23.00 23.09 23.16 23.15
Dec
23.18 23.17 23.15 22.67 22.19 22.08
1971
5 10 15 20 25
22.12 e22.l6 e22.19 622.21 e22.20
21.71
21.68 21.72 21.76 21.80 21.81 21.81
21.81 21.87 21.90 21.97 22.05 22.02
22.16 22.15 21.96
e21.87 21.81
621.90
621. 22. 22. 22. 22. 22.
98 ,07 .00 ,08 13
.15
22.20 22.25 22.31 22.38 22.11 22.18
22, 22, 22, 22 22, 23,
.51
.62
.73
.85
.99
.17
23-31 23.12 23-52 23. 6U 23-77 23-90
23.96 23.99 21.06 21.11 21.22 21.27
21.32 21.38 21.13 21.15 21.51 21.61
21.67 21.71 21.80 21.85 21.89 21.96
21.98 21.99 25.00 21.99 25.02 25.07
e Estimated.
111516070011701. Local number Brewster 21. U.S. Oeol. Survey. Nook Rd. in Nickerson State Park. Augered observation water-table well In sand and gravel, diam 2*5 in (6.1 cm), depth 25 ft (8 m), well point 22-25 ft (7-8 m). Lsd 36.69 ft (11.18 m), previously reported 50 ft (15 m), above msl. MP top of casing, 2.10 ft (0.73 m) above Isd. Highest water level 6.90 ft (2.10 m) below Isd, Apr. 25, 1971; lowest 13.31 ft (1.07 m) below Isd, Oct. 25, 1966. Records available: 1957-71.
Water n ,. Water n . Water n Water level Date level Date level Date level
Jan. 26, 1973 8.87 July 27, 1973 7.12 Jan. 29, 1971 7.26 July 30, 1971 7.18Feb. 26 8.51 Aug. 28 7.22 Feb. 26 7.10 Aug. 28 7.87Mar. 27 8.31 Sept.27 7.15 Mar. 28 7.08 Sept.26 8.21Apr. 26 7.82 Oct. 29 7-59 Apr. 25 6.90 Oct. 30 8.63May 25 7.37 Nov. 28 7.60 May 29 6.93 Nov. 26 8.90June 27 7.28 Dec. 20 7.18 June 26 7.01 Dec. 27 9.20
113119070322101. Local number Falmouth 5. Town of Falraouth. Driven unused water-table well in glacial drift, diam 2\ in (6.1 cm), depth 50 ft (15 m), casing information not available. Lsd about 8 ft (2 m) above rasl. MP top of casing, at Isd. Highest water level 2.55 ft (0.78 m) below Isd, May 1, 1958; lowest 5.69 ft (1.73 m) below Isd, Dec. 31, 1971. Records available: 1950-71. Water levels affected by pumping.

GROUND-WATER LEVELS, 1973-74, NORTHEASTERN STATES
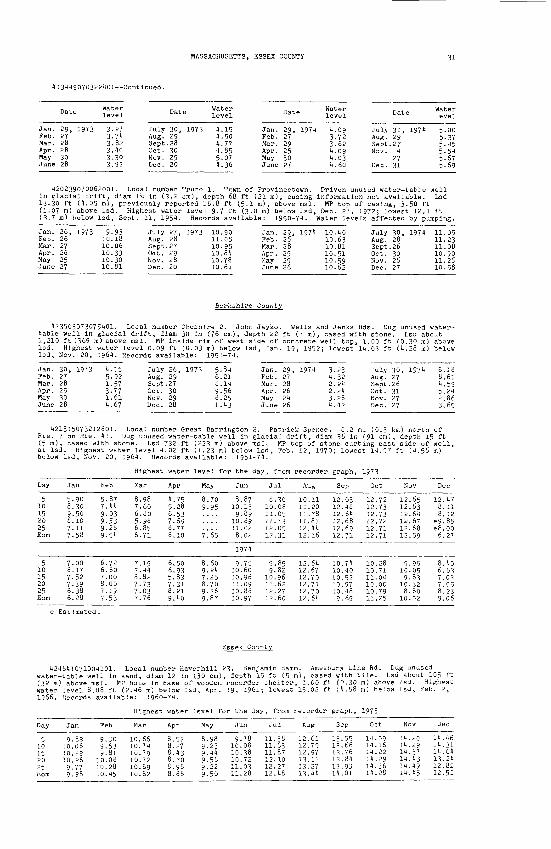
MASSACHUSETTS, ESSEX COUNTY
113ll9070322l01--Continued.
Date Water
Jan. 29, 1973 3.27Feb. 27 3.71Mar. 28 3.82Apr. 28 3.10May 30 3-30June 28 3.92
120239070062001. Locain glacial drift, diam Vn13.30 ft (1.05 m), previo(1.07 m) above isd. High(3-7 m) below Isd, Sept.
Jan. 26, 1973 9.93Feb. 26 10.18Mar. 27 10.06Apr. 26 10.33May 25 10.30June 27 10.81
July 30,Aug. 29Sept. 28Oct. 30Nov. 29Dec. 20
1 numberin (3.2
usly repcest water11, 1951.
July 27,Aug. 28Sept. 27Oct. 29Nov. 28Dec. 20
, 1973
Trurocm),>rted leve
Rec
1973
Water Waterlevel level
111151
1.dept16.81 9.ords
101110101010
.15
.50 77.85.07.36
Jan.Feb.Mar.Apr.MayJune
29, 19712729253027
Town of Provincetown.h 68 ftft (5-
7 ft (3
(21 m),1m), ab.0 m) be
casingove msl.low Isd,
available: 1950-71.
.90
.05
.95
.81
.78
.61
Berkshir
123503073075101. Locatable well in glacial dri1,210 ft (369 m) above mslIsd. Highest water level
1 numberft, diam. MP ins0.09 ft
Isd, Nov. 20, 1961. Records availa
Jan. 30, 1973 1.15Feb. 27 5-92Mar. 28 1.57Apr. 25 3.77May 30 1.61June 28 1.67
July 26,Aug. 29Sept. 27Oct. 30Nov. 29Dec. 28
Cheshire30 inide r(0.03ble:
1973
(76im om)
Jan.Feb.Mar.Apr.MayJune
e County
2. John Jayko.cm), d
f westbelow 1
epth 22side ofsd, Jan.
29, 19712628252926
Wellsft (7 m)concrete19, 195
1.093.723.621.091.031.60
Driven uinformati
MP topDec. 27,
Water lev
10.1010.6310.8110.5110.5910.62
and Jenks, cased wwell top
2; lowest
JulyAug.Sept.Nov.
Dec.
31 ,29?7
if2731
1971
nused water-table won not avof casing1972; lo
all a;, T-west
els affected
JulyAug.Sept.Oct.Nov.Dec.
Rds. Duith stone, 1.00 ft11.03 ft
30,?8263D2627
. I,(0.(1.
.ble.50 ft12.1
by pun.
1971
sd abo30 m)28 m)
Waterlevel
5.005.375.155.515-675.69
ellLsd
ftiping.
11.0511.2311.0810.9011.2610.58
ater-utabovebelow
1951-71.
568981
.81
.21
.11
.56
.25
.13
Jan.Feb.Mar.Apr.MayJune
29, 19712728262126
3.231.322.212.213.281.12
JulyAug.Sept.Oct.Nov.Dec.
30,?726312727
1971 6.188.611.595.212.863.65
Day
510152025Eom
Jan
5.908.309.508.107-117-58
Feb
5.877.119-039.539.289.51
Mar
8.987.606.805.986.856.71
Apr
1.755.286.537.698.778.10
May
8.709.95
7.65
Jun
8.8710.139.89
10.6911.028.02
Jul
8.3010.0811.0511.7312.0512.31
Aug
10.1111.2011.7811.8712.1112.16
Sep
12.0312.1812.6112.6812.6912.71
Oct
12.7212.7312.7312.7212.7112.71
Nov
12.6512.6312.6112.6712.6812.59
Dec
12.178.118.12
e9.85eS.OO
6.27
1971
510152025Eom
7.008.177.527-396.386.28
6.726.807.008.007.197.53
7.197.118.827.737.037.76
6.506.935.837.318.219.10
8.609.217-258.709.269.87
9.7510.6010.9611.0910.8810.97
9.859.82
10.9611.6212.2712.60
12.6112.6712.7012.7112.7012.61
10.7110.1010.5210.9710.189.69
10.2810.7111.0110.0010.7911.25
9.9510.059-83
10.328.80
10.02
8.106.637.037.058.239.06
e Estimated.
121811071001101. Local number Haverhill 23. Benjamin Hamm. Amesbury Line Rd. Dug unused water-table well in sand, diam 12 in (30 cm), depth 15 ft (5 m), cased with tile. Lsd about 105 ft (32 m) above msl. MP hole in base of wooden recorder shelter, 1.00 ft (0.30 m) above Isd. Highest water level 8.08 ft (2.16 m) below Isd, Apr. 19, 1961; lowest 15.02 ft (1.58 m) below Isd, Feb. 2, 1966. Records available: 1960-71.
Highest water level for the day, from recorder graph, 1973 ____________
Day Jan Feb Mar Apr May Jun Jul Aug Sep Oct Nov Dec

GROUND-WATER LEVELS, 1973-71, NORTHEASTERN STATES
424841071004101 Continued.
Day
510 15 20 25
Jan
12.1)1 12.42 12. 4H 12.52 12.42 11.95
Feb
11.75 11.68 11.70 11.64 11.47 11.43
Mar
11.40 11.47 11.55 11.50 11.03 10.81
Apr
10.70 10.55 10.24 9.95 9.96
10.08
May
10.19 10.33 10.20 10.22 10.35 10.57
Jun
10.74 10.93 11.15 11.34 11.55 11.74
Jul
11.95 12.15 12.35 12.55 12.74 12.92
Aug
13.08 13.22 13.35 13-44 13.53 13.61
Sep
13.59 13.60 13.69 13.77 13.71 13.44
Oct
13.18 13.20 13.31 13.21 13.29 13.38
Nov
13.45 13.43 13.10 13.39 13.32 13.26
Dec
12.45 12.34 12.40 12.26 12.06 12.02
425103070513401. Local number Salisbury 9. Eugene 0. Folsum. Garrish Rd. Dug unused water- table well in sand, diam 30 in (76 cm), depth 11 ft (3 m), cased with tile. Lsd about 35 ft (11 m)
3.06 ft (0.^ .... ___.. __, . Records available: 1960-74.
l in sand, diam 30 in (76 cm), depth 11 ft (3 m), cased with tile. Lsd about 35 ft (1 . MP top inside lip of tile casing, 1.60 ft (0.49 m) above Isd. Highest water level 0.93 m) below Isd, Mar. 27, 1969; lowest 8.20 ft (2.50 m) below Isd, Sept. 25, 1964. vailable: 1960-74.
Water n . Water _ ,. Water n . Water level Date level Date level Date level
Jan. 24, 1973 3.85 July 24, 1973 5-89 Jan. 22, 1974 4.46 July 24, 1974 6.60Feb. 21 4.81 Aug. 23 6.15 Feb. 21 4.27 Aug. 26 7.59Mar. 22 4.49 Sept.24 6.56 Mar. 25 4.12 Sept. 24 6.65Apr. 23 4.75 Oct. 24 6.97 Apr. 29 4.64 Oct. 24 . 6.49May 23 4.11 Nov. 23 6.12 May 23 5.06 Nov. 21 4.98June 22 5.4g Dec. 20 3-79 June 24 5.44 Dec. 23 4.27
Franklin County
Jan. 30, 1973 1-70 July 26, 1973 1.35 Jan. 29, 1971 0.75 July 30, 1971 2.61Feb. 27 1.76 Aug. 29 1.93 Feb. 27 1.01 Aug. 28 2.99Mar. 28 .91 Sept.27 1.99 Mar. 28 .80 Sept.27 2.37Apr. 25 .70 Oct. 29 1.88 Apr. 26 .96 Oct. 31 2.13May 30 .42 Nov. 29 1.81 May 24 .91 Nov. 27 2.30June 28 .71 Dec. 28 .70 June 27 1.45 Dec. 27 2.20
422607072324401. Local number Sunderland 7. Town of Sunderland. Rte. 116 at Russellville Brook. Driven unused water-table well in glacial outwash, diam 2\ in (6.4 cm), depth 54 ft (16 m), casing information not available. Lsd about 210 ft (64 m) above msl. MP top of casing, at Isd. Highest water level 6.85 ft (2.09 m) below Isd, Apr. 25, 1973; lowest 23.26 ft (7.09 m) below Isd, Feb. 24, 1966. Records available: 1957-74. Water levels affected by pumping.
Jan. 30, 1973 8.17 July 26, 1973 8.41 Jan. 29, 1974 13.04 July 30, 1974 11.39Feb. 27 8.24 Aug. 29 9.00 Feb. 27 12.30 Aug. 28 14.18Mar. 28 7.04 Sept.27 13.16 Mar. 28 11.92 Sept.27 14.07Apr. 25 6.85 Oct. 30 13.66 Apr. 26 11.32 Oct. 31 14.70May 30 7.92 Nov. 29 14.15 May 24 10.85 Nov. 27 16.92June 28 8.17 Dec. 28 13.10 June 27 10.91 Dec. 27 17.40
Hampden County
420646072420101. Local number Westfield 62. Westfield Sanatorium. East Mountain Rd. near Rte. 20. Driven unused water-table well in glacial outwash, diam 2% in (6.4 cm), depth 25 ft (8 m), casing information not available. Lsd about 210 ft (64 m) above msl. MP top of casing, 3-50 ft (1.07 m) above Isd. Highest water level 4.09 ft (1.25 m) below Isd, Apr. 30, 1958; lowest 11.18 ft (3.41 m) below Isd, Sept. 5, 1957. Records available: 1957-74. Water levels affected by pumping.
Sept. 26, 1973Oct. 29Nov. 28Dec. 27Jan. 28, 1974
8.298.848.875.865.55
Hampshire
Feb. 26, 1974Mar. 27Apr. 25May 23July 29
County
5.735.425.356.008.10
Mar. 27, 1973 5.47 Sept.26, 1973 8.29 Feb. 26, 1974 5.73 Aug. 27, 1971 10.76Apr. 24 4.78 Oct. 29 8.84 Mar. 27 5.42 Sept.26 8.90May 29 4.67 Nov. 28 8.87 Apr. 25 5.35 Oct. 30 8.16June 27 6.00 Dec. 27 5.86 May 23 6.00 Nov. 26 9.01July 25 6.16 Jan. 28, 1974 5.55 July 29 8.10 Dec. 26 7-04Aug. 28 7.12

MASSACHUSETTS, MIDDLESEX COUNTY
421356072322101 Continued.
Feb. Mar. Apr. May
Water level
6.23 6.53 5.83 5.72 5-87 7.18
Date
July 25, 1973 Aug. 28 Sept.26 Oct. 29 Nov. 28 Dec. 27
9.13 9-729.507.34
Date
Jan. 28, 1974 Feb. 26 Mar. 27 Apr. 25 May 23 June 26
Water level
6.54 6.32 5-95 6.30 6.62 7.71
Date
July 2Q, 1974 Aug. 27 Sept.26 Oct. 30 Nov. 26 Dec. 26
7.687.156.93
422316071092501. Local number Cambridge 667. Cambridge Water Dept. Blanohard Rd. and Concord Ave. Drilled unused water-table well in sand and gravel, diam 8 in (20 cm), depth 129 ft (39 m), casing information not available. Lsd 11.63 ft (3.54 m) above msl. HP top of casing, 0.39 ft (0.12 m) above Isd. Highest water level 5.11 ft (1.57 m) below Isd, Dec. 29, 1969; lowest 27.21 ft (8.29 m) below Isd, Dec. 27, 1965. Records available: 1944-74.
Jan. 25, 1973Feb. 22Mar. 23Apr. 24May 24
6.74 6.24 6.59 5.38 5-30
July 25, 1973 Aug. 24 Sept.25 Oct. 25 Nov. 26 Dec. 20
7.218.22
10.3011.119.226.24
Jan. 23, 197t Feb. 22 Mar. 26 Apr. 30 May 24 June 25
5-41 6.16 6.37 5.63 6.29 6.16
July 25, 1974 Aug. 26 Sept.23 Oct. 25No 22Dec. 24
7.9210.9711. 4910.509.717-38
423845071231401. Local number ChelmsfordDrilled unused water-table well in outwash, dia
n). Lsd 100.83 ft (30.73 m) above msl.
Mrs. Harold Blackie. Middles 6 in (15 cm), depth 50 ft (15
(15 m). Lsd 100.83 ft (30.73 m) above msl. MP top of hole in cap on casing, 1.40 ft (0.43 m) below Isd. Highest water level 5.25 ft (1.60 m) below Isd, Apr. 25, 1969; lowest 12.24 ft (3. below Isd, Sept. 28, 1957- Records available: 1939-74.
;x St. and Groton Rd. n), cased to 50 ft
73 m)
Jan. 25, 1973 Feb. 22 Mar. 23 Apr. 24 May 24 June 25
6.937.336.636.597.06
July 25, 1973 Aug. 24 Sept.25 Oct. 25 Nov. 26 Dec. 20
8.159.41
10.009.628.777.30
Jan.Feb.Mar Apr May June 25
23, 197422263024
7.457.847.567.457.898.81
July 25, Aug. 26 Sept.23 Oct. 25 Nov. 22 Dec. 24
1974 9-78 11.17 9-93 8.42 8.09 7-13
423812071174801. Local number Lowell 14. Rogers Hall School. Rogers St. and Fort Hill Ave. Dug unused water-table well in till, diam 24 in (61 cm), depth 30 ft (9 m), cased with stone. Lsd 157.78 ft (48.09 m) above msl. MP top edge of stone slab under wooden cover, 0.20 ft (0.06 m) below Isd. Highest water level 7.79 ft (2.37 m) below Isd, May 27, 1958; lowest 19.79 ft (6.03 m) below Isd, Dec. 29, 1965- Records available: 1939-74.
Jan. 25, 1973
Mar. Apr. May
9.27 9.42 9-29 8.85 9.26
11.09
July 25, 1973 11.6724
Sept.25 Oct. 25 Nov. 26 Dec. 20
13.15 14.57 15-63 16.25 15.85
Jan. 23, 1974 Feb. 22 Mar. 26 Apr. 30 May 24 June 25
12.6511.2510.239.74
10.3411.66
July 25, 1974 Aug. 26 Sept.23 Oct. 25Nov 22Dec. 24
13-38 15.00 15.64 14.69 14.39 13.35
423329071122501. Local number Wilmington 10. L. Chisholm. Hopkins St. and Shawsheen Ave. Dug unused water-table well in sand, diam 36 in (91 cm), depth 9 ft (3 m), cased with stone. Lsd 113.63 ft (34.63 m) above msl. MP projecting stone in well, 0.17 ft (0.05 m) below Isd. Highest water level 0.45 ft (0.14 m) below Isd, Feb. 27, 1968; lowest dry, Dec. 13, 1941, Oct. 30, 1957, Aug. 26, 1974. Records available: 1940-74.
Jan. 24, 1973 Feb. 21 Mar. 22 Apr. 23 May 23 June 22
1.141.331.441.471.443.36
July 24, 1973Aug. 23Sept. 24Oct. 24Nov. 23Dec . 19
3.143.874.635.723.951.31
Jan.Feb.Mar.Apr.MayJune
22, 19742125292324
.27
.01
.31
.87
.803.39
July 24, 1974 Aug. 26 Sept.24 Oct. 24 Nov. 21 Dec. 23
5.35(f)6.573.843-171.69
f Dry.
423401071093801. Local number Wilmington 78. Town of Wilmington. Whitefield School, Middlesex Ave. Dug unused water-table well in sand, diam 42 in (107 cm), depth 12 ft (4 m), cased with stone. Lsd about 80 ft (24 m) above msl. MP hole in base of wooden recorder shelter, 0.33 ft (0.10 m) above Isd. Highest water level 4.90 ft (1.4g m) below Isd, May 2, 1953; lowest 11.27 ft (3.44 m) below Isd, Oct. 30, 1957. Records available: 1951-74.
Highest water level for the day, from recorder graph, 1973
Day
5 10 15 20 25
Jan
6.17 6.39 6.65 6.53 6.46 6.57
Feb
5.94 6.05 6.15 6.48 6.67 6.77
Mar
6.90 6.88 6.84 6.62 6.65 6.78
Apr
5.66 5.51 5.81 6.05 6.26 6.02
May
6.21 6.34 6.52 6.40 6.41 6.64
Jun
6.87 7.08 7.25 7.44 7-57 7.14
Jul
6.95 7.08 7.27 7.49 7.62 7-71
Aug
7.80 7.91 8.05 8.15 8.30 8.25
Sep
8.52 8.61 8.71 8.71 8.83 8.91
Oct
8.99 9.06 9.12 9.18 9.24 8.85
Nov
8.64 8.57 8.56 8.60 8.62 8.50
Dec
8.40 8.16 7-75 6.84 6.60 6.37

GROUND-WATER LEVELS, 1973-7 1!, NORTHEASTERN STATES
423401071093801--Continued.
1971
Day
5 10 15 20 25 Eom
Jan
6.1)7 6.68 6.867.05 6.84 6.1)0
Feb
6.50 6.72 6.89 6.5!) 6.55 6.57
Mar
6.72 6.90 7.08 7.02 6.1)9 6.50
Apr
6.55 6.52 6.31 6.1)2 6.61) 6.76
May
6.92 6.81 6.61) 6.75 6.91 7.11
Jun
7.17 7.28 7.45 7.62 7.78 7-93
Jul
8.10 8.21) 8.1)0 8.57 8.75 8.87
Aug
9.08 9.24 9.38 9.51 9.63 9.7")
Sep
9.76 9.71 9-71 9.80 9.1)6 8.9!)
Oct
8.67 8.63 8.72 8.1)2 8.31 8.38
Nov
8.39 8.39 8.1)1 8.1)1 8.37 8.1)1
Dec
7.73 7.52 7.51 7.33 7.31 7.52
Norfolk County
121135071165701. Local number Dover 10. U.S. Geol. Survey. Springdale Ave. at Dover Public School. Augered observation water-table well in sand and gravel, diam 2 in (5.1 cm), depth 51 ft (16 m), well point 52-51 ft (15-9-16.5 m). Lsd about 160 ft (1)9 m) above msl. MP top of casing, 3.00 ft (0.91 m) above Isd. Highest water level 30.25 ft (9.22 m) below Isd, Feb. 20, 1970; lowest 36.87 ft (11.21 m) below Isd, Jan. 21, 1966. Records available: 1965-74.
Water Water D . Water Water level Date level Date level Date level
Jan. 26, 1973 31.12 July 27, 1973 32.82 Jan. 21), 1971 33-17 July 26, 1971 33.23Feb. 23 31.12 Aug. 27 33.20 Feb. 25 32.20 Aug. 26 3!).01Mar. 26 31.88 Sept.25 33-73 Mar. 26 31.58 Sept.25 31.55Apr. 23 31.59 Oct. 26 31.30 Apr. 29 31.18 Oct. 21 3!).40May 24 32.00 Nov. 27 31.75 May 22 31.60 Nov. 22 34.39June 26 32.58 Dec. 19 31.60 June 25 32.48 Dec. 30 33.63
420432071151201. Local number Foxborough 3. U.S. Geol. Survey. Chestnut St. at Foxborough State Hospital. Augered observation water-table well in sand and gravel, diam 2 in (5-1 cm), depth 32 ft (10 m), well point 30-32 ft (9-10 m). Lsd about 290 ft (88 m) above msl. MP top of casing, 3.00 ft (0.91 m) above Isd. Highest water level 16.24 ft (4.95 m) below Isd, Mar. 25, 1968; lowest 21.42 ft (6.53 m) below Isd, Dec. 28, 1965. Records available: 1965-71.
Jan. 30, 1973 18.03 July 26, 1973 19.14 Jan. 30, 1974 18.09 July 29, 1974 19.85Feb. 23 18.08 Aug. 27 19.63 Feb. 25 18.03 Aug. 27 20.52Mar. 26 18.47 Sept.26 19-96 Mar. 27 17.70 Sept.25 20.52Apr. 25 18.15 Oct. 26 20.38 Apr. 24 17.76 Oct. 24 20.09May 29 18.33 Nov. 27 20.45 May 28 18.6l Nov. 22 20.18June 26 18.94 Dec. 18 19.00 June 28 19.14 Dec. 30 19.18
420954070564501. Local number Weymouth 2. U.S. Geol. Survey. U.S. Naval Air Station at main gate. Augered observation water-table well in glacial till, diam 2 in (5.1 cm), depth 30 ft (9 m), well point 28-30 ft (8.5-9.1 m). Lsd 180 ft (55 m) above msl. MP top of casing, 3.00 ft (0.91 m) above Isd. Highest water level 5.59 ft (1.70 m) below Isd, Mar. 26, 1969; lowest 22.06 ft (6.72 m) below Isd, Nov. 22, 1965. Records available: 1965-74.
Jan. 30, 1973 7-09 July 26, 1973 10.20 Jan. 29, 1974 6.70 July 29, 1974 14.22Feb. 23 8.04 Aug. 27 12.28 Feb. 25 6.79 Aug. 27 16.94Mar. 26 8.27 Sept.26 13.61 Mar. 27 7.26 Sept.25 16.07Apr. 25 7.60 Oct. 26 15-32 Apr. 26 7-45 Oct. 25 13.44May 29 8.50 Nov. 27 15.08 May 28 9.70 Nov. 25 13.69June 26 10.74 Dec. 21 8.62 June 28 11.32 Dec. 31 11.33
Plymouth County
415228070554601. Local number Lakeville 14. U.S. Geol. Survey. Rte. 105 at Lakeville State Sanitarium. Augered observation water-table well in sand and gravel, diam 2 in (5-1 cm), depth 41 ft (13 m), well point 39-41 ft (12-13 m). Lsd about 105 ft (32 m) above msl. MP top of casing, 1.50 ft (0.46 m) above Isd. Highest water level 10.05 ft (3.06 m) below Isd, Jan. 4, 1973; lowest 23.59 ft (7.19 m) below Isd, Oct. 26, 1966. Records available: 1964-74.
Day
5 101520 25Eom
5 10 15 20 25 Eom
Jan
10.10 10.42 10.87 11.18 11.54 11.53
12.43 12.30 12.17 11.68 11.14 10.64
Feb
10.54 10.37 10.43
elO.46 elO.80
11.03
10.74 11.20 11.50 11.51 11.17 10.96
HigheE
Mar
11.30 11.28 11.23 11.47 11.63 11.71
11.05 11-33 11.68 11.69 11.0010.89
Apr
11.00 10.56 10.73 11.07 11.32 10.83
11.15 10.80 10.87 10.96 11.13 11.41
May
10.71 ell. 20 ell. 37 ell. 55 ell. 60 11.59
11.74 11.97 12.11 12.25 12.41 12.72
Jun
11.8612.15 12.50 12.85 13.15 13.36
1974
12.94 13.13 13.41 13.68 13.86 14.01
iy, from
Jul
12.94 12.80 12.90 12.77 12.90 13.21
14.16 14.44 14.63 14.90 15.14 15.45
Aug
13.44 13.71 14.01 14.20 14.37 14.63
15.75 16.03 16.33 16.62 16.88 17.15
- graph,
Sep
14.83 14.35 14.17 14.13 14.18 14.26
17.34 17.50 17.65 17.82 17-96 18.10
1973
Oct
14.45 14.63 14.75 11.91 15.05 15.21
18.24 18.37 18.50 18.59 18.64 18.71
Nov
15.28 15.33 15.38 15.50 15-55 15-63
18.77 18.86 18.93 19.00 19.08 19.14
Dec
15.31 15.17 14.89 13.76 13.56 12.88
19.14 18.96 18.89 18.82 18.71 18.62
e Estimated.
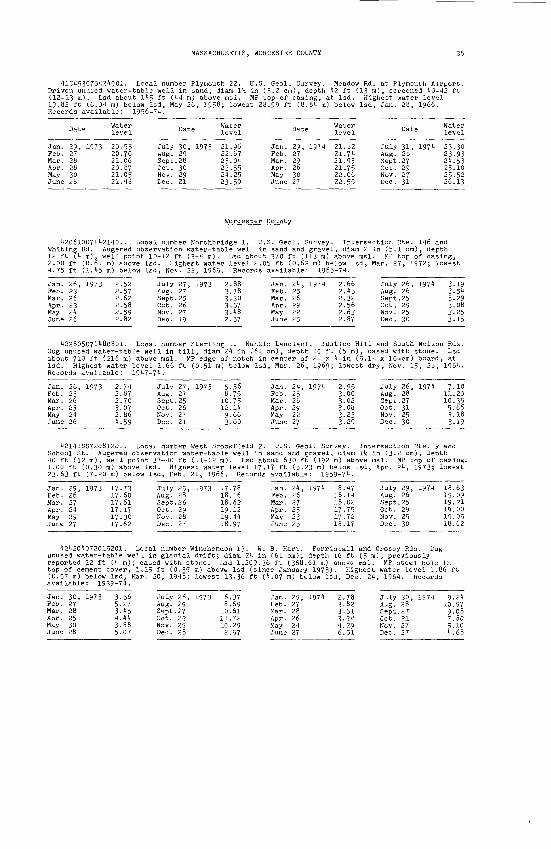
MASSACHUSETTS, WORCESTER COUNTY
4154530701134901. Local number Plymouth 22. U.S. Geol. Survey. Meadow Rd. at Plymouth Airport. Driven unused water-table well in sand, diam IH in (3.2 cm), depth 42 ft (13 m), screened 40-42 ft (12-13 m). Lsd about 145 ft (44 m) above msl. HP top of casing, at Isd. Highest water level 19.82 ft (6.04 m) below Isd, May 26, 1958; lowest 28.99 ft (8.84 m) below Isd, Jan. 28, 1966. Records available: 1956-74.
Water Water Water Water level Date level Date level Date level
Jan. 29, 1973 20-55 July 30, 1973 21.96 Jan. 29, 1974 21.82 July 31, 1974 23-30Feb. 27 20.70 Aug. 29 22.67 Feb. 27 21.74 Aug. 28 23.93Mar. 28 21.06 Sept.28 23.04 Mar. 29 21.93 Sept.27 24.53Apr. 28 20.87 Oct. 30 23.55 Apr. 26 21.75 Oct. 29 25.10May 30 21.05 Nov. 29 24.25 May 30 22.06 Nov. 27 25.52June 28 21.48 Dec. 21 23.50 June 27 22.55 Dec. 31 26.13
Worcester County
420610071421401. Local number Northbridge 1. U.S. Geol. Survey. Intersection Rte. 146 and Whiting Rd. Augered observation water-table well In sand and gravel, diam 2 in (5.1 cm), depth 12 ft (4 m), well point 10-12 ft (3-4 m). Lsd about 370 ft (113 m) above msl. MP top of casing, 2.00 ft (0.61 m) above Isd. Highest water level 2.05 ft (0.62 m) below Isd, Mar. 27, 1972; lowest 4.75 ft (1.45 m) below Isd, Nov. 22, 1965. Records available: 1965-74.
Jan. 26, 1973 2.52 July 27, 1973 2.88 Jan. 24, 1974 2.66 July 26, 1974 3.19Feb. 23 2.57 Aug. 27 3.18 Feb. 25 2.45 Aug. 26 3.54Mar. 26 2.62 Sept.25 3.30 Mar. 26 2.32 Sept.25 3.29Apr. 23 2.58 Oct. 26 3.57 Apr. 29 2.56 Oct. 29 3.08May 24 2.59 Nov. 27 3.48 May 22 2.63 Nov. 25 3.25June 26 2.82 Dec. 19 2.57 June 25 2.87 Dec. 30 3.15
422805071480801. Local number Sterling 1. Nunzio Lanciani. Justice Hill and South Nelson Rds. Dug unused water-table well in till, diam 24 in (61 cm), depth 15 ft (5 m), cased with stone. Lsd about 710 ft (216 m) above msl. MP edge of notch in center of 2- x 4-in (5.1- x 10-cm) board, at Isd. Highest water level 1.66 ft (0.51 m) below Isd, Mar. 26, 1969; lowest dry, Nov. 15, 28, 1964. Records available: 1947-74.
Jan. 26, 1973 2.74 July 27, 1973 5.56 Jan. 24, 1974 2.95 July 26, 1974 7.10Feb. 23 2.87 Aug. 27 8.75 Feb. 25 3.00 Aug. 28 11.20Mar. 26 2.70 Sept.25 10.75 Mar. 26 3.02 Sept.27 10.35Apr. 23 3-07 Oct. 26 12.14 Apr. 29 3.08 Oct. 31 5.66May 24 2.86 Nov. 27 9.66 May 22 3.23 Nov. 25 3.18June 26 4.59 Dec. 21 3.00 June 27 3.29 Dec. 30 3.19
421410072081201. Local number West Brookfield 2. U.S. Geol. Survey. Intersection Rte. 9 and School St. Augered observation water-table well in sand and gravel, diam 1^ in (3.2 cm), depth 40 ft (12 m), well point 37-40 ft (11-12 m). Lsd about 630 ft (192 m) above msl. MP top of casing, 1.00 ft (0.30 m) above Isd. Highest water level 17.17 ft (5.23 m) below Isd, Apr. 24, 1973; lowest 23.63 ft (7-20 m) below Isd, Feb. 21, 1966. Records available: 1959-74.
Jan. 29, 1973 17-73 July 25, 1973 17-78 Jan. 24, 1974 18.47 July 29, 1974 18.63Feb. 26 17.60 Aug. 28 18.16 Feb. 26 18.14 Aug. 26 19.09Mar. 27 17.61 Sept.26 18.62 Mar. 27 18.02 Sept.25 19.21Apr. 24 17.17 Oct. 29 19.12 Apr. 25 17-75 Oct. 29 19.00May 29 17-30 Kov. 28 19.44 May 23 17.72 Nov. 25 19.05June 27 17-62 Dec. 27 18-97 June 25 18.17 Dec. 30 18.62
424204072015201. Local number Winchendon 13- W. B. Hart. Forristall and Crosby Rds. Dug unused water-table well in glacial drift; diam 24 in (61 cm); depth 16 ft (5 m), previously reported 12 ft (4 m); cased with stone. Lsd 1,209-36 ft (368.61 m) above msl. MP steel hole in top of cement cover, 1.15 ft (0-35 m) above Isd (since January 1973). Highest water level 1.86 ft (0.57 m) below Isd, Mar. 20, 1948; lowest 13.36 ft (4.07 m) below Isd, Dec. 24, 1964. Records available: 1939-74.
Jan. 30, 1973 3-56 July 26, 1973 6.37 Jan. 29, 1974 2.78 July 30, 1974 9.24Feb. 27 5.27 Aug. 29 8.69 Feb. 27 3.82 Aug. 28 10.97Mar. 28 3.45 Sept.27 10.61 Mar. 28 3.51 Sept.27 9.08Apr. 25 4.44 Oct. 29 11.72 Apr. 26 3-94 Oct. 31 7.80May 30 3.88 Nov. 29 10.29 May 24 4.29 Nov. 27 5.10June 28 5.07 Dec. 28 2.57 June 27 6.51 Dec. 27 4.68

The observation-well program in Michigan was continued from 1973 through 19/4 in cooperation with the Michigan Department of Natural Resources and its Geological Survey Division. Figure 7 shows the location of observation wells included in this report.
Well-Numbering System
Wells are numbered according to their latitude-longitude location, as explained on page 1. Local well numbers are also given.
The local well number indicates the location of wells within the rectangular subdivision of the land with reference to the Michigan meridian and base line. The first two segments of the well number designate township and range, the third segment of the number designates the section and the letters A thru D designate successively smaller subdivisions of the section. Thus, a well desig nated as 32N 6E 16CCCB would be located to the nearest 2.5 acre (1 hectare) and would be within the shaded area in section 16 below. In the event that two or more wells are located in the same 2.5 acre (1 hectare) tract, a sequential number designation follows the letter designations for example, 16CCCB1, 16CCCB2, 16CCCB3, etc.
-16
Well Descriptions and Water-Level Measurements
Alger County
Au Train Township
461608086373801. Local number 45N 19W 25BDDB. U.S. Forest Service. Drilled unused artesian well in deposits of Pleistocene age, diam 6 in (15 cm), depth 66 ft (20 m), cased. Lsd about 850 ft (259 ra) above rasl. MP top of 3-in (7.6-cm) extension pipe, 3.60 ft (1.10 m) above Isd. Highest water level 6.4 ft (2.0 m) below Isd, June 29, I960; lowest 14.2 ft (4.3 m) below Isd, Apr. 3, 1964. Records available: 1959-74.
Date
Feb. 1, 1973May 1Aug. 21
Water level
11.9111.1210.83
Date Water level
Dec. 7, 1973 11-83 Mar. 11, 1974 12.41
Date Water level
Apr. 29, 1974 12.£ Aug. 6 11.£
Date Water level
Oct. 30, 1974 Dec. 18
11.8211.76
Baraga County
Covington Township
463353088144301. Local number 48N 32W 12DDCC. State Highway Dept. U.S. Hwy. 41, near Nestoria. Driven observation water-table well in sand and gravel of Pleistocene age, diam 1^ in (3-2 cm), depth 10 ft (3 m), screened 7-10 ft (2-3 m). Lsd about 1,630 ft (497 m) above msl. MP top of casing, 0.90 ft (0.27 n) above Isd. Highest water level 3.27 ft (1.00 m) below Isd, Apr. 30, 1965; lowest 8.09 ft (2.47 m) below Isd, Sept. 2, 1969. Records available: 1948-74. Measurements made by Wisconsin-Michigan Power Co.
36

MICHIGAN, CALHOUN COUNTY
463353088l44301--Continued.
Jan.
Feb.Apr.
May
3, 19733128
23031
7-297.417-586.206.747.02
Date
July 3, 197331
Aug. 31Oct. 1
31Nov. 30
Water level
7.637.257.267-517.677.35
Jan.
Feb.Apr.
May
2, 197431261
2931
7.627.667-837.916.486.76
Date
June 1974 July 31 Oct. 2
31 Dec. 3
7.167.066.517.636.50
435128083582401. Local artesian well in Saginaw Fc cased to 60 ft (18 m). Ls< (0.61 m) above Isd. Highe!
Pinconning Township
number 17N 4E 22DBDC. Pinconning Township. Second St. Drilled unused jrmation of Pennsylvanian age, diara 6 in (15 cm), depth 110 ft (34 m), 1 about 620 ft (189 m) above msl. MP top of recorder base, 2.00 ft it water level 0.57 ft (0.17 m) below Isd, Mar. 15, 1971; lowest 10.53 f , 1963. Records available: 1962-74. Water levels affected by regional
pumpingApr. 24
Day
Recording, 1.03; June
Jan Feb
415602084593701.artesiascreene2.50 ft24.1 ftnearby
Day
510152025Eora
n well in saa 73-113 ft(0.76 ra) ab(7.4 ra) bel
pumping.
Jan Feb
17-3 17-115.1 17-217.4 17.015.1 16.:16.8 14.917.4 16.3
gage rein4, 1.61.
Lowest
Mar
Local nund and gra(22-34 m).ove Isd.ow Isd, Au
Lowest
Mar
15.915.415.115.411.313.8
stall
water
Apr
mbervel o
LsdHighee- 7,
wat er
Apr
14.15.13.15.15.15-
ed May 1974.
level for th
May
Bra
City
6S 6W 22CABA.f Pleistoceneabout 970 ft
st water leve1964. Recor
May
7 H.51 15-51 15.75 13.21 15.82 15.2
Jan.
e day,
Jun
1.41
nch Co
8, 1973,
from re
Jul
2.43
2.48
unty
1.20; F
corder g
Aug
2.65
eb. 21, 1.
raph, 1974
Sep
1.84
14; Mar. 26, 1
Oct
1 6?
Nov
56.63
.14;
Dec
.45
.49
of Coldwater
Cityage,(296
1 9.6ds ava
Jun
14.512.915-716.116.312.5
of Coldwater.diara 6 im) aboveft (2.9liable:
Jul
16.416.714.517.217.317-1
n (15 eramsl. V
m) below1964-74
corder g
Aug
14.017.116.2
17-3
Drilled un), depth :P top of rIsd, Mar.
Water 1
raph, 1973
Sep
17.416.718.117.017.615.0
used13 ftecorc11,
evels
Oct
18.018.117-916.217.917-6
(test for(34 m),
er base,1974; lowaffected
Nov
17.716.1
17.917.117-8
PW 4)
estby
Dec
17.517-3
16.7
1974
510152025Eom
16.016.6 ....16.7
11.6 ........ 15-0
14.712.014.214.314.513-0 15-
13.015.117.516.313.3
2 17-5
18.117.015.817.615.914.0
16.219.019-319.720.120.2
17.515.919.719.615.916.7
19.920.015.920.120.019.9
16.220.119-915.917.018.8
18.815.118.818.919.015.7
19.219.617.519.516.218.8
Calhoun County
Pennfield Township
422422085071501. Local number IS 7W 10BBAB. Kenneth N. Sabin. Dug and driven stock water- table well in deposits of Pleistocene age; diam 1>& in (3.2 cm), previously reported 15 in (38 cm); depth 12 ft (4 ra); cased with steel pipe. Lsd 907.99 ft (276.76 m) above msl. MP top of 1^-in (3.2-cra) pipe driven into dug well, 1.50 ft (0.46 m) above Isd. Highest water level 0.89 ft (0.27 m) below Isd, Mar. 28, 1950; lowest dry, July 29, 1964. Records available: 1946-74.

GROUND-WATER LEVELS, 1973-7 1!, NORTHEASTERN STATES

Figu
re 7.
--Lo
cati
on of
observation
wells
in Mi
chig
an,
1973
-71!.

GROUND-WATER LEVELS, 1973-71, NORTHEASTERN STATES
1221122085071501 Continued.
Jan.
Feb.
Mar.
Apr.
May
June
Date
3, 1973101721307
112117
1121281
11182629
1623306
132027
Water level
3.623.113.122.983.093.123.273.3*3.113.103.212.902.792.822.763.203.103.153.103.012.502.332.602.682.802.90
July
Aug.
Sept.
Oct.
Nov.
Dec.
Jan.
Date
1, 19732518
152229
, 51219263
101721317
1121285
1219262, 19719
Water level
3.103.253.313.513.603.683-753.103.353.353.003.103.503.661.191.101.301.111.101.061.061.071.101.093-903.66
Jan.
Feb.
Mar.
Apr.
May
June
July
Date
16, 197123306
1320276
1320273
10172118
1522295
121925263
Water level
3.203.362.912.933.213.503.703.502.902.122.292.222.112.102.121.901.821.882.102.522.502.662.702.982.862.91
July
Aug.
Sept,
Oct.
Nov.
Dec .
Date
10, 19711721317
142128
. 411182529
1623306
1320281
111826
Water level
3.103.193.373.353.163.563.803.7*3.763.901.013.991.021.101.201.221.211.301.281.311.361.101.551.551.50
122025085081001. Local number IS 7W 32DABD. City of Battle Creek. Drilled unused artesian well in Marshall Formation of Mississippian age, diam 8 in (20 cm), depth 127 ft (39 m), cased to 103 ft (31 m). Lsd 830.79 ft (253.22 m) above msl. MP top of recorder base, 2.10 ft (0.61 m) above Isd. Highest water level 0.7 ft (0.2 m) below Isd, Apr. 26, 27, 1950; lowest 16.75 ft (5.11 m) below Isd, July 16, 1959- Records available: 1939-71. Water levels affected by nearby pumping. Measurements made by Water Dept.
Lowest water level for the day, from recorder graph, 1973
Day
5 10 15 20 25 Eom
Jan
7.00 5.10 5.65 6.10 5.80 7.25
Peb
6.50 6.15 7.20 7.35 6.90 7.25
Mar
7.20 6.10 6.65 5.60 5.20 5.00
Apr May Jun Jul
5.20 5.65 6.70 6.15 6.15 6.90 5-25 7.10 5.75 6.70 6.35 6.00 6.00 5.85 6.50 6.00 6.05 7-05 7.25 6.80 6.10 6.25 7.10 6.35
A
6 7 7 6 6 8
ug
.00
.20
.10
.60
.05
.50
Sep
7.80 6.70 7.10 6.50 5.90 5-95
Oct
5.80 6,10 6.05 5.30 5.75 5.10
Nov
5 5 5
5
.00
.00
.00
.55 75 .30
Dec
1.90 1.60 1.50 5.10 1.60 1.10
197*
10 15 20 25 Eom
1.35 1.30 1.15 1.50 3-50 3.80
1.00 3-30 3-85 1.35 3.50 3.15
111651085575601. L
bottom. Lsd Isd. Highest Nov, 1, 1961,
Jan Feb Mar Apr May Jun
Date
. 23, 1973
. 21
. 26
. 25 21
e 21
about 8*0 water le to Mar.
Water level
51.60 51.55 51.10 50.60 19.90 19.18
3.85 2.80 2.85 2.90 3.05 2.85
2.70 2.90 1.60 1.55 2.15 3.90 1.20 5.55 3.30 3.00 1.20 6.95 2.85 3.50 3.70 6.00 3-90 3.15 3-60 6.15 3.70 3.00 3.95 6.00
Cass County
Mason Township
ocal number 8S llW 17BAAA. Ted Little, e age, diam 28 in (71 cm), depth 55 ft ft (256 m) above msl. MP top of woode
vel 16.20 ft (11.08 m) below Isd, July 7, 1965. Records available: 19*5-71-
July Aug. Sept. Oct. Nov. Dec.
*' level
21, 1973 19.98 Jan. 23, 23 50.06 Feb. 25 21 50.60 Mar. 21 23 19-30 Apr. 25 22 50.68 May 25 26 51.00 June 21
5 5 6 6
6
D (17
16,
*
.50
.70
.95
.00
.70
.00
5.80 5.80 5.50 6.65 6.10 5.75
5.25 5.90 5.15 5.20 5.65 5.60
4
1 1 5
.05
.95
.00
.80
.85
.25
5.10 5.15 5.10 1.50 5.05 1.75
ug unused water-table well in m), cribbed with brick to open ell cover, 0.80 ft (0.21 m) above 1950; well dry, Mar. 10, 1917,
1971
Water level
51.08 51.05 52.20 50.70 50.10 50.00
July Aug. Sept Oct. Nov. Dec.
Date
24, 23 .20 22 25 26
1971
Water level
19.70 50.00 18.50 50.15 50.50 50.57
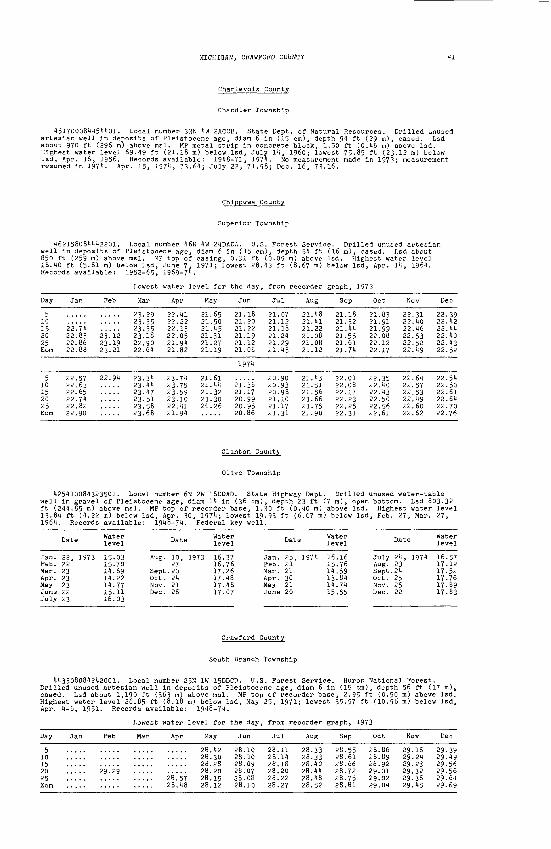
MICHIGAN, CRAWPORD COUNTY 4
Charlevolx County
Chandler Township
151700081151101. Local number 33M MW 2ACCB. State Dept. of Natural Resources. Drilled unused artesian well in deposits of Pleistocene age, diam 6 in (15 cm), depth 91 ft (29 m), cased. Lsd about 970 ft (296 m) above msl. MP metal strip in concrete block, 1.50 ft (0.16 m) above Isd. Highest water level 69.19 ft (21.18 m) below Isd, July 11, I960; lowest 75.85 ft (23.12 m) below Isd, Apr. 16, 1956. Records available: 1918-71, 1971. No measurement made in 1973; measurement resumed in 1971. Apr. 15, 1971, 73.61; July 22, 71.98; Dec. 16, 73.16.
Chippewa County
Superior Township
462158084142201. Local number 46N 4W 24DADA. U.S. Forest Service. Drilled unused artesian well in deposits of Pleistocene age, diam 6 in (15 cm), depth 51 ft (16 m), cased. Lsd about 850 ft (259 m) above msl. MP top of casing, 0.31 ft (0.09 m) above Isd. Highest water level 18.10 ft (5.61 m) below Isd, June 7, 1971; lowest 28.13 ft (8.67 m) below Isd, Apr. 11, 1961. Records available: 1952-65, 1969-71.
Lowest water level for the day, from recorder graph, 1973
Day
10 15 20 25 Eom
5 10 15 20 25 Eom
Jan
22.71 22.83 22.86 22.88
22.57 22.63 22.65 22.71 22.82 22.90
Feb
'23.12 23.19 23.21
22.94
Mar
23.35 23.35 23.18 22.90 22.64
23.31 23.11 23.17 23.51 23.58 23.68
Apr
22.22 22.13 22.05 21.91 21,82
23.71 23.75 23.59 23.10 22.11 21.94
May
21.50 21.45 21.31 21.27 21.19
21.61 21.41 21.32 21.30 2-1 . 26
Jun
21.20 21.22 21.19 21.12 21.06
1971
2l! 17 20.99 20.95 20.86
Jul
21.12 21.18 21.24 21.29 21.43
20.90 20.93 20.98 21.10 21.17 21.31
Aug
21.11 21.22 21.08 21.08 21.12
21.13 21.51 21.56 21.66 21.75 21.90
Sep
21.32 21.14 21.55 21.61 21.74
22.01 22.08 22.17 22.23 22.25 22.31
Oct
21.91 21.99 22.08 22.12 22.17
22.35 22.10 22.13 22.50 22.56 22.61
Nov
22.10 22.46 22.53 22.52 22.49
22.61 22.57 22.53 22.49 22.60 22.62
Dec
22.42 22.44 22.40 22.43 22.52
22.51 22.50 22.61 22.64 22.70 22.76
Clinton County
Olive Township
125110081323501. Local number 6N 2W 16DDAD. State Highway Dept. Drilled unused water-table well in gravel of Pleistocene age, diam 11 in (36 cm), depth 23 ft (7 m), open bottom. Lsd 803.32 ft (211.85 m) above msl. MP top of recorder base, 1.30 ft (0.10 m) above Isd. Highest water level 13.81 ft (4.22 m) below Isd, Apr. 30, 1971; lowest 19.93 ft (6.07 m) below Isd, Feb. 27, Mar. 27, 1961. Records available: 1918-71. Federal key well.
Water _ Water D Water _ Water level Date level Date level Date level
Jan. 22, 1973 15.03 Aug. 10, 1973 16.37 Jan. 25, 1971 16.16 July 21, 1971 16.57Feb. 22 15.70 27 16.76 Feb. 21 15.76 Aug. 23 17.12Mar. 23 11.69 Sept.20 17.26 Mar. 21 11.59 Sept.2l 17-52Apr. 23 11.22 Oct. 21 17.18 Apr. 30 13.81 Oct. 25 17.76May 23 11.77 Nov. 21 17.18 May 21 11.71 Nov. 25 17.89June 22 15.11 Dec. 26 17.07 June 20 15.55 Dec. 22 17.83July 23 16.03
Crawford County
South Branch Township
113308084242001. Local number 25N 1W 15DDCD. U.S. Forest Service. Huron National Forest. Drilled unused artesian well in deposits of Pleistocene age, diam 6 in (15 cm), depth 56 ft (17 m), cased. Lsd about 1,190 ft (363 m) above msl. MP top of recorder base, 2.95 ft (0.90 m) above Isd. Highest water level 26.85 ft (8.18 m) below Isd, May 25, 1971; lowest 35.97 ft (10.96 m) below Isd, Apr. 4-6, 1951. Records available: 1918-71.
Lov«est water level for
Day Jan Feb Mar Apr May
20 ..... 29.29
Eom ..... .....
..... 28.
..... 28.
..... 28.
28.18 28.
.42
.30
.28
.20
.15 1?
the day
Jun
28.10 28.10 28.09 28.07 28.08 28.10
, from recorder graph, 1973
Ji
28 28 28 28, 28 ?R
a.11 .14 .18 .20 .22 . ?7
Aug
28.33 28.33 28.10 28.44 28.18 28.52
Sep
28.55 28.61 28.66 28.72 28.75 28.81
Oct
28, 28, 28 29. 29, ?9
.86
.89
.92
.01
.02 ,04
Nov
29.16 29.21 29.23 29.32 29.36 29.15
Dec
29.39 29.19 29.56 29.56 29.61 29.69
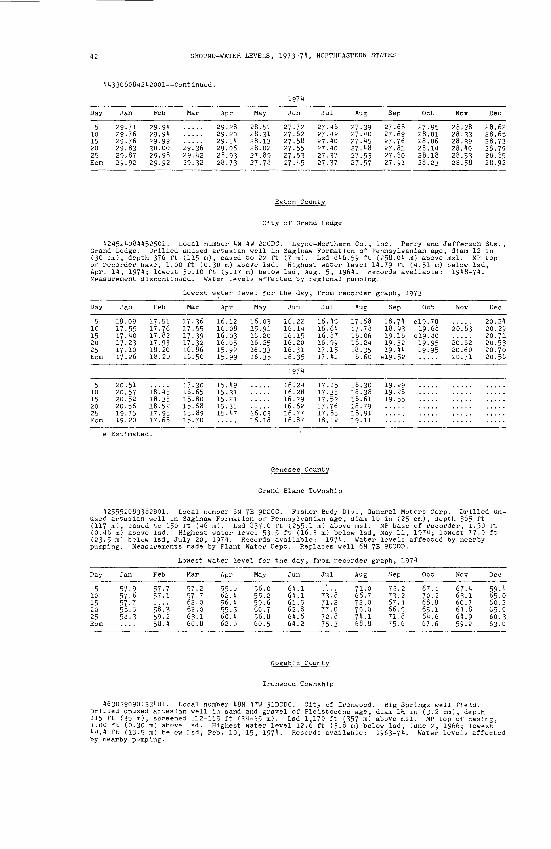
GROUND-WATER LEVELS, 1973-71, NORTHEASTERN STATES
113308081212001 Continued.
1971
Day
5 10 15 20 25 Eom
Jan
29.71 29.76 29.76 29.83 29.87 29.92
Feb
29.91 29.91 29-99 30.00 29.98 29.92
Mar
29.36 29.42 29.32
Apr
29.28 29.20 29-11 29.06 28.93 28.73
May
28.51 28.31 28.13 28.02 27.89 27.78
Jun
27.72 27.62 27.58 27-55 27.53 27.15
Jul
27.46 27-42 27.40 27.10 27.37 27-37
Aug
27.39 27.40 27-45 27.48 27.53 27.57
Sep
27.68 27.69 27.76 27.81 27.80 27.91
Oct
27.95 28.01 28.06 28.14 28.18 28.23
Nov
28.28 28.33 28.39 28.40 28.53 28.58
Dec
28.62 28.65 28.73 28.79 28.85 28.92
Eaton County
City of Grand Ledge
424524084452501. Local number IN 4W 2CCDC. Layne-Northern Co., Inc. Perry and Jefferson Sts. Brand Ledge. Drilled unused artesian well in Saglnaw Formation of Pennsylvanian age, dlam 12 In (30 cm), depth 376 ft (115 m), cased to 22 ft (7 m). Lsd 846.59 ft (258.01 m) above msl. MP top of recorder base, 1.00 ft (0.30 m) above Isd. Highest water level 14.79 ft (4.51 m) below Isd, Apr. 14, 1974; lowest 30.10 ft (9-17 m) below Isd, Aug. 5, 1961. Records available: 1918-71. Measurement discontinued. Water levels affected by regional pumping.
Day
510152025Eom
Jan
18.17.17-17.17-17.
095540231026
Feb
17.17.17-17.18.18.
517682932020
Lov
Mar
17.17.17-17.16.16.
365539,3?8650
waU:r le
Apr
16,16.16.16.15.15.
.12,08.03.05.9?.99
;vel for the day, from recorder
May
16.0315.9116.2016.2516.3316.35
Jun
16.2216.1416.1516.2016.3116.35
Jul
16.16.16.16.17-17-
456487991541
Al
17.17.18.18.18.18,
»g
,68.78,06, ?4,35.60
graph, 1973
Se
18.18.19.19.19.
e!9.
:p Oct
74 e!9.70,93 19-68,18 eig.80.32 19-95.44 19.95.52 .....
Nov Dec
..... 20.2420.63 20.29..... 20.7120.62 20.5320.60 20.7020.71 20.56
1974
e Esti
56
mat
18.
17.
ed.
45
fiR
16. 658n
89
15 .49
16.18
Gra
16.87
Genesee
nd Blanc
18.
County
7685
18.,3R61
19 2928 .....
Township
425552083382801. Local number 6N 7E 9DCCC. Fisher Body Dlv., General Motors Corp. Drilled un used artesian well In Saglnaw Formation of Pennsylvanian age, dlam 10 In (25 cm), depth 385 ft (117 m), cased to 150 ft (46 m). Lsd 837.0 ft (255-1 m) above msl. MP base of recorder, 1.50 ft (0.46 m) above Isd. Highest water level 53-5 ft (16.3 m) below Isd, May 11, 1974; lowest 77.0 ft (23-5 m) below Isd, July 20, 1974. Records available: 1974. Water levels affected by nearby pumping. Measurements made by Plant Water Dept. Replaces well 6N 7E 9DCDD.
Lowest water level for the day, from re
Day
510 15 20 25 Eom
Jan
57.9 57-6 57-7 58.5 58.3
Feb
57-7 57.1
58^3 59.2 58.4
Mar
57.2 57-7 62.0 62.0 63.1 60.8
Apr
55.0 62.4 56.1 55-5 60.1 62.0
May
56.0 55.2 59.6 60.7 56.8 60.5
Jun
61.1 61.1 61.5 62.8 64.6 64.2
Jul
73 '.S 71.2 77-0 72.8 75-3
Aug
71.0 66.7 72.070.0 74.1 68.8
Sep
72.2 73.2 67.4 66.9 71.8 75.6
Oct
67.1 70.2 68.8 65.1 64.6 67.6
Nov
67.4 63.1 60.7 64.8 64.9 59.2
Dec
59.4 65.0 60.2 65.0 60.3 63.0
Gogeble County
Ironwood Township
463029090133401. Local number 48N 47W 31DCDC. City of Ironwood. Drilled unused artesian well In sand and gravel of Pleistocene age, 115 ft (35 m), screened 112-115 ft (34-35 m). Lsd 1,170 ft (357 m) ab 1.00 ft Co.^o ml ' ' ' ' ' ' 44 by nearby pumping.
Big Springs well field. 1»5 In (3.2 cm), depth
MP top.5 ft (35 m), screened 112-115 ft (34-35 m). Lsd 1,170 ft (357 m) above msl. MP top of casing, 00 ft (0.30 m) above Isd. Highest water level 12.6 ft (3.8 m) below Isd, June 2, 1966; lowest .4 ft (13.5 m) below Isd, Feb. 10, 15, 19/1. Records available: 1963-74. Water levels affected nearby pumping.

MICHIGAN, INGHAM COUNTY
463029090133t01--Continued.
Day
15 20
5 10 15 20 25 Eom
Jan
34.1 32.7 33.8 33.3 34.6 34.1
Feb
35.344.4 44.4 34.2 40.0 34.2
Mar
21.9 20.8
34.8 35.6 35.8 35-6 34.8 33.5
Apr
18.7
19.3 19-1
32.1 32.5 30.2 21.1 21.6 20.5
May
19.7
20.5 20.7 19.7 20.521.2 19.3
Jun
20.0
1971
20.8 19-5 17.9 17.8 18.0 18.1
Jul
18.2
2CK8 20.1 20.920.2
Aug
20.6 22.0
20.7 20.0 20.1 20.0 19-3
raph, 19
Sep
19.8
23.3 22.9 23.5
20.0 21.2 19.9 21.9 23.8 22.5
73
Oet
21.9 25.9 26.2
22.1 23.1 22.7 20.3 20.5 20.9
Nov
29.1 28.1 28.628.1
20.9 21.3
Dee
28.828.129.8 30.6
21.0 20.1 20.1 20.6 20.720.7
Grand Traverse County
Blalr Township
113712085375001. Local number 26N 11W 27CBAD. State Dept. of Natural Resources. Formerly State Dept. of Conservation. Jetted observation water-table well In deposits of Pleistocene age, diam 2 in (5.1 cm), depth 11 ft (1 m), open bottom. Lsd 911.25 ft (278.66 m) above msl. MP top c pipe, 0.10 ft (0.12 m) above Isd. Highest water level 1.12 ft (0.31 m) below Isd, Apr. 17, 1962; lowest 4.02 ft (1.23 m) below Isd, Aug. 18, 1936. Records available: 1935-37, 1911-11, 1948-73. Measurement discontinued. Apr. 23, 1973, 1.80; July 11, 2.12; Oet. 10, 2.74; Dec. 20, 2.55.
Gratlot County
City of Alma
132319081381701. Local number 12N 3W 35BCBC. Reed Excavating Co. Bridge Ave. and Washington St., Alma. Dug unused water-table well in deposits of Pleistocene age, diam 36 in (91 era), depth 20 ft (6 m), open bottom. Lsd 738.78 ft (225.18 m) above msl. MP top of wooden pumpbase, 0.20 ft (0.06 m) above Isd. Highest water level 12.66 ft (3-86 m) below Isd, Apr. 27, 1967; lowest 17.92 ft (5.46 m) below Isd, Feb. 27, 1963. Records available: 1950-74. Measurement discontinued.
Date level
Jan. 22, 1973 14.54 June 22, 1973 16.58 Nov. 2, 1973 17.20 Mar. 29, 1974 14.90Feb. 22 15.53 July 23 15.64 30 16.76 May 28 15.15Mar. 23 14.50 Aug. 10 16.98 Jan. 4, 1974 17.20 June 26 15-79Apr. 23 15.12 Sept. 7 17.40 31 15.72 July 23 16.57May 23 15-79 Oct. 9 17-52 Mar. 2 15.56 Aug. 23 17.09
Bethany Township
432608084355401. Local number 12N 2W 18BAAB. Michigan Chemical Co. Riverside Dr. Drilled un used artesian well in Marshall Formation of Mississippian age, diam 5 in (13 cm), depth 1,261 ft (384 m), eased to 1,096 ft (334 m). Lsd about 720 ft (219 m) above msl. MP top of platform, 0.30 ft (0.09 m) above Isd. Highest water level 96.79 ft (29.50 m) below Isd, July 24, 1974; lowest 267.6 ft (81.6 m) below Isd, Aug. 30, 1957- Records available: 1957-74. Measurement dis continued. Water levels recovering as the result of the discontinuance of pumping and possibly from the effects of injection wells.
Jan. 22, 1973 100.91 June 22, 1973 99.60 Nov. 2, 1973 98.45 Mar. 29, 1974 97-31Feb. 22 100-91 July 23 99.54 30 98.36 Apr. 30 97-20Mar. 23 100.82 Aug. 10 99.16 Jan. 4, 1974 98.24 May 28 97-13Apr. 23 100.10 Sept. 7 99.13 31 97.60 June 26 96.96May 23 99.74 Oet. 9 98.90 Mar. 2 97.44 July 24 96.79
Ingham County
City of Lansing
424502084331301. Local number 4N 2W 9BDAD. City of Lansing. North Grand River Ave. and Josephine St., Lansing. Drilled unused artesian well in Saginaw Formation of Pennsylvanian age, diam 14 in (36 em), depth 395 ft (120 m), eased to 49 ft (15 m). Lsd 828.81 ft (252.62 m) above msl. MP top of plywood recorder base, 10.20 ft (3.11 m) below Isd. Highest water level 15-63 ft (4.76 m) below Isd, Mar. 26, 1931; lowest 179.4 ft (54.7 m) below Isd, Apr. 29, 1968. Records available: 1919, 1929-74. Water levels affected by regional pumping.

GROUND-WATER LEVELS, 1973-71, NORTHEASTERN STATES
424502084331301 Continued.
Lowest water level for the day, from recorder graph, 1973
Day
5 10 15 20 25 Eom
5
20 25 Eom
Jan
129.0 128.1 127.7 127.1 126.5 126.0
123.9
123.7 123.8 123.5
Peb
125.6 125.1 124.6 121.0 123.9 123.5
123-6
122.8 122.9 122.2
Mar
122.8 122.5 121.5 121.5 120.9 120.5
122.0
121.6 121.6 120. 4
Apr
119-9 119.8 120.1 121.6 122.1 122.1
120.4
119.7 119-5 118.9
May
123.0 122.9 123.9 124.1 121.3 121.7
118.6
117-7 117-1 116.3
Jun
125.5 126.0 128.2 129.6 130.7 131.4
1974
116.4
116.2 116.6 117.2
Jul
131.6 131.9 132.2 133.6 134.1 134.4
118.7
Aug
134.7 135.6 135.4 135.0 134.6 136.8
121.1 121.6 121.5
Sep
137.5 137.3 136.9 136.7 136.0 134.1
122.8
121.1 120.5 120.6
Oct
132.7 130.9 130.0 129.8 129-2 127-9
120.5
120.2 119-9 119.5
Nov
128!4 127.6 128.1
118.7
117.3 118.2 118.0
Dec
126.8 126.5 126.7 126.0 124.0 122.9
117-9
117-5117.3 117.3 117-3
City of Mason
423500084263601. Local number 2N 1W 5DDAD. City of Mason. Jefferson Ave. and Okemos St., Mason. Drilled unused artesian well in Saginaw Formation of Pennsylvanian age, diam 6 in (15 cm), depth 150 ft (46 m) , cased. Lsd about 890 ft (271 m) above msl. MP top of casing, 1.00 ft (0.30 m) above Isd. Highest water level 0.08 ft (0.02 m) below Isd, June 29, 1949; lowest 10.67 ft (3.25 m) below Isd, Aug. 1, 1961. Records available: 1948-71. Measurement discontinued. Water levels affected by regional pumping. Measurements made by Water Dept.
Date
Jan. 23, 1973Feb. 23Mar. 26Apr. 26May 24
Water level
5.19 5.81 3-29 4.89 5.96
Date
June 25, 1973 July 25 Aug. 24 Sept.21 Oct. 19
Water level
5.577.778.098.738.40
Date Date Water level
Nov. 19, 1973 7-24Dec. 26 4.56Jan. 22, 1974 5-79Feb. 22 5.59Mar. 25 4.50
Date
Apr. 24, 1974 May 21 June 20 July 19 Aug. 16
Water level
5.155.507.007.078.74
Stambaugh Township
460455088412901. Local number 43N 35W 33BDAD. State Highway Dept. Driven unused water-table well in sand and gravel of Pleistocene age, diam 1% in (3.2 cm), depth 12 ft (4 m), screened 9-12 ft (3-4 m). Lsd about 1,520 ft (463 m) above msl. MP top of casing, 2.05 ft (0.62 m) above Isd. Highest water level 1.66 ft (0.51 m) below Isd, June 1, 1973; lowest 8.44 ft (2.57 m) below Isd, Mar. 15, 1949. Records available: 1948-74. Measurement made by Wisconsin-Michigan Power Co.
Jan. Feb. Mar. Apr. May
4, 1973 3.123.443.882.391.831.66
JulyAug.
Oct.Nov.Dec.
2, 19731
30263
2.352.863.423.834.094.24
Dec. Feb.
Apr
31, 19731, 1974
254
303
4.574.905.135.304.403.93
July 1974 Aug. 1 Oct. 1 Nov. 1 Dec. 2
4.03 4.57 5.00 5-15 5.06
Kalaraazoo County
City of Kalamazoo
421641085350601. Local number 2S 11W 22CDBB. City of Kalamazoo. Stockbridge Ave. Drilled un used water-table well in deposits of Pleistocene age, diam 4 in (10 cm), depth 137 ft (42 m), screened 134-137 ft (41-42 m). Lsd 764.7 ft (233.1 m) above msl. MP top of casing, 2.00 ft (0.6l m) above Isd. Highest water level 5.22 ft (1.59 m) below Isd, Nov. 11, 1974; lowest 31.08 ft (9.47 m) below Isd, Aug. 19, 1961. Records available: 1960-74. Water levels affected by nearby pumping.
Day
5 10 15 20 25 Eom
Jan
9-50 8.43 8.82 9.20 9-75 9.65
Feb
8.86 9-30 9-05 8.84 9.05 8.95
Mar
8.82 8.00 9-70
8.50
Apr
8.51 9.30 8.60 9-90 9.45 8.41
May
8.82 9.28 9.25 9.. 20 9.46 9.25
the day,
Jun
10.25 10.28 11.90 12.27 11.98 11.50
Jul
11-58 12.23 12.52 12.90 12.74 13.35
Aug
13.21 14.00 13-50 13.92 13.43
graph, 1<
Sep
e!5.03 el5-33
>73
Oct
12.34 12.05 12.05 11.92 11.86 11.17
Nov
10.68 10.31 9.91 9-75 9.00 9.50
Dec
8.70 8.64 7-70 8.05 6.96 6.74
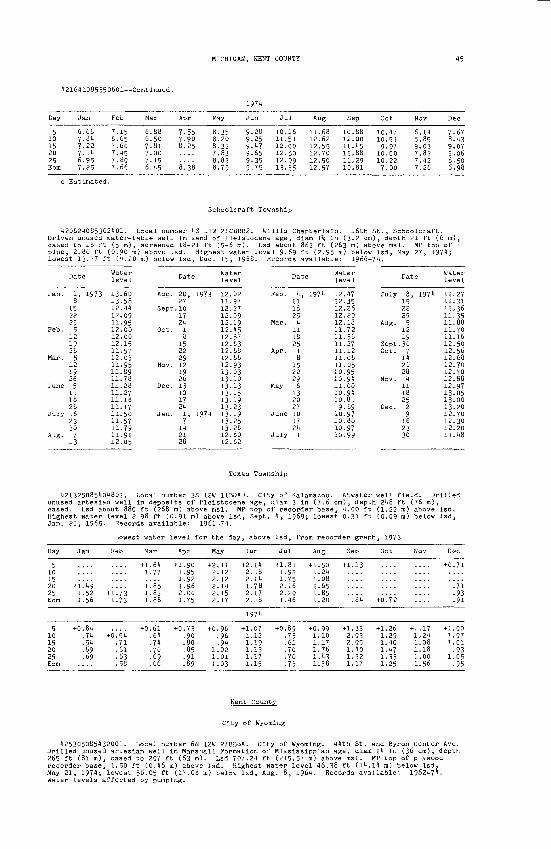
MICHIGAN, KENT COUNTY
121611085 350601 Continued.
1971
Day
510152025Bora
Jan
6.667.8H7.227.116.957.25
e Estimated,
Feb
7.156.657.607.157.807.66
120621085362101.
Mar Apr
6.88 7.556.50 7-907.81 8.257.00 ....7.15 ....6.15 8.38
Local number IS
May
8.358.208.337.838.838.79
Jun
9.289-259.179-659-359.75
Schoolcraft T
11W 21CBBB2.
Jul
10.1611.5112.0012.5012.0913.35
ownship
Wlllis Cham
Aug
11.6812.6212.5512.7012.5012.57
Sep
10.8812.0011.1511.8811.2910.81
Oct
in,10,0,
10,10,7
,17,51.07.00.22.00
Nov
6.115.859.037.827.127.26
Dec
7.678.139.079.068.506.98
Driven unused water-table well in sand of Pleistocene age, dlam l*s In (3.2 cm), depth 21 ft (6 m), cased to 18 ft (5 m), screened 18-21 ft (5-6 m). Lsd about 863 ft (263 m) above msl. MP top of pipe, 2.80 ft (0.90 m) above Isd. Highest water level 9.69 ft (2.95 m) below isd, May 27, 1971; lowest 13-77 ft (1.20 m) below Isd, Dec. 15, 1968. Records available: 1966-71.
Jan.
Feb.
Mar.
June
July
Aug.
Date
1, 19738
1522295
1219265
1219265
1118261623307
13
Wa le
13131212111212121112111111111111111111111112
ter vel
.60 58.11.09 95.00.00.15 57.03 95.89.78.28.27.18.17 50 57.79 91.05
Aug.
Sept
Oct.
Nov.
Dec.
Jan.
Date
20, 197327.10172118
152229121926131017211, 19717
112128
Wale
12111212121212121212121313131313131313131212
tervel
.02 97.27.09.19.15.57.63.68.66 93.03.10.13.15.19.23.19.25.26.80.62
Feb.
Mar.
Apr.
May
June
July
Date
1, 1971111825
it11182518
1522296
1320271017211
Water level
12,12.12,12,12,1111,1111.11.11,10,10,11,10,10,9,
10,10,10,10.
.17,35.26.20.18.72.36.27.12.06.05,95,91,00,91,81,69.97,80.97.99
July
Aug.
SeptOct.
Nov.
Dec.
Date
8, 19711522295
1219.30
7112128
1|11182529
162330
Wa le
111111111111111212121212121213131312121211
ter vel
.27 31.36 35.88 70.16.50.56.68-70.70.88.97.05.00.20 70.30.20.18
Texas Township
i|21325085lOl801. Local number 33 12W 11BDAD. City of Kalamazoo. Atwater well field. Drilled unused artesian well in deposits of Pleistocene age, diam 3 in (7.6 cm), depth 218 ft (76 m), cased. Lsd about 880 ft (268 m) above msl. MP top of recorder base, 1.00 ft (1.22 m) above Isd. Highest water level 2.98 ft (0.91 m) above Isd, Sept. 1, 1969; lowest 0.31 ft (0.09 m) below Isd, Jan. 21, 1965. Records available: 1961-71.
Lowest water level for the day, above Isd, from recorder graph, 1973
Day
5
Eom
Jan
1.56
Feb
1.73
Mar
+1.61
1.85
1.88
Apr
+1.90
1.96
1.75
May
+2.11
2.17
Jun Ji
+2.11 +1.
2.18 1.
a,81 92
,16
Aug
+ 1.50
1.651 flc
1.20
Sep
+1.13
.81
Oct
+0.72
Nov Dec
.... +0,71
.... .91
19715
10152025Eom
+0.81.71.51.69.69
+0.51.71.61.63.58
+0.61.61.71.70.69.66
+0.73.90.80.85.91.89
+0.96.96-91
1.021.011.03
+1.07 +0.1.121.191.131.171.15
8073ft]707073
+0.991.101-171.761.131.38
+1.332.032.051.101.321.17
+1.261.291.101.171.331.25
+1.17 +1.001.21 1,071.08 1.011.18 .931.00 1,051.56 .95
Kent County
City of Wyoming
125305085132001. Local number 6N 12W 27BBBA. City of Wyoming. 11th St. and Byron Center Ave. Drilled unused artesian well In Marshall Formation of Mississippian age, diam 11 in (36 cm), depth 265 ft (8l m), cased to 207 ft (63 m). Lsd 707.21 ft (215.57 m) above msl. MP top of plywood recorder base, 1.50 ft (0.16 m) above Isd. Highest water level 16.38 ft (11.11 m) below Isd, May 21, 1971; lowest 56.05 ft (17.08 m) below Isd, Aug. 8, 1961. Records available: 1962-71. Water levels affected by pumping.
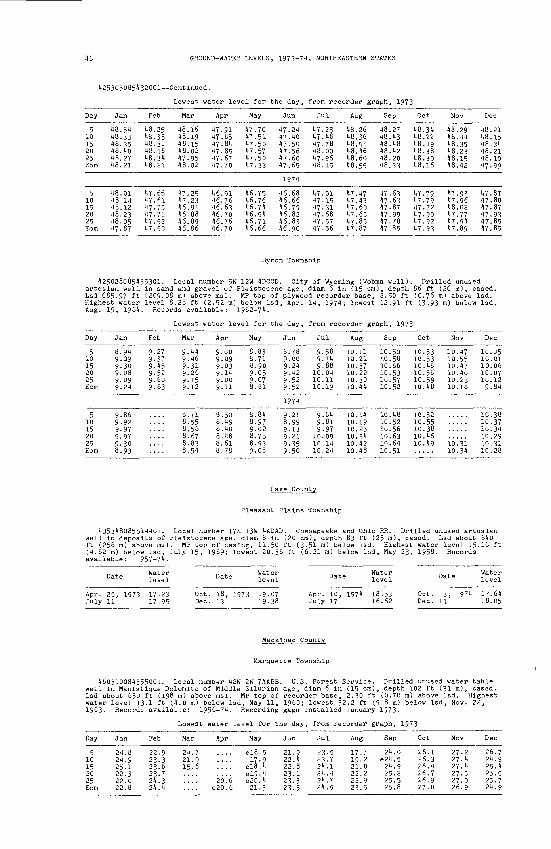
GROUND-WATER LEVELS, 1973-7*, NORTHEASTERN STATES
125305085132001 Continued.
Day
5 10 15 20 25
Jan
18.51 18.33 18.35 18.10 18.27 18.21
Feb
18.25 18.33 18.31 18.16 18.31 18.21
Lowest v
Mar
18.16 18.19 18.15 18.02 17.95 18.02
fater let
Apr
17.91 17.85 17.81 17.85 17.67 17.70
rel for the day,
May
17-70 17.51 17-50 17.57 17.50 17-33
Jun
17.21 17.10 17.50 17-56 17.60 17.65
from recorder gi
Jul
17.23 17.18 17.78 18.00 17-96 18.15
Aug
18.26 18.36 18.51 18.16 18.60 18.55
?aph, 1973
Sep
18.27 18.13 18.18 18.12 18.20 18.33
Oct
18.31 18.22 18.19 18.38 18.30 18.16
Nov
18.29 18.11 18.35 18.23 18.15 18.12
Dec
18.21 18.15 18.31 18.21 18.10 17-99
1971
5 10 15 20 25
18.01 18.11 18.12 18.23 18.05 17.87
17.66 17.61 17-75 17-71 17.52 17-50
17.25 17-23 16.91 16.88 16.89 16.86
16.91 16.76 16.63 16.70 16.76 16.70
16.75 16.76 16.71 16.51 16.71 16.66
16.68 16.66 16.79 16.82 16.83 16.90
17.01 17.15 17.31 17.68 17.57 17.56
17.17 17.13 17.60 17.65 17-85 17.87
17.63 17-63 17.87 17.99 17.78 17.85
17.79 17.79 17.72 17.90 17.92 17-93
17.93 17-96 18.02 17-77 17.91 17.89
17.87 17.80 17.87 17.93 17.85 17.85
Byron Township
Day
510 15 20 25 Eom
Jan
8.91 9.09 9.30 9.08 9.09 9.21
Feb
9.27 9-37 9.15 9-52 9.60 9.63
Lowest w
Mar
9.11 9.16 9.31 9.26 9-15 9.12
ater lev
Apr
9.00 9-09 9-039.11 9.00 9.11
el for the day,
May
8.83 8.71 8.90 9-05 9-07 8.81
Jun
8.78 9.00 9.21 9.12 9.52 9.52
from re<
Jul
9.58 9.71 9.88
10.01 10.11 10.19
:order gi
Aug
10.11 10.21 10.37 10.22 10.30 10.11
aph, 1973
Sep
10.50 10.58 10.66 10.53 10.57 10.52
Oct
10.53 10.53 10.16 10.56 10.59 10.18
Nov
10.17 10.55 10.17 10.10 10.23 10.18
Dec
10.05 10.01 10.06 10.07 10.12 9.81
1971
5 10 15 20 25
9.86 9.92 9-97 9.97 9-30 8.93
8.71 8.55 8.56 8.67 8.83 8.51
8.50 8.19 8.10 8.18 8.61 8.78
8.81 8.97 9.02 8.75 8.93 9.08
9.21 8.99 9-13 9.21 9.35 9-50
9.61 9.81 9.97
10.09 10.11 10.21
10.11 10.19 10.25 10.31 10.12 10.18
10.18 10.52 10.56 10.63 10.61 10.51
10.52 10.55 10.38 10.16 10.19 ioisi
10.31
10.38 10.37 10.31 10.29 10.31 10.28
Pleasant Plains Township
135318085511101. Local number 17N 13W lADAD. Chesapeake and Ohio RR. Drilled unused artesian well In deposits of Pleistocene age, dlam 8 In (20 cm), depth 83 ft (25 m), cased. Lsd about 810 ft (256 m) above msl. MP top of casing, 11.50 ft (3.51 m) below Isd. Highest water level 15.16 ft (1.62 m) below Isd, July 15, 1969; lowest 20.36 ft (6.21 m) below Isd, May 23, 1958. Records available: 1957-71-
Date Wate leve
Apr. 25, 1973 July 11
17.2317.95
Date
Oct. 18, 1973 Dec. 13
19.0719.38
Date Water Date Water level
Apr. 10, 1971 July 17
18.5316.62
Oct. 3, 1971De 11
17.6118.05
Macklnac County
Marquette Township
160310081355001. Local number 12N 2W 7AABB. U.S. Forest Service. Drilled unused water-table well In Manlstlque Dolomite of Middle Silurian age, dlam 6 In (15 cm), depth 102 ft (31 m), cased. Lsd about 650 ft (198 m) above msl. MP top of recorder base, 2.30 ft (0.70 m) above Isd. Highest water level 13.1 ft (1.0 m) below Isd, May 11, I960; lowest 32.2 ft (9.8 m) below Isd, Nov. 22, 1963. Records available: 1956-71. Recording gage Installed January 1973.
Lowest water level for the day, from recorder graph, 1973
Day
5 10 15 20 25 Eom
Jan
21.8 21.9 25.1 22.3 22.0 22.8
Feb
22.9 23-3 23.6 23.7 21.3 21.1
Mar
21.7 21.0 15.6
Apr May
.... elB.5
.... 17 . 9
.... elB.lt
.... e!9.1 20.6 eSO.1
e20.6 21.3
Jun
21.9 22.1 22.8 23.1 23.3 23.5
Jul
23.5 23.7 21.1 21.1 21.7 21.9
Aug
17.7 19-2 21.0 22.2 22.9 23.5
Sep
21.0 e21.5 21.9 25.2 25.5 25.8
Oct
26.1 26.3 26.1 26.7 26.9 27.0
Nov
27.2 27.1 27.1 27-5 27.0 26.9
Dec
26.7 21.9 25.1 25.5 25.7 21.9

1(60310081(355001 Continued.
MICHIGAN, ROSCOMMON COUNTY
1974
Day
510152025Eom
e
Jan
25.125.325-525-725-925-7
Estimated
Peb
25-725-726.026.126.326. n
Mar
26.12n.724.724.925.225-3
Apr
24.322.314.715-717.518.8
May
19.820.520.721.021.522.1
Jun
22.521.220.021.222.322.9
Marquette
Ely Town
Jul Aug
22.1 ....22.7 ....23.7 ....24.324.8 ....
County
ship
Sep
27-527-526.526.726. n26.3
Oct
26. n26.126.125-925.825.8
Nov
23.123.722.622.821. n21.7
Dec
22.523.023. n23-62n.o24.2
462936087475901. Local number 47N 28W 3CCDC. Ely Township. Drilled unused artesian well in sand and gravel of Pleistocene age, diam 8 in (20 cm), depth 72 ft (22 m), screened 68-72 ft (21-22 m). Lsd 1,571-99 ft (479-14 m) above msl. MP top of recorder base, 3-00 ft (0.91 m) above Isd. Highest water level 9-74 ft (2.97 m) below Isd, May 13, 1974; lowest 19-26 ft (5.87 m) below Isd, Apr. 10, 11, 1964. Records available: 1961-74.
Lowest wate 2! for the day, from recorder graph, 1973
Day
5 10 15 20 25 Eom
Jan
14.23 14.36 14.46 14.56 14.69 14.83
Peb
14.94 15.02 15.12 15.24 15.34 15.40
Mar
15-45 15- 54 15.56 15.63 15.71 15.82
Apr
15.91 15-99 15.47 14.58 13.77 13.64
May
13.65 13.68 13.67 13.68 13.64 13.66
Jun
1974
13.66 13.73 13.76 13-18 13.13 13.16
Jul
13. in13-24 13.37 13.49 13.61 13.81
Aug
13-71 13.68 13-80 13.86 13.93 14.07
Sep
14.20 14.28 14.26in. 31 in. 3511.11
Oct
14.45 14.38 14.41 14.53 14.59 14.67
Nov
14.44 11.31 14.05 13.93 14.09 14.17
Dec
14.16
14.21 14.29 14.38 14.50 14.62 14.80
Presque Isle County
Allis Township
451307084131901. Local number 33N 2E 30DACB. State Dept. of Natural Resources. Jetted obser vation water-table well in deposits of Pleistocene age, diam 2 in (5.1 cm), depth 11 ft (4 m), open bottom. Lsd about 800 ft (213 m) above msl. MP top of casing, 1.20 ft (0.37 m) above Isd. High est water level 0.61 ft (0.19 m) below Isd, July 12, I960; lowest 5.69 ft (1.73 m) below Isd, Jan. 27, 1956. Records available: 1934-44, 1948-71.
Date
Apr. 24, 1973 July 17
Water
2.562.78
Date
Oct. 10, 1973 Dec. 13
Water level
3.053.21
Apr. 16, 1974 July 23
" Date
Oct. 7, 1974 Dec. 16
Water level
2.943.73
Roscommon County
Higgins Township
442756084350801. Local number 24N 2W 20BABA. State Dept. of Natural Resources. Jetted obser vation water-table well in sand of Pleistocene age, diam 8 in (20 cm), depth 14 ft (4 m), open bottom. Lsd 1,145.30 ft (349.09 m) above msl. MP top of 8-in (20-cm) pipe, 2.50 ft (0.76 m) above Isd. Highest water level 2.30 ft (0.70 m) below Isd, Apr. 23, 1971; lowest 6.23 ft (1.90 m) below Isd, Dec. 6-11, 1949. Records available: 1934-74. Federal key well.
Lowest water level for the day, from recorder graph, 1973
Day Jan
5 .... 10 .... 15 .... 20 .... 25 .... Eom 3.79
Peb
3.76 3.77 3.81 3.88 3.96 3-99
Mar
3.90 3.62 3.38 3.27 3.28 3.32
Apr
3.28 3.30
I'.ls3.46
May
3^60 3.66 3.72 2.98
Jun
3.00 3-03 3.15 3.24 3-38 3.41
Jul
3.53 3.67 3-78 3.90 4.03 4.08
Aug
4.07 4.14 4.22 4.32 4.39 4.51
Sep
4.57 4.65 4.73 4.78 4.60
n.71
Oct
1.71 1.71 4.71 4.69 4.71 4.70
Nov
4.65 4.65 4.67 4.68
4^60
Dec
4.58 4.43 4.39 4.37 4.39 4.39

GROUND-WATER LEVELS, 1973-74, NORTHEASTERN STATES
442756084350801 Continued.
Day
510152025Eom
Jan
4.424.474.534.594.494.14
Peb
4.114.144.214.264.324.34
432508082554501.wel 1 in lower53 ft (16 m).1.00 ft (0.30 25.64 ft (7.82
Jan
Peb
Mar
Apr
Date
. 3, 197310172431
. 7142128
. 7142128
. 4
part of
Ma
4.3.3.3-3.4.
r
129591929702
Local numbthe
Lsd aboutMarsh
Apr
3.743.603.263.063.093.14
May Jun Jul
3.22 3.36 2.913.29 3.27 2.703.23 3.15 2.883.12 2.95 3.083.14 3.09 3.203.24 3.24 3.37
Sanilac County
Moore Township
Aug Sep
3.46 4.023.55 4.103.66 4.173.78 4.233.91 4.283.95 4.29
Oct
4.284.284.314.344.394.43
er 12N 13E 33DDDD. State Highway Dept. Drilled unusall Form
800 ft (244 m)ation, diam 3 in (7.6above msl. MP top of
m) below Isd, Jan. 6, 1965. Records available
Water level
20.0018.7718.8818.7018.5018.5218.2018.3618.7018.2417-7917.0017.0017.20
Apr.
May
June
July
Aug.
Date
11, 19731829
306
1320274
11181
15
lev^ Dat
17.00 Aug. 22,17.00 2917.23 Sept. 617.20 1217.58 1917.00 2617.10 Oct. 517.50 1017.60 1717.50 2417.90 Nov. 117.29 7
el7-74 2818.23 Dec. 19
cm), depth 150Ut-ln (3.2-cm)
71 m) below Isd : 1948-74.
Water level
1973 19-4019.7920.3720.2420.4021.0021.0621.2621.3721.56
e21.8021.8621.8020.98
ft (46 med)
pipe exte, Apr. 25,
Dec.Jan.Feb.Mar.Apr.MayJuneJulyAug.Sept.Oct.Nov.Dec.
Da
262327271029192425
31135
Nov
4.464.504.524.554.564.58
Dec
4.594.624.644.684.704.73
artesiancased
nsion,1951;
te
, 1973, 1974
to
lowest
Water level
20.5718.2018.1017.2016.9417.2017.8819-5419.8120.9222.4522.5622.99
e Estimated.
461720085565201.artaboisdIsd
Day
510152025
esian wellut 65 ft (2. Highest, Oct. 23,
Jan
5.395.335.345.325.27
Eom 5.29
in lime:0 m).water 11963.
Feb
5-275.325-345.345-315-34
Schoolcraft County
Oermfask Township
Local number 45N 13W 16CCCB. U.S. PishstonLsdevelReco
Ma
5.5-5-5.5.5.
.es ofabout4.64
rds av
.r
322930103539
Ordovici710 ft (ft (1.41ailable:
Apr
5. 415.385.45
an age, diam 4 in (10216 m) above msl. MPm) below Isd, Apr. 131952-74.
May Jun Jul
5-31 5.42 5.435.26 5.40 5.495.40 5.44 5-505.41 5.45 5.555.44 5.44 ....5.40 5.44 5.61
and Wildlife Service.cm), depth 151top of casing,, 1971; lowest
ft (46 m3.60 ft6.50 ft
Drilled) ,(1(1
cased.10 m).98 m)
unusedtobelowbelow
Aug Sep
5.54 ....5.57 ....5.64 5 . 875.65 5.905-68 5.855.71 5.80
t j
Oct
5.815.805-705-715.665.67
Nov
5.665.665.605.615.535.59
Dec
5.535.625-615.605-53
1974
510152025Eon
5.535.535-505.505.46
i 5.45
5-475.415.475.425.405-37
5.5.5.5.5-5.
313734384037
5-275.315.175.355.445.52
5.50 .... 5.455.42 5.29 5.505.43 5-39 5.605.46 5.42 5.625.50 5.53 5-655.42 5.52 5.69
5.63 5.655.69 5.635.69 5.555.60 5.515.57 5-495-57 5-54
5.575-585.555.605.575.55
5.475.515.415.425.415.44
5.425.375.415-375.375.4l
Washtenaw County
York Township
420901083430401. Local number 4S 6E 10BCCC. Ypsllantl State Hospital. Drilled unused artesian well in gravel of Pleistocene age, diam 6 in (15 cm), depth 173 ft (53 m), cased. Lsd about 794 ft (242 m) above msl. MP top of recorder base, 0.90 ft (0.27 m) above Isd. Highest water level 56.64 ft (17.26 m) below isd, Oct. 1, 1962; lowest 88.27 ft (26.90 m) below Isd, July 8, 1955. Records available: 1946-74. Measurement discontinued. Water levels affected by nearby pumping. Measurements made by Ypsilanti State Hospital.
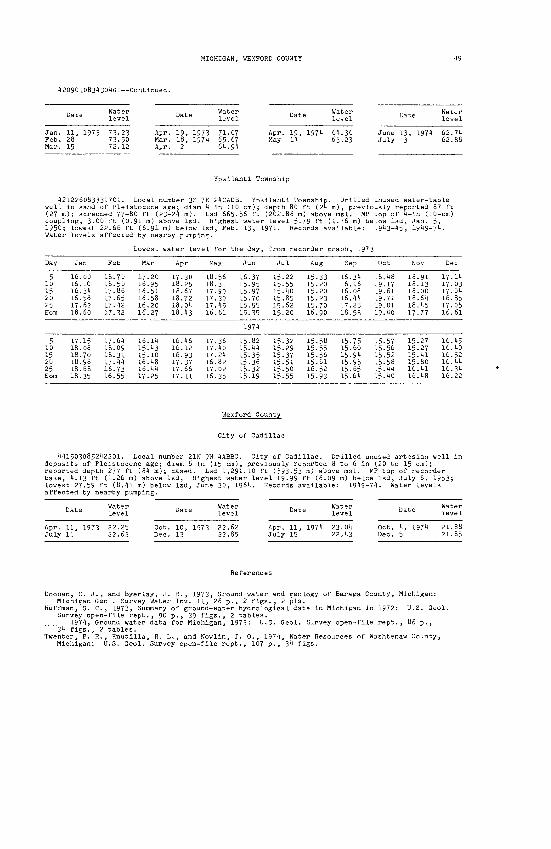
MICHIGAN, WEXFORD COUNTY
1)20901083130401 - Continued.
Jan. 11, 1973Feb. 28Mar. 15
73.2373.5072.12
Waterlevel
Apr. 19, 1973Mar. 18, 1974Apr. 2
71.0765.6761.94
Water level
Apr. 19, 1971 May 14
64.36 63-23
June 13, 1974 July 3
62. 7162.88
Ypsilanti Township
1)21226083331701. Local number 3S 7E 21CADB. Ypsilanti Township. Drilled unused water-table well in sand of Pleistocene age; diam 1 in (10 cm); depth 80 ft (24 m), previously reported 87 ft (27 m); screened 77-80 ft (23-24 m). Lsd 665.56 ft (202.86 m) above msl. MP top of 4-in (10-cm) coupling, 3.00 ft (0.91 m) above Isd. Highest water level 5.79 ft (1.76 m) below Isd, Jan. 5, 1950; lowest 22.66 ft (6.91 m) below Isd, Feb. 13, 1971. Records available: 1943-45, 1949-74. Water levels affected by nearby pumping.
Day
5 10 15 20 25
Jan
16.00 16.10 16.34 16.58 17.62 18.60
Feb
18.70 18.50 17.86 17-65 17.42 17.32
Lowest v
Mar
17.20 16.95 16.51 16.58 16.20 16.27
(ater le\
Apr
17.30 18.25 18.67 18.72 18.04 18.43
/el for the day,
May
18.5618.31 17-90 17.30 17.45 16.61
Jun
16.37 15.95 15.97 15.70 15.55 15.35
from recorder gi
Jul
15.22 15.55 15.40 15.85 15.62 15.20
Aug
15.33 15.20 15.20 15.23 15.70 16.90
'aph, 1973
Sep
16.34 16.16 16.08 16.44 17.25 18.53
Oct
18.48 19.17 19.61 19.71 19.01 19.10
Nov
18.91 18.13 18.00 18.64 18.45 17-77
Dec
17.14 17-03 17.04 16.85 17.05 16.61
1974
5 10 15 20 25 Eom
17-15 18.08 18.70 18.98 18.68 18.35
17.64 18.09 18.31 17.44 16.73 16.55
16.14 15.43 15.10 16.48 16.44 17.25
16.46 16.12 16.93 17-37 17.66 17.11
17.36 17.40 17.24 16.82 17.02 16.35
15.82 15.44 15.35 15.36 15.32 15.19
15.32 15.29 15.37 15.51 15.50 15.55
15.58 15-55 15.56 15.61 16.52 15.93
15.75 15.60 15-94 15.95 15.65 15.64
15.57 15.56 15.52 15.58 15.44 15.40
15.27 15.27 15.41 15.80 16.41 16.48
16.45 16.40 16.52 16.11 16.31 16.22
Wexford County
City of Cadillac
111503085212201. Local number 21N 9W 1ABBC. City of Cadillac. Drilled unused artesian well in deposits of Pleistocene age; diam 6 in (15 cm), previously reported 8 to 6 in (20 to 15 cm); reported depth 277 ft (81 m); cased. Lsd 1,291.10 ft (393.53 m) above msl. MP top of recorder base, 1.13 ft (1.26 m) above Isd, Highest water level 19.99 ft (6.09 m) below Isd, July 6, 1953; lowest 27.59 ft (8.11 m) below Isd, June 30, 1961. Records available: 1919-71. Water levels affected by nearby pumping.
Date
Apr. 11, 1973 July 11
Water level
Oct. 10, 1973 Dec. 13
Waterlevel
22.6222.85
Date
Apr. 11, 1971 July 15
Water level
23.0122.13
Oct. 1, 1971 Dec. 5
Water level
21.8821.85
References
Doonan, C. J., and Byerlay, J. R., 1973, Ground water and geology of Baraga County, Michigan:Michigan Geol. Survey Water Inv. 11, 26 p., 2 figs., 2 pis.
Huffman, G. C., 1973, Summary of ground-water hydrological data in Michigan in 1972: U.S. Geol.Survey open-file rept., 90 p., 39 figs., 2 tables.
____1971, Ground water data for Michigan, 1973: U.S. Geol. Survey open-file rept., 86 p.,J1~figs., 2 tables.
Twenter, F. R., Knutilla, R. L., and Nowlin, J. 0., 1971, Water Resources of Washtenaw County,Michigan: U.S. Geol. Survey open-file rept., 107 p., 31 figs.

NEW HAMPSHIRE
The observation-well program in New Hampshire was continued during 1973 through 1974 in cooper ation with the New Hampshire Water Resources Board. The Manchester Water Works maintained the recording gage on well Auburn 8 and made weekly measurements of the water level in that well. Figure 8 shows the location of observation wells included in this report.
Well-Numbering System
The first number shown is the new national well-numbering system represented by the latitude and longitude coordinates of the well location, as explained on page 1. Local well numbers, designated by town or city name and serial numbers assigned within each city or town, have been continued in this report for the convenience of local users and for easy reference to previously published data.
Well Descriptions and Water-Level Measurements
Water levels are reported in feet below land surface datum, unless otherwise indicated.
Hlllsboro County
1(21(705071281(801. Local number Nashua 101. Pennichuck Water Works. Dug unused water-table well in sand and gravel of Pleistocene age, diam 36 in (91 cm), depth 19 ft (6 m), lined with stone. Lsd about 170 ft (52 m) above msl. MP southeast edge of northwest slab of granite, 0.50 ft (0.15 m) above Isd. Highest water level 3.83 ft (1.17 m) below Isd, Apr. 23, 1969; lowest dry, at times in 1956, 1963-66. Records available: 1955-56, 1958-74.
Water n Water _ t Water _ Water level Date level Date level Date level
Jan. 26, 1973 9-68 July 26, 1973 10.73 Jan. 28, 19711 6.70 July 29, 19711 12.96Feb. 26 10.92 Aug. 27 12.33 Feb. 26 7.85 Aug. 26 13.90Mar. 27 8.17 Sept.27 12.77 Mar. 27 7.7* Sept.25 9.83Apr. 26 9.70 Oct. 29 15.17 Apr. 25 9.74 Oct. 29 11.35May 29 8.88 Nov. 26 12.84 May 28 9.84 Nov. 25 10.49June 26 11.49 Dec. 26 7.94 June 26 11.05 Dec. 23 9-52
Merrlmaek County
Jan. 26, 1973 1.47 July 27, 1973 3-18 Jan. 28, 1974 0.96 July 29, 1974 4.24Feb. 27 2.03 Aug. 27 3-97 Feb. 25 1.73 Aug. 26 5-24Mar. 2? .95 Sept.27 4.07 Mar. 26 .60 Sept.25 4.92Apr. 26 2.10 Oct. 29 4.67 Apr. 24 1.1(0 Oct. 29 4.95May 29 1.00 Nov. 26 4.42 May 28 1.71 Nov. 26 4.07June 26 2.70 Dec. 26 2.45 June 26 2.70 Dec. 21| 3.54
Jan. 30, 1973 5-35 July 22, 1973 7.98 Jan. 22, 19711 7.15 July 22, 1974 10.46Feb. 26 7.60 Aug. 20 10.28 Feb. 21 7-12 Aug. 24 12.65Mar. 22 2.25 Sept.25 12.52 Mar. 23 6.24 Sept.26 11.72Apr. 21 11.20 Oct. 23 13-41 Apr. 22 1|.16 Oct. 23 13.01May 22 3.86 Nov. 24 13.30 May 22 5.1(6 Nov. 21| 13.68June 21 7.89 Dec. 27 4.67 June 24 8.47 Dec. 23 9.59

NEW HAMPSHIRE
Figure 8. Location of observation wells in New Hampshire, 1973-7 1*.

GROUND-WATER LEVELS, 1973-711, NORTHEASTERN STATES
Rockingham County
430100071211301. Local number Auburn 8. Manchester Water Works. Dug unused water-table well in sandy till, diam 32 in (81 cm), depth 8 ft (2 ra), lined with fieldstone to 8 ft (2 m). Lsd about 300 ft (91 n) above rasl. MP edge of steel plate attached to horizontal beam, at Isd. Highest water level 0.45 ft (0.14 ra) below Isd, Apr. 2, 1958; lowest dry, several times, 1957, 1964. Records available: 1942-73. Measurement discontinued.
Water Water Water Water level Date level Date level Date level
1, 1973 1.32 Jan. 29, 1973 1.25 Feb. 26, 1973 1.37 Mar. 19, 1973 1.028 1.46 Feb. 5 1.26 Mar. 5 1.26 27 1.13
14 1.51 14 1.27 12 1.17 Apr. 3 .9722 1.27
Strafford County
Jan. 22, 1973 30.99 July 24, 1973 30.98 Jan. 25, 1974 31.05 Aug. 25, 1974 31.62Feb. 22 30.78 Aug. 28 31.26 Feb. 23 30.64 Sept.26 31.79Mar. 22 30.04 Sept.25 31.44 Mar. 23 30.82 Oct. 26 31.48Apr. 23 30.23 Oct. 24 31.55 Apr. 24 30.43 Nov. 25 31.56May 26 29.46 Nov. 26 31.41 May 23 30.70 Dec. 26 31.00June 23 30.71 Dec. 23 30.44 July 26 31.36

NEW JERSEY
The observation-well program in New Jersey, which was continued during 1973 through 1971, is conducted in cooperation with the State Department of Environmental Protection, Water Resources Division. Figure 9 shows the location of observation wells included in this report.
Well-Numbering System
Wells are numbered according to their latitude-longitude location, as explained on page 1. Local well numbers are also given.
The local well-numbering system is based upon the State topographic atlas sheets. The first segment of the number is that of the atlas sheet on which the well location may be found. The second refers to the 6-minute rectangle in which the well is situated. The third refers to the 2-minute rectangle into which the 6-minute rectangle is subdivided. Each of the 2-minute rectangles is divided into nine equal rectangles which are numbered 1 to 9, beginning in the upper left corner and numbering to the right. These divisions are again divided into nine equal rectangles and numbered in the same way.
Well Descriptions and Water-Level Measurements
Beginning in 1971, water levels are reported in feet referred to land-surface datum; in previous 5-year water-supply papers, water levels were referred to mean sea level. Water-level measurements are below land-surface datum, unless otherwise indicated.
Atlantic County
392751071270101. Local number 36.1.7.2.1. U.S. Geol. Survey. Oceanville. Drilled observation artesian well in Kirkwood Formation of Miocene age, diam 8 in (20 cm), depth 570 ft (171 m) screen ed 560-570 ft (171-171 m), cased with steel. Lsd 27.25 ft (8.31 m) above msl. MP top of casing, 2.10 ft (0.61 m) above Isd. Highest water level 33.62 ft (10.25 m) below Isd, Apr. 13, 1961; lowest 61.69 ft (18.80 m) below Isd, Oct. 6-9, 1971. Records available: 1959-71.
Lowest v
Day
510 15 20 25 Eom
Jan
56.60
Feb ME
55.90 55,
ir
.80
.75
.50
.15
.15
.05
/ater lei
Apr
51.75 51.75 55.00 51.95 51.75 51.70
rel for the day,
May
51.65 51.60 51-70 51.25 51.10 51.35
Jun
51.50 51.70 51.85 55.00 55-15 55.20
from recorder graph
Jul
55.35 55.70 55.95 56.30 56.70 57-05
Aug
57.50 57.95 58.35 58.80 59.25 59.70
S
60 60 60 61 61 61
, 1973
ep
.15
.65 70 .15 .35 .10
Oct
61.1)5 61.50 61.28 61.31 60.95 61.15
Nov
61.35 61.30 60.90 60.63 60.05 60.15
Dec
59.80 59.35 59.25 59.00 58.90 58.55
1971
5 10 15 20 25
58.35 57.95 57.95 58.05 58.25 58.15
'.'.'.'.'. 56!
..... 56,
..... 56,
..... 55.
!35 .15
.60
55.65 55.65 55-60 55.10
5si 30 55.65
55.55
55.50 55-15
56.30
56.6056.19 55-97 55.51 55.11 55.06
1925-71.
Lowest water level for the day, from recorder graph, 1973
Day Jan Feb Mar Apr May Jun Jul Aug Sep Oct Nov Dec
5 ..... ..... ..... ..... 52.13 ..... ..... ..... ..... 60.32 59.90 58.5510 ..... ..... ..... ..... ..... ..... ..... ..... ..... 60.31 59.10 .....15 ..... ..... 53.72 ..... ..... ..... ..... ..... ..... 6o.25 59.11 .....20 ..... ..... ..... ..... ..... ..... 51.15 ..... ..... 60.30 59.00 .....25 ..... ..... ..... ..... ..... ..... ..... ..... ..... 59.37 59.03 .....Eom 55.03 ..... ..... ..... ..... ..... ..... ..... ..... 58.12 58.85 .....
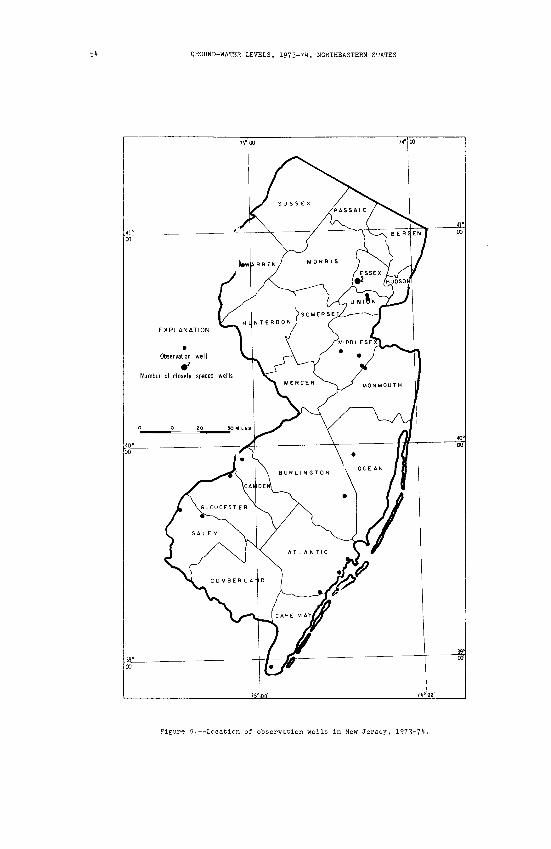
GROUND-WATER LEVELS, 1973-7^, NORTHEASTERN STATES
Figure 9. Location of observation wells in New Jersey, 1973-74.

392436074303501 Continued.
NEW JERSEY, BURLINGTON COUNTY
1971
Day Jan Feb Mar
54.41
Apr May Jun Jul Aug Sep Oct Nov Dec
3918270711371001. Local number 36.22.2.8.1. U.S. Geol. Survey. Drilled observation artesian well in Kirkwood Formation of Miocene age, dlam 8 in (20 cm), depth 680 ft (207 m), screened 670-580 ft (204-207 m), cased with steel. Lsd 10.0 ft (3.1 m) above msl. MP top of casing, 9.00 ft (2.74 m) above Isd. Highest water level 29.10 ft (8.87 m) below Isd, Apr. 13, 1961; lowest 71.01 ft (21.64 m) below Isd, Aug. 31, 1974. Records available: 1959-74.
Lowest water level for the day, from recorder graph, 1973
Day J;in
64
1 Q
,58
Feb Mar
.47
.54
.67
Apr May Jun Jul Aug Si
1974
..... ..... ..... 67
..... ..... ..... 67
?P
.85
16
Oc
65.
63.
t Nov Dec
89 ..... .....
391821074320701. Local number 36.23.1.9.6. Borough of Longport. Northwest end of 14th Ave. Drilled unused artesian well in 800-ft (244-m) sand In Klrkwood Formation of Miocene age, dlam £ (15 cm), depth 803 ft (245 m), cased with steel, length of screen 50 ft (15 m). Lsd 5 ft (2 m) above msl. MP top of casing, 4.07 ft (1.24 m) above Isd. Highest water level 14.0 ft (4.3 m) above Isd, when drilled, 1895; lowest 112.75 ft (34.37 m) below Isd, Sept. 3, 4, 1973. Records available: 1924-74. Affected by tidal fluctuations.
Day
510 15 20 25
Ja
Low (;st v
n Feb Mar
..... 67,
..... 67,
..... 66,
..... 66,
,00 .50 .40 35
«ater
Ap
66. 56. 67. 67- 67. 57.
level for the day,
r
50 75 25 30 75 35
May
66.90 67.25 67.80 68.25 67.90 70.70
Jun
71.10 76.10 77.75 77.05 76.40 77.30
from recorder graph
Jul
80.15 82.50 83.50 85.40 87.70 91.60
Aug
93.15 94.75 94.95 95.00 96.80
102.00
s
103 100 97 93 92 90
, 1973
ep
.40
.50 75 .25 .90 .45
Oct
88.30 88.25 88.00 85.75 85.15 82.30
Nc
81, 80, 78, 77, 75, 75
5V
.60
.10
.50
.00
.10
.25
Dec
74.90 73.10 73-10 73.80 73-80 72.00
1974
510 15 20 25
71. 71. 71. 70. 70. 59.
40 25 25 70 50 95
69.50
..... 67.
..... 58.
..... 58.
,60 .30 ,20
56. 68. 58. 69. 58. 71.
70 05 65 50 90 10
71.90 71-95 71.30 72.60 73.35 74.50
74.35 76.70 79.55 82.35 82.05 81.80
87.45 90.50 92.95 94.50 94.50 98.30
97.75 94.20 96.00 97.10 96.80 98.10
9589
89 86 86
.00
.80
.80
.40
.75
.40
85.10 84.20 83.20 81.40 80.80 79.45
78. 77. 76. 75. 74. 74,
,20 .10 .80 .40 .95 .80
73.20 72.50 71.50
Burlington County
394452074281901. Local number 32.23.6.6.8 observation water-table well in Cohansey Sand depth 10 ft (3 m), cased with steel. Lsd 79 ft (24 2.48 ft (0.75 m) above Isd.
U.S. Geol. Survey. Penn State Forest. DrilledMiocene(?) and Pliocene(?) age, diam 6 in (15 cm),
. ) above msl. MP edge of 6-in (15-cm) coupling,. . Highest water level 0.11 ft (0.03 m) above Isd (flowing), several
1959-62; lowest 5.92 ft (1.80 m) below Isd, Dec. 11, 1955. Records available: 1936-74.
Day Jan
5 ....10 ....15 ....20 ....25 ....Eom 0.99
Feb
0.93.90
1.051.151.241.22
Lowest w
Mar
1.071.151.311.351.441.21
ater lev
Apr
0.76.75
1.121.271.331.09
el for the day,
May Jun
1.20.97
1.311.361.201.30
.34
.68
.06
.65
.52 78
from recorder gr
Jul
1.772.202.392.532.763.07
Aug
2.983.343.493.263-513.81
aph, 1973
Sep
3.393-743.823.233.523.72
Oct
3.894.074.204.334.443.25
Nov
3.293.223.293.483.563.61
Dec
3.583.132.692.561.922.00

GROUND-WATER LEVELS, 1973-74, NORTHEASTERN STATES
3941152071)281901 Continued.
1974
Day Jan Peb Mar Apr May Jun Jul Aug Sep
O 7ft
O Q^1.78
2.36
Camden County
395811075054901. Local number 31.1.3.9.9. Cities Service Oil Co. Pettys Island. Drilled un used artesian well in sand of Raritan Formation of Late Cretaceous age, diam 8 in (20 cm), depth 143 ft (44 m), eased with steel. Lsd 12 ft (4 m) above msl. HP top of casing, 0.35 ft CO.11 m) above Isd. Highest water level 6.1* ft (2.0 m) below Isd, Dec. 8, 1950, Mar. 11, 1952; lowest 16.8 ft (5.1 m) below Isd, Feb. 12, 1951. Records available: 1949-1974. Reflects tidal fluctuations.
Lowest water level for the day, from recorder graph, 1973
Day
510 15 20 25 Eom
25
Jan
12.85 13.70 13.56 13.36 12.32 12.67
11.90
Feb
11.87 12.18 11.48 12. 24 12.62 11.78
12.50
Mar
12.14 12.15 11.72 12.49 11.39 11.63
12.83
Apr
11.21 10.63 11.89 12.19 11.68 11.72
12.11
May
12.12 11.40 11.59 11.09 10.89 11.40
12.11 11.86
Jun
11.64
11.8911.76 11.62 10.34
1974
11.50
Jul
10.81 11.4011.73 11.63 11.87 11.69
Aug
11.83 11.85 11.63 11.53 11.90 12.00
12.40
Sep
11.89 12.12 11.85 11.70 11.69 11.75
11.89
Oot
11.61 11.79 12.03 11.95 11.99 11.26
Nov
12.71 12.98 12.18 12.47 11.79 12.64
12.34
Dec
11.88 11.56 11.87 12.45 11.97 11.78
Cape May County
385804074574201. Local number 37.1.8.7.8. U.S. Geol. Survey (Well 3). Higbee Beach. Drilled observation artesian well in Cohansey Sand of Miocene(?) and Pliocene(?) agej 6-in (15-cm) diam 0-52 ft (0-16 m), 2-in (5-1-cm) diam 52-250 ft (16-76 m); depth 250 ft (76 m); cased with steel; screened 241-250 ft (73-76 m). Lsd 6 ft (2 m) above msl. MP recorder shelf, 2.84 ft (0.87 m) above Isd. Highest water level 13.16 ft (4.01 m) below Isd, Dec. 21, 1965; lowest 35.63 ft (10.85 m) below Isd, Aug. 20, 1974. Records available: 1965-74.
Lowest water level for the day, from recorder graph, 1973
Day
20 25 Eom
10
20 25 Eom
Jan
19.37
20.02 21.10 21.61
Feb Ma
18.83 18.69 18.16
..... 19.
..... 19.
..... 19.
r
ifi3163 09
Apr
18.90 18.6619.12 19.43 20.18
May
is!45 19.46
20.14
21.62 23.40 24.03
Jun
19.84
21.38 21.88 22.90
1974
24.71 25.6627.16 26.40 26.18
Jul
25.57 26.23 28.11
30.05 31.2532.29 32.46 34.22
Aug
27-84
29.5628.67 28.46 29.59
33.04
35.63
33 '.29
Sep
29.44
25.36 24.35 23.41
30.29
29-29 28.03 27.23
Oct
22.22
22.49
24.7423.04 22.5021.10 20.37 20.63
Nov
21.68 21.12 21.23
19.11
18.44 18.45 18.63
Dec
20.50
19.96 19.69 20.03
18.13
17.43 17.32 18.17
Essex County
404452074211601. Local number 25.15.7.5.4. (Well 30). Commonwealth Water Co. About 0.3 mi (0.5 km) north of Canoe Brook pumping station, near Chatham. Drilled unused artesian well in Wisconsin drift, diam 10 in (25 cm), depth about 130 ft (40 m), cased with steel. Lsd 170.0 ft (51.8 m) above msl. MP top of casing, 4.55 ft (1.39 m) above Isd. Highest water level 7.2 ft (2.2 m) below Isd, Aug. 25, 1931; lowest 85.0 ft (25.9 m) below Isd, Aug. 25, 1971. Records available: 1925-74. No measurement made in 1973. Water levels affected by nearby pumping.

NEW JERSEY, MIDDLESEX COUNTY
1*01(1(52071(211601 Continued.
Lowest water level for the day, from recorder graph, 1974
Day Jan Feb
404454074202101.belowdepthft (0.65.75
Day
Parsonabout.27 m)ft (20
Jan
43.42
age Hill6l| ft (20above Isd.04 m) be
Feb
41.6742.42
Mar Apr
Local number 25.Rd. Drilled unum) , cased with
Highest waterlow Isd, Apr. 10
Lowest water lev
Mar Apr
May
15.7.5.sed artsteel.level
, 1967.
el for
May
Jun
9. Eastesian weLsd 1827.20 ft
Jul
Orange11 in Wift (55(2.19 m)
Aug Sep
Water Dept. Noscons inm) abovbelow
drift,e msl.Isd, Oct
Records available: 1925-74.
the day,
Jun
48.64
from re
Jul
corder
Aug
Oct Nov
rth side Canoe Brodiam 6 inMP top of. 25, 1927
(15 cm),casing,; lowest
Dec
ok
0.87
graph, 1973
Sep Oct Nov
53-64
Dec
52.84
1974
510152025Eom
52.0052.4152.0250.9149.5348.74
47.6546.8750.3648.0548.3548.08
48.52 49.2848.88 46.5549-12 46.4649.27 49.2848.74 48.3047.75 48.32
45.8249.0249.1752.2051.9552.40
51.1552.7153-7453.4353.1153.30
53-7553.9954.5454.9455.1054.54
54.7954.9755.0355.2454.7955.05
55.1154.9755.0054.6053.3852.96
53-4453-7452.9051.9252.9952.83
52.0653.9754.3054.4454.3854.76
54.4954.3754.7254.6154.7454.60
Gloucester County
39523207509K201. Local number 31.11.2.7.2. (Well 3). The Texas Co. Eagle Point, Westville. Drilled observation artesian well in Raritan and Magothy Formations of Late Cretaceous age; diam 8 to 6 in (20 to 15 cm); depth 298 ft (91 m); 8-ln (20-cm) steel casing 0-86 ft (0-26 m), 6-in (15-cm) steel casing 86-2K5 ft (26-75 m); screened 225-2K5 ft (69-75 m); open hole 2K5-298 ft (75-91 m). Lsd 22 ft (7 m) above msl. MP top of casing, 1.96 ft (0.60 m) above Isd. Highest water level 37.7 ft (11.5 m) below Isd, Nov. 25, 1950; lowest 87.30 ft (26.61 m) below Isd, June 28, 1963. Records available: 19K9-7K.
Day
5 10 15 20 25
15 20 25
Jan
66.27 67.36 68.06 66.80 65.3-7 64.52
68.5867.98 67.51 68.02
Feb
67.33 66.31 64.83 65.06 64.43
67.8769.84 70.67
Lowe
Ma
66. 67. 70. 65. 66. 64
69.69. 70. 70.
r
73 45 71 72 45
84 44 68 38
Apr
65.67 65.87 66.01 67.76 67.12 65.83
May
65-78 67.08 68.48 64.51 63.38
70.53 74.69 72.23
Jun
66.20 71.94 71.04
69 '.84
1974
76.11 78.57 73.54
Jul
71.15 75.50 70.71 71.81 73.47
73.81 75.19 73-73
Al
75. 78. 75. 76. 74.
76.
'E
.05 ,88 ,26 ,89 .03
,16
aph, 1973
Sep Oc
..... 63.
..... 61,
..... 62,
..... 65,
..... 68,
..... 67.
..... 65,
..... 69,
..... 69.
:t
.70
.32
.27
.55
.48 ,89
ft!.22 .29 .90
Nov Dec
68.08 66.26 70.57 66.23 69.78 66.71 68.20 67-59 68.83 68.95
..... 70.25
..... 70.80
..... 71.19
Middlesex County
Lowest water le\
Day
5 10 15 20 25 Eom
Jan
13.19 13.20 13.23 13.27 13.37 13.07
Feb
12.18 11.98 11.91 11.89 12.01 12.05
Mar
12. 14 12.21 12.31 12.38 12.47 12.50
Apr
12.01 11.84 11.76 11.71 11.69 11.63
rel for the day,
May
11.58 11.46 11.64 11.66 11.73 11.76
Jun
11.82 11.89 12.01 12.13 11.80 11.61
from recorde
Jul
11.47 11.51 11.52 11.68 11.81 12.04
Au
12. 12. 12. 12. 12. 13.
r gi
E
21 39 58 72 92 16
-aph, 1973
Sep
13.34 13.52 13.45 13.7914.00 14.13
Oct Nov Dec

GROUND-WATER LEVELS, 1973-74, NORTHEASTERN STATES
402553074271701 Continued.
1971
Day
10 15 20 25 Eom
Jan
14.01 13.92 13.84 13.82 13.73 13.66
Feb
13-64 13.64 13.71 13.75 13.82 13.82
Mar
13.86 13.93 13.98 13.99 13.75 13.54
Apr
13.42 13.18 13.01 12.95 12.99 12.95
May
13.04 13-09 13.04 13.13 13.15 13.24
Jun
13.32 13.40 13.52 13.61 13.75 13.87
Jul
14.01 14.11 14.29 14.45 14.58 I 1). 77
Aug
14.91 15.02 15.18 15.30 15.43 15.46
Sep
15.50 15.62 15.74 15.84 15.92 15.97
Oct
16.08 16.16 16.24 16.27 16.36 16.15
Nov
16.51 16.60 16.65 16.71 16.78 16.87
Dec
16.82 16.77 16.81 16.53 16.40 16.32
402439074212401. Local number 28.5.4.8.1. (Well 1). Duhernal Water System. About % mi (0.40 km) east of traffic circle on Rte. 18 near Old Bridge. Drilled observation water-table well in Old Bridge Sand Member of Magothy Formation of Late Cretaceous age, diam 6 in (15 cm), depth 67 ft (20 m), cased with steel. Lsd 18.7 ft (5.7 m) above msl. MP top of casing, 1.50 ft (0.46 m) above Isd. Highest water level 11.03 ft (3.36 m) below Isd, July 31, 1945; lowest 16.35 ft (4.98 m) below Isd, Sept. 11, 1954. Records available: 1938-74.
Lowest water level for the day, from recorder graph, 1973
Day
5 10
20 25Eom
Jan
12.40 12.60 12.75 12.75 12.81 13.30
Feb
12.75 11.95 12.00 12.15 12.35 12.45
Mar
12.5512.60 12.70 12.80 12.70 12.75
Apr
12.40 12.15 12.15 12.25 12.35 12.20
May
12.25 12.35 12.45 12.55 12.60 12.65
Jun
12.70 12.85 13.00 13.20 12.70 12.40
Jul .
11.95 11.95 12.10 12.30 12.50 12.65
Aug
12.75 12.95 13.10 13.10 13.20 13.40
Sep
13.50 13.65 13.70 13.70 13.80 13.85
Oct
13.95 11.05 14.10 14.15 14.25 13.80
Nov
13.95 11.05 14.05 14.20 14.20 14.25
Dec
14.35 14.15 14.00 14.00 13.15 12.95
19745
10 15 20
Eom
12.95 12.90 12.95 13.05 12.95 13.05
13.10 13.00 13.20 13.25 13.35 13.15
13.50 13.15 13.55 13.65 13.40 13.05
12.90 12.75 12.70 12.70 12.70 12.85
12.95 12.95 13.05 13.05 13.10 13.20
13.30 13.35 13.50 13.55 13.50 13.60
13-70 13.80 13.90 14.05 14.05 14.15
14.25 14.35 11.40 11.40 11.45 14.50
14.25 14.15 14.15 14.10 14.25 14.35
14.45 14.55 14.55 14.40 14.60 14.60
14.60 14.55 14.50 14.65 14.70 14.75
14.40 14.35 14.30 14.10 14.00 13-95
402143074185201. Local number 29.11.1.2.3. Joseph Morrell. Near Moerls Corner. Dug observa tion water-table well in Englishtown Formation of Late Cretaceous age, diam 17 in (43 cm), depth 11 ft (3 m), cased with pre-cast concrete rings. Lsd 76 ft (23 m) above msl. MP inner edge of concrete ring, 0.95 ft (0.29 m) above Isd. Highest water level 0.42 ft (0.13 m) below Isd, Mar. 7, 1967; lowest 9-56 ft (2.91 m) below Isd, Oct. 6, 1957. Records available: 1923-74.
Lowest level for the day, from recorder graph, 1973
Day Jan Feb f
15 .... .40
Eom .... 1.65
far Apr May Jun Jul Aug Sep Oct
.50 1.45 .55 2.50 1.65 .... .... ....
197t
.26 .... .... .... .... .... .... ....
Nov
2.03 1.96
Dec
1.741.961.69
Monmouth County
402122074184601. Local number 29.11.1.2.9. Walter Novak. Hillsboro Rd., about % mi (0.80 km) .theast of Moerls Corner. Dug observation water-table well in Englishtown Formation of Late ^taceous age, diam 4% ft (1.37 m), depth 19 ft (6 m), cased with concrete well blocks. Lsd 110.0
MP inner edge of door frame, 1.86 ft (0.57 m) above Isd. Highest water Isd, July 20, 1972; lowest 15.02 ft (4.58 m) below Isd, Jan. 1-3, 22,
ft (33.5 m) above level 9.4 ft (2.9 m) 1966. Records available 1936-74.
st water level for the day, from recorder graph, 1973
Day
510152025
Jan
10.1510.3510.5510.6510.7510.60
Feb
10.059.95
10.0510.2510.3510.45
Mar
10.5510.6510.7010.8010.9010.90
Apr
10.5010.2010.1510.2510.3510.20
May
10.2010.2510.2510.3510.4510.55
Jun
10.7010.8010.9511.0010.7510.70
Jul
9.459.609.85
10.1010.3010.55
Aug
10.7511.0011.1511.25
Sep
12.0012.1012.2512.40
Oct
12.5012.6012.7012.8512.9512.25
Nov
12.4512.6512.8513.0013.1013.15
Dec
13-0513.0012.9012.9011.8511.90

NEW JERSEY, SALEM COUNTY
102122071l81601--Continued.
Day
5 10
25 Eom
Jan
11.85 11.85
11.80 11.75
Feb
11.85 11.95
12.10 12.15
Mar
12.15 12.20
11.85 11.65
Apr
11.50 11.1(0
11.35 11.15
May
11.60 11.65
11.90 12.00
1971
Jun
12.05 12.20
12.25 12.25
Jul
12.35 12.15
12.75 12.90
Aug
12.99 13.08
13.32 13.29
Sep
12.91 12.70
Oot
13.23 13-32
13.31 13.12
Nov Dec
13-17 ..... 13.53 .....
Ocean County
Day
5 10 15 20 25 Eom
Jan
50.29 50.10 19.86 19.67 19-55 19-52
Feb
19.13 19.36 19.27 19-15 18.91 18.85
Lowest v
Mar
18.69 18.59 18.50 18.19 18.55 18.58
Apr
18.56 18.61 18.62 18.51 18.35 18.21
May
18.13 18.01 18.00 17-93 17.89 17-91
;he day,
Jun
17-91 17.82 17.83 17.78 17.81 17.83
Jul
17-85 17.89 17.92 17.99 18.01 18.10
Aug
18.17 18.25 18.32 18.12 18.52 18.65
Sep
18.75 18.86 18.97 19.11 19.25 19.37
Oct
19-50 19.63 19.76 19.89 50.01 50.13
Nov
50.65 50.76 50.87 50.98 51.08 51.20
Dec
51-31 51.12 51-52
1971
5 10 15 20 25 Eom
51.20 51.22 51-27 51.32 51-38 51.16
51.53 51.60 51-67 51-77 51-87 51-96
52.06 52.11 52.22 52.29 52.37 52.13
52.19 52.51 52.58 52.61 52.65 52.69
52.72 52.75 52.78 52.80 52.81 52.90
52.92 52.98 53-06 53-12 53-11 53-20
53-26 53-31 53-37 53.11 53-12 53.37
Salem County
391236075272101. Local number 30.22.9-7.3. (Penns Grove 21). State of New Jersey. About 1 mi (2 km) east of Carneys Point. Drilled observation water-table well in sands of Raritan and Magothy Formations of Late Cretaceous age, diam 6 in (15 cm), depth 51 ft (16 m), cased with steel, 5*s-in (11-cm) screen 16-51 ft (11-16 m). Lsd 18 ft (5 m) above msl. MP top of casing, 1.81 ft (0.56 m) above Isd. Highest water level 10.17 ft (3-10 m) below Isd, June 11, 1917; lowest 26.56 ft (8.10 m) below Isd, Mar. 5, 1969. Records available: 1911-71.
Day
5 10 15 20 25 Eom
Jan
18.12 17.98 17.92 17-97 18.28 18.13
Feb
17-59 16.67 16.29 16.12 16.60 16.77
Lowest v
Mar
17.16
rater Ie\
Apr May
;he day,
Jun Jul Aug Sep Oct Nov Dec
1971
5 10 15 20 25 Eom
23-55 23-58 23-53 23-51 23.12 23.33
23.31 23.25 23-22 23.21 23.13 23.12
23.06 23.12 23.07 23.01 23.01 22.80
22.66 22.39 21.76 21.09 20.57 20.19
20.07 20.13 20.21 20.11 20.57 20.71
20.78 20.71 20.90 21.09 21.30 21.11
21.61 21.73 21.86 22.05 22.21 22.35
22.17 22.6222.71 22.87 22.93 23-02
23-11 23-13 23.11 23.08 23-02 22.99
23.1123.23 23.36 23.18 23.56 23.68
23.78 23.89 23.98 21.01 21.15 21.21
21. ii 21.36
Local number 30.31.1.5-7. U.S. Geol. Sutesian well in Raritan Formation
Day
5 10 15 20 25 Eom
Jan
91.16 91.20 91.11 91.08 91.07 91.20
Low<
Feb Mar Aj
91.02
..... 90
..... 90
..... 90
.15
.56
.50
90.
90. 90. 90,
sr May
,29 .....
.56 .....
Jun Jul Aug
91.58 91-70 91-87 91-95 92.13 92.51
Sep
92.51 92.65 92.73 92.81 92.99 93.03
Oct
93-014 93.08 93-06 93.09 93-13 93.00
Nov
93-12 93-11 93-10
9s'ii93-09
Dec
93.09 93.06 93.01 93.07 93.08 92.73

GROUND-WATER LEVELS, 1973-74, NORTHEASTERN STATES
391*037075191501 Continued.
1971
Day j£in
766?69
F«;b Mar A{
67 92.6t
7065 .....61
jr ME
q p93Q3
93
ly Jun Jul
,83 ..... .....
,14 ..... .....
Aug Sep Oc
ncnc
qcQC
qc
:t
,1824
24
Nc
QC
nc
04
91.
>v Dec
94.88
94.63
Union County
1*04106071*171901. Local number 26.21.5.4.6. Union County Park Commission. Galloping Hill Golf Course near Kenilworth. Drilled unused artesian well in Brunswick Shale of Late Triassic age, diam 6 in (15 cm), depth 290 ft (88 m), cased with steel. Lsd 69.00 ft (21.03 m) above msl. MP top of casing, 1.65 ft (0.50 m) above Isd. Highest water level 3.06 ft (0.93 m) below Isd, June 2, 1952; lowest 16.05 ft (It.89 m) below Isd, June 29, 1966. Records available: 1943-74.
Day
10 15
510 15 20 25
Jan
6.917.82 7-597.617.657.67
6.61 6.97 6.70 7-05 7.05 7.00
Feb
6.79 6.75
7.04 7.17 7.44 7.18 7.01 7.12
Mar
7.21
7.11
7-32 7-31 7-67 7.55 6.93 6.87
Apr
6.316.24 6.42
6.87 6.51 5.90
May
6.927.12
he day,
Jun
8.14 8.497.837-69
1974
8.05 7.80 8.51 8.36 7.71 7.70
Jul
7.67 8.33 8.38 8.58 8.52 8.42
order gt
Aug
7.92 8.27 9-13 7.82 7.86 7.80
aph,
Se
10.in
8. 7.7.B'.
7.
, iyv!P
8?00 ?4
?4
02 .42 .61 .96 .56 .51
'3
Oct ' Nov ' Dec
10.64 .... ....
8.70 .... .... 8.83 .... .... 8.21 .... .... 7.91 8.24 .... .... 8.23
404027074164401. Local number 26.21.5.8.3. (Well 3). White Laboratories, Inc. Kenilworth. Drilled observation artesian well in Brunswick Shale of Late Triassic age, diam 6 in (15 cm), depth 400 ft (122 m), cased with steel. Lsd 81.00 ft (24.69 m) above msl. MP top of casing, 3.31 ft (1.01 m) above Isd. Highest water level 6.31 ft (1.92 m) below Isd, Apr. 17, 1961; lowest 41.90 ft (12.77 m) below Isd, Mar. 7, 1952. Records available: 1952-71.
Lowest water level for the day, from recorder graph, 1973
Day
10
Eom
Jan
22.92
23.08
Feb
19.35
23.55
Mar
24.06
20.57 23.41
22.8820.09
Apr
22.94
23.96
May
24.41
24.66
Jun
24.3625.24
1974
23.82
21.71
Jul
24.62
25.37 25.86
25.77
Aug Sep
22.35
Oct
25.96
24.83
25.51
Nov
24.29
22.48
Dec
18.44
23.60 22.74
21.96
Warren County
Belvidere. Drilled 128 ft .79 m) ft (13-23 m)
Lowest water level for the day, from recorder graph, 1973
Day
5 10 15 20 25
Jan
34.22 34.34 34.95 35.66 36.19 36.63
Feb
35.99 34.32 34.15 34.88 35.65 36.13
Mar
36.88 37-32 37-50 37.40 37.24 37.40
Apr
36.89 34.95 33.64 33.63 31.35 35.11
May
35.66 36.24 36.21 35.86 35.16 34.75
Jun
33.62 33.41 34.22 35.24 36.18 36.75
Jul
35.24 35-68 36.55 37.35 37-61 37.99
Aug
38.18 38.54 39.02 39.36 39.65 39.97
Sep
40.25 40.57 40.86 41.08 41.31 41.51
Oct
41.70 41.83 11.99 42.18 42.35 42.42
Nov
42.30 42.38 42.45 42.50 42.56 42.51
Dec
42.37 41.95 40.81 39.92 37.06 34.14

NEW JERSEY, WARREN COUNTY
405050075033201 Continued.
Day
5 10 15
25 Eom
Jan
33.69 31.50 35.15
36.91 36.39
Feb
35.8? 36.23 36.82
37.81 38.25
Mar
38.33 38. H3 38.1(0 37.8637.39 36.49
Apr May
35.39 ..... 35.35 .....
1974
Jun
38!7339.37
40.34 40.83
Jul
41.31 41.45 41.56
41.88 42.29
Aug
42.48 42.73 43.00
43.22 43.27
Sep
43.03 41.87 41.07
41.18 41.32
Oct
40.68 40.46 40.77
41.26 41.58
Nov
41.90 42.45 42.76
42.92 42.99
Dec
43.22 42.99 41.66

Well-Numbering System
Wells are numbered according to their latitude-longitude location, as explained on page 1. Local well numbers are also given.
The local number is a 2-part identifier which consists of the abbreviation of the county name, followed by the serial number assigned within each county.
Well Descriptions and Water-Level Measurements
Water levels in the Upstate section of this report are in feet below land-surface datum, except those for local number Ot 900, which are above land-surface datum. On Long Island, water-levels are referred to mean sea level (Sandy Hook datum). For wells whose water levels fluctuate above and below mean sea level, a plus or minus sign, as appropriate, is shown for the first measurement In each column and for the first and last measurement of a series above ( + ) or below (-) sea level.
Broome County
1(20657075583501. Local number Bm-121. U.S. Geol. Survey. Camden and Main Sts., Johnson City. Drilled observation water-table well in glacial sand of Pleistocene age, dTam 6 In (15 cm), depth 53 ft (16 m), cased to 53 ft (16 m), open end. Lsd about 835 ft (255 m) above msl. MP top of casing, 3.17 ft (0.97 m) above Isd. Highest water level 9-73 ft (2.97 m) below Isd, Apr. 8, 1956; lowest 33."17 ft (10.20 m) below Isd, Sept. 23, 1965. Records available: 19'17-7't. Water levels affected by floods of Susquehanna River, and by pumping (3 to 7 MGD) from nearby municipal supply wells 1,100 ft (335 m) south.
Highest water level for the day, from recorder graph, 1973
Day
5 10 15 20 25 Eom
Jan
20.0 21.3 20.9 22.1 22.2 23.0
Feb
22.1 22.5 23.2 23.6 21.3 21.7
Mar
214.9 214.3 23.9 22.6 22.8 23.6
Apr
21.7 20.7 21.2
. 22.3 22.9 23.1
May
23.0 23.5 23.2 22.3 21.5
Jun
23.3 23.9 21.9 25.3 25.7 25.7
Jul
25.1 25.8
27!! 27.6 27.9
Aug
28.3 28.7 29.0 29.1 29.2 29.5
Sep
29.930.0 30.2 30.2 30.1 30.3
Oct
30.1 30.0 30.0
30.0 29.5
Nov
29.5 29.7 29.8 29.8 29-9 29.5
Dec
29.1 28.1 27.2 27.0 25.0 21.7
1971
5 10 15 20 25 Ecm
23.0 214.1 25.0 25.6 25.1
e23.6
214.0 23.0 23.0 214.1 23.7 214.1
2H.3 23.6 21.2 21.6 21.5 214.8
22.8 21.9 21.5 21.8 22.9 23-9
21.6 25.3 21.6 21.6 25.2 25-7
26.7 26.7 27.0 27.3 27.5 27.6
27.2 26.9 27.3 27.5 27.9 28.0
28.1 28.14 28.7 29.1 29.1 29.1
28.8 28.6 28.8 28.9 28.6 28.8
28.8 28.9 29.1 29.2 29.14 29.5
29. 14 28.6 27.7 27.2 26.5 26.14
26.6 21.8 21.3 21.7 25.1 26.0
e Estimated.
Cattaraugus County
120530078115201. Local number Ct-121. State Dept. of Environmental Conservation. Near Red House. Drilled unused artesian well in sand and gravel of Pleistocene age, diam 6 in (15 cm), depth 53 ft (16 m), cased to 53 ft (16 m), open end. Lsd about 1,170 ft (118 m) above msl. MP top of casing, 0.30 ft (0.09 m) above Isd. Highest water level 3.29 ft (1.00 m) below Isd, Dec. 15, 1967; lowest 31.87 ft (10.63 m) below Isd, Nov. 21, 1972. Records available: 1950-71. Extreme low levels occur during late summer months, with lower than normal levels prevalent throughout the year. A source of nearby pumping has not been determined.

NEW YORK, CORTLAND COUNTY 63
120530078115201 Continued.
Water Water n t Water Water level Date level Date level Date level
Jan. 5, 1973 20.95 July 7, 1973 16.29 Jan. 11, 1971 15.88 July 12, 1971 31-5012 20.16 13 16.72 18 16.23 19 32.2119 19.89 20 17.41 25 16.14 26 33.1926 19.56 Aug. 4 18.36 Feb. 8 16.06 Aug. 2 33.62
Feb. 2 19-77 10 21.37 16 16.53 9 32.799 19.31 17 19.61 20 16.75 16 34.01
16 18.43 24 19-97 Mar. 1 16.84 23 31.2323 18.83 Sept. 3 21.96 8 16.56 30 31.12
Mar. 2 19.30 8 21.86 15 11.54 Sept. 7 31-319 18.87 15 22.25 22 11.29 13 34.00
16 18.11 28 20.70 29 11.34 27 33-5523 17.59 Oct. 6 20.04 Apr. 5 13-69 Oct. 4 33-35
Apr. 14 13.73 12 19-57 12 13.59 11 31-9620 15.69 19 18.84 28 19.28 18 27.3027 16.04 26 18.55 May 10 14.14 25 23-66
May 4 14-31 Nov. 2 17.91 17 18.30 Nov. 1 20.2012 13.54 23 17.89 24 16.05 8 17.3118 12.96 30 17.62 31 20.96 15 11.3125 12.70 Dec. 8 17.26 June 8 24.14 22 14.18
June 8 14.09 11 16.55 11 26.13 Dec. 6 11.1015 11.86 21 16.11 21 27.38 13 9.7222 15.76 31 16.09 29 30.06 20 8.5529 15.88 Jan. 1, 1971 15-92 July 5 30.44
Ghautauqua County
120326079295801. Local number Cu-5. State Dept. of Environmental Conservation. Near Panama. Dug unused water-table well In glacial till of Pleistocene age, dlara 36 In (91 era), depth 33 ft (10 m), stone-lined. Lsd about 1,750 ft (533 m) above msl. MP top of 0.25-in (0.61-cra) steel- plate well cover, Inside shelter door, 0.11 ft (0.13 ra) below Isd. Highest water level 0.95 ft (0.29 m) below Isd, Dec. 26, 1968; lowest 9.4l ft (2.87 m) below Isd, May 21, 1919. Records available: 1919-71.
Jan. 7, 1973 2.10 July 5, 1973 2.15 Jan. 3, 1971 2.30 July 1, 1971 3-20ll 2.15 12 2.20 10 ,2.25 11 3.2518 2.10 19 2.30 17 2.20 18 3.3825 2.35 26 2.35 21 2.10 25 3.10
Feb. 1 2.30 Aug. 2 2.30 31 2.05 Aug. 1 3.158 2.30 9 2.35 Feb. 7 2.00 8 3.10
15 2.30 16 2.10 14 1.90 15 3-4522 2.25 23 2.45 21 1.85 22 3-50
Mar. 1 2.40 30 2.48 28 1.75 29 3-308 2.25 Sept. 6 2.50 Mar. 7 1.80 Sept. 5 3-20
15 2.20 13 2.53 14 2.70 12 3.1022 2.15 20 2.55 21 2.65 26 1.0129 2.20 27 2.60 28 2.68 Oct. 3 6.30
Apr. 5 2.15 Oct. 4 2.70 Apr. 4 1.95 10 5-3012 2.20 11 2.80 11 2.15 17 5.2019 2.25 18 2.70 18 2.25 24 4.6526 2.30 25 2.75 25 2.30 31 4.45
May 3 2.15 Nov. 1 2.70 May 2 2.50 Nov. 7 3.4010 2.12 8 2.65 9 2.25 14 3.1517 2.10 15 2.60 16 2.40 21 3.0024 2.05 22 2.55 23 3.20 28 3.1031 2.00 29 2.50 30 3.35 Dec. 5 3.20
June 7 2.00 Dec. 6 2.45 June 6 3.50 12 3.1014 2.05 13 2.40 13 3-65 19 2.9021 2.10 20 2.35 20 3-85 26 2.8528 2.15 27 2.32 27 3.90
Portland County
423539076114801. Local number C-19. City of Cortland. Broadway, Cortland. Dug unused water- table well In glacial gravel of Pleistocene age, dlam 6 In (15 cm), depth 13 ft (4 m), cased to 13 ft (4 ra), open end. Lsd about 1,140 ft (347 m) above msl. MP top Inner step of flange, 2.45 ft (0.75 m) below Isd. Highest water level 2.98 ft (0.91 ra) below Isd, Apr. 5, 1947; lowest 13.85 ft (4.22 ra) below Isd, Nov. 15, 1973- Records available: 1947-74. Recording gage installed Oct. 31, 1972. Water levels affected by pumping from nearby municipal supply wells and by stage of nearby stream.
Highest water level for the day, from recorder graph, 1973
Day
5 10 15 20 25 Eom
Jan
4.56 4.71
Peb
6.46 7-70 5-42 5-55
5.40
Mar
4.80 5-05 4-78 4-52 4.65 4.55
Apr
4.43 4.58 4.84 5.03 5-26 5-31
May
5.24 5.20 5.45 5.63 5-70 5.62
Jun
5.44 5.25 5.10 5.65 6.10 6.27
Jul
6.36 6.39 6.54 6.75 6.96 7-25
Aug
7.64
s'.ii8.13
8195
Sep
8.60 9.95
10.40 9.85 9-32 9.05
Oct
8.44 8.10 8.38 8.91 9.58 9.73
Nov
10.24 10.66 10.95 9-73 9.38 9.37
Dec
9.20 8.50 7.82 7.61

GROUND-WATER LEVELS, 1973-7 1*, NORTHEASTERN STATES

Figure 10. Location of
observation
wells
in New
York,
1973
-71*.

GROUND-WATER LEVELS, 1973-71, NORTHEASTERN STATES
123539076111)801 Continued.
1971
Day
5 10 15 20 25 Eom
Jan
6.20 5.93 5.85 6.06 5.50 5-35
Feb
5.20 5.22 5-31 5-13 5.15 5.16
Mar
5.21 5.20 5.35 5.11 5.10 5.29
Apr
1.03
5. '09
May
5.19 5.36 5.27 5.12 5.35 5.10
Jun
5.57 5.58 5.81 5.90 6.06 5.89
Jul
6.08 6.31
7l20 7.55 7.89
Aug
7-92 8.23 8.33 9.02 8.93 9.03
Sep
8.60 8.70 8.65 8.95 9.35 9.09
Oct
9.12 9.05 9.18 9.36 9.51 9.68
Nov
9.53 9.22 8.07 7.53 5.91 5.86
Dec
6.10 5.02 1.99
Dutchess County
1H737073563301. Local number Du-321. U.S. National Park Service. Near Hyde Park. Drilled unused artesian well in shale of Ordovician age, diam 6 in (15 cm), depth 128 ft (39 m), open hole. Lsd about 170 ft (52 m) above msl. HP top of casing, 3.10 ft (0.91 m) above Isd. Highest water level 65.62 ft (20.00 m) below Isd, June 22, 1953; lowest 73.85 ft (22.51 m) below Isd, Sept. 13, 1966. Records available: 1918-50, 1953-71. Water levels affected by earth tides, approximately 0.05 ft (0.91 m).
Highest water level for the day, from recorder graph, 1973
Day
5 10 15 20
5 10 15 20 25 Eom
Jan
67^66 67.56 67.38
67-19
68.19 68.11
Feb
67.11 67.10 66.93 67.08
67-35
67^35 67.31 67-13
Mar
66.98 66.93 66.75 66.51 66.8166.82
66.1l 67-50 67-19 67.23 67.25 66.86
Apr
66.22 66.11 66.27 66.21
Hay
66.05 66.15 66.12 65.91
65.87
66.31 66.37 66.30 66.52 66.38 66.55
Jun Ji
..... 66.
..... 66.
..... 66.
..... 66.
1971
..... 67.
..... 67.
..... 67.
..... 67.
..... 67.
..... 67.
il
07 08 10 31
15 29 39
.51
.75 72
Aug Sep Ot
66.28 67.01 67. 66. Il 67.21 68. 66.50 67.33 68. ..... 67.15 68.
..... ..... 68.
!t
.87
.01
.00 ,21
Nov
68.39 68.17 68.52 68.61
68.61
68.10 68.56 68.15 68.12 68.52 68.6?
Dec
68.71 68.63 68.65 68.32 68.1168.33
Genesee County
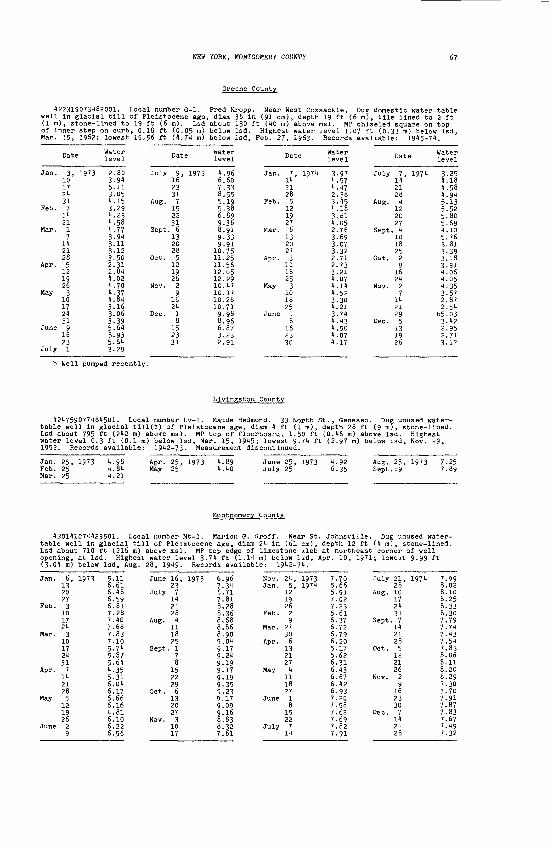
NEW YORK, MONTGOMERY COUNTY 67
County
122319073182001. Local number G-l. well in glacial till of Pleistocene age, (1 m), stone-lined to 19 ft (6 m). Lsd of inner step on curb, 0.18 ft (0.05 m) Mar. 15, 1962; lowest 15.56 ft (1.71 m)
Jan.
Feb.
Mar.
Apr.
May
June
July
Date
3, 1973101721317
112117
1121285
1219263
101721319
16231
Water level
235313111.3.3,3.3.2.2,1,1,1,H,3.3.3.5.5,5.3.
.80
.91
.11
.05
.15
.29
.23
.58 77.91.11.12.50.31.81.02.70.37.81.16.06.39.61.93.61.29
Date
July 9, 1973162331
Aug. 7152231
Sept. 6132028
Oct. 5121926
Nov. 29
1621
Dec. 18
152331
Fred Kropp. Near West Coxsackie. Dug domestic water-table diam 36 in (91 cm), depth 19 ft (6 m), tile-lined to 2 ft about 130 ft (10 m) above msl. MP chiseled square on top below Isd. Highest water level 1.07 ft (0.33 m) below Isd, below Isd, Feb. 27, 1963. Records available: 1915-71.
Water level
16785569899
10.11,11.12121010,10,10,9863 (2.
.96
.60
.33
.55
.19
.38
.89
.36 91.33 91.75.25.56.05.29.17.17.28.71.98.96.87.23.91
Date
Jan. 7, 1971112128
Feb. 5121927
Mar. 6132027
Apr. 3111825
May 3101825
June I8
162330
Water level
3.971.571.172.383.151.183.811.052.763.693.073-322.712.733.211.071.111.523.301.213-711.131.501.071.17
Date
July 7, 1971112128
Aug. 1122027
Sept. 1101825
Oct. 29
1621
Nov. 27
112129
Dec. 5131926
Water level
3.251.181.581.915.135.525.805.691.105.763.813-393.183.911.061.051.353-572.872.51
b5.033.122.952.713.12
b Well pumped recently.
Llvlngston County
121759077181501. Local number Lv-1. Maude Redmond. 33 North St., Geneseo. Dug unused water- table well in glacial till(?) of Pleistocene age, diam 1 ft (1 m), depth 28 ft (9 m), stone-lined. Lsd about 795 ft (212 m) above msl. MP top of floorboard, 1.50 ft (0.16 m) above Isd. Highest water level 0.3 ft (0.1 m) below Isd, Mar. 15, 1915; lowest 9.71 ft (2.97 m) below Isd, Nov. 29, 1952. Records available: 1912-73. Measurement discontinued.
Jan. 25, 1973 1.98 Apr. 25, 1973 1.89 June 25, 1973 1-92 Aug. 25, 1973 7.25Feb. 25 1.81 May 25 1.10 July 25 6.35 Sept.19 7-89Mar. 25 1.21
Montgomery County
130111071123501. Local number Mt-1. Marion G. Groff. Near St. Johnsville. Dug unused water- table well in glacial till of Pleistocene age, diam 21 in (61 cm), depth 12 ft (1 m), stone-lined. Lsd about 710 ft (216 m) above msl. MP top edge of limestone slab at northeast corner of well opening, at Isd. Highest water level 3.71 ft (1.11 m) below Isd, Apr. 10, 1971; lowest 9-99 ft (3.01 m) below Isd, Aug. 28, 1919. Records available: 1912-71.
Jan. 6, 1973 5.11 June 16, 1973 6.96 Nov. 21, 1973 7.70 July 21, 1971 7.9913 6.61 23 7.31 Jan. 5, 1971 5.66 28 8.0220 6.18 July 7 6.71 12 5-91 Aug. 10 8.1027 6.59 11 7.81 19 7-02 17 8.25
Feb. 3 6.81 21 8.28 26 7.23 21 8.3310 7.28 28 8.36 Feb. 2 5.61 31 8.3017 7.10 Aug. 1 8.68 9 6.37 Sept. 7 7.7921 7.68 11 8.86 Mar. 27 6.72 11 7-71
Mar. 3 7.83 18 8.90 30 6.79 21 7.1310 7-10 25 9.01 Apr. 6 6.20 28 7.5117 5-71 Sept. 1 9.17 13 5.17 Oct. 5 7.8321 5.87 7 9.21 21 5.62 12 8.0631 5.61 8 9.19 27 6.31 21 8.11
Apr. 7 1-35 15 9-17 May 1 6.13 26 8.2011 5.31 22 9.19 11 6.67 Nov. 2 8.2921 6.01 29 9.35 18 6.12 9 7-3028 6.17 Oct. 6 9.23 27 6.93 16 7-70
May 5 6.66 13 9.17 June 1 7.20 23 7-9112 6.16 20 9.09 8 7-58 30 7-8719 1.81 27 9.16 15 7.62 Dec. 7 7-8326 6.10 Nov. 3 8.83 22 7.69 11 7-67
June 2 6.22 10 8.32 July 7 7.82 21 7.199 6.56 17 7-61 11 7-91 28 7-32

GROUND-WATER LEVELS, 1973-71, NORTHEASTERN STATES
Onelda County
')33112075091501. Local number Oe-151. Henry Rubyor. At Woodgate. Dug domestic water-table well in glacial sand of Pleistocene age, diaro 36 in (91 cm), depth 31 ft (9 ml, stone-lined. Lsd 1,181.91 ft (152.61 m) above msl. MP top of 2-ft (1-m) square concrete well cover at midpoint of south side of rectangular opening, 1.00 ft (0.30 m) above Isd. Highest water level 11.1)7 ft (3.50 m) below Isd, May 13, 1972; lowest 30.31 ft (9.24 m) below Isd, Feb. 25, 1961. Records available: 1926-15, 1918-71.
Jan.
Feb.
Mar.
Apr.
May
June
July
Date
6, 19731320273
1017213
101721317
1121285
12192629
1623307
Water level
19.0018.7919.6919.7119.0617.8618.6819.3820.2820.6718.9316.9516.8816.3315.0315.6716.6817.8318.6818.0516.1917.0118.2018.9019.5820.1120.90
July
Aug.
Sept.
Oct.
Nov.
Dec.
Date
11, 197321281
111825
, 158
1522296
1320273
10172118
172229
Water level
2122232321212526272525262626262626262727272726232220
.50
.06
.13
.31
.08
.69
.08
.22
.27
.68
.59
.01
.32
.35 76.85 95 90.35.88.33.18.71.35.63.60
Jan.
Feb.
Mar.
Apr.
May
June
Date
5, 197112192629
162329
1623306
1320271
11182518
152227
Water level
19.2019.3920.1120.6020.2620.0720.5720.9920.9819.8519.0019.5619.9319.8118.8818.2817-5817-1117-5511.3715.0716.1117.1717-9318.7719-19
July
Aug.
Sept.
Oct.
Nov.
Dec.
Date
6, 19711320273
101721317
1121285
12192629
1623307
It2128
Water level
19.5119.1819.8620.5020.9821.0220.5121.3122.1022.5822.8723.5721.0721.5821.7825.1625.3225.6125.6725.8125.1923.7122.5522.1821.6221.70
Ontario County
Ap:
12 19 26
Mar. 5 12 19 26 2 9
16 23 30
May 7 11 21 28
June 1 11 18 25
1973 +10.10 10.1810.2110.2210.089-959.96
10.219.769.31
10.1910.3910.1710.5710.5110.5810.1810.3310.1310.1310.1810.219.869-919-719.769.55
July
Aug.
Sept,
Oct.
Nov.
Dec.
9, 19731623306
132027
. 310172118
1522295
1219263
10172131
+9.139.128.808.708.198.308.177.987-767.767-507-317.187.217-317.087.197.187.087-237-137.627-908.168.108.51
Rensselaer
Jan. 7, 1971112128
Feb. 1111825
Mar. 1111825
Apr. 18
152229
May 6132028
June 3101721
July 1
County
+8.828.788.929.009.179-239.229-209-529-369.699.159.829.80
10.1510.159.869.859.689.689.819-759.719-038.979-05
July 8, 15 22 30
Aug. 5 12 19 26
Sept. 2 9
16 23 30
Oct. 7 11 21 28
Nov. 1 11 18 25
Dec. 2 9
16 23 30
+8.82 8.73 8.35 8.37 8.22 8.10 8.00 7.89 8.17 8.11 8.13 8.12 8.71 8.67 8.83 8.16 8.528.598.608.588.799.219.239.119.109.17
123831073391001. Local number Re-700. William P. Hofmann. Near Defreestville. Dug domestic water-table well in sand and gravel of Pleistocene age, diam 1 ft (1 m), depth 16 ft (5 m), stone- lined. Lsd about 105 ft (123 m) above msl. MP top edge of concrete curbing at midpoint of north side of rectangular opening, 2.00 ft (0.61 m) above Isd. Highest water level 8.92 ft (2.72 m) below Isd, Apr. 1, 1970; lowest 15.19 ft (1.72 m) below Isd, Oct. 3, 1961. Records available: 1951-71-

HEW YORK, ST. LAWRENCE COUNTY
423834073391001 Continued.
Water n .. Water D Water . Water level Date level Date level Date level
Jan. 6, 1973 9.90 July 7, 1973 11.37 Jan. 5, 1974 11.17 July 7, 1971 11.6513 10.09 11 11.70 12 11.30 15 12.5020 9.81) 21 12.07 19 11.36 20 12.5728 10.19 28 12.1)8 26 10.75 27 12-72
Feb. 3 9.17 Aug. 4 12.27 Feb. 2 10.51) Aug. 3 12.9810 10.09 12 12.72 9 10.66 10 13.2717 10.53 19 13.19 16 10.84 17 13.1)524 10.71 26 13.00 23 9.95 21 13.80
Mar. 3 10.74 Sept. 1 13.17 Mar. 2 10.51 31 13.9410 10.66 8 13.25 9 10.55 Sept. 7 13.1)517 10.1)8 15 13.48 16 10.68 It 13.5t24 10.5t 22 13.53 24 10.13 22 13.3031 10.36 30 13.72 30 10.10 28 13.16
Apr. 7 9.62 Oct. 6 13.69 Apr. 6 10.06 Oct. 5 13-34It 10.00 13 14.29 13 9.63 12 13.2922 10.79 20 13-88 20 9.79 19 13.1829 10.05 27 13.85 27 9.90 26 13.54
May 7 10.58 Nov. 3 13.84 May t 9.92 Nov. 2 13.5013 10.45 10 13-90 11 10.17 11 13-0919 9-90 17 13-95 18 9-85 16 12.5327 9.70 28 13.87 25 10.00 24 11.80
June 2 10.06 Dec. 2 13.84 June 2 10.69 Dec. 1 11.5210 10.63 8 13.74 8 10.88 8 11.3516 10.98 15 13-19 15 H-t4 15 11.1123 11.t5 22 12.50 22 11.to 22 11.0330 11.12 29 11.35 29 11.78 28 11.05
Roekland County
Jan. 5, 1973 13.08 July 16, 1973 15.15 Dec. 24, 1973 19.31 July 8, 197t 18.0016 14.53 2t 16.13 Jan. 15, 1974 14.90 15 18.5026 14.53 31 16.90 22 15.25 22 19.12
Feb. 9 11-75 Aug. 7 17-59 29 12.20 29 19.6724 15-15 14 18.33 Feb. 5 13.17 Aug. 5 20.30
Mar. 5 15-79 21 18.99 12 14.38 12 20.8616 15.73 28 19.68 28 It.21 19 21.5426 14.85 Oct. 1 22.95 Mar. 15 15.18 Sept. 6 21.96
Apr. 11 12.01 9 23.69 22 15.25 13 21.5220 14.17 15 24.13 Apr. 5 13.36 20 21.80
May 1 14.36 30 25.33 27 11.55 27 22.3214 15.01 Nov. 7 25.85 May 10 15.65 Oct. 4 22.3022 15.04 16 26.38 20 15-75 18 22.86
June 4 15.57 27 27.01 28 16.00 Nov. 8 23.3411 16.09 Dec. 4 27.30 June 10 16.62 15 23.5022 16.87 11 27.18 17 17.03 Dec. 6 22.91
July 3 11.17
St. Lawrence County
4t4904071455201. Local number St-10. State Dept. of Environmental Conservation. Near Brasher Palls. Dug unused water-table well in glacial sand of Pleistocene age, dlara 36 in (91 cm), depth 12 ft (1 ra), concrete cased to 12 ft (4 m), open end. Lsd 299 ft (91 m) above msl (determined with barometric altimeter). MP chisled mark on top edge of 6- x 8-in (15- x 20-cm) opening of concrete well cover, 0.70 ft (0.21 m) above Isd. Highest water level 3.24 ft (0.99 m) below Isd, Apr. 21, 1971; lowest 9.38 ft (2.86 m) below Isd, Oct. 24, 1964. Records available: 1953-74.
Jan. 3, 1973 5.17 June 6, 1973 1.66 Nov. 7, 1973 7.40 Apr. 10, 1974 1.5810 5-26 13 1.75 14 7.50 17 4.3417 5.46 20 4.68 21 7.38 24 1.5924 4.78 27 5.04 28 6.98 May 1 4.4831 5-12 July 3, 5.17 Dec. 5 6.78 8 1.59
Feb. 7 4.86 11 5.51 12 6.51 15 4.7211 5.14 18 5.85 19 6.49 22 4.9121 5.33 26 6.24 26 6.23 29 5.0928 5.48 Aug. 1 6.57 Jan. 2, 1974 7.59 June 5 5.20
Mar. 7 5.25 8 6.61 9 5.90 12 5.1114 4.36 15 6.95 16 6.19 19 5.3522 4.36 22 7.17 23 6.12 26 5.4728 4.55 29 7.42 30 5.47 July 3 5.67
Apr. 4 3.96 Sept. 5 7.65 Feb. 6 5.46 11 5.9511 1.36 12 7.69 14 5.80 17 6.2918 4.60 19 7.71 20 6.01 24 6.3125 4.80 26 7.45 27 5.91 31 6.13
May 2 4.86 Oct. 3 7.51 Mar. 6 5-30 Aug. 8 6.3610 4.96 10 7.09 13 5.10 14 6.6116 4.98 17 7.21 20 5.36 21 6.8123 1.34 24 7.41 27 5.47 28 7.1430 4.70 31 7-18 Apr. 3 5.13 Sept. 4 7.36

GROUND-WATER LEVELS, 1973-74, NORTHEASTERN STATES
l|HI)90l)07HI*55201 Continued.
Date Water Water Water n Water level Date level Date level Date level
Water uate level
Oct. 9, 1974 7.0016 7.1023 7.2230 7.33
Schenectady
Date
Nov. 6, 19741320
Dec. 3
County
Water level
7.377.326.896.22
Sept.11, 1971* 7.41 Oct. 9, 1974 7.00 Nov. 6, 197!) 7.37 Dec. 11, 1971) 6.0318 7.56 16 7.10 13 7.32 18 5.9925 7.09 23 7.22 20 6.89 25 6.06
Oct. 2 7.23
42H910073591401. Local number Sn-363. City of Schenectady. Drilled observation water-table well in sand and gravel of Pleistocene age, diam 6 in (15 cm), original depth 57 ft (17 m), cased to 57 ft (17 m), open end. Lsd 228.50 ft (69.65 m) above msl. MP top of shelter platform, 2.55 ft (0.78 m) above Isd. Highest water level 3.62 ft (1.10 m) below Isd, Dec. 27, 1973; lowest 31.27 ft (9.53 m) below Isd, Feb. 10, 1966. Records available: 1960-74. Water levels affected by stage of Mohawk River and by pumping from municipal well field.
Highest water level for the day, from recorder graph, 1973
Day
510 15 20 25 Eom
Jan
16.16 18.13 19.92 11*. 13 11.29 18.06
Peb
9.1)9 17.03 18.97 20.18 20.72 20. 54
Mar
20.1)0 17.89 19.12 17.03 20.07 21.00
Apr
e!3.5 17. t9 19.50 20.00 19.70 18.83
May
19.0019. on18.09 13.4217.03 17.18
Jun
18.86 19.55 19.12 19.88 20.16 16.45
Jul
18.02 20.81 20.03 21.53 21.63 21.05
Aug
20.34 22.19 19.22 20.35 21.17 22.10
Sep
21.38 19-91 20.07 19.47 19-98 20.01
Oct
20.75 19.79 20.13 20.62 20.39 20.05
Nov
19.29 20.19 20.36 19.77 19.28 19.32
Dec
19.69 el8.95
2o!51 9.75
14.73
1974
5 10 15 20 25 Eom
19.09 19-13 18.95 19.07 17.12 15.71
17.96 19.13 19.68 20.3913.79 16.D5
18. 8H 18.50 20.82 20.77 20.78 21.97
17.50 18.16 16. 6H 18.81 19.7H 20.96
18. 7t 18.47 16.61 18.10 18.49 19.06
19.83 21.00 19.99 19.58 19.61 19.05
14.77 20.15 21.63 20.99 20.25 18.82
19.29 19.78 21.02 20.67 19.32 18.81
17.99 19.23 18.39 18.61 18. HO 18.27
19.03 18.98 19.47 18.25 18.94 18.76
18.92 elS.tl
18.12 19.90 18.23
18.78 17.15 19.16 21.57 19.35 19.64
e Estimated.
Washington County
H31026073194101. Local number W-26H. Village of Salem. Dug fire-protection water-table well in glacial gravel of Pleistocene age, approximate size 8 x 12 ft (2 x H m), depth 15 ft (5 m), stone-lined. Lsd t85.5 ft (1H8.0 m) above msl. MP top edge of concrete cover at north side of square opening, at Isd. Highest water level 6.62 ft (2.02 m) below Isd, Apr. t, I960; lowest 11.70 ft (3.57 m) below Isd, Oct. 12, 1964. Records available: 1946-74. Water levels affected by floods of nearby stream.
Water ,. . Water ., . Water _, , Water level Date level Date level Date level
Jan. 1, 1973 9.07 Oct. 21, 1973 10.12 Mar. 20, 1974 8.97 Aug. 20, 1974 10.92May 25 8.21» Nov. 27 10.77 Apr. 21 8.97 Sept.20 9.98June 6 9.03 Dec. 27 8.95 May 2H 8.97 Oct. 20 9.95
27 9-89 Jan. 2H, 1974 9.93 June 20 10.00 Nov. 20 9-97July 26 9.99 Feb. 26 8.99 July 19 10.00 Dec. 18 9.92Aug. 21 9-94
Westchester County
Highest water level for the day, from recorder graph, 1973
Day Jan Feb Mar Apr May Jun Jul Aug
5101520?5
22. 6H22.7122.7222.7422.9022.88
22.5922.5322.3622.5722.6922.70
22.7722.7822.7022.8722.7822.95
22.7222.5622.7122.6922.6822.67
22.6122.6222. 6H22.6722.7122.70
22.7022.7822.8022.8922. 9H22.95
22.87
23.0322.8222.86
22.8722.8422.9023.0223.1023.18
23.2123.1923.3423.3723.4923.51
23.5923.6823.7023.8123-9323.90
23.932H.092H.052H.1924. 1H24.21
24.2224.172H.1H24.0023.7923.60

NEW YORK, NASSAU COUNTY
410152073460401 Continued.
1974
Day
10 15 ,
Jan
23.52 23. "4
Feb
23.23 23.30
Mar
23. 24 23.37
Apr May
23.03 23.05
Jun
23.25 23.39
Jul
23.60 23.68
Aug
24.01 21.09
Sep
23.67 23.60
Oct Nov
23.68 ..... 23.68 .....
Dec
Wyoming County
423739077595501. Local number Wo-1. State Dept. of Environmental Conservation. Letchworth State Park, near Castle. Dug unused water-table well in glacial tlll(?) of Pleistocene age, diam 2 in (5.1 cm), depth 14 ft (4 m), well point (60-gauze screen) 11-14 ft (3-4 m). Lsd about 1,020 ft (311 m) above msl. MP top of 2- x 1-in (5.1- x 2.5-cm) reducing coupling, 3.33 ft (1.01 m) abov Isd. Highest water level 0.5 ft (0.2 m) below Isd, Apr. 5, 1947; lowest dry, Dec. 6-27, 1964, Jan. 2, 1965. Records available: 1942-74.
Water n . Water _. . Water n , Wat level Date level Date level Date lev
Jan. 20, 1973 3-72 Jan. 19, 1974 5.46 June 1, 1974 3.63 Aug. 27, 197" 11.97Feb. 20 3.58 Feb. 23 2.25 9 4.75 Sept. 1 12.21Mar. 19 2.02 Mar. 19 2.73 17 6.03 8 12.47Apr. 22 3.02 Apr. 1 1.97 23 5.48 15 12.67May 20 3.13 7 2.71 30 7.12 22 12.92June 17 3.79 1" 2.20 July 7 8.57 29 13.03July 22 7.66 21 3.11 14 9.36 Oct. 6 13.16Aug. 25 10.73 28 3.22 21 10.06 15 13.35Sept.23 12.00 May 5 3.38 29 10.51 20 13."6Oct. 21 13.07 12 1.95 Aug. " 10.90 28 13-60Nov. 17 13-73 19 2.67 11 11.29 Nov. 17 13-"1Dec. 22 12.26 28 3.20 18 11.57 Dec. 17 6.65
LONG ISLAND
Kings County
404149073571201. Local Drilled unused water-table screen assumed at bottom. (1.81 m) below Isd. High (9.07 m) below msl, Nov.
Apr. 3, 1973 +2.15 Jan. 9, 1974July 9 2.58 Mar. 19Oct. 2 4.04
403819073581101. Local number K530. J. Morea. 912 Cortelyou Rd., Flatbush. Drilled observa tion water-table well in upper glacial aquifer, diam 18 in (46 cm), depth 145 ft (44 m), screened 95-145 ft (29-44 m). Lsd 40.1 ft (12.2 m) above msl. MP top of l»t-in (3.2-cm) nipple, 7.21 ft (2.20 m) below Isd. Highest water level 8.75 ft (2.67 m) above msl, July 2, 1973; lowest 5.89 ft (1.80 m) below msl, June 2", 1947. Records available: 1947-7".
Apr. 3, 1973 +8.30 Sept.24, 1973 +8.44 Mar. 19, 1974 +8.20 Sept. 4, 197" +8.23 July 2 8.75 Jan. 10, 197" 8.33 June 28 8.14 Dec. 20 8.30
Nassau County
"040"3073413001. Local number N7. Long Island State Park Commission. Corona Ave. and Remsen St., Valley Stream. Drilled unused artesian well in Lloyd aquifer, diam 10 to 6 in (25 to 15 cm), depth 911 ft (278 m), screened 851-911 ft (259-278 m). Lsd 20.8 ft (6.3 m) above msl. MP top of reducer, 2.16 ft (0.66 m) above Isd. Highest water level 12.75 ft (3.89 m) above msl, Mar. 9, 1941; lowest 6.84 ft (2.08 m) below msl, Aug. 25, 1970. Records available: 1936-74.
Jan. 2, 1973 +1.04 June 22, 1973 +0.58 Apr. 8, 197" +4.69 Oct. 1, 197" -5.0"10 1.11 Sept.21 -4.14 June 20 +3.26 Dec. 19 -4.14
Mar. 19 3.77 Dec. 26 -4.53
404048073412501. Local number N9. Long Island State Park Commission. Corona Ave. and Remsen St., Valley Stream. Drilled unused artesian well in Magothy aquifer (previously reported in sands of Magothy aquifer), diam 6 to 4 in (15 to 10 cm), depth 138 ft (42 m), screened 98-138 ft (30-42 m). Lsd 23.2 ft (7.1 m) above msl. MP top of casing, 1.48 ft (0.45 m) above Isd. Highest water level 23.57 ft (7.18 m) above msl, Sept. 3, 1938; lowest 1.88 ft (0.57 m) above msl, June 20, 1974. Records available: 1936-74.

GROUND-WATER LEVELS, 1973-71, NORTHEASTERN STATES
101018073112501-- Continued.
Water n Water . Water level Date level Date level
Jan. 3, 1973 +15.22 June 22, 1973 +11.60 Dec. 26, 1973 +11.56 June 20, 1971 +1.88 Mar. 19 15.56 Sept.21 12.61 Apr. 8, 1971 12.19 Dec. 19 9.96
101029073291201. Local number N180. City of New York. Dept. of Water Supply, Gas and Elec tricity. Sunrise Hwy. and Seamans Neck Rd., Seaford. Drilled unused artesian well in Magothy aquifer, diam 1 to 6 in (10 to 15 cm), depth 762 ft (232 m), screen assumed at bottom. Lsd 15.3 ft (1.7 m) above msl. MP top of 1-in (10-cm) coupling, 11.30 ft (1.36 ra) above Isd. Highest water level 21.08 ft (6.13 m) above msl, June 6, 1952; lowest 12.80 ft (3.90 m) above msl, July 15, 1966. Records available: 1915-71.
Mar. 28, 1973 +15.91 Sept.21, 1973 +15.89 Apr. 8, 1971 +17.36 Oct. 1, 1971 +11.67 June 22 16.83 Dec. 20 15.69 June 19 11.72 Dec. 16 15.19
101609073121601. Local number N1102. Nassau County Dept. of Public Works. Long Island Expressway and Community Dr., Lake Success. Drilled observation water-table well In upper glacial aquifer (previously reported in deposits of late Pleistocene age), diam 1 In (10 cm), depth 166 ft (51 m), screened 161-166 ft (19-51 m). Lsd 181.0 ft (56.1 m) above msl. MP top of 1-in (10-cm) coupling, 0.32 ft (0.10 m) below Isd. Highest water level 59.12 ft (18.02 m) above msl, May 25, 1953; lowest 28.17 ft (8.68 m) above msl, June 29, 1973. Records available: 1939-7%.
28, 1973 +30.91 Sept.21, 1973 +31.01 Apr. 10, 1971 +33.98 Oct. 1, 1971 +33-39 29 28.17 Dec. 27 30.19 June 20 31.26 Dec. 19 32.72
,.,^._..._. Local number N1110. Nassau County Dept. of Public Works. Henry St. near State Parkway, North Valley Stream. Driven observation water-table
Mar. 27, 1973 +77.62 Sept.21, 1973 +80.28 Apr. 10, 1971 +80.53 Oct. 3, 1971 +79.62 June 27 79.13 Dec. 20 80.72 June 19 80.21 Dec. 19 79.73
101317073290901. Local number N1259. U.S. Geol. Survey. Hicksville-Massapequa Rd., Plalnedge. Driven observation water-table well in upper glacial aquifer (previously reported in deposits of late Pleistocene age), diam lA In (3.2 cm), depth 11 ft (13 m), screened 38-11 ft (12-13 m). Lsd 78.1 ft (23.9 m) above msl. MP top of casing, 0.32 ft (0.10 m) below Isd. Highest water level 56.99 ft (17.37 m) above msl, June 23, 1952; lowest 15.61 ft (13.90 m) above msl, Aug. 25, 1966. Records available: 1909-10, 1912-16, 1930-35, 1937-71.
Jan. 26, 1973 +53.23 July 25, 1973 +51.75 Jan. 25, 1971 +52.15 July 23, 1971 +51.17Feb. 22 51.19 Aug. 21 53.76 Feb. 22 52.69 Aug. 27 50.38Mar. 27 51.92 Sept.21 52.88 Mar. 22 52.69 Sept.21 50.71Apr. 26 55.07 Oct. 21 52.01 Apr. 21 53-56 Oct. 21 50.82May 21 51.93 Nov. 26 51.16 May 23 53.11 Nov. 22 50.61June 25 51.13 Dec. 20 51.51 June 21 52.17 Dec. 21 50.88
101551073351501. Local number N1616. Nassau County Dept. of Public Works. Post Ave. and Argyle Rd., Westbury. Driven observation water-table well in upper glacial aquifer (previously re ported in deposits of late Pleistocene age), diam 2 in (5.1 cm), depth 68 ft (21 m), screened 65-68 ft (20-21 m). Lsd 122.1 ft (37-3 m) above msl. MP top of casing, 0.32 ft (0.10 m) below Isd. Highest water level 85.12 ft (26.01 m) above msl, June 1, 1939; lowest 68.28 ft (20.81 m) above msl, Feb. 28, 1967. Records available: 1913-15, 1932-71.
Jan. 26, 1973 +73.73 July 25, 1973 +77.03 Jan. 28, 1971 +75.80 July 25, 1971 +76.03Feb. 22 71.31 Aug. 27 76.75 Feb. 22 75.90 Aug. 28 75.65Mar. 27 71.91 Sept.21 76.52 Mar. 22 75.96 Sept.21 75.61Apr. 27 75-72 Oct. 21 76.15 Apr. 21 76.15 Oct. 21 75-56May 29 76.51 Nov. 26 75.68 May 23 76.19 Nov. 25 75.30June 25 76.72 Dec. 21 75-76 June 21 76.51 Dec. 21 75.11

NEW YORK, SUFFOLK COUNTY
105101073313101. Local number N2528. Nassau County Dept . of Public Works. Chicken Valley and Wolver Hollow Rds., Upper Brookvllle. Drilled observation artesian well in Magothy aquifer (pre viously reported in sands of Magothy aquifer), diam 6 to 1 in (15 to 10 cm), depth 282 ft (86 m), slotted 278-282 ft (85-86 m). Lsd 92.5 ft (28.2 m) above msl. MP top of 6-in (15-cm) nipple, 0.77 ft (0.23 m) above Isd. Highest water level 79-92 ft (21.36 m) above msl, July 25, 1957; lowest 59.12 ft (18.02 m) above msl, Feb. 21, 1967. Records available: 1917-71. Mar. 27, 1973, +67.26; Apr. 8, 1971, +70.37; June 19, +70.16; July 15, +69.11; Oct. 2, +69.76; Dec. 16, +70.67.
101619073270602. Local number N3355. U.S. Geol. Survey. Round Swamp Rd., Plainview. Drilled observation artesian well in Lloyd aquifer, diam 8 to 1 in (20 to 10 cm), depth 1,090 ft (332 m), screened 1,070-1,090 ft (326-332 m). Lsd 183.3 ft (55-9 m) above msl. MP top of casing, 0.76 ft (0.23 m) below Isd. Highest water level 36.52 ft (11.13 m) above msl, Apr. 9, 1957; lowest 23.18 ft (7.07 m) above msl, Apr. 11, 1972. Records available: 1951-71.
Water n . Water _. . Water _. . Water level Oate level Date level Date level
Jan. 16, 1973 +25.66 Sept.21, 1973 +29.81 Apr. 8, 1971 +30.53 Oct. 1, 1971 +29.17Mar. 28 25.75 Dec. 27 29.66 June 19 29-75 Dec. 19 30.65June 27 31.57
Queens County
101151073175001. Local number Q283 . City of New York, Dept. of Water Supply, Gas and Elec tricity. Underhill Ave. and 171st St., Flushing. Drilled unused artesian well in Lloyd aquifer, diam 26 to 12 in (66 to 30 cm), depth 109 ft (125 m), screened 309-352, 367-109 ft (91-107, 112-125 m). Lsd 27.0 ft (8.2 m) above msl. MP top of iron plate, 0.37 ft (0.11 m) above Isd. Highest water level 5.18 ft (1.67 m) above msl, Apr. 7, 1955; lowest 15.78 ft (4.81 m) below msl, Aug. 5, 1971. Records available: 1916-71.
Jan. 10, 1973 -11.25 Sept.27, 1973 -11.02 Mar. 20, 1971 -1.15 Sept.25, 1971 -11.67Apr. 1 10.02 Jan. 17, 1971 10.03 June 25 12.03 Dec. 18 3.60June 26 10.33
101157073180102. Local number Q1252. U.S. Geol. Survey. Liberty Ave. and 157th St., Jamaica. Driven observation water-table well in upper glacial aquifer (previously reported in deposits of late Pleistocene age), diam 1% in (3.2 cm), depth 60 ft (18 m), screened 50-80 ft (15-21 m), pre viously reported 58-60 ft (17.7-18.3 m). Lsd 31.2 ft (9.5 m) above msl. MP top of l\-in (3.2-cm) coupling, 0.31 ft (0.09 m) above Isd. Highest water level 13.92 ft (4.21 m) above msl, Nov. 2, 1918; lowest 2.81 ft (0.86 m) below msl, Feb. 9, 1971. Records available: 1940-71.
Apr. 1, 1973 -0.62 Sept.27, 1973 +0.21 Mar. 21, 1971 -1.13 Sept.25, 1971 -0.95 June 25 -1.36 Jan. 7, 1971 -.19 June 26 1.11 Dec. 18 .31
103957073195002. Local number Q2321. New York Racing Association, Inc. North Conduit Ave. and 111th St., Aqueduct. Driven observation water-table well in upper glacial aquifer (previously reported in deposits of late Pleistocene age), diam 2.5 in (6.1 cm), depth 91 ft (28 m), screen assumed at bottom. Lsd 22.0 ft (6.7 m) above msl. MP top of 2.5-in (6.1-cm) coupling, at Isd. Highest water level 1.93 ft (0.59 m) above msl, Apr. 27, 1961; lowest 3.10 ft (1.01 m) below msl, May 25, 1959. Records available: 1959-71.
Apr. 1, 1973 +1-57 Jan. 17, 1971 +1.20 June 25, 1971 +1.17 Sept.25, 1971 +1.69 Sept.27 1.15 Mar. 21 1.17 Sept. 3 1.18 Dec. 18 1.81
Suffolk County
101611073161101. Local number S1810. U.S. Geol. Survey. Gardiner Dr., Pineaire. Driven observation water-table well in upper glacial aquifer (previously reported in deposits of late Pleistocene age), diam l>c in (3.2 cm), depth 56 ft (17 m), screened 51-56 ft (16-17 m). Lsd 90.1 ft (27.5 m) above msl. MP top of casing, 1.03 ft (0.31 m) above Isd. Highest water level 56.19 ft (17.13 m) above msl, Apr. 29, 1939; lowest 13-30 ft (13.20 m) above msl, Feb. 27, 1967. Records available: 1912-11, 1932-71.
Jan. 26, 1973 +50.25 July 25, 1973 +53.69 Jan. 28, 1971 +51.62 July 23, 1971 +50.23Feb. 22 51.31 Aug. 27 53-25 Feb. 22 51-83 Aug. 27 50.75Mar. 27 51.18 Sept.21 52.71 Mar. 22 51.81 Sept.21 50.63Apr. 27 52.91 Oct. 21 52.07 Apr. 21 52.15 Oct. 21 50.17May 29 53-58 Nov. 26 51.17 May 23 52.61 Nov. 25 19-95June 25 53-13 Dec. 21 51-68 June 21 52.11 Dec. 21 50.18
105116073031901. Local number S3513. New York State Dept. of Transportation. State Hwy. 25, Selden. Drilled unused water-table well in upper glacial aquifer (previously reported in deposits of late Pleistocene age), diam 8 in (20 cm), depth 65 ft (20 m), screened 63-65 ft (19-20 m). Lsd 102.1 ft (31.1 m) above msl. MP top of reducer, 0.21 ft (0.06 m) above Isd. Highest water level 67.63 ft (20.61 m) above msl, Mar. 5, 1952; lowest 56.06 ft (17-09 re) above msl, Mar. 1, 1967. Records available: 1912-71.
Mar. 28, 1973 +63-33 Jan. 23, 1971 +61.73 Aug. 29, 1971 +65-07 Nov. 27, 1971 +61.18June 26 65.31 Apr. 1 65.63 Sept.30 61.81 Dec. 31 63.96Aug. 10 65.01 July 16 65.86 Oct. 31 61.12

71) GROUND-WATER LEVELS, 1973-71, NORTHEASTERN STATES
105030073181101. Local number S35H. Heatherwood Shopping Center. Jericho Turnpike, Coramack. Dug unused water-table well in upper glacial aquifer (previously reported in deposits of late Pleistocene age), diam 30 in (76 cm), depth 98 ft (30 m), brick-lined. Lsd 153.6 ft (06.8 m) abov< rasl. MP top of 2-in (5.1-cm) coupling, 0.18 ft (0.05 m) above Isd. Highest water level 73.72 ft (22.17 m) above msl, June 25, 1973; lowest 61.23 ft (19.58 m) above msl, Mar. 18, 26, 1951. Records avsilable: 1912-71.
Water Water _ t Water Water level Date level Date level Date level
Mar. 27, 1973 +72.65 Oct. 10, 1973 +73.21 July 12, 1974 +72.61 Oct. 30, 1971 +72.31Apr. 30 73.26 Jan. 11, 1971 70.32 Aug. 29 72.23 Nov. 26 72.00June 25 73.72 Apr. 15 70.18 Sept.30 , 72.59 Dec. 31 71.91
105037072390301. Local number S3513. City of New York, Board of Water Supply. West of Old Riverhead Rd., Westhampton. Driven observation water-table well in upper glacial aquifer (previ ously reported in deposits of late Pleistocene age), diam 2 in (5.1 cm), depth 58 ft (18 m), screened 56-58 ft (17-18 m). Lsd 64.1| ft (19.6 m) above msl. MP top of casing, 0.01 ft (0.01 m) above Isd. Highest water level 21.16 ft (6.54 m) above msl, June 24, 1958; lowest 15.03 ft (1.58 m) above msl, Jan. 26, 1967. Records available: 1907-09, 1942-43, 1917-71.
Mar. 30, 1973 +20.12 Dec. 26, 1973 +18.90 Sept.30, 1971 +18.08 Nov. 27, 1971 +17.15July 2 21.21 Mar. 29, 1971 18.35 Oct. 31 17.71 Dec. 27 17.20Oct. 1 20.23 July 4 18.90
1973 +11.78 11.84 11.91 11. 11.91 11.9512.0712.0812.1512.2012.1012.3112.5512.7012.78
1973 +12.84 12.95 12.99 13.01 12. 12.96 12.92 13.03 13.07 13.07 13.0113.0013.01
Sept.21, 1973 +12.87 Oct. 1 12.81
12.79142229
Nov. 11118
12.1912.0812.0612.0611.11.7711.7211.8111.7611.1510.5110.8510.81
Apr May June 24 July 29 Aug. 26 Sept.30 Oct. 28
105119072532201. Local number S5517. Brookhaven National Laboratory. Upton Rd. and Princeton Ave., Upton. Drilled observation water-table well in upper glacial aquifer (previously reported in deposits of late Pleistocene age), diam 1 in (10 cm), depth 91 ft (28 m) , screened 85-91 ft (26-28 m). Lsd 115.0 ft (35.1 m) above msl. MP top of casing, O.Ol ft (0.01 m) above Isd. High est water level 16.93 ft (11.30 m) above msl, June 25, 1958; lowest 33.31 ft (10.16 m) above msl, Mar. 1, 1967. Records available: 1918-74.
Apr. 5, 1973 +42.14 Dec. 26, 1973 +41.70 Sept. 30, 1974 +40.46 Nov. 27, 1974 +39.51June 28 43.80 Mar. 20, 1974 41.45 Oct. 31 39-70 Dec. 31 39.14Sept, 26 43.57 June 11 43.38
405223072523402. Local number S6455. Brookhaven National Laboratory. 10th St.-and Fourth Ave., Upton. Drilled observation artesian well in Magothy aquifer (previously reported in sands of Magothy aquifer), diam 4 in (10 cm), depth 962 ft (293 m), screened 952-962 ft (290-293 m). Lsd 84.6 ft (25.8 m) above rasl. MP top of casing, 0.16 ft (0.05 m) below Isd. Highest water level 41.70 ft (12.71 m) above rasl, June 25, 1958; lowest 33.82 ft (10.31 m) above msl, Dec. 27, 1966, Mar. 1, 1967. Records available: 1949-52, 1954-74.
Mar. 22, 1973 +40.00 Sept.26, 1973 +40.05 Mar. 20, 1974 +39.68 Sept.20, 1974 +38.70Apr. 5 40.43 Dec. 26 39-59 June 11 40.06 Dec. 31 38.04July 2 41.03

NEW XORK, SUFFOLK COUNTY
Water - Water - Water D Water level Date level Date level Date levelDate ""i Date
Mar. 1, 1973 +7.98 Aug. 1, 1973 +7.H Mar. 1, 1971 +7.21 Sept.lS, 1971 +6,3629 9.08 31 6.82 Apr. 10 6.89 Oct. 21 5.90
May 8 8.59 Oct. 1 6.59 June 26 6.92 Dec. 27 5.89June 1 8.53 Dec. 21 6.75

observation-well program was continued in Ohio during the period 1973 through 1974 in coop- i with the Ohio Department of Natural Resources, Division of Water, and the Miami Conser- istrict. Figure 11 shows the location of observation wells included in this report.ancy Di
Well-Numbering Syste
Well Descriptions and Water-Level Measurements
Water levels are reported in feet below land-surface datum, unless otherwise indicated.
Auglaize County
403313083535200. Local number Au-1. C. W. Manchester. Near New Hampshire. Drilled unused artesian well in limestone, diam 4 in (10 cm), depth 96 ft (29 m), casing information not available. Lsd 1,035 ft (315 m) above msl. MP floor of instrument shelter, 3.70 ft (1.13 m) above Isd. Highest water level 14.33 ft (4.37 m) below Isd, Apr. 11, 1948; lowest 27.35 ft (8.34 m) below Isd, Jan. 21, 22, 1965- Records available: 1946-74. Measurement discontinued June 25, 1974.
Lowest water level for the day, from recorder graph, 1973
Day
510 15 20 25 Eom
Jan
20. '45 20.47 20.67 20.84
21.31
Feb
20.65 20.62 20.52 20.68 20.77 20.84
Mar
20.87 20.71 20.50 20.35 20.33 20.24
Apr
20.18 20.13 20.17 20.18 20.1620.15
May
20.27 20.20 20.18 20.16 20.20 20.43
Jun
20.35 20.56 20.56 20.56 20.61 20.60
1974
21.66
Jul
20.62 20.67 20.74 20.98 20.61 20.78
Aug
20.95 20.94 20.76 20.73 20.73 21.08
Sep
21.06 21.17 21.41 21.48 21.63 21.70
Oct
21.83 21.96 21.96 22.23 22.11 22.09
Nov
22.25 22.47 22.33 22.40 22.42 22.34
Dec
22.06 21.96 21.74 21.62 21.55 21.47
Belmont County
400619080423200. Local number B-l. City of Martins Ferry. Drilled unused water-table well in gravel; diam 40 in (102 cm); depth 61 ft (19 m), previously reported 79 ft (24 m); cased. Lsd 650 ft (198 m) above msl. MP floor of instrument platform, 13.40 ft (4.08 m) above Isd (since January 1973). Highest water level 0.05 ft (0.02 m) below Isd, Mar. 11, 1964; lowest (revised), 38.95 ft (11.87 m) below Isd, Sept. 27, 1968. Records available: 1948-74.
Lowest water level for the day, from recorder graph, 1973
Day
5 10 15 20 25 Eom
Jan
30.60 35.10 35.40 34.85 34.51 33.68
Feb
28.50 39.90 33.«5 35.10
Mar
34^54 31.75
Apr
30.00 29.15 31.40 31.53 31.58 25.80
May
29.20 28.50 30.14 32.30 32.50 33.09
Jun
33.43 34.10 35.45 35.36 35.51 35.49
Jul
36.27 36.54 36.81 37.00 36.46 36.70
Aug
36.25 36.78 35.40 35.67 36.10 36.90
Sep
37-06 36.39 36.38 36.31 36.31 34.37
Oct
34.85 35.45 35.15 35.11 35.32 32.15
Nov
32.92 34.40 34.65 34.49 33.50 30.80
Dec
32.40 33.85 31.20 33.15 29.70 25.60
76

Figure 11. Location of observation wells In Ohio, 1973-7 1!.
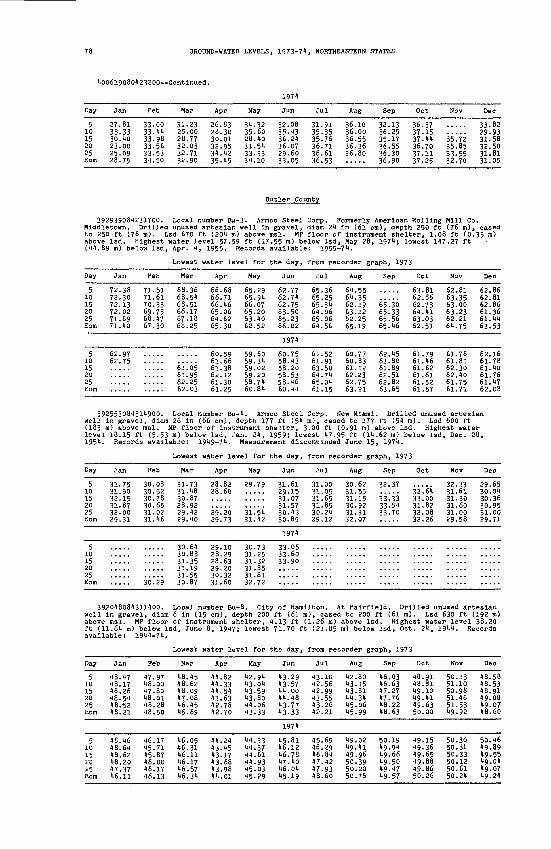
78 GROUND-WATER LEVELS, 1973-71, NORTHEASTERN STATES
1006l9080l23200--Contlnued.
1971
Day
5 10 15 20 25 Eom
Jan
27.81 33.33 30.1*0 23.00 25.09 28.75
Peb
33.00 33.11 33.98 33.56 33.53 31.50
Mar
31.23 25.00 28.77 32.03 32.71 32.90
Apr
26.83 28.30 30.01 32.95 31.1235.15
May
31.32 35.60 28.10 31.51 33-33 31.10
Jun
32.08 35-13 36.21 36.07 29.60 33.05
Jul
31.91 35.35 35.76 36.71 36.61 36.53
Aug
36.10 36.00 36.55 36.36 36.80
Sep
32.13 36.25 35.17 36.55 36.30 36.90
Oct
36.37 37.15 37.11 36.70 37.11 37.25
Nov
35^72 35.85 33.55 32.70
Dec
33.82 29-93 31.58 32.50 31.81 31.05
Butler County
Day
5 10 15 20 25 Eom
Jan
72.38 72.30 72.13 72.02 71.69 71.10
Feb
71.51 71.61 70.33 69.75 68.17 67.30
Mar
68.36 68.51 68.51 66.17 67.18 68.25
Apr
66.68 66.71 66.16 65.06 61.62 65.30
May
65.29 65.91 66.07 65.20 63.10 62.52
Jun
62.77 62.71 62.75 63.50 65.23 66.02
Jul
65.36 65.25 65.31 61.06 65.06 61.56
Aug
61.55 61.35 62.19 63.12 62.25 65-19
Sep
65^30 65.33 65.56 65.16
Oct
63.81 62.86 62.73 61.11 63.03 62.51
Nov
62.81 63.35 63.00 63.23 62.21 61.75
Dec
62.86 62.81 62.86 61.36 61.11 63.53
1971
5 10 15 20 25 Eon
62.97 62.75
61.05 61.95 62.25 62.03
60.59 61.66 61.38 62.12 61.30 61.25
59.60 59.31 59.02 59.20 58.71 60.81
60.75 58.13 58.20 58.53 58.16 60.11
61.52 61.91 63.50 61.71 65.01 61.15
60.77 60.83 61.12 62.23 62.75 63.21
62.15 63.80 61.89 62.51 62.82 63.65
61.79 61.16 61.62 61.61 61.52 61.57
61.76 61.81 62.30 62.10 61.75 61.71
62.16 61.78 61.10 61.76 61.17 62.08
392553081311900. Local number Bu-1. Armco Steel Corp. New Miami. Drilled unused artesian well In gravel, dlam 26 In (66 cm), depth 177 ft (51 m), cased to 177 ft (51 m). Lsd 600 ft (183 m) above msl. MP floor of Instrument shelter, 3.00 ft (0.91 m) above Isd. Highest water level 18.15 ft (5.53 m) below Isd, Jan. 21, 1959; lowest 17.95 ft (11.62 m) below Isd, Dec. 28, 1951- Records available: 1919-71. Measurement discontinued June 15, 1971.
Lowest water level for the day, from recorder graph, 1973
Day
510
20 25
Jan
31.75 31.90 32.1531.87 32.0029.31
Feb
30.08 30.52
30.65 31.02 31.16
Mar
31-73 31.18
28.92 29.12 29.10
31.35
31.55
Apr
28.82 28.60
29^20 29.73
30.32
May
29.79
3U51 31.12
Jun
31.61 29.15
31.57 30.13 30.85
1971
33.60
Jul
31.00 31.05
31.8530.21 29.12
Aug
30.62 31.55
30.92 31.31 32.07
Sep
32.37
ii'.ii33.51 33.70
Oct
32161
31.82 32.08 32.26
Nov
32.33 31.61
31.60 31.00 29.58
Dec
29.65 30.01
30.95 31.00 29.71
392018081311100. Local number Bu-8. City of Hamilton. At Falrfleld. Drilled unused artesian well In gravel, dlam 6 In (15 cm), depth 200 ft (61 m), cased to 200 ft (61 m). Lsd 630 ft (192 m) above msl. MP floor of Instrument shelter, 1.13 ft (1.26 m) above Isd. Highest water level 38.20 ft (11.61 m) below Isd, June 8, 1917; lowest 71.70 ft (21.85 m) below Isd, Oct. 21, 1911. Records available: 1911-71.
Lowest water level for the day, from recorder graph, 1973
Day
5 10 15 20 25 Eom
Jan
18.17 18.17 48.26 18.51 18.52 18.21
Feb
17.97 18.00 17.80 18.01 18.28 18.50
Mar
18.15 18.62 18.09 17.08 16.15 15-69
Apr
11.82 11.33 11.51 13.63 12.78 12.70
May
12.91 13.01 13.59 13.80 11.06 13.33
Jun
13.29 13-57 11.00 11.18 13-77 13-33
Jul
13.10 12.56 12.99 13.55 13.26 12.21
Aug
12.80 13.15 13.81 11.31 15.06 15.99
Sep
16.03 16.63 17.27 17.76 18.22 18.63
Oct
18.91 18.81 19.10 19. 11 19.63 50.00
Nov
50.13 51.10 50.98 51.16 51.53 19.92
Dec
18.58 18.53 18.91 19.08 19.07 18,60
1971
5 10 15 20 25 Eom
18.16 18.61 18.62 18.20 17.37 16.11
16.17 15.71 15.87 16.00 16.17 16.13
16.05 16.31 16.11 16.17 16.57 16.31
11.21 13.15 13.17 13.68 13.98 11.01
11.33 11.37 11.61 11.93 15.03 15-29
15.81 16.12 16.78 17.10 16.01 15-19
15.69 16.29 16.81 17.12 17.93 18.60
19.02 19.11 19.96 50.39 50.20 50.76
50.19 19.91 19.66 19.50 19.17 19.57
19.15 19.36 19.65 19.88 19.86 50.26
50.30 50.31 50.33 50.12 50.6150.21
50.16 19.89 19.55 19.01 19.07 19.21

OHIO, COSHOCTON COUNTY 79
391805081261800 (revised). Local number Bu-9. Olin Mathieson Corp. Formerly Fox Paper Co. Near Sharonville (previously reported Crestville). Drilled unused artesian well in gravel; diara 26 in (66 cm); depth 85 ft (26 m), previously reported 90 ft (27 ro); cased. Lsd 586.89 ft (178.88 m) above msl. MP floor of instrument shelter, "4.66 ft (1.142 m) above Isd. Highest water level 3.77 ft (1.15 m) below Isd, Jan. 27, 1919; lowest 21.140 ft (7.11 m) below Isd, Mar. 16, 1951. Records available: 1938-71.
Lowest water level for the day, from recorder graph, 1973
Day
5 10 15 20 25 Eom
Jan
10.31 10.70 11.02 11.52 11.96 11.90
Feb
11.62 11.83 11.70 12.01 12.32 12.53
Mar
12. 37 12.17 11.95 10.11 10.39 10.08
Apr
9.93 9-89
10.50 9.61 8.50 8.56
May
9.61 10.15 11.01 11.32 11.55 10.19
Jun
10.62 10.50 11.05 11.52 9.88 8.17
Jul
9.08 9-77
10.52 11.23 9.50 8.28
Aug
9-67 10.36 11.00
Sep Oct
12i6212.70 12.62
Nov
13.09 13.25 12.86 13.16 12.17 9.20
Dec
9.51 10.11 11.13 11.32 11.08 10.11
1971
5 10 15 20 25 Eom
10.69 11.15 11.07 9.90 9.65 9-52
10.07 10.27 10.95 11.35 11.12 11.21
11.37 11.77 11.17 11.37 11.72 11.33
8.35 8.31 8.92 9.96
10.60 10.97
10.77 10.97 11.36 10.65 10.81 11.05
10.51 11.09 11.36 11.86 9-31 9.93
10.85 11.22 11.37 11.77 12.31 13.13
13.51 13.75 11.19 11.36 11.52 13-59
12.29 12.37 11.65 11.88 12.23 12.08
11.90 12.11 12.32 12.13 12.23 12.10
i:u9712.20
12.12
11.28 10.58 10.72 10.80 11.28 11.37
393202081211500. Local number Bu-15. City of MIddletown. MIddletown Municipal Airport. Drilled test water-table well in gravel, diam 6 in (15 cm), depth 27 ft (8 m), cased. Lsd 611 ft (195 ni) above msl. MP floor of instrument shelter, 3.50 ft (1.07 m) above Isd. Highest water level 1.86 ft (1.18 m) below Isd, Nov. 16, 1972; lowest 13.16 ft (1.01 m) below Isd, Aug. 23, 1972. Records available: 1972-71.
Lowest water level for the day, from recorder graph, 1972
Day
5 10 15 20 25 Eom
5 10 15 20 25 Eom
Jan
8.58 9.52
10.01 10.1010.329.36
9.51 10.81 11.32
8.25 6.57 7.30
Feb
9-77 10.19 10.91 10.17 11.15 11.31
8.88 9.36 9.78 9-93 9-03 9.61
Mar
11-39 10.21 8.78 5.16 7.83 6.91
9.52 9.61
10.15 10.26 10.80 9.73
Apr
7.70 7.88 7.58 7.90 7.89 8.25
7.55 7.53 7.60 9.22 9.83
10.06
May
9.71 9.56 9.60
10.23 10.56 10.10
10.20 10.11 10.77 9.72
10.19 10.36
Jun
1973
10.05 8.13 8.98 9.08 8.75 8.79
1971
10.56 10.83 11.21 11.13 7.91 9.75
Jul
8.69 9.77
10.58 10.71 9.25 9-15
10.36 10.92 11.21 12.00 12.65 12.58
Aug
10.58 10.82 9-27 8.36
10.18 11.09
11.15 11.52 11.91 11.53 11.77 10.65
Sep
11.13 10.76 11.22 11.68 11.82 11.88
9.90 10.52 11.01 11.58 12.08 11.73
Oct
11.57 11.87 12.30 12.25 12.30 12.10
11.83 12.08 12.22 12.05 11.81 11.68
Nov
8.53
12.50 12.55 12.21 12.11 12.27 8.66
11.50 11.26 10.98 11.58 11.67 11.58
Dec
8.71
9.66 10.79 10.57 11.52 11.66 8.31
11.82 10.19 10.21 10.13 10.62 9.99
Coshocton County
101735081523800. Local number Cs-2. Coshocton Waterworks. Near Coshocton. Drilled unused water-table well in gravel, diam 6 in (15 cm), depth 10 ft (12 m), cased to 10 ft (12 m). Lsd 710 ft (226 m) above msl. MP floor of instrument shelter, 8.50 ft (2.59 m) above Isd. Highestwater level 0.13 ft (0.13 m) below Isd, Feb. 21, 1951; lowest 17-75 ft (5.11 m) belov 1973. Records available: 1919-71.
Lowest water level for the day, from recorder graph, 1973
Day
510 15 20 25 Eom
Jan
12.5512.11 13.78 11.50 11.07 12.80
Feb
10.53 11.39 13.62 11.05 11.10 11.71
Mar
13.56 13.20 12.06 7.17 7-90 9-72
Apr
11.17 11.00 10.65 10.60 12.60 11-59
May
12.96 13.86 12.97 11.27 11.30 13.17
Jun
13.81
ii!i712.93 12.60 12.97
Jul
13.83 13.11 11.91 15.98 15.63 15.37
Aug
15.93 16.19 16.09 15.85 16.26 16.81
Sep
16.76 16.10 16.37 16.81 16.95 16.10
Oct
16.13 16.57 16.27 16.90 16.70 16.50
i Isd, Nov. 15,
Nov
16.13 17.07 17.75 17.56 16.27 10.10
Dec
12.92 11.33 15.60 15.81 13.15 11.29
1971
5 10 15 20 25 Eom
12.32 11.50 15.19 10.75 6.65 7.85
9.91 11.31 13-31 13.86 13-18 12.81
12.50 11.72 10.55 10-72 12.31 10.30
5.06 6.16 9.80
12.35 13-51 11.06
13.65 11.01 12.50 13.65 13.95 11.20
11.71 11.97 15.77 15.57 15.10 11.09
11.03 15.18 15-01 16.12 16.61 16.25
15.95 16.61 16.11 15.98 16.36 15.12

GROUND-WATER LEVELS, 1973-74, NORTHEASTERN STATES
Falrfield County
394544082271000. Local number P-l. Formerly P-la. State of Ohio. West Rushville. Drilled test artesian well in sandstone; diam 6 in (15 em); depth 84 ft (26 m), previously reported 74 ft (23 m); easing information not available. Lsd 980 ft (299 m) above msl. MP floor of shelter, 8.02 ft (2.41) m ) above Isd. Highest water level 7.27 ft (2.22 m) below Isd, May 5, 6, 1962; lowest 19.81 ft (6.04 m) below Isd, Mar. 1-4, 1964. Records available: 1946-74.
Lowest water level for the day, from recorder graph, 1973
Day
510 15 20 25 Eom
Jan
10.58 10.67 10.76 11.03 11.42 11.69
Peb
11.62 11.39 11.29 11.37 11.47 11.65
Mar
12.0712.53 13.03 13.25 13.26 13.12
Apr
12.91 12.67 11.77 11.34 11.04 10.95
May
10.84 10.90 11.20 11.64 12.09 12.61
Jun
12.87 13.13 13.45 13.77 14.07 14.34
Jul
14.64 14.95 15.27 15.58 15.75 15.78
Aug
15.66 15-62 15.66 15.67 15-65 15-72
Sep
15.87 16. 04 16.22 16.38 16.19 16.57
Dot
16.63 16.72 16.82 16.94 17.08 17.20
Nov
17.27 17-33 17-37 17.37 17-38 16.88
Dec
15.58 15.10 14.87 14.8? 14.87 14.60
1974
5 10 15 20 25 Eom
14.15 14.03 13.87 13.46 12.93 12.41
12.2112.24 12.24 12.31 12.48 12.63
12.82 13.03 13.41 13-58 13.64 13.73
13.1712.0711.62 11.73 12.27 13.02
13.60 14.12 14.56 14.90 14.93 14.93
14.55 14.15 14.19 11.37 14.52 14.19
13.83 13.86 14.07 14.42 14.77 15.18
15-35 15.48 15-52 15.57 15.72 15.92
15-92 15-13 14.92 14.93 15.02 15-17
15.39 15.62 15.84 16.06 16.31 16.67
16.83 16.95 17-11 17.23 17.27 17.27
17.08 16.62 15.90 15. It 14.72 14.29
Fayette County
393153083322000. Local number Pa-1. Martha Slagle. Near Jasper Mills. Drilled unused artesian well in limestone, diam 5 in (13 em), depth 78 ft (24 m), casing information not available. Lsd 1,010 ft (308 m) above msl. MP floor of instrument shelter, 3.30 ft (1.01 m) above Isd. High est water level 3.26 ft (0.99 m) below Isd, Apr. 28, 1964; lowest 12.85 ft (3.92 m) below Isd, Jan. 17, 19, 1954. Records available: 1946-74.
Lowest water level for the day, from recorder graph, 1973
Day
5 10 15 20 25 Eom
Jan
7.70 6.60 7.00 7.60 6.80 6.80
Peb
7-75 7.20 6.40 7.00 7-15 7.55
Mar
7-05 7-70 7.20 6.95 7.40 7.35
Apr
6.50 6.60 7.10 6.55 6.20 6.35
Hay
6.85 6.60 6.85 6.90 7.00 7.20
Jun
8.10 7-30 7.00 7.15 7.25 7-15
Jul
7.25 7-50 7-50 7.75 7.25 7.30
Aug
7.15 7.10 7.15 7-25 7-30 7-55
Sep
7-70 7-85 8.25 8.00 8.30 8.35
Oct
8.00 8.10 8.10 8.30 8.35 8.00
Nov
8.15 8.35 8.30 8.30 8.15 7.65
Dec
7.23 7-09 7.10 7.05 6.85 6.80
1971
5 10 15 20 25 Eom
6.70 6.70 6.70 6.65 6.45 6.40
6.62 6.58 6.67 6.696.75 6.67
6.80 6.93 6.85 7.08 7-03 7.00
6.80 6.69 6.71 6.80 6.95 7.20
7.25 7.20 7.40 7.40 7.65 7.60
7.40 7.40 7.75 7-55 7.30 7-25
7.25 7-55 7.80 8.05 7.85 7-85
8.35 7-95 8.70 8.90
10.05 8.50
7.80 7.80 7.55 7.65 7-55 7-75
7.60 7.65 7.50 7.30 7.45 7-65
7.40 7.40 7.35 6.90 6.95 6.80
Pranklin County
395118082573300. Local number Pr-3. R. Hann. Near Reese. Drilled test water-table well in gravel; diam 12 in (30 cm); depth 53 ft (16 m), previously reported 60 ft (18 m); cased. Lsd 712.94 ft (217.30 m) above msl. MP floor of instrument shelter, 3.43 ft (1.05 m) above Isd. Highest water level (revised), 0.0 ft (0.0 m) Jan. 22, 1959; lowest 20.75 ft (6.32 m) below Isd, July 7, 1966. Records available: 1946-74.
Lowest water level for the day, from recorder graph, 1973
Day
510 15 20 25 Eom
Jan
8.77 10.23 11.00 11.10 11.62 10.88
Peb
9.3610.46 10.84 10.88 11.25 11.35
Mar
11.16 11.21 10.94 9.20
10.32 9.75
Apr
9.89 9.73 9.34 9.03 9.82 9.45
May
10.39 10.82 10.77 11.16 11.35 11.01
Jun
11.20 10.30 10.25 8.24 8.80 9.93
Jul
10.12 10.80 11.11 11.50 10.78 10.72
Aug
11.4511.71 10.60 11.23 11.60 11.90
Sep
11.75 11.84 12.08 12.20 12.15 12.28
Oct
11.20 11.90 11.98 12.23 12.28 11.45
Nov
11.59 11.93 11.03 11.75 11.25 8.38
Dec
9-56 10.50 10.82 11.05 10.60 9.76
197t
5 10 15 20 25 Eom
10.60 10.83 10.85 8.20 8.76 9.51
10.14 9.63
10.20 10.47 10.28 10.49
10.61 10.78 10.90 10.78 10.84 8.40
6.85 8.77 9.86
10.44 10.66 10.98
11.09 11.27 11.33 10.91 11.04 11.31
11.55 11.68 11.81 11.75 11.12 11.22
11.64 11.64 11.98 12.15 12.21 12.31
12.04 12.21 12.24 11.95 12.29 11.80
11.55 12.07 12.07 12.27 12.24 12.13
12.40 12.49 12.42 12.28 12.39 12.46
12.19
ii!67
11.31 11.02 11.23 11.20 11.00 11.27

OHIO, HAMILTON COUNTY 8l
400101083021800. Local number Fr-10. State of Ohio. Ohio State University Farms. Drilled unused artesian well in gravel, diam 4 in (10 cm), depth 75 ft (23 m), cased to 75 ft (23 m). Lsd 780 ft (238 m) above msl. MP floor of instrument shelter, 4.00 ft (1.22 m) above Isd. Highest water level 37-75 ft (11.51 m) below Isd, Apr. 14, 1951; lowest 48.20 ft (14.69 m) below Isd, Oct. 7, 1954. Records available: 1944-74.
Day
5 10 15 20 25 Eom
Jan
43.43 43.38 43-31 43-17 43.12
Feb
42.93 43.05 42.83 42.87 42.93 42.95
Lowest v
Mar
42.78 42.82 42.71 42.71 42.59 42.57
*ater le\
Apr
42.45 42.33 42.43 42.27 41.97 41.94
rel for the day,
May
41-97 41.83 42.14
42^20
Jun
42.25 42.30 42.36 41.83 41.75 41.65
from rec
Jul
41.68 41.76 41-97 42.50 42.32
:order graph, 1973
Aug
42.70 42.64 42.99 42.84 43.04 43.05
Sep
43.46 43.33 43.50 44.23 43.92 43.69
Dot
43.77 43.78 43.74 43.70 43.54 43.22
Nov
43.60 43.73 43.33 43.47 43-30 43.32
Dec
43-02 43-05 42.18 42.97 42.95
1974
5 10 15 20 25 Eom 42!l6
42.17 41.96 41.97 41.82 41.83 41.74
41.60 41.82 41.62 41.52 41.78 41.26
41.06 41.13 40.88 41.15 41.01 41.02
40.93 41.00 41.05 41.15 41.26 41.33
41.73 41.44 41.85 41.80 41.67 41.60
41.97 42.19 42.36 42.53 42.97 43-09
43.08 42.83 43.18 43.30 43.10 43.12
43.24 43.24 43.31 43.47 43.40 43.41
43-45
43-07
43.10 43-00 42.96 42.86 42.95 42.65
Greene County
394411083561300. Local number Gr-1. City of Xenia. Near Xenia. Drilled unused artesian well in gravel, diam 30 in (76 era), depth 77 ft (23 m), cased to 77 ft (23 m). Lsd 818.88 ft (249.59 m) above rasl. MP floor of instrument shelter, 4.50 ft (1.37 m) above Isd. Highest water level 0.95 ft (0.29 m) below Isd, Mar. 10, 1964; lowest 21.65 ft (6.60 m) below Isd, Aug. 22, 1972. Records available: 1944-74. Water levels affected by pumping.
Day
5 10 15 20 25 Eom
Jan
13 '.99 14.85 15.25 14.68 14.71
Feb
14.02 14.65 15-05 15.36 15.89 16.11
Lowest v
Mar
16.35 16.20 15-25 12.90 13.90 12.50
<ater lei
Apr
12.92 12.91 12.49 10.55 11.98 11.75
/el for the day,
Hay
12.50 13.28 13.75 13.80 14.31 14.30
Jun
14.90 14.72 14.82 9-50
12.00 11.98
from rec
Jul
12.47 13.95 13.80 14.30 12.10 12.51
:order graph, 1973
Aug
13.41 14.10 14.22 14.33 14.80 15.20
Sep
15.61 15.50 15.59 15.80 16.00 15.65
Oct
15.13 14.90 14.87 15.30 19.15 16.08
Nov
15.61 16.00 15.95 15.52 15.10 11.46
Dec
12.63 17.05 14.21 14.45 14.30 13.22
1974
5 10 15 20 25 Eom
14.00 14.50 15.99 12.70 12.49 12.82
13.45 13.49 13.98 14.10 14.00 14.08
14.34 14.41 14.80 15.20 15.18 14.25
9.10 10.11 11.60 12.60 13.04 13.80
13.91 14.41 15.44 15.70 16.20 16.59
17.27 17.21 17-39 17-40 16.08 16.11
16.78 17.40 16.31
18.07
17-55 17-88 17-54 17.08 17.20 16.55
15.68 16.03 15-45 15.55 16.00 15.09
15-39 16.20 16.42 16.08 16.25 16.40
16.55 15-70 15.62 15.94 16.20 16.05
16.50 15.04 14.45 14.05 14.14 14.53
Hamilton County
391214084470100. Local number H-l. R. Weber. Near Harrison. Drilled test artesian well in gravel, diam 6 in (15 cm), depth 124 ft (38 m), cased to 124 ft (38 m). Lsd 500 ft (152 m) above msl. MP floor of instrument platform, 2.70 ft (0.82 m) above Isd. Highest water level 12.70 ft (3.87 m) below Isd, Jan. 22, 1959; lowest 25.80 ft (7.86 m) below Isd, Jan. 18-20, 1964. Records available: 1949-74.
Day
510Ti2025
Jan
20.9621.0720.7320.65
Feb
20.4820.8920.9020.9421.1421.22
Lowest v
Mar
21.1620.2518.7019.0119.7318.96
*ater le\
Apr
19.0219.4319.7218.8219.0019-70
rel for the day,
May
20.0720,0320.4420.6320.7720.47
Jun
20.6520.3620.7420.7220.8920.20
from recorder graph, 1973
Jul
20.4320.9321.1421.3518.4819.99
Aug
20.4920.7620.8321.0721.1021.27
Sep
21.5121.6721.8522.0222.1922.38
Oct
22.0522.1522.1922.3522.4922.65
Nov
22.6922.8222.9322.6822.0321.29
Dec
21.5321.7521.7821.9121.8021.23
1974
510^20?5Eom
21.3421.4521.2519.0820.1320.30
20.7520.8021.0221.0720.8620.91
20.9521.0420.9621.1121.1720.54
19.6619.0620.1120.5220.7020.92
20.9220.9121.0920.0420.7720.75
21.1921.3021.4721.5920.2020.78
21.0121.2321.4121.6421.8422.11
22.2022.3322.5022.5522.7922.42
21.7622.1121.6721.9121.9421.60
21.8521.9521.9021.8921.8721.87
21.0921.5221.4921.5421.50
21.19
391733084392400. Local number H-2. Southwestern Ohio Water Co. Near Venice. Drilled unused artesian well in gravel, diam 6 in (15 cm), depth 89 ft (27 m), cased to 89 ft (27 m). Lsd 535 ft (163 m) above msl. MP floor of instrument shelter, 8.97 ft (2.73 m) above Isd. Highest water leve 1.20 ft (0.37 m) below Isd. June 16, 1958; lowest 24.37 ft (7.43 m) below Isd, Sept. 13, 25, 1972. Records available: 1952-58, 1960-74. Water levels affected by pumping.

GROUND-WATER LEVELS, 1973-74, NORTHEASTERN STATES
391733081392100 Continued.
Lowest water level for the day, from recorder graph, 1973
Day
5 10 15 20 25 Eora
Jan
18.00 18.11 19.03 19.17 19-39 19.10
Feb
18.98 19.02 19-33 19.19 19-86 20.12
Mar
20.37 20.15 18.35 15-78 15-51 15.15
Apr
15.38 15.61 15.85 15-58 15-35 15.55
May
15-99 16.27 16.71 17-02 17.16 17.25
Jun
17-16 16.21 17.91 17.07 17.23 17.00
Jul
17.21 17-51 17.71 18.49 16.53 16.66
Aug
17.19 18.15 18.01 17-72 18.22 18.81 .
Sep
19.24 19-57 20.16 19-97 20.71 20.99
oct
20.96 21.11 21.13 21.66 21.75 21.81
Nov
21.86 22.03 22.19 22.22 22.21 22.31
Dec
20.00 19.76 19.75 19.87 20.01 18.35
1971
510 15 20 25 Eom
18.13 18.78 19.01 18.25 11.67 11.11
15-25 15.51 16.00 16.38 16.17 16.33
16.67 16.81 16.87 17-20 17.13 17.20
15.12 11.61 15.16 16.55 17-29 17-96
18.33 18.11 18.10 18. OH 18.10 18.61
18.86 19.26 19.62 19-91 16.65 16.15
16.82 17.26 17.87 18.57 18.96 19-22
19.32 19-83 20.20 20.30 20.56 20.50
19.88 20.06 20.08 20.26 20.21 20.16
20.17 20.29 20.31 20.61 20.85 21.06
21.07 21.08 21.20 21.51 21.80 21.71
21.06 21.08 20.60 20.15 20.04 18.98
390653084485700. Local number H-5. E. I. du Pont de Nemours Co. Near Ellzabethtown. Drilled unused water-table well In gravel, dlam 8 In (20 cm), depth 122 ft (37 m), cased to 122 ft (37 m). Lsd 500 ft (152 m) above rasl. MP floor of Instrument shelter, 4.00 ft (1.22 m) above Isd since January 1973. Highest water level 24.15 ft (7.36 ra) below Isd, Mar. 16, 1964; lowest 74.50 ft (22.71 m) below Isd, Sept. 10, 11, 1956. Records available: 1956-74.
Lowest water level for the day, from recorder graph, 1973
Day
510 15 20 25 Eom
25
Jan
49.48 50.38 51.73 52.15 50.85 50.70
47-93
Feb
soiis50.90 51.80 52.10
47.56
51-23
Mar
51.75 50.22 50.22 43.10 45-39 47.20
Apr
48.00 15-51 46.41 47.42 47.25 41.55
44.85
52.09
May
45-30 48.53 47.65 49.41 49-97 48.70
52.2246.85
Jun
50.12 50.60 51.22 50.90 51.57 51.79
1974
45-17
52.11
Jul
51.69 52.11 52.29 52.30 51.52 52.20
Aug
52.30 52.50 52.30 52.22 52.34 52.61
Sep
52.51 52.48 52.37 52.28 52.42 52.30
Oct
52.07 52.35 52.45 52.43 52.43 52.10
Nov
52.33 52.23 52.42 52.13 51.95 44.05
51.48
49.96
Dec
48.85 50.73 51.00 50.88 48.97 43.75
47.38
391321081272500. Local number H-9. Diamond National Corp. Formerly Gardner-Richardson Co. South Cooper Ave., Lockland. Drilled unused artesian well In gravel; dlaoi 10 In (25 cm); depth 163 ft (50 m), previously reported 168 ft (51 m); cased. Lsd 555.30 ft (169.26 m) above msl. MP floor of Instrument shelter, 2.76 ft (0.81 m) above Isd. Highest water level 87.25 ft (26.59 ra) below Isd, Dec. 1, 1971; lowest 136.80 ft (11.70 m) below Isd, Nov. 9, 1917, Feb. 15, 1918. Records available: 1938-71.
Lowest water level for the day, from recorder graph, 1973
Day
5 10 15 20 25 Eom
Jan
95-38 95-35 95-36 95.21 95-36 95-21
Feb
95-15 95-31 95-13 95.21 95.29 95-26
Mar
95-00 95-02 91-92 95-20 91-75 95-10
Apr
95.27 95-22 95.26 91.93 91.68 91.65
May
91.59 91.16 91.55 91.17 91-37 91-77
Jun
94.41 91.40 91.24 94.32 94.09 94.19
Jul
94.00 93.93 93.85 93.70 93.64 93.44
Aug
93.58 93.30 93-48 93.31 93.31 93.20
Sep
93.02 92.98 92.87 92.83 92.73 92.48
Oct
92.67 92.35 92.15 91.95 91.64 91.33
Nov
91.64 91.84 91.03 91.34 91-25 91.66
Dec
91.28 91.31 91.36 91.01 91.01 91.21
1971
510 15 20 25 Eom
91.00 91-01 90.92 90.78 91.12 91.11
91.15 90.93 91.06 91.01 91.08 90.60
90-63 90.90 90.15 90.19 90.91 90.10
90.53 90.51 90.20 90.29 90.25 89.88
89.90 89-96 89.90 89.87 89.81 89.43
89.64 89.56 89.59 89.79 89.69 89.47
89.50 89.29 89.37 89.36 89.38 89.45
89.42 89.27 89.57 89.54 89.12 89.00
89.32 89.09 89.25 89.12 89.18 89.11
89.12 90.95 91.01 91.21 90.69 90.61
90.65 88.44 88.61 88.06 88.51 88.23
88.43 88.12 88.00 88.10 88.06 87.70
Hancock County
105700083355700. Local number Ha-2. Maplehurst Farms. Near Flndlay. Drilled unused water- table well In limestone, dlam 6 In (15 cm), depth 27 ft (8 m), casing Information not available. Lsd 820 ft (250 m) above msl. MP floor of Instrument shelter, 3.50 ft (1.07 m) above Isd. Highest water level 0.25 ft (0.08 m) below Isd, Mar. 5, 1963, Dee. 10. 1966; lowest 8.10 ft (2.47 m) below Isd. Nov. 22-25, Dec. 3, 4, 1964. Records available: 19*7-74. Measurement discontinued Sept. 30, 1971

OHIO, LICKING COUNTY
105700083355700 Continued.
Lowest water level for the day, from recorder graph, 1973
Day
5 10 15 20 25 Eom
Jan
1.140 2.10 2.60 2.55 2.00 1.95
2.50
1.15
Peb
1.70 2.10 2.30 2.30 2.50 2.60
1.15
Mar
2.00 1.10
70 .90
1.35 1.20
Apr
1.10 1.30 1.70 1.75 1.55 1.65
2.45
2.65
May
2.20 1-95 2.25 2.10 2.00 1.20
Jun
1.651.140 1.50 2.20 2.35 2.15
1974
o flc2.95
3.25
Jul
2.00 2.65 2.902.95 2.85 2.92
3.45
1.154.75
Aug
3.05 3.15 2.95 3.05 3.30 4.05
Sep
4.45 4.69 4.90 5.15 4.90 3.45
3.15
4.60
4.55
Oct
3.05 3.45 4.25 4.75 4.85 3.30
Nov
3.12 4.15 4.52 3.65 3.10 2.65
Dec
2.70 2.95 2.90 3.00 3.05 1.85
Jefferson County
102101080372100. Local number Je-1. Barium Chemicals, Inc. Formerly Steubenville Pottery Co. Steubenville. Drilled unused water-table well in gravel, diam 8 in (20 cm), depth 104 ft (32 m), cased to 101 ft (32 m). Lsd 680 ft (207 m) above msl. MP floor of instrument shelter, 3.50 ft (1.07 m) above Isd. Highest water level 30.20 ft (9.20 m) below Isd, Apr. 2, I960; lowest 51.00 ft (15.54 m) below Isd, Peb. 23, 1958. Records available: 1947-50, 1952-71. Measurement discon tinued June 10, 1971.
Day
5 10 15 20 25 Eom
Jan
10.3011.20 11.21 10.78 10.70
Peb
38.68 39-25 10.31 11.06 11.46 11.48
Lowest v
Mar
40.19 39.98 40.30 37.09 38.10 39-80
»ater le^
Apr
39.14 38.66 39-13 39.87 40.28 37.59
rel for the day,
May
38.65 39-04 38.83 10.38 10.18 10.34
Jun
40.44 40.87 41.20 39.89 41.25 41.44
from re<
Jul
41.32 41.30 11.60 11.81 41.72 41.81
:order graph, 1973
Aug
41.74 41.86 41.81 41.93 41.72 41.79
Sep
41.98 41.98 42.03 41.90 42.03 42.00
Oct
42.02 41.58 41.70 41.88 41.81 41.30
Nov
41.36 41.61 41.67 41.51 41.71 39.67
Dec
40.53 11.12 10.18 41.08 39-81 37.61
1971
5 10 15 20 25 Eom
38.51 10.00 38.16 36.90 36.83 38.21
39-72 10.16 10.58 41.01 10.55 11.12
39-75 38.10 37-80 39.24 39.77 39-94
37-92 37.94 38.51 39-50 40.30 10.81
10.48 41.28 37.51 39-13 40.44 40.89
39-85 40.95
402344082300700. Local number K-l. City of Mount Vernon. Drilled unused artesian well in gravel, diam 8 in (20 cm), depth 90 ft (27 m), cased to 90 ft (27 m). Lsd 990 ft (302 m) above msl. MP floor of instrument shelter, 3.50 ft (1.07 m) above Isd. Highest water level 1.90 ft (0.58 m) above Isd, Mar. 19, 1948; lowest 16.90 ft (5.15 m) below Isd, July 25, 1971. Records available: 1946-74. Water levels affected by pumping.
Day
5 10 15 20 25 Eom
Jan
7.78 9.37 6.75 7.04 8.65 8.92
Peb
7.36 10.009.308.527.17 8.60
Lowest v
Mar
9.65 7.81 7-97 7.50 6.34 8.33
»ater le-\
Apr
10.22 9-75 7.07 9.77 9.50
rel for the day,
May
9.56 9-75 7.8o
Jun
11.40
10.31 9.24 9.61
11.06
from rec
Jul
9.56 13.41
13^07
12.17
:order graph, 1973
Aug
14!36 11.8?
13 .'55 14.10
Sep
13.60
11.19 14.60 12.73 11.15
Oct
10.95 10.94 11.34 13.68 14.11 12.78
Nov
10.10 10.91 10.59 10.88 7.59 8.93
Dec
9-17 8.56 9.66
13-13 5-95 6.70
1974
5 10 15 20 25 Eom
9-29 11.99 8.99 8.61 9.95 8.53
9.54 9.90
11.98 11.21 10.34 11.60
8.82 8.30
10.40 10.09 10.39 8.17
9.20 7-93 7.37 8.90 9.58 9.39
8.39 10.17 9.87 9.29 9.86 9.40
9-89 9-71
10.75 9.62 9-09 8.80
10.41 11.33 11.00 12.12 12.80 13.69
10.10 12.01 10.40
iiiog
11.83 12.69 11.49 14.21 14.01 10.00
11.50 10.25 10.59 9.91
11.18 11.70
10.20 10.80 11.25 11.11 10.21 8.05
10.3211.85 7.94 8.90 6.88 9.20
Licking County
400159082282100. Local number Li-2. Union Oil Co. Formerly Heath Refinery. Refinery at Heath (previously reported Newark). Drilled observation artesian well in gravel, diam 6 in (15 cm), depth 23 ft (7 m), cased to 22 ft (7 m). Lsd 885 ft (270 m) above msl. MP floor of instrument shelter, 3.80 ft (1.16 m) above Isd. Highest water level 0.10 ft (0.03 m) above Isd, Apr. 3, 1974; lowest 18.55 ft (5.65 m) below Isd, Dec. 17, 18, 1953. Records available: 1953-74. Measurement discontinued June 1974.
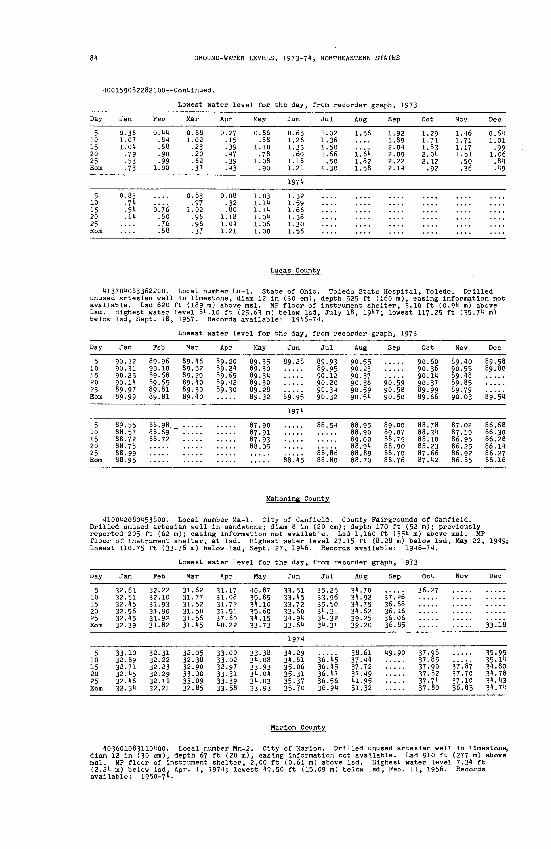
GROUND-WATER LEVELS, 1973-71, NORTHEASTERN STATES
1)00159082282100 Continued.
Lowest water level for the day, from recorder graph, 1973
Day
5 10 15 20 25
10
20
Jan
0.36 1.07 1.04 .79 .53 73
0.83.71.51.11
Feb
0.1)1 .81 .68 .90 .99
1.00
0.76.60.76.68
Mar
0.88 1.02 .23 .20 .62 .37
1.02.96.96
Apr
0.27 .15 .39 .17 .39 .13
.801.18
1.21
May
0.86 .88
1.10 .78
1.08 .90
1.11
Jun
0.65 1.26 1.35 .60
1.18 1.21
1974
1.661.58
1.56
Jul
1.02 1.36 1.50 1.66 .50
1.30
Aug
1.56
iiei1.82 1.58
Sep
1.92 1.89 2.01 2.09 2.22 2.11
Oct
1.29 1.71 1.83 2.01) 2.12
92
Nov
1.1)6 1.71 1.17 1.51 .50 .36
Dec
0.61) 1.01
99 1.06 .81 .19
Lucas County
Lowest water level for the day, from recorder graph, 1973
Day
5 10 15 20 25
5 10 15 20
Jan
90.32 90.31 90.25 90.11 89-97 89.99
89.55 88.57 88.72 88.7588.99
Feb
89.96 f 90.10 f 89.68 ( 89.65 1 89.8! ( 89.8! i
88.98 88.69" . 88.72
Mar
39.16 39.52 39.20 39.1)0 39.30 39.10
Apr
89.20 89.21 89.65 89.1)2 89.30
Ms
89. 89. 89. 89. 89. 89.
87. 87. 87. 8R
iy.35 .30 .31 .30 .28 .32
.90
.91
.93
Jun Ji
89-28 89. ..... 89, ..... 90, ..... 90, ..... 90, 89.95 90
1971
..... 88.
88.15 88,
jl
.93
.95
.12
.20
.31
.32
.51
.80
Aug
90.55 90.23 90.37 90.38 90.59 90.51
88.95 88.90 89.00 88.91
Sep
9Cl!59 90.58 90.50
89.00 89.07 88.79
88.76
Oct
90.60 90.36 90.11 90.37 89.99 89.66
88.78 88.31 88.10
Nov
89.10 90.55 89.18 89.85 89-79 90.03
87.02 87.10 86.95
86.85
Dec
89.58 89.80
86.68 86.30 86.28
86.16
110012080153800. Local number Ma-1. City of Canfield. County Fairgrounds of Canfield. Drilled unused artesian well in sandstone; diam 8 in (20 cm); depth 170 ft (52 m); previously reported 205 ft (62 m); casing information not available. Lsd 1,160 ft (351 ) above msl. MP floor of instrument shelter, at Isd. Highest water level 27-15 ft (8.28 m) below Isd, May 22, lowest 110.75 ft (33.76 m) below Isd, Sept. 27, 1916. Records available: 191)6-71.
Day
510 15 20 25 Horn
Jan
32.61 32.51 32.15 32.56 32.15 32.39
Feb
32.22 32.10 31.93 31.90 31.92 31.82
Lowest v
Mar
31.62 31.77 31.52 31.50 31.56 31.15
later lei
Apr
31.17 31.08 31.72 31-51 37-60 10.22
rel for the day,
May
1)0.87 35.85 31.10 35.60 31.15 33-73
Jun
33.51 33.15 33.72 33.60 31.91 33.61
from recorder graph, 1973
Jul
35.25 33.96 35.50 31.31 31.32 31.31
Aug
31.70 31-92 31.75 31.62 39.25 39.20
Sep
37! 26 36.68 36.16 36.06 36.85
Oct
36.27
Nov Dec
33-18
1971
5 10 15 20 25 Eom
33.10 32.89 32.71 32.15 32.1)6 32.31
32.31 32.22 32.23 32.29 32.18 32.21
32.05 32.38 32.90 33.00 33.09 32.85
33.00 33.02 32.97 33.31 33.39 33.58
33-38 31.08 33.93 31.01 31.03 33.93
31.29 31.61 35-06 35.31 35.37 35.70
36'.'H5
36.15 36.17 36.56 36.91
38.61 37-11 37-72 37-19 11.95 51.32
19-90 37.98 37.85 37-90 37.82 37-71 37.80
37187 37.70 37.10 36.83
35.95 35.11 31.80 31.78 31.13 31.71
Marion County
103601083110100. Local number Mn-2. City of Marion. Drilled unused artesian well in limestone, diam 12 in (30 cm), depth 67 ft (20 m), casing information not available. Lsd 910 ft (277 m) above msl. MP floor of instrument shelter, 2,00 ft (0.61 m) above Isd. Highest water level 7.31 ft (2.21) m ) below Isd, Apr. 1, 1971; lowest lg.50 ft (15.09 m) below Isd, Feb. 11, 1956. Records available: 1950-71.

OHIO, MUSKINCJHAM COUNTY
403601083110400--Continued.
Lowest water level for the day, from recorder graph, 1973
Day
5 10
20
5 10 15 20 25 Eom
Jan
8.00 8.06 8.314
9-53 9-31 9.13 8.33
Feb
8.07 8.32
8.'428.142 8.37 8.33 8.07
Mar
8.25 8. HO 8.25 8.00 8.35 7-77
Apr
8.149 8.16 7-90 8.08 8.22 8.22
May
8.08 8.12
8.33 8.60 8.614 8.72 8.71 8.75
Jun
8.80 8.57 8.68
9.279-58
1974
9.00
9!i6 9.369.1419.114
Jul
9.18 9.07
9.26
9.90 10.39 11.36 11. 94 12.53 13.29
Aug
9-38 9-38 9-57
13.74 114.30 114.84 14.97 15-31 15-48
Sep
9.67 10.73
15.20 14.85 14.83 14.61 14.83 14.94
Oct
12.29 12.17
14.88 14.91 15.07 15.46 15. b7 15.67
Nov
13.24 13.26
15.56 15-40 15-20 14.86 14.70 14.52
Dec
11.70 11.30
9.83
14.27 13.96 13.69 13.40 13.20 13.01
Medina County
410142082005900. Local number Md-1. City of Lodi. Drilled unused water-table well in gravel, diam 6 in (15 cnr), depth 65 ft (20 m), cased to 65 ft (20 m). Lsd 910 ft (277 m) above msl. MP floor of Instrument platform, 1.90 ft (0.58 m) above Isd. Highest water level 7.60 ft (2.32 m) below lad, July 4, 1969i lowest 31.64 ft (9.64 m) below Isd, Nov. 9, 1962. Records available: 1946-74.
Lowest water level for the day, from recorder graph, 1973
Day Jan Feb
5 20.50 20.20 10 20.90 20.60 15 19.55 20.80 20 17.30 20.45 25 21.15 19.85 Eom 17.15 20.60
Mar
20.25 20.20 19.45 20.20 19.50 19.40
Apr
19.10 19.20 19.65 20.20 19-95 19.80
May
19.90 19.75 19.80 20.00 19.65 19.90
Jun
19-95 20.60 20.60 20.30 20.30 20.20
Jul
20.35 20.90 20.25 23.10 21.15 21.00
Aug
21.30 22.65 21.65 21.25 21.40 22.55
Sep
21.80 21.60 21.70 21.90 21.70 21.25
Oct
21.30
21.30
Nov
20.90 21.15 21.10 21.15 20.70 22.22
Dec
30. 21. 20. 20. 19. 17-
35 45 40 15 75 10
1974
5 17,10 17.4010 17.25 .....15 17.45 ..... 20 17.00 17.10 25 17.10 17.00 Eom 17.10 16.80
394025084162800. gravel, diam 6 in (15 msl. MP floor of ins (3.21 m) below Isd, J available: 1947-74.
Day Jan Feb
5 28.00 29.29 10 28.15 29.60 15 28.53 29.95 20 28.66 30.23 25 29.07 30.56 Eom 29.26 30.77
16.65 16.25 17.15 16.65 16.30
15^95 17.10 17.10
16.95 17.20 17.20 17.20 17.60 19.60
Montgo
18.95 18.10 18.30 18.00 17.95 17-35
mery Cou
17.90 20.95 25.15 21.95 22.90 22.65
nty
23.60 24.75 22.10
Local number Mt-49. E. F. Stenger. Drilled u cm), depth 220 ft (67 m) , cased to 220 ft (67
trument shelter, 2.50 ft (0.76 m) above Isd. an. 22, 1959; lowest 36.30 ft (11.06 m) below
Mar
31.11 31.10 30.25 28.57 27.98 27.06
Apr
27.66 26.55 26.18 25.97 25.81 25.85
May
27^11
Jun
27.12 26.31 26.67 26.62 26.57 26.34
Jul
26.51 26.66 26.88 27.46 27.05 27.20
Aug
27.31 27.83 27.66 27.38 27.43 28.03
21.00 21.80
20.45 21.10 20.60 20.15 20.40 20.15
20.05 19.90 19-85 19-70 19.60 is!
18.50 25
nused water-table well in m). Lsd 715 ft (218 m) above
Highest water level 10.52 ft Isd, Dec. 8, 1974. Records
graph, 1973
Sep
28.34 28.69 29.06 29.60 29.99 30.12
Oct
30.51 30.80 31.05 31.32 31.82 32.17
Nov
32.48 32.74 33.14 33.41 33.47 32.73
Dec
32. 33. 33. 33. 33. 32.
88 01 21 44 59 16
1974
5 32.23 26.9610 32.45 27.00 15 33-13 27.45 20 32.10 27-73 25 28.46 27.50 Eom 26.90 27.63
27.91 28.11 28.36 28.85 29.19 29.27
28.53 28.09 27.84 27.76 28.11 28.39
28.34 28.92 29.14 29.30 29.52 29.90
30.19 30.44 30.67 31.10 28.97 28.40
28.81 29.00 29.37 29.73 30.18 30.65
31.03 31.38 31.76 32.08 32.32 32.60
32.60 32.84 32.82 33.21 33.33 33.52
33.90 34.12 34.25
34174 35-01
35.30 35.39 35.59 35.77 35.95 36.06
36. 36. 36. 35. 35. 35.
24 21 09 72 58 27
Musklngum County
395804081593200 (revised). Local number Mu-la. City of Zanesville. Drilled unused water-table well in gravel; diam 6 in (15 cm); depth 132 ft (40 m), previously reported 135 ft (41 m); cased. Lsd 700 ft (213 m) above msl. MP floor of instrument shelter, 4.48 ft (1.37 m) above Isd. Highest water level 8.50 ft (2.59 m) below Isd, May 25, 1967; lowest 37.25 ft (11.35 m) below Isd, Aug. 1, 2, 1954. Records available: 1942-74. Water levels affected by pumping.

GROUND-WATER LEVELS, 1973-74, NORTHEASTERN STATES
395804081593200 Continued.
Lowest water level for the day, from recorder graph, 1973
Day
5 10 15 20 25
Jan
22.35 22.42 23.69 23.71 23.75 23.62
Feb
23-49 e23.00 23.10 23-51 24.04 24.37
Mar
24.72 25.20 24.65 23.25 22.10 21.62
Apr
21.50 22.10 21.80 22.10 21.40 21.00
May
19.85 19.76 19.48 20.01 21.67 21.50
Jun
21.35
2i!soe20.65
21.37
Jul
e21.50 22.02 22.40 23.00 22.42 22.85
Aug
22.86 23-29 23-19 23.22 23-32 23-51
Sep
24.00 24.52 24.85 24.30 24.60 24.52
Dot
25-05 24.75 24.70 24.53 25-01 24.95
Nov
24.68 24.74 24.83 24.87 24.70 23-50
Dec
22.33 22.32 22.99 23.62 23.26 22.25
1974
5 10 15 20 25 Eom
22.75 23-20 23.79 23.70 21.82 19-36
19.75 19-95 20.72 21.21 21.09 21.63
21.30 21.04 20.38 20.02 20.19 20.08
17-55 15.51 15.21 16.49 17-36 18.05
18.21 18.72 18.51 17.98 18.31 18.62
19.41 20.12 20.50 20.98 20.67 20.32
20.50 21.54 22.00 22.99 23-64 23.87
23-71 24.32 23.84 23-80 24.28 24.10
22.76 21.85 21.95 22.18 22.30 22.17
22.47 23.14 23.95 24.51 25.10 25.14
25-39 25.40 25.13 24.92 24.91 24.55
24.57 24.43 23-48 22.61 22.54 21.36
e Estimated.
Portage County
411401081025000. Local number Po-1. Edward Liddle (previously reported Edward Tlddle). Wlndhara. Drilled unused artesian well In sandstone, dlara 6 In (15 cm), depth 55 ft (17 m) , casing information not available. Lsd 970 ft (296 m) above msl. MP floor of instrument shelter, 0.60 ft (0.18 m) above Isd. Highest water level 14.49 ft (4.42 m) ft (7.03 m) below Isd, Feb. 22, 1954. Records available:
, .elow Isd, June 13, 1947; lowest 23.
1946-74.
Day
510 15 20 25
Jan
20.14 20.09 20.17 20.17 20.14 20.09
Feb
20.00 19-9219.81 19.80 19.81 19.75
Lowest v
Mar
19.63 19.55 19.36 19.27 19.05 18.91
later le\
Apr
18.61 18.35 18.27 18.16 18.05 18.06
rel for the day,
May
18.08 18.04 18.05 17.98 17.97
Jun
17179 17.85 17.95 18.05
from rec
Jul
18.17 18.26 18.41 18.50 18.59 18.71
:order graph, 1973
Aug
18.82 18-90 19.08 19.13 19.24 19.42
Sep
19.48 19.60 19.72 19.86 19.96 20.05
Oct
20.13 20.17 20.21 20.30 20.34 20.29
Nov
20.38 20.47 20.37 20.46 20.36 20.39
Dec
20.25 20.24 20.27 20.20 20.16 20.03
1974
510 15 20 25
19.99 19.93 19.81 19.61 19-51 19.34
19.26 19.15 19.14 19.10 19.00 18.90
18.78 18.63 18.40 18.2518.18 17-87
17139 17.36 17.27
17.27 17.22 17.00 17.05 17.02 17-09
17-19 17-28 17.42 17.60 17-74 17.77
17.86 17.96 18.07 18.17 18.26 18.54
18.64 18.71 18.85 18.92 19.01 18.96
19-02 19.04 19.12 19.16 19.19 19.25
19.29 19.32 19.36 19.40 19.32 19.42
19.36 19.39 19.31 19.25 19.16 19.16
19.06 18.84 18.76 18.60 18.46 18.33
Rlehland County
404625082305100. Local number R-4. Ohio Brass Co. Formerly City of Mansfield. North Main St., Mansfield. Drilled unused artesian well in gravel, dlam 14 in (36 cm), depth 127 ft (39 m), casing Information not available. Lsd 1,150 ft (351 m) above msl. MP top of instrument table, 4.70 ft (1.43 m) above Isd. Highest water level 21.00 ft (6.40 m) below Isd, July 25, 1973; lowest 60.10 ft (18.32 m) below Isd, Oct. 12, 13, 19, 20, 1962. Records available: 1942-47, 1949-74. Water levels affected by pumping.
water level for the day, fr corder graph, 1973
Day
510 15 20 25
10
JS
27.28. 28. 28. 28. 28.
in
,90 ,70 ,93 ,80 .74 ,39
Feb
27.72 28.50 28.14 27.85 28.39 28.20
Ms
28. 28. 28. 27. 27. 27.
e26.
,40 ,52 ,30 ,50 .60 ,80
.8S,25on
Apr Mi
27.30 26.80 27. ..... 32 ..... 34 ..... 36, ..... 32
24ls8 11
»y
'.65 .60 .99 .00 .92
Ji
33. 35. 34, 35, 31, 29,
1!
28, ?6?fi
m
,45 ,40 ,55 .05 ,90 .40
?74
.10
Ji
28, 27, 25, 23. 21, 21.
?627,
a.40 ,12 .60 .22 .00 .05
.03
.67
Al
28. 28.27, 27,27, 28,
Ig.02 .05 .53 .40 .12 .45
Sep Oct
27.10 28.22 ..... 28.20 ..... 28-79 ..... 28-90 28.03 28.68 28.73 28.25
..... 33.79
..... 32.28
Nc
28. 28. 28. 28.
27.
?fi
,v
80 62 32
.00
.99
7R,81
Dec
26158 26.39
24.81 25.2024.61
e Estimated.
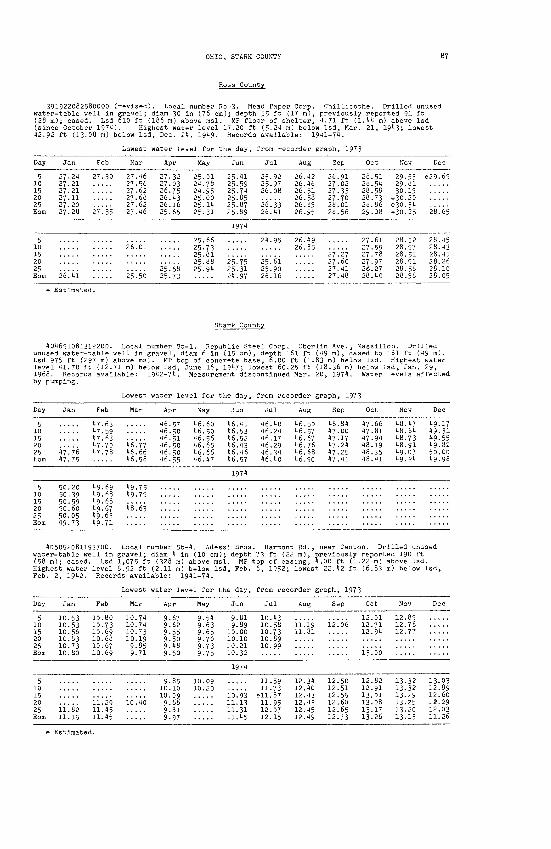
OHIO, STARK COUNTY
391922082580000 (revised). Local number- Ro-3. Mead Paper- Corp. Chillicothe. Drilled unuse water-table well in gravel; diam 30 in (76 cm); depth 55 ft (17 ra), previously reported 91 ft (28 m); cased. Lsd 610 ft (186 m) above msl. MP floor of shelter, 4.71 ft (1.44 m) above Isd (since October 1974). Highest water level 17.20 ft (5.24 m) below Isd, Mar. 21, 1943; lowest 42.92 ft (13.08 m) below Isd, Dec. 24, 1949. Records available: 1941-74.
Day
5 10 15 20 25
10
Ji
27 27 27 27 27 27
26
in
.24
.21
.21
.11
.20
.28
.41
Feb Mar
27.30 27.46 ..... 27.56 ..... 27.62 ..... 27.68 ..... 27.62 27.35 27.46
..... 26.01
..... 25.50
Ap
27. 27. 26. 26. 26. 25-
25.
r
3203 75 43 16 65
5873
May
25.01 24.78 24.95 25.00 25.14 25.31
25-73
;he day,
Jun
25.41 25.59 25.74 25-85 25.87 25.89
1974
24.97
Ji
25. 25. 26.
26! 26.
26.
il
.92
.97
.08
.33
.41
.16
Au
26. 26. 26. 26. 26. 26.
26.
r gi
g
42 46 51 58 85 95
4985
?aph.
Sf
26, 27. 27. 27. 28, 28,
27.
, 19
!P
.91
.02
.33
.70
.01
.56
.6041
.48
r3
Oct
28.51 28.54 28.58 28.73 28.86 29.08
27.59
28.40
Nc
29. 29. 30.
e30. e30, e30,
2828. PRPRPR28,
)V
.53
.81
.15
.20
.34
.25
.57
.58
.58
Dec
e29.65
28.43 28.4128.26
28.05
e Estimated.
Stark County
Lowest water level for the day, from recorder graph, 1973
Day
5 10 15 20 25
25
Jan
'Hi'.!*
47.75
Peb
47-63 47.59 47.63 47.70 47.78
Mar
46^77 46.66 46.58
Apr
46.57 46.50 46.51 46.50 46.50 46.55
May
46.60 46.50 46.56 46.65 46.66 46.47
Jun
46.41 46.53 46.52 46.43 46.46 46.57
1974
Jul
46.40 46.24 46.17 46.29 46.34 46.40
Aug
46.50 46.57 46.67 46.76 46.68 46.90
Sep
46.84 47.00 47.17 47.24 47-25 47.41
Oct
47.66 47.81 47.94 48.19 48.35 48.41
Nov
48.47 48.64 48.73 48.91 49.07 49.24
Dec
49-17 49.31 49.55 49.82 50.00 49-98
405052081193700. Local number St-4. Adessi Bros. Harmont Rd., near Canton. Drilled unused water-table well in gravel; diam 4 in (10 era); depth 73 ft (22 ra), previously reported 190 ft (58 m); cased. Lsd 1,075 ft (328 m) above msl. MP top of casing, 4.00 ft (1.22 m) above Isd. Highest water level 6.92 ft (2.11 ra) below Isd, Feb. 6, 1952; lowest 22.42 ft (6.83 m) below Isd, Feb. 2, 1942. Records available: 1941-74.
Lowest water level for the day, from recorder graph, 1973
Day
10 15
25
5
20 25 Eom
Jan
10.53 10.56
ii!82 11.15
Feb
10.73 10.69
11.29 11.45 11.45
Mar
10.74 10.73
10.40
Apr
9-679.62 9-55
9-85
9.66 9.8l 9.97
May
9.63 9.65
10.09
Jun
9.819-89
10.00
1974
11.13 11.31 11.45
Jul
10.58 10.73
11.59
11.95 12.07 12.15
Aug
11.19 11.81
12.34
12.43 12.45 12.49
Sep
12.06
12.50
12.5512.60 12.65 12.73
Oct
12.71 12.94
12.82
13.08 13-17 13.26
Nov
12.8512.78 12.77
13.32 13-32
13.25 13-20 13.13
Dec
13.03 12.8912.6012.29 12.03 11.26

GROUND-WATER LEVELS, 1973-7*1, NORTHEASTERN STATES
Summit County
410307081280100. Local number Su-3. Goodyear Tire & Rubber Co. Akron. Drilled unused water- table well In gravel, dlam 20 in (51 cm), depth 140 ft (43 m), cased to 140 ft (13 m). Lsd 1,020 ft (311 m) above msl. MP floor of Instrument shelter, 1.76 ft (0.54 m) above Isd. Highest water level 11.00 ft (3.35 m) below Isd, May 25, 1969; lowest 55.87 ft (17.03 m) below Isd, Oct. 18-20, 26-28, 1944. Records available: 1943-69, 1971-74.
Lowest water level for the day, fr recorder graph, 1973
Day
10
20
10
20 25 Eom
Jan
22.94
21.46
26.8526.06
24.36 23.67 22.85
Feb
18.76
21.56
20.35 19.79 19.46
Mar
18.40
16.93 16.43 15-79
Apr
13.62
15.08 14.68
15.10
May
18.22
19.85
ie!9917-39 17.76 18.06
Jun
22.76
24.57
1974
18.72
19.94 20.414 21.03
Jul
26.8527-50 28.1628.77
21.72
22.80 23.08 23.32
Aug
30.48
31.26
23-37
23.58 23.68 23-58
Sep
31.88
31.30 31.13
23-73
23.82 23.92 24.15
Oct
31.01
31.10
24.4224.50 24.6624.78 24.85 24.98
Nov
31.19
31.44 31.53
25.15 25.22
Dec
31.69
30.31
21.25 20.28
Tusearawas County
403653081321800. Local number Tu-1. Everett Waltz. Near Strasburg. Drilled unused water- table well In gravel, dlam 4 in (10 cm), depth 23 ft (7 m), cased to 23 ft (7 m). Lsd 928.24 ft (282.93 m) above msl. MP floor of Instrument shelter, 0.90 ft (0.27 m) above Isd. Highest water level 6.64 ft (2.02 m) below Isd, July 14, 1969; lowest 15.10 ft (4.60 m) below Isd, Oct. 31, Nov. 1, 1966. Records available: 1946-74.
Lowest water level for the day, from recorder graph, 1973
Day
5 10 15 20 25 Eom
Jan
11.05 11.04 11.31 11.51 11.58 11.55
Feb
11.17 10.93 11.01 11.13 11.25 11.42
Mar
11.38 11.07 10.93 10.18 10.13 10.15
Apr
10.12 9.87 9.90 9.85 9.81 9.81
May
9.88 10.10 10.25 10.46 10.52 10.23
Jun
10.43 10.60 10.83 11.06 11.30 11.51
Jul
11.73 11.99 12.04 12.26 12.40 12.49
Aug
12.64 12.77 12.83 12.83 12.99 13.25
Sep
13.32 13.42 13.52 13.66 13.71 13.72
Oct
13.35 13.18 13.13 13-13 13.26 13.20
Nov
12.88 12.91 13.03 13.13 13.18
Dec
ii.- 321974
5 10 15 20 25 Eom
11.46 11.63 11.83 11.15 10.35 10.02
10.27 10.42 10.59 10.86 10.87 10.89
10.80 10.82 10.63 10.50 10.55 10.24
9.12 8.86 8.97 9.27 9-67
10.03
10.18 10.47 10.43 10.48 10.52 10.72
10.92 11.15 11.47 11.67 11.78 12.04
12.22 12.41 12.62 12.79 13.16 13.21
13-30 13-33 13-34 13.22 13-39 12.51
12.08 12.17 12.36 12.57 12.62 12.87
13.00 13.12 13.22 13.27 13.40 13.48
13.45 12.94 12.65 12.54 12.52 12.20
12.16 11.58 11.07 10.64 10.59 9.90
Union County
401826083255200. Local number U-4. State of Ohio. M. Keirns property near Raymond. Drilled test artesian well In limestone, dlam 12 In (30 cm), depth 350 ft (107 m), cased to 37 ft (11 m). Lsd 1,040 ft (317 m) above msl. MP floor of Instrument shelter, 3.00 ft (0.91 m) above Isd. Highest water level 19.85 ft (6.05 m) below Isd, Mar. 17, 1973; lowest 23.60 ft (7.19 m) below Isd, Oct. 21, 1974. Records available: 1973-74.
Lowest water level for the day, from recorder graph, 1973
Day Jan
10 ..... 15 ..... 20 .....
Eom .....
10 ..... 15 ..... 20 ..... 25 .....
Feb
21.64
20.97 21.00 20.89 20.91 20.90
Mar
21.30 20.13
20.33
21.14 21.04 20.91 21.18 20.40
Apr
20.18
20.45
20.25 20.45 20.87 21.10 21.15
May
20.87 21.13
21.40
21.2621.38 21.46 21.60 21.46 21.50
Jun
21.04 21.26
21.08
1974
21.74 21.95 22.19 22.05 22.10
Jul
21.38 21.65 21.89
21.40
22.3022.43 22.49 22.74 22.78 23.03
Aug
21.80 20.42 21.01
21.68
23-17 23.21 23.31 23.35 23.14
Sep
22.03 22.16 22.30
22.46
23.22 23.05
Oct
22.40 22.37 22.46
22.36
23.36 23.43 23.56 23.42 23.49
Nov
22.60 22.44 22.44
21.46
23.29 23.14 22.93 23.04 23.07
Dec
21.63 21.71
22.47 22.06 21.91 21.42 21.69

OHIO, WASHINGTON COUNTY 89
Van Wert County
'40521508143351*00. Local number VW-1. Marsh Foundation. Van Wert. Drilled unused artesian well in dolomite, diam 8 in (20 cm), depth 3*10 ft (ID'4 m) , casing information not available. Lsd 785 ft (239 m) above msl. MP top of instrument platform, 6.15 ft (1.87 m) above Isd. Highest water level 18.85 ft (5.75 m) below Isd, Mar. 6, 1958; lowest 31.23 ft (9.52 m) below Isd, Dec. 31, 197*4. Records available: 1947-74.
Day
5 10 15 20 25
Jan
26.11 26.19 26.20 26.13 26.13 26.18
Feb
26.21 26.25 26.32 26.41 26.49 26.55
Mar
26.37 26.40 26.10 26.23 26.15 26.28
Apr
26.20 26.19 26.45 26.31 26.11 26.15
May
26.35 26.82 26.45 26.15 26.17 26.45
;he day,
Jun
26.39 26.58 26.62 26.66 26.62 26.55
Jul
26.57 26.68 26.73 26.80 26.71 26.73
Aug
26.85 26.71 26.81 26.91 26.96 27.09
Sep
27.09 27.18 27.05 27.17 27.18 27.21
Oct
27.140 27.23 27.29 27. 34 27.21 26.91
Nov
27. 48 27.70 27.10 27.51 27.32 27.63
Dec
27.12 27.61 27-90 27.82 27.85 27.83
1974
5 10 15 20 25 Eom
28.00 27.85 27.68 27.6227.72 27.34
27.65 27.42 27.60 27.40 27.53 27.3 1*
27.20 27.55 27.25 27.16 27.50 26.81
27.01 27.25 27.07 27.31 27.31 27.11
27.20 27.19 27.11) 27.43 27.45 27.07
27.47 27.37 27.40 27.55 27.61 27.63
27.95 27.99 28.26 28.65 28.69 28.83
28.814 28.87 29.15 29.18 29.25 29.10
29.25 29.014 29.10 29.10 29.07 29.13
29.30 29.22 29.33 29.66 29.148 29.50
29.45 29.73 29.92 29.74 30.57 30.80
30.85 30.75 30.91 30.95 31.22 31.23
Warren County
level for the day, from recorder graph, 1972
Day
20
5 10 15 20 25 Eom
5 10 15 20 25
Jan
27.10 28.15 27.65 27.20 26.95 26.95
2i). 35 23.75 24.1)0 2H. 00 24.85 21.75
Feb
26.60 26.55 26.25 26.60 26.00 26.30
22.30 20.80 21.55 21.30 20.95 20.95
Mar
21*. 86
26.1)0 26.30 26.35 25.80 25.40 25.25
21.80 21.1*0 21.15 21.75 22.20 21.70
Apr
25.10 21). 65 23.70 23-35 22.75 23.25
21.55 20.30 20.1*5 19-95 20.10 20.55
May
23.10 22.35 22.55 22.10 24.10 23.90
20.05 20.65 21.25 20.85 21.05 21.30
Jun
22.64
1973
23-00 22.1)5 22.85 24.00 23.15 23.15
1974
23-05 22.55 23.00 23.10 22.00 20.60
Jul
22.95 24.25 24.10 25.30 21*. 50 24.40
21.00 21.15 21.60 22.20 23.20 24.20
Aug
26.85
21). 10 21*. 50 25.05 28.40 25.15 25.85
23.85 23.85 24.00 21). 60 23.80 23.70
Sep
28.1)028.4529.64
28.84
26.05 25.90 26.05 26.65 26.40 26.45
23.40 23.05 22.25 22.10 22.50 21.60
Oct
27.40 26.30 26.25 26.30 26.20 25-50
22.25 21.55 21.65 21.65 22.20 22.25
Nov
25*75
22.10 21.20 21.60 21.30 21.1)0 21.30
Dec
21*. 95 23.95 21*. 85 24.00 23.05 24.10
23.00 20.65 21.25 20.95 20.10 21.00
Washington County
3921)58081271100. Local number Wa-1. Marietta Osteopathic Clinic. Third and Putnam Sts. (previously reported Fourth and Putnam Sts.). Marietta. Drilled unused water-table well in grav diam 6 in (15 cm), depth 1)2 ft (13 m), cased to 1)2 ft (13 m). Lsd 610 ft (186 m) above msl. MP floor of instrument shelter, 4.80 ft (1.1)6 m) above Isd. Highest water level 16.57 ft (5.05 m) below Isd, Mar. 25, 1945; lowest 30.70 ft (9.36 m) below Isd, Sept. 9, 1962. Records available: 191)2-71*. Measurement discontinued June 1974.
Lowest water level for the day, from recorder graph, 1973
Day
5 10 15 20 25
Jan
23.53 21). 16 25.00 25.42 25.42 25.12
Feb
21). 42 21). 33 21). 65 25.13 25.52 25.66
Mar
25.1)1 25.05 25.26 23.80 23.73 21). 00
Apr
24.08 23.38 23-33 23.80 23.98 22.67
May
23.08 23.52 23.21) 21*. 15 24.1)9 2l). 64
Jun
25.17 25. t7 25-83 26.09 26.39
Jul Aug
..... 27.67
..... 27.79
..... 27.82
..... 27.88
..... 27.88 27.56 28.08
Sep
28.21 28.05 28.09 28.06 28.12 28.17
Oct
28.13 28.12 28.17 28.17 28.22 28.07
Nov
27.80 27.82 27.83 27.78 27.78 26.83
Dec
26.75 26.93 26.82 26.82 26.1)0 25.62

GROUND-WATER LEVELS, 1973-74, NORTHEASTERN STATES
392458081271100 Continued.
Day Ji
25
2M2*}po
in
.47
Psib
4Q
49
MEir
29465874
Apr
24.45
Ms
ctr
2524?4
ly11
.76
,76
U
Ji
>74
m Jul Aug Sep Oct Nov Dec
,16 ..... ..... ..... ..... ..... .....
19.44 ..... ..... ..... ..... ..... .....
Wayne County
101802081583100. Local number Wn-2a. City of Wooster. Drilled unused water-table well in gravel, diam 6 in (15 cm), depth 65 ft (20 m), cased to 65 ft (20 m). Lsd 850 ft (259 m) above msl. MP floor of instrument shelter, 6.00 ft (1.83 m) above Isd. Highest water level 1.55 ft (0.17 m) below Isd, Jan. 27, 1952; lowest 34.50 ft (10.52 m) below Isd, Feb. 28, 1972. Records available: 1951-71.
Day
20
Js
18
m
,63
85
P<
21.
>b
,99
,76,78
39
Mar
12.93
24.67
AI
19,
19
Q
1414
3r May
.44 .....
.45 .....
Ji
2222. 21
i<
1818
iay,
in
16
.13
)74
44
from recorder graph, 1973
Jul Aug Sep Oc
PQ..... ..... ..... 30.
:t Nov Dec
.63 ..... .....
.40 ..... .....
.85 ..... .....cfi
105805081162300. Local number Wn-6. Tenneco, Inc. Rittman. Drilled unused water-table well in gravel, diam 8 in (20 cm), depth ISO ft (55 m), cased to 180 ft (55 m). Lsd 960 ft (293 m) above msl. MP top of casing, 2.30 ft (0.70 m) above Isd. Highest water level 78.60 ft (23.96 m) below Isd, Dec. 2, 1971; lowest 93.20 ft (28.11 m) below Isd, Sept. 3, 1971. Records available: 1971-71.
Lowest water level for the day, from recorder graph, 1973
Day
5 10 15 20 25 Eom
5 10
Eom
Jan
86.50 86.11 86.36 86.21 86.11 86.20
88.88 88.80 88.7386.3086.3186.07
Peb
85.30 85.35 84.82 84.76 84.99 84.83
86.20 86.00
88.40
Mar
85-48 85.33 84.96 85.02 83-70 83-85
89-36 86.31
86.58
Apr
84.75 83.78 84.20 84.00 84.10 84.29
86.57 86.88
86.4086.3786.01
May
84.30 84.20 84.40 84.17 84.64 84.97
85.99 86.48
89.0787.82
Jun
84.94 84.26 84.31 83.76 83.43 83.50
1974
88.01 87.85
87.6587.6187.75
Jul
83.41 83-45 83.49 84.85 84.09 83.91
85.79 85.60 85.49
85.4685.45
Aug
84.15 83.93 84.16 84.12 84.21 83.90
85.45 85.33
84.95
Sep
83.55 83.60 83.10 83.09 82.80 82.30
85.15 84.39
Oct
83.85 84.17 82.11 82.21 87.71 86.38
85.24 85.08
84.80
Nov
87.20 87.27 83.25 83.95 83.18 87.95
79-50
Dec
83.05 86.30 86.32 86.15 89.79 89.63
83.90 84.80
84.73
83.79
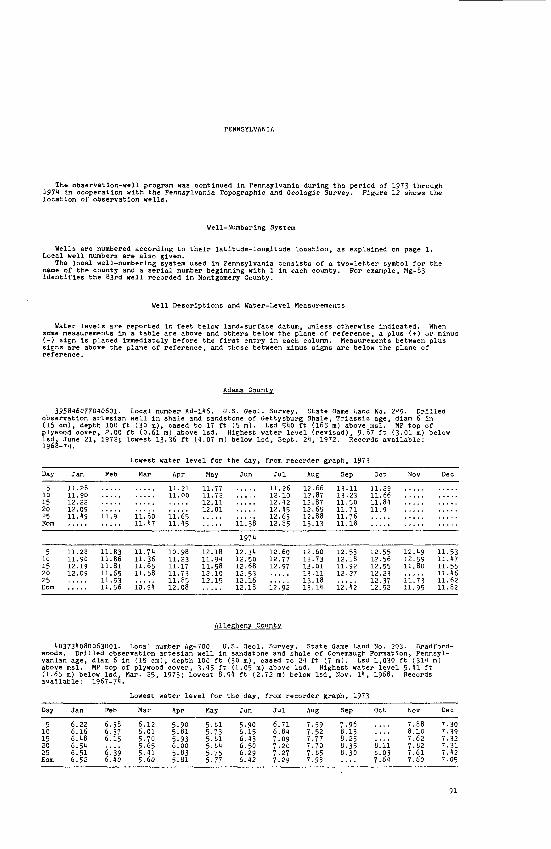
PENNSYLVANIA
The observation-well program was continued in Pennsylvania during the period of 1973 through 197*1 in cooperation with the Pennsylvania Topographic and Geologic Survey. Figure 12 shows the location of observation wells.
Well-Numbering System
Wells are numbered according to their latitude-longitude location, as explained on page 1. Local well numbers are also given.
The local well-numbering system used in Pennsylvania consists of a two-letter symbol for the name of the county and a serial number beginning with 1 in each county. For example, Mg-83 Identifies the 83rd well recorded In Montgomery County.
Well Descriptions and Water-Level Measurements
Water levels are reported in feet below land-surface datum, unless otherwise indicated. When some measurements in a table are above and others below the plane of reference, a plus ( + ) or minus (-) sign Is placed immediately before the first entry in each column. Measurements between plus signs are above the plane of reference, and those between minus signs are below the plane of reference.
Adams County
3958*60770*0601. Local number Ad-146. U.S. Geol. Survey. State Game Land No. 2*19. Drilled observation artesian well in shale and sandstone of Gettysburg Shale, Triassic age, diam 6 In (15 cm), depth 100 ft (30 m), cased to 17 ft (5 m). Lsd 540 ft (165 m) above msl. MP top of plywood cover, 2.00 ft (0.61 m) above Isd. Highest water level (revised), 9.87 ft (3.01 m) below Isd. June 21, 1972; lowest 13.36 ft (*.07 m) below Isd, Sept. 24, 1972. Records available: --'8-74.J.OU .
1968-Lowest water level for the day, from recorder graph, 1973
Day
510 15 20 25 Eom
Jan
11.28 11.90 12.19 12.09
Feb
11.83 11.86 11.81 11.65 11.53 11.56
Mar
11.71) 11.36 11.65 11.58
io!g4
Apr
10.98 11.23 11.17 11.73 11.85 12.08
May
12.18 11.94 11.58 12.10 12.15
Jun
197*
12.3* 12.50 12.68 12.53 12.16 12.18
Jul
12.60 12.77 12.97
12.92
Aug
12.60 12.73 13.0113.11 13.18 13.14
Sep
12.5312.18 11.92 12.27
12. *2
Oct
12.55 12.56 12.55 12.23 12.37 12.52
Nov
12. *9 12.59 11.80
ii'.73 11.95
Dec
11.53 11.47 11.55 11. *6 11.62 11.82
Allegheny County
*03734080063001. Local number Ag-700. U.S. Geol. Survey. State Game Land No. 203. Bradford- woods. Drilled observation artesian well in sandstone and shale of Conemaugh Formation, Pennsyl- vanian age, diam 6 in (15 cm), depth 100 ft (30 m), cased to 24 ft (7 m). Lsd 1,030 ft (311 m) above msl. MP top of plywood cover, 3.*5 ft (1.05 m) above Isd. Highest water level 5.41 ft (1.65 m) below Isd. Mar. 25, 1973; lowest 8.91 ft (2.72 m) below Isd, Nov. 14, 1968. Records available: 1967-7*.
Lowest water level for the day, from recorder graph, 1973
Day
5 10 15 20 25 Eom
Jan
6.22 6.16 6.*8 6.5* 6.51 6.52
Feb
6.38 6.37 6.15
6^39 6.40
Mar
6.12 6.01 5-70 5.65 5.41 5.60
Apr
5-90 5.81 5-93 6.00 5-83 5.81
May
5.81 5.73 5.81 5.84 5.75 5.77
Jun
5.90 6.15 6.43 6.50 6.29 6.42
Jul
6.71 6.84 7.09 7.20 7.27 7-29
AUg
7-59 7.52 7.77 7.70 7-85 7.93
Sep
7-96 8.13 8.25 8.35 8.30
Oct
s.'ii8.03 7.64
Nov
7.88 8.10 7.62 7.82 7.61 7.60
Dec
7-30 7.39 7-32 7-31 7.*2 7.05

Figure 12. Location of
ob
serv
atio
n wells
in Pennsylvania,
1973-71.

1037 31(080063001 Continued.
PENNSYLVANIA, BEDFORD COUNTY
1971
Day
510 15 20 25Horn
Jan
7.18 7.17 6.81 6.tl 6.21 6.16
Peb
6.t7 6.32 6.52 6.53 6.1)7 6.29
Mar
6.23 6.27 5.97 6.01 6.30 6.00
Apr
5.80 6.00 5.80 6.18 6.30 6.26
May
6.20 6.03 5.96 5.91 5.80 5-78
Jun
5.93 5.90 6.30 6.1)7
Jul
e'.sB 6.656.81 6.93 7.11
Aug
7.19 7-32 7-55 7-65 7.75 7.83
Sep
8.03 7.66 7-56 7.55 7-D5 7.1)2
Oct
7.62 7.51 7.51 7.70 7.1)3 7.60
Nov
7.33 7.26 7.32 6.91 7.15 7.12
Dec
6.81) 6.35 6.12 6.22 6.32 6.28
Armstrong County
101056079395201.
Jan.
Feb.
Mar.
Apr.
May
June
Date
3, 1973101721317
1721287
1121281
11182529
1523306
132027
Water level
35.5637.2737.7832.9236.1131-5130.9337.7837.7633.9732.3531.9631.8231.3035.1236.3733.7031.8635.9535.1936.0736.1636.0136.9137.6337.71
L number Ar-2. Martin J. Cordera. Schenley. r Quaternary age, dlam 6 In (15 cm), depth 82r&o ftft (7?ds av
July
Aug.
Sept.
Oct.
Nov.
Dec.
(238 m).57 m) beallable:
Date
1, 197311182518
1522295
1219265
101721317
1121285
121926
above msl.low Isd, J;1919-71.
Water level
38.2638.6838.9538.7138.5638.8738.5238.5038.6138.7538.9838.7138.6637.5638.2138.5938.7135.8637.1738.1137.6935-0136.1135-9635-6233.82
MP top of casiin. 23, 1959; lo
Date
Jan. 2, 19719
162330
Feb. 6132027
Mar. 6132027
Apr. 3101721
May 8152229
June 5121926
July 3
ng,west
Di ft
0.3!10
Water level
3536363133353637353331313633333136363336373838373831
.66
.00
.18
.33 91.57.81-77-30.81 91.95.06-19.63.71.16.70.27.01.36.26.55-52.16.05
Drilled unused water-table (25 m), casing Informa-
i ft (0.12 m) above Isd. 70 ft (12.11 m) below
July
Aug.
Sept.
Oct.
Nov.
Dec.
Date
10, 197")172t317
It2128
. 111182529
1623306
1320271
111825
Water level
37. D838.6838. 9138.9238. 7138.6838.9737.6235.8238.1237.9637-1237.1138.2538.0638.0538.1236.6036.7236.0333.7235.5231.5635.2231.92
Beaver County
103006080252301. Local number Bv-156. U.S. Geol. Survey. Raccoon State Park. Drilled obser vation artesian well in shale of Conemaugh Formation, Pennsylvanlan age, diam 6 in (15 cm), depth 101 ft (31 m), cased to 25 ft (8 m). Lsd 930 ft (283 m) above msl. MP top of plywood cover, 1.05 ft (1.23 m) above Isd. Highest water level 8.00 ft (2.11 m) below Isd, Mar. 15, 1971; lowest 13-72 ft (1.18 m) below Isd, June 5, 1968. Records available: 1967-71.
Lowest water level for the day, from recorder graph, 1973
Day
5 10 15 20 25 Eom
Jan
9-67 9.66 9.80 9.88 9.78 9.61
Feb
9-13 9.38 9.20 9.11 9.57 9.60
Mar
9.39 9.25 8.90 8.85 9.12 9.52
Apr
9.51 9.30 9-52 9.58 9-50 9.37
May
9.70 9.81
10.25 10.30 9.91 9.91
Jun
10.01 10.21 10.60 10.55 10.17 10.81
Jul
11.12 11.35 11.51 11.63 11.80 11.80
Aug
11.98 11.80 11.70 11.68 11.13 11.61
Sep
11.57 11.60 11.61 11.79 11.62 11.10
Dot
10.98 11.08 11.31 11.71 11.68 10.92
Nov
10.92 11.30 10.80 10.69 10.10 10.19
Dec
10.07 10.11 10.00 10.00 9.92 9.83
1971
5101520 25 Eom
9.83 9.71 9.60 8.88 9.18 9.28
9.50 9.37 9-58 9.50 9.16 9.16
9.11 9.02 9.02 9.10 9-30 9.12
8.80 8.98 8.91 9.20 9.20 9.15
9-00 9-07 8.72 8.81 8.92 8.91
9.22 9.10 9.30 9.10 9.20 9-30
9.30 9.20 9.47 9.68 9.71 9.81
9.81 9-90
10.02 9-98
10.00 9.62
9.50 9.55 9.50 9.66 9.32 9.12
9.62 9.60 9.59 9.65 9.69 9.75
9.20 9.31 9.40 9.17 9-23 9-33
9.10 8.77 8.80 8.67 8.51 8.75
Bedford County
100220078282001. Local number Bd-150. U.S. Oeol. Survey. Bedford. Drilled observation artesian well In shale of Onondaga Limestone, Devonian age, dlam 6 In (15 cm), depth 150 ft (16 m), cased to 17 ft (11 m). Lsd 1,110 ft (317 m) above msl. MP top of plywood cover, 3.05 ft (0.93 m) above Isd. Highest water level 3.93 ft (1.20 m) below Isd, Apr. 30, 1973; lowest 11.12 ft (12.62 m) below Isd, Peb. 12, 1966. Records available: 1965-71.

GROUND-WATER LEVELS, 1973-71, NORTHEASTERN STATES
100220078282001 Continued.
Lowest water level for the day, from recorder graph, 1973
Day
5 10 15 20 25 Eon
5 10 15 20 25 Eom
Jan
12.72 12.81 11.13
ieigs13.80
12.75 13-32 11.73 11.08 9-83 9.61
Feb
11.00 9.56
10.30 11.91 13.81 11.78
11.03 12.10 13.71 15.00 11.87 11.86
Mar
15-58 11.83 10.97 10.10
12!o3
11.57 13.32 11.65 12.39 12.71 12.10
Apr
8.06 5.62 5.28 6.68 7.83 3.93
10.18 10.20 8.60 9.65
10.82 11.83
1.90 6.18 7-17 8.50 9.20 1.91
12.92 11.12 13-98 13.68 11.26 15.12
Jun
6.21 7.78 9.70
11.60 13.00 11.10
1971
15-76 15.90 16.56 16.65 11.90 12.50
Jul
15.16 16.50 17.60 18.63
10.81 11.76 12.98 11.28 15.53 16.70
23!l8 23.82
17-70 18.62 19.19 20.30 21.00 21.80
Sep
21.36 25.00 25.55 26.01 26.20 26.31
22.56 23.01 23.50 23.96 21.10 21.87
Oct
21.53 21.73 25-10 26.31 26.95 25.10
25.10 25.80 26.23 26.70 26.97 27.13
Nov
22.78 23.57 23.99 25.10
23ie6
27.7728.11 28.15 28.15 28.19 28.19
Dec
21.53 19.01 16.62 16.10 11.25 12.13
28.12 25.83 23.61 20.22 19.22 19.70
Lowest water level for the day, from recorder graph, 1973
Day
10
5 10 15 20 25 Eom
Jan
25.98
25.28 25.35 25.50 25.13 25.27 25.07
Feb
25.52
25.20 25.56 26.10 26.6327-17 27.17
Mar
26.99 26.16
27.78 28.01 28.03 27.85 27-79 27.91
Apr
21.50
27.90 27.78 27.66 27.19 27.12 27.59
May
21.22
27.82 28.11 28.18 28.83 29.16 29-55
Jun
1971
29.88 30.20 30.52 30.80 31.08 31.21
Jul
31.19 31.10 31.02 31.02 31-10 31.23
Aug
30.3230.60
31.15 31.67 31.90 35.11 32.35 32.72
Sep
31.56
32.99 33-23 33-16 33.68 33.92 31.10
Oct
31.51
31.35 31.55 31.77 35.00 35-20 35-16
Nov
28.90 28.82
35.65 35-85 36.03 36.20 36.37 26.56
Dec
28.12
26.61
36.68 36.78 36.79 36.63 36.33 35.96
Local number Ba-7l. U.S. Gee shale of Bralller Formatlo
102152078271301. _____ ________ ______ _ . ___________ __vation artesian well in shale of Bralller Formation, Devonian age, diam 6 in (15 cm), depth 150 ft (16 m), cased to 11 ft (1 m). Lsd 1,130 ft (311 m) above msl. MP top of casing, 1.80 ft (0.55 m) above Isd. Highest water level 11.01 ft (3-36 m) below Isd, Apr. 5, 1971; lowest 18.65 ft (5.68 m below Isd, Oct. 29, 1969. Records available: 1969-71.
Lowest water level for the day, from recorder graph, 1973
Day
510 15
Eom
5 10 15 20 25 Eom
Jan
is. 25
12.61
11.15 12.00 11.58 11.21 11.11 11.26
Feb
12.19 11.0511.11
11.6 12.18 12.17 12.87 12.21 12.17
Mar Apr
..... 11.70
..... 11.22
..... 11.82
..... 11.19
..... 11.01
..... 11.10
..... 11.15 11.70 11.92 12.06 11.98 11.82 12.35
May
12.00 12.1012.23
12.16
11.91 12.15 12.12 12.83
Jun
13-25
1971
13.12 13.37 13.89 13.87 13-70 13.15
Jul
13.11 13-58 13.85
13.15
12.75 13-02 13.57 13-99 11.39 11.13
Aug
12.87 12.96 13.50
13.30
11.12 11.28 11.19 11.71 11.99 15.02
Sep
13.71 11.12 11.20
13.82
11.85 11.72 11.82 11.90 11.92 15.00
Oct
12.80 12.81 12.90
12.52
15.18 15.61 15-63 15.51 15.12 15-59
Nov
12.10 12.88 12.81
11.93
15.57 15.19 11.96 11-75 11.65 11.71
Dec
11.76 11.5511.5
11.28
11.05 13-19 13.16 12.90 12.71 12.59
Bradford County
111330076280501. Local number Br-92. U.S. Geol. Survey. Monroeton. Drilled observation artesian well in Gardeau Shale Member of West Falls Formation, Devonian age, diam 6 in (15 cm), depth 117 ft (36 m), cased to 55 ft (17 m). Lsd 750 ft (229 m) above msl. MP top of casing, 3.05 ft (0.93 m) above Isd. Highest water level 2.11 ft (0.65 m) below Isd, Mar. 1, 1972; lowest 11.01 ft (3.36 m) below Isd, Oct. 27, 1969. Records available: 1966-71.

PENNSYLVANIA, BUTLER COUNTY
41133007*280501 Continued.
Day
5 10 15 20 25
Jan
5.01 6.12 7.29 7.96 7.55 7.76
Feb
4.30 4.77 6.28 7.30 7.92 8.28
Lowest w
Mar
8.12 7.327.43 5.04 5.74 6.71
ater lev
Apr
3.82 3.14 4.04 5.38 6.64 6.56
el for the day,
May
7.08 7.64 7-17 6.89 6.30 5.80
Jun
6.49 7.31 7.75 8.20 8.39 7.05
from rec
Jul
7.81 8.62 9.08 9.40 9.60 9.80
:order gi
Aug
9.98 10.20 10.29 10.08 10.22 10.40
'aph, 1973
Sep
10.51 10.36 10.10 9.79 9.35 9.61
Got
9.84 10.03 10.21 10.39 10.49 10.38
Nov
10.31 10.40 10.42 10.30 10.50 9.48
Dec
9-50 6.10 5-19 5.92 3.00 2.91
1974
5 10 15 20 25 Eom
4.28 5-70 6.73 6.70 3.34 3.36
4.87 e6.0 e6.9 7-65 5.30 5.71
5-93 4.90 4.80 6.01 6.16 6.78
2.92 3.91 2.804.15 5.68 6.86
7-53 8.13 8.15 8.57 8.92 9-23
9.42 9.70 9.94 9.51 9-67 9-57
7.80 8.64 9.20 9.62 9.92 9.92
10.19 10.37 10.49 10.61 10.76 10.59
8.64 9.02 9-33 9.62 9.26 9.58
9.82 10.03 10.20 10.23 10.31 10.42
10.42 10.20 8.91 8.96 8.58 8.12
8.34 3.88 4.05 3.30 4.19 4.64
Estimated.
402643075150501. Local number Bk-929. U.S. Oeol. Survey. Nockamixon State Park. Drilled o servation artesian well in shale of Brunswick Formation, Triassic age, diam 6 in (15 cm), depth 116 ft (35 m), cased to 27 ft (8 m). Lsd 460 ft (140 m) above msl. MP top of plywood cover, 1.05 ft (0.32 m) above Isd. Highest water level 47.28 ft (14.41 m) below Isd, Dec. 25, 1974; lowest 59.75 ft (18.21 m) below Isd, Nov. 26, 1968. Records available: 1967-74.
Day
5 10 15 20 25 Eom
Jan
50.30 50. 50.62 51.00 51.23 51.05
Feb
50.00 49.62 49.05 49.80 50.48 50.60
Lowest \
Mar
50.83 50.80 50.50 49.78 49.75 49-42
jater le^
Apr
48.5548.43 48.60 48.74 48.63 48.90
rel for the day,
May
48.39 48.48 48.90 48.82 49.0
Jun
50.39
from recorder gi
Jul
50.60 50.2 50.4 50.8
Aug
-aph, 1973
Sep
53.06 53.56 54.03 54.22
Oct Nov Dec
53.95 53.00 51.52
1974
510 15 20 25
51.18 50.89 50.38 50.58 50.2 49-
50.00 49. 50.50 50.89 50.60 48.28
48.20
48.12 48.10 48.46 48.89 49.25 49.68
50.11 50.36 50.50 50.80 50.88 50.66
50.45 49.30 48.76 48.81 49.10 48.89
48.90 48.52 48.60 48.38 47.90 47.97
47-90 48.40 48.68 48.10 48.86 49.95
49.29 48.45 49.16 48.21 47.28 47.31
Butler County
410501079524401. Local number Bt-311. U.S. Geol. Survey. State Game Land No. 95. Drilled observation artesian well in middle part of Kittanning Formation, Late Pennsylvanian age, diam 6 in (15 cm), depth 89 ft (27 m), cased to 12 ft (4 m). Lsd 1,465 ft (447 m) above msl. MP top of casing, 2.30 ft (0.70 m) above Isd. Highest water level 6.55 ft (2.00 m) below Isd, Apr. 15, 1974; lowest 29.21 ft (8.90 m) below Isd, July 24, 1974. Records available: 1970-74.
Day
5 10 15 20 25 Eom
J an Feb
Lowe
Ma
st water level for the day,
r Apr May Jun
from rec
Jiil
;order graph, 1970
Aiig Sep Oc t Nov
17.70 17-30 17.17 16.33
Dec
15.85 15.60 15.00 14.65 14.80 16.50
1971
5 10 15 20 25 Eom
16 16
.35
.7216.96 14.95 14.87 14.30 12.82 12.45
12. 12. 10. 10. 11. 10.
16 20 95 72 09 30
10.83 15-32 15.70 11.32 11.70 16.62 11.80 12.08 16.70 12.65 12.48 17.85 13.17 12.60 19.39 14.55 13.65 21.00
22, 23, 23 24 24, 25,
.38
.05
.42
.00
.62
.32
25 25. 26, 26 27, 27,
.68
.82
.38
.60
.08
.35
27.65 27.74 25.30 23.40 26.00 27.07
27. 27. 27. 27. 27. 27.
12 09 45 60 40 70
27.90 28.00 28.20 28.20 28.92 23.78
15^88 16.05 14.80
1972
5 10 15 20 25 Eom
14 14 14 14 13 13
.13
.00
.86
.46
.93
.90
13.95 14.90 13-30 13.64 13.32 13.09
11. 70 ..... ..... 14.4510, 10, 11, 13. 17.
.16
.21
.16
.03
.59
19-56 20.73 22.37 23.76 24.36 25.47
25.73 25.80 21.38 20.60 25.51 25.58
25. 20. 24. 26. 26. 26.
94 25 65 20 49 50
16.66 14.80 13.10 12.62 12.40 12.03
10.80 10.77 10.40 10.02 10.12 10.02

96 GROUND-WATER LEVELS, 1973-74, NORTHEASTERN STATES
410501079524401 Continued.
Day
510 15 20
10 15 20 25
Jan
9.90 10.12 10.68 10.88 10.40
10.21 10.31
Feb
ii.'oi
10.22 10.48 10.31 10.37
Mar
10.29 10.37 10.08 9.40
9.93 9-90 9.93
10.15
Apr
8.50 8.90 9.31 8.91 8.718.69
7.00 6.55 7.53 7-55
May
8.89 8.80 8.90 8.79
7.119.57 9.66 9-73 9.94
Jun
10.89 12.00 11.811 12.42
12 53
1971
15-05 19.24 23.40 27.38
Jul
14.35 18.00 20.49 23.20
28.01
Aug
24.12 24.23 19.80 15.20
25.97 25.63 25.80 26.00
Sep
23.72 24.61 25.00 25.57
26.08 26.49 26.70 21.46
Oct
21.80 19.94 21.48 24.72
26.77 26.90 27.18 27.21
Nov
12.20 11.60 10.82 10.51
26.81 23.55 26.30 17.95
Dec
9.43 9.81 9.40
8!32
Cambria County
412732078034201. Local number Cm-13. U.S. Qeol. Survey. Sinnemahoning State Park. Drilled observation artesian well in sandstone of Catskill Formation, Mississippian and Devonian age, diam 6 in (15 cm), depth 102 ft (31 m), cased to 57 ft (17 m). Lsd 1,010 ft (308 m) above msl. MP top of plywood cover, 3.07 ft (0.94 m) above Isd. Highest water level (revised), 21.50 ft (6.55 m) below Isd, June 23, 1972; lowest 25.98 ft (7.92 m) below Isd, Sept. 10, 1972. Records available: 1967-74.
Lowest water level for the day, from recorder graph, 1973
Day
5 10 15 20 25
5 10
25Eom
Jan
24.04 24.16 24.32 24.34 24.22
23.38 23.49
23.33 23.49
Feb
23.95 23.95 23.94 24.04 24.36
23.47 23.50
23.54 23.53
Mar
24.11 23-96 23.66 23-62 23.80
23-36 23-31
23.52 23.08
Apr
23.84 23.66 24.11 23.94 23.74
22.84 23.24
May
23.78 23-70 23.73 23-57 23-66
23.24 23.38
Jun
23.66 23-59 23.69 23.84 23.78
1974
23.70 23.69 23.88
23.74 23.62
Jul
24.08 24.22 24.33 24.28 24.26
23.37 23.44
23.75 23.80
Aug
24.54 24.56 24.52 24.21 24.28
23.90 24.18 24.27
24.61 24.12
Sep
24.24 24.21 24.24 24.30 24.53 24.46
24.01 23.88
23.72 23.62
Oct
24.32 24.23 24.11 24.31 24.27
23.85 23.80
23.85 23.95
Nov
23.88 24.06 23.80 24.12
23.65 23.68
23.3523.36 23.58
Dec
23.63 23.18 23.36
23.25 23.24

PENNSYLVANIA, CHESTER COUNTY
Carbon County
410123075425401. Local number Cb-104. U.S. Geol. Survey. Hickory Run State Park. Drilled observation artesian well in shale of Mauch Chunk Formation, Pennsylvanlan and Mlsslssippian age, diam 6 in (15 cm), depth 125 ft (38 m), cased to 20 ft (6 m). Lsd 1,290 ft (393 m) above msl. MP top of casing, 3-00 ft (0.91 m) above Isd. Highest water level 21.12 ft (6.4*4 m) below Isd, Apr. 5, 1970; lowest 83-51 ft (25.45 m) below Isd, Nov. 8, 1972. Records available: 1969-7').
Lowest water level for the day, from recorder graph, 1973
Day
5 10 15 20 25 Eom
5
Ja
32. 37- 12. 15- 36. 33.
30. 36.
4?
n
33 50 1)0 19 81 51
28
Fe
26.29. 3D. 40. 1)1). 1)6.
34.
i)R
36.
b
40 80 97 30 50 80
12 65
Mar
50.37 52.60 50.47 37-50 35-28 39.11
39.32
36.63
Apr
34.80 29.90 30.00 35-33 1)0.60 1)2.70
29.72
M;
43 45 37. 34 36 37
49
4239
47
iy
.43 -55 .20 .30 .09 .00
.66
.56
Jun
40.42 36.70 40.45 45-05 1)8.99 32.99
1974
51.80
Ji
25 3138, 44
59r-O
63,
al
.50
.20
.20
.03
.15
Aug Sep
..... 62.10
..... 64.07
..... 65.78
..... 63.25 55.31 58. 59.50 ----.
..... 69.37
Oct
50.00 50.10 52.20 55.39 58.51 59-95
50.28
Nc
52 51 52 54
56
62
3V
.62
.05
.28
.82
[40
.55
1893
Dec
47.20 34.30 30.00 32.20 22.85 24.12
39-64
Centre County
404518077575501. Local number Ce-ll8. U.S. Geol. Survey. State Game Land No. 176. Drilled observation artesian well in sandstone and dolomite of Gatesburg Formation, Cambrian age, diam 6 in (15 en), depth 130 ft (1)0 m), cased to 40 ft (12 m). Lsd 1,150 ft (351 m) above msl. MP tc of casing, 2.50 ft (0.76 m) above Isd. Highest water level 54.8 ft (16.7 m) below Isd, Oct. 7, 1972; lowest 80.14 ft (24.43 m) below Isd, Mar. 16, 1970. Records available: 1968-74.
Lowest water level for the day, from recorder graph, 1973
Day
510 15 20 25 Eom
Jan
57.80 57.96 58.12
58.'44 58.67
Feb
58.6858.79 58.83 59-02 59-18 59-24
Mar
59-33 59.43 59-47 59.57
59^66
Apr
59-73 59.77 59-89 59-90 59-89 59-91
May
59-88 59-86 59-90 59-83 59-80 59.76
Jun
59-71 59-52 59-36 59.24 59-07 58-95
Jul
58.79 58.67 58.53 58.45 55.2 58.18
Aug
58.10 57-98 57-89 57-85 57-8 57-7
Sep
57-7 57-7 57-7 57-7 57-88 57-93
Oct
58.01 58.08 58.10 58.24 58.31 58.37
Nov
58.5558.71 58.73 58.96
59^24
Dec
59-34 59.47 59-61 59.76 59-90 59.97
1974
5 10 15 20 25 Eom
60.11 60.22 60.38 60.51 60.60 60.68
60.81 60.88 61.02 61.14 61.26 61.29
61.42 61.55 61.62 61.69 61.86 61.93
e6l.9 61.97 61.96 62.04 62.08 62.10
62.14 62.17 62.17 62.22 62.19 62.20
62.24 62.22 62.25 62.27 62.28 62.30
62.31 62.31 62.35 62.35 62.38 62.03
62.04 62.04 62.05 62.05 62.61 62.64
62.72 62.75 62.82 62.88 62.97 63.03
63.14 63.21 63.29 63.43 63.50 63.61
63-70 63.83 63.94 64.00 64.17 64.30
64.41 64.49 64.60 64.65 64.77 64.88
e Estimated.
Chester County
395450075485401. Local number Ch-10. Robert J. Kleberg, Jr. Doe Run. Drilled unused water- table well in Cockeysvllle Marble, Precambrlan age, diam 6 in (15 cm), depth 34 ft (10 m), casing information not available. Lsd 300 ft (91 m) above msl. MP top of wooden cover, 1.00 ft (0.30 m) above Isd. Highest water level 8.28 ft (2.52 m) below Isd, Mar. 30, 1958; lowest 16.22 ft (4.94 m) below Isd, Nov. 3, 1963. Records available: 1951-74.
Lowest water le\
Day
5 10 15 20 25 Eom
Jan
10.32 10.73 11.15 11.30
Feb
10.78 10.93
Mar
10.85 10.78 10.99 11.01 11.21 10.90
Apr
9-49 9.20 9.67
10.19 10.42 9.90
rel for the day,
May
10.26 10.39 10.78 10.97 10.94 10.08
Jun
10.16 10.20 10.27
11.45 11.64
from rec
Jul
10.31 10.73 10.12 11.43 11.69 12.00
:order graph, 1973
Aug
11.98 12.21 12.40 12.58 12.74 12.92
Sep
13.10 13.13 13-23 13.23 13.36 13.45
Oct
13.51 13.62 13.60 13.81 13-89 13-72
Nov
13.82 13.99 14.05 14.12 14.20 14.21
Dec
14.27 13.47 13.28 13-3 11.32 10.57
1974
5 10 15 20 25 Eom
10.53 10.95 10.56 10.88 10.58 11.00
11.45 11.7 12.0 12.17 12.13 12.21
12.28 12.38 12.53 12.55 12.08 11.40
10.69 10.10 10.10 10.73 11.18 11.60
11.91 12.18 12.11 12.43
12.82
12.97 13.10 13.30 13.42 13-02 12.90
13.08 13-30 13-49 13.62 13.76 13.88
13.85 13.90 14.00 14.07 14.14 14.24
14.28 14.15 14.23 14.32 14.39 14.02
14.09 14.29 14.37 14.22 14.32 14.41
14.50 14.55 14.60 14.61 14.61 14.69
14.26 12.40 12.67 11.74 12.21 12.68
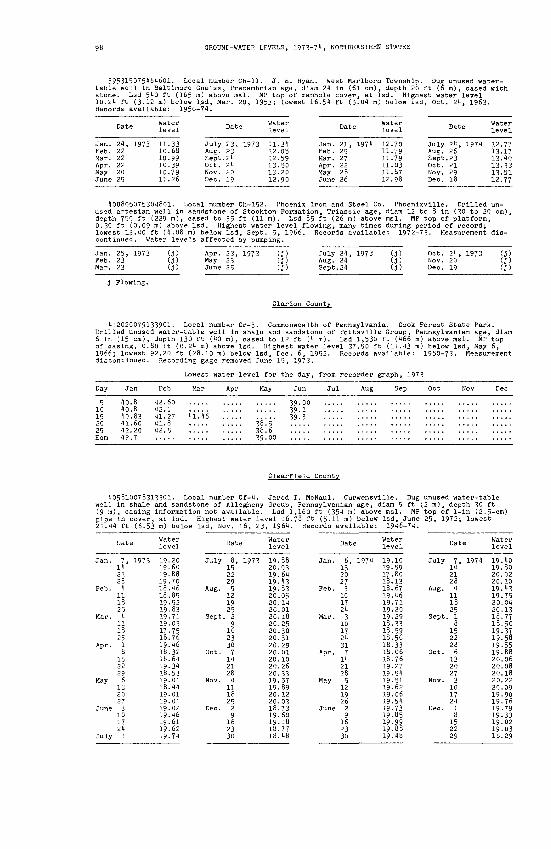
GROUND-WATER LEVELS, 1973-74, NORTHEASTERN STATES
395315075484601. Local number Ch-11. J. E. Ryan. West Marlboro Township. Dug unused water- table well in Baltimore Gneiss, Precambrlan age, dlam 24 In (61 cm), depth 20 ft (6 m), cased with stone. Lsd 540 ft (165 m) above msl. HP top of manhole cover, at Isd. Highest water level 10.24 ft (3.12 m) below Isd, Mar. 20, 1953; lowest 16.54 ft (5.04 m) below Isd, Oct. 24, 1963. Records available: 1950-74.
Jan. Feb. Mar. Apr. May
Date
24, 1973 22 22 22 20
Water level
11.33 10.68 10.99 10.39 10.79
Date
July 23, 1973 Aug. 23 Sept.24 Oct. 24 Nov. 20 Dec. 19
Water level
11.3412.0512.5913.5013.2012.90
Jan.Feb.Mar.Apr.MayJune
Date
21, 19742527222826
Waterlevel
12.7011.7911.7911.0311.8712.98
Date
July 24, 1974 Aug. 26 Sept. 23 Oct. 21 Nov. 29 Dec. 18
Water level
12.77 13.17 13. to 13.33 13.51 12.77
400805075304801. Local number Ch-152. Phoenix Iron and Steel Co. Phoenlxvllle. Drilled un used artesian well In sandstone of Stockton Formation, Trlasslc age, dlam 12 to 8 In (30 to 20 cm), depth 750 ft (229 m), cased to 35 ft (11 m). Lsd 85 ft (26 m) above msl. MP top of platform, 0.30 ft (0.09 m) above Isd. Highest water level flowing, many times during period of record; lowest 13.40 ft (4.08 m) below Isd, Sept. 5, 1966. Records available: 1972-73. Measurement dis continued. Water levels affected by pumping.
Jan. 25, 1973Feb. 23Mar. 23
(J) (J) (J)
Apr. 23, 1973 May 23 June 25
(J) U)(J)
July 24, 1973 Aug. 24 Sept.24
(J) (J) (3)
Oct. 24, 1973 (J)Nov. 20 (J)Dec. 19 (J)
J Flowing.
Clarion County
412020079133901. Local number Cr-3. Commonwealth of Pennsylvania. Cook Forest State Park. Drilled unused water-table well In shale and sandstone of Pottsvllle Group, Pennsylvanlan age, dlam 6 In (15 cm), depth 130 ft (40 m), cased to 12 ft (4 m). Lsd 1,530 ft (466 m) above msl. MP top of casing, 0.80 ft (0.24 m) above Isd. Highest water level 37.50 ft (11.43 m) below Isd, May 6, 1966; lowest 92.20 ft (28.10 m) below Isd, Dec. 6, 1952. Records available: 1950-73. Measurement discontinued. Recording gage removed June 15, 1973.
Day Jan
40.840.8
Lowest watei
Feb Mar Aj
42.1 .....
42 5
* level for 1
5r May
38.538.6
;he day, from recorder graph, 1973
Jun Jul Aug Sep Oct Nov Dec
Clearfleld County
405810078313301. Local number Cf-4. Jared I. McNaul. Curwensvllle. Dug unused water-table well In shale and sandstone of Allegheny Group, Pennsylvanlan age, dlam 5 ft (2 m), depth 30 ft (9 m), casing Information not available. Lsd 1,160 ft (354 m) above msl. MP top of 1-ln (2.5-cm) pipe in cover, at Isd. Highest water level 16.78 ft (5.11 m) below Isd, June 25, 1972; lowest 21.44 ft (6.53 m) below Isd, Nov. 16, 23, 1964. Records available: 1946-74.
Date Water
Jan.
Feb.
Mar.
Apr.
May
June
July
7, 19731421284
1118254
11182518
1522296
1320273
1017241
19.19.19.19.18.18.19-19.19.19.17.18.19-18.18.19.18.19.18.19-19.19.19.19.19.19.
2060887046855283710375764632643453014401010246616274
July
Aug.
Sept.
Oct.
Nov.
Dec.
Date
8, 19731522295
121925
. 29
1623307
1421284
11182529
162330
Water level
19.20.19.19.19.20.20.20.20.20.20.20.20.20.20.20.20.19.19.20.20.18.19.19.18.18.
8803641383051401182530312901102633578912037360187748
Jan.
Feb.
Mar.
Apr.
May
June
Date
6, 19741320273
1017243
101724317
1421285
12192629
162330
Water level
19.1019-5917.8018.1318.6719.4619.7119.2019.2918.3318.5918.5618.3318.0618.7619-2719.5419-5119.6219.0619.5419.7319.8519.9919.8819.48
July
Aug.
Sept.
Oct.
Nov.
Dec.
Date
7, 19711421284
111825
, 18
1522286
1320273
10172418
152229
Water level
19.4019.8020.0220.1019. 1319.7520.0420.1318.7718.5019.3719.5819.5519.8820.0620.0820.1820.2220.0919.9019.7619.7919.3319.0219.0318.29

PENNSYLVANIA, COLUMBIA COUNTY
Clinton County
Day
5 10 1520 25Eom
JE
48. 48. 48.
49.
m Feb
93,98 .....
Ma
48.
r
06
water lei
Apr
48.02 47.89 48.04
e48. 48.22 48.29
tel for the day, from recorder gi
ME
48. 48. 48. 47.47. 47.
.27 ,23.07 82 72 .13
Jun
17.39 47.41 47.66 48.01
Jul
48.83 48.13 49.44 49.50 49.34 49.13
Aug
5l!54
-aph, 1973
Sep
48.47 49.46 49.37
Oct
49, 48. 48, 48, 48, 48,
.19
.94
.77
.88
.93
.84
Nov
48.64 48.58 48.45 48.63 48.63 48.39
Dec
48.16 47.92 47.77 47.92 47.83 47.36
1974
510 15 20 25Eom
47. 47. 47. 47. 47.
e47.
27 ..... 32 ..... ,53 ..... ,70 .....54 47.87 83 47-92
47. 47. 47. 47. 47- 47.
98 80 46 27 41 45
47.22 47.03 46.64 46.69 47.46 47.77
47. 47. 47. 47. 49.
.1816 12 ,11 51
48.11 48.38 48.67 48.54
47.93 48.21 50.20 50.44
49.39 49.66 49.96
50.24 49.90 49.74 49.74 49.61 49.52
49,.64
50^53 50.32 50.20 50.00
49.93
e Estimated.
Columbia County
110010076275001. Local number Co-1. Fred E. Walters. Fernville. Dug unused water-table we in sand of Quaternary age, diam 36 in (91 cm), depth 19 ft (6 m), cased with stone. Lsd 190 ft (119 m) above msl. HP top of concrete cover, 2.10 ft (0.73 m) above Isd. Highest water level 1.75 ft (1.15 m) below Isd, Sept. 2, 1933; lowest 11.38 ft (1.38 m) below Isd, Nov. 28, 1931. Records available: 1931-71.
Jan.
Feb.
Mar.
Apr.
May
June
July
Date
1, 19738
1522295
1219265
12192629
1623307
1421284
1118252
Water level
10.2010.3010.3010.8010.6010.3010.4010.8010.8011.2011.1010.4010.7010.5010.3010.3010.5010.0010.1010.1010.0012.9010.5010.6010.4011.0010.30
July
Aug.
Sept
Oct.
Nov.
Dec.
Date
9, 19731623306
132027
. 310172118
1522295
1219263
10172431
level
10.11.11.11.11.11.11.11.11.10.10.10.11.11.11.11.11.11.11.11.11.11.9.
10.9.
10.
6000101040001040103090400000402000202020703080009000
Jan.
Feb.
Mar.
Apr.
May
June
July
Date
7, 19741421284
1118254
11182518
1522296
1320273
1017241
Water level
10109999
1110101010109999
101010,10111010.101010
.50
.50
.70
.30
.60
.80
.00
.80
.70
.50
.60
.40
.60
.60
.70
.70
.70
.70
.50
.40
.00
.60
.60,70.40.20
July
Aug.
Sept
Oct.
Nov.
Dec.
Date
8, 19711522295
121926
. 29
1623307
112128D
11182529
162330
Water level
101010.101011.1111.9.99
1010.1010101010.101010.1010101010,
.30
.30
.60
.70
.60
.10
.00
.00
.60
.70
.70
.20
.60
.70
.60
.60
.70
.80
.80
.70
.60
.20
.00
.20
.10
.10
Day
15 20 25
Jan F
86.02 85 ..... 85 ..... 84 ..... 84
eb
.58
.50
.75
.58
Lowest water level for 1
Mar Apr May
..... ..... 85.72
..... ..... 85.74 85.10 86.44 ..... 85.41 86.45 .....
;he day, froi
Jun Ji
1971
..... 87
..... 87
..... 87
..... 8787.43 86
il
.81
.98
.71
.90
order graph, 197
Aug Sep
..... 88.30
..... 88.24
..... 88.17
..... 88.25
0
Oct
86.60
86.4286.19
88.18 88.34 88.40 88.23
Nov D
..... 85
..... 85
86.11
..... 84
..... 84
..... 84
..... 84
ec
Rl.69
.19
.55
.82
.06

) GROUND-WATER LEVELS, 1973-71, NORTHEASTERN STATES
110033076261901 Continued.
Day
5 10 15 20
Eom
5 10 15 20 25 Eom
Jan
81.60 81.13 81.36
81.21 81.57 85.19 85.21 85.31 85.11
Peb
81.61 85.01 81.31 81.97
81.53
81.3681.51 81.60 85.09 85.65 85.79
Mar
83-50 81.32 83-58 83.50 82.7883.86
85.79 85.53 85.23 81.69 81.93 85.07
Apr
81.22 81.12 81.30 83.16
83.61
81.29 83.13 83.95 81.11 81.32 81.33
May
82.26 82.01 82.80 83.29
81.22
81.11 81.55
83^75 81.25 81.18
81.53
1972
Jun
83.52 83.71 81.32 81.03
1973
81.37 81.23 81.52 85.08 85.50 83.70
1971
Jul
85.95
83.63 81.08 81.60 81.98 85.11 85.18
Aug
86.22 85.97 86.33 86.52 86.9787.31
85.60 85.85 85.80 86.00 86.52 86.90
Sep
B7i98 87.76 88.13
88.13
87.03 87.18 86.10 85.88 86.06 86.06
81.18
Dot
88.52 88.53 88.52 88.78
88.52
86.21 86.23 86.30 86.68 86.88 86.12
Nov
88.11 87.53 86.76 86.35
86.32
86.50 87.01 86.71 86.91 86.51 86.35
Dec
85.85 83.60 81.95 81.81
81.61
85.60 83-90 85.18
Crawford County
113512080215001. Local number Cw-113. U.S. Geol. Survey. State Game Land No. 211. Near Hartstown. Drilled observation artesian well In sandstone of Cussewago Sandstone, Misslsslppian age, diam 6 In (15 cm), depth 100 ft (30 m), cased to 19 ft (6 m). Lsd 1,110 ft (338 m) above msl. MP top of casing, 2.70 ft (0.82 m) above Isd. Highest water level 20.20 ft (6.16 m) below Isd, May 23, 1969; lowest 18.91 ft (11.92 m) below Isd, July 19, 1967. Records available: 1967-71.
Lowest water level for the day, from recorder graph, 1973
Day
5 10 15 20 25 Eom
Jan Peb
28.80 26.01 27.15 26.07 27.30 26.06 27.01 28.10 27.52 26.80 26.07 26.73
Mar
26.16 26.18 26.06 26.20 26.16 26.95
Apr
26.23 25-90 26.63 26.80 28.93 27.50
May
26.71 26.55 27.06 26.12 27.12 26.57
Jun
27.5826.57 27.12 28.23 27.81 27.83
Jul
27.68 27.85 27-93 28.60 28.28 28.31
Aug
39.00 36.00 31.22 33.50 29.31 28.68
Sep
28.11 28.80 28.81 29.00 29-03 28.91
Got
28.10 27.11 27.10
Nov
37^60 35.00 31.11 29.22 27.69
Dec
28.67 27.20 27.02 26.83 26.73 27.68
1971
5 10 15 20 25 Eom
26.53 26.51 27.88 26.72 28.19 27.05 26.99 26.61 26.62 ..... 26.08 .....
z'e'.'ee 26.08
27.30 26.39 26.10 27.32 27.00 27.87
28.71 27-72 26.21 26.99 27.67 28.15
29.20 29.77 29.18
31.08 30.59
Cumberland C
100209077183301. Local Drilled unused water-table (11 m), casing information (0.16 m) above Isd. Highes (10.21 m) below Isd, Peb. 3
Lowest
Day
5 10 15 20 25
Jan Peb Mar
29.55 28.52 28.89 29.10 29.35 30.70
ounty
33-50 33.15 31.35 31.30 31.52 31.02
number Cu-2. Commonwealth of Pennsylvan well in metarhyolite of Precambrian age, not available. Lsd 955 ft (291 m) above t water level 9-51 ft (2.90 m) below Isd , 1955. Records available: 1951-71.
water level for the day, from recorder
Apr May Jun Jul Aug
30.90 30.20 29.88 29.67
29.22
29.21 27.85 26.95 26.50 30.51 28.18
la. Mlchaux State Forest, diam 6 in (15 cm), depth msl. MP top of casing, 1
, Apr. 18, 1961; lowest 33
graph, 1973
Sep
21.73 21.83
Oct
21.66 21.63 21.73 25.05 25.70 25.08
Nov
21.76 21.12 21.27 21.12 21.96 25.08
26.93 26.11 25.88 25.62 26.07 26.31
37 ft .50 ft .50 ft
Dec
25.16 21.70 23.86 23.38 20.88 17.85
1971
5 10 15 20 25
16.99 11.53 ..... 11.92 ..... 15.53 ..... 15.91 11.53 16.20 11.13 16.28
16.52
16.25
11.20 12.80 12.02 12.51 13.30 11.03
11.85 15.71 15.86 16.13 16.15
17-65 18.05 18.62 19.15 19-52 19-70
19-98 20.10 21.02 21.72 22.38 23.10
25.28 25.82
26.13 26.22 26.2 26.25
26.62
26.85 27.10 27.30 27.19 27.65 27.83
27.97 28.11 28.27 28.31 28.13 28.17
28.29 27.60 27.22 25-13 21.75 21.28

PENNSYLVANIA, ERIE COUNTY
Dauphin County
1)021180761)62101. Local number Da-350. William R. Miller. R.D. #1, Linglestown. Drilled un used artesian well in Martinsburg Shale, Ordovician age, diam 6 in (15 cm), depth 225 ft (69 m), cased to 19 ft (6 m). Lsd 460 ft (140 m) above msl. MP top of casing, 1.31) ft (0.1)1 m) above Isd (since January 1973). Highest water level 2.46 ft (0.75 m) below Isd, June 23, 1972; lowest 6.95 ft (2.12 m) below Isd, Sept. 11, 12, 1966. Records available: 1965-7 1).
Day Jan
5 4.0110 4.5015 4.8420 4.9725 4.35Eom 4.21
L
Feb
3.994.114.224 . 444.644.70
owest water
Mar
4.544.204.364.184.514.36
Ap
3.3.1).1).1) .3.
level for
r May
63 3.9750 4.0413 4.2136 4.1631 3.5083 3.50
the day
Jun
3.634.1)74.604.60
4.33
, from
Ju
14.5-5.5.5.5.
recorder g
1 Aug
81 5.4915 5.5531 5.4543 5.5331 5.6757 5.82
raph, 1973
Sep
5.845.904.584.574.865.00
Oct
4.815.005.125.225.284.20
Nov
4.504.904.925.115.054.83
Dec
4.853.954.104.304.003.93
1974
5 3.9510 4.1915 4.2620 4.1225 4.00Eom 4.12
4.534.684.804.73
14.39
402132076472201. L(previously rdepth 184 ft2.00 ft (0.61
eported u(56 m), cm) above
lowest 6.73 ft (2.05 m
Date
Jan. 25, 1973Feb. 21Mar. 23Apr. 24May 23June 26
Water
+1.34.03
1.30.79
2.00.07
4.484.134.404.274.203.48
3.3.3.4.4.4.
ocal numbernused) aased toIsd. H
) below
rte21ighIsd
53 4.8970 4.8160 4.2015 4.7348 4.9269 5.10
Da-353.sian wellft (6 m) .est water, Sept. 12
Date "a
JulyAug.SeptOct.Nov.Dec.
2422
.252S2719
, 1973 +0_+__
+1
5.155.265.405-415.114.84
5.5.5.5.5.5.
Walter Comptonin MartiLsd 500level 2.
nsburgft (1
00 ft, 13, 1966. R
ter
.27
.30
.63
.91
.36
.69
Jan.Feb.Mar.Apr.MayJune
21 4.3343 5.0059 5.3071 5.4067 5.4215 5.42
. LinglestShale, Ord
52 m) above(0.61 m) ab
4.394.404.184.654.914.93
5.095.205.245.005.105.25
own. Drilled oovicianmsl.ove Isd
ecords available:
Date
22, 19742628232927
Water
+ 2.001.701.39
+1.25-.15.46
age, diMP top o, many t1965-74
JulyAug.SeptOct.Nov.Dec.
5.205.314.704.704.654.79
bservationam 6 in (15f casing,imes, 1970-
25, 197427
.24232219
4.414.214.354.194.444.66
cm) ,
74;
Water
-1.42+ .37+ .61-.01+1.68+ 2.00
Delaware County
395040075341801. Local number De-3. Mrs. Hope W. Ebert. Birmingham Township. Dug unused water-table well in gneiss of Wissahickon Formation, Precambrian to early Paleozoic age (previously
42 in (107 cm), depth 22 ft (7 m), cased with stone, e, 1.80 ft (0.55 m) above Isd. Highest water est dry, many times, 19614-66. Records avail-
Lsdleveable
Jan.
Feb.
Mar.
Apr.
May
June
July
260 ft (791 7-90 ft: 1950-74
1, 19738
1522295
1219265
12192629
1623307
1421284
1118252
m) above(2.1)1 m)
11.9312.6013.0713.5013.059.69
11.1412.2212.9413.4513.7914.0014.1513.5311.7410.9912.5013.0213.1513.3513.5613.7613.3413.5614.0114.3814.35
; msl. MPbelow Isd,
July 9162330
Aug. 6132027
Sept. 3101724
Oct. 18
152230
Nov. 5121926
Dec. 310172431
n age) , diam '
Aug. 22, 195!
, 1973 13.3113.1713.7014.1914.5714.8515.0915.3215.5715.8016.0216.2016.3916.5616.7116.8816.7716.8016.7516.7016.7016.7216.3015.4010.9611.04
Jan.
Feb.
Mar.
Apr.
May
June
July
7, 19741421284
111825
1411182518
1522296
1320273
1017241
11,12.12.1213.131414141414,1413.12.11,12,13131414,14,14,14,15,15,15.
.83
.29
.53
.93
.32
.66
.04
.28
.47
.59
.44
.00
.24
.44
.78
.32
.10
.72
.01
.40
.47
.65
.81
.02
.15
.26
July
Aug.
Sept
Oct.
Nov.
Dec.
8, 19741522295
121926
. 29
1623307
142128
1411182529
162329
15.15151515161616161616161616161616161616161615151313
.30
.33
.47
.65
.85
.05
.25
.44
.60
.63
.65
.64
.62
.64
.69
.49
.32
.17
.11
.11
.14
.19
.75
.00
.18
.23
4156070800414601. Local number Er-82. U.S. Geol. Survey. McLane. Drilled observation artesian well in Riceville Shale, Devonian age, diam 6 in (15 cm), depth 82 ft (25 m), cased to 56 ft (17 m). Lsd 1,419 ft (433 m) above msl. MP top of plywood cover, 3.50 ft (1.07 m) above Isd. Highest water level 10.08 ft (3.07 m) below Isd, Mar. 20, 1973; lowest 18.41 ft (5.61 m) below Isd, Sept. 20, 1966. Records available: 1966-74.

GROUND-WATER LEVELS, 1973-71, NORTHEASTERN STATES
1156 070 80 Oil 1 601 Continued.
Day
5 10 15 20 25 Eom
Jan
10.10 10.93 11.38 11.08 10.89 10.82
Feb
10.50 10.74 11.00 11.31 11.61 11.74
Lowest v
Mar
11.16 10.12 10.30 10.08 10.31 10.26
yater le:
Apr
10.62 10.36 10.88 11.08 11-39 11.00
rel for the day,
May
10.97 11.13 11.07 11.27 11.31 11.13
Jun
10.77 11.26 11.59 11.81 12.08 12.31
from recorder graph, 1973
Jul
12.27 12.16 12.73 12.88 13.03 13.25
Aug
13.43 13.59 13.73 13.71 13.47 13.59
Sep
13.71 13.92 11.08 14.25 11. 11 14.53
Oot
11.59 11.53 11.53 15.79 15.51 15.23
Nov
16.45 16.09 15.99 15.81 15.16 11.71
Dec
14.32 11.23 11.11 11.01 13.61 13.16
1971
5 10 15 20 25 Eom
13.34 13.17 13.60 13.51 12.77 12.78
13.02 13.16 13-38 13.48 12.92 12.89
12.38 12.21 12.43 12.51 12.61 12.60
11.93 12.01 12.16 12.14 12.59 12.75
12.92 12.84 12.14 12.58 12.92 13.24
13.57 13.84 14.04 14.19 14.34 14.41
11.07 11.23 11.16 14.67 14.81) 15.02
15.10 15.21 15.36 15.45 15.63 15.76
15.81 15.95 16.05 15.90 15.58 15.35
11.66 11.53 11.50 11.36 11.29 11.30
11.18 13.61 13.25 13.01 12.10 12.13
12.35 12.20 12.17 12.19 12.19 12.22
Fayette County
39481)3079351401. Local number Fa-17. U.S. Geol. Survey. Fort Necessity. Drilled observation artesian well in shale and sandstone of Conemaugh Formation, Pennsylvanian age, diam 6 in (15 cm), depth 100 ft (30 m), cased to 19 ft (6 m). Lsd 1,910 ft (582 m) above msl. MP top of plywood cover, 2.05 ft (0.62 m) above Isd. Highest water level 19.71 ft (6.01 m) below Isd, Feb. 23, 1971; lowest 40.00 ft (12.19 m) below Isd, Nov. 8, 1967. Records available: 1967-74.
Lowest water level for the day, from recorder graph, 1973
Day Jan Feb
10 ..... 22.95 15 ..... 23.10 20 22.78 22.89 25 ..... 23.32 Eom ..... 23.10
Mar
23.10 23.18 23.20 22.90 23.11
Apr
23.18 23.26
May
23.20
Jun
23.11 23.22 23.19 23.31 23.26 23.40
Jul
23.28 23.20 23.30 23.27 23.41 23.49
Aug
23.60 23.42 23-51 23.47 23.1)2 23.52
Sep
23.40 23.45 23.52 23-77 24.12 23.95
Oct
21.30 23.82 23.80 23.85 23.95 23.93
Nov
23 23 23 23 23 23
.90
.99
.88
.85 98 .65
Dec
23.32 23.11 22.72 22.22 21.60 20.48
1974
5 20.42 23.11 10 21.80 23-30 15 21.13 23.30 20 22.10 23.49 25 22.70 22.77 Eom 22.63 22.87
23-07 23.18 22.97 23.27 23.22 23.20
22. SO 23.18 23.00 23.33 23.32 23.02
23-30 23.18 22.90 22.65 22.71 23.01
22.97 23.06 23.15 21). 12 22.07 22.65
Franklin
395958077393301. Drilled unused arte 441 ft (1311 m), cas (0.76 m) above Isd. (19.20 m) below Isd
Day Jan Feb
5 20.30 15.55 10 22.62 16.75 15 28.00 21.50 20 33.49 25.90
Local number Pr-2. U.S sian well in St. Paul Gro ed to 60 ft (18 m). Lsd
Highest water level 10. , Dec. 11, 1973. Records
Lowest water level for
Mar
28.81
Apr May
22.86
23^37 23.1)0
County
23.38 23.80 23.20 23.33 23.40 23.11
23.37 23.37 23.23 23.32
. Army Letterkenny Ordnance Depot . up, Ordovician age, diam 8 to 6 in 694 ft (212 m) above msl. MP top 26 ft (3.13 m) below Isd, May 12, available: 1950-74.
the day, from recorder graph, 1973
Jun Jul Aug Sep
Chambers (20 to 15
of casing, 1958; lowe
Oct
burg, cm) , 2.1)9
st 62.
Nov
.85
depth ft ,98 ft
Dec
52.00 62.75 52.10 50.00
1971
5 18.31 29.30 10 14.92 35.58 15 14.04 10.10 20 15.62 12.55 25 18.43 33.70 Eom 23.70 37.85
13.25 38.50 10.15 13.90
30.10
19-70 18.45 17.27 22.15 27.15 34.10
37'60 36.80 43.62
39.90 45.38 45-91 15.31
46.20
46.30 47-56 48.38 48.63
48.73
46.15 16.15 16.1547.58
48.03
18.72 18.80 18.81 17.25 48.70 48.85
18 18 16 17 18 48
.87
.92
.28 76 .18 .77
36.11 30.17 37-99 27-52 32.57 39.21
Fulton County
400302078090401. Local number Fu-93. Commonwealth of Pennsylvania. Buchanan State Forest. Drilled unused artesian well in sandstone of Pocono Qroup, Mississippian and Devonian age, diam 6 in (15 cm), depth 194 ft (59 m), cased to 45 ft (11 m). Lsd 1,190 ft (363 m) above msl. MP top of casing, 2.00 ft (0.6l m) above Isd. Highest water level 1.76 ft (0.54 m) above Isd, Apr. 2, 1970; lowest 4.46 ft (1.36 ra) below Isd, Sept. 12, 1966. Records available: 1965-74-

PENNSYLVANIA, INDIANA COUNTY
400302078090401 Continued.
Day
25Bom
5101520?5
Jan Feb
+0.84 ....
1.04 ....
.... +0.24
.... +.02
.... -.35
.... -.57
.... +.02
.... -.06
level
Mar
0.00+ .28
.48
.17
.28
.58
for
Ap
+ 1.
+ 1.1.1.
the
r
414
341627f>2W36
day, above
May
.36
+0.05 +-.17+ .61
.25
.21
and belov
Jun J\.
.53 1.
1974
0.01 +0..36.82.48 1..47 1..05
j Isd
il
,5695
4567
3506
.74234197
, from
Aug
1.781.78
1.27
-1.321.491.741.541.721.80
recorder
Sep
.961.21
.65
-1.501.311.581.791.882.08
graph,
Oct
1.59-1.64
-2.202.232.292.162.202.28
1973
Nc
-2.2.1,1.1.2.
)V
27
,19,?a.86
K2,92,06
Dec
-0.79.25.09
Greene County
394655080014301- Local number Or-118. U.S. Geol. Survey. State Game Lands No. 223. Drilled observation artesian well in shale and sandstone of Waynesburg Formation, Permian and Pennsylvanian age, diara 6 in (15 cm), depth 104 ft (32 m) , cased to 22 ft (7 m) . Lsd 1,000 ft (305 m) above msl.MP t June
Day
5 10 15 20 25 Eom
op of casing, 3.00 ft (0 23, 1974; lowest 37.78
Lowest
Jan Feb Mar
.91 m) above Isd. Highe ft (11.52 m) below Isd,
water level for the day,
Apr May Jun
st water Sept. 15,
from rec
J
34 34
ul
.98
.98
.00
.72
level 1973-
order
Aug
34.6635.98
31.03 ft (9-46 m) b Records available
graph, 1973
Sep
36 37 37
35
.62
.25 78
.27
Oct
33. 33.33. 34. 34. 33.
99 77 98 36 57 49
elo
No
33. 33. 33- 33. 33.
w Isd, 1973-74.
v Dec
49 ..... 78 ..... 85 .....38 ..... 56 .....
1974
5 10 1520 25 Eom
..... 33.03 33-10
..... 32.50 .....
..... 32.87 .....
..... 32.76 .....
..... 32.70 .....
33.00 ..... ..... ..... ..... 33.70 ..... ..... 33.17 ..... ..... 32.30
33 33 33 33 33
.45
.67
.78
.80
.80
.83
33.87 33.99 34.00 34.09 34.89
33 33 33 32
.40
.68
.33 95
Huntingdon County
4018430780751)01. Local number Hu-301. U.S. Geol. Survey. Trough Creek State Park. Drilled observation artesian well in Burgoon Sandstone, Mississippian age, diam 6 in (15 cm), depth 105 ft (32 m), cased to 18 ft (5 m). Lsd 970 ft (296 m) above msl. MP top of casing, 3.30 ft (1.01 m) above Isd. Highest water level 48.82 ft (14.88 m) below Isd, June 23, 1972; lowest 55.56 ft (16.93 m) below Isd, Nov. 9, 1974. Records available: 1969-74.
Lowest water level for the day, from recorder graph, 1973
Day
510 15 20 25
Jan
51.82 51.99 52.23
52^13 51.80
Feb
51.18 51.49 51.79 52.17 52.24 52.69
Mar
52.44 52.15 52.14 51.93
5^32
Apr
51.63 50.90 51.41 51.90 51.94 51.32
May
51.60 51.82 52.00 52.00 51.85 51.29
Jun
51.7251.84 52.12 52.16
5s!?2
Jul
52.64 52.9053.20 53.22 53.20 53.35
Aug
53.39 53.49 53.58 53.35 53.24 53.47
Sep
53.53 53.70 53.60 53.33 53.26 53.00
Oct
52.57 52.80 53.00 53.29 53.44 52.09
Nov
52.20 52.70 52.72 52.05
52^52
Dec
52.30 51.87 51-90 52.30 51.85 51.28
1974
5 10 15 20 25 Eom
51.75 52.2651.90 51.72 51.49 51.82
52.42 52.6852.91
53.02 53.00
53.07 52.70 52.35 52.71 52.65 52.17
51.60 51.98 51-63 52.05 52.35 52.52
52.90 53.09 52.62 52.90 52.90 53.04
53.00 53.00 53-26 53.25 53.05 52.75
52.70 52.95 53.30 53.68 53.80 53.80
53.88 53.93 54.04 54.15 54.22 54.17
54.05 54.02 54.11 54.22 54.16 54.30
54.48 54.50 55.11 55.35 55.35 55.53
55-41 55.54 55.37 55.25 55.31 55.45
54.92 54.3254.55 53.77 54.24 54.44
Indiana County

GROUND-WATER LEVELS, 1973-71, NORTHEASTERN STATES
103702079093001 Continued.
Day
5 10 15 20 25 Horn
Jan
75.51 75.56 75.91 76.03 75.85 75.76
Peb
75.39 75.33 75.08 75.30
Mar
75'32 75.09 71.9 71.93 75.09
Apr
75.01 71.70 75.01 75.02 71.90 71.83
May
71.92 71.88 71.85 71.93 75.13 75-29
Jun
75.30 75.09 75.30
75*35 75.00
Jul
75.10 75-21 75.52 75.62 75.60 75.69
;order gi
Aug
75.96 75.89 76.10 76.10 76.31 76.60
aph, 1973
Sep
76.70 76.81 76.91 77.00 77.10 76.83
Oct
76.10 76.36 76.31 76.70 76.70 76.10
Nov
76.11 76.38 75-92 75.95 75-19 75-55
Dec
75.00 75.18 75.18 75.20 75.12 71.89
1971
5 10 15 20 25 Eom
71.91 75.0? 71.60 71.60 71.66 71.71
75.02 71.75 75.13 75.30
75.10 71.95 71.68 71.70 71.87 71.72
71.65 75.12 75-13 75.70 75-91 75.60
76.08 76.55 76.50 76.70 76.60 76.68
76.15 76.50 76.62 76.10 75.96 75.36
75.11 75.38 75.70 76.09 76.35 76.62
76.79 76.88 76.76 77.00 77.23 77 .22
77.00 76.71 76.26 76.10 76.10 76.71
77.13 77.31 77.50 77.69 77.50 77.67
77-71 77.61 77.80
n'.'os
76.87 76.11 76.11 76.20 76.11 76.06
Jefferson County
110650078575801. Local number Je-23. U.S. Geol. Survey. State Game Land No. 211. Drilled observation artesian well in sandstone and shale of Allegheny Group, Pennsylvania!! age, diam 6 in (15 cm), depth 101 ft (31 m), cased to 37 ft (11 m). Lsd 1,660 ft (506 m) above msl. MP top of plywood cover, 2.05 ft above Isd. Highest water level 11.17 ft (1.32 m) below Isd, Apr. 13, 1970; lowest 32.12 ft (9.79 m) below Isd, Aug. 25, 1971. Records available: 1968-71.
Lowest water level for the day, from recorder graph, 1973
Day
5 10 15 20 25 Eom
20 25
Jan
20.89 21.12 21.16 21.70 22.13 22.33
29.35
Feb
22.21 22.10 21.81 22.32 22.87 22.96
30.16
Mar
22.77 22.51 22.26 22.03 21.98 22.27
29.31
Apr
22.23 21.92 22.26 22.78 22.75 22.89
May
22.87 22.81 22.76 22.76 22.18 22.76
29.76
Jun
22.82 22.75 23.08 23.11 23.30
1971
30.89
Jul
23.31 23.19 23.91 21.11 21.29 21.11
31.26
Aug
21.72 21.76 25,06 25.10 21.79 21.89
32.06
Sep
21.92 25.17 25.11 25-55 25.72 25.63
30.82
Oct
25.26 21.96 21.80 25.10 25.16 25.10
31.06
Nov
25.01 a28.71 a28.55 a29-00 28.88 28.81
30.81
30.51
Dec
28.83 27.16 27.27 27.16 29.11 29.32
30.32
a Well being pumped.
Juniata County
102111077371801. Local number Ju-351. U.S. Oeol. Survey. State Game Land No. 215. Drilled observation artesian well in shale of Mahantango Formation, Devonian age, diara 6 in (15 cm), depth 112 ft (31 m), cased to 18 ft (5 m). Lsd 635 ft (191 m) above msl. MP top of plywood cover, 3.55 ft (1.08 m) above Isd. Highest water level 11.67 ft (3.56 m) below Isd, Peb. 23, 1971; lowest 15.36 ft (1.68 m) below Isd, Sept. 21, 1969- Records available: 1968-71.
Lowest water level for the day, from recorder graph, 1973
Day
5 10 15 20 25 Eora
5 10 15 20 25 Eom
Jan
13.18 13.31 13.70 13.71 13.50 13.22
13.21 13.39 13.31 12.96 12.90 13.15
Peb
12.83 13.03 13.12 13.59 13-59 13.65
13.50 13.18 13.63 13-70 13.22 13.13
Mar
13.35 13-13 13.28 13.11 13.28 13.38
13.25 12.92 13.17 13.12 13.29 12.10
Apr
12.18 13.26 13.11 13.35 13.25 12.76
12.62 12.95 12.66 13.22 13-38
May
13.11 12.99 13.01 13.10 12.80 12.88
13^60
Jun
13.31 13-50 13.52 13.51 13.20 13.31
1971
13.56 13.90 11.12 13.38 13.20 13.09
Jul
13.16 11.01
11^77
13.35 13.66
ii.79 11.90
Aug
11.67 11.90 11.71 13.50 13.99
11.88 11.91 15.16 15.20 15.22 15.22
Sep
ii!io 13.38 13.8213.16
15.10 15-07 15.13 15-21 15-15 15.21
Oct
13.18 13.77 13.91 11.12 11.32
15.29 15.21 15.28 15.12 15.12 15.21
Nov
13.18 13.81 13-79 13-90
13.28
15.16 15-23 15.03 11.80 11.92 11.96
Dec
13.33 12.59 13.18 13.22 13.06 12.81
13.85 13.55 13.91 13.35 13.77 13.91
Laekawanna County
111310075375501. Local number Lk-1. Commonwealth of Pennsylvania. Laekawanna State Forest. Dug unused water-table well in shale and sandstone of Catskill Formation, Mississippian and Devo nian age, diam 36 in (91 cm), depth 10 ft (3 m), casing information not available. Lsd 1,190 ft (363 m) above msl. MP wooden cover, 0.10 ft (0.12 m) above Isd. Highest water level 1.10 ft (0.13 m) below Isd, June 29, 1973; lowest dry, October and November 1961. Records available: 1953-71.

PENNSYLVANIA, LAWRENCE COUNTY
111310075375501 Continued.
Date """ Date "= Date
Jan. 5, 1973 3.55 July 11, 1973 3-50 Feb. 15, 1971 3.80 July 26, 1971 1.2919 1.09 27 3.63 Mar. 1 3.38 Aug. 6 3.7726 3.17 Aug. 10 3.87 8 3.to 16 t.lo
Feb. 9 3.65 17 3.73 15 3-53 23 1.1220 3.93 31 1.18 22 2.71 30 3.18
Mar. 9 5.10 Sept. 7 5.31 Apr. 1 3.57 Sept.13 3-5215 3.30 21 3-95 5 1.75 20 3.5523 3-57 28 3.85 17 3.16 27 1.5830 3.57 Oct. 5 3-82 30 3.66 Oct. 1 3.17
Apr. 20 3.78 12 1.00 May 3 3.38 11 3.6230 3.15 19 1.02 10 3.12 18 3.117
May 1 3.50 Nov. 2 3-55 16 3.37 25 3.6218 2.69 16 3.53 21 3.61 Nov. 1 3.7025 3.20 23 3.81 June 3 3-61 8 3.73
June 1 3.50 30 3-31 7 3.63 15 3-188 3-30 Jan. 2, 197t 3-65 20 3-70 22 3.12
15 3-82 11 3.68 30 3.63 Dec. 6 3-5622 3.57 18 3.65 July 12 1.10 11 3.3929 l.tO 25 3.33 18 1.13 18 3-35
July 6 1.55 Feb. 1 3.65
Lancaster County
100505076235102. Local number Ln-511. Benjamin Landis. Near Landisville. Drilled unused artesian well in shale and limestone of Kinzers Formation, Cambrian age, diam 6 in (15 cm), depth 260 ft (79 m), casing information not available. Lsd 380 ft (116 n) above msl. MP top of casing, 1.00 ft (0.30 m) above Isd. Highest water level 21.75 ft (6.63 m) below Isd, Apr. 1, 1970; lowest 31.68 ft (10.57 m) below Isd, Dec. 1, 1969. Records available: 1961-71.
Lowest water level for the day, from recorder graph, 1973
Day
5 10 15 20 25 Eom
Jan
25.91* 27.01 28.73 30.20 31.02 27-11
Feb
26.18 26.88 27.83 29.03 30.21 30.91
Mar
31.71 32.00 32.30 32.50 32.72 32.39
Apr
25.20 21.80 25.06 25-93 27-13 27.11
May
28.10 29.22 30.11 31.28 31.87 30.23
Jun
30.76 31. tl 32.08 32. tl 32.65 31.62
Jul
31.09 32.22 31.07 31.96 32.50 32.78
Aug
32.90 32.91 32.98 33.01 33.12 33.13
Sep
33.12 33-15 32.70 32.99 33-10 33.13
Oct
33.17 33.20 33.20 33.23 33.21 32.81
Nov
33-01 33.18 33.21 33.20 33.21 33-22
Dec
33.20 33.13 33.02 33.18 28.88 25.92
1971
5 10 15 20 25 Eom
26.56 27.90 28.20 29.28 26.38 27-33
28.93 30.35 31.50 32.30 32.62 32.78
32.88 32.86 32.99 32.98 32.97 32.10
30.58 28.02 26.00 25.59 27.07 28.71
30.29 31. to 31.90 32.15
32!82
32.92 32.96 32.91 33.00 32.90 32.89
33.00 33.01 33.07 33.15 33.11 33.lt
33.13 33.18 33-22 33.21 32.75 32.72
32.59 32.16 32.87 33-00 33.15 33.16
33.20 33.30 33.33 33.23 33-21 33.29
33.30 33.30 33-30 33.30 33-31 33.31
33.21 32.23 32.87 30.20 31-37 32.18
Lawrence County
Il0538o80280801. Local number La-1201. U.S. Geol. Survey. State Qame Land No. 150. Near Pulaski. Drilled observation artesian well in shale and sandstone of lower part of Connoquenessing Formation, Pennsylvanian age, diam 6 in (15 cm), depth 150 ft (46 m), cased to 30 ft (9m). Lsd 1,110 ft (317 m) above msl. MP top of plywood cover, 3.15 ft (1.05 m) above Isd. Highest water level 12.70 ft (3.87 m) below Isd, Mar. 12, 1971; lowest 19.95 ft (6.08 m) below Isd, Nov. 16, 1967. Records available: 1967-71.
Day
5 10 15 20 25 Eom
Jan
11.82 15.28 15-97 16.18 15.98 15.30
Feb
11.13 11.77 15.13 15-25 15.10 15-30
Lowest v
Mar
11.67 11.53 11.70 13.90 11.05 11.53
Apr
11.11 11.10 11.90 It. 78 15.11 11.60
May
15-10 15-36 15.03 15-23 15-07 15.20
;he day,
Jun
15-30 15.61 16.02 15.90 16.17 16.18
from recorder graph, 1973
Jul
16.70 16.92 17-11 17-23 17.25 17.20
Aug
17.32 17.11 17.18 17.26 15.85 16.20
Sep
16.50 16.70 17.02
Oct
ieiso16.7011.70
Nov
11.98 15.11 15-69 15.77 15-70 11.18
Dec
11.81 15-25 11.83 15.00 11.15 11.53
19715
10 15 20 25 Eom
15.03 15.18 15.20 13.80 13.38 11.10
15.10 15.10 15.60 15.22 11.50 11.50
13.61 13.17 13.39
16.22 16.51
16.31 16.53 11.50 15.73 16.21 16.16
16.80 17.09 17.30 17.50 17-58 16.70
16.01 16.52 16.92 17.28 17.51 17.78
17-93 17.89 17-97 18.05 18.25 16.71
16.10 16.38 16.57 16.72 15-98 16.11
16.18 16.71 16.90 16.76 16.90 17.20
16.25 15.95 15-82 15-28 15.61 15.15
15.10 11.71 11.83 15.18 15.03 15-29

GROUND-WATER LEVELS, 1973-74, NORTHEASTERN STATES
Lebanon County
Jan Feb Mar Apr May Jum
Date
. 25, 1973
. 23
. 22
. 24 23
z 26
Water level
7.50 7.43 8.80 7.18 7.23 7.55
Date Water level Dati
July 24, 1973 8.31 Jan. 22, Aug. 24 9.90 Feb. 26 Sept. 25 8.80 Mar. 28 Oct. 25 10.63 Apr. 22 Nov. 27 10.88 May 29 Dec. 20 9.26 June 27
Water - level
1974 6.50 8.13 8.31 7.09 8.18 8.48
July Aug. Sept Oct. Nov. Dec.
Date
25, 1974 27 .24 23 21 19
Water level
9-70 9.56 8.59 9.60
10.47 7.97
Lehlgh County
403429075392401. Local number Le-644. Charles J. Haaf. Haafsvllle. Drilled unused artesian well in Beekmantown Formation, Ordoviclan age, dlam 10 In (25 cm), depth 184 ft (56 m) , cased to 63 ft (19 m). Lsd 470 ft (143 m) above msl. MP top of plywood cover, 1.45 ft (0.44 m) above Isd. Highest water level 36.65 ft (11.17 m) below Isd, June 27, 1972; lowest 93.42 ft (28.47 m) below Isd, Feb. 6, 1971. Records available: 1971-74.
Lowest water level for the day, from recorder graph, 1971
Day
5 10 15 20 25
Jan
9o!l5 90.78 91.76 92.56
Feb
93-32 92.48 85.30 82.25 75-05 72.84
Mar
71.51 68.78 67.47
63.97
Apr
66: 5 3
May Jun
67.22 ..... 67.92 ..... 67.06 .....
66.50 ..... 63.60 63.82
Jul
64.43 65.05 65.76 66.20 66.70 67.05
Aug
63.50 61.92 62.02 62.31 62.85 60.28
Sep
60.01 60.30 59.21 58.08 57.88 58.03
Oct
58.46 58.77 58.43 58.80 58.90 59.42
Nov
56.77 55.42 55.60 55.65 56.15 54.20
Dec
50.54 49.93 49.72
51X82
1972
510 15 20 25 Eom
51^25 51.10 50.99 51.15 60.05
50.92
48.70 46.35 46.31 46.22 44.12
44! 61 45.42 46.08 46.45
..... 49.78 47.50 49.70 48.23 50.00 48.40 50.54 49.54 50.89 49.80 ..... 41.86
41.75 43.12 44.03 44.95
53.71
54.95 55-84 56.52 57-70
59-38
60.18 '
59.66 58.20 56.10
53.21
52.48 49.65 46.90 45.79 43.95 43.40
1973
5 10 15 20 25
41.8041.41 41.81 42.56 43.11 42.74
39-91 39-30 39-32 39-99 40.98 41.85
42.76 43.23 43.93 44.27 44.64 45.14
41.70 40.00 39.52 39.94 40.41 41.15
41.88 44.00 42.66 44.22 43.44 44.81 44.03 45.71 45.25 46.42 44.19 45.47
43.61 43.87 44.78 45.71 46.40 47.50
48.21 49-51 50.63 51.40 52.36 53.83
54.70 55.50 56.40 56.12 56.94 57-71
58.74 59-73 60.48 61.12 62.28 62.60
63.18 63.85 64.53 65.31 65.52 66.42
66.50 65.50 64.71 64.00
1974
5 10 15 20 25
41.80 54.28 53.96 54.04 52.83 50.62
50.16 50.18 50.88 51.33 51.63
403226075343001. vation artesian well cased to 58 ft (18 m Isd. Highest water Isd, July 23, 1969.
Day
5 10 15 20 25
Jan
2.662.90 3.13 3.26 3.30 3.08
Peb
2.07 2.42 2.57 2.90 3.12 3-23
52.42 52.28 51.94 51.28 50.18
Local n In Alle
). Lsd level 1. Records
Lowest
Mar
3.32 3.42 3.51 3.60 3.66 3.70
45.90 43.30 42.65 43.09 43.60
45.00 49.45 46.21 50.38 46.24 51.30 46.68 51.90 ..... 52.68
umber Le-860. Paul Knepp ntown Dolomite, Cambrian 358 ft (109 m) above msl. 28 ft (0.39 m) below Isd, available: 1967-74.
water level for the day,
Apr
2.38 2.40 2.63 2.90 3.65 3.16
May Jun
3-35 .... 3.57 .... 3.71 .... 3.80 .... .... 3.66 .... 2.05
53.80 54.60 55.68 57.02 57-85 59.08
59.29 60.12 60.99 61.16 61.70 62.60
62. '69
62.52 62.87 63.19 62.97 63.11 63.60
63.80 64.29 64.68 65.25 65.88
er. Lower Macungle Township. Drilled o age, diam 6 In (15 cm), depth 100 ft (30 MP top of casing, 2.00 ft (0.6l m) abo June 27, 1972; lowest 10.46 ft (3.19 m)
from recorder graph, 1973
Jul
2.202.78 3.11 3.34 3.50 3.78
Aug
3-75 3.91 4.05 4.11
Sep
4i68
Oct
4.80 4.92 5.02 5.18 5.29 5.17
Nov
5.40 5.51 5.59 5.76 5.78 5.76
66.81 65.08 63.96 61.48 60.98 61.39
bser-
below
Dec
5.82 4.90 4.95 5.10 3.42 3.26
1974
5 1015 20 25 Eom
3.45 3.65 3.7t 3.88 3.30 3.20
3-43 3.56 3.71 3.79 3.87 3.96
4.09 3.93 4.02 3.87 3-76 3-30
2.21 2.25 2.49 2.81 3.04 3.23
3-40 3.95 3.51 4.06 3.41 4.19 3.62 4.20 .... 4.20 3.83 4.26
4.26 4.45 4.60 4.74 4.85 4.97
4.85 5.01 5-19 5.12 5-27 5.33
1.55 4.65 4.68 4.89 5.01 4.85
5.09 5.21 5.30 5-25 5-33 5.t5
5-49 5.60 5.60 5.68 5.79 5.88
5-91 4.72 4.96 4.40 4.57 4.75

PENNSYLVANIA, LYCOMING COUNTY
411800076162501. Local number Lu-243. Commonwealth of Pennsylvania. Rioketts Glen State Park. Fair-mount Township. Drilled unused water-table well in sandstone of Catskill Formation, Mississip- plan and Devonian age, diam 6 In (15 cm), depth ISO ft (49 m), cased to 4o ft (12 m). Lsd 1,280 ft (390 m) above msl. MP top of casing, 1.30 ft (0.40 m) above Isd. Highest water level 36.08 ft (11.00 m) below Isd, Mar. 31, 1950; lowest 58.70 ft (17.89 m) below Isd, Oct. 5, 1957. Records available: 1948-50, 1955-74.
Lowest water lei
Day
5 10 15 20 25 Eom
Jan
50.48 51.04 51.85 52.33
5l'35
Feb
50.12 50.64 51.20 51.91 52.62 52.88
Mar
52.87 52.26 51.72 50.32 50.94 51.35
Apr
50.12 49.74 50.64 51.35 52.25 52.08
rel for the day,
May
52.12 52.12 51.44 51.60 51.27 50.93
Jun
51.14 52.10 52.58 53.31
52 '.14
from re<
Jul
51-73 51.84 51.96 52.44 52.92 53.44
:order graph, 1973
Aug
53.91 53.80 53.97 54.11 54.38 54.70
Sep
54.74 54.80 54.64 53.45 53.18 53.63
Oct
53.58 53.24 53.51 53.77 54.08 53.72
Nov
53.49 53.26 53.34 53.49
5Z'.51
Dec
51.98 50.53 50.42 51.00 49.69 49.31
1974
5 10 15 20 25
50.40 51.16 51.75 52.21 51.02 49.81
50.50 51-17 52.00 52.56 51-38 51.13
51.35 50.73 50.37 51.10 50.98 51.16
49.92 50.10 50.62 51.42 51.82 52.57
52.91 52.86 51.10 51.45 52.27 52.86
52.91 53.45 53.82 52.84 52.64 53.14
52.40 52.55 53.20 53-9353.84 54.13
54.29 54.74 51-78 55-39 55-39 54.06
52.16 52.29 52.32 51.82 51.30 51.68
52.39 52.75 53.10 53.28 53.28 53.50
53.72 53.86 53.49 52.95 52.67
52.73 51.40 50.81 50.54 51.07 51.62
411757075505801. Local number Lu-309. U.S. Geol. Survey. Pittston. Drilled observation artesian well In sand and gravel of glacial outwash, Pleistocene age (previously reported Quater nary age), diam 6 in (15 cm), depth 4o ft (12 m), cased to 35 ft (11 m). Lsd 540 ft (165 m) above msl. MP top of casing, 2.60 ft (0.79 m) above Isd. Highest water level 6.64 ft (2.02 m) below Isd, June 30, 1972; lowest 21.44 ft (6.53 m) below Isd, Oct. 26, 1969. Records available: 1967-74.
Lowest water level for the day, from recorder graph, 1973
Day
5 10 15 20 25
Jan
11.88 13.72 13.30 14.10
i5°40
Feb
13-70 14.00 15.42 16.52 17.07
Mar
13^56 15.03
Apr
13.80 11.47 12.62 14.21 15.30 15-73
May
15.96 16.36 15-92 15-77 14.33 14.92
Jun
15.63 16.15 16.83 17-30 17.54
Jul
15.20 16.79 17.69 18.19 18.60 18.82
Aug
18.89 19.19 19.51 19.56 19-57 19-90
Sep
20.14 20.20 20.30 20.00 19.87 19.76
Oct
20.08 20.26 20.42 20.60 20.71 20.82
Nov
20.26 20.20 20.40 20.43
19^92
Dec
19-38 18.34 16.41 16.66 13.80 11.00
1974
5 10 15 20 25 Eom
13.11 14.95 16.18 16.71 15.40 12.77
13.88 15.10 15.91 16.68 15-30 14.83
15.33 13.92 14.27 15.02 14.82 15.32
12.80 11.29 11.08 11.95 13.51 14.98
15.71 16.32 15-80 15-33 16.10 16.77
17.20 17.82 18.31 18.5 18.69 18.78
18.19 17.97 18.51 19.02 19.40 19.62
19-58 19.76 20.05 20.33 20.55 20.60
19.70 18.90 19.11 19.30 19-18 18.90
18.85 19.05 19.38 19.47 19.57 19.77
19-93 19.65 19.15 18.10 17.45 17-19
17.49 17.00 14.85 15.22 16.10 16.65
Lyeomlng County
412428076594201. Local number Ly-112. U.S. Geol. Survey. State Game Land No. 133, near Trout Run. Drilled observation artesian well in shale of Susquehanna Group, Mississippian and Devonian age, diam 6 in (15 cm), depth 200 ft (61 m), cased to 19 ft (6 m). Lsd 1,380 ft (421 m) above msl. MP top plywood cover, 3.07 ft (0.94 m) above Isd. Highest water level 76.10 ft (23.20 m) below Isd, June 23, 1972; lowest 93.45 ft (28.48 m) below Isd, Mar. 20, 1969. Records available: 1967-74.
Lowest water level for the day, from recorder graph, 1973
Day
5 10 15 20 25 Eom
10
Jan
86.40 87.83 88.56 89-30
89'l5
87.90
84.99
Peb
86.62 87.88 88.50 89-53 90.23 90.42
86.8587.87
Mar
89.72 87.48 87.15 85.00 86.97 87.49
Apr
85-90 85.90 87.04 88.25 88.90 88.20
88.47
May
87.90 88.50 86.67 86.70 86.05 85.8
88.8089.00
88.91
Jun
87.5 85.92 87-73 88.80
8JL49
1974
88.8889.18
89.85
Jul
85.39 87.10 88.46 89.23 88.69 87.98
88.45
89.65
Aug
88.45 89.07 89.28 85.72 87.14 88.62
91.76
Sep
89.11 87.20 87.50 85.52 86.95 87.80
88.0888.22
88.10
Oct
88.48 88.6 88.9 89.50 89.90 88.12
88.8089.25
90.88
Nov
86.70 88.10 88.51 89.45 89.50 86.40
91.11
87.9687.95
Dec
86.85 85.14 86.28 87-56 85.65 85.17
88.5386.09 86.71
86.8887.00

GROUND-WATER LEVELS, 1973-74, NORTHEASTERN STATES
Mercer County
412350080223701. Local number Mr-1364. Borough of Greenville. Drilled unused artesian well in sandstone of Cussewago Sandstone, MississJppian age, diara 6 in (15 cm), depth 235 ft (72 m), cased to 41 ft (13 m). Lsd 965 ft (294 m) above msl. MP top of plywood cover, 2.10 ft (0.64 m) above Isd. Highest water level 1.43 ft (0.44 m) below Isd, Dec. 25, 1968; lowest 7.72 ft (2.35 m) below Isd, Sept. 25, 1966. Records available: 1965-74.
Lowest water level for the day, from recorder graph, 1973
Day
510 15 20 25 Eom
Jan
3.01 4.16 3.5<* 3.77 3.35 3.67
Peb
3.19 3-53 3.15 3.15 3.50 3-15
Mar
3.10 3.73 2.49
2i93 4.13
Apr
2.70 2.94 3.20 3.50 3.53
May
3~. l'
3-27
Jun
3.16 3.11 3.60 4.08 3.76 3.62
Jul
3.65 3.99 3.85 4.05 3.89 4.10
Aug
4.60
'»'.36
11.50
Sep
H.57 4.48 4.42 4.30 4.48 4.42
Oct
4.28 4.43 4.29
Nov
4.20 4.10 4.11 3.78 3.67
Dec
3.56 3.72 3.64 3.61 3.73
197t
510 15 20 25Eom
z'.'e'i3.00
3.33 3.H8 3.50 3.23 3.33
2.88 2.72 2.91 3.00 3.20 2.58
2.592.90 2.99 3.20 3.50
3-17 3-71 3.15 3-71 3-59 3-63
4.04 3.62 4.03 3.77 3.77
3.57 3.72 3.75 3.92 4.03 4.02
4.08 4.15 4.23 4.11 4.06 3.86
3.62 3-7H 4.04
3^76
3.99 3.7H 3-61 3.96 3.95 3.90
3.68 3-93 3.65 3.32 3.15
3.33 3.04 3.31 3.40 3.28 3.51
Mlfflln County
404210077331001. Local number Mf-1. Charles C. Naginey. Village of Naginey. Dug unused water-table well in limestone of Ordovician age, diam 36 in (91 cm), depth 28 ft (9 m), cased with stone. Lsd 680 ft (207 m) above msl. MP top of wooden cover, at Isd. Highest water level 5.88 ft (1.79 m) below Isd, Dec. 4, 1950; lowest 24.94 ft (7.60 m) below Isd, Sept. 10, 1973. Records available: 1941-42, 1946-74.
Jan.
Peb.
Mar.
Apr .
May
June
July
Date
3, 19731522295
1419265
12192629
1623307
1419284
1118252
Water level
16.9916.9819-9117.9313.9518.0018.9819.9918.9817.9814.9716.9916.9914.9616.9217.9216.9116.9915.9616.9214.9815.9916.9717.9517.9117.96
July
Aug.
Sept,
Oct.
Nov.
Dec.
Date
9, 19731623306
132027
. 310172418
1522296
13192610192631
Water level
17.9919-9319.9421.9723-9322.9523.0023.9824.9224.9421.9119.9820.9721.9323.0024.0023.9620.9621.0020.9919.9614.9718.9714.0014.98
Jan.
Peb.
Mar.
Apr.
May
June
July
Date
7, 19741423255
1118266
12182528
1722291320283
1117241
Water level
18.9620.0015.9516.9217.9118.9220.9719.9519.9316.9218.9118.9914.9214.9917.9918.9419.0017.9217.9618.9918.9719.9818.91419.9119.95
July
Aug.
Sept
Oct.
Nov.
Dec.
Date
8, 19741522295
122026
. 49
24307
1421284
1219253
10162330
Water level
19-9919.9520.9721.9221.9122.9924.0024.9219.9823.9322.9623.9524.9124.9123.9424.9124.9324.9121.9921.9418.9217.9617.9517.9719.91
Monroe County
411230075240001. Local number Mo-190. U.S. Geol. Survey. Tobyhanna State Park. Drilled ob servation artesian well in sandstone of Catskill Formation, Mississippian and Devonian age, diam 6 in (15 cm), depth 98 ft (30 m), cased to 59 ft (18 m). Lsd 1,960 ft (597 m) above msl. MP top of plywood cover, 2.57 ft (0.78 m) above Isd. Highest water level 7.13 ft (2.17 m) below Isd, Apr. 10, 1970; lowest 15.15 ft (4.62 m) below Isd, Oct. 14, 1970. Records available: 1967-74.
Lowest water lev
Day
510152025Eom
Jan
8.779-70
10.2610.309-479.49
Peb
8.409.009-55
10.1110.5410.75
Mar
10.289.329.078.518.869.12
Apr
7.767.708.479.109.168.70
el for the day,
May
9.209.188.267.918.248.52
Jun
9.108.559.58
10.2310.30
from recorder graph, 1973
Jul Aug
..... 9.36
..... 10.00
..... 10.23
..... 9.9610.18 10.4310.86 11.10
Sep
11.5211.8011.7311.6011.3011.43
Oct
11.4511.6311.8312.0112.2311.20
Nov
10.6110.7710.8811.19
10.75
Dec
10.688.738.308.968.138.11
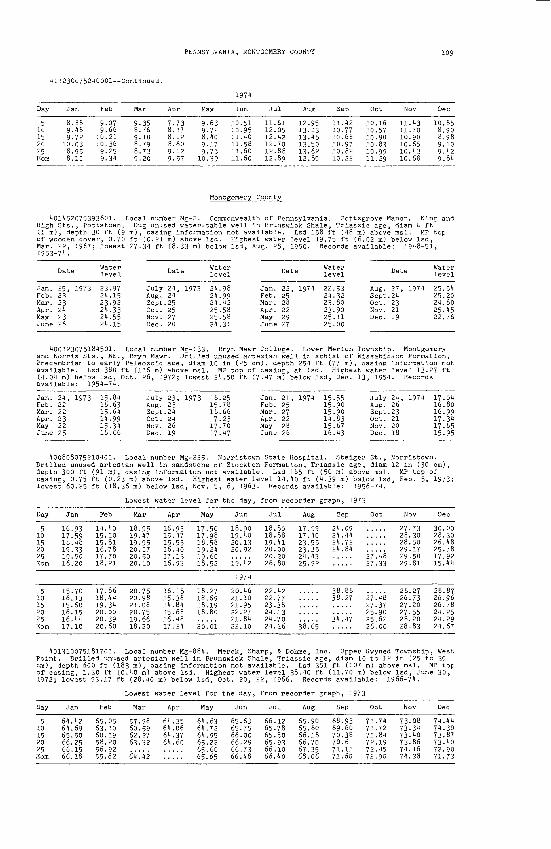
PENNSYLVANIA, MONTOOMERY COUNTY
411230075240001 Continued.
Day
5 10 15 20 25 Eom
Jan
8.88 9.48 9.72
10.03 8.95 8.10
Feb
9.07 9.66
10.21 10.36 9.25 9.34
Mar
9.35 8.76 9.10 8.79 8.73 9.20
Apr
7.73 8.17 8.12 8.60 9.12 9.57
May
9.63 9.72 8.40 9.17 9.75
10.39
Jun
10.51 10.95 11.40 11.58 11.60 11.60
Jul
11.61 12.05 12.42 12.70 12.88 12.89
Aug
12.95 13.13 13.45 13.50 13.62 12.80
Sep
11.12 10.77 10.68 10.97 10.82 10.22
Oct
10.16 10.57 10.90 10.83 10.99 11.29
Nov
11.43 11.70 10.90 10.65 10.43 10.68
Dec
10.85 8.90 8.98 9.10 9.42 9.84
Montgomery County
401452075393601. Local number Mg-2. Commonwealth of Pennsylvania. Pottsgrove Manor. King and
(1 m), depth 30 ft (9 m), casing information not available. Lsd 158 ft (48 m) above msl. MP top of wooden cover, 0.70 ft (0.21 m) above Isd. Highest water level 19.75 ft (6.02 m) below Isd, Mar. 22, 1967; lowest 27.34 ft (8.33 m) below Isd, Aug. 25, 1950. Records available: 1948-51, 1953-74.
Date
Jan. 25, 1973 Feb. 23 Mar. 23 Apr. 24 May 23 June 26
Water level
23.9724.1523.9224.3324.5524.15
Date Water level
July 24, 1973 24.98Aug. 24 24.99Sept.25 24.42Oct. 25 25.58Nov. 27 25.58Dec. 20 24.31
Date
Jan. 22, 1974Feb. 25Mar. 28Apr. 22May 29June 27
Water level
22.5324.3223.8023.9025.1125.00
Date
Aug. 27, 1974 Sept.24 Oct. 23 Nov. 21 Dec. 19
Wate leva
25.5425.2021.8025.4522.76
400123075184501. Local number Mg-133. Bryn Mawr College. Lower Merion Township. Montgomery and Norris Sts., NE., Bryn Mawr. Drilled unused artesian well in schist of Wissahickon Formation, Precambrian to early Paleozoic age, diam 10 in (25 cm), depth 254 ft (77 m), casing information not available. Lsd 380 ft (116 m) above msl. MP top of casing, at Isd. Highest water level 13.27 ft (4.04 m) below Isd, Oct. 26, 1972; lowest 24.50 ft (7.47 m) below Isd, Dec. 13, 1954. Records available: 1954-74.
Jan. 24, 1973Feb. 22Mar. 22Apr. 23May 22June 25
15.8416.6315.6414.9915.3416.06
July 23, 1973 Aug. 23 Sept.24 Oct. 24 Nov. 26 Dec. 19
16.2515.7816.6617.2317.7017.47
Jan. 21, Feb. 25 Mar. 27 Apr. 22 May 28 June 26
1974 15.55 15-90 15.90 14.83 15.67 16.43
July 24, Aug. 26 Sept.23 Oct. 21 Nov. 20 Dec. 18
1974 17.0416.8016.9917.3417.6515.95
400808075210401. Local number Mg-225. Norristown State Hospital. Steiger St., Norristown. Drilled unused artesian well in sandstone of Stockton Formation, Triassic age, diam 12 in (30 cm), depth 300 ft (91 m), casing information not available. Lsd 165 ft (50 m) above msl. MP top of casing, 0.75 ft (0.23 m) above Isd. Highest water level 14.10 ft (4.39 m) below Isd, Feb. 5, 1973; lowest 60.25 ft (18.36 m) below Isd, Nov. 5, 6, 1963. Records available: 1956-74.
Lowest water level for the day, from recorder graph, 1973
Day
5 10 15 20 25
510 15
25
Jan
16.93 17.59 18.48 19.33 19-50 16.20
15.70 16.13 15.60
16.44 17.10
Feb
14.40 15.10 15.81 16.78 17.70 18.21
17.86 18.44 19.34
20.39 20.60
Mar
18.95 19.47 19.95 20.17 20.50 20.10
20.75 20.98 21.08
19.66 18.20
Apr
16.93 15.47 15.53 16.40 17.13 16.93
16.15 15.38 14.84
16.48 17.24
May
17-50 17.98 18.58 19.24 19.60 18.52
18.27 18.89 18.19
20.01
Jun
18.90 19.40 20.13 20.92
19.42
1974
20.46 21.10 21.95
21.84 22.10
Jul
18.80 18.88 19.41 20.00 20.20 26.80
22.42 22.77 23.38
24.70 24.16
Aug
17.59 17.40 23.55 23-35 24.43 25.92
38165
Sep
24.09 24.44 24.72 24.84
38.8638.27
34.47
Oct
27'48 27.33
27i48 27.37
25.62 26.00
Nov
27.73 28.30 28.50 29.17 29.50 29.81
26.27 26.73 27.20
28.20 28.83
Dec
30.00 28.30 26.48 25.78 17.92 15.44
28.87 26.96 26.78
24.29 24.67
401310075181701. Local number Mg-884. Merck, Sharp, & Dohme, Inc. Upper Owyned Township, West Point. Drilled unused artesian well in Brunswick Shale, Triassic age, diam 10 to 12 in (25 to 30 cm), depth 600 ft (183 m), casing information not available. Lsd 351 ft (107 m) above msl. MP top of casing, 1.30 ft (0.40 m) above Isd. Highest water level 38.40 ft (11.70 m) below Isd, June 30, 1972; lowest 93.17 ft (28.40 m) below Isd, Oct. 20, 22, 1966. Records available: 1966-74.
Lowest water level for the day, from recorder graph, 1973
Day
5 10 15 2025 Eom
Jan
64.42 64.69 65.50 66.25 66.15 66.18
Feb
65.05 63.10 60.19 58.20 56.92 55.82
Mar
57-98 60.59 62.27 63.32
64!42
Apr
64.35 64.06 61.37 64.60
May
64.63 61.72 64.95 65.22 65.60 65.65
Jun
65-63 65.75 66.00 66.29 66.73 66.48
Jul
66.12 65-78 65.80 65.93 66.10 66.40
Aug
65.90 65.60 66.18 66.70 67.35 68.06
Sep
68.93 69.60 70.38 70.6 71.11 71.60
Oct
71.71 71.72 71.84 72.19 72.45 72.90
Nov
73.08 73.34 73.40 73.86 74.16 74.38
Dec
74.44 74.30 73.87 73.40 72.90 71.73
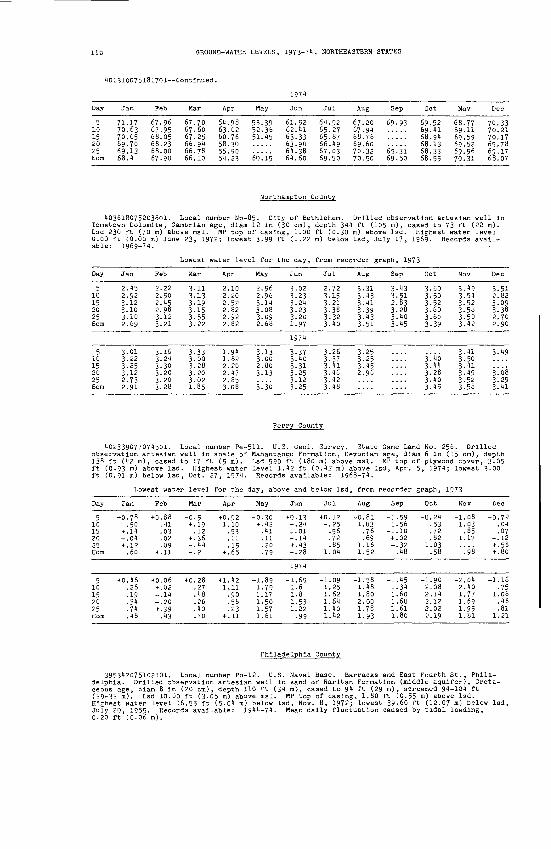
GROUND-WATER LEVELS, 1973-71, NORTHEASTERN STATES
401310075181701 Continued.
1971
Day
5 10 15 20 25 Eom
Jan
71.17 70.63 70.05 69.70 69.13 68.1
Feb
67.96 67.95 68.05 68.23 68.00 67-90
Mar
67.70 67.60 67.25 66. 911 66.78 66.10
Apr
61.98 63.02 60.76 58.30 55.90 51.23
May
53.39 52.36 51.15
60.15
Jun
61.52 62.11 63.33 63.90 61.38 61.60
Jul
61.92 65.27 65.87 66.19 67.03 69-50
Aug
67.20 67.91 68.76 69.60 70.32 70.50
Sep
69.93
69^31 69-50
Oot
69.52 69.11 68.91 68.13 68.33 68.55
Nov
68.77 69.11 69.59 69.52 69.96 70.31
Dec
70.33 70.21 70.17 69.78 69.17 68.07
Northampton County
103618075203801. Local number Np-85. City of Bethlehem. Drilled observation artesian well in Tomstown Dolomite, Cambrian age, diam 12 in (30 cm), depth 311 ft (105 m), cased to 73 ft (22 m). Lsd 230 ft (70 m) above msl. MP top or casing, 1.00 ft (0.30 m) above Isd. Highest water level 0.00 ft (0.00 m) June 23, 1972; lowest 3-99 ft (1.22 m) below Isd, July 17, 1969. Records avail able: 1969-71.
Day
5 10 15 20 25 Eom
Jan
2.15 2.92 3.12 3.10 3.10 2.69
Feb
2.22 2.50 2.15 2.98 3.12 3.21
Lowest w
Mar
3-11 3.13 3.19 3.15 3.55 3-22
ater level for the day,
Apr
2.10 2.20 2.52 2.82 2.92 2.82
May
2.96 2.96 3.11 3.08 3.09 2.68
Jun
3.02 3.23 3.21 3.23 3.20 1.97
from rec
Jul
2.72 3.15 3.21 3.38 3.32 3.10
order graph, 1973
Aug
3-31 3.13 3.11 3.39 3.13 3.51
Sep
3-13 3.51 2.83 3.28 3.10 3.15
Oct
3.50 3.50 3.52 3.60 3.60 3-39
Nov
3.19 3.51 3.52 3.58 3.50 3.12
Dec
3.51 2.82 3-09 3.38 2.70 2.90
1971
5 10 15 20 25
3-01 3.22 3.25 3.12 2.73 2.91
3-16 3.21 3.30 3.20 3-20 3-28
3.33 3.00 3.28 3.20 3.02 1.85
1.91 1.82 2.20 2.17 2.85 3-08
3.13 3.00 2.80 3-13
3.37 3.10 3.31 3-25 3.12 3.25
3.26 3-37 3.11 3.16 3.12 3.18
3-25 3-25 3.15 2.96
3-io 3.11 3.28 3.10 3-15
3.11 3.50 3.11 3.19 3.52 3-58
3.19
3.08 3.29 3.11
Ferry County
t0233907707l501. Local number Pe-511. U.S. Geol. Survey. State Game Land No. 256. Drilled observation artesian well in shale of Mahantango Formation, Devonian age, diam 6 in (15 cm), depth 138 ft (12 m), cased to 17 ft (5 m). Lsd 590 ft (180 m) above msl. MP top of plywood cover, 3.05 ft (0.93 m) above Isd. Highest water level 1.12 ft (0.13 m) above Isd, Apr. 5, 1971; lowest 3-00 ft (0.91 m) below Isd, Oct. 27, 1971- Records available: 1968-71.
Lowest water level for the day, above and below Isd, from recorder graph, 1973
Day
5 10 15 20 25 Eom
Jan
+0.78 50
+ .11 -.01 + .12 .60
Feb
+0.88 .11 .03 .02 .09
+ .11
Mar
-0.5 + .19 .12
+ .36 -.11 -.2
Apr
+0.92 1.10
53 .11 .15
+ .65
May
-0.30 + .12 .11 .11 .20 79
Jun
+0.13 -.21 1.01 -.11 + .13 -.28
Jul
+0.12 -.25
56 .72 .85
1.01
Aug
-0.81 1.03 .76 .69
1.16 1.52
Sep
-1.59 1.56
-1.10 + .02 -.32 .18
Oct
-0.21 .53 .72 .82
1.03 .58
Nov
-1.08 1.03 .85
1.17"98
Dec
-0.72 .01 .07
-.12 + .58 + .80
19715
1,01,5?0PS
+0.16.26-19-31.71.18
+0.06+ .02-.11-.20+ .39.13
+0.28.27.18.26.10 70
+1.121.11.90 56.23
+ .11
L.89 79.17 50.57 :.61
.69 - .09
.6 .25
.8 .62
.53 .61
.22 .10
.99 1.12
-1.58 -1.181.802.001.78 :1.93
.15
.31
.60
.60
.61
.80
-1.902.082.112.122.022.19
-2.012.101.771.691.951.81
-1.16 7 5
1.06.16.81
1.21
Philadelphia County
395312075102101. Local number Ph-12. U.S. Naval Base. Barracks and East Fourth St., Phila delphia. Drilled observation artesian well in sand of Raritan Formation (middle aquifer), Creta ceous age, diam 8 in (20 cm), depth 110 ft (31 m), cased to 91 ft (29 m), screened 91-101 ft (29-32 m). Lsd 10.00 ft (3-05 m) above msl. MP top of casing, 1.80 ft (0.55 m) above Isd. Highest water level 16.55 ft (5.01 m) below Isd, Nov. 8, 1972; lowest 39-60 ft (12.07 m) below Isd, July 20, 1955. Records available: 1911-71. Mean daily fluctuation caused by tidal loading, 0.20 ft (0.06 m).

PENNSYLVANIA, SCHUYLKILL COUNTY
395342075102101 Continued.
Day
5 10 15 20 25 Eom
Jan
17.17 17-55 17.99 18.00 18.01 18.24
Feb
18.00 17.65 17.09 17.61 17.96 17.78
Mar
17.86 17-93 17.73 18.00 17-72 17.68
Apr
17.35 17.20 18.00 18.01 17-70 17.80
May
17.64 17.4o 17.71 17.48 17.44 17.61
;he day,
Jun
17.82 17.90 18.22 18.16 18.06 17.88
Jul
17.6118.02 18.01 17-92 18.09 18. to
Aug
18.55 18.51 18.67 18.611 18.82 18.81
Sep
18.63 18.60 18.44 18.1(2 18.58 18.10
Oct
18.50 18.51 18.37 18.68 18.89 18. 45
Nov
19.23 19.60 19.01 19.52 18.90 19.30
Dec
19.04 19.82 19.97 19. 40 19.50 19.00
1974
5 10 15 20 25
18.94 18.84 18.51 18.72 18.70 18.50
18.76 18.63 18.90 19.00 18.68 18.93
18.75 18.94 18.85 18.85 19.30 18.61
18.53 18.99 18.54 19.10 18.94 18.58
18.79 18.63 18.73 19-28
19.00
18.99 18.60 19.12 19.25 19.42 19-16
19.12 18.68 18.70 18.65 18.95 18.76
18.95 19.00 19.19 19.35 19.25 19.30
19- "7 18.92 18.93 18.88 18.82 18.66
19.07 18.80 18. 74 19.21 19.23 19.1(0
19.19 19.25 19.31 18.87 19.20 19. 64
19.42 19.00 19.21 18.97 18.98 19-22
395316075104901. Local number Ph-20. U.S. Naval Base. Phillip and West Third St., Philadel phia. Drilled observation artesian well in sand of Raritan Formation (lower aquifer), Cretaceous age; diara 8 in (20 cm); depth 266 ft (81 m), 19 ft (6 m) into rock; cased to 238 ft (73 m); screened 238-243 ft (73-74 m). Lsd 13 ft (4 m) above msl. HP top of casing, 3.20 ft (0.98 m) above Isd. Highest water level 18.29 ft (5.57 m) below Isd, Sept. 10, 1974; lowest 64.90 ft (19.78 m) below Isd, Dec. 4, 1964. Records available: 1946-74. Mean daily fluctuation caused by tidal loading, 1.7 ft (0.5 m).
Day
5 10 15 20 25 Eom
Jan
26.98 27.30 28.50 27.62 27.70 27.22
F
28 27 26 26 27 26
eb
.62
.06
.64
.82
.00
.85
Mar
27.44 27.58 28.00 27.51 27.38 26.94
Ap
26. 26. 27. 27. 27. 27.
r
91 80 58 87 73 18
May
27.42 27.34 27-67 26.96 26.52 27.29
Jun
28.21 28.61 29.00 28.00 28.33 28.01
1 i'Ul
Jul
28 29 28 28
.31
.20
.50
.22
JUl'Ut
Al»g Sep Oct Nov
29,.41
Dec
28.83 28.98 28.63 28.87 29.20 28.80
1974
5 10 15 20 25 Eom
28.58 29.01 28.73 28.70 28.60 28.30
28 28 28 29 29 28
.80
.60
.94
.18
.17
.80
29.44 29.00 28.85 29.13 29.90 28.85
29. 29- 29. 29. 29-
28 45 42 81 40
30.00
29.62 29.68 30.52 31.43 32.00 29.70
30, 30, 31, 30, 31, 30,
.01
.02
.55
.33
.50
.21
30. 29. 31. 30. 30. 20.
.32
.80 ,10 ,61 ,40 ,46
19.95 27.68 18.29 27.40 ..... 28.27 ..... 28.90 27.51 30.25 27.80 30.03
30. 29, 30. 29.
.66
.78
.23
.24 29'. 19 29.52 29.90
Potter County
414640077493801. Local number Po-72. U.S. Geol. Survey. Denton Hill State Park. Drilled observation artesian well in shale of Catskill Formation, Mississippian and Devonian age, diam 6 in (15 cm), depth 110 ft (34 m), cased to 21 ft (6 m). Lsd 1,810 ft (552 m) above msl. MP top of plywood cover, 1.10 ft (0.34 m) above Isd. Highest water level 5.20 ft (1.58 m) below Isd. Mar. 23, 1968; lowest 29.00 ft (8.84 m) below Isd, Oct. 20, 1972. Records available: 1967-74.
Day
5 10 15 20 25 Eom
Jan
15.40 18.90 20.66 21.52 17.50 16.11
Feb
22.91 23.66
Lowest \
Mar
13.87 14.12 12.50 13-92 17.13 17.43
*ater level for the day,
Apr
13.50 15.08 17.10 18.91 19.76 15.28
May
16.32 17.84 15.50 17.40 16. 15-70
Jun
19.18 20.75 22.50 24.03 25.74 24.70
from re<
Jul
22.60 25.60 23.55 25.87 26.72 25.70
jorder gi
Aug
26.18 27.12 27.27 18.65
-aph, 1973
Sep
25^50 27.02
Oct
23.10 22.14 23.67 24.75 25.35 12.00
Nov
16.60 19.40 20.00 19.64 19.22 13.85
Dec
17.38 16.90 18.55 19.82
1974
5 10 15 20 25 Eom
20.08 13.20 12.08
17.00 19-34 21.01 21.90 14.68 17.18
13-70 12.00 16.41 18.62 18.90 18.70
11.30
18!22
18.37 18.80 13.30 18.58 20.98 22.56
24.72 26.02 26.76 23.15 25.32 16.40
17.00 20.56 21.90 24.25 26.27 22.55
26.15 27.20 27.78 28.17 28.40 25.95
21.00 23-15 25.00 26.70 23.30 22.60
21.20 22.30 23.30 22.58 22.83 23.70
21.50 17.80 16.60 18.22 15.69 18.01
20.19 12.78 17.72 19.57 20.03 18.95
Schuylklll County
403223076224201. Local number Sc-1. Nick C. Donofrio. Pine Grove. Dug unused water-table well in shale of Mahantango Formation, Devonian age, diam 52 in (132 cm), depth 33 ft (10 m), cased with stone. Lsd 560 ft (171 m) above msl. MP top of wooden cover, at Isd. Highest water level 3.56 ft (1.09 m) below Isd, Aug. 31, 1940; lowest 31.78 ft (9.69 m) below Isd, Nov. 5, 1944. Records available: 1931-74.

GROUND-WATER LEVELS, 1973-74, NORTHEASTERN STATES
403223076224201 Continued.
Water Water Water Water level Date level Date level Date level
6, 1973 12.10 July 7, 1973 18.39 Dec. 29, 1973 11.20 June 29, 197* 16.6013 15.17 14 20.00 Jan. 5, 1974 14.40 July 6 17-1020 15.90 21 19.70 12 15.30 16 19.1027 12.20 28 20.10 19 12.20 27 21.303 13.07 Aug. 7 18.60 26 12.18 Aug. 3 19-17
10 14.60 11 18.80 Feb. 2 13.18 10 18.9817 in.68 18 19-30 9 15.47 17 19.2024 15.00 25 20.50 16 16.30 21 20.703 16.58 Sept. 1 21.30 23 12.30 31 21.30
10 11.17 8 22.00 Mar. 2 11.70 Sept. 7 19.7017 13.40 15 15.70 9 13.00 14 17-2024 14.68 22 16.30 16 12.90 21 17-9031 11.75 29 17.00 23 12.07 28 16-907 12.70 Oct. 6 17.20 30 12.80 Oct. 5 19-50
14 14.30 9 17.20 Apr. 6 12.20 12 20.0021 14.88 13 18.40 13 13.21 19 20.5028 14.58 20 19.00 20 14.70 26 20.205 14.20 27 16.70 27 15.00 Nov. 2 21.30
12 13.50 Nov. 3 16.20 May 4 15.27 9 21.4719 12.20 10 16.46 11 13.00 16 21.6026 12.70 17 17.50 18 14.10 23 19.702 14.20 24 18.10 June 1 18.30 30 19.809 16.18 Dec. 1 16.40 8 18.80 Dec. 7 ' 18.30
16 17.90 8 13.50 15 18.38 14 13.9023 17.30 15 12.90 22 17.80 21 13.6030 18.40 22 13.58
Snyder County
403939076591001. Local number Sn-130. U.S. Geol. Survey. State Game Land No. 194. Drilled observation artesian well in shale of Marine beds of Chemung Formation, Devonian age (previously reported in shale of Catskill Formation, Mississippian and Devonian age), diam 6 in (15 cm), depth 100 ft (30 m), cased to 41 ft (13 m). Lsd 740 ft (226 m) above msl. MP top of plywood cover, 3.55 ft (1.08 m) above Isd. Highest water level 15.08 ft (4.60 m) below Isd, Feb. 3, 1970; lowest 19.42 ft (5.92 m) below Isd, Nov. 5, 1972. Records available: 1968-74.
Lowest water level for the day, from recorder graph, 1973
Day
510 15 20 25 Eom
Jan
18.36 18.57 18.87 18.98 18.46 18.05
Feb
17.88 18.33 18.66 18.89 18.97 19.01
Mar
18.76 18.41 18.71 18.37 18.75 18.94
Apr
17.00 17-82 18-54 18.84 18.93 18.28
May
18.70 18.85 18.95 18.99 18.88 18.35
Jun
18.80 18.89 19.02 19-07
19'.07
Jul
19.08 19.13 19.16 19-17 19.22 19.24
Aug
19.25 19.26 19.28 19.27 19-30 19-30
Sep
19.31 19.33 18.78
isiie 18.80
Oct
18.66 18.94 19-02 19-09 19.14 18.59
Nov
18.96 19.12 19.10 19.19
isieo
Dec
18.82 17.34 18.56 18.79 18.18 18.11
1974
5 10 15 20 25
18.55 18.72 18.67 18.40 18.07 18.43
18.80 18.93 19.08 19.14 18.57 18.72
18.69 17-90 18.50 18.80 18.45 16.90
17.72 17.80 18.35 18.67 18.89 18.93
19-03 19-07 18.81 19.03 19.10 19-12
19.18 19.15 19.20 19.20 19.19 19.10
19.10 19.17 19.20 19.26 19.26 19.10
18.20 18.86 19.03 19.11 19.12 19-17
19.04 19.14 18.69 19.00 18.85 19-08
19-19 19.20 19.23 19.24 19.26 19-31
19.32 19.37 18.85 18.92 18.79 18.97
18.39 18.05 18.70 18.26 18.76 18.87
Somerset County
400008079142801. Local number So-2. Commonwealth of Pennsylvania. Laurel Hill State Park. Drilled unused artesian well in shale and sandstone of Pottsville Group, Pennsylvanian age, diam 6 to 4 in (15 to 10 cm), depth 450 ft (137 m), cased to 310 ft (94 m). Lsd 2,037 ft (621 m) above msl. MP top of casing, 1.43 ft (0.44 m) above Isd. Highest water level 29.04 ft (8.85 m) below Isd, May 8, 1971; lowest 35.97 ft (10.96 m) below Isd, Aug. 21, 1937. Records available: 1937-74.
Lowest water level for the day, from recorder graph, 1973
Day
5 10 15 20 25 Eom
Jan
31.38 31.41 31.42
Feb
h3i.'2331.24 31.28
Mar
31.18 31.24 31-18 31.11
31.' 13
Apr
30.89 30.82 30.99 31.02 30.93 30.86
May
30.84 30.74 30.82 30.82 30.81 30.82
Jun
30.88 30.92 31.03 30.97
31.' 13
Jul
31.20 31-31 31-43 31.57 31-69 31-78
Aug
31.80 31.98 32.3 32.14 32.2 32.3
Sep
32.3 32.3 32.5 32.6 31.71 31.73
Oct
31.75 31.79 34.14 32.93 32.93 32.57
Nov
32.63 32.69 32.62 32.55
32i29
Dec
32.25 32.19 32.11 32.15 32.04
1974
5 10 15 20 25 Eom
31.86 31.83 31.71 31.6 31.67 31.58
31.61 31.54 31.59 31.59 31.54 31-58
31.5331.53 31.58 31.57 31-56 31-3
31.3 31.3 31.2 31.3 31.3 31-2
31.2 31.2 31-1 31.2 31.1 31.17
31.22 31.23 31.48 31.36 31-10 31.23
31-26 31.31 31.37 31.49 31.48 31.66
31-75 31.84 31.98 32.13 32.21 32.18
32.18 32.25 32.27 32.31 32.40 32.41
32.52 32.54 32.60 32.60
32i84
32.75 32.80 32.71 32.68 32.56 32.61
32.35 32.27 32.28 32.10 32.02 32.06
h Tape measurement.

PENNSYLVANIA, SUSQUEHANNA COUNTY
413026076352902. Local nu
Sullivan County
Near Forksville."(1302b07b352902. Local number 5u-3t. U.S. Geol. Survey. Near Forksville. Drilled obser water-table well in shale of Catskill Formation, Mississippian and Devonian age, diam 6 in (1 depth 50 ft (15 m), cased to 34 ft (10 m). Lsd 1,080 ft (329 m) above msl. MP top of casing ft (0.61 m) above Isd. Highest water level 7.42 ft (2.26 m) below Isd, June 23, 1972; lowest 31.12 ft (9.49 m) below Isd, Sept. 4, 1966. Records available: 1965-74.
Drilled observation 6 in (15 cm),
2.00
el for the day, from recorder graph, 1973
Day
510 15 20
5 10 15 20 25 Eom
Jan
24.52 25.80 26.81 27.30
e25.4 26.59 27.04 26.31 22.75 23.05
Feb
21.50 24.92 26.12 26.92
27.74
25.57 26.90 27.50 27.80 23.75 24.92
Mar
26.85 25.62 25-68 19.8
26.02 26.50
Apr
18.80 23.34 25.10
20.80 25.02 24.30 25.50 29-63 27.82
May
25.10
26.25 26.98 24.50 26.3927.73 28.61
Jun
26.40 27.60 28.48 28.60
1974
28.73 29.04 29.20 25.90 27.84 27.94
Jul
28.75 29.12 29.21 29.10
26^80 27.91 28.35 28.65 27.62
Aug
27.40 28.60 28.50 25-50
28.10 28.90 29.18 29.39 29.53 28.80
Sep
29.99 28.36 28.00 26.72
21.70 25.88 27.10 28.20 26.00 27.33
Oct
28.3928.72 28.90 29.08
28.28 28.67 28.88 28.78 29.02 29.10
Nov
27.03 28.28 28.64 28.46
29.08 28.72 27.00 26.22 26.26 26.24
Dec
26.08
24.50 26.10
26.07
24! 56 23.55 25.58 26.10
Susquehanna County
415025075524201. Local number Sq-1. Carlton Farm. Montrose. Dug unused water-table well in sand and gravel of Quaternary age, diam 4 ft (1 m), depth 38 ft (12 m), cased with stone. Lsd 1,690 ft (515 m) above msl. MP top of wooden platform, 0.15 ft (0.05 m) above Isd. Highest water level 0.55 ft (0.17 m) below Isd, Apr. 8, 1970; lowest 11.40 ft (3.47 m) below Isd, Dec. 29, 1961. Records available: 1930-74.
Jan.
Feb.
Mar.
Apr.
May
June
Date
1, 19733113205
192738
22307
212918
Water level
2.077.074.126.237.442.933.412.282.645.056.756.623.753.956.63
JuneJuly
Aug.
Sept
Oct.
Nov.
Dec.
Date
30, 19739
241320
. 4301430131929
2331
Water level
4.554.977-948.428.278.325-546.888.328.628.465.934.092.162.57
Jan.
Feb.
Mar.
Apr .
May
Date
8, 19742129
1(1118255
19252
16233031
Waterlevel
4.176.332.223.394.236.153.254.914.253.664.322.363.895.396.57
June
July
Aug.Sept
Oct.
Nov.
Dec.
Date
4, 197410252
14225
. 93013225
2615
Water level
6.646.656.916.226.277.507.855.935.076.127.017.484.143.65
415323075451301. Local number Sq-6l. U.S. Geol. Survey. State Game Land No. 175. Drilled observation artesian well in sandstone and shale of Susquehanna Group, Mississippian and Devonian age, diam 6 in (15 cm), depth 175 ft (53 m), cased to 80 ft (24 m). Lsd 1,270 ft (387 m) above msl. MP top of casing, 3.00 ft (0.91 m) above Isd. Highest water level 23.82 ft (7-26 m) below Isd, Nov. 16, 1972; lowest 37.11 ft (11.31 m) below Isd, Oct. 22, 1973. Records available: 1972-74.
Day
510 15 20 25 Eom
Jan Peb
Lowest v
Mar
later le\
Apr
rel for the day,
May Jun
from recorder graph, 1972
Jul
31.42 31.67 32.66
Aug
32.74 32.90 33.00 33.20 33.40 33.74
Sep
34.00 34.42 34.58 34.39 34.57 34.50
Oct
34.80 34.08 34.07 34.51 34.72 34.61
Nov
33.39 26.60 25.30 26.86 28.71 27.99
Dec
29.92 26.49 27.89 29.90 28.88 29.07
1973
5 10 15 20 25
28.19 30.06 31.61 32.42 32.10 32.07
29.07 29.80 31.10 32.17 32.90 33.28
33.43 32.08 31.16 25-83 28.36 29.60
27.50 26.64 27.68 30.02 31.24 32.04
31.74 31.78 29.38 28.80 28.66 30.52
31.32 32.00 32.69 33.45
33.20 33.82 34.38 34.86 35.22
35-30 36.61 35.70 35.80 36.31
36.76 36.88 37.00
36. '36 34.59
33.75 30.85 28.68 30.71 27.21 25.60
1974
5 10 15 20 25 Eom
29.02 31.00 32.25 33.05 31.54 26.94
28.92 30.63 31.98 32.79 28.74
30.07 29.57 29.72 30.46 28.46 29.90
26.45 26.89 26.57 27.57 29.63
31.80 31.82 29.53 30.25 31.80 32.73
33.22 33.58 33.93 34.28 34.18
34.35 33.81 34.18 34.77 34.99 35.02
35.15 35.41 35-79 36.00
35^94
34.73 34.62 34.97 35.30 34.52
34.82 35.01 35.48 35.53 35.51 35.75
35-70 35.25 33-24 31.93 31.66
32.79 29.09 28.78 29-90 30.97 31.78

GROUND-WATER LEVELS, 1973-71, NORTHEASTERN STATES
Tloga County
414510077333301. Local number Ti-1. Mrs. Ruth K. Wilson. Galnes. Dug unused1H510077333301. Local number Ti-1. Mrs. Ruth K. Wilson. Galnes. Dug unused water-table wel in sand and gravel of Quaternary age, diam 30 in (76 cm), depth 23 ft (7 m), cased with stone. Ls 1,290 ft (393 m) above msl. MP top of wooden cover, 3.80 ft (1.16 m) above Isd. Highest water level 1.17 ft (1.27 m) below Isd, Apr. 22, 1961; lowest 22.01 ft (6.72 m) below Isd, Nov. 6, 1963. Records available: 1935-71.
Jan.
Feb.
Mar.
Apr.
May
June
Date
6, 19731320273
1017213
101721317
1121285
12192629
192330
Water level
13.3515-9517-3715-3010.099-30
15-2516.1016.1215.256.859.08
13.009-6911.1111.8015.5815.2216.0615.8812.8112.8011.8013.5516.8017-70
July
Aug.
Sept.
Oct.
Nov.
Dec.
Date
7, 19731421284
111825
, 18
152229161720273
10172418
152229
Water level
17.5518.2417.7017-8518.0918.5515.807.8513.458.54
11.9315.2214.6316.6917.5518.2018.7513.4815.8417-3718.2715.1015.5012.2613.466.14
Jan.
Feb.
Mar.
Apr.
May
June
Date
1, 197412192629
162329
1623306
1320271
11182518
152229
Water level
9.7113.8911.8510.7510.1011.0915.9811.1813.0912.758.65
11.7213.345.868.51
10.1513.0515.4016.8014.9016.5017.4718.1218.4017-7516.88
July
Aug.
Sept,
Oct.
Nov.
Dec.
Date
6, 19711320273
10172131
. 71121285
12192629
1623307
112128
Water level
11.6015.2417-3217.9018.0818.2818.5518.8518.4817.2518.1518.33
'17.2118.0818.4418.5518.8018.8917.6917.4016.9917.5018.0015.0014.9014.90
111513077333701. Local number Ti-100. U.S. Geol. Survey. State Game Land No. 208. Drilled observation artesian well in sandstone of Oswayo Formation, Devonian age, diam 6 in (15 cm), depth 77 ft (23 m), cased to 67 ft (20 m). Lsd 1,310 ft (399 m) above msl. MP top of casing, 4.00 ft (1.22 m) above Isd. Highest water level 31.91 ft (9-71 m) below Isd, Apr. 1, 1971; lowest 31.66 ft (10.56 m) below Isd, Oct. 18, 1972. Records available: 1972-71.
Lowest water level for the day, from recorder graph, 1972
Day
51015 20 25 Eom
510 15 20 25
Jan
33.18
32.19 32.53 32.59 32.63 32.11 32.09
Peb
33.00 33.51 33-96 33-90
32.18 32.53 32.91 33.09 32.62
Mar
33.67
33.32 33-10 32.92 33-37
32.60 32.28 32.20 32.39 32.65 32.36
Apr
33.1*
32.02 32.31 32.06 32.17 32.13
May
33.16 33.6233.12
32.72 32.89 32.19 32.85 32.69 32.92
Jun
1973
32.15 33.23 32.99 33.20
1971
33.12 33.06 33.22 33.16 33-31
Jul
33.20
33!i3 33.15 33-63
32.47 32.62 32.98 33.21 33.26 32.36
Aug
33.78
33-70 32.6832.80 32.90 33.04 33.24
33.36 33.51 33.63 33.69 33.68 33.63
Sep
33.86
33.08
33.02 33.12 33.20 33.12
33.59 33.50 33.58 33.68 33-12
Oct
34.53
33.27 33 3733.44 33.58 33.57 33.33
33.71 33.22 33.32 33.14 33.30 33.56
Nov
33-94
33.04
33.26 33.38 33.23 33.11
33.42 33.62 33-34 33.25 33.27
Dec
33.31
32.85
32.71 33.01 32.37 32.19
33.66 33.13 33.18 33.08 33.05 33.08
Union County
405928077115501. Local number Un-51. U.S. Geol. Survey. Robert B. Winter State Park. Drilled observation artesian well in Reedsville Shale, Ordovician age, diam 6 in (15 cm), depth 115 ft (35 m), cased to 91 ft (28 m). Lsd 1,550 ft (472 m) above msl. MP top of plywood cover, 3.58 ft (1.09 m) above Isd. Highest water level 25.46 ft (7-76 m) below Isd, June 30, 1972; lowest 41.50 ft (12.65 m) below Isd, Nov. 5-8, 1972. Records available: 1967-74.
Lowest water level for the day, from recorder graph, 1973
Day
5 10 15 20 25 Eom
Jan
34.18 35.35 36.60 37.13 37-88 38.37
Peb
37-65 35.15 35.10 36.16 37.38 37-87
Mar
38.32 38.56 38.52 36.51 33.68 35.20
Apr
35.98 34.75 34.02 34.90 36.08 36.90
May
36.92 36.78 36.50
35 in 35.57
Jun
35.25 35-58 35-83 36.65 35.37 38.15
Jul
38.62 38.99 39.30 39.53 39.70 39.93
Aug
40.10 40.25 40.37 40.46 40.58 40.72
Sep
40.80 40.89 40.84 40.67 40.58 40.46
Oct
40.27 40.13 39-97 39.88 39.87 39.25
Nov Dec
..... 38.43
..... e37.30
..... e35.55 37.02 e34.20

PENNSYLVANIA, WASHINGTON COUNTY
105928077115501 Continued.
Day
10
20 25 Eom
Jan
35.27
37.16
Feb
37^78 26.05
Mar Apr
..... 32.56
..... 31.73
..... 35.72 36.82 36.80
May
38.15
38.00 37-35 37-65
Jun
38.56
39.08 39.22 39.38
Jul
38.71
38.60 38.81 38.81
Aug
38.97
39.15 39.35 39.55
Sep
39-6139.76
10.00 10.02 10.12
Oct
10.30
10.17 10.58 10.66
Nov
10.79
10.77 10.68 10.59
Dec
39.81 38.36
35^53
e Estimated.
Warren County
111159079213601. Local number Wr-50. U.S. Geol. Survey. State Game Land No. 86. Drilled observation artesian well in shale of Oswayo Formation, Devonian age, diam 6 in {15 cm), depth 105 ft (32 m), cased to 16 ft (11 m). Lsd 1,170 ft (357 m) above msl. MP top of casing, 2.00 ft (0,61 m) above Isd. Highest water level 10.00 ft {12.19 m) below Isd, June 9, 1973; lowest 11.69 ft {13.52 m) below Isd, Nov. 23, 21, 1973. Records available: 1972-71.
Lowest water level for the day, from recorder graph, 1972
Day
10
5 10 15 20 25 Eom
5
25 Eom
Jan
12!62 12.21
13.76 13.61
13.6713.19 13.02
Feb
11.93 11.87 11.70 11.99 12.28 12.33
13.21
13.26
Mi
12 11 11 11 11 11
12 1?12
12, 11
ir
.23
.98
.71
.20
.33
.07
.80
.69
.28
.72
AI
10. 10,11 11, 11. 11
11.ell.
ell,ell,
?r
.82
.76
.32
.05
.00
.18
,63
,73
May
11.11 11.00 11.16 11.19 11.06 11 12
11.39 12.00
Ji
1<
11, 11. 11, 10. 11, 11,
1 =
e12.
12.
in
)73
.10
.06
.33
.99
.73
.81
)71
.1
,91
Jul Aug
..... 13.11
..... 13.18
..... 13.50
..... 13.66 13.11 13.79 13.18 13.90
12.80 .....
..... 11.00
..... 13.89
Si
1?1?
12
13 11 11 11 11 11
11, 11111111.
2P
61
.R5
.91
.00
.05
.11
.31
.28
.00
.07
0<
fl 0
13
11. 11, 11, 11, 11. 11,
11.
13,
13. 11.
:t
in
.63
.32
.11
.36 ,53 ,19 .12
,00a?
,8597
,96,08
Nc
13.13.1?12.12.
11. 11. 11. 11. 11. 11.
13.
13.
81
RR
50 58 35 60 11 16
81 R7
16
Dec
12.6012.0512.0911.90
11.22 11.21 11.00 11.28 11.13 13.68
12.32 12.11
e Estimated.
Washington County
100220080121701. Local number Ws-1. Ployd King. Amity. Dug domestic water-table well in limestone of Washington Formation, Permian age, diam 10 in (102 cm), depth 36 ft (11 m), cased with stone to 1 ft (1 m). Lsd 1,190 ft (363 m) above msl. MP top of brass plate under trap door, 0.70 ft {0.21 m) above Isd. Highest water level 1.87 ft (1.18 m) below Isd, Apr. 28, 1973; lowest dry, July 17, 1965. Records available: 1936-71.
Water n Water n Water t Water level Date level Date level Date level
Jan. 6, 1973 12.81 July 11, 1973 22.85 Jan. 5, 1971 13.87 July 6, 1971 9-8113 12.85 21 22.89 12 12.85 13 9.8320 12.90 28 23.8! 18 9.81 20 9.8527 13.81 Aug. 1 23.85 26 8.85 27 11.81
Feb. 3 12.87 11 29.81 Feb. 2 9.85 Aug. 3 11.9010 12.90 18 28.87 9 9.89 10 12.8117 10.81 25 28.89 16 9.87 17 12.8321 13.87 Sept. 1 28.81 23 10.81 21 20.81
Mar. 3 13.86 8 28.85 Mar. 2 10.89 31 11.9010 8.8l 15 29.85 9 11.83 Sept. 7 12.8117 8.81 22 29.87 16 12.81 11 11.8921 8.87 29 29.89 23 12.85 16 11.9030 11.82 Oct. 7 27.81 30 10.81 28 9.89
Apr. 7 10.89 13 27.83 Apr. 6 9.87 Oct. 5 10.8111 10.81 20 28.81 13 9.89 12 10.8521 10.81 27 28.85 20 10.81 18 10.83
1.87 Nov. 3 27.81 27 11.81 26 10.89May 5 1.89 10 27.87 May 1 11.83 Nov. 2 16.89
8.8l 17 28.81 11 11.81 9 16.858.83 21 26.81 18 9-83 16 17-878.85 Dec. 1 25.85 25 9-87 20 18.81
12.88 8 25.87 June 1 10.81 30 18.859 13.81 15 25.83 8 10.85 Dec. 7 19.81
16 13.83 22 21.81 15 10,89 11 7.8l23 16.81 27 13.80 22 10.81 21 8.8l30 16.85 29 13.81 29 8.86 28 9.83 7 17-81

GROUND-WATER LEVELS, 1973-71), NORTHEASTERN STATES
1)00233080261301. Local number Ws-155. U.S. Geol. Survey. Near Good Intent. Drilled observs ion artesian well In Washington Formation, Permian age, diam 6 in (15 cm), depth 160 ft (1)9 m), ased to 19 ft (6 m). Lsd 1,110 ft (338 m) above msl. MP top of casing, 2.00 ft (0.61 m) above sd. Highest water level 32.51 ft (9-91 m) below Isd. Jan. 15, 1971); lowest 39.01 ft (11.89 m) elow Isd, July 11, 1971. Records available: 1971-711.
Lowest water level for the day, from recorder graph, 1971
Day
5 10 15 20 25
5 10 15 20 25
10
Jan
36i29 36.32
31.95 35.31 35.67 35.69 35.1131.80
Peb
36.17 36.38 31.80 35.27 35.21 35.09
31.08 31.89 31.98 35.37
35.73
31.78
31.96
Mar
31.62 31.91 31.01 31.72 35.11 35.72
iiisS 31.17 33.68 31.18
31.3133.8831.65
Apr
35.88 35.11 31.28 31.61 35.30 35.90
31.67 33.76 31.19 35.13
31.65
May
36.21 36.38 36.20 36.30 36.10 36.50
31.63 31.17 31.89 35.26 35.18
31.58
Jun
1972
37.10 37.00 36.90 36.81 33.76 35.20
1973
35.18 35-52 35.72 35.21
35.71
1971
31-36
Jul
38.83
35-77 35.72 35.91 35.11 35.81 36.27
35.81 35.87 35.73 35.90
Aug
36.10 36.16 36.66 36.50 36.50 36.60
35.20 35.10 35.50 35.10
35.11
Sep
36.50 36.70 36.70 36.73 36.82 36.25
35^91
Oct
37.57
37.81
36.36 36.22 36.2236.26
35.89 35.88 35.92 36.02
35.68
Nov
ssiii35-15 31.88 31.15
35-71 35-92 35-71 35-58 35.1631.63
Dec
31.87 33.27 31.03 31.15 31.18 35.22
31.91 35.03 31.15
Wayne County
111333075153201. Local number Wn-61. U.S. Geol. Survey. State Game Land No. 159. Drilled observation artesian well in sand and gravel of glacial outwash, Quaternary age, diam 6 in (15 cm), depth 52 ft (16 m), cased to 52 ft (16 m). Lsd 1,330 ft (105 m) above msl. MP top of plywood cover, 2.57 ft (0.78 m) above Isd. Highest water level 7.88 ft (2.10 m) below Isd, Nov. 17, 1972; lowest 31.95 ft (9.71 m) below Isd, Nov. 5, 1970. Records available: 1967-71.
Lowest water level for the day, from recorder graph, 1973
Day
510 15 20 25 Eom
Jan
25.10 26.30 27.50 28.15
h27.59 27.58
Feb
27.10 27.00 27.10 28.17 28.66 28.90
Mar
28.95 27.80 26.93 26.60 26.61 26.11
Apr
21.98 21.70 25.17 25-91 26.26 26.31
May
26.00 26.10 21.58 23.10 23.61 23.61
Jun
21.00 22.10 21.92 26.69 27.56 26.51
Jul
25.5226.60 27.70 28.35 28.80 28.88
Aug
28.10 28.23 28.36 27.08 27.20 28.11
Sep
28.68 29.18 29.56 29.80 29.82 29.80
Oct
29.80 29.82 29.80 29.90 29.98 29.90
Nov
29.13 28.80 28.77 28.19
Dec
26.69 25.50 25.17 25.95 25.10 21.82
1971
5 10 15 20 25 Eom
25.37 26.15 26.50 26.78 25.95 21.61
25.01 25.70 26.62 27.20 26.52 26.19
25-92 21.76 25.10 25.05 21.51 25.02
23.85 23.95 23.18 23.81 21.67 25-50
25.18 21.50 23.00 21.02 25.70 27.18
26.67 26.99 27.86 28.53 28.87 29.10
29.12 29.25 29-50 29-77 29-97 29.92
30.00 30.05 30.18 30.29 30.10 30.50
30.09
29.59 29.20
28.16 28.21 28.12 28.17 27.99 28.18
28.23 27.68 26.53 25.98 25.90 26.36
26.50 25.61 25.60 25.81 26.21 26.10
h Tape measurement.
Westmoreland County
102138079031801. Local number We-300. U.S. Geol. Survey. State Game Land No. 12. Drilled observation artesian well in shale of Conemaugh Formation, Pennsylvanian age, diam 6 in (15 cm), depth 110 ft (31 m), cased to 22 ft (7 m). Lsd 1,270 ft (387 m) above msl. MP top of plywood cover, 3.05 ft (0.93 m) above Isd. Highest water level 15.51 ft (1.71 m) below Isd, Apr. 22, 1972; lowest 29.22 ft (8.91 m) below Isd, July 3, 1968. Records available: 1968-71.
Lowest water level for the day, from recorder graph, 1973
Day
510
Jan Ft
18.31 18.66
>b Mar Af
17-90 16.88
>r May J\.
15.79 16.06
16.11
in Jul Aug
19-09 19.13
Sep Oct
19.58 19-18 19-67 19.7
Nov Dec
..... 16.96
..... 16.99
..... 16.98
17.69 17.01

PENNSYLVANIA, YORK COUNTY
402138079031801 Continued.
1974
Day
510152025Horn
Jan
16.9317.0316.6316.8116.7616.59
Feb
16.9016.6717.1717.3516.9817.11
400317076452001.used(149Isd.beloi
artesianm), caslnHighest
1 Isd, Nov
well ing Inforwater 1. 3, 4,
Mar
16.2516.3115-9915.8816.2116.07
Local nuroshale of
matlon noevel 20.01963. R
Apr
15.8416.0515.5716.0316.1616.01
ber YNew
t ava8 ft
May
16.3416.5916.4316.5716.4116.56
0-180.Oxford Fliable.(6.12 m)
ecords avalla
Lowest water 1
Day
25
Jan
24.24
Feb
24.02
Mar
24.60
Apr
21.74
evel for
May
21.46
23.54
Jun
16.5216.9217.7218.2518.3718.36
York Co
New YorkormatlonLsd 360below 1
Jul
17-7817.7618.0118.5519.0019.05
unty
Wire Cloth, Trlasslcft (110 m)
sd, Apr. 30
Aug Sep Oct
18.86 18.18.76 17.18.61 17.18.86 17.19.30 17.19.14 17.
Co. Nearage, dlam 8above msl.
, 1968: lowble: 1962-74. Recording gage
the day
Jun
, from recorder graph,
Jul
25.41
Aug Se
28.30 28.
29 18.2973 18.7367 19.1258 18.9638 18.6078 18.94
Zlons ViewIn (20 cmMP top o
est 37.55removed 0
1973
p Oct
05 28.29
Nov
18.6918.6218.4318.1117-8917.84
Dec
17.7617-39
17.4817-7817.81
. Drilled un-), depthf casing,ft (11.45
490 ftatm)
ctober 1973.
Nov Dec
Jan.Feb.Mar.
Date
22, 19742029
Water level
22.5224.1024.06
Apr.JuneJuly
Date
33?826
Water level
1974 202526
.41
.98
.81
Date
Aug. 23,Sept. 27Oct. 24
Water level
1974 28.1126.7827.65
Nov.Dec.
Date
22, 197420
Water level
27.5025.30

RHODE ISLAND
The observation-well program in Rhode Island was continued during 1973 through 19/1 in coopera tion with the Rhode Island Water Resources Coordinating Board. Figure 13 shows the location of observation wells included in this report.
Well-Numbering System
The first number shown is the new national well-numbering system represented by the latitude and longitude coordinates of the well location, as explained on page 1. Local well numbers, designated by a three-letter abbreviation of a city or town name and serial numbers assigned within each city or town, have been continued in this report for the convenience of local users and for easy refer ence to previously published data.
Well Descriptions and Water-Level Measurements
Water levels are reported in feet below land surface datum, unless otherwise indicated.
414022071332801. Local number Cov til. Robert Card. Powhatan Ave., near Washington. Dug un used water-table well in sand and gravel of Pleistocene age, diam 24 in (61 cm), depth 26 ft (8 m), cased with concrete. Lsd 260 ft (79 m) above msl. MP hole In top of wooden cover, 1.98 ft (0.60 m) above Isd. Highest water level 18.50 ft (5.64 m) below Isd, Dec. 27, 1972; lowest 23.73 ft (7.23 m) below Isd, Jan. 29, 1966. Records available: 1961-74.
Water . Water n ,. Water , Water level Date level Date level Date level
Jan. 27, 1973 19-53 July 29, 1973 21.26 Jan. 26, 197 1) 20.28 July 27, 197!) 21.92Feb. 23 19.49 Aug. 27 21.48 Feb. 23 20.10 Aug. 24 22.31Mar. 24 20.31 Sept.22 21.93 Mar. 23 20.17 Sept.28 22.51)Apr. 24 19.28 Oct. 27 22.21 Apr. 27 19.71 Oct. 26 22.28May 26 19.72 Nov. 24 22.31) May 25 20.79 Nov. 23 22.35June 23 20.60 Dec. 27 20.1)5 June 22 21.52 Dec. 27 21.18
1)139070711)65001. Local number Wgr l8l. E. Lambert. Hazard Rd. , near West Greenwich Center. Dug unused water-table well in sand and gravel of Pleistocene age, diam 30 in (76 cm), depth 19 ft (6 m), lined with stone. Lsd about 380 ft (116 m) above msl. MP edge of shelter floor, 2.19 ft (0.67 m) above Isd. Highest water level 13.36 ft (l).07 m) below Isd, Dec. 29, 1969; lowest 17.68 ft (5.39 m) below Isd, Sept. 28, 1974. Records available: 1969-74.
Jan. 25, 1969 14.86 Aug. 28, 19/0 17.15 Mar. 26, 1972 13.42 Aug. 2/, 1973 16.43Mar. 26 13.45 Oct. 24 17.10 Apr. 22 15.79 Sept.22 16.74Apr. 25 13.84 Nov. 21 15.92 May 27 15.50 Oct. 27 17.05May 24 14.30 Dec. 28 16.01 June 24 14.30 Nov. 23 16.83June 25 16.50 Jan. 23, 1971 16.17 July 22 16.26 Dec. 27 13-92July 28 16.82 Feb. 20 15.47 Aug. 24 16.86 Jan. 26, 1974 14.35Aug. 26 16.72 Mar. 27 15.17 Sept.23 17.01 Feb. 23 15.30Sept.25 16.94 Apr. 24 15.66 Oct. 28 16.79 Mar. 23 14.36Oct. 25 17.00 May 24 15-74 Nov. 25 It.19 Apr. 27 15.77Nov. 22 15.80 June 26 16.62 Dec. 27 14.31 May 25 15-94Dec. 29 13.36 July 24 16.9! Jan. 27, 1973 15.86 June 22 l6.8lJan. 24, 1970 15.88 Aug. 25 17.59 Feb. 23 15.36 July 27 16.98Feb. 21 14.63 Sept.25 17.25 Mar. 24 15.63 Aug. 24 17.29Mar. 27 15.70 Oct. 25 17.51 Apr. 21 15.16 Sept.28 17.68Apr. 25 15.37 Nov. 26 17-22 May 26 15.82 Oct. 26 16.14May 23 16.10 Dec. 27 16.40 June 23 l6.6l Nov. 23 16.68June 27 16.61 Jan. 22, 19/2 15.58 July 29 16.91 Dec. 27 15.45July 25 16.87 Feb. 25 15.01
Providence County
415710071402201. Local number Bur 187. Brothers of the Sacred Heart. Harrisville Rd., near Harrisville. Dug unused water-table well in sand and gravel of Pleistocene age, diam 24 in (61 cm), depth 20 ft (6 m), lined with stone. Lsd 462 ft (141 m) above msl. MP hole in base of shelter, 0.59 ft (0.18 m) above Isd. Highest water level 12.15 ft (3.70 m) below Isd, Apr. 9, 1970; lowest 18.83 ft (5-74 m) below Isd, Nov. 3, 1970. Records available: 1968-74. Continuous recording gage installed Dec. 29, 1967; removed Apr. 21, 1973. Highest and lowest water levels for period of record are from recorder graph.

RHODE ISLAND
Figure 13- Location of observation wells In Rhode Island, 1973-yl).

GROUND-WATER LEVELS, 1973-71, NORTHEASTERN STATES
115710071102201 Continued.
Jan. Feb. Mar.
1968
Apr. 25 May 25 June 25 July 25 Aug. 26 Sept.25 Oct. 26Nov, Dec.
Feb.1969
Mar. Apr. May June 25 July 28 Aug. 26 Sept.29
15.21 11.83 12.85 13.70 11.19 11.31 15-28 16.56 17.50 18.22 18.06 16.H7 16.06 16.11 15.93 13.21 13.65 11.98 16.31 16.75 17.22
Oct.Nov.Dec.Jan.Feb.Mar.Apr.MayJuneJulyAug.Sept.Oct.Nov.Dec.Jan.Feb.Mar.Apr.MayJune
Date
25, 1969222921, 197021272523272528.2121212823, 19712027212126
Water level
17.2916.1111.3911.2912.6113.7112.8813-8611.8615-9917.3718.1718.7718.5217-5517-1716.8111.2011.0013.7915.11
July 21, 1971 Aug. 25 Sept.25
252627Dec
Jan, Feb,
22, 197225262227
Mar. Apr. MayJune 21 July 22 Aug. 21 Sept.23 Oct. 28 Nov. 25 Dec. 27 Jan. 27, 1973 Feb. 23
Water level
16.3817.1018.0818.1018.0116.1615.5715.2812.9113.5212.9812.8313.9815.2716.1515.8113.9612.1813.0113.10
Mar. 21 Apr. 21 July 30 Aug. 27 Sept.22 Oct. 27 NovDec
Feb. Mar.
1973
1971
Apr May June 22 July 27 Aug. 21 Sept.28 Oct. 26 Nov. 23 Dec. 27
Water level
13.69 13.30 15.51 16-53 17.06 17-56 16.91 11.89 13.71 13.11 13.13 12.12 12.91 11.00 15-61 17-15 17.51 16.00 16.07 15.00
115626071251601. Local number Cum 265. Matthew J. Partridge. 27 Scott Rd., near Ashton. Dug unused water-table well in sand and gravel of Pleistocene age, diam 21 in (61 cm), depth 20 ft (6 m), lined with stone. Lsd about 130 ft (10 m) above msl. MP hole in wooden cover, 0.06 ft (0.02 m) above Isd. Highest water level 9.60 ft (2.93 m) below Isd, Mar. 26, 1969; lowest 17.20 ft (5-21 m) below Isd, Sept. 29, 1919. Records available: 1916-71.
Feb. Mar. Apr. May
1973 12.1611.9011.9711.5811.8112.91
July 30, 1973 Aug. 27 Sept.22 Oct. 27 Nov. 23 Dec. 27
12.97 13.81 13.91 11.19 12-72 10.11
Jan. 26, 1971Feb. 23Mar. 23Apr. 27May 25June 22
11.0811.5311.0111.8212.3913.57
July 27, 1971 Aug. 21 Sept.28 Oct. 26 Nov. 23 Dec. 27
15.15 15-96 13-37 12.12 12.16 10.98
115137071212201. Local number Lin 81. Maplehurst Farm, Inc. Between Blackstone River and Front St., Lonsdale. Drilled unused water-table well in sand and gravel of Pleistocene age, diam 8 in (20 cm), depth 107 ft (33 m), cased to 107 ft(33 ra),open bottom. Lsd about 60 ft (18 m) abov msl. MP inside lower lip of 8-in (20-cm) pipe, 3.32 ft (1.01 m) above Isd. Highest water level 0.02 ft (0.01 m) above Isd, Mar. 26, 1969; lowest 7.30 ft (2.23 m) below Isd, Aug. 21, 1966. Records available: 1916-74.
Jan. 27, 1973Feb. 23Mar. 21Apr. 2HMay 26June 23
1.271.915-155-011.635-25
July 30, 1973 Aug. 27 Sept.22 Oct. 27 Nov. 23 Dec. 27
5.10 5.17 5.13 5-73 5.86 2.65
Jan. 26, 1971Feb. 23Mar. 23Apr. 27May 25June 22
3.332.211.173.561.555.21
July 27, 1971 Aug. 21 Sept.28 Oct. 26 Nov. 23 Dec. 27
6.15 6.53 6.72 5-36 5-21 1-73
115918071325001. Local number Nsm 21. Thomas E. Esty. State Highway 116, near Branch Village. Dug domestic water-table well In sand and gravel of Pleistocene age, diam 21 in (6l cm), depth 16 ft (5 m), cased with tile, open bottom. Lsd 238.68 ft (72.75 m) above msl. MP hole in wooden cover at top of tile casing, 2.08 ft (0.63 m) below Isd. Highest water level 3.67 ft (1.12 m) below Isd, Mar. 26, 1969; lowest 11.71 ft (3.57 m) below Isd, Oct. 28, 1957- Records available: 191)7-711. Water levels affected by pumping.
Jan. 27, 1973Feb. 23Mar. 21Apr. 21May 26June 23
6.936.666.866.256.907.17
July 30, 1973 Aug. 27 Sept.22 Oct. 27 Nov. 23 Dec. 27
9.007.11
Jan. Feb.
Apr. May
1971 5.93 5-98 1.89 6.26 6.60 8.29
July 27, 1971 Aug. 21 Sept.28 Oct. 26 Nov. 23 Dec. 27
9.28 9-89
10.18 7.68 7.67 6.99
115318071220101. Local number Paw 136. Greenhalgh Mills, Inc. 311 Woodbine St., Pawtucket. Drilled unused water-table well in gravel of Pleistocene age, diam 2 in (5.1 cm), depth 13 ft (13 m), cased to 10 ft (12 m), screened about 10-13 ft (12-13 m). Lsd about 86 ft (26 m) above msl. MP top of casing, 3.15 ft (0.96 m) above Isd. Highest water level 2.32 ft (0.71 m) below Isd, Dec. 27, 1972; lowest 7.28 ft (2.22 m) below Isd, Jan. 29, 1966. Records available: 1962-71.
Jan. 27, 1973Feb. 23Mar. 21Apr. 21May 26June 23
2.712.713.393.003-303.61
July 30, 1973 Sept.22 Oct. 27 Nov. 23 Dec. 27 Jan. 26, 1971
1-53 3.71 1.17 1.70 3.6i! 3.10
Feb. 23, Mar. 23 Apr. 27 May 25 June 22 July 27
1971 3.10 3.29 3.22 3-69 1.19 1.81
Aug. 21, 1971Sept. 28Oct. 26Nov. 23Dec. 27
6.116.625.075.361-91
111716071255601. Local number Pro 18. Gorham Manufacturing Co. 333 Adelaide Ave., Providence. Drilled unused artesian well in sand and gravel of Pleistocene age, diaro 8 in (20 cm), depth 121 ft (38 m), cased to 116 ft (35 m), screened 116-121 ft (35-38 m). Lsd 15.79 ft (13-96 m) above msl. MP top edge of hole in center of steel cover, 0.18 ft (0.15 m) below Isd. Highest water level 5.08 ft (1.55 m) below Isd, Apr. 20, May 1, 1953; lowest 10.22 ft (3.12 m) below Isd, Oct. 20, 1917. Records available: 1911-71. Water levels affected by pumping.
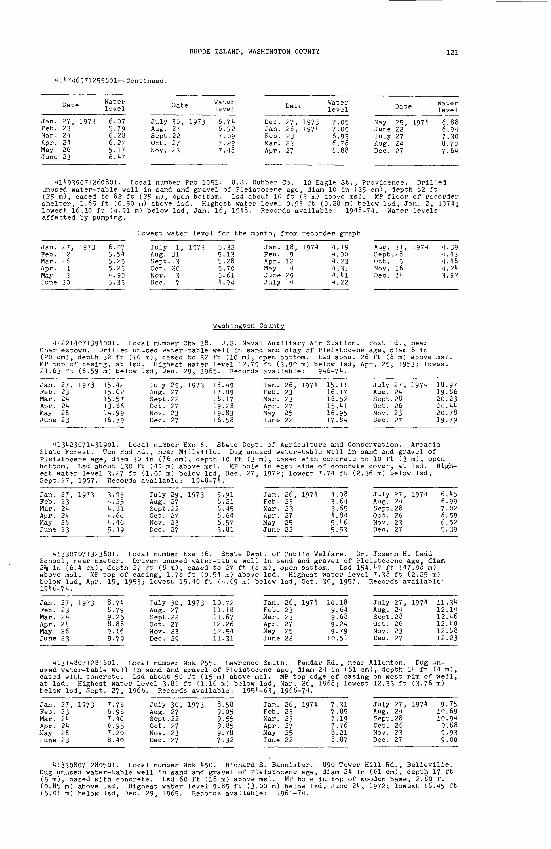
RHODE ISLAND, WASHINGTON COUNTY
411)71)6071255601 Continued.
Date
Jan. 27, 1973 Feb. 23 Mar. 24 Apr. 24 May 26 June 23
vel
6.075.796.286.275.176.47
Date
July 30, 1973 Aug. 27 Sept.22 Oct. 27 Nov. 23
Water level
6.74 6.92 7.09 7.29 7.1)8
Dec. 27, 1973Jan. 26, 1974Feb. 23Mar. 23Apr. 27
Water level
7.057.056.936.786.88
May 25, 1974 June 22 July 27
6.947.308.707.64
414939071260801. Local ro 1051. U.S. Rubbe 10 Eagle St., Providence. Drilledunused water table well In sand and gravel of Pleistocene age, diam 10 In (25 cm), depth 82 ft (25 m), cased to 82 ft (25 m), open bottom. Lsd about 10 ft (3 m) above msl. MP floor of recorder shelter, 1.65 ft (0.50 m) above Isd. Highest water level 0.93 ft (0.28 m) below Isd, Jan. 2, 1974; lowest 16.10 ft (4.91 m) below Isd, Jan. 16, 1948. Records available: 1948-74. Water levels affected by pumping.
Mar. Apr. May
27, 19732
1513
6. 07 5-54 5-25 5.25 4.90 5.33
Lowest water level for the month, fr recorder graph
July 1, 1973 Aug. 31 Sept.13 Oct. 20 Nov. 3 Dec. 7
5-32 5.13 5.28 5.70 5.61
18, 1974 4.194.00
Apr. 12May 4June 29July 4
4.234.334.414.22
Aug. 31, 1971Sept.28Oct. 5Nov. 16 4Dec. 14 3
4.394.434.464.24
92
Washington County
412214071394001. Local number Cha 18. U.S. Naval Auxiliary Air Station. Post Rd., near Charlestown. Drilled unused water-table well in sand and clay of Pleistocene age, diam 8 in (20 cm), depth 32 ft (10 m), cased to 32 ft (10 m), open bottom. Lsd about 26 ft (8 m) above msl. MP top of casing, at Isd. Highest water level 12.79 ft (3.90 m) below Isd, Apr. 25, 1953; lowest 21.63 ft (6.59 m) below Isd, Dec. 29, 1965. Records available: 1946-74.
Jan.Feb.Mar.Apr.MayJune
27, 19732324242623
15.4215.0215.5713.8614.9916.39
July 29, 1973 Aug. 27 Sept.22 Oct. 27 Nov. 23 Dec. 27
16.49 17-09 18.17 19.28 19-83 16.58
Jan. 26, 1974Feb. 23Mar. 23Apr. 27May 25June 22
15.1116.171S.5215. 'tl16.9517.84
July 27, 1971 Aug. 24 Sept.28 Oct. 26 Nov. 23 Dec. 27
18.9719.8620.2320.4420.7819.79
413423071431901. Local number Exe 6. State Dept. of Agriculture and Conservation. Arcadia State Forest. Ten Rod Rd., near Millville. Dug unused water-table well in sand and gravel of Pleistocene age, diam 30 in (76 cm), depth 10 ft (3 m), cased with concrete to 10 ft (3 m), open bottom. Lsd about 130 ft (40 m) above msl. MP hole in east side of concrete cover, at Isd. High est water level 3.27 ft (1.00 m) below Isd, Dec. 27, 1972; lowest 7-71 ft (2.36 m) below Isd, Sept.27, 1957. Records available: 1948-74.
Jan. 27, 1973Feb. 23Mar. 24Apr. 24May 26June 23
3.934.254.814.604.465.49
July 29, 1973 Aug. 27 Sept.22 Oct. 27 Nov. 23 Dec. 27
5-91 6.21 6.45 6.64 6.57 3.81
Jan. 26, 1971Feb. 23Mar. 23Apr. 27May 25June 22
4.083.643.654.845.465.53
July 27, 197t Aug. 24 Sept.28 Oct. 26 Nov. 23 Dec. 27
6.456.997.026.596.525.39
113307071323601. Local number Exe 16. State Dept. of Public Welfare. Dr. Joseph H. Ladd School, near Exeter. Driven unused water-table well in sand and gravel of Pleistocene age, diam 25j in (6.4 cm), depth 27 ft (8 m) . cased to 27 ft (8 m) , open bottom. Lsd 154.47 ft (47.08 m) above msl. MP top of casing, 1.78 ft (0.54 m) above Isd. Highest water level 7-38 ft (2.25 m) below Isd, Apr. 15, 1953; lowest 15.10 ft (1.69 m) below Isd, Oct. 30, 1957. Records available: 1916-71.
Jan. 27, Feb. 23 Mar. 21 Apr. 24 May 26 June 23
1973 8.74 8.79 9.25 8.88 9.16 9-79
July 30, 1973 Aug. 27 Sept.22 Oct. 27 Nov. 23 Dec. 29
10.7211.1811.6712.2612.5411.31
Jan. 26, 197t 10.18Feb. 23Mar. 23Apr. 27May 25June 22
9.649.689.249.79
10.51
July 27, 1971 Aug. 24 Sept.28 Oct. 26 Nov. 23 Dec. 27
11.3112.1412.4612.4012.6812.23
413148071281601. Local number Nok 255. Lawrence Smith. Pendar Rd., near Allenton. Dug un used water-table well In sand and gravel of Pleistocene age, dlam 24 In (61 cm), depth 14 ft (4 m), cased with concrete. Lsd about 50 ft (15 m) above msl. MP top edge of casing on west rim of well, at Isd. Highest water level 3.8l ft (1.16 m) below Isd, Mar. 26, 1968; lowest 12.33 ft (3-76 m) below Isd, Sept. 27, 1966. Records available: 1951-63, 1966-71.
Jan. 27, 1973 Feb. 23 Mar. 24 Apr. 24 May 26 June 23
7.786.987.406.957.208.40
July 30, 1973 Aug. 27 Sept.22 Oct. 27 Nov. 23 Dec. 27
9.05 9-55 9.85 9.78 7.32
Jan.Feb.Mar.Apr.May
26, 197423232725
7-317.857.197.768.21
July 27, 1971 Aug. 21 Sept.28 Oct. 26 Nov. 23 Dec. 27
9.7510.6910.9t9.689-939.00
413308071280501. Local number Nok 150. Richard S. Bannister. 890 Tower Hill Rd., Belleville. Dug unused water-table well in sand and gravel of Pleistocene age, diam 21 in (61 cm), depth 17 ft (5 m), cased with concrete. Lsd 60 ft (18 m) above msl. MP hole in top of wooden base, 2.80 ft (0.85 m) above Isd. Highest water level 9.85 ft (3.00 m) below Isd, June 24, 1972; lowest 16.45 ft (5.01 m) below Isd, Dec. 29, 1965. Records available: 1961-7 1).

GROUND-WATER LEVELS, 1973-71, NORTHEASTERN STATES
113308071280501 Continued.
Jan. Feb. Mar. Apr. May
level
27, 1973 11.3123 10.7521 11.3521 10.7726 11.1523 12.14
July 30, 1973 Aug. 27 Sept.22 Oct. 27 Nov. 23 Dec. 27
level
13-32 13.78 11.11 11.95 15.08 13-79
Jan. Feb. Mar. Apr. May
Date
26, 197123232725
Water level
12.3011.9111.8711.7712.6813.30
Date Water level
July 27, 1971 11.37Aug. 21 11). 99Sept.28 15.1)7Oct. 26 15.05Nov. 23 15.21Dec. 27 14.57
Jan. 27, 1973 Feb. 23 Mar. 21 Apr. 21 May 26 June 23
22.21.7222.0821.3221.7121.97
July 29 Aug. 27 Sept.22 Oct. 27 Nov. 23 Dec. 27
23.00 23.73 21.1)0 25.29 25.88 25.61
Jan. Feb.
Apr May June 22
26, 197123232725
21.31 23.19 23.69 23.01 23.33 2lf.01
July 27, 1971 Aug. 21 Sept.28 Oct. 26 Nov. 23 Dec. 27
21.96 2-5.71 26.56 27.02 27.51 27.61
1)12918071321001. Local number Sok 6. University of Rhode Island. Thirty Acre Rd. , Kingston. Drilled unused water-table well in sand and gravel of Pleistocene age, diam 10 in (25 cm), depth 31 ft (10 m), cased to 31 ft (10 m), open bottom. Lsd 111.89 ft (31.10 m) above msl. MP floor of recorder shelter, 0.57 ft (0.17 m) above Isd (since July 12, 1973). Highest water level 7-92 ft (2.11 m) below Isd, Apr. 12, 13, 1958; lowest 15.06 ft (1.59 m) below Isd, Dec. 29, 1965. Records available: 1917, 1955-71. Recording gage installed July 12, 1973.
Jan. 27, 1973Feb. 23Mar. 21Apr. 21May 26June 23
10.1*110.2610.699-98
10.5711.51
July 30, 1973 Aug. 27 Sept.22 Oct. 27 Nov. 23 Dec. 27
12.1912.7013.2713.8111.0612.50
Jan. 26, 1971Feb. 23Mar. 23Apr. 27May 25June 22
11.1811.3811.3711.3012.0812.71
July 27, 1971 Aug. 21 Sept.28 Oct. 26 Nov. 23 Dec. 27
13.13 11.01 11.30 11.13 11.63 13-93
112923071361601. Local number Sok 515. R- R. Holley. Laurel Lane Golf Course, near West Kingston. Dug unused water-table well in sand and gravel of Pleistocene age, diam 36 in (91 cm), depth 30 ft (9 m), lined with stone. Lsd 127.81) ft (38.97 m) above msl. MP top edge of concrete casing on south rim of well, 2.03 ft (0.62 m) above Isd. Highest water level 21.38 ft (7.1)3 m) below Isd, Apr. 18, 1958, Mar. 26, 1968; lowest 30.11 ft (9.18 m) below Isd, Oct. 25, 1969. Records available: 1955-71-
Jan. 27, 1973Feb. 23Mar. 21Apr. 21May 26June 23
25.7025.5926.0925.3725.8026.38
112151071162901.water-table welined with sto(0.28 m) aboveft (1.39 m) be
Jan. 25, 1969Feb. 27Mar. 26Apr. 25May 21June 25July 28Aug. 26Sept. 25Oct. 25Nov. 22Dec. 29Jan. 21, 1970Feb. 21Mar. 27Apr. 25Aug. 28Sept. 21
11 in sne. LsIsd.
low Isd
12.5012.1111.6811.1112.2513-0913.7113.8311.0013-8112.6510.1)011.8111.D911.1811.0813-7913.71
JulyAug.Sept.Oct.Nov.Dec.
30, 19732722272327
27.27.28.28.28.27-
Local number Wes 522.and and grd about 15Highest wa, Aug. 25,
Oct.Nov.Dec.Jan.Feb.Mar.Apr.MayJuneJulyAug.Sept.Oct.Nov.Dec.Jan.Feb.
avel of PIft (11 m)
ter level1971. Re
21), 1970212823, 1971202721)212621252525262722, 197225
eisab
10.cor
13.11.11.11.12.11.11.11.12.13.li).li).11.13.12.11.11.
397127717610
s.tooove31ds
5270199108118976721839211167189856
Jan.Feb.Mar.Apr.MayJune
Panciera.ene age, dimsl. MP s
ft (3.15 m)available :
Mar.Apr.MayJuneJulyAug.Sept.Oct.Nov.Dec.Jan.Feb.Mar.Apr.MayJuneJuly
26, 19712323272522
Pound Rdam 30 inouthwestbelow 11969-71
26, 1972222721)22212328252727, 1973232121262329
25.8726.2326.1)726.1227.0727.71
. , near(76 cm)corner
sd, Dec.
10.6311.2211.3610.1311.7312.7312.9312.8511.3110.31)11.3111.2211.5611.0811.3812.3311.93
JulyAug.Sept.Oct.Nov.Dec.
27,2128262327
Dunn Corner., depth 16of stone c27, 1972;
Aug.Sept.Oct.Nov.Dec.Jan.Feb.Mar.Apr.MayJuneJulyAug.Sept.Oct.Nov.Dec.
ftasinlow
27,2227232726,2323272522272128262327
1971 28.5129.2629.3229.0529.1128.18
Dug unused(5 m),g, 0.91 ftest 11.39
1973 12.1913.0913.3113.1211.31
1971 10.7511.0911.0911.6312.2012.5913.3611.0313.8113.5813.6012.36

The observation-well program in Vermont was continued during the 1973 through 197!) period in co operation with the Vermont Department of Water Resources. Figure It shows the location of the ob servation wells included in this report.
Well-Numbering System
The first number shown is the new national well-numbering system represented by the latitude and longitude coordinates of the well location, as explained on page 1. Local well numbers, designated by town or city name and serial numbers assigned within each city or town, have been continued in this report for the convenience of local users and for easy reference to previously published data.
Well Descriptions and Water-Level Measurements
Water levels are reported in feet below land surface datum, unless otherwise indicated.
Bennington County
1)218100731601)01. Local number Pownal 1. Robert Rudd, Sr. At North Pownal. Dug unused water- table well in sand and gravel, diam 21 in (61 cm), depth 18 ft (5 m), cased with stone. Lsd about 515 ft (157 m) above msl. HP top of 3/1-in (1.9-cm) diam hole drilled in center of 3/8-in (0.37-em) thick steel cover, at Isd. Highest water level 10.88 ft (3.32 m) below Isd, Apr. 9, 1970; lowest 16.59 ft (5-06 m) below Isd, Oct. 19, 1961. Records available: 1961)-7l).
Water Water Water D Water level uate level ate level uate level
Jan. 7, 1973 12.03 July 29, 1973 13.70 Jan. 25, 1971 12.67 Aug. 6, 197!) 11.0425 12.91 Aug. 21 Il).l6 Feb. 23 12.62 11) 11.17
Feb. 25 13.20 Sept.18 11. 92 Mar. 15 13.20 21) 11.21Mar. 23 12.02 26 15.08 23 12.11 Sept.10 11.73Apr. 22 13.07 Oct. 27 15-85 Apr. 26 12.58 21 13.67May 13 13.51 Nov. 2D 15.08 May 2D 12.91 Oct. 21 13.92
23 13.38 Dec. 15 13-57 June 22 13.50 Nov. 27 13.51June 21) 13-70 22 13.28 July 29 11.00 Dec. 15 13.27July 15 13.55
Chittenden County
113616073121901. Local number Milton 3. U.S. Geol. Survey. At Sandbar Waterfowl Development Area, near Milton. Driven observation water-table well in glacial sand and gravel of Pleistocene age, diam 156 in (3-2 cm), depth 10 ft (12 m), well point 38-10 ft (11.6-12.2 m). Lsd about 160 ft (19 m) above msl. HP top of casing, 1.00 ft (1.22 m) above Isd. Highest water level 21.97 ft (6.70 m) below Isd, May 29, 1971; lowest 37.82 ft (11.53 m) below Isd, Feb. 26, 1965. Records available: 1956-71.
Jan. 26, 1973 33.16 July 27, 1973 22.50 Jan. 28, 1971 26.66 July 26, 1971 23.65Feb. 26 31.23 Aug. 21 21.09 Feb. 25 26.37 Aug. 26 25.15Mar. 26 28.58 Sept.21 25.91 Mar. 25 27.05 Sept.26 27.38Apr. 26 25-15 Oct. 26 27.62 Apr. 25 25.02 Oct. 29 29.23May 29 21.65 Nov. 27 29-13 May 29 21.97 Nov. 25 30.61June 26 22.62 Dec. 20 29.79 June 21 22.05 Dec. 26 31.95
Essex County
111731071511701. Local number Brighton 1. U.S. Geol. Survey. Island Pond. At Brighton State Park Beach, south of the road and Just west of the parking lot. Augered observation water-table well in medium and coarse sand, diam 1% in (3.2 cm), depth 35 ft (11 m), well point 33-35 ft (10-11 m). Lsd about I,l8o ft (360 m) above msl. MP top of casing, 1.00 ft (1,22 m) above Isd. Highest water level 1.91 ft (0.59 m) below Isd, Apr. 25, 1971; lowest 1.8o ft (1.16 m) below Isd, July 27, 1970. Records available: 1966-71.
Jan. 26, 1973 3-39 July 27, 1973 3.85 Feb. 25, 1971 3.63 Aug. 26, 1971 1.50Feb. 26 3.91 Aug. 21 1.27 Mar. 25 3.68 Sept.22 1.37Mar. 26 3-03 Sept.21 3.81 Apr. 25 1.91 Oct. 26 1.35Apr. 26 2.86 Oct. 26 3.96 May 29 '2.69 Nov. 22 3.50May 29 3.11 Nov. 27 3.55 June 21 3.80 Dec. 20 3.20June 26 2.87 Jan. 28, 1971 3.59 July 26 1.07

GROUND-WATER LEVELS, 1973-7'!, NORTHEASTERN STATES
Figure 14. Location of observation wells in Vermont, 1973-71.

VERMONT, ORLEANS COUNTY
Franklin County
445603072422901. Local number Berkshire 1. U.S. Geol. Survey. On Rte. 118 R.O.W., southeast end of bridge over Misslsquoi River, East Berkshire. Augered observation water-table well in fine sand and grlvel, diam i* in (3.2 cm), depth 51 ft (16 m), well point 4 9-51 ft (15-16 m). Lsd about 425 ft (130 m) above msl. MP top of casing, 4.00 ft (1.22 m above Isd Highest water level 10 15 ft (3.09 m) below Isd, Apr. 25, 1974; lowest 15-98 ft (4.87 m) below Isd, Sept. 25, 1968.Records available: 1966-74.
_ Water _,. Water D t Wate Date level Date level ate lev*
26, 1973 11.06 July 27, 1973 15.25 Jan. 28, 1974 12.22 July 26, 1974 14.6826 13 64 Augt 24 15.83 Feb. 25 12.94 Aug. 26 15.49
Mar: 26 12.73 Sept.24 13-80 Mar. 2 5 13.63 Sept.26 14.94mar. <;o .L^.IJ aci>\..c.i j._>.-« .. -. -^ -_ - .
Apr-^ ll-ll IS: IS 15:8! ^11 ii:» : \\ il:!5o26 13.61 Dec. 20 12.61 June 24 14.63
Lamoille County
413405072322501. Local number Morristown 1. U.S. Geol. Survey. Vermont Hwy. Dept. of Rte. 15, approximately 3 mi (5 km) east of Morrisville. Augered observation water-table well in silty-fine to medium sand, diam 1^ in (3.2 cm), depth 50 ft (15 m), well point 48-50 ft (14.6-15.2 m). Lsd approximately 660 ft (201 m) above msl. MP top of casing, approximately 4.00 ft (1.22 m) above Isd. Highest water level 16.26 ft (4.96 m) below Isd, Apr. 24, 1969; lowest 20.33 ft (6.20 m) below Isd, Sept. 25, 1968. Records available: 1966-74. ___
Jan. 26, 1973 17.92 July 27, 1973 18.11 Jan. 28, 1974 17.71 July 26, 1974 19.06Feb. 26 18.78 Aug. 24 19.10 Feb. 25 18.13 Aug. 26 19.58Mar. 26 17-47 Sept.24 18.72 Mar. 25 18.45 Sept.26 19.80Apr. 26 17.47 Oct. 26 19.17 Apr. 25 16.85 Oct. 29 19-87May 29 17.16 Nov. 27 18.85 May 29 16.85 Nov. 25 18.92June 26 17.25 Dec. 20 17.64 June 24 18.26 Dec. 26 19.19
Orange County
435343072151801. Local number West Fairlee 1. U.S. Geol. Survey. At Vermont Hwy. Dept. garage, 60 ft (18 m) west of salt shed, approximately 1.3 mi (2.1 km) south-southeast of West Fairlee Village. Augered observation water-table well in sand, diam 1^ in (3.2 cm), depth 54 ft (16 m), well point 52-54 ft (15-9-16.5 m). Lsd approximately 700 ft (213 m) above msl. MP top of casing, approximately 2.00 ft (0.6l m) above Isd. Highest water level 0.88 ft (0.27 m) below Isd, Apr. 24, 1969; lowest 5.43 ft (1.66 m) below Isd, Nov. 18, 1970. Records available: 1966-74.
Jan. 26, 1973 2.65 July 26, 1973 2.79 Jan. 28, 1974 2.70 July 25, 1974 4.22Feb. 26 3.11 Aug. 27 4.09 Feb. 26 2.16 Aug. 25 4.8lMar. 26 1.27 Sept.24 4.53 Mar. 25 1.98 Sept.25 4.36Apr. 26 2.20 Oct. 26 4.8l Apr. 25 1.33 Oct. 28 4.34May 29 2.08 Nov. 27 4.50 May 28 2.21 Nov. 22 3.91June 25 2.92 Dec. 20 3.87 June 24 3.24 Dec. 26 3.98
Orleans County
443952072114001. Local number Glover 1. U.S. Geol. Survey. Vermont Hwy. Dept. salt shed of Rte. 16, south of Glover Village. Augered observation water-table well in sand and gravel, diam l\ in (3.2 cm), depth 82 ft (25 m), sand point 80-82 ft (24-25 m). Lsd approximately 1,200 ft (366 m) above msl. MP top of casing, approximately 4.00 ft (1.22 m) above Isd. Highest water level 12.11 ft (3.69 m) below Isd, May 23, 1969; lowest 18.95 ft (5.78 m) below Isd, Mar. 28, 1967. Records available: 1966-74.
Jan. 26, 1973 16.85 July 27, 1973 14.26 Jan. 28, 1974 15.54 July 26, 1974 15.15Feb. 26 16.95 Aug. 24 15.39 Feb. 25 15.74 Aug. 26 16.02Mar. 26 15.77 Sept.24 15.53 Mar. 25 16.05 Sept.26 16.45Apr. 26 13.77 Oct. 26 15.94 Apr. 25 13.47 Oct. 29 17.15May 29 13.17 Nov. 27 16.22 May 29 12.72 Nov. 25 17.12June 26 13.32 Dec. 20 15.87 June 24 14.49 Dec. 26 16.97
445057072155201 (revised). Local number Irasburg 1. Normand Beaulieu. Near Irasburg. Dug un used water-table well in glacial till of Pleistocene age, dlam 30 in (76 cm), depth 15 ft (5 m), lined with stone. Lsd about 910 ft (277 m) above msl. MP top edge of notch chiseled in top of concrete well curb, on east side, 0.50 ft (0.15 m) above Isd. Highest water level 0.79 ft (0.24 m) below Isd, May 1, 1971; lowest 13.4 ft (4.1 m) below Isd, Nov. 12, 1964. Records available: 1964-74.
Jan. 26, 1973 3.45 July 27, 1973 7.35 Jan. 28, 1974 5.20 July 26, 1974 5.57Feb. 26 7.35 Aug. 27 7.72 Feb. 25 8.45 Aug. 26 6.28Mar. 26 3.84 Sept.24 6.23 Mar. 25 7.51 Sept.26 5.87Apr. 26 5.48 Oct. 26 6.23 Apr. 25 2.57 Oct. 29 6.77May 29 4.57 Nov. 27 4.75 May 29 3.07 Nov. 25 3.69June 26 4.83 Dec. 20 5.02 June 24 5.13 Dec. 26 5.90
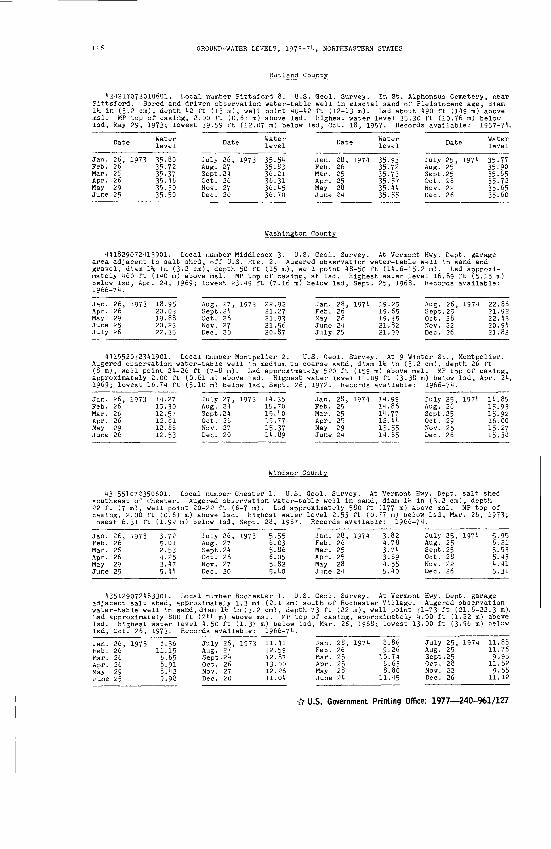
GROUND-WATER LEVELS, 1973-71), NORTHEASTERN STATES
Rutland County
1)31)217073010601. Local number Pittsford 8. U.S. Geol. Surv
Jan. 26, 1973 35.80 July 26, 1973 35-51) Jan. 28, 19711 35.93 July 25, 19711 35-77Feb. 26 35.72 Aug. 27 35.83 Feb. 26 35-72 Aug. 25 35-90Mar. 26 35.37 Sept.21) 36.21 Mar. 25 35-73 Sept.25 35-65Apr. 26 35.1*6 Oct. 26 36.31 Apr. 25 35.57 Oct. 28 35.72May 29 35.30 Nov. 27 36.1)5 May 28 35.11) Nov. 22 35-65June 25 35.50 Dec. 20 36.70 June 21) 35.55 Dec. 26 35.60
Washington County
Jan. 26, 1973 18.95 Aug. 27, 1973 22.92 Jan. 28, 1974 19-25 Aug. 26, 1974 22.86Apr. 26 20.03 Sept.21 21.27 Feb. 26 19.65 Sept.25 21.92May 29 19.88 Oct. 26 21.93 May 28 19.35 Oct. 28 22.13June 25 20.23 Nov. 27 21.56 June 21 21.82 Nov. 22 20.91July 26 22.35 Dec. 20 20.87 July 25 21.99 Dec. 26 21.82
111552072311901. Local number Montpelier 2. U.S. Geol. Survey. At 9 Winter St., Montpelier. Augered observation water-table well in medium to coarse sand, diam H; in (3.2 cm), depth 26 ft (8 m), well point 24-26 ft (7-8 m). Lsd approximately 520 ft (159 m) above msl. MP top of casing, approximately 2.00 ft (0.61 m) above Isd. Highest water level 11.09 ft (3.38 m) below Isd, Apr. 24, 1969; lowest 16.74 ft (5.10 m) below Isd, Sept. 26, 1972. Records available: 1966-74.
Jan. 26, 1973 14.27 July 27, 1973 11-35 Jan. 28, 1971 11.99 July 25, 1971 11.85Feb. 26 15.30 Aug. 24 15.70 Feb. 25 14.86 Aug. 26 15.93Mar. 26 12.57 Sept.24 15.10 Mar. 25 11.77 Sept.25 15.92Apr. 26 12.81 Oct. 26 15.77 Apr. 25 12.11 Oct. 29 16.00May 29 12.86 Nov. 27 15.37 May 29 13.55 Nov. 25 15.27June 26 12.53 Dec. 20 11.89 June 21 11.85 Dec. 26 15.38
Windsor County
131551072350601. Local number Chester 1. U.S. Geol. Survey. At Vermont Hwy. Dept. salt shed southeast of Chester. Augered observation water-table well in sand, diam H; in (3.2 cm), depth 22 ft (7 m), well point 20-22 ft (6-7 m). Lsd approximately 580 ft (177 m) above msl. MP top of casing, 2.00 ft (0.61 m) above Isd. Highest water level 2.53 ft (0.77 m) below Isd, Mar. 26, 1973; lowest 6.31 ft (1.92 m) below Isd, Sept. 28, 1967. Records available: 1966-71.
Jan. 26, 1973 3.72 July 26, 1973 5.55 Jan. 28, 1971 3.82 July 25, 1971 5-95Feb. 26 5.01 Aug. 27 6.03 Feb. 26 1.78 Aug. 25 6.21Mar. 26 2.53 Sept. 21 5.86 Mar. 25 3-71 Sept. 25 5.53Apr. 26 1.25 Oct. 26 6.05 Apr. 25 3.69 Oct. 28 5.43May 29 3.47 Nov. 27 5.82 May 28 1-55 Nov. 22 l.llJune 25 5.11 Dec. 20 5.10 June 21 5.10 Dec. 26 5-31
135129072183301. Local number Rochester 1. U.S. Geol. Survey. At Vermont Hwy. Dept. garage adjacent salt shed, approximately 1.3 mi (2.1 km) south of Rochester Village. Augered observation water-table well in sand, diam l*s in (3.2 cm), depth 73 ft (22 m), well point 71-73 ft (21.6-22.3 m). Lsd approximately 800 ft (211 m) above msl. MP top of casing, approximately 1.00 ft (1.22 m) above Isd. Highest water level 1.50 ft (1.37 m) below Isd, Mar. 26, 1968; lowest 13.00 ft (3-96 m) below Isd, Oct. 26, 1973. Records available: 1966-71. ________________ ________________
Jan. 26, 1973 8.36 July 26, 1973 11.11 Jan. 28, 1974 8.86 July 25, 1974 11.88Feb. 26 11.15 Aug. 27 12.59 Feb. 26 9.26 Aug. 25 11.76Mar. 26 6.65 Sept. 24 12.87 Mar. 25 10.74 Sept. 25 9-95Apr. 26 8.91 Oct. 26 13.00 Apr. 25 6.63 Oct. 28 11.52May 29 8.42 Nov. 27 12.26 May 28 8.80 Nov. 22 9-55June 25 9-98 Dec. 20 11.04 June 24 11.45 Dec. 26 11.12
£ U.S. Government Printing Office: 1977 240-961/127