ground water quality analysis using spatial distribution
TRANSCRIPT

Research Journal of Recent Sciences _______________________________________________ E-ISSN 2277-2502 Vol. 5(ISC-2015), 16-25 (2016) Res. J. Recent. Sci.
International Science Community Association 16
Ground Water Quality Analysis using Spatial Distribution Technique in Geographical Information System – A Case Study of Kakinada, East
Godavari district, Andhra Pradesh, India Padma Kumari K, Srinivas Killi and Gopi Krishna Kasyap V
School of Spatial Information Technology, Institute of Sci. and Tech., Jawaharlal Nehru Technological University Kakinada, Kakinada, AP, India [email protected]
Available online at: www.isca.in Received 30th November 2015, revised 11th January 2016, accepted 26th April 2016
Abstract This paper is about the study of the Ground water quality analysis using Geographical Information System (GIS) techniques of Kakinada mandal of East Godavari District, Andhra Pradesh, India on 1: 50,000 scale. The Godavari district is also known as the rice bowl of Andhra Pradesh. Godavari River is the second longest river in the country with a length of 1,465 km spreads over an area of about 5,100 sq km on the east coast of India bordering the Bay of Bengal and is a densely populated basin. The study area bounded on its North by Kottapalli; Pithapuram; in the West by Samalkota, Pedapudi, Karapa; in the South by Tallarevu and in the East by Bay of Bengal. The area is flourished with lands of fertile soils, good rain fall and balanced climatic conditions and possesses all the natures hand works of perennial rivers, forests. The sea coast covers 144.4 sq km with made up of Gondawana sandstones. The average annual rain fall is between 110 and 115 centimeters. 20 ground water samples collected at different parts of the study area for Physio-chemical analysis. Using the Inverse Distance Weighted (IDW) interpolation method in ArcGIS software, spatial distribution maps of 12 major water quality parameters are prepared. Water Quality Index (WQI) has been calculated to find the suitability of water for potable purposes. Ground water samples analyzed show quality parameters are pH, Electrical Conductivity, TDS, Fluorides, Chlorides, Calcium, Magnesium, Iron, Turbidity, Magnesium, Alkalinity, Hardness and water zoning using spatial data. Keywords: ArcGIS software, Water quality index
Introduction For the Ground water study of an area, the knowledge of the nature of lithological units, geomorphic set up, their structural disposition, surface water conditions and climate occurring in the area are required1. There are many organic constituents and dissolved minerals present in ground water in various concentrations. Among them dissolved mineral substances are Sodium, Magnesium, Potassium, Chloride, Bicarbonate, and Sulphates. These substances are called common constituents2,3. The imbalance between sea water and the groundwater in the coastal zones has been leading to sea water intrusion into fresh water aquifers causing irreparable damage and environmental degradation. Andhra Pradesh is fifth largest state in the country which is a riverine state with 40 major, medium and minor rivers. Of these, three are major interstate rivers viz. Godavari, Penna, Krishna which flow through the heart of the state. All the rivers are seasonal with bulk of flow taking place during monsoon. Many researchers studied on ground water quality in various areas using GIS tools such as Subbarao etal.1, Singh4, and Burrough5 explained the impact of emerging technologies on hydrologic and water modeling. Study area: The study area, Kakinada is the headquarters of East Godavari, bounded on North by Kottapalli, Pithapuram, in
the West by Samalkota, Pedapudi, Karapa, in the South by Tallarevu and in the East by Bay of Bengal. The district flourishes with lands of fertile soils, good rain fall and balanced climatic conditions and possesses all the natures hand works of perennial rivers, forests and also sea coast. East Godavari district with lush paddy fields and coconut groves is also known as Rice Bowl of Andhra Pradesh. The average annual rainfall is 1,157.6 mm. Industrial pollution in the eastern region of the study area, Intensive agriculture in the Northern part and Aquaculture in the south of the study area are the major sources affecting the quantity and quality of the ground water. Physiographically the area is plain and made up of the sandstones of Gondawanas (NAC). The study area is mainly covered by agriculture land, grasslands and plantation. Climate is hot and humid for most of the year. The hottest part of the year late May to early June with maximum temp 38- 48C. Land use /land cover extremely valuable especially for water quantity, quality and assessing the hydrological effects of land uses. Kakinada has fertile soil, good rainfall, all the natures and perennial rivers. Cyclones in the Bay of Bengal frequently hit the town. The East Godavari region is classified into three natural divisions - the Plains, the Delta and the Upland or Agency or hill tracts. Konaseema and portions of Kakinada,

Research Journal of Recent Sciences ____________________________________________________________ E-ISSN 2277-2502 Vol. 5(ISC-2015), 16-25 (2016) Res. J. Recent. Sci.
International Science Community Association 17
Ramachandrapuram and Rajahmundry presents a vast expanse of rice-fields surrounded by innumerable coconut gardens and plantain and betel plantations constitute Delta region. The erstwhile Taluks of Peddapuram, Pithapuram, Tuni, and Portions of Kakinada, Ramachandrapuram and Rajahmundry constitute the Plain areas. The Eastern Ghats mountain range rise by gradations from the level of the coast and spread throughout the erstwhile agency Taluks of Rampachodavaram and Yellavaram.
Methodology From the study area, 20 samples were collected for the analysis and application of the methodology for the assessment of Water Quality Index (WQI) 6. The sample collection points are located using GPS and converted into vector form on 1:50,000 scale. The sample locations are as shown the Figure-2;
Figure-1
Location map of the study area
Figure-2
Location map of the study area

Research Journal of Recent Sciences ____________________________________________________________ E-ISSN 2277-2502 Vol. 5(ISC-2015), 16-25 (2016) Res. J. Recent. Sci.
International Science Community Association 18
The collected water samples are analyzed for the parameters pH, Electrical conductivity, TDS, Fluorides, Calcium, Iron, Turbidity, Fluorides, Magnesium and water zoning using spatial data7,8. This data is presented in Table-1. The analyzed data is added as points into feature class using Inverse Distance Weighted (IDW) Interpolation Method9. Actually the method assumes the known value of a point. The general equation for the inverse distance Weighted method is
푍 =∑ Z
푑
∑ 1푑
Where: Z is the estimated value at a point 0, Z is the distance between control point I, is the distance between control point and point o, is the number of control points used in estimation, k is the specified power. The methodology implemented in the study is as illustrated in the flowchart presented below;
Table-1
Spatial location and Laboratory results of the water samples
Loca
tion
LON
GIT
UD
E (
E )
LATI
TUD
E (
N )
pH
EC
TDS
Turb
idity
Alk
alin
ity
Har
dnes
s
Fluo
rides
Chl
orid
es
Cal
cium
Sulp
hate
Fe
Mg
WQ
I
Rem
arks
GSPC2 82.27017 17.00902 6.91 78 51 0.5 25 30 0.1 12 8 10 0.1 2 54.8646 Poor
APSP 82.25194 17.00846 6.54 550 357 0.5 50 55 0.1 70 18 15 0.1 2 44.3954 Good
Valasapakala 82.25949 16.99777 6.55 260 169 0.5 60 20 0.1 30 4 12 0.2 2 23.2996 Excellent
Gadimoga 82.24740 16.93770 7.1 230 150 0.6 75 45 0.2 30 12 17 0.2 4 19.6096 Excellent
GSPC 82.26961 17.01099 6.94 190 123 0.3 50 50 0.1 20 10 22 0.1 6 39.1082 Good
Pallamrajunagar 82.25259 16.98017 6.9 680 442 0.6 205 225 0.1 50 76 43 0.2 8 32.5051 Good
Vakalapudi 82.26119 17.00361 6.5 100 65 0.2 25 35 0.1 20 8 4 0.1 9 19.6000 Excellent
Fort2 82.27808 16.98657 6.8 280 182 0.5 75 85 0.1 30 18 36 0.2 10 63.9952 Poor
Fort4 82.27171 16.98633 6.67 320 208 0.6 100 100 0.1 25 22 32 0.2 11 55.6228 Poor
Fort 82.27558 16.97766 7.46 580 377 0.3 105 105 0.1 33 24 37 0.2 11 63.7676 Poor
Srinagar 82.23870 16.96868 7.3 280 182 0.2 90 120 0.1 40 28 14 0.1 12 33.0237 Good
Fort3 82.27612 16.98847 7.06 380 247 0.6 90 120 0.1 35 28 55 0.2 12 55.4228 Poor
Bharat Petroleum 82.23144 16.95433 6.52 1200 780 0.2 65 140 0.1 300 32 25 0.2 14 54.3905 Poor
Nagamallithota Junction 82.24128 16.98544 6.8 3000 1950 0.8 370 495 0.2 560 96 220 0.3 61 20.3489 Excellent
Vidhyutnagar 82.23530 16.98697 7.6 1400 910 0.6 400 520 0.2 160 92 224 0.3 69 ERR Ufd
Chitrada 82.24611 17.08137 7.03 2100 1365 0.6 370 575 0.2 345 98 152 0.3 79 21.0517 Excellent
Subhanikethan 82.23082 16.99841 6.4 4300 2795 1 260 1075 0.2 950 230 174 0.3 120 21.0584 Excellent
Ramanayyapeta 82.24629 16.98967 6.38 3700 2405 0.8 250 1230 0.2 950 244 170 0.3 148 34.3133 Good
Vidhaynagar 82.24790 16.98764 7.38 3200 2080 0.6 425 940 0.2 750 104 103 0.3 163 35.7662 Good
Shipping Corp 82.23852 16.94557 6.83 5600 3640 0.6 295 1305 0.2 1360 194 216 0.3 196 34.2000 Good

Research Journal of Recent Sciences ____________________________________________________________ E-ISSN 2277-2502 Vol. 5(ISC-2015), 16-25 (2016) Res. J. Recent. Sci.
International Science Community Association 19
Figure-3
Flowchart of the Methodology Estimation of Water Quality Index (WQI): Water Quality Index (WQI) is a very useful and efficient method for assessing the Quality of water 9. Water Quality Index (WQI) is very useful tool for communicating information on overall quality of water 10,11. To determine the Suitability of the groundwater for drinking purposes, WQI is computed adopting the following formula12. 푊푄퐼 = 퐴푛푡푖푙표푔 [ 훴푊 푙표푔 푞 ] (1) Where: 푊, Weight age factor computed using the following equation 푊푛 = 퐾 / 푆푛 (2) and 퐾, Proportionality constant is derived from, 퐾 = 1 ∑ (1 푆⁄ )⁄ (3) 푆 and 푆 are the WHO / BIS10500 standard values of the water quality parameter 12,13 Quality rating (푞) is calculated using the formula, 푞 = {[(푉 – 푉 ) (푉 – 푉 )] × 100} (4) where, 푞 = Quality rating of 푖 parameter for a total of 푛 water quality parameters. 푉 = Value of the water quality parameter obtained from laboratory analysis 푉 = Value of that water quality parameter can be obtained from the standard tables. 푉 for pH = 7 and for other parameters it is equal to
zero. 푉 = WHO / ICMR standard of the water quality parameter. Based on the above WQI values, the ground water quality is rated as excellent, good, poor, very poor and unfit for human consumption (Table 2). Results and Discussion In this study the spatial distribution of 12 parameters are calculated according as per the ISO 10500-1991 (Table-1). The Electrical conductivity is (Figure-5) high at Subhaniketan, Ramanayyapeta shipping corporation and Vidyutnagar. The spatial distribution of the Total Dissolved Solids (TDS) shown in Figure-6. According to the findings, Gadimoga, Srinagar, Vakalapudi, Fort, Valasapakala, APSP, GSPC have beyond the 500 mg/l. The high Turbity (Figure-7) of water makes the water less acceptable by the public and also interfere with disinfection mechanism and reduce the disinfection efficiency especially of chlorination. Alkalinity shows moderate at centre part of the study (Figure-8) high at Chitrada, Vidhutnagar, Nagamallithota. The Hardness parameter (Figure-9) is high at Subhaniketan, Shipyard and few places at Ramanayyapeta remaining areas are maintain uniformly throughout the study.
20 Ground Water Samples (from Field)
Quality parameters
Laboratory testing
Spatial Distribution for each parameter
IDW (Inverse Difference Weight
age) WQI
(Water Quality Index)
SOI Top sheets on 1:50,000 scale
Geo-Rectification and Digitization
BASE MAP
pH, Electrical Conductivity, Total Dissolved Solids (TDS), Turbidity, Alkalinity, Hardness (CaCO3), Fluoride, Chloride, Calcium, Sulphates, Iron and Magnesium.
Research Journal of Recent Sciences ____________________________________________________________ E-ISSN 2277-2502 Vol. 5(ISC-2015), 16-25 (2016) Res. J. Recent. Sci.
International Science Community Association 20
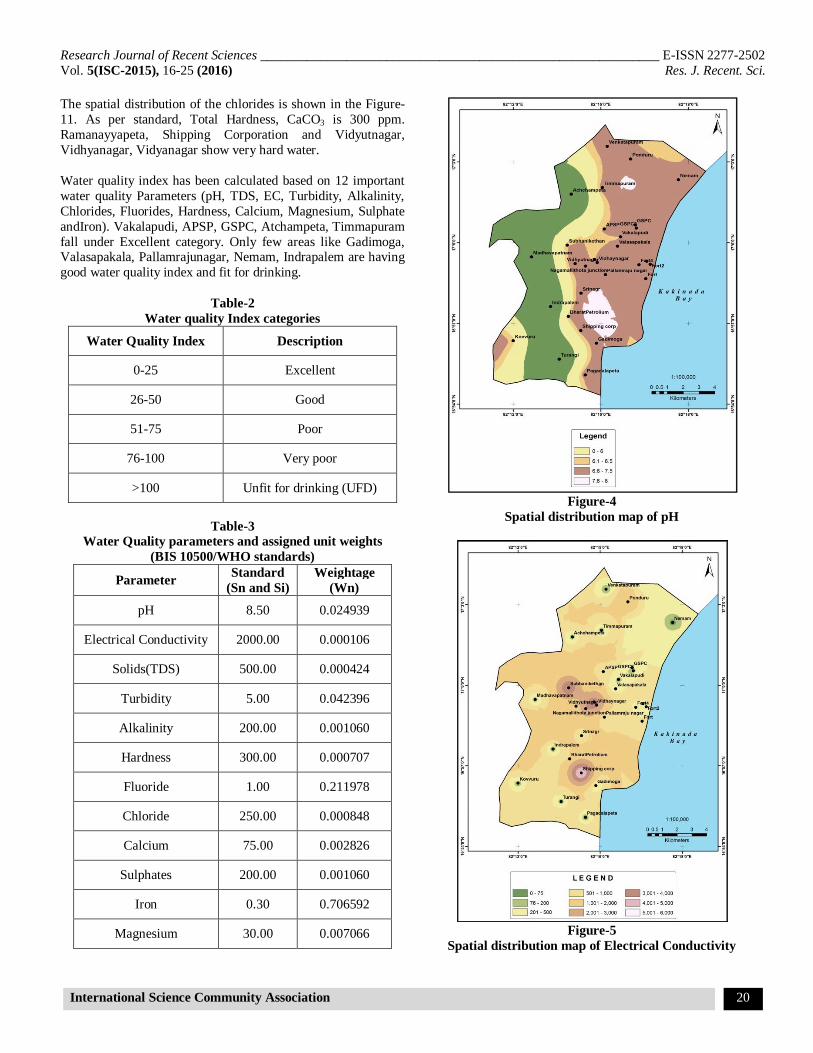
The spatial distribution of the chlorides is shown in the Figure-11. As per standard, Total Hardness, CaCO3 is 300 ppm. Ramanayyapeta, Shipping Corporation and Vidyutnagar, Vidhyanagar, Vidyanagar show very hard water. Water quality index has been calculated based on 12 important water quality Parameters (pH, TDS, EC, Turbidity, Alkalinity, Chlorides, Fluorides, Hardness, Calcium, Magnesium, Sulphate andIron). Vakalapudi, APSP, GSPC, Atchampeta, Timmapuram fall under Excellent category. Only few areas like Gadimoga, Valasapakala, Pallamrajunagar, Nemam, Indrapalem are having good water quality index and fit for drinking.
Table-2 Water quality Index categories
Water Quality Index Description
0-25 Excellent
26-50 Good
51-75 Poor
76-100 Very poor
>100 Unfit for drinking (UFD)
Table-3
Water Quality parameters and assigned unit weights (BIS 10500/WHO standards)
Parameter Standard (Sn and Si)
Weightage (Wn)
pH 8.50 0.024939
Electrical Conductivity 2000.00 0.000106
Solids(TDS) 500.00 0.000424
Turbidity 5.00 0.042396
Alkalinity 200.00 0.001060
Hardness 300.00 0.000707
Fluoride 1.00 0.211978
Chloride 250.00 0.000848
Calcium 75.00 0.002826
Sulphates 200.00 0.001060
Iron 0.30 0.706592
Magnesium 30.00 0.007066
Figure-4
Spatial distribution map of pH
Figure-5
Spatial distribution map of Electrical Conductivity

Research Journal of Recent Sciences ____________________________________________________________ E-ISSN 2277-2502 Vol. 5(ISC-2015), 16-25 (2016) Res. J. Recent. Sci.
International Science Community Association 21
Figure-6
Spatial distribution map of Total Dissolved Solids (TDS)
Figure-7
Spatial distribution map of Turbidity
Figure-8
Spatial distribution map of Alkalinity
Figure-9
Spatial distribution map of Hardness

Research Journal of Recent Sciences ____________________________________________________________ E-ISSN 2277-2502 Vol. 5(ISC-2015), 16-25 (2016) Res. J. Recent. Sci.
International Science Community Association 22
Figure-10
Spatial distribution map of Fluorides
Figure-11
Spatial distribution map of Chlorides
Figure-12
Spatial distribution map of Calcium
Figure-13
Spatial distribution map of Sulphate
Research Journal of Recent Sciences ____________________________________________________________ E-ISSN 2277-2502 Vol. 5(ISC-2015), 16-25 (2016) Res. J. Recent. Sci.
International Science Community Association 23
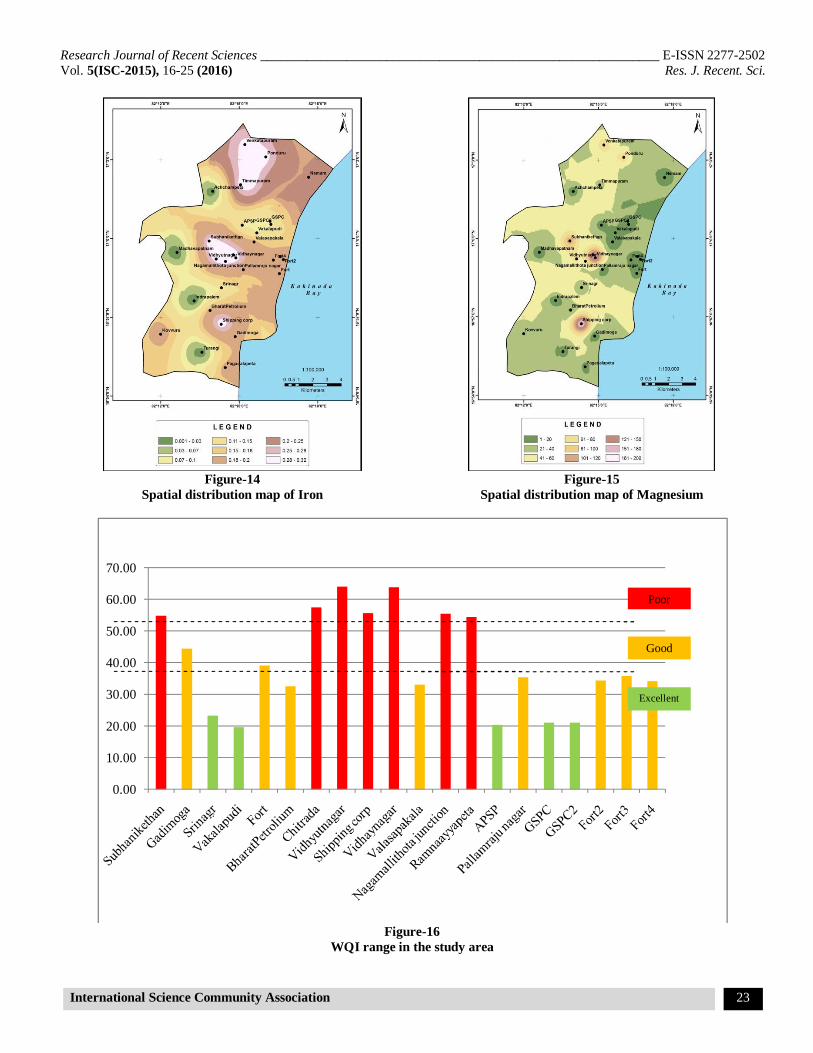
Figure-14
Spatial distribution map of Iron
Figure-15
Spatial distribution map of Magnesium
Figure-16
WQI range in the study area
0.00
10.00
20.00
30.00
40.00
50.00
60.00
70.00
WQI Graph
Excellent
Good
Poor

Research Journal of Recent Sciences ____________________________________________________________ E-ISSN 2277-2502 Vol. 5(ISC-2015), 16-25 (2016) Res. J. Recent. Sci.
International Science Community Association 24
Figure-17
Spatial distribution of Water Quality Index (WQI) in the study area Conclusion pH value equal to 7 indicates neutral water, greater than 7 the water is basic, less than 7 is acidic. Figure-4 shows the pH in the study area starts from 6 to 7 and increases from town to coast in permissible limit only. The maximum Total Dissolved Solids (TDS) allowed for drinking water is 500mg/l and beyond this palatability decreases and may cause gastrointestinal irritation. Fluoride content in the mandal was observed to be less than 1.0 mg/l (Figure-10). Sulphur content is under permissible limit. The desirable limit for Iron is 0.3 ppm beyond which water exhibit bad, appearance bad taste and effect water supply structures and promotes iron bacteria (Figure-14). Remaining other areas is categorized as poor to very poor and is unfit for drinking. The spatial distribution of the Water Quality Index is shown in the Figure-16 and Figure17. Acknowledgment The author thanks the environmental engineering laboratory for providing data and quality testing, the Head, Department of
Civil Engineering, University College of Engineering, Jawaharlal Nehru Technological University Kakinada, Kakinada, and also thanks to Faculty, Supporting Staff of the Department. References 1. Subba Rao N. (1997). Studies on the water quality index
in hard rock terrain of Guntur district, Andhra Pradesh, India, National Seminar on Hydrology of Precambrian Terrains and hard rock areas, 129-134.
2. Zahang H., haan C.T and Nofziger D.L. (1990). Hydrologic modeling with GIS; An overview. Applied Engg, in Agriculture, 6(4), 453-458.
3. Vijith H. and Sateesh R. (2007). Water quality analysis on the Vemband Estuary, Kerala using Remote sensing data, Journal of IAEM, 34(3), 177-182.
4. Singh V.P, (1995). Computer models of watershed hydrology, Water Resource Publications, P.O.B. 260026, Highlands ranch, Colorado 80126-0026, USA

Research Journal of Recent Sciences ____________________________________________________________ E-ISSN 2277-2502 Vol. 5(ISC-2015), 16-25 (2016) Res. J. Recent. Sci.
International Science Community Association 25
5. Burrough PA, Mc Donnell (1998). Principles of Geographical Information Systems. Oxford University Press, Oxford,
6. BIS (Bureau of Indian Standards) 10500, Indian standard for drinking water specification, 1991, First revision, 1-8.
7. WHO (World Health Organization) (1983). Guidelines for drinking water quality, 2nd edition, 1, 188.
8. K. Sundara Kumar, Ch. Kannam Naidu and P. Udayabhaskar (2010). Ground Water Quality Assessment of Srikakulam District of Andhrapradesh, India, using GIS”, International Journal of Applied Environmental Sciences, 5(4), 495-504
9. Ferry Ledi Tjandra, Akihiko Kondhoh, Mohammed Aslam M.A. A Jensen, J (2003). Remote sensing of the environment - An Earth Resource perspective, Pearson edn, 381-393.
10. Jensen J (1986). Introductory Digital Image Processing, Prentice Hall, Englewood Cliffs, New Jersy, 129-134
11. Lee M. and Tandterstriep M.L. (1991). Applications of GIS for water quality modeling in agriculture and urban water shed. Int. Hydr, engg., proc., 1991, Nat, conf., ASCE, New York, NY, 961-965.
12. Mahuya Das, Gupta Adak, Purohit KM and Jayita Datta. (2001). Assessment of drinking water quality of river Brahmani, Indian Journal of Environmental Protection, 8(3), 285-291.
13. Mahidment D.R. (1993), GIS and hydrologic modeling In; environmental modeling with GIS, M.F. Goodchild, B.O. Parks and L.T. Steyeart (eds), New York; Oxford Univ press.