ground-water quality
TRANSCRIPT
Ground-Water Quality 43
GROUND-WATER QUALITY
The geochemistry of ground water may influence the utili-ty of aquifer systems as sources of water. The types and con-centrations of dissolved constituents in the water of an aquifersystem determine whether the resource, without prior treat-ment, is suitable for drinking-water supplies, industrial pur-poses, irrigation, livestock watering, or other uses. Changesin the concentrations of certain constituents in the water of anaquifer system, whether because of natural or anthropogeniccauses, may alter the suitability of the aquifer system as asource of water. Assessing ground-water quality and develop-ing strategies to protect aquifers from contamination are nec-essary aspects of water-resource planning.
Sources of ground-water quality data
The quality of water from the aquifer systems defined inthe Aquifer Systems section of the Ground-Water Hydrologychapter is described using selected inorganic chemical analy-ses from 372 wells (157 completed in unconsolidateddeposits and 215 completed in bedrock) in the West ForkWhite River basin. Sources of ground-water quality data aredomestic, commercial or livestock-watering wells sampledduring a 1989 and 1990 cooperative effort between theIndiana Department of Natural Resources, Division of Water(DOW) and the Indiana Geological Survey (IGS). The loca-tions of ground-water chemistry sites used in the analysis aredisplayed on plate 9, and selected water-quality data fromindividual wells are listed in appendices 1 and 2.
The intent of the water-quality analysis is to characterizethe natural ground-water chemistry of the West Fork WhiteRiver basin. Specific instances of ground-water contamina-tion are not evaluated. In cases of contamination, chemicalconditions are likely to be site-specific and may not representtypical ground-water quality in the basin. Therefore, availabledata from identified sites of ground-water contaminationwere not included in the data sets analyzed for this publica-tion. Samples collected from softened or otherwise treatedwater were also excluded from the analysis because thechemistry of the water was altered from natural conditions.
Factors in the assessment of ground-water quality
Major dissolved constituents in the ground water of theWest Fork White River basin include calcium, magnesium,sodium, chloride, sulfate, and bicarbonate. Less abundantconstituents include potassium, iron, manganese, strontium,zinc, fluoride, and nitrate. Other chemical characteristics dis-cussed in this report include pH, alkalinity, hardness, totaldissolved solids (TDS), and radon.
Although the data from well-water samples in the WestFork White River basin are treated as if they represent thechemistry of ground water at a distinct point, they actuallyrepresent the average concentration of an unknown volume of
water in an aquifer. The extent of aquifer representationdepends on the depth of the well, hydraulic conductivity ofthe aquifer, thickness and areal extent of the aquifer, and rateof pumping. For example, the chemistry of water sampledfrom high-capacity wells may represent average ground-water quality for a large cone of influence (Sasman and oth-ers, 1981). Also, because much of the bedrock in the southernpart of the basin does not produce much ground water, it isnot uncommon for bedrock wells to be deep and to intersectseveral different bedrock units. Because the quality of watermay vary substantially from different zones individual wellsmay show an unusual mixture of ground water types.
To further complicate analysis of the ground-water chem-istry data in this basin, the bedrock in the southern third of thebasin was formed in complex depositional environments result-ing in complex horizontal and vertical relationships of variousbedrock units. In addition, there is an extensive major uncon-formity (old erosion surface) of Mississippian/Pennsylvanianage. Erosion and subsequent deposition of bedrock materialthat occurred during this time period has resulted in younger ormore recent bedrock overlapping onto bedrock of differentages and types.
The order in which ground water encounters strata of dif-ferent mineralogical composition can exert an important con-trol on the water chemistry (Freeze and Cherry, 1979).Considering that hydrogeologic systems in the basin containnumerous types of strata arranged in a wide variety of geo-metric configurations, it is not unreasonable to expect that inmany areas the chemistry of ground water exhibits complexspatial patterns that are difficult to interpret, even when goodstratigraphic and hydraulic head information is available.
The nature of the bedrock in the southern two-thirds of theWest Fork White River basin makes the use of aquifer sys-tems to describe ground-water quality somewhat problemat-ic. The boundaries of the bedrock aquifer systems are definedby 2-dimensional mapping techniques. Although this type ofmapping is useful, it should be remembered that more pro-ductive aquifer systems extend beneath less productive sys-tems and are often used as a water supply within the bound-aries of the latter.
In addition to the factors discussed above, the chemistry oforiginal aquifer water may be altered to some degree by con-tact with plumbing, residence time in a pressure tank, methodof sampling, and time elapsed between sampling and labora-tory analysis. In spite of these limitations, results of sampleanalyses provide valuable information concerning ground-water quality characteristics of aquifer systems.
Analysis of data
Graphical and statistical techniques are used to analyze theavailable ground-water quality data from the West ForkWhite River basin. Graphical analyses are used to display theareal distribution of dissolved constituents throughout thebasin, and to describe the general chemical character of theground water of each aquifer system. Statistical analyses pro-vide useful generalizations about the water quality of the
44 Ground-Water Resource Availability, West Fork and White River Basin
Factors affecting ground-water chemistry
The chemical composition of ground water varies because of many com-plex factors that change with depth and over geographic distances. Ground-water quality can be affected by the composition and solubility of rock mate-rials in the soil or aquifer, water temperature, partial pressure of carbon diox-ide, acid-base reactions, oxidation-reduction reactions, loss or gain of con-stituents as water percolates through clay layers, and mixing of ground waterfrom adjacent strata. The extent of each effect will be determined in part bythe residence time of the water within the different subsurface environments.
Rain and snow are the major sources of recharge to ground water. Theycontain small amounts of dissolved solids and gases such as carbon dioxide,sulfur dioxide, and oxygen. As precipitation infiltrates through the soil, biolog-ically-derived carbon dioxide reacts with the water to form a weak solution ofcarbonic acid. The reaction of oxygen with reduced iron minerals such aspyrite is an additional source of acidity in ground water. The slightly acidicwater dissolves soluble rock material, thereby increasing the concentrationsof chemical constituents such as calcium, magnesium, chloride, iron, andmanganese. As ground water moves slowly through an aquifer the composi-tion of water continues to change, usually by the addition of dissolved con-stituents (Freeze and Cherry, 1979). A longer residence time will usuallyincrease concentrations of dissolved solids. Because of short residence time,ground water in recharge areas often contains lower concentrations of dis-solved constituents than water occurring deeper in the same aquifer or inshallow discharge areas.
Dissolved carbon dioxide, bicarbonate, and carbonate are the principalsources of alkalinity, or the capacity of solutes in water to neutralize acid.Carbonate contributors to alkalinity include atmospheric and biologically-pro-duced carbon dioxide, carbonate minerals, and biologically-mediated sulfatereduction. Noncarbonate contributors to alkalinity include hydroxide, silicate,borate, and organic compounds. Alkalinity helps to buffer natural water so thatthe pH is not greatly altered by addition of acid. The pH of most natural groundwaters in Indiana is neutral to slightly alkaline.
Calcium and magnesium are the major constituents responsible for hard-ness in water. Their presence is the result of dissolution of carbonate miner-als such as calcite and dolomite.
The weathering of feldspar and clay is a source of sodium and potassiumin ground water. Sodium and chloride are produced by the solution of halite(sodium chloride) which can occur as grains disseminated in unconsolidatedand bedrock deposits. Chloride also occurs in bedrock cementing material,connate fluid inclusions, and as crystals deposited during or after depositionof sediment in sea water. High sodium and chloride levels can result fromupward movement of brine from deeper bedrock in areas of high pumpage,from improper brine disposal from peteroleum wells, and from the use of roadsalt (Hem, 1985).
Cation exchange is often a modifying influence of ground-water chemistry.
The most important cation exchange processes are those involving sodium-calcium, sodium-magnesium, potassium-calcium, and potassium-magnesium.Cation exchanges occurring in clay-rich semi-confining layers can cause mag-nesium and calcium reductions which result in natural softening.
Concentrations of sulfide, sulfate, iron, and manganese depend on geol-ogy and hydrology of the aquifer system, amount of dissolved oxygen, pH,minerals available for solution, amount of organic matter, and microbial activ-ity.
Mineral sources of sulfate can include pyrite, gypsum, barite, and celestite.Sulfide is derived from reduction of sulfate when dissolve oxygen concentra-tions are low and anaerobic bacteria are present. Sulfate-reducing bacteriaderive energy from oxidation of organic compounds and obtain oxygen fromsulfate ions (Lehr and others, 1980).
Reducing conditions that produce hydrogen sulfide occur in deep wellscompleted in carbonate and shale bedrock. Oxygen-deficient conditions aremore likely to occur in deep wells than in shallow wells because permeabilityof the carbonate bedrock decreases with depth, and solution features andjoints become smaller and less abundant (Rosenshein and Hunn, 1968a;Bergeron, 1981; Basch and Funkhouser, 1985). Deeper portions of thebedrock are therefore not readily flushed by ground water with high dissolvedoxygen. Hydrogen sulfide gas, a common reduced form of sulfide, has a dis-tinctive rotten egg odor that can be detected in water containing only a fewtenths of a milligram per liter of sulfide (Hem, 1985).
Oxidation-reduction reactions constitute an important influence on concen-trations of both iron and manganese. High dissolved iron concentrations canoccur in ground water when pyrite is exposed to oxygenated water or whenferric oxide or hydroxide minerals are in contact with reducing substances(Hem, 1985). Sources of manganese include manganese carbonate,dolomite, limestone, and weathering crusts of manganese oxide.
Sources of fluoride in bedrock aquifer systems include fluorite, apatite andfluorapatite. These minerals may occur as evaporites or detrital grains in sed-imentary rocks, or as disseminated grains in unconsolidated deposits. Groundwaters containing detectable concentrations of fluoride have been found in avariety of geological settings.
Natural concentrations of nitrate-nitrogen in ground water originate fromthe atmosphere and from living and decaying organisms. High nitrate levelscan result from leaching of industrial and agricultural chemicals or decayingorganic matter such as animal waste or sewage.
The chemistry of strontium is similar to that of calcium, but strontium is pre-sent in ground water in much lower concentrations. Natural sources of stron-tium in ground water include strontianite (strontium carbonate) and celestite(strontium sulfate). Naturally-occurring barium sources include barite (bariumsulfate) and witherite (barium carbonate). Areas associated with deposits ofcoal, petroleum, natural gas, oil shale, black shale, and peat may also containhigh levels of barium.
basin, such as the average concentration of a constituent andthe expected variability.
Regional trends in ground-water chemistry can be analyzedby developing trilinear diagrams for the aquifer systems inthe West Fork White River basin (appendix 3). Trilinear plot-ting techniques developed by Piper (1944) can be used toclassify ground water on the basis of chemistry, and to com-pare chemical trends among different aquifer systems (appen-dix 3) (see sidebar titled Chemical classification of groundwater using trilinear diagrams). To graphically representvariation in ground-water chemistry, box plots (appendix 4)are prepared for selected ground-water constituents. Boxplots are useful for depicting descriptive statistics, showingthe general variability in constituent concentrations occurringin an aquifer system, and making general chemical compar-isons among aquifer systems.
Symmetry of a box plot across the median line (appendix4) can provide insights into the degree of skewness of chem-ical concentrations or parameter values in a data set. A boxplot that is almost symmetrical about the median line may
indicate that the data originate from a nearly symmetrical dis-tribution. In contrast, marked asymmetry across the medianline may indicate a skewed distribution of the data.
The areal distribution of selected chemical constituents,mapped according to aquifer system, is included among fig-ures 14 to 26. Several sampling and geologic factors compli-cate the development of chemical concentration maps for theWest Fork White River basin. The sampling sites are notevenly distributed in the basin, but are clustered around townsand developed areas (plate 9). Data points are generallyscarce in areas where surface-water sources are used forwater supply. Furthermore, lateral and vertical variations ingeology can also influence the chemistry of subsurface water.Therefore, the maps presented in the following discussiononly represent approximate concentration ranges.
Where applicable, ground-water quality is assessed in thecontext of National Primary and Secondary Drinking-WaterStandards (see sidebar titled National Drinking-waterStandards). The secondary standard referred to in this reportis the secondary maximum contaminant level (SMCL). The
Ground-Water Quality 45
SMCLs are recommended, non-enforceable standards estab-lished to protect aesthetic properties such as taste, odor, orcolor of drinking water. Some chemical constituents (includ-ing fluoride and nitrate) are also considered in terms of themaximum contaminant level (MCL). The MCL is the concen-tration at which a constituent may represent a threat to humanhealth. Maximum contaminant levels are legally-enforceableprimary drinking-water standards that should not be exceed-ed in treated drinking water distributed for public supply.General water-quality criteria for irrigation and livestock andstandards for public supply are given in appendix 5.
Because of data constraints, ground-water quality can onlybe described for selected aquifer systems as defined in theAquifer Systems section of this report (plate 5).Unconsolidated aquifer systems analyzed include the TiptonTill Plain, Tipton Till Plain subsystem, Dissected Till andResiduum, White River and Tributaries Outwash, WhiteRiver and Tributaries Outwash subsystem, Buried Valley, and
Lacustrine and Backwater Deposits aquifer systems. Bedrockaquifer systems analyzed include the Silurian and DevonianCarbonates, Devonian and Mississippian/New Albany Shale,Mississippian/Borden Group, Mississippian/Blue River andSanders Group, Mississippian/Buffalo Wallow, Stephensport,and West Baden Group, Pennsylvanian/Raccoon Creek Group, Pennsylvanian/Carbondale Group, andPennsylvanian/McLeansboro Group Aquifer systems. Thebedrock Ordovician/Maquoketa Group Aquifer system is notincluded in the analysis as none of the wells sampled werecompleted in that aquifer (Data on ground-water chemistry ofwells completed in Ordovician bedrock are available in theDOW Whitewater River Basin report). Because the numberof samples from the White River and Tributaries Outwash,Dissected Till and Residuum, Lacustrine and BackwaterDeposits, and Devonian and Mississippian/New AlbanyShale Aquifer systems is 7 or less, the sampling results maynot accordingly reflect chemical conditions in these aquifers.
Chemical Classification of Ground waters UsingTrilinear Diagrams
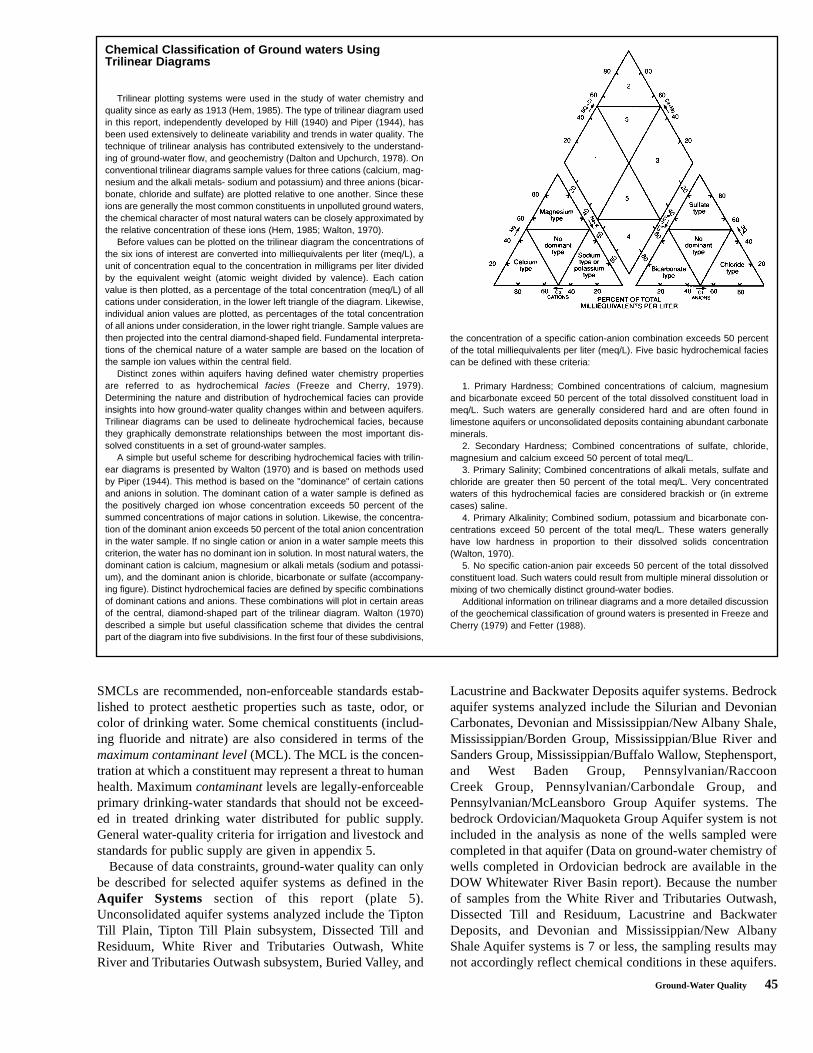
Trilinear plotting systems were used in the study of water chemistry andquality since as early as 1913 (Hem, 1985). The type of trilinear diagram usedin this report, independently developed by Hill (1940) and Piper (1944), hasbeen used extensively to delineate variability and trends in water quality. Thetechnique of trilinear analysis has contributed extensively to the understand-ing of ground-water flow, and geochemistry (Dalton and Upchurch, 1978). Onconventional trilinear diagrams sample values for three cations (calcium, mag-nesium and the alkali metals- sodium and potassium) and three anions (bicar-bonate, chloride and sulfate) are plotted relative to one another. Since theseions are generally the most common constituents in unpolluted ground waters,the chemical character of most natural waters can be closely approximated bythe relative concentration of these ions (Hem, 1985; Walton, 1970).
Before values can be plotted on the trilinear diagram the concentrations ofthe six ions of interest are converted into milliequivalents per liter (meq/L), aunit of concentration equal to the concentration in milligrams per liter dividedby the equivalent weight (atomic weight divided by valence). Each cationvalue is then plotted, as a percentage of the total concentration (meq/L) of allcations under consideration, in the lower left triangle of the diagram. Likewise,individual anion values are plotted, as percentages of the total concentrationof all anions under consideration, in the lower right triangle. Sample values arethen projected into the central diamond-shaped field. Fundamental interpreta-tions of the chemical nature of a water sample are based on the location ofthe sample ion values within the central field.
Distinct zones within aquifers having defined water chemistry propertiesare referred to as hydrochemical facies (Freeze and Cherry, 1979).Determining the nature and distribution of hydrochemical facies can provideinsights into how ground-water quality changes within and between aquifers.Trilinear diagrams can be used to delineate hydrochemical facies, becausethey graphically demonstrate relationships between the most important dis-solved constituents in a set of ground-water samples.
A simple but useful scheme for describing hydrochemical facies with trilin-ear diagrams is presented by Walton (1970) and is based on methods usedby Piper (1944). This method is based on the "dominance" of certain cationsand anions in solution. The dominant cation of a water sample is defined asthe positively charged ion whose concentration exceeds 50 percent of thesummed concentrations of major cations in solution. Likewise, the concentra-tion of the dominant anion exceeds 50 percent of the total anion concentrationin the water sample. If no single cation or anion in a water sample meets thiscriterion, the water has no dominant ion in solution. In most natural waters, thedominant cation is calcium, magnesium or alkali metals (sodium and potassi-um), and the dominant anion is chloride, bicarbonate or sulfate (accompany-ing figure). Distinct hydrochemical facies are defined by specific combinationsof dominant cations and anions. These combinations will plot in certain areasof the central, diamond-shaped part of the trilinear diagram. Walton (1970)described a simple but useful classification scheme that divides the centralpart of the diagram into five subdivisions. In the first four of these subdivisions,
the concentration of a specific cation-anion combination exceeds 50 percentof the total milliequivalents per liter (meq/L). Five basic hydrochemical faciescan be defined with these criteria:
1. Primary Hardness; Combined concentrations of calcium, magnesiumand bicarbonate exceed 50 percent of the total dissolved constituent load inmeq/L. Such waters are generally considered hard and are often found inlimestone aquifers or unconsolidated deposits containing abundant carbonateminerals.
2. Secondary Hardness; Combined concentrations of sulfate, chloride,magnesium and calcium exceed 50 percent of total meq/L.
3. Primary Salinity; Combined concentrations of alkali metals, sulfate andchloride are greater then 50 percent of the total meq/L. Very concentratedwaters of this hydrochemical facies are considered brackish or (in extremecases) saline.
4. Primary Alkalinity; Combined sodium, potassium and bicarbonate con-centrations exceed 50 percent of the total meq/L. These waters generallyhave low hardness in proportion to their dissolved solids concentration(Walton, 1970).
5. No specific cation-anion pair exceeds 50 percent of the total dissolvedconstituent load. Such waters could result from multiple mineral dissolution ormixing of two chemically distinct ground-water bodies.
Additional information on trilinear diagrams and a more detailed discussionof the geochemical classification of ground waters is presented in Freeze andCherry (1979) and Fetter (1988).
46 Ground-Water Resource Availability, West Fork and White River Basin
Secondary Maximum Maximum Contaminant
Contaminant Level Level (MCL)
(SMCL) (ppm) Constituent (ppm) Remarks
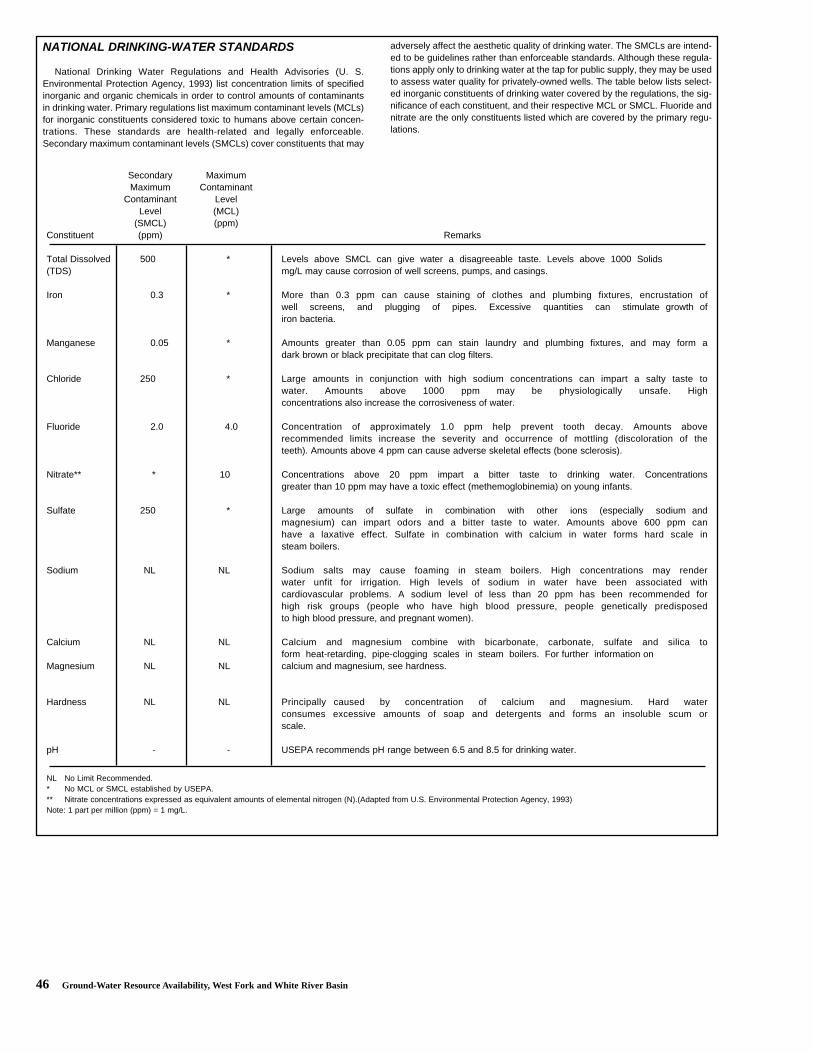
Total Dissolved 500 * Levels above SMCL can give water a disagreeable taste. Levels above 1000 Solids(TDS) mg/L may cause corrosion of well screens, pumps, and casings.
Iron 0.3 * More than 0.3 ppm can cause staining of clothes and plumbing fixtures, encrustation of well screens, and plugging of pipes. Excessive quantities can stimulate growth of iron bacteria.
Manganese 0.05 * Amounts greater than 0.05 ppm can stain laundry and plumbing fixtures, and may form adark brown or black precipitate that can clog filters.
Chloride 250 * Large amounts in conjunction with high sodium concentrations can impart a salty taste towater. Amounts above 1000 ppm may be physiologically unsafe. High concentrations also increase the corrosiveness of water.
Fluoride 2.0 4.0 Concentration of approximately 1.0 ppm help prevent tooth decay. Amounts above recommended limits increase the severity and occurrence of mottling (discoloration of the teeth). Amounts above 4 ppm can cause adverse skeletal effects (bone sclerosis).
Nitrate** * 10 Concentrations above 20 ppm impart a bitter taste to drinking water. Concentrations greater than 10 ppm may have a toxic effect (methemoglobinemia) on young infants.
Sulfate 250 * Large amounts of sulfate in combination with other ions (especially sodium and magnesium) can impart odors and a bitter taste to water. Amounts above 600 ppm can have a laxative effect. Sulfate in combination with calcium in water forms hard scale in steam boilers.
Sodium NL NL Sodium salts may cause foaming in steam boilers. High concentrations may render water unfit for irrigation. High levels of sodium in water have been associated with cardiovascular problems. A sodium level of less than 20 ppm has been recommended for high risk groups (people who have high blood pressure, people genetically predisposed to high blood pressure, and pregnant women).
Calcium NL NL Calcium and magnesium combine with bicarbonate, carbonate, sulfate and silica to form heat-retarding, pipe-clogging scales in steam boilers. For further information on
Magnesium NL NL calcium and magnesium, see hardness.
Hardness NL NL Principally caused by concentration of calcium and magnesium. Hard water consumes excessive amounts of soap and detergents and forms an insoluble scum or scale.
pH - - USEPA recommends pH range between 6.5 and 8.5 for drinking water.
NL No Limit Recommended. * No MCL or SMCL established by USEPA. ** Nitrate concentrations expressed as equivalent amounts of elemental nitrogen (N).(Adapted from U.S. Environmental Protection Agency, 1993)Note: 1 part per million (ppm) = 1 mg/L.
NATIONAL DRINKING-WATER STANDARDS
National Drinking Water Regulations and Health Advisories (U. S.Environmental Protection Agency, 1993) list concentration limits of specifiedinorganic and organic chemicals in order to control amounts of contaminantsin drinking water. Primary regulations list maximum contaminant levels (MCLs)for inorganic constituents considered toxic to humans above certain concen-trations. These standards are health-related and legally enforceable.Secondary maximum contaminant levels (SMCLs) cover constituents that may
adversely affect the aesthetic quality of drinking water. The SMCLs are intend-ed to be guidelines rather than enforceable standards. Although these regula-tions apply only to drinking water at the tap for public supply, they may be usedto assess water quality for privately-owned wells. The table below lists select-ed inorganic constituents of drinking water covered by the regulations, the sig-nificance of each constituent, and their respective MCL or SMCL. Fluoride andnitrate are the only constituents listed which are covered by the primary regu-lations.
Ground-Water Quality 47
Also, although the two-dimensional mapping used to delin-eate the bedrock aquifer systems is useful, it should beremembered that, especially for deeper wells, a significantportion of the water produced could come from aquifer sys-tems underlying the one mapped at the bedrock surface.
Trilinear-diagram analyses
Ground-water samples from aquifer systems in the WestFork White River basin are classified using the trilinear plot-ting strategy described in the sidebar titled Chemical classi-fication of ground water using trilinear diagrams.Trilinear diagrams developed with the available ground-waterchemistry data are presented in appendix 3.
Trilinear analysis indicates that most of the availableground-water samples from the unconsolidated aquifers (92percent) are chemically dominated by alkaline-earth metals(calcium and magnesium) and bicarbonate. Sodium concen-trations exceed 40 percent of the sum of major cations in only8 samples, but variations in sodium levels are observedamong samples. The combined chloride and sulfate concen-tration exceeds 50 percent of the sum of major anions in only2 percent of the samples.
In contrast, approximately 70 percent of the ground-watersamples from the bedrock aquifers are chemically dominatedby alkaline-earth metals (calcium and magnesium) and bicar-bonate. Two-thirds (approximately 22 percent) of the remain-der are chemically dominated by sodium and bicarbonate.The combined chloride and sulfate concentration exceeds 50percent of the sum of major anions in fewer than 4 percent ofthe samples.
Trilinear analysis suggests that the ground water from allbut one of the unconsolidated aquifer systems belong to a dis-tinct hydrochemical facies (appendix 3). Most samples fromthese aquifer systems are chemically dominated by calcium,magnesium, and bicarbonate (Ca-Mg-HCO3). The one excep-tion is the Lacustrine and Backwater Deposits Aquifer systemin which only 2 of the 4 samples belong to this facies. Also,samples from a total of 6 wells in the White River andTributaries Outwash Aquifer system, White River andTributaries Outwash Aquifer subsystem, and the Lacustrineand Backwater Deposits system have sodium as the dominantcation with little calcium or magnesium.
In contrast to the ground-water samples from the unconsol-idated aquifers, samples from some of the bedrock aquifersappear to originate from more than one hydrochemical facies.Although most of the samples in 6 of the 8 bedrock aquifersystems belong to the calcium-magnesium-bicarbonatefacies, a large portion of the samples from the Pennsylvanianaquifer systems belong to the sodium bicarbonate facies. Afew samples from the Pennsylvanian aquifer systems belongto the sodium-chloride facies. A small portion, 5 of the 215ground-water samples from the bedrock aquifer systems, ischemically dominated by calcium, magnesium, and sulfate(Ca-Mg-SO4) ions. Three of these are within an approximate4-mile radius of each other in northeastern Greene and south-eastern Owen counties.
Differences in hydrochemical facies within and betweenaquifer systems may indicate differences in the processesinfluencing ground-water quality. Variations in the mineralcontent of aquifer systems are probably a significant controlon the geochemistry of ground water. For example, the calci-um-magnesium-bicarbonate waters in some wells probablyresult from the dissolution of carbonate minerals. Calcium-magnesium-sulfate dominated ground water in the West ForkWhite River basin probably result from the dissolution ofgypsum, pyrite, or other sulfur-containing minerals. Sodiumbicarbonate dominated ground water may be due to cationexchange processes with surrounding clays and clay miner-als. Ground-water flow from areas of recharge to areas of dis-charge and the subsequent mixing of chemically-distinctground water may also influence the geochemical classifica-tion of ground water in the West Fork White River basin.
Assessment of ground-water quality
Alkalinity and pH
The alkalinity of a solution may be defined as the capacityof its solutes to react with and neutralize acid. The alkalinityin most natural waters is primarily due to the presence of dis-solved carbon species, particularly bicarbonate and carbon-ate. Other constituents that may contribute minor amounts ofalkalinity to water include silicate, hydroxide, borates, andcertain organic compounds (Hem, 1985). In this report, alka-linity is expressed as an equivalent concentration of dissolvedcalcite (CaCO3). At present, no suggested limits have beenestablished for alkalinity levels in drinking water. However,some alkalinity may be desirable in ground water because thecarbonate ions moderate or prevent changes in pH.
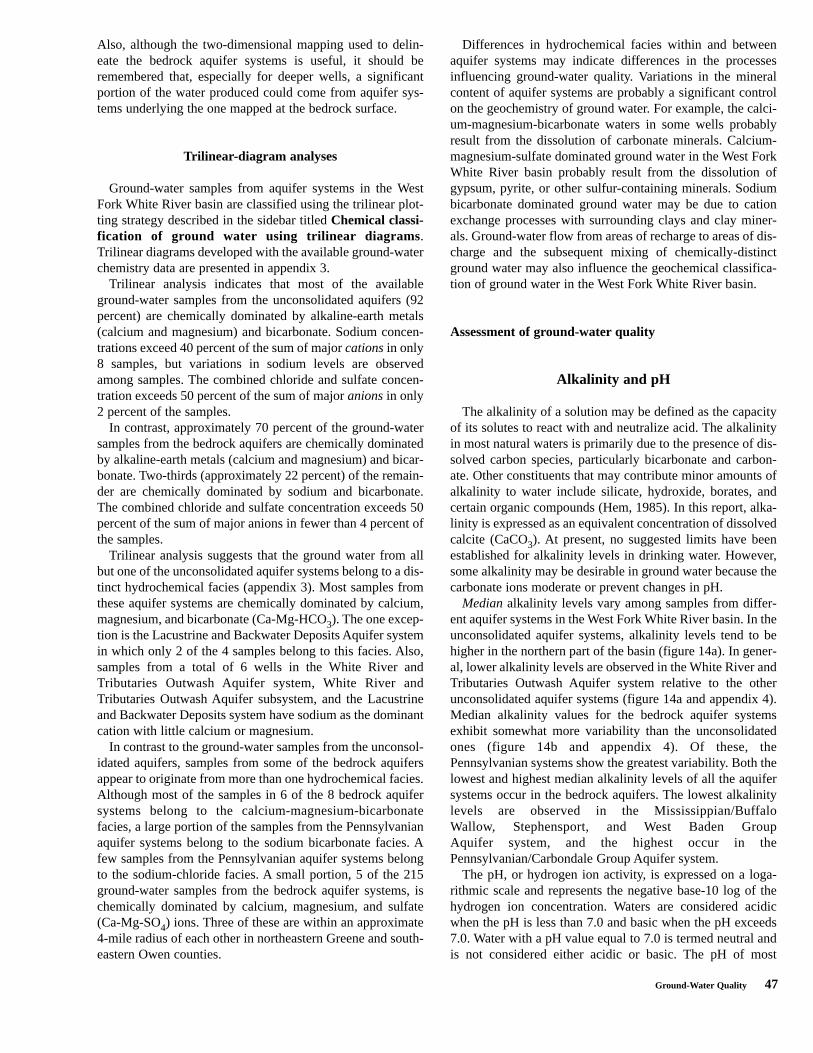
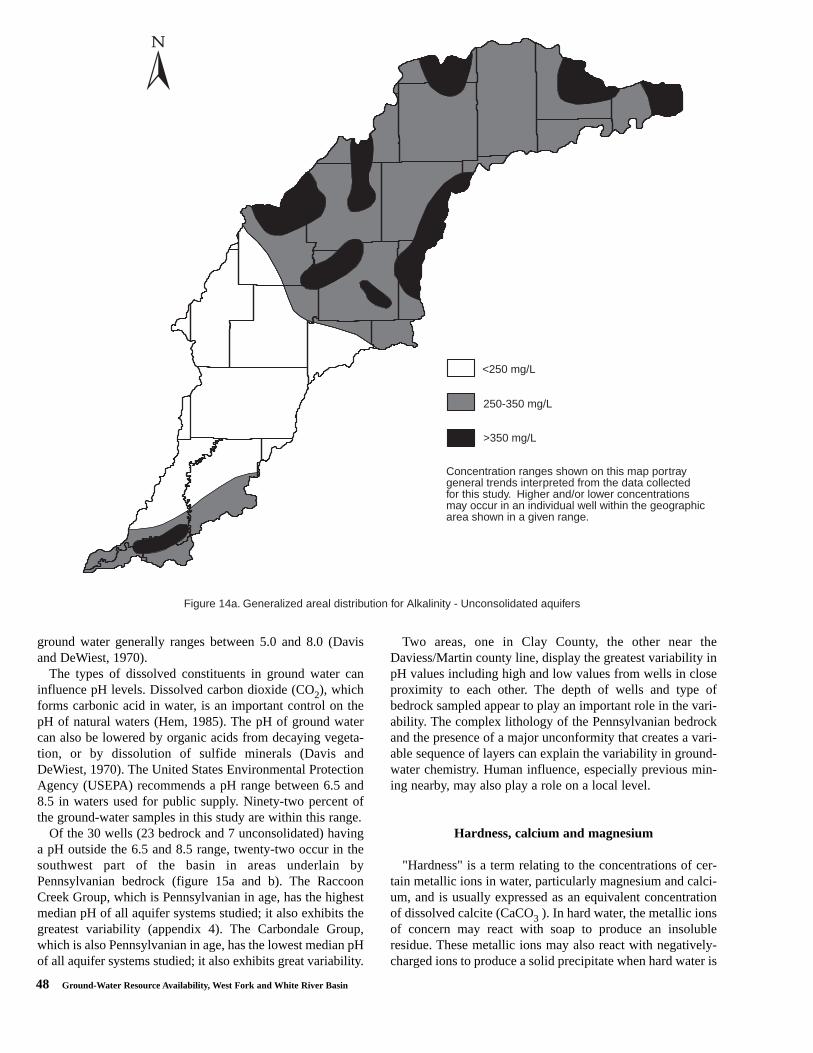
Median alkalinity levels vary among samples from differ-ent aquifer systems in the West Fork White River basin. In theunconsolidated aquifer systems, alkalinity levels tend to behigher in the northern part of the basin (figure 14a). In gener-al, lower alkalinity levels are observed in the White River andTributaries Outwash Aquifer system relative to the otherunconsolidated aquifer systems (figure 14a and appendix 4).Median alkalinity values for the bedrock aquifer systemsexhibit somewhat more variability than the unconsolidatedones (figure 14b and appendix 4). Of these, thePennsylvanian systems show the greatest variability. Both thelowest and highest median alkalinity levels of all the aquifersystems occur in the bedrock aquifers. The lowest alkalinity levels are observed in the Mississippian/Buffalo Wallow, Stephensport, and West Baden GroupAquifer system, and the highest occur in thePennsylvanian/Carbondale Group Aquifer system.
The pH, or hydrogen ion activity, is expressed on a loga-rithmic scale and represents the negative base-10 log of thehydrogen ion concentration. Waters are considered acidicwhen the pH is less than 7.0 and basic when the pH exceeds7.0. Water with a pH value equal to 7.0 is termed neutral andis not considered either acidic or basic. The pH of most
48 Ground-Water Resource Availability, West Fork and White River Basin
Figure 14a. Generalized areal distribution for Alkalinity - Unconsolidated aquifers
<250 mg/L
250-350 mg/L
>350 mg/L
Concentration ranges shown on this map portray general trends interpreted from the data collectedfor this study. Higher and/or lower concentrations may occur in an individual well within the geographic area shown in a given range.
ground water generally ranges between 5.0 and 8.0 (Davisand DeWiest, 1970).
The types of dissolved constituents in ground water caninfluence pH levels. Dissolved carbon dioxide (CO2), whichforms carbonic acid in water, is an important control on thepH of natural waters (Hem, 1985). The pH of ground watercan also be lowered by organic acids from decaying vegeta-tion, or by dissolution of sulfide minerals (Davis andDeWiest, 1970). The United States Environmental ProtectionAgency (USEPA) recommends a pH range between 6.5 and8.5 in waters used for public supply. Ninety-two percent ofthe ground-water samples in this study are within this range.
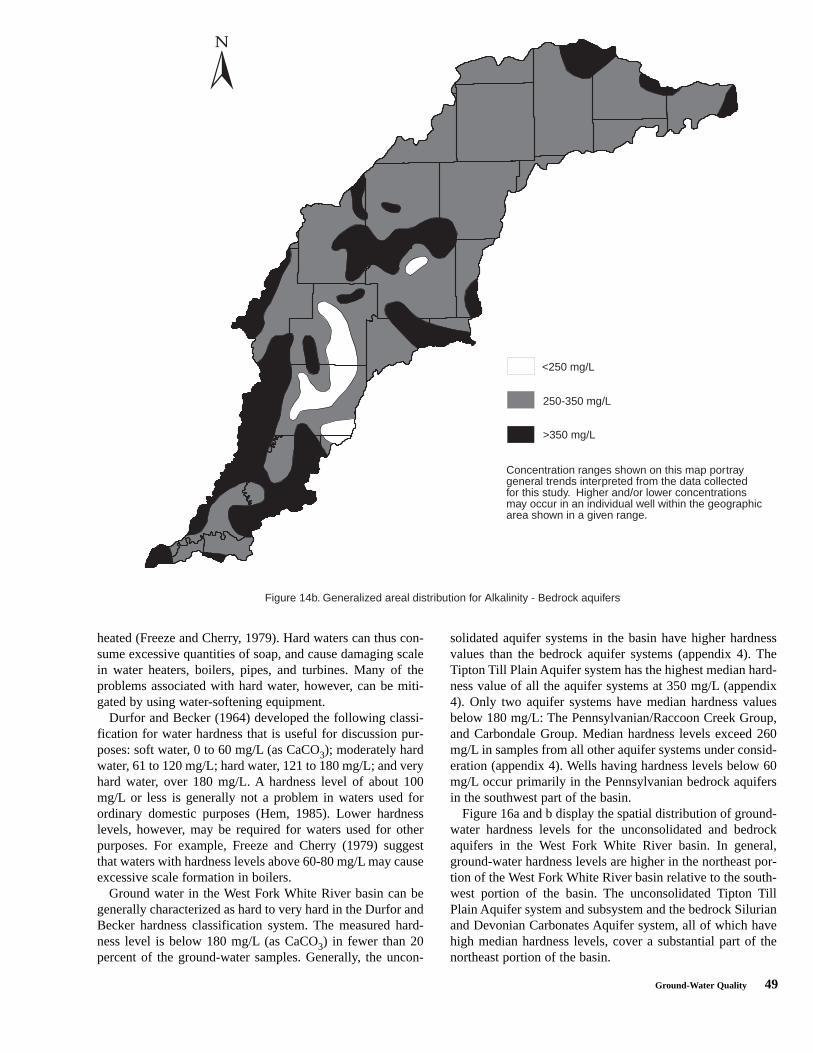
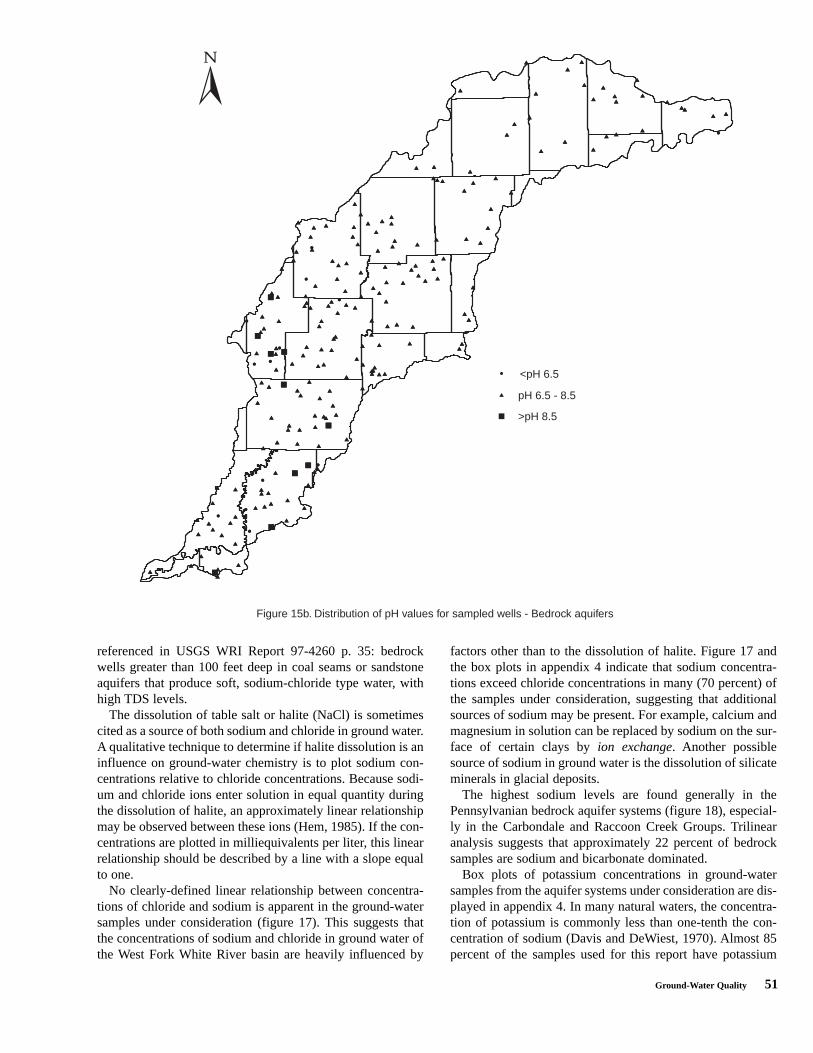
Of the 30 wells (23 bedrock and 7 unconsolidated) havinga pH outside the 6.5 and 8.5 range, twenty-two occur in thesouthwest part of the basin in areas underlain byPennsylvanian bedrock (figure 15a and b). The RaccoonCreek Group, which is Pennsylvanian in age, has the highestmedian pH of all aquifer systems studied; it also exhibits thegreatest variability (appendix 4). The Carbondale Group,which is also Pennsylvanian in age, has the lowest median pHof all aquifer systems studied; it also exhibits great variability.
Two areas, one in Clay County, the other near theDaviess/Martin county line, display the greatest variability inpH values including high and low values from wells in closeproximity to each other. The depth of wells and type ofbedrock sampled appear to play an important role in the vari-ability. The complex lithology of the Pennsylvanian bedrockand the presence of a major unconformity that creates a vari-able sequence of layers can explain the variability in ground-water chemistry. Human influence, especially previous min-ing nearby, may also play a role on a local level.
Hardness, calcium and magnesium
"Hardness" is a term relating to the concentrations of cer-tain metallic ions in water, particularly magnesium and calci-um, and is usually expressed as an equivalent concentrationof dissolved calcite (CaCO3 ). In hard water, the metallic ionsof concern may react with soap to produce an insolubleresidue. These metallic ions may also react with negatively-charged ions to produce a solid precipitate when hard water is
Ground-Water Quality 49
heated (Freeze and Cherry, 1979). Hard waters can thus con-sume excessive quantities of soap, and cause damaging scalein water heaters, boilers, pipes, and turbines. Many of theproblems associated with hard water, however, can be miti-gated by using water-softening equipment.
Durfor and Becker (1964) developed the following classi-fication for water hardness that is useful for discussion pur-poses: soft water, 0 to 60 mg/L (as CaCO3); moderately hardwater, 61 to 120 mg/L; hard water, 121 to 180 mg/L; and veryhard water, over 180 mg/L. A hardness level of about 100mg/L or less is generally not a problem in waters used forordinary domestic purposes (Hem, 1985). Lower hardnesslevels, however, may be required for waters used for otherpurposes. For example, Freeze and Cherry (1979) suggestthat waters with hardness levels above 60-80 mg/L may causeexcessive scale formation in boilers.
Ground water in the West Fork White River basin can begenerally characterized as hard to very hard in the Durfor andBecker hardness classification system. The measured hard-ness level is below 180 mg/L (as CaCO3) in fewer than 20percent of the ground-water samples. Generally, the uncon-
solidated aquifer systems in the basin have higher hardnessvalues than the bedrock aquifer systems (appendix 4). TheTipton Till Plain Aquifer system has the highest median hard-ness value of all the aquifer systems at 350 mg/L (appendix4). Only two aquifer systems have median hardness valuesbelow 180 mg/L: The Pennsylvanian/Raccoon Creek Group,and Carbondale Group. Median hardness levels exceed 260mg/L in samples from all other aquifer systems under consid-eration (appendix 4). Wells having hardness levels below 60mg/L occur primarily in the Pennsylvanian bedrock aquifersin the southwest part of the basin.
Figure 16a and b display the spatial distribution of ground-water hardness levels for the unconsolidated and bedrockaquifers in the West Fork White River basin. In general,ground-water hardness levels are higher in the northeast por-tion of the West Fork White River basin relative to the south-west portion of the basin. The unconsolidated Tipton TillPlain Aquifer system and subsystem and the bedrock Silurianand Devonian Carbonates Aquifer system, all of which havehigh median hardness levels, cover a substantial part of thenortheast portion of the basin.
Figure 14b. Generalized areal distribution for Alkalinity - Bedrock aquifers
<250 mg/L
250-350 mg/L
>350 mg/L
Concentration ranges shown on this map portray general trends interpreted from the data collectedfor this study. Higher and/or lower concentrations may occur in an individual well within the geographic area shown in a given range.
50 Ground-Water Resource Availability, West Fork and White River Basin
<pH 6.5
pH 6.5 - 8.5
>pH 8.5
Figure 15a. Distribution of pH values for sampled wells - Unconsolidated aquifers
Box plots of calcium and magnesium concentrations inground water are presented in appendix 4. Because calciumand magnesium are the major constituents responsible forhardness in water, the highest levels of these ions generallyoccur in ground water with high hardness levels. As expect-ed, the unconsolidated Tipton Till Plain Aquifer system andsubsystem and the bedrock Silurian and Devonian CarbonatesAquifer system have high median calcium and magnesiumlevels relative to most of the other aquifer systems. At thetime of this publication, no enforceable or suggested stan-dards have been established for calcium or magnesium.
Chloride, sodium and potassium
Chloride in ground water may originate from varioussources including: the dissolution of halite and related miner-als, marine water entrapped in sediments, and anthropogenicsources. Although chloride is often an important dissolvedconstituent in ground water, only three of the samples fromthe aquifer systems in the West Fork White River basin are
classified as chloride dominated (appendix 3). Median chlo-ride levels are less than 15 mg/L in all of the aquifer systemsunder consideration except the New Albany Shale (appendix4). The highest median levels of all aquifer systems (approx-imately 40 mg/L) are in the Devonian and Mississippian NewAlbany Shale (appendix 4). The highest median values forunconsolidated aquifers occur in the White River andTributaries Outwash subsystem and White River andTributaries Outwash. Chloride concentrations at or above 250mg/L, the SMCL for this ion, are detected in only six samples,all from bedrock aquifers.
Anthropogenic processes can locally affect chloride con-centrations in ground water. Some anthropogenic factorscommonly cited as influences on chloride levels in waterinclude road salting during the winter, improper disposal ofoil-field brines, contamination from sewage, and contamina-tion from various types of industrial wastes (Hem, 1985,1993). Five of the six wells with chloride levels at or abovethe SMCL occur in the southwestern part of the basin in thePennsylvanian/Raccoon Creek Group Aquifer system. Thesewells have characteristics similar to the "soda water" wells
Ground-Water Quality 51
referenced in USGS WRI Report 97-4260 p. 35: bedrockwells greater than 100 feet deep in coal seams or sandstoneaquifers that produce soft, sodium-chloride type water, withhigh TDS levels.
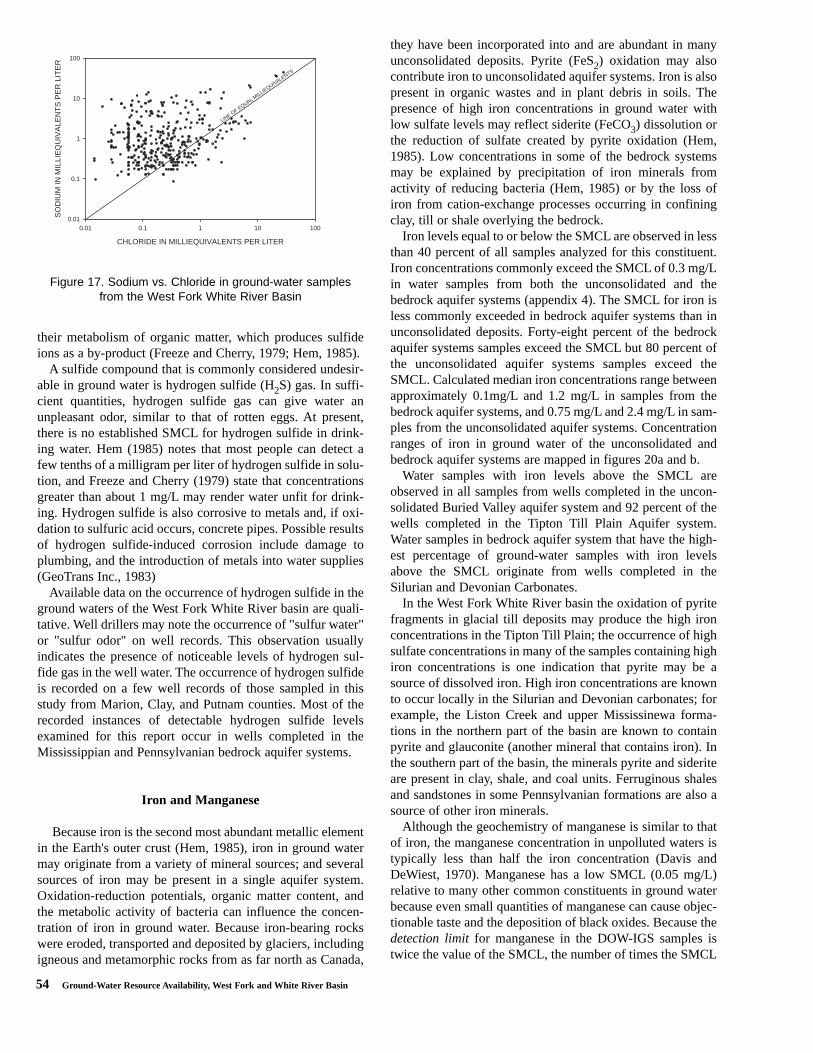
The dissolution of table salt or halite (NaCl) is sometimescited as a source of both sodium and chloride in ground water.A qualitative technique to determine if halite dissolution is aninfluence on ground-water chemistry is to plot sodium con-centrations relative to chloride concentrations. Because sodi-um and chloride ions enter solution in equal quantity duringthe dissolution of halite, an approximately linear relationshipmay be observed between these ions (Hem, 1985). If the con-centrations are plotted in milliequivalents per liter, this linearrelationship should be described by a line with a slope equalto one.
No clearly-defined linear relationship between concentra-tions of chloride and sodium is apparent in the ground-watersamples under consideration (figure 17). This suggests thatthe concentrations of sodium and chloride in ground water ofthe West Fork White River basin are heavily influenced by
factors other than to the dissolution of halite. Figure 17 andthe box plots in appendix 4 indicate that sodium concentra-tions exceed chloride concentrations in many (70 percent) ofthe samples under consideration, suggesting that additionalsources of sodium may be present. For example, calcium andmagnesium in solution can be replaced by sodium on the sur-face of certain clays by ion exchange. Another possiblesource of sodium in ground water is the dissolution of silicateminerals in glacial deposits.
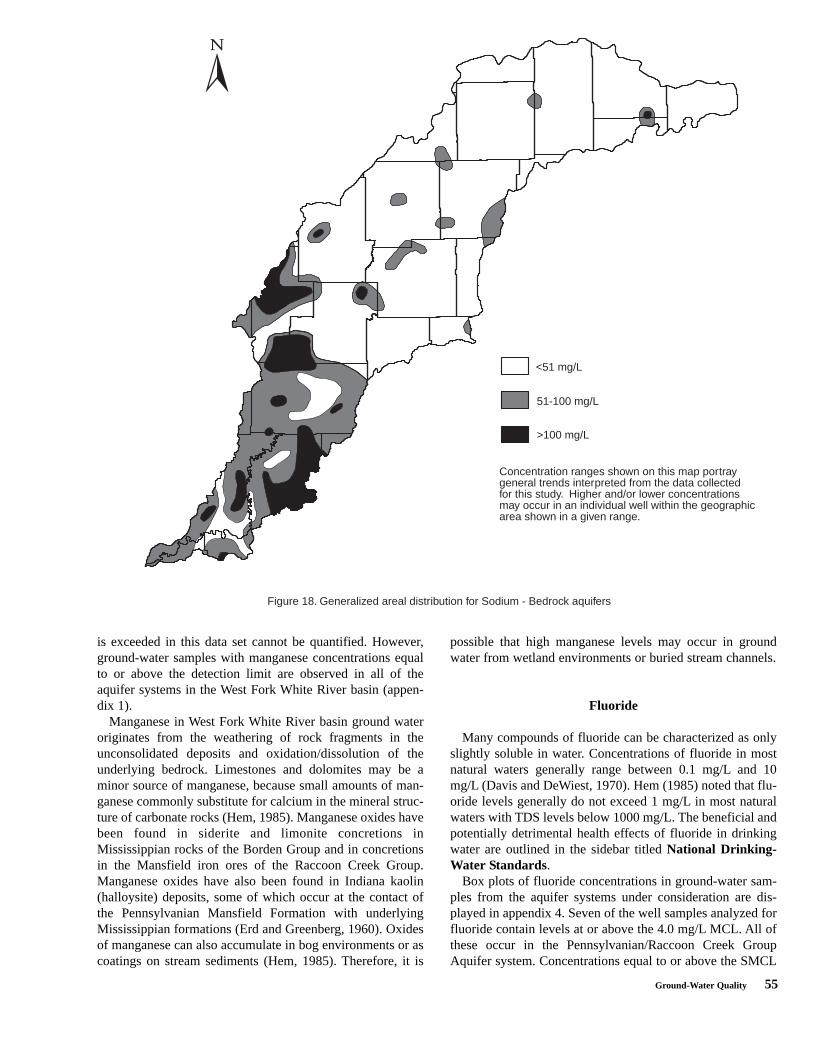
The highest sodium levels are found generally in thePennsylvanian bedrock aquifer systems (figure 18), especial-ly in the Carbondale and Raccoon Creek Groups. Trilinearanalysis suggests that approximately 22 percent of bedrocksamples are sodium and bicarbonate dominated.
Box plots of potassium concentrations in ground-watersamples from the aquifer systems under consideration are dis-played in appendix 4. In many natural waters, the concentra-tion of potassium is commonly less than one-tenth the con-centration of sodium (Davis and DeWiest, 1970). Almost 85percent of the samples used for this report have potassium
<pH 6.5
pH 6.5 - 8.5
>pH 8.5
Figure 15b. Distribution of pH values for sampled wells - Bedrock aquifers
52 Ground-Water Resource Availability, West Fork and White River Basin
concentrations that are less than one-tenth the concentrationof sodium.
Sulfate and sulfide
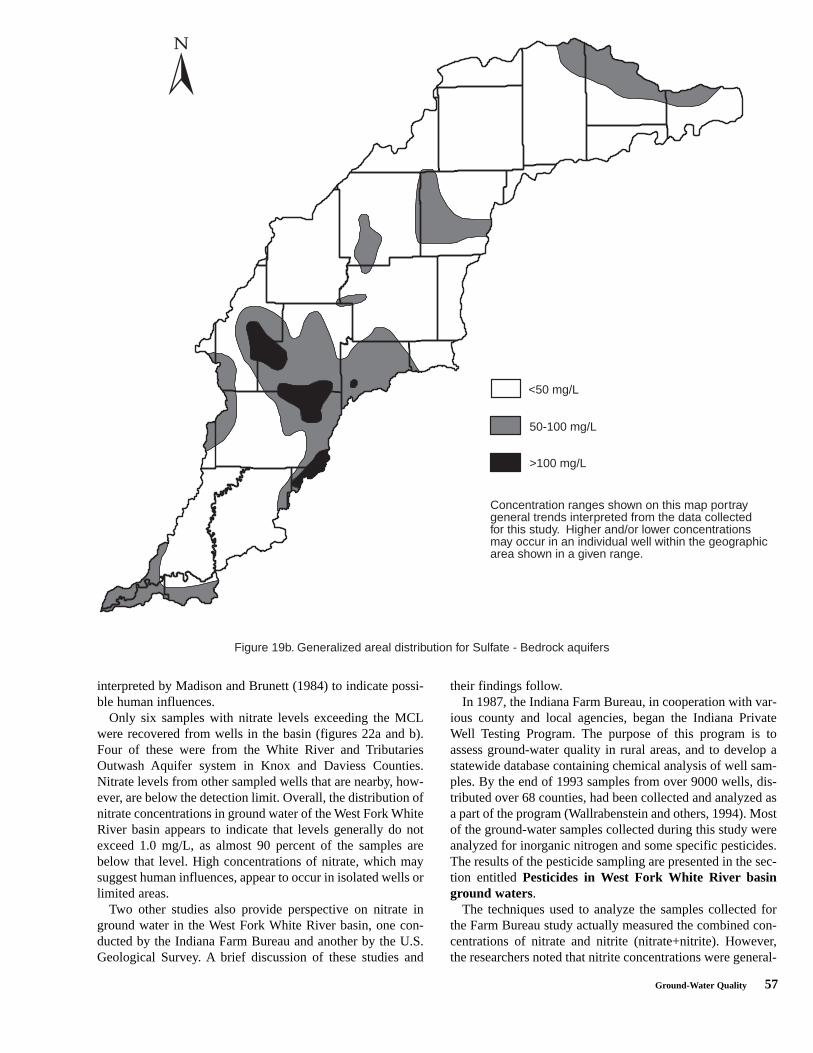
Sulfate (SO4), an anion formed by oxidation of the elementsulfur, is commonly observed in ground water. The estab-lished secondary maximum contaminant level (SMCL) forsulfate is 250 mg/L. Median sulfate levels for the samplesfrom all aquifer systems in the West Fork White River arewell below the SMCL. However, there are 8 ground-watersamples that have sulfate concentrations above the SMCL,and another 16 samples have sulfate concentrations above100 mg/L. The eight samples having sulfate values above theSMCL are all bedrock wells located in the southern part ofOwen and Clay Counties and the northern part of GreeneCounty. The other 16 are also located primarily in the south-west part of the basin with about half from unconsolidatedaquifer systems. In general, sulfate levels are higher in thebedrock aquifer systems in the basin than in the unconsoli-
dated systems. But, median sulfate concentrations vary con-siderably in both bedrock and unconsolidated aquifer sys-tems.
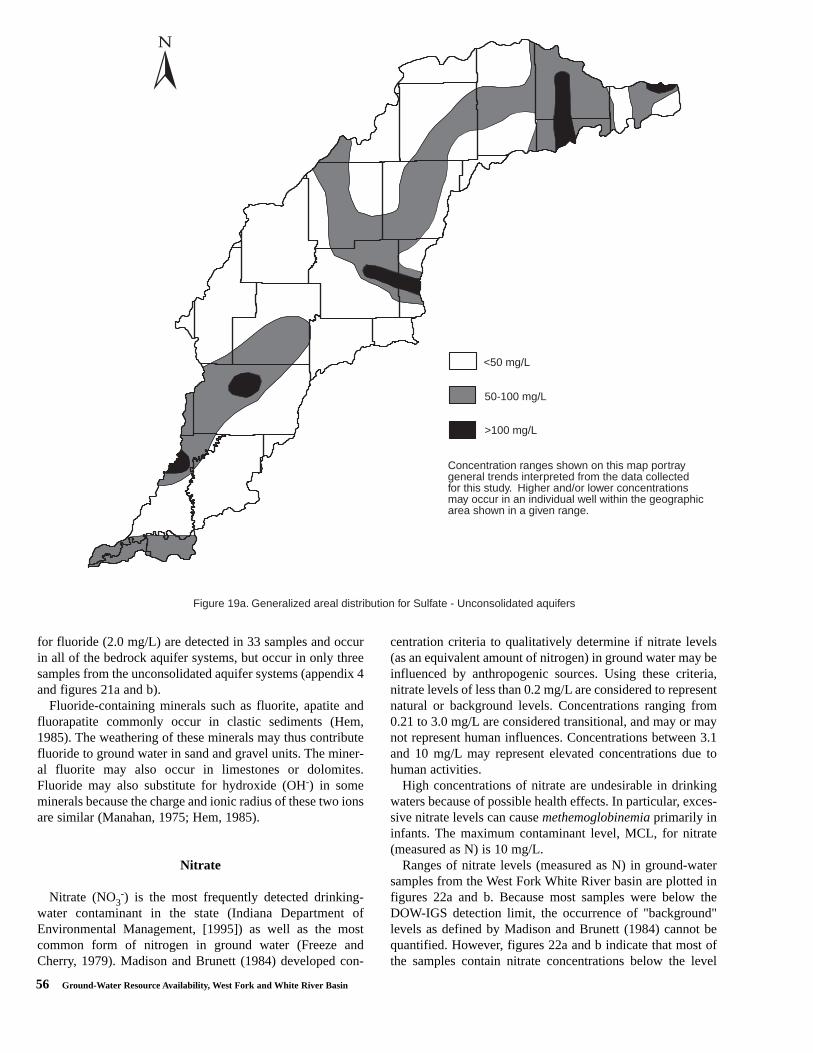
Concentration ranges of sulfate in the unconsolidatedaquifer systems are shown in figures 19a and b. Of the uncon-solidated aquifer systems, the White River and TributariesOutwash Aquifer system has the highest median levels. Theaquifer system having the overall highest median levels is theMississippian/Buffalo Wallow, Stephensport, and West BadenGroup bedrock aquifer system; however, it must be remem-bered that the boundaries of each bedrock aquifer system arebased on the boundaries of the subcrop of each major bedrocksystem. Therefore, wells located within this bedrock aquifersystem may actually extend through the upper system into theunderlying aquifer system (Blue River Group).
Various geochemical processes, sources, and time mayinfluence the concentration of sulfate in ground water. Oneimportant source is the dissolution or weathering of sulfur-containing minerals. Two possible mineral sources of sulfatehave been identified in the aquifers of the West Fork WhiteRiver basin.
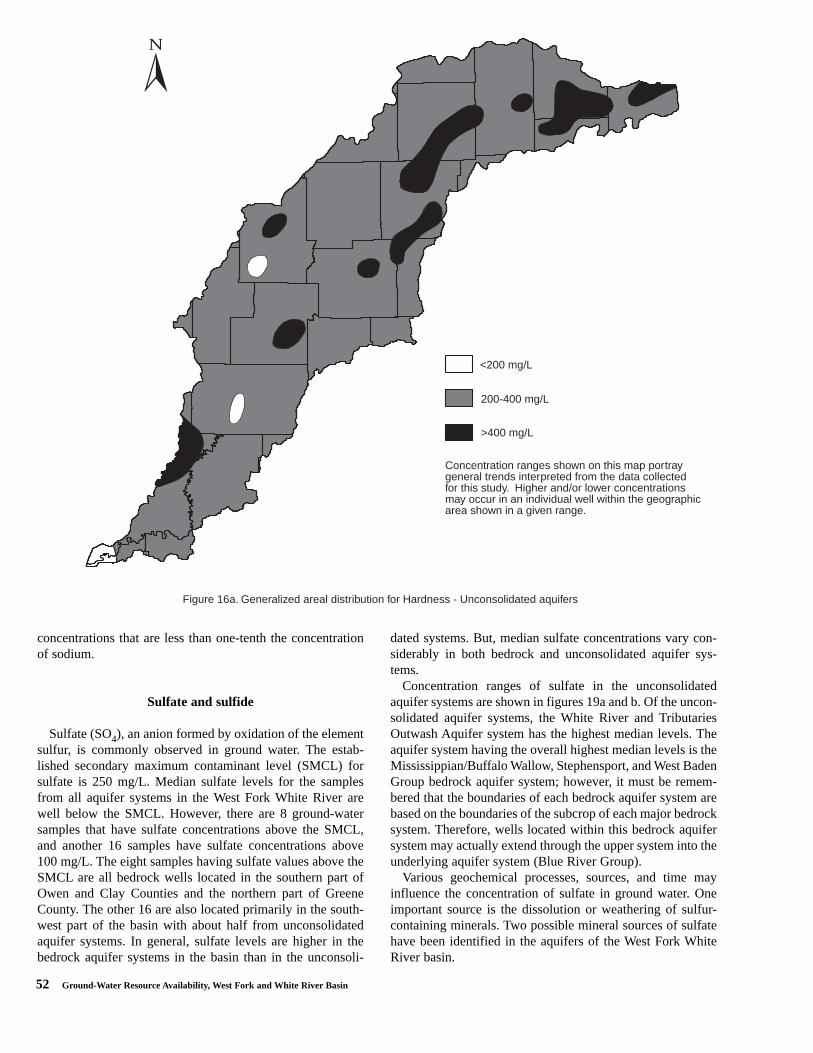
Concentration ranges shown on this map portray general trends interpreted from the data collectedfor this study. Higher and/or lower concentrations may occur in an individual well within the geographic area shown in a given range.
Figure 16a. Generalized areal distribution for Hardness - Unconsolidated aquifers
<200 mg/L
200-400 mg/L
>400 mg/L
Ground-Water Quality 53
The first includes evaporite minerals, such as gypsum andanhydrite (CaSO4). Gypsum and anhydrite are the two calci-um sulphate minerals occurring in nature. Evaporite mineralsare known to occur in both Mississippian and Devonianbedrock, and to a lesser extent, in Pennsylvanian and Silurianbedrock. Fragments of evaporite-bearing rocks may also havebeen incorporated into some unconsolidated units duringglacial advances. There are rather extensive gypsum depositsin the lower part of the St. Louis limestone. The St. Louisevaporite unit accumulated in small basins within largerbasins (intrasilled basins). Three major intrasilled basins existin southwestern Indiana and are aligned in a northwest-south-east direction that corresponds to the trend of the rock forma-tions. The maximum accumulation of the evaporites corre-sponds to the geographic locations of the intrasilled basins.One of these intrasilled basins lies within the West ForkWhite River basin in northern Greene County, southwesternOwen County, and southern Clay County.
The second possible mineral source of sulfate is pyrite(FeS2), a mineral present in Silurian dolomite as highly local-ized nodules. Pyrite is also a common mineral in carbona-ceous or black shales and Pennsylvanian coal beds. The oxi-dation of pyrite releases iron and sulfate into solution.
The high-sulfate ground-water samples taken from westernMonroe, northeastern Greene, and southeastern Owen coun-ties appear to be a result of dissolution of gypsum depositsrelated to the St. Louis limestone deposits. The high-sulfateground-water samples taken from western Owen and Claycounties may be related to past coal-mining operations near-by. However, it is not apparent what the sources of other high-sulfate samples in the basin are.
Under reducing, low-oxygen conditions, sulfide (S-2) maybe the dominant species of sulfur in ground water. Some ofthe most important influences on the levels of sulfide inground water are the metabolic processes of certain types ofanaerobic bacteria. These bacteria use sulfate reduction in
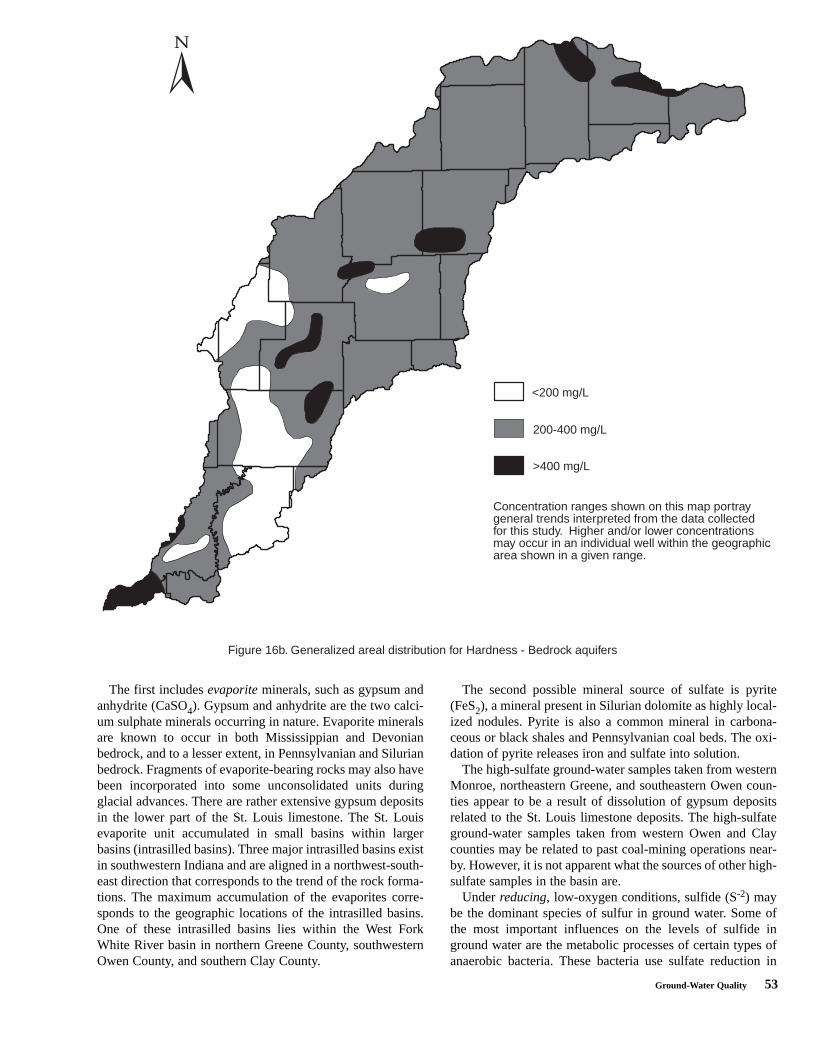
Figure 16b. Generalized areal distribution for Hardness - Bedrock aquifers
<200 mg/L
200-400 mg/L
>400 mg/L
Concentration ranges shown on this map portray general trends interpreted from the data collectedfor this study. Higher and/or lower concentrations may occur in an individual well within the geographic area shown in a given range.
54 Ground-Water Resource Availability, West Fork and White River Basin
their metabolism of organic matter, which produces sulfideions as a by-product (Freeze and Cherry, 1979; Hem, 1985).
A sulfide compound that is commonly considered undesir-able in ground water is hydrogen sulfide (H2S) gas. In suffi-cient quantities, hydrogen sulfide gas can give water anunpleasant odor, similar to that of rotten eggs. At present,there is no established SMCL for hydrogen sulfide in drink-ing water. Hem (1985) notes that most people can detect afew tenths of a milligram per liter of hydrogen sulfide in solu-tion, and Freeze and Cherry (1979) state that concentrationsgreater than about 1 mg/L may render water unfit for drink-ing. Hydrogen sulfide is also corrosive to metals and, if oxi-dation to sulfuric acid occurs, concrete pipes. Possible resultsof hydrogen sulfide-induced corrosion include damage toplumbing, and the introduction of metals into water supplies(GeoTrans Inc., 1983)
Available data on the occurrence of hydrogen sulfide in theground waters of the West Fork White River basin are quali-tative. Well drillers may note the occurrence of "sulfur water"or "sulfur odor" on well records. This observation usuallyindicates the presence of noticeable levels of hydrogen sul-fide gas in the well water. The occurrence of hydrogen sulfideis recorded on a few well records of those sampled in thisstudy from Marion, Clay, and Putnam counties. Most of therecorded instances of detectable hydrogen sulfide levelsexamined for this report occur in wells completed in theMississippian and Pennsylvanian bedrock aquifer systems.
Iron and Manganese
Because iron is the second most abundant metallic elementin the Earth's outer crust (Hem, 1985), iron in ground watermay originate from a variety of mineral sources; and severalsources of iron may be present in a single aquifer system.Oxidation-reduction potentials, organic matter content, andthe metabolic activity of bacteria can influence the concen-tration of iron in ground water. Because iron-bearing rockswere eroded, transported and deposited by glaciers, includingigneous and metamorphic rocks from as far north as Canada,
they have been incorporated into and are abundant in manyunconsolidated deposits. Pyrite (FeS2) oxidation may alsocontribute iron to unconsolidated aquifer systems. Iron is alsopresent in organic wastes and in plant debris in soils. Thepresence of high iron concentrations in ground water withlow sulfate levels may reflect siderite (FeCO3) dissolution orthe reduction of sulfate created by pyrite oxidation (Hem,1985). Low concentrations in some of the bedrock systemsmay be explained by precipitation of iron minerals fromactivity of reducing bacteria (Hem, 1985) or by the loss ofiron from cation-exchange processes occurring in confiningclay, till or shale overlying the bedrock.
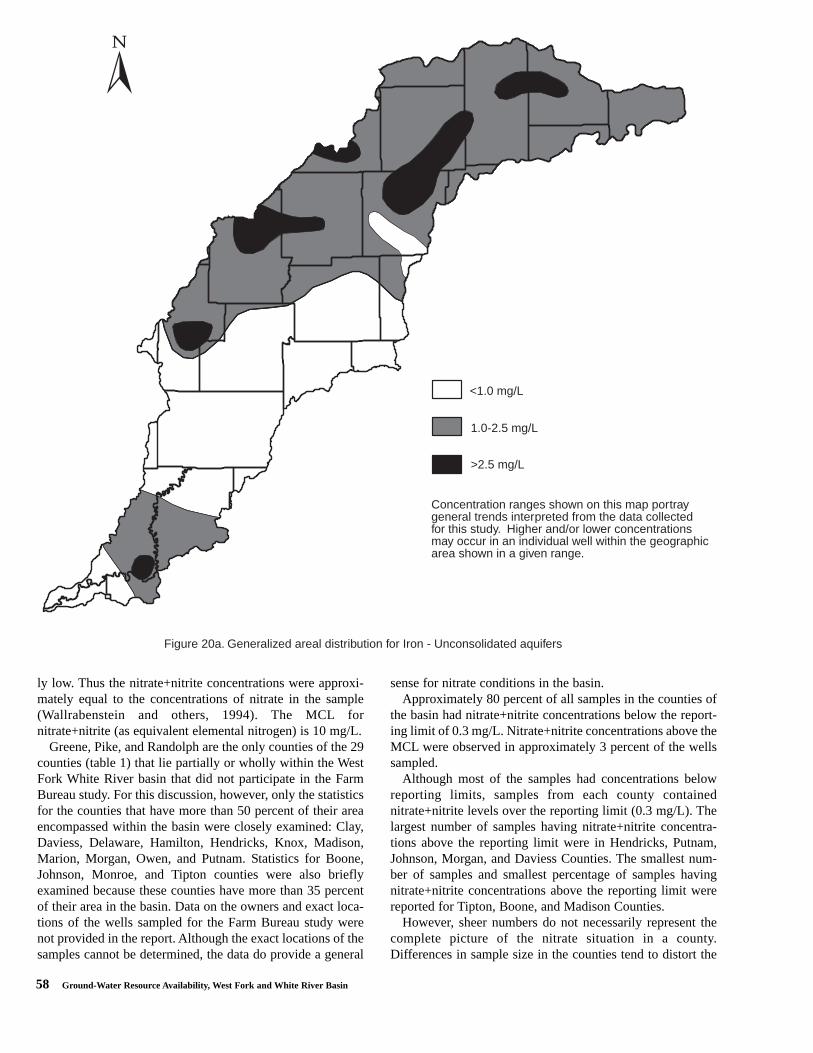
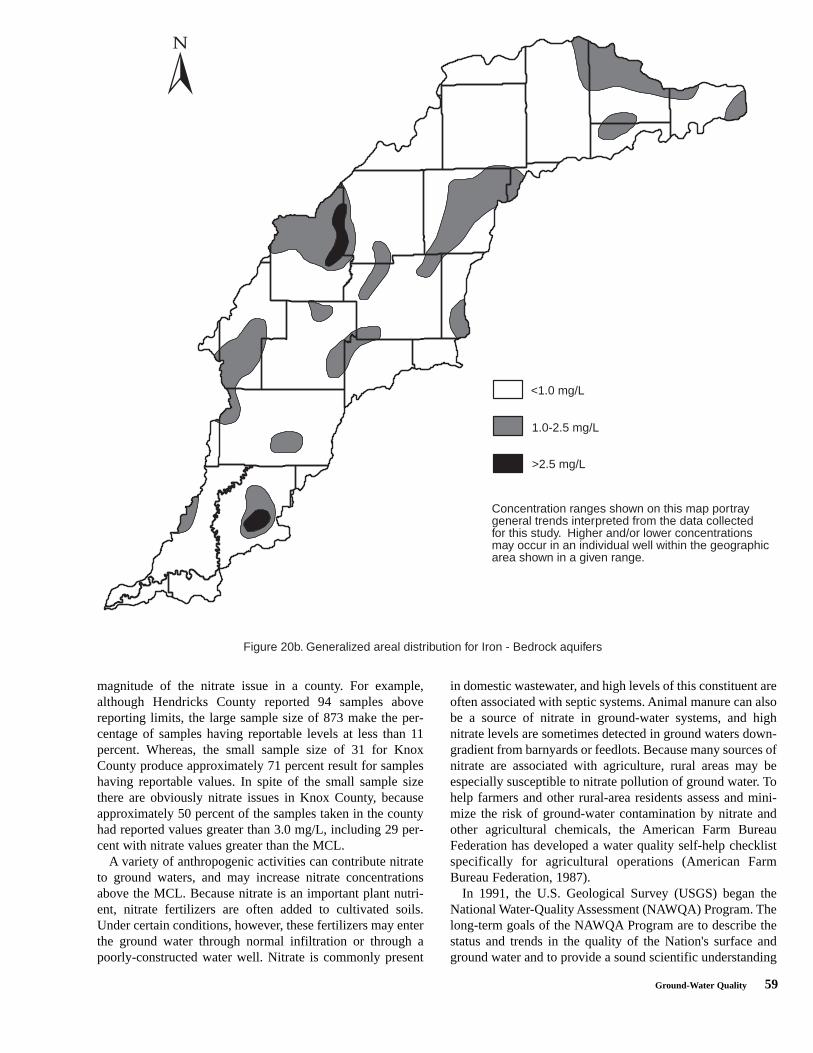
Iron levels equal to or below the SMCL are observed in lessthan 40 percent of all samples analyzed for this constituent.Iron concentrations commonly exceed the SMCL of 0.3 mg/Lin water samples from both the unconsolidated and thebedrock aquifer systems (appendix 4). The SMCL for iron isless commonly exceeded in bedrock aquifer systems than inunconsolidated deposits. Forty-eight percent of the bedrockaquifer systems samples exceed the SMCL but 80 percent ofthe unconsolidated aquifer systems samples exceed theSMCL. Calculated median iron concentrations range betweenapproximately 0.1mg/L and 1.2 mg/L in samples from thebedrock aquifer systems, and 0.75 mg/L and 2.4 mg/L in sam-ples from the unconsolidated aquifer systems. Concentrationranges of iron in ground water of the unconsolidated andbedrock aquifer systems are mapped in figures 20a and b.
Water samples with iron levels above the SMCL areobserved in all samples from wells completed in the uncon-solidated Buried Valley aquifer system and 92 percent of thewells completed in the Tipton Till Plain Aquifer system.Water samples in bedrock aquifer system that have the high-est percentage of ground-water samples with iron levelsabove the SMCL originate from wells completed in theSilurian and Devonian Carbonates.
In the West Fork White River basin the oxidation of pyritefragments in glacial till deposits may produce the high ironconcentrations in the Tipton Till Plain; the occurrence of highsulfate concentrations in many of the samples containing highiron concentrations is one indication that pyrite may be asource of dissolved iron. High iron concentrations are knownto occur locally in the Silurian and Devonian carbonates; forexample, the Liston Creek and upper Mississinewa forma-tions in the northern part of the basin are known to containpyrite and glauconite (another mineral that contains iron). Inthe southern part of the basin, the minerals pyrite and sideriteare present in clay, shale, and coal units. Ferruginous shalesand sandstones in some Pennsylvanian formations are also asource of other iron minerals.
Although the geochemistry of manganese is similar to thatof iron, the manganese concentration in unpolluted waters istypically less than half the iron concentration (Davis andDeWiest, 1970). Manganese has a low SMCL (0.05 mg/L)relative to many other common constituents in ground waterbecause even small quantities of manganese can cause objec-tionable taste and the deposition of black oxides. Because thedetection limit for manganese in the DOW-IGS samples istwice the value of the SMCL, the number of times the SMCL
CHLORIDE IN MILLIEQUIVALENTS PER LITER
0.01 0.1 1 10 100
SO
DIU
MIN
MIL
LIE
QU
IVA
LEN
TS
PE
RLI
TE
R
0.01
0.1
1
10
100
LINE OF EQUAL M
ILLIEQUIVALENTS
Figure 17. Sodium vs. Chloride in ground-water samplesfrom the West Fork White River Basin
Ground-Water Quality 55
is exceeded in this data set cannot be quantified. However,ground-water samples with manganese concentrations equalto or above the detection limit are observed in all of theaquifer systems in the West Fork White River basin (appen-dix 1).
Manganese in West Fork White River basin ground wateroriginates from the weathering of rock fragments in theunconsolidated deposits and oxidation/dissolution of theunderlying bedrock. Limestones and dolomites may be aminor source of manganese, because small amounts of man-ganese commonly substitute for calcium in the mineral struc-ture of carbonate rocks (Hem, 1985). Manganese oxides havebeen found in siderite and limonite concretions inMississippian rocks of the Borden Group and in concretionsin the Mansfield iron ores of the Raccoon Creek Group.Manganese oxides have also been found in Indiana kaolin(halloysite) deposits, some of which occur at the contact ofthe Pennsylvanian Mansfield Formation with underlyingMississippian formations (Erd and Greenberg, 1960). Oxidesof manganese can also accumulate in bog environments or ascoatings on stream sediments (Hem, 1985). Therefore, it is
possible that high manganese levels may occur in groundwater from wetland environments or buried stream channels.
Fluoride
Many compounds of fluoride can be characterized as onlyslightly soluble in water. Concentrations of fluoride in mostnatural waters generally range between 0.1 mg/L and 10mg/L (Davis and DeWiest, 1970). Hem (1985) noted that flu-oride levels generally do not exceed 1 mg/L in most naturalwaters with TDS levels below 1000 mg/L. The beneficial andpotentially detrimental health effects of fluoride in drinkingwater are outlined in the sidebar titled National Drinking-Water Standards.
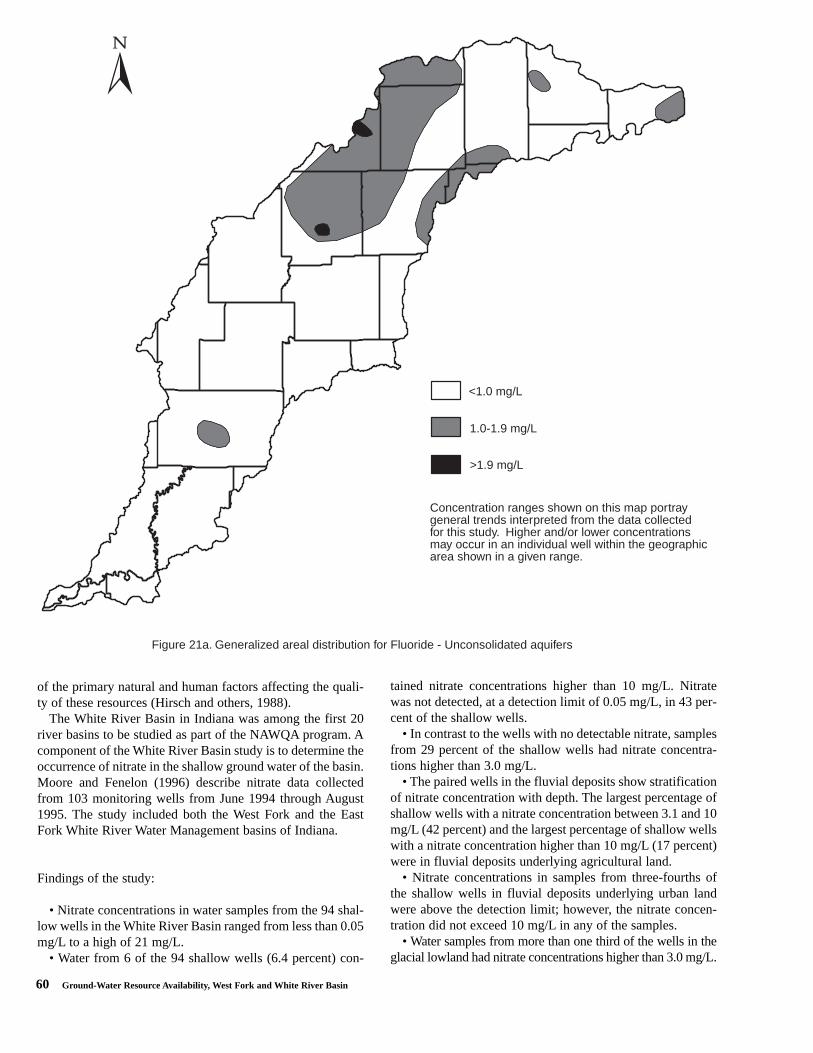
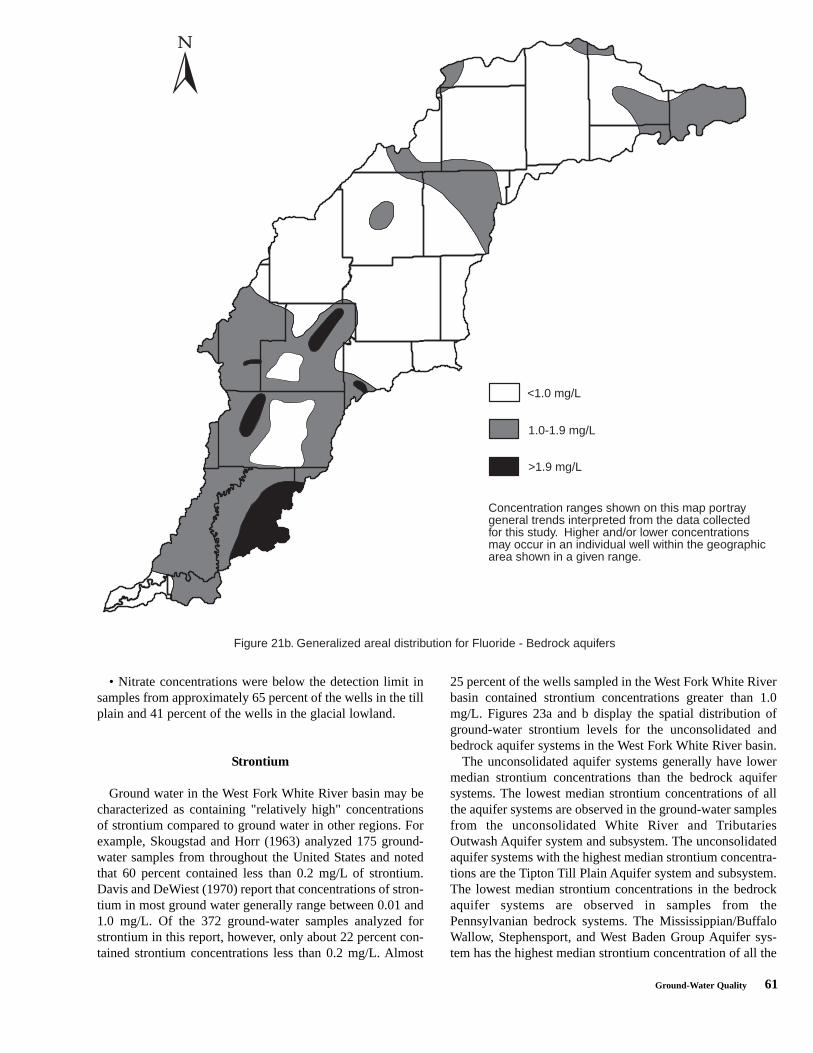
Box plots of fluoride concentrations in ground-water sam-ples from the aquifer systems under consideration are dis-played in appendix 4. Seven of the well samples analyzed forfluoride contain levels at or above the 4.0 mg/L MCL. All ofthese occur in the Pennsylvanian/Raccoon Creek GroupAquifer system. Concentrations equal to or above the SMCL
Figure 18. Generalized areal distribution for Sodium - Bedrock aquifers
<51 mg/L
51-100 mg/L
>100 mg/L
Concentration ranges shown on this map portray general trends interpreted from the data collectedfor this study. Higher and/or lower concentrations may occur in an individual well within the geographic area shown in a given range.
56 Ground-Water Resource Availability, West Fork and White River Basin
Figure 19a. Generalized areal distribution for Sulfate - Unconsolidated aquifers
<50 mg/L
50-100 mg/L
>100 mg/L
Concentration ranges shown on this map portray general trends interpreted from the data collectedfor this study. Higher and/or lower concentrations may occur in an individual well within the geographic area shown in a given range.
for fluoride (2.0 mg/L) are detected in 33 samples and occurin all of the bedrock aquifer systems, but occur in only threesamples from the unconsolidated aquifer systems (appendix 4and figures 21a and b).
Fluoride-containing minerals such as fluorite, apatite andfluorapatite commonly occur in clastic sediments (Hem,1985). The weathering of these minerals may thus contributefluoride to ground water in sand and gravel units. The miner-al fluorite may also occur in limestones or dolomites.Fluoride may also substitute for hydroxide (OH-) in someminerals because the charge and ionic radius of these two ionsare similar (Manahan, 1975; Hem, 1985).
Nitrate
Nitrate (NO3-) is the most frequently detected drinking-
water contaminant in the state (Indiana Department ofEnvironmental Management, [1995]) as well as the mostcommon form of nitrogen in ground water (Freeze andCherry, 1979). Madison and Brunett (1984) developed con-
centration criteria to qualitatively determine if nitrate levels(as an equivalent amount of nitrogen) in ground water may beinfluenced by anthropogenic sources. Using these criteria,nitrate levels of less than 0.2 mg/L are considered to representnatural or background levels. Concentrations ranging from0.21 to 3.0 mg/L are considered transitional, and may or maynot represent human influences. Concentrations between 3.1and 10 mg/L may represent elevated concentrations due tohuman activities.
High concentrations of nitrate are undesirable in drinkingwaters because of possible health effects. In particular, exces-sive nitrate levels can cause methemoglobinemia primarily ininfants. The maximum contaminant level, MCL, for nitrate(measured as N) is 10 mg/L.
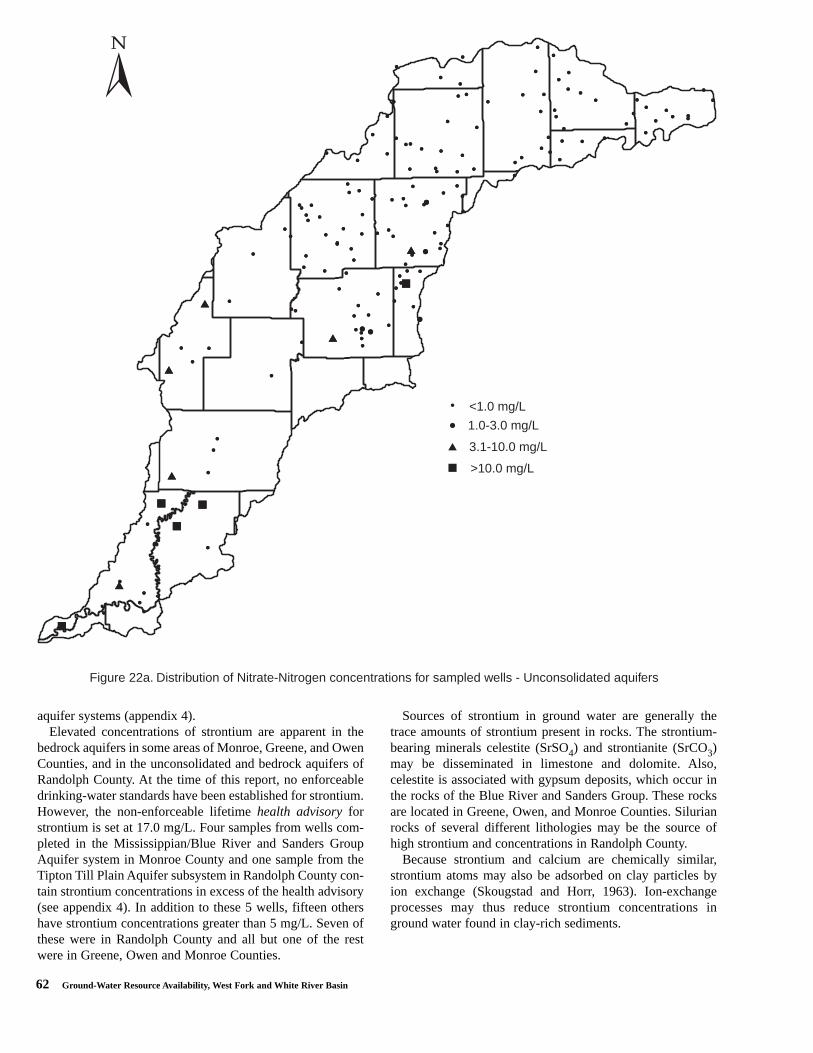
Ranges of nitrate levels (measured as N) in ground-watersamples from the West Fork White River basin are plotted infigures 22a and b. Because most samples were below theDOW-IGS detection limit, the occurrence of "background"levels as defined by Madison and Brunett (1984) cannot bequantified. However, figures 22a and b indicate that most ofthe samples contain nitrate concentrations below the level
Ground-Water Quality 57
interpreted by Madison and Brunett (1984) to indicate possi-ble human influences.
Only six samples with nitrate levels exceeding the MCLwere recovered from wells in the basin (figures 22a and b).Four of these were from the White River and TributariesOutwash Aquifer system in Knox and Daviess Counties.Nitrate levels from other sampled wells that are nearby, how-ever, are below the detection limit. Overall, the distribution ofnitrate concentrations in ground water of the West Fork WhiteRiver basin appears to indicate that levels generally do notexceed 1.0 mg/L, as almost 90 percent of the samples arebelow that level. High concentrations of nitrate, which maysuggest human influences, appear to occur in isolated wells orlimited areas.
Two other studies also provide perspective on nitrate inground water in the West Fork White River basin, one con-ducted by the Indiana Farm Bureau and another by the U.S.Geological Survey. A brief discussion of these studies and
their findings follow.In 1987, the Indiana Farm Bureau, in cooperation with var-
ious county and local agencies, began the Indiana PrivateWell Testing Program. The purpose of this program is toassess ground-water quality in rural areas, and to develop astatewide database containing chemical analysis of well sam-ples. By the end of 1993 samples from over 9000 wells, dis-tributed over 68 counties, had been collected and analyzed asa part of the program (Wallrabenstein and others, 1994). Mostof the ground-water samples collected during this study wereanalyzed for inorganic nitrogen and some specific pesticides.The results of the pesticide sampling are presented in the sec-tion entitled Pesticides in West Fork White River basinground waters.
The techniques used to analyze the samples collected forthe Farm Bureau study actually measured the combined con-centrations of nitrate and nitrite (nitrate+nitrite). However,the researchers noted that nitrite concentrations were general-
Figure 19b. Generalized areal distribution for Sulfate - Bedrock aquifers
<50 mg/L
50-100 mg/L
>100 mg/L
Concentration ranges shown on this map portray general trends interpreted from the data collectedfor this study. Higher and/or lower concentrations may occur in an individual well within the geographic area shown in a given range.
58 Ground-Water Resource Availability, West Fork and White River Basin
ly low. Thus the nitrate+nitrite concentrations were approxi-mately equal to the concentrations of nitrate in the sample(Wallrabenstein and others, 1994). The MCL fornitrate+nitrite (as equivalent elemental nitrogen) is 10 mg/L.
Greene, Pike, and Randolph are the only counties of the 29counties (table 1) that lie partially or wholly within the WestFork White River basin that did not participate in the FarmBureau study. For this discussion, however, only the statisticsfor the counties that have more than 50 percent of their areaencompassed within the basin were closely examined: Clay,Daviess, Delaware, Hamilton, Hendricks, Knox, Madison,Marion, Morgan, Owen, and Putnam. Statistics for Boone,Johnson, Monroe, and Tipton counties were also brieflyexamined because these counties have more than 35 percentof their area in the basin. Data on the owners and exact loca-tions of the wells sampled for the Farm Bureau study werenot provided in the report. Although the exact locations of thesamples cannot be determined, the data do provide a general
sense for nitrate conditions in the basin.Approximately 80 percent of all samples in the counties of
the basin had nitrate+nitrite concentrations below the report-ing limit of 0.3 mg/L. Nitrate+nitrite concentrations above theMCL were observed in approximately 3 percent of the wellssampled.
Although most of the samples had concentrations belowreporting limits, samples from each county containednitrate+nitrite levels over the reporting limit (0.3 mg/L). Thelargest number of samples having nitrate+nitrite concentra-tions above the reporting limit were in Hendricks, Putnam,Johnson, Morgan, and Daviess Counties. The smallest num-ber of samples and smallest percentage of samples havingnitrate+nitrite concentrations above the reporting limit werereported for Tipton, Boone, and Madison Counties.
However, sheer numbers do not necessarily represent thecomplete picture of the nitrate situation in a county.Differences in sample size in the counties tend to distort the
Figure 20a. Generalized areal distribution for Iron - Unconsolidated aquifers
<1.0 mg/L
1.0-2.5 mg/L
>2.5 mg/L
Concentration ranges shown on this map portray general trends interpreted from the data collectedfor this study. Higher and/or lower concentrations may occur in an individual well within the geographic area shown in a given range.
Ground-Water Quality 59
magnitude of the nitrate issue in a county. For example,although Hendricks County reported 94 samples abovereporting limits, the large sample size of 873 make the per-centage of samples having reportable levels at less than 11percent. Whereas, the small sample size of 31 for KnoxCounty produce approximately 71 percent result for sampleshaving reportable values. In spite of the small sample sizethere are obviously nitrate issues in Knox County, becauseapproximately 50 percent of the samples taken in the countyhad reported values greater than 3.0 mg/L, including 29 per-cent with nitrate values greater than the MCL.
A variety of anthropogenic activities can contribute nitrateto ground waters, and may increase nitrate concentrationsabove the MCL. Because nitrate is an important plant nutri-ent, nitrate fertilizers are often added to cultivated soils.Under certain conditions, however, these fertilizers may enterthe ground water through normal infiltration or through apoorly-constructed water well. Nitrate is commonly present
in domestic wastewater, and high levels of this constituent areoften associated with septic systems. Animal manure can alsobe a source of nitrate in ground-water systems, and highnitrate levels are sometimes detected in ground waters down-gradient from barnyards or feedlots. Because many sources ofnitrate are associated with agriculture, rural areas may beespecially susceptible to nitrate pollution of ground water. Tohelp farmers and other rural-area residents assess and mini-mize the risk of ground-water contamination by nitrate andother agricultural chemicals, the American Farm BureauFederation has developed a water quality self-help checklistspecifically for agricultural operations (American FarmBureau Federation, 1987).
In 1991, the U.S. Geological Survey (USGS) began theNational Water-Quality Assessment (NAWQA) Program. Thelong-term goals of the NAWQA Program are to describe thestatus and trends in the quality of the Nation's surface andground water and to provide a sound scientific understanding
Figure 20b. Generalized areal distribution for Iron - Bedrock aquifers
<1.0 mg/L
1.0-2.5 mg/L
>2.5 mg/L
Concentration ranges shown on this map portray general trends interpreted from the data collectedfor this study. Higher and/or lower concentrations may occur in an individual well within the geographic area shown in a given range.
60 Ground-Water Resource Availability, West Fork and White River Basin
of the primary natural and human factors affecting the quali-ty of these resources (Hirsch and others, 1988).
The White River Basin in Indiana was among the first 20river basins to be studied as part of the NAWQA program. Acomponent of the White River Basin study is to determine theoccurrence of nitrate in the shallow ground water of the basin.Moore and Fenelon (1996) describe nitrate data collectedfrom 103 monitoring wells from June 1994 through August1995. The study included both the West Fork and the EastFork White River Water Management basins of Indiana.
Findings of the study:
• Nitrate concentrations in water samples from the 94 shal-low wells in the White River Basin ranged from less than 0.05mg/L to a high of 21 mg/L.
• Water from 6 of the 94 shallow wells (6.4 percent) con-
tained nitrate concentrations higher than 10 mg/L. Nitratewas not detected, at a detection limit of 0.05 mg/L, in 43 per-cent of the shallow wells.
• In contrast to the wells with no detectable nitrate, samplesfrom 29 percent of the shallow wells had nitrate concentra-tions higher than 3.0 mg/L.
• The paired wells in the fluvial deposits show stratificationof nitrate concentration with depth. The largest percentage ofshallow wells with a nitrate concentration between 3.1 and 10mg/L (42 percent) and the largest percentage of shallow wellswith a nitrate concentration higher than 10 mg/L (17 percent)were in fluvial deposits underlying agricultural land.
• Nitrate concentrations in samples from three-fourths ofthe shallow wells in fluvial deposits underlying urban landwere above the detection limit; however, the nitrate concen-tration did not exceed 10 mg/L in any of the samples.
• Water samples from more than one third of the wells in theglacial lowland had nitrate concentrations higher than 3.0 mg/L.
Figure 21a. Generalized areal distribution for Fluoride - Unconsolidated aquifers
<1.0 mg/L
1.0-1.9 mg/L
>1.9 mg/L
Concentration ranges shown on this map portray general trends interpreted from the data collectedfor this study. Higher and/or lower concentrations may occur in an individual well within the geographic area shown in a given range.
Ground-Water Quality 61
• Nitrate concentrations were below the detection limit insamples from approximately 65 percent of the wells in the tillplain and 41 percent of the wells in the glacial lowland.
Strontium
Ground water in the West Fork White River basin may becharacterized as containing "relatively high" concentrationsof strontium compared to ground water in other regions. Forexample, Skougstad and Horr (1963) analyzed 175 ground-water samples from throughout the United States and notedthat 60 percent contained less than 0.2 mg/L of strontium.Davis and DeWiest (1970) report that concentrations of stron-tium in most ground water generally range between 0.01 and1.0 mg/L. Of the 372 ground-water samples analyzed forstrontium in this report, however, only about 22 percent con-tained strontium concentrations less than 0.2 mg/L. Almost
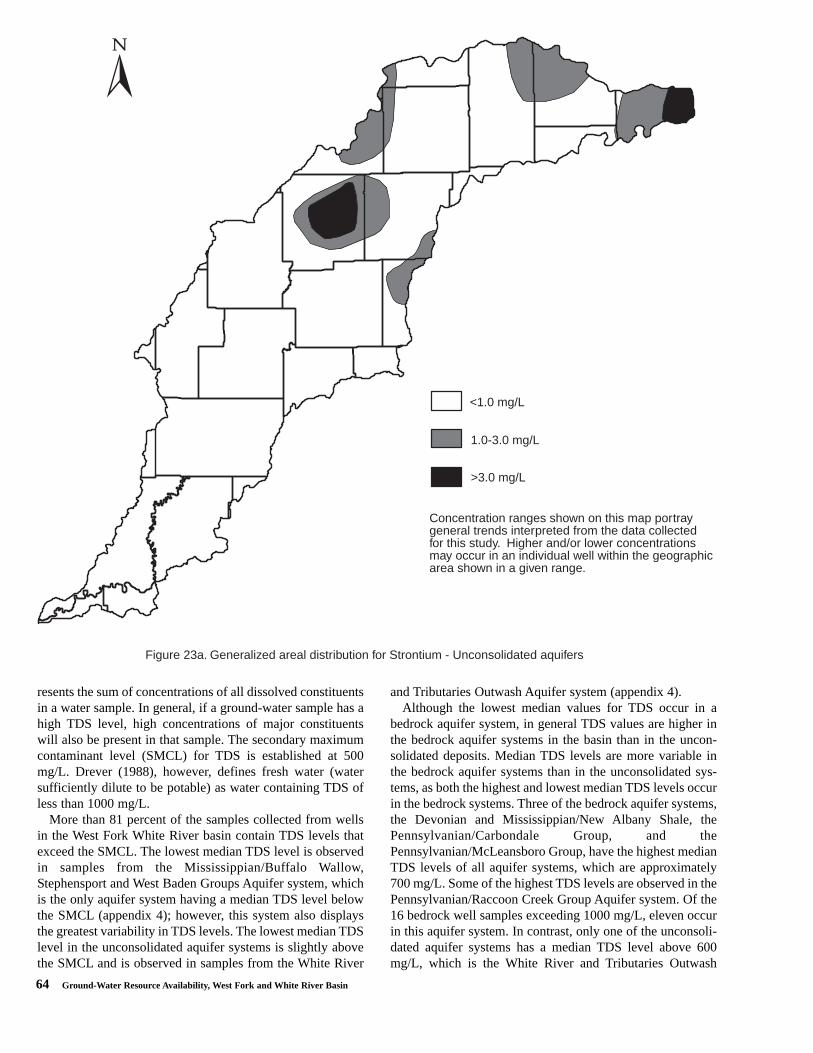
25 percent of the wells sampled in the West Fork White Riverbasin contained strontium concentrations greater than 1.0mg/L. Figures 23a and b display the spatial distribution ofground-water strontium levels for the unconsolidated andbedrock aquifer systems in the West Fork White River basin.
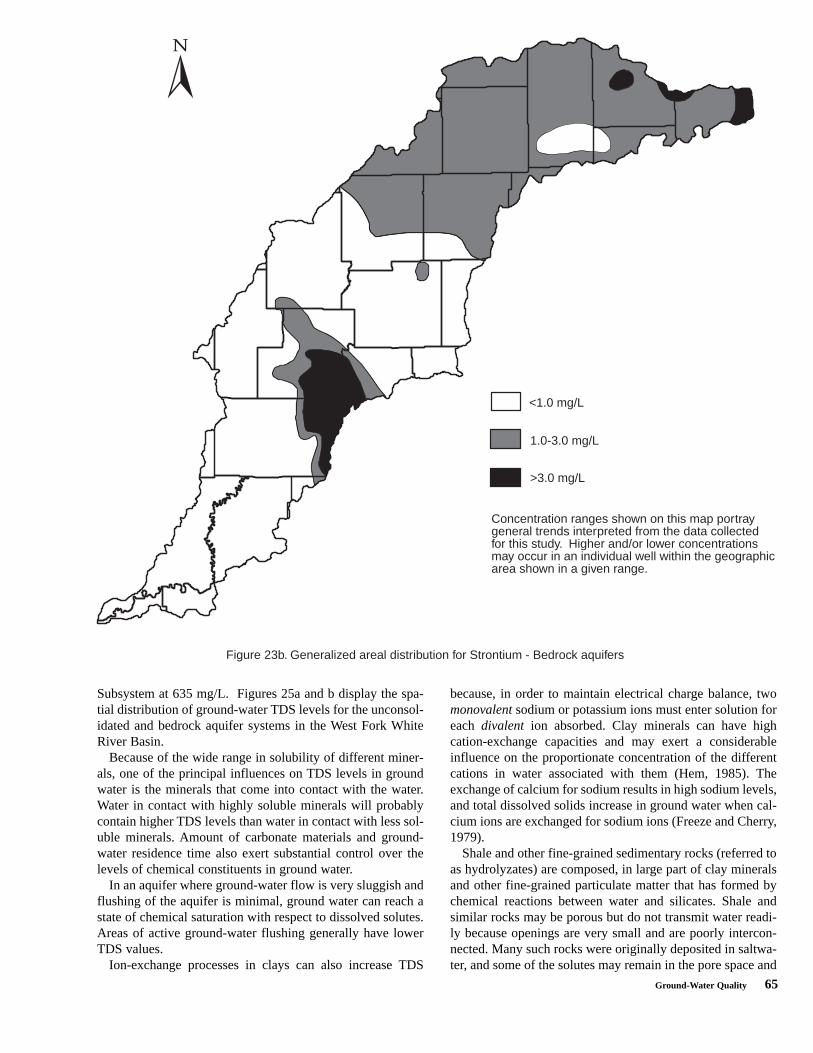
The unconsolidated aquifer systems generally have lowermedian strontium concentrations than the bedrock aquifersystems. The lowest median strontium concentrations of allthe aquifer systems are observed in the ground-water samplesfrom the unconsolidated White River and TributariesOutwash Aquifer system and subsystem. The unconsolidatedaquifer systems with the highest median strontium concentra-tions are the Tipton Till Plain Aquifer system and subsystem.The lowest median strontium concentrations in the bedrockaquifer systems are observed in samples from thePennsylvanian bedrock systems. The Mississippian/BuffaloWallow, Stephensport, and West Baden Group Aquifer sys-tem has the highest median strontium concentration of all the
Figure 21b. Generalized areal distribution for Fluoride - Bedrock aquifers
<1.0 mg/L
1.0-1.9 mg/L
>1.9 mg/L
Concentration ranges shown on this map portray general trends interpreted from the data collectedfor this study. Higher and/or lower concentrations may occur in an individual well within the geographic area shown in a given range.
62 Ground-Water Resource Availability, West Fork and White River Basin
aquifer systems (appendix 4).Elevated concentrations of strontium are apparent in the
bedrock aquifers in some areas of Monroe, Greene, and OwenCounties, and in the unconsolidated and bedrock aquifers ofRandolph County. At the time of this report, no enforceabledrinking-water standards have been established for strontium.However, the non-enforceable lifetime health advisory forstrontium is set at 17.0 mg/L. Four samples from wells com-pleted in the Mississippian/Blue River and Sanders GroupAquifer system in Monroe County and one sample from theTipton Till Plain Aquifer subsystem in Randolph County con-tain strontium concentrations in excess of the health advisory(see appendix 4). In addition to these 5 wells, fifteen othershave strontium concentrations greater than 5 mg/L. Seven ofthese were in Randolph County and all but one of the restwere in Greene, Owen and Monroe Counties.
Sources of strontium in ground water are generally thetrace amounts of strontium present in rocks. The strontium-bearing minerals celestite (SrSO4) and strontianite (SrCO3)may be disseminated in limestone and dolomite. Also,celestite is associated with gypsum deposits, which occur inthe rocks of the Blue River and Sanders Group. These rocksare located in Greene, Owen, and Monroe Counties. Silurianrocks of several different lithologies may be the source ofhigh strontium and concentrations in Randolph County.
Because strontium and calcium are chemically similar,strontium atoms may also be adsorbed on clay particles byion exchange (Skougstad and Horr, 1963). Ion-exchangeprocesses may thus reduce strontium concentrations inground water found in clay-rich sediments.
<1.0 mg/L
1.0-3.0 mg/L
3.1-10.0 mg/L
>10.0 mg/L
Figure 22a. Distribution of Nitrate-Nitrogen concentrations for sampled wells - Unconsolidated aquifers

Ground-Water Quality 63
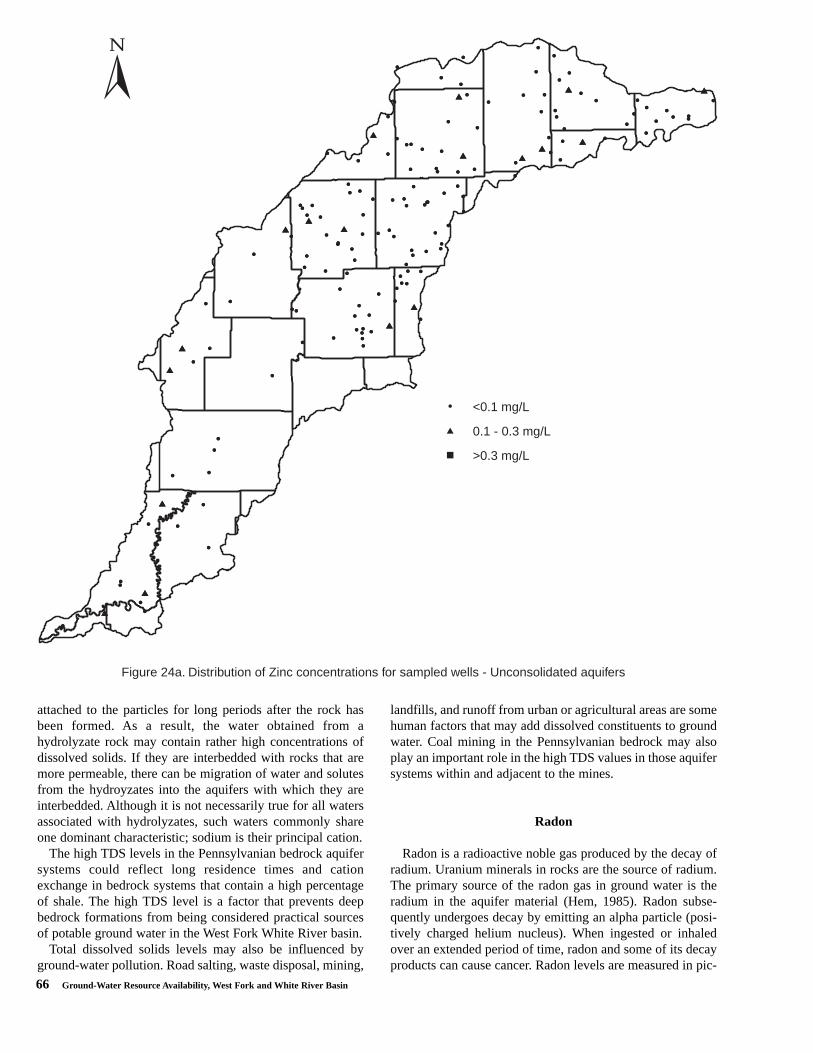
Zinc
Generally, significant dissolved quantities of the metal zincoccur only in low pH or high-temperature ground water(Davis and DeWiest, 1970). Concentrations of zinc inground-water samples from the West Fork White River basinare plotted in figures 24a and b. Three hundred eleven of theground-water samples analyzed (approximately 84 percent)contain levels below the detection limit of 0.1 mg/L for zinc.None of the samples analyzed contain zinc in concentrations abovethe 5 mg/L SMCL established for this constituent (appendix 2).
Lead
Naturally occurring minerals that contain lead are widely
dispersed, but have low solubility in most natural groundwater. The co-precipitation of lead with manganese oxide andthe adsorption of lead on organic and inorganic sediment sur-faces help to maintain low lead concentration levels in groundwater (Hem, 1985). Much of the lead present in tap watermay come from anthropogenic sources, particularly lead sol-der used in older plumbing systems. Because natural concen-trations of lead are normally low and because there are somany uncertainties involved in collecting and analyzing sam-ples, lead was not analyzed in this study.
Total dissolved solids
Total dissolved solids (TDS) are a measure of the totalamount of dissolved minerals in water. Essentially, TDS rep-
<1.0 mg/L
1.0-3.0 mg/L
3.1-10.0 mg/L
>10.0 mg/L
Figure 22b. Distribution of Nitrate-Nitrogen concentrations for sampled wells - Bedrock aquifers
64 Ground-Water Resource Availability, West Fork and White River Basin
resents the sum of concentrations of all dissolved constituentsin a water sample. In general, if a ground-water sample has ahigh TDS level, high concentrations of major constituentswill also be present in that sample. The secondary maximumcontaminant level (SMCL) for TDS is established at 500mg/L. Drever (1988), however, defines fresh water (watersufficiently dilute to be potable) as water containing TDS ofless than 1000 mg/L.
More than 81 percent of the samples collected from wellsin the West Fork White River basin contain TDS levels thatexceed the SMCL. The lowest median TDS level is observedin samples from the Mississippian/Buffalo Wallow,Stephensport and West Baden Groups Aquifer system, whichis the only aquifer system having a median TDS level belowthe SMCL (appendix 4); however, this system also displaysthe greatest variability in TDS levels. The lowest median TDSlevel in the unconsolidated aquifer systems is slightly abovethe SMCL and is observed in samples from the White River
and Tributaries Outwash Aquifer system (appendix 4).Although the lowest median values for TDS occur in a
bedrock aquifer system, in general TDS values are higher inthe bedrock aquifer systems in the basin than in the uncon-solidated deposits. Median TDS levels are more variable inthe bedrock aquifer systems than in the unconsolidated sys-tems, as both the highest and lowest median TDS levels occurin the bedrock systems. Three of the bedrock aquifer systems,the Devonian and Mississippian/New Albany Shale, thePennsylvanian/Carbondale Group, and thePennsylvanian/McLeansboro Group, have the highest medianTDS levels of all aquifer systems, which are approximately700 mg/L. Some of the highest TDS levels are observed in thePennsylvanian/Raccoon Creek Group Aquifer system. Of the16 bedrock well samples exceeding 1000 mg/L, eleven occurin this aquifer system. In contrast, only one of the unconsoli-dated aquifer systems has a median TDS level above 600mg/L, which is the White River and Tributaries Outwash
Figure 23a. Generalized areal distribution for Strontium - Unconsolidated aquifers
<1.0 mg/L
1.0-3.0 mg/L
>3.0 mg/L
Concentration ranges shown on this map portray general trends interpreted from the data collectedfor this study. Higher and/or lower concentrations may occur in an individual well within the geographic area shown in a given range.
Ground-Water Quality 65
Subsystem at 635 mg/L. Figures 25a and b display the spa-tial distribution of ground-water TDS levels for the unconsol-idated and bedrock aquifer systems in the West Fork WhiteRiver Basin.
Because of the wide range in solubility of different miner-als, one of the principal influences on TDS levels in groundwater is the minerals that come into contact with the water.Water in contact with highly soluble minerals will probablycontain higher TDS levels than water in contact with less sol-uble minerals. Amount of carbonate materials and ground-water residence time also exert substantial control over thelevels of chemical constituents in ground water.
In an aquifer where ground-water flow is very sluggish andflushing of the aquifer is minimal, ground water can reach astate of chemical saturation with respect to dissolved solutes.Areas of active ground-water flushing generally have lowerTDS values.
Ion-exchange processes in clays can also increase TDS
because, in order to maintain electrical charge balance, twomonovalent sodium or potassium ions must enter solution foreach divalent ion absorbed. Clay minerals can have highcation-exchange capacities and may exert a considerableinfluence on the proportionate concentration of the differentcations in water associated with them (Hem, 1985). Theexchange of calcium for sodium results in high sodium levels,and total dissolved solids increase in ground water when cal-cium ions are exchanged for sodium ions (Freeze and Cherry,1979).
Shale and other fine-grained sedimentary rocks (referred toas hydrolyzates) are composed, in large part of clay mineralsand other fine-grained particulate matter that has formed bychemical reactions between water and silicates. Shale andsimilar rocks may be porous but do not transmit water readi-ly because openings are very small and are poorly intercon-nected. Many such rocks were originally deposited in saltwa-ter, and some of the solutes may remain in the pore space and
Figure 23b. Generalized areal distribution for Strontium - Bedrock aquifers
<1.0 mg/L
1.0-3.0 mg/L
>3.0 mg/L
Concentration ranges shown on this map portray general trends interpreted from the data collectedfor this study. Higher and/or lower concentrations may occur in an individual well within the geographic area shown in a given range.
66 Ground-Water Resource Availability, West Fork and White River Basin
attached to the particles for long periods after the rock hasbeen formed. As a result, the water obtained from ahydrolyzate rock may contain rather high concentrations ofdissolved solids. If they are interbedded with rocks that aremore permeable, there can be migration of water and solutesfrom the hydroyzates into the aquifers with which they areinterbedded. Although it is not necessarily true for all watersassociated with hydrolyzates, such waters commonly shareone dominant characteristic; sodium is their principal cation.
The high TDS levels in the Pennsylvanian bedrock aquifersystems could reflect long residence times and cationexchange in bedrock systems that contain a high percentageof shale. The high TDS level is a factor that prevents deepbedrock formations from being considered practical sourcesof potable ground water in the West Fork White River basin.
Total dissolved solids levels may also be influenced byground-water pollution. Road salting, waste disposal, mining,
landfills, and runoff from urban or agricultural areas are somehuman factors that may add dissolved constituents to groundwater. Coal mining in the Pennsylvanian bedrock may alsoplay an important role in the high TDS values in those aquifersystems within and adjacent to the mines.
Radon
Radon is a radioactive noble gas produced by the decay ofradium. Uranium minerals in rocks are the source of radium.The primary source of the radon gas in ground water is theradium in the aquifer material (Hem, 1985). Radon subse-quently undergoes decay by emitting an alpha particle (posi-tively charged helium nucleus). When ingested or inhaledover an extended period of time, radon and some of its decayproducts can cause cancer. Radon levels are measured in pic-
<0.1 mg/L
0.1 - 0.3 mg/L
>0.3 mg/L
Figure 24a. Distribution of Zinc concentrations for sampled wells - Unconsolidated aquifers
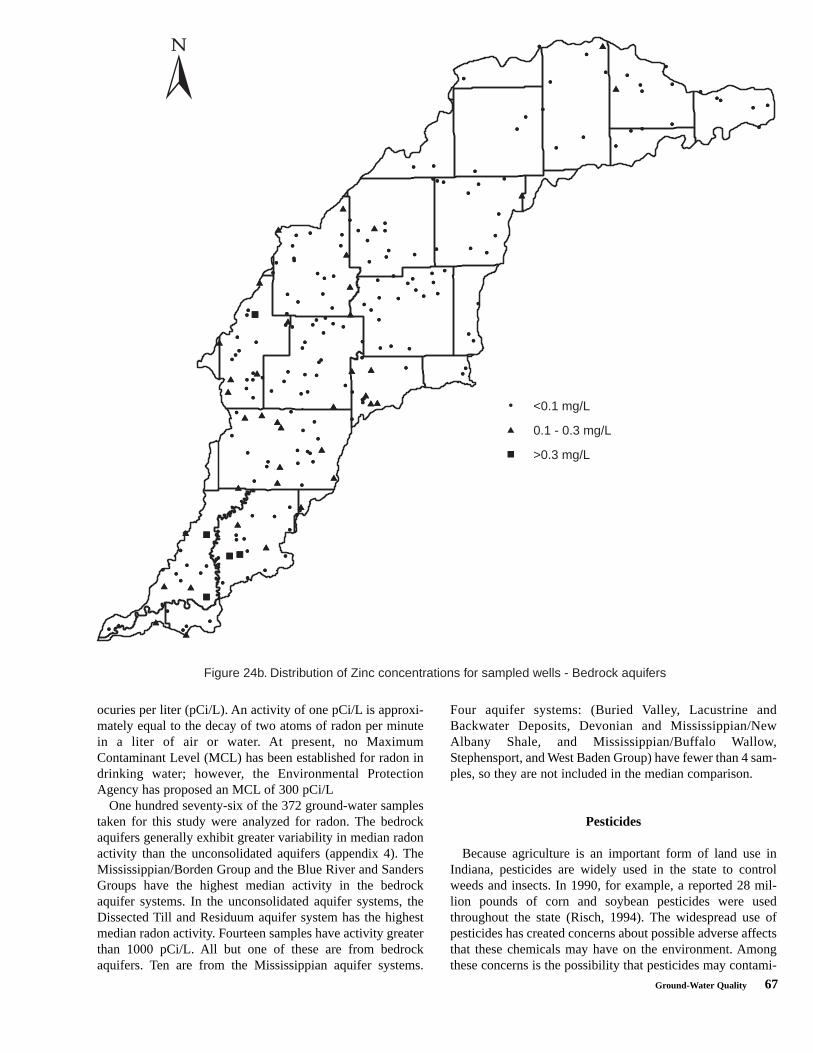
Ground-Water Quality 67
ocuries per liter (pCi/L). An activity of one pCi/L is approxi-mately equal to the decay of two atoms of radon per minutein a liter of air or water. At present, no MaximumContaminant Level (MCL) has been established for radon indrinking water; however, the Environmental ProtectionAgency has proposed an MCL of 300 pCi/L
One hundred seventy-six of the 372 ground-water samplestaken for this study were analyzed for radon. The bedrockaquifers generally exhibit greater variability in median radonactivity than the unconsolidated aquifers (appendix 4). TheMississippian/Borden Group and the Blue River and SandersGroups have the highest median activity in the bedrockaquifer systems. In the unconsolidated aquifer systems, theDissected Till and Residuum aquifer system has the highestmedian radon activity. Fourteen samples have activity greaterthan 1000 pCi/L. All but one of these are from bedrockaquifers. Ten are from the Mississippian aquifer systems.
Four aquifer systems: (Buried Valley, Lacustrine andBackwater Deposits, Devonian and Mississippian/NewAlbany Shale, and Mississippian/Buffalo Wallow,Stephensport, and West Baden Group) have fewer than 4 sam-ples, so they are not included in the median comparison.
Pesticides
Because agriculture is an important form of land use inIndiana, pesticides are widely used in the state to controlweeds and insects. In 1990, for example, a reported 28 mil-lion pounds of corn and soybean pesticides were usedthroughout the state (Risch, 1994). The widespread use ofpesticides has created concerns about possible adverse affectsthat these chemicals may have on the environment. Amongthese concerns is the possibility that pesticides may contami-
<0.1 mg/L
0.1 - 0.3 mg/L
>0.3 mg/L
Figure 24b. Distribution of Zinc concentrations for sampled wells - Bedrock aquifers
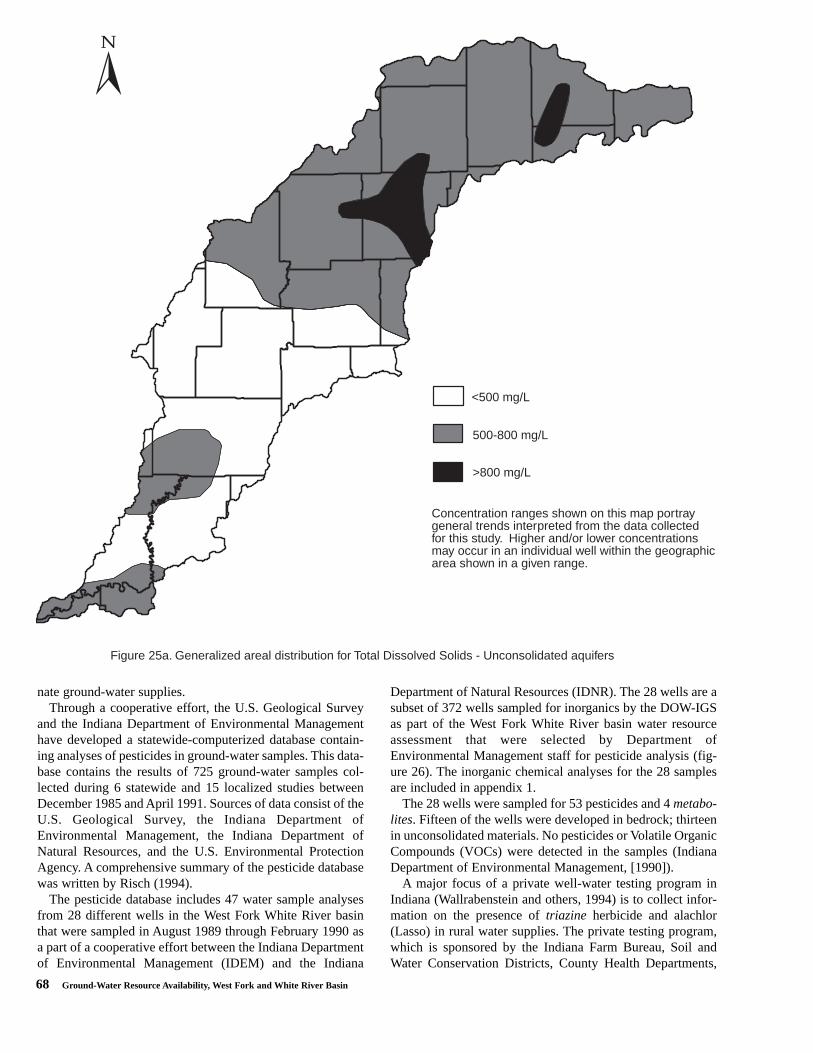
68 Ground-Water Resource Availability, West Fork and White River Basin
nate ground-water supplies.Through a cooperative effort, the U.S. Geological Survey
and the Indiana Department of Environmental Managementhave developed a statewide-computerized database contain-ing analyses of pesticides in ground-water samples. This data-base contains the results of 725 ground-water samples col-lected during 6 statewide and 15 localized studies betweenDecember 1985 and April 1991. Sources of data consist of theU.S. Geological Survey, the Indiana Department ofEnvironmental Management, the Indiana Department ofNatural Resources, and the U.S. Environmental ProtectionAgency. A comprehensive summary of the pesticide databasewas written by Risch (1994).
The pesticide database includes 47 water sample analysesfrom 28 different wells in the West Fork White River basinthat were sampled in August 1989 through February 1990 asa part of a cooperative effort between the Indiana Departmentof Environmental Management (IDEM) and the Indiana
Department of Natural Resources (IDNR). The 28 wells are asubset of 372 wells sampled for inorganics by the DOW-IGSas part of the West Fork White River basin water resourceassessment that were selected by Department ofEnvironmental Management staff for pesticide analysis (fig-ure 26). The inorganic chemical analyses for the 28 samplesare included in appendix 1.
The 28 wells were sampled for 53 pesticides and 4 metabo-lites. Fifteen of the wells were developed in bedrock; thirteenin unconsolidated materials. No pesticides or Volatile OrganicCompounds (VOCs) were detected in the samples (IndianaDepartment of Environmental Management, [1990]).
A major focus of a private well-water testing program inIndiana (Wallrabenstein and others, 1994) is to collect infor-mation on the presence of triazine herbicide and alachlor(Lasso) in rural water supplies. The private testing program,which is sponsored by the Indiana Farm Bureau, Soil andWater Conservation Districts, County Health Departments,
Figure 25a. Generalized areal distribution for Total Dissolved Solids - Unconsolidated aquifers
<500 mg/L
500-800 mg/L
>800 mg/L
Concentration ranges shown on this map portray general trends interpreted from the data collectedfor this study. Higher and/or lower concentrations may occur in an individual well within the geographic area shown in a given range.
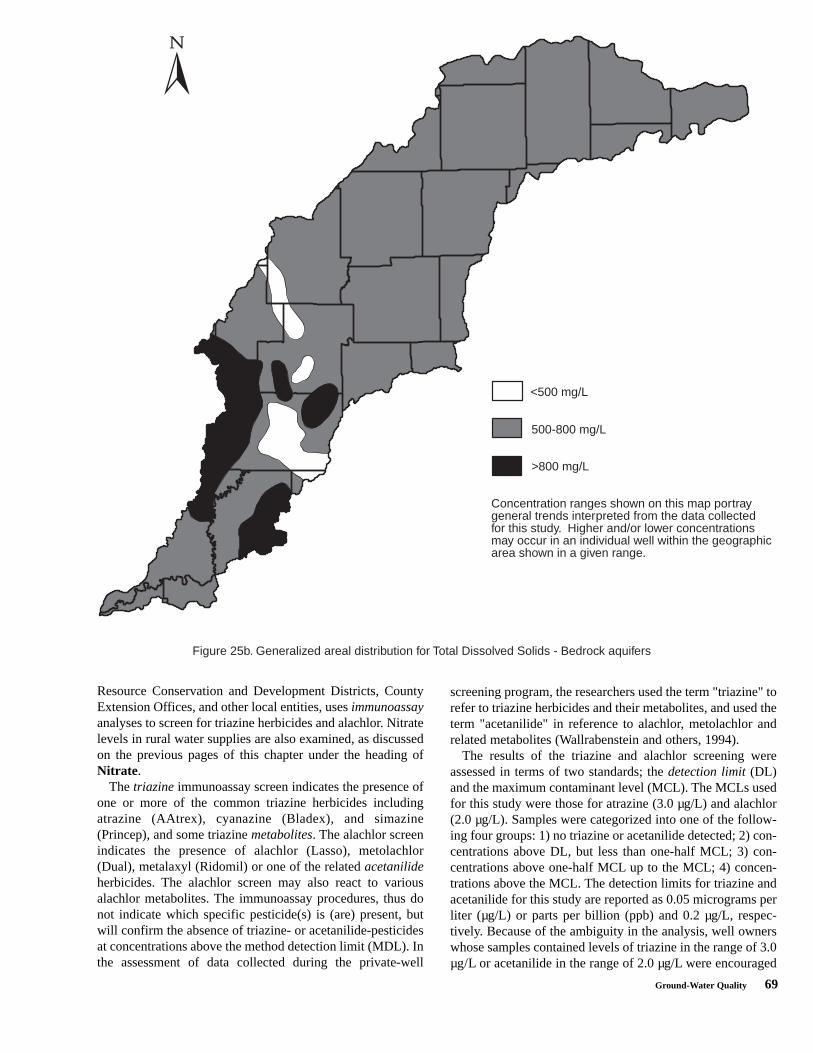
Ground-Water Quality 69
Resource Conservation and Development Districts, CountyExtension Offices, and other local entities, uses immunoassayanalyses to screen for triazine herbicides and alachlor. Nitratelevels in rural water supplies are also examined, as discussedon the previous pages of this chapter under the heading ofNitrate.
The triazine immunoassay screen indicates the presence ofone or more of the common triazine herbicides includingatrazine (AAtrex), cyanazine (Bladex), and simazine(Princep), and some triazine metabolites. The alachlor screenindicates the presence of alachlor (Lasso), metolachlor(Dual), metalaxyl (Ridomil) or one of the related acetanilideherbicides. The alachlor screen may also react to variousalachlor metabolites. The immunoassay procedures, thus donot indicate which specific pesticide(s) is (are) present, butwill confirm the absence of triazine- or acetanilide-pesticidesat concentrations above the method detection limit (MDL). Inthe assessment of data collected during the private-well
screening program, the researchers used the term "triazine" torefer to triazine herbicides and their metabolites, and used theterm "acetanilide" in reference to alachlor, metolachlor andrelated metabolites (Wallrabenstein and others, 1994).
The results of the triazine and alachlor screening wereassessed in terms of two standards; the detection limit (DL)and the maximum contaminant level (MCL). The MCLs usedfor this study were those for atrazine (3.0 µg/L) and alachlor(2.0 µg/L). Samples were categorized into one of the follow-ing four groups: 1) no triazine or acetanilide detected; 2) con-centrations above DL, but less than one-half MCL; 3) con-centrations above one-half MCL up to the MCL; 4) concen-trations above the MCL. The detection limits for triazine andacetanilide for this study are reported as 0.05 micrograms perliter (µg/L) or parts per billion (ppb) and 0.2 µg/L, respec-tively. Because of the ambiguity in the analysis, well ownerswhose samples contained levels of triazine in the range of 3.0µg/L or acetanilide in the range of 2.0 µg/L were encouraged
Figure 25b. Generalized areal distribution for Total Dissolved Solids - Bedrock aquifers
<500 mg/L
500-800 mg/L
>800 mg/L
Concentration ranges shown on this map portray general trends interpreted from the data collectedfor this study. Higher and/or lower concentrations may occur in an individual well within the geographic area shown in a given range.
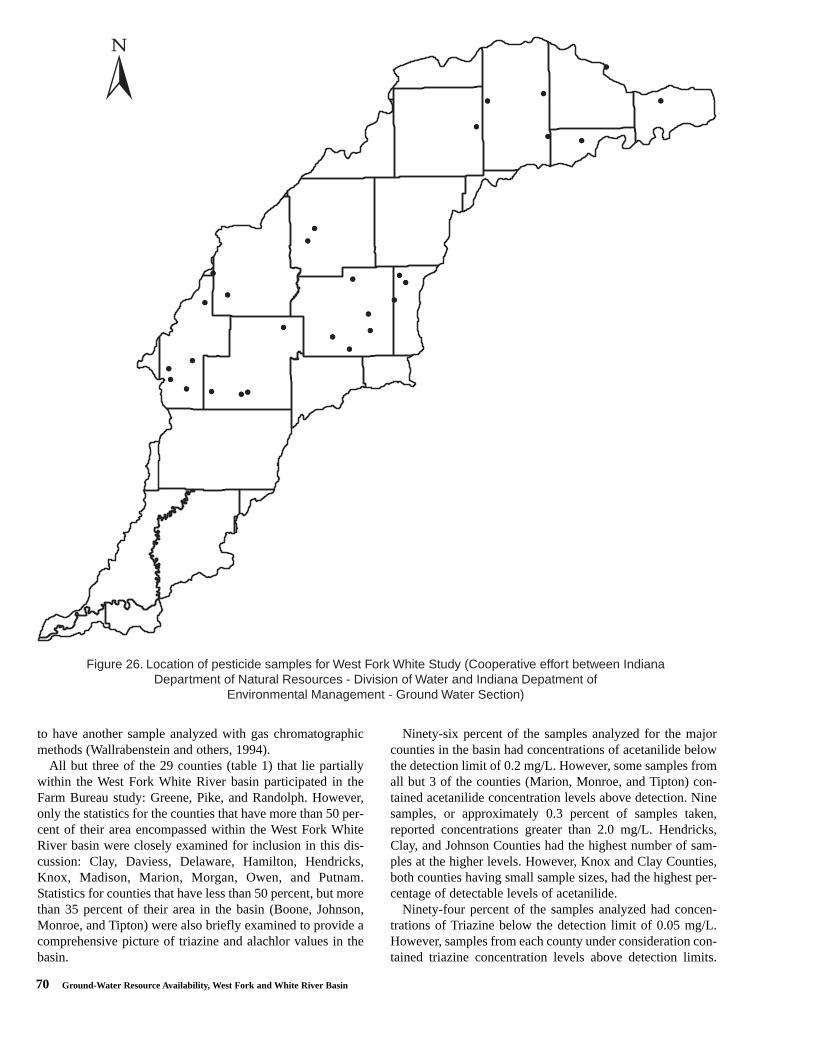
70 Ground-Water Resource Availability, West Fork and White River Basin
to have another sample analyzed with gas chromatographicmethods (Wallrabenstein and others, 1994).
All but three of the 29 counties (table 1) that lie partiallywithin the West Fork White River basin participated in theFarm Bureau study: Greene, Pike, and Randolph. However,only the statistics for the counties that have more than 50 per-cent of their area encompassed within the West Fork WhiteRiver basin were closely examined for inclusion in this dis-cussion: Clay, Daviess, Delaware, Hamilton, Hendricks,Knox, Madison, Marion, Morgan, Owen, and Putnam.Statistics for counties that have less than 50 percent, but morethan 35 percent of their area in the basin (Boone, Johnson,Monroe, and Tipton) were also briefly examined to provide acomprehensive picture of triazine and alachlor values in thebasin.
Ninety-six percent of the samples analyzed for the majorcounties in the basin had concentrations of acetanilide belowthe detection limit of 0.2 mg/L. However, some samples fromall but 3 of the counties (Marion, Monroe, and Tipton) con-tained acetanilide concentration levels above detection. Ninesamples, or approximately 0.3 percent of samples taken,reported concentrations greater than 2.0 mg/L. Hendricks,Clay, and Johnson Counties had the highest number of sam-ples at the higher levels. However, Knox and Clay Counties,both counties having small sample sizes, had the highest per-centage of detectable levels of acetanilide.
Ninety-four percent of the samples analyzed had concen-trations of Triazine below the detection limit of 0.05 mg/L.However, samples from each county under consideration con-tained triazine concentration levels above detection limits.
Figure 26. Location of pesticide samples for West Fork White Study (Cooperative effort between IndianaDepartment of Natural Resources - Division of Water and Indiana Depatment of
Environmental Management - Ground Water Section)
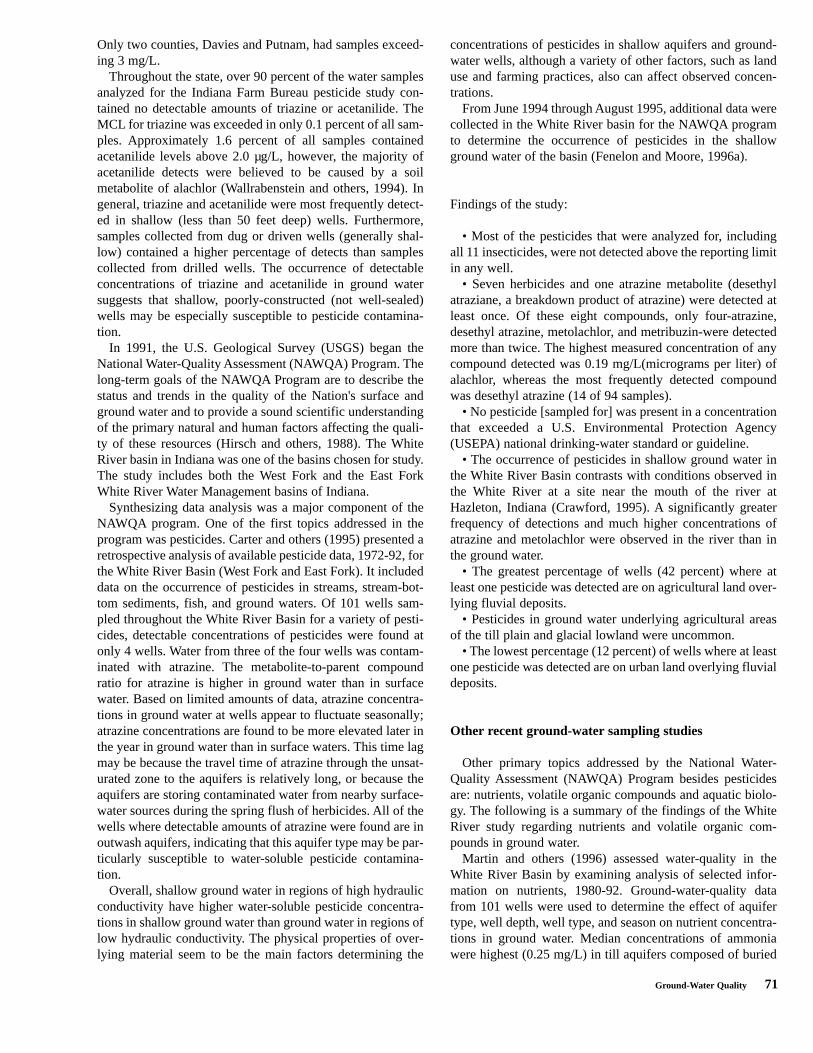
Ground-Water Quality 71
Only two counties, Davies and Putnam, had samples exceed-ing 3 mg/L.
Throughout the state, over 90 percent of the water samplesanalyzed for the Indiana Farm Bureau pesticide study con-tained no detectable amounts of triazine or acetanilide. TheMCL for triazine was exceeded in only 0.1 percent of all sam-ples. Approximately 1.6 percent of all samples containedacetanilide levels above 2.0 µg/L, however, the majority ofacetanilide detects were believed to be caused by a soilmetabolite of alachlor (Wallrabenstein and others, 1994). Ingeneral, triazine and acetanilide were most frequently detect-ed in shallow (less than 50 feet deep) wells. Furthermore,samples collected from dug or driven wells (generally shal-low) contained a higher percentage of detects than samplescollected from drilled wells. The occurrence of detectableconcentrations of triazine and acetanilide in ground watersuggests that shallow, poorly-constructed (not well-sealed)wells may be especially susceptible to pesticide contamina-tion.
In 1991, the U.S. Geological Survey (USGS) began theNational Water-Quality Assessment (NAWQA) Program. Thelong-term goals of the NAWQA Program are to describe thestatus and trends in the quality of the Nation's surface andground water and to provide a sound scientific understandingof the primary natural and human factors affecting the quali-ty of these resources (Hirsch and others, 1988). The WhiteRiver basin in Indiana was one of the basins chosen for study.The study includes both the West Fork and the East ForkWhite River Water Management basins of Indiana.
Synthesizing data analysis was a major component of theNAWQA program. One of the first topics addressed in theprogram was pesticides. Carter and others (1995) presented aretrospective analysis of available pesticide data, 1972-92, forthe White River Basin (West Fork and East Fork). It includeddata on the occurrence of pesticides in streams, stream-bot-tom sediments, fish, and ground waters. Of 101 wells sam-pled throughout the White River Basin for a variety of pesti-cides, detectable concentrations of pesticides were found atonly 4 wells. Water from three of the four wells was contam-inated with atrazine. The metabolite-to-parent compoundratio for atrazine is higher in ground water than in surfacewater. Based on limited amounts of data, atrazine concentra-tions in ground water at wells appear to fluctuate seasonally;atrazine concentrations are found to be more elevated later inthe year in ground water than in surface waters. This time lagmay be because the travel time of atrazine through the unsat-urated zone to the aquifers is relatively long, or because theaquifers are storing contaminated water from nearby surface-water sources during the spring flush of herbicides. All of thewells where detectable amounts of atrazine were found are inoutwash aquifers, indicating that this aquifer type may be par-ticularly susceptible to water-soluble pesticide contamina-tion.
Overall, shallow ground water in regions of high hydraulicconductivity have higher water-soluble pesticide concentra-tions in shallow ground water than ground water in regions oflow hydraulic conductivity. The physical properties of over-lying material seem to be the main factors determining the
concentrations of pesticides in shallow aquifers and ground-water wells, although a variety of other factors, such as landuse and farming practices, also can affect observed concen-trations.
From June 1994 through August 1995, additional data werecollected in the White River basin for the NAWQA programto determine the occurrence of pesticides in the shallowground water of the basin (Fenelon and Moore, 1996a).
Findings of the study:
• Most of the pesticides that were analyzed for, includingall 11 insecticides, were not detected above the reporting limitin any well.
• Seven herbicides and one atrazine metabolite (desethylatraziane, a breakdown product of atrazine) were detected atleast once. Of these eight compounds, only four-atrazine,desethyl atrazine, metolachlor, and metribuzin-were detectedmore than twice. The highest measured concentration of anycompound detected was 0.19 mg/L(micrograms per liter) ofalachlor, whereas the most frequently detected compoundwas desethyl atrazine (14 of 94 samples).
• No pesticide [sampled for] was present in a concentrationthat exceeded a U.S. Environmental Protection Agency(USEPA) national drinking-water standard or guideline.
• The occurrence of pesticides in shallow ground water inthe White River Basin contrasts with conditions observed inthe White River at a site near the mouth of the river atHazleton, Indiana (Crawford, 1995). A significantly greaterfrequency of detections and much higher concentrations ofatrazine and metolachlor were observed in the river than inthe ground water.
• The greatest percentage of wells (42 percent) where atleast one pesticide was detected are on agricultural land over-lying fluvial deposits.
• Pesticides in ground water underlying agricultural areasof the till plain and glacial lowland were uncommon.
• The lowest percentage (12 percent) of wells where at leastone pesticide was detected are on urban land overlying fluvialdeposits.
Other recent ground-water sampling studies
Other primary topics addressed by the National Water-Quality Assessment (NAWQA) Program besides pesticidesare: nutrients, volatile organic compounds and aquatic biolo-gy. The following is a summary of the findings of the WhiteRiver study regarding nutrients and volatile organic com-pounds in ground water.
Martin and others (1996) assessed water-quality in theWhite River Basin by examining analysis of selected infor-mation on nutrients, 1980-92. Ground-water-quality datafrom 101 wells were used to determine the effect of aquifertype, well depth, well type, and season on nutrient concentra-tions in ground water. Median concentrations of ammoniawere highest (0.25 mg/L) in till aquifers composed of buried
72 Ground-Water Resource Availability, West Fork and White River Basin
sand and gravel lenses, probably because of biochemicalreduction of nitrate to ammonia. Concentrations of nitrate intill aquifers were low, probably because till reduced thedownward percolation of soil water and because reducingconditions enabled denitrification and biochemical reductionof nitrate to ammonia. Median concentrations of nitrate werehighest in karst aquifers, probably because macropore, sink-holes, and other solution features provided a direct connec-tion of surface and ground water through preferential flowpaths from the clayey mantle to the karst aquifer.Concentrations of ammonia generally were higher in deepwells, whereas concentrations of nitrate generally were high-er in shallow wells. High ammonia concentrations at depthmay have been caused by nitrate by the downward percola-tion of nitrogen-containing soil water from the land surface.Refer to the Nitrate section of this report for additionaldetails.
Another component of the White River Basin study is todetermine the occurrence of volatile organic compounds(VOCs) in the shallow ground water of the basin. VOCs areof national concern because some of the compounds are toxicand (or) carcinogenic. Fenelon and Moore (1996b) presentthe findings from VOC data collected from 100 monitoringwells from June 1994 through August 1995. The studyincludes both the West Fork and the East Fork White RiverWater Management basins of Indiana.
Findings of the study:
• Twelve of the 58 VOCs that were analyzed for in groundwater samples were detected at or above the reporting limit inat least 1 of the 91 shallow wells.
• Chloroform (trichloromethane) was the most commonlydetected VOC, whereas the highest measured VOC concen-tration was 39 mg/L (microgram per liter) of 1,1-dichloroethene.
• No VOC had a measured concentration in ground waterthat exceeded a national drinking-water standard or guidelinefor public water supplies.
• Samples from shallow wells in the nine pairs of shallowand deep wells had a greater frequency of detections andhigher concentrations of VOCs than samples from the deepwells.
• VOCs were detected in only 4 of the 66 wells in agricul-tural settings.
• Most of the ground water with detectable VOCs in theWhite River Basin underlies urban land. Slightly more thanhalf of the shallow wells in urban settings, as compared to sixpercent of the shallow wells in agricultural settings, had atleast one VOC detected above the reporting limit.
• Chloroform was the most frequently detected VOC (40percent of wells) in ground water underlying urban land. Themedian detected concentration of chloroform in urban set-tings was 0.5 mg/L; all of the chloroform detections were inIndianapolis.
• A likely source of the low concentrations of chloroform inground water underlying urban land in the White River Basin
is chlorinated public-supply water.• Atmospheric deposition is probably a minor source of
chloroform in ground water.
Ground-water contamination
A ground-water supply, that under natural conditions wouldbe acceptable for a variety of uses, can be adversely affectedby contamination from human activities. Contamination, asdefined by the Indiana Department of EnvironmentalManagement, occurs when levels of contaminants are inexcess of public drinking-water standards, or health protec-tion guidance levels promulgated by the USEPA.
Over the past 100 years industrial and agricultural practicesthat accompany development have created ample opportunityfor ground-water contamination in the West Fork White Riverbasin. Numerous potential sources for ground-water contam-ination exist in the West Fork White River basin, includingsanitary landfills, sewage treatment plants, industrial facili-ties, agricultural operations, septic and underground storagetanks, and road-salt storage facilities.
Some cases of actual ground-water contamination havebeen identified in the basin. The Indiana Department ofEnvironmental Management (IDEM), Ground-Water Section,maintains a database of Indiana sites having 'confirmed'ground-water contamination. The 1998 and 2000 IndianaWater Quality Reports produced by the Indiana Departmentof Environmental Management, Office of WaterManagement, Planning Branch provide an overview of theten highest priority sources of ground-water contamination inIndiana and the associated contaminants impacting ground-water quality; a summary of Indiana ground-water protectionefforts is also included. In these reports, IDEM summarizesthe ground water contamination sites in ground water in theWhite, West Fork White, and Patoka River basins by hydro-geologic settings developed by Fleming and others, 1995.Nitrates were identified by IDEM as the contaminant mostoften encountered in ground water.
Susceptibility of aquifers to surface contamination
Because contaminants can be transmitted to the ground-water system by infiltration from the surface, the susceptibil-ity of an aquifer system to contamination from surfacesources depends in part on the type of material that forms thesurface layer above the aquifer. In general, sandy surficialsediments can easily transmit water from the surface, but pro-vide negligible filtering of contaminants. Clay-rich surficialdeposits, such as glacial till, generally have lower verticalhydraulic conductivity than sand and gravel deposits, therebylimiting the movement of contaminated water. However, thepresence of fractures can locally decrease the effectiveness ofa till in protecting ground water. The differences in basichydrologic properties of sands and clays make it possible touse surficial geology to estimate the potential for ground-water contamination.
Ground-Water Quality 73
The highly complex relationships of the various glacialdeposits in the West Fork White River basin preclude site-specific comments about susceptibility of the regional aquifersystems to contamination. However, a few gross generaliza-tions can be made here. Additional detail on susceptibility ofhydrogeologic settings in the state are available in Flemingand others, 1995.
The Tipton Till Plain aquifer system consists chiefly ofintratill lenses of outwash sand and gravel that are highlyvariable in depth and lateral extent and are confined by vari-ably thick clay or till sequences. It generally is considered tohave low susceptibility to surface contamination.
The Tipton Till Plain Subsystem aquifer system is com-posed primarily of glacial tills that contain intratill sand andgravel of limited thickness and extent. It is similar to theTipton Till Plain aquifer system but is generally consideredmoderately vulnerable to surface contamination. This systemis located in many areas where the bedrock is shallow and tillcover overlying the sand and gravel is thin.
The Dissected Till and Residuum aquifer system, consist-ing of thin, eroded residuum and predominantly pre-Wisconsin till overlying bedrock dominates the southern por-tions of the basin. Because of the low permeability of the sur-face materials, this system is not very susceptible to contam-ination from surface sources.
The water-bearing units of the White River andTributaries Outwash aquifer system are unconfined, usuallyfairly shallow, and are characterized by thick sequences ofsand and gravel with little clay. This aquifer system is highlysusceptible to contamination due to its lack of clay layers andshallow water levels.
White River and Tributaries Outwash Subsystemaquifer system, adjacent to the White River and TributariesOutwash Aquifer system, consists of thick zones of sand andgravel that have been covered by a layer of clay or till. In gen-eral, this system is highly susceptible to surface contamina-tion. Although the overlying clay or till may provide someprotection to the confined portions of the White River andTributaries Outwash Subsystem Aquifer system, in manyplaces surficial valley train deposits coalesce with the deeperoutwash deposits making them more vulnerable. Two smallareas of this system in Gibson and Knox Counties have thicklayers of clay overlying the sand and gravel making themmoderately susceptible to surface contamination.
The Lacustrine and Backwater Deposits aquifer systemthat is made up of discontinuous bodies of deposits extendingalong areas of outwash close to the West Fork White RiverValley. These bodies are marked by thick deposits of soft siltand clay that have low susceptibility to surface contamination
The Buried Valley aquifer system has a low susceptibilityto surface contamination because outwash sediments withinthe bedrock valleys are generally overlain by tills. Althoughlenses of outwash sand and gravel may occur within the tills,the predominance of fine-grained sediments above thebedrock valleys limits the migration of contaminants fromsurface sources to the deep aquifers.
The susceptibility of bedrock aquifer systems to surfacecontamination is dependant on the nature of the overlying
sediments, because the bedrock throughout the basin is over-lain by unconsolidated deposits. Just as recharge for bedrockaquifers cannot exceed that of overlying unconsolidateddeposits, susceptibility to surface contamination will notexceed that of overlying deposits. However, because thebedrock aquifer systems have complex fracturing systems,once a contaminant has been introduced into a basin bedrockaquifer system, it will be difficult to track. The outcrop/sub-crop area of the Blue River and Sanders Groups is wellknown for significant karst development. Because of the shal-low rock, open joints, and solution channels the aquifer sys-tem is quite susceptible to contaminants introduced at andnear land surface. In the outcrop/subcrop area of the BuffaloWallow, Stephensport, and West Baden Groups the rock ispredominantly shallow and contains numerous, irregularjoints. In limited areas some karst has developed in the lime-stone beds. These conditions warrant considering the aquifersystem as a whole to be somewhat susceptible to contami-nants introduced at and near land surface. In areas where theSilurian and Devonian Carbonates are overlain directly byunconfined sand and gravel outwash, the bedrock is highlysusceptible to surface contamination. In general, thePennsylvanian bedrock aquifer systems are not very suscepti-ble to contamination from the land surface.
Regional estimates of aquifer susceptibility can differ con-siderably from local reality. Variations within geologic envi-ronments can cause variation in susceptibility to surface con-tamination. Also, man-made structures such as poorly-con-structed water wells, unplugged or improperly-abandonedwells, and open excavations, can provide contaminant path-ways which bypass the naturally-protective clays. In contrast,man-made structures can also provide ground-water protec-tion that would not normally be furnished by the natural envi-ronment. For example, large containment structures caninhibit infiltration of both surface water and contaminants.Current regulations administered by the Indiana Departmentof Environmental Management (IDEM) contain provisionsfor containment structures, thereby permitting many opera-tions to occur that would otherwise provide an increased con-tamination risk to soils and the ground water. Other regula-tions administered by the IDNR regulate the proper construc-tion of new wells and sealing (plugging) of abandoned wells,whether related to petroleum or water production.
Protection and management of ground-water resources
Major ground-water management and protection activitiesin Indiana are administered by the Indiana Department ofEnvironmental Management (IDEM), Indiana Department ofNatural Resources (IDNR), and the Indiana State Departmentof Health (ISDH). An expanded cooperative effort in the formof the Inter-Agency Ground-Water Task Force involves rep-resentatives of these three agencies as well as the StateChemist, State Fire Marshal, and members of local govern-ment, labor, and the business, environmental and agriculturalcommunities. The Task Force was first formed in 1986 todevelop a state ground-water quality protection and manage-
74 Ground-Water Resource Availability, West Fork and White River Basin
ment strategy and is mandated by the 1989 Ground WaterProtection Act (IC 13-7-26) to coordinate the implementationof this strategy. The strategy is an agenda of state action toprevent, detect, and correct contamination and depletion ofground water in Indiana (Indiana Department ofEnvironmental Management, 1986). The 1989 act alsorequires the IDEM to maintain a registry of contaminationsites, operate a clearinghouse for complaints and reports of
ground-water pollution, and investigate incidents of contami-nation that affect private supply wells.
The 1998 and 2000 Indiana Water Quality Reports pro-duced by the Indiana Department of EnvironmentalManagement, Office of Water Management, Planning Branchprovide a summary of Indiana ground-water protectionefforts.
Glossary 75
GLOSSARYablation-the melting of a glacier and associated depositional processes. An
ablation complex is a heterogeneous assemblage of till-like sediment,sand and gravel, and lake deposits formed during the disintegration ofa glacier
accretionary-in this usage, describes the gradual addition of new land toold by the deposition of sediment carried by stream flow
acetanilide-a white, crystalline organic powder (CH3CONHC6H5) usedchiefly in organic synthesis and in medicine for the treatment ofheadache, fever and rheumatism
alluvial-pertaining to or composed of alluviumalluvium-fine- to coarse-grained sediment deposited in or adjacent to mod-
ern streams and derived from erosion of surface sediments elsewhere inthe watershed or from valley walls
anhydrite-a mineral consisting of anhydrous calcium sulfate: CaSO4; itrepresents gypsum without its water of crystallization, and it altersreadily to gypsum. It usually occurs in white or slightly colored, gran-ular to compact masses
anion-an atom or molecule that has gained one or more electrons and pos-sess a negative electrical charge
anthropogenic-relating to the impact or influence of humans or humanactivities on nature
aquifer-a saturated geologic unit that can transmit significant quantities ofwater under ordinary hydraulic gradients
aquifer system-a heterogeneous body of permeable and poorly permeablematerials that functions regionally as a water-yielding unit; it consistsof two or more aquifers separated at least locally by confining units thatimpede ground-water movement, but do not affect the overall hydrauliccontinuity of the system
aquitard-a confining layer that retards but does not prevent the flow ofwater to or from an adjacent aquifer
arenaceous-said of a sediment or sedimentary rock consisting wholly or inpart of sand-size fragments, or having a sandy texture or the appearanceof sand
argillaceous-pertaining to, largely composed of, or containing clay-sizedparticles or clay minerals
artesian-see confinedbackwater-water held or forced back, as by a dam, flood, tide, etc.basal tills-refers to tills originating from the zone of the glacier near the
bedbase flow-the portion of stream flow derived largely or entirely from
ground-water dischargebasement rocks-the crust of the Earth below sedimentary deposits bioclastic vuggy dolomite-a calcium magnesium carbonate rock which
consists primarily of fragments or broken remains of organisms (suchas shells) and which contains small cavities usually lined with crystalsof a different mineral composition from the enclosing rock
calcareous-describes a rock or sediment that contains calcium carbonatecarbonate-in this usage, a rock consisting chiefly of carbonate minerals
which were formed by the organic or inorganic precipitation from aque-ous solution of carbonates of calcium, magnesium, or iron; e.g. lime-stone and dolomite
carcinogenic-capable of producing a cancercation-an atom or molecule that has lost one or more electrons and pos-
sesses a positive chargeclastic-pertaining to a rock or sediment composed principally of broken
fragments that are derived from preexisting rocks or minerals and thathave been transported some distance from their places of origin; alsosaid of the texture of such a rock
colluvial-pertaining to colluviumcolluvium-loose rock debris at the foot of a slope or cliff deposited by rock
falls, landslides and slumpagecone of depression-a depression in the ground water table or potentiomet-
ric surface that has the shape of an inverted cone and develops arounda well from which water is being withdrawn. It defines the area of influ-ence of a well
confined-describes an aquifer which lies between impermeable forma-tions; confined ground-water is generally under pressure greater thanatmospheric; also referred to as artesian
contact-a plane or irregular surface between two types or ages of rockcontaminant (drinking water)-as defined by the U.S. Environmental
Protection Agency, any physical, chemical, biological, or radiologicalsubstance in water, including constituents which may not be harmful
contemporaneous-formed or existing at the same timecuesta-a hill or ridge with a gentle slope on one side and a steep slope on
the other
cyclothem-a cycle applied to sedimentary rocks to describe a series of bedsdeposited during a single sedimentary cycle of the type that prevailedduring the Pennsylvanian Period. Cyclothems are typically associatedwith unstable shelf or interior basin conditions in which alternatemarine transgressions and regressions occur; nonmarine sediments usu-ally occur in the lower half of a cyclothem, marine sediments in theupper half
debris-flow-body of sediment that has moved downslope under the influ-ence of gravity; may be derived from a wide variety of pre-existing sed-iments that are generally saturated and may be deposited on or againstunstable substrates, such as glacial ice; flowage occurs when the sedi-ments lose their cohesive strength and liquify. Mud flows are a varietyof debris flow composed primarily of fine-grained sediment such as siltand clay. Historically, debris flows formed by flowage of soft till havebeen referred to as flow till. Because ancient mudflows frequentlyresemble glacial till they are sometimes referred to as till-like sediment
detection limit-is the amount of constituent that produces a signal suffi-ciently large that 99 percent of the trials with the amount will producea detectable signal 5X the instrumental detection limit
differential erosion-erosion that occurs at irregular or varying rates,caused by the differences in the resistance and hardness of surfacematerials: softer and weaker rocks are rapidly worn away; whereasharder and more resistant rocks remain to form ridges, hills, or moun-tains
disconformity-term used to refer to rock formations that exhibit parallelbedding but have between them a time break in deposition
discharge-see discharge areadischarge area-region where ground water is moving toward, and general-
ly appearing at the land surface or in a surface water bodydivalent-having a valence of two, the capacity to unite chemically with two
atoms of hydrogen or its equivalentdolomitic-dolomite-bearing, or containing dolomite; esp. said of a rock
that contains 5 to 50 percent of the mineral dolomite in the form ofcement and/or grains or crystals; containing magnesium
down-dip-a direction that is downwards and parallel to the dip (angle fromthe horizontal) of a structure or surface
drainage basin-the land area drained by a river and its tributaries; alsocalled watershed or drainage area
drawdown (ground water)-the difference between the water level in awell before and during pumping
end moraine-see moraine, end epicontinental-situated on the continental shelf or on the continental inte-
riorescarpment-a long, more or less continuous cliff or relatively steep slope
facing in one general direction, breaking the continuity of the land byseparating two level or gently sloping surfaces, and produced by ero-sion or by faulting
esker-narrow, elongate ridge of ice-contact stratified drift believed to formin channels under a glacier
evapotranspiration-a collective term that includes water discharged to theatmosphere as a result of evaporation from the soil and surface-waterbodies and by plant transpiration
evaporite-see evaporitic depositsevaporitic deposits-of or pertaining to sedimentary salts precipitated from
aqueous solutions and concentrated by evaporationexposure-in this usage, (geology) an area of a rock formation or geologic
structure that is visible, either naturally or artificially, i.e. is unobscuredby soil, vegetation, water, or the works of man; also, the condition ofbeing exposed to view at the earth's surface
facies-features, such as bedding characteristics or fossil content, whichcharacterize a sediment as having been deposited in a unique environ-ment
fan-body of outwash having a fan shape and an overall semi-conical pro-file; generally deposited where a constricted meltwater channelemerges from an ice margin into a large valley or open plain. The fanhead represents the highest and most ice-proximal part of the fan andcommonly emanates from an end moraine or similar ice marginal fea-ture. Ice-contact fans were deposited up against or atop ice and arecommonly collapsed and pitted. Meltwater along the toe of the fancommonly occupies fan-marginal channels
fault-(structural geology) a fracture or a zone of fractures along whichthere has been displacement of the sides relative to one another parallelto the fracture
flow till-see debris flowflowing well-a well completed in a confined aquifer in which the hydro-
static pressure is greater than atmospheric pressure, and the water risesnaturally to an elevation above land surface
fluvial-of or pertaining to rivers
76 Ground-Water Resource Availability, West Fork and White River Basin
fossiliferous-containing fossils, which are preserved plant or animalimprints or remains
gamma-ray logs-the radioactivity log curve of the intensity of naturalgamma radiation emitted from rocks in a cased or uncased borehole. Itis used for correlation, and for distinguishing shales and till (which areusually richer in naturally radioactive elements) from sand, gravel,sandstone, carbonates, and evaporites
geode-a hollow or partly hollow and globular or subspherical body, from2.5 cm to 30 cm or more in diameter, found in certain limestone bedsand rarely in shales
glacial lobe-segment of a continental ice sheet having a distinctive flowpath and lobate shape that formed in response to the development ofregional-scale basins (e.g., Lake Erie) on the surface that the ice flowedacross. The shapes and flow paths of most of the individual glaciallobes in this part of the upper Midwest were largely related to the formsof the Great Lake basins. Each lobe was tens of thousands of squaremiles in size and had flow patterns and histories that were distinct fromone another
glacial terrain-geographic region or landscape characterized by a geneticrelationship between landforms and the underlying sequences of sedi-ments
glaciolacustrine-pertaining to, produced by, or formed in a lake or lakesassociated with glaciers
ground-water discharge-in this usage, the part of total runoff which haspassed into the ground and has subsequently been discharged into astream channel
gypsum-a widely distributed mineral consisting of hydrous calcium sulfatehealth advisories (HAs)-provide the level of a contaminant in drinking
water at which adverse non-carcinogenic health effect would not beanticipated with a margin of safety
hummocky-describes glacial deposits arranged in mounds with interven-ing depressions
hydraulic conductivity-a parameter that describes the conductive proper-ties of a porous medium; often expressed in gallons per day per squarefoot; more specifically, rate of flow in gallons per day through a crosssection of one square foot under a unit hydraulic gradient, at the pre-vailing temperature
hydraulic gradient-the rate of change in total head per unit of distance offlow in a given direction
hydrostatic pressure-the pressure exerted by the water at any given pointin a body of water at rest. The hydrostatic pressure of ground water isgenerally due to the weight of water at higher levels in the zone of sat-uration
ice-contact fans-see fanice-contact stratified drift-glacial sediment composed primarily of sand
and gravel that was deposited on, against, or within glacier ice. Thesedeposits typically have highly irregular surface form due to the collapseof the adjacent ice
igneous-describes rocks that solidified from molten or partly molten mate-rial
immunoassay-is a quantitative or qualitative method of analysis for a sub-stance which relies on an antibody or mixture of antibodies as the ana-lytical reagent. Antibodies are produced in animals in response to a for-eign substance called an antigen. The highly sensitive and specific reac-tion between antigens and antibodies is the basis for immunoassay tech-nology
incised-describes the result of the process whereby a downward-erodingstream deepens its channel or produces a narrow, steep-walled valley
infiltration-the process (rate) by which water enters the soil surface andwhich is controlled by surface conditions
ion exchange-the process of reciprocal transfer of ionskame-irregular ridge or roughly conical mound of sand and gravel with a
hummocky surface; usually formed in contact with disintegrating icekarst-topography characterized by closed depressions or sinkholes, caves,
and underground drainage formed by dissolution of limestone,dolomite, or gypsum
lacustrine-pertaining to, produced by, or formed in a lake or lakeslacustrine sediment-sediment deposited in lakes; usually composed of
fine sand, silt, and clay in various combinationslithologic-describes the physical character of a rock; includes features such
as composition, grain size, color, and type of beddinglithology-the description of rocks, esp. in hand specimen and in outcrop, on
the basis of such characteristics as color, mineralogic composition, andgrain size
loam-describes a soil composed of a mixture of clay, silt, sand, and organ-ic matter
mass movement-a unit movement of a portion of the land surface; gravi-tative transfer of material down a slope
maximum contaminant level-the maximum permissible level of a conta-minant in water which is delivered to the free-flowing outlet of the userof a public water system
median-middle value of a set of observations arranged in order of magni-tude
meltwater-water resulting from the melting of snow or glacial icemetabolite-a product of metabolic actionmethemoglobinemia-a disease, primarily in infants, caused by the conver-
sion of nitrate to nitrite in the intestines, and which limits the blood'sability to transport oxygen
monovalent-having a valence of one, the capacity to unite chemically withone atom of hydrogen or its equivalent
moraine-unsorted, unstratified glacial drift deposited chiefly by the directaction of glacial ice
moraine, end-a ridgelike accumulation of drift built along any part of theouter margin of an active glacier; often arcuate in shape, end morainesmark places along which the terminus of a glacier remained for rela-tively long periods. Terminal moraines mark the ultimate extent of aparticular glacier, whereas recessional moraines are deposited wherethe ice-margin stabilized for a period of time during the retreat of theglacier
moraine, ground-material (primarily till) deposited from a glacier on theground surface over which the glacier moved, and generally forming aregion of low relief
muck-a highly organic dark or black soil less than 50 percent combustiblemud flow-see debris flowoutwash-sediment deposited by meltwater out in front of an ice margin;
usually composed of sand and/or gravel. An outwash plain is a broadtract of low relief covered by outwash deposits, whereas an outwashterrace is a relatively small flat or gently sloping tract that lies abovethe valley of a modern stream
outwash plain-see outwash outwash terrace-see outwashoverconsolidated-refers to the consistency of unconsolidated sediment
that is much harder than would be expected from its present depth ofburial; fine-grained glacial sediments such as till are commonly over-consolidated due to such processes as burial by ice or younger sedi-ments, frequent wetting and drying, and freezing and thawing
paraconformably-this type of unconformity is a kind of disconformity inwhich no erosion surface is discernible or in which the contact is a sim-ple bedding plane, and in which the beds above and below the break areparallel
paired wells-in this usage, refers to multiple closely spaced observationswells each set at a different depth for the purpose of determining thehydrostatic pressure on different aquifers at the same location
percolate (geology)-to seep downward from an unsaturated zone to a satu-rated zone
periglacial-said of the processes, conditions, areas, climates, and topo-graphic features at the immediate margins of former and existing glac-iers and ice sheets, and influenced by the cold temperature of the ice
permeability-the capacity of a porous medium to transmit a fluid; highlydependent upon the size and shape of the pores and their interconnec-tions
physiographic region-an area of characteristic soils, landforms, anddrainage that have been developed on geologically similar materials
physiography-in this usage, a description of the physical nature (form,substance, arrangement, changes) of objects, esp. of natural features
pinnacle reefs-a term used in the Michigan Basin to apply to an isolatedstromatoporoid-algal reef mound, now dolomitized, in the MiddleSilurian rocks of the subsurface
piezometric surface-an imaginary surface representing the level to whichwater from a given aquifer will rise under the hydrostatic pressure ofthe aquifer
Pleistocene-geologic epoch corresponding to the most recent ice age;beginning about 2 million years ago and ending approximately 10,000years ago
porosity-the amount of pore space; specifically, the ratio of the total vol-ume of voids to the total volume of a porous medium
postdepositional-occurring after materials had been depositedpotable-water which is palatable and safe to drink: ie., fit for human con-
sumptionpotentiometric surface-an imaginary surface representing the total head
of ground water in a confined aquifer that is defined by the level towhich water will rise in a well
pre Wisconsin-general term that refers to the part of the Ice Age prior toabout 75,000 years ago, during which many other glacial episodes atleast as extensive as those of the Wisconsin Age took place
prodeltaic-the part of a delta that is below the effective depth of wave ero-
Glossary 77
sion, lying beyond the delta front, and sloping gently down to the floorof the basin into which the delta is advancing and where clastic riversediment ceases to be a significant part of the basin-floor deposits
proglacial-occurring or being deposited directly in front of a glacierprovenance-a place of origin; specifically the area from which the con-
stituent materials of a sedimentary rock or facies are derived; also, therocks of which this area is composed
pumping test-a test conducted by pumping a well at a constant rate for aperiod of time, and monitoring the change in hydraulic head in theaquifer
recharge (ground water)-the process by which water is absorbed andadded to the zone of saturation
reducing-describes the process of removing oxygen from a compoundreef-a ridgelike or moundlike structure, layered or massive, built by seden-
tary calcareous organisms, esp. corals, and consisting mostly of theirremains
regression-(stratigraphy) the retreat or contraction of the sea from landareas, and the consequent evidence of such withdrawal
relict-said of a topographic feature that remains after other parts of the fea-ture have been removed or have disappeared
residuum-(weathering) residuerunoff, (total)-the part of precipitation that appears in surface-water bod-
ies; it is the same as stream flow unaffected by artificial manipulationsaline-describes water that contains a high concentration of dissolved
solids, typically greater than 10,000 milligrams per litersandstone-a medium-grained clastic sedimentary rock composed of abun-
dant rounded or angular fragments of sand size set in a fine-grainedmatrix (silt or clay) and more or less firmly united by a cementingmaterial
secondary maximum contaminant level-recommended, nonenforceablestandards established to protect aesthetic properties of drinking water,such as taste and odor
sedimentary rock-formed by the deposition of sedimentseismic-pertaining to an earthquake or earth vibration, including those that
are artificially inducedshale-a fine-grained detrital sedimentary rock, formed by the consolidation
(esp. by compression) of clay, silt, or mudskewed-describes the state of asymmetry of a statistical frequency distrib-
ution, which results from a lack of coincidence of the mode, median,and arithmetic mean of the distribution
slack water-a quiet part of, or a still body of water sluiceway-valley or channel that conducted large amounts of glacial melt-
water through and/or away from a glacier; may or may not be occupiedby a modern stream; commonly associated with one or more former icemargins
solution-(geology) a process of chemical weathering by which mineral androck materials passes into solution; e.g. removal of the calcium carbon-ate in limestone by carbonic acid derived from rain-water containingcarbon dioxide acquired during its passage through the atmosphere
source area-general geographic region that furnished the sediment supplyfor a particular deposit. Sediments deposited by different rivers or glac-iers can often be distinguished because their respective source areas dif-fer in terms of the composition of bedrock and other sediments theycontain; see provenance
static water level-the level of water in a well that is not being affected bywithdrawal of ground water
stratigraphy-the geologic study of the formation, composition, sequenceand correlation of unconsolidated or rock layers
storage coefficient-the volume of water an aquifer releases from or takesinto storage per unit surface area of the aquifer per unit change in head
subcrop-a "subsurface outcrop" that describes the areal limits of a truncat-ed rock unit at the buried surface of an unconformity
subjacent-being lower, but not necessarily lying directly belowswale-a slight depression, sometimes swampy, in the midst of generally
level landtectonic-said of or pertaining to the forces involved in, or the resulting
structures or features of, tectonics or earth movementsterminal moraine-see moraine, endtill-unsorted sediment deposited directly from glacier ice with little or no
reworking by meltwater or mass movement; usually contains particlesranging in size from clay to boulders
till-like sediment-see till and debris flowtill plain-an extensive area with a flat to undulating surface, underlain by
till and commonly covered by ground moraines and subordinate endmoraines
topography-the relief and contour of a surface, especially land surfacetoxic-describes materials which are or may become harmful to plants or
animals when present in sufficient concentrationstransgression-the spread or extension of the sea over the land areastransmissivity-the rate at which water is transmitted through a unit width
of an aquifer under a unit hydraulic gradienttriazine-any of a group of chemicals containing three nitrogen and three
carbon atoms arranged in a six member ring and having the formulaC3H3N3; also any of various derivative of these compounds includingseveral used as herbicides
tunnel valley-wide, linear channel oriented perpendicular to an ice marginand eroded into the substrate below the ice sheet. A tunnel valley typi-cally represents a major route for meltwater draining part of an icesheet, and exiting the front of that ice sheet
unconfined-describes an aquifer whose upper surface is the water tablewhich is free to fluctuate under atmospheric pressure
unconformably-not succeeding the underlying rocks in immediate order ofage or not fitting together with them as parts of a continuous whole
unconformity-a substantial break or gap in the geologic record where arock unit is overlain by another that is not next in stratigraphic succes-sion
valley train-large, elongated body of outwash localized within the confinesof a topographic valley
water table-the upper surface of the zone of saturation below which allvoids in rock and soil are saturated with water
watershed-see drainage basinWisconsin Age-the most recent period of major glacial activity during the
ongoing ice age, perhaps beginning as long as 75,000 years ago andcontinuing until about 10,000 years ago
78 Ground-Water Resource Availability, West Fork and White River Basin
SELECTED REFERENCESAmerican Farm Bureau Federation, 1987, Water quality self-help checklist:
American Farm Bureau Federation pamphletArihood, L.D., 1982, Groundwater resources of the White River Basin,
Hamilton and Tipton Counties, Indiana: U.S. Geological Survey Water-Resources Investigations 82-48, 69 p.
Arihood, L.D., and Lapham, W.W., 1982, Ground-water resources of theWhite River basin, Delaware County, Indiana: U.S. Geological SurveyWater-Resources Investigations 82-47, 69 p.
Ault, C.H., Austin, G.S., Bleuer, N.K., Hill, J.R., Moore, M.C., 1973,Guidebook to the geology of some Ice Age features and bedrock for-mations in the Fort Wayne area, Indiana: Indiana Geological SurveyGuidebook, 62 p.
Bailey, Z.C., and Imbrigiotta, R.E., 1982, Ground-water resources of theglacial outwash along the White River, Johnson and Morgan Counties,Indiana: U.S. Geological Survey Water-Resources Investigations 82-4016, 87 p.
Barnhart, J.R., and Middleman, B.H., 1990, Hydrogeology of GibsonCounty, Indiana: Indiana Department of Natural Resources, Divisionof Water Bulletin 41, 17 p.
Basch, M.E., and Funkhouser, R.V., 1985, Irrigation impacts on ground-water levels in Jasper and Newton Counties, Indiana, 1981-84: IndianaDepartment of Natural Resources, Division of Water, Water ResourcesAssessment 85-1
Bates, R.L., and Jackson, J.A., eds., 1987, Glossary of Geology (3rd edi-tion): Alexandria, Virginia, American Geological Institute, 788 p.
Bechert, C.H., and Heckard, J.M., 1966, Physiography, in Lindsey, A.A.,ed., Natural features of Indiana: Indianapolis, Indiana Academy ofScience, p. 100-115
Becker, L.E., 1974, Silurian and Devonian rocks in Indiana southwest ofthe Cincinnati Arch: Indiana Geological Survey, Bulletin 50
Becker, L.E., and Keller, S.J., 1976, Silurian reefs in southwestern Indianaand their relation to petroleum accumulation: Indiana GeologicalSurvey Occasional Paper 19, 11 p.
Becker, L.E., Hreha, A.J., and Dawson, T.A., 1978, Pre-Knox (Cambrian)stratigraphy in Indiana, Indiana Geological Survey, Bulletin 57
Bergeron, M.P., 1981, Effect of irrigation pumping on the ground-watersystem in Newton and Jasper Counties, Indiana: U.S. GeologicalSurvey, Water-Resources Investigation 81-38
Bleuer, N.K., 1974, Buried till ridges in the Fort Wayne area, Indiana, andtheir regional significance: Geological Society of America Bulletin,v.85, p. 917-920
_____1989, Historical and geomorphic concepts of the Lafayette BedrockValley System (so-called Teays Valley) in Indiana Department ofNatural Resources, Geological Survey Special Report 46, 11 p.
_____1991, The Lafayette Bedrock Valley System of Indiana; concept,form, and fill stratigraphy, in Melhorn, W.N., and Kempton, J.P., eds.,Geology and hydrogeology of the Teays-Mahomet Bedrock ValleySystem: Geological Society of America Special Paper 258, p. 51-77
Bleuer, N.K., Melhorn, W.N., Steen, W.J., and Bruns, T.M., 1991, Aquifersystems of the buried Marion-Mahomet trunk valley (LafayetteBedrock Valley System) of Indiana, in Melhorn, W.N., and Kempton,J.P., eds., Geology and hydrogeology of the Teays-Mahomet BedrockValley System: Geological Society of America Special Paper 258, p.79-89
Bradbury, K.R., and Rothschild, E.R., 1985, A computerized technique forestimating the hydraulic conductivity of aquifers from specific capaci-ty data: Ground Water 23, p. 240?246
Brown, E.A., 1949, Ground-water resources of Boone County, Indiana:Indiana Department of Conservation, Division of Water ResourcesBulletin 4, 152 p.
Bruns, T.M., Logan, S.M., and Steen, W.J., 1985, Maps showing bedrocktopography of the Teays Valley, north-central Indiana: IndianaGeological Survey Miscellaneous Map 43, scale 1:100,000
Burger, A.M., Forsyth, J.L., Nicoll, R.S., and Wayne, W.J., 1971, Geologicmap of the 1o x 2o Muncie Quadrangle, Indiana and Ohio, showingbedrock and unconsolidated deposits: Indiana Geological SurveyRegional Geologic Map 5
Cable, L.W., and Robison, T.M., 1973, Hydrogeology of the principalaquifers in Sullivan and Greene Counties, Indiana: Indiana Departmentof Natural Resources, Division of Water Bulletin 35, 26 p.
_____1974, Ground-water resources of Montgomery County, Indiana:Indiana Department of Conservation, Division of Water ResourcesBulletin 36, 20 p.
Cable, L.W., Watkins, F.A., Jr., and Robison, T.M., 1971, Hydrogeology ofthe principal aquifers in Vigo and Clay Counties, Indiana: Indiana
Department of Natural Resources, Division of Water Bulletin 34, 34 p.Carter, D.S., Lydy, M.J., and Crawford, C.G., 1995, Water-quality assess-
ment of the White River Basin, Indiana-Analysis of available informa-tion on pesticides, 1972-92: U.S. Geological Survey Water-ResourcesInvestigation Report 94-4024, 60 p.
Casey, G.D., 1996, Hydrogeologic framework of the midwestern basins andarches region in parts of Indiana, Ohio, Michigan, and Illinois: U.S.Geological Survey Professional Paper 1423-B, 46 p.
Crawford, C.G., 1995, Occurrence of pesticides in the White River,Indiana, 1991-95: U.S. Geological Survey Fact Sheet 233-95, 4 p.
Dalton, M.G., and Upchurch, S.B., 1978, Interpretation of hydro-chemicalfacies by factor analysis: Groundwater, 16(4), p. 228-233
Davis, S.N., and DeWiest, R.J.M., 1970, Hydrogeology: New York, JohnWiley, 463 p.
Doheny, E.J., Droste, J.B., and Shaver, R.H., 1975, Stratigraphy of theDetroit River Formation (Middle Devonian) of northern Indiana:Indiana Geological Survey, Bulletin 53
Drever, J.I., 1988, The geochemistry of natural waters (2nd ed.):Englewood Cliffs, N.J., Prentice Hall, 437 p.
Droste, J.B., Abdulkareem, T.F., and Patton, J.B., 1982, Stratigraphy of theAncell and Black River Groups (Ordovician) in Indiana: IndianaGeological Survey Occasional Paper 36, 15 p.
Droste, J.B., and Keller, S.J., 1989, Development of theMississippian/Pennsylvanian unconformity in Indiana, IndianaGeological Survey Occasional Paper 55, 11 p.
Droste, J.B., and Patton, J.B., 1985, Lithostratigraphy of the SaukSequence in Indiana: Indiana Geological Survey Occasional Paper 47,24 p.
Droste, J.B., and Shaver, R.H., 1982, The Salina Group (Middle and UpperSilurian) of Indiana: Indiana Geological Survey, Special Report 24
Dufor C.N., and Becker, E., 1964, Public water supplies of the 100 largestcities in the United States, 1962: U.S. Geological Survey, Water-Supply Paper 1812
Eberts, S.M., and George, L.L., 2000, Regional Ground-water flow andgeochemistry in the Midwestern Basin and Arches Aquifer System inparts of Indiana, Ohio, Michigan, and Illinois: U.S. Geological SurveyRegional Aquifer System Analysis, Professional Paper 1423-C, 103 p.
Erd, R.C., and Greenberg, S.S., 1960, Minerals of Indiana: IndianaDepartment of Conservation, Geological Survey, Bulletin No. 18
Eschman, D.F., 1985, Summary of the Quaternary history of Michigan,Ohio and Indiana: Journal of Geological Education 33, p. 161?167
Fenelon, J.M., 1998, Water Quality in the White River Basin, Indiana,1992-96: U.S. Geological Survey Circular 1150, 34 p.
Fenelon, J.M., and Moore, R.C., 1996a, Occurrence of pesticides in groundwater in the White River Basin, Indiana, 1994-95: U.S. GeologicalSurvey Fact Sheet 084-96, 4 p.
_______ 1996b, Occurrence of volatile organic compounds in groundwater in the White River Basin, Indiana, 1994-95: U.S. GeologicalSurvey Fact Sheet 138-96, 4 p.
Fetter, C.W., 1988, Applied hydrogeology (2nd ed.): Columbus, Ohio,Merrill Publishing, 592 p.
Fleming, A.H., Brown, S.E., and Ferguson, V.R., 1993, The hydrogeologicframework of Marion County, Indiana-Atlas emphasizing hydrogeolog-ic terrain and sequence: Indiana Geological Survey Open-File Report93-5, 67 p.
Fleming, A.H., ed., and others, 1994, Atlas of hydrogeologic terrains andsettings in Indiana, northern part: Indiana Geological Survey Open-File Report 94-17.
Fleming, A.H., ed., Bonneau, P., Brown, S.E., Grove, G., Harper, D.,Herring, W., Lewis, E.S., Moeller, A.J., Powell, R., Reehling, P., Rupp,R.F., and Steen, W.J., 1995, Atlas of hydrogeologic terrains and settingsof Indiana: Indiana Geological Survey Open-File Report 95-7. Thisreport supercedes Indiana Geological Survey Report 94-17, "Atlas ofHydrogeologic terrains and settings of Indiana: northern part".
Freeze, R.A., and Cherry, J.A., 1979, Groundwater: New Jersey,Prentice?Hall
GeoTrans Inc., 1983, Assessment of Prudential pumping on the ground-water system of Jasper and Newton Counties, Indiana: Reston Va.,report to J.R. Nesbitt
Gillies, D.C., 1976, Availability of ground water near Carmel, HamiltonCounty, Indiana: U.S. Geological Survey Water ResourcesInvestigations Report 76-46, 27 p.
Geosciences Research Associates, Inc., 1982, Hydrogeologic atlas ofIndiana: Bloomington, Ind., 31 p.
Gray, H.H., 1972, Lithostratigraphy of the Maquoketa Group (Ordovician)in Indiana: Indiana Geological Survey Special Report 7, 31 p.
_____1978, Buffalo Wallow Group, Upper Chesterian (Mississippian) ofsouthern Indiana: Indiana Geological Survey Occasional Paper 25, 28 p.
Selected References 79
_____1979, The Mississippian and Pennsylvanian Systems in the UnitedStates-Indiana: U.S. Geological Survey Professional Paper 1110-K, 20 p.
_____1982, Map of Indiana showing topography of the bedrock surface:Indiana Geological Survey, Miscellaneous Map 36, scale 1:500,000
_____1983, Map of Indiana showing thickness of unconsolidated deposits:Indiana Geological Survey, Miscellaneous Map 38, scale 1:500,000
_____1988, Relict drainageways associated with the glacial boundary insouthern Indiana: Indiana Geological Survey Special Report 45, 23 p.
_____1989, Quaternary geologic map of Indiana: Indiana GeologicalSurvey, Miscellaneous Map 49, scale 1:500,000
_____2000, Physiographic divisions of Indiana: Indiana GeologicalSurvey, 15 p.
Gray, H.H., Ault, C.H., and Keller, S.J., 1987, Bedrock geologic map ofIndiana: Indiana Geological Survey, Miscellaneous Map 48, scale1:500,000
Gray, H.H., Wayne, W.J., and Wier, C.E., 1970, Geologic map of the 1o x2o Vincennes Quadrangle and parts of adjoining quadrangles, Indianaand Illinois, showing bedrock and unconsolidated deposits: IndianaGeological Survey Regional Geologic Map 3.
Gray, H.H., and others, 1972, Geologic map of the 1o x 2o CincinnatiQuadrangle, Indiana and Ohio, showing bedrock and unconsolidateddeposits: Indiana Geological Survey Regional Geologic Map 7.
_____1979, Geologic map of the 1o x 2o Indianapolis Quadrangle, Indianaand Illinois, showing bedrock and unconsolidated deposits: IndianaGeological Survey Regional Geologic Map 1
Gutstadt, A.M., 1958, Cambrian and Ordovician stratigraphy and oil andgas possibilities in Indiana: Indiana Department of Conservation,Geological Survey, Bulletin 14
Hartke, E.J., and Hill, J.R., 1976, Environmental geologic maps for landuse evaluations in Morgan County, Indiana: Indiana Geological SurveyOccasional Paper 17, 10 p.
Hasenmueller, N.R. and Nauth, D.D., Radon: Indiana Geological Survey,Information Circular, v. 1, no. 2, 4 p.
Heckard, J.M., 1964, Water resources of Morgan County, with emphasis onground-water availability: Indiana Department of Natural Resources,Division of Water, 1 sheet.
Hem, J.D., 1985, Study and interpretation of the chemical characteristics ofnatural water (3d ed.): U.S. Geological Survey, Water?Supply Paper2254
_____1993, Factors affecting stream water quality, and water-qualitytrends in four basins in the conterminous United States, 1905-90, inPaulson, R.W., Chase, E.B., Williams, J.S., and Moody, D.W., eds.,National water summary 1990-91; hydrologic events and stream waterquality: U.S. Geological Survey Water-Supply Paper 2400
Herring, W.C., 1971, Water resources of Hamilton County, with emphasison ground-water availability: Indiana Department of NaturalResources, Division of Water, 1 sheet.
_____1974, Water resources of Marion County, with emphasis on ground-water availability: Indiana Department of Natural Resources, Divisionof Water, 1 sheet.
_____1976, Technical atlas of the ground-water resources of MarionCounty, Indiana: Indiana Department of Natural Resources, Divisionof Water, 53 p.
Hill, R.A., 1940, Geochemical patterns in Coachella Valley, California:American Geophysical Union Trans., 21, p. 46-49
Hirsch, R.M., Alley, W.M., and Wilber, W.G., 1988, Concepts for aNational Water-Quality Assessment Program: U.S. Geological SurveyCircular 1021, 42 p.
Hoggatt, R.E., 1975, Drainage areas of Indiana streams: U.S. GeologicalSurvey, unnumbered report, 231 p.
Hoggatt, R.E., Hunn, J.K., and Steen, W.J., 1968, Water resources ofDelaware County, Indiana: Indiana Department of Natural Resources,Division of Water Bulletin 37, 57 p.
Homoya, M.A., Abrell, D.B., Aldrich, J.R., and Post, T.W., 1985, The nat-ural regions of Indiana: Indiana Academy of Science, Proc., v. 94, p.245-268
Hoover, M.E., and Durbin, J.M., 1994, White River Basin, in Fenelon,J.M., Bobay, K.E., and others, Hydrogeologic atlas of aquifers inIndiana: U.S. Geological Survey Water-Resources InvestigationsReport 92-4142, p. 113-133.
Indiana Department of Environmental Management, 1986, The protectionof Indiana's ground water-strategy and draft implementation plan
_____[1990], 305{b} Report, 1988-1089_____[1995], 305(b) Report, 1992-1993_____1998, 305(b) Report, 1996, IDEM/34/02/002/1998_____2000, Indiana Water Quality Report, 2000, IDEM/34/02/001/2000Indiana Department of Natural Resources (Clark, G.D., ed.), 1980, The
Indiana water resource-availability, uses, and needs: Governor's Water
Resource Study CommissionIndiana Water Pollution Control Board, 1992, 327 IAC 2-1 Water quality
standardsJacques, D.V., and Crawford, C.G., 1991, National Water-Quality
Assessment Program-White River Basin: U.S. Geological SurveyOpen-File Report 91-169, 2 p.
Johnson, G.H., and Keller, S.J., 1972, Geologic map of the 1o x 2o FortWayne Quadrangle, Indiana, Michigan, and Ohio, showing bedrock andunconsolidated deposits: Indiana Geological Survey Regional GeologicMap 8
Keller, S.J., 1983, Analysis of subsurface brines in Indiana: IndianaGeological Survey, Occasional Paper 41
Lapham, W.W., 1981, Ground-water resources of the White River Basin,Madison County, Indiana: U.S. Geological Surey Water-ResourcesInvestigations 81-35, 112 p.
Lapham, W.W., and Arihood, L.D., 1984, Ground-water resources of theWhite River Basin, Randolph County, Indiana: U.S. GeologicalSurvey, Water-Resources Investigations Report 83-4267, 86 p.
Lehr, J.H., Gass, T.E., Pettijohn, W.A., and DeMarre, J., 1980, Domesticwater treatment: New York, McGraw-Hill, 264 p.
Leverett, F., 1897, The water resources of Indiana and Ohio: U.S.Geological Survey Annual Report 18 (1896-1897), pt. 4, p. 419-560
Leverett, F., and Taylor, F.B., 1915, The Pleistocene of Indiana andMichigan and the history of the Great Lakes: U.S. Geological SurveyMonograph 53, 529 p.
Lindsey, A.A. (ed.), 1966, Natural features of Indiana: Indiana Academyof Science and Indiana State Library
Lindsey, A.A., Schmeiz, D.V., and Nichols, S.A., 1970 (reprinted edition),Natural areas in Indiana and their preservation: Report of the IndianaNatural Areas Survey, Notre Dame, Indiana
Lineback, J.A., 1970, Stratigraphy of the New Albany Shale in Indiana:Indiana Geological Survey Bulletin 44, 73 p.
Lineback, J.A., Bleuer, N.K., Mickelson, D.M., Farrand, W.R., andGoldthwait, R.P., (Richmond, G.M., and Fullerton, D.S., eds.), 1983,Quaternary geologic map of the Chicago 4° x 6° Quadrangle, UnitedStates: U.S. Geological Survey, Miscellaneous Investigations Series,Map I?1420 (NK?16), scale 1:1,000,000
Linsley, R.K., Jr., Kohler, M.A., and Paulhus, J.L.H., 1982, Hydrology forengineers (3d ed.): New York, McGraw?Hill
Madison, R.J., and Brunett, J.O., 1984, Overview of the occurrence ofnitrate in ground water of the United States, in National WaterSummary 1984: U.S. Geological Survey, Water?Supply Paper 2275
Malott, C.A., 1922, The physiography of Indiana, in Indiana Department ofConservation, Handbook of Indiana Geology: Division of Geology
Manahan, S.E., 1975, Environmental chemistry: Boston, Willard GrantPress, 532 p.
Martin, J.D., Crawford, C.G., Frey, J.W., and Hodgkins, G.A., 1996, Water-quality assessment of the White River Basin, Indiana-Analysis of avail-able information on nutrients, 1980-92: U.S. Geological Survey Water-Resources Investigantions Report 96-4192, 91 p.
Melhorn, W.N., and Kempton, J.P. [ed], 1991, Geology and hydrogeologyof the Teays-Mahomet bedrock valley system: Geological Society ofAmerica, Inc., Special Paper 258, 128 p.
Meyer, W., Reussow, J.P., and Gillies, D.C., 1975, Availability of groundwater in Marion County, Indiana: U.S. Geological Survey Open-FileReport 75-312, 87 p.
Moore, R.C., and Fenelon, J.M., 1996, Occurrence of nitrate in groundwater in the White River Basin, Indiana, 1994-95: U.S. GeologicalSurvey Fact Sheet 110-96, 4 p.
Nyman, D.J., and Pettijohn, R.A., 1971, Ground Water, in Wabash RiverCoordinating Committee, Wabash River basin comprehensive study:U.S. Geological Survey and U.S. Army Corps of Engineers, LouisvilleDistrict, volume VII, appendix G, 100 p.
O'Hearn, M., and Gibb, J.P., 1980, Groundwater discharge to Illinoisstreams: Illinois State Water Survey, Contract Report 246
Pettyjohn, W.A., and Henning, R., 1979, Preliminary estimate of ground-water recharge rates, related streamflow and water quality in Ohio:Department of Geology and Mineralogy, Ohio State University ReportNo. 552
Pinsak, A.P., and Shaver, R.H., 1964, The Silurian formations of northernIndiana: Indiana Department of Conservation, Geological Survey,Bulletin 32
Piper, A.M., 1944, A graphical procedure in the geochemical interpretationof water analysis: American Geophysical Union Trans., v. 25, p. 914-923
Rexroad, C.B., and Droste, J.B., 1982, Stratigraphy and conodont paleontol-ogy of the Sexton Creek Limestone and the Salamonie Dolomite (Silurian)in northwestern Indiana: Indiana Geological Survey, Special Report 25
80 Ground-Water Resource Availability, West Fork and White River Basin
Risch, M.R., 1994, A summary of pesticides in ground-water data collect-ed by government agencies in Indiana from December 1985 to April1991: U.S. Geological Survey Open-File report 93-133, 30 p.
Risch, M.R., and Cohen, D.A., 1995, A computerized data base of Nitrateconcentrations in Indiana ground water: U.S. Geological Survey Open-File Report 95-468, 17 p.
Rosenshein, J.S., and Hunn, J.D., 1968, Geohydrology and ground-waterpotential of Lake County, Indiana: Indiana Department of NaturalResources, Division of Water, Bulletin 31
Rupp, J.A. 1991, Structure and isopach maps of the Paleozoic rocks ofIndiana: Indiana Geological Survey, Special Report 48, 106 p.
Sasman, R.T., Schicht, R.J., Gibb, J.P., O'Hearn, M., Benson, C.R., andLudwigs, R.S., 1981, Verification of the potential yield and chemicalquality of the shallow dolomite aquifer in DuPage County, Illinois:Illinois State Water Survey, Circular 149
Schneider, A.F., 1966, Physiography, in Lindsey, A.A. (ed.), Natural fea-tures of Indiana: Indiana Academy of Science and Indiana StateLibrary
Searcy, J.K., 1959, Flow duration curves; Manual of Hydrology, part 2,Low?flow techniques: U.S. Geological Survey, Water?Supply Paper1542?A
Shaver, R.H., 1974, The Muscatatuck Group (New Middle DevonianName) in Indiana: Indiana Geological Survey, Occasional Paper 3, 7 p.
Shaver, R.H., and others, 1961, Stratigraphy of the Silurian rocks of north-ern Indiana: Indiana Geological Survey Field Conference Guidebook10, 62 p.
_____ 1978, The search for a Silurian reef model: Great Lakes area:Indiana Geological Survey Special Report 15, 36 p.
Shaver, R.H., Ault, C.H., Burger, A.M., Carr, D.D., Droste, J.B., Eggert,D.L., Gray, H.H., Harper, D., Hasenmueller, N.R., Hasenmueller, W.A.,Horowitz, A.S., Hutchison, H.C., Keith, B.D., Keller, S.J., Patton, J.B.,Rexroad, C.B., and Wier, C.E., 1986, Compendium of Paleozoicrock?unit stratigraphy in Indiana, a revision: Indiana GeologicalSurvey, Bulletin 59, 203 p.
Skougstad, M.W., and Horr, C.A., 1963, Chemistry of strontium in naturalwater: U.S. Geological Survey, Water-Supply Paper 1496
Smith, B.S., 1983, Availability of water from the outwash aquifer, MarionCounty, Indiana: U.S. Geological Survey Water-ResourcesInvestigation Report 83-4144, 70 p.
Smith, C.R., and Krothe, N.C., 1983, Hydrogeology of the Carbondale andRaccoon Creek Groups, Pennsylvanian System, Vigo, Clay, andSullivan Counties, Indiana: Indiana University Water ResourcesResearch Center, 93 p.
Steen, W.J., 1968, Water resources of Hendricks County with emphasis onground-water availability: Indiana Department of Natural Resources,Division of Water, 1 sheet.
_____1970, Water resources of Madison County, with emphasis on ground-water availability: Indiana Department of Natural Resources, Divisionof Water, 1 sheet.
Steen, W.J., Bruns, T.M., and Perry, A.O., 1977, Water resources of BooneCounty, with emphasis on ground-water availability: IndianaDepartment of Natural Resources, Division of Water, 1 sheet.
Stewart, J.A., Keeton, C.R., Hammil, L.E., Nguyen, H.T., and Majors,D.K., 2001, Water Resources Data, Indiana Water Year 2000: U.S.Geological Survey, Water-Data Report IN-00-1, 450 p.
Sullivan, D.M., 1972, Subsurface stratigraphy of the West Baden Group inIndiana: Indiana Geological Survey Bulletin 47, 31 p.
Swann, D.H., 1968, A summary geologic history of the Illinois Basin, inGeology and petroleum production of the Illinois Basin, a symposium:Ill. and Ind.-Ky. Geol. Socs., p. 3-22
Tanner, G.F., 1986, The Mt. Carmel Fault and associated features in south-central Indiana: Bloomington, Ind., Indiana University, Master's thesis,66 p.
Thomas, J.M., 1980, Water chemistry of the early Pennsylvanian MansfieldFormation aquifer system in Clay County, Indiana: Bloomington, Ind.,Indiana University, Master's thesis, 76 p.
Todd, D.K., 1980, Ground?water hydrology (2nd ed.): New York, JohnWiley, 336 p.
Tucker, W.M., 1922, Hydrology of Indiana, in Indiana Department ofConservation, Handbook of Indiana geology: Division of Geology
Turco, R.F., and Konopka, A.E., 1988, Agricultural impact on groundwaterquality: Purdue University, Water Resources Research Center,Technical Report 185
Uhl, J.E., 1966, Water resources of Johnson County, with emphasis onground water availability: Indiana Department of Natural Resources,Division of Water, 1 sheet.
_____1973, Water resources of Henry County, Indiana, with emphasis onground-water availability: Indiana Department of Natural Resources,
Division of Water, 1 sheet._____1975, Water Resources of Hancock County, Indiana, with emphasis
on ground-water availability: Indiana Department of NaturalResources, Division of Water, 1 sheet.
Uhl, J., and Kingsbury, T., 1957, Irrigation in Indiana using ground?watersources: Indiana Department of Conservation, Division of WaterResources
U.S. Environmental Protection Agency, 1973, Water quality criteria, 1972:Environmental Studies Board, Committee on Water Quality Criteria,U.S. Government Printing Office
_____1976, Quality criteria for water: U.S. Government Printing Office_____2001, Drinking water regulations and health advisories, updated
September 7, 2001 (http://www.epa.gov/safewater/mcl.html): Office ofWater, 8 p.
Wallrabenstein, L.K., Richards, R.P., Baker, D.B., and Barnett, J.D., 1994,Nitrate and pesticides in private wells of Indiana: Indiana Farm BureauInc.
Walton, W.C., 1962, Selected analytical methods for well and aquifer eval-uation: Illinois State Water Survey, Bulletin 49
_____1970, Groundwater resource evaluation: New York, McGraw?HillWangsness, D.J., Miller, R.L., Bailey, Z.C., and Crawford, C.G., 1981,
Hydrology of area 32, eastern region, Interior Coal Province, Indiana:U.S. Geological Survey Water-Resources Investigations Open-FileReport 82-566, 43 p.
Watkins, R.A., Jr., and Jordan, D.G., 1961, Ground-water resources ofwest-central Indiana-preliminary report, Greene County: IndianaDepartment of Natural Resources, Division of Water Bulletin 11, 225 p.
_____1962a, Ground-water resources of west-central Indiana-preliminaryreport, Sullivan County: Indiana Department of Natural Resources,Division of Water Bulletin 14, 345 p.
_____1962b, Ground-water resources of west-central Indiana-preliminaryreport, Clay County: Indiana Department of Natural Resources,Division of Water Bulletin 16, 309 p.
_____1963a, Ground-water resources of west-central Indiana-preliminaryreport, Vigo County: Indiana Department of Natural Resources,Division of Water Bulletin 17, 358 p.
_____1963b, Ground-water resources of west-central Indiana-preliminaryreport, Owen County: Indiana Department of Natural Resources,Division of Water Bulletin 18, 99 p.
_____1964a, Ground-water resources of west-central Indiana-preliminaryreport, Putnam County: Indiana Department of Natural Resources,Division of Water Bulletin 21, 83 p.
_____1964b, Ground-water resources of west-central Indiana-preliminaryreport, Parke County: Indiana Department of Natural Resources,Division of Water Bulletin 23, 125 p.
_____1965, Ground-water resources of west-central Indiana-preliminaryreport, Montgomery County: Indiana Department of NaturalResources, Division of Water Bulletin 27, 107 p.
Wayne, W.J., 1956, Thickness of drift and bedrock physiography of Indiananorth of the Wisconsin glacial boundary: Indiana Department ofConservation, Geological Survey, Report of Progress 7
_____1958, Glacial geology of Indiana: Indiana Department ofConservation, Geological Survey, Atlas of mineral resources ofIndiana, Map 10
_____1963, Pleistocene formations in Indiana: Indiana Department ofConservation, Geological Survey, Bulletin 25, 85 p.
_____1965, The Crawfordsville and Knightstown Moraines in Indiana:Indiana Department of Conservation, Geological Survey Report ofProgress 28, 15 p.
_____1968, The Erie Lobe margin in east-central Indiana during theWisconsin glaciations: Proceedings of the Indiana Academy ofScience, v. 77, p. 279-291
_____1975, Urban geology of Madison County, Indiana: IndianaGeological Survey Special Report 10, 24 p
Wayne, W.J., Johnson, G.H., and Keller, S.J., 1966, Geologic map of the 1°x 2° Danville Quadrangle, Indiana and Illinois, showing bedrock andunconsolidated deposits: Indiana Geological Survey RegionalGeologic Map 2
Wier, C.E., Glore, C.R., and Agnew, A.F., 1973, Sandstone aquifers in east-ern Sullivan County, Indiana: in Proceedings of the Indiana Academyof Science, 1973, v. 82, p. 297-302
Wright, H.E., Jr., and Frey, D.G., eds., 1965, The Quaternary of the UnitedStates: Princeton, N.J., Princeton University Press, 922 p.
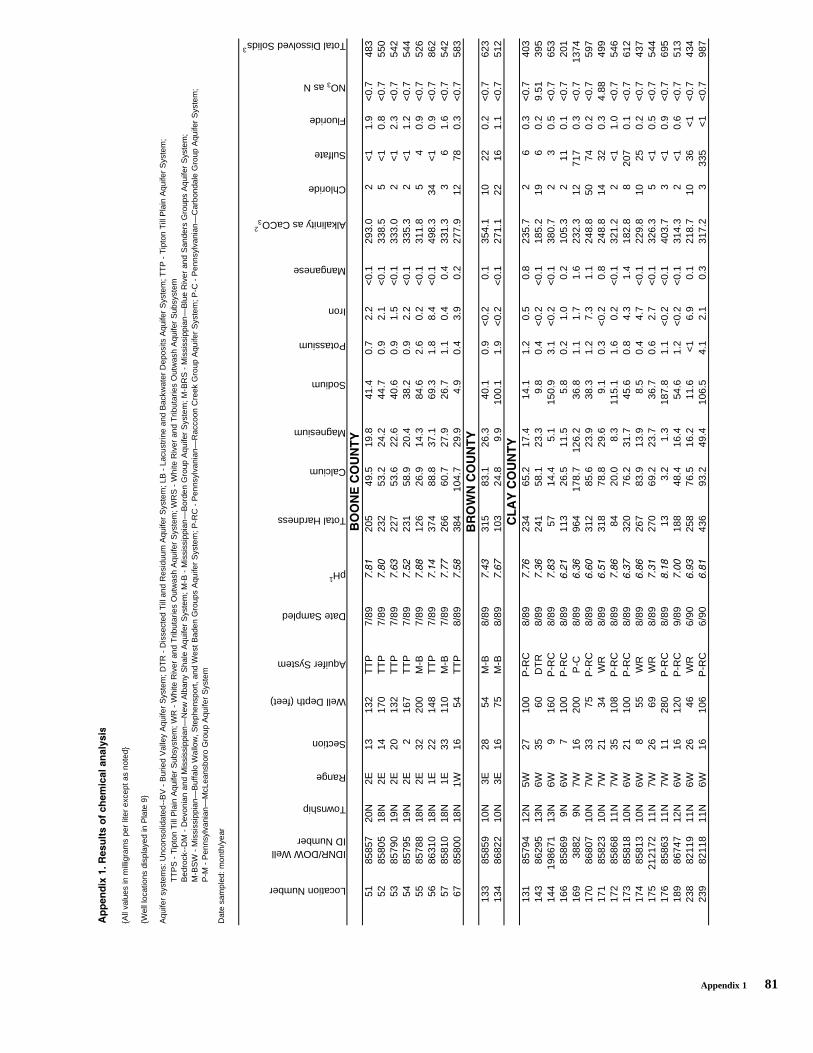
Appendix 1 81
���������3-���"���"�����#���� �� � �!"�"
{All
valu
es in
mill
igra
ms
per
liter
exc
ept a
s no
ted}
{Wel
l loc
atio
ns d
ispl
ayed
in P
late
9}
Aqu
ifer
syst
ems:
Unc
onso
lidat
ed--
BV
- B
urie
d V
alle
y A
quife
r S
yste
m; D
TR
- D
isse
cted
Till
and
Res
iduu
m A
quife
r S
yste
m; L
B -
Lac
ustr
ine
and
Bac
kwat
er D
epos
its A
quife
r S
yste
m; T
TP
- T
ipto
n T
ill P
lain
Aqu
ifer
Sys
tem
; T
TP
S -
Tip
ton
Till
Pla
in A
quife
r S
ubsy
stem
; WR
- W
hite
Riv
er a
nd T
ribut
arie
s O
utw
ash
Aqu
ifer
Sys
tem
; WR
S -
Whi
te R
iver
and
Trib
utar
ies
Out
was
h A
quife
r S
ubsy
stem
Bed
rock
--D
M -
Dev
onia
n an
d M
issi
ssip
pian
—N
ew A
lban
y S
hale
Aqu
ifer
Sys
tem
; M-B
- M
issi
ssip
pian
—B
orde
n G
roup
Aqu
ifer
Sys
tem
; M-B
RS
- M
issi
ssip
pian
—B
lue
Riv
er a
nd S
ande
rs G
roup
s A
quife
r S
yste
m;
M-B
SW
- M
issi
ssip
pian
—B
uffa
lo W
allo
w, S
teph
ensp
ort,
and
Wes
t Bad
en G
roup
s A
quife
r S
yste
m; P
-RC
- P
enns
ylva
nian
—R
acco
on C
reek
Gro
up A
quife
r S
yste
m; P
-C -
Pen
nsyl
vani
an—
Car
bond
ale
Gro
up A
quife
r S
yste
m;
P-M
- P
enns
ylva
nian
—M
cLea
nsbo
ro G
roup
Aqu
ifer
Sys
tem
Dat
e sa
mpl
ed: m
onth
/yea
r
Location Number
IDNR/DOW WellID Number
Township
Range
Section
Well Depth (feet)
Aquifer System
Date Sampled
pH1
Total Hardness
Calcium
Magnesium
Sodium
Potassium
Iron
Manganese
Alkalinity as CaCO32
Chloride
Sulfate
Fluoride
NO3 as N
Total Dissolved Solids3
5185
857
20N
2E13
132
TT
P7/
89����
205
49.5
19.8
41.4
0.7
2.2
<0.
129
3.0
2<
11.
9<
0.7
483
5285
805
18N
2E14
170
TT
P7/
89����
232
53.2
24.2
44.7
0.9
2.1
<0.
133
8.5
5<
10.
8<
0.7
550
5385
790
19N
2E20
132
TT
P7/
89����
227
53.6
22.6
40.6
0.9
1.5
<0.
133
3.0
2<
12.
3<
0.7
542
5485
795
19N
2E2
167
TT
P7/
89���
231
58.9
20.4
38.2
0.9
2.2
<0.
133
5.3
2<
11.
2<
0.7
544
5585
788
18N
2E32
200
M-B
7/89
����
126
26.9
14.3
84.6
2.6
0.2
<0.
131
1.8
54
0.9
<0.
752
656
8631
018
N1E
2214
8T
TP
7/89
���
374
88.8
37.1
69.3
1.8
8.4
<0.
149
8.3
34<
10.
9<
0.7
862
5785
810
18N
1E33
110
M-B
7/89
����
266
60.7
27.9
26.7
1.1
0.4
0.4
331.
33
61.
6<
0.7
542
6785
800
18N
1W16
54T
TP
8/89
����
384
104.
729
.94.
90.
43.
90.
227
7.9
1278
0.3
<0.
758
3
133
8585
910
N3E
2854
M-B
8/89
���
315
83.1
26.3
40.1
0.9
<0.
20.
135
4.1
1022
0.2
<0.
762
313
486
822
10N
3E16
75M
-B8/
89����
103
24.8
9.9
100.
11.
9<
0.2
<0.
127
1.1
2216
1.1
<0.
751
2
131
8579
412
N5W
2710
0P
-RC
8/89
����
234
65.2
17.4
14.1
1.2
0.5
0.8
235.
72
60.
3<
0.7
403
143
8629
513
N6W
3560
DT
R8/
89����
241
58.1
23.3
9.8
0.4
<0.
2<
0.1
185.
219
60.
29.
5139
514
419
8671
13N
6W9
160
P-R
C8/
89����
5714
.45.
115
0.9
3.1
<0.
2<
0.1
380.
72
30.
5<
0.7
653
166
8586
99N
6W7
100
P-R
C8/
89���
113
26.5
11.5
5.8
0.2
1.0
0.2
105.
32
110.
1<
0.7
201
169
3882
9N7W
1620
0P
-C8/
89����
964
178.
712
6.2
36.8
1.1
1.7
1.6
232.
312
717
0.3
<0.
713
7417
086
807
10N
7W33
75P
-RC
8/89
����
312
85.6
23.9
38.3
1.2
7.3
1.1
248.
850
740.
2<
0.7
597
171
8582
310
N7W
2134
WR
8/89
����
318
78.8
29.6
9.1
0.3
<0.
20.
824
8.8
1432
0.3
4.88
499
172
8586
811
N7W
3510
8P
-RC
8/89
����
8420
.08.
311
5.1
1.6
0.2
<0.
132
1.2
2<
11.
0<
0.7
546
173
8581
810
N6W
2110
0P
-RC
8/89
����
320
76.2
31.7
45.6
0.8
4.3
1.4
182.
88
207
0.1
<0.
761
217
485
813
10N
6W8
55W
R8/
89����
267
83.9
13.9
8.5
0.4
4.7
<0.
122
9.8
1025
0.2
<0.
743
717
521
2172
11N
7W26
69W
R8/
89����
270
69.2
23.7
36.7
0.6
2.7
<0.
132
6.3
5<
10.
5<
0.7
544
176
8586
311
N7W
1128
0P
-RC
8/89
����
133.
21.
318
7.8
1.1
<0.
2<
0.1
403.
73
<1
0.9
<0.
769
518
986
747
12N
6W16
120
P-R
C9/
89����
188
48.4
16.4
54.6
1.2
<0.
2<
0.1
314.
32
<1
0.6
<0.
751
323
882
119
11N
6W26
46W
R6/
90����
258
76.5
16.2
11.6
<1
6.9
0.1
218.
710
36<
1<
0.7
434
239
8211
811
N6W
1610
6P
-RC
6/90
����
436
93.2
49.4
106.
54.
12.
10.
331
7.2
333
5<
1<
0.7
987
(������
(�7�����
�8�������
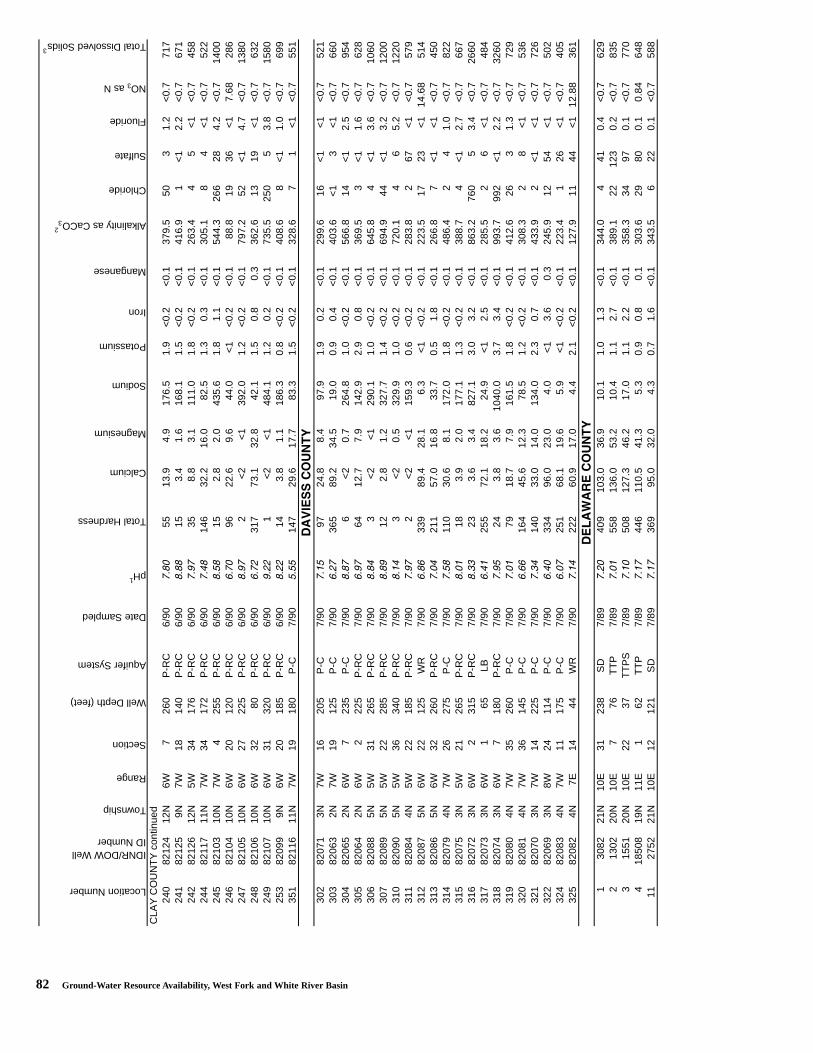
82 Ground-Water Resource Availability, West Fork and White River Basin
Location Number
IDNR/DOW WellID Number
Township
Range
Section
Well Depth (feet)
Aquifer System
Date Sampled
pH1
Total Hardness
Calcium
Magnesium
Sodium
Potassium
Iron
Manganese
Alkalinity as CaCO32
Chloride
Sulfate
Fluoride
NO3 as N
Total Dissolved Solids3
CLA
Y C
OU
NT
Y c
ontin
ued
240
8212
412
N6W
726
0P
-RC
6/90
����
5513
.94.
917
6.5
1.9
<0.
2<
0.1
379.
550
31.
2<
0.7
717
241
8212
59N
7W18
140
P-R
C6/
90����
153.
41.
616
8.1
1.5
<0.
2<
0.1
416.
91
<1
2.2
<0.
767
124
282
126
12N
5W34
176
P-R
C6/
90����
358.
83.
111
1.0
1.8
<0.
2<
0.1
263.
44
5<
1<
0.7
458
244
8211
711
N7W
3417
2P
-RC
6/90
���
146
32.2
16.0
82.5
1.3
0.3
<0.
130
5.1
84
<1
<0.
752
224
582
103
10N
7W4
255
P-R
C6/
90����
152.
82.
043
5.6
1.8
1.1
<0.
154
4.3
266
284.
2<
0.7
1400
246
8210
410
N6W
2012
0P
-RC
6/90
����
9622
.69.
644
.0<
1<
0.2
<0.
188
.819
36<
17.
6828
624
782
105
10N
6W27
225
P-R
C6/
90����
2<
2<
139
2.0
1.2
<0.
2<
0.1
797.
252
<1
4.7
<0.
713
8024
882
106
10N
6W32
80P
-RC
6/90
���
317
73.1
32.8
42.1
1.5
0.8
0.3
362.
613
19<
1<
0.7
632
249
8210
710
N6W
3132
0P
-RC
6/90
��
1<
2<
148
4.1
1.2
0.2
<0.
173
5.5
250
53.
8<
0.7
1580
253
8209
99N
6W20
185
P-R
C6/
90��
143.
81.
118
6.3
0.8
<0.
2<
0.1
408.
68
<1
1.0
<0.
769
935
182
116
11N
7W19
180
P-C
7/90
����
147
29.6
17.7
83.3
1.5
<0.
2<
0.1
328.
67
1<
1<
0.7
551
302
8207
13N
7W16
205
P-C
7/90
����
9724
.88.
497
.91.
90.
2<
0.1
299.
616
<1
<1
<0.
752
130
382
063
2N7W
1912
5P
-C7/
90���
365
89.2
34.5
19.0
0.9
0.4
<0.
140
3.6
<1
3<
1<
0.7
660
304
8206
52N
6W7
235
P-C
7/90
����
6<
20.
726
4.8
1.0
<0.
2<
0.1
566.
814
<1
2.5
<0.
795
430
582
064
2N6W
222
5P
-RC
7/90
����
6412
.77.
914
2.9
2.9
0.8
<0.
136
9.5
3<
11.
6<
0.7
628
306
8208
85N
5W31
265
P-R
C7/
90���
3<
2<
129
0.1
1.0
<0.
2<
0.1
645.
84
<1
3.6
<0.
710
6030
782
089
5N5W
2228
5P
-RC
7/90
����
122.
81.
232
7.7
1.4
<0.
2<
0.1
694.
944
<1
3.2
<0.
712
0031
082
090
5N5W
3634
0P
-RC
7/90
���
3<
20.
532
9.9
1.0
<0.
2<
0.1
720.
14
65.
2<
0.7
1220
311
8208
44N
5W22
185
P-R
C7/
90����
2<
2<
115
9.3
0.6
<0.
2<
0.1
283.
82
67<
1<
0.7
579
312
8208
75N
6W22
125
WR
7/90
����
339
89.4
28.1
6.3
<1
<0.
2<
0.1
223.
517
23<
114
.68
514
313
8208
65N
6W32
260
P-R
C7/
90���
211
57.0
16.8
33.7
0.5
1.8
<0.
126
6.8
7<
1<
1<
0.7
450
314
8207
94N
7W26
275
P-C
7/90
����
110
30.6
8.1
172.
01.
8<
0.2
<0.
148
6.4
24
1.0
<0.
782
231
582
075
3N5W
2126
5P
-RC
7/90
����
183.
92.
017
7.1
1.3
<0.
2<
0.1
388.
74
<1
2.7
<0.
766
731
682
072
3N6W
231
5P
-RC
7/90
����
233.
63.
482
7.1
3.0
3.2
<0.
186
3.2
760
53.
4<
0.7
2660
317
8207
33N
6W1
65LB
7/90
���
255
72.1
18.2
24.9
<1
2.5
<0.
128
5.5
26
<1
<0.
748
431
882
074
3N6W
718
0P
-RC
7/90
����
243.
83.
610
40.0
3.7
3.4
<0.
199
3.7
992
<1
2.2
<0.
732
6031
982
080
4N7W
3526
0P
-C7/
90����
7918
.77.
916
1.5
1.8
<0.
2<
0.1
412.
626
31.
3<
0.7
729
320
8208
14N
7W36
145
P-C
7/90
����
164
45.6
12.3
78.5
1.2
<0.
2<
0.1
308.
32
8<
1<
0.7
536
321
8207
03N
7W14
225
P-C
7/90
���
140
33.0
14.0
134.
02.
30.
7<
0.1
433.
92
<1
<1
<0.
772
632
282
069
3N8W
2411
4P
-C7/
90���
334
96.0
23.0
4.0
<1
3.6
0.3
245.
912
54<
1<
0.7
502
324
8208
34N
7W11
175
P-C
7/90
����
251
68.1
19.6
5.9
<1
<0.
2<
0.1
223.
41
26<
1<
0.7
405
325
8208
24N
7E14
44W
R7/
90���
222
60.9
17.0
4.4
2.1
<0.
2<
0.1
127.
911
44<
112
.88
361
130
8221
N10
E31
238
SD
7/89
���
409
103.
036
.910
.11.
01.
3<
0.1
344.
04
410.
4<
0.7
629
213
0220
N10
E7
76T
TP
7/89
����
558
136.
053
.210
.41.
12.
7<
0.1
389.
122
123
0.2
<0.
783
53
1551
20N
10E
2237
TT
PS
7/89
����
508
127.
346
.217
.01.
12.
2<
0.1
358.
334
970.
1<
0.7
770
418
508
19N
11E
162
TT
P7/
89����
446
110.
541
.35.
30.
90.
80.
130
3.6
2980
0.1
0.84
648
1127
5221
N10
E12
121
SD
7/89
����
369
95.0
32.0
4.3
0.7
1.6
<0.
134
3.5
622
0.1
<0.
758
8
������������
��8�7��������
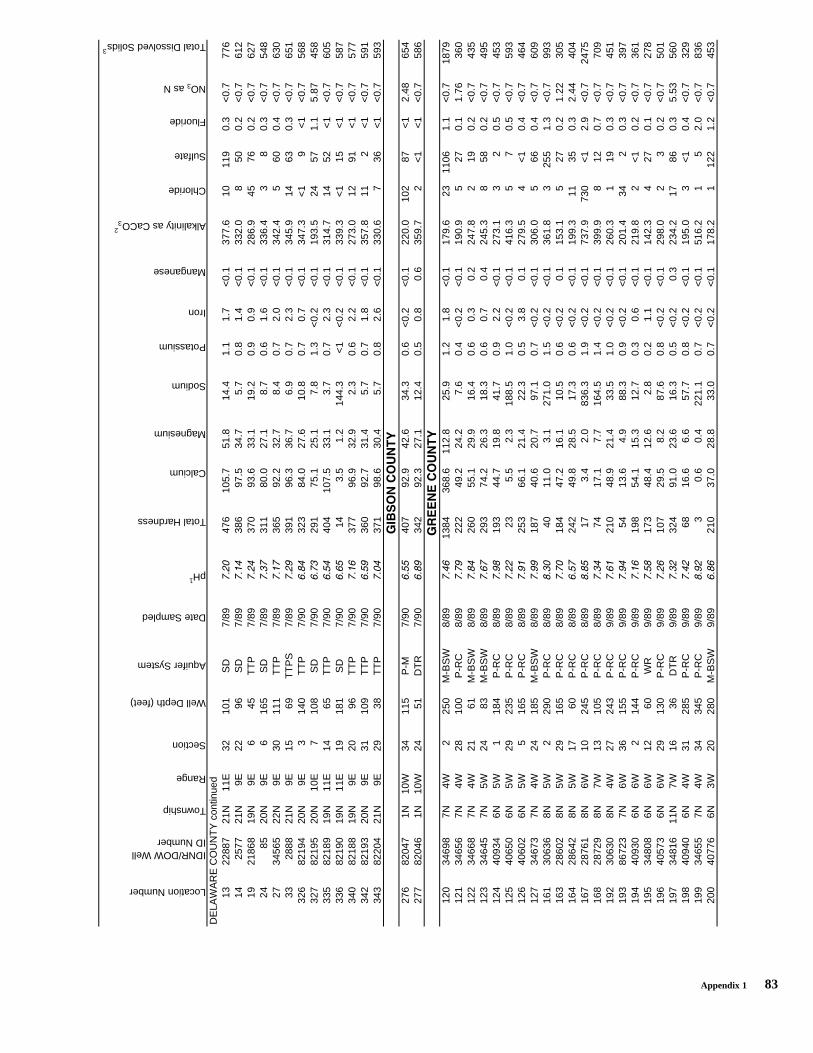
Appendix 1 83
Location Number
IDNR/DOW WellID Number
Township
Range
Section
Well Depth (feet)
Aquifer System
Date Sampled
pH1
Total Hardness
Calcium
Magnesium
Sodium
Potassium
Iron
Manganese
Alkalinity as CaCO32
Chloride
Sulfate
Fluoride
NO3 as N
Total Dissolved Solids3
DE
LAW
AR
E C
OU
NT
Y c
ontin
ued
1322
887
21N
11E
3210
1S
D7/
89���
476
105.
751
.814
.41.
11.
7<
0.1
377.
610
119
0.3
<0.
777
614
2577
21N
9E22
96S
D7/
89���
386
97.5
34.7
5.7
0.8
1.4
<0.
133
2.0
850
0.2
<0.
761
219
2186
819
N9E
645
TT
P7/
89��
370
93.6
33.1
19.2
0.9
0.9
<0.
128
6.9
4576
0.2
<0.
762
724
8520
N9E
616
5S
D7/
89����
311
80.0
27.1
8.7
0.6
1.6
<0.
133
6.4
38
0.3
<0.
754
827
3456
522
N9E
3011
1T
TP
7/89
����
365
92.2
32.7
8.4
0.7
2.0
<0.
134
2.4
560
0.4
<0.
763
033
2888
21N
9E15
69T
TP
S7/
89���
391
96.3
36.7
6.9
0.7
2.3
<0.
134
5.9
1463
0.3
<0.
765
132
682
194
20N
9E3
140
TT
P7/
90���
323
84.0
27.6
10.8
0.7
0.7
<0.
134
7.3
<1
9<
1<
0.7
568
327
8219
520
N10
E7
108
SD
7/90
����
291
75.1
25.1
7.8
1.3
<0.
2<
0.1
193.
524
571.
15.
8745
833
582
189
19N
11E
1465
TT
P7/
90���
404
107.
533
.13.
70.
72.
3<
0.1
314.
714
52<
1<
0.7
605
336
8219
019
N11
E19
181
SD
7/90
����
143.
51.
214
4.3
<1
<0.
2<
0.1
339.
3<
115
<1
<0.
758
734
082
188
19N
9E20
96T
TP
7/90
����
377
96.9
32.9
2.3
0.6
2.2
<0.
127
3.0
1291
<1
<0.
757
734
282
193
20N
9E31
109
TT
P7/
90����
360
92.7
31.4
5.7
0.7
1.8
<0.
135
7.8
112
<1
<0.
759
134
382
204
21N
9E29
38T
TP
7/90
���
371
98.6
30.4
5.7
0.8
2.6
<0.
133
0.6
736
<1
<0.
759
3
276
8204
71N
10W
3411
5P
-M7/
90����
407
92.9
42.6
34.3
0.6
<0.
2<
0.1
220.
010
287
<1
2.48
654
277
8204
61N
10W
2451
DT
R7/
90����
342
92.3
27.1
12.4
0.5
0.8
0.6
359.
72
<1
<1
<0.
758
6
120
3469
87N
4W2
250
M-B
SW
8/89
���
1384
368.
611
2.8
25.9
1.2
1.8
<0.
117
9.6
2311
061.
1<
0.7
1879
121
3465
67N
4W28
100
P-R
C8/
89����
222
49.2
24.2
7.6
0.4
<0.
2<
0.1
190.
95
270.
11.
7636
012
234
668
7N4W
2161
M-B
SW
8/89
���
260
55.1
29.9
16.4
0.6
0.3
0.2
247.
82
190.
2<
0.7
435
123
3464
57N
5W24
83M
-BS
W8/
89����
293
74.2
26.3
18.3
0.6
0.7
0.4
245.
38
580.
2<
0.7
495
124
4093
46N
5W1
184
P-R
C8/
89����
193
44.7
19.8
41.7
0.9
2.2
<0.
127
3.1
32
0.5
<0.
745
312
540
650
6N5W
2923
5P
-RC
8/89
��
235.
52.
318
8.5
1.0
<0.
2<
0.1
416.
35
70.
5<
0.7
593
126
4060
26N
5W5
165
P-R
C8/
89����
253
66.1
21.4
22.3
0.5
3.8
0.1
279.
54
<1
0.4
<0.
746
412
734
673
7N4W
2418
5M
-BS
W8/
89����
187
40.6
20.7
97.1
0.7
<0.
2<
0.1
306.
05
660.
4<
0.7
609
161
3063
68N
5W2
290
P-R
C8/
89����
4011
.03.
127
1.0
1.5
<0.
2<
0.1
361.
83
255
1.3
<0.
799
316
328
602
8N5W
2916
5P
-RC
8/89
����
184
47.2
16.1
10.5
0.6
<0.
20.
115
3.1
527
0.2
1.22
305
164
2864
28N
5W17
60P
-RC
8/89
����
242
49.8
28.5
17.3
0.6
<0.
2<
0.1
199.
311
350.
32.
4440
416
728
761
8N6W
1024
5P
-RC
8/89
����
173.
42.
083
6.3
1.9
<0.
2<
0.1
737.
973
0<
12.
9<
0.7
2475
168
2872
98N
7W13
105
P-R
C8/
89���
7417
.17.
716
4.5
1.4
<0.
2<
0.1
399.
98
120.
7<
0.7
709
192
3063
08N
4W27
243
P-R
C9/
89����
210
48.9
21.4
33.5
1.0
<0.
2<
0.1
260.
31
190.
3<
0.7
451
193
8672
37N
6W36
155
P-R
C9/
89���
5413
.64.
988
.30.
9<
0.2
<0.
120
1.4
342
0.3
<0.
739
719
440
930
6N6W
214
4P
-RC
9/89
����
198
54.1
15.3
12.7
0.3
0.6
<0.
121
9.8
2<
10.
2<
0.7
361
195
3480
86N
6W12
60W
R9/
89����
173
48.4
12.6
2.8
0.2
1.1
<0.
114
2.3
427
0.1
<0.
727
819
640
573
6N6W
2913
0P
-RC
9/89
���
107
29.5
8.2
87.6
0.8
<0.
2<
0.1
298.
02
30.
2<
0.7
501
197
3481
611
N7W
1636
DT
R9/
89���
324
91.0
23.6
16.3
0.5
<0.
20.
323
4.2
1786
0.3
5.53
560
198
4094
06N
4W31
285
P-R
C9/
89��
6816
.66.
657
.70.
8<
0.2
<0.
119
5.0
3<
10.
4<
0.7
329
199
3465
57N
4W34
345
P-R
C9/
89���
30.
60.
422
1.1
0.7
<0.
2<
0.1
516.
21
52.
0<
0.7
836
200
4077
66N
3W20
280
M-B
SW
9/89
����
210
37.0
28.8
33.0
0.7
<0.
2<
0.1
178.
21
122
1.2
<0.
745
3
9�(������
9���������
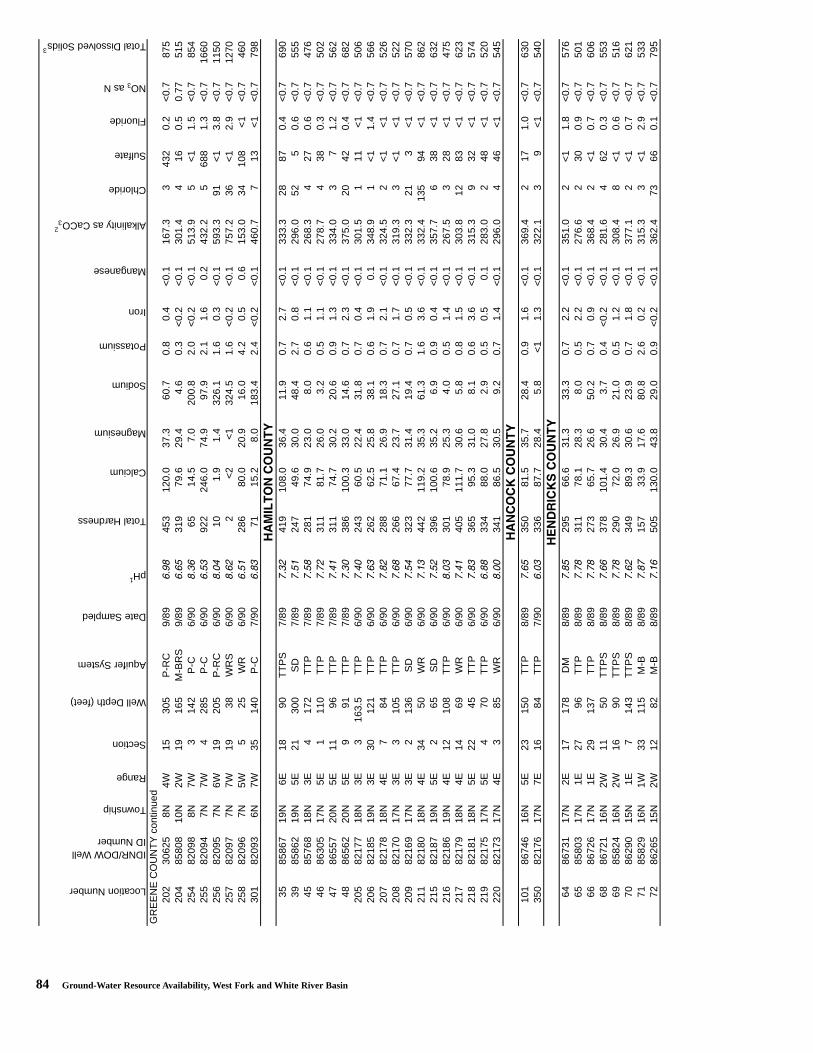
84 Ground-Water Resource Availability, West Fork and White River Basin
Location Number
IDNR/DOW WellID Number
Township
Range
Section
Well Depth (feet)
Aquifer System
Date Sampled
pH1
Total Hardness
Calcium
Magnesium
Sodium
Potassium
Iron
Manganese
Alkalinity as CaCO32
Chloride
Sulfate
Fluoride
NO3 as N
Total Dissolved Solids3
GR
EE
NE
CO
UN
TY
con
tinue
d20
230
625
8N4W
1530
5P
-RC
9/89
����
453
120.
037
.360
.70.
80.
4<
0.1
167.
33
432
0.2
<0.
787
520
485
808
10N
2W19
165
M-B
RS
9/89
����
319
79.6
29.4
4.6
0.3
<0.
2<
0.1
301.
44
160.
50.
7751
525
482
098
8N7W
314
2P
-C6/
90����
6514
.57.
020
0.8
2.0
<0.
2<
0.1
513.
95
<1
1.5
<0.
785
425
582
094
7N7W
428
5P
-C6/
90����
922
246.
074
.997
.92.
11.
60.
243
2.2
568
81.
3<
0.7
1660
256
8209
57N
6W19
205
P-R
C6/
90���
101.
91.
432
6.1
1.6
0.3
<0.
159
3.3
91<
13.
8<
0.7
1150
257
8209
77N
7W19
38W
RS
6/90
���
2<
2<
132
4.5
1.6
<0.
2<
0.1
757.
236
<1
2.9
<0.
712
7025
882
096
7N5W
525
WR
6/90
����
286
80.0
20.9
16.0
4.2
0.5
0.6
153.
034
108
<1
<0.
746
030
182
093
6N7W
3514
0P
-C7/
90����
7115
.28.
018
3.4
2.4
<0.
2<
0.1
460.
77
13<
1<
0.7
798
3585
867
19N
6E18
90T
TP
S7/
89���
419
108.
036
.411
.90.
72.
7<
0.1
333.
328
870.
4<
0.7
690
3985
862
19N
5E21
300
SD
7/89
����
247
49.6
30.0
48.4
2.7
0.8
<0.
129
6.0
525
0.6
<0.
755
545
8576
818
N3E
417
2T
TP
7/89
����
281
74.9
23.0
8.0
0.6
1.1
<0.
126
8.3
427
0.6
<0.
747
646
8630
517
N5E
111
0T
TP
7/89
���
311
81.7
26.0
3.2
0.5
1.1
<0.
127
8.7
438
0.3
<0.
750
247
8655
720
N5E
1196
TT
P7/
89���
311
74.7
30.2
20.6
0.9
1.3
<0.
133
4.0
37
1.2
<0.
756
248
8656
220
N5E
991
TT
P7/
89����
386
100.
333
.014
.60.
72.
3<
0.1
375.
020
420.
4<
0.7
682
205
8217
718
N3E
316
3.5
TT
P6/
90���
243
60.5
22.4
31.8
0.7
0.4
<0.
130
1.5
111
<1
<0.
750
620
682
185
19N
3E30
121
TT
P6/
90����
262
62.5
25.8
38.1
0.6
1.9
0.1
348.
91
<1
1.4
<0.
756
620
782
178
18N
4E7
84T
TP
6/90
���
288
71.1
26.9
18.3
0.7
2.1
<0.
132
4.5
2<
1<
1<
0.7
526
208
8217
017
N3E
310
5T
TP
6/90
����
266
67.4
23.7
27.1
0.7
1.7
<0.
131
9.3
3<
1<
1<
0.7
522
209
8216
917
N3E
213
6S
D6/
90���
323
77.7
31.4
19.4
0.7
0.5
<0.
133
2.3
213
<1
<0.
757
021
182
180
18N
4E34
50W
R6/
90����
442
119.
235
.361
.31.
63.
6<
0.1
332.
413
594
<1
<0.
786
221
582
187
19N
5E2
65S
D6/
90���
396
100.
635
.26.
90.
90.
4<
0.1
357.
76
38<
1<
0.7
632
216
8218
619
N4E
1210
8T
TP
6/90
����
301
78.9
25.3
4.0
0.5
1.4
<0.
126
7.5
328
<1
<0.
747
521
782
179
18N
4E14
69W
R6/
90���
405
111.
730
.65.
80.
81.
5<
0.1
303.
812
83<
1<
0.7
623
218
8218
118
N5E
2245
TT
P6/
90����
365
95.3
31.0
8.1
0.6
3.6
<0.
131
5.3
932
<1
<0.
757
421
982
175
17N
5E4
70T
TP
6/90
����
334
88.0
27.8
2.9
0.5
0.5
0.1
283.
02
48<
1<
0.7
520
220
8217
317
N4E
385
WR
6/90
����
341
86.5
30.5
9.2
0.7
1.4
<0.
129
6.0
446
<1
<0.
754
5
101
8674
616
N5E
2315
0T
TP
8/89
����
350
81.5
35.7
28.4
0.9
1.6
<0.
136
9.4
217
1.0
<0.
763
035
082
176
17N
7E16
84T
TP
7/90
����
336
87.7
28.4
5.8
<1
1.3
<0.
132
2.1
39
<1
<0.
754
0
6486
731
17N
2E17
178
DM
8/89
����
295
66.6
31.3
33.3
0.7
2.2
<0.
135
1.0
2<
11.
8<
0.7
576
6585
803
17N
1E27
96T
TP
8/89
����
311
78.1
28.3
8.0
0.5
2.2
<0.
127
6.6
230
0.9
<0.
750
166
8672
617
N1E
2913
7T
TP
8/89
����
273
65.7
26.6
50.2
0.7
0.9
<0.
136
8.4
2<
10.
7<
0.7
606
6886
721
16N
2W11
50T
TP
S8/
89����
378
101.
430
.43.
70.
4<
0.2
<0.
128
1.6
462
0.3
<0.
755
369
8582
416
N2W
1690
TT
PS
8/89
����
290
72.0
26.9
21.0
0.5
1.2
<0.
130
8.4
8<
10.
6<
0.7
516
7086
290
15N
1E7
143
TT
PS
8/89
���
349
89.3
30.6
23.9
0.7
1.8
<0.
137
7.1
2<
10.
7<
0.7
621
7185
829
16N
1W33
115
M-B
8/89
����
157
33.9
17.6
80.8
2.6
0.2
<0.
131
5.3
3<
12.
9<
0.7
533
7286
265
15N
2W12
82M
-B8/
89����
505
130.
043
.829
.00.
9<
0.2
<0.
136
2.4
7366
0.1
<0.
779
5
�:�8������
���;�����
�����;������
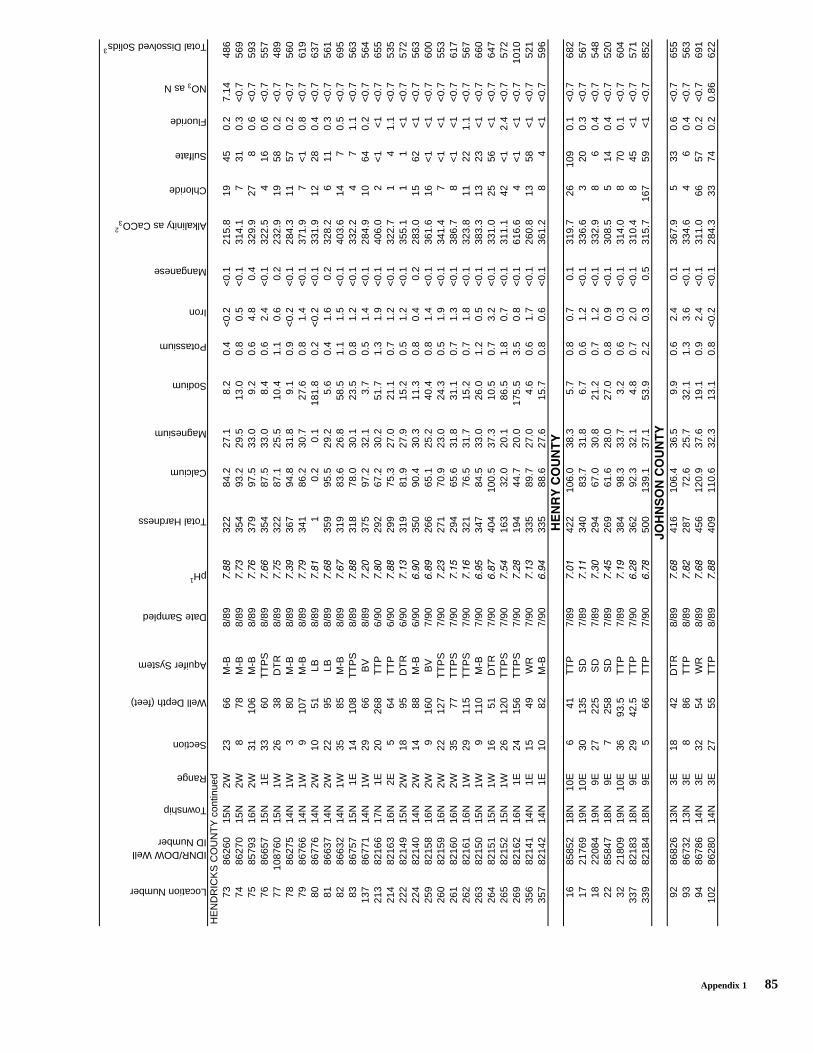
Appendix 1 85
Location Number
IDNR/DOW WellID Number
Township
Range
Section
Well Depth (feet)
Aquifer System
Date Sampled
pH1
Total Hardness
Calcium
Magnesium
Sodium
Potassium
Iron
Manganese
Alkalinity as CaCO32
Chloride
Sulfate
Fluoride
NO3 as N
Total Dissolved Solids3
HE
ND
RIC
KS
CO
UN
TY
con
tinue
d73
8626
015
N2W
2366
M-B
8/89
����
322
84.2
27.1
8.2
0.4
<0.
2<
0.1
215.
819
450.
27.
1448
674
8627
015
N2W
878
M-B
8/89
����
354
93.2
29.5
13.0
0.8
0.5
<0.
131
4.1
731
0.3
<0.
756
975
8579
316
N2W
3110
6M
-B8/
89����
379
97.5
33.0
9.2
0.6
4.8
0.4
329.
927
80.
6<
0.7
593
7686
657
15N
1E33
60T
TP
S8/
89����
354
87.5
33.0
8.4
0.6
2.4
<0.
132
2.5
416
0.6
<0.
755
777
1087
6015
N1W
2638
DT
R8/
89����
322
87.1
25.5
10.4
1.1
0.6
0.2
232.
919
580.
2<
0.7
489
7886
275
14N
1W3
80M
-B8/
89����
367
94.8
31.8
9.1
0.9
<0.
2<
0.1
284.
311
570.
2<
0.7
560
7986
766
14N
1W9
107
M-B
8/89
����
341
86.2
30.7
27.6
0.8
1.4
<0.
137
1.9
7<
10.
8<
0.7
619
8086
776
14N
2W10
51LB
8/89
����
10.
20.
118
1.8
0.2
<0.
2<
0.1
331.
912
280.
4<
0.7
637
8186
637
14N
2W22
95LB
8/89
����
359
95.5
29.2
5.6
0.4
1.6
0.2
328.
26
110.
3<
0.7
561
8286
632
14N
1W35
85M
-B8/
89����
319
83.6
26.8
58.5
1.1
1.5
<0.
140
3.6
147
0.5
<0.
769
583
8675
715
N1E
1410
8T
TP
S8/
89����
318
78.0
30.1
23.5
0.8
1.2
<0.
133
2.2
47
1.1
<0.
756
313
786
771
14N
1W29
66B
V8/
89���
375
97.2
32.1
3.7
0.5
1.4
<0.
128
4.9
1064
0.2
<0.
756
421
382
166
17N
1E20
268
TT
P6/
90����
292
67.2
30.2
51.7
1.3
1.9
<0.
140
6.0
2<
1<
1<
0.7
655
214
8216
316
N2E
564
TT
P6/
90����
299
75.3
27.0
21.1
0.7
1.2
<0.
132
2.7
14
1.1
<0.
753
522
282
149
15N
2W18
95D
TR
6/90
����
319
81.9
27.9
15.2
0.5
1.2
<0.
135
5.1
11
<1
<0.
757
222
482
140
14N
2W14
88M
-B6/
90����
350
90.4
30.3
11.3
0.8
0.4
0.2
283.
015
62<
1<
0.7
563
259
8215
816
N2W
916
0B
V7/
90����
266
65.1
25.2
40.4
0.8
1.4
<0.
136
1.6
16<
1<
1<
0.7
600
260
8215
916
N2W
2212
7T
TP
S7/
90���
271
70.9
23.0
24.3
0.5
1.9
<0.
134
1.4
7<
1<
1<
0.7
553
261
8216
016
N2W
3577
TT
PS
7/90
����
294
65.6
31.8
31.1
0.7
1.3
<0.
138
6.7
8<
1<
1<
0.7
617
262
8216
116
N1W
2911
5T
TP
S7/
90����
321
76.5
31.7
15.2
0.7
1.8
<0.
132
3.8
1122
1.1
<0.
756
726
382
150
15N
1W9
110
M-B
7/90
����
347
84.5
33.0
26.0
1.2
0.5
<0.
138
3.3
1323
<1
<0.
766
026
482
151
15N
1W16
51D
TR
7/90
����
404
100.
537
.310
.50.
73.
2<
0.1
331.
025
56<
1<
0.7
647
265
8215
215
N1W
2612
0T
TP
S7/
90���
163
32.0
20.1
86.5
1.8
0.7
<0.
131
1.1
42<
12.
4<
0.7
572
269
8216
216
N1E
2415
6T
TP
S7/
90���
194
44.7
20.0
175.
53.
50.
8<
0.1
616.
64
<1
<1
<0.
710
1035
682
141
14N
1E15
49W
R7/
90����
335
89.7
27.0
4.6
0.6
1.7
<0.
126
0.8
1358
<1
<0.
752
135
782
142
14N
1E10
82M
-B7/
90���
335
88.6
27.6
15.7
0.8
0.6
<0.
136
1.2
84
<1
<0.
759
6
1685
852
18N
10E
641
TT
P7/
89����
422
106.
038
.35.
70.
80.
70.
131
9.7
2610
90.
1<
0.7
682
1721
769
19N
10E
3013
5S
D7/
89����
340
83.7
31.8
6.7
0.6
1.2
<0.
133
6.6
320
0.3
<0.
756
718
2208
419
N9E
2722
5S
D7/
89����
294
67.0
30.8
21.2
0.7
1.2
<0.
133
2.9
86
0.4
<0.
754
822
8584
718
N9E
725
8S
D7/
89���
269
61.6
28.0
27.0
0.8
0.9
<0.
130
8.5
514
0.4
<0.
752
032
2180
919
N10
E36
93.5
TT
P7/
89����
384
98.3
33.7
3.2
0.6
0.3
<0.
131
4.0
870
0.1
<0.
760
433
782
183
18N
9E29
42.5
TT
P7/
90���
362
92.3
32.1
4.8
0.7
2.0
<0.
131
0.4
845
<1
<0.
757
133
982
184
18N
9E5
66T
TP
7/90
����
500
139.
137
.153
.92.
20.
30.
531
5.7
167
59<
1<
0.7
852
9286
826
13N
3E18
42D
TR
8/89
����
416
106.
436
.59.
90.
62.
40.
136
7.9
533
0.6
<0.
765
593
8673
213
N3E
886
TT
P8/
89���
287
72.6
25.7
32.1
1.3
3.6
<0.
133
4.6
46
0.4
<0.
756
394
8678
614
N3E
3254
WR
8/89
����
456
120.
937
.619
.10.
92.
4<
0.1
311.
066
570.
2<
0.7
691
102
8628
014
N3E
2755
TT
P8/
89����
409
110.
632
.313
.10.
8<
0.2
<0.
128
4.3
3374
0.2
0.86
622
��������
< ������
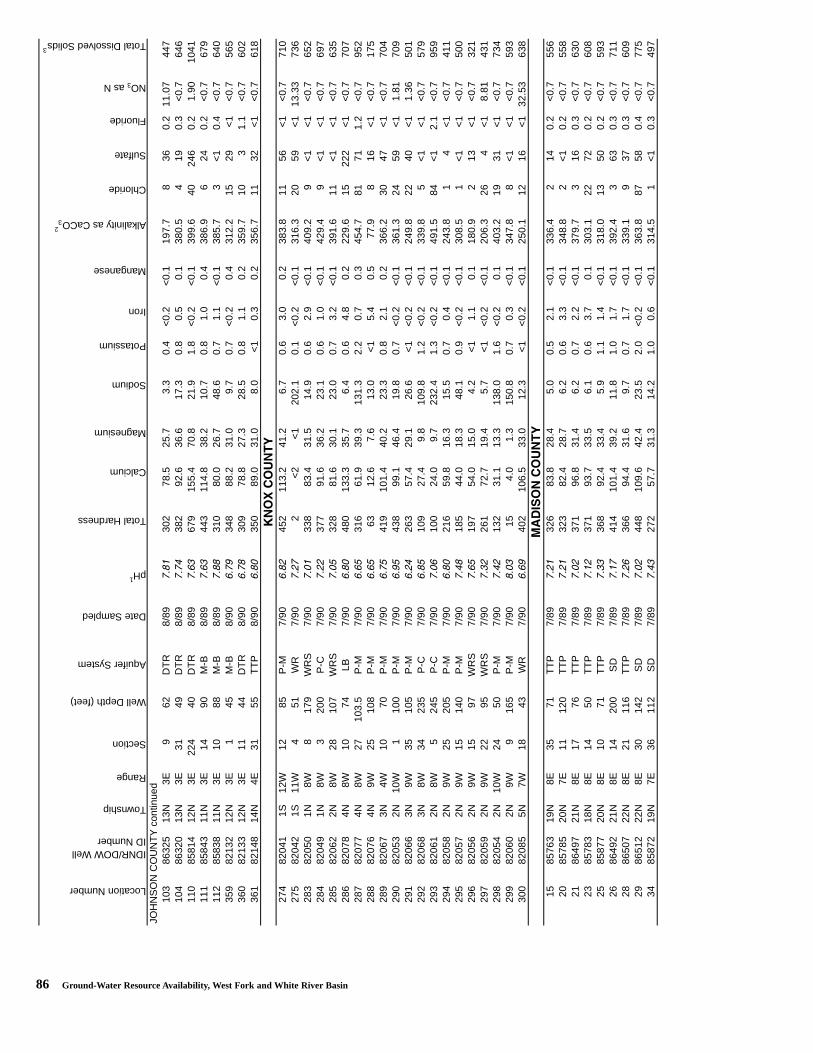
86 Ground-Water Resource Availability, West Fork and White River Basin
Location Number
IDNR/DOW WellID Number
Township
Range
Section
Well Depth (feet)
Aquifer System
Date Sampled
pH1
Total Hardness
Calcium
Magnesium
Sodium
Potassium
Iron
Manganese
Alkalinity as CaCO32
Chloride
Sulfate
Fluoride
NO3 as N
Total Dissolved Solids3
JOH
NS
ON
CO
UN
TY
con
tinue
d10
386
325
13N
3E9
62D
TR
8/89
����
302
78.5
25.7
3.3
0.4
<0.
2<
0.1
197.
78
360.
211
.07
447
104
8632
013
N3E
3149
DT
R8/
89���
382
92.6
36.6
17.3
0.8
0.5
0.1
380.
54
190.
3<
0.7
646
110
8581
412
N3E
224
40D
TR
8/89
����
679
155.
470
.821
.91.
8<
0.2
<0.
139
9.6
4024
60.
21.
9010
4111
185
843
11N
3E14
90M
-B8/
89����
443
114.
838
.210
.70.
81.
00.
438
6.9
624
0.2
<0.
767
911
285
838
11N
3E10
88M
-B8/
89����
310
80.0
26.7
48.6
0.7
1.1
<0.
138
5.7
3<
10.
4<
0.7
640
359
8213
212
N3E
145
M-B
8/90
����
348
88.2
31.0
9.7
0.7
<0.
20.
431
2.2
1529
<1
<0.
756
536
082
133
12N
3E11
44D
TR
8/90
����
309
78.8
27.3
28.5
0.8
1.1
0.2
359.
710
31.
1<
0.7
602
361
8214
814
N4E
3155
TT
P8/
90����
350
89.0
31.0
8.0
<1
0.3
0.2
356.
711
32<
1<
0.7
618
274
8204
11S
12W
1285
P-M
7/90
���
452
113.
241
.26.
70.
63.
00.
238
3.8
1156
<1
<0.
771
027
582
042
1S11
W4
51W
R7/
90���
2<
2<
120
2.1
0.1
<0.
2<
0.1
316.
320
59<
113
.33
736
283
8205
01N
8W8
179
WR
S7/
90����
338
83.4
31.5
14.9
0.6
2.9
<0.
140
9.2
9<
1<
1<
0.7
652
284
8204
91N
8W3
200
P-C
7/90
��
377
91.6
36.2
23.1
0.6
1.0
<0.
142
9.4
9<
1<
1<
0.7
697
285
8206
22N
8W28
107
WR
S7/
90����
328
81.6
30.1
23.0
0.7
3.2
<0.
139
1.6
11<
1<
1<
0.7
635
286
8207
84N
8W10
74LB
7/90
����
480
133.
335
.76.
40.
64.
80.
222
9.6
1522
2<
1<
0.7
707
287
8207
74N
8W27
103.
5P
-M7/
90����
316
61.9
39.3
131.
32.
20.
70.
345
4.7
8171
1.2
<0.
795
228
882
076
4N9W
2510
8P
-M7/
90����
6312
.67.
613
.0<
15.
40.
577
.98
16<
1<
0.7
175
289
8206
73N
4W10
70P
-M7/
90����
419
101.
440
.223
.30.
82.
10.
236
6.2
3047
<1
<0.
770
429
082
053
2N10
W1
100
P-M
7/90
����
438
99.1
46.4
19.8
0.7
<0.
2<
0.1
361.
324
59<
11.
8170
929
182
066
3N9W
3510
5P
-M7/
90��
263
57.4
29.1
26.6
<1
<0.
2<
0.1
249.
822
40<
11.
3650
129
282
068
3N8W
3423
5P
-C7/
90����
109
27.4
9.8
109.
81.
2<
0.2
<0.
133
9.8
5<
1<
1<
0.7
579
293
8206
12N
8W5
245
P-C
7/90
����
100
24.0
9.7
232.
41.
3<
0.2
<0.
149
1.5
84<
12.
1<
0.7
959
294
8205
82N
9W25
205
P-M
7/90
����
216
59.8
16.3
15.5
0.7
0.4
<0.
124
3.8
14
<1
<0.
741
129
582
057
2N9W
1514
0P
-M7/
90���
185
44.0
18.3
48.1
0.9
<0.
2<
0.1
308.
51
<1
<1
<0.
750
029
682
056
2N9W
1597
WR
S7/
90����
197
54.0
15.0
4.2
<1
1.1
0.1
180.
92
13<
1<
0.7
321
297
8205
92N
9W22
95W
RS
7/90
���
261
72.7
19.4
5.7
<1
<0.
2<
0.1
206.
326
4<
18.
8143
129
882
054
2N10
W24
50P
-M7/
90��
132
31.1
13.3
138.
01.
6<
0.2
0.1
403.
219
31<
1<
0.7
734
299
8206
02N
9W9
165
P-M
7/90
����
154.
01.
315
0.8
0.7
0.3
<0.
134
7.8
8<
1<
1<
0.7
593
300
8208
55N
7W18
43W
R7/
90����
402
106.
533
.012
.3<
1<
0.2
<0.
125
0.1
1216
<1
32.5
363
8
1585
763
19N
8E35
71T
TP
7/89
���
326
83.8
28.4
5.0
0.5
2.1
<0.
133
6.4
214
0.2
<0.
755
620
8578
520
N7E
1112
0T
TP
7/89
���
323
82.4
28.7
6.2
0.6
3.3
<0.
134
8.8
2<
10.
2<
0.7
558
2186
497
21N
8E17
76T
TP
7/89
���
371
96.8
31.4
6.2
0.7
2.2
<0.
137
9.7
316
0.3
<0.
763
023
8578
318
N8E
1450
TT
P7/
89���
371
93.7
33.5
6.1
0.6
3.7
0.1
303.
122
720.
2<
0.7
608
2585
877
20N
8E10
71T
TP
7/89
����
368
92.4
33.4
5.9
1.1
1.4
<0.
131
8.0
1350
0.2
<0.
759
326
8649
221
N8E
1420
0S
D7/
89����
414
101.
439
.211
.81.
01.
7<
0.1
392.
43
630.
3<
0.7
711
2886
507
22N
8E21
116
TT
P7/
89���
366
94.4
31.6
9.7
0.7
1.7
<0.
133
9.1
937
0.3
<0.
760
929
8651
222
N8E
3014
2S
D7/
89���
448
109.
642
.423
.52.
0<
0.2
<0.
136
3.8
8758
0.4
<0.
777
534
8587
219
N7E
3611
2S
D7/
89���
272
57.7
31.3
14.2
1.0
0.6
<0.
131
4.5
1<
10.
3<
0.7
497
;=�����
:���������
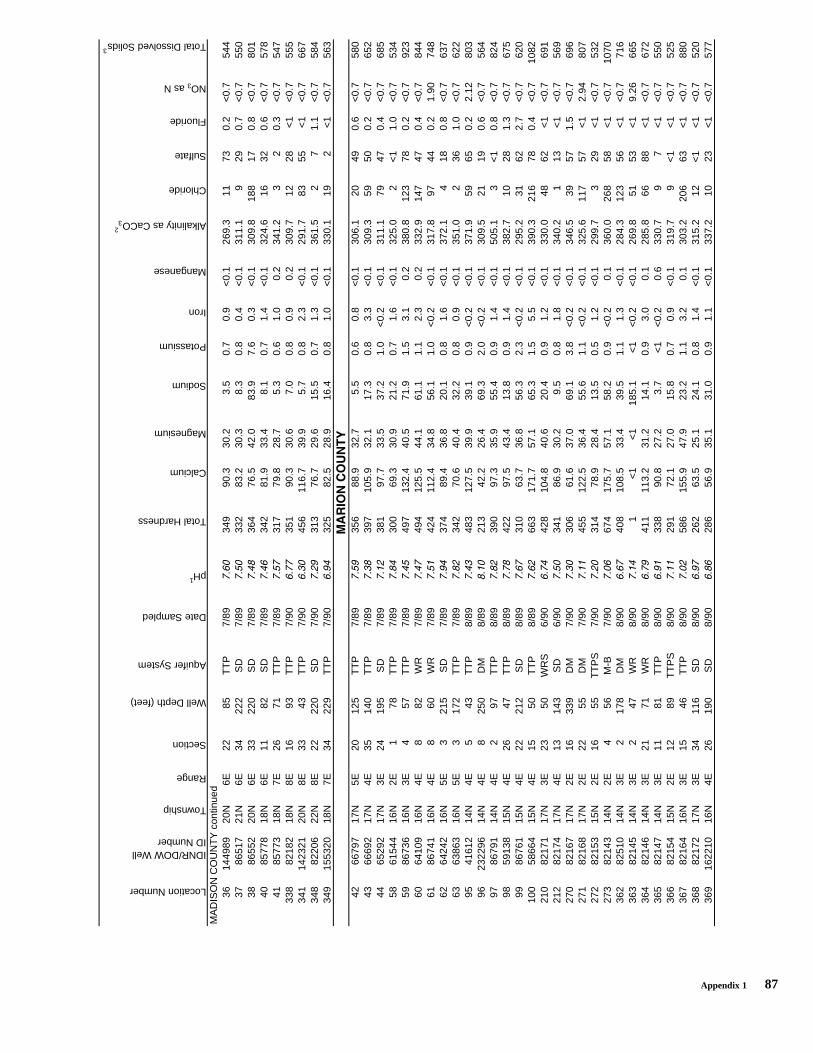
Appendix 1 87
Location Number
IDNR/DOW WellID Number
Township
Range
Section
Well Depth (feet)
Aquifer System
Date Sampled
pH1
Total Hardness
Calcium
Magnesium
Sodium
Potassium
Iron
Manganese
Alkalinity as CaCO32
Chloride
Sulfate
Fluoride
NO3 as N
Total Dissolved Solids3
MA
DIS
ON
CO
UN
TY
con
tinue
d36
1449
8920
N6E
2285
TT
P7/
89����
349
90.3
30.2
3.5
0.7
0.9
<0.
126
9.3
1173
0.2
<0.
754
437
8651
721
N6E
3422
2S
D7/
89����
332
83.2
30.3
8.3
0.8
0.4
<0.
131
1.1
929
0.7
<0.
755
038
8655
220
N6E
3322
0S
D7/
89���
364
76.5
42.0
83.9
7.6
0.3
<0.
130
9.8
188
170.
8<
0.7
801
4085
778
18N
6E11
82S
D7/
89���
342
81.9
33.4
8.1
0.7
1.4
<0.
132
4.6
1632
0.6
<0.
757
841
8577
318
N7E
2671
TT
P7/
89����
317
79.8
28.7
5.3
0.6
1.0
0.2
341.
23
20.
3<
0.7
547
338
8218
218
N8E
1693
TT
P7/
90����
351
90.3
30.6
7.0
0.8
0.9
0.2
309.
712
28<
1<
0.7
555
341
1423
2120
N8E
3343
TT
P7/
90����
456
116.
739
.95.
70.
82.
3<
0.1
291.
783
55<
1<
0.7
667
348
8220
622
N8E
2222
0S
D7/
90���
313
76.7
29.6
15.5
0.7
1.3
<0.
136
1.5
27
1.1
<0.
758
434
915
5320
18N
7E34
229
TT
P7/
90���
325
82.5
28.9
16.4
0.8
1.0
<0.
133
0.1
192
<1
<0.
756
3
4266
797
17N
5E20
125
TT
P7/
89����
356
88.9
32.7
5.5
0.6
0.8
<0.
130
6.1
2049
0.6
<0.
758
043
6669
217
N4E
3514
0T
TP
7/89
����
397
105.
932
.117
.30.
83.
3<
0.1
309.
359
500.
2<
0.7
652
4465
292
17N
3E24
195
SD
7/89
���
381
97.7
33.5
37.2
1.0
<0.
2<
0.1
311.
179
470.
4<
0.7
685
5861
544
16N
2E1
78T
TP
7/89
���
300
69.3
30.9
21.2
0.7
1.6
<0.
132
5.0
2<
11.
0<
0.7
534
5986
736
16N
3E4
57T
TP
7/89
���
497
132.
440
.571
.91.
53.
10.
238
0.8
123
780.
2<
0.7
923
6064
109
16N
4E8
82W
R7/
89���
494
125.
544
.161
.11.
12.
30.
233
2.9
147
470.
4<
0.7
844
6186
741
16N
4E8
60W
R7/
89����
424
112.
434
.856
.11.
0<
0.2
<0.
131
7.8
9744
0.2
1.90
748
6264
242
16N
5E3
215
SD
7/89
���
374
89.4
36.8
20.1
0.8
1.6
<0.
137
2.1
418
0.8
<0.
763
763
6386
316
N5E
317
2T
TP
7/89
���
342
70.6
40.4
32.2
0.8
0.9
<0.
135
1.0
236
1.0
<0.
762
295
4161
214
N4E
543
TT
P8/
89���
483
127.
539
.939
.10.
9<
0.2
<0.
137
1.9
5965
0.2
2.12
803
9623
2296
14N
4E8
250
DM
8/89
����
213
42.2
26.4
69.3
2.0
<0.
2<
0.1
309.
521
190.
6<
0.7
564
9786
791
14N
4E2
97T
TP
8/89
���
390
97.3
35.9
55.4
0.9
1.4
<0.
150
5.1
3<
10.
8<
0.7
824
9859
138
15N
4E26
47T
TP
8/89
����
422
97.5
43.4
13.8
0.9
1.4
<0.
138
2.7
1028
1.3
<0.
767
599
8676
115
N4E
2221
2S
D8/
89����
310
63.7
36.8
56.3
2.3
<0.
2<
0.1
295.
231
622.
7<
0.7
620
100
5866
415
N4E
1550
TT
P8/
89���
663
171.
757
.165
.31.
55.
5<
0.1
390.
321
678
0.4
<0.
710
8221
082
171
17N
3E23
50W
RS
6/90
���
428
104.
840
.620
.40.
91.
2<
0.1
330.
048
62<
1<
0.7
691
212
8217
417
N4E
1314
3S
D6/
90����
341
86.9
30.2
9.5
0.8
1.8
<0.
134
0.2
113
<1
<0.
756
927
082
167
17N
2E16
339
DM
7/90
����
306
61.6
37.0
69.1
3.8
<0.
2<
0.1
346.
539
571.
5<
0.7
696
271
8216
817
N2E
2255
DM
7/90
����
455
122.
536
.455
.61.
1<
0.2
<0.
132
5.6
117
57<
12.
9480
727
282
153
15N
2E16
55T
TP
S7/
90���
314
78.9
28.4
13.5
0.5
1.2
<0.
129
9.7
329
<1
<0.
753
227
382
143
14N
2E4
56M
-B7/
90����
674
175.
757
.158
.20.
9<
0.2
0.1
360.
026
858
<1
<0.
710
7036
282
510
14N
3E2
178
DM
8/90
����
408
108.
533
.439
.51.
11.
3<
0.1
284.
312
356
<1
<0.
771
636
382
145
14N
3E2
47W
R8/
90���
1<
1<
118
5.1
<1
<0.
2<
0.1
269.
851
53<
19.
2666
536
482
146
14N
3E21
71W
R8/
90����
411
113.
231
.214
.10.
93.
00.
128
5.8
6688
<1
<0.
767
236
582
147
14N
3E11
81T
TP
8/90
����
338
90.8
27.2
3.7
<1
<0.
20.
633
0.7
97
<1
<0.
755
036
682
154
15N
2E12
89T
TP
S8/
90����
291
72.1
27.0
15.8
0.7
0.9
<0.
131
9.7
9<
1<
1<
0.7
525
367
8216
416
N3E
1546
TT
P8/
90���
586
155.
947
.923
.21.
13.
20.
130
3.2
206
63<
1<
0.7
880
368
8217
217
N3E
3411
6S
D8/
90����
262
63.5
25.1
24.1
0.8
1.4
<0.
131
5.2
12<
1<
1<
0.7
520
369
1622
1016
N4E
2619
0S
D8/
90����
286
56.9
35.1
31.0
0.9
1.1
<0.
133
7.2
1023
<1
<0.
757
7
:��������
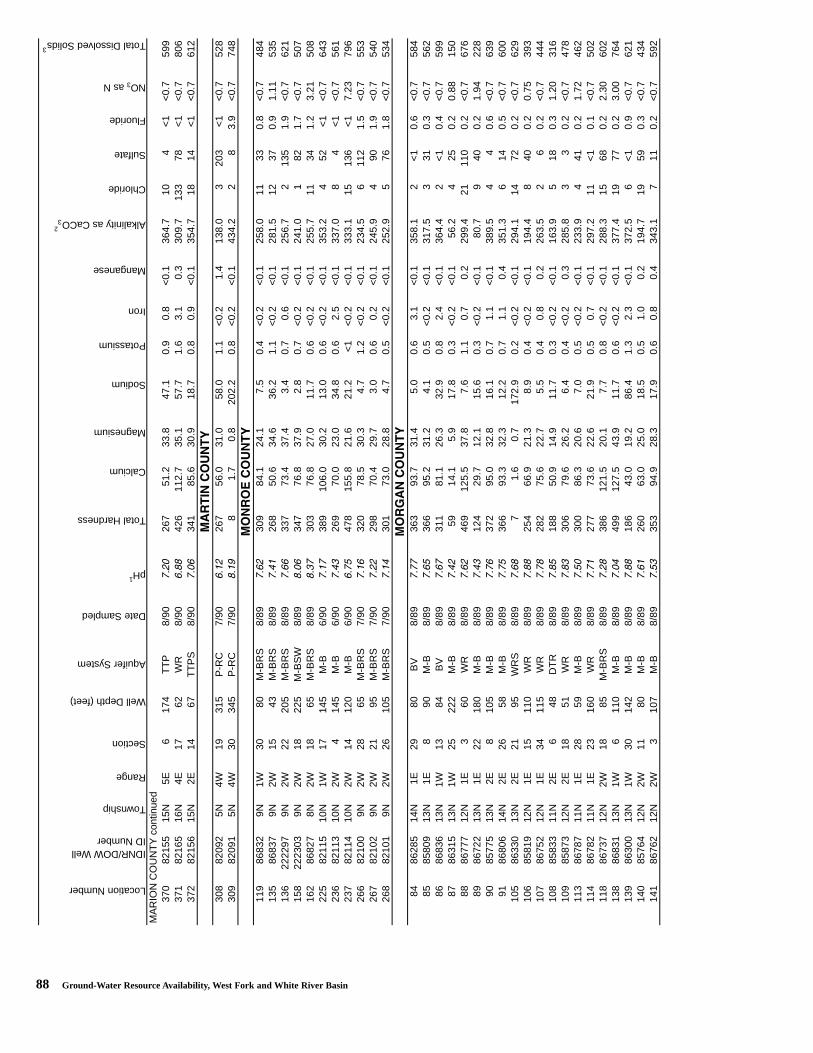
88 Ground-Water Resource Availability, West Fork and White River Basin
Location Number
IDNR/DOW WellID Number
Township
Range
Section
Well Depth (feet)
Aquifer System
Date Sampled
pH1
Total Hardness
Calcium
Magnesium
Sodium
Potassium
Iron
Manganese
Alkalinity as CaCO32
Chloride
Sulfate
Fluoride
NO3 as N
Total Dissolved Solids3
MA
RIO
N C
OU
NT
Y c
ontin
ued
370
8215
515
N5E
617
4T
TP
8/90
���
267
51.2
33.8
47.1
0.9
0.8
<0.
136
4.7
104
<1
<0.
759
937
182
165
16N
4E17
62W
R8/
90����
426
112.
735
.157
.71.
63.
10.
330
9.7
133
78<
1<
0.7
806
372
8215
615
N2E
1467
TT
PS
8/90
����
341
85.6
30.9
18.7
0.8
0.9
<0.
135
4.7
1814
<1
<0.
761
2
308
8209
25N
4W19
315
P-R
C7/
90���
267
56.0
31.0
58.0
1.1
<0.
21.
413
8.0
320
3<
1<
0.7
528
309
8209
15N
4W30
345
P-R
C7/
90����
81.
70.
820
2.2
0.8
<0.
2<
0.1
434.
22
83.
9<
0.7
748
119
8683
29N
1W30
80M
-BR
S8/
89���
309
84.1
24.1
7.5
0.4
<0.
2<
0.1
258.
011
330.
8<
0.7
484
135
8683
79N
2W15
43M
-BR
S8/
89���
268
50.6
34.6
36.2
1.1
<0.
2<
0.1
281.
512
370.
91.
1153
513
622
2297
9N2W
2220
5M
-BR
S8/
89����
337
73.4
37.4
3.4
0.7
0.6
<0.
125
6.7
213
51.
9<
0.7
621
158
2223
039N
2W18
225
M-B
SW
8/89
����
347
76.8
37.9
2.8
0.7
<0.
2<
0.1
241.
01
821.
7<
0.7
507
162
8682
78N
2W18
65M
-BR
S8/
89����
303
76.8
27.0
11.7
0.6
<0.
2<
0.1
255.
711
341.
23.
2150
822
582
115
10N
1W17
145
M-B
6/90
����
389
106.
030
.213
.00.
6<
0.2
<0.
135
3.2
452
<1
<0.
764
323
682
113
10N
2W4
145
M-B
6/90
���
269
70.0
23.0
34.8
0.6
2.5
<0.
133
7.0
84
<1
<0.
756
123
782
114
10N
2W14
120
M-B
6/90
����
478
155.
821
.621
.2<
1<
0.2
<0.
133
3.1
1513
6<
17.
2379
626
682
100
9N2W
2865
M-B
RS
7/90
����
320
78.5
30.3
4.7
1.2
<0.
2<
0.1
234.
56
112
1.5
<0.
755
326
782
102
9N2W
2195
M-B
RS
7/90
��
298
70.4
29.7
3.0
0.6
0.2
<0.
124
5.9
490
1.9
<0.
754
026
882
101
9N2W
2610
5M
-BR
S7/
90���
301
73.0
28.8
4.7
0.5
<0.
2<
0.1
252.
95
761.
8<
0.7
534
8486
285
14N
1E29
80B
V8/
89����
363
93.7
31.4
5.0
0.6
3.1
<0.
135
8.1
2<
10.
6<
0.7
584
8585
809
13N
1E8
90M
-B8/
89����
366
95.2
31.2
4.1
0.5
<0.
2<
0.1
317.
53
310.
3<
0.7
562
8686
836
13N
1W13
84B
V8/
89����
311
81.1
26.3
32.9
0.8
2.4
<0.
136
4.4
2<
10.
4<
0.7
599
8786
315
13N
1W25
222
M-B
8/89
��
5914
.15.
917
.80.
3<
0.2
<0.
156
.24
250.
20.
8815
088
8677
712
N1E
360
WR
8/89
���
469
125.
537
.87.
61.
10.
70.
229
9.4
2111
00.
2<
0.7
676
8986
722
13N
1E22
180
M-B
8/89
���
124
29.7
12.1
15.6
0.3
<0.
2<
0.1
80.7
940
0.2
1.94
228
9085
775
13N
2E8
105
M-B
8/89
����
372
95.0
32.8
16.1
0.7
1.1
<0.
138
9.5
44
0.6
<0.
763
991
8680
614
N2E
2658
M-B
8/89
����
366
93.3
32.3
12.2
0.7
1.1
0.4
351.
36
140.
5<
0.7
600
105
8633
013
N2E
2195
WR
S8/
89����
71.
60.
717
2.9
0.2
<0.
2<
0.1
294.
114
720.
2<
0.7
629
106
8581
912
N1E
1511
0W
R8/
89����
254
66.9
21.3
8.9
0.4
<0.
2<
0.1
194.
48
400.
20.
7539
310
786
752
12N
1E34
115
WR
8/89
����
282
75.6
22.7
5.5
0.4
0.8
0.2
263.
52
60.
2<
0.7
444
108
8583
311
N2E
648
DT
R8/
89����
188
50.9
14.9
11.7
0.3
<0.
2<
0.1
163.
95
180.
31.
2031
610
985
873
12N
2E18
51W
R8/
89����
306
79.6
26.2
6.4
0.4
<0.
20.
328
5.8
33
0.2
<0.
747
811
386
787
11N
1E28
59M
-B8/
89����
300
86.3
20.6
7.0
0.5
<0.
2<
0.1
233.
94
410.
21.
7246
211
486
782
11N
1E23
160
WR
8/89
����
277
73.6
22.6
21.9
0.5
0.7
<0.
129
7.2
11<
10.
1<
0.7
502
118
8673
712
N2W
1885
M-B
RS
8/89
���
386
121.
520
.17.
70.
8<
0.2
<0.
128
8.3
1568
0.2
2.30
602
138
8683
113
N1W
611
0M
-B8/
89���
499
127.
543
.911
.70.
6<
0.2
<0.
137
7.4
1977
0.2
3.00
764
139
8630
013
N1W
3014
2M
-B8/
89����
186
43.0
19.2
86.4
1.3
2.3
<0.
137
2.5
6<
10.
9<
0.7
621
140
8576
412
N2W
1180
M-B
8/89
����
260
63.0
25.0
18.5
0.5
1.0
0.2
194.
719
590.
3<
0.7
434
141
8676
212
N2W
310
7M
-B8/
89����
353
94.9
28.3
17.9
0.6
0.8
0.4
343.
17
110.
2<
0.7
592
:���������
:�������
:�9������
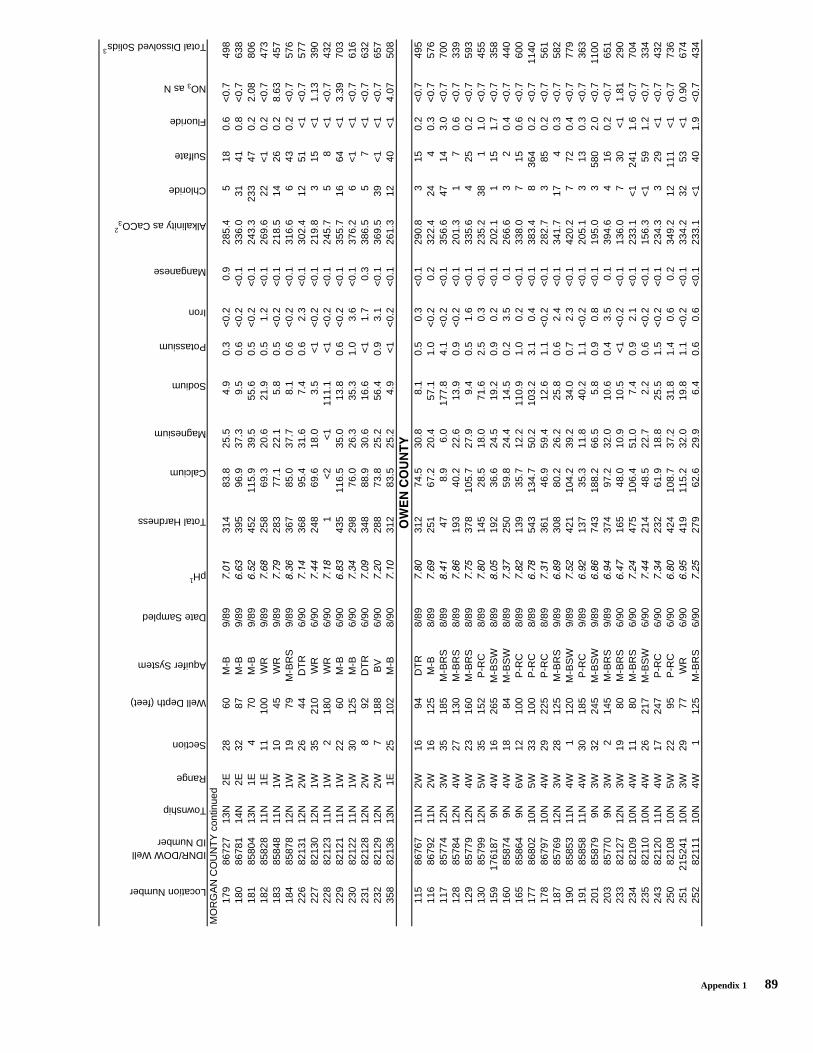
Appendix 1 89
Location Number
IDNR/DOW WellID Number
Township
Range
Section
Well Depth (feet)
Aquifer System
Date Sampled
pH1
Total Hardness
Calcium
Magnesium
Sodium
Potassium
Iron
Manganese
Alkalinity as CaCO32
Chloride
Sulfate
Fluoride
NO3 as N
Total Dissolved Solids3
MO
RG
AN
CO
UN
TY
con
tinue
d17
986
727
13N
2E28
60M
-B9/
89����
314
83.8
25.5
4.9
0.3
<0.
20.
928
5.4
518
0.6
<0.
749
818
086
781
14N
2E32
87M
-B9/
89����
395
96.9
37.3
9.5
0.6
<0.
2<
0.1
336.
031
410.
8<
0.7
638
181
8580
413
N1E
470
M-B
9/89
���
452
115.
939
.555
.60.
5<
0.2
<0.
124
3.3
233
470.
22.
0880
618
285
828
11N
1E11
100
WR
9/89
����
258
69.3
20.6
21.9
0.5
1.2
<0.
126
9.6
22<
10.
2<
0.7
473
183
8584
811
N1W
1045
WR
9/89
����
283
77.1
22.1
5.8
0.5
<0.
2<
0.1
218.
514
260.
28.
6345
718
485
878
12N
1W19
79M
-BR
S9/
89����
367
85.0
37.7
8.1
0.6
<0.
2<
0.1
316.
66
430.
2<
0.7
576
226
8213
112
N2W
2644
DT
R6/
90���
368
95.4
31.6
7.4
0.6
2.3
<0.
130
2.4
1251
<1
<0.
757
722
782
130
12N
1W35
210
WR
6/90
��
248
69.6
18.0
3.5
<1
<0.
2<
0.1
219.
83
15<
11.
1339
022
882
123
11N
1W2
180
WR
6/90
����
1<
2<
111
1.1
<1
<0.
2<
0.1
245.
75
8<
1<
0.7
432
229
8212
111
N1W
2260
M-B
6/90
����
435
116.
535
.013
.80.
6<
0.2
<0.
135
5.7
1664
<1
3.39
703
230
8212
211
N1W
3012
5M
-B6/
90���
298
76.0
26.3
35.3
1.0
3.6
<0.
137
6.2
6<
1<
1<
0.7
616
231
8212
812
N2W
892
DT
R6/
90����
348
88.9
30.6
16.6
<1
1.7
0.3
386.
55
7<
1<
0.7
632
232
8212
912
N2W
718
8B
V6/
90���
288
73.8
25.2
56.4
0.9
3.1
<0.
136
9.5
39<
1<
1<
0.7
657
358
8213
613
N1E
2510
2M
-B8/
90����
312
83.5
25.2
4.9
<1
<0.
2<
0.1
261.
312
40<
14.
0750
8
115
8676
711
N2W
1694
DT
R8/
89����
312
74.5
30.8
8.1
0.5
0.3
<0.
129
0.8
315
0.2
<0.
749
511
686
792
11N
2W16
125
M-B
8/89
����
251
67.2
20.4
57.1
1.0
<0.
20.
232
2.4
244
0.3
<0.
757
611
785
774
12N
3W35
185
M-B
RS
8/89
���
478.
96.
017
7.8
4.1
<0.
2<
0.1
356.
647
143.
0<
0.7
700
128
8578
412
N4W
2713
0M
-BR
S8/
89����
193
40.2
22.6
13.9
0.9
<0.
2<
0.1
201.
31
70.
6<
0.7
339
129
8577
912
N4W
2316
0M
-BR
S8/
89����
378
105.
727
.99.
40.
51.
6<
0.1
335.
64
250.
2<
0.7
593
130
8579
912
N5W
3515
2P
-RC
8/89
����
145
28.5
18.0
71.6
2.5
0.3
<0.
123
5.2
381
1.0
<0.
745
515
917
6187
9N4W
1626
5M
-BS
W8/
89����
192
36.6
24.5
19.2
0.9
0.2
<0.
120
2.1
115
1.7
<0.
735
816
085
874
9N4W
1884
M-B
SW
8/89
����
250
59.8
24.4
14.5
0.2
3.5
0.1
266.
63
20.
4<
0.7
440
165
8586
49N
6W12
100
P-R
C8/
89���
139
35.7
12.2
110.
91.
00.
2<
0.1
338.
07
150.
6<
0.7
600
177
8680
210
N5W
3310
0P
-RC
8/89
����
543
134.
750
.210
3.2
3.1
0.4
<0.
138
3.4
836
40.
2<
0.7
1140
178
8679
710
N4W
2922
5P
-RC
8/89
����
361
46.9
59.4
12.6
1.1
<0.
2<
0.1
282.
73
850.
2<
0.7
561
187
8576
912
N3W
2812
5M
-BR
S9/
89����
308
80.2
26.2
25.8
0.6
2.4
<0.
134
1.7
174
0.3
<0.
758
219
085
853
11N
4W1
120
M-B
SW
9/89
���
421
104.
239
.234
.00.
72.
3<
0.1
420.
27
720.
4<
0.7
779
191
8585
811
N4W
3018
5P
-RC
9/89
���
137
35.3
11.8
40.2
1.1
<0.
2<
0.1
205.
13
130.
3<
0.7
363
201
8587
99N
3W32
245
M-B
SW
9/89
����
743
188.
266
.55.
80.
90.
8<
0.1
195.
03
580
2.0
<0.
711
0020
385
770
9N3W
214
5M
-BR
S9/
89���
374
97.2
32.0
10.6
0.4
3.5
0.1
394.
64
160.
2<
0.7
651
233
8212
712
N3W
1980
M-B
RS
6/90
���
165
48.0
10.9
10.5
<1
<0.
2<
0.1
136.
07
30<
11.
8129
023
482
109
10N
4W11
80M
-BR
S6/
90��
475
106.
451
.07.
40.
92.
1<
0.1
233.
1<
124
11.
6<
0.7
704
235
8211
010
N4W
2621
7M
-BS
W6/
90��
214
48.5
22.7
2.2
0.6
<0.
2<
0.1
156.
3<
159
1.2
<0.
733
424
382
120
11N
4W17
247
P-R
C6/
90���
232
61.9
18.8
25.5
1.5
<0.
2<
0.1
234.
33
29<
1<
0.7
432
250
8210
810
N5W
2295
P-R
C6/
90����
424
108.
737
.231
.81.
40.
60.
234
9.2
1211
1<
1<
0.7
736
251
2152
4110
N3W
2977
WR
6/90
����
419
115.
232
.019
.81.
1<
0.2
<0.
133
4.2
3253
<1
0.90
674
252
8211
110
N4W
112
5M
-BR
S6/
90���
279
62.6
29.9
6.4
0.6
0.6
<0.
123
3.1
<1
401.
9<
0.7
434
7������
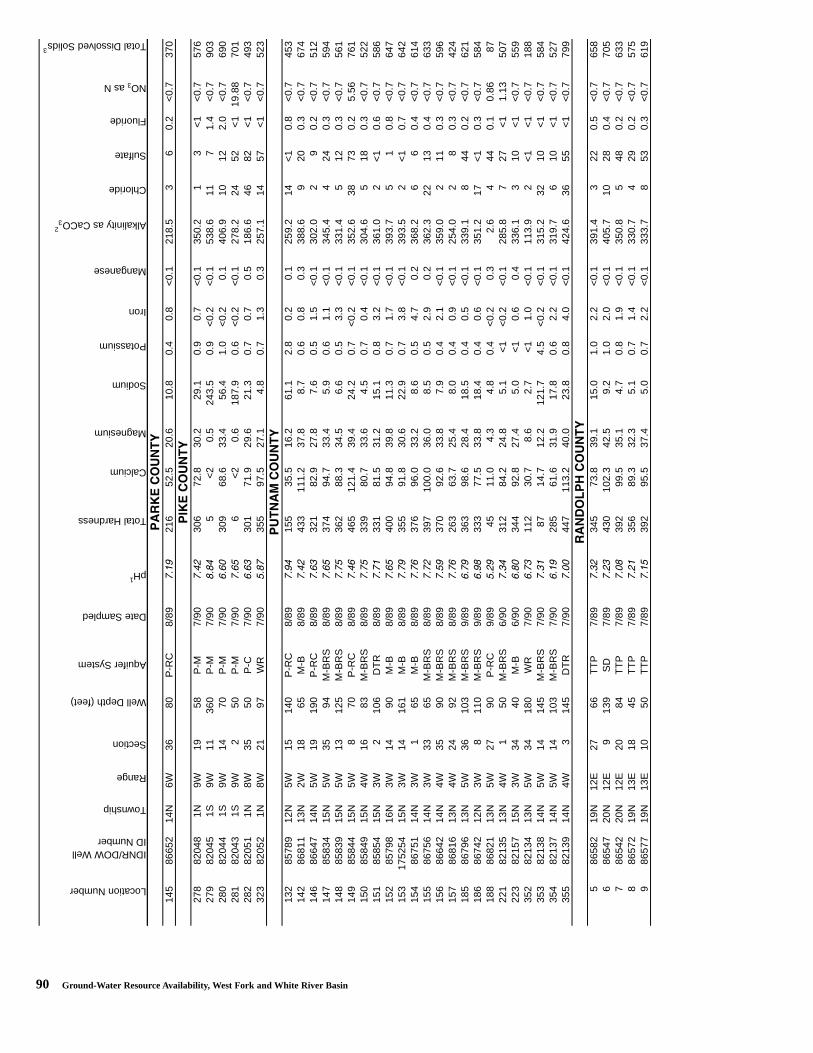
90 Ground-Water Resource Availability, West Fork and White River Basin
Location Number
IDNR/DOW WellID Number
Township
Range
Section
Well Depth (feet)
Aquifer System
Date Sampled
pH1
Total Hardness
Calcium
Magnesium
Sodium
Potassium
Iron
Manganese
Alkalinity as CaCO32
Chloride
Sulfate
Fluoride
NO3 as N
Total Dissolved Solids3
145
8665
214
N6W
3680
P-R
C8/
89����
216
52.5
20.6
10.8
0.4
0.8
<0.
121
8.5
36
0.2
<0.
737
0
278
8204
81N
9W19
58P
-M7/
90��
306
72.8
30.2
29.1
0.9
0.7
<0.
135
0.2
13
<1
<0.
757
627
982
045
1S9W
1136
0P
-M7/
90���
5<
20.
524
3.5
0.9
<0.
2<
0.1
538.
611
71.
4<
0.7
903
280
8204
41S
9W14
70P
-M7/
90����
309
68.6
33.4
56.4
1.0
<0.
20.
140
6.9
1012
2.0
<0.
769
028
182
043
1S9W
250
P-M
7/90
����
6<
20.
618
7.9
0.6
<0.
2<
0.1
278.
224
52<
119
.88
701
282
8205
11N
8W35
50P
-C7/
90����
301
71.9
29.6
21.3
0.7
0.7
0.5
186.
646
82<
1<
0.7
493
323
8205
21N
8W21
97W
R7/
90����
355
97.5
27.1
4.8
0.7
1.3
0.3
257.
114
57<
1<
0.7
523
132
8578
912
N5W
1514
0P
-RC
8/89
���
155
35.5
16.2
61.1
2.8
0.2
0.1
259.
214
<1
0.8
<0.
745
314
286
811
13N
2W18
65M
-B8/
89��
433
111.
237
.88.
70.
60.
80.
338
8.6
920
0.3
<0.
767
414
686
647
14N
5W19
190
P-R
C8/
89����
321
82.9
27.8
7.6
0.5
1.5
<0.
130
2.0
29
0.2
<0.
751
214
785
834
15N
5W35
94M
-BR
S8/
89����
374
94.7
33.4
5.9
0.6
1.1
<0.
134
5.4
424
0.3
<0.
759
414
885
839
15N
5W13
125
M-B
RS
8/89
����
362
88.3
34.5
6.6
0.5
3.3
<0.
133
1.4
512
0.3
<0.
756
114
985
844
15N
5W8
70P
-RC
8/89
���
465
121.
439
.424
.20.
7<
0.2
<0.
135
2.6
3873
0.2
5.56
761
150
8584
915
N4W
1683
M-B
RS
8/89
����
339
80.7
33.6
4.5
0.7
0.4
<0.
130
4.6
518
0.3
<0.
752
215
185
854
15N
3W2
106
DT
R8/
89����
331
81.5
31.2
15.1
0.8
3.2
<0.
136
1.0
2<
10.
6<
0.7
586
152
8579
816
N3W
1490
M-B
8/89
����
400
94.8
39.8
11.3
0.7
1.7
<0.
139
3.7
51
0.8
<0.
764
715
317
5254
15N
3W14
161
M-B
8/89
����
355
91.8
30.6
22.9
0.7
3.8
<0.
139
3.5
2<
10.
7<
0.7
642
154
8675
114
N3W
165
M-B
8/89
����
376
96.0
33.2
8.6
0.5
4.7
0.2
368.
26
60.
4<
0.7
614
155
8675
614
N3W
3365
M-B
RS
8/89
���
397
100.
036
.08.
50.
52.
90.
236
2.3
2213
0.4
<0.
763
315
686
642
14N
4W35
90M
-BR
S8/
89����
370
92.6
33.8
7.9
0.4
2.1
<0.
135
9.0
211
0.3
<0.
759
615
786
816
13N
4W24
92M
-BR
S8/
89����
263
63.7
25.4
8.0
0.4
0.9
<0.
125
4.0
28
0.3
<0.
742
418
586
796
13N
5W36
103
M-B
RS
9/89
����
363
98.6
28.4
18.5
0.4
0.5
<0.
133
9.1
844
0.2
<0.
762
118
686
742
12N
3W8
110
M-B
RS
9/89
����
333
77.5
33.8
18.4
0.4
0.6
<0.
135
1.2
17<
10.
3<
0.7
584
188
8682
113
N5W
2790
P-R
C9/
89���
4511
.04.
34.
80.
4<
0.2
0.3
2.6
444
0.1
0.86
8722
182
135
13N
4W1
50M
-BR
S6/
90���
312
84.2
24.8
5.1
<1
<0.
2<
0.1
285.
87
27<
11.
1350
722
382
157
15N
3W34
40M
-B6/
90����
344
92.8
27.4
5.0
<1
0.6
0.4
336.
13
10<
1<
0.7
559
352
8213
413
N5W
3418
0W
R7/
90����
112
30.7
8.6
2.7
<1
1.0
<0.
111
3.9
2<
1<
1<
0.7
188
353
8213
814
N5W
1414
5M
-BR
S7/
90����
8714
.712
.212
1.7
4.5
<0.
2<
0.1
315.
232
10<
1<
0.7
584
354
8213
714
N5W
1410
3M
-BR
S7/
90����
285
61.6
31.9
17.8
0.6
2.2
<0.
131
9.7
610
<1
<0.
752
735
582
139
14N
4W3
145
DT
R7/
90����
447
113.
240
.023
.80.
84.
0<
0.1
424.
636
55<
1<
0.7
799
586
582
19N
12E
2766
TT
P7/
89���
345
73.8
39.1
15.0
1.0
2.2
<0.
139
1.4
322
0.5
<0.
765
86
8654
720
N12
E9
139
SD
7/89
���
430
102.
342
.59.
21.
02.
0<
0.1
405.
710
280.
4<
0.7
705
786
542
20N
12E
2084
TT
P7/
89����
392
99.5
35.1
4.7
0.8
1.9
<0.
135
0.8
548
0.2
<0.
763
38
8657
219
N13
E18
45T
TP
7/89
���
356
89.3
32.3
5.1
0.7
1.4
<0.
133
0.7
429
0.2
<0.
757
59
8657
719
N13
E10
50T
TP
7/89
����
392
95.5
37.4
5.0
0.7
2.2
<0.
133
3.7
853
0.3
<0.
761
9
>��;������
>�;������
>���:�����
���8> �����
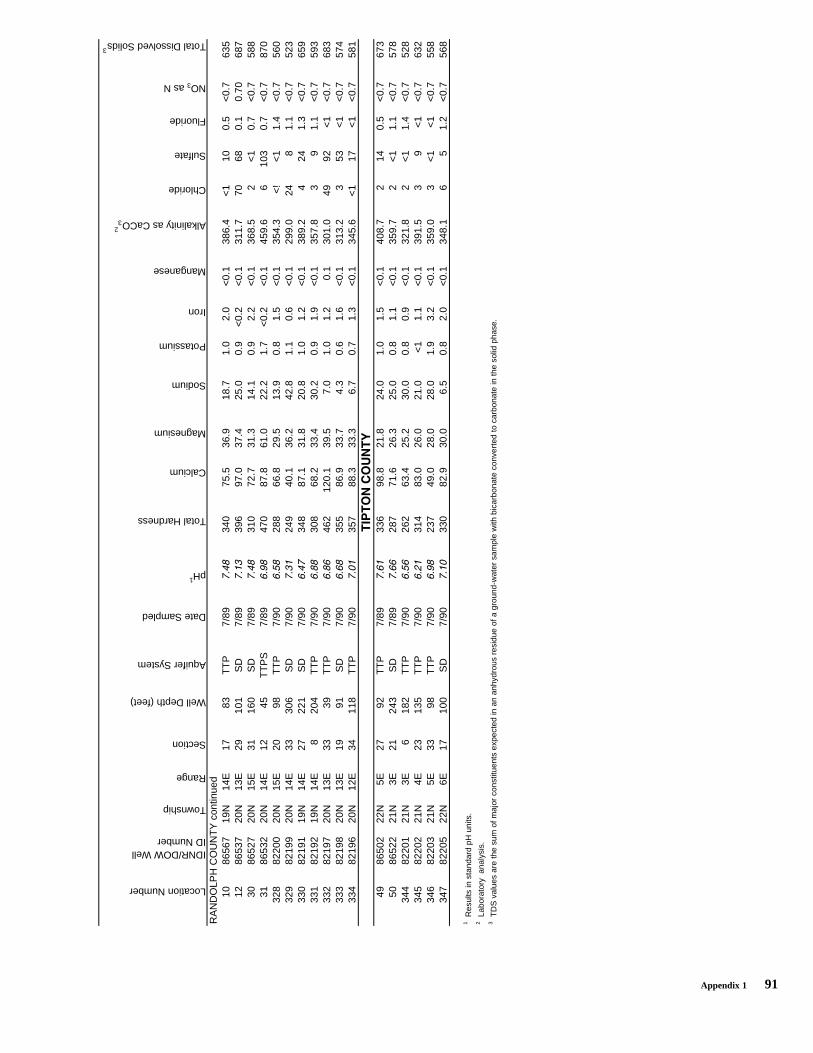
Appendix 1 91
Location Number
IDNR/DOW WellID Number
Township
Range
Section
Well Depth (feet)
Aquifer System
Date Sampled
pH1
Total Hardness
Calcium
Magnesium
Sodium
Potassium
Iron
Manganese
Alkalinity as CaCO32
Chloride
Sulfate
Fluoride
NO3 as N
Total Dissolved Solids3
RA
ND
OLP
H C
OU
NT
Y c
ontin
ued
1086
567
19N
14E
1783
TT
P7/
89���
340
75.5
36.9
18.7
1.0
2.0
<0.
138
6.4
<1
100.
5<
0.7
635
1286
537
20N
13E
2910
1S
D7/
89����
396
97.0
37.4
25.0
0.9
<0.
2<
0.1
311.
770
680.
10.
7068
730
8652
720
N15
E31
160
SD
7/89
���
310
72.7
31.3
14.1
0.9
2.2
<0.
136
8.5
2<
10.
7<
0.7
588
3186
532
20N
14E
1245
TT
PS
7/89
����
470
87.8
61.0
22.2
1.7
<0.
2<
0.1
459.
66
103
0.7
<0.
787
032
882
200
20N
15E
2098
TT
P7/
90����
288
66.8
29.5
13.9
0.8
1.5
<0.
135
4.3
<!
<1
1.4
<0.
756
032
982
199
20N
14E
3330
6S
D7/
90����
249
40.1
36.2
42.8
1.1
0.6
<0.
129
9.0
248
1.1
<0.
752
333
082
191
19N
14E
2722
1S
D7/
90���
348
87.1
31.8
20.8
1.0
1.2
<0.
138
9.2
424
1.3
<0.
765
933
182
192
19N
14E
820
4T
TP
7/90
����
308
68.2
33.4
30.2
0.9
1.9
<0.
135
7.8
39
1.1
<0.
759
333
282
197
20N
13E
3339
TT
P7/
90����
462
120.
139
.57.
01.
01.
20.
130
1.0
4992
<1
<0.
768
333
382
198
20N
13E
1991
SD
7/90
����
355
86.9
33.7
4.3
0.6
1.6
<0.
131
3.2
353
<1
<0.
757
433
482
196
20N
12E
3411
8T
TP
7/90
����
357
88.3
33.3
6.7
0.7
1.3
<0.
134
5.6
<1
17<
1<
0.7
581
4986
502
22N
5E27
92T
TP
7/89
����
336
98.8
21.8
24.0
1.0
1.5
<0.
140
8.7
214
0.5
<0.
767
350
8652
221
N3E
2124
3S
D7/
89����
287
71.6
26.3
25.0
0.8
1.1
<0.
135
9.7
2<
11.
1<
0.7
578
344
8220
121
N3E
618
2T
TP
7/90
����
262
63.4
25.2
30.0
0.8
0.9
<0.
132
1.8
2<
11.
4<
0.7
528
345
8220
221
N4E
2313
5T
TP
7/90
���
314
83.0
26.0
21.0
<1
1.1
<0.
139
1.5
39
<1
<0.
763
234
682
203
21N
5E33
98T
TP
7/90
����
237
49.0
28.0
28.0
1.9
3.2
<0.
135
9.0
3<
1<
1<
0.7
558
347
8220
522
N6E
1710
0S
D7/
90����
330
82.9
30.0
6.5
0.8
2.0
<0.
134
8.1
65
1.2
<0.
756
8
1 Res
ults
in s
tand
ard
pH u
nits
.2 L
abor
ator
y a
naly
sis.
3 TD
S v
alue
s ar
e th
e su
m o
f maj
or c
onst
ituen
ts e
xpec
ted
in a
n an
hydr
ous
resi
due
of a
gro
und-
wat
er s
ampl
e w
ith b
icar
bona
te c
onve
rted
to c
arbo
nate
in th
e so
lid p
hase
.
��>������
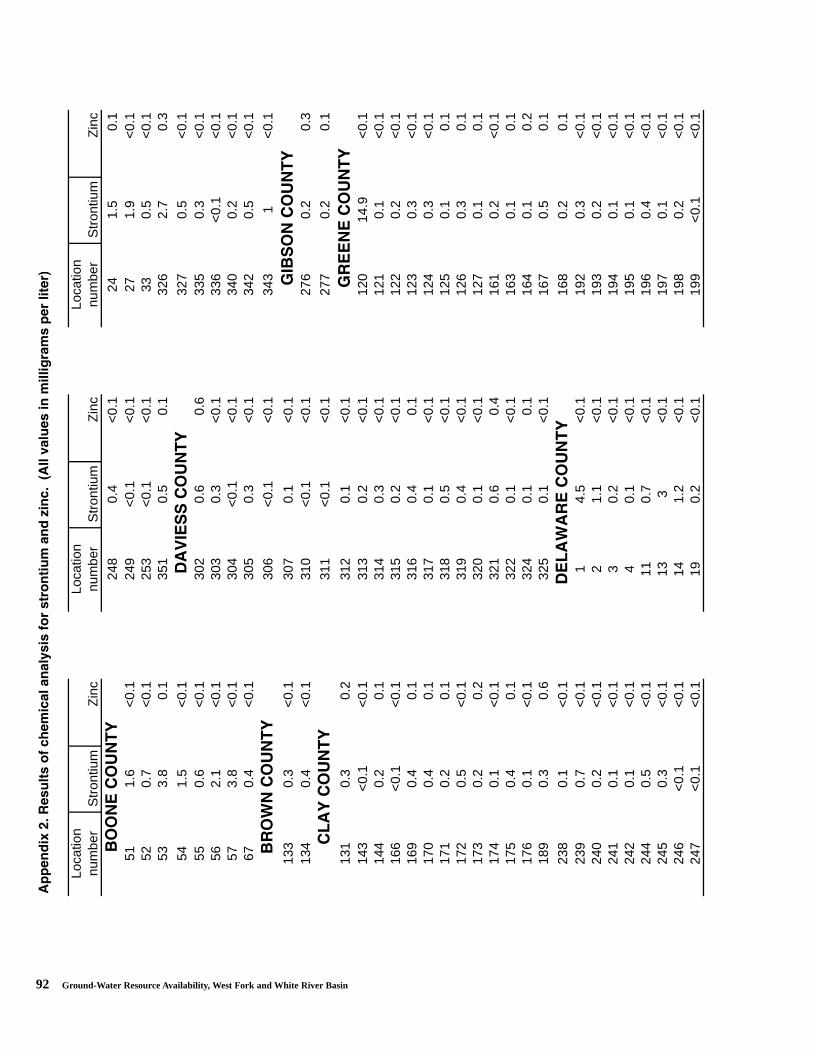
92 Ground-Water Resource Availability, West Fork and White River Basin
���������1-���"���"�����#���� �� � �!"�"�����"��������� ���?���-��%����) ���"����������� �"����������&
Loca
tion
num
ber
Str
ontiu
mZ
inc
Loca
tion
num
ber
Str
ontiu
mZ
inc
Loca
tion
num
ber
Str
ontiu
mZ
inc
248
0.4
<0.
124
1.5
0.1
511.
6<
0.1
249
<0.
1<
0.1
271.
9<
0.1
520.
7<
0.1
253
<0.
1<
0.1
330.
5<
0.1
533.
80.
135
10.
50.
132
62.
70.
3
541.
5<
0.1
327
0.5
<0.
155
0.6
<0.
130
20.
60.
633
50.
3<
0.1
562.
1<
0.1
303
0.3
<0.
133
6<
0.1
<0.
157
3.8
<0.
130
4<
0.1
<0.
134
00.
2<
0.1
670.
4<
0.1
305
0.3
<0.
134
20.
5<
0.1
306
<0.
1<
0.1
343
1<
0.1
133
0.3
<0.
130
70.
1<
0.1
134
0.4
<0.
131
0<
0.1
<0.
127
60.
20.
3
311
<0.
1<
0.1
277
0.2
0.1
131
0.3
0.2
312
0.1
<0.
114
3<
0.1
<0.
131
30.
2<
0.1
120
14.9
<0.
114
40.
20.
131
40.
3<
0.1
121
0.1
<0.
116
6<
0.1
<0.
131
50.
2<
0.1
122
0.2
<0.
116
90.
40.
131
60.
40.
112
30.
3<
0.1
170
0.4
0.1
317
0.1
<0.
112
40.
3<
0.1
171
0.2
0.1
318
0.5
<0.
112
50.
10.
117
20.
5<
0.1
319
0.4
<0.
112
60.
30.
117
30.
20.
232
00.
1<
0.1
127
0.1
0.1
174
0.1
<0.
132
10.
60.
416
10.
2<
0.1
175
0.4
0.1
322
0.1
<0.
116
30.
10.
117
60.
1<
0.1
324
0.1
0.1
164
0.1
0.2
189
0.3
0.6
325
0.1
<0.
116
70.
50.
1
238
0.1
<0.
116
80.
20.
123
90.
7<
0.1
14.
5<
0.1
192
0.3
<0.
124
00.
2<
0.1
21.
1<
0.1
193
0.2
<0.
124
10.
1<
0.1
30.
2<
0.1
194
0.1
<0.
124
20.
1<
0.1
40.
1<
0.1
195
0.1
<0.
124
40.
5<
0.1
110.
7<
0.1
196
0.4
<0.
124
50.
3<
0.1
133
<0.
119
70.
1<
0.1
246
<0.
1<
0.1
141.
2<
0.1
198
0.2
<0.
124
7<
0.1
<0.
119
0.2
<0.
119
9<
0.1
<0.
1
(������
������������
(�7�����
9�(������
�8�������
9���������
��8�7��������
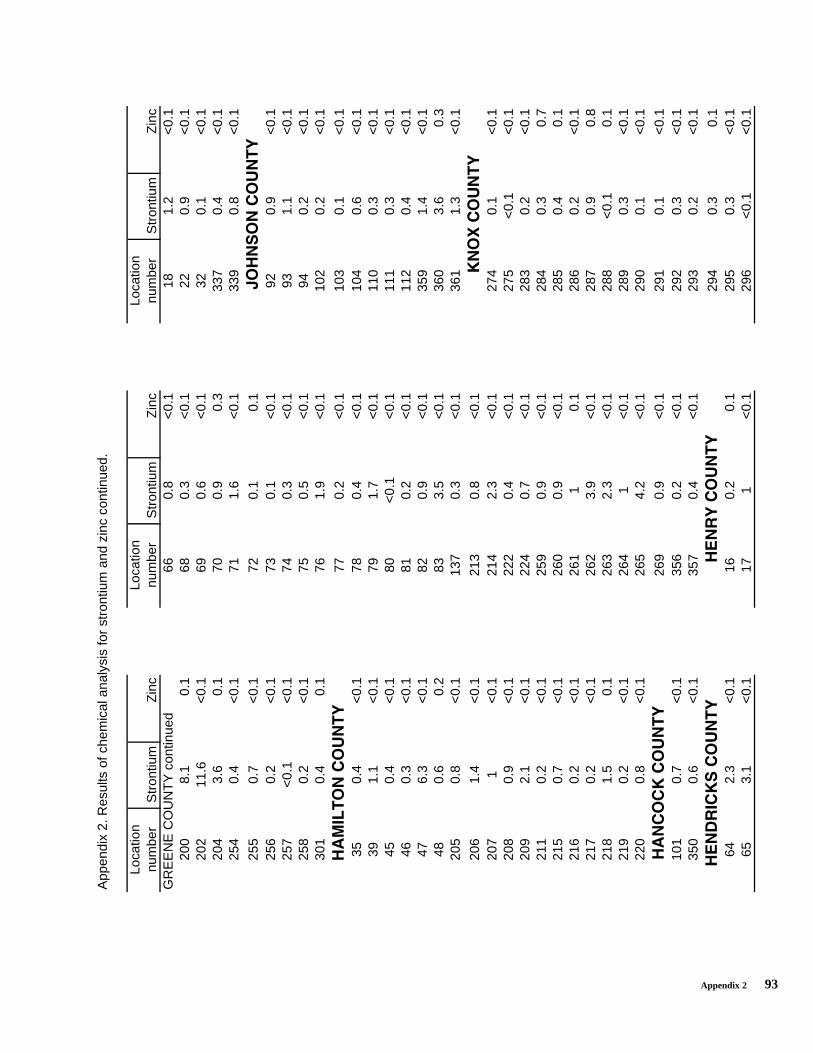
Appendix 2 93
App
endi
x 2.
Res
ults
of c
hem
ical
ana
lysi
s fo
r st
ront
ium
and
zin
c co
ntin
ued.
Loca
tion
num
ber
Str
ontiu
mZ
inc
Loca
tion
num
ber
Str
ontiu
mZ
inc
Loca
tion
num
ber
Str
ontiu
mZ
inc
GR
EE
NE
CO
UN
TY
con
tinue
d66
0.8
<0.
118
1.2
<0.
120
08.
10.
168
0.3
<0.
122
0.9
<0.
120
211
.6<
0.1
690.
6<
0.1
320.
1<
0.1
204
3.6
0.1
700.
90.
333
70.
4<
0.1
254
0.4
<0.
171
1.6
<0.
133
90.
8<
0.1
255
0.7
<0.
172
0.1
0.1
256
0.2
<0.
173
0.1
<0.
192
0.9
<0.
125
7<
0.1
<0.
174
0.3
<0.
193
1.1
<0.
125
80.
2<
0.1
750.
5<
0.1
940.
2<
0.1
301
0.4
0.1
761.
9<
0.1
102
0.2
<0.
1
770.
2<
0.1
103
0.1
<0.
135
0.4
<0.
178
0.4
<0.
110
40.
6<
0.1
391.
1<
0.1
791.
7<
0.1
110
0.3
<0.
145
0.4
<0.
180
<0.
1<
0.1
111
0.3
<0.
146
0.3
<0.
181
0.2
<0.
111
20.
4<
0.1
476.
3<
0.1
820.
9<
0.1
359
1.4
<0.
148
0.6
0.2
833.
5<
0.1
360
3.6
0.3
205
0.8
<0.
113
70.
3<
0.1
361
1.3
<0.
1
206
1.4
<0.
121
30.
8<
0.1
207
1<
0.1
214
2.3
<0.
127
40.
1<
0.1
208
0.9
<0.
122
20.
4<
0.1
275
<0.
1<
0.1
209
2.1
<0.
122
40.
7<
0.1
283
0.2
<0.
121
10.
2<
0.1
259
0.9
<0.
128
40.
30.
721
50.
7<
0.1
260
0.9
<0.
128
50.
40.
121
60.
2<
0.1
261
10.
128
60.
2<
0.1
217
0.2
<0.
126
23.
9<
0.1
287
0.9
0.8
218
1.5
0.1
263
2.3
<0.
128
8<
0.1
0.1
219
0.2
<0.
126
41
<0.
128
90.
3<
0.1
220
0.8
<0.
126
54.
2<
0.1
290
0.1
<0.
1
269
0.9
<0.
129
10.
1<
0.1
101
0.7
<0.
135
60.
2<
0.1
292
0.3
<0.
135
00.
6<
0.1
357
0.4
<0.
129
30.
2<
0.1
294
0.3
0.1
642.
3<
0.1
160.
20.
129
50.
3<
0.1
653.
1<
0.1
171
<0.
129
6<
0.1
<0.
1
< ������
�:�8������
;=�����
���;�����
�����;������
��������
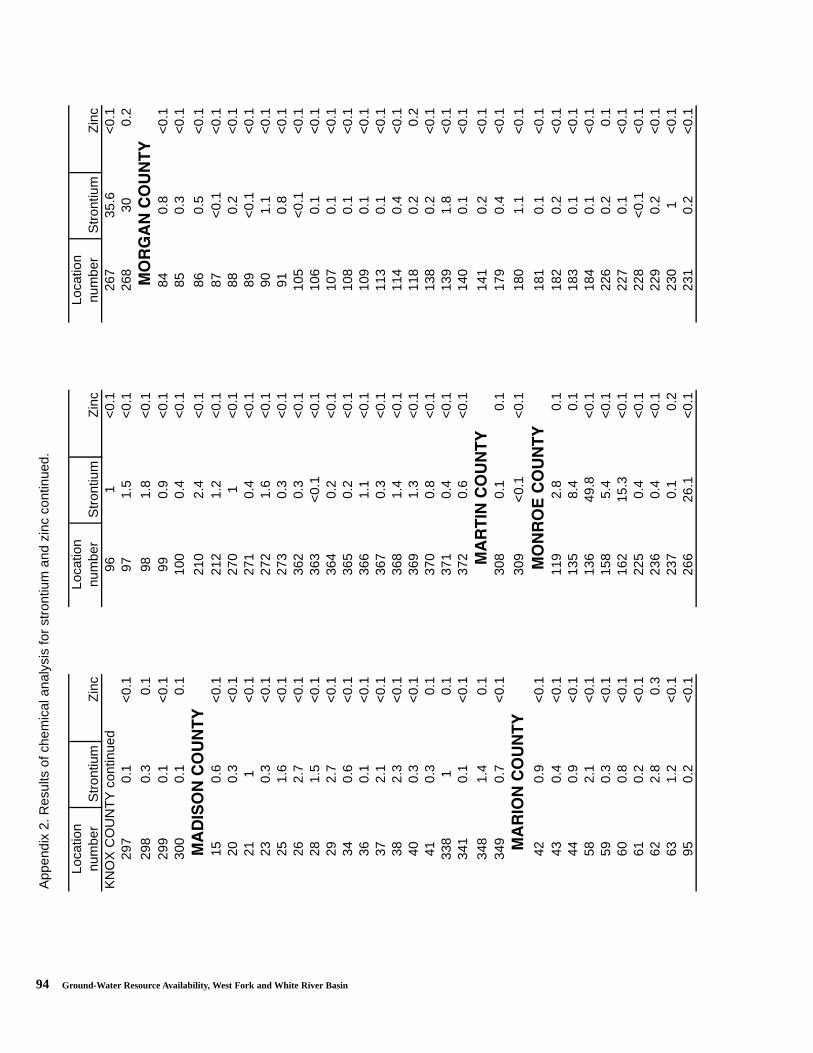
94 Ground-Water Resource Availability, West Fork and White River Basin
App
endi
x 2.
Res
ults
of c
hem
ical
ana
lysi
s fo
r st
ront
ium
and
zin
c co
ntin
ued.
Loca
tion
num
ber
Str
ontiu
mZ
inc
Loca
tion
num
ber
Str
ontiu
mZ
inc
Loca
tion
num
ber
Str
ontiu
mZ
inc
KN
OX
CO
UN
TY
con
tinue
d96
1<
0.1
267
35.6
<0.
129
70.
1<
0.1
971.
5<
0.1
268
300.
2
298
0.3
0.1
981.
8<
0.1
299
0.1
<0.
199
0.9
<0.
184
0.8
<0.
130
00.
10.
110
00.
4<
0.1
850.
3<
0.1
210
2.4
<0.
186
0.5
<0.
115
0.6
<0.
121
21.
2<
0.1
87<
0.1
<0.
120
0.3
<0.
127
01
<0.
188
0.2
<0.
121
1<
0.1
271
0.4
<0.
189
<0.
1<
0.1
230.
3<
0.1
272
1.6
<0.
190
1.1
<0.
125
1.6
<0.
127
30.
3<
0.1
910.
8<
0.1
262.
7<
0.1
362
0.3
<0.
110
5<
0.1
<0.
128
1.5
<0.
136
3<
0.1
<0.
110
60.
1<
0.1
292.
7<
0.1
364
0.2
<0.
110
70.
1<
0.1
340.
6<
0.1
365
0.2
<0.
110
80.
1<
0.1
360.
1<
0.1
366
1.1
<0.
110
90.
1<
0.1
372.
1<
0.1
367
0.3
<0.
111
30.
1<
0.1
382.
3<
0.1
368
1.4
<0.
111
40.
4<
0.1
400.
3<
0.1
369
1.3
<0.
111
80.
20.
241
0.3
0.1
370
0.8
<0.
113
80.
2<
0.1
338
10.
137
10.
4<
0.1
139
1.8
<0.
134
10.
1<
0.1
372
0.6
<0.
114
00.
1<
0.1
348
1.4
0.1
141
0.2
<0.
134
90.
7<
0.1
308
0.1
0.1
179
0.4
<0.
1
309
<0.
1<
0.1
180
1.1
<0.
1
420.
9<
0.1
181
0.1
<0.
143
0.4
<0.
111
92.
80.
118
20.
2<
0.1
440.
9<
0.1
135
8.4
0.1
183
0.1
<0.
158
2.1
<0.
113
649
.8<
0.1
184
0.1
<0.
159
0.3
<0.
115
85.
4<
0.1
226
0.2
0.1
600.
8<
0.1
162
15.3
<0.
122
70.
1<
0.1
610.
2<
0.1
225
0.4
<0.
122
8<
0.1
<0.
162
2.8
0.3
236
0.4
<0.
122
90.
2<
0.1
631.
2<
0.1
237
0.1
0.2
230
1<
0.1
950.
2<
0.1
266
26.1
<0.
123
10.
2<
0.1
:�9������
:���������
:��������
:���������
:�������
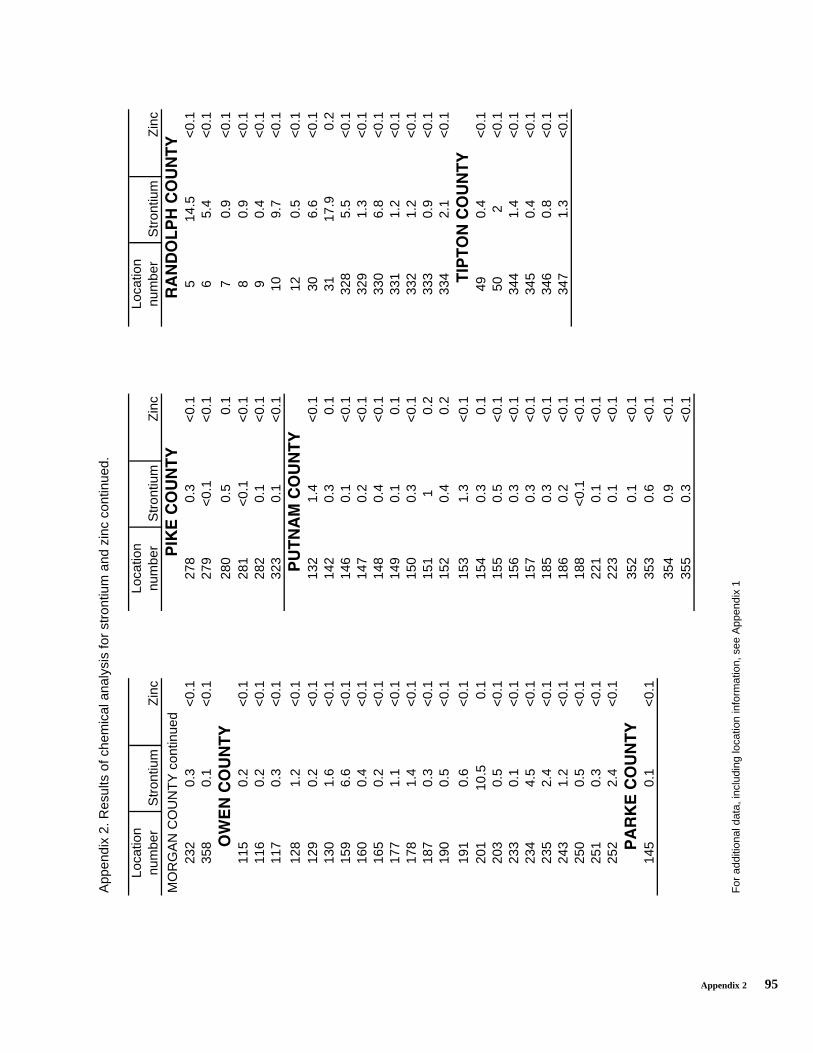
Appendix 2 95
App
endi
x 2.
Res
ults
of c
hem
ical
ana
lysi
s fo
r st
ront
ium
and
zin
c co
ntin
ued.
Loca
tion
num
ber
Str
ontiu
mZ
inc
Loca
tion
num
ber
Str
ontiu
mZ
inc
Loca
tion
num
ber
Str
ontiu
mZ
inc
MO
RG
AN
CO
UN
TY
con
tinue
d23
20.
3<
0.1
278
0.3
<0.
15
14.5
<0.
135
80.
1<
0.1
279
<0.
1<
0.1
65.
4<
0.1
280
0.5
0.1
70.
9<
0.1
115
0.2
<0.
128
1<
0.1
<0.
18
0.9
<0.
111
60.
2<
0.1
282
0.1
<0.
19
0.4
<0.
111
70.
3<
0.1
323
0.1
<0.
110
9.7
<0.
1
128
1.2
<0.
112
0.5
<0.
112
90.
2<
0.1
132
1.4
<0.
130
6.6
<0.
113
01.
6<
0.1
142
0.3
0.1
3117
.90.
215
96.
6<
0.1
146
0.1
<0.
132
85.
5<
0.1
160
0.4
<0.
114
70.
2<
0.1
329
1.3
<0.
116
50.
2<
0.1
148
0.4
<0.
133
06.
8<
0.1
177
1.1
<0.
114
90.
10.
133
11.
2<
0.1
178
1.4
<0.
115
00.
3<
0.1
332
1.2
<0.
118
70.
3<
0.1
151
10.
233
30.
9<
0.1
190
0.5
<0.
115
20.
40.
233
42.
1<
0.1
191
0.6
<0.
115
31.
3<
0.1
201
10.5
0.1
154
0.3
0.1
490.
4<
0.1
203
0.5
<0.
115
50.
5<
0.1
502
<0.
123
30.
1<
0.1
156
0.3
<0.
134
41.
4<
0.1
234
4.5
<0.
115
70.
3<
0.1
345
0.4
<0.
123
52.
4<
0.1
185
0.3
<0.
134
60.
8<
0.1
243
1.2
<0.
118
60.
2<
0.1
347
1.3
<0.
125
00.
5<
0.1
188
<0.
1<
0.1
251
0.3
<0.
122
10.
1<
0.1
252
2.4
<0.
122
30.
1<
0.1
352
0.1
<0.
114
50.
1<
0.1
353
0.6
<0.
1
354
0.9
<0.
135
50.
3<
0.1
For
add
ition
al d
ata,
incl
udin
g lo
catio
n in
form
atio
n, s
ee A
ppen
dix
1
���8> �����
��>������
>��;������
7������
>�;������
>���:�����
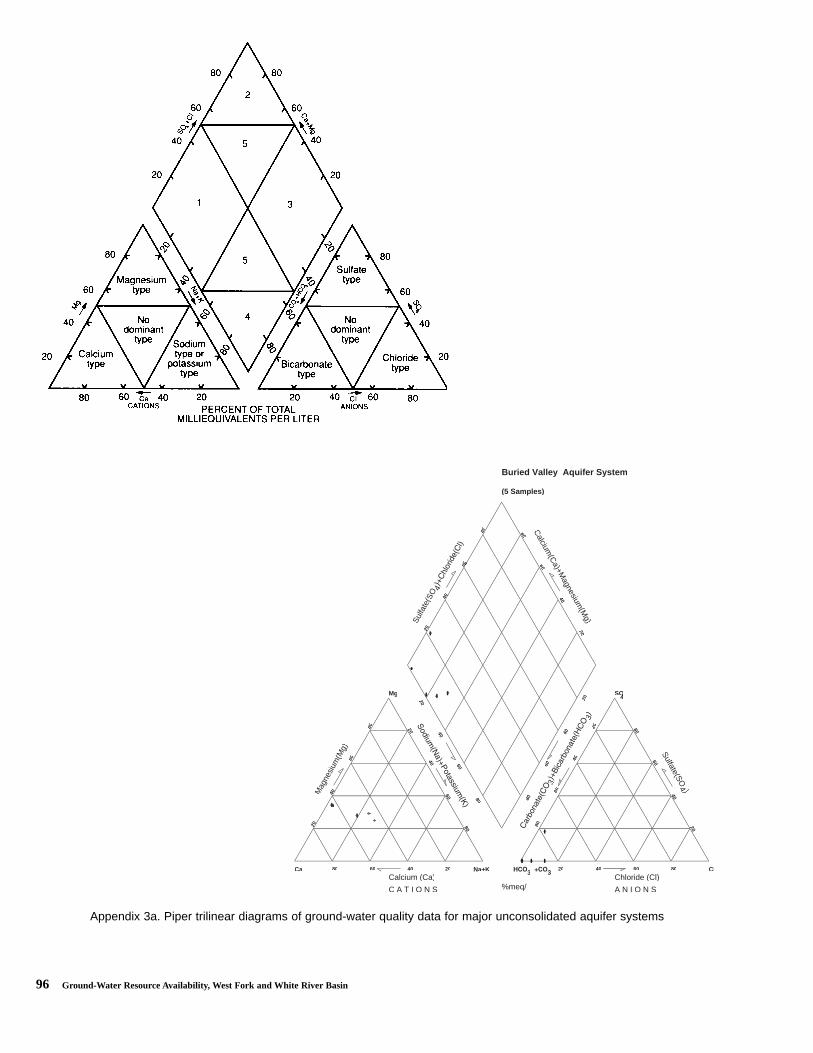
96 Ground-Water Resource Availability, West Fork and White River Basin
Buried Valley Aquifer System
(5 Samples)
C A T I O N S A N I O N S%meq/l
Na+K 3 3 Cl
Mg SO4O4O
CaCalcium (Ca) Chloride (Cl)
Sulfa
te(S
O 4
Calcium
(Ca)+M
agnesium(M
g)
3
3)
Sulfate(SO4 )M
agne
sium
(Mg)
80 60 40 20 20 40 60 80
80
60
40
20
20
40
60
80
20
40
60
80
80
60
40
20
20
4040
60606
80
20
40
60
80
80
60
40
20
80
60
40
20
Appendix 3a. Piper trilinear diagrams of ground-water quality data for major unconsolidated aquifer systems
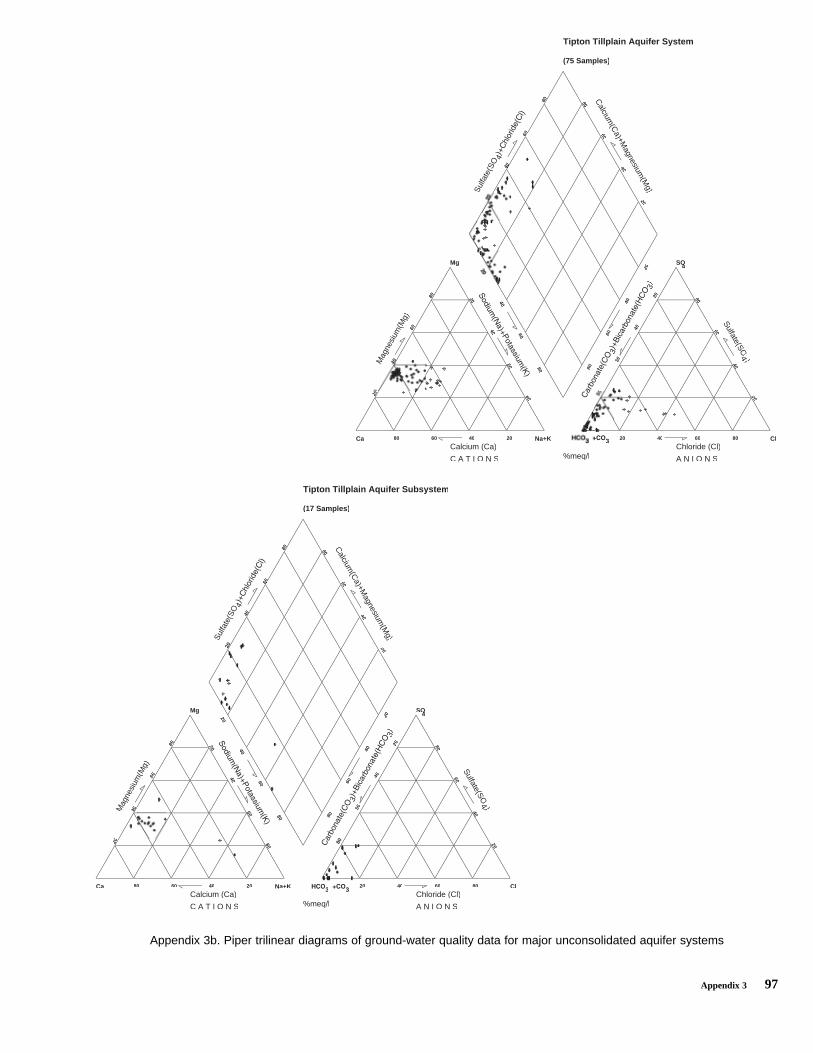
Appendix 3 97
Tipton Tillplain Aquifer System
(75 Samples)
C A T I O N S A N I O N S%meq/l
Na+K Cl
Mg SO4O4O
CaCalcium (Ca) Chloride (Cl)
Sulfa
te(S
O 4
Calcium
(Ca)+M
agnesium(M
g)
3
3)
Sulfate(SO4 )M
agne
sium
(Mg)
80 60 40 20 20 40 60 80
0
60
40
20
20
40
60
80
20
60
80
80
60
40
20
4040
60606
80
20
40
60
80
80
60
40
80
60
40
20
3
Tipton Tillplain Aquifer Subsystem
(17 Samples)
C A T I O N S A N I O N S%meq/l
Na+K Cl
Mg SO4O4O
CaCalcium (Ca) Chloride (Cl)
Sulfa
te(S
O 4
Calcium
(Ca)+M
agnesium(M
g)
3
3)
Sulfate(SO4 )M
agne
sium
(Mg)
80 60 40 20 20 40 60 80
60
40
20
20
40
60
80
20
40
60
80
80
60
40
20
4040
60606
80
20
40
60
80
80
60
40
20
80
60
40
20
3 3
Appendix 3b. Piper trilinear diagrams of ground-water quality data for major unconsolidated aquifer systems
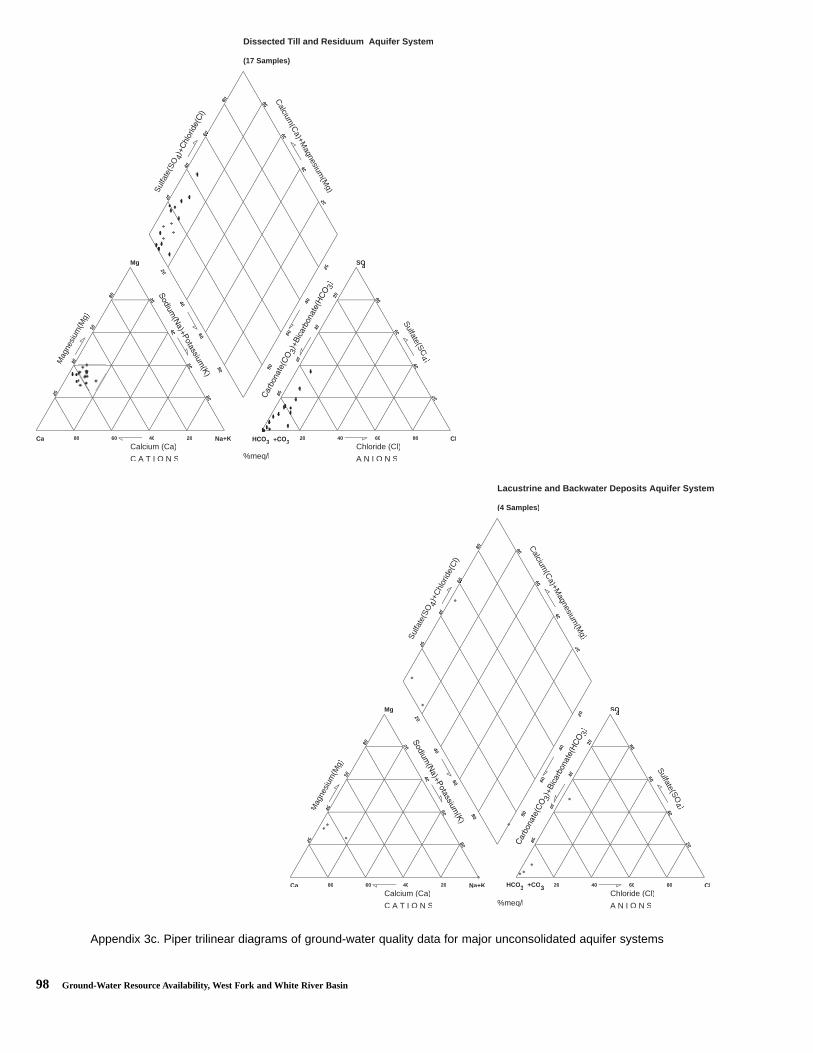
98 Ground-Water Resource Availability, West Fork and White River Basin
Dissected Till and Residuum Aquifer System
(17 Samples)
C A T I O N S A N I O N S%meq/l
Na+K Cl
Mg SO4O4O
CaCalcium (Ca) Chloride (Cl)
Sulfa
te(S
O 4
Calcium
(Ca)+M
agnesium(M
g)
3
3)
Sulfate(SO4 )M
agne
sium
(Mg)
80 60 40 20 20 40 60 80
80
60
40
20
20
40
60
80
20
40
60
80
80
60
40
20
20
4040
60606
80
20
40
60
80
80
60
40
20
80
60
40
20
3 3
Lacustrine and Backwater Deposits Aquifer System
(4 Samples)
C A T I O N S A N I O N S%meq/l
Na+K Cl
Mg SO4O4O
CaCalcium (Ca) Chloride (Cl)
Sulfa
te(S
O 4)+
Chl
orid
e(C
l)
Calcium
(Ca)+M
agnesium(M
g)
3
3)
Sulfate(SO4 )M
agne
sium
(Mg)
80 60 40 20 20 40 60 80
80
60
40
20
20
40
60
80
20
40
60
80
80
60
40
20
20
4040
60606
80
20
40
60
80
80
60
40
20
80
60
40
20
HCO3 +CO3
Appendix 3c. Piper trilinear diagrams of ground-water quality data for major unconsolidated aquifer systems
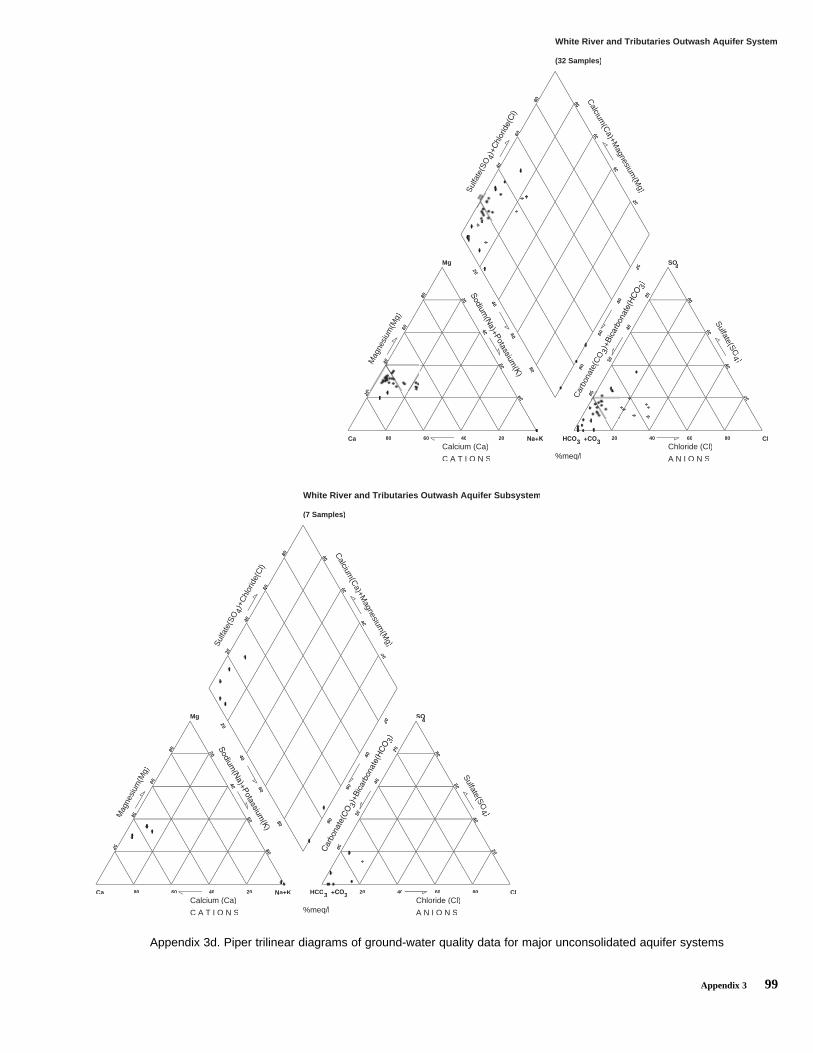
Appendix 3 99
White River and Tributaries Outwash Aquifer System
(32 Samples)
C A T I O N S A N I O N S%meq/l
Cl
Mg SO4
O4
O
CaCalcium (Ca) Chloride (Cl)
Sulfa
te(S
O 4
Calcium
(Ca)+M
agnesium(M
g)
Car
bona
te(C
O 3
3)
Sulfate(SO4 )M
agne
sium
(Mg)
80 60 40 20 20 40 60 80
80
60
40
20
20
40
60
80
20
40
60
80
80
60
40
20
2
4040
60606
80
20
40
60
80
80
60
40
20
80
60
40
20
3 3
White River and Tributaries Outwash Aquifer Subsystem
(7 Samples)
C A T I O N S A N I O N S%meq/l
Na+K Cl
Mg SO4O4O
CaCalcium (Ca) Chloride (Cl)
Sulfa
te(S
O 4)+
Chl
orid
e(C
l)
Calcium
(Ca)+M
agnesium(M
g)
3
3)
Sulfate(SO4 )M
agne
sium
(Mg)
80 60 40 20 20 40 60 80
80
60
40
20
20
40
60
80
20
40
60
80
80
60
40
20
20
4040
60606
80
20
40
60
80
80
60
40
20
80
60
40
20
HCO3 3
Appendix 3d. Piper trilinear diagrams of ground-water quality data for major unconsolidated aquifer systems
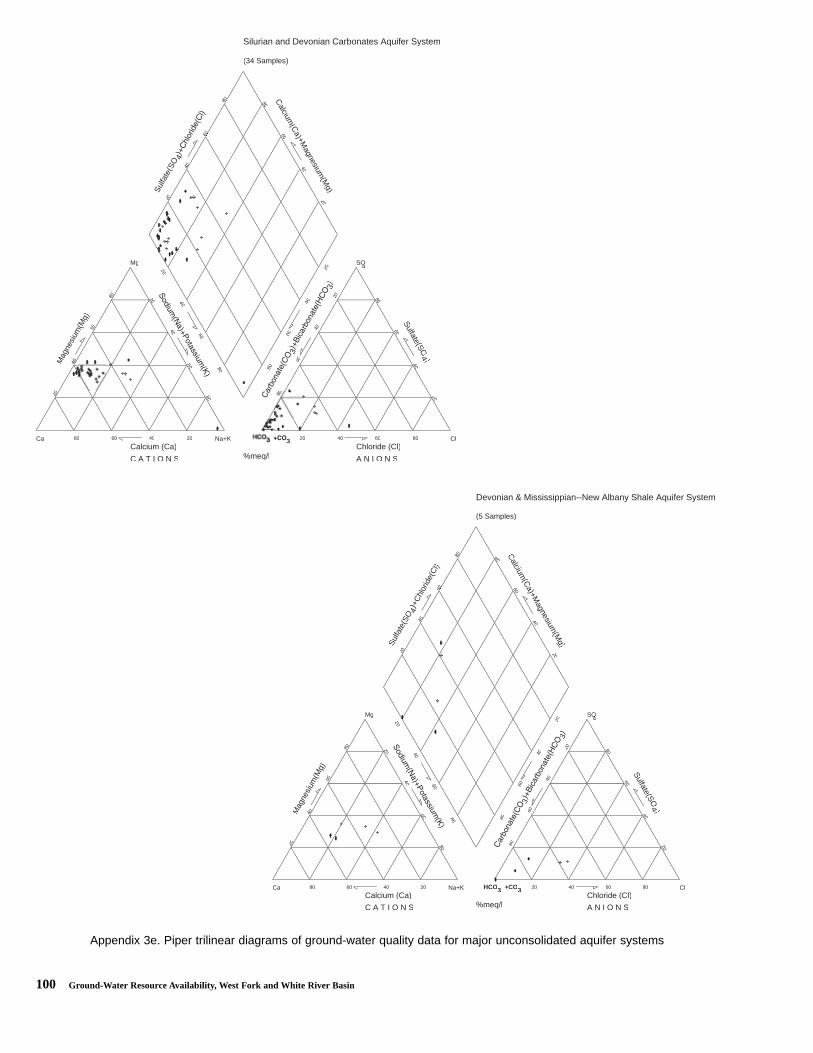
100 Ground-Water Resource Availability, West Fork and White River Basin
Silurian and Devonian Carbonates Aquifer System
(34 Samples)
C A T I O N S A N I O N S%meq/l
Na+K Cl
Mg SO4O4O
CaCalcium (Ca) Chloride (Cl)
Sulfa
te(S
O 4
Calcium
(Ca)+M
agnesium(M
g)
3
3)
Sulfate(SO4 )M
agne
sium
(Mg)
80 60 40 20 20 40 60 80
0
60
40
20
20
40
60
80
20
60
80
80
60
40
20
20
4040
60606
80
20
40
60
80
80
60
40
20
80
60
40
20
3
Devonian & Mississippian--New Albany Shale Aquifer System
(5 Samples)
C A T I O N S A N I O N S%meq/l
Na+K Cl
Mg SO4O4O
CaCalcium (Ca) Chloride (Cl)
Sulfa
te(S
O 4)+
Chl
orid
e(C
l)
Calcium
(Ca)+M
agnesium(M
g)
3
3)
Sulfate(SO4 )M
agne
sium
(Mg)
80 60 40 20 20 40 60 80
80
60
40
20
20
40
60
80
20
40
60
80
80
60
40
20
20
4040
60606
80
20
40
60
80
80
60
40
20
80
60
40
20
HCO3 +CO3
Appendix 3e. Piper trilinear diagrams of ground-water quality data for major unconsolidated aquifer systems
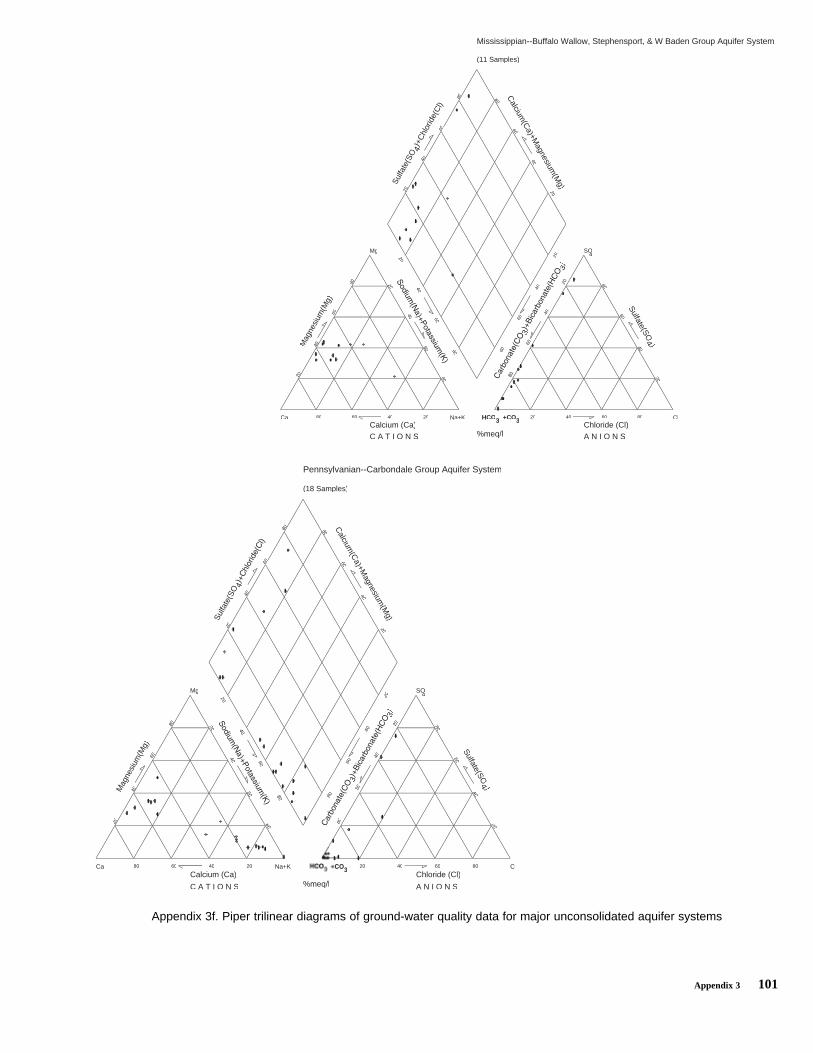
Appendix 3 101
Mississippian--Buffalo Wallow, Stephensport, & W Baden Group Aquifer System
(11 Samples)
C A T I O N S A N I O N S%meq/l
Na+K Cl
Mg SO4O4O
CaCalcium (Ca) Chloride (Cl)
Sulfa
te(S
O 4)+
Chl
orid
e(C
l)
Calcium
(Ca)+M
agnesium(M
g)
3
3)
Sulfate(SO4 )M
agne
sium
(Mg)
80 60 40 20 20 40 60 80
60
40
20
20
40
60
80
20
60
80
80
60
40
20
20
4040
60606
80
20
40
60
80
80
60
40
20
80
60
40
20
HCO3 +CO3
Pennsylvanian--Carbondale Group Aquifer System
(18 Samples)
C A T I O N S A N I O N S%meq/l
Na+K Cl
Mg SO4O4O
CaCalcium (Ca) Chloride (Cl)
Sulfa
te(S
O 4
Calcium
(Ca)+M
agnesium(M
g)
3
3)
Sulfate(SO4 )M
agne
sium
(Mg)
80 60 40 20 20 40 60 80
80
60
40
20
20
40
60
80
20
40
60
80
80
60
40
20
20
4040
60606
80
20
40
60
80
80
60
40
20
80
60
40
20
3
Appendix 3f. Piper trilinear diagrams of ground-water quality data for major unconsolidated aquifer systems
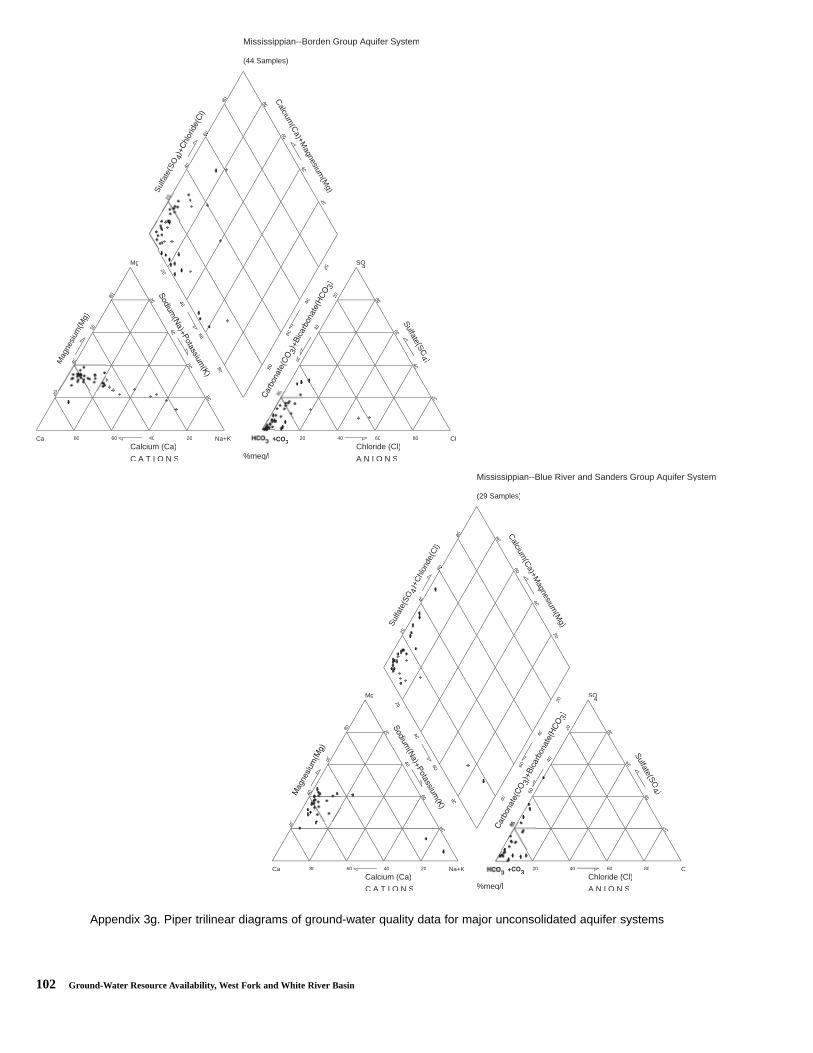
102 Ground-Water Resource Availability, West Fork and White River Basin
Mississippian--Borden Group Aquifer System
(44 Samples)
C A T I O N S A N I O N S%meq/l
Na+K Cl
Mg SO4O4O
CaCalcium (Ca) Chloride (Cl)
Sulfa
te(S
O 4
Calcium
(Ca)+M
agnesium(M
g)
3
3)
Sulfate(SO4 )M
agne
sium
(Mg)
80 60 40 20 20 40 60 80
0
60
40
20
20
40
60
80
20
40
60
80
80
60
40
20
4040
60606
80
20
40
60
80
80
60
40
20
80
60
40
20
3
Mississippian--Blue River and Sanders Group Aquifer System
(29 Samples)
C A T I O N S A N I O N S%meq/l
Na+K Cl
Mg SO4O4O
CaCalcium (Ca) Chloride (Cl)
Sulfa
te(S
O 4)+
Chl
orid
e(C
l)
Calcium
(Ca)+M
agnesium(M
g)
3
3)
Sulfate(SO4 )
80 60 40 20 20 40 60 80
60
40
20
20
40
60
80
20
60
80
80
60
40
20
20
4040
60606
80
20
40
60
80
80
60
40
20
80
60
40
20
3
Appendix 3g. Piper trilinear diagrams of ground-water quality data for major unconsolidated aquifer systems
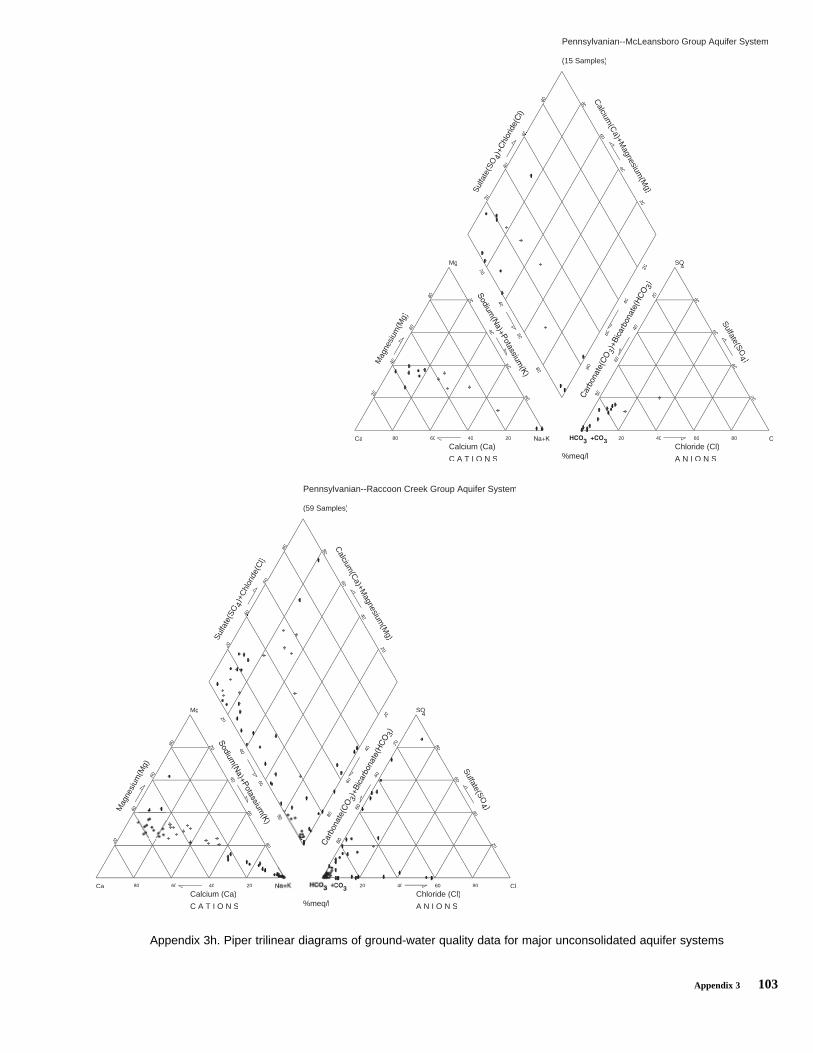
Appendix 3 103
Pennsylvanian--McLeansboro Group Aquifer System
(15 Samples)
C A T I O N S A N I O N S%meq/l
Cl
Mg SO4O4O
CaCalcium (Ca) Chloride (Cl)
Sulfa
te(S
O 4
Calcium
(Ca)+M
agnesium(M
g)
3
3)
Sulfate(SO4 )M
agne
sium
(Mg)
80 60 40 20 20 40 60 80
80
60
40
20
20
40
60
80
20
40
60
80
80
60
40
20
20
4040
60606
80
20
40
60
80
80
60
40
20
80
60
40
20
3
Pennsylvanian--Raccoon Creek Group Aquifer System
(59 Samples)
C A T I O N S A N I O N S%meq/l
Cl
Mg SO4O4O
CaCalcium (Ca) Chloride (Cl)
Sulfa
te(S
O 4)+
Chl
orid
e(C
l)
Calcium
(Ca)+M
agnesium(M
g)
3
3)
Sulfate(SO4 )M
agne
sium
(Mg)
80 60 40 20 20 40 80
40
20
20
40
60
80
20
40
60
80
80
60
40
20
20
4040
60606
80
20
40
60
80
80
60
40
20
80
60
40
20
Appendix 3h. Piper trilinear diagrams of ground-water quality data for major unconsolidated aquifer systems
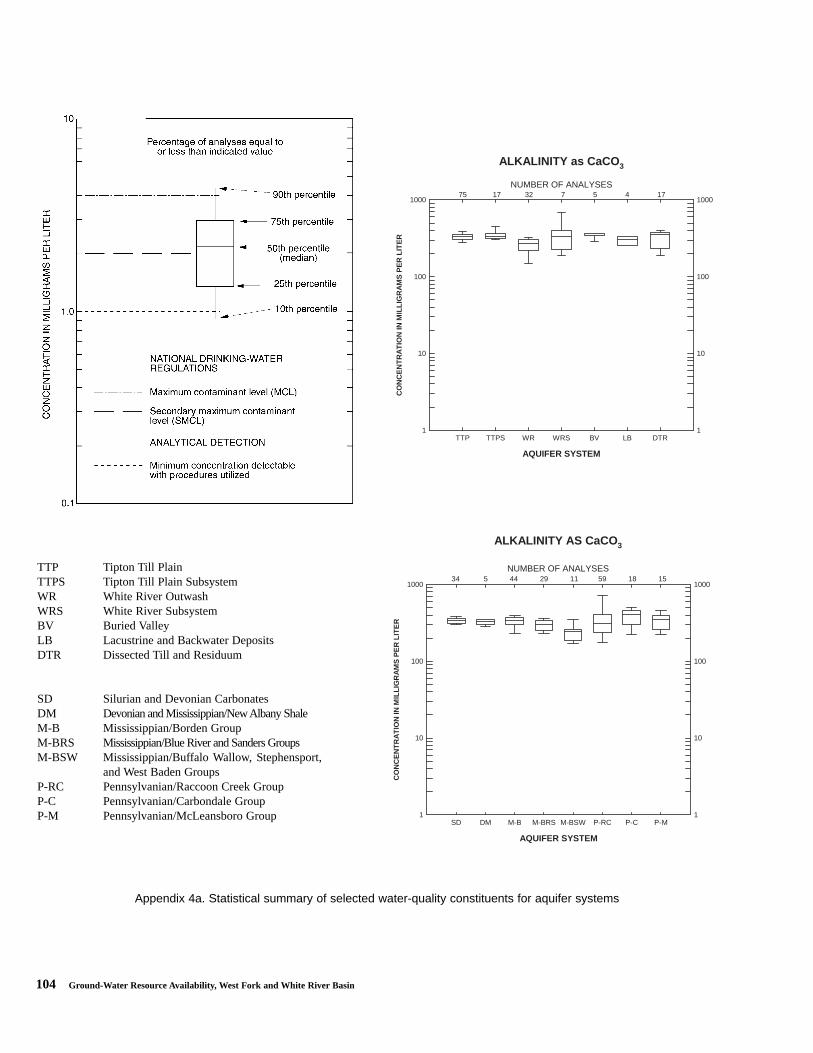
104 Ground-Water Resource Availability, West Fork and White River Basin
ALKALINITY as CaCO3
NUMBER OF ANALYSES
AQUIFER SYSTEM
TTP TTPS WR WRS BV LB DTR
CO
NC
EN
TR
AT
ION
INM
ILL
IGR
AM
SP
ER
LIT
ER
1
10
100
1000
1
10
100
100075 17 32 7 5 4 17
ALKALINITY AS CaCO3
NUMBER OF ANALYSES
AQUIFER SYSTEM
SD DM M-B M-BRS M-BSW P-RC P-C P-M
34 5 44 29 11 59 18 15
CO
NC
EN
TR
AT
ION
IN M
ILL
IGR
AM
S P
ER
LIT
ER
1
10
100
1000
1
10
100
1000
Appendix 4a. Statistical summary of selected water-quality constituents for aquifer systems
TTP Tipton Till PlainTTPS Tipton Till Plain SubsystemWR White River OutwashWRS White River SubsystemBV Buried ValleyLB Lacustrine and Backwater DepositsDTR Dissected Till and Residuum
SD Silurian and Devonian CarbonatesDM Devonian and Mississippian/New Albany ShaleM-B Mississippian/Borden GroupM-BRS Mississippian/Blue River and Sanders GroupsM-BSW Mississippian/Buffalo Wallow, Stephensport,
and West Baden GroupsP-RC Pennsylvanian/Raccoon Creek GroupP-C Pennsylvanian/Carbondale GroupP-M Pennsylvanian/McLeansboro Group
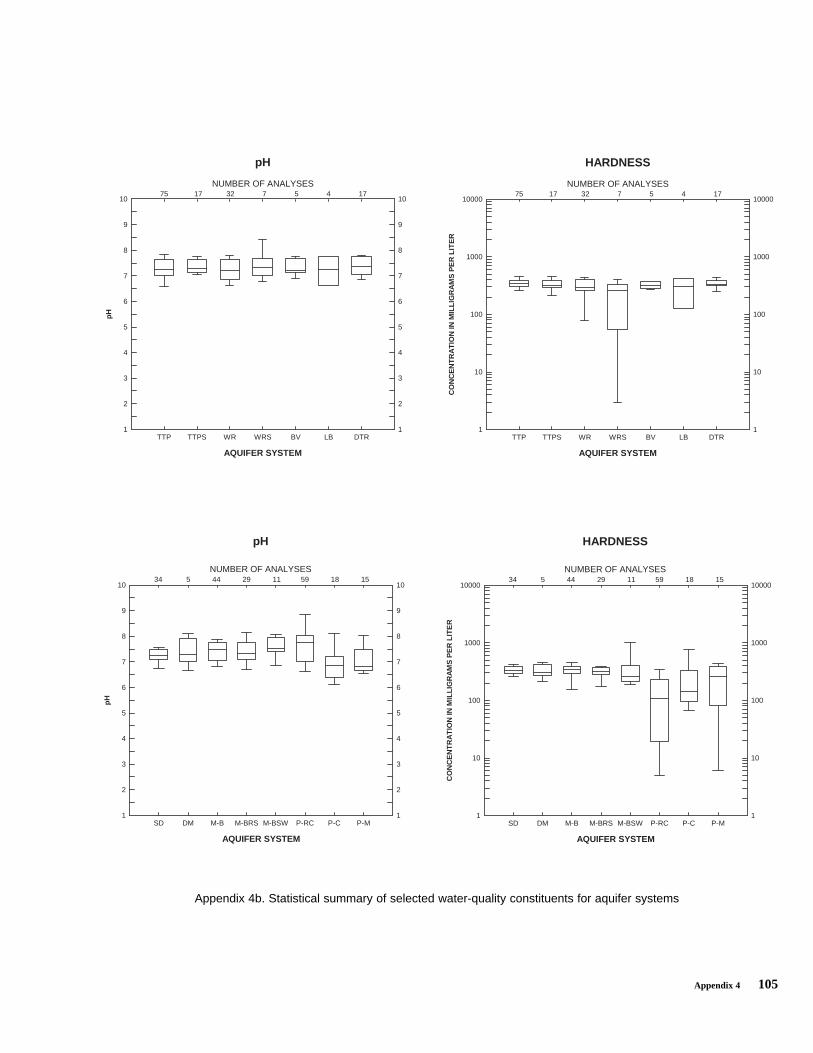
Appendix 4 105
pH
NUMBER OF ANALYSES
AQUIFER SYSTEM
TTP TTPS WR WRS BV LB DTR
pH
1
2
3
4
5
6
7
8
9
10
1
2
3
4
5
6
7
8
9
1075 17 32 7 5 4 17
HARDNESS
NUMBER OF ANALYSES
AQUIFER SYSTEM
TTP TTPS WR WRS BV LB DTR
CO
NC
EN
TR
AT
ION
INM
ILL
IGR
AM
SP
ER
LIT
ER
1
10
100
1000
10000
1
10
100
1000
1000075 17 32 7 5 4 17
pH
NUMBER OF ANALYSES
AQUIFER SYSTEM
SD DM M-B M-BRS M-BSW P-RC P-C P-M
34 5 44 29 11 59 18 15
pH
1
2
3
4
5
6
7
8
9
10
1
2
3
4
5
6
7
8
9
10
HARDNESS
NUMBER OF ANALYSES
AQUIFER SYSTEM
SD DM M-B M-BRS M-BSW P-RC P-C P-M
34 5 44 29 11 59 18 15
CO
NC
EN
TR
AT
ION
IN M
ILL
IGR
AM
S P
ER
LIT
ER
1
10
100
1000
10000
1
10
100
1000
10000
Appendix 4b. Statistical summary of selected water-quality constituents for aquifer systems
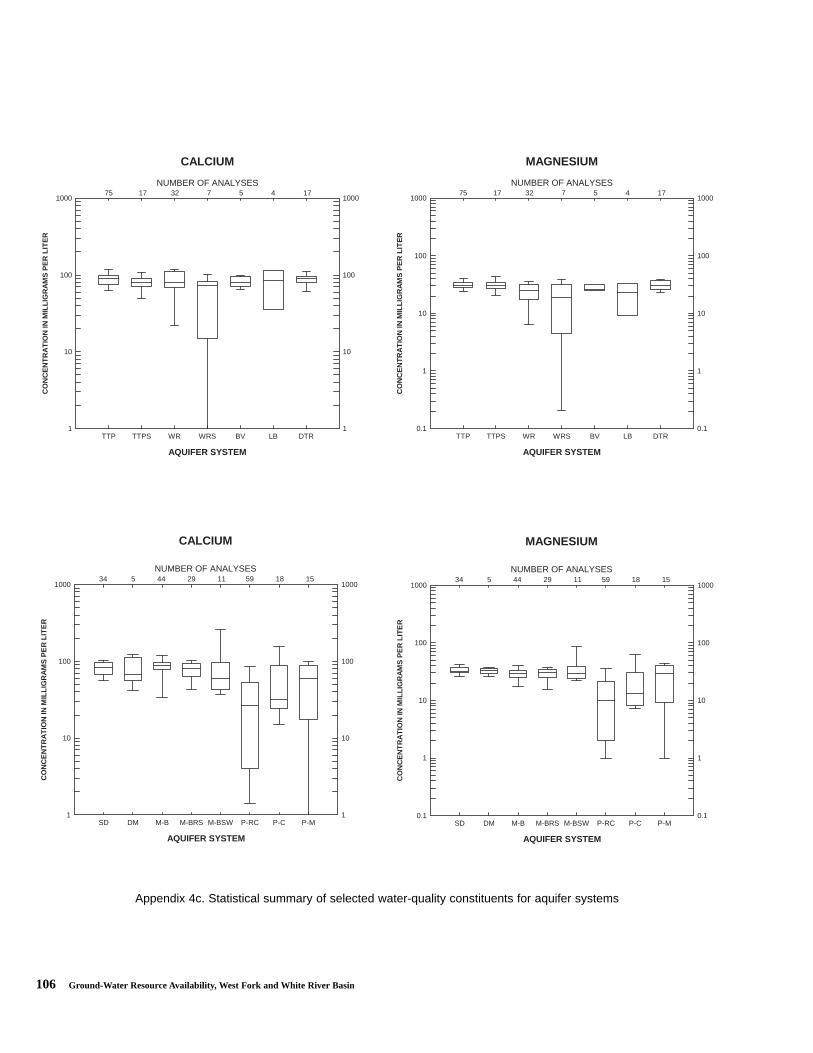
106 Ground-Water Resource Availability, West Fork and White River Basin
CALCIUM
NUMBER OF ANALYSES
AQUIFER SYSTEM
TTP TTPS WR WRS BV LB DTR
CO
NC
EN
TR
AT
ION
INM
ILL
IGR
AM
SP
ER
LIT
ER
1
10
100
1000
1
10
100
100075 17 32 7 5 4 17
MAGNESIUM
NUMBER OF ANALYSES
AQUIFER SYSTEM
TTP TTPS WR WRS BV LB DTR
CO
NC
EN
TR
AT
ION
INM
ILL
IGR
AM
SP
ER
LIT
ER
0.1
1
10
100
1000
0.1
1
10
100
100075 17 32 7 5 4 17
CALCIUM
NUMBER OF ANALYSES
AQUIFER SYSTEM
SD DM M-B M-BRS M-BSW P-RC P-C P-M
34 5 44 29 11 59 18 15
CO
NC
EN
TR
AT
ION
IN M
ILL
IGR
AM
S P
ER
LIT
ER
1
10
100
1000
1
10
100
1000
MAGNESIUM
NUMBER OF ANALYSES
AQUIFER SYSTEM
SD DM M-B M-BRS M-BSW P-RC P-C P-M
34 5 44 29 11 59 18 15
CO
NC
EN
TR
AT
ION
IN M
ILL
IGR
AM
S P
ER
LIT
ER
0.1
1
10
100
1000
0.1
1
10
100
1000
Appendix 4c. Statistical summary of selected water-quality constituents for aquifer systems
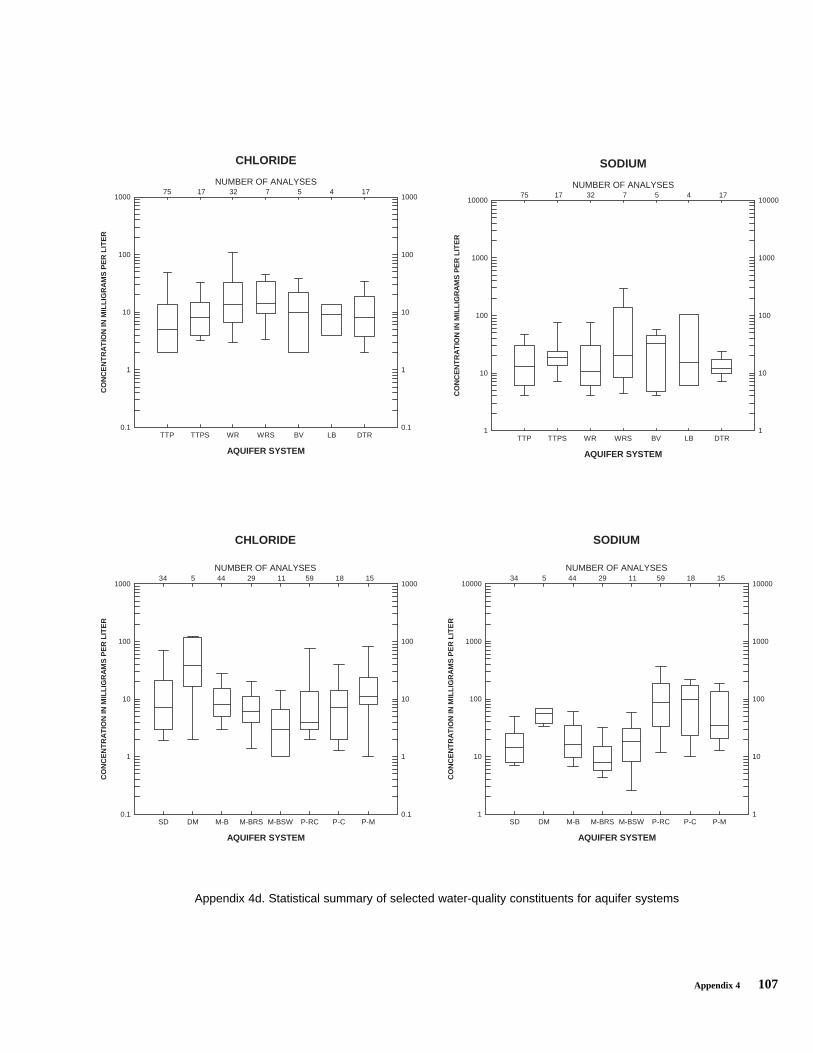
Appendix 4 107
CHLORIDE
NUMBER OF ANALYSES
AQUIFER SYSTEM
TTP TTPS WR WRS BV LB DTR
CO
NC
EN
TR
AT
ION
INM
ILL
IGR
AM
SP
ER
LIT
ER
0.1
1
10
100
1000
0.1
1
10
100
100075 17 32 7 5 4 17
SODIUM
NUMBER OF ANALYSES
AQUIFER SYSTEM
TTP TTPS WR WRS BV LB DTR
CO
NC
EN
TR
AT
ION
INM
ILL
IGR
AM
SP
ER
LIT
ER
1
10
100
1000
10000
1
10
100
1000
1000075 17 32 7 5 4 17
CHLORIDE
NUMBER OF ANALYSES
AQUIFER SYSTEM
SD DM M-B M-BRS M-BSW P-RC P-C P-M
34 5 44 29 11 59 18 15
CO
NC
EN
TR
AT
ION
IN M
ILL
IGR
AM
S P
ER
LIT
ER
0.1
1
10
100
1000
0.1
1
10
100
1000
SODIUM
NUMBER OF ANALYSES
AQUIFER SYSTEM
SD DM M-B M-BRS M-BSW P-RC P-C P-M
34 5 44 29 11 59 18 15
CO
NC
EN
TR
AT
ION
IN M
ILL
IGR
AM
S P
ER
LIT
ER
1
10
100
1000
10000
1
10
100
1000
10000
Appendix 4d. Statistical summary of selected water-quality constituents for aquifer systems
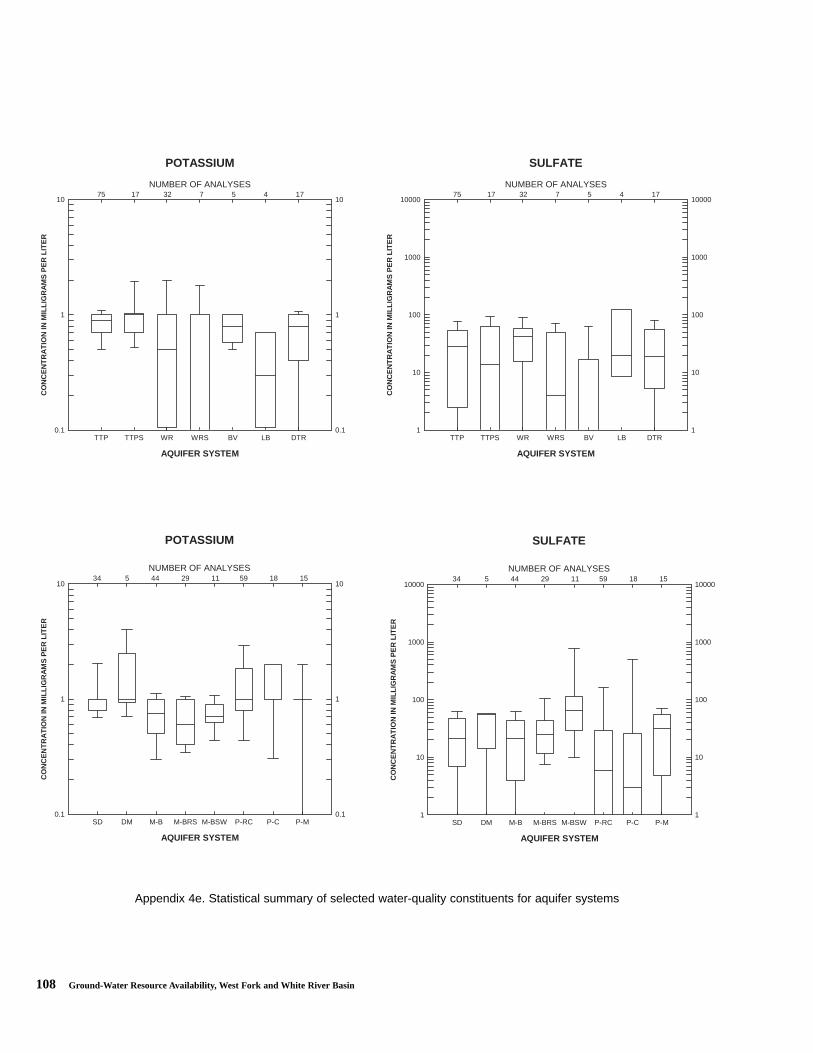
108 Ground-Water Resource Availability, West Fork and White River Basin
POTASSIUM
NUMBER OF ANALYSES
AQUIFER SYSTEM
TTP TTPS WR WRS BV LB DTR
CO
NC
EN
TR
AT
ION
INM
ILL
IGR
AM
SP
ER
LIT
ER
0.1
1
10
0.1
1
1075 17 32 7 5 4 17
SULFATE
NUMBER OF ANALYSES
AQUIFER SYSTEM
TTP TTPS WR WRS BV LB DTR
CO
NC
EN
TR
AT
ION
INM
ILL
IGR
AM
SP
ER
LIT
ER
1
10
100
1000
10000
1
10
100
1000
1000075 17 32 7 5 4 17
POTASSIUM
NUMBER OF ANALYSES
AQUIFER SYSTEM
SD DM M-B M-BRS M-BSW P-RC P-C P-M
34 5 44 29 11 59 18 15
CO
NC
EN
TR
AT
ION
IN M
ILL
IGR
AM
S P
ER
LIT
ER
0.1
1
10
0.1
1
10
SULFATE
NUMBER OF ANALYSES
AQUIFER SYSTEM
SD DM M-B M-BRS M-BSW P-RC P-C P-M
34 5 44 29 11 59 18 15
CO
NC
EN
TR
AT
ION
IN M
ILL
IGR
AM
S P
ER
LIT
ER
1
10
100
1000
10000
1
10
100
1000
10000
Appendix 4e. Statistical summary of selected water-quality constituents for aquifer systems
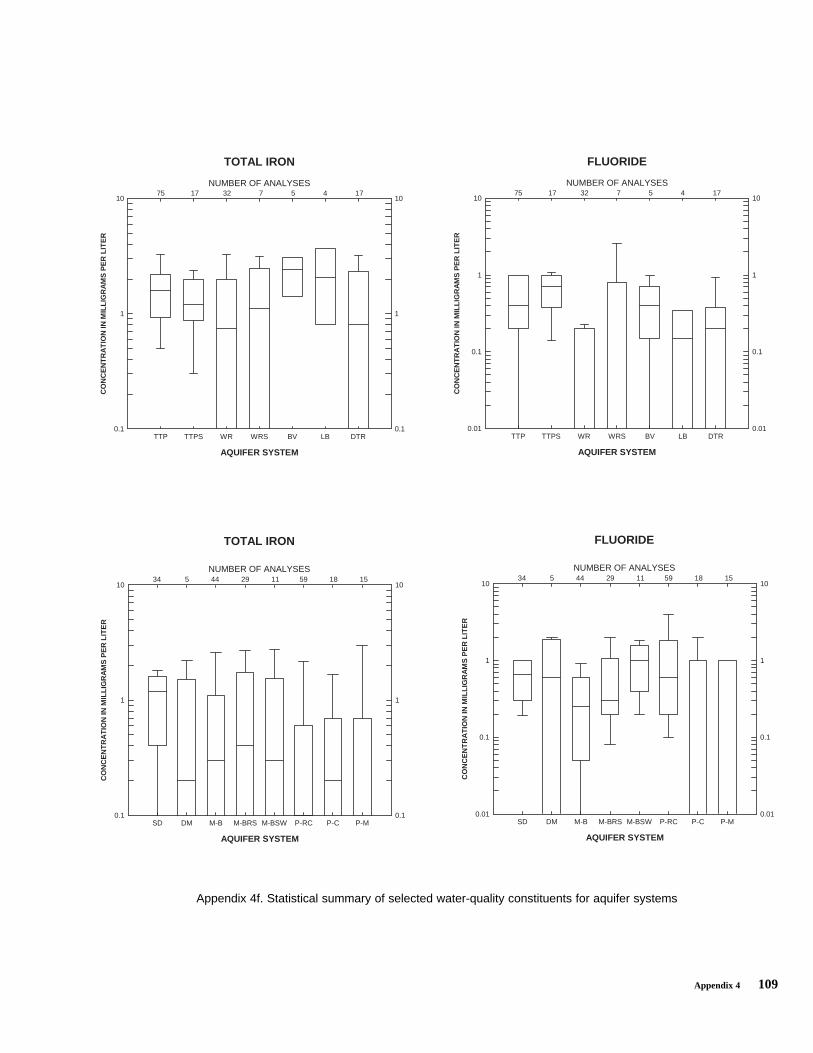
Appendix 4 109
TOTAL IRON
NUMBER OF ANALYSES
AQUIFER SYSTEM
TTP TTPS WR WRS BV LB DTR
CO
NC
EN
TR
AT
ION
INM
ILL
IGR
AM
SP
ER
LIT
ER
0.1
1
10
0.1
1
1075 17 32 7 5 4 17
FLUORIDE
NUMBER OF ANALYSES
AQUIFER SYSTEM
TTP TTPS WR WRS BV LB DTR
CO
NC
EN
TR
AT
ION
INM
ILL
IGR
AM
SP
ER
LIT
ER
0.01
0.1
1
10
0.01
0.1
1
1075 17 32 7 5 4 17
TOTAL IRON
NUMBER OF ANALYSES
AQUIFER SYSTEM
SD DM M-B M-BRS M-BSW P-RC P-C P-M
34 5 44 29 11 59 18 15
CO
NC
EN
TR
AT
ION
IN M
ILL
IGR
AM
S P
ER
LIT
ER
0.1
1
10
0.1
1
10
FLUORIDE
NUMBER OF ANALYSES
AQUIFER SYSTEM
SD DM M-B M-BRS M-BSW P-RC P-C P-M
34 5 44 29 11 59 18 15
CO
NC
EN
TR
AT
ION
IN M
ILL
IGR
AM
S P
ER
LIT
ER
0.01
0.1
1
10
0.01
0.1
1
10
Appendix 4f. Statistical summary of selected water-quality constituents for aquifer systems
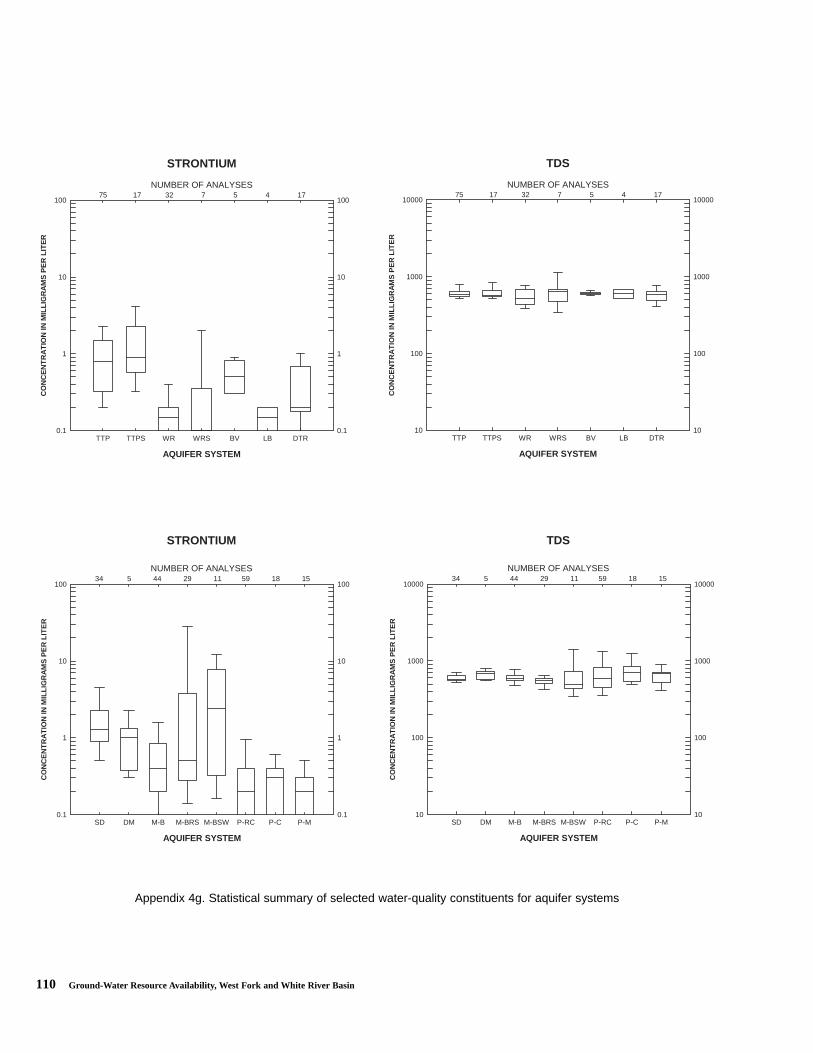
110 Ground-Water Resource Availability, West Fork and White River Basin
STRONTIUM
NUMBER OF ANALYSES
AQUIFER SYSTEM
TTP TTPS WR WRS BV LB DTR
CO
NC
EN
TR
AT
ION
INM
ILL
IGR
AM
SP
ER
LIT
ER
0.1
1
10
100
0.1
1
10
10075 17 32 7 5 4 17
TDS
NUMBER OF ANALYSES
AQUIFER SYSTEM
TTP TTPS WR WRS BV LB DTR
CO
NC
EN
TR
AT
ION
INM
ILL
IGR
AM
SP
ER
LIT
ER
10
100
1000
10000
10
100
1000
1000075 17 32 7 5 4 17
STRONTIUM
NUMBER OF ANALYSES
AQUIFER SYSTEM
SD DM M-B M-BRS M-BSW P-RC P-C P-M
34 5 44 29 11 59 18 15
CO
NC
EN
TR
AT
ION
IN M
ILL
IGR
AM
S P
ER
LIT
ER
0.1
1
10
100
0.1
1
10
100
TDS
NUMBER OF ANALYSES
AQUIFER SYSTEM
SD DM M-B M-BRS M-BSW P-RC P-C P-M
34 5 44 29 11 59 18 15
CO
NC
EN
TR
AT
ION
IN M
ILL
IGR
AM
S P
ER
LIT
ER
10
100
1000
10000
10
100
1000
10000
Appendix 4g. Statistical summary of selected water-quality constituents for aquifer systems
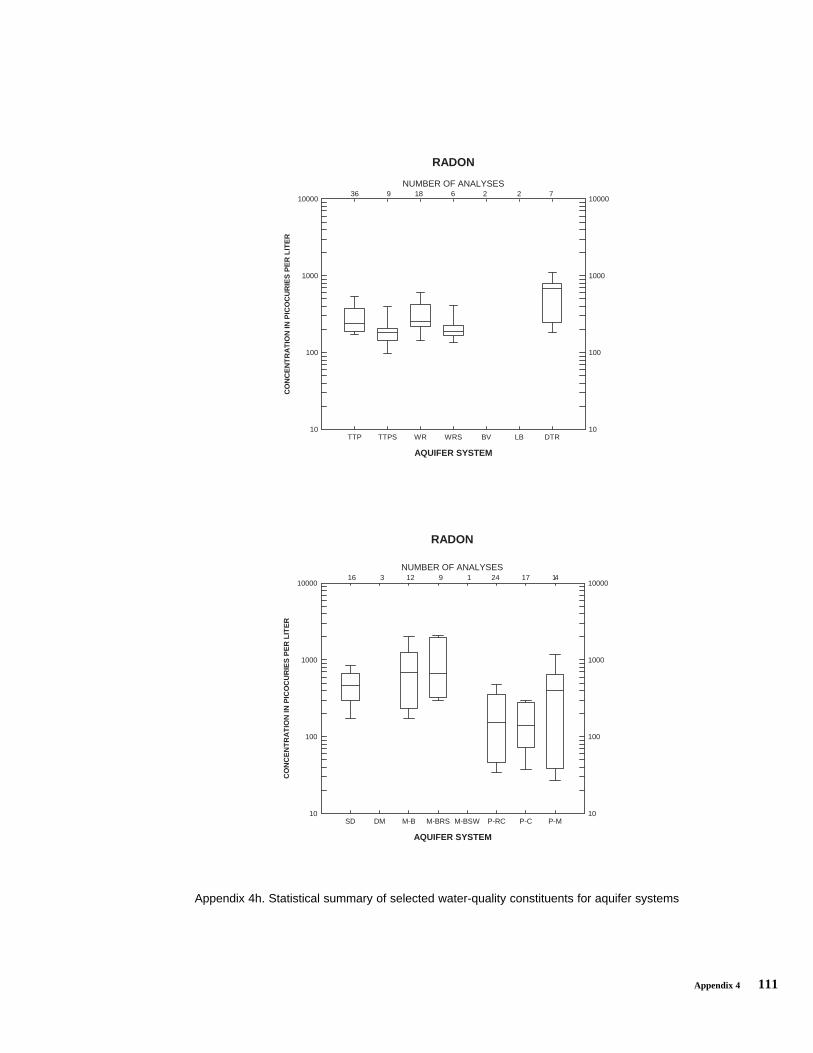
Appendix 4 111
RADON
NUMBER OF ANALYSES
AQUIFER SYSTEM
TTP TTPS WR WRS BV LB DTR
CO
NC
EN
TR
AT
ION
INP
ICO
CU
RIE
SP
ER
LIT
ER
10
100
1000
10000
10
100
1000
1000036 9 18 6 2 2 7
RADON
NUMBER OF ANALYSES
AQUIFER SYSTEM
SD DM M-B M-BRS M-BSW P-RC P-C P-M
16 3 12 9 1 24 17 14
CO
NC
EN
TR
AT
ION
IN P
ICO
CU
RIE
S P
ER
LIT
ER
10
100
1000
10000
10
100
1000
10000
Appendix 4h. Statistical summary of selected water-quality constituents for aquifer systems
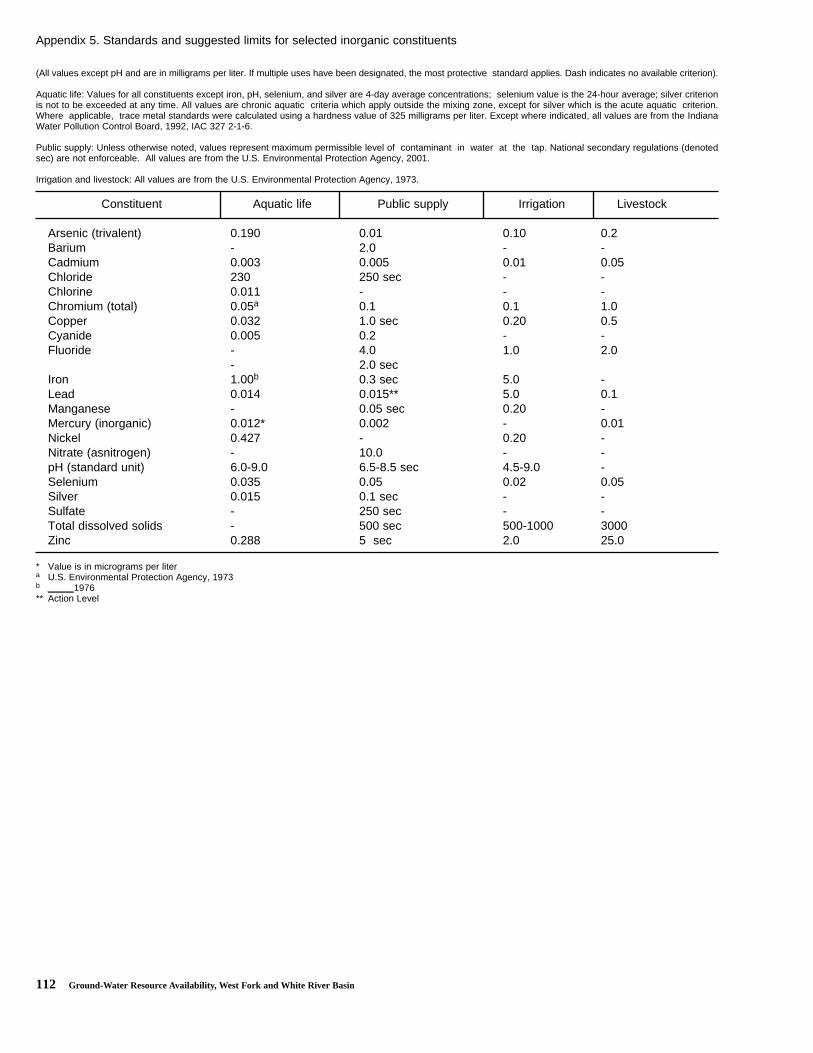
112 Ground-Water Resource Availability, West Fork and White River Basin
Appendix 5. Standards and suggested limits for selected inorganic constituents
(All values except pH and are in milligrams per liter. If multiple uses have been designated, the most protective standard applies. Dash indicates no available criterion).
Aquatic life: Values for all constituents except iron, pH, selenium, and silver are 4-day average concentrations; selenium value is the 24-hour average; silver criterionis not to be exceeded at any time. All values are chronic aquatic criteria which apply outside the mixing zone, except for silver which is the acute aquatic criterion.Where applicable, trace metal standards were calculated using a hardness value of 325 milligrams per liter. Except where indicated, all values are from the IndianaWater Pollution Control Board, 1992, IAC 327 2-1-6.
Public supply: Unless otherwise noted, values represent maximum permissible level of contaminant in water at the tap. National secondary regulations (denotedsec) are not enforceable. All values are from the U.S. Environmental Protection Agency, 2001.
Irrigation and livestock: All values are from the U.S. Environmental Protection Agency, 1973.
Constituent Aquatic life Public supply Irrigation Livestock
Arsenic (trivalent) 0.190 0.01 0.10 0.2 Barium - 2.0 - -Cadmium 0.003 0.005 0.01 0.05 Chloride 230 250 sec - -Chlorine 0.011 - - -Chromium (total) 0.05a 0.1 0.1 1.0 Copper 0.032 1.0 sec 0.20 0.5Cyanide 0.005 0.2 - -Fluoride - 4.0 1.0 2.0
- 2.0 secIron 1.00b 0.3 sec 5.0 -Lead 0.014 0.015** 5.0 0.1 Manganese - 0.05 sec 0.20 -Mercury (inorganic) 0.012* 0.002 - 0.01 Nickel 0.427 - 0.20 -Nitrate (asnitrogen) - 10.0 - -pH (standard unit) 6.0-9.0 6.5-8.5 sec 4.5-9.0 -Selenium 0.035 0.05 0.02 0.05 Silver 0.015 0.1 sec - -Sulfate - 250 sec - -Total dissolved solids - 500 sec 500-1000 3000 Zinc 0.288 5 sec 2.0 25.0
* Value is in micrograms per litera U.S. Environmental Protection Agency, 1973b _____1976** Action Level