groundbreaking decisions. annual report 2 017 - … · paragon has much more to offer. just last...
TRANSCRIPT

GROUNDBREAKING DECISIONS.ANNUAL REPORT 2017

2 | P A R A G O N A G A N N U A L R E P O R T 2 0 1 7
At a Glance
1 Excluding € 3.553 extraordinary items of the Mechanics segment (unadjusted)2 Adjusted EBIT margin: 9.0%3 Thereof € 15.158 million cash payments for the acquisition of consolidated companies4 Net debt = interest bearing liabilities – free liquidity5 Plus 130 temporary employees (December 31, 2016: 107)
Group Key Figures (IFRS)
In € thousands / as indicated Jan. 1 to Jan. 1 to Change Oct. 1 to Oct. 1 to ChangeDec. 31, 2017 Dec. 31, 2016 in % Dec. 31, 2017 Dec. 31, 2016 in %
Revenue 124,823 102,790 21.4 40,078 29,091 37.8
EBITDA 17,028 16,092 5.8 4,433 5,929 -25.2
EBITDA margin in % 13.6 15.7 n. a. 11.1 20.4 n. a.
EBIT1 7,633 8,929 -14.5 1,501 3,831 -60.8
EBIT margin2 in % 6.1 8.7 n. a. 3.7 13.2 n. a.
Group result -657 3,561 -118.4 -2,798 2,746 -201.9
Earnings per share in € -0.15 0.84 -117.2 -0.62 0.61 -201.9
Investments3 37,747 23,262 61.6 24,269 6,548 270.6
Operating cash flow -8,370 16,798 -184.7 -11,055 8,355 -232.3
In € thousands / as indicated Dec. 31, 2017 Dec. 31, 2016 Change Dec. 31, 2017 Sep. 30, 2017 Changein % in %
Total assets 311,847 115,553 169.9 311,847 152,146 105.0
Equity 177,062 34,674 410.6 177,062 35,043 405.3
Equity ratio in % 56.8 30.0 n. a. 56.8 23.0 n. a.
Free liquidity 166,826 17,324 863.0 166,826 52,272 219.1
Interest bearing liabilities 86,336 49,181 75.5 86,336 85,473 1.0
Net debt4 -80,490 31,857 -352.7 -80,490 20,118 -342.4
Employees5 678 519 30.6 678 495 37.0
ShareDec. 31, 2017 Dec. 31, 2016 Change Dec. 31, 2017 Sep. 30, 2017 Change
Xetra closing price in € 78.68 41.53 89.5 % 78.68 88.55 -11.1 %
Number of shares outstanding 4,526,266 4,526,266 0.0 % 4,526,266 4,526,266 0.0 %
Market capitalization in € million 356.1 188.0 168.1 356.1 400.8 -44.7
Highlights from Fiscal Year 2017• Group sales increase 21.4% to € 124.8 million (prior year: € 102.8 million)• EBITDA up 5.8% to € 17.0 million (prior year: € 16.1 million)• EBIT1 down 14.6% to € 7.6 million (prior year: € 8.9 million)• Revenue growth to around € 175 million expected for 2018 with an EBIT margin of around 9%

AT A GLANCEHighlights from Fiscal Year 2017 2Group Key Figures (IFRS) 2Share 2
TABLE OF CONTENTS 3LETTER FROM THE MANAGEMENT BOARD 5GROUNDBREAKING DECISIONS –INTERVIEW WITH THE MANAGEMENT BOARD 6INVESTOR RELATIONS AT PARAGON 10
Capital Market Environment 10Share: Share Price Performance and Trading Volumes 11Corporate Bond 2013/18 12Corporate Bond 2017/22 12IPO of Voltabox AG 13Financial Communications 13
SUPERVISORY BOARD REPORTMonitoring and Consulting in Continuous Dialogue With the Management Board 15Supervisory Board Meetings 15Forming Committees 16Audit of the Annual Financial Statements and Consolidated Financial Statementsfor Fiscal Year 2017 16
COMBINED MANAGEMENT REPORT FOR THEPARAGON GROUP AND PARAGON AG
Key Facts About the Group 20• Business Model 20• Group Structure 20• Corporate Strategy 21• Control System 23• Financial Performance Indicators 23• Nonfinancial Performance Indicators 25• Other Control Benchmarks 27• Financial Management 30• Dividend Policy 30
Remuneration Report of the Management Board and Supervisory Board 31• Management Board Remuneration 31• Supervisory Board Remuneration 32
Economic Report 33• Global Economic Conditions 33• Market Development 2017 33• Business Performance of the Group 34• Business Performance of the Parent Company paragon AG 35• Key Factors of Business Performance 36• Assets, Financial Position and Earnings 36
Opportunity and Risk Report 41• Opportunity Report 41• Risk Report 43
Description of the Key Characteristics of the Internal Control and Risk ManagementSystem with Regard to Group Accounting Processes (Section 315 (2) no. 5 HGB) 49Risk reporting on the use of financial instruments (Section 315 (2) no. 1 HGB) 50Forecast 51
• Market Development 2018 51• paragon Group 52• paragon AG 52
Takeover-Related Disclosures Pursuant to Section 315 (4)of the German Commercial Code (HGB) 53
• Composition of the Share Capital 53• Stock Voting Right and Transfer Restrictions 53• Holdings That Exceed 10 Percent of the Voting Rights 53• Shares With Special Rights of Control 53• Voting Right Controls for Employees Participating in the Capital 53• Appointment and Dismissal of Members of the Management Board and
Amendments to the Articles of Association 53• Authorization of the Management Board to Issue Shares 53• Change of Control and Compensation Agreements 54
Corporate Governance Statement Pursuant to Section 315d in ConjunctionWith Section 289f (1) of the HGB 54
CONSOLIDATED FINANCIAL STATEMENTSConsolidated income statement 56Consolidated statement of comprehensive income 56Consolidated balance sheet 57Consolidated cash flow statement 58Schedule of changes in equity 59
NOTES TO THE CONSOLIDATED FINANCIALSTATEMENTS 2017 61AUDITOR'S REPORT 103DECLARATION BY THE LEGAL REPRESENTATIVES 109FINANCIAL CALENDAR 110IMPRINT 111
T A B E L O F C O N T E N T 3

4 | P A R A G O N A G A N N U A L R E P O R T 2 0 1 7

L E T T E R F R O M T H E M A N A G E M E N T B O A R D 5
D E A R S H A R E H O L D E R S , C U S T O M E R S ,
B U S I N E S S P A R T N E R S A N D E M P L O Y E E S ,
against the backdrop of our 30-year company history,we are particularly pleased that the 2017 fiscal year wasthe most successful to date. Once again, we grew fasterthan the market. The more than 20 percent increase insales speaks for itself.
Our strategy addresses the major megatrends in the au-tomotive sector with growing success: increasing con-venience, urbanization, CO2 reduction and digitization.With our innovations, we are increasingly moving frombeing a direct supplier of electronic components to anintegrated system provider. Our internal project “PUSH2018” is aimed precisely at the market opportunitiesarising from the changing mobility requirements of endcustomers.
In our industry, the forthcoming transformationalchanges in the automotive value chain are now beingdiscussed more and more openly. It is evident that the-se changes have already begun, in part through the verysubstantial structural considerations of major manu-facturers and suppliers. We placed the cornerstone forour current success with our entry into e-mobility in2011, which initially focused on industrial applications.
With the successful IPO of our e-mobility subsidiaryVoltabox AG in October 2017, we established the fra-mework for rapidly expanding our position in this fast-growing market. Of the more than € 150 million we rai-sed with the IPO, Voltabox has a large share availablefor acquisitions. paragon AG received around € 27 milli-on from the sale of Voltabox shares and the repaymentof shareholder loans.
In addition, we issued a new € 50 million paragon cor-porate bond in the summer. It was named the most suc-
cessful SME bond issue of 2017 by Bond Magazine.With the takeover of HS Genion GmbH in Decemberand the merger of our Body Kinematics unit under theumbrella of paragon movasys GmbH, we are now wri-ting another success story as a leading global supplier ofactive mobile aerodynamic systems.
The chances are therefore good that we will again growsignificantly faster than the automotive sector in thisanniversary year. paragon movasys GmbH in the Me-chanics operating segment and Voltabox AG in theElectromobility operating segment are expected to bethe main contributors to this growth. We are alsoforecasting a further jump in Group sales of more than40 percent to around € 175 million with a consolidatedEBIT margin of around 9 percent. From fiscal year 2019onward, the Electronics operating segment is also ex-pected to make a stronger contribution to Groupgrowth with new products.
We would like to take this opportunity to thank all ouremployees for their outstanding work and our businesspartners, customers and shareholders for their trust.
Klaus Dieter Frers Dr. Stefan SchwehrChief Executive Officer Chief Technology Officer (Electronics)
Letter From the Management Board

6 | P A R A G O N A G A N N U A L R E P O R T 2 0 1 7
Mr. Frers, Dr. Schwehr, you have just completed oneof the best fiscal years in your 30-year company histo-ry and, with over 20 percent organic growth, you havecreated a solid basis for achieving your ambitious me-dium-term growth targets.
Frers: It’s true – this year really was something special. Itwas a year full of crucial decisions for the future and onewhere we established a solid foundation for growth wellbeyond 2017.
After the capital increase in October 2016, we startedthe new year with momentum and were able to initiateimportant product initiatives. The bond issue in July2017 was another highlight: We had planned for a volu-me of € 30 million, but we were pleasantly surprised bythe interest from the capital market. In the end, we in-creased the volume to € 50 million – and could haveachieved significantly more. But the highlight was un-doubtedly the IPO of Voltabox. The response, both inGermany and abroad, was indescribable. The shares were
Groundbreaking Decisions –Interview With the Management Board
Chief Executive Officer Klaus Dieter Frers and Chief Technology Officer (Electronics) Dr. Stefan Schwehr

I N T E R V I E W W I T H T H E M A N A G E M E N T B O A R D
oversubscribed ten times. This shows that the future be-longs to electromobility – and Voltabox is part of it. Itwas truly a huge success. And, at the end of the year, wealso succeeded in acquiring HS Genion GmbH. The mer-ger with our Body Kinematics unit created the worldmarket leader in this sector.
It was a full year, and yet we managed to stay true to the“paragon principle”: dynamism, agility, courage for inno-vation and change. We can honestly say that we are inexcellent position for the future.
It sounds as if you and your management team are in-terpreting the classic image of the entrepreneur in amodern way.
Frers: We combine a lot of things that might make usunique. For instance, the sustainability and stability of afamily-owned company paired with the transparencyand dynamism of a listed company. Our company isnow a good 30 years old, but we have retained thementality of a start-up.
Of course, this is only possible if you have employees atall management levels who share these values and real-ly embody them. Not only achieving strong growth, butalso harnessing it for constant change requires strongmanagers with passion – and we have them. I am alsovery pleased that we were able to attract additional ta-lents over the last year.
Voltabox is a good example of this start-up mentality.What distinguishes this company from its competitors?
Frers: Long before e-mobility was on everyone’s lips,we were focusing on highly developed battery systemsfor industrial applications. That is now paying off. Wesupply battery systems for forklifts, mining vehicles,public transportation trolleybuses and automated guided
vehicles. We also manufacture lithium-ion batteries forselected mass market applications, with the current fo-cus being on high-performance motorcycles. In a fast-growing market, we have established ourselves as a lea-ding provider in our market segments and have doubledour revenue each year to date. Due to the complexity ofVoltabox’s products, their margins will always be higherthan those in mass-produced, price-competitive applica-tions. In fact, we are aiming for an EBIT margin of aroundten percent at Voltabox for 2018.
That is sure to be received well by the capital market.What battery solutions do you offer that others don’thave?
Frers: It is always about special applications: Our sys-tems are tailored for the application the customerneeds. Here, we benefit from the modularization andscalability of our individual components. A currentexample is a prototype that we are developing for a lar-ge, newly designed vehicle for underground mining.This battery system is based on innovative pouch cellsand weighs around 8.5 tons. The energy content isaround 800 kWh, which is many times that of a “nor-mal” electric car.
Will Voltabox be the growth driver for paragon overthe next few years?
Frers: Voltabox has tremendous growth prospects, butparagon has much more to offer. Just last year, we ma-de several groundbreaking decisions that will accelerateparagon’s growth in the Electronics operating segmentover the coming years as well. With our latest develop-ments, we are increasingly becoming a system providerwith core competencies in the series production ofhigh-quality electronic components. Here, we are strict-ly following the major megatrends in the sector. I amfirmly convinced that we will benefit particularly stron-

gly from the changes in the automotive value chain inthe medium term.
Can you give a few examples of this?
Dr. Schwehr: Today, around half of the world’s popula-tion lives in major cities. A negative side effect of themegatrend of urbanization is increasing air pollution.With our DustDetect particle sensors, we struck achord with vehicle manufacturers, especially in Asia.Our particle sensors determine how high the concentra-tion of respirable particulate matter is in the passengercompartment and in the air surrounding the vehicle withgreat accuracy. The driver and passengers can see at aglance how quickly the filtered air in the passengercompartment reaches non-critical levels of particulatematter pollution.
Or just think of the growing need for people to be “on-line” at all times and in all places. Our technologyplatform MirrorPilot offers trend-setting integration ofthe smartphone into the vehicle via Apple CarPlay andGoogle Android Auto, so that popular and necessaryapps such as navigation, calling, contacts or music strea-ming can be seamlessly used in the car, with a familiarinterface. Especially for vehicles in the shared mobilitysector, MirrorPilot offers a standard that enables a uni-versal infotainment experience with almost all commonsmartphones. Additional functions, such as convenientuser authentication and secure vehicle access, can beintegrated here.
Our Acoustics activities are also fully involved here. Un-til now, paragon has been known for its high-quality andhighly innovative microphone solutions, such as the beltmicrophone. With the resulting expertise in interioracoustics and our competence in electronics and vehiclenetworking, we have now developed a system thatopens up numerous functionalities that are not availableanywhere else in the market today. The 3D+ high-endsound system offers an unrivaled three-dimensionalsound experience that is identical for every passengerand can be coupled with in-car communication functi-ons, additional sound generation for electric vehiclesand counter-noise control to suppress vehicle noise,which is particularly noticeable in electric vehicles.
And what about the trend toward autonomous dri-ving? Will paragon also benefit from this?
Dr. Schwehr: We are working on different approacheshere. I can say this much: Due to the legislation regar-ding autonomous driving, among other things, assessingthe driver’s condition will become a very importantaspect – particularly in the context of retaking controlfrom the autonomous system. This transition is ex-pected to take several seconds. This time is calculatedusing a large number of recorded data, including thedriver’s vital state, using concrete models and self-lear-ning algorithms. We are taking an innovative approachhere, which I will be able to report more on later thisyear.
That sounds very futuristic. When will we be able toexpect initial revenues from these new products?
Frers: This depends very much on the innovation cyclesof the individual manufacturers. Traditionally, it takesup to 24 months for a new product to make it onto theroad. New systems in particular must always be takeninto account when designing new models or generati-ons of models. However, we see increasing manufactu-rer interest in innovative system solutions from provendirect suppliers. Consumer expectations are growing.The more mobile and demanding consumers become,the greater the pressure on manufacturers to innovate.We are uniquely positioned here. The first revenue con-tributions will come from a pilot application of the Mir-rorPilot mentioned by Dr. Schwehr this year. It involvesa shared mobility business model operated by a Germanpremium manufacturer.
What about the data that will be generated with yoursystems in the future?
Dr. Schwehr: Of course, there is unbelievable potentialhere, if you just look at the data that our sensors pro-cess. With our particulate matter sensor and a sufficientpenetration of the market, it is possible to create localresolution maps for particulate matter pollution essenti-ally in real time. Combined with past values and the dai-ly weather forecast, the software allows you to predict
8 | P A R A G O N A G A N N U A L R E P O R T 2 0 1 7

the concentration of particulate matter around the cor-ner, near the kindergarten or at the sports field nearby.The driver monitoring we just mentioned is well suitedfor determining values for the stress and well-being ofthe driver – particularly in the context of autonomousdriving. Programs to increase well-being can then be de-rived from this data. I'm thinking here of targeted musicselection, suitable ambient lighting or even fragrancingin the vehicle.
So is paragon increasingly developing into a softwarecompany?
Dr. Schwehr: Given our high level of expertise in theelectronics and mechanics sectors, I wouldn’t go thatfar. But the applications I just mentioned show thatsoftware represents an additional pillar for paragon withenormous possibilities. Speaking more generally, we arealready within the value chains of the new and futureecosystems with the traditional paragon products. I’vealready mentioned data fusion in the cloud. It is there-fore only logical that we should also offer new services,from air quality information inside and outside the vehi-cle to health monitoring and changing mobility services,which we are helping to shape. The breakthrough of ar-tificial intelligence methods also opens up completelynew applications in terms of operation and infotain-ment.
Back to hardware. At the end of the year, you onceagain strengthened the area of Body Kinematics. Whatdo you expect from this move?
Frers: The subsidiary paragon movasys GmbH, with itsheadquarters and plant in Delbrück and additional sitein Landsberg am Lech, has emerged from the merger ofHS Genion GmbH and our former Body Kinematics unitas a new world market leader. We want to utilize thepotential synergy quickly and offer our customers inte-grated systems by relying on the expertise of the unitsin the Mechanics operating segment. The strategic po-tential for active mobile aerodynamics is enormous. Wewill be the only supplier worldwide that can offer ready-to-install systems from a single source.
With the new forecast for the current year, you arecontinuing your growth momentum unabated. Whatcan we expect from paragon in the medium term?What is your vision for the paragon Group at the be-ginning of the new decade?
Frers: paragon will be a recognized systems supplierwith products and services that address the megatrendsof urbanization, digitization, CO2 reduction and com-fort. We will be the world market leader in our sectorsand a partner on equal footing with our customers, hel-ping to shape and guide changing mobility. We will be amagnet for customers, investors and new employees,who appreciate our ambition, our passion, our innovati-ve spirit and our reliability.
Mr. Frers, Dr. Schwehr, thank you very much for theinsightful conversation. We wish you and your em-ployees at paragon all the best and much success inthis new phase of the company’s development.
I N T E R V I E W W I T H T H E M A N A G E M E N T B O A R D 9

Capital Market Environment
Against the backdrop of an overall positive economicenvironment, the capital market was subject to variouscurrency and geopolitical influences at the internationallevel in the past year, which resulted in varying adjust-ments to the expectations of market participants. TheUS Federal Reserve raised key interest rates in Marchand June, while the European Central Bank’s main refi-nancing rate remained unchanged at 0.0%.
In a positive economic environment, the capital marketshowed a mixed trend in the first quarter with initiallylow trading volumes. While the course of trade in Janu-ary was dominated by a consolidation phase with side-ways movement due to a lack of momentum, increasedprofit expectations among predominantly foreign insti-tutional investors led to an improved mood starting inFebruary. This resulted in the magic threshold of12,000 points being exceed on the DAX in March.However, profit-taking and increasing uncertaintyamong institutional investors about the current risk situ-ation slowed further development. By mid-March, pes-simism among institutional DAX investors reached itshighest level since March 2015.
As a result of the strong economic growth in the firstquarter, the utilization of overall economic capacitiescontinued to increase – thanks in particular to the in-dustrial sector and exports. Once again, China played aprominent role. The political risks prevailing at the be-ginning of the second quarter with regard to the Frenchpresidential election and the uncertainties associatedwith the announced US tax reform initially led to a lot ofskepticism on the capital markets. Nonetheless, foreign
investors significantly increased their European stock-holding, which led to the largest shift away from Ameri-can stocks since 1999. This process ultimately led tonew record levels for the DAX. After a correction inMay, however, the market then performed unevenly.
The beginning of the third quarter was marked byprofit-taking on the stock exchange due to a generaluncertainty surrounding the possible end to the Euro-pean Central Bank’s loose monetary policy. By the be-ginning of August, this was overshadowed by geopoliti-cal risks – particularly the intensifying dispute betweenthe U.S. and North Korean governments. As a result,August was neutral on the German stock market. In-vestor sentiment brightened somewhat in September,and this was increasingly supported by private in-vestors. The outcome of the Bundestag elections hadno notable effect.
The focus of the final quarter was initially on the psy-chologically important 13,000-point mark on the DAX.In October, professional investors responded by re-treating from this hurdle and building up short positions,while private investors were on the buying side. Senti-ment then brightened considerably over the course ofthe year, though profit-taking outweighed positive fun-damentals in November. In the end, December was alsodominated by a skeptical attitude on the part of marketparticipants.
Interest rates remain at a very low level, despite the firstkey interest rate hikes by the US Federal Reserve Bankand the tax reform announced by the US government atthe end of the year. As a result, the yield curve re-mained flat as investors increasingly invested in longer-term government bonds, thereby squeezing yields.
1 0 | P A R A G O N A G A N N U A L R E P O R T 2 0 1 7
Investor Relations at paragon

Share: Share Price Performance andTrading Volumes
The price development of the paragon share was againcarried by positive dynamics in the past fiscal year. Witha Xetra closing price of € 78.68 as of the reporting date(prior year: € 41.53), the share achieved a price increaseof 89.5%. This corresponds to a growth in stock marketvalue for the company of about € 168.1 million.
In the first quarter, the most important German shareindices recorded an increase (DAX 7%, SDAX 6% andTecDAX 13%). The STOXX Europe 600 Automobiles &Parts (SXAP) index, which lists the most important Euro-pean automotive industry stocks, posted a gain of near-ly 5%. In this market environment, the paragon stockoutperformed the market in the first quarter – posting a17% increase in its share price. Starting from an initialprice of € 43.61, which was near the low of € 41.10from January, the share price reached its high of €49.39 in the second half of February. After profit-taking
in March, the share price ended the quarter at € 48.77.This corresponds to a stock market value of approxi-mately € 220.7 million for paragon AG as of the end ofthe period and represents an increase of around € 32.8million in the company’s market capitalization for thefirst quarter.
The second quarter was mixed for the share indices(DAX 0%, SDAX just under 8% and TecDAX 7%). Bycontrast, the STOXX Europe 600 Automobiles & Parts(SXAP) recorded a decline of more than 5%. In this mar-ket environment, the paragon stock once more outper-formed the market – posting a 35% increase in its shareprice. Starting from an initial price of € 49.88, whichwas near the low of € 48.30 from April, the share pricereached its high of € 72.70 at the start of June. Afterprofit-taking in June, the share price ended the secondquarter at € 66.00. This corresponds to a stock marketvalue of approximately € 298.7 million for paragon AGas of the end of the reporting period and represents anincrease of around € 110.7 million in the company’smarket capitalization for the first half of 2017.
I N V E S T O R R E L A T I O N S A T P A R A G O N 1 1
Performance of paragon share
240 %
220 %
200 %
180 %
160 %
140 %
120 %
100 %
80 %
paragon AG TecDAX SDAX DAX SXAP
12/30/2016
01/30/2017
03/02/2017
04/02/2017
05/02/2017
06/02/2017
07/02/2017
08/02/2017
09/02/2017
10/02/2017
11/02/2017
12/02/2017
In the third quarter, the share indices again performedwell overall (DAX 4%, SDAX 10% and TecDAX 11%).The STOXX Europe 600 Automobiles & Parts (SXAP)recorded growth of almost 11%. In this market environ-ment, the paragon share was again able to achieve a dis-proportionately high increase in value of 34%. Startingfrom an initial price of € 63.78, the share reached ashort-term low of € 55.69 at the end of July, while anew high of € 89.05 was reached at the end of Septem-ber. The third quarter ended at € 88.55. This corre-sponds to a market capitalization of approximately €400.8 million for paragon AG as of the end of the re-porting period, which represents an increase of around€ 212.9 million over the first nine months of 2017.
The share indices closed the final quarter with mixed re-sults (DAX 0.7%, SDAX -0.2% and TecDAX 3.9%). TheSTOXX Europe 600 Automobiles & Parts (SXAP) wasslightly more robust at 3.5%. In this market environ-ment, the paragon share price was initially marked byprofit-taking. From an initial price of € 90.25, close tothe high of € 92.69, the share price moved sideways inOctober, while the lowest price of € 66.08 was reachedin mid-November. This was followed by a technical re-covery, which led to a closing price of € 78.68 at theend of the quarter. This corresponds to a stock marketvalue of approximately € 356.1 million for the companyas of the end of the year and represents an increase ofaround € 168.2 million in the company’s market capital-ization over the course of 2017.
The trading volume developed largely stably over thecourse of the year and was in line with the overall mar-ket. While the summer months traditionally show re-duced trading volumes, September showed a particular-ly strong increase in activity. For the year, an average ofroughly ten thousand shares were traded daily via thetrading platforms of the Deutsche Börse AG, and thisaccounted for an average of 70% of all trading activities.Trading via dark pools (i.e., internal bank and stock ex-change trading) therefore remained relatively low in thepast fiscal year. The number of brokers actively tradingparagon continued to rise.
Corporate Bond 2013/18
In July 2013, paragon AG issued a corporate bond de-nominated in euros with a term lasting until July 2, 2018,and an annual interest coupon of 7.25%. It is tradable un-der WKN A1TND9 or ISIN DE000A1TND93. The bond2013/18 was traded at an average of 3.4% above its ini-tial issue price throughout 2017. It closed the year trad-ing at 102.75% of the issue price. The rating of BB+ forparagon AG by Creditreform Rating AG expired on May29, 2016. An extension was not requested. The repay-ment of the outstanding € 13 million will be made fromthe inflow of funds from the corporate bond 2017/22 is-sued in July.
Corporate Bond 2017/22
paragon AG successfully placed its new corporate bond(ISIN DE000A2GSB86; WKN A2GSB8) with a total vol-ume of € 50 million on the first day of the subscriptionperiod: June 27, 2017. Due to oversubscription of theoffer, the subscription period was ended prematurely.The final annual interest rate has been set at 4.5% p.a.The first trading day for the bonds on the open market(free trade) of the Frankfurt Stock Exchange inDeutsche Börse AG’s Scale segment for corporatebonds was June 28, 2017. The issue date and the be-ginning of the interest term is July 5, 2017. The bondmatures on July 5, 2022.
It closed the year trading at 105.5% of the issue price. Acompany rating is not planned for this bond either.Bankhaus Lampe KG accompanied the issue as soleglobal coordinator and joint bookrunner together withHauck & Aufhäuser Privatbankiers AG.
1 2 | P A R A G O N A G A N N U A L R E P O R T 2 0 1 7

IPO of Voltabox AG
On September 11, the Management Board of paragonAG approved the IPO of the wholly owned subsidiaryVoltabox AG. On September 25, it approved the pricerange for a public offering of Voltabox shares. In the pe-riod from September 26 to October 10, a total of up to6.325 million Voltabox shares were offered at a price of€ 20.00 to € 24.00 per share. The offer comprised fivemillion new shares plus a greenshoe option of 0.825million additional new shares from a capital increase byVoltabox AG as well as a sale of 0.5 million shares byparagon AG.
The placement volume amounted to € 151.8 million, ofwhich Voltabox AG received € 139.8 million andparagon AG € 12.0 million in gross proceeds from theissue. In addition to the targeted further developmentof its products, the increase in production capacity andthe repayment of a shareholder loan from paragon AG,the issue proceeds are primarily intended to increasethe flexibility of Voltabox AG as it also seeks to growthrough value-enhancing acquisitions.
Voltabox AG was listed on the Frankfurt Stock Ex-change (Prime Standard) on October 13 with the sym-bol VBX, the ISIN DE000A2E4LE9 and the WKNA2E4LE at an initial listing price of € 30.00 per share.Voltabox AG’s market capitalization at that time wastherefore € 474.75 million. paragon AG now holds 60percent of Voltabox AG, while the remaining share cap-ital is in free float. paragon AG also intends to remainthe majority shareholder of Voltabox in the long term.
Bankhaus Lampe KG accompanied the IPO as sole glob-al coordinator and joint bookrunner together withHauck & Aufhäuser Privatbankiers AG.
Financial Communications
In the past fiscal year, the company continued to buildup internal resources in the area of Investor Relations.This allowed the company to solidify and further expandits ongoing communications with institutional and pri-vate investors. Particularly in connection with the issueof the corporate bond 2017/22 and the IPO ofVoltabox AG, existing and new shareholders made ex-tensive use of the company’s offer for direct dialogue atthe Management Board and Investor Relations level.
More than 200 individual meetings were held with insti-tutional investors from Germany, the U.K., France, Fin-land, Sweden, Denmark, Luxembourg, the Netherlands,Switzerland, Austria, Italy, Spain, Poland and the U.S.Over the course of the year, five research firms (prioryear: five) published a total of 21 studies (prior year: 21)on paragon AG.
The company sees effective financial communication asthe targeted reduction in the asymmetric flow of infor-mation between management and shareholders on thecurrent economic situation and specific future potentialof paragon AG. Accordingly, the ongoing dialog withcapital market participants is given a high priority. Fur-thermore, the company aims to provide the broaderpublic with up-to-date and relevant information via di-verse media channels.
In the current fiscal year, the expanded group of institu-tional investors will be accounted for with increasedparticipation in investor and analyst conferences androad shows. Additionally, the company actively invitesnew studies and evaluations from research firms.
I N V E S T O R R E L A T I O N S A T P A R A G O N 1 3
1 4 | P A R A G O N A G A N N U A L R E P O R T 2 0 1 7
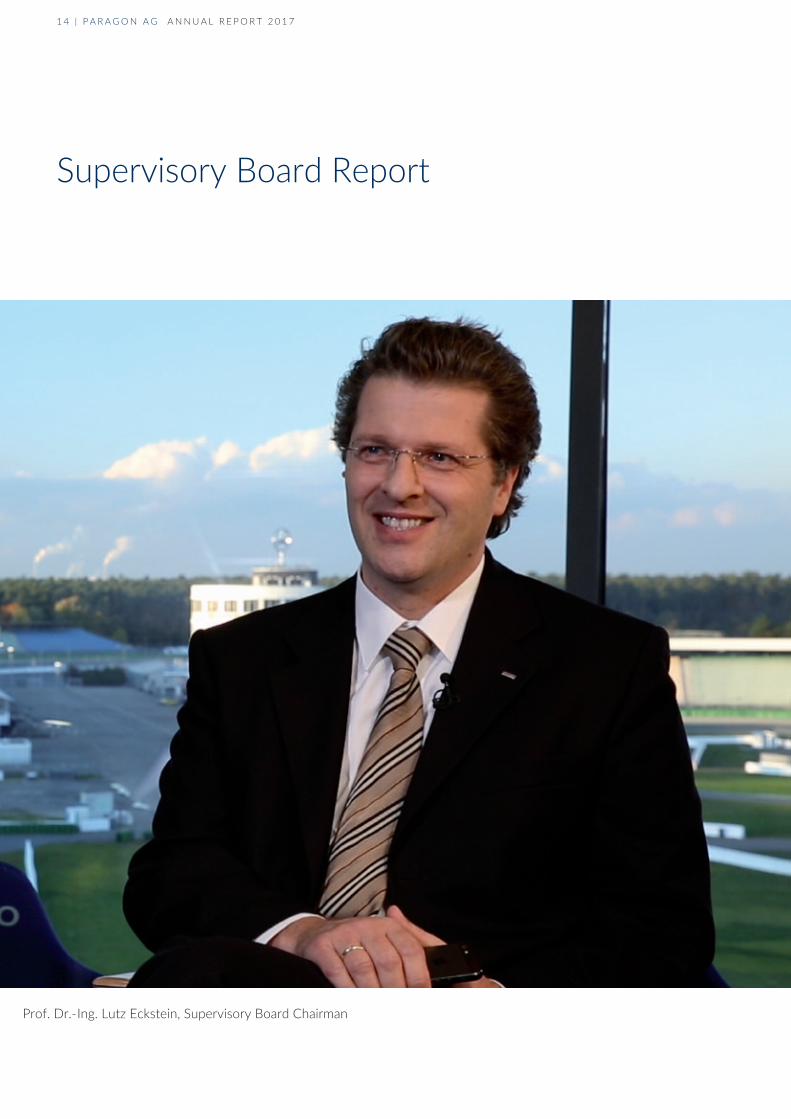
Supervisory Board Report
Prof. Dr.-Ing. Lutz Eckstein, Supervisory Board Chairman

Monitoring and Consulting inContinuous Dialogue With theManagement Board
The Management Board and Supervisory Board ofparagon AG uphold the obligation highlighted in theGerman Corporate Governance Code (GCGC) of ensur-ing the continued viability of the company and its sus-tained value creation (corporate interests) in conformitywith the principles of the “social market economy.”There were no conflicts of interest among the Manage-ment Board or Supervisory Board members in fiscalyear 2017. The mandates of the Supervisory Boardmembers are listed in the notes (note 44).
The Supervisory Board of paragon AG fulfilled the con-sulting and monitoring obligations incumbent upon itaccording to law, the Articles of Association, GermanCorporate Governance Code and rules of procedurewith great care in fiscal year 2017. Here, the Superviso-ry Board supervised the company’s management on anongoing basis and made sure of its legal and regulatorycompliance, appropriateness and effectiveness. Fur-thermore, the Supervisory Board was available to theManagement Board for consultation and was involvedin discussions and decisions regarding issues of materialimportance. Thanks to the good cooperation betweenthe Supervisory Board members, even time-sensitivedecisions were resolved quickly.
In March 2018, the Management Board and SupervisoryBoard updated the company’s Declaration of Complianceaccording to Section 161 of the German Stock Corpora-tion Act (AktG) and made it publicly available on theparagon AG website. The deviations from the recommen-dations of the GCGC and additional information on cor-porate governance at paragon AG are also provided here.
The Management Board comprehensively informed theSupervisory Board in written and oral form in the Super-visory Board meetings on all proceedings of material im-portance, the company’s general performance and itscurrent situation. Here, it gave particular priority to thetopics of strategy, planning, business development, risksituation and risk management. The Supervisory Board
intensively reviewed the Management Board’s reportsand discussed them at its meetings. In addition to theSupervisory Board meetings and conference calls in-volving all members of the Management Board and Su-pervisory Board, the Supervisory Board Chairman andthe Management Board discussed important matterswhen necessary. The Supervisory Board was fully in-formed about exceptional instances that were of mate-rial importance for assessing the year’s results.
Supervisory Board Meetings
In fiscal year 2017, the Supervisory Board convened atfour ordinary plenary meetings and held four confer-ence calls. All Supervisory Board meetings were heldwith the participation of the Management Board. Allof the Supervisory Board’s conference calls were heldwith the participation of the CEO. The entire Superviso-ry Board was present for every meeting.
The focus of the first ordinary meeting of the Supervi-sory Board in Delbrück on March 17, 2017, was the as-sessment and verification of the annual financial state-ments for fiscal year 2016 as well as the assessmentand approval of the consolidated financial statementsfor fiscal year 2016. The Supervisory Board also dealtwith the nomination of the auditor for fiscal year 2017and recommended Baker Tilly GmbH & Co. KGWirtschaftsprüfungsgesellschaft, Düsseldorf, as the au-ditor. During this meeting, the Supervisory Board alsodiscussed the agenda of the Annual General Meetingand approved the invitation proposed by the Manage-ment Board. Finally, the Supervisory Board was in-formed about current business developments.
In its second meeting in Hövelhof on May 9, 2017, theSupervisory Board was informed about the company’sperformance in the first quarter and its currentprospects. Further preparations for the Annual GeneralMeeting were also on the agenda.
In the first conference call on August 15, 2017, the Su-pervisory Board dealt with the approval of the forward-ing of planning data.
S U P E R V I S O R Y B O A R D R E P O R T 1 5
In its third meeting in Suhl on August 31, 2017, theSupervisory Board discussed the company's currentperformance and the status of capital strengtheningmeasures.
In the second conference call on September 25, 2017,the Supervisory Board dealt addressed the IPO ofVoltabox AG.
In the third conference call on October 10, 2017, theSupervisory Board dealt with the placement price of theVoltabox shares.
In the fourth conference call on November 22, 2017,the Supervisory Board discussed the acquisition of HSGenion GmbH.
In its fourth meeting in San Jose (USA) on December 2,2017, the Supervisory Board focused on the businessdevelopments from the first nine months and the com-pany’s current prospects. It also discussed the planningfor fiscal year 2018 presented by the ManagementBoard as well as the scheduling of the financial calendarfor 2018.
Forming Committees
As in the past, the three-member Supervisory Board didnot form any committees in fiscal year 2017 and dealtwith all issues as a single body.
Audit of the Annual Financial State-ments and Consolidated FinancialStatements for Fiscal Year 2017
Baker Tilly GmbH & Co. KG Wirtschaftsprüfungsge-sellschaft, Düsseldorf, was appointed by resolution ofthe Annual General Meeting on May 10, 2017 as audi-tor for the fiscal year from January 1 to December 31,2017, and accordingly commissioned by the Superviso-ry Board Chairman. The Supervisory Board was provid-ed a statement of independence from the auditor pur-suant to No. 7.2.1 of the German CorporateGovernance Code.
The scope of the audit included the annual financialstatements of paragon AG prepared by the Manage-ment Board pursuant to the provisions of the GermanCommercial Code (HGB) for the fiscal year from Janu-ary 1 to December 31, 2017, the consolidated financialstatements prepared by the Management Board pur-suant to Section 315a HGB and on the basis of the In-ternational Financial Reporting Standards (IFRS) for thefiscal year from January 1 to December 31, 2017, andthe combined management report of the paragonGroup and paragon AG.
Upon completion of the audit, Baker Tilly GmbH & Co.KG Wirtschaftsprüfungsgesellschaft, Düsseldorf, pro-vided an unqualified audit certificate for the annual fi-nancial statements, the consolidated financial state-
1 6 | P A R A G O N A G A N N U A L R E P O R T 2 0 1 7

ments and the combined management report of theparagon Group and paragon AG.
The auditor also determined that the information andmonitoring system established by the ManagementBoard meets the statutory requirements and is suitablefor recognizing developments that could endanger thecontinued existence of the company at an early stage.
The auditor made the documents submitted for auditingthe annual financial statements, the consolidated finan-cial statements, the combined management report ofthe paragon Group and paragon AG and the report onthe audit available to every member of the SupervisoryBoard. The audit was reported on and discussed at theSupervisory Board meeting on March 12, 2018. The au-ditors participated in the discussions on the annual andconsolidated financial statements. They reported on thekey audit results and were available to the SupervisoryBoard to answer any questions and provide additionalinformation. Based on the final outcome of its examina-tions, the Supervisory Board approved the annual andconsolidated financial statements. The annual financialstatements are thereby approved.
The Supervisory Board also assessed the proposal fromthe Management Board on the appropriation of the bal-
ance sheet profits at its meeting on March 12, 2018,and discussed this with the auditor. The SupervisoryBoard subsequently agreed with the ManagementBoard’s proposal.
The Supervisory Board did not exercise its right to in-spect the company’s accounts and correspondence inthe past fiscal year.
The Supervisory Board expresses its gratitude and ap-preciation to the members of the Management Boardand all of the Group’s employees for their hard workand personal commitment in 2017.
Delbrück, Germany, March 12, 2018
For the Supervisory Board,
Prof. Dr.-Ing. Lutz Eckstein
Supervisory Board Chairman
S U P E R V I S O R Y B O A R D R E P O R T 1 7

1 8 | P A R A G O N A G A N N U A L R E P O R T 2 0 1 7

Gro
upM
anag
emen
tRep
ort
1 9

Key Facts About the Group
Business Model
According to its Articles of Association, the businesspurpose of paragon AG (hereinafter also “company”) isthe research and development of microelectronics, themanufacture and sale of electronic devices, their corre-sponding peripherals and component groups as well asthe management of patents, licenses and utility models.The company can found or purchase other companies,hold interests in companies, establish branches and im-plement all other measures and legal transactions thatare necessary or serve to achieve or promote the com-pany’s aims.
The business model of the paragon Group (hereinafteralso simply “paragon”) is based on the independent de-velopment of product innovations at its own expense.To achieve this, a proven innovation system is used tokeep the current product portfolio at a very high level ofinnovation. With the overall vehicle expertise that hasbeen built up over the last three decades in the paragonGroup, developments and prototypes are characterizedby a deep understanding of the entire automotive man-ufacturing process.
The basic inspiration for the company’s product innova-tion is influenced by the core idea of enhancing thedriving experience for passengers of modern cars (endcustomers). The global megatrends of increased com-fort, urbanization, CO2 reduction and digitization areused to systematically derive the relevant innovationdrivers for the Sensors, Cockpit, Acoustics, Electromo-bility and Body Kinematics units. This allows paragon toaccurately anticipate the demands of end customers formodern features and characteristics in future models.
2 0 | P A R A G O N A G A N N U A L R E P O R T 2 0 1 7
Combined Management Reportfor the paragon Group and paragon AG
The market launch of product innovations follows the“push principle,” where specific marketing with automo-tive manufacturers as direct customers only beginsonce functional prototypes (A-samples) and the corre-sponding patent applications have been established.This allows paragon to maintain a time advantage overits competitors even in shorter innovation cycles. Withan optimized vertical range of manufacturing, paragonhas also established itself as a reliable partner for auto-motive manufacturers.
The level of automation in series production is con-stantly being increased to improve the cost structureover the life cycle of the individual product series. Inthis way, the series production of a wide range of prod-uct variations represents its own field of innovationwithin the company. At the end of the past fiscal year,26 industrial robots (prior year: 21) were being usedacross the Group for manufacturing tasks.
Group Structure
paragon Aktiengesellschaft (hereinafter “paragon AG”) isa joint stock corporation incorporated under Germanlaw. The company’s headquarters are at Artegastrasse1, Delbrück, Germany (Commercial register districtcourt of Paderborn HRB 6726). paragon AG’s sharesare traded on the Frankfurt Stock Exchange in thePrime Standard segment. paragon AG has its adminis-trative headquarters in Delbrück and central productionfacilities in Suhl, St. Georgen and Bexbach. It also has alocation in Nuremberg.
The scope of consolidation for the paragon Group in-cludes the wholly owned subsidiaries paragon Automo-tive Kunshan Co., Ltd. (Kunshan, China), paragon Auto-motive Technology (Shanghai) Co., Ltd. (Shanghai,

China), Voltabox AG (Delbrück), which is also listed inthe Prime Standard segment of the Frankfurt Stock Ex-change since October 13, 2016, Voltabox of Texas Inc.(Leander, Texas, U.S.) as well as SphereDesign GmbH(Bexbach), paragon movasys GmbH (Landsberg amLech) and KarTec GmbH (Delbrück).
Corporate Strategy
paragon’s corporate strategy is developed as part of arevolving process. This process involves the Manage-ment Board, the management of the operating seg-ments Electronics, Electromobility and Mechanics.
The strategic planning is based on the corporate missionstatement of occupying lucrative market niches in thepremium segment at an early stage. To accomplish this,technological innovations are developed based on exist-ing megatrends in an institutionalized process. Thegrowth potential that results from automotive manufac-turers adapting to these megatrends in future modelgenerations is addressed by the individual operatingsegments in a targeted manner.
From the global megatrends of increased comfort, ur-banization, CO2 reduction and digitization, paragon hasderived priorities that are of central importance for R&Dactivities. As a result of global climate change, con-
C O M B I N E D M A N A G E M E N T R E P O R T F O R F I S C A L 2 0 1 7 2 1
paragon AG
paragonmovasys GmbH
LANDSBERG AM LECH
paragon AutomotiveTechnology
(Shanghai) Co., Ltd.SHANGHAI (CHINA)
paragon AutomotiveKunshan Co., Ltd.
KUNSHAN (CHINA)
VoltaboxAG
DELBRÜCK
Voltaboxof Texas Inc.
LEANDER, TX (USA)
productronicGmbH
DELBRÜCK
Branch
SUHL
Branch
ST. GEORGEN
Branch
NÜRNBERG
SphereDesignGmbH
BEXBACH
KarTecGmbH
DELBRÜCK
DELBRÜCK
Branch
BEXBACH
100% 100%
100% 100%
100%
100%
100% 60.03%

sumers are showing an increasing awareness for sus-tainability and health. Furthermore, the reduction ofCO2 emissions is supported by weight reductions andimproved aerodynamics. Urbanization has led to a fun-damental change in consumer behavior in terms of indi-vidual mobility and therefore to alternative mobilityconcepts, such as shared mobility and autonomous driv-ing. In connection with the increasingly connectedlifestyle due to advancing digitization, themes such assecurity, comfort and connectivity are playing an ever-growing role for car owners.
The rise of these megatrends is resulting in a dynamicshift in the automotive value chain. In this context, theimportance of innovative product solutions from auto-motive suppliers is also rising on a system level. With in-creasingly shorter innovation cycles, new ecosystemsare developing in the automotive industry that requirehorizontal integration and cooperation. Here, particular-ly in the Electronics operating segment, paragon ad-dresses the fields for action that result from the chang-ing demands of end customers.
In the Electromobility operating segment, which is rep-resented by the 60 percent-owned subsidiary VoltaboxAG (hereinafter also referred to as “Voltabox”), thestrategic focus of the past fiscal year was on certain in-dustrial submarkets. In addition to local public trans-portation (trolleybuses), intralogistics (forklift trucks andautomated guided vehicles) and mining applications (un-derground mining vehicles), these submarkets includevehicles in the agricultural and construction sectors(compact-, wheel- and teleloaders) as well as starterbatteries (motorcycles).
Characteristic for these submarkets is the substitutionof lead-acid batteries or diesel generators with modernlithium-ion battery systems. Voltabox benefits directlyfrom these substitution effects resulting from users’ ra-tional, economical investment decisions. Global marketaccess in these submarkets is generally achievedthrough cooperation with leading manufacturers in therespective submarkets.
In the future, Voltabox will also deal with other submar-kets such as the electrification of vehicles for municipalservices, airport service vehicles, etc. As part of theglobal mass market for cars, Voltabox will also addressthe segment for modern 48V lithium-ion battery sys-tems for hybrid cars. Finally, Voltabox will continue tooffer powertrain components such as electric motorsand power electronics such as DC/DC converters in thefuture.
Through Voltabox, paragon has strategically positioneditself as a pioneer in the e-mobility sector for high-per-formance battery systems. The market position is basedon four strengths:
• Technology: technological edge over the competition
• Modularization: quick and cost-efficient developmentbased on a modular principle
• Specialized applications: optimal system adaptationfor each customer’s needs through customized appli-cations
• Automation: cost-effective and reliable serial produc-tion
In summary, the paragon Group’s growth strategy com-prises the following aspects:
• Constant development of product innovations basedon megatrends (product development)
• Gaining new automotive manufacturers as customers(market penetration)
• Tapping into new sales areas (market development)
• Tapping into new submarkets with new product of-fers (diversification)
2 2 | P A R A G O N A G A N N U A L R E P O R T 2 0 1 7

The competitive strategy of paragon can thereforelargely be described as a niche strategy without focus-ing on small quantities. This focus results in a high dif-ferentiation within the product portfolio. At the sametime, the constant optimization of the company’s auto-mated mass production processes ensures cost leader-ship.
Control System
Alongside a high level of innovation, the organizationalstructure at paragon is characterized by flat hierarchies,fast decision-making and continual optimization ofprocess management as part of the “paragon processideal” (ppi) project. The Group has the character of anowner-operated, medium-sized company while combin-ing a long-term strategic orientation with the integrationabilities of a publicly traded company. Thanks to thisunique organizational orientation, paragon is in positionto successfully compete with substantially larger corpo-rations and expand its position as a direct supplier torenowned automotive manufacturers.
The Management Board of paragon AG regularly com-pares its strategy with the actual results achieved by thecompany. In review meetings, follow-up activities andoptimization measures are determined at the manage-ment level as well as fundamental changes in directionwhen necessary.
The domestic production of paragon AG at the plants inDelbrück, Suhl, St. Georgen and Bexbach is uniformlycontrolled by productronic GmbH. The aim is to in-crease efficiency by reducing production costs. In addi-tion to the automation of production processes, themain focus here is on reducing quality costs.
To provide the Group with a better overview of theeconomic situation as well as improved planning andmanagement of operational processes, the ERP systemMicrosoft Dynamics AX will be used across the Group.
paragon AG has a comprehensive planning and controlsystem for implementing its strategic planning into its
operations. This includes constant monitoring of week-ly, monthly and annual plans. The Management Boardof paragon AG receives a detailed report as part of amonthly review on business development. These re-ports document possible deviations from the plannedfigures in a target/actual comparison and provide thebasis for decisions. Another important control instru-ment is the regular manager meetings, where the cur-rent developments in the individual segments and medi-um to long-term outlooks are discussed in addition toregular interdisciplinary and segment-related projectstatus meetings.
Financial Performance Indicators
The Management Board regularly uses key figures tomeasure the economic success of the operative imple-mentation of its corporate strategy. The control systemtakes into account the type and/or amount of one-timeor extraordinary effects on the performance indicators,particularly regarding the new operating segments Elec-tromobility and Mechanics (Body Kinematics). Due tothese specific influences, the internal targets are gener-ally set as bandwidths for measuring and managing op-erative performance, depending on the respective plan-ning horizon. The relative development of the keyfigures of Group sales, EBIT margin and investments isobserved using rolling medium-term planning that ac-counts for experience curve effects within a given corri-dor. Given the dynamic growth strategy, this facilitatesforward-looking management in terms of both risk- andopportunity-oriented corporate governance.
Group Revenue
The established range of electronic components offeredon the market includes a broad portfolio of sensors, mi-crophones and display instruments that are in variousphases of their product life cycles. This is contrasted bythe most recent product innovations, which representfuture revenue drivers that are dependent on thelaunch of new car models or model generations by au-tomotive manufacturers. A product’s revenue contribu-
C O M B I N E D M A N A G E M E N T R E P O R T F O R F I S C A L 2 0 1 7 2 3

tion varies principally during the various phases of itslife cycle. The take-rates of the products, which changeover time, are another influencing factor.
In contrast, paragon’s business activities in the fields ofe-mobility, which are represented by the publicly tradedsubsidiary Voltabox AG, and adjustable body compo-nents, which are represented by the subsidiaries KarTecGmbH and paragon movasys GmbH, are aimed atyoung submarkets that are growing at different rates. Inits development of drive controls for movable bodycomponents, paragon has initially focused on premiumsports cars. These technologically challenging, safety-related products are currently being produced in rela-tively small quantities and their impact on revenue iscorrespondingly low. The development of revenue ismainly attributable to the start of serial production forthe latest generation of adaptively extendible rear spoil-ers. However, the significance of movable body compo-nents will continue to increase as auto aerodynamics –and thus their CO2 emissions – also continue to grow inimportance.
The business activity in the field of e-mobility, which isrepresented by the publicly traded subsidiary VoltaboxAG, already accounts for a significant share of Groupsales in the year under review. The future annualgrowth rates of revenue depend on the mix of the re-spective application areas. While large and complex bat-tery systems with many battery modules are used fortrolleybuses and especially for mining vehicles as part ofproject business, the serial production of battery mod-ules for forklifts and automated guided vehicles as wellas starter batteries for motorcycles comes closer to be-ing definable as mass production.
As such, Group revenue is subject to a series of influ-ences relating to type, scope and direction, which areall regularly evaluated. This fact is accounted for withthe provision of a target corridor when providing fore-casts.
Group EBIT Margin
EBIT represents Group earnings before interest andtaxes and provides a general snapshot of a company’soperative profitability or efficiency. Profitability can becompared over time and internationally – irrespective ofvarying financial structures and income taxes.
In terms of corporate management, however, EBIT isnot defined by the Management Board as a stand-alonecorporate monetary target (in absolute terms). Instead,the development of operative earnings is managed insuch a way that the strategically defined growth coursecan be implemented with appropriate profitability. Tak-ing into account the development of revenue, all rele-vant expenses are therefore included in the company’sforward-looking management. This fact is accounted forwith the provision of the EBIT margin as a relative keyfigure when providing forecasts. This means that medi-um-term planning also accounts for the dynamic effectsthat arise over time in expenditure and income posi-tions.
Investments
For paragon, investments are a key factor for managingthe dynamic growth strategy as part of medium-termplanning. Since this involves the long-term commitmentof financial resources in property, plant and equipmentand intangible assets, the investment decisions of theManagement Board are made as a result of a structuredand careful decision-making process. This process takesinto particular account the impact of investment deci-sions on the non-monetary corporate objectives stem-ming from the corporate strategy. In addition to an ear-ly expansion into profitable market niches withindependently developed product innovations that aimto take advantage of megatrends, the high technologicaland quality requirements in the serial production oflarge quantities is particularly relevant.
2 4 | P A R A G O N A G A N N U A L R E P O R T 2 0 1 7

Furthermore, investment decisions are used to react tomarket developments within the framework of the dy-namic growth strategy, thereby making the most of thepotential for growth in the short and medium term. Fi-nally, the investment decisions account for the Group’sR&D activities. The forecast therefore shows the allplanned investments to highlight the medium-term dy-namics in the operational implementation of the growthstrategy.
In the past fiscal year, paragon once again investedheavily in the further expansion of its business activities.Investments of the Group in intangible assets amountedto about € 17.1 million (prior year: € 14.4 million). Ofthe development work capitalized of € 16.4 million (pri-or year: € 15.3 million), € 15.8 million related to ownwork pursuant to IAS 38 (prior year: € 14.3 million),about 37% which can be attributed to the Electronicsoperating segment, 33% to the Electromobility operat-ing segment and about 30% the Mechanics operatingsegment.
Investments of the Group in property, plant and equip-ment amounted to roughly € 4.7 million (prior year:€ 7.7 million). These related to the building expansion ofArtegastraße 1 (€ 0.4 million), testing equipment (€ 0.3million) and various technical machines and plants forthe ongoing production process (€ 4.0 million).
Nonfinancial Performance Indicators
As the company is strategically positioned as an innova-tive provider of technologically sophisticated and high-quality products and systems that are based on currentmegatrends, the Management Board also uses nonfi-nancial performance indicators as part of its corporatemanagement. Employees and the area of quality andenvironment are critical success factors for paragon inthis respect.
Employees
The current megatrends are leading to a fundamentalchange in the value chain of the automotive sector. Thisalso has an influence on the future qualification require-ments of employees. The operational implementation ofthe growth strategy also necessitates an ongoing reviewand adaptation of both procedural organization andprocesses. At the same time, the business model of in-dependently developing product innovations requiresthe targeted further development of the existing inno-vation culture within the company. Essential elementsfor this are the anchoring of entrepreneurial thinkingand responsible, independent action along with barrier-free internal communication. Development processesare being converted to conform with the principles ofagile project management in order to better meet theever-shorter model generation and maintenance cyclesof automotive manufacturers. Creativity, self-confi-dence and inspiration play a special role here. The cre-ation of efficient project teams – also across differentlocations and business units – is becoming increasinglyimportant.
The successful sourcing, development and retention ofqualified employees are therefore particularly importantfor the successful implementation of the growth strate-gy. In the fiscal year 2017, 133 new employees werehired across the Group (prior year: 95). Of these, 47were hired by the Voltabox subsidiaries (prior year: 20)and 86 were added to the other Group companies (pri-or year: 75). In this context, 62 new positions were cre-ated within the Group (prior year: 55). Another 102 em-ployees were added in December via the acquisition ofHS Genion GmbH (now paragon movasys GmbH). Theturnover rate was 5.1% (prior year: 11.8%). The share offemale employees in the Group was down slightly at25.7% (prior year: 34.5%). At 28.3%, the number of em-ployees with university degrees, however, was downslightly (prior year: 31.8%). The average employee ageincreased minimally to 43.1 years (prior year: 42.8).
C O M B I N E D M A N A G E M E N T R E P O R T F O R F I S C A L 2 0 1 7 2 5
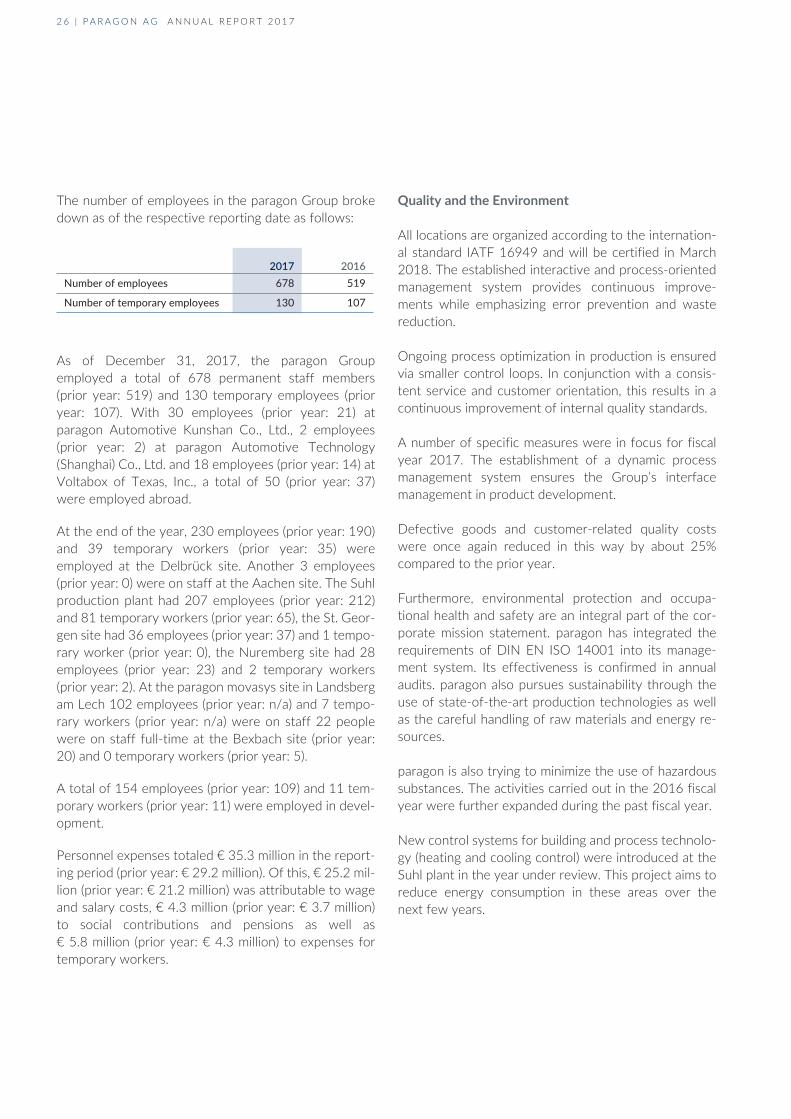
The number of employees in the paragon Group brokedown as of the respective reporting date as follows:
As of December 31, 2017, the paragon Groupemployed a total of 678 permanent staff members(prior year: 519) and 130 temporary employees (prioryear: 107). With 30 employees (prior year: 21) atparagon Automotive Kunshan Co., Ltd., 2 employees(prior year: 2) at paragon Automotive Technology(Shanghai) Co., Ltd. and 18 employees (prior year: 14) atVoltabox of Texas, Inc., a total of 50 (prior year: 37)were employed abroad.
At the end of the year, 230 employees (prior year: 190)and 39 temporary workers (prior year: 35) wereemployed at the Delbrück site. Another 3 employees(prior year: 0) were on staff at the Aachen site. The Suhlproduction plant had 207 employees (prior year: 212)and 81 temporary workers (prior year: 65), the St. Geor-gen site had 36 employees (prior year: 37) and 1 tempo-rary worker (prior year: 0), the Nuremberg site had 28employees (prior year: 23) and 2 temporary workers(prior year: 2). At the paragon movasys site in Landsbergam Lech 102 employees (prior year: n/a) and 7 tempo-rary workers (prior year: n/a) were on staff 22 peoplewere on staff full-time at the Bexbach site (prior year:20) and 0 temporary workers (prior year: 5).
A total of 154 employees (prior year: 109) and 11 tem-porary workers (prior year: 11) were employed in devel-opment.
Personnel expenses totaled € 35.3 million in the report-ing period (prior year: € 29.2 million). Of this, € 25.2 mil-lion (prior year: € 21.2 million) was attributable to wageand salary costs, € 4.3 million (prior year: € 3.7 million)to social contributions and pensions as well as€ 5.8 million (prior year: € 4.3 million) to expenses fortemporary workers.
2017 2016Number of employees 678 519
Number of temporary employees 130 107
Quality and the Environment
All locations are organized according to the internation-al standard IATF 16949 and will be certified in March2018. The established interactive and process-orientedmanagement system provides continuous improve-ments while emphasizing error prevention and wastereduction.
Ongoing process optimization in production is ensuredvia smaller control loops. In conjunction with a consis-tent service and customer orientation, this results in acontinuous improvement of internal quality standards.
A number of specific measures were in focus for fiscalyear 2017. The establishment of a dynamic processmanagement system ensures the Group’s interfacemanagement in product development.
Defective goods and customer-related quality costswere once again reduced in this way by about 25%compared to the prior year.
Furthermore, environmental protection and occupa-tional health and safety are an integral part of the cor-porate mission statement. paragon has integrated therequirements of DIN EN ISO 14001 into its manage-ment system. Its effectiveness is confirmed in annualaudits. paragon also pursues sustainability through theuse of state-of-the-art production technologies as wellas the careful handling of raw materials and energy re-sources.
paragon is also trying to minimize the use of hazardoussubstances. The activities carried out in the 2016 fiscalyear were further expanded during the past fiscal year.
New control systems for building and process technolo-gy (heating and cooling control) were introduced at theSuhl plant in the year under review. This project aims toreduce energy consumption in these areas over thenext few years.
2 6 | P A R A G O N A G A N N U A L R E P O R T 2 0 1 7

Despite higher product quantities, electricity consump-tion at the Suhl plant was roughly on a par with the pri-or year’s level.
Other Control Benchmarks
In addition to the most important financial and nonfi-nancial performance indicators, further control bench-marks are used to manage the paragon Group. Theseother control benchmarks are of subordinate impor-tance compared to the performance indicators. TheManagement Board pays particular attention to the ac-tivities in research and development and materials man-agement in addition to the free liquidity and equity ratiobenchmarks as indicators for control and further devel-opment.
Research and Development
Specialist expertise and sufficient capacities in researchand development (R&D) are key success factors for abusiness model of active, independent product devel-opment. Therefore, paragon has defined this depart-ment as another control benchmark. The responsibilityfor the development of new products lies with the fivesegments (Sensors, Cockpit, Acoustics, Electromobilityand Body Kinematics), which are managed and coordi-nated in operating segments.
In the fiscal year 2017, paragon spent € 16.8 million(prior year: € 15.2 million) on internal R&D activities.This corresponds to 13.5% of revenue (prior year:14.8%). The ratio of capitalized development costs wasapproximately 93.7% (prior year: 94.1%) of overall re-search and development costs.
Across the period from 2011 to 2017, the ratio of cu-mulative capitalized development costs to total devel-opment costs was 75%. The Management Board viewsthe corresponding capitalization of this internal work asappropriate compared to others in the industry. The
number of employees in research and development in-creased during the reporting year by 37.3% to 165 (pri-or year: 120). That figure accounts for about 20.4% ofall Group employees (prior year: 19.2%).
The orientation of research and development towardsglobal megatrends was consistently pursued in 2017.Pressure is being felt across the entire automotive in-dustry that is characterized by the megatrends of cli-mate change/CO2 reduction, global urbanization and in-creasingly accelerated digitization. The keywordsconnectivity, autonomous driving, shared mobility, elec-tromobility and increased comfort are integral to thesemegatrends. It is impossible to overlook the fact that es-tablished and emerging OEMs are focusing their invest-ments in these areas. paragon recognized this at an ear-ly stage and focused its research and developmentactivities on these exact areas. Moreover, these mega-trends lead to a further increase in vehicle complexity,resulting in the further outsourcing of entire systems tothe supplier industry. paragon’s systematic expansion atthe system level in recent years has reached a new peakin all units as well as across the board.
The Acoustics unit presented the new 3D+ sound sys-tem in a demonstration vehicle at the High End in Mu-nich –the world’s leading trade fair for audio systems –with great interest from experts. The paragon 3D+sound system sets new standards in sound quality andinnovation and offers a perfectly balanced acousticexperience for every seat in the vehicle. A new audiosystem architecture was implemented in a PorscheCayenne as part of the trend towards digitization. De-centralized, networked amplifier modules were devel-oped for this purpose and installed together with 34loudspeakers. This system architecture resolves all theprevious disadvantages of analog cables and also bringssignificant cost and weight savings for the vehicle man-ufacturer. All development and implementation workwas performed internally. A wide range of experts werealready able to experience this unique sound system atvarious trade fairs and symposiums.
C O M B I N E D M A N A G E M E N T R E P O R T F O R F I S C A L 2 0 1 7 2 7

In addition to hardware implementation, the Acousticsunit continued to focus on the development of algo-rithms for future sound systems. By means of what iscalled a 3D-upmix algorithm, it is possible to transposeexisting stereo files into the 3D format. Moreover, thealgorithm was made ready for series production as partof in-car communications.
Digitization is also advancing in the development of mi-crophones. Alongside of the digitization of the systemarchitecture, the unit developed promising approachesfor a digital microphone that enables signals to be con-verted at nearly zero-loss quality.
The development activities of the Sensors unit were al-so significantly influenced by new developments aimedat rounding out paragon’s air-quality management sys-tem. This included the completion of the DUSTDETECTparticle sensor and DUSTPROTECT – a new type of fil-ter system for fine particulates. The DUSTDETECT par-ticle sensor solidifies paragon’s position as the marketleader for innovative air-quality management in vehicleinteriors. In addition to the typical fine particulatematter size of 2.5 µm, the sensor – developed entirelyby paragon – can also detect the size classes PM1.0,PM5.0 and PM10. Serial production readiness wasreached earlier than originally planned. Having securedan order from a German premium manufacturer, thefoundation for a new paragon sensor success story is al-ready being written, just as before with the AQS sensor.Serial production is slated for 2019. The fine particulatematter separator DUSTPROTECT is based on the devel-opment expertise from the AQI ionizer and its effective-ness is more than six times greater than modern HEPAair filters.
Along with finding solutions in air-quality management,the Sensors unit is also active in the megatrend field ofautonomous driving in cooperation with other businessunits. By linking these two areas of expertise, paragonhas created a completely new range of services at thesystem level. Here, we are focusing on reliably monitor-ing the driver’s condition via sensors, as, due to legalstipulations, every automated system must be able to
measure the driver’s readiness to assume control. De-termining vital signs through noncontact methods is akey competence that paragon has developed in 2017.
The megatrend of connectivity played a central role inthe Cockpit unit. In this context, new concepts of wire-less charging with 15W were developed to enable aharmonious integration into vehicle design concepts.The scalable paragon product MirrorPilot has addedfunctions for electric vehicles and is therefore the righthead unit solution for the future of urban mobility. Tosolve urban traffic problems, the connectivity modulefor car-sharing use also entered series production. Themodule allows smartphones to connect and control nu-merous car-sharing vehicle functions (vehicle access,vehicle status, etc.).
Another integral part of the Cockpit unit’s activities isthe development and integration of luxurious vehicle in-struments. A new generation of instruments for a Ger-man sports car manufacturer has been brought into se-ries production. At the same time, the first exemplars ofthe finest electronic serial clock available on the marketwere delivered to a customer.
The megatrends of connectivity and autonomous driv-ing will continue to create interesting development pos-sibilities for innovative interior control and display con-cepts in the coming year. For instance, paragon isdeveloping new display applications for new installationlocations in the vehicle cockpit. The expansion of theMirrorPilot head unit platform to include a combinationdisplay as well as concepts for a cloud-based head unitwill be of central importance.
In the Electromobility operating segment, the expansionof the product portfolio and customer projects, whichhave since been completed, were among the main fo-cuses of research and development. A 5Ah and a 10Ahmotorcycle starter battery were transferred from devel-opment to series production for a German manufactur-er. Furthermore, a battery kit was developed for a well-known manufacturer of automated guided vehicles andalso entered serial production.
2 8 | P A R A G O N A G A N N U A L R E P O R T 2 0 1 7

The following modules were added to the product port-folio:
• 4x9 LFP round cell module
• Pouch module for NMC and LTO chemistry
• Prismatic LFP module
• Finalization of the 25Ah racing battery
At the U.S. site, initial prototypes and preseries batterieswere delivered to a world market leader in mining vehi-cles. Using the brand-new 4x9 LFP round cell modules,a battery system for an underground tractor vehicle wasdeveloped and delivered as a prototype. A prototypebattery system with the NMC chemistry pouch modulewas also developed and delivered for use in an under-ground loader.
Materials Management
Materials management plays a special role at paragonwith its production-intensive plants and broad productportfolio. In the reporting year, the material input ratiowas 57.1% (prior year: 56.2%). The operational imple-mentation of the dynamic growth strategy, especially inthe new units, requires the targeted enhancement ofexisting structures and processes. As a result, materialsmanagement has the function of an internal benchmark.
The close cooperation with select high-performancesuppliers and a demand-oriented purchasing policy alsoformed the basis for procurement in fiscal year 2017.The aim of this approach was to be able to achieve am-bitious production targets even in the case of short-term and large-volume orders by automobile manufac-turers as well as individual project developments ine-mobility.
In particular, the integration of HS Genion GmbH (re-named paragon movasys GmbH), which was acquired atthe end of 2017, has resulted in significant synergy ef-fects in materials management for the Body Kinematicsunit. In addition to pure quantity effects, this especiallyincludes the pooling of the supplier base. The establish-ment and expansion of the supplier management sys-tem through the creation of a separate department instrategic purchasing is intended to open up furthercost-cutting potentials with the suppliers via processoptimization in procurement, production and logistics.
In addition, paragon’s general make-or-buy strategy inthe area of materials management will continue to beconsistently implemented. This includes an expansion ofthe Plastics Center of Excellence with new machinesand systems at the St. Georgen location as well as anexpanded portfolio of technical plastic parts. Greaterflexibility will be achieved by increasing the verticalrange of manufacturing for technical plastic parts andassembly modules, welded assemblies and mechanicalsub-assemblies. In-house production also offers addi-tional cost reduction potential.
The organizational integration of sales and distributionfor serial and inventory products into materials manage-ment creates additional potential for optimizing theentire supply chain – from raw material to finishedproduct – for automobile manufacturers in terms ofquantity and supplier pooling.
Free Liquidity
The business model of paragon AG requires the ongo-ing availability of sufficient liquid funds. Further, liquidi-ty is considered an important economic indicator forthird parties looking to comparatively assess the respec-tive business situations of various companies. In addi-tion, the medium and long-term liquidity planning forservicing interest payments and repayments is con-stantly being reviewed by creditors. Finally, the compa-ny’s liquidity planning contributes to the internal man-agement of the balance sheet structure.
C O M B I N E D M A N A G E M E N T R E P O R T F O R F I S C A L 2 0 1 7 2 9

Free liquidity includes all funding that is available withinthe paragon Group and is not intended to be used. Ac-cording to the definition of the company, the currentnet debt is therefore to be determined by subtractingfree liquidity from interest-bearing liabilities.
Free liquidity developed as of the reporting date as fol-lows:
Equity Ratio
The equity ratio is used by the Management Board asan internal indicator for the management of the capitalstructure. The capital-intensive growth strategy of thecompany requires a comparatively high proportion ofleverage in the current development phase in order toensure adequate profitability of the equity capital em-ployed by the shareholders (leverage effect). The equityratio reflects the respective current state of the invest-ment cycle in the development of the new Body Kine-matics and Electromobility units. In the long term, theManagement Board sees an equity ratio of about 30%as optimal.
The equity ratio developed as of the reporting date asfollows:
Financial Management
The financial management of the company does not in-clude an independent target system. Rather, the Man-agement Board uses internal financial management to
In € thousands 2017 2016Free liquidity 166,826 17,324
In Percent 2017 2016Equity ratio 56.8 30.0
plan and monitor the implementation of its growthstrategy. In this context, comprehensive financial plan-ning is carried out on the basis of revolving sales plan-ning, from which investment and liquidity plans are thenderived. In addition to the individual segments, the com-pany’s legal entities are viewed and consolidated at aGroup level on a monthly basis. The introduction of Mi-crosoft Dynamics AX as a uniform ERP system through-out the Group is intended to facilitate further expansioninto integrated financial planning.
Dividend Policy
Over the last few years, the Management Board has de-veloped a dividend policy that is designed to meet thecompany’s strategic goal of profitable growth. On theone hand, this is intended to enable paragon sharehold-ers to further increase the value of their shares throughdividend payments and provide an incentive for long-term investment decisions. On the other hand, the com-pany’s equity base should not be excessively burdenedduring its capital-intensive growth phase. Corporateprofits are therefore largely reinvested. In the mediumterm, the Management Board would consider a dis-bursement ratio in the range of 20 to 40 percent ofparagon AG's balance sheet profit (as reported in the fi-nancial statements) as appropriate.
For the reporting year, the Management Board andSupervisory Board will propose a dividend of € 0.25(prior year: € 0.25) per participating share to theAnnual General Meeting. With a balance sheetprofit of € 4,196,526,44 for paragon AG (prior year:€ 1,379,069.79), this corresponds to a payout rate of27% (prior year: about 82%).
3 0 | P A R A G O N A G A N N U A L R E P O R T 2 0 1 7

Remuneration Report ofthe Management Board andSupervisory Board
The company is committed to a high degree of trans-parency in its reporting. This also applies to the remu-neration of the Management Board, which is disclosedand explained in full in the remuneration report, togeth-er with all its components and on an individualized ba-sis. The Management Board and Supervisory Boardhave therefore decided to use the Management Boardremuneration sample tables provided by the GermanCorporate Governance Code (GCGC) in the remunera-tion report.
Management Board Remuneration
The remuneration of the members of the ManagementBoard consists of an annual fixed remuneration, ancil-lary benefits and a one-year variable remuneration com-ponent. A cap (minimum/maximum) is not provided for
the variable compensation component. A variable com-pensation component for multiple years has not beenspecified. Finally, the total remuneration still includes aservice cost under IAS 19. This is recognized pursuantto the GCGC as part of total remuneration, even thoughthis is not a newly granted contribution in the narrowersense, but a past decision of the Supervisory Board thatcontinues to be effective.
The total remuneration of the Management Board con-tains salaries and short-term benefits of € 1,238 thou-sand (prior year: € 1,235 thousand) and includes fixedcomponents of € 860 thousand (prior year: € 854 thou-sand) and variable components of € 376 thousand (prioryear: € 380 thousand). The main ariable remunerationcomponents are oriented on EBITDA as defined by IFRSand the economic situation of the company. Expensesrelating to share-based remuneration were not incurredin the year under review (prior year: € 0). Service costsamounted to € 2 thousand (prior year: € 2 thousand).
The following table shows the contributions granted tothe members of the Management Board in the report-ing year:
C O M B I N E D M A N A G E M E N T R E P O R T F O R F I S C A L 2 0 1 7 3 1
Benefits granted Klaus Dieter Frers Dr. Stefan SchwehrChief Executive Officer Chief Technology Officer Electronics
in € Date joined: April 11, 1988 Date joined: April 1, 2014
2017 2016 2017 2016
Fixed compensation 600,000.00 600,000.00 200,000.00 200,000.00
Fringe benefits 51,792.52 44,421.00 8,688.00 9,209.28
Total 651,792.52 644,421.00 208,688.00 209,209.28
One-year variable compensation* 332,000.00 334,663.53 44,000.00 45,336.47
Total 983,792.52 979,084.53 252.680.00 254,545.75
Service cost 1,789.56 1,789.56 0.00 0.00
Total compensation 985,582.08 980,874.09 252,688.00 254,545.75
* Uncapped (minimum/maximum)

The following table shows the contributions paid to themembers of the Management Board in the reportingyear:
* Uncapped (minimum/maximum)
paragon AG incurred expenses for the allocation ofpension provisions to Klaus Dieter Frers amounting to €364 thousand (prior year: € 232 thousand) in the finan-cial statements of paragon AG according to the GermanCommercial Code (HGB).
paragon AG incurred expenses for the allocation ofpension provisions to Klaus Dieter Frers amounting to €251 thousand (prior year: € 429 thousand) in the con-solidated financial statements of paragon Group (IFRS).
Supervisory Board Remuneration
In accordance with the Articles of Association, the re-muneration of the members of the Supervisory Boardis determined by the Annual General Meeting andconsists of a fixed remuneration. The SupervisoryBoard Chairman receives € 60 thousand and the re-maining members of the Supervisory Board each re-ceive € 30 thousand per fiscal year.
The members of the Supervisory Board received fixedremuneration totaling of € 120 thousand in the yearunder review (prior year: € 120 thousand).
The following table shows the remuneration of theSupervisory Board members:
3 2 | P A R A G O N A G A N N U A L R E P O R T 2 0 1 7
Allocation Klaus Dieter Frers Dr. Stefan SchwehrChief Executive Officer Chief Technology Officer Electronics
in € Date joined: April 11, 1988 Date joined: April 1, 2014
2017 2016 2017 2016
Fixed compensation 600,000.00 600,000.00 200,000.00 200,000.00
Fringe benefits 51,792.52 44,421.00 8,688.00 9,209.28
Total 651,792.52 644,421.00 208,688.00 209,209.28
One-year variable compensation* 482,760.00 426,360.00 65,230.00 60,530.00
Total 1.134,552.52 1,070,781.00 273,918.00 269,217.67
Service cost 1,789.56 1,789.56 0.00 0.00
Total compensation 1,136,552.52 1,072,570.56 273,918.00 269,217.67
Prof. Dr. Lutz Eckstein Hermann Börnemeier Walter Schäfersin € Chairman of the Supervisory Board Dep. Chairman of the Supervisory Board
2017 2016 2017 2016 2017 2016
Fixed compensation 60 60 30 30 30 30
Total compensation 60 60 30 30 30 30

Economic Report
Global Economic Conditions
In its global economic outlook in6 October 2017, the In-ternational Monetary Fund (IMF) indicated a positiveglobal economic situation with accelerated growth in theeurozone, Japan, China and the U.S. Global economicgrowth was estimated at 3.6% for 2017, the second-weakest year of growth (following 2016 at 3.2%) sincethe financial crisis. The unequal distribution of economicgrowth between the developed economies (2.2%) andthe emerging countries (4.6%) remained unchanged.Overall, however, the global economy benefited fromgrowth on a broad basis (approximately 75%). In particu-lar, economic growth in the U.S. was estimated to haveamounted to 2.2% in 2017, 2.1% in the eurozone, 2.0%in Germany and 6.8% in China.
In this good economic environment, the German econo-my proved to be very robust in the past fiscal year. Ac-cording to data from the German Federal Statistical Of-fice (“Destatis”)7, following price, seasonal and calendaradjustment, gross domestic product (GDP) rose 2.3% inthe fourth quarter of 2017. This follows increases of2.2% in the third quarter, 1.0% in the second quarterand 3.4% in the first quarter. Private consumer spend-ing, which is important for the automotive industry, con-tributed strongly to the positive momentum in thefourth quarter. It posted an adjusted growth of 0.7% af-ter 1.1% in the third quarter, 1.1% in the second quarterand 1.2% in the first quarter.
As a supplier to the automotive industry, paragon gener-ated the lion’s share of its revenue in fiscal year 2017with automotive manufacturers – particularly those inthe premium segment, headquartered in Germany and inthe European Union. These, in turn, sell the vehiclesthey produce worldwide. Overall economic develop-ment is therefore important for paragon in that it affectsthe sales opportunities for the automotive manufactur-ers it supplies, and thus also indirectly affects the devel-opment of private consumer demand for paragon prod-ucts.
Market Development 2017
In line with the general economic trend, the automotiveindustry also developed positively in the past fiscal year.
According to estimates from the German Association ofthe Automotive Industry8 (hereinafter also referred toas VDA), the global passenger car market grew by 1.7%to 84.6 million new cars in 2017; China was the largestsales market, recording an increase of 2% to 24.1 mil-lion new cars.
For the U.S. light vehicle market, the VDA expects aslight contraction for the first time in seven years, de-clining by 1.7% to 17.2 million units. Europe, however,continued its growth course in 2017 with an increase of3.3% to 15.6 million units. Of the TOP 5 in Europe (Ger-many, France, the U.K., Italy, Spain), only the UnitedKingdom showed a decline, which stemmed from theBrexit decision.
New registrations/sales of passenger cars developed inthe most important sales markets as follows:
million units 2017 2016 Change
USA 17.2 17.5 1.7%
Europe 15.6 15.1 3.3%
China 24.1 23.7 1.7%
On the whole, the VDA sees the German automotiveindustry as being well-positioned in 2017, with aglobal market share of almost 20% and a global pre-mium market share of more than 70%.
paragon’s five largest customers, Audi, Volkswagen,Porsche, Daimler and BMW, sold around 13.2 millionpassenger cars worldwide in the past fiscal year (prioryear: 12.3 million).9 This corresponds to growth forthis customer group of around 7.4%.
In the e-mobility market, 2017 continued to bemarked by dynamic market growth in the industrial
C O M B I N E D M A N A G E M E N T R E P O R T F O R F I S C A L 2 0 1 7 3 3
6 https://www.imf.org/en/Publications/WEO/Issues/2017/09/19/world-economic-outlook-october-20177 Federal Office of Statistics, press release from February 23, 2018 – 058/188 VDA press release from December 06, 2017: German passenger car market reaches highest level this decade9 Calculated from data provided in press releases by automotive manufacturers

submarkets relevant to Voltabox. This market dynam-ic was based on substitution effects in which dieselengines and lead-acid batteries were replaced withmodern lithium-ion battery systems.
All in all, paragon also experienced a positive eco-nomic environment during the past fiscal year.
Business Performance of the Group
The excellent operative performance in the young oper-ating segments Electromobility and Mechanics (BodyKinematics unit) was a key factor in the company’sgrowth in the fiscal year 2017.
The largest operating segment, Electronics, dominatedGroup activities with revenue of € 94.9 million (prioryear: € 89.5 million). Of this amount, € 90.8 million wereattributable to third-party revenue in the Sensors, Cock-pit and Acoustics units (prior year: € 85.3 million). At €33.8 million, revenue in the Sensors unit declined fromthe prior year’s level (prior year: € 34.6 million). This isprimarily due to life-cycle effects with simultaneouslyincreasing take-rates in the current vehicle models withthe latest sensor generation from paragon. Revenue inthe Cockpit unit increased by 5.8% to € 35.7 million(prior year: € 33.7 million), which was mainly due to anew generation of instrumentation. The Acoustics unitrecorded revenue growth of 25.8% to € 21.4 million(prior year: € 17.0 million) as a result of increased vol-
umes of the current version of the premium hands-freemicrophones. The EBIT for the operating segmentamounted to € 9.7 million (prior year: € 12.7 million).
Segment revenue in the Electromobility operating seg-ment rose to € 27.3 million (prior year: € 14.5 million),of which € 24.7 million was achieved with third parties.This operating segment is represented by the Voltaboxsubsidiaries in Germany and the U.S. With an increaseof 73.0% in third party revenues, this operating seg-ment posted disproportionately high growth dynamics.The largest growth driver was the serial production ofbattery modules for forklifts. EBIT for the operatingsegment amounted to € 0.6 million (prior year: € -3.7million).
Segment revenue in the Mechanics operating segmentamounted to € 74.1 million (prior year: € 60.3 million).Of this figure, € 9.3 million was attributable to third-par-ty revenue in the Body Kinematics unit (prior year: € 3.2million). With an increase in growth of 188.0%, this op-erating segment also achieved particularly stronggrowth. Segment revenue with third parties was mainlycharacterized by the parallel start of serial productionfor new generations of freely adjustable rear spoilersthat optimize vehicle aerodynamics. EBIT for the oper-ating segment amounted to € 1.2 million (prior year:€ -0.1 million).
3 4 | P A R A G O N A G A N N U A L R E P O R T 2 0 1 7
Segment revenue (third party) 2017 Share 2016 Share Changein € thousands in % in % in %
Electronics(Sensors, Cockpit, Acoustics) 90,799 72.7 85,280 83.0 6.5
Electromobility 24,694 19.8 14,271 13.9 73.0
Mechanics(Body Kinematics) 9,330 7.5 3,239 3.1 188.0
Total 124,823 100.0 102,790 100.0 21.4
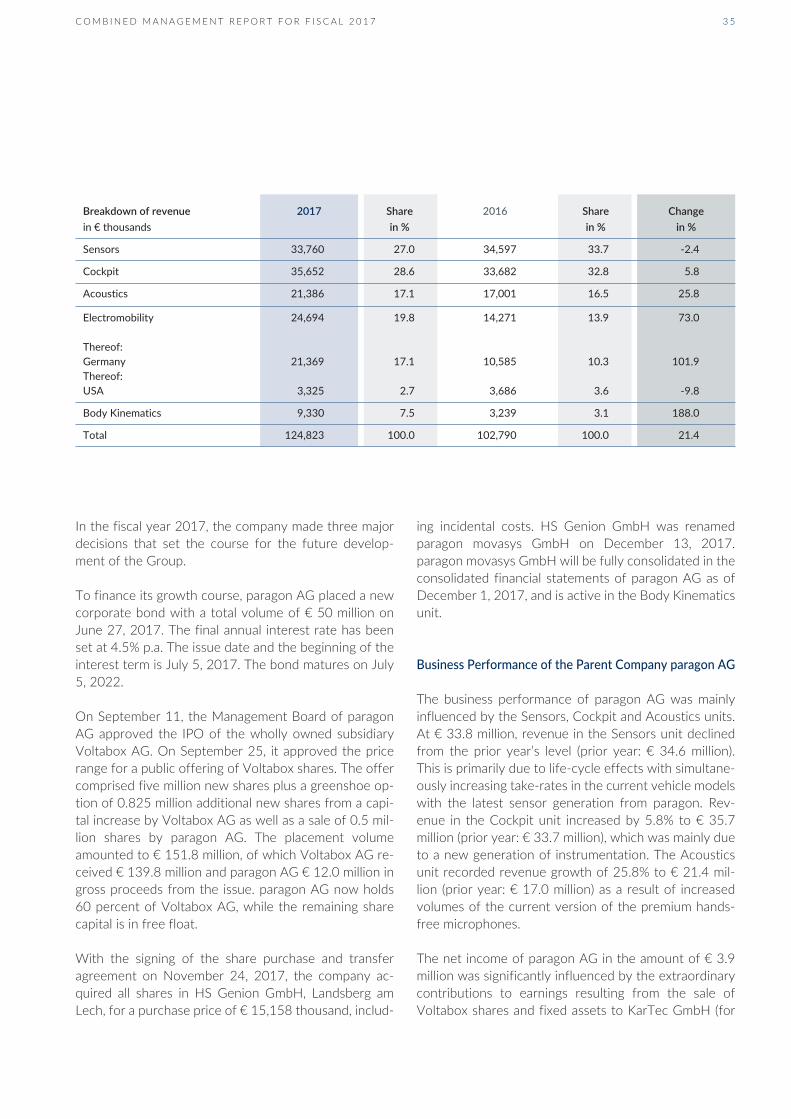
In the fiscal year 2017, the company made three majordecisions that set the course for the future develop-ment of the Group.
To finance its growth course, paragon AG placed a newcorporate bond with a total volume of € 50 million onJune 27, 2017. The final annual interest rate has beenset at 4.5% p.a. The issue date and the beginning of theinterest term is July 5, 2017. The bond matures on July5, 2022.
On September 11, the Management Board of paragonAG approved the IPO of the wholly owned subsidiaryVoltabox AG. On September 25, it approved the pricerange for a public offering of Voltabox shares. The offercomprised five million new shares plus a greenshoe op-tion of 0.825 million additional new shares from a capi-tal increase by Voltabox AG as well as a sale of 0.5 mil-lion shares by paragon AG. The placement volumeamounted to € 151.8 million, of which Voltabox AG re-ceived € 139.8 million and paragon AG € 12.0 million ingross proceeds from the issue. paragon AG now holds60 percent of Voltabox AG, while the remaining sharecapital is in free float.
With the signing of the share purchase and transferagreement on November 24, 2017, the company ac-quired all shares in HS Genion GmbH, Landsberg amLech, for a purchase price of € 15,158 thousand, includ-
ing incidental costs. HS Genion GmbH was renamedparagon movasys GmbH on December 13, 2017.paragon movasys GmbH will be fully consolidated in theconsolidated financial statements of paragon AG as ofDecember 1, 2017, and is active in the Body Kinematicsunit.
Business Performance of the Parent Company paragon AG
The business performance of paragon AG was mainlyinfluenced by the Sensors, Cockpit and Acoustics units.At € 33.8 million, revenue in the Sensors unit declinedfrom the prior year’s level (prior year: € 34.6 million).This is primarily due to life-cycle effects with simultane-ously increasing take-rates in the current vehicle modelswith the latest sensor generation from paragon. Rev-enue in the Cockpit unit increased by 5.8% to € 35.7million (prior year: € 33.7 million), which was mainly dueto a new generation of instrumentation. The Acousticsunit recorded revenue growth of 25.8% to € 21.4 mil-lion (prior year: € 17.0 million) as a result of increasedvolumes of the current version of the premium hands-free microphones.
The net income of paragon AG in the amount of € 3.9million was significantly influenced by the extraordinarycontributions to earnings resulting from the sale ofVoltabox shares and fixed assets to KarTec GmbH (for
C O M B I N E D M A N A G E M E N T R E P O R T F O R F I S C A L 2 0 1 7 3 5
Breakdown of revenue 2017 Share 2016 Share Changein € thousands in % in % in %
Sensors 33,760 27.0 34,597 33.7 -2.4
Cockpit 35,652 28.6 33,682 32.8 5.8
Acoustics 21,386 17.1 17,001 16.5 25.8
Electromobility 24,694 19.8 14,271 13.9 73.0
Thereof:Germany 21,369 17.1 10,585 10.3 101.9Thereof:USA 3,325 2.7 3,686 3.6 -9.8
Body Kinematics 9,330 7.5 3,239 3.1 188.0
Total 124,823 100.0 102,790 100.0 21.4

further details, please refer to the Net Assets, FinancialPosition and Earnings section).
Key Factors of Business Performance
The business performance of the paragon Group duringthe past fiscal year was again mainly characterized by anincrease in the take-rate for certain air quality sensorsand an increase in the output volume of the latest gen-eration of hands-free microphones as well as severalproduction starts for display instruments and the latestgeneration of adjustable spoilers. At the same time, pro-duction volumes for older product generations fell aspart of their life cycles.
Furthermore, the relative composition of the customerstructure changed over the course of the year accord-ing to the successive implementation of the growthstrategy. This was mainly attributable to the significantgrowth in the Electromobility operating segment, whichfed off of the particularly dynamic development in theintralogistics market.
At the same time, the revenue share with the automo-bile manufacturers fell, while a further widening of thecustomer base was achieved by expanding activitieswith other customers. The different model cycles of therespective manufacturers and the time schedules formodel maintenance and changes additionally influencedthis development.
In the past fiscal year, the development and productionof lithium-ion battery systems for industrial applicationshad a major impact on the course of business in theElectromobility operating segment, which is represent-ed by the 60 percent-owned subsidiary Voltabox AG.These include, in particular, local public transportation(trolleybuses), intralogistics (forklift trucks and automat-ed guided vehicles) as well as mining and agricultural ve-hicles. Business performance was increasingly dominat-ed by the automated series production of ready-to-usebattery modules for intralogistics for the customer
Triathlon. In addition, serial production of 5Ah and10Ah starter batteries for BMW motorcycles began inthe third quarter. The first series-produced battery sys-tems for the first application in mining were delivered inthe fourth quarter. Moreover, business was character-ized by the construction of a further prototype for anewly designed large underground mining vehicle fromKomatsu and the development of power electronics.
Assets, Financial Position and Earnings
Earnings of the paragon Group
The paragon Group continued its growth dynamics infiscal year 2017 with revenue growth of 21.4% toaround € 124.8 million (prior year: € 102.8 million) andtherefore reached the top of the expected corridor ofits revenue forecast. With a Group EBIT margin of 9.0%(adjusted for one-time effects), the ManagementBoard’s profit forecast of approximately 9% was like-wise achieved.
The cost of materials increased 23.4% to € 71.2 million(prior year: € 57.7 million). Apart from a modified prod-uct mix due to the establishment of new units, this de-velopment is particularly due to various one-time start-up costs. The material input ratio was accordingly higherat 57.1% (prior year: 56.2%). Development work capi-talized was up by 7.0% to € 16.4 million (prior year: €15.3 million). This resulted in a gross profit for the fiscalyear 2017 of € 70.2 million (prior year: € 60.5 million),which corresponds to a gross profit margin of 56.3%(prior year: 58.9%).
Personnel costs increased particularly strongly by20.6% to € 35.3 million (prior year: € 29.2 million) main-ly as a result of new hires in connection with operationalgrowth in the new Electromobility and Mechanics oper-ating segments as well as in central Group functions.The personnel expense ratio was accordingly slightly
3 6 | P A R A G O N A G A N N U A L R E P O R T 2 0 1 7

lower at 28.2% (prior year: 28.5%). Other operating ex-penses increased from € 15.2 million in the prior year to€ 17.9 million. This is mainly attributable to the opera-tive growth within the Group. Earnings before interest,taxes, depreciation and amortization (EBITDA) there-fore rose 5.8% to € 17.0 million (prior year: € 16.1 mil-lion), which corresponds to an EBITDA margin of 13.6%(prior year: 15.7%).
After a planned significant increase to depreciation andamortization of € 9.4 million (prior year: € 7.1 million),earnings before interest and taxes (EBIT) decreased14.5% to € 7.6 million (prior year: € 8.9 million) thankslargely to the € 2.7 million increase in other operatingexpenses. The EBIT margin therefore decreased to6.1% (prior year: 8.7%). An adjusted EBIT margin of9.0% results when one-time effects in the Mechanicsoperating segment are accounted for. These consist ofstart-up costs and an increased cost of materials due tothe construction of prototypes amounting to € 1.4 millionas well as one-time expenses not yet passed on to cus-tomers in the past fiscal year amounting to € 2.2 million.
As a result of a slight increase in financial income andsignificantly higher financial expenses, the net financecosts increased to € -4.4 million (prior year: € -3.2 mil-lion). As a result, earnings before taxes (EBT) fell to€ 3.2 million (prior year: € 5.8 million). Taking into ac-count higher income taxes (deferred tax assets) of € 3.9million (prior year: € 2.2 million), the paragon Groupgenerated a loss for the year (prior year: Group net in-come) of € -0.7 million (prior year: € 3.6 million). Thiscorresponds to earnings per share of € -0.15 (prior year:€ 0.84).
The portion of net income attributable to minority inter-ests is € 3,873 thousand. The portion of other compre-hensive income attributable to minority interests is € -407 thousand. The balance of net income and otherincome and expenses of € 3,466 thousand was allocat-ed to minority interests.
Net Assets of the paragon Group
As of the end of the reporting period, the assets ofparagon AG increased significantly to € 311.8 million(December 31, 2016: € 115.6 million) mainly as a resultof the capitalization of development costs, the issue ofthe 2017/2022 bond with a volume of € 50 million atthe end of the first half of 2017, the IPO of thesubsidiary Voltabox AG in the fourth quarter, the ac-quisition of HS Genion GmbH (now paragon movasysGmbH) as well as the increase in receivables in theElectromobility operating segment.
Noncurrent assets increased to € 111.8 million (Decem-ber 31, 2016: € 75.9 million). The reason for this in-crease is the continued high capitalized developmentcosts of € 16.4 million (prior year: € 15.3 million) due toa large number of new projects in the year under re-view. The remaining increase is mainly due to the acqui-sition of paragon movasys GmbH on November 24,2017, and its initial consolidation. Intangible assets of €10.4 million and goodwill of € 6.6 million were allocatedas part of the initial consolidation. Please refer to sec-tion 6 in the notes for details. In the year under review,the Management Board issued an investment forecastof around € 27.0 million, which, adjusted for transactioninvestments of € 22.5 million, was fulfilled.
Current assets increased to € 200.1 million (December31, 2016: € 39.7 million). This is mainly attributable tothe increase in cash and cash equivalents due to thebond issue with a volume of € 50.0 million and the IPOof the subsidiary Voltabox AG, which resulted in a cashinflow of € 150.0 million. The acquisition of paragonmovasys GmbH represents a significant outgoing pay-ment in the area of cash and cash equivalents. Overall,this resulted in significantly higher cash and cash equiv-alents of € 145.8 million (December 31, 2016: € 14.3million). In addition, inventories increased to € 17.3 mil-lion (December 31, 2016: € 13.7 million) as a result ofthe expansion of business activities and an increase in
C O M B I N E D M A N A G E M E N T R E P O R T F O R F I S C A L 2 0 1 7 3 7

trade receivables to € 32.7 million (December 31, 2016:€ 8.4 million). This is attributable to changes in theterms and conditions of contracts in the Electromobilityunit.
Noncurrent provisions and liabilities increased signifi-cantly by € 43.5 million to € 88.4 million (December 31,2016: € 44.9 million), which was mainly due to higherdeferred taxes and the increase in noncurrent bonds re-lated to the issue of the 2017/22 bond with a volumeof € 50 million. By contrast, noncurrent loans decreasedto € 16.4 million (December 31, 2016: € 20.4 million) asa result of repayments. Current provisions and liabilitiesincreased to € 46.4 million (December 31, 2016: € 36.0million). In addition to the decline in current loan liabili-ties to € 4.6 million (December 31, 2016: € 12.4 million)due to reductions in current account lines, this develop-ment is particularly attributable to the 2013/18 corpo-rate bond maturing in 2018 with a total volume of€ 13.0 million. The slightly higher trade payables of€ 17.5 million (December 31, 2016: € 16.4 million) aredue to the expansion of business activities.
paragon AG’s equity increased by € 142.4 million to€ 177.1 million (December 31, 2016: € 34.7 million).The profit carried forward increased to € 106.0 million(December 31, 2016: € 12.9 million) as a consequenceof Voltabox AG’s IPO. Furthermore, the share of othershareholders (39.97%) in Voltabox AG of € 57.9 millionwas reported for the first time.
Given the sharp rise in total assets, the equity ratio in-creased to 56.8% as of the reporting date (December31, 2016: 30.0%).
Financial Position of the paragon Group
Cash flow from operating activities decreased in the pe-riod under review to € -8.4 million (prior year: € 16.8 mil-lion). In addition to the lower earnings before taxes(EBT), this is primarily due to a significant increase intrade receivables and an increase in inventories.
Adjusted for transaction investments, cash flow from in-vestment activity decreased in the period under reviewby 3.2% to € 21.3 million (prior year: € 22.0 million).This development is the result of the sharp decrease of39.0% in payments for investments in property, plantand equipment, which amounted to € 4.7 million (prioryear: € 7.7 million), while payments for investments inintangible assets were up 18.7% to € 17.1 million (prioryear: € 14.4 million). The increased transaction invest-ments of € 15.9 million in the year under relate to theacquisition of HS Genion GmbH and the last purchaseprice installment for SphereDesign GmbH
Cash and cash equivalents increased to € 145.8 millionas of the end of the reporting period (prior year: € 14.3million), which is mainly attributable to the issue of the2017/22 bond and the IPO of Voltabox AG in thefourth quarter 2017.
General Statement on the Net Assets, Financial Posi-tion and Earnings of the paragon Group
The company’s assets, financial position and earningsdeveloped as planned during the past fiscal year.
The earnings situation benefited mainly from thegrowth in revenue in the Electromobility operating seg-ment but was significantly burdened by one-time ef-fects of € 1.4 million in the Mechanics operating seg-ment as well as start-up costs and increased cost ofmaterials of € 2.2 million due to prototype constructionin the fiscal year.
The capitalization of development costs, the issue of the2017/2022 bond, the IPO of the subsidiary VoltaboxAG in the fourth quarter and the acquisition of paragonmovasys GmbH resulted in significantly higher net as-sets compared to the prior year.
The significantly more positive financial situation com-pared to the prior year was positively influenced by theissue of the 2017/2022 bond with a volume of € 50million in the first half of 2017 and the IPO of the sub-sidiary Voltabox AG.
3 8 | P A R A G O N A G A N N U A L R E P O R T 2 0 1 7

Earnings of paragon AG
paragon AG recorded a 13.5% decline in revenue inits financial statements to € 108.7 million (prior year:€ 125.7 million). This development is attributable to aone-time internal material cost allocation of € 24.3 mil-lion from the prior year. If only the external revenueof paragon AG is taken into account, there was an in-crease in revenue to € 94.1 million (prior year: € 84.3million).
The EBIT margin rose to 15.0% (prior year: 4.2%). Thereason for the increase in EBIT is the sale of assets anddevelopment work to the subsidiary KarTec GmbH witheffect as of December 28, 2017, and the sale of sharesin Voltabox AG in the course of the IPO in the fourthquarter.
Other operating income amounted to € 21.2 million inthe year under review (prior year: € 0.9 million). The in-crease is due to proceeds from the sale of shares inVoltabox AG (€ 11.5 million) on the one hand and thesale of assets and development work to the subsidiaryKarTec GmbH (€ 9.2 million) on the other.
The cost of materials ratio was 73.1% in the year underreview (prior year: 73.0%). As a result of the service costallocation agreement between paragon AG and paragonproductronic GmbH valid for the whole year in 2017,there is a significant reduction in raw materials, consum-ables and supplies in the year under review, as the com-plete production and the input of materials associatedwith the products are entirely borne by paragon pro-ductronic GmbH.
The personnel costs increased 10.4% to € 14.1 million(prior year: € 12.7 million). The reason for this increaseis the strong operational growth in the units and the re-sulting need to increase personnel capacity.
Other operating expenses amounted to € 14.8 million inthe year under review (prior year: € 13.9 million).
The increase in other operating expenses mainly resultsfrom higher consulting expenses as a result of the bondissue and the IPO of Voltabox AG
paragon AG’s net finance costs decreased to € -12.4 mil-lion (prior year: € -5.0 million). The increase is attributa-ble to the higher loss assumption of € 5.4 million. In to-tal, a loss assumption of € 9.9 million was made in thefiscal year (prior year: € 4.5 million). The transfer ofprofit or loss from the Voltabox AG subsidiary is madeup of the transferred profit of productronic GmbH of€ 0.3 million, the transferred profit of SphereDesignGmbH of € 0.1 million and the assumption of loss forVoltabox Deutschland GmbH of € 9.9 million combined.
In the period under review, paragon AG generated netincome of € 3.9 million (prior year: net loss of € 43thousand).
Net Assets of paragon AG
The assets of paragon AG increased significantly to€ 266.0 million as of the end of the reporting period(December 31, 2016: € 145.2 million), mainly as a resultof internal cost allocations to the subsidiaries and theacquisition of companies.
Fixed assets increased € 24.1 million to € 69.6 million(prior year: € 45.5 million). The main reason for this in-crease are the investment activities in financial assets.Investments in financial assets amounted to € 26.0 mil-lion and relate mainly to the purchase of paragonmovasys GmbH with a carrying amount of € 15.2 mil-lion as of the end of the reporting period and the capitalincrease of € 9.4 million from the investment inVoltabox AG (formerly Voltabox Deutschland GmbH).
Current assets increased to € 196.1 million (December31, 2016: € 99.5 million). This is mainly due to a signifi-cant increase in receivables from affiliated companies aspart of the internal cost allocation with subsidiaries.
C O M B I N E D M A N A G E M E N T R E P O R T F O R F I S C A L 2 0 1 7 3 9

Cash and cash equivalents increased to € 37.1 million(December 31, 2016: € 11.5 million). This is mainly dueto the issue of the 2017/22 bond with a volume of €50.0 million.
Equity increased by € 2.9 million from € 22.7 million to€ 25.6 million.
The provisions of paragon AG amounted to € 4.5 millionas of the end of the reporting period (December 31,2016: € 3.6 million). This increase is particularly due tothe higher warranty provision and personnel provisions.
Liabilities increased to € 234.9 million (December 31,2016: € 117.7 million). This is mainly due to the internalcost allocation between the subsidiaries as well as the2017/22 bond issue.
Financial Position of paragon AG
Cash flow from operating activities decreased in the pe-riod under review to € 6.7 million (prior year: € 9.8 mil-lion). This is primarily due to the significantly higher in-terest charges and lower inventories.
Cash flow from investment activity increased in the pe-riod under review to € 17.6 million (prior year: € 16.9million). This development resulted from the significantincrease in payments for investments in financial assetsto € 26.0 million (prior year: € 10.3 million).
Cash and cash equivalents increased to € 37.1 million asof the end of the reporting period (prior year: € 11.5million), mainly as a result of the issue of the2017/2022 bond and the pro rata sale of shareholdingsin Voltabox AG.
General Statement on the Net Assets, Financial Posi-tion and Earnings of paragon AG
The net assets, financial position and results of opera-tions developed as planned in the past fiscal year,and
the Management Board considers the operative per-formance favorable. The earnings situation benefitedmainly from the proceeds from the internal sale of de-velopment work and the partial sale of shares inVoltabox AG. The balance sheet volume increased sig-nificantly as a result of the increase in receivables fromand payables to affiliated companies as a result of inter-nal cost allocation and the issue of the 2017/2022bond. The financial position in the period under reviewwas characterized in particular by the inflow of fundsfrom the bond issue.
4 0 | P A R A G O N A G A N N U A L R E P O R T 2 0 1 7

Opportunity and Risk Report
paragon has established a comprehensive risk manage-ment system to identify opportunities and risks in cor-porate development. All the operating segments regu-larly issue risk reports, from which management isinformed about the probability of occurrence and possi-ble damages resulting from the risks identified. The riskreports contain an assessment of the risks as well assuggestions for appropriate countermeasures. For in-formation on the risk management objectives and meth-ods with regard to the use of derivative financial instru-ments, please refer to the notes (note 38).
Opportunity Report
Opportunities
The German Association of the Automotive Industry ex-pects a further increase in sales for German automotivemanufacturers in fiscal year 2018. There are opportuni-ties associated with this for paragon in the Electronicsand Mechanics operating segments. For years, the Man-agement Board has pursued the goal of increasing theshare of sales per vehicle by increasing take-rates withexisting customers, winning new customers for existingproducts internationally and developing innovativeproducts and systems with a higher added value, for in-stance. Examples of this from fiscal year 2017 includethe development of the DUSTPROTECT filter systemfor fine particulate matter and the launch of the soft-ware-controlled 3D+ audio system.
In addition, numerous new product innovations fromthe Electronics operating segment are currently beingintensively marketed. Due to its strategic positioning,paragon AG will be able to profit from changes in theautomotive value chain that will arise from the mega-trends digitization, electrification, shared mobility, CO2reduction and autonomous driving. The investmentbank Lazard and the consulting firm Roland Bergerquantified these changes in the joint “Global Automo-
tive Supplier Study,”10 published in December 2017. Itasserts that the connectivity of vehicles will becomeavailable as a standard feature – at least in developedmarkets – which, together with the steady rise of artifi-cial intelligence, opens up almost limitless possibilities.The authors also estimate that the proportion of newvehicles sold in 2018 attributable to new mobility con-cepts will account for 10–15 percent in the U.S. and upto 35 percent in China. At the same time, they forecastthe share of new vehicles with more advanced au-tonomous systems to be between 5 and 26 percent in15 to 20 years’ time. After all, the momentum for in-creasing electrification is steadily growing, so that theshare of electric vehicles is forecast to amount to 8–20percent in the U.S., 20–32 percent in Europe and 29–47 percent in China by 2025. In its September 2017 re-port “Industrial and Commercial Electric Vehicles onLand 2017-2027,”11 the market research instituteIDTechEx Ltd assumes that the markets currently occu-pied by Voltabox AG will grow at an average annualgrowth rate (CAGR) of 17 percent over the next 10years (basis: 2017).
As a result, paragon has the following opportunities,particularly in the medium term:
• Thanks to the business model focused on the inde-pendent development of product innovations,paragon can tap into strategic business advantages(pioneering advantages) in the Electronics operatingsegment due to the dynamic technology shift sur-rounding current megatrends.
• The focus on the development of product innovationsis increasingly shifting from the component level tothe system level in the Electronics and Mechanics op-erating segments. As a result, paragon can successive-ly increase its value added per vehicle.
• Due to the globally high levels of air pollution in heav-ily frequented, urbanized areas, in the future, paragonwill be able to benefit from potentially higher take-rates for air quality sensors in passenger cars, particu-larly with the DUSTPROTECT particle filter systemcurrently in development. When breathed in, fine par-ticulate matter (PM2.5) can reach the alveoli and have
C O M B I N E D M A N A G E M E N T R E P O R T F O R F I S C A L 2 0 1 7 4 1
10 https://www.lazard.com/perspective/global-automotive-supplier-study-2018/11 https://www.idtechex.com/research/reports/industrial-and-commercial-electric-vehicles-on-land-2017-2027-000505.asp

negative health impacts. Its small size allows it to re-main in the atmosphere longer and be carried furtherdistances. As a result, political strategies to reduce thehealth impacts of air pollution are gaining in impor-tance internationally.
• The increasing relevance of increased comfort, mod-ern infotainment and artificial intelligence is account-ed for in a special way by the 3D+ sound system pre-sented by paragon in the year under review. It notonly enables future augmented audio applications tobe realized, but also allows for a noise reduction func-tion, for instance, by eliminating unwanted drivingnoises through counter signals. At the same time, it isalso possible for car manufacturers and mobilityproviders to stream seat/passenger-specific contenton a subscription basis.
• In the past fiscal year, the Chinese automotive marketfurther underscored its significance as the largest re-gional sales market with some 24.1 million new regis-trations. Further sales growth of around 2% is expect-ed here for fiscal year 2018. With paragonAutomotive Kunshan Co., Ltd., paragon is present inChina with its own production site, which currentlyhas 30 employees and a production area of around2,600 square meters. The Chinese government’s five-year plan (2016–2020) provides concrete targets forthe significant reduction of air pollution. The Chineseautomotive industry is now one of the world’s largestgrowth drivers for the rapid spread of resource-con-serving technologies. This means there is particularlyhigh sales potential in the Chinese automotive marketfor paragon in the medium term if it can acquire Chi-nese automotive manufacturers as new customers forthe DUSTPROTECT particle filter system with hightake-rates and sales figures.
paragon’s Electromobility operating segment also offersgreat opportunities for further applications for the lithi-um-ion battery systems developed by the publicly trad-ed 60 percent-owned subsidiary Voltabox AG. Themegatrend electromobility has already led to the firstapplications in individual capital goods submarkets such
as trolleybuses for public transport, intralogistics fork-lifts and automated guided vehicles in networked pro-duction as well as underground mining vehicles. Withthe help of strong cooperation partners, paragon is ableto benefit from substitution effects here that resultfrom the economic advantages its battery technologiesoffer compared to the lead-acid batteries or diesel gen-erators used to date. In these fast-growing submarkets,paragon has the opportunity to significantly increaseVoltabox’s relative market share within a short period oftime and thus occupy a leading market position.
The niche strategy of diversification also offers largesales opportunities in further submarkets in the mediumterm as soon as similar substitution effects come intoplay there. In the year under review, this includes thecompany’s entry into the market segment of agricultur-al and construction vehicles and the start of series pro-duction of starter batteries for motorcycles. Often it isthe complex requirements regarding the performance,safety and reliability of the lithium-ion battery systemsdeveloped by Voltabox AG that play a decisive role.
As part of its presence in the global mass market forcars, paragon will also be able to occupy the segmentfor modern 48V lithium-ion battery systems for hybridcars.
Overall Assessment of Opportunities
Through the regular and structured monitoring of op-portunities within the paragon Group and the relevantsales markets as well as the internal, barrier-free com-munication at the various levels of management, theManagement Board is in a good position to identify op-portunities for the Group. The consistent utilization ofbusiness opportunities in the form of planning adjust-ments can make a significant positive contribution tothe company’s strategic and operational success. At theend of fiscal year 2017, both external and internal op-portunities were identified that are basically unchangedcompared to the prior year.
4 2 | P A R A G O N A G A N N U A L R E P O R T 2 0 1 7
The significance of the listed opportunities as well asthe resulting positive effects on the financial perform-ance indicators projected for fiscal year 2018, and thuson the short-term development of the paragon Groupas a whole, is classified as low. The Management Boardtherefore expects the positive development of businessdescribed in the forecast.
Risk Report
Risk Management
paragon uses a comprehensive risk management systemas part of its risk-oriented corporate governance.
Risks are defined in the paragon Group not only as ac-tivities, events and developments endangering the com-pany’s existence, but also those affecting its businesssuccess. Particular attention is paid to risk concentra-tions, e.g. dependencies on individual customers, suppli-ers, products or countries. In the case of material risks,mutual dependencies and impacts are taken into ac-count, since individual risks can mutually reinforce eachother or cause compensation effects between them. Inaddition, opportunities are also subsumed under the riskconcept. We understand business success in terms ofmeasurable values, e.g. revenue and EBIT. Risks aretherefore represented in these figures in the evalua-tions from the respective process owners. Risk assess-ment is always based on the risk outcome. A risk is thepossibility that a threat exposes a vulnerability andcauses damage to or the loss of an object and therebydirectly or indirectly results in a negative impact. Theaim is also to identify and evaluate these risks in orderto be able to select suitable and appropriate counter-measures on this basis.
Risks are determined in terms of the following parame-ters:
• The value of the affected objects (extent of damage)
• The possibility of a threat exploiting a vulnerability
• The probability that a threat occurs
• Existing or planned measures that could reduce thisrisk
Strategic Governance and Risk Management
The aim of risk management is to secure the company’scontinued existence, i.e., securing its future develop-ment and profitability as well as reducing the risks ofbreaching the confidentiality, integrity and availabilityof the information or data used or contained in theperformance of activities. The task of risk managementis also to report deviations from the corporate objec-tives at an early stage and thereby enable timely coun-termeasures. Risk guidelines are defined in the risk man-ual.
Group-wide responsibility for risk management lies withthe Management Board. Risk management at the re-spective sites is adequately covered and secured in reg-ular (video and telephone) meetings with the respectivesenior management. This means that the ManagementBoard is directly informed of the situation and the cor-responding risks are continuously monitored and man-aged by the Management Board. In risk fields wherequantification is not possible or useful, work is done toidentify risk factors.
C O M B I N E D M A N A G E M E N T R E P O R T F O R F I S C A L 2 0 1 7 4 3

Central Risk Management
An important role in the risk management and controlprocess belongs to central risk management. Within itsresponsibility for the risk situation of the company, theManagement Board transfers the task of implementingpermanent risk management activities to the central riskmanagement team. Responsibility for central risk man-agement lies with the Head of Controlling. paragon’scentral risk management team is responsible for coordi-nating all decentralized risk management functions,evaluating risk analyses and consolidating them into riskreporting as well as improving and enhancing the riskmanagement system. Working with the ManagementBoard, the central risk management team determinesthe reporting cycles and defines the thresholds for therisks which, when exceeded, require a risk control re-port to be prepared outside the obligatory reporting re-quirements. Both the threshold values and the reportingcycles are based on the relevance of the risks.
Central risk management supports the decentralizedrisk managers in the preparation of risk analyses andchecks their returns and plausibility. It summarizes theindividual risk profiles in a joint document. This meansthat interactions between the risks can be analyzed andthe overall risk situation of the paragon Group can berecorded, evaluated and commented on. This summaryis referred to as risk reporting. This task is of particularimportance because the objective of an integrated riskmanagement system is the holistic consideration of acompany’s risk situation. Risk reporting acts as the basisfor the statements on the paragon Group’s risk situationin the combined management report.
The decentralized risk managers are consulted whenev-er new risk management measures are established orexisting measures are adapted.
Decentralized Risk Management
Decentralized risk management in the paragon Group islocated within the company’s individual segments andsites. The area and process managers are responsiblefor risk management in their respective areas of work asdecentralized risk managers. The decentralized riskmanagement team reports on the development of risksin these areas as part of risk control measures. For eachreporting cycle, the decentralized risk managers writeup a report on the risks for which they are responsible.The focus here is on the description of the expected de-velopment of the risk. With this, measures for futurerisk management or the improvement of existing meas-ures are developed and included in the risk control re-port as proposed measures for implementation. The de-cision on implementation is the responsibility of theManagement Board. In addition, the ManagementBoard must be informed without delay of any risks in-curred throughout the year (ad-hoc risk reporting). Ac-cording to a resolution by the Management Board, reg-ular meetings with all decentralized risk managers areno longer held. Instead, individual discussions are heldwith the decentralized risk managers.
Risk Monitoring
Risk monitoring is the task of decentralized and centralrisk management. Early warning indicators for criticalsuccess factors are defined by the decentralized riskmanagers. The task of central risk management is tomonitor the defined early warning indicators. As soon asthe defined thresholds are reached, a risk report is pre-pared by the decentralized risk manager, i.e., a forecastof the expected effects of the risk event for paragon.These forecasts are to be supplemented by scenarioanalyses, which take into account different data con-stellations. Risk monitoring thus serves as a form ofknowledge enhancement to assist with managementdecisions, as attempts are made to reduce uncertaintyregarding the future development of the company orthe risk situation.
4 4 | P A R A G O N A G A N N U A L R E P O R T 2 0 1 7

Based on this information and the recommendationsmade by the decentralized risk managers and centralrisk management, the Management Board decideswhether and to what extent measures are to be imple-mented or whether an adjustment of the company’s ob-jectives is necessary. The monitoring of the early warn-ing indicators and their associated threshold values aswell as the creation of scenario analyses is the responsi-bility of decentralized risk management.
Risk Reporting
The monthly report to the Management Board containsall new risks identified in the reporting month as well asrisks that have changed by a degree greater than orequal to 50% from the prior month.
Central risk management is required to provide an adhoc report to the Management Board in the case ofrisks with a change of 100% or more as compared tothe previous month. The Management Board, in turn, isthen obliged to provide a report to the SupervisoryBoard within 24 hours of being informed about therisk.
The risks continually analyzed by paragon as part of riskmonitoring can be assigned to the following risk cate-gories, each of which is divided into individual risks:
• Strategic and Environmental Risks
• Market Risks
• Operating Risks
• Financial Risks
• Management and Organizational Risks
At the end of the reporting year, 25 individual riskswere recorded in the paragon Group, which equally af-fect paragon AG. In the opinion of paragon AG, none ofthese individual risks endangered the company’s contin-ued existence.
Risks
Strategic and Environmental Risks
Overall economic development is observed in the riskmanagement system due to its possible influence onend customer behavior within the automotive industry.This can lead to fundamental changes to supply and de-mand behavior in the procurement and sales marketsfor paragon. For example, a longer-term economicdownturn, possibly triggered by the economic policymeasures of individual submarkets such as the U.S. orChina, could have a negative impact on the company’sassets, financial position and earnings. A politically moti-vated move away from the rule-based internationaltrade system or its disturbance through isolated protec-tionist measures could lead to distortions in the globalautomotive value-added chain. As the paragon Grouphas its own production facilities in China and the U.S.,and as it has a specific customer/product structure, theManagement Board views the overall risk of protection-ist influence on earnings as low.
Market Risks
For years, paragon has held a strong market position asa proven and innovative direct supplier of premium Ger-man manufacturers in the automotive industry – andthis is increasingly true for large customers in the areaof e-mobility as well. As expected, the three largestsales markets of Western Europe, the U.S. and Chinacontinued to grow in 2017. In fiscal year 2018, growthin the major submarkets, and as a result in the globalsales market, is expected to slow to about 1 percent.
Due to its specific customer/product structure, paragonwas able to grow significantly faster than the market inorganic terms in the past fiscal year, and further poten-tial is available through its M&A strategy. The acquisi-tion of 100 percent of the shares in HS Genion GmbH,headquartered in Landsberg am Lech, Germany, whichsees itself as the number one in the German market for“movable body components,” significantly strengthenedthe Body Kinematics unit in November 2017. One
C O M B I N E D M A N A G E M E N T R E P O R T F O R F I S C A L 2 0 1 7 4 5

month is consolidated in the figures for 2017, and thegrowth effects will intensify accordingly in 2018.
All in all, paragon grew by approximately 20 percent in2017 compared to the prior year, and therefore ex-panded significantly faster than the market. The Man-agement Board attributes this development to the factthat paragon’s largest customers are among the leaderswithin the sector, who continue to have very goodprospects for the future. Apart from that, the strategyof delivering complete systems is increasingly payingoff. The globally active premium German manufacturersAudi, Daimler, BMW and Porsche were again able toachieve sales increases in fiscal year 2017 and are well-positioned to continue this development in the currentfiscal year with a number of new models and favorablegeneral economic conditions.
paragon’s close ties to these key customers and its con-centration on specific market niches shape the compa-ny’s strategic positioning. Sales opportunities and risksare assessed through a comprehensive operative salesmanagement system. Key components of this systemare the analysis of market and competition data, rollingplanning for the short and medium term and regular co-ordination between sales, production and development.The comparatively broad portfolio with around 200 in-dividual products highlights the comparatively high in-dependence of individual product groups and cus-tomers.
Nevertheless, the loss of a major customer could have asignificant impact on the company’s assets, financial po-sition and earnings in the medium term. However, dueto the multi-year contract periods for the various series,the loss of a key customer would be known at an earlystage. This risk is counteracted by comprehensive de-velopment work on product innovations as well as de-tailed permanent order backlog analyses focusing onearly risk identification.
The paragon innovation process is characterized by in-dependent product development that takes the inter-ests and wishes of car owners into consideration. In
contrast to many other automotive suppliers, paragondoes not wait for automotive manufacturers to makecertain demands or specify requirements, but rather de-velops its own, innovative solutions, which are imple-mented in cooperation with pilot customers and subse-quently offered to a wider customer base. As a growingnumber of automotive innovations are electronic in na-ture, paragon sees a wide range of market opportunitiesfor its Electronics operating segment. However, it can-not be ruled out that a product development may notachieve its expected quantities or that its economic suc-cess may be lower or later than originally planned.
Operating Risks
In terms of operating risks, paragon is currently focusingon its research and development, materials manage-ment, production and information technology activities.
The market for automotive electrics, electronics andmechatronics is subject to increasingly dynamic, tech-nological change. The future economic success ofparagon will therefore depend on the ability to continu-ously develop new and innovative products on time andsuccessfully introduce them to the market. Recognizingnew technological developments at an early stage andimplementing them in partnership with customers is keyhere. Should paragon not be able to, or not quicklyenough, recognize and implement new trends, changingcustomer requirements or future technological ad-vances or to develop new products and adapt existingproducts in accordance with business principles, thismay have a detrimental effect on the company’s assets,financial position and earnings.
In addition, development costs may not be recoverableif paragon’s customers subsequently do not issue serialproduction orders or if the quantities paragon sells aresignificantly lower than expected. Given the high pro-portion of capitalized development activities on the bal-ance sheet, a corresponding valuation allowance for in-tangible assets could have a negative impact on thecompany’s assets, financial position and earnings.
4 6 | P A R A G O N A G A N N U A L R E P O R T 2 0 1 7

In close cooperation with the development departmentsof key customers, paragon contributes to automotiveproduct innovations with its wide range of developmentprojects and innovative solutions. Significant deviationsfrom the project objectives in terms of time and moneymay result in cost and legal risks (e.g., contractual penal-ties). Ongoing development and project monitoring isundertaken to limit associated risks.
Past experience has shown that, through the use of theexisting sales channels, paragon can generate additionalbusiness with new products. The company was alsoable to gain new customers, such as Komatsu andSchäffer, with its own product developments during thepast fiscal year. With continuous investments in ma-chinery and plants, paragon ensures that the productionfacilities at all of the Group’s sites meet the high re-quirements of the automotive industry.
The past fiscal year was characterized by a sharp rise inprices for aluminum, which is used in the production ofbattery modules and is also the basic material for theproduction of printed circuit boards. paragon took ad-vantage of the global price competition on all relevantprocurement markets and secured a substantial portionof its procurement prices through framework contracts,annual agreements and long-term supplier relationships.The Group continues to purchase more than 80 percentof its purchasing volumes from European contract part-ners, while the rest is purchased directly in Asia and theU.S. The payment terms are regarded as above-averageby the Management Board as compared with the indus-try. The major purchasing currency is the euro. The vol-ume of purchases in U.S. dollars will continue to rise sig-nificantly as a result of the expected sales growth in theElectromobility operating segment. Currency risks ariseprimarily for purchases in U.S. dollars that are intendedfor the European currency area. These risks are mini-mized by sliding-price clauses and other appropriatemeasures.
With the rapid spread of information technology (IT)and the ubiquitous connectivity provided by the inter-net, IT risks, such as hardware failures and unauthorized
access to company data and information, are also on therise. In order to avert possible dangers, paragon, in co-operation with specialized service companies, has es-tablished modern security solutions that protect its dataand IT infrastructure. In the fiscal year 2017, the com-pany continued to modernize its IT infrastructure andconverted its first subsidiaries to a new, integrated ERPsoftware and connected new locations to the IT land-scape. This involved use of the servers and systems thathave been assembled in recent years. This resulted insignificant synergies in various processes and collabora-tions. Finally, various security measures have been es-tablished to protect the company from internet threats(cyber attacks).
Financial Risks
In addition to interest rate, liquidity and currency risks,paragon also monitors risks associated with the loss ofreceivables, balance sheet risks and tax risks in the fi-nancial risks category.
Interest rate risks are virtually meaningless for paragon,as fixed interest rates are currently agreed upon formost of its long-term liabilities. Financial covenants donot exist with any credit institutions.
The company’s ability to pay is ensured by comprehen-sive planning and monitoring of liquidity. These plansare prepared on a short, medium and long-term basis. Inaddition, paragon has a rigorous receivables manage-ment system to ensure timely cash inflows. A substan-tial portion of the receivables is also hedged by meansof a commercial credit insurance. An additional possibil-ity for short-term financing exists in the form of factor-ing agreements.
The successful issuance of a € 50 million bond with aterm of five years, carried out in June, has resulted in acash inflow of around € 48 million. The refinancing ofthe bond issued in 2013 slated for mid-2018 will becovered by free cash inflows and the bond. In addition,the subsidiary Voltabox AG was successfully floated on
C O M B I N E D M A N A G E M E N T R E P O R T F O R F I S C A L 2 0 1 7 4 7

the stock exchange in October 2017, generating a fur-ther € 142 million in cash inflow for the Group. paragontherefore significantly strengthened the Group’s liquidi-ty and financial strength in 2017.
The company monitors possible currency risks on theprocurement and sales side by continuously trackingforeign currency exchange rates. At present, paragondoes not use financial instruments to hedge currencyrisks.
Management and Organizational Risks
In this risk category, paragon is primarily observing riskfactors resulting from the growth strategy. This includespersonnel and organizational risks in particular, as wellas management and communication risks. Clear assign-ments and demarcations in the respective areas of re-sponsibility within the system of owner-oriented gover-nance have been laid out in order to prevent cases oflacking interfaces and functional overlaps. Currently,the Management Board does not consider there to beany material risks to paragon in this area.
However, the company is fundamentally dependent onthe retention of qualified personnel and persons in keypositions. The future economic success of paragon de-pends to a considerable extent on the continued in-volvement of its executives, senior employees and em-ployees in key positions. This is particularly the case forits founder, primary shareholder and CEO Klaus DieterFrers, who is the company’s engine and an importantsource of ideas. In addition, paragon also relies on qual-ified employees in the areas of management, researchand development, and sales. The company cannot guar-antee that it will be able to hold key executives, seniorexecutives and employees in key positions or attractnew executives and employees with appropriate qualifi-cations. There is increasing competition for such quali-fied employees and the personnel market, particularly in
regions outside major German cities, is comparativelysmall. This means that individual experts can only be re-placed with difficulty or not at all. If paragon is unable toprovide sufficient personnel in the future, the strategicand economic objectives of the company may not beachievable or only achievable at a later date. This couldhave a detrimental impact on the company’s assets, fi-nancial position and earnings.
Overall Assessment of the Risk Situation
The company’s risk management was further adapted tothe dynamic development of the paragon Group overthe past year. Here, the new organizational structurewith the operating segments Electronics, Mechanicsand Electromobility – which contains the now publiclytraded subsidiary Voltabox AG – was taken into accountin accordance with the internal management system.The Management Board currently expects that the on-going Group-wide monitoring of operating risks will be-come increasingly important as business activities ex-pand.
In the future, paragon will also protect itself againstgeneral market risks in the automotive industry. Thecompany’s strategic positioning as a direct supplier topremium German manufacturers and its long-standing,successful business relationships with these companiescontinually reduces these risks. Therefore, the relativedependence on economic fluctuations in the automo-tive industry’s global sales markets will also be reducedin the future. Existing customer contacts also offer con-siderable opportunities to position new product innova-tions within the Electronics and Mechanics operatingsegments. The increasing diversification of the businessmodel, particularly via the high-growth Electromobilityoperating segment, also secures a second pillar and is al-ready noticeably reducing dependence on the econom-ic development of the automotive industry.
4 8 | P A R A G O N A G A N N U A L R E P O R T 2 0 1 7

The consolidation of the paragon Group’s medium-termfinancing structure, through the bond issued in the sum-mer of 2017 and the successful IPO of its subsidiaryVoltabox AG in the fall, significantly reduced the overallfinancial risk in the fiscal year 2017. With paragon’scapital-intensive growth strategy, the company’s overalleconomic development remains linked to the economicdevelopment of the automotive industry and, particular-ly, its key customers.
As of the publication date of this report, no risks havebeen identified that could jeopardize the company’scontinued existence. A differentiated view on the devel-opment of the automotive industry shows that the com-pany is positioned in forward-looking market segmentsor submarkets, has promising customer relationshipsand offers diverse niche products that are often withouttrue competition on the market.
The potential impact from the various risks on the over-all future performance of the paragon Group, as well asits financial and nonfinancial performance indicators forfiscal year 2018, are regarded as low by the Manage-ment Board as a whole. Accordingly, the ManagementBoard expects that the business development describedin the forecast will not be significantly impacted by thedisclosed risks.
Description of theKey Characteristics of theInternal Control and RiskManagement System with Regardto Group Accounting Processes(Section 315 (2) no. 5 HGB)
Since the internal control and risk management systemis not legally defined, paragon based its definition onthat of the Institut der Wirtschaftsprüfer in Deutschlande.V., Düsseldorf, Germany, regarding accounting-relat-ed internal control systems (IDW PS 261).
An internal control system is therefore understood asthe principles, procedures and measures enacted bymanagement that are aimed at the organizational imple-mentation of management’s decisions. The objectivesare as follows:
a) Ensure the effectiveness and profitability of thebusiness (including the protection of assets and theprevention and detection of asset damages)
b) Ensure the regularity and reliability of internal andexternal accounting
c) Comply with the legal and statutory regulations ap-plicable to the company
The Group’s risk management system includes all orga-nizational regulations and measures for risk identifi-cation and handling risks related to entrepreneurial ac-tivity.
The Management Board of paragon AG bears the over-all responsibility for the internal control and risk man-agement system with regard to the accounting process.The principles, procedural instructions, procedural or-ganization and processes of the accounting-related in-
C O M B I N E D M A N A G E M E N T R E P O R T F O R F I S C A L 2 0 1 7 4 9

ternal control and risk management system are laiddown in organizational instructions that are adapted atregular intervals to current external and internal devel-opments.
In view of the size and complexity of the accountingprocess, management has determined the scope anddesign of the control activities and implemented them inthis process. Independent controls have also been es-tablished. The control activities address those controlrisks which, in terms of their probability of occurrenceand their impact, could have a significant influence onthe accounting and overall statement of the consolidat-ed financial statements, including the combined man-agement report. Key principles, procedures, measuresand control activities include:
• Identification of the key control risks relevant to theaccounting process
• Process-independent controls for monitoring theaccounting process and its results at the level of theManagement Board of paragon AG
• Control activities in the accounting and controllingdepartments of paragon AG, which provide essentialinformation for the preparation of the annual financialstatements and combined management report, in-cluding the required separation of functions and ap-proval procedures
• Measures that ensure the proper computerized pro-cessing of accounting-related information
Risk reporting on the use offinancial instruments(Section 315 (2) no. 1 HGB)
The use of financial instruments gives the followingrisks to the paragon Group:
The company counters liquidity risk by means of com-prehensive liquidity planning and control. These plansare prepared on a short, medium and long term basis.The successful issue of a € 50 million bond with a termof five years in June resulted in a cash inflow of around€ 48 million. The refinancing of the bond issued in 2013in the middle of 2018 will be possible from free cash in-flows and out of the bond. In addition, the subsidiaryVoltabox AG was floated on the stock exchange inOctober 2017, which resulted in a further cash in-flow of € 142 million. In 2017, paragon significantlystrengthened the Group's liquidity and financialstrength.
Interest rate risks are virtually irrelevant for paragon, asfixed interest rates are currently agreed for the majorityof long-term liabilities. Financial covenants do not existwith any of the financing credit institutions.
In addition, paragon has a consistent debtor managementsystem to ensure a timely cash inflow and to counter thedefault risk of financial instruments. A substantial part ofthe receivables is additionally secured by trade credit in-surance. An additional option for short-term financing isgiving in the form of factoring agreements.
The Company monitors potential currency risks on theprocurement and sales side on the basis of continuous-ly revised exchange rate expectations. At present,paragon does not use any financial instruments tohedge currency risks.
The company counteracts the annual cash flow fluctua-tions by exploiting existing credit facilities and an exist-ing factoring agreement.
5 0 | P A R A G O N A G A N N U A L R E P O R T 2 0 1 7

Forecast
Market Development 2018
The International Monetary Fund (IMF) published itsforecast12 for the global economy in October 2017. Ac-cordingly, it expects global growth to further accelerateto 3.7%. Economic policy risks are seen in particular inthe disproportionately low increases in nominal wagesand the effects of increasing automation on the labormarket. In addition, the IMF notes geopolitical risks andthe economic adjustment costs of climate change. As aresult of global economic convergence, medium- andlong-term economic growth will eventually decline.
The IMF again expects an uneven distribution of eco-nomic growth between developed economies (2.0%)and emerging economies (4.9%) in 2018. In particular,economic growth of 2.3% is being forecast for the U.S.,1.9% for the eurozone, 1.8% for Germany and 6.5% forChina.
Accordingly, the most important global markets for theautomotive industry will continue to be characterizedby a positive economic outlook in the current fiscalyear. Correspondingly, the German Association of theAutomotive Industry (VDA) expects global growth inpassenger car sales13 of around 1% to 85.7 million units(prior year: 84.6 million units) in a flat growth curve.
With sales of around 16.8 million units, the U.S. marketis expected to contract by about 2%, while a slight de-cline of 1% to a volume of more than 14.2 million unitsis expected for Western Europe – primarily due to thedecline in the United Kingdom as a result of the Brexitdecision. By contrast, the Chinese passenger car marketis expected to grow about 2% to 24.6 million passengercars in 2018 according to the VDA.
In the Electromobility operating segment, paragon ismainly active in selected industrial submarkets throughthe Voltabox subsidiaries. These currently include:
• Trolleybuses used in public transportation
• Forklift trucks and automated industrial trucks in in-tralogistics or networked production environments
• Mining vehicles in underground mining
The development in these submarkets is essentiallycharacterized by a substitution process for lead-acidbatteries, or diesel generators in the case of trolleybus-es, from which Voltabox benefits with its modular prod-uct portfolio. These are trends that have a period ofseveral years and typically show a saturation curve withincreasing market penetration.
In 2018, the market research institute IDTechEx14 ex-pects a market growth of about 11% for battery sys-tems in the submarkets currently occupied by Voltabox.The average annual growth rate through 2027 is esti-mated at 17% in these submarkets (base year: 2017).
As a result, the following assumptions are particularlyimportant for establishing the paragon Group’s forecast:
• Positive economic environment with acceleratedglobal economic growth
• Increase in global sales of passenger cars of around 1%
• Continuous substitution of lead-acid batteries anddiesel generators with lithium-ion batteries in occu-pied submarkets
• Global market growth of around 11% for battery sys-tems in Voltabox’s submarkets
C O M B I N E D M A N A G E M E N T R E P O R T F O R F I S C A L 2 0 1 7 5 1
12 https://www.imf.org/en/Publications/WEO/Issues/2017/09/19/world-economic-outlook-october-201713 VDA press release from December 06, 2017: German passenger car market reaches highest level this decade14 https://www.idtechex.com/research/reports/industrial-and-commercial-electric-vehicles-on-land-2017-2027-000505.asp

paragon Group
The Group’s corporate planning is based on detailedsales and revenue planning and is broken down by cus-tomer to the product level. The main cost componentsare planned via individual planning models for a periodof several years and are then updated in proportion tothe development of revenue.
Significant parameters, such as price changes in pur-chasing or sales as well as possible cost increases in per-sonnel or changes in the tax base, are integrated intothe planning. The constantly updated risk managementsystem allows the company to identify risks at an earlystage and, if necessary, counter them accordingly.
Based on the good order situation for 2018, the Man-agement Board once again expects to grow significantlyfaster than the automotive sector. In view of VoltaboxAG’s robust order backlog for 2018, the ManagementBoard is expecting a significantly higher growth rate inthe Electromobility operating segment. The Body Kine-matics unit is also expected to contribute disproportion-ately to growth.
The Electromobility operating segment is expected tomore than double its revenues to around € 60 millionand make a sustained contribution to the Group’s prof-itability with an EBIT margin of around 10 percent. An-other growth driver will be the Mechanics operating
5 2 | P A R A G O N A G A N N U A L R E P O R T 2 0 1 7
segment. From the fiscal year 2019 onwards, the Elec-tronics operating segment is expected to increasinglycontribute to the Group’s growth through new prod-ucts.
Against this backdrop, the paragon Management Boardis very optimistic about the current fiscal year. It is alsoforecasting a further jump in Group sales of more than40 percent to around € 175 million with a consolidatedEBIT margin of around 9 percent.
The Management Board expects to see an investmentvolume of around € 35 million in the current year.
The further significant expansion planned in the Elec-tromobility operating segment is intended to makeparagon more independent of macroeconomic factorsin the automotive industry and broaden the customerstructure.
paragon AG
In the current fiscal year, the Management Board ex-pects the revenue to increase slightly for the individualfinancial statement of paragon AG. An EBIT margin ofaround 5% of is expected. The body kinematics unit isconsidered the main growth driver.
2016 2017 Change in % Forecast
In € thousands / as indicated 2017 2018
Financial performance As of As ofMar. 27, 2017 Aug. 15, 2017
Group revenue 102,790 124,823 21.4 € 120 million € 120 millionto to € 175 million
€ 125 million € 125 million
EBIT margin 8.7% 6.1%1 n. a. 9.0% to 9.5% 9.0% to 9.5% Approx. 9%
Investments 23,262 37,5822 61.6 Approx. Approx. Approx.€ 27 million € 21 million € 35 million
Development of Key Performance Indicators
1 Thereof € 15.159 million cash payments for the acquisition of consolidated companies2 Excluding € 3.553 million one-time special effects of the Mechanics segment (adjusted EBIT margin: 9.0 %)

C O M B I N E D M A N A G E M E N T R E P O R T F O R F I S C A L 2 0 1 7 5 3
Takeover-Related DisclosuresPursuant to Section 315 (4) of theGerman Commercial Code (HGB)
Composition of the Share Capital
paragon AG’s subscribed capital amounts to €4,526,266.00 and is divided into 4,526,266 no-par-value shares with a nominal value of € 1.00 each. Allshares are entitled to dividends. Each share grants onevote at the Annual General Meeting.
Stock Voting Right and Transfer Restrictions
The Management Board is not aware of any limitationsaffecting voting rights or the transfer of shares.
Holdings That Exceed 10 Percent of the Voting Rights
As of December 31, 2017, the CEO of the companyheld 50 percent plus 1 share of the company’s sharecapital.
Shares With Special Rights of Control
There are no shares that confer special rights of control.
Voting Right Controls for Employees Participating inthe Capital
Insofar as employees participate in the capital as share-holders, they cannot derive any special rights fromthem.
Appointment and Dismissal of Members of the Man-agement Board and Amendments to the Articles ofAssociation
Regarding the rules for appointing and dismissing themembers of the Management Board, reference is madeto the statutory provisions of Sections 84 and 85 of theGerman Stock Corporation Act (AktG).
Regarding the rules for amending the Articles of Associ-ation, please refer to the statutory provisions of Sec-tions 133 and 179 AktG.
Authorization of the Management Board to IssueShares
With the resolution of the Annual General Meeting onMay 10, 2017, the Management Board is authorized,with the consent of the Supervisory Board, to increasethe company’s share capital once or several times by upto € 2,263,133.00 until May 9, 2022, inclusive, via theissue of up to 2,263,133 new no-par-value sharesagainst contribution in cash and/or in kind (AuthorizedCapital 2017/I).
Shareholders are to be granted a subscription right. Thestatutory subscription right may also be granted by hav-ing the new shares taken over by a banking consortiumwith the obligation to offer the shares indirectly toshareholders for subscription pursuant to Section 186(5) of the German Stock Corporation Act (AktG). TheManagement Board is, however, authorized (with theconsent of the Supervisory Board) to exclude the statu-tory subscription rights of shareholders in the casesspecified in Section 5 (6) of the Articles of Associationas updated in May 2017.
A resolution at the Annual General Meeting from May10, 2017, approved the conditional increase in the sub-scribed capital of up to € 2,263,133.00 by issuing2,263,133 new no-par-value shares (Conditional Capital2017/I).
The conditional capital was created exclusively to grantshares to holders or creditors of convertible bondsand/or bonds with options that are issued by the com-pany (or by a Group company as defined in Section 18

of the German Stock Corporation Act (AktG), in whichthe company has a shareholding of at least 90%) pur-suant to the authorization by the Annual General Meet-ing on May 10, 2017, against contributions in cash or inkind until May 9, 2022. In accordance with the respec-tive terms and conditions for convertible bonds andbonds with options, the conditional capital increase alsoserves to issue shares to holders of convertible bondsand/or bonds with options subject to conversion or op-tion obligations.
The conditional capital increase shall only be imple-mented to the extent that the holders of warrants fromoptions or creditors of convertible bonds exercise theirconversion or option rights, or the holders or creditorsof convertible or warrant-linked bonds who are obligat-ed to exercise or convert the option or warrant-linkedbonds fulfill their obligation to exercise or convert theoption or warrant-linked bonds, provided that the con-version or option rights are not serviced by grantingtreasury stock or other forms of settlement. Theserights must have been issued by the company (or by aGroup company as defined in Section 18 of the GermanStock Corporation Act (AktG), in which the companyhas a direct or indirect shareholding of at least 90%)based on the authorization granted by the Annual Gen-eral Meeting, which lasts from May 10, 2017, throughMay 9, 2022. The new shares shall be issued at the con-version/option prices in the bond or option conditionsto be determined in accordance with the aforemen-tioned authorizing resolution. The new shares may begranted a dividend entitlement starting in the fiscalyears for which the Annual General Meeting has not yetpassed a resolution on the appropriation of profits. TheManagement Board is authorized to determine the fur-ther details regarding the implementation of the condi-tional capital increase.
Change of Control and Compensation Agreements
There are no special provisions for a change of controlnor are there any compensation agreements for possi-ble takeover offers.
Corporate Governance StatementPursuant to Section 315d inConjunction With Section 289f (1)of the HGB.
The Management Board and the Supervisory Board ofparagon AG are committed to the principles of a trans-parent and responsible corporate governance and con-trol structure. They ascribe a high priority to the stan-dards of good corporate governance. With the CEO asthe majority shareholder, the working methods of theManagement Board conform with the principles of the“honorable merchant” in terms of its entrepreneurial re-sponsibilities. This includes the obligation to ensure thecontinued viability of the company and its sustained val-ue creation (corporate interests) in conformity with theprinciples of the “social market economy.”
The Corporate Governance Statement pursuant toSection 315d in conjunction with Section 289f (1)of the German Commercial Code (HGB) can beaccessed at any time on the paragon website athttp://www.paragon.ag/en/investors/corporate-gover-nance.html. It contains the corporate governance decla-ration pursuant to Section 161 of the German StockCorporation Act (AktG) and the corporate governancereport pursuant to No. 3.10 of the German CorporateGovernance Code (GCGC).
Delbrück, Germany, March 9, 2018
Klaus Dieter Frers Dr. Stefan SchwehrChief Executive Officer Chief Technology Officer (Electronics)
5 4 | P A R A G O N A G A N N U A L R E P O R T 2 0 1 7

Con
solid
ated
Fina
ncia
lSta
tem
ents
2017
Note: Rounding differences of +/- one unit (€ thousands) may occur in tables.
Consolidated income statement
Consolidated statement of comprehensive income
Consolidated balance sheet
Consolidated cash flow statement
Schedule of changes in equity
Notes to the consolidated financial statements
5 5

5 6 | P A R A G O N A G A N N U A L R E P O R T 2 0 1 7
Consolidated income statement of paragon AG, Delbrück,for the period from January 1, to December 31, 2017 (IFRS)
In € thousands Notes Jan. 1 to Jan. 1 toDec. 31, 2017 Dec. 31, 2016
Revenue (10), (42) 124,823 102,790
Other operating income (11) 1,379 1,086Increase or decrease in inventory of finished goodsand work in progress -1,138 -924Other own work capitalized (12) 16,388 15,317Total operating performance 141,452 118,269
Cost of materials (13) -71,226 -57,741Gross profit 70,226 60,528
Personnel expenses (14) -35,262 -29,248Depreciation of property, plant and equipment,and amortization of intangible assets (16) -9,390 -7,126Impairment of property, plant and equipmentand intangible assets (20) -5 -37Other operating expenses (15) -17,936 -15,188Earnings before interest and taxes (EBIT) 7,633 8,929
Financial income (17) 13 2Financial expenses (17) -4,396 -3,169Financial result -4,383 -3,167
Earnings before taxes (EBT) 3,250 5,762Income taxes (18) -3,907 -2,201
Group result -657 3,561
Earnings per share in € (basic) (19) -0.15 0.84Earnings per share in € (diluted) (19) -0.15 0.84Average number of outstanding shares(basic) (19) 4,526,266 4,217,658Average number of outstanding shares(diluted) (19) 4,526,266 4,217,658
In € thousands Notes Jan. 1 to Jan. 1 toDec. 31, 2017 Dec. 31, 2016
Group result -657 3,561Actuarial gains and losses (32) -7 -142Currency translation reserve -613 -245
Total comprehensive income -1,277 3,174
Consolidated statement of comprehensive income of paragon AG,Delbrück, for the period from January 1, to December 31, 2017 (IFRS)
Group result attributable to minority interestsShareholder paragon Group - 4,531Non-controlling interests 3,874
Total comprehensive income attributable to minority interestsShareholder paragon Group - 4,743Non-controlling interests 3,466

C O N S O L I D A T E D F I N A N C I A L S T A T E M E N T S 5 7
In € thousands Notes Dec. 31, 2017 Dec. 31, 2016
ASSETSNoncurrent assetsIntangible assets (20) 60,027 37,188Goodwill (21) 7,410 843Property, plant and equipment (22) 36,360 37,378Financial assets (23) 326 326Other assets 90 88Deferred taxes 7,574 0
111,787 75,823Current assetsInventories (24) 17,344 13,716Trade receivables (25) 32,662 8,377Income tax assets 22 1,210Other assets (26) 4,206 2,149Liquid funds (27) 145,826 14,278
200,060 39,730
Total assets 311,847 115,553
In € thousands Notes Dec. 31, 2017 Dec. 31, 2016
EQUITY AND LIABILITIESEquitySubscribed capital (28) 4,526 4,526Capital reserve (28) 15,165 15,165Minority interests 57,918 0Revaluation reserve (28) -915 -908Profit/loss carried forward 106,048 12,867Group result -4,530 3,561Currency translation differences -1,150 -537
177,062 34,674Noncurrent provisions and liabilitiesNoncurrent liabilities from finance lease (29) 1,402 2,215Noncurrent loans (30) 16,350 20,369Noncurrent bonds (31) 49,566 13,186Special item for investment grants (34) 1,005 1,092Deferred income tax liabilities (18) 17,054 5,475Pension provisions (32) 3,001 2,516Other noncurrent liabilities 0 0
88,378 44,853Current provisions and liabilitiesCurent portion of liabilities from finance lease (29) 1,067 998Current loans and current portion of noncurrent loans (30) 4,588 12,413Current bonds (31) 13,363 0Trade payables 17,492 16,383Other provisions (35) 220 18Income tax liabilities (36) 34 82Other current liabilities (33) 9,643 6,132
46,407 36,026
Total equity and liabilities 311,847 115,553
Consolidated balance sheet of paragon AG, Delbrück,as of December 31, 2017 (IFRS)

5 8 | P A R A G O N A G A N N U A L R E P O R T 2 0 1 7
Consolidated cash flow statement of paragon AG, Delbrück,for the period of January 1 to December 31, 2017 (IFRS)
In € thousands Notes Jan. 1 – Dec. 31. 2017 Jan. 1 – Dec. 31. 2016
Earnings before taxes (EBT) 3,250 5,762
Depreciation/amortization of noncurrent fixed assets -9,390 7,126
Financial result 4,383 3,167
Gains (-), losses (+) from the disposal of property, plant
and equipment and financial assets 1,420 198
Increase (+), decrease (-) in other provisions
and pension provisions 1,541 312
Income from the reversal of the special item for investment grants -88 -88
Other non-cash income and expenses 48 -1,425
Increase (-), decrease (+) in trade receivables, other receivables,
and other assets -26,343 1,379
Impairment of intangible assets 5 37
Increase (-), decrease (+) in inventories -3,628 -2,499
Increase (+), decrease (-) in trade payables and other liabilities 4,809 6,169
Interest paid -4,396 -3,169Income taxes 1,239 -171
Cash flow from operating activities (42) -8,370 16,798
Cash receipts from the disposal of property, plant
and equipment 496 110
Cash payments for investments in property, plant and equipment -4,705 -7,709
Cash payments for investments in intangible assets -17,097 -14,398
Cash payments for investments in financial assets 0 0
Cash payments for the acquisition of consolidated companies
and other business units -15,945 -1,155
Interest received 13 2
Cash flow from investment activities (42) -37,238 -23,150
Distribution to shareholders -1,132 -1,029
Loan repayments -12,328 -3,796
Proceeds from loans 959 4,757
Repayments of liabilities
from finance lease -1,007 -883
Proceeds from equity contributions 142,376 13,127
Net proceeds from bond issue 48,287 0
Cash flow from financing activities (42) 177,155 12,176
Changes in cash and cash equivalents 131,547 5,824
Cash and cash equivalents at the beginning of the period 14,278 8,454
Cash and cash equivalents at the end of the period (27), (42) 145,826 14,278

C O N S O L I D A T E D F I N A N C I A L S T A T E M E N T S 5 9
Schedule of changes in equity of paragon AG, Delbrück,for the period of January 1 to December 31, 2017 (IFRS)
In € thousands Sub- Capital Revalu- Reserve from Profit Group Minority Totalscribed reserve ation currency carried result interestscapital deficit translation forward
Jan. 1, 2016 4,115 2,450 -766 -292 13,896 0 0 19,402
Groupresult 0 0 0 0 0 3,561 0 3,561
Actuarial gainsand losses 0 0 -142 0 0 0 0 -142
Currencytranslation 0 0 0 -245 0 0 0 -245
Otherresult 0 0 -142 -245 0 0 0 -387
Totalcomprehensiveincome 0 0 -142 -245 0 0 0 3,174
Capitalincrease 411 12,715 0 0 0 0 0 13,126
Dividendpayout 0 0 0 0 -1,029 0 0 -1,029
Dec. 31, 2016 4,526 15,165 -908 -537 12,867 3,561 0 34,674
R e t a i n e d e a r n i n g s
In € thousands Sub- Capital Revalu- Reserve from Profit Group Minority Totalscribed reserve ation currency carried result interestscapital deficit translation forward
Jan. 1, 2017 4,526 15,165 -908 -537 16,428 0 0 34,674
Groupresult 0 0 0 0 0 -4,531 3,874 -657
Actuarial gainsand losses 0 0 -7 0 0 0 0 -7
Currencytranslation 0 0 0 -613 0 0 -407 -1,020
Otherresult 0 0 -7 -613 0 0 -407 -1,027
Totalcomprehensiveincome 0 0 -7 -613 0 -4,530 3,466 -1.684
Capitalincrease 0 0 0 0 90,752 0 54,452 145,204
Dividendpayout 0 0 0 0 -1,132 0 0 -1,132
Dec. 31, 2017 4,526 15,165 -915 -1,150 106,048 -4,530 57,918 177,063
R e t a i n e d e a r n i n g s

6 0 | P A R A G O N A G A N N U A L R E P O R T 2 0 1 7

Not
esto
the
Con
solid
ated
Fina
ncia
lSt
atem
ents
2017
6 1

(2) Application of International Financial Reporting Standards (IFRS)
The consolidated financial statements of paragon AG as of December31, 2017, have been prepared in accordance with the InternationalFinancial Reporting Standards (IFRS) issued by the InternationalAccounting Standards Board (IASB), London, as adopted by the Euro-pean Union (EU) and applicable on the balance sheet date, and inaccordance with the interpretations of the International FinancialReporting Standards Interpretations Committee (IFRSIC).
(3) Going Concern
The financial statements for the reporting period from January 1 toDecember 31, 2017, have been prepared under the going concernassumption. The carrying amounts of assets and liabilities weretherefore determined on the basis of going concern values.
6 2 | P A R A G O N A G A N N U A L R E P O R T 2 0 1 7
Notes to the Consolidated FinancialStatements 2017
(1) General Information
paragon Aktiengesellschaft (hereafter “paragon AG” or “paragon”) isa joint stock corporation incorporated under German law. The com-pany’s headquarters are at Artegastrasse 1, Delbrück, Germany.paragon AG’s shares have been traded on the Frankfurt StockExchange in the Prime Standard segment of the regulated marketsince 2000. paragon AG is entered in the commercial register of thedistrict court of Paderborn (HRB 6726). paragon develops and manu-factures electronic components and sensors for the automotiveindustry.
The Management Board of paragon AG authorized the consolidatedfinancial statements as of December 31, 2017, and the combinedmanagement report for the period from January 1 to December 31,2017, for submission to the Supervisory Board on March 12, 2018.
The consolidated financial statements and combined managementreport of paragon AG for the period from January 1 to December31, 2017, are published in the electronic Federal Gazette and areavailable as part of the Annual Report on the company’s website(www.paragon.ag).

(4) Events After the Balance Sheet Date
The consolidated financial statements are prepared on the basis ofthe circumstances existing as of the balance sheet date. In accor-dance with IAS 10.7, events after the reporting period include allevents up to the date the consolidated financial statements areauthorized for issue.The consolidated financial statements as ofDecember 31, 2017, were authorized by the Management Board andsubmitted to the Supervisory Board for approval on March 12, 2018.Up to this date, the following significant events emerged:
On January 19, 2018, the company signed a purchase agreement fora property in Delbrück. A mortgage on this property was registeredon January 22 of the year. The payment of the purchase price is sub-ject to the approval of the city of Delbrück and the state of NorthRhine-Westphalia to change the land-use plan.
(5) New Accounting Principles Due to New Standards
The following revised and new standards issued by the IASB, as well asinterpretations from the IFRSIC, had been endorsed by the EU andrequired mandatory application for the first time as of December 31,2017:
• On January 13, 2016, the IASB issued a new accounting standard,IFRS 16 Leases. The basic principle of the new standard is thatlessees shall present all leases and the resulting contractual rightsand obligations on the balance sheet. The obligation for the lesseeto distinguish between finance leases and operating leasesrequired to date under IAS 17 no longer applies. The lesseerecords a leasing liability in the balance sheet for the obligation tomake lease payments in future periods in respect of all leases. Atthe same date, the lessee records a right of use in respect of theunderlying asset, which shall represent the present value of thefuture lease payments plus any directly attributable costs. Thelease payments include all fixed payments, variable payments thatare index-based, expected payments based on residual value guar-antees, and, where applicable, the exercise price for a purchaseoption and penalties for the early termination of lease agreements.During the term of the lease agreement, the leasing liability is car-ried forward in a manner similar to IAS 17 requirements forfinance leases, while the right-of-use asset is amortized. This gen-erally leads to higher expenses at the beginning of the contractualperiod of the lease. Simplified rules apply to short-term leasearrangements and to leased assets with a small value. For the les-sor, however, the rules under the new standards are similar tothose under the existing IAS 17 standard. Lease contracts will con-tinue to be classified as either finance or operating leases. Leasesthat transfer all significant risks and rewards of ownership will beclassified as finance leases, and all other leases will be classified as
operating leases. The classification criteria under IAS 17 has beencarried forward into IFRS 16. In addition, IFRS 16 includes a num-ber of additional rules on disclosure requirements and require-ments that apply to sale and leaseback transactions.
The new requirements shall be applied to fiscal years beginning onor after January 1, 2019. Earlier application is permitted, providedthat IFRS 15 is also applied. The amendments were endorsed bythe European Union on October 31, 2017. The company willimplement the new standard in the fiscal year 2019. At the pres-ent time, the company expects an increase in the balance sheetand insignificant effects on earnings from this.
• The IASB published amendments to IFRS 15 Clarifications to IFRS15 on April 12, 2016. These are the result of the discussions of theTransition Resource Group for Revenue Recognition (TRG), whichwas jointly established by the IASB and the U.S. standards setterFASB to discuss application/implementation issues. Since the dis-cussions themselves are not legally binding, they need to be imple-mented in the standard-setting process. In January 2016, the IASBannounced its withdrawal from the TRG, which means that IFRS15 will not be subject to any further changes (before coming intoeffect).
The amendments to the requirements of IFRS 15 that have nowbeen adopted include the following points:
Identification of performance obligations
The identification of an entity’s performance obligations should bebased on independently definable commitments for goods or serv-ices. For the purpose of clarification, further examples areincluded to explain the independence of performance obligations.
N O T E S T O T H E C O N S O L I D A T E D F I N A N C I A L S T A T E M E N T S 2 0 1 7 6 3
Principal-Agent Relationships
Whether an entity acts as principal or agent in the supply of goodsor services to third parties is determined by the new regulations inIFRS 15.B34ff.
The assessment of the question of whether an entity is acting asprincipal or agent is made based on the possibility of controllingthe goods/services before their transfer to the customer. The indi-cators from IFRS 15.B37 for clarifying whether an entity is actingon its own behalf or as an agent are similar to the previous indica-tors from IAS 18.A21 and include, among other things, the ques-tion of whether it bears the inventory risk or can determine thesales price of the performance/goods prior to transport or uponreturn.
In addition, the existing implementation guidelines have beenadjusted and the current examples have been amended orexpanded.
Licensing Agreements
If a license is granted that can be independently distinguishedfrom other goods or services, the contractual arrangement mustspecify whether the proceeds will be realized over time or at a cer-tain point in time. New guidelines have been introduced in IFRS15.B59A to clarify when an intangible asset is significantlychanged. Substantial changes will then occur if the form or func-tionality or if the expected benefit is significantly changing.
The clarifications to IFRS 15 will require mandatory applicationanalogous to the standard in fiscal years beginning on or after Jan-uary 1, 2018. The amendments were endorsed by the EuropeanUnion on October 31, 2017. The Company will implement thenew standard in the fiscal year 2018. The Company does notexpect any significant effects from its first application on the netassets and results of operations. The company carried out ananalysis of the customer contracts during the financial year. Theanalysis showed that there are no significant combined customercontracts within the Group.
• On September 12, 2016, the IASB published amendments to IFRS4 Applying IFRS 9 Financial Instruments with IFRS 4 InsuranceContracts. The overlay and deferral approaches introduced by theamendments to IFRS 4 are to be applied for the first time at thesame time as IFRS 9 (i.e., January 1, 2018); the deferral approachmust be applied by 2021 at the latest.
The amendments to IFRS 4 are intended to address concerns aris-ing from the variance in timing of the first-time application of IFRS4 and IFRS 9. The following concerns were previously raisedregarding the IASB:
The volatilities in the income statement resulting from the differ-ent application dates may be difficult for readers of the financialstatements to understand or follow. Decisions regarding the appli-cation of the new classification and measurement rules in IFRS 9depend on the final decisions of the insurance standard and aretherefore difficult to make without prior knowledge.
The amendments to IFRS 4 published by the IASB in September2016 include the following two optional approaches:
The deferral approach allows companies, insofar as their activitiesare predominantly related to the insurance business, to postponethe application of IFRS 9 until January 1, 2021, at the latest andcontinue to apply IAS 39 until then.
Alternatively, an entity may use the overlay approach when apply-ing IFRS 9 for the first time. This allows companies to exclude tem-porary volatilities arising from the application of IFRS 9 prior tothe application of IFRS 17 in the income statement and insteadreclassify them to OCI. This applies to financial instruments thatare measured at fair value through profit or loss in accordancewith IFRS 9 but not IAS 39.
The overlay and deferral approaches introduced by the amend-ments to IFRS 4 are to be applied for the first time at the sametime that IFRS 9 is applied for the first time from January 1, 2018,while the deferral approach must be applied by 2021 at the latest.The amendments were endorsed by the European Union onNovember 03, 2017. The changes had no effect on the consoli-dated financial statements.
• On January 29, 2016, the IASB issued amendments to IAS 7 State-ment of Cash Flows as part of its Disclosure Initiative. The amend-ments are intended to improve the information reported about anentity’s financing activities. Following the amendments, an entityis required to provide disclosures about the changes in financialliabilities whose cash inflows and outflows are shown in the state-ment of cash flows within financing activities. The disclosurerequirements also relate to changes in associated financial assets(e.g., assets used for hedging purposes).
6 4 | P A R A G O N A G A N N U A L R E P O R T 2 0 1 7

Disclosure is required of changes from financing cash flows,changes arising from acquiring or disposing of businesses, theeffect of changes in foreign exchange rates, changes in fair valuesand other changes.
The IASB proposes that the disclosures are made by providing areconciliation between the opening and closing balances in thestatement of financial position. Other forms of presentation arealso permitted. These amendments require application in fiscalyears beginning on or after January 1, 2017. Comparative figuresare not required in the year of initial application. The amendmentswere endorsed by the European Union on November 6, 2017. Thecompany has determined the necessary disclosures. The changeshad no material effect on the consolidated financial statements.
• On January 19, 2016, the IASB published amendments to IAS 12Income Taxes entitled Recognition of Deferred Tax Assets forUnrealized Losses. The aim of the project was to clarify variousissues relating to the recognition of deferred tax assets for unreal-ized losses in other comprehensive income (OCI) arising fromchanges in the fair value of debt instruments.
Specifically, the amendments to IAS 12 clarified the followingaspects:
An unrealized loss on a fixed-interest debt instrument will result ina deductible temporary difference if this debt instrument is meas-ured at fair value and its tax value matches its acquisition costs.
Insofar as the tax law distinguishes between the different types oftaxable profits, an independent assessment must be made for eachpart of the taxable profit as to whether a deferred tax asset shouldbe recognized.
When estimating its future taxable profit, an entity can assumethat it is possible to realize an asset in excess of its carryingamount, provided that such realization is probable.
Insofar as the tax law distinguishes between the different types oftaxable profits, an independent assessment must be made for eachpart of the taxable profit as to whether a deferred tax asset shouldbe recognized.
These amendments require application in fiscal years beginning onor after January 1, 2017. The amendments were endorsed by theEuropean Union on November 6, 2017. The company has deter-
mined the necessary disclosures. The changes had no effect onthe consolidated financial statements.
The following standards and interpretations had already beenissued but did not yet require mandatory application and/or hadnot been endorsed by the European Union as of the date that thefinancial statements for the period from January 1 to December31, 2017, were prepared:
• On September 11, 2014, the IASB issued amendments to IFRS 10Consolidated Financial Statements and IAS 28 Investments inAssociates and Joint Ventures based on Sale or Contribution ofAssets between an Investor and its Associate or Joint Venture(Amendments to IFRS 10 and IAS 28). This is intended to eliminatethe previous inconsistency between IFRS 10 and IAS 28 concern-ing the question of full (IFRS 10) or partial (IAS 28) gain or lossrecognition upon the loss of control of a subsidiary. Within IAS 28,the requirements governing gains and losses from transactionsbetween an enterprise and its associate or joint venture have beenamended (IAS 28.28–30). The new requirements refer exclusivelyto assets that do not constitute a business as defined in IFRS 3.3(in conjunction with IFRS 3.B7 et seq.). Gains and losses fromtransactions with associates and joint ventures in respect of assetsthat constitute a business must now be fully recognized in thefinancial statements of the investor (IAS 28.31A). Enterprises mustfurther review whether assets sold or contributed in separatetransactions constitute a business and should be accounted for asa single transaction (IAS 28.31B). In IFRS 10, an exception to thecomplete recognition through profit or loss of any loss of controlover a subsidiary has therefore been included in Paragraph B99A.This applies to the extent that the assets abandoned do not con-stitute a business, and in the event that the loss of control arisesdue to a transaction with an associate or joint venture recognizedusing the equity method. Guidelines have also been added thatany gains or losses arising from such transactions may only be rec-ognized in the income statement of the parent company in theamount of the share attributable to unrelated third-party investorsin the associate or joint venture. The same applies to gains andlosses resulting from the fair value measurement of interests insubsidiaries that now constitute associates or joint ventures andare measured using the equity method. The amendments originallyrequired application in fiscal years beginning on or after January 1,2016. On December 17, 2015, the IASB proposed postponing thedate of first-time application indefinitely. The company is of theopinion that the amendments will have no material implications onthe consolidated financial statements.
N O T E S T O T H E C O N S O L I D A T E D F I N A N C I A L S T A T E M E N T S 2 0 1 7 6 5

• On June 20, 2016, the IASB issued amendments to IFRS 2 Classifi-cation and Measurement of Share-based Payment Transactions.The amendments affect the following aspects:
The effects of vesting conditions (service conditions, market con-ditions and other performance conditions) on the measurement ofcash-settled share-based payment transactions. Following theamendments, market and non-vesting conditions are taken intoaccount when estimating fair value. Service conditions and otherperformance conditions are taken into account by adjusting thenumber of awards.
The classification of share-based payment transactions with netsettlement features for withholding tax obligations: If an entitywithholds shares that would have otherwise been issued becauseit is required to fund the payment to the tax authority in respect ofthe employee’s tax obligation associated with the share-basedpayment, and this net arrangement is provided for in the contract,then the remuneration – despite the partial settlement in cash – isto be accounted for as equity-settled share-based remuneration.
The accounting for a modification to the terms and conditions of ashare-based payment transaction that changes its classificationfrom cash-settled to equity-settled: The equity-settled share-based payment transaction is measured at the (pro rata temporis)fair value of the equity instruments granted at the modificationdate. Any difference to the derecognized liability is recorded inprofit and loss.
The amendments shall be applied to remuneration which isgranted or modified in fiscal years beginning on or after January 1,2018. Earlier application is permitted. A retrospective applicationis only permitted when the use of improved information obtainedin hindsight is excluded. The European Union has not yet endorsedthe amendments. The Group is currently of the opinion that theamendments will not have a significant effect on the presentationof the financial statements.
• The IASB issued an amendment to IAS 40 Investment Property onDecember 8, 2016. The amendment to IAS 40 is designed to clar-ify when the classification of a property as “investment property”begins and ends if the property is under construction or develop-ment. The complete list provided to date in IAS 40.57 did not pro-
vide sufficient clarification on the treatment of property underconstruction. The list is now explicitly described as not beingexhaustive so that property under construction can be included inthe definition. The amendment is effective from January 1, 2018.Earlier application is permitted. The European Union has not yetendorsed the amendments. The amendment will not have anyeffect on the consolidated financial statements.
• The IASB issued IFRIC 22 Foreign Currency Transactions andAdvance Consideration on December 8, 2016. IFRIC 22 addressesan application question relating to IAS 21 The Effects of Changesin Foreign Exchange Rates. The interpretation clarifies the date onwhich the exchange rate used to convert a payment or receipt ofadvance consideration should be determined. The date to be usedto determine the exchange rate for the underlying asset, incomeor expense is the date of initial recognition of the prepaymentasset or deferred income liability. The interpretation is effectivefrom January 1, 2018. Earlier application is permitted. The Euro-pean Union has not yet endorsed the amendments. The companyis of the opinion that the amendments will have no material impli-cations on the consolidated financial statements.
• In July 2014, the IASB published IFRS 9, Financial Instruments.IFRS 9 introduces a uniform approach to the classification andmeasurement of financial assets. As a basis, the standard refers tothe cash flow characteristics and the business model under whichthey are managed. It also provides for a new impairment modelbased on expected credit losses. IFRS 9 also includes new rules onthe application of hedge accounting in order to better represent acompany's risk management activities, in particular with regard tothe management of non-financial risks. The new standard is effec-tive for annual periods beginning on or after January 1, 2018.paragon AG will apply IFRS 9 for the first time for the financialyear beginning on January 1, 2018; the adjustment of prior-yearfigures is waived in accordance with the transitional provisions ofIFRS 9.
We completed the analysis of the impact of IFRS 9 on the presen-tation of the net assets, financial position and results of opera-tions. On the basis of current knowledge, the effects of the firstapplication in relation to the allocation to valuation categories andthe associated earnings effects are not considered as significant.
6 6 | P A R A G O N A G A N N U A L R E P O R T 2 0 1 7

• The IASB issued the Annual Improvements to IFRSs (2014–2016)on December 8, 2016. Three standards were amended in theAnnual Improvements to IFRSs (2014–2016). The amendmentswere as follows:
- IFRS 1 First-time Adoption of International Financial ReportingStandards: deletion of the remaining exemptions in IFRS 1 whichwere limited to specific periods of time. Appendix E (IFRS 1.E3–E7) for first time adopters..
- IFRS 12 Disclosure of Interests in Other Entities: clarificationthat the disclosure requirements in this standard – with theexception of IFRS 12.B10–B16 – also apply to investmentswhich fall within the application of IFRS 5.
- IAS 28 Investments in Associates and Joint Ventures: clarifica-tion that the option to measure an investment in an associate orjoint venture that is held by a venture capital entity or anotherqualifying entity can be exercised individually on an investment-by-investment basis.
- The amendments to IFRS 12 are effective from January 1, 2017,and the amendments to IFRS 1 and IAS 28 are effective fromJanuary 1, 2018. Earlier application is permitted. The EuropeanUnion has not yet endorsed the amendments. The company is ofthe opinion that the amendments will have no material implica-tions on the consolidated financial statements.
• On June 7, 2017, the IFRS Interpretations Committee (IFRIC) pub-lished IFRIC 23 Uncertainty over Income Tax Treatments. The taxtreatment of certain items and transactions may depend on futurerecognition by the tax authorities or fiscal jurisdiction.
IAS 12 Income Taxes regulates how actual and deferred taxes areto be recognized. IFRIC 23 supplements the provisions of IAS 12with regard to the recognition of uncertainties relating to theincome tax treatment of facts and transactions. IFRIC 23 thus stip-ulates that tax risks (e.g., in the event of a tax dispute) must betaken into account if it is probable that the tax authorities will notaccept a certain tax-relevant circumstance as it has been includedin the entity’s tax calculation. It is always assumed that the taxauthorities are fully informed, i.e., a possible discovery risk is irrel-evant for both recognition and measurement. The measurementshall be based on the most probable value or expected value,depending on the value that best reflects the existing risk. Theinterpretation does not deal with the interest on additional taxclaims and refunds or possible penalties.
IFRIC 23 is applicable to fiscal years beginning on or after January1, 2019. Earlier application is permitted. The European Union hasnot yet endorsed the amendments. The company is of the opinionthat the interpretation will have no material implications on theconsolidated financial statements.
• On May 18, 2017, the IASB published IFRS 17 Insurance Contracts.After years of discussion, there is now a uniform internationalaccounting standard for insurance transactions. The objective is toincrease the transparency and comparability of insurance balancesheets. Current accounting in accordance with the previous IFRS 4does not adequately ensure this.
Key changes are:
- Use of current assumptions, including discount rate used for taxpurposes, in the measurement of insurance service provisions
- Elimination of savings portions and financing components in theincome from premiums and in
- Expenses for insurance services
- Strict separation of insurance service result and financial result inthe income statement
- Option to recognize interest-related measurement changes inother comprehensive income (OCI) instead of in the incomestatement
- Simplification based on unearned premiums for short-term con-tracts
- Allocation of initial profit in accordance with the provision ofbenefits by taking into account a contractual service margin(CSM) in the insurance service provisions
- In the case of profit-sharing business, recording of the share-holder’s share of the gross profit in the CSM and correspondingallocation
- Treatment of reinsurance liabilities irrespective of the underlyingprimary insurance business
- Extensive disclosures in the notes, including on the profitabilityof new business.
N O T E S T O T H E C O N S O L I D A T E D F I N A N C I A L S T A T E M E N T S 2 0 1 7 6 7

• IFRS 17 does not prescribe accounting rules for policyholders. Thestandard is effective for fiscal years beginning on or after January1, 2021. The European Union has not yet endorsed the amend-ments. The company is of the opinion that the standard will haveno effects on the consolidated financial statements.
• The IASB issued the Annual Improvements 2015-2017 on Decem-ber 12, 2017. This includes three amendments to IAS 12, IAS 23and IFRS 3/IFRS 11. The originally proposed amendment to IAS 28with regard to Long-term Interests in Associates and Joint Ven-tures was published as a separate amendment to IAS 28 or IFRS 9in October 2017 as part of a narrow scope amendment. Theamendments to IFRS 3 and IFRS 11 were previously dealt with in aseparate amendment proposal but were included in the AnnualImprovements as a final amendment after the Board’s decision.
The amendments were as follows:
- IAS 12: The provisions of IAS 12.52B are to be applied to allincome tax effects of dividends. This means that actual incometaxes resulting from dividend payments must be recognized inprofit or loss.
- IAS 23: If an asset is ready for its intended use or sale, anyremaining borrowings that have been expressly incurred for thatasset must be treated as part of the general borrowings.
- IFRS 3/IFRS 11: A clarification has been made on the acquisitionof control over a joint operation that necessitates the remea-surement of previously held interests in the assets and liabilitiesof the joint operation at that time. Specifically with regard toIFRS 11, a clarification has been provided on shares held beforegaining (possibly joint) control in a joint operation within themeaning of IFRS 11 or its assets and liabilities (previously heldinterests). However, previously held interests in the assets andliabilities of the joint operation are not remeasured.
The amendments are to become mandatory in fiscal years commenc-ing on or after January 1, 2019. The European Union has not yetendorsed the amendments. The company is of the opinion that theamendments will have no effect on the consolidated financial state-ments.
(6) Scope of Consolidation
6 8 | P A R A G O N A G A N N U A L R E P O R T 2 0 1 7
Name and registered office of the company Shareholding Consolidation Currency Revenue in local currency(prior to consolidation)
in € thousands
Germany
paragon AG, Delbrück n. a. n. a. EUR 108,693
KarTec GmbH, Delbrück 100.00 % Consolidated subsidiary EUR 0,00
Voltabox AG, Delbrück 60.03 % Consolidated subsidiary EUR 24,619
productronic GmbH, Delbrück 100.00 % Consolidated subsidiary EUR 65,758
SphereDesign GmbH, Bexbach 100.00 % Consolidated subsidiary EUR 5,107
paragon movasys GmbH*, Landsberg am Lech 100.00 % Consolidated subsidiary EUR 1,723
China
paragon Automotive Technology
(Shanghai) Co., Ltd. 100.00 % Consolidated subsidiary RMB 1,428
paragon Automotive
(Kunshan) Co., Ltd. 100.00 % Consolidated subsidiary RMB 15,364
USA
Voltabox of Texas, Inc. 60.03 % Consolidated subsidiary USD 3,792
*The revenues of paragon movasys GmbH relate to December 2017 after first-time consolidation as of December 1, 2017.

In addition to the parent company, paragon AG, Delbrück, Germany,subsidiaries are fully consolidated. The reporting date for all companiesis December 31. Voltabox Deutschland GmbH was incorporated intoVoltabox. HS Genion GmbH, acquired with effect from November 24,2017, was renamed paragon movasys GmbH. A list of companiesincluded in the scope of consolidation and a list of shareholdings areset out in the table.
Account of the acquisition of paragon movasys GmbH with eco-nomic effect as of December 1, 2017:
By signing the share purchase and assignment agreement datedNovember 24, 2017, the company has acquired all of HS GenionGmbH's shares in Landsberg am Lech for a purchase price includingancillary costs of € 5,158 thousand. The seller was the Augenio AG inDortmund. The company designs, develops and produces automo-tive products. It is mainly active in the field of adaptive aerodynamicsystems. By shareholder resolution of December 7, 2017 HS GenionGmbH was renamed paragon movasys GmbH.
N O T E S T O T H E C O N S O L I D A T E D F I N A N C I A L S T A T E M E N T S 2 0 1 7 6 9
In € thousands Dec. 1, 2017 Dec. 1, 2017
Carrying amount Fair value
Customer list 0 4,209
Technology 0 3,288
Development work 0 2,851
Other intangible assets 287 287
Property, plant and equipment 548 548
Financial assets 3 3
Inventories 4,936 4,936
Trade receivables 4,034 4,034
Other current assets 335 335
Liquid funds 601 601
Deferred tax liabilities 0 -2,822
Pension provisions -56 -226
Other current provisions -242 -242
Income tax provisions -34 -34
Liabilities to banks -2,400 -2,400
Trade payables -6,472 -6,472
Other current liabilities -305 -305
Acquired net assets 1,235 8,590
Goodwill 6,568
Purchase price 15,158
Of which paid by means of payment in 2017 15,158
paragon movasys GmbH is assigned to the Body Kinematics businessunit and generates full-year revenues of € 25.3 million and a net lossof € 1,951 thousand on the basis of the annual financial statementsprepared in accordance with German commercial law (HGB). Thecompany employs around 100 people.
The acquisition of HS Genion GmbH is based on the foundation, thatthe Body Kinematics business unit is becoming the leading systemsprovider for overall vehicle aerodynamics. The purchase seestremendous growth potential in the global megatrend CO2 reduc-tion.
Date of first consolidation is December 1, 2017. Since the acquisi-tion took place shortly before the balance sheet date, the purchaseprice allocation can be adjusted on the basis of further information inthe following financial year.
The purchase price agreed in the context of the transaction was paidin cash in the 2017 financial year and further earn-out payments andother contingent consideration are not contractually agreed.
The goodwill of € 6,568 thousand remaining after the purchase priceallocation can be attributed to various factors. This mainly includesthe development know-how in the field of kinematics acquiredthrough paragon movasys GmbH. In addition, the acquisition willstrengthen the market position of the paragon Group. In addition,the expertise of the employees and the synergies in the businessvalue are recorded.
paragon movasys GmbH was acquired with effect as of November24, 2017. The date of initial consolidation is December 1, 2017. Theremaining goodwill of € 8,113 thousand subsequent to the purchaseprice allocation is attributable to various factors, primarily the devel-opment expertise in kinematics acquired via paragon movasysGmbH. The acquisition also strengthens the paragon Group’s marketposition. Goodwill is not deductible for tax purposes.
Deferred tax liabilities totaling € 2,822 thousand were formed intotal on the hidden reserves disclosed in the customer list, technol-ogy, development work and the hidden charges disclosed in the pro-vision for pensions. These are amortized over the useful lives of theassets and provisions. No deferred tax liabilities are recognized ongoodwill.
In December 2017, paragon movasys GmbH generated sales of€ 1,723 and net income of € 743, which was included in the consoli-dated financial statements.
The hidden reserves disclosed in the purchase price allocation areamortized as follows:
• Customer list, 12 years
• Technology, 10 years
• Own work capitalized, 4 years
The depreciation expense in the financial year amounted to € 57thousand.
Consolidation Methods
The consolidated financial statements are based on the separatefinancial statements of the companies included in the Group, whichwere prepared using uniform accounting policies under IFRS as ofDecember 31, 2017. The financial statements are included in the con-solidated financial statements from the date on which control isobtained until the end of control. Adjustments were made to theaudited annual financial statements of paragon AG prepared in accor-dance with German commercial law as of December 31, 2017, in orderto prepare the financial statements in compliance with IFRS.
The consolidation was performed using the acquisition method inaccordance with IAS 27.22 and IFRS 3. The carrying amount for theinvestments in associates recorded by the parent companies isreplaced by the fair value of the assets and liabilities of the associatesincluded in the consolidation. As a result, the equity of the subsidiariesis compared with the carrying amount of the investment recorded bythe parent company. Any remaining excess from consolidation isreported as goodwill under noncurrent assets and is tested annuallyfor impairment in accordance with IFRS 3 in conjunction with IAS 36.
In addition, debt consolidation was carried out, as was consolidationof income and expenses. The differences arising from the consolida-tion of income and expenses were offset through profit or loss.
Assets from intercompany deliveries that are recognized in noncur-rent assets and inventories have been adjusted for interim profit andloss.
7 0 | P A R A G O N A G A N N U A L R E P O R T 2 0 1 7

(7) Currency Translation
In paragon’s consolidated financial statements, receivables and liabil-ities denominated in foreign currencies are measured at the transac-tion rate in effect at the date they are initially recognized, and subse-quently adjusted to the exchange rate applicable as of the balancesheet date. Exchange rate gains and losses are recognized in profitand loss within other operating income or other operating expenses.
Exchange rate losses arising on operating activities of € 66 thousand(prior year: € 136 thousand) and exchange rate gains of € 182 thou-sand (prior year: € 142 thousand) are recognized in the consolidatedstatement of comprehensive income. These exchange rate differ-ences are reported within other operating expenses and other oper-ating income, respectively.
The exchange rates of the currencies significant to the paragonGroup were as follows:
Due to new information in accordance with IAS 21, paragon AG, theparent company of Voltabox AG, has valued the loan provided inorder to establish Voltabox of Texas, Inc. – as outlined in the half-year financial report as of June 30, 2017 – as a net investment in anoverseas business. Since then, it has presented the unrealized cur-rency movements directly in equity under the “currency translationdifferences” item. The currency loss from the valuation of the netinvestment amounts to € 2,040 thousand as of December 31, 2017.
In December 2017, the loan liabilities were transferred from paragonAG to Voltabox AG so that the unrealized currency movements as ofDecember 31, 2017, are also shown in the equity of the Voltaboxsubgroup.
(8) Description of Accounting Polices and Measurement Methods
The consolidated financial statements were prepared in euros (€). Thereporting currency as defined in IAS 21 “The Effects of Changes inForeign Exchange Rates“ is the euro. Unless stated otherwise, allamounts are stated in thousands of euros (€ thousand). The reportingperiod for paragon in these financial statements extends from January1 to December 31, 2017. Individual items in the consolidated balancesheet and the consolidated statement of comprehensive income havebeen combined in order to provide better clarity and transparency.Where this has occurred, the items are explained individually in thenotes to the financial statements. The consolidated statement of com-
prehensive income is presented using the nature of expense method,as in previous periods. Assets and liabilities are classified into noncur-rent and current assets and liabilities in the balance sheet; furtherdetails on their maturity are presented in the notes. Assets and liabili-ties are recognized as current if they mature within twelve months.
The consolidated financial statements comprise the consolidatedstatement of financial position, the consolidated statement of com-prehensive income, the notes to the consolidated financial state-ments, the consolidated cash flow statement and the consolidatedstatement of changes in equity. A combined management report hasbeen prepared as a supplement to the above statements.
Recognition of Acquisitions
Goodwill is recognized in the Group’s statement of financial positionas a result of acquisitions. When an acquisition is initially consolidated,
all identifiable assets, liabilities and contingent liabilities are recog-nized at fair value as of the acquisition date. One of the most signifi-cant estimates relates to determining the fair values of these assetsand liabilities as of the acquisition date. Land, buildings and officeequipment are generally valued on the basis of independent expertopinions, while marketable securities are valued at the stock exchangeprice. If intangible assets are identified, the fair value is determinedinternally using an appropriate measurement technique, which is usu-ally based on the estimate of total expected future cash flows. Thesevaluations are closely linked to the assumptions made by managementregarding the future performance of the respective assets and to theassumed changes in the discount rate to be applied.
Intangible Assets
Intangible assets acquired for monetary consideration are recognizedin the balance sheet at their acquisition cost, taking into account ancil-lary costs and any purchase price reductions.
Research costs are recognized as expenses in the period in which theyare incurred. Costs incurred in connection with the development ofpatents and customer-specific solutions are only recognized as intan-gible assets at their production cost when the costs are clearly attrib-utable to the asset as required by IAS 38 “Intangible Assets“, the techni-cal feasibility and marketability or use is assured, and when the antici-pated realization of future economic benefits has been demonstrated.
N O T E S T O T H E C O N S O L I D A T E D F I N A N C I A L S T A T E M E N T S 2 0 1 7 7 1
Foreign currency for € 1 Balance sheet – mean Profit & loss average Balance sheet – mean Profit & loss averagerate as of Dec. 31, 2017 rate 2017 rate as of Dec. 31, 2016 rate 2016
US-dollar (USD) 1.1980 1.1841 1.0520 1.0538
Chinesische renminbi yuan (RMB) 7.7956 7.8035 7.3062 7.3062

The costs of production comprise all costs that are directly or indi-rectly attributable to the development process, as well as a propor-tionate share of necessary project-related overhead costs. If the assetrecognition requirements are not fulfilled, development costs aredirectly expensed in profit or loss within other operating expenses inthe year in which they are incurred. Subsequent to initial recognition,development costs are reported in the balance sheet at cost lesscumulative amortization and cumulative impairment losses.
Intangible assets that have limited useful lives are amortized on astraight-line basis over their useful economic lifetimes. Amortizationstarts as soon as the asset is available for use, i.e., when it is in thelocation and condition necessary for it to be capable of operating inthe manner intended by management. Intangible assets with indefiniteuseful lives are subject to annual impairment tests. At each balancesheet date, the carrying amounts of such intangible assets are exam-ined in order to determine whether there are indications that thevalue of the asset may be impaired. An impairment test pursuantto IAS 36 “Impairment of Assets“ was performed where there aresuch indicators. The residual values, useful lives and amortizationmethods are reviewed at the end of each fiscal year and amended asnecessary.
The useful lives for internal development costs correspond to theexpected product life cycles and amount to four years. The useful livesfor licenses, patents and software range from three to ten years.
Goodwill is carried at acquisition cost and tested for impairment eachyear and, additionally, at other dates when there are any indications ofpotential impairment. Impairment losses are recognized under impair-ments of property, plant and equipment and intangible assets andreported as other operating expenses.
Property, Plant and Equipment
Additions to property, plant and equipment are measured at cost plusincidental acquisition costs and less any purchase price reductionsreceived. If the cost of individual components of an item of property,plant and equipment is significant when measured against the item’stotal purchase cost, then such components are recorded as separateassets and depreciated individually. Depreciation is recorded on astraight-line basis. The useful life for depreciation purposes rangesfrom 20 to 33 years for buildings, five to ten years for technical plants,and three to ten years for other plants, operating and office equip-ment.
Fully depreciated noncurrent assets are presented under cost andaccumulated depreciation until the asset is retired. Amortized cost andaccumulated depreciation are deducted from the sales proceeds gen-erated on disposal. Gains and losses generated on disposal (disposalproceeds less residual carrying amounts) are shown in the consoli-dated statement of comprehensive income within other operatingincome or other operating expenses. All residual values, useful livesand depreciation methods are reviewed annually and amended as nec-essary.
At each balance sheet date, the carrying amounts of property, plantand equipment (which are depreciated in accordance with their usefullives) are examined in order to determine whether there are indica-tions that the value of the asset may be impaired. If such indicatorsexist, an impairment test is performed.
Leases
Leases are classified as finance leases if all the risks and rewards asso-ciated with beneficial ownership of an asset are substantially trans-ferred to paragon. Property, plant and equipment held under financelease arrangements in accordance with IAS 17 “Leases“ are capitalizedat the lower of their fair value and the present value of the minimumlease payments at the beginning of the usage period. A liability is rec-ognized in the balance sheet for the same amount, and, subsequent toinitial recognition, measured at amortized cost using the effectiveinterest method. The amortization methods and useful lives corre-spond to those of similar assets acquired under purchase arrange-ments.
If beneficial ownership in a lease falls to the lessor (operating lease),the leased asset is recognized in the balance sheet of the lessor.Expenses arising from such leases are shown under other operatingexpenses.
The determination as to whether an agreement contains a lease isbased on the economic nature of the agreement at its inception.Therefore, an estimate is made regarding every lease as to whetherfulfilling the contractual agreement is dependent on using a specificasset or specific assets and whether the agreement grants a right touse the asset.
A sale and leaseback transaction involves the sale of an asset ownedand already used by the future lessee to the lessor and the subsequentcontinued use of the asset by the lessee under a lease agreement. In
7 2 | P A R A G O N A G A N N U A L R E P O R T 2 0 1 7

this respect, two economically interdependent agreements areinvolved (purchase agreement and lease agreement). The transactionis accounted for as a single transaction, either as an operating lease ora finance lease, depending on the nature of the leaseback agreement.
Impairment of Nonfinancial Assets
At each balance sheet date, an assessment takes place to ascertainwhether there are any indications that the value of nonfinancial assets(in particular intangible assets with definite useful lives) are impaired.If there are indications of impairment, an estimation of the recover-able amount of the relevant asset is made. In accordance with IAS36.6 “Impairment of Assets“, the recoverable amount reflects thehigher of fair value less cost to sell and value in use of the asset or anidentifiable group of assets that represent a cash-generating unit(CGU). If the carrying amount of an asset or a CGU exceeds the recov-erable amount, the asset is impaired and written down to its recover-able amount.
For property, plant and equipment and intangible assets other thangoodwill, an assessment is made at each balance sheet date to estab-lish whether there is any indication that a previously recognizedimpairment loss no longer exists or has decreased. If there are suchindications, an estimate of the recoverable amount of the asset or theCGU is made. A previously recognized impairment loss is reversedonly if the assumptions used in determining the recoverable amounthave changed since the last impairment loss was recognized. Thereversal of the impairment loss is limited in that the carrying amountof an asset may not exceed its recoverable amount or the carryingamount that would have resulted after taking depreciation and amor-tization into account if no impairment loss had been recorded for theasset in earlier years.
Financial Instruments
A financial instrument is a contract that gives rise to a financial assetof one entity and a financial liability or equity instrument of anotherentity. A necessary requirement is that the rights or obligations arefinancial in nature, based on legal transactions in the form of agree-ments or contracts.
Financial assets primarily include cash and cash equivalents, tradereceivables, loan receivables, other receivables, and primary and deriv-
ative financial assets held for trading. Financial assets are measured ateither fair value or amortized cost depending on their classification.The fair values recorded in the balance sheet are generally measuredusing the market prices of the financial assets. Where no marketprices are available, fair value is calculated using recognized valuationmodels and by referring to current market parameters.
Financial assets and derivative financial instruments held for tradingare measured at fair value. Financial instruments classified as loansand receivables are accounted for at amortized cost. Amortized costtakes into account repayments and the amortization of any possibledifference between the cost and the anticipated payment inflows atmaturity, using the effective interest rate method, less any possibledecreases from impairment due to uncollectability.
As a rule, financial liabilities are contractual obligations to deliver cashor another financial asset. Pursuant to IAS 39 “Financial Instruments:Recognition and Measurement“, at paragon these consist in particularof trade payables and other current liabilities as well as liabilities tobanks. paragon classifies financial liabilities under the measurementcategory of loans and receivables and measures them at amortizedcost, taking into account principal payments and the amortization ofany difference between the acquisition cost and the payment obliga-tion due on maturity using the effective interest rate method.
Financial assets are derecognized once the contractual right to obtaincash flows from these financial assets has expired, or once paragonhas transferred its contractual rights to obtain cash flows from thefinancial asset to a third party or has taken on a contractual obligationfor immediate payment of the cash flows to a third party as part of anagreement that fulfills the conditions in IAS 39.19 (pass-througharrangement). If financial assets are transferred, paragon examineswhether it has either (1) transferred all substantial risks and rewardsconnected with a financial asset, or (2) neither transferred norretained any substantial risks or rewards associated with the financialasset but has transferred the power to control the asset.
paragon recognizes a new asset if (1) all contractual rights to cashflows from the asset have been transferred to paragon, or (2) the sub-stantial risks and rewards associated with the asset have neither beentransferred nor retained, but paragon has received the power to con-trol the asset.
N O T E S T O T H E C O N S O L I D A T E D F I N A N C I A L S T A T E M E N T S 2 0 1 7 7 3

Financial liabilities are derecognized if the underlying obligation hasbeen fulfilled, canceled or has expired. If an existing financial liability isreplaced by another financial liability to the same creditor with signifi-cantly new contract terms, or if the terms of an existing liability arefundamentally changed, this replacement or change is treated as aderecognition of the original liability and the recognition of a new lia-bility. The difference between the respective carrying amounts is rec-ognized in profit or loss.
Financial assets and financial liabilities that are not denominated ineuros are initially recognized at the average rate applicable on thetransaction date and subsequently remeasured at each balance sheetdate. Any currency translation differences that arise are recognized inprofit or loss.
Financial assets and financial liabilities are shown as current in the bal-ance sheet if they are either classified as held for trading or if they areexpected to be settled within twelve months of the balance sheetdate.
Income Taxes
Income taxes contain both taxes that are payable on income anddeferred taxes.
Income taxes payable for current and earlier periods are measured atthe amount at which a refund from or payment to fiscal authorities isanticipated. The calculation of that amount is based on the currentstatus of tax legislation and therefore on the tax rates that are ineffect or that have been announced as of the balance sheet date.
Deferred taxes are recognized using the balance sheet liability methodin accordance with IAS 12 “Income Taxes“. Deferred tax assets and lia-bilities are recognized to reflect temporary differences between thecarrying amount of a specific balance sheet item in the IFRS consoli-dated financial statements and its tax base (temporary concept).Deferred taxes are also recognized for future tax refund claims.
Deferred tax assets on deductible temporary differences and taxrefund claims are recognized to the extent it can be assumed that theycan be expected to be used in future periods, based on the availabilityof adequate taxable income.
The calculation of current and deferred taxes is based on judgmentsand estimates. If actual events deviate from these estimates, this couldhave a positive or negative impact on the assets, financial position andearnings. A deciding factor for the recoverability of deferred tax assetsis the estimate of the probability of reversal of measurement differ-ences or the usability of the tax loss carryforwards or tax benefits thatled to recognition of the deferred tax assets. This is in turn dependenton the generation of future taxable profits during the period in whichthe tax loss carryforwards can be used. Deferred taxes are measuredusing the tax rates applicable at the time of realization based on thecurrent legal situation as of the balance sheet date.
Current income tax assets and liabilities and deferred income taxassets and liabilities are only offset if it is legally permissible to do soand the deferred tax assets and liabilities relate to income taxes thathave been levied by the same tax authority and if there is a legallyenforceable right to offset current tax refund claims against currenttax liabilities. Deferred taxes are reported as noncurrent in accordancewith IAS 1.70.
Inventories
Inventories are measured at the lower of cost and net realizable value.In accordance with IAS 2 “Inventories“, the costs of conversion includeall costs directly related to the units of production as well as a system-atic allocation of fixed and variable production overheads. In additionto direct materials and direct labor, they therefore also contain pro-portional indirect materials and overheads. Administration and socialwelfare expenses are taken into account provided they can be attrib-uted to production. Financing costs are not recognized as part of thecost of acquisition or conversion because the assets do not meet qual-ification criteria. Inventory risks resulting from the storage period and
7 4 | P A R A G O N A G A N N U A L R E P O R T 2 0 1 7

reduced usability are taken into account during the calculation of thenet realizable value by applying appropriate write-downs. Lower val-ues at year-end resulting from reduced selling prices are also takeninto account. Raw materials, consumables and supplies as well as mer-chandise are primarily measured using the moving average method.
Trade Receivables and Other Current Assets
Trade receivables are classified as loans and receivables and measuredat amortized cost less any necessary write-downs. Write-downs in theform of specific valuation allowances take sufficient account of theexpected default risks. Specific defaults lead to the derecognition ofthe receivables concerned. The calculation of write-downs for doubt-ful receivables is primarily based on estimates and evaluations of thecreditworthiness and solvency of the respective customer.
Other current assets are measured at amortized cost, taking intoaccount necessary write-downs sufficient to cover the expecteddefault risks. If recourse to the courts is made for the collection ofthese receivables, paragon firmly expects that the amounts recog-nized in the balance sheet will be fully enforceable. Where these rep-resent financial assets (financial instruments), they are classified asloans and receivables.
Cash and Cash Equivalents
Cash and cash equivalents include cash and bank balances with origi-nal maturities of up to three months. They are measured at nominalvalue. Foreign currency positions are measured at fair value. The totalof cash and cash equivalents reported in the cash flow statement cor-responds to the cash and cash equivalents stated in the balance sheet(cash and bank balances). As of December 31, 2017, the Groupreported receivables of € 408 thousand (prior year: € 734 thousand)relating to factoring agreements under cash and cash equivalents.
Provisions for Pensions
Provisions for pensions are calculated using the projected unit creditmethod in accordance with the revised requirements of IAS 19“Employee Benefits“. The projected unit credit method not only takesinto account the pension benefits and benefit entitlements known asof the balance sheet date, but also the increases in salaries and pen-sion benefits to be expected in the future based on relevant estima-
tion factors. The calculation is based on actuarial calculations, usingbiometric actuarial principles. Amounts not yet recorded in the bal-ance sheet arise from actuarial gains and losses due to changes ininventory and differences between the assumptions made and actualdevelopments. Actuarial gains and losses occurring in the reportingperiod are recognized in full directly in equity within other compre-hensive income. The service cost is shown under personnel expenses.The interest cost included in pension expenses is recorded in thefinancial result.
Other Provisions
Other provisions are recognized in accordance with IAS 37 “Provi-sions, Contingent Liabilities and Contingent Assets“, when paragonhas a legal or constructive present obligation to third parties as a resultof a past event that is likely to lead to an outflow of resources. Provi-sions are measured based on a best estimate of the expenditureneeded to discharge the liability. Reimbursement claims are not offsetagainst these amounts. Each situation is evaluated separately to deter-mine the probability that pending proceedings will be successful or toqualify the possible amount of the payment obligations. In each case,the most probable settlement amount has been taken into account.Noncurrent provisions have been measured at their discounted settle-ment amount as of the balance sheet date.
Due to the uncertainty associated with these evaluations, the actualsettlement obligation or the actual outflow of resources may deviatefrom the original estimates and, accordingly, from the amounts of theprovisions made. In addition, estimates may change based on subse-quent new information, which may have a substantial impact on thefuture earnings position.
Government Grants
Government grants are recognized in accordance with IAS 20“Accounting for Government Grants and Disclosure of GovernmentAssistance“ and shown in the balance sheet under noncurrent liabili-ties. In accordance with IAS 20, government grants are recognizedonly if there is reasonable assurance that the conditions attached tothem will be complied with and that the grants will be received. Gov-ernment grants are accounted for as a deferred liability and releasedto income over the average useful life of the assets subsidized. Thegrants are released to income over the expected assumed useful life ofthe assets subsidized and credited to other operating income.
N O T E S T O T H E C O N S O L I D A T E D F I N A N C I A L S T A T E M E N T S 2 0 1 7 7 5

Financial Liabilities and Equity Instruments
Financial liabilities and equity instruments are classified in accordancewith the economic substance of the underlying agreements. Equityinstruments are recognized at the value of the funds or other assetsreceived less directly attributable external transaction costs.
Trade Payables and Other Current Liabilities
Trade payables and other current liabilities do not bear interest andare recognized at their nominal amounts.
Recognition of Income and Expenses
Income is recognized when it is probable that economic benefits willflow to paragon and the amount of the income can be measured reli-ably. Income is measured at the fair value of the considerationreceived. Sales tax and other levies are not included. If transactionsprovide for a declaration of acceptance on the part of the purchaser,the related revenue is only recognized once such a declaration hasbeen issued. If the sale of products and services includes multipledelivery and service components (multiple element arrangements),such as varying remuneration agreements in the form of prepayments,milestone payments and similar payments, a review takes place toascertain whether revenue should be recognized separately for partialsales at different points in time. Contractually agreed prepaymentsand other nonrecurring payments are deferred reported in profit orloss over the period during which the contractually agreed service isperformed.
Income from the sale of products is recognized once the significantrisks and rewards associated with ownership of the products soldhave been transferred to the purchaser. This normally occurs uponshipment of the products, consistent with the agreements enteredinto with customers. Revenue is shown after the deduction of dis-counts, rebates and returns.
Interest expenses from the issue of bonds are recognized according tothe effective interest method. Operating expenses are recorded inprofit and loss when the relevant services are rendered or when theexpenses are incurred.
Borrowing Costs
Borrowing costs are recognized as an expense in the period in whichthey are incurred. They are capitalized if they fulfill the requirementsof a qualifying asset in accordance with IAS 23 Borrowing Costs. Noborrowing costs were capitalized in the financial year.
(9) Use of Estimates and Assumptions
The preparation of the consolidated financial statements in accor-dance with IFRS requires assumptions and estimates to be made thatimpact the assets and liabilities recorded, the disclosure of contin-gent liabilities as of the balance sheet date and the presentation ofincome and expenses during the period under review. If actualevents deviate from these estimates, this could have a positive ornegative impact on the assets, financial position and earnings.
When applying the accounting policies, the following estimates andassumptions were made that significantly influenced the amountscontained in the financial statements:
Measurement of the Fair Values of the Assets Acquired and Liabili-ties Assumed in Business Combinations
The fair values as well as the allocation of acquisition costs to theassets acquired and liabilities assumed were determined on thebasis of experience and estimates regarding future cash inflows.The actual cash inflows may differ from the estimated amounts.Please refer to the explanations in note 6 for the valuation ofacquired intangible assets from the acquisition of paragonmovasys GmbH (technology, customer list, development work).
Goodwill
As described in the accounting principles, the Group tests goodwillfor impairment once a year and when there are any indications thatthe value of goodwill may be impaired. This involves estimating therecoverable amount of the cash generating unit. This corresponds tothe higher of fair value less costs of disposal and value in use. Whendetermining the value in use, adjustments and estimates have to be
7 6 | P A R A G O N A G A N N U A L R E P O R T 2 0 1 7

made concerning the forecast and discounting of future cash flows.Although the Management Board believes that the assumptionsused to determine the recoverable amount are appropriate, unfore-seeable changes in these assumptions could lead to an impairmentloss that could have an adverse negative influence on the assets,financial position and earnings.
Capitalized Development Costs
In order to measure capitalized development costs, assumptionshave been made about the amount of anticipated future cash flowsfrom assets, about the discount rates to be used and about theperiod of time during which these assets will generate anticipatedfuture cash flows. The assumptions made regarding the timing andamount of future cash flows are based on expectations of the futuredevelopment of the order backlog from those customers with whomdevelopment projects are being conducted.
Inventories
In specific cases, inventories are measured based on anticipated rev-enue less the estimated costs to completion and the estimated sell-ing costs required. Actual revenue and the actual costs to completionmay deviate from anticipated amounts.
Information about the measurement discounts can be found in thecomments on inventories in the previous section 8.
Estimates are required for the recognition of income from the provi-sion of services on the basis of the percentage of completion as ofthe balance sheet date. The main measurement parameter is the per-centage of completion which is determined on the basis of a carefulestimate of the total contract costs, the costs to be incurred up tothe time of completion, the total contract revenue, the contract risks,and other assumptions.
Other Assets and Liabilities
Assumptions and estimates are also necessarily made when calculat-ing allowances for doubtful receivables, when estimating contingentliabilities and other provisions, and when determining the fair valueof long-lived assets included in property, plant and equipment andintangible assets.
In individual cases, actual values may deviate from the assumptionsand estimates made, requiring an adjustment of the carryingamounts of the assets or liabilities concerned.
Deferred Tax Assets
Deferred tax assets are only recorded if a positive tax result isexpected in future periods and as a result their realization appearssufficiently assured. The actual taxable income situation in futureperiods may deviate from the estimate made at the time the deferredtax assets were recognized.
Domestic deferred taxes were calculated as of December 31, 2017,at a combined income tax rate of 30.0% (prior year: 30.0%). Thisincludes a corporate tax rate of 15% and a solidarity surcharge of5.5%. The income tax rate also reflects trade taxes, taking intoaccount the breakdown of the trade tax assessment rates among themunicipalities in which the company’s branches are located. Thedeferred taxes for Voltabox Inc. were calculated as of December 31,2017, at a combined income tax rate of 27.6% (prior year: 34.6%). InChina, a combined income tax rate of 34.6% (prior year: 34.6%) wasapplied.
In the purchase price allocation of paragon movasys GmbH, anincome tax rate of 27.73% was expected.
Provisions for Pensions
Expenses arising from defined benefit plans are calculated usingactuarial valuation reports. The actuarial valuation reports are basedon assumptions concerning discount rates, expected revenue fromplan assets, future wage and salary increases, mortality rates andfuture pension increases. These estimates are subject to significantuncertainty due to the long-term nature of these plans.
The valuation as of December 31, 2017, was discounted using theexpected long-term market rate of interest of 1.50% (prior year:1.50%). The valuation of provisions for pensions is based on theactuarial guideline tables “2005 G” by Prof. Dr. Klaus Heubeck.
The remaining assumptions used in the actuarial valuation were asalary growth rate of 0% from 2009 onwards and pension growth of2.00%, as in the prior year.
N O T E S T O T H E C O N S O L I D A T E D F I N A N C I A L S T A T E M E N T S 2 0 1 7 7 7

Other Provisions
The recognition and measurement of other provisions was based onthe estimated probability of the future outflow of benefits and onexperience values, and on the facts and circumstances known as ofthe balance sheet date. The subsequent actual outflow of benefitsmay therefore differ from the amount recorded within other provi-sions as of the balance sheet date.
Legal Risks
From time to time, paragon Group companies may become parties tolegal disputes. Management regularly analyzes the latest informationavailable for these cases and, where necessary, recognizes provisionsto cover probable obligations, including the estimated amount ofassociated legal costs. External attorneys are consulted in theprocess of making these assessments. In determining the need forprovisions, the Management Board accounts for the probability of anunfavorable outcome and whether the obligation can be measuredwith sufficient reliability. The filing of a lawsuit, the formal assertionof a claim or the presence of a disclosure for legal dispute in thenotes does not automatically mean that a provision for the respec-tive risk is appropriate.
(10) Revenue
Revenue consists of the proceeds from sales of products and serv-ices less any sales reductions. The total revenue for the period underreview amounted to € 124,823 thousand (prior year: € 102,790thousand). Of this, € 90,189 thousand (prior year: € 70,251 thou-sand) were generated domestically, € 34,634 thousand (prior year: €32,539 thousand) abroad.
Other revenue of € 8,768 thousand (prior year: € 7,815 thousand)was generated from development services and € 2,000 thousand(prior year: € 0 thousand) from the sale of sales rights in the report-ing period.
The breakdown and classification of revenue by strategic businessactivities and regions are shown in the “Segment Report.”
(11) Other Operating Income
year: € 88 thousand).
(12) Other OwnWork Capitalized
For development projects that meet the requirements of IAS 38.21and IAS 38.57 in the reporting period and for which project-relateddevelopment costs have been capitalized, the capitalized develop-ment costs have been recognized in other own work capitalized. Theamounts capitalized are recognized under intangible assets. Otherown work capitalized also includes costs incurred in manufacturingtest equipment.
(13) Cost of Materials
In € thousands Jan. 1, toDec. 31, 2017
Jan. 1, toDec. 31, 2016
Disposal of fixed assets 143 347
Income from the use of company carsby employees
388 323
Gains on foreign currencyexchange
182 88
Income from the release of deferredincome for investment grants
88 88
Reversal of provisions 45 20
Investment subsidies 0 10
Rental income 38 0
Other 495 158
Total: 1,379 1,086
In € thousands Jan. 1, toDec. 31, 2017
Jan. 1, toDec. 31, 2016
Project-related development costs 15,772 14,313
Cost of test equipment 616 1,003
Other own work capitalized 16,388 15,317
In € thousands Jan. 1, toDec. 31, 2017
Jan. 1, toDec. 31, 2016
Raw materials and supplies 69,510 55,788
Cost of purchased services 1,716 1,953
Cost of material 71,226 57,741
7 8 | P A R A G O N A G A N N U A L R E P O R T 2 0 1 7

(14) Personnel Expenses
Personnel expenses amounted to € 35,262 thousand in the reportingperiod (prior year: € 29,248 thousand) and consist of the following:
The number of employees, including temporary employees, haschanged as follows in comparison to the prior year:
(15) Other Operating Expenses
Other operating expenses primarily include costs for building rentalexpenses and premises costs (€ 1,438 thousand, prior year: € 1,299thousand), energy costs (€ 1,121 thousand, prior year: € 1,065 thou-sand), third-party development costs (€ 3,048 thousand, prior year: €3,500 thousand), freight and packaging costs (€ 704 thousand, prioryear: € 580 thousand), IT and telephone costs (€ 1,354 thousandprior year: € 1,347 thousand), vehicle costs (€ 959 thousand, prioryear: € 862 thousand), repair and maintenance costs (€ 1,013 thou-sand, prior year: € 787 thousand), legal and consulting costs (€ 959thousand, prior year: € 1,210 thousand), advertising and marketingcosts (€ 709 thousand, prior year: € 818 thousand), and costs ofplant insurance and leasing (€ 1,151 thousand, prior year: € 585thousand). Other taxes recognized under other operating expensesduring the reporting period amounted to € 54 thousand (prior year: €56 thousand).
(16) Depreciation and Amortization
A breakdown of depreciation of property, plant and equipment, andamortization of intangible assets, can be found in the consolidatedstatement of noncurrent assets.
Jan. 1, toDec. 31, 2017
Jan. 1, toDec. 31, 2016
Salaried employees 451 333
Wage-earning employees 357 293
Total number of employees 808 626
In € thousands Jan. 1, toDec. 31, 2017
Jan. 1, toDec. 31, 2016
Wages and salaries 25,241 21,186
Social security contributions /pension expenses
4,323 3,689
Expenses for temporary emloyees 5,698 4,373
Personnel expenses 35,262 29,248
(17) Financial Result
Other financial and interest expenses include interest expenses tobanks of € 3,457 thousand (prior year: € 2,422 thousand).
(18) Income taxes
Current taxes include corporate income tax and trade tax refunds forprior years in the current financial year.
Deferred tax assets of € 7,574 thousand (prior year: € 4,523 thou-sand) at the end of the reporting period represent deferred tax bal-ances in Germany of € 4,262 thousand (prior year: € 2,293 thousand)and foreign deferred taxes of € 3,312 thousand (prior year: € 2,230thousand). Deferred tax liabilities of € 17,054 thousand (prior year:€ 9,998 thousand) at the end of the reporting period representdeferred tax balances in Germany of € 16,847 thousand (prior year:€ 9,849 thousand) and foreign deferred taxes of € 207 thousand(prior year: € 149 thousand).
In € thousands Jan. 1, toDec. 31, 2017
Jan. 1, toDec. 31, 2016
Financial income 13 2
Interest income 13 2
Financial expenses - 4,396 - 3,169
Other financial andinterest expenses
- 4,396 - 3,169
Financial result - 4,383 - 3,167
In € thousands Jan. 1, toDec. 31, 2017
Jan. 1, toDec. 31, 2016
Current taxes - 107 253
Current domestic taxes - 107 253
Current foreign taxes 0 0
Deferred taxes 4,014 1,948
Deferred domestic taxes 5,413 3,442
Deferred foreign taxes - 1,399 - 1,494
Income taxes 3,907 2,201
N O T E S T O T H E C O N S O L I D A T E D F I N A N C I A L S T A T E M E N T S 2 0 1 7 7 9

Deferred tax assets and liabilities were recognized for the followingitems:
In contrast to the prior year, netting of deferred tax assets and liabil-ities is waived. The reason for this change in approach is a moretransparent presentation of the financial position. In the previousyear, prior to netting, deferred tax assets would have amounted to €4,522 thousand and deferred tax liabilities to € 9,997 thousand.
The increase in deferred tax liabilities of € 7,057 thousand primarilyresults from the capitalization of development costs in the reportingperiod reported within intangible assets (€ 6,793 thousand).
The increase in deferred tax assets of € 3,052 thousand primarilyrelates to deferred tax assets on tax losses carried forward of €3,274 thousand. Tax losses in Germany can be carried forward andused for an indefinite period of time, subject to minimum taxationrules. Foreign tax losses carried forward relate to Voltabox of Texas,Inc., and their use is limited to a period of 20 years.
An amount of deferred taxes of € 3 thousand (prior year: € 61 thou-sand) arising on pension provisions was recorded directly in equitywithin the revaluation reserve. This also corresponds to the amountof deferred tax assets in other comprehensive income.
Due to the tax reform in the US in 2017, the tax rate changed from34.6% to 27.6%. The reduction in deferred tax assets led to anincrease in deferred tax expenses of € 815 thousand.
Voltabox AG has corporate income tax and trade tax loss carried for-ward amounting to € 1,189 thousand from the period prior to thatcompany being included in the Group’s tax pooling arrangements.
In € thousands Dec. 31, 2017 Dec. 31, 2016
Deferredtax
assets
Deferredtax
liabilities
Deferredtax
assets
Deferredtax
liabilities
Intangible assets 0 16,362 0 9,576
Property, plant and equipment 267 0 281 0
Receivables andother assets
0 87 192 196
Pension provisions 680 0 697 0
Bonds 0 500 0 86
Liabilities 0 105 0 148
Loss carried forward 6,627 0 3,352 0
Deferred tax assets andliabilities prior to netting
7,574 17,054 4,522 9,997
Netting 0 0 - 4,522 - 4,522
Deferred tax assets andliabilities after netting
7,574 17,054 0 5,475
No deferred taxes have been recognized for these tax losses carriedforward.
Dividends to be paid by paragon AG in Germany in the future haveno impact on the company’s tax burden.
The following table shows a reconciliation between the actual taxexpense and the expected tax expense, calculated as the product ofaccounting profit multiplied by the applicable tax rates in accordancewith IAS 12.81 (c).
sächlichen Steueraufwand.
The arithmetical tax expense is calculated by multiplying the tax rateby the taxable profit.
(19) Earnings per share
Basic earnings per share are calculated by dividing the result for thereporting period by the weighted average number of shares issued.The weighted average number of shares issued in the reportingperiod was 4,526,266 (prior year: 4,217,658).
Based on the result for the period of € -657 thousand (prior year: €3,561 thousand), the basic earnings per share amount to € -0.15 pershare (prior year: € 0.84).
The diluted earnings per share are calculated by adjusting theweighted average number of shares issued by the number of poten-tially dilutive shares.
Stock option plans generally result in a potential dilution of earningsper share. There were no share option rights to acquire paragon AGshares outstanding during the fiscal year from January 1 to Decem-ber 31, 2017.
In € thousands Jan. 1, toDec. 31, 2017
Jan. 1, toDec. 31, 2016
Earnings before taxes 3,250 5,762
Calculatory tax expense at a tax rateof 30.0% (prior year: 30.0%)
0 1,729
tax income relating to other accountingperiods (prior year: tax expense)
- 105 224
Income from capitalization of deferredtax assets
- 3,242 0
Expense from passivation of deferredtax liabilities
7,254 0
Other 0 248
Current tax expenses 3,907 2,201
8 0 | P A R A G O N A G A N N U A L R E P O R T 2 0 1 7

(20) Intangible Assets
Capitalized Development Costs
The development and breakdown of intangible assets, property, plantand equipment is shown in the consolidated statement of movements innoncurrent assets. Explanations of the investments can be found in thecombined management report.
Intangible assets include capitalized development costs of € 44,037thousand (prior year: € 30,950 thousand). Total development costs inthe period amounted to € 16,825 thousand (prior year: € 15,193 thou-sand). This includes internal development costs of € 15,772 thousand(prior year: € 14,313 thousand) capitalized as intangible assets in thereporting period.
Depreciation in the reporting period amounted to € 2,680 thousand(prior year: € 1,145 thousand). The depreciation period for developmentprojects is a standard four-year period from the start of series produc-tion.
The capitalized development costs were subject to an impairment test inaccordance with IAS 36. The recoverable amount of a specific projectrepresents the fair value of the project determined on the basis of recentinformation on the marketability of the project. The impairment loss inaccordance with IAS 36 totaled € 5 thousand in the reporting period(prior year: € 37 thousand).
The recoverable amount of internally generated intangible assets isdetermined based on the calculation of the value-in-use using estimatedcash flows, which are in turn derived from sales forecasts adopted by theManagement Board. The sales forecasts cover a period of five years. Agrowth rate is determined for each product based on market analyses. Arisk-adjusted discount factor of 4% is applied to the estimated cashflows.
Customer List SphereDesign GmbH
In the course of the business combination with SphereDesign GmbH,completed with effect from January 1, 2015, the company identifieda customer base as an intangible asset. This represents contractuallyagreed customer relationships that meet the criteria for recognitionpursuant to IAS 38.8 et seq. The acquisition costs for the customerbase of SphereDesign GmbH amounted to € 2,565 thousand. Thisitem is recognized under “Licenses, patents, software/customer lists.”In accordance with IAS 38, the customer list was classified as anintangible asset without a finite useful life of seven years. In the yearunder review, an adjustment of the purchase price of SphereDesignGmbH was agreed with the sellers.
The movement on the customer list was as follows:
Customer List / Technology paragon movasys GmbH
As part of the purchase price allocation of paragon movasys GmbH,the Group has identified a customer list and technology as an intangi-ble asset. The customer list will be amortized on a straight-line basisover 12 years starting on 1 December 2017. The technology will beamortized on a straight-line basis over 10 years from 1 December2017 onwards.
The movement on the customer list was as follows:
The movement of the technology was as follows:
In € thousands
Technology Dec. 1, 2017 3,288
Amortization in fiscal year - 27
Carrying amount as of Dec. 31, 2017 3,261
In € thousands
Customer list Jan. 1, 2017 2,052
Amortization in fiscal year - 411
Carrying amount as of Dec. 31, 2017 1,641
In € thousands
Customer list Dec. 1, 2017 4,209
Amortization in fiscal year - 29
Carrying amount as of Dec. 31, 2017 4,180
N O T E S T O T H E C O N S O L I D A T E D F I N A N C I A L S T A T E M E N T S 2 0 1 7 8 1

(21) Goodwill
In accordance with IFRS 3 (Business Combinations) and the two stan-dards revised in this respect, namely IAS 36 (Impairment of Assets)and IAS 38 (Intangible Assets), goodwill and internally generatedintangible assets whose production is not yet complete are subject toregular impairment tests.
This involves goodwill and internally generated intangible assetswhose production is not yet complete being tested for potentialimpairment once a year. In addition, the impairment test is also to beperformed more frequently should any events or changes in circum-stances indicate that a potential impairment has occurred.
The impairment tests performed at the paragon Group involve com-paring the residual carrying amounts of individual cash-generatingunits (CGUs) with their respective recoverable amounts, i.e., thehigher of their fair value less costs to sell and their value in use. Wherethe carrying amount of the cash-generating unit is higher than itsrecoverable amount, an impairment loss is recognized in the amountof the respective difference. The recoverable amount is determinedby calculating the value in use by means of the discounted cash flowmethod. The cash flows used to calculate the value in use are deter-mined on the basis of management’s medium-term planning. Thesebudgets are based on past experience and on expectations as tofuture market developments, taking account of strategic and opera-tive measures already initiated to manage the respective businessfield. The detailed planning period is usually a period of five years.
The cost of capital is calculated as the weighted average of equity anddebt capital costs (weighted average cost of capital – WACC). Equitycosts are derived from a peer group analysis of the relevant marketsector, i.e., information that can be obtained from capital markets. Toaccount for the different return and risk profiles of our different fieldsof activity, we calculate individual cost of capital rates for our compa-nies (CGUs). The weighted average cost of capital, i.e., WACC beforetaxes used to discount cash flows, amounted to 4.0% (prior year:4.0%).
Goodwill for SphereDesign GmbH amounted to € 843 thousand as ofthe reporting date (prior year: € 843 thousand).
Goodwill in the course of the paragon movasys GmbH transactionamounted to € 6,567 thousand as of the balance sheet date.
(22) Property, Plant and Equipment
Depreciation in the reporting period amounted to € 4,999 thousand(prior year: € 4,532 thousand). Land and buildings are subject toproperty charges as collateral for long-term bank loans.
Certain items of movable noncurrent assets are financed by financeleases. Generally, these leases have terms of four to five years. Thecorresponding payment obligations for future lease installments arerecognized as liabilities. The net carrying amount of assets capital-ized under financial leases amounted to € 2,077 thousand as ofDecember 31, 2017 (prior year: € 2,849 thousand). The correspon-ding payment obligations for future lease installments amounted to €2,469 thousand (prior year: € 3,213 thousand) and are recognized asliabilities at their present value. The capitalized assets under financeleases wholly relate to technical plants and machinery. The majorityof these lease arrangements provide for the transfer of ownershipwithout further payments after full settlement of all obligations dur-ing the basic lease period (full amortization). No firm agreementshave been entered into concerning the further use of the leasedassets following expiry of the basic lease period. Nevertheless,paragon assumes that the leased assets can be acquired at a favor-able price after the basic lease period has expired or may continue tobe used at a favorable lease rate.
Advance payments for machinery and equipment amounting to €553 thousand were made in the reporting year (prior year: € 3,913thousand).
The loss on disposal of property, plant and equipment amounted to €432 thousand (prior year: € 307 thousand).
(23) Financial Assets
Under a purchase and assignment agreement dated February 18,2015, paragon AG acquired the entire share capital of SphereDesignGmbH, Bexbach, for an acquisition price of € 3,015 thousand. Theacquisition was effective from January 1, 2015. This company is anestablished development service provider and system supplier to theautomotive industry in the control and display element sector. A por-tion of the total purchase price amounting to € 1,796 thousand ispayable in installments in the following two years and has thereforebeen recognized within other liabilities. paragon AG and SphereDesign GmbH entered into a profit and loss transfer agreement onMarch 20, 2015, taking effect as of January 1, 2016. In the annualfinancial statements as of December 31, 2017, the company reportedequity of € 274 thousand (prior year: € 274 thousand) and net incomebefore profit and loss transfer of € 42 thousand (prior year: net lossbefore profit and loss transfer of € 46 thousand).
8 2 | P A R A G O N A G A N N U A L R E P O R T 2 0 1 7

Revenue of € 4,203 thousand generated by SphereDesign GmbH isincluded in the paragon Group’s consolidated financial statements forthe reporting year. Since the date of initial consolidation (January 1,2015), the acquired company has contributed a net loss of € -778thousand to the paragon Group. This includes the impact on earningsof the amortization of intangible assets acquired as part of the busi-ness combination (€ -1,170 thousand) and associated deferred taxes(€ 392 thousand).
productronic GmbH, Delbrück, was formed on November 25, 2015.The object of the company is to manufacture electronic and mechan-ical components, particularly for use in automobile production.paragon AG holds 100% of the shares in productronic GmbH. In theannual financial statements as of December 31, 2017, the companyreported equity of € 7,819 thousand (prior year: € 7,819 thousand)and net income before transfer of profit of € 314 thousand (prioryear: net loss of € 1,693 thousand).
paragon Automotive (KunShan) Co., Ltd. was formed on September15, 2015. The object of the company is to manufacture and marketparagon products for the Chinese market. Production activities at thenew plant in the “German Industrial Park” were launched on Novem-ber 4, 2015. paragon AG holds 100% of the shares in paragon Auto-motive (KunShan) Co., Ltd. In the annual financial statements as ofDecember 31, 2017, the company reported equity of € 1,324 thou-sand (prior year: € 723 thousand) and a net loss of € -896 thousand(prior year: € -1,181 thousand).
On July 29, 2013, the share capital of KarTec GmbH, Forchheim, wasacquired for an acquisition price of € 1,036 thousand following theexercise of a put option subject to conditions precedent set out in thepurchase agreement. The parties agreed that the purchase pricewould be offset against a receivable of paragon AG in connectionwith a loan granted. In the annual financial statements as of Decem-ber 31, 2017, the company reported equity of € 27 thousand (prioryear: € 221 thousand) and net loss of € -9 thousand (prior year netincome: € 194 thousand).
paragon Automotive Technology Co. Ltd., Shanghai commencedoperations in 2013. The full license applied for under Chinese lawwas granted on January 3, 2014. In the annual financial statements asof December 31, 2017, the company reported equity of € 35 thou-sand (prior year: € 44 thousand) and net loss of € -7 thousand (prioryear net income: € 14 thousand).
With a shareholders' resolution of December 19, 2017 and entry inthe commercial register on 18 May 2017, Voltabox DeutschlandGmbH was renamed Voltabox AG.
By resolution of the Annual General Meeting on September 6, 2017,the shareholders of the company decided to increase the share capi-tal against contribution in kind by € 9,900,000.00 to € 10,000,000.00.The contribution in kind was made in the form of an assignment of aclaim from paragon AG to Voltabox AG.
The Annual General Meeting of Voltabox AG on September 22, 2017resolved to increase the share capital by up to € 5,000,000,000 byissuing up to 5,000,000 no-par-value bearer shares with a pro rataamount of the share capital of € 1.00 each.
Due to the authorization granted by resolution of the Annual GeneralMeeting on September 22, 2017 - Authorized Capital 2017 - the cap-ital stock of Voltabox AG was increased by € 825,000.00 through theissue of 825,000 no-par-value bearer shares.
As part of the IPO of Voltabox AG, paragon AG sold 39.97% of theshares in this company on the capital market. The initial listing of theshare took place on October 13, 2017 and the shares are listed underthe code number A2E4LE. The sale took place in three tranches andincludes the 5,000,000 and 825,000 new no-par-value bearer sharesfrom the two capital increases in 2017. paragon AG has sold a further500,000 shares on the capital market from its stock of shares. Thetransaction costs amounted to € 8,835 thousand and were offsetagainst the profit carried forward without effect on income.
paragon AG holds 60.03% of the shares of Voltabox AG. EffectiveJanuary 1, 2015, a profit and loss transfer agreement was concludedon April 23, 2014 between paragon AG and Voltabox AG. Followingthe conversion of Voltabox Deutschland GmbH into Voltabox AG andthe inclusion of minority shareholders in the IPO on October 13,2017, the contract expires on December 31, 2017 in accordance withSection 307 AktG. In the annual financial statements as of December31, 2017, paragon AG made the net loss in the amount of € -9,930thousand (prior year: € 4,449 thousand). As at December 31, 2017,the company's equity amounted to € 149,905 thousand (previousyear: € 205 thousand).
paragon AG has assumed joint and several guarantees with respect toVoltabox Deutschland GmbH in the amount of EUR 5,503 thousand.
Voltabox of Texas, Inc., Austin, was formed on December 18, 2013.Since 2014, the company has been responsible for manufacturing andmarketing activities for the Electromobility segment in the U.S. mar-ket. Voltabox AG holds 100 % of the shares in Voltabox of Texas, Inc.,which is in turn a subsidiary of paragon AG. In the annual financialstatements as of December 31, 2017, the company reported equityof € -10,553 thousand (prior year: € -6,378 thousand) and a net lossof € -5,195 thousand (prior year: € -2,526 thousand).
N O T E S T O T H E C O N S O L I D A T E D F I N A N C I A L S T A T E M E N T S 2 0 1 7 8 3

With a notarized agreement dated November 24, 2017, paragon AGwith economic effect (profit-sharing rights) as of January 1, 2017acquired all shares in paragon movasys GmbH, Landsberg am Lech,for a price of € 15,158 thousand. The company is an establisheddevelopment service provider and system supplier for the automotiveindustry in the field of kinematics. The purchase price was paid in fullon November 24, 2017.
In the reporting year, paragon movasys GmbH reported revenues of€ 1,723 thousand in the paragon Group. In the annual financial state-ments as of December 31, 2017, the company reported equity of€ 1,978 thousand and a net income of € 743 thousand. The acquiredbusiness has increased since the date of first-time consolidation(December 1, 2017) in the 2017 financial year, including the effectson earnings from the scheduled amortization of intangible assets(€ -57 thousand) acquired as part of the business combination and therelated deferred taxes (€ 15 thousand), and contributed a net profit of€ 701 thousand to the paragon Group.
In addition, paragon AG holds a limited partnership interest with acapital share of € 100 thousand in the limited partnership Bilster BergDrive Resort GmbH & Co. KG, whose registered office is in BadDriburg, Germany. This was acquired on September 19, 2013, for aprice of € 120 thousand.
(24) Inventories
Inventories consist of the following:
In € thousands Dec. 31, 2017 Dec. 31, 2016
Raw materials and supplies 9,242 5,764
Work in progress and finished goodsand services
7,870 7,060
Advance payments on inventories 232 892
Inventories 17,344 13,716
There was no extraordinary impairment on inventories in the report-ing period or in the prior year. In addition, no reversals were recog-nized in the reporting period, as in the prior year. Inventories with acarrying value of € 858 thousand were written down in the reportingperiod, primarily relating to salvage inventories and inventories ofspare parts (prior year: € 343 thousand). At the balance sheet date,inventories of € 0 thousand served as collateral for liabilities (prioryear: € 0 thousand).
(25) Trade Receivables
The carrying value of trade receivables is derived as follows:
The maturity structure of trade receivables for which no impairmentallowances have been recorded as of the balance sheet date is as fol-lows:
In € thousands Dec. 31, 2017 Dec. 31, 2016
Trade receivables,gross
32,933 8,492
Less impairment losses - 271 - 115
Tradereceivables
32,662 8,377
8 4 | P A R A G O N A G A N N U A L R E P O R T 2 0 1 7
In € thousands Carryingamount
thereof neitherimpaired norpast due
thereof past due but not impaired, as follows
Dec. 31, 2017 0 - 30 days 30 - 60 days 60 - 90 days > 90 days
Trade receivables 32,631 23,440 6,958 563 483 1,178
Dec. 31, 2016 0 - 30 days 30 - 60 days 60 - 90 days > 90 days
Trade receivables 8,343 6,114 480 320 51 1,378

There were no indications as of the balance sheet date that debtorswith receivables that are neither impaired nor overdue will fail tomeet their payment obligations.
Based on this information, the movement on allowances againstreceivables was as follows:
The expense arising on recording impairment losses and on derecog-nition of trade receivables is reported within other operatingexpenses. Income from receipts for derecognized receivables isreported under other operating income. There were no write-downsor derecognition of other financial assets in the reporting period or inthe prior year.
(26) Other Current Assets
Other current assets were as follows:
The overdue amounts included in other current assets as of the bal-ance sheet date were as follows:
In € thousands Dec. 31, 2017 Dec. 31, 2016
Other current assets
Purchase price retention relatedto factoring arrangements
1,280 1,110
Deferred income 284 189
Creditors with debit balances 765 267
Other assets 1,878 583
Other current assets 4,206 2,149
In € thousands Dec. 31, 2017 Dec. 31, 2016
Impaired receivables before allowancesfor losses
302 149
Allowances for losses - 271 - 115
Impaired receivables before allowancesfor losses
31 34
As of December 31, 2017, there were no indications that significantamounts included in other current assets would not be collectible.
N O T E S T O T H E C O N S O L I D A T E D F I N A N C I A L S T A T E M E N T S 2 0 1 7 8 5
In € thousands Carryingamount
thereof neitherimpaired norpast due
thereof past due but not impaired, as follows
Dec. 31, 2017 0 - 30 days 30 - 60 days 60 - 90 days > 90 days
Other current assets 4,206 4,206 0 0 0 0
Dec. 31, 2016 0 - 30 days 30 - 60 days 60 - 90 days > 90 days
Other current assets 2,149 2,149 0 0 0 0

(27) Cash and Cash Equivalents
Cash on hand and bank deposits are recognized at their nominalamounts. Cash and cash equivalents include € 35 thousand (prioryear: € 14 thousand) in cash on hand and € 145,791 thousand (prioryear: € 14,264 thousand) in bank deposits. Cash and cash equiva-lents include, among other items, an amount of € 0 thousand held onthe insolvency escrow account (prior year: € 626 thousand) and anamount of € 37 thousand on the insolvency dividend payout account(prior year: € 1,454 thousand). Both accounts are under the solepower of disposal of the former insolvency administrator. Changes incash and cash equivalents are presented in the consolidated cashflow statement.
(28) Equity
The changes in the individual components of equity for the fiscalyear from January 1 to December 31, 2016, and for the reportingperiod from January 1 to December 31, 2017, are presented in theconsolidated statement of changes in equity.
Subscribed Capital
paragon AG’s subscribed capital as of December 31, 2017, amounted to€ 4,526 thousand (prior year: € 4,526 thousand) and is divided into4,526,266 no-par-value shares with a notional share in the share capitalof € 1.00 each. By resolution of the Annual General Meeting on May 9,2012, and pursuant to Section 207 et seq. of the German Stock Corpo-ration Act (AktG) governing capital increases from capital funds, thecompany’s subscribed capital was increased to € 5,143,485 by transfer-ring an amount of € 1,028,697 from the capital reserve, as reported inthe balance sheet as of December 31, 2011, to subscribed capital. Theincrease in the subscribed capital was made without new shares beingissued, but instead by increasing the notional share in the company’ssubscribed capital attributable to each share. Subsequently, in order toeffect a repayment of a portion of the subscribed capital to the com-pany’s shareholders by means of a cash distribution of € 0.25 per sharecurrently in issue, and pursuant to Section 222 et seq. of the GermanStock Corporation Act (AktG) concerning ordinary capital reductions,the subscribed capital was reduced by € 1,028,697 from € 5,143,485 to€ 4,114,788, divided into 4,114,788 no-par-value shares with a notionalshare in capital of € 1.25 each. The capital reduction was effected byreducing the notional share in the company’s subscribed capital attrib-utable to each share. The payment of the capital reduction amounttotaling € 1,028,697 was made following registration of the capitalreduction, which was completed on January 3, 2013. Under partial uti-lization of the authorized capital resolved by the Annual General Meet-ing on April 27, 2016, and with the consent of the Supervisory Board,the Management Board increased the company’ share capital by €411,478.00 to a total value of € 4,526,266.00 on October 5, 2016, via
the issue of 411,478 new no-par-value shares with a notional share incapital of € 1.00 each and full entitlement to dividends from January 1,2016.
Exchange rate differences arising from the translation of financial state-ments prepared in foreign currencies and on exchange rate differencesarising during consolidation were recognized directly in equity in accor-dance with IAS 21.
Conditional Capital
Conditional Capital 2017/I according to the resolution at the AnnualGeneral Meeting from May 10, 2017
A resolution at the Annual General Meeting from May 10, 2017,approved the conditional increase in the subscribed capital of upto € 2,263,133.00 by issuing 2,263,133 new no-par-value shares(Conditional Capital 2017/I).
The conditional capital was created exclusively to grant shares toholders or creditors of convertible bonds and/or bonds withoptions that are issued by the company (or by a Group companyas defined in Section 18 of the German Stock Corporation Act(AktG), in which the company has a shareholding of at least 90%)pursuant to the authorization by the Annual General Meeting onMay 10, 2017, against contributions in cash or in kind until May 9,2022. In accordance with the respective terms and conditions forconvertible bonds and bonds with options, the conditional capitalincrease also serves to issue shares to holders of convertiblebonds and/or bonds with options subject to conversion or optionobligations.
The conditional capital increase shall only be implemented to theextent that the holders of warrants from options or creditors ofconvertible bonds exercise their conversion or option rights, orthe holders or creditors of convertible or warrant-linked bondswho are obligated to exercise or convert the option or warrant-linked bonds fulfill their obligation to exercise or convert theoption or warrant-linked bonds, provided that the conversion oroption rights are not serviced by granting treasury stock or otherforms of settlement. These rights must have been issued by thecompany (or by a Group company as defined in Section 18 of theGerman Stock Corporation Act (AktG), in which the company hasa direct or indirect shareholding of at least 90%) based on theauthorization granted by the Annual General Meeting, which lastsfrom May 10, 2017, through May 9, 2022. The new shares shallbe issued at the conversion/option prices in the bond or optionconditions to be determined in accordance with the aforemen-tioned authorizing resolution. The new shares may be granted adividend entitlement starting in the fiscal years for which theAnnual General Meeting has not yet passed a resolution on the
8 6 | P A R A G O N A G A N N U A L R E P O R T 2 0 1 7

appropriation of profits. The Management Board is authorized todetermine the further details regarding the implementation of theconditional capital increase.
Authorized Capital 2017/I according to the resolution at the AnnualGeneral Meeting from May 10, 2017
With the resolution of the Annual General Meeting on May 10,2017, the Management Board is authorized, with the consent ofthe Supervisory Board, to increase the company’s share capitalonce or several times by up to € 2,263,133.00 until May 9, 2022,inclusive, via the issue of up to 2,263,133 new no-par-valueshares against contribution in cash and/or in kind (AuthorizedCapital 2017/I).
Shareholders are to be granted a subscription right. The statutorysubscription right may also be granted by having the new sharestaken over by a banking consortium with the obligation to offerthe shares indirectly to shareholders for subscription pursuant toSection 186 (5) of the German Stock Corporation Act (AktG). TheManagement Board is, however, authorized (with the consent ofthe Supervisory Board) to exclude the statutory subscriptionrights of shareholders in the cases specified in Section 5 (6) of theArticles of Association as updated in May 2017.
Capital Reserve
The capital reserve amounted to € 15,165 thousand as of December31, 2017 (prior year: € 15,165 thousand). Pursuant to Sections 207et seq. of the German Stock Corporation Act (AktG) concerning cap-ital increases from capital reserve and based on a resolution adoptedby the Annual General Meeting on May 9, 2012, the company’sshare capital was increased by transferring an amount of € 1,029thousand from the capital reserve as reported in the balance sheet asof December 31, 2011.
The capital reserve increased in the fiscal year 2016 by € 12,715thousand to € 15,165 thousand as a result of the successful place-ment of 411,478 new no-par-value shares under partial utilization ofthe authorized capital approved by the Annual General Meeting onApril 27, 2016.
Reavulation Reserve
In order to comply with the requirement to recognize actuarial gainsand losses from provisions for pensions directly in equity in accor-dance with the revised IAS 19 Employee Benefits, amounts of € 915thousand are reclassified to the revaluation reserve. In the reportingperiod, an amount of € 7 thousand net of deferred taxes (prior year:€ 142 thousand) was recognized in the revaluation reserve.
Dividends
A proposal will be submitted to the Annual General Meeting that adividend of € 0.25 per share shall be paid for the period ending onDecember 31, 2017. The distribution volume will amount to €1,132 thousand.
Minority Interests
Due to the initial public offering of Voltabox AG on October 13,2017, minority interests are reported in the consolidated financialstatements for the first time. The first-time valuation of minorityinterests took place on the basis of the consolidated financialstatements of Voltabox. Subsequent to the IPO, the total equity ofthe Voltabox Group amounted to € 145,072 thousand before IPOtransaction costs. The transaction costs amounted to € 8,835 thou-sand and were deducted from the equity of the Voltabox Group.Equity, which was reduced by the transaction costs, amounted to€ 136,237 thousand and was multiplied by the minority interest of39.97%. This resulted in a minority interest of € 54,452 thousand.
The profit attributable to the Voltabox Group amounted to € 9,692thousand as of the balance sheet date. The portion of net incomeattributable to minority interests amounted to € 3,873 thousand.The portion of other comprehensive income attributable to minor-ity interests amounted to € -407 thousand. The balance of netincome and other income of € 3,466 thousand was allocated tominority interests.
N O T E S T O T H E C O N S O L I D A T E D F I N A N C I A L S T A T E M E N T S 2 0 1 7 8 7

(29) Finance Lease Obligations
Liabilities under finance leasing arrangements primarily relate totechnical equipment and are recorded at their present value or amor-tized cost in accordance with IAS 17. The repayment obligationsreported here are derived as follows:
(30) Liabilities to Banks
Current and noncurrent liabilities to banks totaled € 20,938 thou-sand (prior year: € 32,782 thousand), and collateral for liabilities tobanks was provided in the amount of € 20,938 thousand (prior year:€ 32,782 thousand).
Liabilities to banks are secured by property charges for loan liabilitiesin the amount of € 16,600 thousand (prior year: € 16,818 thousand)and by charges over property, plant and equipment of € 4,202 thou-sand (prior year: € 5,127 thousand). The collateralization of rawmaterials and supplies and of work in progress and finished productsdated June 16, 2010, was ended in August 2014.
Liabilities to banks mature as follows:
There is no exposure to interest rate risk for the loans with fixedinterest rates. Loans with floating interest rates (€ 3,239 thousand)are subject to interest rate risk (see note 17 Interest Rate Risks).
8 8 | P A R A G O N A G A N N U A L R E P O R T 2 0 1 7
(31) Bonds
The company made a public bond subscription offer in 2013 in orderto promote its further internationalization and to expand its existingbusiness activities. A total volume of € 10,000 thousand was placedwith retail and institutional investors. The term bond has a maturitydate of July 2, 2018. In 2014, the company placed a further trancheof € 3,000 thousand of the corporate bond previously issued in
In € thousands Remaing term< 1 year
Remaining termbetween 1 and
5 years
Remaining term> 5 years
Dec. 31, 2017 Dec. 31, 2016
Minimum lease payments 1,129 1,445 0 2,574 3,394
Future interest payments - 62 - 43 0 - 105 - 181
Liabilities from finance lease (repayment portion) 1,067 1,402 0 2,469 3,213
thereof reported under noncurrent liabilities 1,402 2,215
thereof reported under current liabilities 1,067 998
In € thousands Remaing term< 1 year
Remaining termbetween 1 and
5 years
Remaining term> 5 years
Dec. 31, 2017 Dec. 31, 2016
Liabilities to banks 4,588 13,568 2,782 20,938 32,782
thereof reported under noncurrent liabilities 16,350 20,369
thereof reported under current liabilities 4,588 12,413

2013. This tranche also has a maturity date of July 2, 2018. Thetransaction costs of € 790 thousand incurred in connection with thetwo placements are being amortized over the term of the bond usingthe effective interest method in accordance with IAS 39.47.
On June 28, 2017, the company issued a non-subordinated andunsecured bearer bond with a nominal value of € 50,000 thousand.The bond is listed and traded on the Open Market of the FrankfurtStock Exchange (WKN: A2GSB8). The term bond has a term fromJuly 05, 2017, to July 5, 2022. The transaction costs of € 1,713 thou-sand incurred in connection with the two placements are beingamortized over the term of the bond using the effective interestmethod in accordance with IAS 39.47. The carrying amount of thebond at the balance sheet date amounted to € 49,566 thousand andthe pro rata interest expense in the fiscal year 2017 amounts to€ 1,125 thousand.
(32) Provisions for Pensions
paragon recognizes a provision for a defined benefit pension plan inaccordance with the revised IAS 19 Employee Benefits. This relatesto a single contractual commitment to the payment of a fixedamount from age 65 based on an individual contract arrangement. Inaddition to this existing pension agreement, a new commitment wasmade in fiscal year 2005. This involves a single contractual commit-ment to payments from age 65, the amount of which is based onlength of employment and salary level. Provisions exist for pensioncommitments to members of the Management Board. In accordancewith a resolution approved by the Supervisory Board on August 31,2009, a portion of provisions for pensions amounting to € 794 thou-sand and the corresponding plan assets of € 1,425 thousand weretransferred to HDI Gerling Pensionsfonds in fiscal year 2010. Inaccordance with a resolution approved by the Supervisory Board onDecember 10, 2013, another partial transfer of provisions for pen-sions to Allianz Pensionsfonds AG was effected in the amount of€ 1,453 thousand during fiscal year 2013.
In June 2011, the IASB issued a revised version of IAS 19 requiringmandatory application in fiscal years beginning on or after January 1,2013. The company decided to apply the amended standard early ona voluntarily basis and to account for provisions for pensions inaccordance with the revised standard from fiscal year 2012. The keychange is the elimination of the previously permitted accountingoption to defer the recognition of actuarial gains and losses using thecorridor method, and the related introduction of the full recognitiondirectly in equity in retained earnings. The changes to the new ruleshave to be made retrospectively in accordance with IAS 8.22, withany adjustments recognized directly in equity. To comply with therequirement to recognize actuarial gains and losses directly in equity,the amounts recorded in profit or loss in earlier years were reclassi-fied from profit/loss carried forward to the revaluation reserve.
An actuarial loss of € -7 thousand was recognized in other compre-hensive income (prior year: loss of € -142 thousand).
The actuarial calculations are based on the following assumptions:
As a result of the transaction of paragon movasys GmbH as ofNovember 24, 2017, a pension obligation of € 703 thousand andplan assets of € 469 thousand were assumed. The balance sheetvalue as at the balance sheet date was € 234 thousand. For reasonsof simplification, the accounting for the effects on earnings forDecember 2017 was waived due to the first-time consolidation as ofDecember 1, 2017.
Actuarial gains or losses may arise from increases or decreases in thepresent value of the defined benefit obligations. These may bebrought about by, among other things, changes in calculation param-eters and changes in estimates of the risks related to the pensionobligations, and may impact on the level of equity. The net pensionprovisions have been calculated as follows:
Present value of the defined benefit obligation:
In € thousands Dec. 31, 2017 Dec. 31, 2016
Present value of defined benefitobligation at beginning of year
2,516 2,087
Initial consolidation of paragon movasysGmbH – in equity –
703 0
Service cost 203 185
Interest cost 38 41
Actuarial gains (-),losses (+)
10 203
Present value of defined benefitobligation as of record date
3,470 2,516
In Percent Dec. 31, 2017 Dec. 31, 2016
Discount rates 1.50 1.50
Expected return on plan assets 0.00 0.00
Salary increase (recommitment basedon individual contracts until 2009,0% thereafter)
0.00 0.00
Pension increase 2.00 2.00
Fluctuation 0.00 0.00
N O T E S T O T H E C O N S O L I D A T E D F I N A N C I A L S T A T E M E N T S 2 0 1 7 8 9

The actuarial losses incurred in fiscal year 2017 were recognizeddirectly in equity in the revaluation reserve in accordance with therevised IAS 19. Changes in demographic assumptions had no effecton the level of actuarial losses in the reporting year.
Net amount of defined benefit obligation recognized for which thereare no corresponding plan assets:
Movements on the net amount were as follows:
The following amounts have been recognized in the consolidatedstatement of comprehensive income:
The actuarial gains and losses in the reporting year and prior yearswere classified in full to other comprehensive income.
In past years the financing status, consisting of the present valueof all pension commitments and the fair value of plan assets,changed as follows:
In € thousands Dec. 31, 2017 Dec. 31, 2016
Present value of defined benefitobligation
3,470 2,516
Less fair value of plan assets 469 0
Unfunded defined benefit obligationas of record date
3,001 2,516
In € thousands Dec. 31, 2017 Dec. 31, 2016
Service cost 203 185
Interest cost 38 41
Losses from settlements 0 0
Actuarial gains (-),losses (+)
10 203
Pension expense 251 429
In € thousands Dec. 31, 2017 Dec. 31, 2016
Unfunded defined benefit obligation atbeginning of year
2,516 2,087
Pension expense 241 226
Actuarial gains (-),losses (+)
10 203
Initial consolidation of paragon movasysGmbH – in equity –
234 0
Unfunded defined benefit obligationas of record date
3,001 2,516
Disclosures on sensitivities and risks:
Salary increase sensitivities have not been disclosed as there havebeen no such salary increases since the 2010 service period. Thereare no material extraordinary or company-specific risks in connec-tion with the provisions for pensions reported.
(33) Other Liabilities
Other liabilities were as follows:
Deferrals mainly contain personnel-related obligations.
In € thousands Dec. 31, 2017 Dec. 31, 2016
Present value of defined benefitobligation
3,470 2,516
Less fair value of plan assets 469 0
Unfunded defined benefit obligationas of record date
3,001 2,516
In € thousands Dec. 31, 2017 Dec. 31, 2016
Other liabilities
Financial liabilities
Deferred income 5,221 3,272
purchase price liabilities for companyacquisition (discounted)
0 886
Old debt measured atinsolvency ratio
37 1,454
Other liabilities 780 65
Liabilities from other taxes
6,037
3,606
5,677
455
Other liabilities 9,643 6,132
In € thousands Dec. 31, 2017 Dec. 31, 2016
DBO as of Dec. 31., 2016, interest rate1.25% (prior year: interest rate 1.75%)
3,114 2,625
DBO as of Dec. 31., 2016, interest rate1.75% (prior year: interest rate 2.25%)
2,895 2,414
DBO as of Dec. 31., 2016, pension increase1.75% (prior year: pension increase 1.75%)
2,898 2,423
DBO as of Dec. 31., 2016, pension increase2.25% (prior year: pension increase 2.25%)
3,110 2,615
9 0 | P A R A G O N A G A N N U A L R E P O R T 2 0 1 7

Other liabilities mature as follows:
(34) Special Item for Investment Grants
This represents investment grants recorded as deferred income inaccordance with IAS 20. An amount of € 88 thousand (prior year: €90 thousand) was amortized in the reporting period. The Groupreceived government assistance of € 0 thousand in the reportingperiod (prior year: € 10 thousand) and disclosed a special item forinvestment grants of € 1,005 thousand (prior year: € 1,092 thousand)as a noncurrent liability in the consolidated balance sheet.
(35) Other Provisions
Other provisions are all due within one year. The movements on theprovisions were as follows:
(36) Income Tax Liabilities
This item relates exclusively to liabilities for trade tax and corporateincome tax in respect of prior reporting periods.
(37) Additional Disclosures on Financial Instruments
This section provides an overview of financial instruments in use atparagon AG. The tables below show the carrying amounts (CA) andfair values (FV) of financial assets and financial liabilities as ofDecember 31, 2017 and December 31, 2017:
N O T E S T O T H E C O N S O L I D A T E D F I N A N C I A L S T A T E M E N T S 2 0 1 7 9 1
In € thousands Remaing term< 1 year
Remaining termbetween 1 and
5 years
Remaining term> 5 years
Dec. 31, 2017 Dec. 31, 2016
Other liabilities 9,643 0 0 9,643 6,132
thereof reported under noncurrent liabilities 0 0
thereof reported under current liabilities 9,643 6,132
Dec. 31, 2017
Nominal amount Amortized cost
Cash reserve Loans and receivables
In € thousands CA FV CA FV
ASSETS
Liquid funds 145,826 145,826
Trade receivables 32,662 32,662
Other assets 4,206 4,206
Positive fair values of derivative financial instruments
Financial assets
Total assets 145,826 145,826 36,868 36,868
EQUITY AND LIABILITIES
Bonds 62,929 63,122
Liabilities to banks 20,938 22,089
Finance Lease 2,469 2,451
Trade payables 17,492 17,492
Other liabilities 9,643 9,643
Total equity and liabilities 0 0 113,471 114,797
In € Jan. 1, Acqui Utili- Re- Ad- Dec. 31,thousands 2017 sition zation versal dition 2017
Guaranteesand ex gratia 18 102 0 1 101 220paymentsOtherprovi- 18 102 0 1 101 220sions

Determining Market Values
The market value of cash and cash equivalents, current receivables,other assets, trade payables and other liabilities approximate theircarrying amounts due to their short term to maturity.
paragon measures noncurrent receivables and other assets based onspecific parameters such as interest rates and the customer’s creditstanding and risk structure. Based on these factors, paragon recog-nizes allowances for anticipated defaults on receivables.
paragon determines the fair value of liabilities under finance leases,bonds, and the fair value of liabilities to banks by discounting theanticipated future cash flows using the interest rates applicable forsimilar financial liabilities with a comparable term to maturity.
A hierarchical classification was used to measure fair value in accor-dance with IAS 39.A71 et seq. The hierarchical fair value levels andtheir application to paragon’s financial assets and liabilities are as fol-lows:
Level 1: Quoted prices for identical assets or liabilities in activemarkets
Level 2: Measurement factors other than quoted market pricesthat are directly (for instance, from prices) or indirectly (forinstance, derived from prices) observable for assets or lia-bilities
Level 3: Measurement factors for assets and liabilities not based onobservable market data
Net Gains and Losses
Realized net gains and losses from financial instruments were as fol-lows:
The net gain/loss from receivables includes changes in impairmentallowances, gains and losses from derecognition as well as paymentinflows and reversals of impairment losses on receivables previouslywritten down, which were recorded in profit or loss in the consoli-dated statement of comprehensive income.
Derivative Financial Instruments
In addition to primary financial instruments, paragon also makes useof various derivative financial instruments as needed. As part of itsrisk management process, the company primarily uses derivativefinancial instruments to limit the risks associated with interest rateand exchange rate fluctuations. Further information on risk manage-ment strategies can be found in the section entitled “Management ofRisks Associated with Financial Instruments.” The company onlyenters into derivative financial instruments with financial institutionsof the very highest credit standing.
In € thousands Dec. 31, 2017 Dec. 31, 2016
Receivables - 7 - 93
Net gains / losses - 7 - 93
9 2 | P A R A G O N A G A N N U A L R E P O R T 2 0 1 7
Dec. 31, 2016
Nominal amount Amortized cost
Cash reserve Loans and receivables
In € thousands CA FV CA FV
ASSETS
Liquid funds 14,278 14,278
Trade receivables 8,377 8,377
Other assets 2,149 2,149
Total assets 14,278 14,278 10,526 10,526
EQUITY AND LIABILITIES
Bonds 13,186 13,793
Liabilities to banks 32,782 34,447
Finance Lease 3,213 3,225
Trade payables 16,383 16,383
Other liabilities 6,132 6,132
Total equity and liabilities 0 0 71,696 73,980

Derivative Financial Instruments Used for Currency HedgingPurposes
As a result of the international nature of its activities, paragon isexposed to a number of financial risks. These include, in particular,the effects of changes in foreign exchange rates. paragon takes anintegrated approach in hedging the risks associated with fluctuatingexchange rates. Risks are centralized across the business and hedgedwhere appropriate using derivative financial instruments. If neces-sary, paragon enters into forward exchange contracts as part of thehedging process. The company had no derivative financial instru-ments for currency hedging as of December 31, 2017.
Derivative Financial Instruments Used for Interest Rate HedgingPurposes
Interest rate risk results from the sensitivity of financial liabilities tochanges in the market interest rate. paragon generally hedges theserisks with the use of interest rate derivatives. The Group uses over-the-counter interest rate swaps to hedge interest rates. The transac-tions are exclusively entered into with banks of very high credit-wor-thiness. If the trade date and settlement date do not coincide, theninitial recognition is based on the settlement date.When hedging a potential interest rate risk, the company adopts anapproach specific to the variable interest rate of the respective indi-vidual financial liabilities. Accordingly, swap contracts are tailored tothe specific amounts and maturity of the variable-rate borrowingshedged. The Group does not apply hedge accounting as defined inIAS 39.85. The company had no derivative financial instruments forinterest rate hedging as of December 31, 2017, or in the prior year.
(38) Management of Risks Associated with Financial Instruments
Market price fluctuations can involve substantial cash flow and profitrisks for paragon. Changes in exchange rates and interest rates influ-ence business operations as well as investing and financing activities.In order to optimize the Group’s financial resources, the risks associ-ated with changes in interest rates and exchange rates are analyzedon an ongoing basis and used to manage and supervise current busi-ness and financial market activities. These risks are managed withthe assistance of derivative financial instruments.
Fluctuations in currency exchange rates and interest rates can resultin significant profit and cash flow risks. Accordingly, paragon central-izes these risks as far as possible and manages them in a proactivemanner, which includes making use of derivative financial instru-
ments. The management of these risks within the overall risk man-agement system is a core responsibility of paragon AG’s Manage-ment Board.
paragon has implemented an internal sensitivity analysis systembased on a variety of risk analysis and risk management methods.The use of sensitivity analyses enables the Group to identify riskpositions within the segments. Sensitivity analyses quantify the risksthat can arise within given assumptions when certain parameters arechanged in a defined range. They include the following assumptions:
• An appreciation of the euro against all foreign currencies by 10percentage points
• A parallel shift in interest rate curves of 100 basis points (onepercentage point)
The potential effects of the sensitivity analysis are estimates and arebased on the assumption that the supposed negative marketchanges will occur. The actual effects may differ significantly if mar-ket developments deviate from assumptions made.
Foreign Currency Risks
Due to the international nature of its operations, paragon’s ongoingbusiness operations are exposed to foreign currency risk. The com-pany uses derivative financial instruments to limit these risks.Exchange rate fluctuations can lead to undesirable earnings and liq-uidity fluctuations. For paragon, the risk arises on foreign currencypositions and possible changes in the relevant exchange rates. Theuncertainty involved in future trends is referred to as exchange raterisk. paragon limits this risk by primarily settling purchases and salesof merchandise and services in the respective local currencies.
The sensitivity to potential fluctuations in foreign currency exchangerates is determined by aggregating the net currency positions of theoperating business that are not denominated in the Group’s func-tional currency. Sensitivity is calculated by simulating a 10% depreci-ation of the euro in relation to all foreign currencies. The simulatedappreciation of the euro would have resulted in a change in futurepayment inflows in the amount of € -238 thousand as of December31, 2017 (prior year: € -172 thousand). To the extent that futurepurchases are not hedged against currency exchange risks, adepreciation of the euro against other currencies would have anegative effect on the financial position and earnings as the Group’spurchases in foreign currencies exceed its foreign currency cashinflows.
N O T E S T O T H E C O N S O L I D A T E D F I N A N C I A L S T A T E M E N T S 2 0 1 7 9 3

The following table provides an overview of the net foreign currencyexchange risk by currency as of December 31, 2017:
Interest Rate Risks
Interest rate risk refers to any change in interest rates that impactsearnings or equity. Interest rate risk primarily arises in connection withfinancial liabilities.
The interest-bearing financial liabilities mainly have fixed interestrates. Accordingly, changes in the interest rate would only have aneffect if the financial instruments were recorded at fair value. As this isnot the case, the financial instruments with fixed interest rates are notsubject to interest rate risks within the meaning of IFRS 7.
The interest rate risks associated with variable-rate financial liabilitiesare measured using cash flow sensitivity techniques. The paragonGroup had variable-rate financial liabilities of € 3,239 thousand as ofDecember 31, 2017. A change in interest rates (+1%/-1%) is associ-ated with the following cash flow risk:
Liquidity Risks
Liquidity risk, i.e., the risk that paragon might not be able to meet itspayment obligations as they fall due, is managed by means of flexiblecash management. As of December 31, 2017, paragon had cash andcash equivalents of € 145,826 thousand (prior year: € 14,278 thou-sand). Unused credit lines totaling € 18,000 thousand were availableas of December 31, 2017 (prior year: € 4,501 thousand). In additionto the instruments providing assurance of liquidity described above,the Group follows developments on financial markets on an ongoingbasis in order to take advantage of attractive financing opportunitiesas they become available.
9 4 | P A R A G O N A G A N N U A L R E P O R T 2 0 1 7
In € thousands Dec. 31, 2017 Dec. 31, 2016USD Other USD Other
Transaction-related currency risk
Currency risk from balance sheet items - 2,215 - 37 - 1,261 - 289
Currency risk from pending transactions 0 0 0 0
Items economically hedged by derivatives
- 2,215
0
- 37
0
- 1,261
0
- 289
0
Net exposure to currency risk - 2,215 - 37 - 1,261 - 289
Change in currency exposure from 10%appreciation of the euro
- 234 - 4 - 140 - 32
In € thousands Dec. 31, 2017 Dec. 31, 2016+ 1% - 1% + 1% - 1%
Cash flow risk
from financial instruments with floating interest rates - 32 32 - 38 38

The following table shows the maturity date of installments, maturityrepayments and interest arising on the financial liabilities recorded inthe balance sheet as of December 31, 2017:
The net liquidity and net borrowing are derived from the sum of cashand cash equivalents less liabilities to banks and liabilities underfinance leasing arrangements as shown in the balance sheet.
Credit Risks
Credit risk is defined as the financial loss that arises when a contractpartner fails to meet its payment obligations. The maximum risk ofdefault is therefore equal to the positive fair value of the respectiveinterest rate instruments. The effective monitoring and control ofcredit risk is a core task of the risk management system. paragon per-
In € thousands Dec. 31, 2017 Dec. 31, 2016
Cash andcash equivalents
145,826 14,278
Total liquidity 145,826 14,278
Current financial liabilities andcurrent portion of noncurrentfinancial liabilities
19,018 13,411
Noncurrent financial liabilities 67,317 35,770
Total financial liabilities 86,335 49,181
Net debt 59,491 - 34,903
forms credit checks for all customers requiring credit limits exceed-ing predefined amounts. The Group monitors credit risk on an ongo-ing basis.
(39) Capital Management
The primary goal of capital management is to maintain an appropri-ate equity ratio. The capital structure is managed and adapted tochanging economic conditions. No significant changes in capitalmanagement goals, methods or processes were made in the fiscalyear up to December 31, 2017.
Capital management refers exclusively to paragon AG equity asreported in the balance sheet. Changes in equity are shown in thestatement of changes in equity.
paragon was not required to comply with any financial covenants bythe terms of agreements made with banks providing loan capital dur-ing the reporting period up to December 31, 2017.
(40) Commitments, Contingent Assets, Contingent Liabilities andOther Financial Obligations
There were no commitments or off-balance sheet contingent assetsor contingent liabilities as of December 31, 2017. Other financial lia-bilities are as follows:
The purchase commitment includes purchase order items from non-current assets and inventories.
N O T E S T O T H E C O N S O L I D A T E D F I N A N C I A L S T A T E M E N T S 2 0 1 7 9 5
In € thousands 2018 2019 – 2022 2023 and thereafter
Non-derivative financial liabilities
Liabilities from bonds 16,193 59,000 0
Liabilities to banks 5,383 15,113 2,880
Liabilities from finance lease 1,129 1,445 0
Trade payables 17,492 0 0
Other financial liabilities 9,643 0 0
Non-derivative financial liabilities 46,260 74,433 2,880
In € thousands Remaining term< 1 year
Remaining termbetween 1 and
5 years
Remaining term> 5 years
Dec. 31, 2017 Dec. 31, 2016
Order commitments 54,253 0 0 54,253 34,555
Tenancy obligations 1,232 1,189 0 2,421 2,310
Other obligations 1,798 4,364 92 6,254 5,234
Other financial obligations 57,283 5,553 92 62,928 42,099

9 6 | P A R A G O N A G A N N U A L R E P O R T 2 0 1 7
Not
e:Ro
undi
ngdi
ffer
ence
sof
+/-o
neun
it(€
thou
sand
s)m
ayoc
curi
nta
bles
.
(41)
Consolidated
Statem
ento
fMov
emen
tson
Non
curren
tAssets
Consolidated
Statem
ento
fMov
emen
tson
Non
curren
tAssetsas
ofDecem
ber3
1,20
17
In€
thou
sand
sJa
n.1,
Chan
geAd
ditio
nsAd
ditio
nsD
ispos
alsRe
class
ific-
Dec
.31,
Jan.
1,Ch
ange
Addi
tions
Addi
tions
Impa
irmen
tsD
ispos
alsD
ec.3
1,D
ec.3
1,D
ec.3
1,20
17cu
rrenc
yfro
mco
mpa
nyat
ions
2017
2017
curre
ncy
from
com
pany
acco
rdin
g20
1720
1620
17ac
quisi
tion
acqu
isitio
nto
IAS
36/3
8
Intang
ibleassets
Lice
nces
,pat
ents
,sof
twar
e,cu
stom
erlis
t22
,900
-44
473
10,9
280
1,31
235
,568
20,8
402
1,36
529
20
022
,499
2,06
113
,070
Capi
taliz
edde
velo
pmen
tco
sts
37,1
32-3
7416
,075
00
052
,834
4,20
777
3,02
60
50
7,31
532
,926
45,5
18
Goo
dwill
843
00
6,56
70
07,
410
00
00
00
084
37,
410
Adv
ance
paym
ents
mad
eor
inta
ngib
leas
sets
2,20
10
549
00
-1,3
121,
439
00
00
00
02,
201
1,43
9
Totalintan
gible
assets
63,077
-418
17,097
17,495
00
97,251
25,046
794,39
129
25
029
,814
38,031
67,437
Prop
erty,plant
andeq
uipm
ent
Land
and
build
ings
30,6
23-7
9322
325
60
3,42
733
,736
9,39
5-4
51,
069
206
00
10,6
2521
,228
23,1
10
Tech
nica
lequ
ipm
enta
ndm
achi
nery
32,3
24-3
480
642
280
21,
978
34,6
9422
,815
-100
2,99
936
70
383
25,6
989,
510
8,99
6
Oth
erpl
ant,
offic
efu
rnitu
rean
deq
uipm
ent
13,6
75-4
51,
128
1,45
714
249
416
,567
10,9
4611
293
21,
014
013
912
,866
2,72
83,
700
Adv
ance
paym
ents
3,91
30
2,54
72
10-5
,899
553
00
00
00
03,
913
553
Totalp
rope
rty,plan
tand
equipm
ent
80,535
-872
4,70
52,13
695
40
85,549
43,157
-32
4,99
91,58
70
522
49,189
37,378
36,360
Fina
ncialassets
Equi
tyin
vest
men
ts32
60
00
00
326
00
00
00
032
632
6
Totalfinan
cialassets
326
00
00
032
60
00
00
00
326
326
Total
143,93
8-1,290
21,802
19,631
954
018
3,12
668
,203
479,39
01,88
05
522
79,003
75,735
104,12
3
AC
QU
ISIT
ION
CO
STS
DEP
RECI
ATI
ON
,AM
ORT
IZA
TIO
NA
ND
IMPA
IRM
ENT
LOSS
ESCA
RRYI
NGAM
OUN
TS

N O T E S T O T H E C O N S O L I D A T E D F I N A N C I A L S T A T E M E N T S 2 0 1 7 9 7
Consolidated
Statem
ento
fMov
emen
tson
Non
curren
tAssetsas
ofDecem
ber3
1,20
16
In€
thou
sand
sJa
n.1,
Chan
geAd
ditio
nsD
ispos
als
Re-
Dec
.31,
Jan.
1,Ch
ange
Addi
tions
Impa
irmen
tsD
ispos
als
Dec
.31,
Dec
.31,
Dec
.31,
2016
curr
ency
class
ifica
tions
2016
2016
curr
ency
acco
rdin
gto
2016
2015
2016
IAS
36/3
8
Intang
ibleassets
Lice
nces
,pat
ents
,sof
twar
e,cu
stom
erlis
t23
,398
952
80
-1,0
3422
,900
19,8
24-1
131,
128
00
20,8
403,
574
2,06
1
Capi
taliz
edde
velo
pmen
tco
sts
22,6
482
14,4
820
037
,132
2,60
410
01,
466
370
4,20
720
,044
32,9
26
Goo
dwill
770
074
00
843
00
00
00
770
843
Adv
ance
paym
ents
mad
efo
rint
angi
ble
asse
ts34
00
911
095
02,
201
00
00
00
340
2,20
1
Totalintan
gible
assets
47,156
1115
,995
0-8
463
,077
22,427
-13
2,59
437
025
,046
24,728
38,031
Prop
erty,plant
andeq
uipm
ent
Land
and
build
ings
29,9
4723
036
10
8530
,623
8,41
244
939
00
9,39
521
,535
21,2
28
Tech
nica
lequ
ipm
enta
ndm
achi
nery
27,7
836
627
152
4,06
032
,324
20,2
2773
2,58
40
6322
,815
7,55
79,
509
Oth
erpl
ant,
offic
efu
rnitu
rean
deq
uipm
ent
12,9
239
556
447
633
13,6
7510
,117
451,
008
022
910
,946
2,80
52,
729
Adv
ance
paym
ents
2,65
30
5,95
40
-4,6
943,
913
00
00
00
2,65
33,
913
Totalp
rope
rty,plan
tand
equipm
ent
73,307
246
7,49
860
084
80,535
38,756
163
4,53
20
292
43,157
34,551
37,378
Fina
ncialassets
Equi
tyin
vest
men
ts32
60
00
032
60
00
00
032
632
6
Totalfinan
cialassets
326
00
00
326
00
00
00
326
326
Total
120,78
825
723
,493
600
014
3,93
861
,183
149
7,12
637
292
68,203
59,605
75,735
Not
e:Ro
undi
ngdi
ffer
ence
sof
+/-o
neun
it(€
thou
sand
s)m
ayoc
curi
nta
bles
.

(42) Notes to the Consolidated Cash Flow Statement
The consolidated cash flow statement shows the cash flows within agiven fiscal year in order to present information about movements inthe company’s cash and cash equivalents in accordance with IAS 7“Statement of Cash Flows“. The consolidated cash flow statementhas been prepared pursuant to the indirect method as defined in IAS7.18 (b). Cash flows are classified separately as cash flows from oper-ating activities, cash flows from investing activities and cash flowsfrom financing activities.
The current cash inflows and outflows resulting from the factoringagreement have been allocated to the cash flow from operatingactivities.
The cash and cash equivalents shown in the consolidated cash flowstatement include all cash and cash equivalents reported in the bal-ance sheet that are available for use at short notice.
Cash and cash equivalents include, among other items, an amount of€ 0 thousand held on the insolvency escrow account (prior year: €626 thousand) and an amount of € 37 thousand on the insolvencydividend payout account (prior year: € 1,454 thousand). Bothaccounts are under the sole power of disposal of the former insol-vency administrator.
(43) Segment Reporting
Starting in 2017, the Group’s business activities are allocated to andreported as three operating segments on a recurring basis based onthe requirements of IFRS 8. The Electronics operating segmentincludes paragon AG’s activities for the development and sale of sen-sors, microphones and instruments, primarily for the automotiveindustry, together with the SphereDesign GmbH and the paragonKunshan Co., Ltd businesses. In 2017, it generated segment revenueof € 94,863 thousand (prior year: € 89,518 thousand) (thereof€ 90,799 thousand with third parties [prior year: € 85,280 thousand]).The operating segment’s EBIT amounted to € 9,683 thousand (prioryear: € 12,705 thousand).
The Electromobility operating segment includes the activities of man-ufacturing battery systems and battery management systems for vari-ous industries within Voltabox Deutschland AG and Voltabox of TexasInc. In 2017, it generated segment revenue of € 27,273 thousand
In € thousands Dec. 31, 2017 Dec. 31, 2016
Bank deposits 145,791 14,264
Cash on hand 35 14
Cash and cash equivalents 145,826 14,278
(prior year: € 14,493 thousand (thereof € 24,694 thousand with thirdparties [prior year: € 14,271 thousand]). The operating segment’s EBITamounted to € 577 thousand (prior year: € -3,676 thousand).
The Mechanics operating segment includes paragon AG’s activities indeveloping and marketing electromechanical components for theautomotive industry and the mechanical manufacturing of paragonGroup’s products at productronic GmbH. In 2017, it generated rev-enue of € 74,058 thousand (prior year: € 60,261 thousand), thereof€ 9,330 thousand with third parties (prior year: € 3,239 thousand).The operating segment’s EBIT amounted to € 1,167 thousand (prioryear: € -100 thousand).
The various legal entities within the paragon Group enter into supplyagreements with one another. Invoices for such supplies are raised onthe same basis as with third parties, including an appropriate margin.Internal revenue primarily arises with productronic GmbH, as thiscompany is responsible for all manufacturing processes within theGroup, and with paragon AG, which is responsible for developmentwork and central coordinating activities. This includes, among otherthings, central purchasing arrangements, human resources and com-mercial management activities to the extent that these activities arenot performed by the individual entities, as well as the Group’s centralmanagement function. Also included are rentals paid by subsidiariesfor the use of land, buildings, plant and other equipment owned byparagon AG. Charges made between the operating segments arebased on the utilization made of the respective items charged. Seg-ment assets and segment liabilities are presented on the same basis.
9 8 | P A R A G O N A G A N N U A L R E P O R T 2 0 1 7

N O T E S T O T H E C O N S O L I D A T E D F I N A N C I A L S T A T E M E N T S 2 0 1 7 9 9
Electronics Electromobility* Mechanics Eliminations Group
In € thousands
Revenue with third parties 90,799 24,694 9,330 0 124,823
Revenue intersegment 4,064 2,580 64,728 -71,372 0
Segment revenue 94,863 27,273 74,058 -71,372 124,823
Changes in inventory, other operating income,capitalized development costs 13,547 4,018 6,728 -7,664 16,629
Expenses from intersegment accounting -63,443 -3,009 -8,790 75,241 0
Cost of materials, personnel expenses andother operating expenses -28,700 -25,276 -70,448 0 -124,424
Segment EBITDA 16,267 3,007 1,549 -3,795 17,029
Depreciation(incl. amortization) -6,584 -2,430 -382 0 -9,395
Segment EBIT 9,683 577 1,167 -3,795 7,633
Group Financial Result n/a n/a n/a n/a -4,383
Earnings before taxes n/a n/a n/a n/a 3,250
Assets 268,350 148,509 173,589 -286,175 304,273
Investments 10,424 6,630 4,748 0 21,802
Debt -236,900 -10,923 -156,071 286,163 -117,731
* The Electromobility segment includes 39.97% minority interests.
2017
Electronics Electro-mobility Mechanics*) Eliminations Group
In € thousands
Revenue with third parties 85,280 14,271 3,239 0 102,790
Revenue intersegment 4,238 222 57,022 -61,482 n/a
Segment revenue 89,518 14,493 60,261 -61,482 102,790
Changes in inventory, other operating income,capitalized development costs 14,487 5,906 2,639 -7,553 15,479
Expenses from intersegment accounting -57,244 -4,878 -6,913 69,035 n/a
Cost of materials, personnel expenses andother operating expenses -28,543 -17,658 -55,976 0 -102,177
Segment EBITDA 18,218 -2,137 11 0 16,092
Depreciation(incl. amortization) -5,513 -1,539 -111 0 -7,163
Segment EBIT 12,705 -3,676 -100 0 8,929
Group Financial Result n/a n/a n/a n/a -3,167
Earnings before taxes n/a n/a n/a n/a 5,762
Assets 134,794 27,297 45,265 -91,803 115,553
Investments 13,516 7,190 2,787 0 23,493
Debt -98,583 -37,328 -37,225 97,732 -75,404
** The segment has been presented as though productronic GmbH had already been an independent entity from January 1, 2016.
2016

Information on Geographical Areas
The following table shows a geographical analysis of the Group’s rev-enue with external customers. The revenues generated with externalcustomers for the purposes of the geographical analysis is based onthe location of the registered head office of the respective externalcustomer.
Information About Transactions with Key Customers
In fiscal year 2017, three groups of companies exceeded the thresholdof 10% in the revenue share according to IFRS 8.34. Of these, onegroup of companies, which is to be regarded as one customerbecause of its joint control, had a revenue share of 49%. Anothergroup of companies, which is to be regarded as one customer due toits joint control, had a revenue share of 14.7% and a third group ofcompanies which, because of their joint control, are to be consideredas one customer had a revenue share of 12.9%.
(44) Directors and Officers
In the period from January 1 to December 31, 2017, the Manage-ment Board of paragon AG comprised the Chief Executive Officer,Klaus Dieter Frers, and the Chief Technology Officer, Dr. StefanSchwehr.
The following persons are members of the Supervisory Board:
1 0 0 | P A R A G O N A G A N N U A L R E P O R T 2 0 1 7
In € thousandsJan. 1, to
Dec. 31, 2017Jan. 1, to
Dec. 31, 2016Jan. 1, to
Dec. 31, 2017Jan. 1, to
Dec. 31, 2016Jan. 1, to
Dec. 31, 2017Jan. 1, to
Dec. 31, 2016Jan. 1, to
Dec. 31, 2017Jan. 1, to
Dec. 31, 2016
Revenue 90,189 70,251 29,210 25,943 5,423 6,596 124,823 102,790
Domestic EU Rest of the world Total
Name Occupation Membership in Supervisory Boards and Other Supervisory Committees
Prof. Dr. Lutz Eckstein Prof. Dr., Supervisory Board mandates:Chairman Head of the Chair and Institute • ATC GmbH, Aldenhoven (member)
for Automotive Engineering (ika),RWTH Aachen University Further mandates:
• Chairman of the Advisory Board of ForschungsgesellschaftKraftfahrwesen Aachen mbH (fka)
• Member of the Advisory Council for Vehicle andTraffic Engineering (VDI-FVT)
• VOSS Holding GmbH & Co. KG., Wipperfürth(Member of the Advisory Board)
Hermann Börnemeier Dipl. Financial Consultant and Tax Advisor,Managing Director of Treu-UnionTreuhandgesellschaft mbH
Walter Schäfers Lawyer, Partner at Societät SchäfersRechtsanwälte und Notare

(45) Related Party Disclosures
Related parties as defined in IAS 24 “Related Party Disclosures“include members of the Management Board, the Supervisory Boardand their immediate families as well as affiliated companies.
Treu-Union Treuhandgesellschaft mbH, Steuerberatungsgesellschaft,Paderborn, rendered services totaling € 71 thousand under an ongo-ing agreement in fiscal year 2017 (prior year: € 98 thousand). Her-mann Börnemeier, a member of the Supervisory Board of paragonAG, is also managing director of the above company.
In fiscal year 2017, Societät Schäfers, Rechtsanwälte & Notare,Paderborn, rendered services in the amount of € 0 thousand (prioryear: € 0 thousand). Mr. Schäfers, a member of the SupervisoryBoard at paragon AG, is also a partner in this company.
In fiscal year 2017, Forschungsgesellschaft Kraftfahrwesen mbHAachen rendered development services totaling € 35 thousand (prioryear: € 74 thousand). Professor Dr. Lutz Eckstein, a member of theSupervisory Board at paragon AG, is the Chairman of the AdvisoryBoard of this company.
Members of the Supervisory Board held 4,000 shares (prior year:4,000) out of a total of 4,526,266 shares as of the balance sheetdate.
Members of the Management Board held 2,265,676 shares (prioryear: 2,265,676) from a total of 4,526,266 shares (prior year:4,526,266).
Payments of € 9 thousand (previous year: € 6 thousand) were madeto Artega GmbH in 2017 on the basis of an agreed cooperationagreement, mainly for services. In addition, fixed assets worth € 58thousand (prior year: € 0 thousand) were acquired from ArtegaGmbH.
As of the balance sheet date, performance guarantees with a maxi-mum amount of € 153 thousand had been provided by Mr. Frerswith respect to paragon AG’s liabilities to banks (prior year: € 153thousand). Therefore Mr Frers received a guarantee commission of€ 2 thousand (prior year: € 2 thousand).
Mrs. Frers is employed under an employment contract consistentwith market terms and conditions.
Concerning related party disclosures for the management boardmembers of Voltabox AG, Mr. Pampel (CEO) and Mr. Klasing (CFO)as well as the members of the board of directors of Voltabox AG, Mr.Frers (chairman of the supervisory board), Prof. Dr. med. Winter andMr. Börnemeier, we refer to the consolidated financial statements ofVoltabox AG.
The outstanding balances for related parties were immaterial as ofthe reporting date.
We refer to Section D.4 “Financial assets” for further disclosures oftransactions between paragon and its affiliated companies.
(46) Share Based Remuneration
The Stock Option Program 2012 expired on May 8, 2017. No stockoptions were granted under the stock option program 2012 in theyear under review.
(47) Auditor’s Fee
Expenses of € 390 thousand were recognized in the period underreport from January 1 to December 31, 2017, as total fees for BakerTilly GmbH & Co. KG, Wirtschaftsprüfungsgesellschaft, Steuerber-atungsgesellschaft (prior year: € 106 thousand).
The fee is divided into audit services in the amount of € 190 thou-sand (prior year: € 63 thousand), other confirmation services of€ 181 thousand (prior year: € 0 thousand) and other services of € 19thousand (prior year: € 43 thousand). The fee for audit servicesrelates to the audit of the annual financial statements, the audit ofthe IFRS consolidated financial statements and the review of severalfinancial statements for paragon AG and Voltabox AG. The fee forother confirmation services relates to the audit of the profit forecast,the combined financial statements and the granting of several com-fort letters for paragon AG and Voltabox AG.
(48) Risk Management
The company’s risk management is described in the combined man-agement report.
(49) Application of the Exemption Provisions of Section 264 (3) ofthe German Commercial Code (HGB)
The following fully consolidated domestic subsidiaries make use ofsome of the exemption provisions for the year under review:
• productronic GmbH, Delbrück• KarTec GmbH, Delbrück• Sphere Design GmbH, Bexbach• paragon movasys GmbH, Landsberg am Lech
N O T E S T O T H E C O N S O L I D A T E D F I N A N C I A L S T A T E M E N T S 2 0 1 7 1 0 1

(50) Declaration Pursuant to Section 160 (1) No. 8 of the GermanStock Corporation Act (AktG)
Voting Right Notifications
In the year under review, the company received the following notifi-cations pursuant to Section 26 (1) of the German Securities TradingAct (WpHG) that require disclosure in accordance with Section 160(1) No. 8 of the German Stock Corporation Act (AktG):
• Otus Capital Management LP (represented by Otus Capital Man-agement Limited, represented by Andrew Gibbs) informed the com-pany that its shareholding fell below the 5% threshold on May 4,2017. As a result, its shareholding in paragon AG on that date was4.75% (215,095 voting rights).
• HANSAINVEST Hanseatische Investment-GmbH informed thecompany that the 3% threshold was exceeded as of June 21, 2017.As a result, its shareholding in paragon AG on that date was 3.04%(137,425 voting rights).
• Otus Capital Management LP (represented by Otus Capital Man-agement Limited, represented by Andrew Gibbs) informed the com-pany that its shareholding fell below the 3% threshold on Septem-ber 6, 2017. As a result, its shareholding in paragon AG on that datewas 2.74% (124,240 voting rights).
• HANSAINVEST Hanseatische Investment-GmbH informed thecompany that it fell below the 3 percent threshold as of September27, 2017. As a result, its shareholding in paragon AG on that datewas 2.99% (135,449 voting rights).
• HANSAINVEST Hanseatische Investment-GmbH informed thecompany that the 3 percent threshold was exceeded as of October23, 2017. As a result, its shareholding in paragon AG on that datewas 3.24% (146,823 voting rights).
Directors’ Dealings
The company did not receive any reports on proprietary transactionsby executives in accordance with Art. 19 of the EU regulation No596/2014 (MAR) on market abuse (market abuse regulation) duringthe reporting period.
Corporate Governance Declaration
The Declaration of Conformity with the German Corporate Gover-nance Code (GCGC) required under Section 161 of the GermanStock Corporation Act (AktG) was most recently submitted in March2018, and is available to shareholders on a permanent basis on thecompany’s website (www.paragon.ag).
Delbrück, Germany, March 9, 2018
paragon AGThe Management Board
Klaus Dieter Frers Dr. Stefan SchwehrChief Executive Officer Chief Technology Officer (Electronics)
1 0 2 | P A R A G O N A G A N N U A L R E P O R T 2 0 1 7

A U D I T O R ’ S R E P O R T 1 0 3
Auditor’s Report
paragon AG, Delbrück
REPORT ON THE AUDIT OF THE CONSOLIDATEDFINANCIAL STATEMENTS AND THE COMBINEDMANAGEMENT REPORT
Audit Opinions
We have audited the consolidated financial statementsof paragon AG and its subsidiaries (the Group), whichcomprises the consolidated balance sheet as of Decem-ber 31, 2017, the consolidated statement of compre-hensive income, the consolidated statement of changesin equity and the consolidated cash flow statement forthe fiscal year starting January 01, 2017, and endingDecember 31, 2017, as well as the notes to the conso-lidated financial statements, including a summary of im-portant accounting policies. Furthermore, we have audi-ted the combined management report of paragon AGfor the fiscal year starting January 01, 2017, and endingDecember 31, 2017.
In our opinion, based on the findings of our audit,
• the enclosed consolidated financial statements com-ply with IFRS as adopted by the EU and the additionalrequirements pursuant to Section 315e (1) of theGerman Commercial Code (HGB), and provide a trueand fair view of the net assets and financial positionof the Group as of December 31, 2017, as well as itsearnings for the fiscal year starting January 01, 2017,and ending December 31, 2017, in accordance withthese requirements and
• the enclosed combined management report providesa suitable view of the Group's position. The combinedmanagement report is consistent with the consolida-ted financial statements, complies with all statutoryregulations and suitably presents the opportunitiesand risks of future development.
Pursuant to Section 322 (3) sentence 1 of the GermanCommercial Code (HGB), we declare that our audit hasnot led to any objections to the regularity of the conso-lidated financial statements and the combined manage-ment report.
Basis for the Audit Opinions
We conducted our audit of the consolidated financialstatements and the combined management report inaccordance with Section 317 HGB and the EU AuditRegulation (no. 537/2014, referred to subsequently as“EU Audit Regulation”) and in compliance with Germangenerally accepted standards for the audit of financialstatements promulgated by the Institut der Wirtschafts-prüfer [Institute of Public Auditors in Germany] (IDW).Our responsibilities according to those requirementsand principles are further described in the “Auditor’s Re-sponsibility for the Audit of the Consolidated FinancialStatements and the combined Management Report”section of our auditor’s report. We are independent ofthe Group companies in accordance with the require-ments of European law and German commercial lawand professional rules of conduct, and we have fulfilledour other German professional responsibilities in com-pliance with these requirements. In addition, in accor-dance with Article 10 (2) point (f) of the EU Audit Regu-lation, we declare that we have not provided anynon-audit services prohibited under Article 5 (1) of theEU Audit Regulation. We believe that the audit evi-dence we have obtained is sufficient and appropriate toprovide a basis for our audit opinions on the consolida-ted financial statements and the combined managementreport.
Key Audit Matters in the Audit of the ConsolidatedFinancial Statements
Key audit matters are those matters that, in our professio-nal judgment, were of most significance in our audit ofthe consolidated financial statements for the fiscal yearfrom January 1, 2017 to December 31, 2017. These mat-
Auditor’s Report

ters were addressed in the context of our audit of theconsolidated financial statements as a whole and in for-ming our audit opinion thereon; we do not provide a se-parate audit opinion on these matters.
Our presentation of these key audit matters has the fol-lowing structure:
1.) Specific matter and problem
2.) Audit approach and findings
3.) Further information
I. Initial Public Offering of Voltabox AG
1.) The shares of the subsidiary Voltabox AG have beenlisted on the regulated market of the Frankfurt StockExchange since October 13, 2017. Against the back-ground of the magnitude of this transaction and itsimpact on the net assets, financial position and re-sults of operations of paragon AG, this issue was ofparticular importance during our audit.
2.) We have taken into consideration the legal and or-ganizational restructuring measures associated withthe IPO of Voltabox AG insofar as these were of sig-nificance for our audit. In our audit of shares in affi-liated companies, cash and cash equivalents, equityand the statement of cash flows, among other activi-ties we obtained proof of the amount of the issueproceeds. We obtained proof of the amount of thecosts for the IPO and reviewed the accounting rulesfor the issue costs. In our assessment of the resultsof the accounting and measurement rules applied,we relied, among other activities, upon documentsincluding bank and commercial register excerpts, re-solutions passed by the company’s Supervisory Bo-ard and Management Board as well as other boardresolutions of Voltabox AG. There were no objecti-ons.
3.) The company’s significant disclosures regarding theeffects of the IPO of Voltabox AG are included in thesections “(6) Scope of Consolidation”, “(23) FinancialAssets“, “(28) Equity”, and “(32) Provisions for Pensi-ons” of the notes.
II. Initial Consolidation of paragon movasys GmbH(Previously: HS Genion GmbH)
1.) With the signing of the share purchase and transferagreement on November 24, 2017, the companyacquired all shares in HS Genion GmbH, Landsbergam Lech. Due to the significant overall effects of thiscompany acquisition on the company’s net assetsand financial position, it was particularly importantfor the purpose of our audit.
2.) Within the scope of our audit of the company acqui-sition, we initially inspected and reviewed the con-tractual agreements and reconciled the purchase pri-ce paid in return for the shares received with theproof of payments which we received. For the pur-pose of the acquisition, we have reviewed the preli-minary purchase price allocation to the extent thatwe have reconstructed the original data for the reva-luation of assets and liabilities and the underlying as-sumptions. There were no objections to the accoun-ting treatment of the company acquisition from ouraudit procedures.
3.) The company’s significant disclosures regarding theeffects of the IPO of Voltabox AG are included in thesections “(6) Scope of Consolidation”, “(23) FinancialAssets“, “(28) Equity”, and “(32) Provisions for Pensi-ons” of the notes.
III. Measurement of Capitalized Development Costs
1.) As of December 31, 2017, the company has repor-ted capitalized development work in its balancesheet as an intangible asset in the amount of €44,037 thousand. Due to the overall significant im-pact of this item on the Group's net assets and re-sults of operations and the complexity of accountingand valuation, the capitalized development costs we-re particularly important for the purpose of our audit.
2.) As part of our review of capitalized developmentcosts, we performed randomized test procedures tovalidate the valuation of capitalized developmentcosts. We reviewed the methodological approachapplied in the measurement of capitalized develop-ment costs and evaluated this calculation in terms of
1 0 4 | P A R A G O N A G A N N U A L R E P O R T 2 0 1 7

its amount. For this purpose, for the selected sam-ples the project documentation was analyzed, dis-cussions were held with the project managers andthe related planned profit contribution calculationwas analyzed. There were no objections to the ac-counting treatment of the capitalized developmentcosts from our audit procedures.
3.) The company’s disclosures concerning the effects ofthe capitalized development costs are included inthe notes, mainly in the following sections: “(8) Des-cription of Accounting Policies and MeasurementMethods - Intangible Assets”, “(9) Use of Estimatesand Assumptions - Capitalized Development Costs“,“(12) Capitalized Development Costs“ and “(20) In-tangible Assets.”
Other Information
The company’s legal representatives are responsible forthe other information. This other information comprisesthe declaration provided in the section “Corporate Go-vernance Statement Pursuant to Section 315d in con-nection with 289f (1) HGB” of the combined manage-ment report, as a component of the combinedmanagement report whose contents have not been au-dited.
This other information likewise includes the remainingparts of the Annual Report, with the exception of theaudited consolidated financial statements, the auditedcombined management report and our auditor’s report,and especially
- the confirmation pursuant to Section 297 (2) sentence4 HGB regarding the consolidated financial state-ments and the confirmation pursuant to Section 315(1) sentence 5 HGB regarding the combined manage-ment report and
- the corporate governance report pursuant to no. 3.10of the German Corporate Governance Code.
Our audit opinions on the consolidated financial state-ments and the combined management report do not co-ver this other information, and consequently we do notexpress an audit opinion or any other form of audit con-clusion thereon.
In connection with our audit, our responsibility is to re-ad this other information and, in so doing, to considerwhether this other information
• is materially inconsistent with the consolidated finan-cial statements, the combined management report orour knowledge obtained in the audit, or
• otherwise appears to be materially misstated.
Responsibility of the Company’s Legal Representati-ves and the Supervisory Board for the ConsolidatedFinancial Statements and the Combined ManagementReport
The company’s legal representatives are responsible forthe preparation of the consolidated financial statementswhich comply with the IFRS as adopted by the EU aswell as the German supplementary statutory regulationsapplicable under Section 315e (1) HGB in all significantrespects and for ensuring that the consolidated financi-al statements provide a true and fair view of the net as-sets, financial position and earnings of the Group in ac-cordance with these provisions. In addition, thecompany’s legal representatives are responsible forsuch internal control as they have determined necessa-ry to enable the preparation of consolidated financialstatements that are free from material misstatement,whether due to fraud or error.
In preparing the consolidated financial statements, thecompany’s legal representatives are responsible for as-sessing the Group’s ability to continue as a going con-cern. They are also responsible for disclosing, as appli-cable, matters related to going concern. In addition,they are responsible for financial reporting based on thegoing concern basis of accounting unless there is an in-tention to liquidate the Group or to cease operations, orthere is no realistic alternative but to do so.
Furthermore, the company’s legal representatives areresponsible for the preparation of the combined ma-nagement report that, as a whole, provides an appro-priate view of the Group’s position and is, in all materialrespects, consistent with the consolidated financialstatements, complies with German legal requirements,and appropriately presents the opportunities and risks
A U D I T O R ’ S R E P O R T 1 0 5
of future development. In addition, the company’s legalrepresentatives are responsible for such arrangementsand measures (systems) as they have considered neces-sary to enable the preparation of a combined manage-ment report that is in accordance with the applicableGerman legal requirements, and to be able to providesufficient appropriate evidence for the assertions in thecombined management report.
The Supervisory Board is responsible for overseeing theGroup’s financial reporting process for the preparationof the consolidated financial statements and the combi-ned management report.
Auditor’s Responsibility for the Audit of the Consoli-dated Financial Statements and the Combined Ma-nagement Report
Our objectives are to obtain reasonable assuranceabout whether the consolidated financial statements asa whole are free from material misstatement, whetherdue to fraud or error, and whether the combined ma-nagement report as a whole provides an appropriateview of the Group’s position and, in all material re-spects, is consistent with the consolidated financialstatements and the knowledge obtained in the audit,complies with German legal requirements and appro-priately presents the opportunities and risks of futuredevelopment, as well as to issue an auditor’s report thatincludes our audit opinions on the consolidated financi-al statements and the combined management report.
Reasonable assurance is a high level of assurance, but isnot a guarantee that an audit conducted in accordancewith Section 317 HGB and the EU Audit Regulation andin compliance with German generally accepted stan-dards for the audit of financial statements promulgatedby IDW will always detect a material misstatement.Misstatements can arise from fraud or error and areconsidered material if, individually or in the aggregate,they could reasonably be expected to influence theeconomic decisions of users made on the basis of theseconsolidated financial statements and this combinedmanagement report.
We exercise professional judgment and maintain pro-fessional skepticism throughout the audit. We also:
• Identify and assess the risks of material misstatementin the consolidated financial statements and the com-bined management report, whether due to fraud orerror, design and perform audit procedures responsi-ve to those risks, and obtain audit evidence that issufficient and appropriate to provide a basis for ouraudit opinions. The risk of not detecting a materialmisstatement resulting from fraud is higher than forone resulting from error, as fraud may involve collusi-on, forgery, intentional omissions, misrepresentations,or the override of internal control.
• Obtain an understanding of internal control relevantto the audit of the consolidated financial statementsand of arrangements and measures relevant to theaudit of the combined management report, in order todesign audit procedures that are appropriate in thecircumstances, but not for the purpose of expressingan audit opinion on the effectiveness of these sys-tems.
• Evaluate the appropriateness of accounting policiesused by the company’s legal representatives and thereasonableness of estimates made by the company’slegal representatives and related disclosures.
• Draw conclusions regarding the appropriateness ofthe company’s legal representatives’ use of the goingconcern basis of accounting and, based on the auditevidence obtained, whether a material uncertaintyexists related to events or conditions that may castsignificant doubt on the Group’s ability to continue asa going concern. If we conclude that a material uncer-tainty exists, we are required to draw attention in theauditor’s report to the related disclosures in the con-solidated financial statements and in the combinedmanagement report or, if such disclosures are inade-quate, to modify our respective audit opinions. Ourconclusions are based on the audit evidence obtainedup to the date of our auditor’s report. However, futu-re events or conditions may cause the Group to ceaseto be able to continue as a going concern.
1 0 6 | P A R A G O N A G A N N U A L R E P O R T 2 0 1 7

• Evaluate the overall presentation, structure and con-tent of the consolidated financial statements, includingthe disclosures, and whether the consolidated financialstatements present the underlying transactions andevents such that the consolidated financial statementsgive a true and fair view of the net assets, financial po-sition and earnings of the Group in compliance withIFRS as adopted by the EU and the additional require-ments of German commercial law pursuant to Section315e (1) HGB.
• Obtain sufficient appropriate audit evidence regar-ding the financial information of the entities or busi-ness activities within the Group to express audit opi-nions on the consolidated financial statements andthe combined management report. We are responsi-ble for the direction, supervision and performance ofthe audit of the consolidated financial statements. Weremain solely responsible for our audit opinions.
• Evaluate the consistency of the combined manage-ment report with the consolidated financial state-ments, its conformity with German law, and the viewof the Group’s position which it provides.
• Perform audit procedures regarding the prospectiveinformation presented by the company’s legal repre-sentatives in the combined management report. Onthe basis of sufficient appropriate audit evidence weevaluate, in particular, the significant assumptionsused by the company’s legal representatives as a basisfor the prospective information, and evaluate whetherthis prospective information has been properly deri-ved from these assumptions. We do not express a se-parate audit opinion on this prospective informationand on the assumptions used as a basis. There is asubstantial unavoidable risk that future events will dif-fer materially from the prospective information.
We discuss with those charged with governance regar-ding, among other matters, the planned scope and ti-ming of the audit and significant audit findings, includingany significant deficiencies in internal control that weidentify during our audit.
We also provide those charged with governance with astatement that we have complied with the relevant in-dependence requirements, and discuss with them anyrelationships and other matters that may reasonably bethought to bear on our independence, and where appli-cable, the related safeguards.
On the basis of the matters discussed with the personscharged with governance, we determine the mattersthat were of most significance in the audit of the conso-lidated financial statements for the current period underreview and are therefore the key audit matters. We des-cribe these matters in our auditor’s report unless anylaw or other regulation precludes public disclosure ofthis matter.
OTHER LEGAL AND REGULATORY REQUIREMENTS
Further Information Pursuant to Article 10 of the EUAudit Regulation
We were elected as the auditor of the consolidated fi-nancial statements by the Annual General Meeting heldon May 10, 2017. We were engaged by the Superviso-ry Board on January 18, 2018. We have audited theconsolidated financial statements of paragon AG wit-hout interruption since fiscal year 2013.
We declare that the audit opinions expressed in this au-ditor’s report are consistent with the additional reportto the audit committee pursuant to Article 11 of the EUAudit Regulation (long-form audit report).
A U D I T O R ’ S R E P O R T 1 0 7

1 0 8 | P A R A G O N A G A N N U A L R E P O R T 2 0 1 7
GERMAN PUBLIC ACCOUNTANTS RESPONSIBLE FORTHE ENGAGEMENT
The public accountants responsible for the engagementare Thomas Gloth and Christoph Tyralla.
Düsseldorf, March 9, 2018
Thomas Gloth Christoph TyrallaGerman public accountant German public accountant
Baker Tilly GmbH & Co. KGWirtschaftsprüfungsgesellschaft(Düsseldorf)
(before Baker Tilly AGWirtschaftsprüfungsgesellschaft)
paragon AG, Delbrück
Consolidated financial statements andcombined management reportfor the fiscal year 2017

We declare that to the best of our knowledge and in ac-cordance with the applicable accounting principles, theconsolidated financial statements give a true and fairview of the assets, financial position and earnings of theGroup, and that the combined management reportpresents the development of business, including thebusiness results and the position of the Group, in sucha way that a true and fair view is conveyed and thesignificant opportunities and risks of the Group’s fore-seeable development are described.
Klaus Dieter Frers Dr. Stefan SchwehrChief Executive Officer Chief Technology Officer (Electronics)
Declaration by the Legal Representatives
D E C L A R A T I O N B Y T H E L E G A L R E P R E S E N T A T I V E S 1 0 9
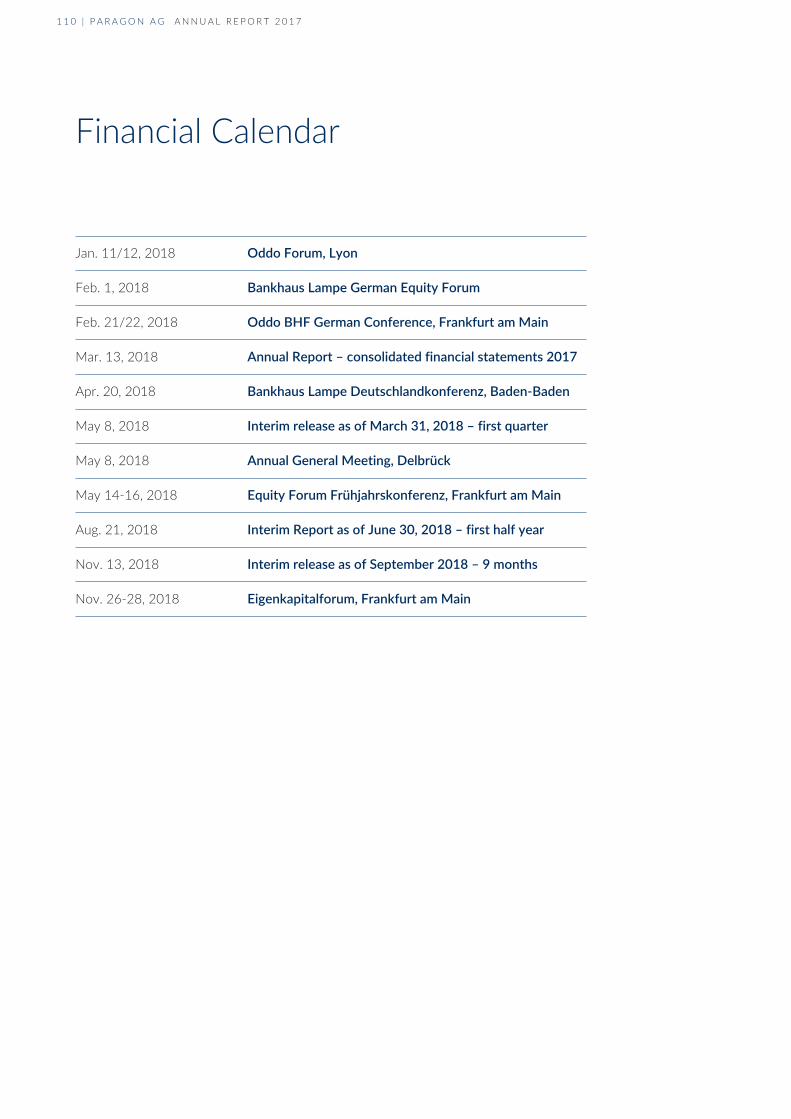
1 1 0 | P A R A G O N A G A N N U A L R E P O R T 2 0 1 7
Financial Calendar
Jan. 11/12, 2018 Oddo Forum, Lyon
Feb. 1, 2018 Bankhaus Lampe German Equity Forum
Feb. 21/22, 2018 Oddo BHF German Conference, Frankfurt am Main
Mar. 13, 2018 Annual Report – consolidated financial statements 2017
Apr. 20, 2018 Bankhaus Lampe Deutschlandkonferenz, Baden-Baden
May 8, 2018 Interim release as of March 31, 2018 – first quarter
May 8, 2018 Annual General Meeting, Delbrück
May 14-16, 2018 Equity Forum Frühjahrskonferenz, Frankfurt am Main
Aug. 21, 2018 Interim Report as of June 30, 2018 – first half year
Nov. 13, 2018 Interim release as of September 2018 – 9 months
Nov. 26-28, 2018 Eigenkapitalforum, Frankfurt am Main

IMPRINT
paragon AGArtegastraße 133129 Delbrück /GermanyTel.: +49 (0) 5250 9762–0Fax: +49 (0) 5250 9762–60E-Mail: [email protected]: @paragon_irwww.paragon.ag
I M P R I N T 1 1 1
