groundwater and microbial processes of alabama coastal...
TRANSCRIPT

Groundwater and microbial processes of Alabama coastal plain
aquifers
Elizabeth Penny and Ming-Kuo Lee
Department of Geology and Geography, Auburn University, Alabama, USA
Cynthia Morton
Carnegie Museum of Natural History, Pittsburgh, Pennsylvania, USA
Received 2 January 2003; revised 14 July 2003; accepted 28 August 2003; published 21 November 2003.
[1] We integrate groundwater geochemistry, microbiology, and numerical modelingtechniques to study the origin of elevated salinity and chemical evolution of groundwatersin the coastal plain aquifers of Alabama. Our field data indicate that chemical compositionof groundwater evolves by various geochemical and microbial processes as it movesdeeper into the subsurface. Sequential peaks of Ca2+, Mg2+, K+, and Na+ along flow pathsindicate that separation of ions may be driven by cation exchange. Microbial-mediatedreactions are important for the formation of several discrete hydrochemical zonescontaining Fe2+, Mn2+, Sr2+, and SO4
2� rich groundwaters. Elevated Fe2+, Mn2+, and Sr2+
concentrations may be derived from bacterial iron and manganese reduction. High sulfateconcentrations observed a short distance from the recharge may be partly explained bymicrobial sulfur oxidation and nitrate reduction (denitrification). The presence ofdenitrifying and sulfur-oxidizing bacteria in water further supports these reactions. Majorion compositions and dD and d18O values are used to determine the source of salinity andthe nature of mixing of different groundwaters. Three water types were identified; theseinclude carbonate groundwater, brines associated with evaporites, and groundwater ofmeteoric origin. Groundwater age differences and flow velocities were calculated usingthe 36Cl/Cl ratios. Calculated groundwater flow velocities within the Eutaw andTuscaloosa aquifers are about 0.20 m/yr and 0.15 m/yr, respectively. We modeled basin-scale hydrologic and solute transport processes in a cross section extending from theaquifer outcrops to the Gulf Coast. The modeling result shows that the buried JurassicLouann Salt can significantly increase groundwater salinity in the overlying coastal plainaquifers by density-driven advection and hydrodynamic dispersion. The modelingresults are consistent with Cl/Br ratios and O/H isotope signatures, which indicate thatsalinity of the groundwater could be derived from seawater that has been evaporatedbeyond halite saturation. The predicted groundwater flow pattern reveals the mixing ofmeteoric water, carbonate groundwater (from the Ordovician Knox Group), and salinebrines associated with the Louann Salt. The hydrologic model is consistent with thehydrochemical facies distribution in the Alabama coastal plain. INDEX TERMS: 1832
Hydrology: Groundwater transport; 1045 Geochemistry: Low-temperature geochemistry; 1065 Geochemistry:
Trace elements (3670); 1040 Geochemistry: Isotopic composition/chemistry; KEYWORDS: groundwater,
microbiology, hydrochemistry, isotopes, trace elements, coastal plain
Citation: Penny, E., M.-K. Lee, and C. Morton, Groundwater and microbial processes of Alabama coastal plain aquifers,
Water Resour. Res., 39(11), 1320, doi:10.1029/2003WR001963, 2003.
1. Introduction
[2] The sources of salinity and chemical evolution ofgroundwater in sedimentary aquifers remain one of the mostcontroversial problems in basin hydrology. Coastal plainaquifers in central south Alabama are exploited for largequantities of drinking water at depths, but groundwateris locally contaminated with trace elements including Feand Mn (>300 ug/mg) and its chloride contents increase
dramatically (>100,000 mg/kg) downdip. Although hydro-chemistry and geology of coastal plain aquifers in Alabamahave been studied bymany investigators [e.g.,Knowles et al.,1963; Scott et al., 1987; King, 1990; Floesser, 1996; Cook,1993, 1997], the source of salinity and the influenceof geochemical and microbial processes on groundwaterchemistry remain poorly understood. Continuous increasesin groundwater extraction from coastal plain aquifers havenecessitated an evaluation of the origin of salinity andchemical evolution of groundwater supply in this region.[3] Hydrogeologists have used different tools to construct
the chemical evolution and hydrologic transport model forCopyright 2003 by the American Geophysical Union.0043-1397/03/2003WR001963$09.00
HWC 2 - 1
WATER RESOURCES RESEARCH, VOL. 39, NO. 11, 1320, doi:10.1029/2003WR001963, 2003
regional groundwater systems. Back and Hanshaw [1970]introduced the hydrochemical facies concept to study themixing of different groundwaters and water-sediment inter-action along a flow path. Geochemists have since increas-ingly used the distribution and composition of stable isotopetracers to study groundwater sources and geochemicalprocesses [Clark and Fritz, 1997]. Radioactive tracer tech-niques (e.g., 3H, 36Cl, 3H/3He, 87Sr/86Sr) have been widelyused for estimating the residence time or age of ground-waters as well as their recharge and discharge rates [e.g.,Davis and Bentley, 1982; Bentley et al., 1986; Lehmann etal., 1993; Johnson et al., 2000; Roback et al., 2001; Alley etal., 2002]. In the past decade, newly developing nucleic-acid technology (see review by Madsen [2000]) allowsscientists to investigate how microbial diversity and activitycreate discrete hydrochemical zones in regional aquifersystems [e.g., Chapelle, 1993; Lovley and Chapelle, 1995;Jakobsen and Postma, 1999]. Since then, the effect ofmicrobial processes on chemical evolution of groundwaterhas been the subject of a large body of research. The nucleicacid probing and amplification method is especially usefulin groundwater environments where the organisms of inter-est are usually present in relatively small number andtraditional culture methods have not yet been successful.
Because the mass transport processes are quite complex,scientists have come to rely on numerical modeling techni-ques to study how moving groundwater redistributes dis-solved solutes. New hydrologic modeling tools whichincorporate detailed hydrostratigraphic variations and geo-logic history have advanced our understanding of ground-water flow and solute transport processes in regional aquifersystems [Bethke, 1989; Person et al., 1996; Lee andWilliams, 2000]. The regional transport models have beenused to study the origin of brines and the nature of salinitydistributions observed in many sedimentary basins [e.g.,Ranganathan and Hanor, 1987; Garven et al., 1993].[4] This study emphasizes the integrated approach by
applying isotopic tracers, hydrochemistry, microbiologydata, and numerical modeling in a regional-scale hydro-geology model. Data of major ions, trace elements, stableisotopes, radioactive isotopes, and the type of microorga-nisms were collected along two flow paths southward fromoutcrops of aquifers. The flow paths or general directions ofgroundwater flow were estimated from published potentio-metric surfaces of regional aquifers in the study area [Cook,1993]. Regional groundwater flow modeling was conductedto interpret the occurrence of brines and groundwatermixing in coastal plain aquifers. The results of numerical
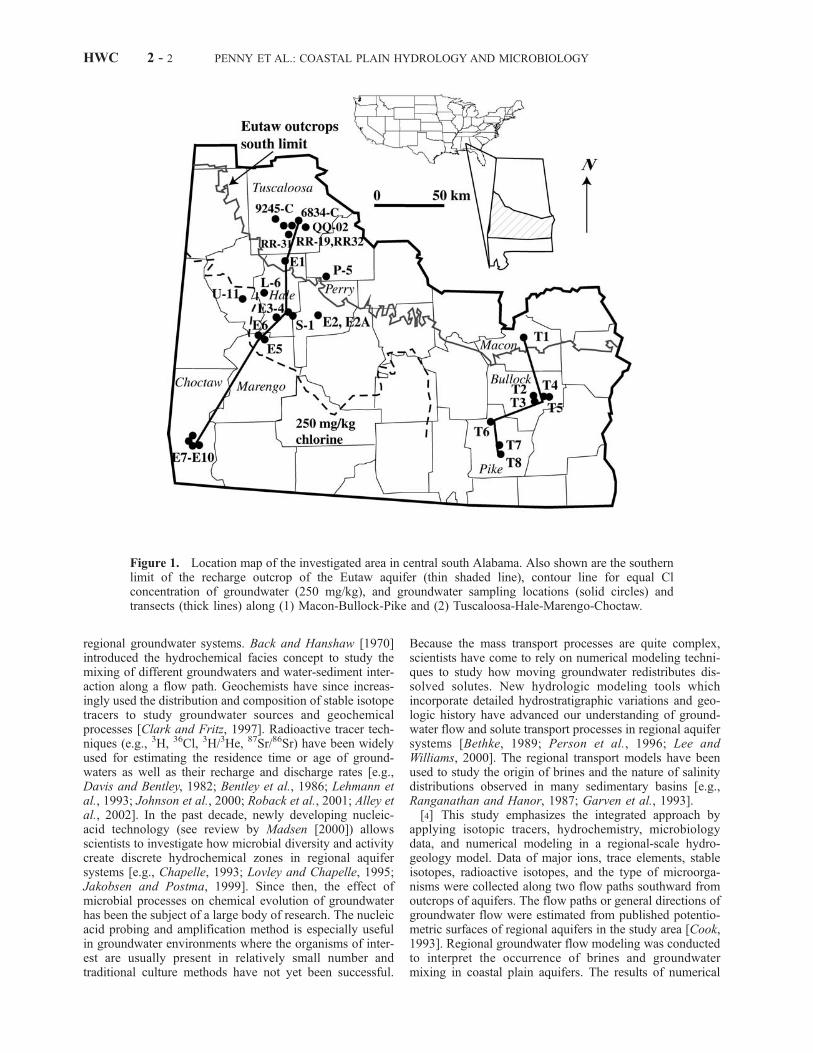
Figure 1. Location map of the investigated area in central south Alabama. Also shown are the southernlimit of the recharge outcrop of the Eutaw aquifer (thin shaded line), contour line for equal Clconcentration of groundwater (250 mg/kg), and groundwater sampling locations (solid circles) andtransects (thick lines) along (1) Macon-Bullock-Pike and (2) Tuscaloosa-Hale-Marengo-Choctaw.
HWC 2 - 2 PENNY ET AL.: COASTAL PLAIN HYDROLOGY AND MICROBIOLOGY
modeling are integrated with geochemical and isotopic datato interpret the origin of salinity and chemical evolution ofcoastal plain aquifers in central south Alabama.
2. Geology and Hydrogeology
[5] The study area in central south Alabama belongs tothe southeastern coastal plain province of the United States(Figures 1 and 2). The area is of moderate relief with surfaceelevations ranging from 200–300 m above sea level in thenorth to about 50–100 m in the south. The study areaconsists of unconsolidated Mesozoic and Cenozoic sedi-ments unconformably overlying Precambrian to Paleozoicmetamorphic and igneous rocks of the Alabama Piedmontprovince [Horton et al., 1984;King, 1990]. The updip portionof coastal plain is a thick (>3000 m) wedge of sedimentarystrata dipping south-southwest and trending approximatelyeast-west and northwest-southeast (Figure 3). Table 1 showsthe correlations of hydrostratigraphic and lithostratigraphicunits in central south Alabama. These stratigraphic unitsconsist of different sediment types with age ranging fromCambrian to late Paleocene.[6] This study focuses on the hydrogeology and ground-
water geochemistry of the Cretaceous Tuscaloosa and Eutawaquifers. The Tuscaloosa Group is present in central southAlabama and crops out along the northern limit of the coastalplain. The thickness of the Tuscaloosa Group ranges from200 to 400 m. The Tuscaloosa Group consists mainly ofnonmarine deposits along the outcrops to marine clastics inthe southern subsurface. West of the Tallapoosa River, theTuscaloosa is divided into the Coker and Gordo Formations.The Tuscaloosa is not differentiated in eastern Alabamabecause of the absence of distinct marine deposits and fossils.The undifferentiated Tuscaloosa Group consists mainly ofclay, fine to very coarse sand, and gravel.[7] The Eutaw Formation consists of light to green-gray,
cross laminated, fine to medium, well-sorted, micaceous,glauconitic sand [Raymond et al., 1988; King, 1990]. TheEutaw Formation dips about 0.6 meter per kilometer with athickness of a few meters at the northern part of the outcropto 150 m near the Gulf coast. The Eutaw Formation isdistinctly coarser and contains more marine glauconiticmaterials than the Tuscaloosa [King, 1990]. A clay zoneseparates the Eutaw Formation into the upper well-cemented sandstone and lower clay interbedded with sand.The upper confining units of the Eutaw aquifer, the Moore-ville Chalk, Demopolis Chalk, and Blufftown Formation arelow-permeability, micaceous and calcareous clays. Thelower confining unit, the upper part of the Gordo Forma-tion, is mostly clay.[8] The Eutaw and Tuscaloosa aquifers are a major
source of water supply for central south Alabama. Ground-water recharges along east-west and northwest-southeastoutcrop trends in central Alabama (Figure 1). Groundwatermigrates generally to the south in central east Alabama, andmoves southwest in the western part of the study area,following the dip of the aquifers. Groundwater is pumpedfrom the sandy portion of the aquifers throughout thenorthern part of the study area. Wells pumping potablegroundwater from the Tuscaloosa aquifer are located as farsouth as central Pike County, about 70 km south of theoutcrop area in south Alabama. In some locations, thecontinuous sand portion of these aquifers yields up to
1 million gallons (3780 m3) of water per day [Cook,1993]. Groundwater salinity increases southward and rea-ches several thousands of mg/kg in west-central Alabamaand hundreds of thousands in southwest Alabama, whereassalinity of groundwater in eastern Alabama is mostly below100 mg/kg. Why salinity is significantly higher in thewestern part of the study area is poorly understood. Abnor-mal salinity in western Alabama may be attributed to thepresence of Louann Salt below the coastal plain aquifers[e.g., Brobst et al., 1973; Keller, 2000] or a marinedepositional environment.
3. Methodology
3.1. Geochemistry Analysis
[9] Geochemical and isotope analyses have been con-ducted on groundwater samples taken along two transects(Figure 1) following flow lines southward from rechargeareas in central Alabama. Major cations and stable isotopes(18O and 2H) analyses were conducted at the Universityof Arizona. Anions including Cl�, Br�, and SO4
2� were
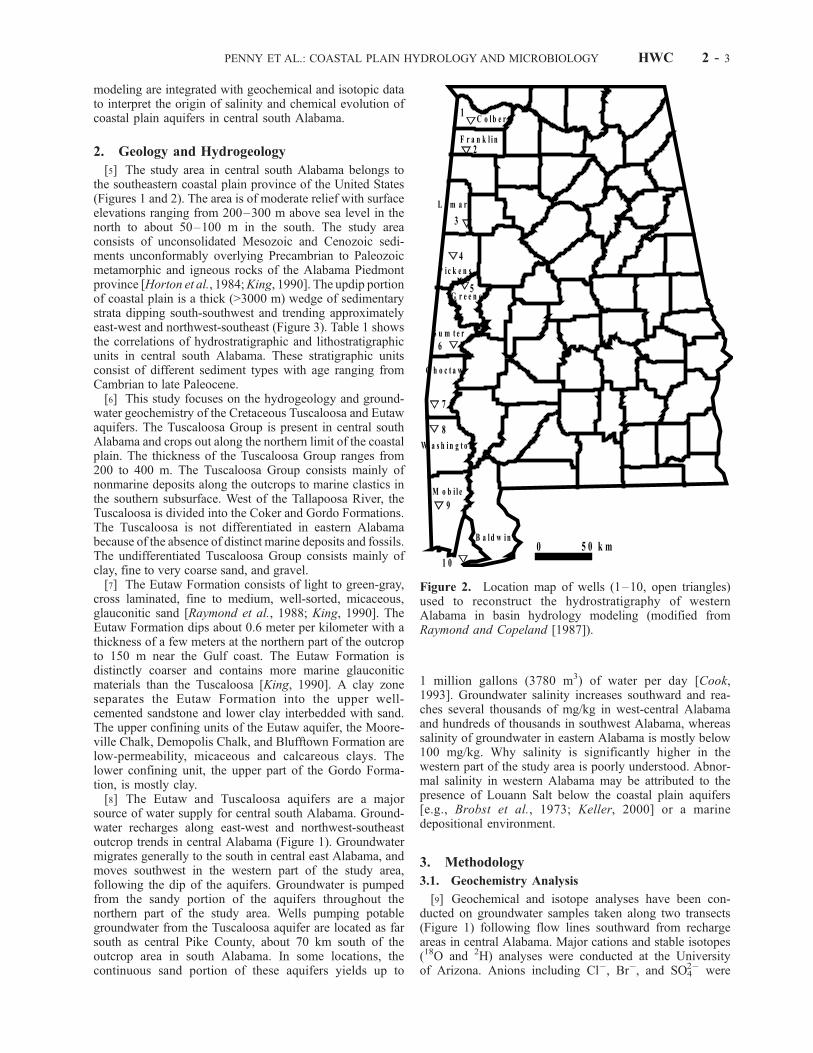
Figure 2. Location map of wells (1–10, open triangles)used to reconstruct the hydrostratigraphy of westernAlabama in basin hydrology modeling (modified fromRaymond and Copeland [1987]).
PENNY ET AL.: COASTAL PLAIN HYDROLOGY AND MICROBIOLOGY HWC 2 - 3

analyzed at Los Alamos National Laboratory. Radioactiveisotopes 36Cl and 3H compositions of groundwater sampleswere measured at the PRIME (Purdue Rare Isotope Measure-ment) Laboratory and U.S. Geological Survey (Menlo Park),respectively.
[10] All water samples but those from the ChoctawCounty were taken from municipal water supply. TheChoctaw samples were collected from four industrial supplywells. To procure a sample that is representative of forma-tion water, all wells were pumped continuously for at least
Figure 3. General hydrostratigraphic units in western Alabama used in the regional groundwater andsolute transport modeling. The cross section is constructed based on geologic columnar sections fromRaymond and Copeland [1987]. Well locations are shown in Figure 2.
Table 1. Hydrostratigraphic and Lithostratigraphic Units From Recharge Area to Gulf Coast in Western Alabama
Hydrostratigraphy System/Series Lithostratigraphy
Coastal Deposits Quaternary coastal and low-level fluvial deposits, high-level fluvial depositsWilcox Group Tertiary Miocene undifferentiated, Pensacola Clay, Tampa Formation
and Chickasawhay Limestone undifferentiated, Bucatunna ClayMember of Byram Formation, Jackson Group,Claiborne Group, Wilcox Group, Naheola Formation,Porters Creek Formation, Clayton Formation
Selma Group Upper Cretaceous Selma GroupEutaw Formation Upper Cretaceous Eutaw FormationUpper Tuscaloosa/Gordo Upper Cretaceous Gordo Formation or ‘‘upper Tuscaloosa’’Marine Tuscaloosa Upper Cretaceous ‘‘marine Tuscaloosa’’Lower Tuscaloosa/Coker Upper Cretaceous Coker Formation or ‘‘lower Tuscaloosa’’Undifferentiated Cretaceous Upper Cretaceous Lower Cretaceous undifferentiated, also Washita and
Fredricksburg Groups undifferentiatedCotton Valley Group Lower Cretaceous Paluxy Formation, Mooringsport Formation,
Ferry Lake Anhydrite, Rodessa Formation,Silgo Formation, Hosston Formation, Cotton Valley Group
Haynesville Formation Jurassic Cotton Valley Group, Haynesville Formation,Buckner Anhydrite Member, Smackover Formation,Norphlet Formation, Pine Hill anhydrite,Louann Salt, Werner Formation
Eagle Mills Formation Triassic Eagle Mills FormationPottsville Formation Pennsylvanian Pottsville Formation, Parkwood FormationParkwood Formation Mississippian Parkwood Formation, Floyd Shale, Bangor Limestone,
Hartselle Sandstone, Pride Mountain Formation,Tuscumbia Limestone, Fort Payne Chert
Chatanooga Shale Devonian-Silurian Chatanooga Shale, unnamed Devonian carbonate and chert unit,Sliurian undifferentiated, Wayne Group
Ordovician Ordovician Ordovician undifferentiated, Maysville and NashvilleGroups undifferentiated
Knox Group Cambrian-Ordovician Knox Group undifferentiated, Ketona DolomiteConasauga Cambrian Conasauga FormationPre-Conasauga Precambrian basement complex
HWC 2 - 4 PENNY ET AL.: COASTAL PLAIN HYDROLOGY AND MICROBIOLOGY

one hour before sampling. A raw and an acidified samplefrom each well and their replicates were sent to ACTLABSfor major ion and trace element analysis using inductivelycoupled plasma mass spectrometry (ICP-MS). Samples fortrace element and cation analyses were passed througha 0.45 mm filter, acidified with concentrated HNO3,and stored in polyethelene bottles. Temperature, pH, andelectrical conductivity were measured in the field usinghand-held water quality probes. Chloride and alkalinityconcentrations were first measured in the field usingstandard titration methods. Chloride, bromide, and sulfateconcentrations were measured in the laboratory using aDionex 2000 ion chromatography. All samples were filteredprior to analysis using a 0.2 mm nylon filter. Precision ofanion analyses is ±1% for chloride and sulfate, and ±3% forbromide. An AgNO3 solution was added to the samples toprecipitate AgCl for 36Cl analysis. AgCl precipitates werepurified by dissolution in NH4OH and subsequentlyneutralized by HNO3. A Ba(NO3)2 solution was also addedto remove unwanted sulfur as BaSO4. The procedure wasrepeated several times and the purified AgCl was oven-dried. A carrier was added to samples that contained verylow concentrations of chloride. Stable isotopes ratios (d18Oand d2H) were determined using the standard CO2 equilib-rium method. Results are reported in concentration units asper mil deviations from the SMOW standard [Craig, 1961].The precision limits are ±0.2% for d18O and ±2% for d2H.[11] The saturation indices (log Q/K) of carbonate min-
erals in groundwater were calculated using the Geochem-ist’s Workbench [Bethke, 1996; Lee and Bethke, 1996]. TheGeochemist’s Workbench is one of a class of reaction pathmodels that calculate the species distribution in aqueoussolutions and traces chemical evolution of the systemsinvolving fluids, minerals, and gases.
3.2. Microbial DNA Analysis
[12] Bacterial DNA extraction and sequencing wereconducted at Auburn University to identify different micro-
bial populations from selected hydrochemical zones whereabnormal enrichments of Fe2+, Mn2+, and SO4
2� are found.Microorganisms were filtered and their DNA extractedusing an UltraClean Soil DNA Isolation kit (MOBIOlaboratories, Inc.). Total DNA extracted was amplifiedusing the Polymerase Chain Reaction (PCR) method[Madigan et al., 1996]. Both the forward and reverse 16SrDNA universal primers were used for Bacterial andArchaeal domains [Dojka et al., 1998]. The PCR productswere used to create clone libraries in E. coli. Approximately100 clones from each well site were subjected to RestrictionFragment Length Polymorphism (RFLP). RFLP data enableus to estimate the number of strains present and the majorityat each site. The computer program Sequencher (GeneCodes Corporation version 3.0) was used to align rawsequencing data on a G3 Macintosh platform. Sequenceswere compared with all of the available sequences withinthe NCBI (National Center for Biotechnology Information)database for similarity using the BLAST (Basic LocalAlignment Search Tool) network service.
3.3. Numerical Modeling
[13] Salinity distribution in the Tuscaloosa and Eutawaquifers was modeled in two-dimension using a basin-scalegroundwater flow model Basin2 [Bethke et al., 1993; Lee,1997]. The Basin2 model calculates groundwater flowresulting from density variation, sediment compaction,buoyancy, topographic relief, and the transport of heat,dissolved solutes, and noble gases in the basin strata. Thepartial differential equation for groundwater flow in adeforming two-dimensional medium is
fb@P
@t¼ @
@x
kx
m@P
@x
� �þ @
@z
kz
m@P
@z� rg
� �� �� 1
1� fð Þ@f@t
ð1Þ
here kx and kz are permeability (m2), u is viscosity of fluid(kg m�1s�1), P is fluid pressure (kg m�1s�2), g is the
Table 2. Compositions of Selected Ions of Tuscaloosa and Eutaw Groundwatera
Sample Well NameCa,
mg/kgMg,mg/kg
Na,mg/kg
K,mg/kg
SO4,mg/kg
Mn,ug/kg
Fe,ug/kg
Sr,ug/kg pH
Alkalinity,mg/kg
TDS,mg/kg
Tuscaloosa AquiferT1 South Macon 43.5 1.7 9.4 4.3 18.0 3.9 0 195.0 7.55 142 224T2 Union Springs 4 2.4 <0.5 51.4 <1 20.8 0.6 0 25.7 8.90 78 158T3 Union Springs 3 1.0 <0.5 41.2 <1 13.8 0.1 0 7.4 9.04 54 115T4 Layne3 1.4 <0.5 62.8 <1 45.5 0.1 0 11.5 9.06 52 170T5 Smith 1 2.0 <0.5 78.6 <1 73.8 0.3 0 19.0 9.07 62 227T6 Orion <1 <0.5 66.1 <1 6.0 0.1 0 2.4 9.39 108 184T7 Troy 6 <1 <0.5 107.0 <1 19.3 0.5 0 5.2 8.83 166 306T8 Troy 8 <1 <0.5 79.0 <1 4.9 0.9 0 5.6 9.30 135 225
Eutaw AquiferE1 Moundville 1.1 0.7 1.5 2.9 2.3 0.1 0 12.9 5.55 5 15E2 Marion-MMI 27.2 7.3 2.9 4.7 7.3 26.8 346 450.5 7.02 78 131E2A Marion-Plant 15.0 4.5 2.0 3.9 10.1 21.9 388 120.6 6.64 44 78E3 Greensboro-CH 1.8 1.2 1.6 4.5 4.0 0.1 0 16.9 5.62 5 20E4 Greensboro-Big 1.8 1.1 1.7 4.8 4.2 0.3 0 22.1 5.63 9 24E5 Demopolis 5 1.1 <0.5 201.0 1.6 <0.2 7.6 478 97.4 8.66 265 574E6 Demopolis 1 1.2 <0.5 213.0 <1 <0.2 8.8 338 118.6 8.72 279 600E7 Morries 28-8 37300 3150 97320 5850 71750 7100 15000 2120000 5.48 6300 405700E8 Skinner 30-10 35000 3100 96000 6350 82810 2900 10000 2100000 5.72 9800 402000E9 Boney 33-8 2870 780 27360 120 1990 1300 10000 340000 6.41 760 82800E10 Johnson 1870 640 19900 90 980 500 5000 220000 6.72 1200 60090
aCl and Br concentrations are shown in Table 3.
PENNY ET AL.: COASTAL PLAIN HYDROLOGY AND MICROBIOLOGY HWC 2 - 5
acceleration due to gravity (m s�2), b is fluid compressi-bility (m s2 kg�1), f is porosity, and r is fluid density(kg m�3). By equation (1), groundwater flow is driven bypressure compressing and density variation, rather than acombined form of hydraulic potential defined by Hubbert[1940].[14] The Basin2 model also simulates diffusion, disper-
sion, and advection processes responsible for salinitydistribution and solute transport. Basin2 calculates thedistribution and transport of a solute in a groundwatersystem by solving the equation
@
@tCð Þ ¼ @
@xDx
@C
@x
� �þ @
@zDz
@C
@z
� �� qx
@C
@x
� �� qz
@C
@z
� �
ð2Þ
where C is concentration (mol cm�3), q is specific discharge(cm s�1), t is time (s), and D is hydrodynamic dispersion(cm2 s�1), which accounts for molecular diffusion of solutesas well as mechanical dispersion. The model calculates thecoefficients of hydrodynamic dispersion Dx and Dz from thefollowing equations:
Dx ¼ D*þ aLv0x þ aT v
0z ð3Þ
Dz ¼ D*þ aLv0z þ aT v
0x ð4Þ
where D* is the diffusion constant (cm2 s�1), aL and aT arethe dispersivities (cm) in the longitudinal and transversedirections, and v0x and v0z are lateral and vertical fluidflow velocities (cm s�1) in curvilinear coordinates. Theprogram maps an irregular basin cross section into a finitedifference grid. The x0 direction lies along stratigraphic linesand hence curves to follow the dip of the basin strata. The z0
direction is normal to x0, or the stratigraphic lines.According to equations (3) and (4), the effect of dispersionis proportional to the flow velocity. Because the diffusioncoefficient is relatively small (�10�6 cm2 s�1) with respect
to dispersivities [Freeze and Cherry, 1979], the effects ofdispersion usually dominate the solute transport processeseven at modest flow rates (>10�6 cm s�1 or a few metersper year).
4. Groundwater Geochemistry and Microbiology
[15] New and existing data of concentrations or trends ofmajor and trace elements (Tables 2 and 3) were used toassess the fluid sources,mixing ratios, biochemical processes,and water-rock interaction history. Many previous studies[e.g., Lee, 1985; Lovley and Chapelle, 1995] found thatredox potential of groundwater usually decreases along theflow path. The consumption of free oxygen by bacteriallycatalyzed reactions is followed by reduction of NO3
�,reduction of MnO2, and then reduction of ferric oxyhy-droxides. When sufficiently negative redox levels have beenreached, bacterial reduction of SO4
2� to H2S followed byreduction of organic matter to CH4 will occur. In addition,Chapelle and Knobel [1983] and Appelo [1994] demon-strated that diagenetic reactions with carbonate minerals andcation exchange could result in systematic change of cationcomposition of groundwater along flow paths in coastalplain aquifers. The new geochemical data collected werecompared to the theoretical electrochemical and chromato-graphic sequences.
4.1. Major Ions and Trace Elements
[16] Along the western transect, three major hydrochem-ical facies were identified, carbonate groundwater, salinegroundwater associated with evaporites (sodium chloride),and groundwater of meteoric origin (Figure 4). The calciumbicarbonate facies was mostly found in coastal plain aqui-fers where deep groundwaters that migrated along faultsdischarge upward into Cretaceous aquifers (see discussionin section 6). Water samples contain significantly higherproportions of sodium and chloride likely derived fromevaporated seawater (see following sections). Groundwaterswith low major ion concentrations are largely meteoric
Table 3. The 36Cl/Cl, Cl, and Br Concentrations of Groundwaters in the Tuscaloosa and Eutaw Aquifers, Central South
Alabama
Sample Well Name County Distance From Recharge, km Cl, mg/kg Br, mg/kg Cl/Br 36Cl/Cl, � 10�15
Tuscaloosa AquiferT1 South Macon Macon 5 4.55 0.02 256 156T2 Union Springs 4 Bullock 30 5.14 0.03 166 144T3 Union Springs 3 Bullock 32 4.01 0.03 153 134T4 Layne 3 Bullock 40 7.63 0.07 110 119T5 Smith 1 Bullock 40 9.98 0.05 180 113T6 Orion Pike 50 2.83 0.02 174 100T7 Troy 6 Pike 70 12.99 <0.01 – 61T8 Troy 8 Pike 70 4.52 0.05 84 58
Eutaw AquiferE1 Moundville 1 Hale 0 1.44 0.02 97 122E2 Marion-MMI Perry 15 2.32 0.02 104 105E2A Marion-Plant Perry 15 4.22 0.01 340 44E3 Greensboro-CH Hale 20 1.74 0.01 149 95E4 Greensboro-Big Hale 20 1.72 0.09 195 91E5 Demopolis 5 Marengo 50 104.53 0.95 109 8E6 Demopolis 1 Marengo 50 106.35 0.98 108 6E7 Morries 28-8 Choctaw 125 180,000 1,945 92 –E8 Skinner 30-10 Choctaw 125 165,000 1,845 89 –E9 Boney 33-8 Choctaw 125 48,500 242 200 –E10 Johnson Choctaw 125 35,000 185 188 –
HWC 2 - 6 PENNY ET AL.: COASTAL PLAIN HYDROLOGY AND MICROBIOLOGY

water with some influence of the mixing of calciumbicarbonate and sodium chloride type groundwaters. Inaddition to physical mixing, the observed bulk waterchemistry displays influence from cation exchange andmicrobial redox reactions.[17] In western Alabama, significantly higher alkalinity
and pH in the Marion and Demopolis wells (E2, E2A, E5,E6, Table 2) correspond to parallel spikes in Fe, Mn, and Srconcentrations (Figure 5). These correlations suggest thatelevated Fe, Mn, and Sr concentrations may be derived frombacterial iron and manganese reduction similar to thatproposed by Saunders et al. [1997] and Zobrist et al.[2000]:
4FeOOH sð Þ þ CH2Oþ 7Hþ ! 4Fe2þ þ HCO�3 þ 6H2O ð5Þ
where CH2O represents organic matter. This dissimilatoryiron reduction would release metals and raise alkalinity of
groundwater at the expense of H+, organic carbon, and ironoxides. Concentrations of Sr also correlate well withdissolved Fe in the Ganges-Brahmaputra floodplain in theBengal basin [Dowling et al., 2003]. Recent experimentalstudies indicated that Sr can be sorbed to FeOOH solids andbacteria cell surfaces under oxidized conditions [e.g., Smallet al., 1999]. The sorbed Sr is subsequently mobilized whenthe redox conditions become favorable for bacterial ironreduction [Roden et al., 2002; Dowling et al., 2003]. Ehvalues of groundwater from Marion and Demopolis wellsrange from �5 to �50 mV; such slightly reducingconditions are favorable for bacterial iron reduction.Although coastal plain sediments contain abundant ferricoxyhydroxides [Lee and Saunders, 2003] and reduction ofthese solids is expected to generate large amounts of ferrousiron and alkalinity, the millimolar increase of alkalinitywithout concurrent increase in iron is not easily explained.The measured dissolved iron is less than 500 ug/l (0.01 mM)
Figure 4. Piper diagram showing different hydrochemical facies from the Cretaceous aquifers inwestern Alabama, including carbonate groundwater, groundwater associated with evaporites, andmeteoric water affected by the mixing of these two waters. Sample locations are shown in Figure 1.
PENNY ET AL.: COASTAL PLAIN HYDROLOGY AND MICROBIOLOGY HWC 2 - 7

and thus accompanying HCO3� increase would then be
0.0025 mM (0.15 mg/kg). Even when carbon-rich organicmaterials such as sucrose (C12H22O11) are considered,the resulting alkalinity increase would be 0.03 mM(1.83 mg/kg) and significantly smaller than measuredalkalinity (44–279 mg/kg, Table 2). The relatively highalkalinity could also be derived from inorganic sources suchas calcite through dissolution or cation exchange reactionsas suggested by Chapelle and Knoble [1983] and Appelo[1994]:
CaCO3 þ Na2 � Exþ Hþ ! Ca� Exþ 2Naþ þ HCO�3 ð6Þ
where Ex represents exchanging substrates. Downgradientfrom the recharge area, a sequence of Ca2+, Mg2+, K+, andNa+ dominated water along the western flow path (Figure 6)indicates that cation exchange could control the bulk water
chemistry. In general, cations with small hydrated radii andhigher charge tend to have higher affinity for exchange. Theobserved sequential peaks of cations are generally consis-tent with the order of cations competing for exchange sites:Ca2+ > Mg2+ > K+ > Na+. The sequences of Mg and Ca arenot so widely separated (Figure 6) probably because bothhave two positive charges and are so similar in size. Thecation exchange reaction (6) would produce a NaHCO3 typewater with high Na/Cl molar ratios (Tables 2 and 3).[18] Groundwater samples collected along the eastern
transect all have low TDS, <300 mg/kg (Tables 2 and 3),probably due to the lack of influence of buried evaporitebeds that are present only in western Alabama [e.g., Brobstet al., 1973; Keller, 2000]. High pH and alkalinity, as wellas high Na contents without concurrent increase in Cl(Tables 2 and 3), again, indicate that the bulk waterchemistry is highly influenced by cation exchange. Ground-water along the eastern transect is also influenced bybiologically catalyzed reactions. High sulfate concentrationalong the aerobic portion of flow path near southern MaconCounty (wells T1–T5, Table 2) cannot be explained byremnant seawater because the SO4/Cl molar ratios ofgroundwater (ranging from 1.27–2.73) are much higherthan those of seawater (0.05). Sulfur oxidation andmicrobial nitrate reduction (denitrification) may be partlyresponsible for elevated sulfate contents. The amounts of O2
dissolved in infiltrating water (about 5–6 mg/kg or 0.2 mM)can dissolve about 0.1 mM of pyrite or produce about10 mg/kg of sulfate. This amount is close to those observedin wells T1, T2 and T3 but lower than elevated sulfateconcentrations (up to 74 mg/kg) in wells T4 and T5, whichare not easily explained. Alternatively, sulfate ions couldbe derived from surrounding confining layers by diffusionprocesses [Hendry and Schwartz, 1988]. The presence ofchemolithotrophic bacteria Thiobacillus in the shallowMacon well T1 (see section 4.5) supports that bacterialoxidation of reduced sulfur might be an important source of
Figure 5. (a) Alkalinity and pH (Table 2) of groundwatersamples at various distances from recharge along thetransect (Figure 1) in western Alabama. (b) Fe, Mn, andSr concentrations (Table 2) along the same transect.
Figure 6. Concentrations of dissolved Ca, Mg, K, and Nain the Eutaw aquifer as function of distance along a flowpath in western Alabama.
HWC 2 - 8 PENNY ET AL.: COASTAL PLAIN HYDROLOGY AND MICROBIOLOGY

sulfate in the groundwater. These sulfur-oxidizing bacteriacan derive their energy and grow chemolithotrophically onreduced sulfur compounds [Madigan et al., 1996]. Inaddition, the presence of denitrifying bacteria in the water(see section 4.5) suggests that some sulfate may be derivedfrom the following biochemical reaction:
14 NO�3 þ 5 FeS2 þ 4 Hþ ! 7 N2 þ 10 SO2�
4 þ 5 Fe2þ
þ 2 H2O ð7Þ
In this reaction denitrifying bacteria use reduced sulfurcompounds (such as pyrite) as electron donors to transformnitrate. Because there are no significant mineralogicalnitrate sources, bacterial denitrification cannot be the majorprocess for generating elevated sulfate contents unlessorganic nitrate matter or anthropogenic sources such assewage or agrochemicals are present. Further downdip tothe south, the dramatic decrease of SO4
2� and an increase inthe ‘‘rotten egg’’ smell of H2S in groundwater from southMacon to Troy (Table 2) indicates the bacteria reduction ofsulfate in the deeper aquifer.[19] We calculated the distribution of aqueous species in
fluids and their saturation indices (S.I.) with respect tocarbonate minerals at measured temperatures (Table 4).Most relatively shallow groundwaters in the Tuscaloosaaquifer (T1–T5) are slightly undersaturated or near equi-librium (S.I. ranges from �0.30 to 0.03) with respect tocalcite. The deeper groundwater (T6–T8) near Troy aremore undersaturated because dissolved Ca2+ is almostcompletely removed from aqueous solution by cationexchange reactions. Moundville water (E1) in the Eutawaquifer is probably relatively recent meteoric water (pH =5.55) that has had no significant contact with carbonateminerals; it is much more undersaturated with respect tocarbonate minerals than other wells. The saturation states ofcalcite fluctuate along the Eutaw flow path (Table 4),
reflecting various levels of alkalinity or Ca2+ concentrationsinfluenced by cation exchange or microbial processes (i.e.,equations 5 and 6). It should be noted that Fe-rich ground-waters in Demopolis and Marion are actually saturated withsiderite (FeCO3) and strontianite (SrCO3), suggesting thatreduced metal species also combine with HCO3
� releasedfrom cation exchange or organic sources (equation (3)) toform carbonate minerals. Saline groundwaters in the Choc-taw County originated from evaporated seawater (seesections 4.2 and 4.4) are supersaturated with most carbonateminerals.
4.2. Cl//Br Ratios
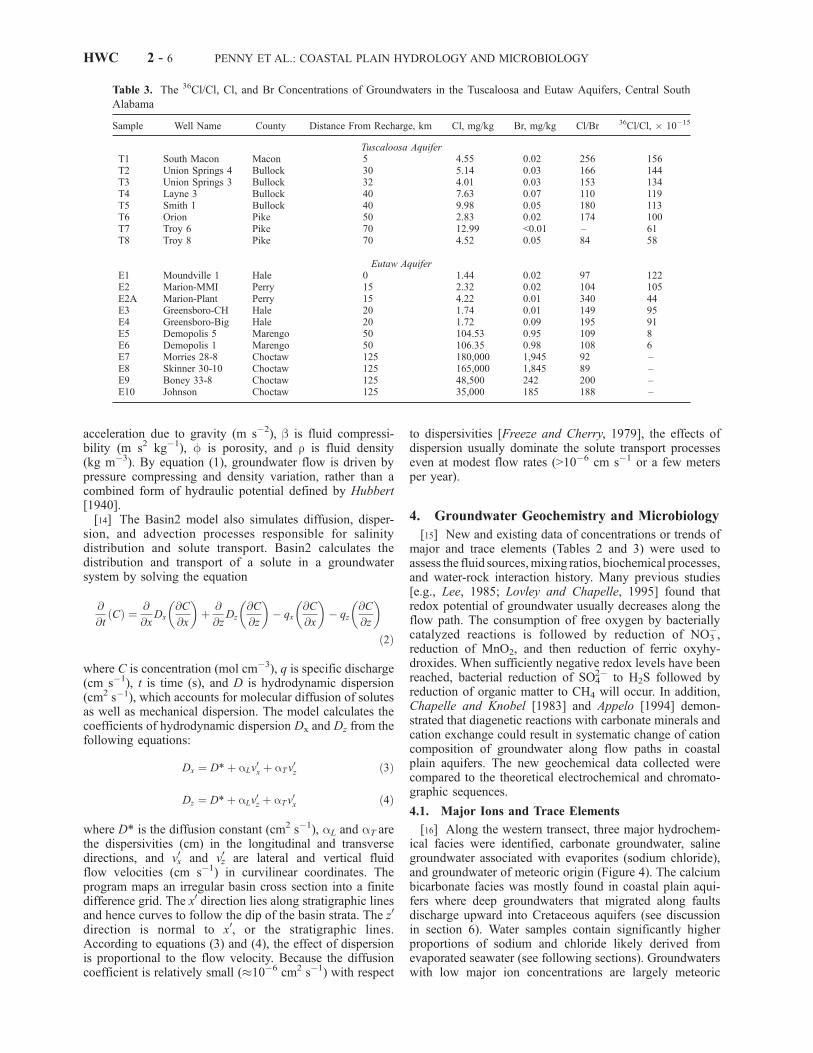
[20] Cl/Br ratios (Table 3) were used to determine thesource of salinity in groundwater of the Eutaw aquifer inwestern-central Alabama. Different Cl/Br ratios have beenobserved in various natural waters [Davis et al., 1998]including atmospheric precipitation (50–150), seawaterand evaporated seawater (�290), and deep basin brineaffected by congruent halite dissolution (>1000). The Cl/Brratios of Eutaw aquifer samples range from 100 to 250,indicating that the groundwater has been influenced mostlyby fresh water incursion and seawater evaporation, ratherthan congruent halite dissolution.[21] The Cl/Br ratios of Eutaw groundwater (Figure 7)
show a close correspondence with the seawater dilution andevaporation trajectory [Carpenter, 1978]. The origin andprocesses affecting salinity can be determined by the Cl/Brrelationship to this trajectory (Figure 7). Cl/Br ratios remainconstant during seawater evaporation until halite saturationis achieved, at which point Br is concentrated in theremaining solution, while Cl is removed by halite precipi-tation [Connolly et al., 1990]. As a result, the Cl/Br ratio ofthe remaining brine decreases progressively during haliteprecipitation. Saline groundwaters derived from remnantevaporated brines beyond halite saturation generally exhibitCl/Br ratios lower than seawater (i.e., to the right of the
Table 4. Temperatures and Calculated Saturation Indices of Carbonate Minerals in Tuscaloosa and Eutaw
Groundwaters Along the Flow Transect in Western Alabama
Sample Well Name Distance From Recharge, km Temperature, �C
Saturation Indices
Calcite Dolomite Strontianite Siderite
Tuscaloosa AquiferT1 South Macon 5 22.50 0.03 �0.23 0.17 �4.84T2 Union Springs 4 30 25.78 0.02 �1.20 0.51 �1.63T3 Union Springs 3 32 26.28 �0.30 �1.46 0.02 �1.58T4 Layne 3 40 26.78 �0.13 �1.24 0.24 �3.55T5 Smith 1 40 27.22 0.03 �1.08 0.45 �3.54T6 Orion 50 34.00 �1.76 �2.29 0.02 �3.05T7 Troy 6 70 31.50 �2.08 �2.97 0.04 �3.32T8 Troy 8 70 34.28 �1.76 �2.28 0.39 �3.04
Eutaw AquiferE1 Moundville 1 0 20.11 �4.61 �8.30 �4.03 �7.90E2 Marion-MMI 15 20.50 �0.77 �1.01 �0.03 �0.09E2A Marion Plant 15 21.11 �1.68 �2.77 �1.26 �1.49E3 Greensboro-CH 20 22.11 �4.13 �7.34 �3.67 �7.62E4 Greensboro-Big 20 21.78 �4.15 �7.42 �3.57 �7.64E5 Demopolis 5 50 26.61 �0.11 �1.09 1.30 1.24E6 Demopolis 1 50 24.78 �0.06 �1.02 1.45 1.09E7 Morries 28-8 125 37.25 0.41 1.26 1.83 �1.32E8 Skinner 30-10 125 37.10 0.95 2.35 2.35 �0.90E9 Boney 33-8 125 36.50 0.27 1.44 1.86 �0.38E10 Johnson 125 36.12 0.76 2.49 2.30 �0.02
PENNY ET AL.: COASTAL PLAIN HYDROLOGY AND MICROBIOLOGY HWC 2 - 9
seawater evaporation trajectory) while congruent halitedissolution can produce groundwater with higher Cl/Brratios (i.e., to the left of the seawater evaporation trajectory).The four brine samples from Choctaw County (E7–E10,Table 3) that are considerably more saline than seawater plotslightly to the right of the trajectory (Figure 7), indicatingthat they acquired salinity from remnant evaporite brines,rather than congruent dissolution of evaporite minerals.Dissolution of Louann Salt is therefore unlikely as a salinitysource in the coastal plain aquifers since no Cl/Br ratiosplotted above or to the left of the trajectory. The Cl/Br ratiosof brine samples indicate that the salinity could be derivedfrom seawater that has been evaporated beyond halitesaturation and later diluted by subsequent meteoric waterincursion. The Eutaw samples that are considerably moredilute than seawater have Cl/Br ratios lower than seawater,reflecting their meteoric origin. These samples fall slightlyto the right or close to the conservative dilution line forseawater and meteoric water.
4.3. Radioactive Isotopes (36Cl and 3H)
[22] Radioactive isotopes data provide quantitative infor-mation on the age of groundwater (age between modern andseveral million years) and may be used to characterizecurrent flow directions and velocities. Chlorine 36, with ahalf-life of about 300,000 years, can be used to date oldergroundwater [Davis and Bentley, 1982; Bentley et al.,1986]. 36Cl is formed naturally in the atmosphere by thebombardment of 40Ar by cosmic-rays. Anthropogenic 36Cl,however, has also been released into the atmosphere fromnuclear explosions after 1952. All samples analyzed in thisstudy have less than approximately 2 tritium units (TU),indicating that groundwater contains negligible anthropo-
genic 36Cl. The 36Cl method is most useful for datinggroundwater that is significantly older (beyond the detectionlimit for 14C) than that which can be dated with 14C.[23] 36Cl/Cl ratios of groundwater in the Tuscaloosa and
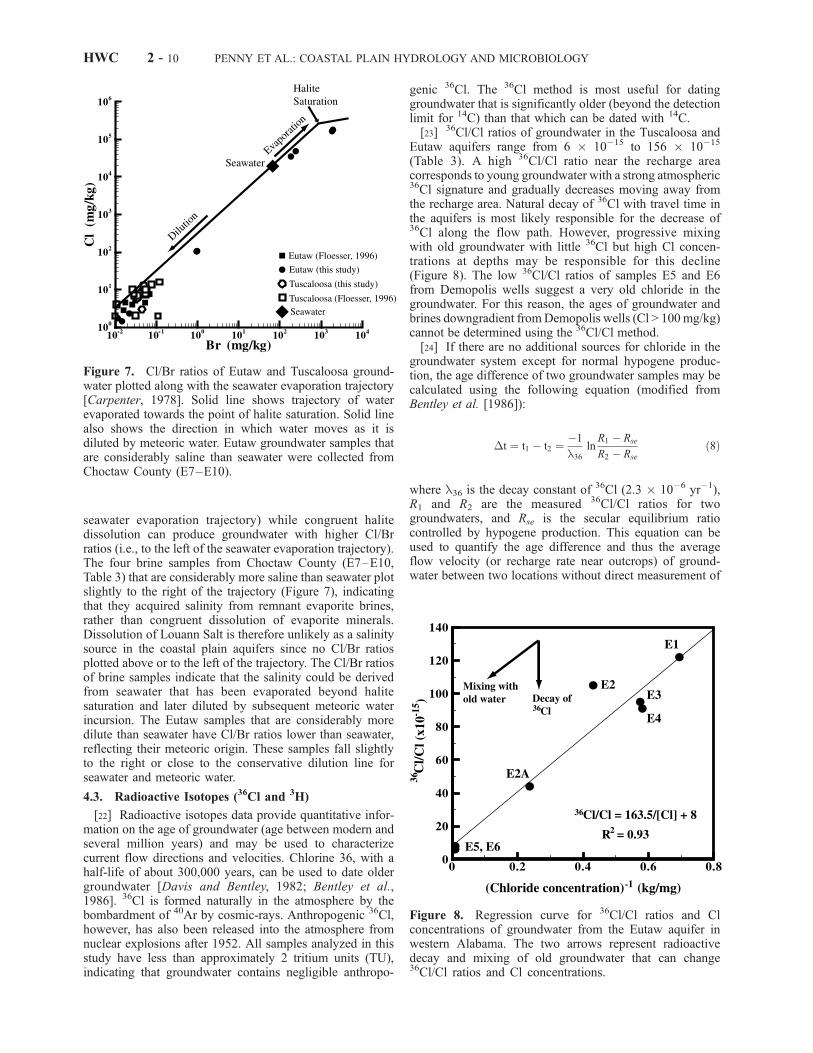
Eutaw aquifers range from 6 � 10�15 to 156 � 10�15
(Table 3). A high 36Cl/Cl ratio near the recharge areacorresponds to young groundwater with a strong atmospheric36Cl signature and gradually decreases moving away fromthe recharge area. Natural decay of 36Cl with travel time inthe aquifers is most likely responsible for the decrease of36Cl along the flow path. However, progressive mixingwith old groundwater with little 36Cl but high Cl concen-trations at depths may be responsible for this decline(Figure 8). The low 36Cl/Cl ratios of samples E5 and E6from Demopolis wells suggest a very old chloride in thegroundwater. For this reason, the ages of groundwater andbrines downgradient fromDemopolis wells (Cl > 100mg/kg)cannot be determined using the 36Cl/Cl method.[24] If there are no additional sources for chloride in the
groundwater system except for normal hypogene produc-tion, the age difference of two groundwater samples may becalculated using the following equation (modified fromBentley et al. [1986]):
�t ¼ t1 � t2 ¼ �1
l36
lnR1 � Rse
R2 � Rse
ð8Þ
where l36 is the decay constant of 36Cl (2.3 � 10�6 yr�1),R1 and R2 are the measured 36Cl/Cl ratios for twogroundwaters, and Rse is the secular equilibrium ratiocontrolled by hypogene production. This equation can beused to quantify the age difference and thus the averageflow velocity (or recharge rate near outcrops) of ground-water between two locations without direct measurement of
Figure 7. Cl/Br ratios of Eutaw and Tuscaloosa ground-water plotted along with the seawater evaporation trajectory[Carpenter, 1978]. Solid line shows trajectory of waterevaporated towards the point of halite saturation. Solid linealso shows the direction in which water moves as it isdiluted by meteoric water. Eutaw groundwater samples thatare considerably saline than seawater were collected fromChoctaw County (E7–E10).
Figure 8. Regression curve for 36Cl/Cl ratios and Clconcentrations of groundwater from the Eutaw aquifer inwestern Alabama. The two arrows represent radioactivedecay and mixing of old groundwater that can change36Cl/Cl ratios and Cl concentrations.
HWC 2 - 10 PENNY ET AL.: COASTAL PLAIN HYDROLOGY AND MICROBIOLOGY

36Cl/Cl ratios of an atmospheric recharge source. Using theparameters Rse = 5.7 � 10�15 from Bentley et al. [1986],the 36Cl age difference of groundwater between Moundville(well E1) and Greensboro (well E4) is about 110,000 years.Given a flow path of 20 km, groundwater migrates at a rateof about 0.2 m/yr between these two wells in the Eutawaquifer. The 36Cl age difference of groundwater in SouthMacon (well T1) and Troy (well T8) is about 459,000 years.Thus groundwater travels at a rate of about 0.15 m/yr in theTuscaloosa aquifer, close to the flow velocity in the Eutawaquifer. It should be noted that the use of 36Cl/Cl ingroundwater dating must be viewed with caution because ofuncertainty issues associated with groundwater mixing andcarbonate diagenesis.
4.4. Stable Isotopes (DD//D18O)
[25] dD and d18O values (Table 5) are used to determinethe source of groundwater and its geochemical evolution inthe coastal plain aquifers. Figure 9 shows dD and d18Oratios of groundwater relative to the seawater evaporationtrajectory [Holser, 1979], the local meteoric water line, andthe standard mean ocean water (SMOW). The local mete-oric water line was constructed using rainwater data col-lected in this study (Table 5) as well as data from Cook[1997]. During evaporation, remnant seawater becomesprogressively enriched in 18O and 2H relative to SMOW,as the light isotopes (16O and 1H) are preferentially con-centrated in the vapor phase. However, with further evap-oration beyond gypsum precipitation (4X) and toward halitesaturation (�10X), the residual brine becomes depleted in18O and 2H due to mineral precipitation and isotopicfractionation. This hook-back trajectory explains why somebasin brines could have lower dD and d18O values withrespect to SMOW [Stueber and Walter, 1991]. Isotope ratiosof Eutaw brines from Choctaw County (E7–E10, circles in
Figure 9) fall along the mixing trends between the localmeteoric water and evaporated seawater (Figure 9). ThedD-d18O trend of brines intersects the evaporation trajectoryat a point close to halite saturation (�10X), which isconsistent with the extent of seawater evaporation inferredfrom Cl-Br relations (Figure 7). Shallow Eutaw samples(circles in Figure 9) fall close to the local meteoric water line,indicating their common association with an atmosphericrecharge source.[26] Both dD-d18O and Cl-Br trends clearly indicate the
mixing of remnant evaporated seawater (close to halitesaturation) with meteoric water. Groundwater samples(9268-C, 6834-C, RR-31, B-20, L-6) of Cook [1997] col-lected to the north of the southern outcrop limit (Figure 1)display distinctively different dD and d18O values withrespect to groundwater collected to the south. The ground-water likely originated from older Paleozoic carbonate rocksin the Alabama Valley and Ridge (Figure 2). The differentisotope signatures may be attributed to different climateconditions at the time of recharge or through exchange ofisotopes resulting from carbonate diagenesis. dD and d18Ovalues of these samples, again, indicate three possiblesources of groundwater. These include meteoric water,evaporated seawater (close to halite saturation), and ground-water from Ordovician/Devonian carbonate rocks.
4.5. Microorganisms
[27] Bacteria in SO42�, Fe2+ and Mn2+ rich groundwater
samples were filtered and identified using DNA sequencing
Table 5. The dD and d18O Values of Groundwater in the
Cretaceous Aquifers, Central South Alabama
Sample County Aquifer dD, % d18O, %
T1 Macon Tuscaloosa �24 �4.7T2 Bullock Tuscaloosa �22 �4.7T3 Bullock Tuscaloosa �22 �4.7T4 Bullock Tuscaloosa �22.5 �4.8T5 Bullock Tuscaloosa �24 �4.7T6 Pike Tuscaloosa �24 �4.8T7 Pike Tuscaloosa �25 �4.8T8 Pike Tuscaloosa �26 �4.99245-Ca Tuscaloosa Pottsville �25 �4.46834-Ca Tuscaloosa Pottsville �31 �3.7RR-31a Tuscaloosa Coker �33 �4.9B-20a Hale Coker �25 �4.9L-6a Hale Lower Cretaceous �32 �5.1E0 Hale Eutaw �24 �5.0E2 Perry Eutaw �21.5 �4.3E6 Marengo Eutaw �24.5 �4.9E7 Choctaw Eutaw �15 �2.3E8 Choctaw Eutaw �10 2.9E9 Choctaw Eutaw �19 �3.1E10 Choctaw Eutaw �9 3.0M1b Lee meteoric water �93 �13M2b Lee meteoric water �37 �6.8M3b Lee meteoric water �16 �0.7
aData from Cook [1997].bLocal meteoric water collected in Lee country, Alabama in January
(M1), August (M2), and November (M3) during 2001.
Figure 9. The dD and d18O ratios of Eutaw andTuscaloosa groundwater plotted along with the seawaterevaporation trajectory [Holser, 1979] and the local meteoricwater line [Cook, 1997]. Shallow groundwater samples(solid squares, wells T1–T8, E1–E6) have isotopiccompositions resembling that of local meteoric water.Isotope ratios of brines (solid circles, wells E7–E10)indicate that they were generated from mixing of evaporatedseawater (10X, near halite saturation) with surface meteoricwater. The isotopic compositions of water samples areshown in Table 5.
PENNY ET AL.: COASTAL PLAIN HYDROLOGY AND MICROBIOLOGY HWC 2 - 11
methods. Four different genera of bacteria, includingBurkholderia, Bacillus, Pseudomonas, and Thiobacillus,were found in sulfate-rich water T1. Burkholderia, Bacillus,and Pseudomonas are major denitrifying bacteria [Miller etal., 2002] and Thiobacillus can feed exclusively on iron andare capable of Fe2+ and Mn2+ oxidation [Ariza, 1998;Bargar et al., 2000; Malhotra et al., 2002]. Thiobacillusalso utilizes the oxidation of inorganic sulfur sources togrow [Madigan et al., 1996]. Thiobacillus is abundant innatural acid mine drainages such as the red Rio Tinto inSpain; some investigators believe that the low pH andelevated concentrations of metals in these extreme environ-ments are produced by Thiobacillus [Ariza, 1998]. Thepresence of Burkholderia, Bacillus, Pseudomonas, andThiobacillus suggests that bacteria sulfur oxidation anddenitrification may be partly responsible for high sulfateconcentrations in these groundwaters.[28] Pseudomonas was found in Fe2+ and Mn2+ rich
Eutaw groundwaters from Demopolis and Marion citywells. Both cities have to maintain expensive water treat-ment facilities to treat high-iron water. Previous pure batchculturing experiments have shown that Pseudomonas canutilize Fe(III) as terminal electron acceptors to grow in theabsence of molecular oxygen [Arnold et al., 1986]. TypicalFe(III) reducing bacteria include both strictly anaerobic(such as Geobacter) and facultative microbes (such asPseudomonas) that survive in the presence of minor amountof oxygen [Ehrlich, 2002]. Most Fe-reducing microorga-nisms require sources of ferric iron and carbon to grow andmetabolize. Fe (III) hydroxides (common in the coastalplain aquifer sediments) such as goethite, hematite, andferrihydrite can be used as a ferric iron source for theseorganisms. Further work is needed to characterize the roleof Pseudomonas in iron reduction and how various types ofFe(III) reducing bacteria [Lovley et al., 1990; Holmen et al.,1999] such as Geobacter may impact biogeochemicalprocesses in the subsurface.
5. Basin Hydrology and SoluteTransport Modeling
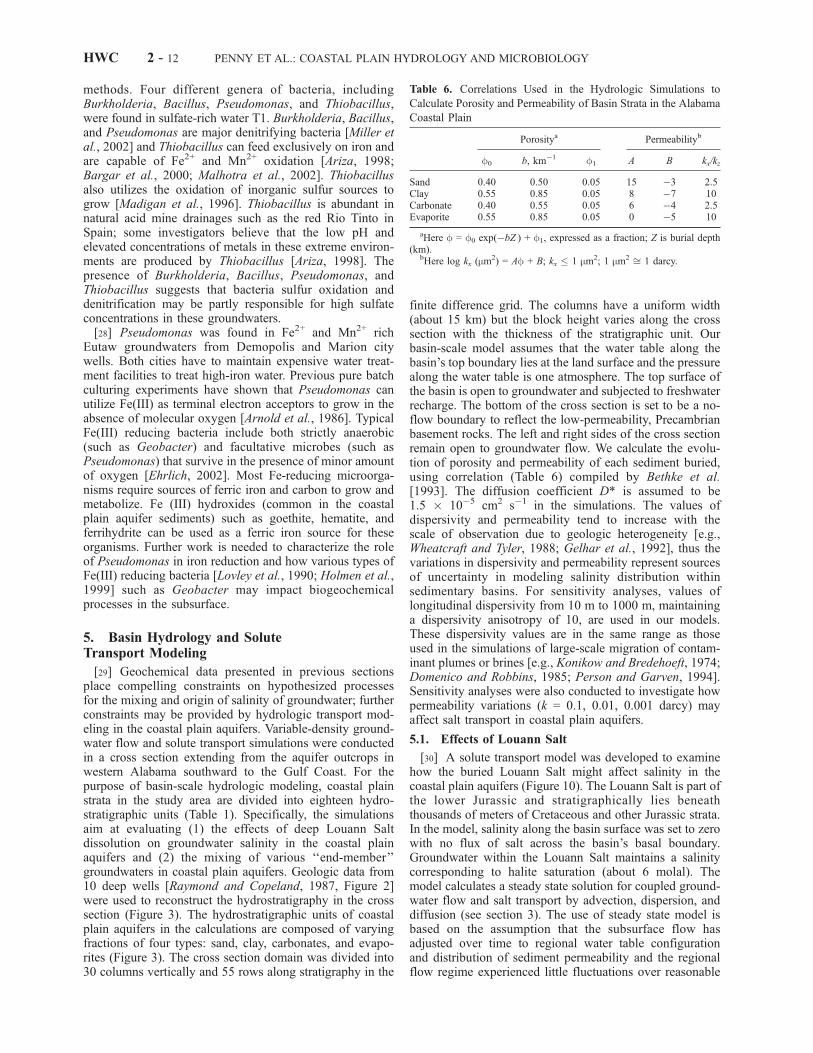
[29] Geochemical data presented in previous sectionsplace compelling constraints on hypothesized processesfor the mixing and origin of salinity of groundwater; furtherconstraints may be provided by hydrologic transport mod-eling in the coastal plain aquifers. Variable-density ground-water flow and solute transport simulations were conductedin a cross section extending from the aquifer outcrops inwestern Alabama southward to the Gulf Coast. For thepurpose of basin-scale hydrologic modeling, coastal plainstrata in the study area are divided into eighteen hydro-stratigraphic units (Table 1). Specifically, the simulationsaim at evaluating (1) the effects of deep Louann Saltdissolution on groundwater salinity in the coastal plainaquifers and (2) the mixing of various ‘‘end-member’’groundwaters in coastal plain aquifers. Geologic data from10 deep wells [Raymond and Copeland, 1987, Figure 2]were used to reconstruct the hydrostratigraphy in the crosssection (Figure 3). The hydrostratigraphic units of coastalplain aquifers in the calculations are composed of varyingfractions of four types: sand, clay, carbonates, and evapo-rites (Figure 3). The cross section domain was divided into30 columns vertically and 55 rows along stratigraphy in the
finite difference grid. The columns have a uniform width(about 15 km) but the block height varies along the crosssection with the thickness of the stratigraphic unit. Ourbasin-scale model assumes that the water table along thebasin’s top boundary lies at the land surface and the pressurealong the water table is one atmosphere. The top surface ofthe basin is open to groundwater and subjected to freshwaterrecharge. The bottom of the cross section is set to be a no-flow boundary to reflect the low-permeability, Precambrianbasement rocks. The left and right sides of the cross sectionremain open to groundwater flow. We calculate the evolu-tion of porosity and permeability of each sediment buried,using correlation (Table 6) compiled by Bethke et al.[1993]. The diffusion coefficient D* is assumed to be1.5 � 10�5 cm2 s�1 in the simulations. The values ofdispersivity and permeability tend to increase with thescale of observation due to geologic heterogeneity [e.g.,Wheatcraft and Tyler, 1988; Gelhar et al., 1992], thus thevariations in dispersivity and permeability represent sourcesof uncertainty in modeling salinity distribution withinsedimentary basins. For sensitivity analyses, values oflongitudinal dispersivity from 10 m to 1000 m, maintaininga dispersivity anisotropy of 10, are used in our models.These dispersivity values are in the same range as thoseused in the simulations of large-scale migration of contam-inant plumes or brines [e.g., Konikow and Bredehoeft, 1974;Domenico and Robbins, 1985; Person and Garven, 1994].Sensitivity analyses were also conducted to investigate howpermeability variations (k = 0.1, 0.01, 0.001 darcy) mayaffect salt transport in coastal plain aquifers.
5.1. Effects of Louann Salt
[30] A solute transport model was developed to examinehow the buried Louann Salt might affect salinity in thecoastal plain aquifers (Figure 10). The Louann Salt is part ofthe lower Jurassic and stratigraphically lies beneaththousands of meters of Cretaceous and other Jurassic strata.In the model, salinity along the basin surface was set to zerowith no flux of salt across the basin’s basal boundary.Groundwater within the Louann Salt maintains a salinitycorresponding to halite saturation (about 6 molal). Themodel calculates a steady state solution for coupled ground-water flow and salt transport by advection, dispersion, anddiffusion (see section 3). The use of steady state model isbased on the assumption that the subsurface flow hasadjusted over time to regional water table configurationand distribution of sediment permeability and the regionalflow regime experienced little fluctuations over reasonable
Table 6. Correlations Used in the Hydrologic Simulations to
Calculate Porosity and Permeability of Basin Strata in the Alabama
Coastal Plain
Porositya Permeabilityb
f0 b, km�1 f1 A B kx/kz
Sand 0.40 0.50 0.05 15 �3 2.5Clay 0.55 0.85 0.05 8 �7 10Carbonate 0.40 0.55 0.05 6 �4 2.5Evaporite 0.55 0.85 0.05 0 �5 10
aHere f = f0 exp(�bZ ) + f1, expressed as a fraction; Z is burial depth(km).
bHere log kx (mm2) = Af + B; kx � 1 mm2; 1 mm2 ffi 1 darcy.
HWC 2 - 12 PENNY ET AL.: COASTAL PLAIN HYDROLOGY AND MICROBIOLOGY

geologic time. The initial conditions were a hydrostaticdistribution for pressure and a vertical diffusive gradientfor salinity. In the simulations, the model proceeded torepeatedly solve the flow and mass transport equationsuntil changes in pressure and concentration are withinsmall tolerances for pressure (10�4 bar) and for salinity(10�4 molal). It usually took more than 300 iterations forour solute transport simulations to reach a convergence. Theunder-relaxation technique was used to limit the oscillationsof variables over an iteration. We used a small under-relaxation parameter of 0.1 to reduce the correction madeat each iteration, which avoid large oscillations and improvethe overall convergence.[31] Figure 10 shows the calculated steady state flow
regime and the distribution of salinity in the cross section.The topographic relief across the basin surface provides thehead for the regional flow regime and downward rechargeof freshwater. The maximum flow velocity predicted by thismodel is on the order of 1.5 m/yr near the vicinity ofoutcrops. The calculated velocity decreases rapidly down-stream from Moundville to less than a few tenths ofmeter per year. The decreasing flow velocities are consistentwith field data that hydraulic gradients and hydraulicconductivity decrease rapidly down the dip of the Eutawformation [Cook, 1993]. The calculated velocities down-gradient from Moundville are within the same order ofmagnitude compared to those estimated by 36Cl method, asdiscussed earlier.
[32] The results show that the Louann Salt can signifi-cantly increase groundwater salinity in the overlying coastalplain aquifers by density-driven advection and hydrody-namic dispersion (Figure 10). The large salinity variationcreates a density flow, which carries salt toward therecharge area. Dispersion moves salt upward into theshallow strata where it is caught up in the southward flowof meteoric water. Thus the salt can advance and disperselaterally or vertically and result in an increase in fluidsalinity upstream from the halite beds. When groundwaterdensity varies along a stratigraphy direction l, the specificdischarge q (cm s�1) between two points in the formation isgiven by
ql ¼ � kl
m@P
@l� rg
@z
@l
� �ð9Þ
Equation (9) implies that fluid flow must take place anytime(ql 6¼ 0) if a lateral density gradient exists alongstratigraphy. Deming [2002] indicated that the headdifference �h between two points along a stratigraphy linemay be calculated as
�h ¼ P1 � P2
rag¼ r1z1 � r2z2
rað10Þ
where r1 and r2 are the average fluid density above points 1and 2, respectively, and ra = (r1 + r2)/2. If we assume a
Figure 10. Solute transport model shows how the buried Louann Salt affects groundwater flow andsalinity distribution in the Alabama coastal plain. Arrows are direction-only flow vectors. Large arrowshighlight the flow directions in the Eutaw aquifer along the stratigraphy. Geologic well logs are marked byopen triangles. The predicted flow pattern shows the mixing of meteoric water, carbonate groundwater,and saline brine associated with the Louann Salt. See color version of this figure in the HTML.
PENNY ET AL.: COASTAL PLAIN HYDROLOGY AND MICROBIOLOGY HWC 2 - 13
depth of 5000 m (z1 = z2 = 5000 m), r1 = 1100 kg m�3, andr2 = 1000 kg m�3, the result �h between two points isabout 475 m. Groundwater would migrate from point 1 topoint 2 in response to this lateral density gradient.Moreover, the average flow velocity between these twopoints is
v ¼ � kragmf
�h
�lð11Þ
If we further assume a typical formation permeability k of10�15 m2, fluid viscosity m of 10�3 kg m�1s�1, a porosity fof 0.1, and a lateral migration distance �l of 10 km, theflow velocity v driven by density variation is about 0.15 mper year. It would take about 66 k.y. for the denser fluid atpoint 1 to replace fluids at point 2. Specifying moreconcentrated brines and more permeable basin strata wouldincrease the flow velocity and solute transport. Although themagnitude of density-driven flow is relatively small incomparison to those of topographic-driven flow (usually onthe order of meters or tens of meters per year), thecumulative effects of slow solute transport processes couldsignificantly raise groundwater salinity over geologic time.Our modeling result (Figure 10) suggests that the LouannSalt could create large variations in fluid salinity, which inturn leads to density-driven fluid flow and upstream salttransport in the Alabama coastal plain. Ranganathan andHanor [1987] studied the effects of a buried halite layeron the salinity distribution in sedimentary basins. Theirresults also show that upward advection and dispersionof salt could form very salty pore waters in overlyingstrata.[33] On the basis of Cl/Br and stable isotope signatures
(Figures 7 and 9), salinity of the Eutaw groundwater couldbe derived from seawater that has been evaporated beyondhalite saturation. However, the salinity could not be deriveddirectly from congruent halite dissolution, which wouldproduce much higher Cl/Br ratios (>1000) than thoseobserved in the field (50–200). The elevated salinity ingroundwater more likely comes from the deep buried brinesreaching halite saturation, in close association with theLouann Salt. Our field data (Table 3) show that groundwatersalinity quickly increases and exceeds that of seawater atdistances >100 km to the south of the recharge zone (i.e.,downdip from the Choctaw County). The low Cl/Br ratiosand elevated salinity imply that the extent to whichfreshwater can infiltrate downdip toward the deep Louannsalt is quite limited. The deep freshwater incursion islimited by the flat hydraulic potentials [Miller, 1990; Cook,1993] and the presence of dense brines in southernAlabama coastal plain. The upstream migration of densebrines (Figure 10) could also counter-act the downdipfreshwater incursion.[34] A series of three simulations illustrate the effects of
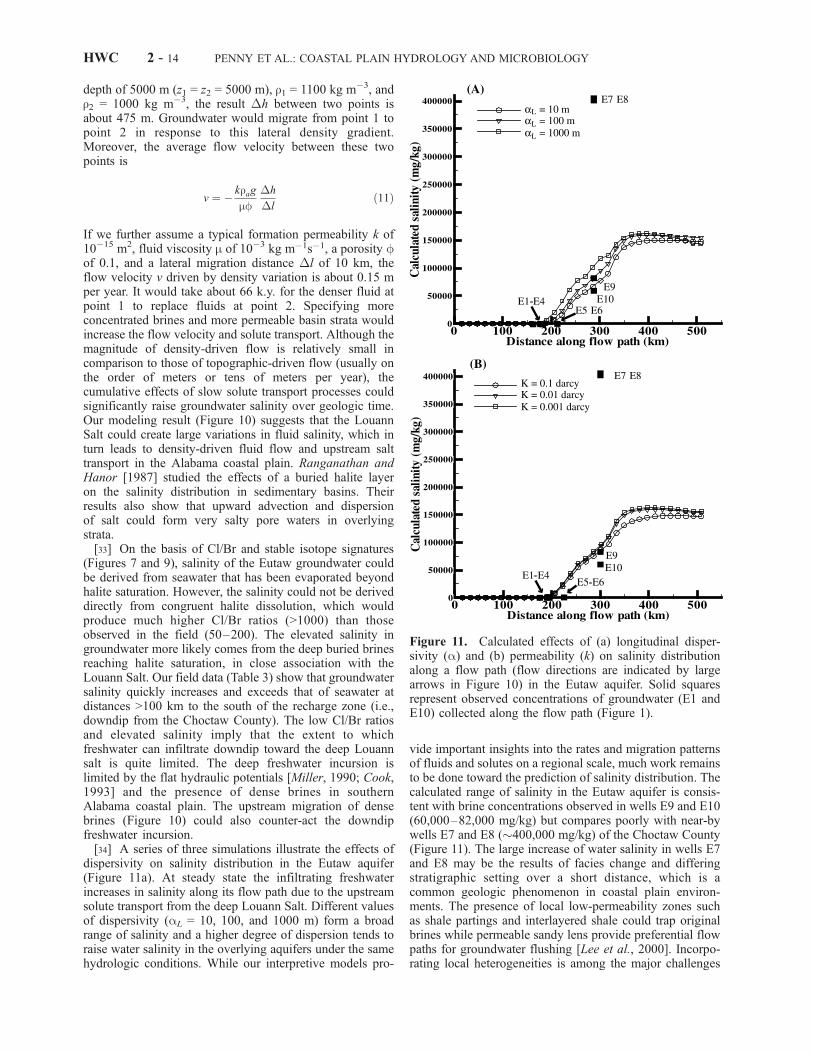
dispersivity on salinity distribution in the Eutaw aquifer(Figure 11a). At steady state the infiltrating freshwaterincreases in salinity along its flow path due to the upstreamsolute transport from the deep Louann Salt. Different valuesof dispersivity (aL = 10, 100, and 1000 m) form a broadrange of salinity and a higher degree of dispersion tends toraise water salinity in the overlying aquifers under the samehydrologic conditions. While our interpretive models pro-
vide important insights into the rates and migration patternsof fluids and solutes on a regional scale, much work remainsto be done toward the prediction of salinity distribution. Thecalculated range of salinity in the Eutaw aquifer is consis-tent with brine concentrations observed in wells E9 and E10(60,000–82,000 mg/kg) but compares poorly with near-bywells E7 and E8 (�400,000 mg/kg) of the Choctaw County(Figure 11). The large increase of water salinity in wells E7and E8 may be the results of facies change and differingstratigraphic setting over a short distance, which is acommon geologic phenomenon in coastal plain environ-ments. The presence of local low-permeability zones suchas shale partings and interlayered shale could trap originalbrines while permeable sandy lens provide preferential flowpaths for groundwater flushing [Lee et al., 2000]. Incorpo-rating local heterogeneities is among the major challenges
Figure 11. Calculated effects of (a) longitudinal disper-sivity (a) and (b) permeability (k) on salinity distributionalong a flow path (flow directions are indicated by largearrows in Figure 10) in the Eutaw aquifer. Solid squaresrepresent observed concentrations of groundwater (E1 andE10) collected along the flow path (Figure 1).
HWC 2 - 14 PENNY ET AL.: COASTAL PLAIN HYDROLOGY AND MICROBIOLOGY
and uncertainties in basin hydrologic modeling since thelocal behavior may deviate significantly from averageproperties of the same basin strata on the regional scale ofinterest.[35] Our sensitivity analyses also explored how variations
in sediment permeability may affect solute transport in theEutaw aquifer. In three sets of numerical experiments, theEutaw aquifer had constant permeability values of 0.1, 0.01,and 0.001 darcy (1 darcy = 10�8 cm2), respectively. Thedispersivity aL and aTwere held constant as 100 m and 10 min these simulations. A reduction in permeability wouldreduce both the extent of freshwater incursion and upstreamsolute dispersion by lowering the groundwater velocity. Thecalculated salinities show little variations at distances lessthan about 200 km from the recharge (Figure 11b) becausethe changes of freshwater incursion and solute dispersioncancel out each other. However, specifying lower perme-ability yields higher solute concentrations further down-stream near the salt source (>300 km) where diffusiondominates solute transport at very low flow rates. Oursensitivity analyses show that variations in dispersivityand permeability would affect the solute concentrations tosome extent, but not the occurrence of brines in the southerncoastal plain. While it is still a long way off for thedevelopment of three-dimensional basin models fullyaccounting for all coupling hydrogeologic processes andsub-basin scale heterogeneities, our regional hydrologicmodel should be viewed most of its use in calculating‘‘order of magnitude’’ estimates of flow rates and solutetransport processes.
5.2. Groundwater Mixing Model
[36] The predicted flow pattern (Figure 10) reveals thepossible mixing and interaction between meteoric rechargeand groundwater associated with Knox Group carbonatestrata (Ordovician) and Louann Salt. The Tuscaloosa andEutaw sands serve as major regional aquifers for southwardflow of meteoric water. Near the northern portion of thecoastal plain, groundwater migrating in the OrdovicianKnox Group carbonate strata discharges upward along thebasement high, probably through faults and fractures inPaleozoic rocks [Cook, 1997], into the overlying Cretaceousaquifers. The carbonate groundwater then mixes withmeteoric water in the shallow aquifers and continues tomigrate southward. This flow pattern is consistent with thehydrochemical facies distribution in the northern coastalplain, which suggests widespread mixing of carbonategroundwater (e.g., wells P-5, S-1, and QQ-02 in Figures 1and 4) with meteoric water.[37] The calculated results (Figure 10) demonstrate the
effects of Louann Salt on the salinity of the groundwater inAlabama coastal plain aquifers. Salinities are generally lowin the northern recharge area but high in the southern coastalplain, especially at depth within and adjacent to the LouannSalt. Shallow groundwater driven by topography migratesdownward and mixes with saline brines associated with theLouann Salt, and then flow toward the Gulf Coast under theregional hydraulic gradient. The high brine density causesgroundwater to sink along the northern edge of the salt (atdepth between wells 6 and 7) and then carry salt backtoward the northern coastal plain. This density drivengroundwater then mixes with shallow groundwater andcauses an increase in fluid salinity upstream from the
Louann Salt (e.g., wells U-11, L-6, RR-19, and 9245-C inFigures 1 and 4).
6. Conclusions
[38] This research correlates hydrologic, geologic, geo-chemical and microbial data to develop an integratedreactive transport model for water, solutes, isotopes, andmicrobes in coastal plain aquifer systems. Detailed fielddata and numerical models were used to understand rela-tions among groundwater geochemistry, isotope hydrologyand microbiology. The results indicate that chemical com-position of groundwater evolves by mechanic mixing,cation exchange, and biochemical processes as it movesdeeper into the subsurface.[39] The three water types that were identified are car-
bonate groundwater, groundwater associated with evapo-rates, and groundwater of meteoric origin. Discretehydrochemical zones with distinct major ion and traceelement compositions are maintained by cation exchange,carbonate dissolution, and microbial processes. Peaks ofCa2+, Mg2+, K+, and Na+ are spatially separated along theflow path as the coastal plain aquifers are subject tofreshwater flushing and cation exchange processes. Cationexchange processes also lead to significantly elevated alka-linity and pH values of groundwater. Elevated Fe, Mn, andSr concentrations may be derived from bacterial iron andmanganese reduction. High sulfate concentrations in shallowwells may be partly explained by oxidation of reduced sulfurand microbial denitrification. The presence of denitrifyingbacteria Burkholderia, Bacillus, and Pseudomonas as well assulfur oxidizing bacteria Thiobacillus in shallow waterfurther supports this model. The dramatic decrease ofSO4
2� and smell of H2S in groundwater southward fromMacon to Pike County indicate that the deeper groundwatersare affected by the bacterial reduction of sulfate.[40] Cl/Br ratios and dD and d18O values were used to
determine the source of salinity and the nature of mixing ofgroundwaters. Both dD-d18O and Cl-Br trends indicate themixing of remnant evaporated seawater (close to halitesaturation) with meteoric water. Groundwater age differ-ences and flow velocities were calculated using the 36Cl/Clratios. Calculated groundwater flow velocities in the Eutawand Tuscaloosa aquifers are 0.2 m/yr and 0.15 m/yr,respectively.[41] Basin-scale hydrologic transport models were devel-
oped in a cross section extending from the aquifer rechargezones to the Gulf Coast. The solute transport model showsthat the buried Jurassic Louann Salt can significantlyincrease groundwater salinity in the overlying coastal plainaquifers by density-driven advection and dispersion. Themodeling results are consistent with Cl/Br ratios and stableisotope signatures, both indicating that salinity of thegroundwater could be derived from seawater that has beenevaporated beyond halite saturation. Sensitivity analysesshow that salinity distribution depends on assumptions ofdispersivity and permeability. The predicted salinity in theshallow aquifers increases with increasing solute dispersionfrom the underlying Louann Salt. Lower permeability yieldshigher solute concentrations at depths near the salt sourcewhere diffusion dominates solute transport at very low flowrates. The predicted groundwater flow pattern reveals themixing of meteoric water, carbonate groundwater (from the
PENNY ET AL.: COASTAL PLAIN HYDROLOGY AND MICROBIOLOGY HWC 2 - 15
Ordovician Knox Group), and saline brines associated withLouann Salt. The hydrologic model is consistent with thehydrochemical facies distribution in the Alabama coastalplain.
[42] Acknowledgments. This research was supported by grants fromthe Gulf Coast Association of Geological Societies (to Elizabeth Penny),the USGS-AWRRI Program (to L. W. Wolf, J. A. Saunders, and M.-K.Lee), and by the Petroleum Research Fund, administered by the AmericanChemical Society under ACS-PRF 37071-AC2 (to Ming-Kuo Lee). Wethank Marlon Cook and Charles Smith for many helpful discussions onhydrogeology and stratigraphy of the study area. A portion of the chemicaland isotopic data was collected from a separate study of the geographicvariations of chlorine 36 in groundwater. Stanley N. Davis cooperated withus in this work and his assistance is gratefully acknowledged. This paperhas greatly benefited from constructive comments from Fiona Whitaker andone anonymous reviews.
ReferencesAlley, W. M., R. W. Healy, J. W. LaBaugh, and T. E. Reilly, Flow andstorage in groundwater systems, Science, 296, 1985–1990, 2002.
Appelo, C. A. J., Cation and proton exchange, pH variations, and carbonatereactions in a freshing aquifer,Water Resour. Res., 30, 2793–2805, 1994.
Ariza, L. M., River of vitriol, Sci. Am., 26, 26–28, 1998.Arnold, R. G., T. M. Olson, and M. R. Hoffmann, Kinetics and mechanismof dissimilative Fe(III) reduction by Pseudomonas sp. 200, Biotech.Bioeng., 28, 1657–1671, 1986.
Back, W., and B. B. Hanshaw, Comparison of chemical hydrogeology ofthe carbonate peninsulas of Florida and Yucatan, J. Hydrol., 10, 330–368, 1970.
Bargar, J. R., B. M. Tebo, and J. E. Villinski, In situ characterization ofMn(II) oxidation by spores of the marine Bacillus sp. strain SG-1, Geo-chim. Cosmochim. Acta, 64(16), 2775–2778, 2000.
Bentley, H. W., F. M. Phillips, S. N. Davis, M. A. Habermehl, P. L. Airey,G. E. Calf, D. Elmore, H. E. Gove, and T. Torgersen, Chlorine 36 datingof very old ground water: 1, The Great Artesian basin, Australia, WaterResour. Res., 22, 1991–2001, 1986.
Bethke, C. M., Modeling subsurface flow in sedimentary basins, Geol.Rundsch., 78, 129–154, 1989.
Bethke, C. M., Geochemical Reaction Modeling, Oxford Univ. Press, NewYork, 1996.
Bethke, C. M., M.-K. Lee, H. A. M. Quinodoz, and W. N. Kreiling, Basinmodeling with Basin2: A guide to using Basin2, B2plot, B2video,and B2view, Hydrogeol. Program, Univ. of Ill. at Urbana-Champaign,Urbana, 1993.
Brobst, D. A., W. P. Pratt, and V. E. McKelvey, Summary of United Statesmineral sources, U.S. Geol. Surv. Circ., 682, 1973.
Carpenter, A. B., Origin and chemical evolution brines in sedimentarybasins, Circ. Okla. Geol. Surv., 79, 60–77, 1978.
Chapelle, F. H., Ground-water Microbiology and Geochemistry, JohnWiley, Hoboken, N. J., 1993.
Chapelle, F. H., and L. L. Knobel, Aqueous geochemistry and theexchangeable cation compostion of glauconite in the Aquia Aquifer,Maryland, Groundwater, 21, 343–352, 1983.
Clark, I., and P. Fritz, Environmental Isotopes in Hydrogeology, CRC Press,Boca Raton, Fla., 1997.
Connolly, C. A., L. M. Walter, H. Baadsgaard, and F. J. Longstaffe, Originand evolution of formation waters, Alberta basin, western Canada sedi-mentary basin. I. Chemistry, Appl. Geochem., 5, 375–395, 1990.
Cook, M. R., The Eutaw Aquifer in Alabama, Bull. Geol. Surv. Ala.,vol. 156, 105 pp., Geol. Surv. Ala., Tuscaloosa, 1993.
Cook, M. R., Origin and evolution of anomalous hydrogeochemical char-acter of the Tuscaloosa aquifer system of west-central Alabama, M.S.thesis, Univ. of Ala., Tuscaloosa, 1997.
Craig, H., Isotopic variations in meteoric waters, Science, 133, 1702–1703,1961.
Davis, S. N., and H. W. Bentley, Dating groundwater: A short review,in Nuclear and Chemical Dating Techniques: Interpretation of theEnvironmental Record, ACS Symp. Ser., vol. 176, edited by L. A. Currie,pp. 187–222, Am. Chem. Soc., Washington, D. C., 1982.
Davis, S. N., D. O. Whittemore, and J. Fabryka-Martin, Uses of chloride/bromide ratios in studies of potable water, Ground Water, 36, 338–350,1998.
Deming, D., Introduction to Hydrogeology, McGraw-Hill, New York, 2002.
Dojka, M. A., P. Hugenholtz, S. K. Haack, and N. R. Pace, Microbialdiversity in a hydrocarbon- and chlorinated-solvent-contaminated aquiferundergoing intrinsic bioremediation, Appl. Environ. Microbiol., 64,3869–3877, 1998.
Domenico, P. A., and G. A. Robbins, The displacement of connate waterfrom aquifers, Geol. Soc. Am. Bull., 96, 328–335, 1985.
Dowling, C. B., R. J. Poreda, and A. R. Basu, The groundwater geochem-istry of the Bengal basin: Weathering, chemsorption, and trace metal fluxto the oceans, Geochim. Cosmochim. Acta, 67, 2117–2136, 2003.
Ehrlich, H. L., Geomicrobiology, 4th ed., Marcel Dekker, New York, 2002.Floesser, J. A., Groundwater geochemistry of four upper Cretaceousand lower Tertiary aquifers in the Gulf Coastal Plain of southeasternAlabama, M.S. thesis, Auburn Univ., Auburn, Ala., 1996.
Freeze, R. A., and J. A. Cherry, Groundwater, Prentice-Hall, Old Tappan,N. J., 1979.
Garven, G., S. Ge, M. A. Person, and D. A. Sverjensky, Genesis of strata-bound ore deposits in the midcontinent basins of North America, 1. Therole of regional groundwater flow, Am. J. Sci., 293, 497–568, 1993.
Gelhar, L. W., C. Welty, and K. R. Rehfeldt, A critical review of data offield-scale dispersion in aquifers, Water Resour. Res., 28, 1955–1974,1992.
Hendry, M. J., and F. W. Schwartz, An alternative view on the origin ofchemical and isotopic patterns in groundwater from the Milk River aqui-fer, Water Resour. Res., 24, 1747–1764, 1988.
Holmen, B. A., J. D. Sison, D. C. Nelson, and W. H. Casey, Hydroxamatesiderophores, cell growth and Fe(III) cycling in two anaerobic iron oxidemedia containing Geobacter metallireducens, Geochim. Cosmochim.Acta, 63(2), 227–239, 1999.
Holser, W. T., Trace elements and isotopes in evaporates, Short CoarseNotes Mineral. Soc. Am., 6, 295–346, 1979.
Horton, J. W., Jr., I. Zietz, and T. L. Neathery, Truncation of the Appala-chian Piedmont beneath the Coastal Plain of Alabama: Evidence from thenew magnetic data, Geology, 12, 51–55, 1984.
Hubbert, M. K., The theory of ground-water motion, J. Geol., 48, 785–944,1940.
Jakobsen, R., and D. Postma, Redox zoning, rates of sulfate reduction andinteractions with Fe-reduction and methanogenesis in a shallow sandyaquifer, Romo, Denmark, Geochim. Cosmochim. Acta, 63, 137–151,1999.
Johnson, T. M., R. C. Roback, T. L. McLing, T. D. Bullen, D. J. DePaolo,C. Doughty, R. J. Hunt, M. T. Murrell, and R. W. Smith, Groundwater‘‘fast paths’’ in the Snake River Plain aquifer: Radiogenic isotope ratiosas natural groundwater tracers, Geology, 28, 871–874, 2000.
Keller, E. A., Environmental Geology, Prentice-Hall, Old Tappan, N. J.,2000.
King, D. T., Jr., Facies stratigraphy and relative sea-level history—UpperCretaceous Eutaw Formation, central and eastern Alabama, Trans. GulfCoast Assoc. Geol. Soc., 40, 381–387, 1990.
Knowles, D. B., H. L. Reade Jr., and J. C. Scott, Geology and GroundwaterResources of Montgomery County, Alabama, With Special Reference tothe Montgomery Area, Bull. Geol. Surv. Ala., vol. 68, part B, 493 pp.,Geol. Surv. Ala., Tuscaloosa, 1963.
Konikow, L. F., and J. D. Bredehoeft, Modeling flow and chemical qualitychanges in an irrigated aquifer system, Water Resour. Res., 10, 546–562,1974.
Lee, M.-K., Predicting diagenetic effects of groundwater flow in sedimen-tary basins: A modeling approach with examples, in Basinwide FluidFlow and Associated Diagenetic Patterns: Integrated Petrographic,Geochemical, and Hydrologic Consideration, edited by I. P. Montanez,J. M. Gregg, and K. L. Shelton, Spec. Publ. SEPM Soc. Econ. Paleontol.Mineral., 57, 3–14, 1997.
Lee, M.-K., and C. M. Bethke, A model of isotopic fractionation in reactinggeochemical systems, Am. J. Sci., 296, 965–988, 1996.
Lee, M.-K., and J. A. Saunders, Effects of pH on metals precipitation andsorption: Field bioremediation and geochemical modeling approaches,Vadose Zone J., 2, 177–185, 2003.
Lee, M.-K., and D. D. Williams, Paleohydrology of the Delaware basin,western Texas: Overpressure development, hydrocarbon migration, andore genesis, AAPG Bull., 85, 961–974, 2000.
Lee, M.-K., J. A. Saunders, and L. W. Wolf, Effects of geologic hetero-geneities on pump-and-treat and in-situ bioremediation: A stochasticanalysis, Environ. Eng. Sci., 17, 183–189, 2000.
Lee, R. W., Geochemistry of groundwater in Cretaceous sediments of thesoutheastern coastal plain of eastern Mississippi and western Alabama,Water Resour. Res., 21, 1545–1556, 1985.
HWC 2 - 16 PENNY ET AL.: COASTAL PLAIN HYDROLOGY AND MICROBIOLOGY
Lehmann, B. E., S. N. Davis, and J. Fabryka-Martin, Atmospheric andsubsurface sources of stable and radioactive nuclides used for ground-water dating, Water Resour. Res., 29, 2027–2040, 1993.
Lovley, D. R., and F. H. Chapelle, Deep subsurface microbial processes,Rev. Geophys., 33, 365–381, 1995.
Lovley, D. R., F. H. Chapelle, and E. J. P. Phillips, Fe(III)-reducing bacteriain deeply buried sediments of the Atlantic coastal plain, Geology, 18,954–957, 1990.
Madigan, M. T., J. M. Martinko, and J. Parker, Biology of Microorganisms,Prentice-Hall, Old Tappan, N. J., 1996.
Madsen, E. L., Nucleic-acid characterization of the identity and activity ofsubsurface microorganisms, Hydrogeol. J., 8, 112–125, 2000.
Malhotra, S., A. S. Tankhiwale, A. S. Rayvaidya, and R. A. Pandey, Optimalconditions for bio-oxidation of ferrous ions to ferric ions using Thio-bacillus ferrooxidans, Biores. Tech., 85, 225–234, 2002.
Miller, J. A., Ground Water Atlas of United States: Alabama, Georgia, andFlorida, Hydrol. Invest. Atlas HA 730-G, U.S. Geol. Surv., Reston, Va.,1990.
Miller, S. C. M., J. J. LiPuma, and J. L. Parke, Culture-based and non-growth-dependent detection of the Burkholderia cepacia complex in soilenvironments, Appl. Environ. Microbiol., 68, 3750–3758, 2002.
Person, M. E., and G. Garven, A sensitivity study of the driving forces onfluid flow during continental-rift basin evolution, Geol. Soc. Am. Bull.,106, 461–475, 1994.
Person, M., J. P. Raffensperger, S. Ge, and G. Garven, Basin-scale hydro-logic modeling, Rev. Geophys., 34, 61–87, 1996.
Ranganathan, V., and J. S. Hanor, A numerical model for the formation ofsaline waters due to diffusion of dissolved NaCl in subsiding sedimentarybasins with evaporites, J. Hydrol., 92, 97–120, 1987.
Raymond, D. E., and C. W. Copeland, Selected columnar sections for theCoastal Plain, Appalachian Plateaus, Interior Low Plateaus, and Valleyand Ridge Provinces in Alabama, Geol. Surv. Ala. Atlas Ser., 20, 43 pp.,1987.
Raymond, D. E., W. E. Osborne, C. W. Copeland, and T. L. Neathery,Alabama stratigraphy, Circ. Geol. Surv. Ala., 140, 97 pp., 1988.
Roback, R. C., T. M. Johnson, T. L. McLing, M. T. Murrell, S. Luo, andT.-L. Ku, Uranium isotopic evidence for groundwater chemical evolutionand flow patterns in the eastern Snake River Plain aquifer, Idaho, Geol.Soc. Am. Bull., 113, 1133–1141, 2001.
Roden, E. E., M. R. Leonardo, and F. G. Ferris, Immobilization of strontiumduring iron biomineralization coupled to dissimilatory hydrous ferricoxide reduction, Geochim. Cosmochim. Acta, 66, 2823–2839, 2002.
Saunders, J. A., M. A. Prichett, and R. B. Cook, Geochemistry of biogenicpyrite and ferromanganese stream coatings: A bacteria connection?, Geo-microbiol. J., 14, 203–217, 1997.
Scott, J. C., R. H. Cobband, and D. Castleberry, Geohydrology and suscep-tibility of major aquifers to surface contamination; area 8, U.S. Geol.Surv. Water Resour. Invest. Rep., 86-4360, 65 pp., 1987.
Small, T. D., L. A. Warren, E. E. Roden, and F. G. Ferris, Sorption ofstrontium by bacteria, Fe(II) oxide and bacteria-Fe(III) oxide composites,Environ. Sci. Technol., 33, 4465–4470, 1999.
Stueber, A. M., and L. M. Walter, Origin and chemical evolution of for-mation waters from Silurian-Devonian strata in the Illinois basin, USA,Geochim. Cosmochim. Acta, 55, 309–325, 1991.
Wheatcraft, S. W., and S. W. Tyler, An explanation of scale-dependentdispersivity in heterogeneous aquifer using concepts of fractal geometry,Water Resour. Res., 24, 566–578, 1988.
Zobrist, J., P. R. Dowddle, J. A. Davis, and R. S. Oreland, Mobilization ofarsenite by dissimilatory reduction of absorbed arsenate, Environ. Sci.Technol., 31, 4646–4753, 2000.
����������������������������M.-K. Lee and E. Penny, Department of Geology and Geography,
210 Petrie Hall, Auburn University, AL 36849, USA. ([email protected])
C. Morton, Carnegie Museum of Natural History, 4400 Forbes Avenue,Pittsburgh, PA 15213, USA.
PENNY ET AL.: COASTAL PLAIN HYDROLOGY AND MICROBIOLOGY HWC 2 - 17