groundwater and soil vapour investigations of … hydrogeological profile & groundwater gradient...
TRANSCRIPT

KELVINATOR AUSTRALIA PTY LIMITED
Groundwater and Soil Vapour Investigations of Trichloroethene: Stage 4 Ashford Rd & Everard Ave, Keswick South Australia
APRIL 2016

WSP | Parsons Brinckerhoff Level 27, Ernst & Young Centre 680 George Street Sydney NSW 2000 GPO Box 5394 Sydney NSW 2001
Tel: +61 2 9272 5100 Fax: +61 2 9272 5101
www.wsp-pb.com
This document may contain confidential and legally privileged information, neither of which are intended to be waived, and must be used only for its intended purpose. Any unauthorised copying, dissemination or use in any form or by any means other than by the addressee, is strictly prohibited. If you have received this document in error or by any means other than as authorised addressee, please notify us immediately and we will arrange for its return to us.
Project no: Keswick Stage 4 Report March 2016_2201557C-REP- Rev0.docx Date: March 2016
REV DATE DETAILS
0 12 April 2016 Original draft
1 18 April 2016 Final
AUTHOR, REVIEWER AND APPROVER DETAILS
Prepared by: Adrian Heggie Date: 18 April 2016 Signature:
Reviewed by: Nivari Jayasinghe Date: 12 April 2016 Signature:
Approved by: Adrian Heggie Date: 18 April 2016 Signature:
Groundwater and Soil Vapour Investigations of Trichloroethene: Stage 4 Ashford Rd & Everard Ave, Keswick South Australia Kelvinator Australia Pty Limited

i
Groundwater and Soil Vapour Investigations of Trichloroethene: Stage 4 Ashford Rd & Everard Ave, Keswick South Australia Kelvinator Australia Pty Limited
WSP | Parsons Brinckerhoff Project No 2201557c
TABLE OF CONTENTS EXECUTIVE SUMMARY ..............................................................................................IV
1 INTRODUCTION ............................................................................................ 1 1.1 Purpose of this report ........................................................................................................ 1 1.2 Background information .................................................................................................... 1 1.3 Objectives of the investigation .......................................................................................... 2 1.4 Scope of works................................................................................................................... 3
2 SITE INFORMATION ..................................................................................... 4 2.1 Identification of investigation areas .................................................................................. 4 2.2 Current land uses ............................................................................................................... 4 2.3 Physical conditions ............................................................................................................ 4
3 CONTAMINANTS OF INTEREST .................................................................. 5
4 SAMPLING PLAN AND METHODS .............................................................. 6 4.1 Groundwater sampling plan and methods ........................................................................ 6 4.2 Vapour sampling design rationale .................................................................................... 6 4.3 Sub-slab soil vapour sampling plan .................................................................................. 7 4.4 Surface mass flux sampling plan ...................................................................................... 8 4.5 Ambient air sampling plan ................................................................................................. 9
5 DATA QUALITY OBJECTIVES ................................................................... 10 5.1 Setting data quality objectives – program planning ....................................................... 10 5.2 Considerations in the data quality planning process – vapour
investigation ..................................................................................................................... 11 5.3 Data quality control – field and laboratory ...................................................................... 11 5.3.1 Surface flux measurements ................................................................................................ 11 5.3.2 Sub-slab vapour measurements ......................................................................................... 12 5.3.3 Groundwater sampling ....................................................................................................... 13 5.3.4 Field quality control ............................................................................................................ 13 5.4 Laboratory quality assurance .......................................................................................... 14 5.4.1 Laboratory quality assurance .............................................................................................. 14 5.4.2 Laboratory quality control ................................................................................................... 14
6 REFERENCE GUIDANCE FOR CONTAMINANTS ..................................... 15 6.1 Groundwater ..................................................................................................................... 15 6.2 Soil vapour ....................................................................................................................... 15

ii
Groundwater and Soil Vapour Investigations of Trichloroethene: Stage 4 Ashford Rd & Everard Ave, Keswick South Australia Kelvinator Australia Pty Limited
WSP | Parsons Brinckerhoff Project No 2201557c
6.2.1 Surface mass flux ............................................................................................................ 16 6.2.2 Ambient air ....................................................................................................................... 16
7 FIELDWORKS.............................................................................................. 18 7.1 Installation, development, gauging and sampling of groundwater
monitoring wells ............................................................................................................... 18 7.2 Installation of passive sub-slab sampling tubes ............................................................ 18 7.3 Deployment of passive flux chambers ............................................................................ 18 7.4 Deployment of ambient air sampling tubes .................................................................... 18
8 GROUNDWATER SAMPLING RESULTS & DISCUSSION ........................ 19 8.1 Geological profile ............................................................................................................. 19 8.2 Hydrogeological profile & groundwater gradient ........................................................... 19 8.3 Pattern of groundwater impacts ...................................................................................... 19 8.4 Metals in groundwater ..................................................................................................... 20 8.5 General field water quality parameters ........................................................................... 20
9 VAPOUR SAMPLING RESULTS AND DISCUSSION ................................. 22 9.1 Weather conditions over the sampling period ................................................................ 22 9.2 Sub-slab soil conditions .................................................................................................. 22 9.3 Sub-slab vapour concentrations ..................................................................................... 22 9.4 Surface vapour flux .......................................................................................................... 23 9.5 Ambient air concentrations ............................................................................................. 23 9.6 Evaluation of vapour intrusion health risk ...................................................................... 23
10 ASSESSMENT OF DATA QUALITY ........................................................... 27 10.1 Groundwater ..................................................................................................................... 27 10.2 Sub-slab soil vapour ........................................................................................................ 27 10.3 Surface flux and ambient air ............................................................................................ 28 10.4 Conclusions on data quality assurance .......................................................................... 28
11 CONCEPTUAL SITE MODEL ...................................................................... 29
12 SUMMARY AND CONCLUSIONS ............................................................... 31 12.1 Summary .......................................................................................................................... 31 12.2 Conclusions ..................................................................................................................... 33
13 LIMITATIONS ............................................................................................... 34
14 REFERENCES ............................................................................................. 36

iii
Groundwater and Soil Vapour Investigations of Trichloroethene: Stage 4 Ashford Rd & Everard Ave, Keswick South Australia Kelvinator Australia Pty Limited
WSP | Parsons Brinckerhoff Project No 2201557c
L I S T O F A P P E N D I C E SFigures Appendix A Groundwater summary tables Appendix B Sub-slab vapour, floor flux & ambient air summary tables Appendix C Daily weather observations – bureau of Meteorology data Appendix D Bore logs Appendix E Laboratory reports: groundwater Appendix F Laboratory reports: sub-slab vapour, flux & ambient air Appendix G Survey of newly installed wells Appendix H photographs

iv
Groundwater and Soil Vapour Investigations of Trichloroethene: Stage 4 Ashford Rd & Everard Ave, Keswick South Australia Kelvinator Australia Pty Limited
WSP | Parsons Brinckerhoff Project No 2201557c
E X E C U T I V E S U M M A RYIn January 2016, Kelvinator Australia Pty Limited (Kelvinator) engaged Parsons Brinckerhoff Australia Pty Limited (WSP | Parsons Brinckerhoff) to undertake field testing of groundwater and soil vapours at and in the vicinity of three properties along Ashford Road and Everard Avenue, South Australia.
This report presents the findings of the investigations carried out in February and March 2016.
Parsons Brinckerhoff understands that Kelvinator was a former owner of three properties in the area of the investigation. The properties have been designated K1, K2 and K3, all fronting Everard Avenue, Keswick a few kilometres south west of the Adelaide central business district. All three properties may have been associated with the manufacturing of refrigerators. Kelvinator sold the properties in or around 1985.
INVESTIGATION OBJECTIVES
A principal objective of the current investigation was to investigate the extent of the migration of TCE in groundwater downgradient (to the north and west of the K1 site).
A second and largely unrelated objective of the March 2016 investigations was to test the sub-slab soil vapour concentrations and surface floor fluxes beneath the building on the western half of the K3 site (i.e. Australian Motors warehouse) to examine whether TCE or related industrial solvents were present and whether, if present, the fluxes were causing an unacceptable risk to workers in the warehouse.
SCOPE OF WORK
To date, four stages of investigation have been conducted by WSP | Parsons Brinckerhoff for Kelvinator. Investigations comprised the following:
Stage 1, Soil vapour and flux investigations around the perimeter of the K1 site in March 2014(Parsons Brinckerhoff, 28 May 2014)
Stage 2, Soil vapour and flux investigations within the Explorer Coachlines depot on the easternhalf of the K3 site in November 2014 (Parsons Brinckerhoff, 26 February 2015)
Stage 3, Soil vapour, flux and groundwater investigations on the K2 site in August 2015 (ParsonsBrinckerhoff, September 2015); and
Stage 4, Soil vapour and flux within the Australian Motors warehouse on the western half of the K3building; and groundwater investigations downgradient of the K1 site, carried out in February/March2016 (the current investigation reported herein).
RESULTS
Geological profile
Five new bores were drilled to depths of 19 m below grade. The profile was primarily a silty or sandy clay, varying largely, only with respect to the proportion of sand and the moisture content. Wet layers lying above the standing water level of the regional aquifer were encountered in some of the wells at variable depths.
Hydrogeological profile & groundwater gradient
The depth to the regional aquifer lay between 14.4 and 15.4 m below ground level. Upper water bearing zones, i.e., perched water identified in the earlier investigations at the K2 site, was not investigated in the current investigation, although it was gauged in the existing shallow well KMW1 at a

v
Groundwater and Soil Vapour Investigations of Trichloroethene: Stage 4 Ashford Rd & Everard Ave, Keswick South Australia Kelvinator Australia Pty Limited
WSP | Parsons Brinckerhoff Project No 2201557c
depth of 7.8 m below ground level. Wet zones in the soil profile above the saturated zone of the regional aquifer were observed and logged at three of the five new wells installed.
A distinct gradient of 1 in 100 and flow direction to the north-west was found. This north-westerly flow direction is consistent with the overall direction of Keswick creek which traverses the investigation area, albeit, as a piped channel.
PATTERN OF GROUNDWATER IMPACTS
Volatile organic compounds (VOCs) in groundwater
Well KMW2 on the K1 site remains the only well with substantially high concentrations of TCE (28,560 µg/L). The new wells off-site to the north and west of the K1 site showed impacts in all, but at much lower concentrations. The highest off-site concentration of TCE was 1,100 µg/L at KMW4 on the NHP site.
It can reasonably be assumed that well KMW2 is at or near the centre of a TCE source area, but it is not known whether the off-site wells are down-gradient of the source at KMW1. There may be other areas of impact causing the observed concentrations in the off-site wells. \
This observation is supported by the pattern of impacts by carbon tetrachloride which appears to be unrelated to the TCE source or sources. Carbon tetrachloride does however appear to originate on the K1 site as there were no detections in the wells south of Everard Avenue on and around the K2 site which lies up-gradient of the K1 site. Carbon tetrachloride may also have more than one source. Its presence at KMW7 on the K3 site, and the relatively high concentrations at KMW5 on the NHP site, suggest more than one carbon tetrachloride source area.
Another chlorinated VOC appearing in most of the monitoring wells is trichloromethane (chloroform). The observed chloroform may be a degradation product of carbon tetrachloride although some may be naturally formed (Hoekstra et al, 1998).
cis-1,2-dichloroethene (cis DCE) the primary breakdown products of TCE was detected at all but KMW6, and vinyl chloride, a breakdown product of cis DCE, was detected at two wells KMW1 and KMW7.
An important finding of the current groundwater investigation was that high concentrations of TCE were not found in the more distant off-site wells, suggesting that TCE may be attenuating substantially. Even the wells just to the north of the K1 site (KMW4 and KMW5) showed TCE concentrations significantly lower than the KMW2 value.
Metals in groundwater Dissolved metals in groundwater were analysed in the current investigation in order to screen for the possible occurrence of metals at high concentrations. Most of the metals analysed were at low concentrations. Non-speciated (total) chromium was relatively high in one of the wells on the NHP property (320 µg/L at KMW5), and at this same well, molybdenum, measured at 310 µg/L, exceeded the Australian and South Australian drinking water criterion of 50 µg/L. SUB-SLAB VAPOURS, FLOOR FLUXES AND INDOOR AIR
Sub-slab vapour concentrations
Sub-slab soil vapour sampling points were drilled at 6 locations, all within the warehouse of the Australian Motors building on the K3 site.

vi
Groundwater and Soil Vapour Investigations of Trichloroethene: Stage 4 Ashford Rd & Everard Ave, Keswick South Australia Kelvinator Australia Pty Limited
WSP | Parsons Brinckerhoff Project No 2201557c
Concentrations of TCE were high at two sampling locations (AM SS 1 (19,000 µg/m3) and AM SS 6 (13,000 µg/m3)), both considerably in excess of the vapour intrusion risk based criterion (80 µg/m3). Only two of the six locations showed exceedences of the NEPM criterion of 80 µg/m3. Of the other four sampling locations, three were less than the detection limit (2.2 µg/m3) and the third was also low at 9.1 µg/m3.
Sub-slab soil vapour testing location AM SS1, which showed the highest TCE concentration also showed cis-1,2-dichloroethene(cis DCE) over the vapour intrusion risk based criterion of 300 µg/m3.
The observed high concentrations of TCE are indicative of local soil sources beneath the area of the slab, in the vicinity of the sampling locations.
Surface vapour flux
Surface mass fluxes of VOCs were measured beside all 6 of the sub-slab vapour testing points. The purpose of measuring the flux beside the sub-slab vapour test points was not to verify one method by the other, but rather to show whether high concentrations beneath the slab were resulting in strong fluxes of contaminant vapours into the internal air of the warehouse, potentially causing vapour intrusion health risks.
Flux rates of TCE through the floors of the warehouses were substantial at the two locations where sub-slab soil vapour concentrations were high, i.e. AM Flux 1 and AM Flux 6. AM Flux 7 was a duplicate chamber beside AM Flux 6 and it too showed considerable flux strengths of TCE. These flux strengths were significant enough to indicate the need for the calculation of vapour intrusion health risks. At the other four flux measurement locations the flux strengths were very low and can be considered trivial and of no consequence.
The highest flux, recorded at AM SS 1, which was also the site of a high sub-slab soil vapour concentration, was found to cause a significant contribution to indoor air concentrations. The flux value, 24.12 µg/m2/h would result in an indoor air TCE concentration of 6.48 µg/m3, based on assumptions used in the calculation. However, when the spatial average flux value of 7.1 µg/m2/h (i.e., the mean of all 6 flux measurement locations) was used the calculation resulted in a much lower indoor air value of 1.9 µg/m3, which is close to the measured results for indoor air (see Figure 8).
Ambient air concentrations
Ambient air concentrations of a suite of VOCs were sampled at three indoor and two outdoor locations at the Australian Motors site. Compared to the health risk based acceptable air concentrations derived from toxicity values for carcinogenic end points published by WHO and US EPA, 23 µg/m3 and 2.4 µg/m3, respectively, the measured concentrations of TCE were low compared to the WHO criterion but comparable to the US EPA criterion. The highest TCE concentration measured within either of the warehouses was 2.1 µg/m3.
VAPOUR INTRUSION RISK ASSESSMENT
Human health risks from the intrusion of TCE vapours into the warehouses from the sub-slab soil vapours can be evaluated in more than one way. As a worst case scenario, the maximum measured floor flux was used to calculate an indoor air concentration of 6.48 µg/m3. That value was then adjusted for worker exposure (a factor of 0.08 for carcinogens and 0.22 for non carcinogens. When adjusted for exposure the air concentration becomes 0.52 µg/m3 for carcinogens and 1.43 µg/m3 for non-carcinogens.
Using the WHO unit risk value of 4.7 x 10⁻⁷, the exposure adjusted concentrations produced a low and acceptable risk. Using the US EPA IRIS data base criteria for TCE the calculated risk was also acceptable, though the calculated risk value for non-carcinogens was close to the acceptable limit.

vii
Groundwater and Soil Vapour Investigations of Trichloroethene: Stage 4 Ashford Rd & Everard Ave, Keswick South Australia Kelvinator Australia Pty Limited
WSP | Parsons Brinckerhoff Project No 2201557c
The measured ambient air concentrations of TCE at location AM AA 3, located in the northern part of the warehouse, near the locations of the high flux readings, was 2.1 µg/m3, approximately equal to the US EPA’s criteria for carcinogenic health risks (2.4 µg/m3) and for non-carcinogenic health risks (2 µg/m3). However, these criteria need to be factored downwards to account for worker exposure.
Measured indoor air concentrations were lower than the indoor air concentrations calculated by the maximum and the average flux rates. Thus, measured indoor air concentrations provided a second and independent measure of the risk to workers from vapour intrusion and demonstrated an acceptable risk.
CONCLUSIONS
The migration of chlorinated VOCs from the K1 site in a north to westerly direction was demonstrated by the additional wells installed in February 2016 and high concentrations of TCE were again measured in one well on the K1 site. Some uncertainty remains as to the delineation of the plume or plumes leaving the K1 site. Notwithstanding this limitation, an important finding of the current groundwater investigation was that high concentrations of TCE were not found in the more distant off-site wells, suggesting that TCE may be attenuating substantially. Even the wells just to the north of the K1 site (KMW4 and KMW5) showed TCE concentrations significantly lower than the KMW2 value.
The presence of moderate concentrations of TCE and moderate to high concentrations of carbon tetrachloride in groundwater on the NHP property to the north of the K1 site, is indicative of a potential vapour intrusion risk in the NHP building.
The measurements of substantial concentrations of TCE in sub-slab vapours beneath the Australian Motors warehouse on the K3 site is a clear indication of a local source not related to the K1 site.
The high concentrations of sub-slab TCE vapours beneath the Australian Motors floor slab produced substantial fluxes through the floor that were calculated to contribute indoor air TCE concentrations approximately equal to the US EPA IRIS data base criterion, but considerably below the risk level published by WHO. Directly measured indoor air concentrations (i.e. averaged over 17 days) were also commensurate with the US EPA IRIS criteria. However, when worker exposure factors were applied to the indoor air concentrations (both calculated by flux measurements, or measured directly), the health risk was determined to be acceptable –on the basis of both reference guidelines.
However, as sub-slab vapour concentrations and flux strengths of TCE were high in the northern part of the Australian Motors warehouse, if changes were to be made to the building structure or to its use, further investigations of the sources and further sub-slab or surface flux testing should be carried out to ensure that health risks from intruding TCE vapours does not occur.

1
Groundwater and Soil Vapour Investigations of Trichloroethene: Stage 4 Ashford Rd & Everard Ave, Keswick South Australia Kelvinator Australia Pty Limited
WSP | Parsons Brinckerhoff Project No 2201557c
1 INTRODUCTION 1.1 Purpose of this report
In January 2016, Kelvinator Australia Pty Limited (Kelvinator) engaged Parsons Brinckerhoff Australia Pty Limited (WSP | Parsons Brinckerhoff) to undertake field testing of groundwater and soil vapours at and in the vicinity of three properties along Ashford Road and Everard Avenue, South Australia.
This report presents the findings of the investigations carried out in February and March 2016.
1.2 Background information
WSP | Parsons Brinckerhoff understands that Kelvinator owned or operated a number of manufacturing facilities along Everard Avenue, Keswick. Figure 1 shows the location of the former manufacturing sites, approximately 3 km south-west of the Adelaide CBD and Figure 2 shows the locations of three of the former Kelvinator sites, designated K1, K2 and K3 along Everard Avenue, Keswick. Kelvinator is currently not the owner or operator, nor tenant of any of the properties. Kelvinator sold the properties in or around 1985.
The present investigation comprised vapour investigations in the western building of the K3 site, an automotive parts warehouse operated by Australian Motors; indoor air testing in a lighting retail showroom in the north-eastern corner of the K2 site and an extension of groundwater investigations on Ashford Road, on the K3 site and on a commercial property neighbouring to the north of the K1 site (NHP property).
Earlier investigations of groundwater and soil vapour impacts have been carried out by current or recent land owners.
At the time of redevelopment of the K1 site the Environment Protection Authority of South Australia (EPA) wrote to Arrium Limited (Arrium) in a letter dated 13 February 2014, advising Arrium that EPA had received on 4 November 2013, notification of site contamination of underground water pursuant to section 83A of the Environment Protection Act, 1993. Arrium is the owner of Kelvinator. As stated in the EPA’s letter the following chemical substances were present at concentrations above relevant investigation levels: tetrachloroethene (PCE), trichloroethene (TCE), cis-1,2-dichloroethene (DCE), vinyl chloride (VC), chloroform and carbon tetrachloride. The EPA noted that the chemicals were identified in soil, soil vapour on-site and/or in groundwater on-site and off-site. Further, the EPA’s letter to Arrium stated: “The nature of the chemical substances identified at the site and at the site boundaries indicates a potential human health risk to adjacent receptors through exposure to vapour intrusion and contaminated groundwater.”
Following the EPA’s letter, Kelvinator engaged Parsons Brinckerhoff to investigate the possible migration of the nominated chemicals in soil vapour and groundwater from the K1 site. That investigation was reported in Parsons Brinckerhoff, 28 May 2014. A second investigation of the possible migration of contaminants from the K1 site towards the west (the K3 site) was undertaken in December 2014, reported as Parsons Brinckerhoff, February 2015.
A soil contamination investigation at the K1 site was undertaken by Tierra Environment for Badge Constructions (SA) Pty Ltd – reported 20 November 2013, and a groundwater investigation was undertaken by Tierra Environment for JE Pty Ltd and reported on 18 December 2013. BlueSphere conducted an investigation of soil vapour on the K1 site for JE Pty Ltd and prepared a letter report on the investigation dated 17 December 2013.
The earlier investigations of the K1 site found localised high concentrations of trichloroethene (TCE) in both soil and groundwater. The limited extent of groundwater investigations on the K1 site (Tierra Environment, 18 December 2013), did not identify a flow direction for groundwater, nor was the hydrogeological structure

2
Groundwater and Soil Vapour Investigations of Trichloroethene: Stage 4 Ashford Rd & Everard Ave, Keswick South Australia Kelvinator Australia Pty Limited
WSP | Parsons Brinckerhoff Project No 2201557c
fully characterised. Consequently, the migration route for possible off-site transport of TCE contaminant from the K1 site, was not identified. Parsons Brinckerhoff’s vapour investigations around the perimeter of the K1 site indicated relatively high concentrations of TCE vapours in the sub-slab soil adjacent to the site on the southern side of the K1 site indicating a possible migration of TCE in groundwater from the K1 site towards the south. However, it was not clear whether the TCE on the southern side of Everard Avenue originated from the K1 or the K2 site.
During February to May 2014, Mott MacDonald undertook investigations of soil, soil vapour and groundwater at the K2 site for Le Cornu Contractors Pty Ltd (Mott MacDonald, 8 August 2014). Results identified elevated concentrations of TCE in soil vapour and low concentrations in groundwater. The groundwater investigations did not adequately identify a groundwater gradient and flow direction. The results of the Mott MacDonald investigation suggested TCE source areas on the K2 site.
To expand on the investigations on the K2 site, WSP | Parsons Brinckerhoff undertook further investigations of groundwater and soil vapour at the K2 site for Kelvinator. Those additional investigations, undertaken in August 2015, established the water bearing zones and identified a groundwater flow direction within the regional aquifer, to the north-west. The vapour investigation identified some localised soil source areas of TCE beneath the warehouse floor of the K2 site buildings. The August 2015 investigation was reported in Parsons Brinckerhoff 30 September 2015.
Stages of investigations by WSP | Parsons Brinckerhoff
To date, four stages of investigation have been conducted by WSP | Parsons Brinckerhoff for Kelvinator. Investigations comprised the following:
Stage 1, Soil vapour and flux investigations around the perimeter of the K1 site in March 2014 (Parsons Brinckerhoff, 28 May 2014
Stage 2, Soil vapour and flux investigations within the Explorer Coachlines depot on the eastern half of the K3 site in November 2014 (Parsons Brinckerhoff, 26 February 2015)
Stage 3, Soil vapour, flux and groundwater investigations on the K2 site in August 2015 (Parsons Brinckerhoff, September 2015); and
Stage 4, Soil vapour and flux within the Australian Motors warehouse on the western half of the K3 building; and groundwater investigations downgradient of the K1 site, carried out in March 2016 (the current investigation reported herein).
1.3 Objectives of the investigation
As mentioned above, the August 2015 groundwater investigations at the K2 site identified a north-westerly flow direction, and earlier work on the K1 site by Tierra Environment 18 December 2013, identified high concentrations of TCE in groundwater. The fate and direction of the contaminant plume, beyond the K1 site had not been investigated.
A principal objective of the current (i.e., March 2016) investigation was to investigate the extent of the migration of TCE in groundwater downgradient (to the north and west of the K1 site).
A second and largely unrelated objective of the March 2016 investigations was to test the sub-slab soil vapour concentrations and surface floor fluxes beneath the western half of the K3 building (Australian Motors warehouse) to examine whether TCE or related industrial solvents were present and whether, if present, the fluxes were causing an unacceptable risk to workers in the warehouse.

3
Groundwater and Soil Vapour Investigations of Trichloroethene: Stage 4 Ashford Rd & Everard Ave, Keswick South Australia Kelvinator Australia Pty Limited
WSP | Parsons Brinckerhoff Project No 2201557c
1.4 Scope of works
Groundwater
Five groundwater monitoring wells were installed and screened in the regional aquifer. Soil profiles were logged with detail sufficient to distinguish significant soil horizon changes, including changes in moisture conditions. Field screening of soil cutting for VOC concentrations by PID was undertaken during the drilling, and selected soils showing higher PID readings were submitted to a laboratory for analysis. Locations of the monitoring wells are shown on Figure 3.
The five new wells were surveyed to allow determination of groundwater gradient.
The five new wells plus the 3 existing wells on the K1 site (KMW1, KMW2 & KMW3) were sampled to provide a comparable set of data on groundwater concentrations (for wells north of Everard Avenue). Groundwater was analysed for a standard suite of VOCs plus total recoverable hydrocarbons (TRH) and a suite of 15 metals.
In addition to the gauging of all new wells and existing wells on the K1 site, all 6 of the deep wells (regional aquifer wells) on the K2 site were gauged to provide a robust set of values for determination of groundwater gradient.
Groundwater data obtained from the investigation were assessed for the purpose of identifying a possible plume of TCE migrating away from the K1 site, and determining its orientation and concentrations within the plume.
Vapour at the K3 site (Australian Motors building)
Sub-slab soil vapour measurements were taken at six locations within the Australian Motors building (warehouse) by placing WMS_LU passive sorption tubes in drilled sub-slab holes.
Surface vapour flux was measured at each of the six sub-slab soil vapour testing locations.
Ambient air concentrations of VOCs were measured at three locations inside the Australian Motors building and at two outdoor locations adjacent to the building
Sub-slab soil vapour, surface flux and ambient air samples were analysed for a suite of VOCs.
Vapour data were assessed for the purpose of determining whether an unacceptable health risk through vapour intrusion into the warehouse may be occurring, and quantifying the risk, if existing.

4
Groundwater and Soil Vapour Investigations of Trichloroethene: Stage 4 Ashford Rd & Everard Ave, Keswick South Australia Kelvinator Australia Pty Limited
WSP | Parsons Brinckerhoff Project No 2201557c
2 SITE INFORMATION 2.1 Identification of investigation areas
For the groundwater investigation works, the area of investigation was Ashford Road and on properties along Ashford Road, Explorer Coachlines (56-60 Everard Ave, Keswick) and NHP Electrical Engineering Products (38 Croydon Road, Keswick); (refer to Figures 2 and 3).
For the soil vapour investigation works, the area of investigation was the warehouse of the Australian Motors building at 50-54 Everard Avenue, Keswick.
2.2 Current land uses
Land uses at the time of the investigation are described below.
Ashford Road: A two lane suburban street in a mixed commercial/residential district
Explorer Coachlines: Bus depot; goods dispatch and storage
Australian Motors: Automotive parts warehouse and associated offices under a common roof.
The wider area is an area of mixed commercial and residential land use
2.3 Physical conditions
The land is visually flat, although there is a slight slope within the investigation area towards the north-west. Most of the land surface is built upon or asphalt or concrete surface roads and car parks. Road verges are covered by granulated granite. Minor areas of landscaping exit.

5
Groundwater and Soil Vapour Investigations of Trichloroethene: Stage 4 Ashford Rd & Everard Ave, Keswick South Australia Kelvinator Australia Pty Limited
WSP | Parsons Brinckerhoff Project No 2201557c
3 CONTAMINANTS OF INTEREST In its letter to Arrium dated 13 February 2014, the EPA listed the following volatile chemical substances present at the K1 site at concentrations above relevant investigation levels: tetrachloroethene (PCE), trichloroethene (TCE), cis-1,2-dichloroethene (cis-1,2-DCE), vinyl chloride, chloroform and carbon tetrachloride.
The chemicals listed by the EPA have been included in a suite of volatile organic compounds (VOCs) used in the analysis of groundwater, surface flux, sub-slab soil vapour samples and ambient air. The chemical analysis suite can be found in the laboratory reports attached as Appendices E and F. The analytical suite also contains many compounds that may not be associated with the site. The additional analytes have been retained in the analytical suite because it is a standard analytical suite and because they may assist in the interpretation of the data.
The EPA noted in its letter to Kelvinator, dated 13 November, 2015, a letter in response to WSP | Parsons Brinckerhoff’s report on groundwater investigations at the K2 site, that previous investigations of groundwater on the K2 site had identified elevated concentrations of heavy metals. The EPA recommended that future characterisation of contamination include the analysis of heavy metals. Accordingly, a suite of 15 heavy metals was analysed for all 8 monitoring wells sampled in the current, March 2016 groundwater sampling.
6
Groundwater and Soil Vapour Investigations of Trichloroethene: Stage 4 Ashford Rd & Everard Ave, Keswick South Australia Kelvinator Australia Pty Limited
WSP | Parsons Brinckerhoff Project No 2201557c
4 SAMPLING PLAN AND METHODS 4.1 Groundwater sampling plan and methods
A previous groundwater investigation on and around the K2 site (Parsons Brinckerhoff 30 September 2015), established a regional groundwater gradient to the north-west. That information, coupled with the high TCE concentrations in groundwater on the K1 site, indicated that a plume of TCE may extend off-site from K1 towards the north-west.
The emphasis of the hydrogeological investigations on the K2 site were to establish the hydrogeological features, particularly the nature of the water bearing zones and to differentiate the upper perched water from the deeper regional aquifer. In the current extension of the groundwater investigation north and westward from the K1 site, the same emphasis on describing the hydrogeological conditions was made.
Five wells were installed into the regional aquifer which lay at depths between 14.4 m and 15.3 m below ground level. All wells were drilled to a depth of 19 m below ground level, and all were screened from 19 m to 16 m.
One new well (KMW1d) was drilled immediately beside an existing well (KMW1) which was drilled only across a perched water layer. The new deeper well was screened from 19 m to 16 m below ground level to ensure that it did not intersect higher level perched water not representative of the regional aquifer.
Newly installed wells KMW4 and KMW5, located on the NHP commercial property, and KMW6, located on Ashford Road footpath, were installed to investigate the possible migration of the TCE plume in the north-north-westerly to north-westerly direction. Well KMW7, located on the K3 site, was located close to a sub-slab vapour test point that had shown substantial TCE vapour concentrations during the vapour investigation of the K3 site (Parsons Brinckerhoff, 26 February 2015). This well also served to examine water quality in a westerly direction from the K1 site.
All five new monitoring wells were drilled for the upper portion by push tube, to aid in the logging of the soil profile, generally to depths of 7 m. Deeper portions were drilled using solid flight augers.
Soil cuttings were screened in the field by photoionisation detector (PID) and soils showing substantial PID readings were collected in sampling jars for laboratory analysis of volatile organic compounds (VOCs), plus hydrocarbon fractions.
All newly installed wells, three pre-existing wells at the K1 site, and five deep wells on the K2 were gauged one week after installation of the new wells.
Following the gauging, newly installed wells, plus the three existing wells at the K1 site were sampled for a suite of volatile organic compounds (VOCs) and fractions of petroleum hydrocarbons (TPH fractions). A suite of 15 metals were also sampled because some elevated molybdenum had been detected by earlier investigations on the K2 site.
Groundwater was sampled using the HydraSleeve ™ method of purgeless sampling.
4.2 Vapour sampling design rationale
The objective of the soil vapour investigations at the Australian Motors commercial facility, a warehouse and office building, was to test the sub-slab soil vapour concentrations and surface floor fluxes to examine whether TCE or related industrial solvents were present and whether, if present, the fluxes were causing an unacceptable risk to workers in the warehouse.

7
Groundwater and Soil Vapour Investigations of Trichloroethene: Stage 4 Ashford Rd & Everard Ave, Keswick South Australia Kelvinator Australia Pty Limited
WSP | Parsons Brinckerhoff Project No 2201557c
Such a risk may potentially occur due to the intrusion of vapours from the sub-floor soil, through the floor slab and into the buildings. The approach taken to the testing of that potential risk was to measure the contaminants, if present, at three points along the exposure pathway – firstly in soil vapour beneath the floor slab, secondly in the flux of the contaminant vapours passing through the floor slab, and thirdly in the concentration of contaminant vapours in the indoor air of the buildings. This approach could demonstrate that even if contaminant vapours are present beneath the concrete flooring of the building, the presence of those vapours may not pose an unacceptable risk to building occupants. Low flux rates of contaminants entering the buildings through the floor and low indoor air concentrations, would demonstrate that the vapour intrusion pathway is incomplete.
Indoor ambient air measurements were one of the three lines of evidence along the vapour intrusion pathway. It is possible that TCE (the major contaminant of interest) was being used in the Australian Motors building, although the probability was very low because of the non-industrial, non-processing nature of the business activities in the offices and warehouse. Site management indicated that no such chemicals were in use.
Guidance criteria on acceptable vapour concentrations of chlorinated volatile compounds, available in the National Environment Protection Council (NEPC) 2013, National Environment Protection (Assessment of Site Contamination) Amendment Measure 2013 (No. 1) apply only to the concentrations of certain individual chlorinated VOC compounds in the soil vapour within the shallow soil profile or directly beneath a floor slab. The criteria are presented as Tier 1 screening level values which, if exceeded, indicate a need for a tier 2, more site specific or a more direct measurement of actual risk posed by the vapours. For this current investigation at the Australian Motors building that tier 2 higher level assessment comprised the measurement of surface flux through the warehouse floors and the measurement of indoor air concentrations of the contaminants of interest. The tier 2 measurements were undertaken concurrently with the sub-slab soil vapour testing on the basis that there was a reasonable probability that soil vapour concentrations would exceed the very conservative criterion for TCE given in the NEPM 2013 guidance document.
4.3 Sub-slab soil vapour sampling plan
WSP | Parsons Brinckerhoff has no knowledge of previous environmental investigations at the Australian Motors facility. And, no information on the exact commercial and industrial activities conducted at the site in the past were available at or prior to the vapour investigation carried out in February and March 2016 by WSP | Parsons Brinckerhoff.
Design
Six sub-slab soil vapour testing points were located on a generalised grid pattern across the warehousing area of the building. Keswick creek, an enclosed culvert or pipes, passes beneath the southern portion of the building. Sub-slab soil vapour test points were not placed over the alignment of the creek. The area on the southern side of the creek alignment was office and facilities, thus unlikely to have been the source area of industrial solvents. The vapour testing was therefore done on the norther side of the creek alignment. Sampling locations are shown on Figure 6.
Methodology
The passive soil vapour sampling tube type used was the Waterloo Membrane Sampler – Low Uptake (WMS_LU™), developed by the University of Waterloo. While the WMS_LU™ sampler is a passive sampler, containing an absorptive carbon medium within a small glass vial with a permeable membrane at the end of the glass vial, the sampler has been specifically designed and developed to allow quantification of volatile organic compounds in the soil pore space. A description of the method of passive soil vapour sampling using the WMS samplers is given in McAlary et al., 2009.
The method allows for the calculation of actual concentrations in the soil gas on account of two critical features of the method. Firstly, the samplers are designed to maintain a constant but low uptake rate which,

8
Groundwater and Soil Vapour Investigations of Trichloroethene: Stage 4 Ashford Rd & Everard Ave, Keswick South Australia Kelvinator Australia Pty Limited
WSP | Parsons Brinckerhoff Project No 2201557c
consequently, establishes the second critical factor – prevention of the depletion of the target analyte concentrations (the VOCs in the soil void), i.e., a ‘starvation effect’ is avoided and a constant uptake rate onto the sampler is maintained. Uptake rates for the sampler have been empirically derived and the method has been validated against the TO-15 active sampling method.
Data are expressed as calculated concentrations of soil vapour, in the units of µg/m3. The calculation was performed using the manufacturer’s published uptake rates which are specific for each compound and for the type of sampler used (i.e. the WMS_LU™). Expression of the data in concentration terms allows direct comparison of the measured concentrations against health investigation levels (HILs) for soil vapour published in NEPM, 2013.
The concrete floor was drilled using a 20 mm diameter drill bit on a hand held electric drill to depths of 300 mm below the top of the concrete which was approximately 10 cm thick at all six locations. To deploy the WMS-LU™ tubes in the holes, the tubes were first wrapped in metal flyscreen to protect the sampling tube from direct contact with soil. The tube was then lowered into the drilled hole attached on a wire. The duplicate samples were two tubes placed in the same hole. The holes were sealed using a sand-cement grout to provide an air and water seal. The grout plug was finished flush with the pavement surface.
Sampling tubes were recovered from the sampling holes after 17 days of deployment by pulling up the sampler by the attached wire after breaking the grout seal. Sampling tubes were placed in their glass vials and sent under chain of custody to the analytical laboratory, SGS - Leeder Consulting.
4.4 Surface mass flux sampling plan
The surface mass flux of VOCs was measured by passive flux chambers immediately adjacent to or within 2 m of each of the 6 sub-slab soil vapour sampling locations. Two forms of duplicate samples were taken. One duplicate sampling involved the placement of two sampling tubes within the same chamber. In such a case the masses collected on each of the tubes must be added to provide the total flux. In the second type of duplicate, a second chamber was placed immediately beside the primary chamber. In this investigation, AM Flux 7 was the adjacent duplicate. AM Flux 7 was a smaller chamber with half the footprint of the other chambers. Thus the mass collected on needs to be factored by 2 in order to make the mass flux collected comparable to the other chambers.
While human health based criteria are available for sub-slab soil vapour concentrations, health risks only arise if the sub-slab vapours permeate through flooring by means of molecular diffusion fluxes or by advective flows through floor joints in the concrete. The passive flux chambers deployed in the August 2015 investigations measure the diffusive molecular fluxes of the VOCs through the floor from the sub-slab vapours and thus provide a more direct measure of potential vapour intrusion risks.
Flux sampling methodology
The passive flux chamber involves the placement of a high uptake rate sorption tube within the void of a stainless steel chamber located directly on the ground surface or pavement. After the predetermined deployment period of around 20 days for the chambers used in the current investigations, the passive sorption tubes were collected for laboratory analysis involving solvent extraction followed by GC-MS analysis.
For the current investigation, Radiello solvent desorption tubes (ID code 130 cartridge) were used, allowing a detection limit of 0.05 µg/tube. The samplers are suitable for deployment periods of days or weeks. The detection limit, expressed as a calculated flux, is proportional to the deployment (sampling) time. Radiello sampling tubes are described in: Radiello Fondazione Salvatore Maugeri-IRCCS, http://www.radiello.it/index.html
The principal of operation of the passive flux chamber is that the VOC mass absorbed onto the passive tube placed within the chamber void is a close approximation of the total VOC mass flux into the chamber from

9
Groundwater and Soil Vapour Investigations of Trichloroethene: Stage 4 Ashford Rd & Everard Ave, Keswick South Australia Kelvinator Australia Pty Limited
WSP | Parsons Brinckerhoff Project No 2201557c
the surface on which the chamber is placed. For the mass collected on the sampling sorption tube to be approximately equal to the mass flux into the chamber, a concentration depression within the chamber must be maintained. This is achieved through the high sorption rates (sampling rates) of the Radiello sampler which has a capacity to sorb contaminants at a greater rate than the flux into the chamber. Essentially, the Radiello sampler ‘captures’ the mass flux into the chamber from the ground surface. The concentration depression is maintained unless the sorption tube becomes saturated. Saturation of the sorption tube would not occur under normal sampling conditions. Maintenance of the concentration depression has been previously demonstrated and reported in Heggie & Stavropoulos 2010.
Flux into the passive chamber can thus be expressed as:
Flux (µg/m2/h) = mass on tube (µg) x 1/chamber footprint (m2) x 1/ sampling duration (h)
Deployment method – passive flux chambers
The stainless steel passive flux chambers, 0.35 m in diameter and 8 L capacity, were seated on the concrete flooring of the warehouses. A Radiello passive absorptive sampling tube was suspended within the void of the chamber. To ensure no advective exchange of air occurred between the ambient air (the outdoor atmosphere) and the air within the chamber each chamber was sealed to the floor surface by placing BluTack around the outer rim of the chamber and the floor.
After the predetermined deployment (i.e. sampling) time, the sampling tubes were removed from the chambers and placed in sealed glass vials for transport to the analytical laboratory.
4.5 Ambient air sampling plan
Ambient air concentrations of the contaminants of interest were measured at three locations within the warehouse buildings of the Australian Motors building and at two locations immediately outside the building – the outside locations used to obtain background ambient air concentrations.
Ambient air was sampled using Radiello code 130 solvent desorption tubes. The sorption tubes consist of activated carbon housed in a cylindrical steel gauze. The Radiello tubes were designed for the sampling of volatile organics in ambient air.
Sampling tubes located outside the building were placed within cassette holders and suspended within rain shelters and affixed to fences or other structures around the perimeter of the building at heights of about 1.5 m. Sampling tubes located inside the building were identically housed except the rain shelters were not required.
Deployment period for ambient air sampling is not critical and for ambient air sampling is normally conducted over periods of days or weeks. Providing the tubes remain dry (sheltered from rain), the length of exposure is not crucial to effective sampling. For the investigations at the K2 site the ambient air sampling tubes were deployed for a period of 17 days.
At the completion of the sampling period, the sorption tubes were recovered from the Radiello cassette holders and placed into dedicated glass vials for transport to the analytical laboratory. Analysis of the passive samplers was performed by solvent desorption and gas chromatography/mass spectrometry (GC-MS). Detection limits are typically around 0.05 µg/tube which equates to about to around 0.03 µg/m3 or less for the 17 day deployment times.

10
Groundwater and Soil Vapour Investigations of Trichloroethene: Stage 4 Ashford Rd & Everard Ave, Keswick South Australia Kelvinator Australia Pty Limited
WSP | Parsons Brinckerhoff Project No 2201557c
5 DATA QUALITY OBJECTIVES 5.1 Setting data quality objectives – program planning
Schedule B2 of the NEPM 2013, recommends that a systematic planning process is used for defining the objectives of the assessment and the sampling plan that can meet those objectives. The NEPM 2013 states:
“In its simplest form, the planning process should consider:
the overall objective of the site assessment
the decision(s) to be made on the basis of the site assessment findings
the constraints on the assessment (financial, time and logistical) and
the degree of flexibility to conduct follow-up investigations.”
The intent of the above planning process is to identify the methodologies needed to undertake measurements that are achievable and collect data that are adequate to meet the study objectives. A second aspect of data quality control is the process of assuring the quality of the data collected which in turn involves the controls on how samples are collected. A third aspect is the means by which the reliability of the analytical results is quantified.
The US EPA has produced a document describing a process for quality assurance planning for projects. The document, USEPA 2000, Guidance for the Data Objective Process and Data Quality Objectives Process for Hazardous Waste Site Investigations specifies that the Data Quality Objectives process is a seven step planning approach to develop sampling designs for data collection activities that support decision making. This process uses systematic planning and statistical hypothesis testing to differentiate between two or more clearly defined alternatives (i.e. alternative conditions such as compliance or non-compliance. The USEPA’s DQO process describes a seven step process designed to support systematic planning of an environmental program.
For the present investigation WSP | Parsons Brinckerhoff has adapted the US EPA’s seven step DQO process to the project objectives. A description of the process is given below.
The ‘Problem’
This step involves clarifying the issue to be resolved – i.e. the problem that initiated the study. In this case the problem is to produce reliable data that accurately define the concentrations in the regional aquifer at the chosen sampling locations and vapour data that can be used to answer the question as to whether unacceptable risk to human health exist in the building tested.
Identify the decision
The decisions are: i) whether groundwater is contaminated by TCE and ii) whether there is an unacceptable risk from vapour intrusion in the building tested. The decisions are based on data considered to be of acceptable quality.
This step also includes the process of devising a conceptual model that illustrates the spatial characteristics of the contaminant impacts.

11
Groundwater and Soil Vapour Investigations of Trichloroethene: Stage 4 Ashford Rd & Everard Ave, Keswick South Australia Kelvinator Australia Pty Limited
WSP | Parsons Brinckerhoff Project No 2201557c
Identifying inputs to the decision
This process identifies the information that is needed to resolve the problem and make a decision. This involves sampling and analytical methods, acceptance of the quality of the data and acceptance of the adequacy of the conceptual model in describing the possible contamination.
Defining the study boundaries
In this step the spatial and temporal limits to the investigation are defined. These boundaries were set in the scope of work.
Developing a decision rule & specifying limits on decision errors
These steps involve the choosing of parameters and action levels on which to base a decision. These steps are not essential for the current plume delineation study as the objectives of the study are not to determine compliance, but rather, to determine the location of the plume. The decision to take no further action will be dependent, in part, on whether the plume has been delineated.
In the case of vapour data, the decision as to whether a risk exists is based on calculation of exposures and the accepted risk levels and accepted toxicity levels.
Optimisation of the design for obtaining data
This step involves processes and considerations for designing a resource effective sampling and analysis program. Section 4 describes the rationale for the current study’s sampling and analysis plan.
5.2 Considerations in the data quality planning process – vapour investigation
With regard to controls on project quality planning and design, the following comments are relevant.
The overall and principal objective of the vapour work planned and undertaken in February/March 2016 at the Australian Motors building, was to identify the presence and distribution of chlorinated solvent soil vapours in the sub-floor-slab soils, in the floor flux and in the ambient indoor air. The data were required to be sufficient to show whether or not there was an unacceptable health risk to building occupants from sub-floor vapours intruding into the building.
With regard to the decisions to be made on the basis of the findings, the results may assist in any considerations of possible further work or in any control measures if unacceptable risks were indicated by the data.
The large area to be assessed and the finite number of sampling locations meant that the available data may not be sufficient to delineate the contaminant sources to the extent needed. However, the sampling design was formulated so as to aid decisions of future assessment, if considered necessary – based on the findings.
5.3 Data quality control – field and laboratory
5.3.1 Surface flux measurements
Field data quality control for passive flux chambers is a relatively simple process that involves:
proper handling of the sampling tubes to avoid contaminating the tubes during deployment into the chambers and collection from the chambers, and avoiding any exposure of the sampling tubes to contaminants other than during the deployment within the chambers. This process is easily achieved by the use of clean nitrile gloves when handling the tubes and avoiding any contact of the tubes by hand.

12
Groundwater and Soil Vapour Investigations of Trichloroethene: Stage 4 Ashford Rd & Everard Ave, Keswick South Australia Kelvinator Australia Pty Limited
WSP | Parsons Brinckerhoff Project No 2201557c
careful handling of the cleaned flux chambers to ensure the internal chamber surface remains untouched during transport and deployment;
ensuring no gap exists between the chamber rim and the ground surface through which an advective air exchange could occur;
taking duplicate samples within one or more of the chambers to provide a measurement of the precision of the measurements. For the current investigation duplicate tubes were placed in two of the flux chambers. There are no Australian reference guidelines for the acceptable degree of difference (as assessed by relative percent difference (RPD)) for flux measurements, nor even for soil vapour concentration measurements. Acceptability of an RPD value is dependent on measured mass, relative to the detection limit. Generally, where the measured mass is more than one order of magnitude greater than the detection limit, RPDs within 100% are acceptable. The detection limit for flux measurements are at trace levels, so even an RPD of 100% for values 10 times the detection limit is entirely acceptable as both values are still at trace levels. The value of RPDs becomes significant only when one or both of the measured concentrations are within a factor of two or three of the unacceptable risk levels. In that range, an RPD of 67% is acceptable.
analysing one trip blank to quantify any background contaminants on the sampling tubes.
These actions to ensure the quality of the field samples are not difficult to achieve and certainty in their achievement is easy to verify at the time of the field sampling.
Laboratory quality control can be evaluated by the results from method blank testing and from recoveries from spiked samples. For the current investigation the analytical laboratory undertook one method blank analysis and one method spike analysis – conducted in duplicate.
5.3.2 Sub-slab vapour measurements
Field data quality control for sub-slab vapour measurements is, like the process for flux, a relatively simple process that involves:
proper handling of the sampling tubes to avoid contaminating the tubes during deployment into the drilled holes and collection from the holes at conclusion of sampling, and avoiding any exposure of the sampling tubes to contaminants other than during their deployment. This process is easily achieved by the use of clean nitrile gloves when handling the tubes and avoiding any contact of the tubes by hand.
Deploying the sampling tubes into the drilled holes in a manner that protects the tubes from direct contact with soil and water; and the sealing of the holes to prevent the entry of air or water for the duration of the sampling period.
taking duplicate samples within one or more of the chambers to provide a measurement of the precision of the measurements. For the current investigation duplicate tubes were placed in two of the flux chambers. There are no Australian reference guidelines for the acceptable degree of difference (as assessed by relative percent difference (RPD)) for flux measurements, nor even for soil vapour concentration measurements. Acceptability of an RPD value is dependent on measured mass, relative to the detection limit. Generally, where the measured mass is more than one order of magnitude greater than the detection limit, RPDs within 100% are acceptable. The detection limit for flux measurements are at trace levels, so even an RPD of 100% for values 10 times the detection limit is entirely acceptable as both values are still at trace levels. The value of RPDs becomes significant only when one or both of the measured concentrations are within a factor of two or three of the unacceptable risk levels. In that range, an RPD of 67% is acceptable.

13
Groundwater and Soil Vapour Investigations of Trichloroethene: Stage 4 Ashford Rd & Everard Ave, Keswick South Australia Kelvinator Australia Pty Limited
WSP | Parsons Brinckerhoff Project No 2201557c
It is critical to ensure that any supporting materials deployed with the sampling tubes – such as the protecting wire screen in which the sampling tubes are wrapped before deployment into the holes, is laboratory tested to ensure it is free from VOCs.
Upon collection of the sampling tubes from the holes, placement of the tubes immediately into their vials and ensuring complete sealing of the vials.
Laboratory quality control can be evaluated by the results from method blank testing and from recoveries from spiked samples. For the current investigation the analytical laboratory undertook one method blank analyses and one method spike analysis.
5.3.3 Groundwater sampling
Groundwater monitoring well construction, development, purging and sampling were conducted in general accordance with Parsons Brinckerhoff’s standard procedures, which are based on industry accepted standard practice. The key requirements of these procedures are listed below:
decontamination procedures – including the use of new disposable gloves for the collection of each sample, decontamination of gauging equipment, using new disposable Hydrasleeve sampling sleves for the collection of each sample and the use of dedicated sampling containers provided by the laboratory
sample identification procedures - collected groundwater samples were immediately transferred to sample containers of appropriate composition and preservation for the required laboratory analysis. All sample containers were clearly labelled with a sample number, sample location, sample date and sampler’s initials. The sample containers were then transferred to a chilled esky for sample preservation prior to and during shipment to the testing laboratory
chain of custody information requirements – a chain-of-custody form was completed for each batch of samples and forwarded to the testing laboratory
sample duplicate frequency – sufficient duplication to comply with the NEPM 2013 guidance.
Field observations were documented in accordance with the approved sampling and analysis plan. Chain-of-Custody documentation was prepared for sample transfer from the point of sampling to the laboratory. Quality control checks were conducted both in the field and at the laboratory.
All samples were labelled in the field with a unique sample identification code by writing on a sample label affixed to the side of the container in waterproof indelible (xylene free) ink.
Sample containers
All samples were collected and placed into laboratory prepared bottles for waters, prepared with appropriate preservation.
Water quality meter calibration.
A Water Quality Meter used for field obtaining field parameters was calibrated at the beginning of the monitoring period by the provider.
5.3.4 Field quality control
Field quality control procedures used during the groundwater sampling comprised:
Field duplicates: these are prepared in the field by filling two sets of two sample vials from the same sampling sleeve. The field duplicate samples were sent to the project laboratory. Field duplicates

14
Groundwater and Soil Vapour Investigations of Trichloroethene: Stage 4 Ashford Rd & Everard Ave, Keswick South Australia Kelvinator Australia Pty Limited
WSP | Parsons Brinckerhoff Project No 2201557c
provide an indication of the analytical precision of the project laboratory, but may also be affected by factors such as sampling methodology or inherent heterogeneity of the sample medium. Field duplicates were collected at a rate of at least 1 in 10 samples. One primary lab duplicate was collected from amongst the 8 wells sampled, and one duplicate was analysed by a check laboratory.
Rinsate blank: a sample made by rinsing field equipment with laboratory supplied rinsate water. Rinsate blanks provide an indication of the adequateness of decontamination procedures and the sterility of disposable equipment. One rinsate blank was collected and analysed.
Trip blank: a sample prepared by the laboratory using clean water. The sample is transported with the sample containers, and remains with the batch of field samples until analysed with the field samples at the laboratory. Trip blanks provide an indication of contamination introduced during sample transport and handling. One trip blank was prepared by the primary laboratory and later analysed.
The Relative Percentage Differences (RPDs) for groundwater were calculated for the primary and duplicate samples for assessment of the data quality, in particular for assessment of the reproducibility of the analytical data measurements or ‘precision’ given the adopted field and laboratory methods. There are no reference criteria for the evaluation of acceptability for RPDs for volatile organics in groundwater, which are the contaminants of concern. The acceptability of the RPD achieved is dependent on the closeness of the measured values to the laboratory reporting limits. In practice, as a general indicator, RPDs less than 100% are acceptable when values are greater than ten times the laboratory reporting limits.
The RPDs were calculated using the formula below, and the results are presented in Appendix C.
where Ro is the primary sample and Rd is the duplicate or the triplicate sample.
5.4 Laboratory quality assurance
5.4.1 Laboratory quality assurance
Primary and intra-laboratory duplicate samples were analysed by Envirolab. The check laboratory was Eurofins. Both the laboratories used are accredited by NATA for the analyses undertaken, and methods followed by these laboratories are in accordance with the requirements of NEPM 2013.
5.4.2 Laboratory quality control
Laboratory quality control (QC) procedures were undertaken at the project and check laboratories. The following tests were conducted.
The primary laboratory conducted one method bland and one spike recovery. Duplicates were assessed by calculating the RPD. Blanks should return analyte concentrations as not detected. Percent recovery is used to assess spiked samples and surrogate standards. Per cent recovery - although dependent on the type of analyte tested, concentrations of analytes and sample matrix - should normally range from about 70-130%.
Assessment of laboratory QC was undertaken internally by the individual laboratory; however, the results were independently reviewed and assessed by Parsons Brinckerhoff.
%1002/)(
%RdRo
RdRoRPD

15
Groundwater and Soil Vapour Investigations of Trichloroethene: Stage 4 Ashford Rd & Everard Ave, Keswick South Australia Kelvinator Australia Pty Limited
WSP | Parsons Brinckerhoff Project No 2201557c
6 REFERENCE GUIDANCE FOR CONTAMINANTS
6.1 Groundwater
Reference guidelines used for the evaluation of groundwater quality should relate to the use and potential use of the groundwater and to the use of receiving water bodies – streams, lakes, estuarine and marine waters. The fate of the impact to groundwater is currently not known, nor are the receptors. Consequently, appropriate water quality criteria for the groundwater has not been identified (with respect to groundwater in the area investigated). Nevertheless, for the purpose of providing reference values, both ecological and drinking water guidelines are presented here for selected chlorinated VOCs.
Table 6-1 summarises the groundwater assessment criteria used in this investigation.
Table 6.1 Groundwater investigation levels
ANALYTE FRESHWATER ECOSYSTEM
(µg/L)
MARINE WATER GUIDELINES
(µg/L)
AUSTRALIAN DRINKING WATER GUIDELINES (µg/L)
SA EPA 2003 POTABLE WATER
WHO 2005 DRINKING
WATER
TCE 330 330 20
PCE 70 70 50 40
cis-1,2-DCE - - 60
Vinyl Chloride 100 100 0.3 0.3
1,1-dichloroethene 30 30
Carbon Tetrachloride 3 3
1,2-dichloroethane - - 3 3
1,1,2-trichloroethane 6,500 1,900 -
6.2 Soil vapour
Relevant screening level (tier 1) guidelines, for human health effects, relating to soil vapour concentrations are interim soil vapour health investigation levels for volatile organic chlorinated compounds (HILs) presented in Schedule B1 Investigation Levels for Soil and Groundwater in the NEPM. HILs for the contaminants of interest for this investigation are listed in Table 6.2.

16
Groundwater and Soil Vapour Investigations of Trichloroethene: Stage 4 Ashford Rd & Everard Ave, Keswick South Australia Kelvinator Australia Pty Limited
WSP | Parsons Brinckerhoff Project No 2201557c
Table 6.2 Interim screening level criteria for soil vapour concentrations of chlorinated VOCs. Criteria are applicable to shallow soil (to 1 m below ground/floor level)
CHEMICAL INTERIM SOIL VAPOUR HIL (µg/m3)
Commercial/industrial land use Low density residential land use
tetrachloroethene 8,000 2,000
trichloroethene 80 20
cis-1,2-dichloroethene 300 80
vinyl chloride 100 30
Of the HILs the NEPM states:
“Interim HILs for VOCs are conservative soil vapour concentrations that can be adopted for the purpose of screening sites where further investigation is required on a site-specific basis. They are based on the potential for vapour intrusion using an indoor air-to-soil vapour attenuation factor of 0.1...”
Thus the guideline can be interpreted to mean that a sub-slab concentration of 80 µg/m3 of TCE may result, if taking a conservative statistical approach, in causing an indoor air concentration of 8 µg/m3, which, if exceeded, would represent a possible health risk to building occupiers (in commercial or industrial buildings).
6.2.1 Surface mass flux
There are no published reference values for flux rates. It would not be appropriate to produce and present such reference values as the effect of the flux is dependent on the resulting concentration which itself is dependent on the mixing rate within the receiving air (such as a room within a building).
For the present investigation, flux has been used to provide an indication of whether the TCE measured in the sub-slab vapours is diffusing through the floor at rates that could lead to a potential health risk, via the vapour intrusion process, for occupants of the existing on-site buildings.
With regard to the use of flux as a method to evaluate and quantify potential vapour intrusion health risks, both Australian and overseas guidance refers to surface flux as a further line of evidence that provides a measurement near to the end of the vapour intrusion pathway. Flux measurements are commonly taken as a next step when high sub-slab vapour concentrations have been detected. It is the only measurement method that measures the diffusive pathway of vapours into the building through the floor.
6.2.2 Ambient air
There are no published Australian reference values for indoor ambient air concentrations of chlorinated VOCs other than reference concentrations published by the NSW Department of Environment, Climate Change and Water in the document Vapour Intrusion: Technical Practice Note, September 2010. The document lists a reference concentration for TCE of 23 µg/m3. The value is referenced as being sourced from WHO 2000 and is derived from a 1 x 10⁻⁵ risk level and a carcinogen unit risk of 4.3 x 10⁻⁷ per µg/m3. Although not discussed in the reference document, the value of 23 µg/m3 listed for acceptable ambient air, applies to a 24 hour per day exposure for a person’s lifetime. Without adjustment for a typical commercial worker’s period of exposure, this value is highly conservative.

17
Groundwater and Soil Vapour Investigations of Trichloroethene: Stage 4 Ashford Rd & Everard Ave, Keswick South Australia Kelvinator Australia Pty Limited
WSP | Parsons Brinckerhoff Project No 2201557c
In more recent times the US EPA has listed in its IRIS data base a reference dose for TCE of 2 µg/m3 and a Unit Risk of 4.1 x 10⁻⁶. Using an acceptable risk level of 10-5 (one extra cancer per 100,000 people), the Unit Risk equates to an acceptable air concentration of 2.4 µg/m3. These numbers are 10 times lower than those derived from the WHO criterion. It should be noted that the ambient air concentrations listed in, or derived from the WHO and US EPA criteria need to be factored for receptor exposure, which, for the commercial worker’s exposure is a factor of 0.08 for carcinogens and 0.22 for non-carcinogens.
Occupational hygiene air exposure limits do not apply for commercial workers who are not working with the chemicals of interest.

18
Groundwater and Soil Vapour Investigations of Trichloroethene: Stage 4 Ashford Rd & Everard Ave, Keswick South Australia Kelvinator Australia Pty Limited
WSP | Parsons Brinckerhoff Project No 2201557c
7 FIELDWORKS 7.1 Installation, development, gauging and sampling of groundwater
monitoring wells
Five bores were drilled into which monitoring wells were installed on 15,16, 17 and 20 February 2016. Bores were drilled using push-tubes to the maximum depth possible (about 7 m) so as to allow for accurate descriptions and logging of the profile. Identification of more permeable and wet layers was necessary to identify potential zones of groundwater migration, and particularly to identify the presence and vertical structure of perched water layers. Bores were continued to depths of 19 m below ground level using solid flight augers.
Wells were installed using 50 mm diameter PVC casing with 3.0 m screened sections from the base of the bore. Bore and well construction details are shown in the bore logs included in Appendix D.
Wells were developed after completion of construction by bailing the wells with a stainless steel bailer until water turbidity and sediment load substantially declined.
Wells were gauged on 29th February 2016, 9 days after the last of the wells was installed. In addition to the five newly installed wells, three existing wells on the K1 site were also gauged as were five existing wells (wells screened in the regional aquifer) on the K2 site.
Sampling of the five newly installed deep wells and three existing wells on the K1 site, was carried out on the 1st March, 2016, 10 days after the completion of installation of the final of the four new wells. Water samples for analysis were collected using HydraSleeve ™ samplers.
7.2 Installation of passive sub-slab sampling tubes
The WMS_LU passive soil vapour samplers were installed into the sub-slab at 6 locations by drilling 20 mm diameter holes in the concrete flooring of the warehouses using a hand held electric hammer drill. Sample tubes were inserted into the holes, suspended on a wire so as to allow retrieval after the sampling period of 17 days. Samples were deployed on 15 February 2016 and retrieved on 4 March 2016. The tops of the boreholes were sealed using a cement grout which was chipped out at the time of retrieval of the sample tubes.
7.3 Deployment of passive flux chambers
The passive flux chambers were located immediately adjacent to, or within 2 m of each of the 6 sub-slab soil vapour testing points. The sampling deployment period was the same for both the sub-slab tubes and the flux chamber tubes. All sub-slab and all flux sampling tubes were collected on 4 March 2016.
7.4 Deployment of ambient air sampling tubes
Ambient air sampling tubes, Radiello solvent desorption tubes, code 130, shared the same sampling period as the flux and sub-slab sampling tubes. The Radiello tubes were clipped to walls or structural posts within the warehouse, or on external walls of the warehouse buildings at heights of approximately 2 m. Three tubes were placed inside the warehouse and two immediately outside.

19
Groundwater and Soil Vapour Investigations of Trichloroethene: Stage 4 Ashford Rd & Everard Ave, Keswick South Australia Kelvinator Australia Pty Limited
WSP | Parsons Brinckerhoff Project No 2201557c
8 GROUNDWATER SAMPLING RESULTS & DISCUSSION
8.1 Geological profile
Five new bores were drilled to depths of 19 m below grade. The profile was primarily a silty or sandy clay, varying largely, only with respect to the proportion of sand and the moisture content. Wet layers lying above the standing water level of the regional aquifer were encountered in some of the wells at variable depths. KMW1d showed a wet layer at 9 m, KMW5 at 10 m, and KMW6 showed wet layers at 6 m and 10 m. Bore logs are included in Appendix D.
8.2 Hydrogeological profile & groundwater gradient
The additional five newly installed monitoring showed the depth to the regional aquifer, originally defined in the August 2014 investigation at the K2 site (Parsons Brinckerhoff September 2015), lay between 14.4 and 15.4 m below ground level. Upper water bearing zones, i.e., perched water identified in the earlier investigations at the K2 site, was not investigated in the current investigation, although it was gauged in shallow well KMW1 at a depth of 7.8 m below ground level. Wet zones in the soil profile above the saturated zone of the regional aquifer were observed and logged at three of the five new wells installed.
Figure 3 shows the standing water levels in all monitoring wells installed into the regional aquifer. A flow direction from south-east to north-west is shown in the drawing. A cross sectional drawing of the hydrogeological structure along the flow direction transect shown in Figure 3, is shown in Figure 4. Figure 4 shows a consistent fall in standing water levels along the transect from south-east, GW6, to KMW6 north-west on the K1 site. The fall is approximately 1 m in 100 m, which represents a distinct and unambiguous gradient. This north-westerly flow direction is consistent with the overall direction of Keswick creek which traverses the investigation area, albeit, as a piped channel.
Measured standing water levels, shown in Figure 3, show a consistent pattern, although KMW2, recorded a inconsistent level, somewhat higher than predicted from the overall gradient. The difference was also observed in three previous gauging events dating back to December 2013 (Tierra Environment, 18, December 2013; Parsons Brinckerhoff, 26 February 2015; Parsons Brinckerhoff, 30 September 2015). The differences may relate to the longer screen length on the KMW2 well which extends from within the regional aquifer up into the higher levels where perched water may be present. The screening on KMW2 extends from 11.5 m AHD to 19.0 m AHD. The standing water level of the regional aquifer is at 13.44, so the well is screened about 2 m into the regional aquifer. The drilling of near-by wells KMW1d and KMW5 found saturated clayey sand 18 m AHD and 17 m AHD, respectively, indicating that perched water is likely within the screened interval of KMW2. An interception of perched water may account for the anomalously high standing water level in KMW2.
8.3 Pattern of groundwater impacts
Concentrations of VOCs in groundwater are tabulated in Table A2 of Appendix A and Figure 5 shows the spatial distribution of the major contaminant, TCE.
Well KMW2 on the K1 site remains the only well with substantially high concentrations of TCE (28,560 µg/L). The new wells off-site to the north and west of the K1 site showed impacts in all, but at much lower concentrations. The highest off-site concentration of TCE was 1,100 µg/L at KMW4 on the NHP site. It can reasonably be assumed that well KMW2 is at or near the centre of a TCE source area, but it is not known whether the off-site wells are directly down-gradient of the source at KMW2. There may be other areas of impact causing the observed concentrations in the off-site wells. This observation is supported by the

20
Groundwater and Soil Vapour Investigations of Trichloroethene: Stage 4 Ashford Rd & Everard Ave, Keswick South Australia Kelvinator Australia Pty Limited
WSP | Parsons Brinckerhoff Project No 2201557c
pattern of impacts by carbon tetrachloride which appears to be unrelated to the TCE source or sources. Carbon tetrachloride does however appear to originate on the K1 site as there were no detections in the wells south of Everard Avenue on and around the K2 site which lies up-gradient of the K1 site. Carbon tetrachloride may also have more than one source. Its presence at KMW7 on the K3 site, and the relatively high concentrations at KMW5 on the NHP site, suggest more than one carbon tetrachloride source area.
Another chlorinated VOC appearing in most of the monitoring wells is trichloromethane (chloroform). The observed chloroform may be a degradation product of carbon tetrachloride although some may be naturally formed (Hoekstra et al, 1998).
cis-1,2-dichloroethene (cis DCE) the primary breakdown products of TCE was detected at all but KMW6, and vinyl chloride, a breakdown product of cis DCE, was detected at two wells KMW1 and KMW7. The relatively high chloroform concentration at KMW7 (510 µg/L), compared to a carbon tetrachloride concentration of 480 µg/L, suggest a highly degraded contaminant and the presence of significant cis DCE and vinyl chloride, support this assumption that the contamination is old or a considerable distance from the source.
Despite some uncertainty about the axes of plumes from the K1 site, the data show that high concentrations of TCE are not present in the more distant wells installed in the current investigation, suggesting that TCE may be attenuating substantially. Even the wells just to the north of the K1 site (KMW4 and KMW5) showed TCE concentrations significantly lower than the KMW2 value.
The wells on the K1 site have been sampled three times over the past 2 years (since December 2013). Over this relatively short period trends are not apparent. The measured concentrations are reasonably consistent which in itself confirms the general accuracy of the results. Historical data are tabulated in Table A2.1.
8.4 Metals in groundwater
A suite of 15 metals was included in the analysis of the water sampled on 1 March 2016 as a screening to check that the K1 site was not a source of metals in groundwater. An investigation of metals in groundwater on and around the K2 site (Mott MacDonald, 8 August 2014) identified two wells with lead and total (non-speciated) chromium significantly greater than normal background concentrations. On that basis the screening of metals in the current groundwater investigation was carried out. Results are shown in Table A2 of Appendix A.
Metal analyses showed most metals to be low and typical of background although two metals, chromium (total of all valencies) and molybdenum showed relatively high values in KMW5 on the NHP site. There is no Australian guideline for non-speciated chromium in drinking water or freshwater ecosystems, but the concentration in KMW5 (320 ug/L) is considerably greater that the local background. Molybdenum in KMW5 (320 ug/L) was likewise considerably greater than the local background and exceeded the Australian drinking water guideline of 50 µg/L. Lead, which was elevated in concentration in two of the K2 wells (Mott MacDonald, 8 August 2014), was not detected in any well during the current investigation at and around the K1 site.
8.5 General field water quality parameters
General water quality parameters were measured from sample water remaining in the Hydrasleeve ™ sampling vessel after the decanting of water for analyses of contaminants. Some of the parameter values may not be closely representative of the formation water in-situ. Temperature and dissolved oxygen are most likely to be affected by the measurement method. A general characterisation of the water quality parameters as measured is given below. Data tabulated in Table A3 of Appendix A.
pH readings were consistently near-neutral but slightly alkaline. pH ranged from 6.97 to 8.78.
Electrical conductivity, a measure of salinity, showed the water was of low to moderate salinity. Values ranged from 1,590 S/cm to 3,990 S/cm.

21
Groundwater and Soil Vapour Investigations of Trichloroethene: Stage 4 Ashford Rd & Everard Ave, Keswick South Australia Kelvinator Australia Pty Limited
WSP | Parsons Brinckerhoff Project No 2201557c
Oxidation – reduction potential (ORP) values ranged from 192 to 325 mV, indicating reducing conditions. No readings indicated aerobic conditions.
Dissolved oxygen values measured by Parsons Brinckerhoff in the field samples, varied from 1.28 ppm to 4.57 ppm. In-situ measurements are required for accurate measurements representative of formation water.

22
Groundwater and Soil Vapour Investigations of Trichloroethene: Stage 4 Ashford Rd & Everard Ave, Keswick South Australia Kelvinator Australia Pty Limited
WSP | Parsons Brinckerhoff Project No 2201557c
9 VAPOUR SAMPLING RESULTS AND DISCUSSION
9.1 Weather conditions over the sampling period
Weather conditions may influence shallow soil vapour concentrations and fluxes. For that reason weather records for February and March 2016, which covers the period leading up to and during the sampling time, have been included in Appendix C. The magnitude of the effect of changes in soil vapour concentration in response to changes in soil moisture content has not been clearly established in the literature. However, increasing moisture content in the soil profile is expected to have a minor impact on soil vapour concentrations but for diffusive mass flux rates the influence of increasing moisture within the soil profile may be significant. All 6 of the sub-slab and flux measurement locations were within the warehouse buildings on the Australian Motors site, so for those measurements the influence of recent rainfall was negligible.
Temperature of the soil profile also has an effect on soil pore vapour concentrations, although the effect is relatively small. The expected seasonal range in profile temperature, of about 5 oC would result in a change of about 25% in vapour concentration. The temperature of the soil profile will also influence the mass flux through the profile such that rates of flux will increase with temperature.
The weather conditions prevailing during the period leading up to the vapour testing and during the time of the testing are considered to be normal and typical for the early summer season. Accordingly, the vapour results can be considered to be representative of normal conditions.
9.2 Sub-slab soil conditions
In the process of drilling the concrete flooring to install the sub-slab soil vapour WMS_LU passive sampling tubes it was noted from the drill bit that the material underlying the concrete slab was dry at all locations.
The concrete flooring was approximately 10 to 12 cm thick and the sampling holes were drilled to depths of 25 cm to 30 cm – from the surface of the flooring.
9.3 Sub-slab vapour concentrations
Sub-slab soil vapour sampling points were drilled at 6 locations, all within the warehouse of the Australian Motors building on the K3 site. Analytical results for all compounds in the VOC suite are listed in Table B1 in Appendix B and the spatial pattern of TCE, the only contaminant found at significant concentrations in the sub-slab vapours, is shown in Figure 6.
Concentrations of TCE were high at two sampling locations (i.e. AM SS 1 (19,000 µg/m3) and AM SS 6 (13,000 µg/m3)), both considerably in excess of the vapour intrusion risk based criterion (80 µg/m3). Only two of the 6 locations showed exceedences of the NEPM criterion of 80 µg/m3. Of the other four sampling locations, three were less than the detection limit (2.2 µg/m3) and the third was also low at 9.1 µg/m3.
Sub-slab soil vapour testing location AM SS 1, which showed the highest TCE concentration also showed cis DCE over the vapour intrusion risk based criterion of 300 µg/m3.
The observed high concentrations of TCE are indicative of local soil sources beneath the area of the slab, in the vicinity of the sampling locations.

23
Groundwater and Soil Vapour Investigations of Trichloroethene: Stage 4 Ashford Rd & Everard Ave, Keswick South Australia Kelvinator Australia Pty Limited
WSP | Parsons Brinckerhoff Project No 2201557c
Whether or not the high vapour concentrations present a potential unacceptable vapour intrusion risk to occupants of the warehouse was investigated by way of surface flux measurements on the warehouse floor and measurements of indoor air concentrations which are discussed in the following two sections.
9.4 Surface vapour flux
Surface mass fluxes of VOCs were measured beside all 6 of the sub-slab vapour testing points. Flux chambers were placed immediately adjacent to the vapour points or within 2 m. Analytical results for all compounds in the VOC suite are listed in Table B2 in Appendix B and the spatial pattern of TCE is shown in Figure 7. The data listed in Table B2, and in the laboratory report on flux, are in the units of mass (µg) on the sampling tube. The TCE fluxes, in units of µg/m2/h, have been calculated, in accordance with the equation shown in section 4.4 of this report, and results are shown on Figure 7.
Mass flux rates will show a strong correlation with sub-slab vapour concentrations if the vapour permeability of the concrete slabs making up the warehouse flooring are consistent. There was good agreement between the flux values and the sub-slab soil vapour concentrations. The purpose of measuring the flux beside the sub-slab vapour test points was not to verify one method by the other, but rather to show whether high concentrations beneath the slab were resulting in strong fluxes of contaminant vapours into the internal air of the warehouse, potentially causing vapour intrusion health risks.
In general descriptive terms the results show two locations, AM Flux 1 and AM Flux 6 and its duplicates (see Figure 7), with strong fluxes of TCE. The remaining four locations showed very low flux rates. Note that AM Flux 7 was a duplicate at location AM Flux 6. AM Flux 7 was in a separate adjacent chamber with a smaller foot print which was half the area of the other chambers. It represented a second duplicate of AM Flux 6, the primary duplicate being a second tube within the chamber of AM Flux 6.
The contribution from the floor flux of TCE vapour to indoor air concentrations is discussed in section 9.6.
9.5 Ambient air concentrations
Ambient air concentrations of a suite of VOCs were sampled at three indoor and two outdoor locations at the Australian Motors site. Sampling locations are shown in Figure 8 and results of all compounds in the VOC suite are shown in Table B5 of Appendix B. Compared to the health risk based acceptable air concentrations derived from toxicity values for carcinogenic end points published by WHO and US EPA, 23 µg/m3 and 2.4 µg/m3, respectively, the measured concentrations of TCE were low compared to the WHO criterion but comparable to the US EPA criterion. The highest TCE concentration measured within either of the warehouses was 2.1 µg/m3.
Generally, indoor air concentrations of TCE were about 10 to 30 times higher indoor compared to outdoor air concentrations.
9.6 Evaluation of vapour intrusion health risk
The contribution of the diffusive flux of TCE vapours from beneath the warehouse floor to the indoor air concentrations of TCE, and any other VOC, can be calculated from the flux measurements.
As mentioned earlier in section 4 Sampling Plan and Methods, the mass collected on the passive sampling tubes within the flux chambers can be expressed as a mass per unit area per unit time as:
Flux (µg/m2/h) = mass on tube (µg) x 1/chamber footprint (m2) x 1/ sampling duration (h)
The primary measurement data for flux chambers – i.e. mass of each analyte compound on the sorption tube, are listed in Table B2 Appendix B. The calculated flux rates in units of mass (of TCE) per m2 per hour are shown on Figure 7 and in Table B3.

24
Groundwater and Soil Vapour Investigations of Trichloroethene: Stage 4 Ashford Rd & Everard Ave, Keswick South Australia Kelvinator Australia Pty Limited
WSP | Parsons Brinckerhoff Project No 2201557c
Indoor air concentrations, arising from the diffusive flux were calculated using the following equation.
rateexchangeairVAFlux
Cbuilding
floorair
where, Cair = concentration in indoor air (µg/m3) Flux = measured flux (µg/m2/h) Afloor = floor area of the office or warehouse (m2) Vbuilding = floor area x ceiling height (m3) air exchange rate = volume exchange per hour (h)
The calculation has been run for the highest measured TCE flux, 24.12 µg/m2/h measured at AM Flux7. The calculated indoor air TCE concentration from flux through the floor was 6.48 µg/m3.
The area of the floor is not a critical variable if it is assumed that the flux is equal over the entire floor area. The factor cancels out in the equation. The volume term in the equation is set by assuming a ceiling (i.e., mixing) height and an air exchange rate. For commercial buildings NEPM, 2013 recommends a ceiling height of 3 m. An air exchange rate of 1.24 volumes per hour has been assumed for the warehouse.
The calculated indoor air concentration from the maximum measured flux of 6.48 µg/m3 is an overestimate for the existing building’s measured indoor air concentrations on account of two factors. Firstly, the flux rate used, 24.12 µg/m2/h in the calculation was the highest measured of the seven measurements taken in the warehouse, whereas the average flux (of the 6 locations) was 7.1 µg/m2/h, which would result in an indoor air concentration of 1.9 µg/m3, which is close to the measured results for indoor air in the northern part of the warehouse (see Figure 8). Some contribution of sub-slab vapours to indoor air is expected from possible advective flows of ground vapours through concrete joint gaps although none were identified by PID scanning.
Risk calculation
To place these results into a human health risk context (for carcinogenic risk), using World Health Organisation (WHO) 2000 toxicity and risk guidance values (a unit risk of 4.3 x10⁻⁷) at a risk level of 10-5, the acceptable ambient (indoor) air concentration, without exposure adjustment, is 23 µg/m3. The US EPA’s IRIS data base lists a higher value for unit risk (a more stringent criterion) at 4.1 x 10⁻⁶. Using this ‘toxicity’ derived value and an acceptable risk level of 10-5, an acceptable indoor air concentration of 2.4 µg/m3 is derived. The highest measured indoor air concentration of 2.1 µg/m3 is approximately equal to the IRIS derived indoor air acceptable concentration and the average flux also indicates an indoor air concentration of 1.9 µg/m3, slightly lower than the IRIS criterion. However, local areas of high impact below the floor slab could contribute higher local indoor air concentrations (as was shown by the calculation from the highest measured flux).
The US EPA’s IRIS data base lists also a criterion for non-carcinogenic health risks from TCE. The value, called the reference dose is 2 µg/m3. As this value is close to the concentration for carcinogenic effects, the same risk outcome applies to both carcinogenic and non-carcinogenic health effects. Risk criteria for TCE and PCE are listed in Table 9.1.
As a precautionary approach, a calculation of health risk to commercial workers exposed to the maximum flux rates measured (24.12 µg/m2/h at location AM Flux 7) which may lead to an indoor air concentration of 6.48 µg/m3, has been carried out below (refer to Tables B3 and B4 in Appendix B).
The carcinogenic risk resulting from the flux calculated indoor air concentration of 6.48 µg/m3 is determined using the equation:
Risk = the exposure adjusted concentration x unit risk

25
Groundwater and Soil Vapour Investigations of Trichloroethene: Stage 4 Ashford Rd & Everard Ave, Keswick South Australia Kelvinator Australia Pty Limited
WSP | Parsons Brinckerhoff Project No 2201557c
The adjustment used in the risk calculations is in accordance with the referenced factors listed in Table 9.2 and the equation for the conversion of indoor air concentrations (Cair) to exposure concentrations (EC) is:
EC = Cair x ET x EF x ED / AT
Toxicity values are listed in Table 9.1 and exposure adjustment factors for indoor commercial/industrial workers are shown in Table 9.2. Table 9.1 Toxicity criteria for TCE and PCE
COMPOUND REFERENCE UNIT RISK (CARCINOGENS) (RISK PER µg/m3)
REFERENCE DOSE (NON-CARCINOGENS)
UNITS: µg/m3)
TCE US EPA IRIS database 4.1 x 10⁻⁶ 2
WHO 4.3 x 10⁻⁷ not given
PCE US EPA IRIS database 2.6 x 10⁻⁷ 40
WHO 2010 not classified as a carcinogen
250
Table 9.2 Exposure parameters – commercial/industrial indoor workers
EXPOSURE PARAMETER
UNIT VALUE REFERENCE NOTE
Exposure time (ET) h/day 8 CRC CARE (2011)
Exposure frequency (EF)
days/year 240 CRC CARE (2011) Working days per year
Exposure duration (ED)
years 30 CRC CARE (2011) Number of years in one occupation
Averaging time for carcinogenic effects (ATc)
years 82 CRC CARE (2011) Life expectancy (enHealth (2012))
Averaging time for non-carcinogenic effects (ATnc)
years 30 CRC CARE (2011) set equal to the exposure duration
In accordance with the exposure factors listed in Table 9.2, the factors to adjust the ambient air concentration to the exposure adjusted concentration are 0.08 for carcinogens and 0.22 for non-carcinogens. The potential indoor air concentration determined from the highest measured flux rate, i.e., 6.48 µg/m3 , adjusted for exposure becomes 0.52 µg/m3 for carcinogens and 1.43 µg/m3 for non-carcinogens.
Risk of excess cancer effects is determined from the equation:
Risk = Unit Risk x exposure adjusted concentration in air
And risk of non-cancer health effects is determined by the equation:
Risk = exposure adjusted concentration in air / Reference Dose
Using the WHO Unit Risk value of 4.3 x 10⁻⁷, the excess cancer risk from an exposure adjusted concentration of TCE of 0.52 µg/m3 is 2.4 x 10⁻⁷, which is substantially below the acceptable risk level of 10-5.

26
Groundwater and Soil Vapour Investigations of Trichloroethene: Stage 4 Ashford Rd & Everard Ave, Keswick South Australia Kelvinator Australia Pty Limited
WSP | Parsons Brinckerhoff Project No 2201557c
Using the US EPA IRIS data base Unit Risk of 4.1 x 10⁻⁶ the resultant cancer risk is still very low and acceptable at 2.1 x 10⁻⁶ which is less than the acceptable risk level of 1 in 10-5.
The US EPA IRIS data base lists a reference dose for TCE of 2 µg/m3. WHO does not list a reference dose for non-cancer health effects. The non-cancer risk is thus: 1.43 µg/m3 / 2 µg/m3 which is 0.72, less than the reference dose and thus normally considered acceptable.
These calculations show that there is no indication of an unacceptable health risk from the vapour intrusion pathway into the Australian Motors warehouse. Nevertheless, two of the 6 flux measurement locations showed substantial flux was detected so the presence of sub-slab TCE vapours would need to be considered and further investigated if the site is to be redeveloped.

27
Groundwater and Soil Vapour Investigations of Trichloroethene: Stage 4 Ashford Rd & Everard Ave, Keswick South Australia Kelvinator Australia Pty Limited
WSP | Parsons Brinckerhoff Project No 2201557c
10 ASSESSMENT OF DATA QUALITY 10.1 Groundwater
One groundwater sample was analysed in duplicate by the primary laboratory (Envirolab) and a second sample of another well was duplicated and analysed by a check laboratory (Eurofins). RPDs have been calculated for all compounds where both samples showed a defined number (i.e. results where one or other or both values were reported as less than the limit of reporting, were not assigned an RPD). Results are shown in Table A4, Appendix A. RPDs for the primary lab, the primary sample and the duplicate, were very low for the VOCs (maximum value was 19% for carbon tetrachloride). So too were the RPDs for the TRH fractions (maximum RPD was 24% for the C10-C14 fraction. RPDs for metals were also low with a maximum of 30% for molybdenum. However, some RPDs for the primary lab compared to the check lab samples showed higher RPDs. For the compound of most interest, TCE, the RPD was 51%. While this is acceptable, it is higher than expected given that other VOCs showed lower RPDs. The value of 100% for chromium is of no consequence as the values were close to the detection limits.
A rinsate blank was submitted to the laboratory which showed no detections of any compound analysed. One trip blank was prepared by the laboratory and submitted with the sample batch. There were no detections of any compound in the trip blank.
The primary laboratory analysed on method blank which showed no detections of any compound analysed.
Spike recoveries were also performed by the primary lab. Results showed acceptable recovery rates of between 93% and 117%.
The check lab carried out method blanks and recoveries in laboratory control samples. No detections were found in the blanks samples and recoveries were within acceptable ranges.
10.2 Sub-slab soil vapour
One duplicate sample pair was sampled and analysed. The duplicate pair – for sample location AM SS6 showed high concentrations of TCE and much lower concentrations of PCE and cis-1,2-DCE. The TRH C6-C10 fraction is primarily TCE.
The RPDs for the AM SS6 and its duplicate are acceptable. The RPDs for the main contaminant of interest, TCE, was 26% and 0% for PCE.
As stated in the above section on data quality control planning, there are no Australian guidelines for acceptable values of RPDs for soil vapour measurements. For this study an RPD of 100 % is considered acceptable where the values are greater than 10 times the detection limit. As the highest RPD for all compounds analysed was 84 %, it is concluded that the measurement and analytical methods produced reliable replicable results. Results of the RPD calculations are shown in Table B5 of Appendix B.
One trip blank was analysed. Three petrol compounds were present on the trip blank, hexane, 2-methylpentane and toluene. Chlorinated VOCs, which were the contaminants of interest for the investigation, were not detected on the trip blank. Detection of some petrol compounds on the WMS_LU occurs occasionally, usually at low concentrations, as was observed in the trip blank for this investigation. It can be assumed that the batch of sampling tubes was slightly contaminated by petrol vapours and for that reason, all petrol compounds in the results should be considered contamination.
Trip blank results, where were all non-detect were not separately tabulated. Results can be seen in the laboratory report pages 16 and 17, in Appendix F.

28
Groundwater and Soil Vapour Investigations of Trichloroethene: Stage 4 Ashford Rd & Everard Ave, Keswick South Australia Kelvinator Australia Pty Limited
WSP | Parsons Brinckerhoff Project No 2201557c
The laboratory performed one method blank analysis to test that the extraction and analytical procedures did not introduce any false positives into the results. There were no detections in the blank.
To test the recovery of the extraction process, the laboratory performed two spike recovery analyses in duplicate. Percentage recoveries all fell within an acceptable range, from a low of 96% to a high of 104 %.
Results for the laboratory analyses of method blanks and recoveries are given in the laboratory report page 22, included in Appendix F.
10.3 Surface flux and ambient air
The sampling tubes used for flux chambers and for the ambient air measurements in and around the building were of the same type and from the same batch and analysed in the same run (Radiello SD code 130, solvent desorption). Consequently, the quality assurance measures apply equally to both.
For the flux sampling tubes one duplicate sample was run – at location AM Flux 6. RPDs were very low for all compounds with detections. The highest measured RPD was 25% for 4-isopropyltoluene, a compound of little interest in this investigation. For TCE the RPDs in both duplicate pairs were low at 3% and 4% respectively. Results are shown in Table B6 of Appendix B.
Ambient air duplicates were sampled at AM AA3. The highest RPD for any of the VOC compounds quantified was 23% for dodecane, a compound of little interest for the purposes of the current investigation. The RPD for TCE was 10%. These RPDs are considered low and the results very good. RPDs are listed in Table B7 of Appendix 7.
One trip blank was analysed. Small detections of dodecane and toluene were detected. These results can be seen on page 8 of the lab report in Appendix F.
One method blank was analysed and there were no detections of any compound (see page 8 of the lab report in Appendix F.
The analytical method for the WMS_LU samples used for sub-slab sampling and the Radiello sample tubes used for the flux and ambient air sampling are one and the same. As all the sample tubes of both types were analysed in the same batch, the surrogate recovery testing by the lab, reported in section 10.2, above, are applicable also to the flux and ambient air sample batches.
10.4 Conclusions on data quality assurance
The laboratory quality assurance results were sufficiently good to provide confidence in the accuracy of the measurements. There was close agreement between the duplicate pairs for flux and ambient air and for sub-slab duplicate pairs.
Field trip blanks, laboratory method blanks and surrogate recovery analyses showed very favourable results.
The detection of low concentrations of petrol vapours on the WMS_LU sampling tubes for sub slab sampling was undesirable but as the contamination was restricted to a few petrol compounds, it had no bearing on the results of the investigation. Chlorinated VOCs were not detected on the trip blanks.
It can be concluded that the sampling and analytical quality was good and the results should be considered reliable.

29
Groundwater and Soil Vapour Investigations of Trichloroethene: Stage 4 Ashford Rd & Everard Ave, Keswick South Australia Kelvinator Australia Pty Limited
WSP | Parsons Brinckerhoff Project No 2201557c
11 CONCEPTUAL SITE MODEL The site description given below has been conceptualised in the context of the objectives of the investigation. Those objectives were:
to investigate the extent of the migration of TCE in groundwater downgradient (to the north and west) of the K1 site).
to test the sub-slab soil vapour concentrations and surface floor fluxes beneath the western half of the K3 building (Australian Motors warehouse) to examine whether TCE or related industrial solvents were present and whether, if present, the fluxes were causing an unacceptable risk to workers in the warehouse.
The two objectives are not closely related, except to the extent that they both relate to past releases of TCE on one or more of the former industrial properties referred to in this report as K1, K2 and K3.
Groundwater
Following the completion of the groundwater investigation works described in this report, and earlier investigations on the K1 and K2 sites, the crucial hydrogeological features in the investigation area can be described as follows:
The surface is primarily hardstand – roadways, driveways and warehouse flooring, of concrete and asphalt
The soil profile is silty and sandy clays with some lenses of sand or clayey sand
Bedrock was not encountered to the maximum depth of drilling, 19 m below grade
Layers of perched water, lying at depths of 4 m to 7 m, approximately, with thicknesses up to 2 m (in the bores drilled), are discontinuous across the investigation area (K2 and K1 sites and off-site to the north and west of the K1 site).
A regional aquifer lies at a depth of 13.7 m to 15.4 m below grade. The aquifer has a distinct gradient to the north-west of 1 in 100, a direction roughly in accordance with the flow of Keswick Creek. The potentiometric levels of the regional aquifer coincide approximately with the levels recorded for water strike during drilling. Thus the aquifer appears to be unconfined.
The study area is immediately on the north-eastern side of the natural drainage line of Keswick Creek – the implication being that the K2 and K1 sites are near the base of a shallow valley. The regional aquifer is lower than the base of the creek, thus the regional aquifer does not discharge to Keswick Creek in the vicinity of the investigation area.
Both the perched water layers and the regional aquifer have low level impacts of chlorinated alkenes – the parent compound of which is TCE, and to a very minor extent, PCE. The source of the chlorinated alkenes at the K2 site is most likely the historical spillage or leakage of TCE within the K2 warehouse buildings at more than one location. The TCE has seeped as a dissolved phase solution or diffused as vapour downwards into the lenses of perched water resulting in low concentrations of dissolved phase TCE in the perched water. Some of the TCE has degraded – probably through the naturally occurring reductive dechlorination microbiological process, to cis-I,2-DCE and vinyl chloride, which are present at very low concentrations. A cross sectional drawing of the hydrogeological structure (the perched and the regional water bearing zones) is depicted in Figure 4.

30
Groundwater and Soil Vapour Investigations of Trichloroethene: Stage 4 Ashford Rd & Everard Ave, Keswick South Australia Kelvinator Australia Pty Limited
WSP | Parsons Brinckerhoff Project No 2201557c
The mechanism by which the deeper regional aquifer has been impacted by mainly TCE but also to a lesser degree, cis-1,2-DCE and vinyl chloride, and also carbon tetrachloride, is less clear. In past years there may have been connection between the perched water and the regional aquifer, either through a thickening of the perched aquifer or the rise in level of the regional aquifer, or both. It is also possible that in an area or areas where perched water is not present, dissolved phase TCE has percolated downwards through the profile and into the regional aquifer.
Certain aspects of the distribution of the major contaminants, TCE and carbon tetrachloride, remain unclear. Uncertainties include the following:
Monitoring well KMW2 on the K1 site appears to be in the source area of one TCE source. However, that source alone appears not to account for the observed distribution of TCE.
Sources of TCE and carbon tetrachloride do not seem to coincide closely.
It is not clear whether the TCE and carbon tetrachloride on the K3 site (KMW7) originated from the K1 site, or whether it represents a more localise source. This well shows distinct signs of aged TCE, in that degradation product, cis DCE is relatively high in proportion to TCE and vinyl chloride is also present.
The plume or plumes have not been definitively identified.
Soil vapour
Soil vapour concentrations, of TCE, were high, considerably above the NEPM 2013 interim health investigation levels (HILs) in two of the sub-slab testing points in the Australian Motors warehouse on the K3 site. The high TCE vapour concentrations beneath the northern portion of the warehouse suggest a local soil source. The strength of the vapour impacts is indicative of a soil source rather than a contaminated plume in the regional groundwater (refer to Figure 6).
The spatial extent of the sub-slab soil vapour impacts has not been delineated.
Surface floor flux measurements confirm that the sub-slab vapours, primarily of TCE but also of PCE and cis-1,2-DCE to minor extents, are diffusing through the warehouse floor slab and resulting in a contribution of TCE to indoor air. The floor flux rates were not sufficient to cause unacceptable indoor air concentrations based on human health risk criteria.
31
Groundwater and Soil Vapour Investigations of Trichloroethene: Stage 4 Ashford Rd & Everard Ave, Keswick South Australia Kelvinator Australia Pty Limited
WSP | Parsons Brinckerhoff Project No 2201557c
12 SUMMARY AND CONCLUSIONS
12.1 Summary
An unconfined regional aquifer approximately 14 m to 15 m below ground level had previously been identified with a gradient downwards to the north-northwest or north-west. In earlier investigations on the K2 site in August 2015 (Parsons Brinckerhoff, September 2015), a perched water bearing zone was found to be discontinuous and was considered not a major transport mechanism. The current (February 2016) groundwater investigations were primarily designed to investigate the possible presence of a plume of TCE apparently originating on the K1 site.
TCE and other chlorinated VOCs in groundwater
With respect to migration off-site from the K1 property, two monitoring wells on the NHP property immediately to the north of the K1 site showed low to moderate impacts of TCE , and also carbon tetrachloride, and their degradation products at low concentrations. Based on one well a further 45 m to the north, outside a residential property, where concentrations off all contaminants were very low or near detection limits, it appears the plume has not migrated far to the north along Ashford Road. Westwards of the K1 site, one monitoring well drilled into the K3 site (KMW7) showed low to moderate concentrations of TCE and carbon tetrachloride. At this well the concentrations of the breakdown products, cis DCE and trichloromethane, (respectively degradation products of TCE and carbon tetrachloride) were both at greater concentrations than the parent products indicating aged contamination, possibly at some distance from the source. Alternatively, the results could indicate a local source of considerable age. It should be noted that earlier investigations of sub-slab soil vapours near to KMW7 (Parsons Brinckerhoff, 26 February 2015) had found moderately high concentrations of TCE in soil vapours and current investigations (see below) in the adjoining Australian Motors warehouse, found high sub slab TCE concentrations, indicative of a local source in the soil. In summary, the groundwater investigations to date have not established the dimensions or extent of plumes of TCE or carbon tetrachloride. However, the concentrations found off-site to the north and west of the K1 site were much lower than the maximum found on the K1 site. Dissolved metals in groundwater were analysed in the current investigation in order to screen for the possible occurrence of metals at high concentrations. Most of the metals analysed were at low concentrations. Non-speciated (total) chromium was relatively high in one of the wells on the NHP property (320 µg/L at KMW5), and at this same well, molybdenum, measured at 310 µg/L, exceeded the Australian and South Australian drinking water criterion of 50 µg/L. VOCs in soil vapour Of the six sub-slab soil vapour testing locations beneath the floor slab of the Australian Motors warehouse, concentrations of TCE were high at two and very low or less than detection at the remaining four. The locations showing the high concentrations were both in the northern section of the warehouse. These concentrations, 13,000 µg/m3 at AM SS 6 and 19,000 µg/m3 at AM SS 1, were well in excess of the NEPM’s interim soil vapour health investigation level for TCE, 80 ug/m3 and are indicative of soil that has been directly impacted by TCE leaks or spills.

32
Groundwater and Soil Vapour Investigations of Trichloroethene: Stage 4 Ashford Rd & Everard Ave, Keswick South Australia Kelvinator Australia Pty Limited
WSP | Parsons Brinckerhoff Project No 2201557c
PCE and cis DCE were present also, but at much lower concentrations and some vapours of petroleum origin were present at most of the sampling locations, albeit, at insignificant concentrations from a health risk perspective.
TCE floor fluxes
Diffusive mass fluxes of TCE, and other VOCs, were measured beside each of the sub-slab test locations for the purpose of assessing the extent to which the sub-slab vapours were diffusing through the floor – and contributing to a possible vapour intrusion health risk for workers in the warehouse.
Flux rates of TCE through the floors of the warehouses were substantial at the two locations where sub-slab soil vapour concentrations were high, i.e. AM Flux 1 and AM Flux 6. AM Flux 7 was a duplicate chamber beside AM Flux 6 and it too showed considerable flux strengths of TCE. These flux strengths were significant enough to indicate the need for the calculation of vapour intrusion health risks. At the other four flux measurement locations the flux strengths were very low and can be considered trivial and of no consequence.
The highest flux, recorded at AM SS 1, which was also the site of a high sub-slab soil vapour concentration, was found to cause a significant contribution to indoor air concentrations. The flux value, 24.12 µg/m2/h would result in an indoor air TCE concentration was 6.48 µg/m3, based on assumptions used in the calculation. However, when the spatial average flux value of 7.1 µg/m2/h was used the calculation resulted in a much lower indoor air value of 1.9 µg/m3, which is close to the measured results for indoor air (see Figure 8).
Measured indoor and outdoor ambient air concentrations of TCE
Ambient air concentrations of a suite of VOCs were sampled at three indoor and two outdoor locations at the Australian Motors site. Compared to the health risk based acceptable air concentrations derived from toxicity values published by WHO and US EPA, 23 µg/m3 and 2.4 µg/m3, respectively, the measured concentrations of TCE were low or comparable to the standards depending on which standard is used. The highest TCE concentration measured within either of the warehouses was 2.1 µg/m3. Care should be taken in assessing the acceptability of indoor air concentrations as exposure adjustments for warehouse workers need to be considered.
Outdoor samples showed consistently low concentrations (0.06 to 0.08 µg/m3) while all indoor air concentrations were significantly higher – indicating sub-slab vapours are intruding into the building. TCE was believed to be not used in the warehouse.
Health risk evaluation
Human health risks from the intrusion of TCE vapours into the warehouses from the sub-slab soil vapours can be evaluated in more than one way. As a worst case scenario, the maximum measured floor flux was used to calculate an indoor air concentration of 6.48 µg/m3. That value was then adjusted for worker exposure (a factor of 0.08 for carcinogens and 0.22 for non carcinogens. Adjusted for exposure the air concentration becomes 0.52 µg/m3 for carcinogens and 1.43 µg/m3 for non-carcinogens.
Using the WHO unit risk value of 4.3 x 10⁻⁷,and the exposure adjusted concentrations, a cancer risk of 1.7 x 10⁻⁷ is calculated, a value substantially below the acceptable risk of 10-5. Using the US EPA IRIS data base Unit Risk of 4.1 x 10⁻⁶ the resultant cancer risk is still very low and acceptable at 1.6 x 10⁻⁶.
The US EPA’s IRIS data base lists also a criterion for non-carcinogenic health risks from TCE. The value, called the reference dose is 2 µg/m3. The exposure adjusted value determined from maximum flux (1.43 µg/m3) is less than the criterion.
33
Groundwater and Soil Vapour Investigations of Trichloroethene: Stage 4 Ashford Rd & Everard Ave, Keswick South Australia Kelvinator Australia Pty Limited
WSP | Parsons Brinckerhoff Project No 2201557c
The measured ambient air concentrations of TCE at location AM AA 3, located in the northern part of the warehouse, near the locations of the high flux readings, was 2.1 ug/m3, approximately equal to the US EPA’s criteria for carcinogenic health risks (2.4 µg/m3) and for non-carcinogenic health risks (2 µg/m3). However, these criteria need to be factored downwards to account for worker exposure.
These calculations show that there is no indication of an unacceptable health risk from the vapour intrusion pathway into the Australian Motors warehouse. Nevertheless, two of the 6 flux measurement locations showed substantial flux was detected so the presence of sub-slab TCE vapours would need to be considered and further investigated if the site is to be redeveloped. Likewise, ambient air measurements in the northern part of the warehouse showed definite impacts by TCE.
12.2 Conclusions
The migration of chlorinated VOCs from the K1 site in a north to westerly direction was demonstrated by the additional wells installed in February 2016 and high concentrations of TCE were again measured in one well on the K1 site. Some uncertainty remains as to the delineation of the plume or plumes leaving the K1 site. Notwithstanding this limitation, an important finding of the current groundwater investigation was that high concentrations of TCE were not found in the more distant off-site wells, suggesting that TCE may be attenuating substantially. Even the wells just to the north of the K1 site (KMW4 and KMW5) showed TCE concentrations significantly lower than the KMW2 value.
The presence of moderate concentrations of TCE and moderate to high concentrations of carbon tetrachloride in groundwater on the NHP property to the north of the K1 site, is indicative of a potential vapour intrusion risk in the NHP building.
The measurements of substantial concentrations of TCE in sub-slab vapours beneath the Australian Motors warehouse on the K3 site is a clear indication of a local source not related to the K1 site.
The high concentrations of sub-slab TCE vapours beneath the Australian Motors floor slab produced substantial fluxes through the floor that were calculated to contribute indoor air TCE concentrations approximately equal to the US EPA IRIS data base criterion, but considerably below the risk level published by WHO. Directly measured indoor air concentrations (i.e. averaged over 17 days) were also commensurate with the US EPA IRIS criteria. However, when worker exposure factors are applied to the indoor air concentrations (both calculated by flux measurements, or measured directly), the health risk is determined to be acceptable –on the basis of both reference guidelines.
However, as sub-slab vapour concentrations and flux strengths of TCE were high in the northern part of the Australian Motors warehouse, if changes were to be made to the building structure or to its use, further investigations of the sources and further sub-slab or surface flux testing should be carried out to ensure that health risks from intruding TCE vapours does not occur.

34
Groundwater and Soil Vapour Investigations of Trichloroethene: Stage 4 Ashford Rd & Everard Ave, Keswick South Australia Kelvinator Australia Pty Limited
WSP | Parsons Brinckerhoff Project No 2201557c
13 LIMITATIONS Scope of Services
This soil vapour measurement report (‘the report’) has been prepared in accordance with the scope of services set out in the contract, or as otherwise agreed, between the Client and PB (‘scope of services’). In some circumstances the scope of services may have been limited by a range of factors such as time, budget, access and/or site disturbance constraints.
Reliance on Data
In preparing the report, PB has relied upon data, surveys, analyses, designs, plans and other information provided by the Client and other individuals and organisations, most of which are referred to in the report (‘the data’). Except as otherwise stated in the report, PB has not verified the accuracy or completeness of the data. To the extent that the statements, opinions, facts, information, conclusions and/or recommendations in the report (‘conclusions’) are based in whole or part on the data, those conclusions are contingent upon the accuracy and completeness of the data. PB will not be liable in relation to incorrect conclusions should any data, information or condition be incorrect or have been concealed, withheld, misrepresented or otherwise not fully disclosed to PB.
Environmental Conclusions
In accordance with the scope of services, PB has relied upon the data and has conducted environmental field monitoring and/or testing in the preparation of the report. The nature and extent of monitoring and/or testing conducted is described in the report.
On all sites, varying degrees of non-uniformity of the vertical and horizontal soil or groundwater conditions are encountered. Hence no monitoring, common testing or sampling technique can eliminate the possibility that monitoring or testing results/samples are not totally representative of soil vapour, soil and/or groundwater conditions encountered. The conclusions are based upon the data and the environmental field monitoring and/or testing and are therefore merely indicative of the environmental condition of the site at the time of preparing the report, including the presence or otherwise of contaminants or emissions.
Also, it should be recognised that site conditions, including the extent and concentration of contaminants, can change with time.
Within the limitations imposed by the scope of services, the monitoring, testing, sampling and preparation of this report have been undertaken and performed in a professional manner, in accordance with generally accepted practices and using a degree of skill and care ordinarily exercised by reputable environmental consultants under similar circumstances. No other warranty, expressed or implied, is made.
Report for Benefit of Client
The report has been prepared for the benefit of the Client and no other party. PB assumes no responsibility and will not be liable to any other person or organisation for or in relation to any matter dealt with or conclusions expressed in the report, or for any loss or damage suffered by any other person or organisation arising from matters dealt with or conclusions expressed in the report (including without limitation matters arising from any negligent act or omission of PB or for any loss or damage suffered by any other party relying upon the matters dealt with or conclusions expressed in the report). Other parties should not rely upon the report or the accuracy or completeness of any conclusions and should make their own enquiries and obtain independent advice in relation to such matters.

35
Groundwater and Soil Vapour Investigations of Trichloroethene: Stage 4 Ashford Rd & Everard Ave, Keswick South Australia Kelvinator Australia Pty Limited
WSP | Parsons Brinckerhoff Project No 2201557c
Other Limitations
PB will not be liable to update or revise the report to take into account any events or emergent circumstances or facts occurring or becoming apparent after the date of the report.
The scope of services did not include any assessment of the title to or ownership of the properties, buildings and structures referred to in the report nor the application or interpretation of laws in the jurisdiction in which those properties, buildings and structures are located.

36
Groundwater and Soil Vapour Investigations of Trichloroethene: Stage 4 Ashford Rd & Everard Ave, Keswick South Australia Kelvinator Australia Pty Limited
WSP | Parsons Brinckerhoff Project No 2201557c
14 REFERENCES BlueSphere Environmental, 17 December 2013, Re: Soil Vapour Investigation at U-Store-It Keswick, Letter report to John Eastwood, U-Store-It Pty Ltd.
CRC Care September 2011. Health screening levels for petroleum hydrocarbons in soil and groundwater. Part 1: Technical development document. CRC CARE Technical Report No 10. CRC for Contamination Assessment and Remediation of the Environment, Adelaide, Australia.
Hoekstra, E.J; De Leer, E. W. B; Brinkman, U. A. T.h. Natural formation of chloroform and brominated trihalomethanes in soil. Environ. Sci, Technol. 1998, 32,3724 – 3729
McAlary, T; Groenevelt, H; Gorecki, T; Seethapathy, S. PDMS Membrane Samplers for Quantitative Passive Monitoring of Soil Vapor Intrusion to Indoor Air. A&WMA ‘Vapor Intrusion 2009’, January 27-30, San Diego, CA Heggie, A. C; Stavropoulos, B. Evaluating vapour intrusion risk using comparative dynamic and passive flux chambers at a TCE impacted site in Sydney, Australia. A&WMA Vapor Intrusion 2010, September 2010
National Environment Protection Council (NEPC) 2013, National Environment Protection (Assessment of Site Contamination) Amendment Measure 2013 (No. 1)
Parsons Brinckerhoff, 30 September 2015, Soil Vapour Investigations of Trichloroethene – Ashford Road & Everard Avenue, Keswick, South Australia [K3 site]
Parsons Brinckerhoff, 26 February 2015, Soil Vapour and Groundwater Investigations for Identification of Trichloroethene –Everard Avenue, Keswick, South Australia [K2 site]
Parsons Brinckerhoff, 28 May 2014, Surface Mass Flux & Sub-slab Soil Vapour Measurements for Identification of Trichloroethene, March 2014 Keswick, South Australia
South Australian EPA 2003, Freshwater ecosystem water quality guidelines
Terra Environment, 18 December 2013, 62-70 Everard Avenue, Keswick Limited Groundwater Investigations Monitoring Report Prepared for JE Pty Ltd.
US EPA, 2004 User’s guide for evaluating subsurface vapour intrusion into buildings, prepared by Environmental Quality Management Inc., North Carolina
US EPA Guidance for the Data Objective Process and Data Quality Objectives Process for Hazardous Waste Site Investigations, January 2000, EPA/600/R-00/007
USEPA EPA On-line tools for Site Assessment Calculation http://www.epa.gov/Athens/learn2model/part-two/onsite/esthenry.html World Health Organisation Regional Office for Europe, WHO guidelines for indoor air quality: selected pollutants, Denmark, 2010
World Health Organisation Regional Office for Europe, Air quality guidelines for Europe, second edition, WHO regional publications, European series, no 91, Copenhagen, 2000

2
Groundwater and Soil Vapour Investigations of Trichloroethene: Stage 4 Ashford Rd & Everard Ave, Keswick South Australia Kelvinator Australia Pty Limited
WSP | Parsons Brinckerhoff Project No 2201557c

FIGURES

EVERARD AVENUE, KESWICK, SOUTH AUSTRALIAKelvinator Australia Pty Ltd
Figure 1 Investigation areas, March 2016 Keswick, South Australia 5035
MILE END SOUTHMILE END SOUTH
KESWICKKESWICK
FORESTVILLEFORESTVILLE
ASHFORDASHFORD
EVERARD PARKEVERARD PARK
GOODWOODGOODWOOD
WAYVILLEWAYVILLE
MILE END SOUTH
KESWICK
FORESTVILLE
ASHFORD
EVERARD PARK
GOODWOOD
WAYVILLE
Investigation areas
N
0 300m

EVERARD AVENUE, KESWICK, SOUTH AUSTRALIAKelvinator Australia Pty Ltd
Figure 2 Areas of investigation, March 2016 Keswick, South Australia 5035
Note: Site boundaries are approximations and only indicative of the investigation areas.
EVERARD AVENUEEVERARD AVENUE
ASH
FOR
D R
OA
DA
SHFO
RD
RO
AD
CR
OYD
ON
RO
AD
CR
OYD
ON
RO
AD
HAMPTON R
OAD
HAMPTON R
OAD
ANZAC H
IGHWAY
ANZAC H
IGHWAY
ALEXANDER AVENUE
ALEXANDER AVENUE
KEN
T RO
AD
KEN
T RO
AD
EVERARD AVENUE
ASH
FOR
D R
OA
D
CR
OYD
ON
RO
AD
HAMPTON R
OAD
ANZAC H
IGHWAY
ALEXANDER AVENUE
KEN
T RO
AD
N
0 40m
K3 site
ExplorerCoachlines
AustralianMotors
NHP ElectricalEngineering Products
K1 site
K2 site

EVERARD AVENUE, KESWICK, SOUTH AUSTRALIAKelvinator Australia Pty Ltd
Figure 3 Monitoring well locations, surveyed groundwater elevation, flow direction and cross-sectional transect, March 2016 Keswick, South Australia 5035
KEY:
EVERARD AVENUEEVERARD AVENUE
ASH
FOR
D R
OA
D
CR
OYD
ON
RO
AD
CR
OYD
ON
RO
AD
HAMPTON R
OAD
HAMPTON R
OAD
ANZAC H
IGHWAY
ANZAC H
IGHWAY
ALEXANDER AVENUE
ALEXANDER AVENUE
KEN
T RO
AD
KEN
T RO
AD
EVERARD AVENUE
ASH
FOR
D R
OA
D
CR
OYD
ON
RO
AD
HAMPTON R
OAD
ANZAC H
IGHWAY
ALEXANDER AVENUE
KEN
T RO
AD
N
0 40m
11.5 mAHD
12.0 mAHD
12.5 mAHD
12.0 mAHD
13.0 mAHD
14.0 mAHD
13.5 mAHD
11.5
Cross-section transectGroundwater elevation
NW
SE
Flow directionWater level (mAHD)
KMW3
KMW4
KMW1d
KMW7
KMW6
GW7d
GW3d
GW1d
Monitoring well in regional aquiferShallow monitoring well in perched water
KMW1
11.06
11.64
12.09KMW5
11.92
12.37 12.51
KMW2
13.44
13.45
13.86
GW4
13.98
GW5d
13.82
GW6
13.94

EVERARD AVENUE, KESWICK, SOUTH AUSTRALIAKelvinator Australia Pty Ltd
Figure 4 Cross-section NW-SE showing potentiometric groundwater levels and well screening depths, March 2016 Keswick, South Australia 5035
KEY:
Groundwater flow
11.6412.09
12.51
13.95
NHP Commercial
SOUTH-EASTNORTH-WEST
Ashford Road K1 storage warehouse K2 commercialCroydon Road andEverard Avenue
KMW626.19
KMW426.77
KMW327.91 GW6
27.61
(mA
HD
)
(mA
HD
)
cis DCE <1
Distance along transect (m)
silty clay
clayey silty
silty clay
sandy silty clay
clayey sand
sandy clay
silty clay
slighty moist
moist
wet
slighty moist
wetsilty clay
silty clay and gravels
sandy clay wet
silty clay
silty clay
silty clay dry
clayey sand
wet
moist
clayey sand
moist
sandy silty clay
CT 2
PCE 24
TCE 39
cis DCE 9
CT 320
PCE <1
TCE 1,100
cis DCE 23
CT 2,200
PCE 2
TCE 1,800cis DCE <1
CT <1
PCE <1
TCE <1
1,100
Anzac Highway
28
27
26
25
24
23
22
21
20
19
18
17
16
15
14
13
12
11
10
9
8
7
6
5
28
27
26
25
24
23
22
21
20
19
18
17
16
15
14
13
12
11
10
9
8
7
6
5
0 50 100 150 200 250
Water level (potentiometric level)
TCE concentrations (ug/L)

EVERARD AVENUE, KESWICK, SOUTH AUSTRALIAKelvinator Australia Pty Ltd
Figure 5 Trichloroethene (TCE) concentrations in groundwater, March 2016 Keswick, South Australia 5035
KEY:
EVERARD AVENUEEVERARD AVENUE
ASH
FOR
D R
OA
D
CR
OYD
ON
RO
AD
CR
OYD
ON
RO
AD
HAMPTON R
OAD
HAMPTON R
OAD
ANZAC H
IGHWAY
ANZAC H
IGHWAY
ALEXANDER AVENUE
ALEXANDER AVENUE
KEN
T RO
AD
KEN
T RO
AD
EVERARD AVENUE
ASH
FOR
D R
OA
D
CR
OYD
ON
RO
AD
HAMPTON R
OAD
ANZAC H
IGHWAY
ALEXANDER AVENUE
KEN
T RO
AD
N
0 40m
KMW3
KMW5KMW4
KMW1d
KMW7
KMW6
KMW2
Deep monitoring wellShallow monitoring well
KMW1
240
39
5601,100
1,800
28,560
130
180
xxx Units (μg/L)

EVERARD AVENUE, KESWICK, SOUTH AUSTRALIAKelvinator Australia Pty Ltd
Figure 6 Trichloroethene (TCE) concentrations in sub-slab soil vapour (Australian Motors building), March 2016 Keswick , South Australia 5035
KEY:
EVERARD AVENUEEVERARD AVENUE
ASH
FOR
D R
OA
DA
SHFO
RD
RO
AD
KEN
T RO
AD
KEN
T RO
AD
EVERARD AVENUE
ASH
FOR
D R
OA
D
KEN
T RO
AD
0 20m
NUnits in μg/m3
13,000
AM SS 613,000
AM SS 5<2.2
AM SS 4<2.2
AM SS 119,000
AM SS 2<2.2
AM SS 39.1
Sub-slab sampling locationConcentration of TCE

EVERARD AVENUE, KESWICK, SOUTH AUSTRALIAKelvinator Australia Pty Ltd
Figure 7 Trichloroethene (TCE) surface floor flux (Australian Motors building), March 2016 Keswick, South Australia 5035
KEY:
EVERARD AVENUEEVERARD AVENUE
ASH
FOR
D R
OA
DA
SHFO
RD
RO
AD
KEN
T RO
AD
KEN
T RO
AD
EVERARD AVENUE
ASH
FOR
D R
OA
D
KEN
T RO
AD
0 20m
NUnits in μg/m2/h
18.16
AM Flux 6
18.16 AM Flux 7
24.12
AM Flux 1
18.41
AM Flux 5
0.044AM Flux 2
0.01
AM Flux 4
0.004AM Flux 3
0.005
Flux sampling locationFlux value of TCE

EVERARD AVENUE, KESWICK, SOUTH AUSTRALIAKelvinator Australia Pty Ltd
Figure 8 Trichloroethene (TCE) concentrations in ambient air (Australian Motors building), March 2016 Keswick, South Australia 5035
KEY:
EVERARD AVENUEEVERARD AVENUE
ASH
FOR
D R
OA
DA
SHFO
RD
RO
AD
KEN
T RO
AD
KEN
T RO
AD
EVERARD AVENUE
ASH
FOR
D R
OA
D
KEN
T RO
AD
0 20m
NUnits in μg/m3
Air sampling location
X
XX
X
X
X
AM AA 3
2.1
AM AA 4
0.06AM AA 2
0.63
AM AA 1
0.58
AM AA 5
0.08

Appendix A GROUNDWATER SUMMARY TABLES
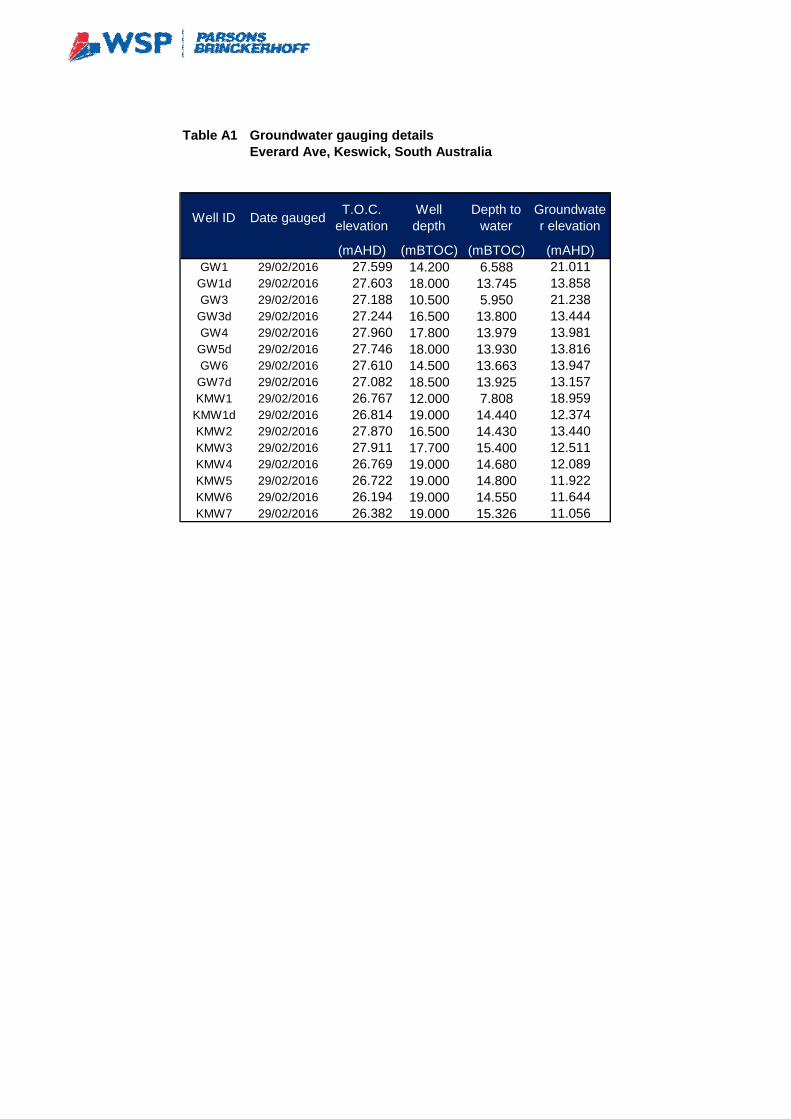
Table A1 Groundwater gauging detailsEverard Ave, Keswick, South Australia
Well ID Date gauged T.O.C.elevation
Welldepth
Depth towater
Groundwater elevation
(mAHD) (mBTOC) (mBTOC) (mAHD)GW1 29/02/2016 27.599 14.200 6.588 21.011
GW1d 29/02/2016 27.603 18.000 13.745 13.858GW3 29/02/2016 27.188 10.500 5.950 21.238
GW3d 29/02/2016 27.244 16.500 13.800 13.444GW4 29/02/2016 27.960 17.800 13.979 13.981
GW5d 29/02/2016 27.746 18.000 13.930 13.816GW6 29/02/2016 27.610 14.500 13.663 13.947
GW7d 29/02/2016 27.082 18.500 13.925 13.157KMW1 29/02/2016 26.767 12.000 7.808 18.959
KMW1d 29/02/2016 26.814 19.000 14.440 12.374KMW2 29/02/2016 27.870 16.500 14.430 13.440KMW3 29/02/2016 27.911 17.700 15.400 12.511KMW4 29/02/2016 26.769 19.000 14.680 12.089KMW5 29/02/2016 26.722 19.000 14.800 11.922KMW6 29/02/2016 26.194 19.000 14.550 11.644KMW7 29/02/2016 26.382 19.000 15.326 11.056

Table A2 Groundwater Analytical Results March 2016, Everard Ave, Keswick, South Australia
Field_ID KMW1 KMW1d KMW2 KMW3 KMW4 KMW5 KMW6 KMW7Sampled_Date 1/03/2016 1/03/2016 1/03/2016 1/03/2016 1/03/2016 1/03/2016 1/03/2016 1/03/2016
Chem_Group ChemName Unit EQLTRH C6-C10 µg/L 10 320 210 42,000 2300 1300 1800 84 5800C6 - C10 Fraction minus BTEX (F1) µg/L 10 7000 320 210 42,000 2300 1300 1800 84 4900C10 - C16 Fraction µg/L 50 57 <50 130 72 190 58 <50 130TRH >C10-C16 less Naphthalene (F2) µg/L 50 55 <50 130 72 190 58 <50 120C16 - C34 Fraction µg/L 100 180 <100 <100 <100 <100 <100 <100 <100C34 - C40 Fraction µg/L 100 <100 <100 <100 <100 <100 <100 <100 <100C6 - C9 Fraction µg/L 10 340 220 38,000 2300 1300 1900 84 5300C10 - C14 Fraction µg/L 50 <50 110 300 440 190 220 98 110C15 - C28 Fraction µg/L 100 170 <100 <100 <100 100 <100 <100 <100C29-C36 Fraction µg/L 100 <100 <100 <100 <100 <100 <100 <100 <100Benzene µg/L 1 1 1 5000 300 950 2 <1 4 <1 <1 <1 <1 840Toluene µg/L 1 800 800 300 <1 <1 <1 <1 <1 <1 <1 2Ethylbenzene µg/L 1 300 300 <1 <1 <1 <1 <1 <1 <1 2Xylene (m & p) µg/L 2 <2 <2 <2 <2 <2 <2 <2 <2Xylene (o) µg/L 1 350 <1 <1 <1 <1 <1 <1 <1 110Arsenic (Filtered) µg/L 1 7 10 50 <1 1 2 4 2 4 1 <1Barium (Filtered) µg/L 1 700 2000 50 70 71 91 260 21 60 130Berryllium (Filtered) µg/L 0.5 60 4 <0.5 <0.5 <0.5 <0.5 <0.5 <0.5 <0.5 <0.5Cadmium (Filtered) µg/L 0.1 2 2 2 0.2 <0.1 <0.1 <0.1 <0.1 <0.1 <0.1 <0.1 <0.1Chromium (Filtered) µg/L 1 3 24 3 18 43 320 50 16Cobalt (Filtered) µg/L 1 <1 1 <1 2 1 <1 <1 2Copper (Filtered) µg/L 1 2000 2000 10 1.4 <1 <1 <1 <1 1 4 <1 4Iron (Filtered) mg/L 0.01 0.2 0.88 0.36 0.63 0.81 <0.01 <0.01 <0.01Lead (Filtered) µg/L 1 10 10 5 3.4 <1 <1 <1 <1 <1 <1 <1 <1Manganese (Filtered) µg/L 5 500 500 1900 33 11 <5 31 46 <5 <5 69Mercury (Filtered) µg/L 0.05 1 1 0.1 0.06 <0.05 <0.05 <0.05 <0.05 <0.05 <0.05 <0.05 <0.05Molybdenum (Filtered) µg/L 1 50 50 14 23 5 4 34 310 42 36Nickel (Filtered) µg/L 1 20 20 150 11 37 5 <1 <1 2 <1 <1 5Silver (Filtered) µg/L 1 100 100 0.1 0.05 <1 <1 <1 <1 <1 <1 <1 <1Zinc (Filtered) µg/L 1 50 8 <1 10 1 1 30 4 11 12Cyclohexane µg/L 1 4 <1 <1 <1 <1 <1 <1 32
PAH Naphthalene µg/L 1 16 2 <1 <1 <1 <1 <1 <1 6
NEPM GIL FreshWaters
NEPM HSL-DCommercial/Industrial forVapour Intrusion,8m+, Sand
SA EPA 2003FreshwaterEcosystem
SA EPA 2003PotableWater
Metals
BTEX
TRH
WHO 2005DrinkingWater
TRH
NEPM GILDrinkingWater

Table A2 Groundwater Analytical Results March 2016, Everard Ave, Keswick, South Australia
Field_ID KMW1 KMW1d KMW2 KMW3 KMW4 KMW5 KMW6 KMW7Sampled_Date 1/03/2016 1/03/2016 1/03/2016 1/03/2016 1/03/2016 1/03/2016 1/03/2016 1/03/2016
Chem_Group ChemName Unit EQL
NEPM GIL FreshWaters
NEPM HSL-DCommercial/Industrial forVapour Intrusion,8m+, Sand
SA EPA 2003FreshwaterEcosystem
SA EPA 2003PotableWater
WHO 2005DrinkingWater
TRH
NEPM GILDrinkingWater
1,1,1,2-tetrachloroethane µg/L 1 <1 <1 <1 <1 <1 <1 <1 <11,1,1-trichloroethane µg/L 1 <1 <1 <1 <1 <1 <1 <1 <11,1,2,2-tetrachloroethane µg/L 1 <1 <1 <1 <1 <1 <1 <1 <11,1,2-trichloroethane µg/L 1 6500 <1 <1 33 2 2 <1 <1 51,1-dichloroethane µg/L 1 <1 <1 11 <1 <1 <1 <1 31,1-dichloroethene µg/L 1 30 30 <1 <1 43 <1 <1 <1 <1 121,1-dichloropropene µg/L 1 <1 <1 <1 <1 <1 <1 <1 <11,2,3-trichlorobenzene µg/L 1 30 0.9 3 <1 <1 <1 <1 <1 <1 <1 <11,2,3-trichloropropane µg/L 1 <1 <1 <1 <1 <1 <1 <1 <11,2,4-trichlorobenzene µg/L 1 30 0.5 85 <1 <1 <1 <1 <1 <1 <1 <11,2,4-trimethylbenzene µg/L 1 <1 <1 <1 <1 <1 <1 <1 41,2-dibromo-3-chloropropane µg/L 1 <1 <1 <1 <1 <1 <1 <1 <11,2-dibromoethane µg/L 1 <1 <1 <1 <1 <1 <1 <1 <11,2-dichlorobenzene µg/L 1 1500 1500 2.5 160 <1 <1 <1 <1 <1 <1 <1 <11,2-dichloroethane µg/L 1 3 3 <1 <1 <1 <1 <1 <1 <1 501,2-dichloropropane µg/L 1 <1 <1 <1 <1 <1 <1 <1 61,3,5-trimethylbenzene µg/L 1 <1 <1 <1 <1 <1 <1 <1 <11,3-dichlorobenzene µg/L 1 2.5 260 <1 <1 <1 <1 <1 <1 <1 <11,3-dichloropropane µg/L 1 <1 <1 <1 <1 <1 <1 <1 <11,4-dichlorobenzene µg/L 1 40 40 4 60 <1 <1 <1 <1 <1 <1 <1 <12,2-dichloropropane µg/L 1 <1 <1 <1 <1 <1 <1 <1 <12-chlorotoluene µg/L 1 <1 <1 <1 <1 <1 <1 <1 <14-chlorotoluene µg/L 1 <1 <1 <1 <1 <1 <1 <1 <1Bromobenzene µg/L 1 <1 <1 <1 <1 <1 <1 <1 <1Bromochloromethane µg/L 1 <1 <1 <1 <1 <1 <1 <1 <1Bromodichloromethane µg/L 1 <1 <1 <1 <1 <1 <1 <1 <1Bromoform µg/L 1 <1 <1 <1 <1 <1 <1 <1 <1Bromomethane µg/L 10 1 <10 <10 <10 <10 <10 <10 <10 <10Carbon tetrachloride µg/L 1 3 3 83 99 67 2200 320 2400 2 480Chlorobenzene µg/L 1 300 15 <1 <1 <1 <1 <1 <1 <1 <1Chlorodibromomethane µg/L 1 <1 <1 <1 <1 <1 <1 <1 <1Chloroethane µg/L 10 <10 <10 <10 <10 <10 <10 <10 <10Chloroform µg/L 1 83 50 17 34 10 58 2 510Chloromethane µg/L 10 <10 <10 <10 <10 <10 <10 <10 <10cis-1,2-dichloroethene µg/L 1 32 2 160 23 9 8 <1 380cis-1,3-dichloropropene µg/L 1 <1 <1 <1 <1 <1 <1 <1 <1Dibromomethane µg/L 1 <1 <1 <1 <1 <1 <1 <1 <1Dichlorodifluoromethane µg/L 10 <10 <10 <10 <10 <10 <10 <10 <10Hexachlorobutadiene µg/L 1 0.7 0.7 <1 <1 <1 <1 <1 <1 <1 <1Isopropylbenzene µg/L 1 <1 <1 <1 <1 <1 <1 <1 6n-butylbenzene µg/L 1 <1 <1 <1 <1 <1 <1 <1 1n-propylbenzene µg/L 1 <1 <1 <1 <1 <1 <1 <1 4p-isopropyltoluene µg/L 1 <1 <1 <1 <1 <1 <1 <1 <1sec-butylbenzene µg/L 1 <1 <1 <1 <1 <1 <1 <1 2Styrene µg/L 1 30 30 <1 <1 <1 <1 <1 <1 <1 3TCE µg/L 1 20 180 130 28,560 1800 1100 560 39 240tert-butylbenzene µg/L 1 <1 <1 <1 <1 <1 <1 <1 <1Tetrachloroethene µg/L 1 40 50 5 <1 14 2 <1 2 24 17trans-1,2-dichloroethene µg/L 1 <1 <1 14 <1 <1 <1 <1 2trans-1,3-dichloropropene µg/L 1 <1 <1 <1 <1 <1 <1 <1 <1Trichlorofluoromethane µg/L 10 <10 <10 <10 30 <10 20 <10 20Vinyl chloride µg/L 10 0.3 0.3 70 <10 <10 <10 <10 <10 <10 20
VOC

Table A2.1 Historical results for chlorinated solvents in groundwater at the K1 site
Compound Sampling date Units KMW1 KMW1d KMW2 KMW3Trichloroethene 10-Dec-13 µg/L 180 22,000 2,400
8-Dec-14 µg/L 264 16,300 1,3801-Mar-16 µg/L 180 130 28,560 1,800
Tetrachloroethene 10-Dec-13 µg/L 26 37 58-Dec-14 µg/L 7 19 <51-Mar-16 µg/L 5 <1 14 2
cis-1,2-dichloroethene 10-Dec-13 µg/L 26 88 208-Dec-14 µg/L 34 80 251-Mar-16 µg/L 32 2 160 23
1,1-dichloroethene 10-Dec-13 µg/L <1 45 <18-Dec-14 µg/L <5 <5 <51-Mar-16 µg/L <1 <1 43 <1
1,2-dichloroethane 10-Dec-13 µg/L <1 <1 <18-Dec-14 µg/L <5 <5 <51-Mar-16 µg/L <1 <1 <1 <1
1,1,2-trichloroethane 10-Dec-13 µg/L 5 34 38-Dec-14 µg/L <5 23 <51-Mar-16 µg/L <1 <1 33 2
Chloroform 10-Dec-13 µg/L 44 38 268-Dec-14 µg/L 195 18 271-Mar-16 µg/L 83 50 17 34
Carbon terachloride 10-Dec-13 µg/L 29 17 1,0008-Dec-14 µg/L 123 8 9141-Mar-16 µg/L 83 99 67 2,200
Vinyl chloride 10-Dec-13 µg/L <50 <1 <18-Dec-14 µg/L <50 <50 <501-Mar-16 µg/L 70 <10 <10 <10
Note:10-Dec-13 Sampled by Tierra Environment for JE Pty Limited8-Dec-14 Sampled by WSP | Parsons Brinckerhoff for Kelvinator Pty Limited1-Mar-16 Sampled by WSP | Parsons Brinckerhoff for Kelvinator Pty Limited

Table A3 Groundwater Field Water Quality Parameters1/03/2016Everard Ave Keswick, South Australia
KMW1 KMW1d KMW2 KMW3 KMW4 KMW5 KMW6 KMW7pH 7.74 7.08 7.38 7.23 7.2 8.78 7.34 6.97Electrical conductivity (EC) µS/cm 2,440 1,590 3,640 3,210 3,990 3,060 2,770 3,530Oxidation/reduction potential (Redox) mV 64 126 107 48 67.6 -4 14 -7Oxidation/reduction potential (Redox)# mV 263 325 306 247 267 195 213 192Dissolved oxygen mg/L 1.95 2.07 4.57 1.73 4.19 3.38 2.44 1.28Turbidity clear clear clear clear clear clear low lowTemperature
oC 21 20.7 21.5 20.7 22.2 22.7 23.6 22.2NOTE:
Deep well screened in regional aquiferRedox# Field redox values converted to Standard Hydrogen Electrode (SHE) values by adding conversion value of 199 mV

Table A4 Groundwater QC Results March 2016, Everard Ave, Keswick, South Australia
Lab Report Number 8053 8053 8053 Interlab_DField ID KMW1d QC01 RPD KMW2 QC02 RPDSampled Date 1/03/2016 1/03/2016 1/03/2016 1/03/2016
Chem_Group ChemName Units EQLCyclohexane µg/L 1 <1 <1 na
TRH TPH C6-C10 µg/L 10 : 20 (Interlab) 210 230 9 42000 23000 58C6 - C10 Fraction minus BTEX (F1) µg/L 10 : 20 (Interlab) 210 230 9 42000 23000 58C10 - C16 Fraction µg/L 50 <50 <50 na 130 <50 naTRH >C10-C16 less Naphthalene (F2) µg/L 50 <50 <50 na 130 <50 naC16 - C34 Fraction µg/L 100 <100 <100 na <100 <100 naC34 - C40 Fraction µg/L 100 <100 <100 na <100 <100 na
C6 - C9 Fraction µg/L 10 : 20 (Interlab) 220 250 13 38000 23000 49C10 - C14 Fraction µg/L 50 110 140 24 300 <50 naC15 - C28 Fraction µg/L 100 <100 <100 na <100 <100 naC29-C36 Fraction µg/L 100 <100 <100 na <100 <100 na
BTEX Benzene µg/L 1 <1 <1 na 4 5 22Benzene µg/L 1 <1 <1 na 4 5 22Toluene µg/L 1 <1 <1 na <1 2 naToluene µg/L 1 <1 <1 na <1 2 naEthylbenzene µg/L 1 <1 <1 na <1 <1 naEthylbenzene µg/L 1 <1 <1 na <1 <1 naXylene (m & p) µg/L 2 <2 <2 na <2 <2 naXylene (m & p) µg/L 2 <2 <2 na <2 <2 naXylene (o) µg/L 1 <1 <1 na <1 <1 naXylene (o) µg/L 1 <1 <1 na <1 <1 na
Metals Arsenic (Filtered) µg/L 1 1 1 0 2 2 0Barium (Filtered) µg/L 1 : 20 (Interlab) 70 68 3 71 70 1Berryllium (Filtered) µg/L 0.5 : 1 (Interlab) <0.5 <0.5 na <0.5 <1 naCadmium (Filtered) µg/L 0.1 : 0.2 (Interlab) <0.1 <0.1 na <0.1 <0.2 naChromium (Filtered) µg/L 1 24 23 4 3 1 100Cobalt (Filtered) µg/L 1 1 1 0 <1 <1 naCopper (Filtered) µg/L 1 <1 <1 na <1 <1 naIron (Filtered) mg/l 0.01 0.88 0.74 17Lead (Filtered) µg/L 1 <1 <1 na <1 <1 naManganese (Filtered) µg/L 5 11 12 9 <5 <5 naMercury (Filtered) µg/L 0.05 : 0.1 (Interlab) <0.05 <0.05 na <0.05 <0.1 naMolybdenum (Filtered) µg/L 1 23 17 30Nickel (Filtered) µg/L 1 5 4 22 <1 <1 naSilver (Filtered) µg/L 1 <1 <1 naZinc (Filtered) µg/L 1 10 11 10 1 2 67
PAH Naphthalene µg/L 1 : 10 (Interlab) <1 <1 na <1 <10 0
VOC 1,1,1,2-tetrachloroethane µg/L 1 <1 <1 na <1 <1 na1,1,1-trichloroethane µg/L 1 <1 <1 na <1 <1 na1,1,2,2-tetrachloroethane µg/L 1 <1 <1 na <1 <1 na1,1,2-trichloroethane µg/L 1 <1 <1 na 33 28 161,1-dichloroethane µg/L 1 <1 <1 na 11 13 171,1-dichloroethene µg/L 1 <1 <1 na 43 35 211,1-dichloropropene µg/L 1 <1 <1 na1,2,3-trichlorobenzene µg/L 1 <1 <1 na1,2,3-trichloropropane µg/L 1 <1 <1 na <1 <1 na1,2,4-trichlorobenzene µg/L 1 <1 <1 na1,2,4-trimethylbenzene µg/L 1 <1 <1 na <1 <1 na1,2-dibromo-3-chloropropane µg/L 1 <1 <1 na1,2-dibromoethane µg/L 1 <1 <1 na <1 <1 na1,2-dichlorobenzene µg/L 1 <1 <1 na <1 <1 na1,2-dichloroethane µg/L 1 <1 <1 na <1 <1 na1,2-dichloropropane µg/L 1 <1 <1 na <1 <1 na1,3,5-trimethylbenzene µg/L 1 <1 <1 na <1 <1 na1,3-dichlorobenzene µg/L 1 <1 <1 na <1 <1 na1,3-dichloropropane µg/L 1 <1 <1 na <1 <1 na1,4-dichlorobenzene µg/L 1 <1 <1 na <1 <1 na2,2-dichloropropane µg/L 1 <1 <1 na2-chlorotoluene µg/L 1 <1 <1 na4-chlorotoluene µg/L 1 <1 <1 na <1 <1 naBromobenzene µg/L 1 <1 <1 na <1 <1 naBromochloromethane µg/L 1 <1 <1 na <1 <1 naBromodichloromethane µg/L 1 <1 <1 na <1 32 naBromoform µg/L 1 <1 <1 na <1 <1 naBromomethane µg/L 10 : 1 (Interlab) <10 <10 na <10 <1 naCarbon tetrachloride µg/L 1 99 120 19 67 51 27Chlorobenzene µg/L 1 <1 <1 na <1 <1 naChlorodibromomethane µg/L 1 <1 <1 na <1 <1 naChloroethane µg/L 10 : 1 (Interlab) <10 <10 na <10 <1 naChloroform µg/L 1 : 5 (Interlab) 50 52 4 17 22 26Chloromethane µg/L 10 : 1 (Interlab) <10 <10 na <10 <1 nacis-1,2-dichloroethene µg/L 1 2 2 0 160 170 6cis-1,3-dichloropropene µg/L 1 <1 <1 na <1 <1 naDibromomethane µg/L 1 <1 <1 na <1 <1 naDichlorodifluoromethane µg/L 10 : 1 (Interlab) <10 <10 na <10 <1 naHexachlorobutadiene µg/L 1 <1 <1 naIsopropylbenzene µg/L 1 <1 <1 na <1 <1 nan-butylbenzene µg/L 1 <1 <1 nan-propylbenzene µg/L 1 <1 <1 nap-isopropyltoluene µg/L 1 <1 <1 nasec-butylbenzene µg/L 1 <1 <1 naStyrene µg/L 1 <1 <1 na <1 <1 naTCE µg/L 1 130 140 7 28560 17000 51tert-butylbenzene µg/L 1 <1 <1 naTetrachloroethene µg/L 1 <1 <1 na 14 19 30trans-1,2-dichloroethene µg/L 1 <1 <1 na 14 12 15trans-1,3-dichloropropene µg/L 1 <1 <1 na <1 <1 naTrichlorofluoromethane µg/L 10 : 1 (Interlab) <10 <10 na <10 3 naVinyl chloride µg/L 10 : 1 (Interlab) <10 <10 na <10 2 na
*RPDs have only been considered where a concentration is greater than 1 times the EQL.**High RPDs are in bold.

Table A5 Rinsate/Trip Blank Results March 2016, K1+K2 Everard Ave, Keswick, South Australia
SDG 8053 8053Field ID RB01 TB01Sampled_Date 1/03/2016 1/03/2016Sample Type Rinsate Trip_B
Chem_Group ChemName Units EQLCyclohexane µg/L 1 <1 <1
BTEX Benzene µg/L 1 <1 <1Toluene µg/L 1 <1 <1Ethylbenzene µg/L 1 <1 <1Xylene (m & p) µg/L 2 <2 <2Xylene (o) µg/L 1 <1 <1
Metals Arsenic (Filtered) µg/L 1 <1Barium (Filtered) µg/L 1 <1Berryllium (Filtered) µg/L 0.5 <0.5Cadmium (Filtered) µg/L 0.1 <0.1Chromium (Filtered) µg/L 1 <1Cobalt (Filtered) µg/L 1 <1Copper (Filtered) µg/L 1 <1Iron (Filtered) mg/l 0.01 <0.01Lead (Filtered) µg/L 1 <1Manganese (Filtered) µg/L 5 <5Mercury (Filtered) µg/L 0.05 <0.05Molybdenum (Filtered) µg/L 1 <1Nickel (Filtered) µg/L 1 <1Silver (Filtered) µg/L 1 <1Zinc (Filtered) µg/L 1 <1
PAH Naphthalene µg/L 1 <1 <1
TRH C6 - C9 Fraction µg/L 10 <10 <10C10 - C14 Fraction µg/L 50 <50C15 - C28 Fraction µg/L 100 <100C29-C36 Fraction µg/L 100 <100
TRH TRH C6-C10 µg/L 10 <10 <10C6 - C10 Fraction minus BTEX (F1) µg/L 10 <10 <10C10 - C16 Fraction µg/L 50 <50TRH >C10-C16 less Naphthalene (F2) µg/L 50 <50C16 - C34 Fraction µg/L 100 <100C34 - C40 Fraction µg/L 100 <100
VOC 1,1,1,2-tetrachloroethane µg/L 1 <1 <11,1,1-trichloroethane µg/L 1 <1 <11,1,2,2-tetrachloroethane µg/L 1 <1 <11,1,2-trichloroethane µg/L 1 <1 <11,1-dichloroethane µg/L 1 <1 <11,1-dichloroethene µg/L 1 <1 <11,1-dichloropropene µg/L 1 <1 <11,2,3-trichlorobenzene µg/L 1 <1 <11,2,3-trichloropropane µg/L 1 <1 <11,2,4-trichlorobenzene µg/L 1 <1 <11,2,4-trimethylbenzene µg/L 1 <1 <11,2-dibromo-3-chloropropane µg/L 1 <1 <11,2-dibromoethane µg/L 1 <1 <11,2-dichlorobenzene µg/L 1 <1 <11,2-dichloroethane µg/L 1 <1 <11,2-dichloropropane µg/L 1 <1 <11,3,5-trimethylbenzene µg/L 1 <1 <11,3-dichlorobenzene µg/L 1 <1 <11,3-dichloropropane µg/L 1 <1 <11,4-dichlorobenzene µg/L 1 <1 <12,2-dichloropropane µg/L 1 <1 <12-chlorotoluene µg/L 1 <1 <14-chlorotoluene µg/L 1 <1 <1Bromobenzene µg/L 1 <1 <1Bromochloromethane µg/L 1 <1 <1Bromodichloromethane µg/L 1 <1 <1Bromoform µg/L 1 <1 <1Bromomethane µg/L 10 <10 <10Carbon tetrachloride µg/L 1 <1 <1Chlorobenzene µg/L 1 <1 <1Chlorodibromomethane µg/L 1 <1 <1Chloroethane µg/L 10 <10 <10Chloroform µg/L 1 <1 <1Chloromethane µg/L 10 <10 <10cis-1,2-dichloroethene µg/L 1 <1 <1cis-1,3-dichloropropene µg/L 1 <1 <1Dibromomethane µg/L 1 <1 <1Dichlorodifluoromethane µg/L 10 <10 <10Hexachlorobutadiene µg/L 1 <1 <1Isopropylbenzene µg/L 1 <1 <1n-butylbenzene µg/L 1 <1 <1n-propylbenzene µg/L 1 <1 <1p-isopropyltoluene µg/L 1 <1 <1sec-butylbenzene µg/L 1 <1 <1Styrene µg/L 1 <1 <1TCE µg/L 1 <1 <1tert-butylbenzene µg/L 1 <1 <1Tetrachloroethene µg/L 1 <1 <1trans-1,2-dichloroethene µg/L 1 <1 <1trans-1,3-dichloropropene µg/L 1 <1 <1Trichlorofluoromethane µg/L 10 <10 <10Vinyl chloride µg/L 10 <10 <10

Appendix B SUB-SLAB VAPOUR, FLOOR FLUX & AMBIENT AIR SUMMARY TABLES
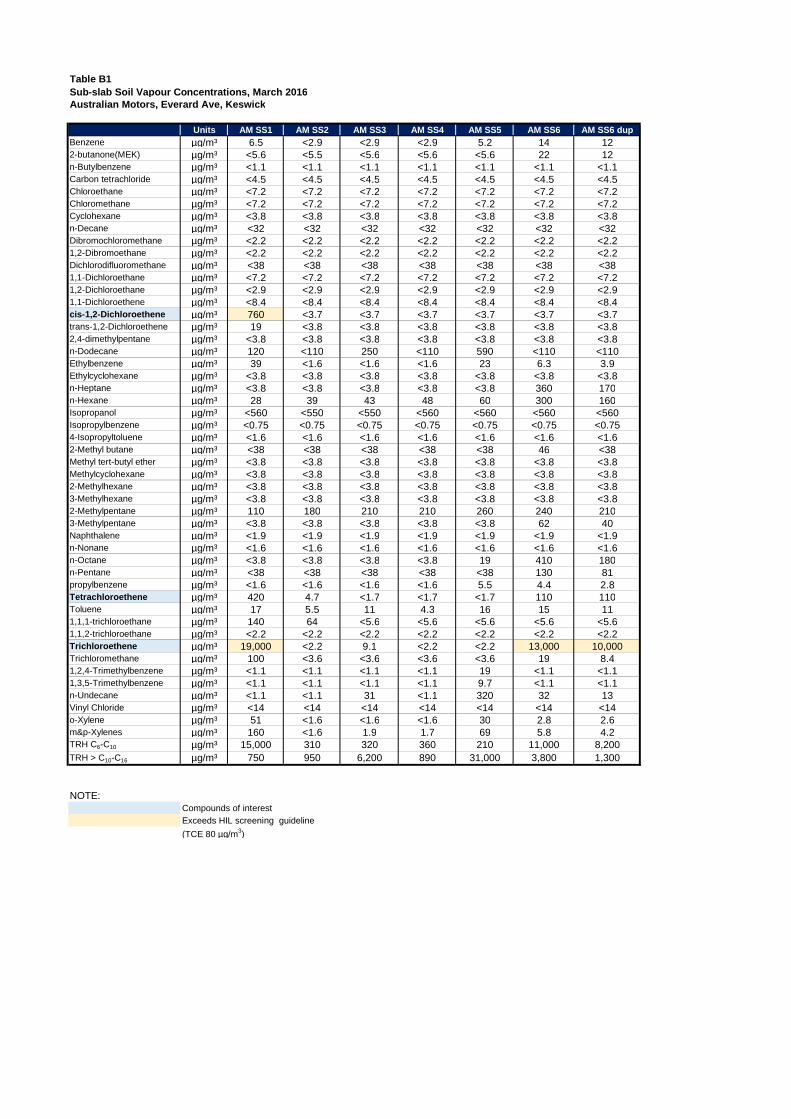
Table B1Sub-slab Soil Vapour Concentrations, March 2016Australian Motors, Everard Ave, Keswick
Units AM SS1 AM SS2 AM SS3 AM SS4 AM SS5 AM SS6 AM SS6 dupBenzene µg/m³ 6.5 <2.9 <2.9 <2.9 5.2 14 122-butanone(MEK) µg/m³ <5.6 <5.5 <5.6 <5.6 <5.6 22 12n-Butylbenzene µg/m³ <1.1 <1.1 <1.1 <1.1 <1.1 <1.1 <1.1Carbon tetrachloride µg/m³ <4.5 <4.5 <4.5 <4.5 <4.5 <4.5 <4.5Chloroethane µg/m³ <7.2 <7.2 <7.2 <7.2 <7.2 <7.2 <7.2Chloromethane µg/m³ <7.2 <7.2 <7.2 <7.2 <7.2 <7.2 <7.2Cyclohexane µg/m³ <3.8 <3.8 <3.8 <3.8 <3.8 <3.8 <3.8n-Decane µg/m³ <32 <32 <32 <32 <32 <32 <32Dibromochloromethane µg/m³ <2.2 <2.2 <2.2 <2.2 <2.2 <2.2 <2.21,2-Dibromoethane µg/m³ <2.2 <2.2 <2.2 <2.2 <2.2 <2.2 <2.2Dichlorodifluoromethane µg/m³ <38 <38 <38 <38 <38 <38 <381,1-Dichloroethane µg/m³ <7.2 <7.2 <7.2 <7.2 <7.2 <7.2 <7.21,2-Dichloroethane µg/m³ <2.9 <2.9 <2.9 <2.9 <2.9 <2.9 <2.91,1-Dichloroethene µg/m³ <8.4 <8.4 <8.4 <8.4 <8.4 <8.4 <8.4cis-1,2-Dichloroethene µg/m³ 760 <3.7 <3.7 <3.7 <3.7 <3.7 <3.7trans-1,2-Dichloroethene µg/m³ 19 <3.8 <3.8 <3.8 <3.8 <3.8 <3.82,4-dimethylpentane µg/m³ <3.8 <3.8 <3.8 <3.8 <3.8 <3.8 <3.8n-Dodecane µg/m³ 120 <110 250 <110 590 <110 <110Ethylbenzene µg/m³ 39 <1.6 <1.6 <1.6 23 6.3 3.9Ethylcyclohexane µg/m³ <3.8 <3.8 <3.8 <3.8 <3.8 <3.8 <3.8n-Heptane µg/m³ <3.8 <3.8 <3.8 <3.8 <3.8 360 170n-Hexane µg/m³ 28 39 43 48 60 300 160Isopropanol µg/m³ <560 <550 <550 <560 <560 <560 <560Isopropylbenzene µg/m³ <0.75 <0.75 <0.75 <0.75 <0.75 <0.75 <0.754-Isopropyltoluene µg/m³ <1.6 <1.6 <1.6 <1.6 <1.6 <1.6 <1.62-Methyl butane µg/m³ <38 <38 <38 <38 <38 46 <38Methyl tert-butyl ether µg/m³ <3.8 <3.8 <3.8 <3.8 <3.8 <3.8 <3.8Methylcyclohexane µg/m³ <3.8 <3.8 <3.8 <3.8 <3.8 <3.8 <3.82-Methylhexane µg/m³ <3.8 <3.8 <3.8 <3.8 <3.8 <3.8 <3.83-Methylhexane µg/m³ <3.8 <3.8 <3.8 <3.8 <3.8 <3.8 <3.82-Methylpentane µg/m³ 110 180 210 210 260 240 2103-Methylpentane µg/m³ <3.8 <3.8 <3.8 <3.8 <3.8 62 40Naphthalene µg/m³ <1.9 <1.9 <1.9 <1.9 <1.9 <1.9 <1.9n-Nonane µg/m³ <1.6 <1.6 <1.6 <1.6 <1.6 <1.6 <1.6n-Octane µg/m³ <3.8 <3.8 <3.8 <3.8 19 410 180n-Pentane µg/m³ <38 <38 <38 <38 <38 130 81propylbenzene µg/m³ <1.6 <1.6 <1.6 <1.6 5.5 4.4 2.8Tetrachloroethene µg/m³ 420 4.7 <1.7 <1.7 <1.7 110 110Toluene µg/m³ 17 5.5 11 4.3 16 15 111,1,1-trichloroethane µg/m³ 140 64 <5.6 <5.6 <5.6 <5.6 <5.61,1,2-trichloroethane µg/m³ <2.2 <2.2 <2.2 <2.2 <2.2 <2.2 <2.2Trichloroethene µg/m³ 19,000 <2.2 9.1 <2.2 <2.2 13,000 10,000Trichloromethane µg/m³ 100 <3.6 <3.6 <3.6 <3.6 19 8.41,2,4-Trimethylbenzene µg/m³ <1.1 <1.1 <1.1 <1.1 19 <1.1 <1.11,3,5-Trimethylbenzene µg/m³ <1.1 <1.1 <1.1 <1.1 9.7 <1.1 <1.1n-Undecane µg/m³ <1.1 <1.1 31 <1.1 320 32 13Vinyl Chloride µg/m³ <14 <14 <14 <14 <14 <14 <14o-Xylene µg/m³ 51 <1.6 <1.6 <1.6 30 2.8 2.6m&p-Xylenes µg/m³ 160 <1.6 1.9 1.7 69 5.8 4.2TRH C6-C10 µg/m³ 15,000 310 320 360 210 11,000 8,200TRH > C10-C16 µg/m³ 750 950 6,200 890 31,000 3,800 1,300
NOTE:Compounds of interestExceeds HIL screening guideline(TCE 80 µg/m3)

Table B2Floor Vapour Flux - (Mass on Sampling Tubes)Australian Motors, Everard Ave, KeswickMarch 2016
Units Detection limit AM Flux 1 AM Flux 2 AM Flux3 AM Flux 4 AM Flux 5 AM Flux 6 AM Flux 6
dup AM Flux 7
Benzene µg/tube 0.05 0.46 0.35 0.3 0.42 0.32 0.97 0.81 1.22-butanone(MEK) µg/tube 0.05 0.27 0.59 0.56 0.73 0.32 0.59 0.6 0.59n-Butylbenzene µg/tube 0.05 nd nd nd nd nd nd nd ndCarbon tetrachloride µg/tube 0.05 0.17 0.19 0.13 0.15 nd nd nd ndChloroethane µg/tube 0.05 nd nd nd nd nd nd nd ndChloromethane µg/tube 0.05 nd nd nd nd nd nd nd ndCyclohexane µg/tube 0.05 0.64 0.52 0.43 0.42 0.34 2.3 2 3.3n-Decane µg/tube 0.05 nd nd nd nd nd nd nd ndDibromochloromethane µg/tube 0.05 nd nd nd nd nd nd nd nd1,2-Dibromoethane µg/tube 0.05 nd nd nd nd nd nd nd ndDichlorodifluoromethane µg/tube 0.05 nd nd nd nd nd nd nd nd1,1-Dichloroethane µg/tube 0.05 0.87 nd nd nd nd nd nd nd1,2-Dichloroethane µg/tube 0.05 nd nd nd nd nd nd nd nd1,1-Dichloroethene µg/tube 0.05 7.6 nd nd nd nd nd nd ndcis-1,2-Dichloroethene µg/tube 0.05 21 nd nd nd nd nd nd ndtrans-1,2-Dichloroethene µg/tube 0.05 0.46 nd nd nd nd nd nd nd2,4-dimethylpentane µg/tube 0.05 0.1 0.06 nd 0.06 nd 0.34 0.27 0.47n-Dodecane µg/tube 0.05 2.2 3.2 3.6 5.2 22 9.9 9.5 13Ethylbenzene µg/tube 0.05 0.55 0.53 0.62 0.85 0.79 0.61 0.59 0.78Ethylcyclohexane µg/tube 0.05 nd nd nd nd nd nd nd ndn-Heptane µg/tube 0.05 0.2 0.17 0.15 0.2 0.2 0.6 0.55 1.8n-Hexane µg/tube 0.05 1.1 0.82 0.53 0.75 0.52 3.8 3.7 7.8Isopropanol µg/tube 0.05 nd nd nd nd nd nd nd ndIsopropylbenzene µg/tube 0.05 nd nd nd nd nd 0.1 0.08 0.134-Isopropyltoluene µg/tube 0.05 0.26 0.22 0.23 0.25 0.19 0.18 0.14 0.22-Methyl butane µg/tube 0.05 7.2 5.6 2.8 4.1 2.7 27 26 44Methyl tert-butyl ether µg/tube 0.05 nd nd nd nd nd 3.7 3.4 4.4Methylcyclohexane µg/tube 0.05 0.13 0.12 0.11 0.14 0.09 0.15 0.16 0.312-Methylhexane µg/tube 0.05 0.35 0.26 0.2 0.25 0.16 1.2 1.1 2.13-Methylhexane µg/tube 0.05 0.36 0.28 0.21 0.27 0.18 1.3 1.2 2.62-Methylpentane µg/tube 0.05 2.3 1.2 1.1 0.83 0.95 8.4 7.7 143-Methylpentane µg/tube 0.05 0.76 0.56 0.34 0.48 0.32 3.4 3.2 5.8Naphthalene µg/tube 0.05 nd nd nd nd nd nd nd ndn-Nonane µg/tube 0.05 0.25 0.24 0.23 0.43 0.25 0.16 0.18 0.24n-Octane µg/tube 0.05 nd nd nd nd nd nd nd ndn-Pentane µg/tube 0.05 4.7 3.6 1.7 2.5 1.8 22 21 32propylbenzene µg/tube 0.05 0.23 0.24 0.27 0.3 0.24 0.22 0.21 0.31Tetrachloroethene µg/tube 0.05 26 0.09 0.05 0.06 0.07 2.4 2.3 4.1Toluene µg/tube 0.05 26 28 27 34 31 25 22 371,1,1-trichloroethane µg/tube 0.05 2.4 nd nd nd nd nd nd nd1,1,2-trichloroethane µg/tube 0.05 nd nd nd nd nd nd nd ndTrichloroethene µg/tube 0.05 760 0.34 0.19 0.17 1.8 380 370 480Trichloromethane µg/tube 0.05 2.8 nd nd nd nd 0.24 0.23 0.191,2,4-Trimethylbenzene µg/tube 0.05 1.9 2 2.1 2.1 1.8 1.9 1.9 2.41,3,5-Trimethylbenzene µg/tube 0.05 0.49 0.51 0.53 0.58 0.49 0.44 0.39 0.6n-Undecane µg/tube 0.05 0.79 1.4 1.4 2 5.8 2.3 2.1 3.2Vinyl Chloride µg/tube 0.05 nd nd nd nd nd nd nd ndo-Xylene µg/tube 0.05 0.76 0.79 0.96 1.3 1.3 0.69 0.62 0.96m&p-Xylenes µg/tube 0.05 1.9 1.9 2.4 3.4 2.7 2 2.1 2.7TRH C6-C10 µg/tube 5 690 66 61 73 55 380 340 440TRH > C10-C16 µg/tube 5 99 180 170 180 860 480 400 430
NOTE:Compound of interest
Sampling times for flux chambers AM Flux 1 to AM Flux 6 and 6 dup were essentially identical, ranging from 428 h to 429 h. Therefore data for mass collected on tubes are directly comparable.This is not the case for AM Flux 7 which had a footprint half the area of the other chambers. So a factor of 2 is required to make the data for for AM Flux 7 comparable to the others

Table B3Surface floor flux of TCE (µg/m2/h)Australian Motors Everard Ave, KeswickMarch 2016
Analyte Units AM Flux 1 AM Flux 2 AM Flux3 AM Flux 4 AM Flux 5 AM Flux 6 AM Flux 7 (dup) *Trichloroethene µg/m2/h 18.41 0.01 0.005 0.004 0.044 18.16 24.12
* AM Flux 7 was co-located with AM Flux 6.
Table B4Indoor air TCE concentrations calculated from floor fluxAustralian Motors Everard Ave, KeswickMarch 2016
Analyte Units AM Flux 1 AM Flux 2 AM Flux3 AM Flux 4 AM Flux 5 AM Flux 6 AM Flux 7 (dup) *Trichloroethene µg/m3 4.95 0.003 0.001 0.001 0.012 4.88 6.48
Calculation assumptions/imputsCeiling height : 3 mAir exchange rate: 1.24 per hour

Australian Motors, Everard Avenue, Keswick; March 2016
Compound Units AM SS6 AM SS6 dup RPD (%)Benzene µg/m3 14 12 15%2-butanone(MEK) µg/m3 22 12 59%n-Butylbenzene µg/m3 <1.1 <1.1 -Carbon tetrachloride µg/m3 <4.5 <4.5 -Chloroethane µg/m3 <7.2 <7.2 -Chloromethane µg/m3 <7.2 <7.2 -Cyclohexane µg/m3 <3.8 <3.8 -n-Decane µg/m3 <32 <32 -Dibromochloromethane µg/m3 <2.2 <2.2 -1,2-Dibromoethane µg/m3 <2.2 <2.2 -Dichlorodifluoromethane µg/m3 <38 <38 -1,1-Dichloroethane µg/m3 <7.2 <7.2 -1,2-Dichloroethane µg/m3 <2.9 <2.9 -1,1-Dichloroethene µg/m3 <8.4 <8.4 -cis-1,2-Dichloroethene µg/m3 <3.7 <3.7 -trans-1,2-Dichloroethene µg/m3 <3.8 <3.8 -2,4-dimethylpentane µg/m3 <3.8 <3.8 -n-Dodecane µg/m3 <110 <110 -Ethylbenzene µg/m3 6.3 3.9 47%Ethylcyclohexane µg/m3 <3.8 <3.8 -n-Heptane µg/m3 360 170 72%n-Hexane µg/m3 300 160 61%Isopropanol µg/m3 <560 <560 -Isopropylbenzene µg/m3 <0.75 <0.75 -4-Isopropyltoluene µg/m3 <1.6 <1.6 -2-Methyl butane µg/m3 46 <38 -Methyl tert-butyl ether µg/m3 <3.8 <3.8 -Methylcyclohexane µg/m3 <3.8 <3.8 -2-Methylhexane µg/m3 <3.8 <3.8 -3-Methylhexane µg/m3 <3.8 <3.8 -2-Methylpentane µg/m3 240 210 13%3-Methylpentane µg/m3 62 40 43%Naphthalene µg/m3 <1.9 <1.9 -n-Nonane µg/m3 <1.6 <1.6 -n-Octane µg/m3 410 180 78%n-Pentane µg/m3 130 81 46%propylbenzene µg/m3 4.4 2.8 44%Tetrachloroethene µg/m3 110 110 0%Toluene µg/m3 15 11 31%1,1,1-trichloroethane µg/m3 <5.6 <5.61,1,2-trichloroethane µg/m3 <2.2 <2.2 -Trichloroethene µg/m3 13,000 10,000 26%Trichloromethane µg/m3 19 8.4 77%1,2,4-Trimethylbenzene µg/m3 <1.1 <1.1 -1,3,5-Trimethylbenzene µg/m3 <1.1 <1.1 -n-Undecane µg/m3 32 13 84%Vinyl Chloride µg/m3 <14 <14 -o-Xylene µg/m3 2.8 2.6 7%m&p-Xylenes µg/m3 5.8 4.2 32%TRH C6-C10 µg/m3 11,000 8,200 29%TRH > C10-C16 µg/m3 3,800 1,300 98%Note:
Compounds of interest
Table B5 Relative Percent Differences for Sub-slab Vapour Duplicate Samples
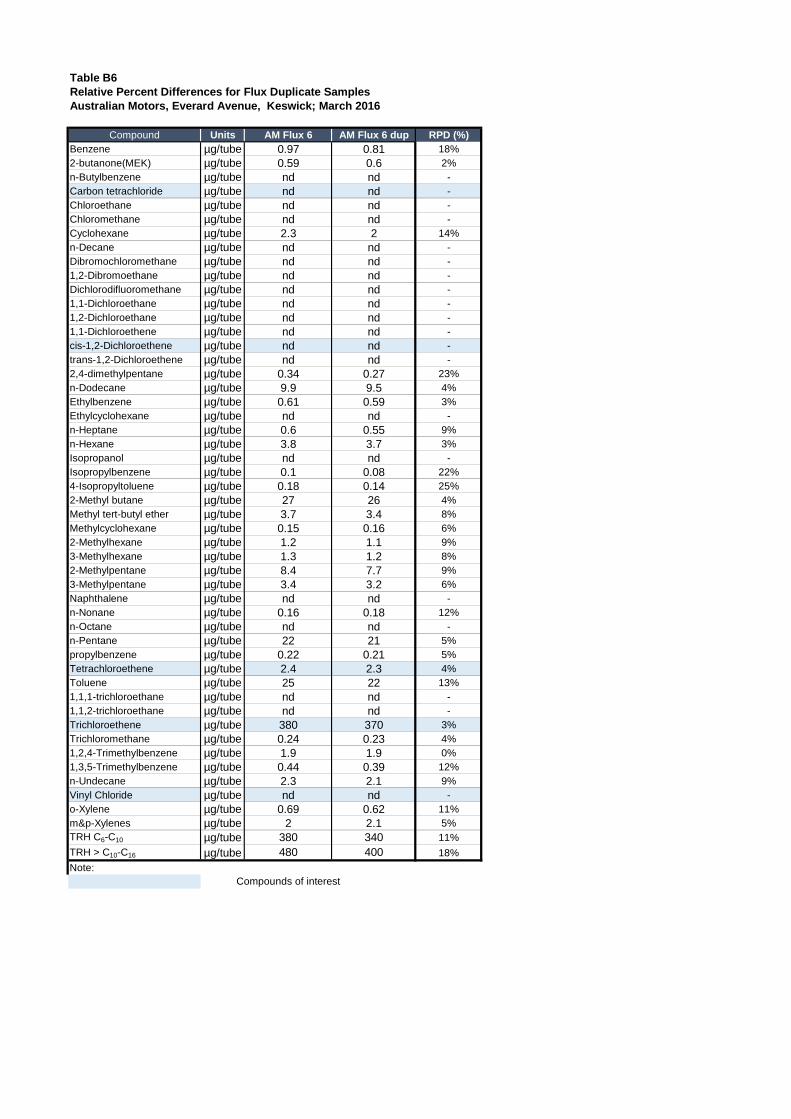
Australian Motors, Everard Avenue, Keswick; March 2016
Compound Units AM Flux 6 AM Flux 6 dup RPD (%)Benzene µg/tube 0.97 0.81 18%2-butanone(MEK) µg/tube 0.59 0.6 2%n-Butylbenzene µg/tube nd nd -Carbon tetrachloride µg/tube nd nd -Chloroethane µg/tube nd nd -Chloromethane µg/tube nd nd -Cyclohexane µg/tube 2.3 2 14%n-Decane µg/tube nd nd -Dibromochloromethane µg/tube nd nd -1,2-Dibromoethane µg/tube nd nd -Dichlorodifluoromethane µg/tube nd nd -1,1-Dichloroethane µg/tube nd nd -1,2-Dichloroethane µg/tube nd nd -1,1-Dichloroethene µg/tube nd nd -cis-1,2-Dichloroethene µg/tube nd nd -trans-1,2-Dichloroethene µg/tube nd nd -2,4-dimethylpentane µg/tube 0.34 0.27 23%n-Dodecane µg/tube 9.9 9.5 4%Ethylbenzene µg/tube 0.61 0.59 3%Ethylcyclohexane µg/tube nd nd -n-Heptane µg/tube 0.6 0.55 9%n-Hexane µg/tube 3.8 3.7 3%Isopropanol µg/tube nd nd -Isopropylbenzene µg/tube 0.1 0.08 22%4-Isopropyltoluene µg/tube 0.18 0.14 25%2-Methyl butane µg/tube 27 26 4%Methyl tert-butyl ether µg/tube 3.7 3.4 8%Methylcyclohexane µg/tube 0.15 0.16 6%2-Methylhexane µg/tube 1.2 1.1 9%3-Methylhexane µg/tube 1.3 1.2 8%2-Methylpentane µg/tube 8.4 7.7 9%3-Methylpentane µg/tube 3.4 3.2 6%Naphthalene µg/tube nd nd -n-Nonane µg/tube 0.16 0.18 12%n-Octane µg/tube nd nd -n-Pentane µg/tube 22 21 5%propylbenzene µg/tube 0.22 0.21 5%Tetrachloroethene µg/tube 2.4 2.3 4%Toluene µg/tube 25 22 13%1,1,1-trichloroethane µg/tube nd nd -1,1,2-trichloroethane µg/tube nd nd -Trichloroethene µg/tube 380 370 3%Trichloromethane µg/tube 0.24 0.23 4%1,2,4-Trimethylbenzene µg/tube 1.9 1.9 0%1,3,5-Trimethylbenzene µg/tube 0.44 0.39 12%n-Undecane µg/tube 2.3 2.1 9%Vinyl Chloride µg/tube nd nd -o-Xylene µg/tube 0.69 0.62 11%m&p-Xylenes µg/tube 2 2.1 5%TRH C6-C10 µg/tube 380 340 11%TRH > C10-C16 µg/tube 480 400 18%Note:
Compounds of interest
Table B6Relative Percent Differences for Flux Duplicate Samples
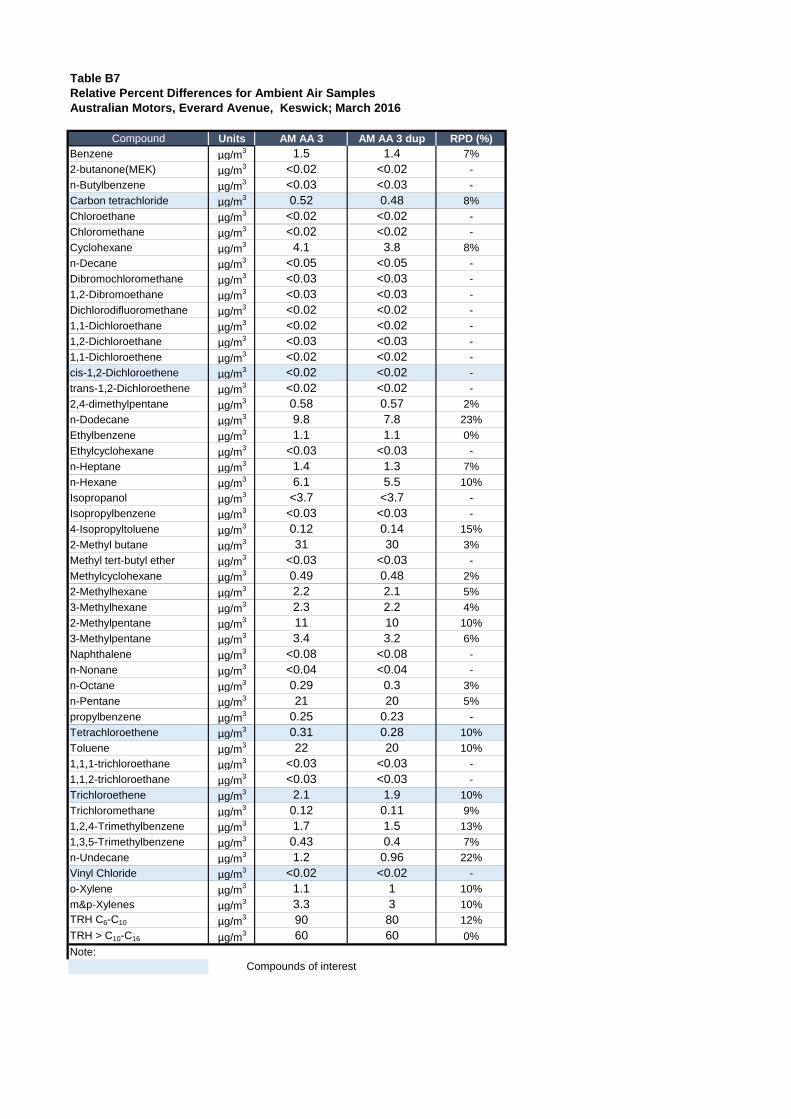
Australian Motors, Everard Avenue, Keswick; March 2016
Compound Units AM AA 3 AM AA 3 dup RPD (%)Benzene µg/m3 1.5 1.4 7%2-butanone(MEK) µg/m3 <0.02 <0.02 -n-Butylbenzene µg/m3 <0.03 <0.03 -Carbon tetrachloride µg/m3 0.52 0.48 8%Chloroethane µg/m3 <0.02 <0.02 -Chloromethane µg/m3 <0.02 <0.02 -Cyclohexane µg/m3 4.1 3.8 8%n-Decane µg/m3 <0.05 <0.05 -Dibromochloromethane µg/m3 <0.03 <0.03 -1,2-Dibromoethane µg/m3 <0.03 <0.03 -Dichlorodifluoromethane µg/m3 <0.02 <0.02 -1,1-Dichloroethane µg/m3 <0.02 <0.02 -1,2-Dichloroethane µg/m3 <0.03 <0.03 -1,1-Dichloroethene µg/m3 <0.02 <0.02 -cis-1,2-Dichloroethene µg/m3 <0.02 <0.02 -trans-1,2-Dichloroethene µg/m3 <0.02 <0.02 -2,4-dimethylpentane µg/m3 0.58 0.57 2%n-Dodecane µg/m3 9.8 7.8 23%Ethylbenzene µg/m3 1.1 1.1 0%Ethylcyclohexane µg/m3 <0.03 <0.03 -n-Heptane µg/m3 1.4 1.3 7%n-Hexane µg/m3 6.1 5.5 10%Isopropanol µg/m3 <3.7 <3.7 -Isopropylbenzene µg/m3 <0.03 <0.03 -4-Isopropyltoluene µg/m3 0.12 0.14 15%2-Methyl butane µg/m3 31 30 3%Methyl tert-butyl ether µg/m3 <0.03 <0.03 -Methylcyclohexane µg/m3 0.49 0.48 2%2-Methylhexane µg/m3 2.2 2.1 5%3-Methylhexane µg/m3 2.3 2.2 4%2-Methylpentane µg/m3 11 10 10%3-Methylpentane µg/m3 3.4 3.2 6%Naphthalene µg/m3 <0.08 <0.08 -n-Nonane µg/m3 <0.04 <0.04 -n-Octane µg/m3 0.29 0.3 3%n-Pentane µg/m3 21 20 5%propylbenzene µg/m3 0.25 0.23 -Tetrachloroethene µg/m3 0.31 0.28 10%Toluene µg/m3 22 20 10%1,1,1-trichloroethane µg/m3 <0.03 <0.03 -1,1,2-trichloroethane µg/m3 <0.03 <0.03 -Trichloroethene µg/m3 2.1 1.9 10%Trichloromethane µg/m3 0.12 0.11 9%1,2,4-Trimethylbenzene µg/m3 1.7 1.5 13%1,3,5-Trimethylbenzene µg/m3 0.43 0.4 7%n-Undecane µg/m3 1.2 0.96 22%Vinyl Chloride µg/m3 <0.02 <0.02 -o-Xylene µg/m3 1.1 1 10%m&p-Xylenes µg/m3 3.3 3 10%TRH C6-C10 µg/m3 90 80 12%TRH > C10-C16 µg/m3 60 60 0%Note:
Compounds of interest
Table B7Relative Percent Differences for Ambient Air Samples

Appendix C
DAILY WEATHER OBSERVATIONS – BUREAU OF METEOROLOGY DATA
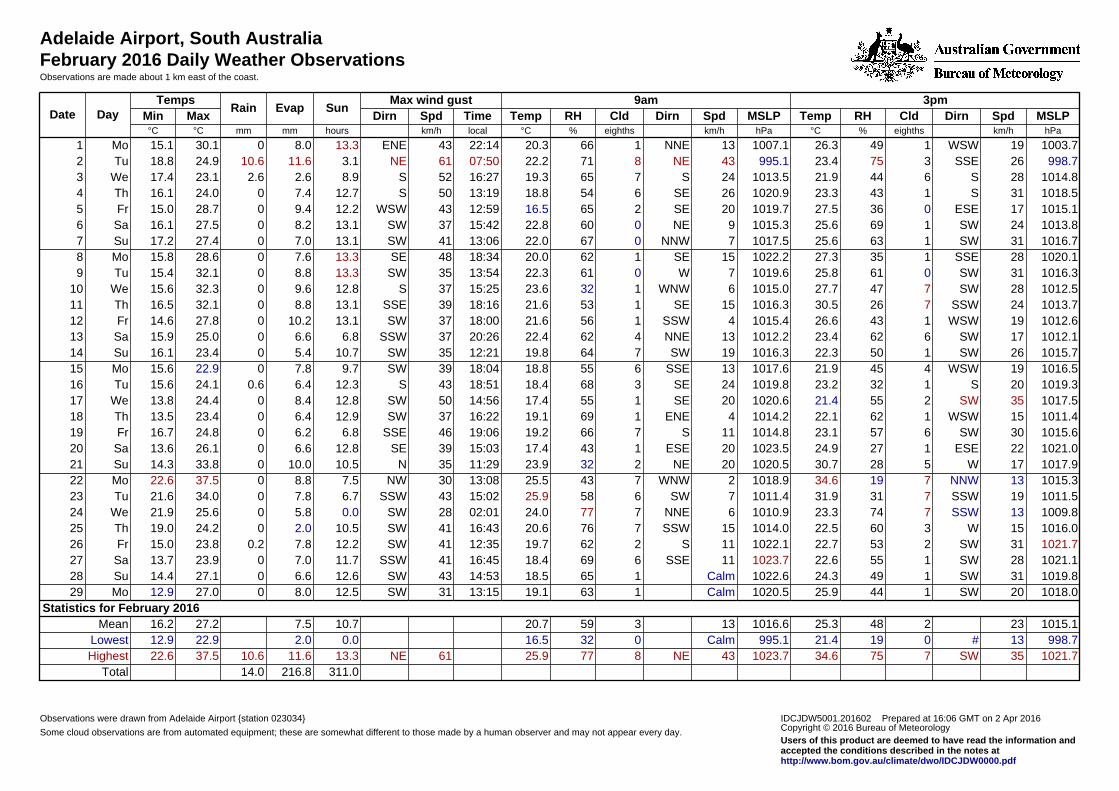
Adelaide Airport, South AustraliaFebruary 2016 Daily Weather ObservationsObservations are made about 1 km east of the coast.
IDCJDW5001.201602 Prepared at 16:06 GMT on 2 Apr 2016Copyright © 2016 Bureau of MeteorologyUsers of this product are deemed to have read the information andaccepted the conditions described in the notes athttp://www.bom.gov.au/climate/dwo/IDCJDW0000.pdf
Observations were drawn from Adelaide Airport {station 023034}
Some cloud observations are from automated equipment; these are somewhat different to those made by a human observer and may not appear every day.
3pm9amMax wind gustSunEvapRain
TempsDayDate MSLPSpdDirnCldRHTempMSLPSpdDirnCldRHTempTimeSpdDirnMaxMin
hPakm/heighths%°ChPakm/heighths%°Clocalkm/hhoursmmmm°C°C
1003.719WSW14926.31007.113NNE16620.322:1443ENE13.38.0030.115.1Mo1998.726SSE37523.4995.143NE87122.207:5061NE3.111.610.624.918.8Tu2
1014.828S64421.91013.524S76519.316:2752S8.92.62.623.117.4We31018.531S14323.31020.926SE65418.813:1950S12.77.4024.016.1Th41015.117ESE03627.51019.720SE26516.512:5943WSW12.29.4028.715.0Fr51013.824SW16925.61015.39NE06022.815:4237SW13.18.2027.516.1Sa61016.731SW16325.61017.57NNW06722.013:0641SW13.17.0027.417.2Su71020.128SSE13527.31022.215SE16220.018:3448SE13.37.6028.615.8Mo81016.331SW06125.81019.67W06122.313:5435SW13.38.8032.115.4Tu91012.528SW74727.71015.06WNW13223.615:2537S12.89.6032.315.6We101013.724SSW72630.51016.315SE15321.618:1639SSE13.18.8032.116.5Th111012.619WSW14326.61015.44SSW15621.618:0037SW13.110.2027.814.6Fr121012.117SW66223.41012.213NNE46222.420:2637SSW6.86.6025.015.9Sa131015.726SW15022.31016.319SW76419.812:2135SW10.75.4023.416.1Su141016.519WSW44521.91017.613SSE65518.818:0439SW9.77.8022.915.6Mo151019.320S13223.21019.824SE36818.418:5143S12.36.40.624.115.6Tu161017.535SW25521.41020.620SE15517.414:5650SW12.88.4024.413.8We171011.415WSW16222.11014.24ENE16919.116:2237SW12.96.4023.413.5Th181015.630SW65723.11014.811S76619.219:0646SSE6.86.2024.816.7Fr191021.022ESE12724.91023.520ESE14317.415:0339SE12.86.6026.113.6Sa201017.917W52830.71020.520NE23223.911:2935N10.510.0033.814.3Su211015.313NNW71934.61018.92WNW74325.513:0830NW7.58.8037.522.6Mo221011.519SSW73131.91011.47SW65825.915:0243SSW6.77.8034.021.6Tu231009.813SSW77423.31010.96NNE77724.002:0128SW0.05.8025.621.9We241016.015W36022.51014.015SSW77620.616:4341SW10.52.0024.219.0Th251021.731SW25322.71022.111S26219.712:3541SW12.27.80.223.815.0Fr261021.128SW15522.61023.711SSE66918.416:4541SSW11.77.0023.913.7Sa271019.831SW14924.31022.6Calm16518.514:5343SW12.66.6027.114.4Su281018.020SW14425.91020.5Calm16319.113:1531SW12.58.0027.012.9Mo29
Statistics for February 20161015.12324825.31016.61335920.710.77.527.216.2Mean998.713#01921.4995.1Calm03216.50.02.022.912.9Lowest
1021.735SW77534.61023.743NE87725.961NE13.311.610.637.522.6Highest311.0216.814.0Total

Adelaide Airport, South AustraliaMarch 2016 Daily Weather ObservationsObservations are made about 1 km east of the coast.
IDCJDW5001.201603 Prepared at 13:06 GMT on 7 Apr 2016Copyright © 2016 Bureau of MeteorologyUsers of this product are deemed to have read the information andaccepted the conditions described in the notes athttp://www.bom.gov.au/climate/dwo/IDCJDW0000.pdf
Observations were drawn from Adelaide Airport {station 023034}
Some cloud observations are from automated equipment; these are somewhat different to those made by a human observer and may not appear every day.
3pm9amMax wind gustSunEvapRain
TempsDayDate MSLPSpdDirnCldRHTempMSLPSpdDirnCldRHTempTimeSpdDirnMaxMin
hPakm/heighths%°ChPakm/heighths%°Clocalkm/hhoursmmmm°C°C
1014.619SW82927.41015.54NW35923.511:5235WSW7.68.4032.615.8Tu11015.415SW64328.51016.36NNE63425.218:3243SSE9.97.6030.117.0We21016.530SW65625.71020.011S35920.713:4539SW11.27.4030.217.0Th31014.224SW25925.91015.57ENE55822.613:0228WSW12.28.0028.516.1Fr41014.411WSW63931.91016.97NW55423.017:0228SE9.76.8036.418.1Sa51012.119SSW73034.91015.311WNW77026.015:5359NNE5.87.2036.922.6Su61016.724SSW76625.01016.14WSW76924.902:5646SE2.17.810.828.222.3Mo71012.111SW73531.81014.1Calm25726.816:3041WSW10.34.4033.621.0Tu81015.013NNE76427.41015.7Calm77523.823:1230NNE3.37.4030.421.8We91015.819WSW57325.41018.0Calm89222.212:4526SW6.66.218.026.821.1Th101015.320SW37126.71016.59NE17624.015:2631SW10.93.00.627.820.3Fr111018.115S74629.71019.611WSW77722.914:4631SSE8.76.2030.219.4Sa121016.822SW16526.61018.76NNE37622.214:3433SW11.54.2028.316.9Su131017.826SSE4725.71019.926SE66219.817:0943SE9.18.0026.418.1Mo141015.820SW04525.41018.724ESE15618.323:0441SE11.47.2028.315.7Tu151011.620SW15426.41014.8Calm16222.313:2726SW11.35.0029.216.5We161003.517WNW63133.21007.817NE44528.322:4659WSW8.37.0034.122.3Th171012.833SW34219.81010.837SW55217.302:0572WSW8.310.28.620.816.5Fr181018.720SW75619.71019.3Calm57215.814:1433SW4.16.0021.211.5Sa191019.126WSW14920.51021.47N06115.715:0139WSW11.13.40.223.29.9Su201017.822WSW04621.71020.7Calm16017.012:3030W11.16.4022.311.2Mo211014.817W31926.91016.6Calm15818.212:4133WNW10.94.2029.911.5Tu221018.824SW76521.51017.213S85621.613:5933SW0.16.6023.518.0We231017.813SSW75324.21020.67ENE76520.111:0828WSW2.03.4024.917.9Th241021.637SW14821.01023.911SSE66317.413:3250SW11.12.40.821.613.9Fr251022.317W75620.91023.59E74917.715:2931SW1.86.2021.512.2Sa261020.311ESE83921.11023.09ENE86917.017:2335SSE1.95.0022.515.3Su271017.613SSW53621.71019.817ENE74716.001:2241ESE4.55.4023.714.6Mo281020.626SSE63220.91022.711ESE75415.812:2841SSE8.64.8021.914.3Tu291023.013W75019.21024.411N76015.215:5028WSW1.45.0020.08.9We301019.413WSW54121.31022.115NE37115.512:2724W10.13.2023.910.6Th31
Statistics for March 20161016.51944725.11018.2946120.57.65.927.116.4Mean1003.511#01919.21007.8Calm03415.20.12.420.08.9Lowest1023.037SW87334.91024.437SW89228.372WSW12.210.218.036.922.6Highest
236.9184.039.0Total

Appendix D
BORE LOGS
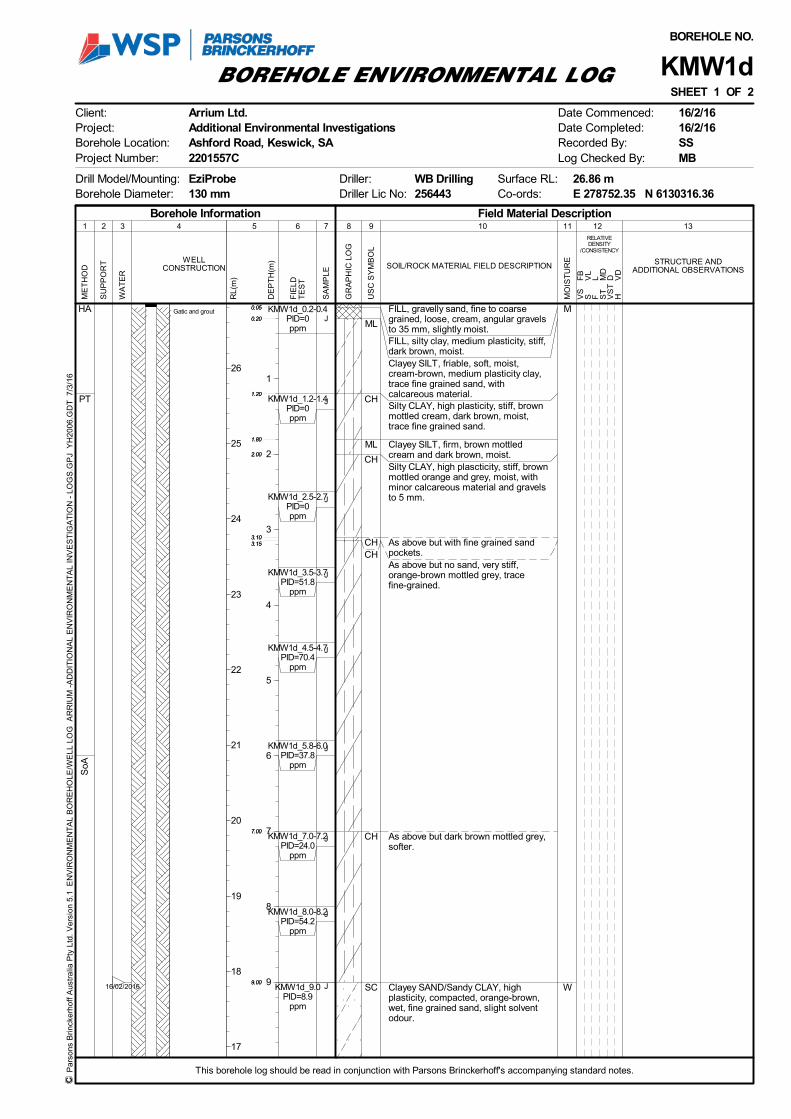
SoA
16/02/2016
M
W
HA
PT
KMW1d_0.2-0.4PID=0ppm
KMW1d_1.2-1.4PID=0ppm
KMW1d_2.5-2.7PID=0ppm
KMW1d_3.5-3.7PID=51.8
ppm
KMW1d_4.5-4.7PID=70.4
ppm
KMW1d_5.8-6.0PID=37.8
ppm
KMW1d_7.0-7.2PID=24.0
ppm
KMW1d_8.0-8.2PID=54.2
ppm
KMW1d_9.0PID=8.9
ppm
ML
CH
ML
CH
CHCH
CH
SC
Gatic and grout FILL, gravelly sand, fine to coarsegrained, loose, cream, angular gravelsto 35 mm, slightly moist.FILL, silty clay, medium plasticity, stiff,dark brown, moist.Clayey SILT, friable, soft, moist,cream-brown, medium plasticity clay,trace fine grained sand, withcalcareous material.Silty CLAY, high plasticity, stiff, brownmottled cream, dark brown, moist,trace fine grained sand.
Clayey SILT, firm, brown mottledcream and dark brown, moist.Silty CLAY, high plascticity, stiff, brownmottled orange and grey, moist, withminor calcareous material and gravelsto 5 mm.
As above but with fine grained sandpockets.As above but no sand, very stiff,orange-brown mottled grey, tracefine-grained.
As above but dark brown mottled grey,softer.
Clayey SAND/Sandy CLAY, highplasticity, compacted, orange-brown,wet, fine grained sand, slight solventodour.
J
J
J
J
J
J
J
J
J
0.05
0.20
1.20
1.80
2.00
3.103.15
7.00
9.00
0.05
0.20
1.20
1.80
2.00
3.103.15
7.00
9.00
This borehole log should be read in conjunction with Parsons Brinckerhoff's accompanying standard notes.
RELATIVEDENSITY
/CONSISTENCY
GR
AP
HIC
LO
G
4
MO
IST
UR
E
12
WELLCONSTRUCTION
6
SOIL/ROCK MATERIAL FIELD DESCRIPTION
SHEET 1 OF 2
10 11 13
VS
S F ST
VS
TH
FB
VL
L MD
D VD
31
FIE
LDT
ES
T
7 82
Borehole Information
SA
MP
LE
US
C S
YM
BO
L
9
Field Material Description
STRUCTURE ANDADDITIONAL OBSERVATIONS
5
BOREHOLE ENVIRONMENTAL LOGS
UP
PO
RT
WA
TE
R
ME
TH
OD
Drill Model/Mounting:Borehole Diameter:
Arrium Ltd.Additional Environmental InvestigationsAshford Road, Keswick, SA2201557C
Client:Project:Borehole Location:Project Number:
EziProbe130 mm
Date Commenced:Date Completed:Recorded By:Log Checked By:
BOREHOLE NO.
KMW1d
16/2/1616/2/16SSMB
Driller:Driller Lic No:
WB Drilling256443
26.86 mE 278752.35 N 6130316.36
Surface RL:Co-ords:
1
2
3
4
5
6
7
8
9
DE
PT
H(m
)
RL(
m)
26
25
24
23
22
21
20
19
18
17
Par
sons
Brin
cker
hoff
Aus
tral
ia P
ty L
td.
Ver
sion
5.1
EN
VIR
ON
ME
NT
AL
BO
RE
HO
LE/W
ELL
LO
G A
RR
IUM
-A
DD
ITIO
NA
L E
NV
IRO
NM
EN
TA
L IN
VE
ST
IGA
TIO
N -
LO
GS
.GP
J Y
H20
06.G
DT
7/3
/16

SoA
29/02/2016
WKMW1d_10.0PID=14.8
ppm
KMW1d_11.0PID=14.7
ppm
KMW1d_12.0PID=59.0
ppm
KMW1d_15.0PID=10.2
ppm
SC
SC
SC
Bentonite
Sand
Screen
End cap
Clayey SAND, fine-grained,compacted, sticky, orange-brown, wet,moderate solvent odour.
As above but decrease in clay content,moderate solvent odour.
As above but no odour.
END OF BOREHOLE AT 19.00 m
J
J
J
J
10.00
11.00
18.00
19.00
10.00
11.00
18.00
This borehole log should be read in conjunction with Parsons Brinckerhoff's accompanying standard notes.
RELATIVEDENSITY
/CONSISTENCY
GR
AP
HIC
LO
G
4
MO
IST
UR
E
12
WELLCONSTRUCTION
6
SOIL/ROCK MATERIAL FIELD DESCRIPTION
SHEET 2 OF 2
10 11 13
VS
S F ST
VS
TH
FB
VL
L MD
D VD
31
FIE
LDT
ES
T
7 82
Borehole Information
SA
MP
LE
US
C S
YM
BO
L
9
Field Material Description
STRUCTURE ANDADDITIONAL OBSERVATIONS
5
BOREHOLE ENVIRONMENTAL LOGS
UP
PO
RT
WA
TE
R
ME
TH
OD
Drill Model/Mounting:Borehole Diameter:
Arrium Ltd.Additional Environmental InvestigationsAshford Road, Keswick, SA2201557C
Client:Project:Borehole Location:Project Number:
EziProbe130 mm
Date Commenced:Date Completed:Recorded By:Log Checked By:
BOREHOLE NO.
KMW1d
16/2/1616/2/16SSMB
Driller:Driller Lic No:
WB Drilling256443
26.86 mE 278752.35 N 6130316.36
Surface RL:Co-ords:
11
12
13
14
15
16
17
18
19
DE
PT
H(m
)
RL(
m)
16
15
14
13
12
11
10
9
8
7
Par
sons
Brin
cker
hoff
Aus
tral
ia P
ty L
td.
Ver
sion
5.1
EN
VIR
ON
ME
NT
AL
BO
RE
HO
LE/W
ELL
LO
G A
RR
IUM
-A
DD
ITIO
NA
L E
NV
IRO
NM
EN
TA
L IN
VE
ST
IGA
TIO
N -
LO
GS
.GP
J Y
H20
06.G
DT
7/3
/16
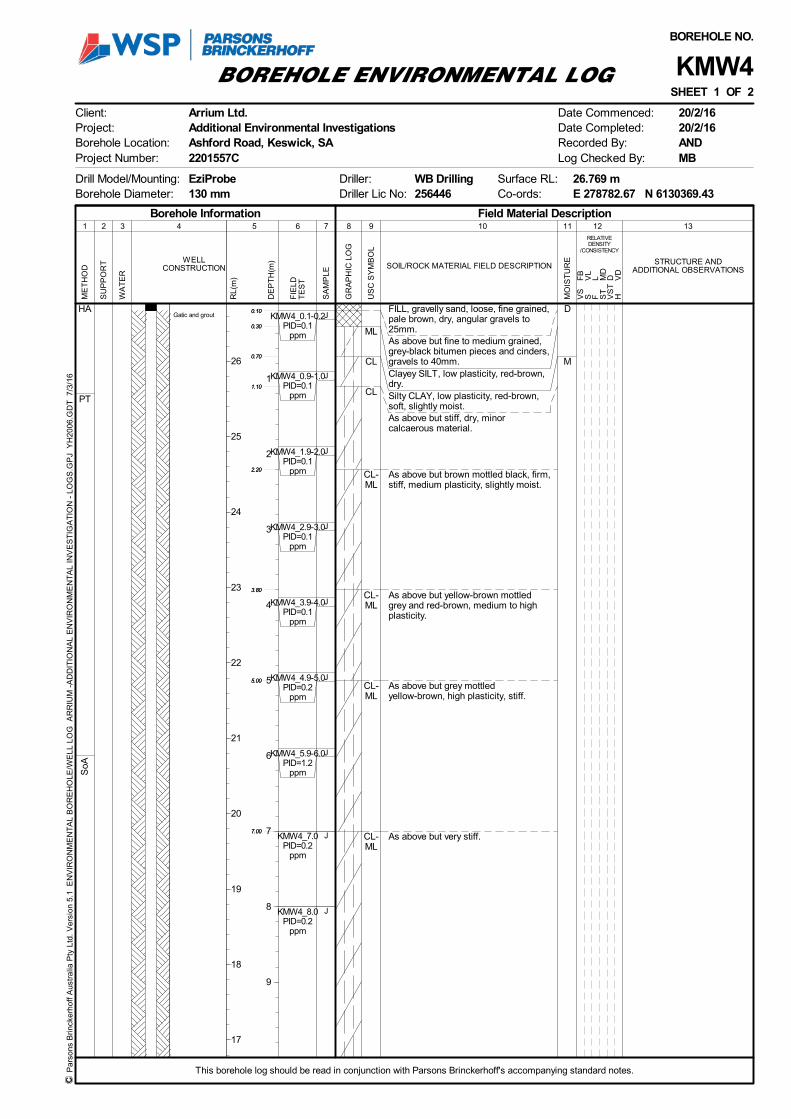
SoA
D
M
HA
PT
KMW4_0.1-0.2PID=0.1
ppm
KMW4_0.9-1.0PID=0.1
ppm
KMW4_1.9-2.0PID=0.1
ppm
KMW4_2.9-3.0PID=0.1
ppm
KMW4_3.9-4.0PID=0.1
ppm
KMW4_4.9-5.0PID=0.2
ppm
KMW4_5.9-6.0PID=1.2
ppm
KMW4_7.0PID=0.2
ppm
KMW4_8.0PID=0.2
ppm
ML
CL
CL
CL-ML
CL-ML
CL-ML
CL-ML
Gatic and groutFILL, gravelly sand, loose, fine grained,pale brown, dry, angular gravels to25mm.As above but fine to medium grained,grey-black bitumen pieces and cinders,gravels to 40mm.Clayey SILT, low plasticity, red-brown,dry.Silty CLAY, low plasticity, red-brown,soft, slightly moist.As above but stiff, dry, minorcalcaerous material.
As above but brown mottled black, firm,stiff, medium plasticity, slightly moist.
As above but yellow-brown mottledgrey and red-brown, medium to highplasticity.
As above but grey mottledyellow-brown, high plasticity, stiff.
As above but very stiff.
J
J
J
J
J
J
J
J
J
0.10
0.30
0.70
1.10
2.20
3.80
5.00
7.00
0.10
0.30
0.70
1.10
2.20
3.80
5.00
7.00
This borehole log should be read in conjunction with Parsons Brinckerhoff's accompanying standard notes.
RELATIVEDENSITY
/CONSISTENCY
GR
AP
HIC
LO
G
4
MO
IST
UR
E
12
WELLCONSTRUCTION
6
SOIL/ROCK MATERIAL FIELD DESCRIPTION
SHEET 1 OF 2
10 11 13
VS
S F ST
VS
TH
FB
VL
L MD
D VD
31
FIE
LDT
ES
T
7 82
Borehole Information
SA
MP
LE
US
C S
YM
BO
L
9
Field Material Description
STRUCTURE ANDADDITIONAL OBSERVATIONS
5
BOREHOLE ENVIRONMENTAL LOGS
UP
PO
RT
WA
TE
R
ME
TH
OD
Drill Model/Mounting:Borehole Diameter:
Arrium Ltd.Additional Environmental InvestigationsAshford Road, Keswick, SA2201557C
Client:Project:Borehole Location:Project Number:
EziProbe130 mm
Date Commenced:Date Completed:Recorded By:Log Checked By:
BOREHOLE NO.
KMW4
20/2/1620/2/16ANDMB
Driller:Driller Lic No:
WB Drilling256446
26.769 mE 278782.67 N 6130369.43
Surface RL:Co-ords:
1
2
3
4
5
6
7
8
9
DE
PT
H(m
)
RL(
m)
26
25
24
23
22
21
20
19
18
17
Par
sons
Brin
cker
hoff
Aus
tral
ia P
ty L
td.
Ver
sion
5.1
EN
VIR
ON
ME
NT
AL
BO
RE
HO
LE/W
ELL
LO
G A
RR
IUM
-A
DD
ITIO
NA
L E
NV
IRO
NM
EN
TA
L IN
VE
ST
IGA
TIO
N -
LO
GS
.GP
J Y
H20
06.G
DT
7/3
/16

SoA
20/216
29/02/2016
M
W
M
KMW4_10.0PID=0.3
ppm
KMW4_11.0PID=0.1
ppm
KMW4_12.0PID=0.2
ppm
KMW4_13.0PID=0.3
ppm
KMW4_15.0PID=0.3
ppm
KMW_18.0PID=0.6
ppm
CL-ML
SC
SC
SC
SC
CH
Bentonite
Sand
Screen
End cap
As above but red-brown mottled grey.
Clayey SAND, fine to medium grained,medium plasticity, soft, pale red-brown,wet.
As above but very moist, low plasticity,medium grained.
As above but red-brown, moist.
Clayey SAND / Sandy CLAY, soft tofirm, medium plasticity, red-brown, fineto medium grained, moist.
Sandy Silty CLAY, medium to highplasticity, firm, red-brown mottled greyand yellow-brown, fine-grained sand.
END OF BOREHOLE AT 19.00 m
J
J
J
J
J
J
10.00
11.00
12.00
13.00
15.00
18.00
19.00
10.00
11.00
12.00
13.00
15.00
18.00
This borehole log should be read in conjunction with Parsons Brinckerhoff's accompanying standard notes.
RELATIVEDENSITY
/CONSISTENCY
GR
AP
HIC
LO
G
4
MO
IST
UR
E
12
WELLCONSTRUCTION
6
SOIL/ROCK MATERIAL FIELD DESCRIPTION
SHEET 2 OF 2
10 11 13
VS
S F ST
VS
TH
FB
VL
L MD
D VD
31
FIE
LDT
ES
T
7 82
Borehole Information
SA
MP
LE
US
C S
YM
BO
L
9
Field Material Description
STRUCTURE ANDADDITIONAL OBSERVATIONS
5
BOREHOLE ENVIRONMENTAL LOGS
UP
PO
RT
WA
TE
R
ME
TH
OD
Drill Model/Mounting:Borehole Diameter:
Arrium Ltd.Additional Environmental InvestigationsAshford Road, Keswick, SA2201557C
Client:Project:Borehole Location:Project Number:
EziProbe130 mm
Date Commenced:Date Completed:Recorded By:Log Checked By:
BOREHOLE NO.
KMW4
20/2/1620/2/16ANDMB
Driller:Driller Lic No:
WB Drilling256446
26.769 mE 278782.67 N 6130369.43
Surface RL:Co-ords:
11
12
13
14
15
16
17
18
19
DE
PT
H(m
)
RL(
m)
16
15
14
13
12
11
10
9
8
7
Par
sons
Brin
cker
hoff
Aus
tral
ia P
ty L
td.
Ver
sion
5.1
EN
VIR
ON
ME
NT
AL
BO
RE
HO
LE/W
ELL
LO
G A
RR
IUM
-A
DD
ITIO
NA
L E
NV
IRO
NM
EN
TA
L IN
VE
ST
IGA
TIO
N -
LO
GS
.GP
J Y
H20
06.G
DT
7/3
/16

SoA
D
M
HA
PT
Hard bands
KMW5_0.1-0.2PID=0.1
ppm
KMW5_0.7-0.8PID=0.0
ppm
KMW5_1.8-1.9PID=0.0
ppm
KMW5_2.8-2.9PID=0.0
ppm
KMW5_3.8-3.9PID=0.0
ppm
KMW5_4.8-4.9PID=0.1
ppm
KMW5_5.9-6.0PID=0.5
ppm
KMW5_7.0PID=0.1
ppm
KMW5_8.0PID=0.5
ppm
KMW5_9.0PID=0.3
ppm
CL-MLCL-MLCL-MLCL-ML
CL-ML
CL-ML
CL-ML
CL-ML
Gatic and groutFILL, gravelly sand, fine grained,brown, dry, angular gravels to 10 mm.FILL, sandy gravel, angular gravels to35 mm, black, bitumen pieces, cinders,dry.Silty CLAY, low to medium plasticity,soft, dark red-brown, slightly moist.As above but red-brown.As above but with calcareous material.As above but firm.
As above but medium plasticity,mottled brown, red-brown and grey.
As above but mottled grey,yellow-brown and black.
As above but stiff, medium to highplasticity, grey mottled yellow-brown.
As above but with minor gravels to 5mm.
J
J
J
J
J
J
J
J
J
J
0.10
0.25
0.40
0.70
1.10
2.10
4.00
5.00
8.00
0.10
0.25
0.40
0.70
1.10
2.10
4.00
5.00
8.00
This borehole log should be read in conjunction with Parsons Brinckerhoff's accompanying standard notes.
RELATIVEDENSITY
/CONSISTENCY
GR
AP
HIC
LO
G
4
MO
IST
UR
E
12
WELLCONSTRUCTION
6
SOIL/ROCK MATERIAL FIELD DESCRIPTION
SHEET 1 OF 2
10 11 13
VS
S F ST
VS
TH
FB
VL
L MD
D VD
31
FIE
LDT
ES
T
7 82
Borehole Information
SA
MP
LE
US
C S
YM
BO
L
9
Field Material Description
STRUCTURE ANDADDITIONAL OBSERVATIONS
5
BOREHOLE ENVIRONMENTAL LOGS
UP
PO
RT
WA
TE
R
ME
TH
OD
Drill Model/Mounting:Borehole Diameter:
Arrium Ltd.Additional Environmental InvestigationsAshford Road, Keswick, SA2201557C
Client:Project:Borehole Location:Project Number:
EziProbe130 mm
Date Commenced:Date Completed:Recorded By:Log Checked By:
BOREHOLE NO.
KMW5
20/2/1620/2/16ANDMB
Driller:Driller Lic No:
WB Drilling256445
26.722 mE 278754.78 N 6130358.54
Surface RL:Co-ords:
1
2
3
4
5
6
7
8
9
DE
PT
H(m
)
RL(
m)
26
25
24
23
22
21
20
19
18
17
Par
sons
Brin
cker
hoff
Aus
tral
ia P
ty L
td.
Ver
sion
5.1
EN
VIR
ON
ME
NT
AL
BO
RE
HO
LE/W
ELL
LO
G A
RR
IUM
-A
DD
ITIO
NA
L E
NV
IRO
NM
EN
TA
L IN
VE
ST
IGA
TIO
N -
LO
GS
.GP
J Y
H20
06.G
DT
7/3
/16

SoA
20/02/16
29/02/2016
W
M
W
Hard bands
KMW5_10.0PID=0.3
ppm
KMW5_11.0PID=0.3
ppm
KMW5_12.0PID=0.2
ppm
KMW5_13.0PID=0.5
ppm
KMW5_14.0PID=1.1
ppm
KMW5_15.0PID=0.9
ppm
CL-ML
SC
SC
SC
Bentonite
Sand
Screen
End cap
Clayey SAND/Sandy CLAY, finegrained, medium plasticity, soft to firm,red-brown, wet.
Clayey SAND, fine to medium grained,low plasticity, soft, red-brown, wet.
As above but moist.
As above but wet.
END OF BOREHOLE AT 19.00 m
J
J
J
J
J
J
10.00
12.00
13.00
15.00
19.00
10.00
12.00
13.00
15.00
This borehole log should be read in conjunction with Parsons Brinckerhoff's accompanying standard notes.
RELATIVEDENSITY
/CONSISTENCY
GR
AP
HIC
LO
G
4
MO
IST
UR
E
12
WELLCONSTRUCTION
6
SOIL/ROCK MATERIAL FIELD DESCRIPTION
SHEET 2 OF 2
10 11 13
VS
S F ST
VS
TH
FB
VL
L MD
D VD
31
FIE
LDT
ES
T
7 82
Borehole Information
SA
MP
LE
US
C S
YM
BO
L
9
Field Material Description
STRUCTURE ANDADDITIONAL OBSERVATIONS
5
BOREHOLE ENVIRONMENTAL LOGS
UP
PO
RT
WA
TE
R
ME
TH
OD
Drill Model/Mounting:Borehole Diameter:
Arrium Ltd.Additional Environmental InvestigationsAshford Road, Keswick, SA2201557C
Client:Project:Borehole Location:Project Number:
EziProbe130 mm
Date Commenced:Date Completed:Recorded By:Log Checked By:
BOREHOLE NO.
KMW5
20/2/1620/2/16ANDMB
Driller:Driller Lic No:
WB Drilling256445
26.722 mE 278754.78 N 6130358.54
Surface RL:Co-ords:
11
12
13
14
15
16
17
18
19
DE
PT
H(m
)
RL(
m)
16
15
14
13
12
11
10
9
8
7
Par
sons
Brin
cker
hoff
Aus
tral
ia P
ty L
td.
Ver
sion
5.1
EN
VIR
ON
ME
NT
AL
BO
RE
HO
LE/W
ELL
LO
G A
RR
IUM
-A
DD
ITIO
NA
L E
NV
IRO
NM
EN
TA
L IN
VE
ST
IGA
TIO
N -
LO
GS
.GP
J Y
H20
06.G
DT
7/3
/16

SoA
DM
W
M
HA
PT
KMW6_0.1-0.3PID=0.0
ppm
KMW6_1.0-1.2PID=0ppm
KMW6_2.1-2.3PID=47.7
ppm
KMW6_3.3-3.5PID=75.0
ppm
KMW6_4.7-4.9PID=84.3
ppm
KMW6_5.8-6.0PID=47.7
ppm
KMW6_7.0PID=13.8
ppm
KMW6_8.0PID=42.5
ppm
KMW6_9.0PID=28.7
ppm
CL-ML
CL-MLML
CH
CH
CH
CH
CL-MLSC
SC
CHCH
Gatic and groutFILL, gravelly sand, fine grained,cream-grey, loose, dry, subangulargravels to 35 mm.As above but grey-brown, with clayinclusions.Silty CLAY, medium plasticity, stiff butfriable, dark orange-brown, slightlymoist, trace fine-grained sand.As above but orange-brown mottledcream, with calcareous material andgravels to 10 mm.Clayey SILT, stiff, orange-brownmottled cream, slightly moist,calcareous material.Silty CLAY, high plasticity, stiff,orange-brown, moist.As above but brown mottled orangeand cream, trace fine-grained sand,calcerous material.
As above but very stiff, brown mottledgrey.
As above but orange-brown mottledgrey.
Sandy Silty CLAY, medium plasticity,stiff, orange-brown mottled grey,slightly moist, fine-grained sand.Clayey SAND/ Sandy CLAY, mediumplasticity, fine-grained sand,compacted, orange-brown mottledgrey-black, moist.
As above but wet.
Silty CLAY, high plasticity, very stiff,brown mottled orange-grey, slightlymoist.As above but soft.Hard bands between 8.5 and 9.1 m and9.1 to 9.5 m
J
J
J
J
J
J
J
J
J
0.050.10
0.60
0.80
1.70
2.10
2.80
3.50
4.70
5.00
5.80
7.707.80
0.050.10
0.60
0.80
1.70
2.10
2.80
3.50
4.70
5.00
5.80
7.707.80
This borehole log should be read in conjunction with Parsons Brinckerhoff's accompanying standard notes.
RELATIVEDENSITY
/CONSISTENCY
GR
AP
HIC
LO
G
4
MO
IST
UR
E
12
WELLCONSTRUCTION
6
SOIL/ROCK MATERIAL FIELD DESCRIPTION
SHEET 1 OF 2
10 11 13
VS
S F ST
VS
TH
FB
VL
L MD
D VD
31
FIE
LDT
ES
T
7 82
Borehole Information
SA
MP
LE
US
C S
YM
BO
L
9
Field Material Description
STRUCTURE ANDADDITIONAL OBSERVATIONS
5
BOREHOLE ENVIRONMENTAL LOGS
UP
PO
RT
WA
TE
R
ME
TH
OD
Drill Model/Mounting:Borehole Diameter:
Arrium Ltd.Additional Environmental InvestigationsAshford Road, Keswick, SA2201557C
Client:Project:Borehole Location:Project Number:
EziProbe130 mm
Date Commenced:Date Completed:Recorded By:Log Checked By:
BOREHOLE NO.
KMW6
17/2/1617/2/16SSMB
Driller:Driller Lic No:
WB Drilling256444
26.194 mE 278744.76 N 6130404.26
Surface RL:Co-ords:
1
2
3
4
5
6
7
8
9
DE
PT
H(m
)
RL(
m)
26
25
24
23
22
21
20
19
18
17
Par
sons
Brin
cker
hoff
Aus
tral
ia P
ty L
td.
Ver
sion
5.1
EN
VIR
ON
ME
NT
AL
BO
RE
HO
LE/W
ELL
LO
G A
RR
IUM
-A
DD
ITIO
NA
L E
NV
IRO
NM
EN
TA
L IN
VE
ST
IGA
TIO
N -
LO
GS
.GP
J Y
H20
06.G
DT
7/3
/16

SoA
17/02/2016
29/02/2016
M
W
KMW6_12.0PID=39.6
ppm
KMW6_15.0PID=68.5
ppm
KMW6_19.0PID=4.7
ppm
CH
CH
CH
SC
Bentonite
Sand
Screen
End cap
As above but with gravelly layer,sub-rounded gravels to 30mm.
Silty CLAY, high plasticity, very stiff,grey-mottled orange and yellow, wet.
Sandy CLAY, medium plasticity,orange-brown, wet, fine grained sand.
END OF BOREHOLE AT 19.00 m
J
J
J
10.20
11.80
15.00
19.00
10.20
11.80
15.00
This borehole log should be read in conjunction with Parsons Brinckerhoff's accompanying standard notes.
RELATIVEDENSITY
/CONSISTENCY
GR
AP
HIC
LO
G
4
MO
IST
UR
E
12
WELLCONSTRUCTION
6
SOIL/ROCK MATERIAL FIELD DESCRIPTION
SHEET 2 OF 2
10 11 13
VS
S F ST
VS
TH
FB
VL
L MD
D VD
31
FIE
LDT
ES
T
7 82
Borehole Information
SA
MP
LE
US
C S
YM
BO
L
9
Field Material Description
STRUCTURE ANDADDITIONAL OBSERVATIONS
5
BOREHOLE ENVIRONMENTAL LOGS
UP
PO
RT
WA
TE
R
ME
TH
OD
Drill Model/Mounting:Borehole Diameter:
Arrium Ltd.Additional Environmental InvestigationsAshford Road, Keswick, SA2201557C
Client:Project:Borehole Location:Project Number:
EziProbe130 mm
Date Commenced:Date Completed:Recorded By:Log Checked By:
BOREHOLE NO.
KMW6
17/2/1617/2/16SSMB
Driller:Driller Lic No:
WB Drilling256444
26.194 mE 278744.76 N 6130404.26
Surface RL:Co-ords:
11
12
13
14
15
16
17
18
19
DE
PT
H(m
)
RL(
m)
16
15
14
13
12
11
10
9
8
7
Par
sons
Brin
cker
hoff
Aus
tral
ia P
ty L
td.
Ver
sion
5.1
EN
VIR
ON
ME
NT
AL
BO
RE
HO
LE/W
ELL
LO
G A
RR
IUM
-A
DD
ITIO
NA
L E
NV
IRO
NM
EN
TA
L IN
VE
ST
IGA
TIO
N -
LO
GS
.GP
J Y
H20
06.G
DT
7/3
/16

SoA
DM
CCHA
PT
KMW7_0.2-0.4PID=0ppm
KMW7_1.0-1.2PID=0ppm
KMW7_2.0-2.2PID=0ppm
KMW7_4.0-4.2PID=287
ppm
KMW7_5.8-6.0PID=0ppm
KMW7_7.0-7.2PID=30
ppm
KMW7_8.0-8.2PID=0ppm
KMW7_9.0-9.2PID=0ppm
CL-MLCL-MLML
CH
CH
ML
CH
CH
CHCH
CH
CH
CH
CH
Gatic and groutCONCRETE.FILL, sandy gravel, angular gravels to25 mm, loose, yellow-brown, wet.Silty CLAY, medium plasticity, stiff,dark brown, moist, slight hydrocarbonodour.As above but orange-brown.Clayey SILT, firm, friable,orange-brown mottled cream, slightlymoist, calcareous material.Silty CLAY, high plasticity, stiff,orange-brown mottled cream, moist,with calcareous material.As above but with trace fine grainedsand, dark yellow-brown, friable.Clayey SILT, firm, orange-brownmottled yellow-brown, black andcream, moist, with trace fine-grainedsand, calcareous material.
Silty CLAY, high plasticity, stiff, brownmottled orange-cream, slightly moist.
As above but brown mottledorange-grey and cream.
As above but with minor roundedcalcareous gravels to 20mm.As above but no gravels.As above but with minor roundedcalcareous gravels to 5mm.
As above but no gravels.
As above but brown, softer, trace finegrained sand.
As above but very stiff, brown mottledgrey and red, no sand.
J
J
J
J
J
J
J
J
0.170.20
0.40
0.70
1.00
1.50
2.00
2.80
4.00
4.704.80
5.10
7.00
8.00
9.00
0.170.20
0.40
0.70
1.00
1.50
2.00
2.80
4.00
4.704.80
5.10
7.00
8.00
9.00
This borehole log should be read in conjunction with Parsons Brinckerhoff's accompanying standard notes.
RELATIVEDENSITY
/CONSISTENCY
GR
AP
HIC
LO
G
4
MO
IST
UR
E
12
WELLCONSTRUCTION
6
SOIL/ROCK MATERIAL FIELD DESCRIPTION
SHEET 1 OF 2
10 11 13
VS
S F ST
VS
TH
FB
VL
L MD
D VD
31
FIE
LDT
ES
T
7 82
Borehole Information
SA
MP
LE
US
C S
YM
BO
L
9
Field Material Description
STRUCTURE ANDADDITIONAL OBSERVATIONS
5
BOREHOLE ENVIRONMENTAL LOGS
UP
PO
RT
WA
TE
R
ME
TH
OD
Drill Model/Mounting:Borehole Diameter:
Arrium Ltd.Additional Environmental InvestigationsAshford Road, Keswick, SA2201557C
Client:Project:Borehole Location:Project Number:
EziProbe130 mm
Date Commenced:Date Completed:Recorded By:Log Checked By:
BOREHOLE NO.
KMW7
15/2/1615/2/16SSMB
Driller:Driller Lic No:
WB Drilling256447
26.382 mE 278694.39 N 6130335.2
Surface RL:Co-ords:
1
2
3
4
5
6
7
8
9
DE
PT
H(m
)
RL(
m)
26
25
24
23
22
21
20
19
18
17
Par
sons
Brin
cker
hoff
Aus
tral
ia P
ty L
td.
Ver
sion
5.1
EN
VIR
ON
ME
NT
AL
BO
RE
HO
LE/W
ELL
LO
G A
RR
IUM
-A
DD
ITIO
NA
L E
NV
IRO
NM
EN
TA
L IN
VE
ST
IGA
TIO
N -
LO
GS
.GP
J Y
H20
06.G
DT
7/3
/16

SoA
15/02/2016
29/02/2016
M
W
KMW7_10.0-10.2PID=0ppm
KMW7_14.0-14.2PID=0ppm
KMW7_15.0-15.2PID=0ppm
KMW7_18.8-19.0PID=0ppm
CL
CL
SC
SC
SC
Bentonite
Sand
Screen
End cap
Sandy CLAY, medium plasticity, soft,brown, moist to wet, fine-grained sand.
As above but orange-brown, wet.
Clayey SAND, fine-grained, loose,orange-brown, wet.
As above but pale grey-brown, verymoist.
As above but harder.
END OF BOREHOLE AT 19.00 m
J
J
J
J
10.00
13.00
14.00
15.00
18.00
19.00
10.00
13.00
14.00
15.00
18.00
This borehole log should be read in conjunction with Parsons Brinckerhoff's accompanying standard notes.
RELATIVEDENSITY
/CONSISTENCY
GR
AP
HIC
LO
G
4
MO
IST
UR
E
12
WELLCONSTRUCTION
6
SOIL/ROCK MATERIAL FIELD DESCRIPTION
SHEET 2 OF 2
10 11 13
VS
S F ST
VS
TH
FB
VL
L MD
D VD
31
FIE
LDT
ES
T
7 82
Borehole Information
SA
MP
LE
US
C S
YM
BO
L
9
Field Material Description
STRUCTURE ANDADDITIONAL OBSERVATIONS
5
BOREHOLE ENVIRONMENTAL LOGS
UP
PO
RT
WA
TE
R
ME
TH
OD
Drill Model/Mounting:Borehole Diameter:
Arrium Ltd.Additional Environmental InvestigationsAshford Road, Keswick, SA2201557C
Client:Project:Borehole Location:Project Number:
EziProbe130 mm
Date Commenced:Date Completed:Recorded By:Log Checked By:
BOREHOLE NO.
KMW7
15/2/1615/2/16SSMB
Driller:Driller Lic No:
WB Drilling256447
26.382 mE 278694.39 N 6130335.2
Surface RL:Co-ords:
11
12
13
14
15
16
17
18
19
DE
PT
H(m
)
RL(
m)
16
15
14
13
12
11
10
9
8
7
Par
sons
Brin
cker
hoff
Aus
tral
ia P
ty L
td.
Ver
sion
5.1
EN
VIR
ON
ME
NT
AL
BO
RE
HO
LE/W
ELL
LO
G A
RR
IUM
-A
DD
ITIO
NA
L E
NV
IRO
NM
EN
TA
L IN
VE
ST
IGA
TIO
N -
LO
GS
.GP
J Y
H20
06.G
DT
7/3
/16

Appendix E LABORATORY REPORTS: GROUNDWATER

CERTIFICATE OF ANALYSIS 8053
Client:
Parsons Brinckerhoff (Adelaide)
Level 16, 1 King William Street
Adelaide
SA 5001
Attention: Sandra Struck
Sample log in details:
Your Reference: 2201557C Keswick
No. of samples: 11 waters
Date samples received / completed instructions received 02/03/2016 / 02/03/2016
Analysis Details:
Please refer to the following pages for results, methodology summary and quality control data.
Samples were analysed as received from the client. Results relate specifically to the samples as received.
Results are reported on a dry weight basis for solids and on an as received basis for other matrices.
Please refer to the last page of this report for any comments relating to the results.
Report Details:
Date results requested by: / Issue Date: 8/03/16 / 9/03/16
Date of Preliminary Report: Not Issued
NATA accreditation number 2901. This document shall not be reproduced except in full.
Accredited for compliance with ISO/IEC 17025. Tests not covered by NATA are denoted with *.
Results Approved By:
Page 1 of 19Envirolab Reference: 8053
Revision No: R 01

Client Reference: 2201557C Keswick
VOCs in water
Our Reference: UNITS 8053-1 8053-2 8053-3 8053-4 8053-5
Your Reference ------------- KMW1 KMW1d KMW2 KMW3 KMW4
Date Sampled ------------ 1/03/2016 1/03/2016 1/03/2016 1/03/2016 1/03/2016
Type of sample Water Water Water Water Water
Date extracted - 04/03/2016 04/03/2016 04/03/2016 04/03/2016 04/03/2016
Date analysed - 04/03/2016 04/03/2016 04/03/2016 04/03/2016 04/03/2016
Dichlorodifluoromethane µg/L <10 <10 <10 <10 <10
Chloromethane µg/L <10 <10 <10 <10 <10
Vinyl Chloride µg/L 70 <10 <10 <10 <10
Bromomethane µg/L <10 <10 <10 <10 <10
Chloroethane µg/L <10 <10 <10 <10 <10
Trichlorofluoromethane µg/L <10 <10 <10 30 <10
1,1-Dichloroethene µg/L <1 <1 43 <1 <1
Trans-1,2-dichloroethene µg/L <1 <1 14 <1 <1
1,1-dichloroethane µg/L <1 <1 11 <1 <1
Cis-1,2-dichloroethene µg/L 32 2 160 23 9
Bromochloromethane µg/L <1 <1 <1 <1 <1
Chloroform µg/L 83 50 17 34 10
2,2-dichloropropane µg/L <1 <1 <1 <1 <1
1,2-dichloroethane µg/L <1 <1 <1 <1 <1
1,1,1-trichloroethane µg/L <1 <1 <1 <1 <1
1,1-dichloropropene µg/L <1 <1 <1 <1 <1
Cyclohexane µg/L 4 <1 <1 <1 <1
Carbon tetrachloride µg/L 83 99 67 2,200 320
Benzene µg/L 2 <1 4 <1 <1
Dibromomethane µg/L <1 <1 <1 <1 <1
1,2-dichloropropane µg/L <1 <1 <1 <1 <1
Trichloroethene µg/L 180 130 28,560 1,800 1,100
Bromodichloromethane µg/L <1 <1 <1 <1 <1
trans-1,3-dichloropropene µg/L <1 <1 <1 <1 <1
cis-1,3-dichloropropene µg/L <1 <1 <1 <1 <1
1,1,2-trichloroethane µg/L <1 <1 33 2 2
Toluene µg/L <1 <1 <1 <1 <1
1,3-dichloropropane µg/L <1 <1 <1 <1 <1
Dibromochloromethane µg/L <1 <1 <1 <1 <1
1,2-dibromoethane µg/L <1 <1 <1 <1 <1
Tetrachloroethene µg/L 5 <1 14 2 <1
1,1,1,2-tetrachloroethane µg/L <1 <1 <1 <1 <1
Chlorobenzene µg/L <1 <1 <1 <1 <1
Ethylbenzene µg/L <1 <1 <1 <1 <1
Bromoform µg/L <1 <1 <1 <1 <1
m+p-xylene µg/L <2 <2 <2 <2 <2
Styrene µg/L <1 <1 <1 <1 <1
1,1,2,2-tetrachloroethane µg/L <1 <1 <1 <1 <1
Page 2 of 19Envirolab Reference: 8053
Revision No: R 01
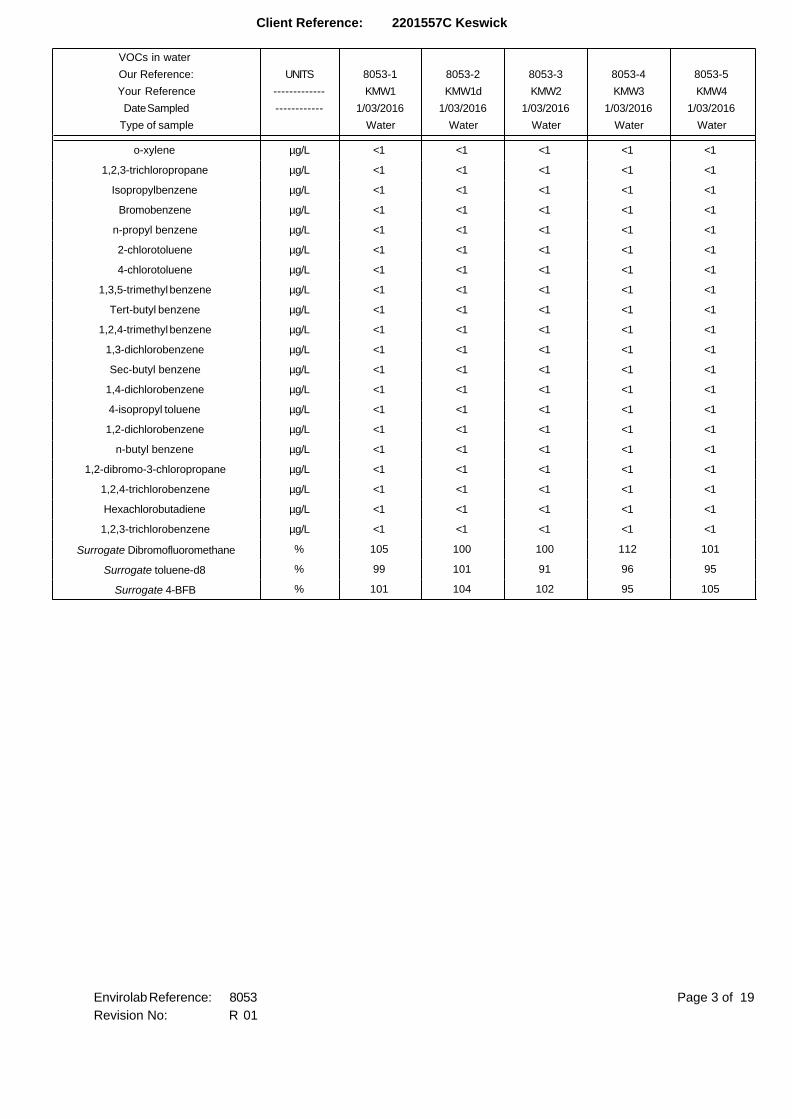
Client Reference: 2201557C Keswick
VOCs in water
Our Reference: UNITS 8053-1 8053-2 8053-3 8053-4 8053-5
Your Reference ------------- KMW1 KMW1d KMW2 KMW3 KMW4
Date Sampled ------------ 1/03/2016 1/03/2016 1/03/2016 1/03/2016 1/03/2016
Type of sample Water Water Water Water Water
o-xylene µg/L <1 <1 <1 <1 <1
1,2,3-trichloropropane µg/L <1 <1 <1 <1 <1
Isopropylbenzene µg/L <1 <1 <1 <1 <1
Bromobenzene µg/L <1 <1 <1 <1 <1
n-propyl benzene µg/L <1 <1 <1 <1 <1
2-chlorotoluene µg/L <1 <1 <1 <1 <1
4-chlorotoluene µg/L <1 <1 <1 <1 <1
1,3,5-trimethyl benzene µg/L <1 <1 <1 <1 <1
Tert-butyl benzene µg/L <1 <1 <1 <1 <1
1,2,4-trimethyl benzene µg/L <1 <1 <1 <1 <1
1,3-dichlorobenzene µg/L <1 <1 <1 <1 <1
Sec-butyl benzene µg/L <1 <1 <1 <1 <1
1,4-dichlorobenzene µg/L <1 <1 <1 <1 <1
4-isopropyl toluene µg/L <1 <1 <1 <1 <1
1,2-dichlorobenzene µg/L <1 <1 <1 <1 <1
n-butyl benzene µg/L <1 <1 <1 <1 <1
1,2-dibromo-3-chloropropane µg/L <1 <1 <1 <1 <1
1,2,4-trichlorobenzene µg/L <1 <1 <1 <1 <1
Hexachlorobutadiene µg/L <1 <1 <1 <1 <1
1,2,3-trichlorobenzene µg/L <1 <1 <1 <1 <1
Surrogate Dibromofluoromethane % 105 100 100 112 101
Surrogate toluene-d8 % 99 101 91 96 95
Surrogate 4-BFB % 101 104 102 95 105
Page 3 of 19Envirolab Reference: 8053
Revision No: R 01

Client Reference: 2201557C Keswick
VOCs in water
Our Reference: UNITS 8053-6 8053-7 8053-8 8053-9 8053-10
Your Reference ------------- KMW5 KMW6 KMW7 QC01 RB01
Date Sampled ------------ 1/03/2016 1/03/2016 1/03/2016 1/03/2016 1/03/2016
Type of sample Water Water Water Water Water
Date extracted - 04/03/2016 04/03/2016 04/03/2016 04/03/2016 04/03/2016
Date analysed - 04/03/2016 04/03/2016 04/03/2016 04/03/2016 04/03/2016
Dichlorodifluoromethane µg/L <10 <10 <10 <10 <10
Chloromethane µg/L <10 <10 <10 <10 <10
Vinyl Chloride µg/L <10 <10 20 <10 <10
Bromomethane µg/L <10 <10 <10 <10 <10
Chloroethane µg/L <10 <10 <10 <10 <10
Trichlorofluoromethane µg/L 20 <10 20 <10 <10
1,1-Dichloroethene µg/L <1 <1 12 <1 <1
Trans-1,2-dichloroethene µg/L <1 <1 2 <1 <1
1,1-dichloroethane µg/L <1 <1 3 <1 <1
Cis-1,2-dichloroethene µg/L 8 <1 380 2 <1
Bromochloromethane µg/L <1 <1 <1 <1 <1
Chloroform µg/L 58 2 510 52 <1
2,2-dichloropropane µg/L <1 <1 <1 <1 <1
1,2-dichloroethane µg/L <1 <1 50 <1 <1
1,1,1-trichloroethane µg/L <1 <1 <1 <1 <1
1,1-dichloropropene µg/L <1 <1 <1 <1 <1
Cyclohexane µg/L <1 <1 32 <1 <1
Carbon tetrachloride µg/L 2,400 2 480 120 <1
Benzene µg/L <1 <1 830 <1 <1
Dibromomethane µg/L <1 <1 <1 <1 <1
1,2-dichloropropane µg/L <1 <1 6 <1 <1
Trichloroethene µg/L 560 39 2,400 140 <1
Bromodichloromethane µg/L <1 <1 <1 <1 <1
trans-1,3-dichloropropene µg/L <1 <1 <1 <1 <1
cis-1,3-dichloropropene µg/L <1 <1 <1 <1 <1
1,1,2-trichloroethane µg/L <1 <1 5 <1 <1
Toluene µg/L <1 <1 2 <1 <1
1,3-dichloropropane µg/L <1 <1 <1 <1 <1
Dibromochloromethane µg/L <1 <1 <1 <1 <1
1,2-dibromoethane µg/L <1 <1 <1 <1 <1
Tetrachloroethene µg/L 2 24 17 <1 <1
1,1,1,2-tetrachloroethane µg/L <1 <1 <1 <1 <1
Chlorobenzene µg/L <1 <1 <1 <1 <1
Ethylbenzene µg/L <1 <1 2 <1 <1
Bromoform µg/L <1 <1 <1 <1 <1
m+p-xylene µg/L <2 <2 <2 <2 <2
Styrene µg/L <1 <1 3 <1 <1
1,1,2,2-tetrachloroethane µg/L <1 <1 <1 <1 <1
o-xylene µg/L <1 <1 110 <1 <1
Page 4 of 19Envirolab Reference: 8053
Revision No: R 01

Client Reference: 2201557C Keswick
VOCs in water
Our Reference: UNITS 8053-6 8053-7 8053-8 8053-9 8053-10
Your Reference ------------- KMW5 KMW6 KMW7 QC01 RB01
Date Sampled ------------ 1/03/2016 1/03/2016 1/03/2016 1/03/2016 1/03/2016
Type of sample Water Water Water Water Water
1,2,3-trichloropropane µg/L <1 <1 <1 <1 <1
Isopropylbenzene µg/L <1 <1 6 <1 <1
Bromobenzene µg/L <1 <1 <1 <1 <1
n-propyl benzene µg/L <1 <1 4 <1 <1
2-chlorotoluene µg/L <1 <1 <1 <1 <1
4-chlorotoluene µg/L <1 <1 <1 <1 <1
1,3,5-trimethyl benzene µg/L <1 <1 <1 <1 <1
Tert-butyl benzene µg/L <1 <1 <1 <1 <1
1,2,4-trimethyl benzene µg/L <1 <1 4 <1 <1
1,3-dichlorobenzene µg/L <1 <1 <1 <1 <1
Sec-butyl benzene µg/L <1 <1 2 <1 <1
1,4-dichlorobenzene µg/L <1 <1 <1 <1 <1
4-isopropyl toluene µg/L <1 <1 <1 <1 <1
1,2-dichlorobenzene µg/L <1 <1 <1 <1 <1
n-butyl benzene µg/L <1 <1 1 <1 <1
1,2-dibromo-3-chloropropane µg/L <1 <1 <1 <1 <1
1,2,4-trichlorobenzene µg/L <1 <1 <1 <1 <1
Hexachlorobutadiene µg/L <1 <1 <1 <1 <1
1,2,3-trichlorobenzene µg/L <1 <1 <1 <1 <1
Surrogate Dibromofluoromethane % 102 101 111 104 99
Surrogate toluene-d8 % 97 95 92 98 101
Surrogate 4-BFB % 107 107 104 100 102
Page 5 of 19Envirolab Reference: 8053
Revision No: R 01

Client Reference: 2201557C Keswick
VOCs in water
Our Reference: UNITS 8053-11
Your Reference ------------- TB01
Date Sampled ------------ 1/03/2016
Type of sample Water
Date extracted - 04/03/2016
Date analysed - 04/03/2016
Dichlorodifluoromethane µg/L <10
Chloromethane µg/L <10
Vinyl Chloride µg/L <10
Bromomethane µg/L <10
Chloroethane µg/L <10
Trichlorofluoromethane µg/L <10
1,1-Dichloroethene µg/L <1
Trans-1,2-dichloroethene µg/L <1
1,1-dichloroethane µg/L <1
Cis-1,2-dichloroethene µg/L <1
Bromochloromethane µg/L <1
Chloroform µg/L <1
2,2-dichloropropane µg/L <1
1,2-dichloroethane µg/L <1
1,1,1-trichloroethane µg/L <1
1,1-dichloropropene µg/L <1
Cyclohexane µg/L <1
Carbon tetrachloride µg/L <1
Benzene µg/L <1
Dibromomethane µg/L <1
1,2-dichloropropane µg/L <1
Trichloroethene µg/L <1
Bromodichloromethane µg/L <1
trans-1,3-dichloropropene µg/L <1
cis-1,3-dichloropropene µg/L <1
1,1,2-trichloroethane µg/L <1
Toluene µg/L <1
1,3-dichloropropane µg/L <1
Dibromochloromethane µg/L <1
1,2-dibromoethane µg/L <1
Tetrachloroethene µg/L <1
1,1,1,2-tetrachloroethane µg/L <1
Chlorobenzene µg/L <1
Ethylbenzene µg/L <1
Bromoform µg/L <1
m+p-xylene µg/L <2
Styrene µg/L <1
1,1,2,2-tetrachloroethane µg/L <1
o-xylene µg/L <1
Page 6 of 19Envirolab Reference: 8053
Revision No: R 01

Client Reference: 2201557C Keswick
VOCs in water
Our Reference: UNITS 8053-11
Your Reference ------------- TB01
Date Sampled ------------ 1/03/2016
Type of sample Water
1,2,3-trichloropropane µg/L <1
Isopropylbenzene µg/L <1
Bromobenzene µg/L <1
n-propyl benzene µg/L <1
2-chlorotoluene µg/L <1
4-chlorotoluene µg/L <1
1,3,5-trimethyl benzene µg/L <1
Tert-butyl benzene µg/L <1
1,2,4-trimethyl benzene µg/L <1
1,3-dichlorobenzene µg/L <1
Sec-butyl benzene µg/L <1
1,4-dichlorobenzene µg/L <1
4-isopropyl toluene µg/L <1
1,2-dichlorobenzene µg/L <1
n-butyl benzene µg/L <1
1,2-dibromo-3-chloropropane µg/L <1
1,2,4-trichlorobenzene µg/L <1
Hexachlorobutadiene µg/L <1
1,2,3-trichlorobenzene µg/L <1
Surrogate Dibromofluoromethane % 100
Surrogate toluene-d8 % 95
Surrogate 4-BFB % 107
Page 7 of 19Envirolab Reference: 8053
Revision No: R 01

Client Reference: 2201557C Keswick
vTRH(C6-C10)/BTEXN in Water
Our Reference: UNITS 8053-1 8053-2 8053-3 8053-4 8053-5
Your Reference ------------- KMW1 KMW1d KMW2 KMW3 KMW4
Date Sampled ------------ 1/03/2016 1/03/2016 1/03/2016 1/03/2016 1/03/2016
Type of sample Water Water Water Water Water
Date extracted - 04/03/2016 04/03/2016 04/03/2016 04/03/2016 04/03/2016
Date analysed - 04/03/2016 04/03/2016 04/03/2016 04/03/2016 04/03/2016
TRH C6 - C9 µg/L 340 220 38,000 2,300 1,300
TRH C6 - C10 µg/L 320 210 42,000 2,300 1,300
TRH C6 - C10 less BTEX (F1) µg/L 320 210 42,000 2,300 1,300
Benzene µg/L 2 <1 4 <1 <1
Toluene µg/L <1 <1 <1 <1 <1
Ethylbenzene µg/L <1 <1 <1 <1 <1
m+p-xylene µg/L <2 <2 <2 <2 <2
o-xylene µg/L <1 <1 <1 <1 <1
Naphthalene µg/L 2 <1 <1 <1 <1
Surrogate Dibromofluoromethane % 111 105 106 118 108
Surrogate toluene-d8 % 98 100 89 95 94
Surrogate 4-BFB % 99 100 101 94 102
vTRH(C6-C10)/BTEXN in Water
Our Reference: UNITS 8053-6 8053-7 8053-8 8053-9 8053-10
Your Reference ------------- KMW5 KMW6 KMW7 QC01 RB01
Date Sampled ------------ 1/03/2016 1/03/2016 1/03/2016 1/03/2016 1/03/2016
Type of sample Water Water Water Water Water
Date extracted - 04/03/2016 04/03/2016 04/03/2016 04/03/2016 04/03/2016
Date analysed - 04/03/2016 04/03/2016 04/03/2016 04/03/2016 04/03/2016
TRH C6 - C9 µg/L 1,900 84 5,300 250 <10
TRH C6 - C10 µg/L 1,800 84 5,800 230 <10
TRH C6 - C10 less BTEX (F1) µg/L 1,800 84 4,900 230 <10
Benzene µg/L <1 <1 840 <1 <1
Toluene µg/L <1 <1 2 <1 <1
Ethylbenzene µg/L <1 <1 2 <1 <1
m+p-xylene µg/L <2 <2 <2 <2 <2
o-xylene µg/L <1 <1 100 <1 <1
Naphthalene µg/L <1 <1 6 <1 <1
Surrogate Dibromofluoromethane % 109 107 117 109 106
Surrogate toluene-d8 % 96 93 90 96 100
Surrogate 4-BFB % 102 104 104 97 99
Page 8 of 19Envirolab Reference: 8053
Revision No: R 01

Client Reference: 2201557C Keswick
vTRH(C6-C10)/BTEXN in Water
Our Reference: UNITS 8053-11
Your Reference ------------- TB01
Date Sampled ------------ 1/03/2016
Type of sample Water
Date extracted - 04/03/2016
Date analysed - 04/03/2016
TRH C6 - C9 µg/L <10
TRH C6 - C10 µg/L <10
TRH C6 - C10 less BTEX (F1) µg/L <10
Benzene µg/L <1
Toluene µg/L <1
Ethylbenzene µg/L <1
m+p-xylene µg/L <2
o-xylene µg/L <1
Naphthalene µg/L <1
Surrogate Dibromofluoromethane % 107
Surrogate toluene-d8 % 94
Surrogate 4-BFB % 104
Page 9 of 19Envirolab Reference: 8053
Revision No: R 01

Client Reference: 2201557C Keswick
TRH Water(C10-C40) NEPM
Our Reference: UNITS 8053-1 8053-2 8053-3 8053-4 8053-5
Your Reference ------------- KMW1 KMW1d KMW2 KMW3 KMW4
Date Sampled ------------ 1/03/2016 1/03/2016 1/03/2016 1/03/2016 1/03/2016
Type of sample Water Water Water Water Water
Date extracted - 03/03/2016 03/03/2016 03/03/2016 03/03/2016 03/03/2016
Date analysed - 04/03/2016 04/03/2016 04/03/2016 04/03/2016 04/03/2016
TRH C10 - C14 µg/L <50 110 300 440 190
TRH C15 - C28 µg/L 170 <100 <100 <100 100
TRH C29 - C36 µg/L <100 <100 <100 <100 <100
TRH >C10 - C16 µg/L 57 <50 130 72 190
TRH >C10 - C16 less Naphthalene
(F2)
µg/L 55 <50 130 72 190
TRH >C16 - C34 µg/L 180 <100 <100 <100 <100
TRH >C34 - C40 µg/L <100 <100 <100 <100 <100
Surrogate o-Terphenyl % 73 64 60 68 70
TRH Water(C10-C40) NEPM
Our Reference: UNITS 8053-6 8053-7 8053-8 8053-9 8053-10
Your Reference ------------- KMW5 KMW6 KMW7 QC01 RB01
Date Sampled ------------ 1/03/2016 1/03/2016 1/03/2016 1/03/2016 1/03/2016
Type of sample Water Water Water Water Water
Date extracted - 03/03/2016 03/03/2016 03/03/2016 03/03/2016 03/03/2016
Date analysed - 04/03/2016 04/03/2016 04/03/2016 04/03/2016 04/03/2016
TRH C10 - C14 µg/L 220 98 110 140 <50
TRH C15 - C28 µg/L <100 <100 <100 <100 <100
TRH C29 - C36 µg/L <100 <100 <100 <100 <100
TRH >C10 - C16 µg/L 58 <50 130 <50 <50
TRH >C10 - C16 less Naphthalene
(F2)
µg/L 58 <50 120 <50 <50
TRH >C16 - C34 µg/L <100 <100 <100 <100 <100
TRH >C34 - C40 µg/L <100 <100 <100 <100 <100
Surrogate o-Terphenyl % 62 61 74 82 86
Page 10 of 19Envirolab Reference: 8053
Revision No: R 01

Client Reference: 2201557C Keswick
HM in water - dissolved
Our Reference: UNITS 8053-1 8053-2 8053-3 8053-4 8053-5
Your Reference ------------- KMW1 KMW1d KMW2 KMW3 KMW4
Date Sampled ------------ 1/03/2016 1/03/2016 1/03/2016 1/03/2016 1/03/2016
Type of sample Water Water Water Water Water
Date prepared - 03/03/2016 03/03/2016 03/03/2016 03/03/2016 03/03/2016
Date analysed - 03/03/2016 03/03/2016 03/03/2016 03/03/2016 03/03/2016
Silver-Dissolved µg/L <1 <1 <1 <1 <1
Arsenic-Dissolved µg/L <1 1 2 4 2
Barium-Dissolved µg/L 50 70 71 91 260
Beryllium-Dissolved µg/L <0.5 <0.5 <0.5 <0.5 <0.5
Cadmium-Dissolved µg/L <0.1 <0.1 <0.1 <0.1 <0.1
Cobalt-Dissolved µg/L <1 1 <1 2 1
Chromium-Dissolved µg/L 3 24 3 18 43
Copper-Dissolved µg/L <1 <1 <1 <1 1
Iron-Dissolved µg/L 200 880 360 630 810
Lead-Dissolved µg/L <1 <1 <1 <1 <1
Mercury-Dissolved µg/L <0.05 <0.05 <0.05 <0.05 <0.05
Manganese-Dissolved µg/L 33 11 <5 31 46
Molybdenum-Dissolved µg/L 14 23 5 4 34
Nickel-Dissolved µg/L 37 5 <1 <1 2
Zinc-Dissolved µg/L <1 10 1 1 30
HM in water - dissolved
Our Reference: UNITS 8053-6 8053-7 8053-8 8053-9 8053-10
Your Reference ------------- KMW5 KMW6 KMW7 QC01 RB01
Date Sampled ------------ 1/03/2016 1/03/2016 1/03/2016 1/03/2016 1/03/2016
Type of sample Water Water Water Water Water
Date prepared - 03/03/2016 03/03/2016 03/03/2016 03/03/2016 03/03/2016
Date analysed - 03/03/2016 03/03/2016 03/03/2016 03/03/2016 03/03/2016
Silver-Dissolved µg/L <1 <1 <1 <1 <1
Arsenic-Dissolved µg/L 4 1 <1 1 <1
Barium-Dissolved µg/L 21 60 130 68 <1
Beryllium-Dissolved µg/L <0.5 <0.5 <0.5 <0.5 <0.5
Cadmium-Dissolved µg/L <0.1 <0.1 <0.1 <0.1 <0.1
Cobalt-Dissolved µg/L <1 <1 2 1 <1
Chromium-Dissolved µg/L 320 50 16 23 <1
Copper-Dissolved µg/L 4 <1 4 <1 <1
Iron-Dissolved µg/L <10 <10 <10 740 <10
Lead-Dissolved µg/L <1 <1 <1 <1 <1
Mercury-Dissolved µg/L <0.05 <0.05 <0.05 <0.05 <0.05
Manganese-Dissolved µg/L <5 <5 69 12 <5
Molybdenum-Dissolved µg/L 310 42 36 17 <1
Nickel-Dissolved µg/L <1 <1 5 4 <1
Zinc-Dissolved µg/L 4 11 12 11 <1
Page 11 of 19Envirolab Reference: 8053
Revision No: R 01

Client Reference: 2201557C Keswick
Method ID Methodology Summary
Org-013 Water samples are analysed directly by purge and trap GC-MS.
Org-016 Soil samples are extracted with methanol and spiked into water prior to analysing by purge and trap GC-MS.
Water samples are analysed directly by purge and trap GC-MS. F1 = (C6-C10)-BTEX as per NEPM B1
Guideline on Investigation Levels for Soil and Groundwater.
Note, the Total +ve Xylene PQL is reflective of the lowest individual PQL and is therefore "Total +ve Xylenes"
is simply a sum of the positive individual Xylenes.
Org-003 Soil samples are extracted with Dichloromethane/Acetone and waters with Dichloromethane and analysed by
GC-FID.
F2 = (>C10-C16)-Naphthalene as per NEPM B1 Guideline on Investigation Levels for Soil and Groundwater
(HSLs Tables 1A (3, 4)). Note Naphthalene is determined from the VOC analysis.
Note, the Total +ve TRH PQL is reflective of the lowest individual PQL and is therefore "Total +ve TRH" is
simply a sum of the positive individual TRH fractions (>C10-C40).
Metals-022 ICP-MS Determination of various metals by ICP-MS.
Metals-021 CV-
AAS
Determination of Mercury by Cold Vapour AAS.
Page 12 of 19Envirolab Reference: 8053
Revision No: R 01

Client Reference: 2201557C Keswick
QUALITY CONTROL UNITS PQL METHOD Blank Duplicate
Sm#
Duplicate results Spike Sm# Spike %
Recovery
VOCs in water Base ll Duplicate ll %RPD
Date extracted - 04/03/2
016
[NT] [NT] LCS-1 04/03/2016
Date analysed - 04/03/2
016
[NT] [NT] LCS-1 04/03/2016
Dichlorodifluoromethane µg/L 10 Org-013 <10 [NT] [NT] [NR] [NR]
Chloromethane µg/L 10 Org-013 <10 [NT] [NT] [NR] [NR]
Vinyl Chloride µg/L 10 Org-013 <10 [NT] [NT] [NR] [NR]
Bromomethane µg/L 10 Org-013 <10 [NT] [NT] [NR] [NR]
Chloroethane µg/L 10 Org-013 <10 [NT] [NT] [NR] [NR]
Trichlorofluoromethane µg/L 10 Org-013 <10 [NT] [NT] [NR] [NR]
1,1-Dichloroethene µg/L 1 Org-013 <1 [NT] [NT] [NR] [NR]
Trans-1,2-
dichloroethene
µg/L 1 Org-013 <1 [NT] [NT] [NR] [NR]
1,1-dichloroethane µg/L 1 Org-013 <1 [NT] [NT] LCS-1 114%
Cis-1,2-dichloroethene µg/L 1 Org-013 <1 [NT] [NT] [NR] [NR]
Bromochloromethane µg/L 1 Org-013 <1 [NT] [NT] [NR] [NR]
Chloroform µg/L 1 Org-013 <1 [NT] [NT] LCS-1 116%
2,2-dichloropropane µg/L 1 Org-013 <1 [NT] [NT] [NR] [NR]
1,2-dichloroethane µg/L 1 Org-013 <1 [NT] [NT] LCS-1 113%
1,1,1-trichloroethane µg/L 1 Org-013 <1 [NT] [NT] LCS-1 99%
1,1-dichloropropene µg/L 1 Org-013 <1 [NT] [NT] [NR] [NR]
Cyclohexane µg/L 1 Org-013 <1 [NT] [NT] [NR] [NR]
Carbon tetrachloride µg/L 1 Org-013 <1 [NT] [NT] [NR] [NR]
Benzene µg/L 1 Org-013 <1 [NT] [NT] [NR] [NR]
Dibromomethane µg/L 1 Org-013 <1 [NT] [NT] [NR] [NR]
1,2-dichloropropane µg/L 1 Org-013 <1 [NT] [NT] [NR] [NR]
Trichloroethene µg/L 1 Org-013 <1 [NT] [NT] [NR] [NR]
Bromodichloromethane µg/L 1 Org-013 <1 [NT] [NT] LCS-1 93%
trans-1,3-
dichloropropene
µg/L 1 Org-013 <1 [NT] [NT] [NR] [NR]
cis-1,3-dichloropropene µg/L 1 Org-013 <1 [NT] [NT] [NR] [NR]
1,1,2-trichloroethane µg/L 1 Org-013 <1 [NT] [NT] [NR] [NR]
Toluene µg/L 1 Org-013 <1 [NT] [NT] [NR] [NR]
1,3-dichloropropane µg/L 1 Org-013 <1 [NT] [NT] [NR] [NR]
Dibromochloromethane µg/L 1 Org-013 <1 [NT] [NT] LCS-1 115%
1,2-dibromoethane µg/L 1 Org-013 <1 [NT] [NT] [NR] [NR]
Tetrachloroethene µg/L 1 Org-013 <1 [NT] [NT] [NR] [NR]
1,1,1,2-
tetrachloroethane
µg/L 1 Org-013 <1 [NT] [NT] [NR] [NR]
Chlorobenzene µg/L 1 Org-013 <1 [NT] [NT] [NR] [NR]
Ethylbenzene µg/L 1 Org-013 <1 [NT] [NT] [NR] [NR]
Bromoform µg/L 1 Org-013 <1 [NT] [NT] [NR] [NR]
m+p-xylene µg/L 2 Org-013 <2 [NT] [NT] [NR] [NR]
Styrene µg/L 1 Org-013 <1 [NT] [NT] [NR] [NR]
1,1,2,2-
tetrachloroethane
µg/L 1 Org-013 <1 [NT] [NT] [NR] [NR]
Page 13 of 19Envirolab Reference: 8053
Revision No: R 01

Client Reference: 2201557C Keswick
QUALITY CONTROL UNITS PQL METHOD Blank Duplicate
Sm#
Duplicate results Spike Sm# Spike %
Recovery
VOCs in water Base ll Duplicate ll %RPD
o-xylene µg/L 1 Org-013 <1 [NT] [NT] [NR] [NR]
1,2,3-trichloropropane µg/L 1 Org-013 <1 [NT] [NT] [NR] [NR]
Isopropylbenzene µg/L 1 Org-013 <1 [NT] [NT] [NR] [NR]
Bromobenzene µg/L 1 Org-013 <1 [NT] [NT] [NR] [NR]
n-propyl benzene µg/L 1 Org-013 <1 [NT] [NT] [NR] [NR]
2-chlorotoluene µg/L 1 Org-013 <1 [NT] [NT] [NR] [NR]
4-chlorotoluene µg/L 1 Org-013 <1 [NT] [NT] [NR] [NR]
1,3,5-trimethyl benzene µg/L 1 Org-013 <1 [NT] [NT] [NR] [NR]
Tert-butyl benzene µg/L 1 Org-013 <1 [NT] [NT] [NR] [NR]
1,2,4-trimethyl benzene µg/L 1 Org-013 <1 [NT] [NT] [NR] [NR]
1,3-dichlorobenzene µg/L 1 Org-013 <1 [NT] [NT] [NR] [NR]
Sec-butyl benzene µg/L 1 Org-013 <1 [NT] [NT] [NR] [NR]
1,4-dichlorobenzene µg/L 1 Org-013 <1 [NT] [NT] [NR] [NR]
4-isopropyl toluene µg/L 1 Org-013 <1 [NT] [NT] [NR] [NR]
1,2-dichlorobenzene µg/L 1 Org-013 <1 [NT] [NT] [NR] [NR]
n-butyl benzene µg/L 1 Org-013 <1 [NT] [NT] [NR] [NR]
1,2-dibromo-3-
chloropropane
µg/L 1 Org-013 <1 [NT] [NT] [NR] [NR]
1,2,4-trichlorobenzene µg/L 1 Org-013 <1 [NT] [NT] [NR] [NR]
Hexachlorobutadiene µg/L 1 Org-013 <1 [NT] [NT] [NR] [NR]
1,2,3-trichlorobenzene µg/L 1 Org-013 <1 [NT] [NT] [NR] [NR]
Surrogate
Dibromofluoromethane
% Org-013 100 [NT] [NT] LCS-1 117%
Surrogate toluene-d8 % Org-013 98 [NT] [NT] LCS-1 117%
Surrogate 4-BFB % Org-013 108 [NT] [NT] LCS-1 94%
Page 14 of 19Envirolab Reference: 8053
Revision No: R 01

Client Reference: 2201557C Keswick
QUALITY CONTROL UNITS PQL METHOD Blank Duplicate
Sm#
Duplicate results Spike Sm# Spike %
Recovery
vTRH(C6-C10)/BTEXN in
Water
Base ll Duplicate ll %RPD
Date extracted - 04/03/2
016
[NT] [NT] LCS-1 04/03/2016
Date analysed - 04/03/2
016
[NT] [NT] LCS-1 04/03/2016
TRH C6 - C9 µg/L 10 Org-016 <10 [NT] [NT] LCS-1 105%
TRH C6 - C10 µg/L 10 Org-016 <10 [NT] [NT] LCS-1 105%
Benzene µg/L 1 Org-016 <1 [NT] [NT] LCS-1 104%
Toluene µg/L 1 Org-016 <1 [NT] [NT] LCS-1 119%
Ethylbenzene µg/L 1 Org-016 <1 [NT] [NT] LCS-1 102%
m+p-xylene µg/L 2 Org-016 <2 [NT] [NT] LCS-1 100%
o-xylene µg/L 1 Org-016 <1 [NT] [NT] LCS-1 106%
Naphthalene µg/L 1 Org-013 <1 [NT] [NT] [NR] [NR]
Surrogate
Dibromofluoromethane
% Org-016 109 [NT] [NT] LCS-1 111%
Surrogate toluene-d8 % Org-016 98 [NT] [NT] LCS-1 115%
Surrogate 4-BFB % Org-016 104 [NT] [NT] LCS-1 101%
QUALITY CONTROL UNITS PQL METHOD Blank Duplicate
Sm#
Duplicate results Spike Sm# Spike %
Recovery
TRH Water(C10-C40)
NEPM
Base ll Duplicate ll %RPD
Date extracted - 03/03/2
016
[NT] [NT] LCS-W1 03/03/2016
Date analysed - 04/03/2
016
[NT] [NT] LCS-W1 04/03/2016
TRH C10 - C14 µg/L 50 Org-003 <50 [NT] [NT] LCS-W1 73%
TRH C15 - C28 µg/L 100 Org-003 <100 [NT] [NT] LCS-W1 95%
TRH C29 - C36 µg/L 100 Org-003 <100 [NT] [NT] LCS-W1 107%
TRH >C10 - C16 µg/L 50 Org-003 <50 [NT] [NT] LCS-W1 73%
TRH >C16 - C34 µg/L 100 Org-003 <100 [NT] [NT] LCS-W1 95%
TRH >C34 - C40 µg/L 100 Org-003 <100 [NT] [NT] LCS-W1 107%
Surrogate o-Terphenyl % Org-003 96 [NT] [NT] LCS-W1 119%
Page 15 of 19Envirolab Reference: 8053
Revision No: R 01

Client Reference: 2201557C Keswick
QUALITY CONTROL UNITS PQL METHOD Blank Duplicate
Sm#
Duplicate results Spike Sm# Spike %
Recovery
HM in water - dissolved Base ll Duplicate ll %RPD
Date prepared - 08/03/2
016
8053-1 03/03/2016 || 03/03/2016 LCS-1 08/03/2016
Date analysed - 08/03/2
016
8053-1 03/03/2016 || 03/03/2016 LCS-1 08/03/2016
Silver-Dissolved µg/L 1 Metals-022
ICP-MS
<1 8053-1 <1 || <1 LCS-1 114%
Arsenic-Dissolved µg/L 1 Metals-022
ICP-MS
<1 8053-1 <1 || <1 LCS-1 100%
Barium-Dissolved µg/L 1 Metals-022
ICP-MS
<1 8053-1 50 || 47 || RPD: 6 LCS-1 106%
Beryllium-Dissolved µg/L 0.5 Metals-022
ICP-MS
<0.5 8053-1 <0.5 || <0.5 LCS-1 106%
Cadmium-Dissolved µg/L 0.1 Metals-022
ICP-MS
<0.1 8053-1 <0.1 || <0.1 LCS-1 107%
Cobalt-Dissolved µg/L 1 Metals-022
ICP-MS
<1 8053-1 <1 || <1 LCS-1 105%
Chromium-Dissolved µg/L 1 Metals-022
ICP-MS
<1 8053-1 3 || 3 || RPD: 0 LCS-1 99%
Copper-Dissolved µg/L 1 Metals-022
ICP-MS
<1 8053-1 <1 || <1 LCS-1 105%
Iron-Dissolved µg/L 10 Metals-022
ICP-MS
<10 8053-1 200 || 200 || RPD: 0 LCS-1 102%
Lead-Dissolved µg/L 1 Metals-022
ICP-MS
<1 8053-1 <1 || <1 LCS-1 106%
Mercury-Dissolved µg/L 0.05 Metals-021
CV-AAS
<0.05 8053-1 <0.05 || <0.05 LCS-1 105%
Manganese-Dissolved µg/L 5 Metals-022
ICP-MS
<5 8053-1 33 || 33 || RPD: 0 LCS-1 102%
Molybdenum-Dissolved µg/L 1 Metals-022
ICP-MS
<1 8053-1 14 || 13 || RPD: 7 LCS-1 103%
Nickel-Dissolved µg/L 1 Metals-022
ICP-MS
<1 8053-1 37 || 36 || RPD: 3 LCS-1 102%
Zinc-Dissolved µg/L 1 Metals-022
ICP-MS
<1 8053-1 <1 || <1 LCS-1 103%
QUALITY CONTROL UNITS Dup. Sm# Duplicate Spike Sm# Spike % Recovery
HM in water - dissolved Base + Duplicate + %RPD
Date prepared - [NT] [NT] 8053-2 08/03/2016
Date analysed - [NT] [NT] 8053-2 08/03/2016
Silver-Dissolved µg/L [NT] [NT] 8053-2 84%
Arsenic-Dissolved µg/L [NT] [NT] 8053-2 103%
Barium-Dissolved µg/L [NT] [NT] 8053-2 105%
Beryllium-Dissolved µg/L [NT] [NT] 8053-2 107%
Cadmium-Dissolved µg/L [NT] [NT] 8053-2 107%
Cobalt-Dissolved µg/L [NT] [NT] 8053-2 102%
Chromium-Dissolved µg/L [NT] [NT] 8053-2 97%
Copper-Dissolved µg/L [NT] [NT] 8053-2 101%
Page 16 of 19Envirolab Reference: 8053
Revision No: R 01

Client Reference: 2201557C Keswick
QUALITY CONTROL UNITS Dup. Sm# Duplicate Spike Sm# Spike % Recovery
HM in water - dissolved Base + Duplicate + %RPD
Iron-Dissolved µg/L [NT] [NT] 8053-2 96%
Lead-Dissolved µg/L [NT] [NT] 8053-2 100%
Mercury-Dissolved µg/L [NT] [NT] [NR] [NR]
Manganese-Dissolved µg/L [NT] [NT] 8053-2 101%
Molybdenum-Dissolved µg/L [NT] [NT] 8053-2 96%
Nickel-Dissolved µg/L [NT] [NT] 8053-2 99%
Zinc-Dissolved µg/L [NT] [NT] 8053-2 109%
Page 17 of 19Envirolab Reference: 8053
Revision No: R 01

Client Reference: 2201557C Keswick
Report Comments:
This report replaces the one dated 09/03/2016 due to changes in VOC results.
Asbestos ID was analysed by Approved Identifier: Not applicable for this job
Asbestos ID was authorised by Approved Signatory: Not applicable for this job
INS: Insufficient sample for this test PQL: Practical Quantitation Limit NT: Not tested
NR: Test not required RPD: Relative Percent Difference NA: Test not required
<: Less than >: Greater than LCS: Laboratory Control Sample
Page 18 of 19Envirolab Reference: 8053
Revision No: R 01
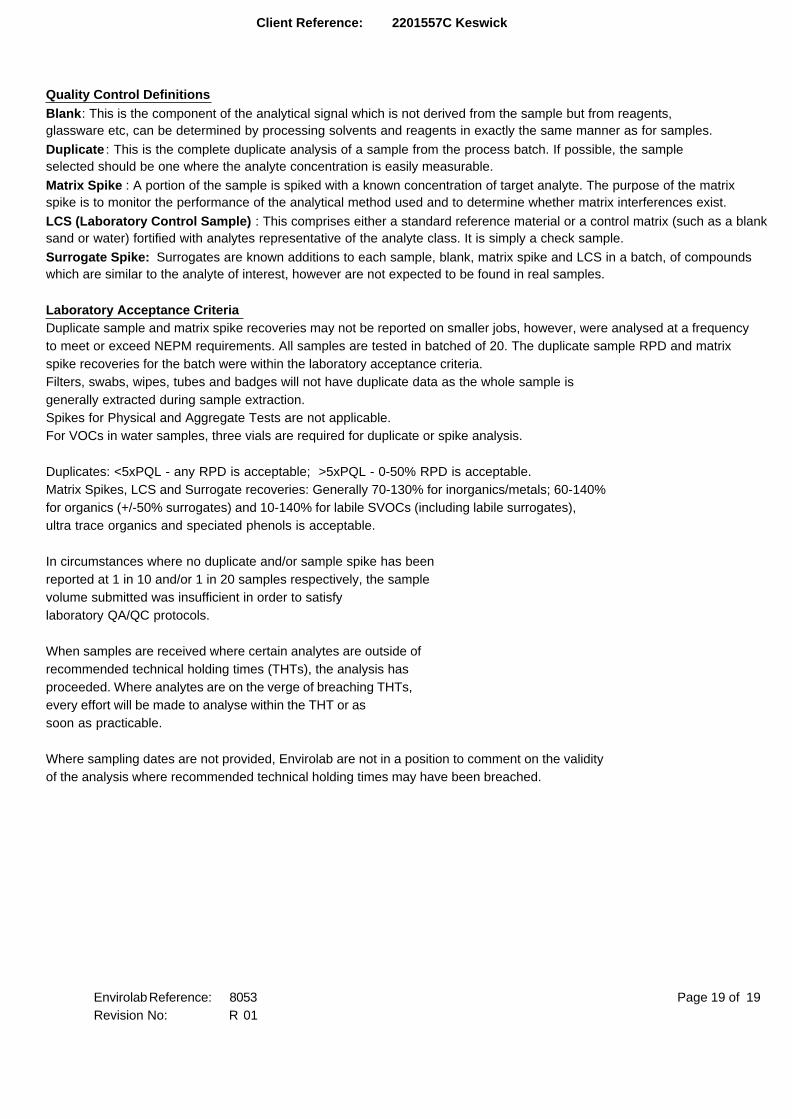
Client Reference: 2201557C Keswick
Quality Control Definitions
Blank: This is the component of the analytical signal which is not derived from the sample but from reagents,
glassware etc, can be determined by processing solvents and reagents in exactly the same manner as for samples.
Duplicate : This is the complete duplicate analysis of a sample from the process batch. If possible, the sample
selected should be one where the analyte concentration is easily measurable.
Matrix Spike : A portion of the sample is spiked with a known concentration of target analyte. The purpose of the matrix
spike is to monitor the performance of the analytical method used and to determine whether matrix interferences exist.
LCS (Laboratory Control Sample) : This comprises either a standard reference material or a control matrix (such as a blank
sand or water) fortified with analytes representative of the analyte class. It is simply a check sample.
Surrogate Spike: Surrogates are known additions to each sample, blank, matrix spike and LCS in a batch, of compounds
which are similar to the analyte of interest, however are not expected to be found in real samples.
Laboratory Acceptance Criteria
Duplicate sample and matrix spike recoveries may not be reported on smaller jobs, however, were analysed at a frequency
to meet or exceed NEPM requirements. All samples are tested in batched of 20. The duplicate sample RPD and matrix
spike recoveries for the batch were within the laboratory acceptance criteria.
Filters, swabs, wipes, tubes and badges will not have duplicate data as the whole sample is
generally extracted during sample extraction.
Spikes for Physical and Aggregate Tests are not applicable.
For VOCs in water samples, three vials are required for duplicate or spike analysis.
Duplicates: <5xPQL - any RPD is acceptable; >5xPQL - 0-50% RPD is acceptable.
Matrix Spikes, LCS and Surrogate recoveries: Generally 70-130% for inorganics/metals; 60-140%
for organics (+/-50% surrogates) and 10-140% for labile SVOCs (including labile surrogates),
ultra trace organics and speciated phenols is acceptable.
In circumstances where no duplicate and/or sample spike has been
reported at 1 in 10 and/or 1 in 20 samples respectively, the sample
volume submitted was insufficient in order to satisfy
laboratory QA/QC protocols.
When samples are received where certain analytes are outside of
recommended technical holding times (THTs), the analysis has
proceeded. Where analytes are on the verge of breaching THTs,
every effort will be made to analyse within the THT or as
soon as practicable.
Where sampling dates are not provided, Envirolab are not in a position to comment on the validity
of the analysis where recommended technical holding times may have been breached.
Page 19 of 19Envirolab Reference: 8053
Revision No: R 01

~ CHAIN OF CUSTODY - Client Sydney Lab· Envlrolab services U Ashley St. Chatswood, NSW 2067
EnVIROLRB Ph 02 9910 6200 I [email protected]
~ ENVIROLAB GROUP - National phone number uoo 42 43 44 f!!1!:! Lab • MPL laboratories 16·18 Hayden Crt Myaree, WA 6154
Client: WSP I Parsons Brinr.:kerhoff Client Project Name I Number I Site etc {le report title): Ph OB 9317 2505 / [email protected]
Contact Person: Sandra Struck 2201557C Keswick Melbourne Lab • Envlrolab Sentlces
Project Mgr: Adrian Heggie PO No.: 1A Oalrnore Drive Scoresby VIC 3179
Sampler: Sandra Struck Envirolab Quote No. : Ph 03 9763 2500 / melbo~rlvirol1b.aim.au
Address: Level 14/1 King William Street Date results required: Brisbane Office· Envlrolab Services
Adelaide SA 5000 Or choose: standard I HMO .. iFf ~ l ctay ~ ~ day ~! a lliFf 20I, 1G-20 Depot St, Bailyo, QU> 4014
Note: Infonn lab in advance If urgent turnaround is required· Ph 07 3266 9532 / [email protected]
surcharaes a"nlv Adelaide Office • Envlrolab Services
Phone: 08 8405 4300 Mob: 0428936641 Report format: esdat ~ e1111is ~ 7a The Parade, Norwood, SA 5067
Email: [email protected]; [email protected]; [email protected] Lab Comments: Ph 0406 350 706 / adelalde4Penvlrolab.com.au
Sample information Tests Required Comments
..!!!
Envirolab Client Sam(l'le ID or Depth Date sampled Jype of sample u :r: ~ PID(ppm)
Sample ID lnforml!ltion ~ ~ E
E~ E"vir ,,,,, &! rWc:es
"' 1a i aim on Drive ... RB \....._-_...... C; ribbea 1Park - "' -~·-
r KMWl 3/01/2016 water 1 1 1 ..... h l\lr -~{' Ph:~ '3) 97~ ~2500
7~ KMWld 3/01/2016 water 1 1 1 'U 1. L 3 KMW2 . 3/01/2016 water 1 1 1 [ ;:ite R1 ceivec :·~ 'J:.r7' tf KMW3 3/01/2016 water 1 1 1 11me"' '""In" . .
~ -s KMW4 3/01/2016 water 1 1 1 ¥-
~r' r_ l' /"'-·-~-·
KMWS 3/01/2016 water 1 1 1 ~ ,
b 1 · i:Ntlnc · I . ~, KMW6 3/01/2016 water 1 1 1 i,ecurlt •:\ntl( • rok1 n/NOr'9
'&' KMW7 3/01/2016 water 1 1 1
'1 QCOl 3/01/2016 water 1 1 1 - QC02 3/01/2016 water 1 1 1 Please forward to Eurofms MGT Melbourne {o RBOl 3/01/2016 water 1 1 1
lf TBOl 3/01/2016 water 1 1
Relinquished bv (Comnanvl: S Struck CWSP PBl Received bv (Company): ~. ~ Lab use only:
Print Name: Sandra Struck Print Name: '} f nllC7 ~ I Samples Received: Cool or Ambient (circle one)
Date&. Time: 01/03/16 Date a. Time: J. ~lit-. Temperature Received at: (if applicable)
Signature: Signature: I.Mr\ Transported by: Hand delivered / courier
White - Lab copy/ Blue - Oient copy/ Pink - Retain in Book Page No:
Form: 302 • Chain of Custody-Client, Issued 22105112, Version 5; Page 1 of 1 .

.Company Name: Parsons Brinckerhoff Aust P/L SA Order No.: Received: Mar 2, 2016 1:19 PMAddress: Level 16, 1 King William St Report #: 491316 Due: Mar 9, 2016
Adelaide Phone: 08 8405 4300 Priority: 5 DaySA 5000 Fax: 08 8405 4301 Contact Name: Sandra Struck
Project Name: KESWICKProject ID: 2201557C
Eurofins | mgt Client Manager: Sarah Gould
Sample Detail
NE
PM
1999 Metals : M
etals M15
filtered
Volatile O
rganics
Total R
ecoverable Hydrocarbons
Laboratory where analysis is conducted
Melbourne Laboratory - NATA Site # 1254 & 14271 X X X
Sydney Laboratory - NATA Site # 18217
Brisbane Laboratory - NATA Site # 20794
External Laboratory
Sample ID Sample Date SamplingTime
Matrix LAB ID
QC02 Feb 01, 2016 Water M16-Ma02244 X X X
ABN – 50 005 085 521 e.mail : [email protected] web : www.eurofins.com.au
MelbourneMelbourneMelbourneMelbourne3-5 Kingston Town CloseOakleigh VIC 3166Phone : +61 3 8564 5000NATA # 1261Site # 1254 & 14271
SydneySydneySydneySydneyUnit F3, Building F16 Mars RoadLane Cove West NSW 2066Phone : +61 2 9900 8400NATA # 1261 Site # 18217
BrisbaneBrisbaneBrisbaneBrisbane1/21 Smallwood PlaceMurarrie QLD 4172Phone : +61 7 3902 4600NATA # 1261 Site # 20794

Certificate of Analysis
Parsons Brinckerhoff Australia P/L SA
Level 16, 1 King William St
Adelaide
SA 5000
Attention: Sandra Struck
Report 491316-W
Project name KESWICK
Project ID 2201557C
Received Date Mar 02, 2016
Client Sample ID QC02
Sample Matrix Water
Eurofins | mgt Sample No. M16-Ma02244
Date Sampled Feb 01, 2016
Test/Reference LOR Unit
Total Recoverable Hydrocarbons - 1999 NEPM Fractions
TRH C6-C9 0.02 mg/L 23
TRH C10-C14 0.05 mg/L < 0.05
TRH C15-C28 0.1 mg/L < 0.1
TRH C29-C36 0.1 mg/L < 0.1
TRH C10-36 (Total) 0.1 mg/L < 0.1
Volatile Organics
Comments G01
1.1-Dichloroethane 0.001 mg/L < 0.2
1.1-Dichloroethene 0.001 mg/L < 0.2
1.1.1-Trichloroethane 0.001 mg/L < 0.2
1.1.1.2-Tetrachloroethane 0.001 mg/L < 0.2
1.1.2-Trichloroethane 0.001 mg/L < 0.2
1.1.2.2-Tetrachloroethane 0.001 mg/L < 0.2
1.2-Dibromoethane 0.001 mg/L < 0.2
1.2-Dichlorobenzene 0.001 mg/L < 0.2
1.2-Dichloroethane 0.001 mg/L < 0.2
1.2-Dichloropropane 0.001 mg/L < 0.2
1.2.3-Trichloropropane 0.001 mg/L < 0.2
1.2.4-Trimethylbenzene 0.001 mg/L < 0.2
1.3-Dichlorobenzene 0.001 mg/L < 0.2
1.3-Dichloropropane 0.001 mg/L < 0.2
1.3.5-Trimethylbenzene 0.001 mg/L < 0.2
1.4-Dichlorobenzene 0.001 mg/L < 0.2
2-Butanone (MEK) 0.001 mg/L < 0.2
2-Propanone (Acetone) 0.001 mg/L < 0.2
4-Chlorotoluene 0.001 mg/L < 0.2
4-Methyl-2-pentanone (MIBK) 0.001 mg/L < 0.2
Allyl chloride 0.001 mg/L < 0.2
Benzene 0.001 mg/L < 0.2
Bromobenzene 0.001 mg/L < 0.2
Bromochloromethane 0.001 mg/L < 0.2
Bromodichloromethane 0.001 mg/L < 0.2
Bromoform 0.001 mg/L < 0.2
Bromomethane 0.001 mg/L < 0.2
Carbon disulfide 0.001 mg/L < 0.2
Date Reported: Mar 11, 2016
Eurofins | mgt 2-5 Kingston Town Close, Oakleigh, Victoria, Australia, 3166
ABN : 50 005 085 521 Telephone: +61 3 8564 5000 Facsimile: +61 3 8564 5090
Page 1 of 11
Report Number: 491316-W
NATA AccreditedAccreditation Number 1261Site Number 1254
Accredited for compliance with ISO/IEC 17025.The results of the tests, calibrations and/ormeasurements included in this document are traceableto Australian/national standards.

Client Sample ID QC02
Sample Matrix Water
Eurofins | mgt Sample No. M16-Ma02244
Date Sampled Feb 01, 2016
Test/Reference LOR Unit
Volatile Organics
Carbon Tetrachloride 0.001 mg/L < 0.2
Chlorobenzene 0.001 mg/L < 0.2
Chloroethane 0.001 mg/L < 0.2
Chloroform 0.005 mg/L < 0.2
Chloromethane 0.001 mg/L < 0.2
cis-1.2-Dichloroethene 0.001 mg/L < 0.2
cis-1.3-Dichloropropene 0.001 mg/L < 0.2
Dibromochloromethane 0.001 mg/L < 0.2
Dibromomethane 0.001 mg/L < 0.2
Dichlorodifluoromethane 0.001 mg/L < 0.2
Ethylbenzene 0.001 mg/L < 0.2
Iodomethane 0.001 mg/L < 0.2
Isopropyl benzene (Cumene) 0.001 mg/L < 0.2
m&p-Xylenes 0.002 mg/L < 0.4
Methylene Chloride 0.001 mg/L < 0.2
o-Xylene 0.001 mg/L < 0.2
Styrene 0.001 mg/L < 0.2
Tetrachloroethene 0.001 mg/L < 0.2
Toluene 0.001 mg/L < 0.2
trans-1.2-Dichloroethene 0.001 mg/L < 0.2
trans-1.3-Dichloropropene 0.001 mg/L < 0.2
Trichloroethene 0.001 mg/L 17
Trichlorofluoromethane 0.001 mg/L < 0.2
Vinyl chloride 0.001 mg/L < 0.2
Xylenes - Total 0.003 mg/L < 0.6
Fluorobenzene (surr.) 1 % 117
4-Bromofluorobenzene (surr.) 1 % 122
Total Recoverable Hydrocarbons - 2013 NEPM Fractions
NaphthaleneN02 0.01 mg/L G01< 2
TRH C6-C10 0.02 mg/L 23
TRH C6-C10 less BTEX (F1)N04 0.02 mg/L 23
TRH >C10-C16 less Naphthalene (F2)N01 0.05 mg/L < 0.05
Total Recoverable Hydrocarbons - 2013 NEPM Fractions
TRH >C10-C16 0.05 mg/L < 0.05
TRH >C16-C34 0.1 mg/L < 0.1
TRH >C34-C40 0.1 mg/L < 0.1
Chromium (hexavalent) 0.001 mg/L < 0.001
Chromium (trivalent) 0.001 mg/L 0.001
Heavy Metals
Arsenic (filtered) 0.001 mg/L 0.002
Barium (filtered) 0.02 mg/L 0.07
Beryllium (filtered) 0.001 mg/L < 0.001
Boron (filtered) 0.05 mg/L 7.1
Cadmium (filtered) 0.0002 mg/L < 0.0002
Chromium (filtered) 0.001 mg/L 0.001
Cobalt (filtered) 0.001 mg/L < 0.001
Copper (filtered) 0.001 mg/L < 0.001
Lead (filtered) 0.001 mg/L < 0.001
Date Reported: Mar 11, 2016
Eurofins | mgt 2-5 Kingston Town Close, Oakleigh, Victoria, Australia, 3166
ABN : 50 005 085 521 Telephone: +61 3 8564 5000 Facsimile: +61 3 8564 5090
Page 2 of 11
Report Number: 491316-W

Client Sample ID QC02
Sample Matrix Water
Eurofins | mgt Sample No. M16-Ma02244
Date Sampled Feb 01, 2016
Test/Reference LOR Unit
Heavy Metals
Manganese (filtered) 0.005 mg/L < 0.005
Mercury (filtered) 0.0001 mg/L < 0.0001
Nickel (filtered) 0.001 mg/L < 0.001
Vanadium (filtered) 0.005 mg/L 0.015
Zinc (filtered) 0.001 mg/L 0.002
Date Reported: Mar 11, 2016
Eurofins | mgt 2-5 Kingston Town Close, Oakleigh, Victoria, Australia, 3166
ABN : 50 005 085 521 Telephone: +61 3 8564 5000 Facsimile: +61 3 8564 5090
Page 3 of 11
Report Number: 491316-W

Sample HistoryWhere samples are submitted/analysed over several days, the last date of extraction and analysis is reported.A recent review of our LIMS has resulted in the correction or clarification of some method identifications. Due to this, some of the method reference information on reports has changed. However,no substantive change has been made to our laboratory methods, and as such there is no change in the validity of current or previous results (regarding both quality and NATA accreditation).
If the date and time of sampling are not provided, the Laboratory will not be responsible for compromised results should testing be performed outside the recommended holding time.
Description Testing Site Extracted Holding Time
Total Recoverable Hydrocarbons - 1999 NEPM Fractions Melbourne Mar 04, 2016 7 Day
- Method: TRH C6-C36 - LTM-ORG-2010
Total Recoverable Hydrocarbons - 2013 NEPM Fractions Melbourne Mar 02, 2016 7 Day
- Method: TRH C6-C40 - LTM-ORG-2010
Total Recoverable Hydrocarbons - 2013 NEPM Fractions Melbourne Mar 04, 2016 7 Day
- Method: TRH C6-C40 - LTM-ORG-2010
Volatile Organics Melbourne Mar 02, 2016 7 Day
- Method: USEPA 8260 - MGT 350A Volatile Organics by GCMS
Chromium (hexavalent) Melbourne Mar 03, 2016 28 Day
- Method: Cr (VI) by MGT 1170A
Heavy Metals (filtered) Melbourne Mar 02, 2016 180 Day
- Method: LTM-MET-3040 Metals in Waters by ICP-MS
Mobil Metals : Metals M15 Melbourne Mar 02, 2016 28 Day
- Method: LTM-MET-3040 Metals in Waters by ICP-MS
Date Reported: Mar 11, 2016
Eurofins | mgt 2-5 Kingston Town Close, Oakleigh, Victoria, Australia, 3166
ABN : 50 005 085 521 Telephone: +61 3 8564 5000 Facsimile: +61 3 8564 5090
Page 4 of 11
Report Number: 491316-W

.Company Name: Parsons Brinckerhoff Aust P/L SA Order No.: Received: Mar 2, 2016 1:19 PMAddress: Level 16, 1 King William St Report #: 491316 Due: Mar 9, 2016
Adelaide Phone: 08 8405 4300 Priority: 5 DaySA 5000 Fax: 08 8405 4301 Contact Name: Sandra Struck
Project Name: KESWICKProject ID: 2201557C
Eurofins | mgt Client Manager: Sarah Gould
Sample Detail
NE
PM
1999 Metals : M
etals M15
filtered
Volatile O
rganics
Total R
ecoverable Hydrocarbons
Laboratory where analysis is conducted
Melbourne Laboratory - NATA Site # 1254 & 14271 X X X
Sydney Laboratory - NATA Site # 18217
Brisbane Laboratory - NATA Site # 20794
External Laboratory
Sample ID Sample Date SamplingTime
Matrix LAB ID
QC02 Feb 01, 2016 Water M16-Ma02244 X X X
ABN – 50 005 085 521 e.mail : [email protected] web : www.eurofins.com.au
MelbourneMelbourneMelbourneMelbourne3-5 Kingston Town CloseOakleigh VIC 3166Phone : +61 3 8564 5000NATA # 1261Site # 1254 & 14271
SydneySydneySydneySydneyUnit F3, Building F16 Mars RoadLane Cove West NSW 2066Phone : +61 2 9900 8400NATA # 1261 Site # 18217
BrisbaneBrisbaneBrisbaneBrisbane1/21 Smallwood PlaceMurarrie QLD 4172Phone : +61 7 3902 4600NATA # 1261 Site # 20794
Date Reported:Mar 11, 2016
Eurofins | mgt 2-5 Kingston Town Close, Oakleigh, Victoria, Australia, 3166
ABN : 50 005 085 521 Telephone: +61 3 8564 5000 Facsimile: +61 3 8564 5090
Page 5 of 11
Report Number: 491316-W

Internal Quality Control Review and Glossary
General
Holding Times
Units
Terms
QC - Acceptance Criteria
QC Data General Comments
1. Laboratory QC results for Method Blanks, Duplicates, Matrix Spikes, and Laboratory Control Samples are included in this QC report where applicable. Additional QC data may be available on
request.
2. All soil results are reported on a dry basis, unless otherwise stated.
3. Actual LORs are matrix dependant. Quoted LORs may be raised where sample extracts are diluted due to interferences.
4. Results are uncorrected for matrix spikes or surrogate recoveries.
5. SVOC analysis on waters are performed on homogenised, unfiltered samples, unless noted otherwise.
6. Samples were analysed on an 'as received' basis. 7. This report replaces any interim results previously issued.
Please refer to 'Sample Preservation and Container Guide' for holding times (QS3001).
For samples received on the last day of holding time, notification of testing requirements should have been received at least 6 hours prior to sample receipt deadlines as stated on the Sample
Receipt Advice.
If the Laboratory did not receive the information in the required timeframe, and regardless of any other integrity issues, suitably qualified results may still be reported.
Holding times apply from the date of sampling, therefore compliance to these may be outside the laboratory's control.
**NOTE: pH duplicates are reported as a range NOT as RPD
mg/kg: milligrams per Kilogram mg/l: milligrams per litre
ug/l: micrograms per litre ppm: Parts per million
ppb: Parts per billion %: Percentage
org/100ml: Organisms per 100 millilitres NTU: Nephelometric Turbidity Units
MPN/100mL: Most Probable Number of organisms per 100 millilitres
Dry Where a moisture has been determined on a solid sample the result is expressed on a dry basis.
LOR Limit of Reporting.
SPIKE Addition of the analyte to the sample and reported as percentage recovery.
RPD Relative Percent Difference between two Duplicate pieces of analysis.
LCS Laboratory Control Sample - reported as percent recovery
CRM Certified Reference Material - reported as percent recovery
Method Blank In the case of solid samples these are performed on laboratory certified clean sands.
In the case of water samples these are performed on de-ionised water.
Surr - Surrogate The addition of a like compound to the analyte target and reported as percentage recovery.
Duplicate A second piece of analysis from the same sample and reported in the same units as the result to show comparison.
Batch Duplicate A second piece of analysis from a sample outside of the clients batch of samples but run within the laboratory batch of analysis.
Batch SPIKE Spike recovery reported on a sample from outside of the clients batch of samples but run within the laboratory batch of analysis.
USEPA United States Environmental Protection Agency
APHA American Public Health Association
ASLP Australian Standard Leaching Procedure (Eurofins | mgt uses NATA accredited in-house method LTM-GEN-7010)
TCLP Toxicity Characteristic Leaching Procedure
COC Chain of Custody
SRA Sample Receipt Advice
CP Client Parent - QC was performed on samples pertaining to this report
NCP Non-Client Parent - QC performed on samples not pertaining to this report, QC is representative of the sequence or batch that client samples were analysed within
TEQ Toxic Equivalency Quotient
RPD Duplicates: Global RPD Duplicates Acceptance Criteria is 30% however the following acceptance guidelines are equally applicable:
Results <10 times the LOR : No Limit
Results between 10-20 times the LOR : RPD must lie between 0-50%
Results >20 times the LOR : RPD must lie between 0-30%
Surrogate Recoveries : Recoveries must lie between 50-150% - Phenols 20-130%.
1. Where a result is reported as a less than (<), higher than the nominated LOR, this is due to either matrix interference, extract dilution required due to interferences or contaminant levels within
the sample, high moisture content or insufficient sample provided.
2. Duplicate data shown within this report that states the word "BATCH" is a Batch Duplicate from outside of your sample batch, but within the laboratory sample batch at a 1:10 ratio. The Parent
and Duplicate data shown is not data from your samples.
3. Organochlorine Pesticide analysis - where reporting LCS data, Toxaphene & Chlordane are not added to the LCS.
4. Organochlorine Pesticide analysis - where reporting Spike data, Toxaphene is not added to the Spike.
5. Total Recoverable Hydrocarbons - where reporting Spike & LCS data, a single spike of commercial Hydrocarbon products in the range of C12-C30 is added and it's Total Recovery is reported
in the C10-C14 cell of the Report.
6. pH and Free Chlorine analysed in the laboratory - Analysis on this test must begin within 30 minutes of sampling.Therefore laboratory analysis is unlikely to be completed within holding time.
Analysis will begin as soon as possible after sample receipt.
7. Recovery Data (Spikes & Surrogates) - where chromatographic interference does not allow the determination of Recovery the term "INT" appears against that analyte.
8. Polychlorinated Biphenyls are spiked only using Aroclor 1260 in Matrix Spikes and LCS.
9. For Matrix Spikes and LCS results a dash " -" in the report means that the specific analyte was not added to the QC sample.
10. Duplicate RPDs are calculated from raw analytical data thus it is possible to have two sets of data.
Date Reported: Mar 11, 2016
Eurofins | mgt 2-5 Kingston Town Close, Oakleigh, Victoria, Australia, 3166
ABN : 50 005 085 521 Telephone: +61 3 8564 5000 Facsimile: +61 3 8564 5090
Page 6 of 11
Report Number: 491316-W

Quality Control Results
Test Units Result 1 AcceptanceLimits
PassLimits
QualifyingCode
Method Blank
Total Recoverable Hydrocarbons - 1999 NEPM Fractions
TRH C6-C9 mg/L < 0.02 0.02 Pass
TRH C10-C14 mg/L < 0.05 0.05 Pass
TRH C15-C28 mg/L < 0.1 0.1 Pass
TRH C29-C36 mg/L < 0.1 0.1 Pass
Method Blank
Volatile Organics
1.1-Dichloroethane mg/L < 0.001 0.001 Pass
1.1-Dichloroethene mg/L < 0.001 0.001 Pass
1.1.1-Trichloroethane mg/L < 0.001 0.001 Pass
1.1.1.2-Tetrachloroethane mg/L < 0.001 0.001 Pass
1.1.2-Trichloroethane mg/L < 0.001 0.001 Pass
1.1.2.2-Tetrachloroethane mg/L < 0.001 0.001 Pass
1.2-Dibromoethane mg/L < 0.001 0.001 Pass
1.2-Dichlorobenzene mg/L < 0.001 0.001 Pass
1.2-Dichloroethane mg/L < 0.001 0.001 Pass
1.2-Dichloropropane mg/L < 0.001 0.001 Pass
1.2.3-Trichloropropane mg/L < 0.001 0.001 Pass
1.2.4-Trimethylbenzene mg/L < 0.001 0.001 Pass
1.3-Dichlorobenzene mg/L < 0.001 0.001 Pass
1.3-Dichloropropane mg/L < 0.001 0.001 Pass
1.3.5-Trimethylbenzene mg/L < 0.001 0.001 Pass
1.4-Dichlorobenzene mg/L < 0.001 0.001 Pass
2-Butanone (MEK) mg/L < 0.001 0.001 Pass
2-Propanone (Acetone) mg/L < 0.001 0.001 Pass
4-Chlorotoluene mg/L < 0.001 0.001 Pass
4-Methyl-2-pentanone (MIBK) mg/L < 0.001 0.001 Pass
Allyl chloride mg/L < 0.001 0.001 Pass
Benzene mg/L < 0.001 0.001 Pass
Bromobenzene mg/L < 0.001 0.001 Pass
Bromochloromethane mg/L < 0.001 0.001 Pass
Bromodichloromethane mg/L < 0.001 0.001 Pass
Bromoform mg/L < 0.001 0.001 Pass
Bromomethane mg/L < 0.001 0.001 Pass
Carbon disulfide mg/L < 0.001 0.001 Pass
Carbon Tetrachloride mg/L < 0.001 0.001 Pass
Chlorobenzene mg/L < 0.001 0.001 Pass
Chloroethane mg/L < 0.001 0.001 Pass
Chloroform mg/L < 0.005 0.005 Pass
Chloromethane mg/L < 0.001 0.001 Pass
cis-1.2-Dichloroethene mg/L < 0.001 0.001 Pass
cis-1.3-Dichloropropene mg/L < 0.001 0.001 Pass
Dibromochloromethane mg/L < 0.001 0.001 Pass
Dibromomethane mg/L < 0.001 0.001 Pass
Dichlorodifluoromethane mg/L < 0.001 0.001 Pass
Ethylbenzene mg/L < 0.001 0.001 Pass
Iodomethane mg/L < 0.001 0.001 Pass
Isopropyl benzene (Cumene) mg/L < 0.001 0.001 Pass
m&p-Xylenes mg/L < 0.002 0.002 Pass
Methylene Chloride mg/L < 0.001 0.001 Pass
o-Xylene mg/L < 0.001 0.001 Pass
Date Reported: Mar 11, 2016
Eurofins | mgt 2-5 Kingston Town Close, Oakleigh, Victoria, Australia, 3166
ABN : 50 005 085 521 Telephone: +61 3 8564 5000 Facsimile: +61 3 8564 5090
Page 7 of 11
Report Number: 491316-W
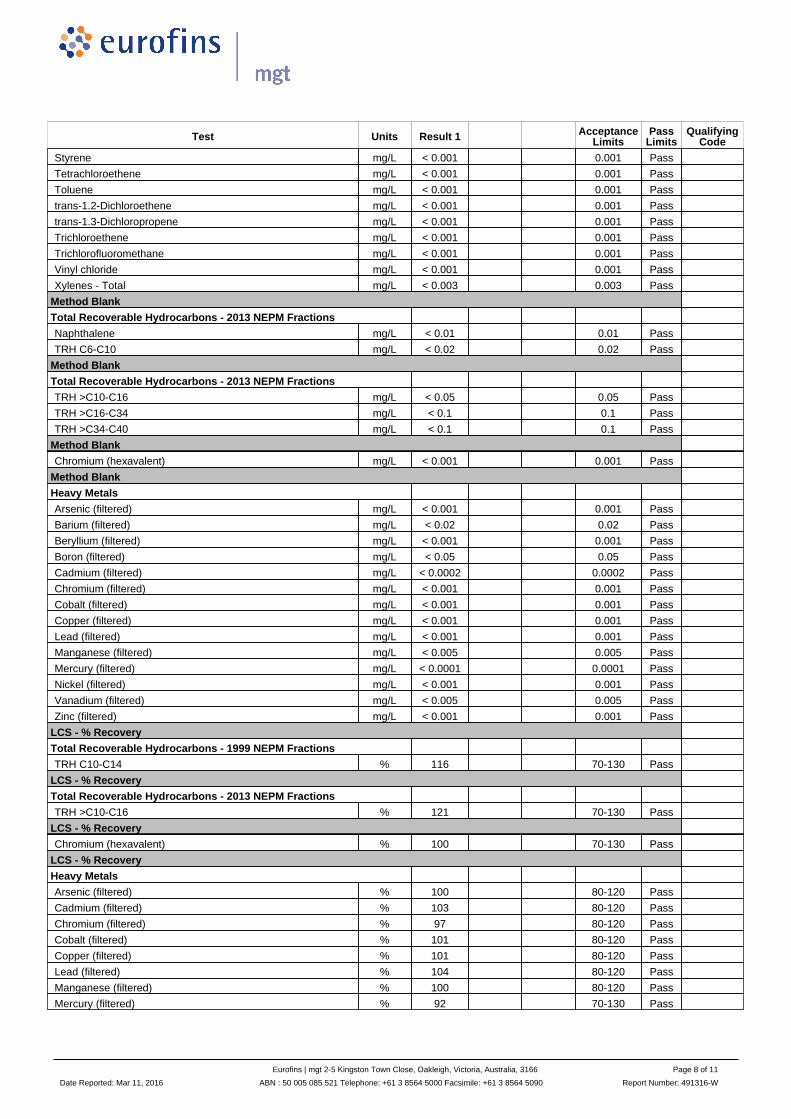
Test Units Result 1 AcceptanceLimits
PassLimits
QualifyingCode
Styrene mg/L < 0.001 0.001 Pass
Tetrachloroethene mg/L < 0.001 0.001 Pass
Toluene mg/L < 0.001 0.001 Pass
trans-1.2-Dichloroethene mg/L < 0.001 0.001 Pass
trans-1.3-Dichloropropene mg/L < 0.001 0.001 Pass
Trichloroethene mg/L < 0.001 0.001 Pass
Trichlorofluoromethane mg/L < 0.001 0.001 Pass
Vinyl chloride mg/L < 0.001 0.001 Pass
Xylenes - Total mg/L < 0.003 0.003 Pass
Method Blank
Total Recoverable Hydrocarbons - 2013 NEPM Fractions
Naphthalene mg/L < 0.01 0.01 Pass
TRH C6-C10 mg/L < 0.02 0.02 Pass
Method Blank
Total Recoverable Hydrocarbons - 2013 NEPM Fractions
TRH >C10-C16 mg/L < 0.05 0.05 Pass
TRH >C16-C34 mg/L < 0.1 0.1 Pass
TRH >C34-C40 mg/L < 0.1 0.1 Pass
Method Blank
Chromium (hexavalent) mg/L < 0.001 0.001 Pass
Method Blank
Heavy Metals
Arsenic (filtered) mg/L < 0.001 0.001 Pass
Barium (filtered) mg/L < 0.02 0.02 Pass
Beryllium (filtered) mg/L < 0.001 0.001 Pass
Boron (filtered) mg/L < 0.05 0.05 Pass
Cadmium (filtered) mg/L < 0.0002 0.0002 Pass
Chromium (filtered) mg/L < 0.001 0.001 Pass
Cobalt (filtered) mg/L < 0.001 0.001 Pass
Copper (filtered) mg/L < 0.001 0.001 Pass
Lead (filtered) mg/L < 0.001 0.001 Pass
Manganese (filtered) mg/L < 0.005 0.005 Pass
Mercury (filtered) mg/L < 0.0001 0.0001 Pass
Nickel (filtered) mg/L < 0.001 0.001 Pass
Vanadium (filtered) mg/L < 0.005 0.005 Pass
Zinc (filtered) mg/L < 0.001 0.001 Pass
LCS - % Recovery
Total Recoverable Hydrocarbons - 1999 NEPM Fractions
TRH C10-C14 % 116 70-130 Pass
LCS - % Recovery
Total Recoverable Hydrocarbons - 2013 NEPM Fractions
TRH >C10-C16 % 121 70-130 Pass
LCS - % Recovery
Chromium (hexavalent) % 100 70-130 Pass
LCS - % Recovery
Heavy Metals
Arsenic (filtered) % 100 80-120 Pass
Cadmium (filtered) % 103 80-120 Pass
Chromium (filtered) % 97 80-120 Pass
Cobalt (filtered) % 101 80-120 Pass
Copper (filtered) % 101 80-120 Pass
Lead (filtered) % 104 80-120 Pass
Manganese (filtered) % 100 80-120 Pass
Mercury (filtered) % 92 70-130 Pass
Date Reported: Mar 11, 2016
Eurofins | mgt 2-5 Kingston Town Close, Oakleigh, Victoria, Australia, 3166
ABN : 50 005 085 521 Telephone: +61 3 8564 5000 Facsimile: +61 3 8564 5090
Page 8 of 11
Report Number: 491316-W

Test Units Result 1 AcceptanceLimits
PassLimits
QualifyingCode
Nickel (filtered) % 100 80-120 Pass
Zinc (filtered) % 103 80-120 Pass
Test Lab Sample ID QASource Units Result 1 Acceptance
LimitsPass
LimitsQualifying
Code
Spike - % Recovery
Total Recoverable Hydrocarbons - 1999 NEPM Fractions Result 1
TRH C10-C14 M16-Ma00817 NCP % 115 70-130 Pass
Spike - % Recovery
Total Recoverable Hydrocarbons - 2013 NEPM Fractions Result 1
TRH >C10-C16 M16-Ma00817 NCP % 118 70-130 Pass
Spike - % Recovery
Result 1
Chromium (hexavalent) M16-Ma01558 NCP % 99 70-130 Pass
Spike - % Recovery
Heavy Metals Result 1
Arsenic (filtered) M16-Ma02449 NCP % 96 70-130 Pass
Barium (filtered) M16-Ma02449 NCP % 80 75-125 Pass
Beryllium (filtered) M16-Ma02449 NCP % 99 75-125 Pass
Cadmium (filtered) M16-Ma02449 NCP % 94 70-130 Pass
Chromium (filtered) M16-Ma02449 NCP % 89 70-130 Pass
Cobalt (filtered) M16-Ma02449 NCP % 90 75-125 Pass
Copper (filtered) M16-Ma02449 NCP % 89 70-130 Pass
Lead (filtered) M16-Ma02449 NCP % 93 70-130 Pass
Manganese (filtered) M16-Fe26876 NCP % 99 70-130 Pass
Mercury (filtered) M16-Ma02449 NCP % 82 70-130 Pass
Nickel (filtered) M16-Ma02449 NCP % 87 70-130 Pass
Vanadium (filtered) M16-Ma02449 NCP % 97 75-125 Pass
Zinc (filtered) M16-Ma02449 NCP % 90 70-130 Pass
Test Lab Sample ID QASource Units Result 1 Acceptance
LimitsPass
LimitsQualifying
Code
Duplicate
Total Recoverable Hydrocarbons - 1999 NEPM Fractions Result 1 Result 2 RPD
TRH C10-C14 M16-Ma01691 NCP mg/L < 0.05 < 0.05 <1 30% Pass
TRH C15-C28 M16-Ma01691 NCP mg/L < 0.1 < 0.1 <1 30% Pass
TRH C29-C36 M16-Ma01691 NCP mg/L < 0.1 < 0.1 <1 30% Pass
Duplicate
Total Recoverable Hydrocarbons - 2013 NEPM Fractions Result 1 Result 2 RPD
TRH >C10-C16 M16-Ma01691 NCP mg/L < 0.05 < 0.05 <1 30% Pass
TRH >C16-C34 M16-Ma01691 NCP mg/L < 0.1 < 0.1 <1 30% Pass
TRH >C34-C40 M16-Ma01691 NCP mg/L < 0.1 < 0.1 <1 30% Pass
Duplicate
Result 1 Result 2 RPD
Chromium (hexavalent) M16-Ma01558 NCP mg/L < 0.001 < 0.001 <1 30% Pass
Duplicate
Heavy Metals Result 1 Result 2 RPD
Arsenic (filtered) M16-Ma02449 NCP mg/L 0.016 0.016 <1 30% Pass
Barium (filtered) M16-Ma02449 NCP mg/L 0.09 0.09 2.0 30% Pass
Beryllium (filtered) M16-Ma02449 NCP mg/L < 0.001 < 0.001 <1 30% Pass
Boron (filtered) M16-Ma02449 NCP mg/L 0.82 0.75 9.0 30% Pass
Cadmium (filtered) M16-Ma02449 NCP mg/L < 0.0002 < 0.0002 <1 30% Pass
Chromium (filtered) M16-Ma02449 NCP mg/L < 0.001 < 0.001 <1 30% Pass
Cobalt (filtered) M16-Ma02449 NCP mg/L 0.004 0.004 2.0 30% Pass
Copper (filtered) M16-Ma02449 NCP mg/L < 0.001 < 0.001 <1 30% Pass
Lead (filtered) M16-Ma02449 NCP mg/L < 0.001 < 0.001 <1 30% Pass
Manganese (filtered) M16-Ma02449 NCP mg/L 1.3 1.3 2.0 30% Pass
Date Reported: Mar 11, 2016
Eurofins | mgt 2-5 Kingston Town Close, Oakleigh, Victoria, Australia, 3166
ABN : 50 005 085 521 Telephone: +61 3 8564 5000 Facsimile: +61 3 8564 5090
Page 9 of 11
Report Number: 491316-W

Duplicate
Heavy Metals Result 1 Result 2 RPD
Mercury (filtered) M16-Ma02449 NCP mg/L < 0.0001 < 0.0001 <1 30% Pass
Nickel (filtered) M16-Ma02449 NCP mg/L 0.004 0.004 <1 30% Pass
Vanadium (filtered) M16-Ma02449 NCP mg/L < 0.005 < 0.005 <1 30% Pass
Zinc (filtered) M16-Ma02449 NCP mg/L 0.001 0.001 18 30% Pass
Date Reported: Mar 11, 2016
Eurofins | mgt 2-5 Kingston Town Close, Oakleigh, Victoria, Australia, 3166
ABN : 50 005 085 521 Telephone: +61 3 8564 5000 Facsimile: +61 3 8564 5090
Page 10 of 11
Report Number: 491316-W

Comments
Sample IntegrityCustody Seals Intact (if used) N/A
Attempt to Chill was evident Yes
Sample correctly preserved Yes
Appropriate sample containers have been used Yes
Sample containers for volatile analysis received with minimal headspace Yes
Samples received within HoldingTime Yes
Some samples have been subcontracted No
Qualifier Codes/Comments
Code DescriptionG01 The LORs have been raised due to matrix interference
N01F2 is determined by arithmetically subtracting the "naphthalene" value from the ">C10-C16" value. The naphthalene value used in this calculation is obtained from volatiles(Purge & Trap analysis).
N02
Where we have reported both volatile (P&T GCMS) and semivolatile (GCMS) naphthalene data, results may not be identical. Provided correct sample handling protocols havebeen followed, any observed differences in results are likely to be due to procedural differences within each methodology. Results determined by both techniques have passedall QAQC acceptance criteria, and are entirely technically valid.
N04F1 is determined by arithmetically subtracting the "Total BTEX" value from the "C6-C10" value. The "Total BTEX" value is obtained by summing the concentrations of BTEXanalytes. The "C6-C10" value is obtained by quantitating against a standard of mixed aromatic/aliphatic analytes.
Authorised By
Sarah Gould Analytical Services Manager
Emily Rosenberg Senior Analyst-Metal (VIC)
Harry Bacalis Senior Analyst-Volatile (VIC)
Huong Le Senior Analyst-Inorganic (VIC)
Mele Singh Senior Analyst-Organic (VIC)
Glenn Jackson
National Operations Manager
- Indicates Not Requested
* Indicates NATA accreditation does not cover the performance of this service
Uncertainty data is available on requestEurofins | mgt shall not be liable for loss, cost, damages or expenses incurred by the client, or any other person or company, resulting from the use of any information or interpretation given in this report. In no case shall Eurofins | mgt be liable for consequential damages including, but notlimited to, lost profits, damages for failure to meet deadlines and lost production arising from this report. This document shall not be reproduced except in full and relates only to the items tested. Unless indicated otherwise, the tests were performed on the samples as received.
Date Reported: Mar 11, 2016
Eurofins | mgt 2-5 Kingston Town Close, Oakleigh, Victoria, Australia, 3166
ABN : 50 005 085 521 Telephone: +61 3 8564 5000 Facsimile: +61 3 8564 5090
Page 11 of 11
Report Number: 491316-W
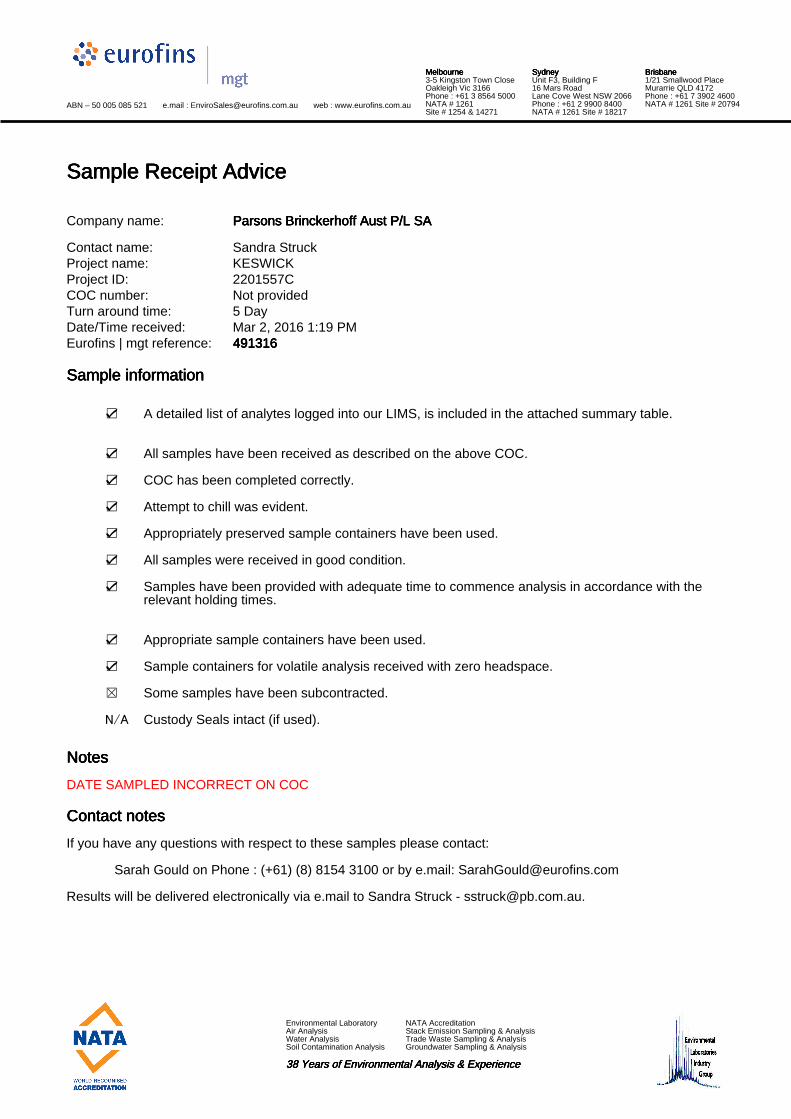
ABN – 50 005 085 521 e.mail : [email protected] web : www.eurofins.com.au
MelbourneMelbourneMelbourneMelbourne3-5 Kingston Town CloseOakleigh Vic 3166Phone : +61 3 8564 5000NATA # 1261Site # 1254 & 14271
SydneySydneySydneySydneyUnit F3, Building F16 Mars RoadLane Cove West NSW 2066Phone : +61 2 9900 8400NATA # 1261 Site # 18217
BrisbaneBrisbaneBrisbaneBrisbane1/21 Smallwood PlaceMurarrie QLD 4172Phone : +61 7 3902 4600NATA # 1261 Site # 20794
Environmental LaboratoryAir AnalysisWater AnalysisSoil Contamination Analysis
NATA AccreditationStack Emission Sampling & AnalysisTrade Waste Sampling & AnalysisGroundwater Sampling & Analysis
38 Years of Environmental Analysis & Experience38 Years of Environmental Analysis & Experience38 Years of Environmental Analysis & Experience38 Years of Environmental Analysis & Experience
Sample Receipt AdviceSample Receipt AdviceSample Receipt AdviceSample Receipt Advice
Company name: Parsons Brinckerhoff Aust P/L SAParsons Brinckerhoff Aust P/L SAParsons Brinckerhoff Aust P/L SAParsons Brinckerhoff Aust P/L SA
Contact name: Sandra StruckProject name: KESWICKProject ID: 2201557CCOC number: Not providedTurn around time: 5 DayDate/Time received: Mar 2, 2016 1:19 PMEurofins | mgt reference: 491316491316491316491316
Sample informationSample informationSample informationSample information
☑ A detailed list of analytes logged into our LIMS, is included in the attached summary table.
☑ All samples have been received as described on the above COC.
☑ COC has been completed correctly.
☑ Attempt to chill was evident.
☑ Appropriately preserved sample containers have been used.
☑ All samples were received in good condition.
☑ Samples have been provided with adequate time to commence analysis in accordance with therelevant holding times.
☑ Appropriate sample containers have been used.
☑ Sample containers for volatile analysis received with zero headspace.
☒ Some samples have been subcontracted.
N/A Custody Seals intact (if used).
NotesNotesNotesNotes
DATE SAMPLED INCORRECT ON COC
Contact notesContact notesContact notesContact notes
If you have any questions with respect to these samples please contact:
Sarah Gould on Phone : (+61) (8) 8154 3100 or by e.mail: [email protected]
Results will be delivered electronically via e.mail to Sandra Struck - [email protected].

~ CHAIN OF CUSTODY- Client Svdnev Lab - Envirolab Services 12 Ashley St, Chatswood, NSW 2067
EnVIROLAB Ph 02 9910 6200 / [email protected]
~ ENVIROLAB GROUP - National phone number 1300 42 43 44 Perth Lab - MPL Laboratories 16-18 Hayden Crt Myaree, WA 6154
Client: WSP I Parsons Brinckerhoff
Contact Person: Sandra Struck
Project Mgr: Adrian Heggie
Sampler: Sandra Struck
Address: Level 14/ 1 King William Street
Adelaide SA 5000
Phone: 08 8405 4300 Mob: 0428936641
c.'"" .. ;" .... a.ind'[email protected]; [email protected]; sstruc'[email protected] ..
Samole information
Envirolab Client Sample ID or Depth Date sampled Tyoe of samole
Sample ID information
KMWl 3/01/2016 water
KMWld 3/01/2016 water
KMW2 3/01/2016 water
KMW3 3/01/2016 water KMW4 3/01/2016 water KMWS 3/01/2016 water
KMW6 3/01/2016 water
KMW7 3/01/2016 water
QCOl 3/01/2016 water
QC02 3/01/2016 water
RBOl 3/01/2016 water
TBOl 3/ 01/ 2016 water
Relinouished by (Company): S Struck (WSP PB)
Print Name: Sandra Struck
Date & Time: 01/03/16
Signature:
Form: 302 - Chain of Custody-Client, Issued 22/05/12, Version 5; Page 1 of 1.
Client Project Name/ Number/ Site etc (ie report title): Ph 08 9317 2505 / [email protected]
2201557C Keswick Melbourne Lab - Envirolab Services PO No.: lA Dalmore Drive Scoresby VIC 3179
Envirolab Quote No. : Ph 03 9763 2500 / melbourn\[email protected]
Date results required: Brisbane Office - Envirolab Services
Or choose: standard / sa111e da•r f i: da•r f ~ daw f 3 daw 20a, 10-20 Depot St, Banyo, QLD 4014
Note: I nform lab in advance if urgent turnaround is required -Ph 07 3266 9532 / [email protected]
surchames afln/v Adelaide Office - Envirolab Services Report format: esdat f eq11is f 7a The Parade, Norwood, SA 5067
~=-~ ':~~:nents: Ph 0406 350 706 I [email protected]
Tests Required Comments
VI
u J: ]§
0 ~ .,
PIO (ppm) > E
"' ....
1 1 1
1 1 1
1 1 1
1 1 1
1 1 1
1 1 1
1 1 1
1 1 1
1 1 1
1 1 1 Please forward to Eurofins MGT Melbourne
1 1 1
1 1
Received bv <Comoanv): 1 ~ Lab use only:
Print Name: ) { nK1 S<!"I 9 Samples Received: Cool or Ambient (circle one)
Date&Timc: L. r-<:\t6 Temperature Received at: (if applicable)
Signature: ( kl/i\ Transported by: Hand delivered / courier
White - Lab copy/ Blue - Client copy I Pmk - Retam m Book
l_,.,1 ~
er/ rvu-,1 2 ( 15 (1~ ( · ( Cf
Page No:

Appendix F LABORATORY REPORTS: SUB-SLAB VAPOUR, FLUX & AMBIENT AIR

Chartered Chemists
A.B.N. 44 000 964 2783 ‐ 5, 18 Redland DriveMitcham, Vic, 3132Telephone: (03) 9874 1988Fax: (03) 9874 1933
Level 27/680 George StreetSydneyNSW 2000A en on: Adrian Heggie
SAMPLES:
DATE RECEIVED:
DATE COMMENCED:
METHODS:
RESULTS: Please refer to a ached pages for results.
REPORTED BY:
Ernst & Young Centre
8‐Mar‐2016
Twenty‐three samples were received for analysis
8‐Mar‐2016
This report replaces previous report dated 21‐Mar‐2016
CERTIFICATE OF ANALYSIS
Adam Atkinson
See A ached Results
Business Manager
Note: Results are based on samples as received at SGS Leeder Consul ng's laboratoriesResults in airbourne concentra ons are calculated using data provided by the client
WSP Parsons Brinckerhoff
23‐Mar‐2016
REPORT NUMBER:
Site/Client Ref:
Order No: 2201557C
M160563R1
2201557C
NATA Accredited Laboratory Number: 14429
Accredited for compliance with ISO/IEC 17025.
Page 1 of 23

ANALYTICAL RESULTS
Report N°: M160563R1
Matrix: Radiello Tube
Method: MA‐5.RAD.09 Vola le Organics (w/v)
Sample units are expressed in µg/m³ Test Started: 08‐Mar‐16
Analyte Name
PQL
Client ID
Sampled Date
Leeder ID
0.88
<0.02
<0.03
0.50
<0.02
<0.02
1.4
<0.05
<0.03
<0.03
<0.02
<0.02
<0.03
<0.02
<0.02
<0.02
0.18
9.4
0.74
<0.03
0.54
1.8
<3.7
<0.03
0.11
9.2
<0.03
0.30
0.68
0.71
3.1
1.2
<0.08
<0.04
0.25
5.3
0.14
0.24
7.3
<0.03
0.91
<0.02
<0.03
0.48
<0.02
<0.02
1.5
<0.05
<0.03
<0.03
<0.02
<0.02
<0.03
<0.02
<0.02
<0.02
0.23
9.0
0.80
<0.03
0.55
2.1
<3.7
<0.03
0.10
11
<0.03
0.32
0.84
0.89
3.4
1.3
<0.08
<0.04
0.18
6.9
0.14
0.23
8.9
<0.03
1.5
<0.02
<0.03
0.52
<0.02
<0.02
4.1
<0.05
<0.03
<0.03
<0.02
<0.02
<0.03
<0.02
<0.02
<0.02
0.58
9.8
1.1
<0.03
1.4
6.1
<3.7
<0.03
0.12
31
<0.03
0.49
2.2
2.3
11
3.4
<0.08
<0.04
0.29
21
0.25
0.31
22
<0.03
1.4
<0.02
<0.03
0.48
<0.02
<0.02
3.8
<0.05
<0.03
<0.03
<0.02
<0.02
<0.03
<0.02
<0.02
<0.02
0.57
7.8
1.1
<0.03
1.3
5.5
<3.7
<0.03
0.14
30
<0.03
0.48
2.1
2.2
10
3.2
<0.08
<0.04
0.30
20
0.23
0.28
20
<0.03
0.61
<0.02
<0.03
0.47
<0.02
<0.02
0.47
<0.05
<0.03
<0.03
<0.02
<0.02
<0.03
<0.02
<0.02
<0.02
0.080
9.4
0.50
<0.03
0.29
0.62
<3.7
<0.03
0.10
3.8
<0.03
0.21
0.34
0.35
0.82
0.40
<0.08
<0.04
0.17
1.6
0.10
0.27
3.3
<0.03
0.55
<0.02
<0.03
0.45
<0.02
<0.02
0.40
<0.05
<0.03
<0.03
<0.02
<0.02
<0.03
<0.02
<0.02
<0.02
0.070
7.5
0.44
<0.03
0.29
0.56
<3.7
<0.03
0.13
3.6
<0.03
0.20
0.32
0.32
1.0
0.35
<0.08
<0.04
0.13
1.4
0.090
0.26
3.1
<0.031,1,1‐trichloroethane
Toluene
Tetrachloroethene
propylbenzene
n‐Pentane
n‐Octane
n‐Nonane
Naphthalene
3‐Methylpentane
2‐Methylpentane
3‐Methylhexane
2‐Methylhexane
Methylcyclohexane
Methyl tert‐butyl ether
2‐Methyl butane
4‐Isopropyltoluene
Isopropylbenzene
Isopropanol
n‐Hexane
n‐Heptane
Ethylcyclohexane
Ethylbenzene
n‐Dodecane
2,4‐dimethylpentane
trans‐1,2‐Dichloroethene
cis‐1,2‐Dichloroethene
1,1‐Dichloroethene
1,2‐Dichloroethane
1,1‐Dichloroethane
Dichlorodifluoromethane
1,2‐Dibromoethane
Dibromochloromethane
n‐Decane
Cyclohexane
Chloromethane
Chloroethane
Carbon tetrachloride
n‐Butylbenzene
2‐butanone(MEK)
Benzene
AM AA5(outside)698SB
04‐Mar‐16
2016008018
AM AA4(outside)697SB
04‐Mar‐16
2016008017
AM AA3 dup(inside)696SB
04‐Mar‐16
2016008016
AM AA3(inside)695SB
04‐Mar‐16
2016008015
AM AA2(inside)694SB
04‐Mar‐16
2016008014
AM AA1(inside)693SB
04‐Mar‐16
2016008013
Page 2 of 23
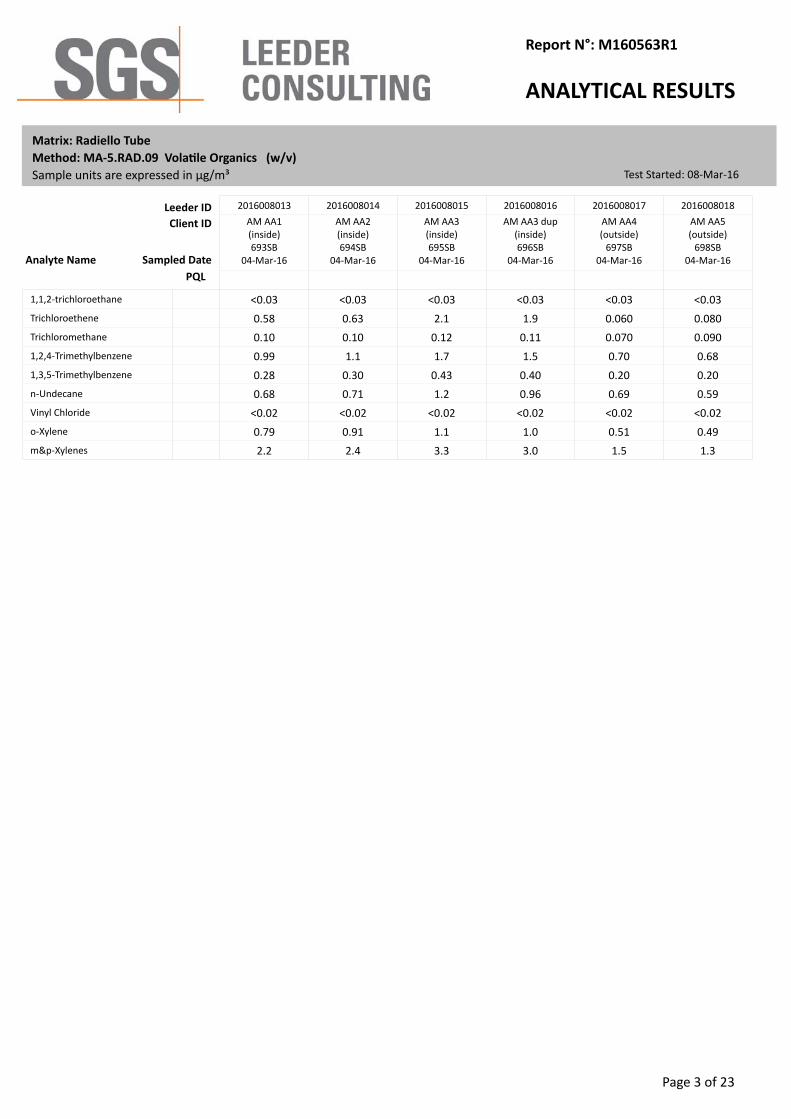
ANALYTICAL RESULTS
Report N°: M160563R1
Matrix: Radiello Tube
Method: MA‐5.RAD.09 Vola le Organics (w/v)
Sample units are expressed in µg/m³ Test Started: 08‐Mar‐16
Analyte Name
PQL
Client ID
Sampled Date
Leeder ID
<0.03
0.58
0.10
0.99
0.28
0.68
<0.02
0.79
2.2
<0.03
0.63
0.10
1.1
0.30
0.71
<0.02
0.91
2.4
<0.03
2.1
0.12
1.7
0.43
1.2
<0.02
1.1
3.3
<0.03
1.9
0.11
1.5
0.40
0.96
<0.02
1.0
3.0
<0.03
0.060
0.070
0.70
0.20
0.69
<0.02
0.51
1.5
<0.03
0.080
0.090
0.68
0.20
0.59
<0.02
0.49
1.3m&p‐Xylenes
o‐Xylene
Vinyl Chloride
n‐Undecane
1,3,5‐Trimethylbenzene
1,2,4‐Trimethylbenzene
Trichloromethane
Trichloroethene
1,1,2‐trichloroethane
AM AA5(outside)698SB
04‐Mar‐16
2016008018
AM AA4(outside)697SB
04‐Mar‐16
2016008017
AM AA3 dup(inside)696SB
04‐Mar‐16
2016008016
AM AA3(inside)695SB
04‐Mar‐16
2016008015
AM AA2(inside)694SB
04‐Mar‐16
2016008014
AM AA1(inside)693SB
04‐Mar‐16
2016008013
Page 3 of 23

ANALYTICAL RESULTS
Report N°: M160563R1
Matrix: Radiello Tube
Method: MA‐5.RAD.08 Vola le Organics
Sample units are expressed in µg total Test Started: 08‐Mar‐16
Analyte Name
PQL
Client ID
Sampled Date
Leeder ID
1.8
nd
nd
0.86
nd
nd
1.9
nd
nd
nd
nd
nd
nd
nd
nd
nd
0.27
1.9
1.3
nd
0.80
3.1
nd
nd
0.16
16
nd
0.50
1.0
1.1
5.6
2.1
nd
nd
0.35
10
0.20
0.36
14
nd
1.9
nd
nd
0.82
nd
nd
2.1
nd
nd
nd
nd
nd
nd
nd
nd
nd
0.34
1.9
1.4
nd
0.82
3.6
nd
nd
0.14
19
nd
0.54
1.3
1.3
6.2
2.4
nd
nd
0.25
13
0.21
0.35
17
nd
3.1
nd
nd
0.90
nd
nd
5.7
nd
nd
nd
nd
nd
nd
nd
nd
nd
0.87
2.0
2.0
nd
2.1
10
nd
nd
0.18
52
nd
0.82
3.2
3.4
19
6.2
nd
nd
0.40
39
0.36
0.47
41
nd
2.9
nd
nd
0.83
nd
nd
5.3
nd
nd
nd
nd
nd
nd
nd
nd
nd
0.85
1.6
1.8
nd
2.0
9.4
nd
nd
0.21
51
nd
0.81
3.1
3.3
18
5.7
nd
nd
0.40
38
0.33
0.42
38
nd
1.3
nd
nd
0.80
nd
nd
0.66
nd
nd
nd
nd
nd
nd
nd
nd
nd
0.12
1.9
0.87
nd
0.43
1.0
nd
nd
0.15
6.4
nd
0.35
0.51
0.52
1.5
0.71
nd
nd
0.23
2.9
0.15
0.41
6.3
nd
1.1
nd
nd
0.77
nd
nd
0.56
nd
nd
nd
nd
nd
nd
nd
nd
nd
0.10
1.5
0.77
nd
0.43
0.94
nd
nd
0.18
6.1
nd
0.34
0.47
0.48
1.8
0.63
nd
nd
0.18
2.7
0.13
0.40
6.0
nd0.051,1,1‐trichloroethane
0.05Toluene
0.05Tetrachloroethene
0.05propylbenzene
0.05n‐Pentane
0.05n‐Octane
0.05n‐Nonane
0.05Naphthalene
0.053‐Methylpentane
0.052‐Methylpentane
0.053‐Methylhexane
0.052‐Methylhexane
0.05Methylcyclohexane
0.05Methyl tert‐butyl ether
0.052‐Methyl butane
0.054‐Isopropyltoluene
0.05Isopropylbenzene
0.05Isopropanol
0.05n‐Hexane
0.05n‐Heptane
0.05Ethylcyclohexane
0.05Ethylbenzene
0.05n‐Dodecane
0.052,4‐dimethylpentane
0.05trans‐1,2‐Dichloroethene
0.05cis‐1,2‐Dichloroethene
0.051,1‐Dichloroethene
0.051,2‐Dichloroethane
0.051,1‐Dichloroethane
0.05Dichlorodifluoromethane
0.051,2‐Dibromoethane
0.05Dibromochloromethane
0.05n‐Decane
0.05Cyclohexane
0.05Chloromethane
0.05Chloroethane
0.05Carbon tetrachloride
0.05n‐Butylbenzene
0.052‐butanone(MEK)
0.05Benzene
AM AA5(outside)698SB
04‐Mar‐16
2016008018
AM AA4(outside)697SB
04‐Mar‐16
2016008017
AM AA3 dup(inside)696SB
04‐Mar‐16
2016008016
AM AA3(inside)695SB
04‐Mar‐16
2016008015
AM AA2(inside)694SB
04‐Mar‐16
2016008014
AM AA1(inside)693SB
04‐Mar‐16
2016008013
Page 4 of 23

ANALYTICAL RESULTS
Report N°: M160563R1
Matrix: Radiello Tube
Method: MA‐5.RAD.08 Vola le Organics
Sample units are expressed in µg total Test Started: 08‐Mar‐16
Analyte Name
PQL
Client ID
Sampled Date
Leeder ID
nd
1.0
0.19
1.3
0.36
0.42
nd
1.3
3.9
nd
1.1
0.20
1.4
0.39
0.44
nd
1.5
4.4
nd
3.7
0.24
2.2
0.55
0.71
nd
1.9
5.9
nd
3.4
0.22
1.9
0.52
0.59
nd
1.8
5.4
nd
0.11
0.13
0.90
0.26
0.43
nd
0.86
2.7
nd
0.13
0.17
0.88
0.25
0.36
nd
0.83
2.40.05m&p‐Xylenes
0.05o‐Xylene
0.05Vinyl Chloride
0.05n‐Undecane
0.051,3,5‐Trimethylbenzene
0.051,2,4‐Trimethylbenzene
0.05Trichloromethane
0.05Trichloroethene
0.051,1,2‐trichloroethane
AM AA5(outside)698SB
04‐Mar‐16
2016008018
AM AA4(outside)697SB
04‐Mar‐16
2016008017
AM AA3 dup(inside)696SB
04‐Mar‐16
2016008016
AM AA3(inside)695SB
04‐Mar‐16
2016008015
AM AA2(inside)694SB
04‐Mar‐16
2016008014
AM AA1(inside)693SB
04‐Mar‐16
2016008013
Page 5 of 23
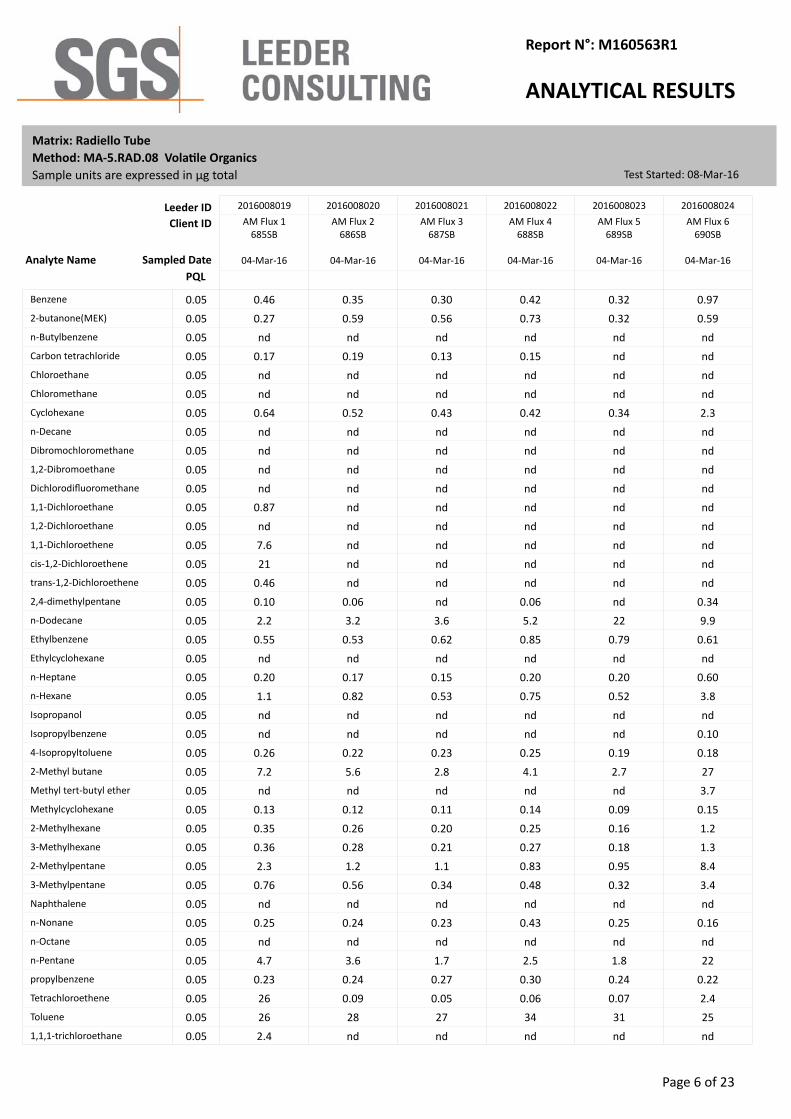
ANALYTICAL RESULTS
Report N°: M160563R1
Matrix: Radiello Tube
Method: MA‐5.RAD.08 Vola le Organics
Sample units are expressed in µg total Test Started: 08‐Mar‐16
Analyte Name
PQL
Client ID
Sampled Date
Leeder ID
0.46
0.27
nd
0.17
nd
nd
0.64
nd
nd
nd
nd
0.87
nd
7.6
21
0.46
0.10
2.2
0.55
nd
0.20
1.1
nd
nd
0.26
7.2
nd
0.13
0.35
0.36
2.3
0.76
nd
0.25
nd
4.7
0.23
26
26
2.4
0.35
0.59
nd
0.19
nd
nd
0.52
nd
nd
nd
nd
nd
nd
nd
nd
nd
0.06
3.2
0.53
nd
0.17
0.82
nd
nd
0.22
5.6
nd
0.12
0.26
0.28
1.2
0.56
nd
0.24
nd
3.6
0.24
0.09
28
nd
0.30
0.56
nd
0.13
nd
nd
0.43
nd
nd
nd
nd
nd
nd
nd
nd
nd
nd
3.6
0.62
nd
0.15
0.53
nd
nd
0.23
2.8
nd
0.11
0.20
0.21
1.1
0.34
nd
0.23
nd
1.7
0.27
0.05
27
nd
0.42
0.73
nd
0.15
nd
nd
0.42
nd
nd
nd
nd
nd
nd
nd
nd
nd
0.06
5.2
0.85
nd
0.20
0.75
nd
nd
0.25
4.1
nd
0.14
0.25
0.27
0.83
0.48
nd
0.43
nd
2.5
0.30
0.06
34
nd
0.32
0.32
nd
nd
nd
nd
0.34
nd
nd
nd
nd
nd
nd
nd
nd
nd
nd
22
0.79
nd
0.20
0.52
nd
nd
0.19
2.7
nd
0.09
0.16
0.18
0.95
0.32
nd
0.25
nd
1.8
0.24
0.07
31
nd
0.97
0.59
nd
nd
nd
nd
2.3
nd
nd
nd
nd
nd
nd
nd
nd
nd
0.34
9.9
0.61
nd
0.60
3.8
nd
0.10
0.18
27
3.7
0.15
1.2
1.3
8.4
3.4
nd
0.16
nd
22
0.22
2.4
25
nd0.051,1,1‐trichloroethane
0.05Toluene
0.05Tetrachloroethene
0.05propylbenzene
0.05n‐Pentane
0.05n‐Octane
0.05n‐Nonane
0.05Naphthalene
0.053‐Methylpentane
0.052‐Methylpentane
0.053‐Methylhexane
0.052‐Methylhexane
0.05Methylcyclohexane
0.05Methyl tert‐butyl ether
0.052‐Methyl butane
0.054‐Isopropyltoluene
0.05Isopropylbenzene
0.05Isopropanol
0.05n‐Hexane
0.05n‐Heptane
0.05Ethylcyclohexane
0.05Ethylbenzene
0.05n‐Dodecane
0.052,4‐dimethylpentane
0.05trans‐1,2‐Dichloroethene
0.05cis‐1,2‐Dichloroethene
0.051,1‐Dichloroethene
0.051,2‐Dichloroethane
0.051,1‐Dichloroethane
0.05Dichlorodifluoromethane
0.051,2‐Dibromoethane
0.05Dibromochloromethane
0.05n‐Decane
0.05Cyclohexane
0.05Chloromethane
0.05Chloroethane
0.05Carbon tetrachloride
0.05n‐Butylbenzene
0.052‐butanone(MEK)
0.05Benzene
AM Flux 6690SB
04‐Mar‐16
2016008024
AM Flux 5689SB
04‐Mar‐16
2016008023
AM Flux 4688SB
04‐Mar‐16
2016008022
AM Flux 3687SB
04‐Mar‐16
2016008021
AM Flux 2686SB
04‐Mar‐16
2016008020
AM Flux 1685SB
04‐Mar‐16
2016008019
Page 6 of 23

ANALYTICAL RESULTS
Report N°: M160563R1
Matrix: Radiello Tube
Method: MA‐5.RAD.08 Vola le Organics
Sample units are expressed in µg total Test Started: 08‐Mar‐16
Analyte Name
PQL
Client ID
Sampled Date
Leeder ID
nd
760
2.8
1.9
0.49
0.79
nd
0.76
1.9
nd
0.34
nd
2.0
0.51
1.4
nd
0.79
1.9
nd
0.19
nd
2.1
0.53
1.4
nd
0.96
2.4
nd
0.17
nd
2.1
0.58
2.0
nd
1.3
3.4
nd
1.8
nd
1.8
0.49
5.8
nd
1.3
2.7
nd
380
0.24
1.9
0.44
2.3
nd
0.69
2.00.05m&p‐Xylenes
0.05o‐Xylene
0.05Vinyl Chloride
0.05n‐Undecane
0.051,3,5‐Trimethylbenzene
0.051,2,4‐Trimethylbenzene
0.05Trichloromethane
0.05Trichloroethene
0.051,1,2‐trichloroethane
AM Flux 6690SB
04‐Mar‐16
2016008024
AM Flux 5689SB
04‐Mar‐16
2016008023
AM Flux 4688SB
04‐Mar‐16
2016008022
AM Flux 3687SB
04‐Mar‐16
2016008021
AM Flux 2686SB
04‐Mar‐16
2016008020
AM Flux 1685SB
04‐Mar‐16
2016008019
Page 7 of 23
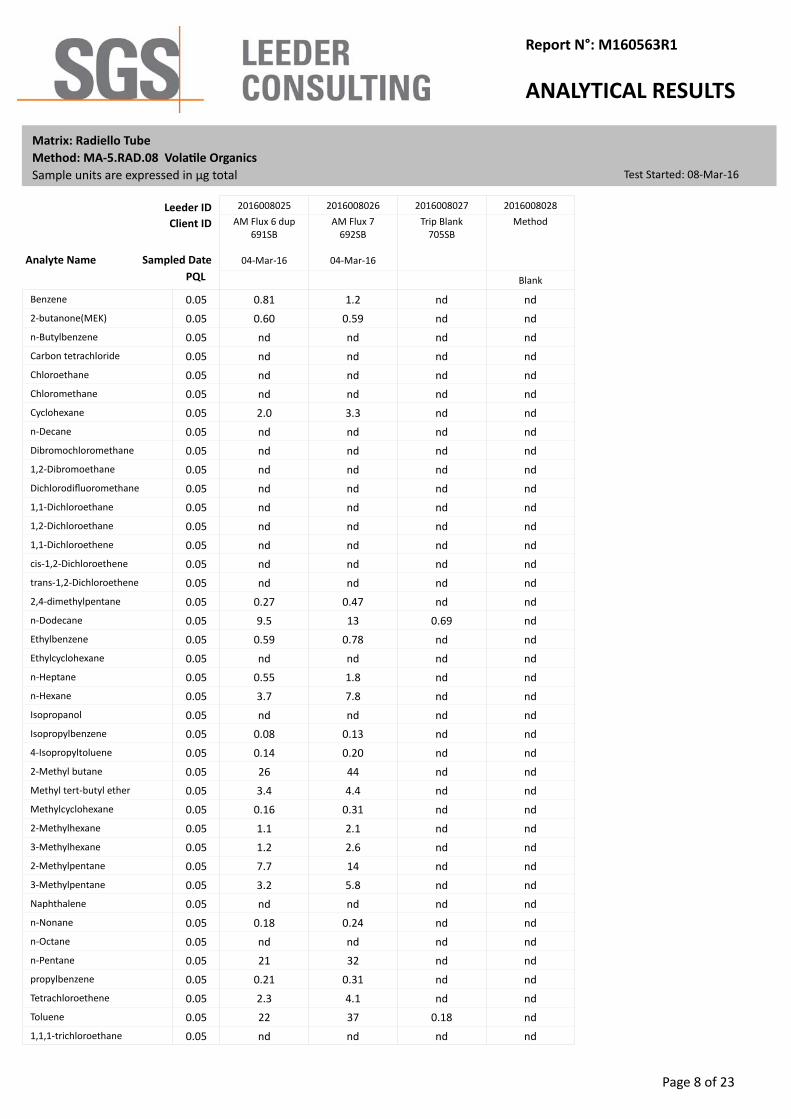
ANALYTICAL RESULTS
Report N°: M160563R1
Matrix: Radiello Tube
Method: MA‐5.RAD.08 Vola le Organics
Sample units are expressed in µg total Test Started: 08‐Mar‐16
Analyte Name
PQL
Client ID
Sampled Date
Leeder ID
0.81
0.60
nd
nd
nd
nd
2.0
nd
nd
nd
nd
nd
nd
nd
nd
nd
0.27
9.5
0.59
nd
0.55
3.7
nd
0.08
0.14
26
3.4
0.16
1.1
1.2
7.7
3.2
nd
0.18
nd
21
0.21
2.3
22
nd
1.2
0.59
nd
nd
nd
nd
3.3
nd
nd
nd
nd
nd
nd
nd
nd
nd
0.47
13
0.78
nd
1.8
7.8
nd
0.13
0.20
44
4.4
0.31
2.1
2.6
14
5.8
nd
0.24
nd
32
0.31
4.1
37
nd
nd
nd
nd
nd
nd
nd
nd
nd
nd
nd
nd
nd
nd
nd
nd
nd
nd
0.69
nd
nd
nd
nd
nd
nd
nd
nd
nd
nd
nd
nd
nd
nd
nd
nd
nd
nd
nd
nd
0.18
nd
nd
nd
nd
nd
nd
nd
nd
nd
nd
nd
nd
nd
nd
nd
nd
nd
nd
nd
nd
nd
nd
nd
nd
nd
nd
nd
nd
nd
nd
nd
nd
nd
nd
nd
nd
nd
nd
nd
nd
nd0.051,1,1‐trichloroethane
0.05Toluene
0.05Tetrachloroethene
0.05propylbenzene
0.05n‐Pentane
0.05n‐Octane
0.05n‐Nonane
0.05Naphthalene
0.053‐Methylpentane
0.052‐Methylpentane
0.053‐Methylhexane
0.052‐Methylhexane
0.05Methylcyclohexane
0.05Methyl tert‐butyl ether
0.052‐Methyl butane
0.054‐Isopropyltoluene
0.05Isopropylbenzene
0.05Isopropanol
0.05n‐Hexane
0.05n‐Heptane
0.05Ethylcyclohexane
0.05Ethylbenzene
0.05n‐Dodecane
0.052,4‐dimethylpentane
0.05trans‐1,2‐Dichloroethene
0.05cis‐1,2‐Dichloroethene
0.051,1‐Dichloroethene
0.051,2‐Dichloroethane
0.051,1‐Dichloroethane
0.05Dichlorodifluoromethane
0.051,2‐Dibromoethane
0.05Dibromochloromethane
0.05n‐Decane
0.05Cyclohexane
0.05Chloromethane
0.05Chloroethane
0.05Carbon tetrachloride
0.05n‐Butylbenzene
0.052‐butanone(MEK)
0.05Benzene
Blank
Method
2016008028
Trip Blank705SB
2016008027
AM Flux 7692SB
04‐Mar‐16
2016008026
AM Flux 6 dup691SB
04‐Mar‐16
2016008025
Page 8 of 23

ANALYTICAL RESULTS
Report N°: M160563R1
Matrix: Radiello Tube
Method: MA‐5.RAD.08 Vola le Organics
Sample units are expressed in µg total Test Started: 08‐Mar‐16
Analyte Name
PQL
Client ID
Sampled Date
Leeder ID
nd
370
0.23
1.9
0.39
2.1
nd
0.62
2.1
nd
480
0.19
2.4
0.60
3.2
nd
0.96
2.7
nd
nd
nd
nd
nd
nd
nd
nd
nd
nd
nd
nd
nd
nd
nd
nd
nd
nd0.05m&p‐Xylenes
0.05o‐Xylene
0.05Vinyl Chloride
0.05n‐Undecane
0.051,3,5‐Trimethylbenzene
0.051,2,4‐Trimethylbenzene
0.05Trichloromethane
0.05Trichloroethene
0.051,1,2‐trichloroethane
Blank
Method
2016008028
Trip Blank705SB
2016008027
AM Flux 7692SB
04‐Mar‐16
2016008026
AM Flux 6 dup691SB
04‐Mar‐16
2016008025
Page 9 of 23

ANALYTICAL RESULTS
Report N°: M160563R1
Matrix: Passive Sampler
Method: MA‐5.WL.06 Vola le Organics (w/v)
Sample units are expressed in µg/m³ Test Started: 08‐Mar‐16
Analyte Name
PQL
Client ID
Sampled Date
Leeder ID
6.5
<5.6
<1.1
<4.5
<7.2
<7.2
<3.8
<32
<2.2
<2.2
<38
<7.2
<2.9
<8.4
760
19
<3.8
120
39
<3.8
<3.8
28
<560
<0.75
<1.6
<38
<3.8
<3.8
<3.8
<3.8
110
<3.8
<1.9
<1.6
<3.8
<38
<1.6
420
17
140
<2.9
<5.5
<1.1
<4.5
<7.2
<7.2
<3.8
<32
<2.2
<2.2
<38
<7.2
<2.9
<8.4
<3.7
<3.8
<3.8
<110
<1.6
<3.8
<3.8
39
<550
<0.75
<1.6
<38
<3.8
<3.8
<3.8
<3.8
180
<3.8
<1.9
<1.6
<3.8
<38
<1.6
4.7
5.5
641,1,1‐trichloroethane
Toluene
Tetrachloroethene
propylbenzene
n‐Pentane
n‐Octane
n‐Nonane
Naphthalene
3‐Methylpentane
2‐Methylpentane
3‐Methylhexane
2‐Methylhexane
Methylcyclohexane
Methyl tert‐butyl ether
2‐Methyl butane
4‐Isopropyltoluene
Isopropylbenzene
Isopropanol
n‐Hexane
n‐Heptane
Ethylcyclohexane
Ethylbenzene
n‐Dodecane
2,4‐dimethylpentane
trans‐1,2‐Dichloroethene
cis‐1,2‐Dichloroethene
1,1‐Dichloroethene
1,2‐Dichloroethane
1,1‐Dichloroethane
Dichlorodifluoromethane
1,2‐Dibromoethane
Dibromochloromethane
n‐Decane
Cyclohexane
Chloromethane
Chloroethane
Carbon tetrachloride
n‐Butylbenzene
2‐butanone(MEK)
Benzene
AM SS21504‐AN‐LU‐072
04‐Mar‐16
2016008030
AM SS11504‐AN‐LU‐073
04‐Mar‐16
2016008029
Page 10 of 23

ANALYTICAL RESULTS
Report N°: M160563R1
Matrix: Passive Sampler
Method: MA‐5.WL.06 Vola le Organics (w/v)
Sample units are expressed in µg/m³ Test Started: 08‐Mar‐16
Analyte Name
PQL
Client ID
Sampled Date
Leeder ID
<2.2
19000
100
<1.1
<1.1
<1.1
<14
51
160
<2.2
<2.2
<3.6
<1.1
<1.1
<1.1
<14
<1.6
<1.6m&p‐Xylenes
o‐Xylene
Vinyl Chloride
n‐Undecane
1,3,5‐Trimethylbenzene
1,2,4‐Trimethylbenzene
Trichloromethane
Trichloroethene
1,1,2‐trichloroethane
AM SS21504‐AN‐LU‐072
04‐Mar‐16
2016008030
AM SS11504‐AN‐LU‐073
04‐Mar‐16
2016008029
Page 11 of 23

ANALYTICAL RESULTS
Report N°: M160563R1
Matrix: Passive Sampler
Method: MA‐5.WL.06 Vola le Organics (w/v)
Sample units are expressed in µg/m³ Test Started: 08‐Mar‐16
Analyte Name
PQL
Client ID
Sampled Date
Leeder ID
<2.9
<5.6
<1.1
<4.5
<7.2
<7.2
<3.8
<32
<2.2
<2.2
<38
<7.2
<2.9
<8.4
<3.7
<3.8
<3.8
250
<1.6
<3.8
<3.8
43
<550
<0.75
<1.6
<38
<3.8
<3.8
<3.8
<3.8
210
<3.8
<1.9
<1.6
<3.8
<38
<1.6
<1.7
11
<5.6
<2.9
<5.6
<1.1
<4.5
<7.2
<7.2
<3.8
<32
<2.2
<2.2
<38
<7.2
<2.9
<8.4
<3.7
<3.8
<3.8
<110
<1.6
<3.8
<3.8
48
<560
<0.75
<1.6
<38
<3.8
<3.8
<3.8
<3.8
210
<3.8
<1.9
<1.6
<3.8
<38
<1.6
<1.7
4.3
<5.6
5.2
<5.6
<1.1
<4.5
<7.2
<7.2
<3.8
<32
<2.2
<2.2
<38
<7.2
<2.9
<8.4
<3.7
<3.8
<3.8
590
23
<3.8
<3.8
60
<560
<0.75
<1.6
<38
<3.8
<3.8
<3.8
<3.8
260
<3.8
<1.9
<1.6
19
<38
5.5
<1.7
16
<5.6
14
22
<1.1
<4.5
<7.2
<7.2
<3.8
<32
<2.2
<2.2
<38
<7.2
<2.9
<8.4
<3.7
<3.8
<3.8
<110
6.3
<3.8
360
300
<560
<0.75
<1.6
46
<3.8
<3.8
<3.8
<3.8
240
62
<1.9
<1.6
410
130
4.4
110
15
<5.6
12
12
<1.1
<4.5
<7.2
<7.2
<3.8
<32
<2.2
<2.2
<38
<7.2
<2.9
<8.4
<3.7
<3.8
<3.8
<110
3.9
<3.8
170
160
<560
<0.75
<1.6
<38
<3.8
<3.8
<3.8
<3.8
210
40
<1.9
<1.6
180
81
2.8
110
11
<5.61,1,1‐trichloroethane
Toluene
Tetrachloroethene
propylbenzene
n‐Pentane
n‐Octane
n‐Nonane
Naphthalene
3‐Methylpentane
2‐Methylpentane
3‐Methylhexane
2‐Methylhexane
Methylcyclohexane
Methyl tert‐butyl ether
2‐Methyl butane
4‐Isopropyltoluene
Isopropylbenzene
Isopropanol
n‐Hexane
n‐Heptane
Ethylcyclohexane
Ethylbenzene
n‐Dodecane
2,4‐dimethylpentane
trans‐1,2‐Dichloroethene
cis‐1,2‐Dichloroethene
1,1‐Dichloroethene
1,2‐Dichloroethane
1,1‐Dichloroethane
Dichlorodifluoromethane
1,2‐Dibromoethane
Dibromochloromethane
n‐Decane
Cyclohexane
Chloromethane
Chloroethane
Carbon tetrachloride
n‐Butylbenzene
2‐butanone(MEK)
Benzene
AM SS6 dup1504‐AN‐LU‐099
04‐Mar‐16
2016008035
AM SS61504‐AN‐LU‐098
04‐Mar‐16
2016008034
AM SS51504‐AN‐LU‐097
04‐Mar‐16
2016008033
AM SS41504‐AN‐LU‐096
04‐Mar‐16
2016008032
AM SS31504‐AN‐LU‐095
04‐Mar‐16
2016008031
Page 12 of 23

ANALYTICAL RESULTS
Report N°: M160563R1
Matrix: Passive Sampler
Method: MA‐5.WL.06 Vola le Organics (w/v)
Sample units are expressed in µg/m³ Test Started: 08‐Mar‐16
Analyte Name
PQL
Client ID
Sampled Date
Leeder ID
<2.2
9.1
<3.6
<1.1
<1.1
31
<14
<1.6
1.9
<2.2
<2.2
<3.6
<1.1
<1.1
<1.1
<14
<1.6
1.7
<2.2
<2.2
<3.6
19
9.7
320
<14
30
69
<2.2
13000
19
<1.1
<1.1
32
<14
2.8
5.8
<2.2
10000
8.4
<1.1
<1.1
13
<14
2.6
4.2m&p‐Xylenes
o‐Xylene
Vinyl Chloride
n‐Undecane
1,3,5‐Trimethylbenzene
1,2,4‐Trimethylbenzene
Trichloromethane
Trichloroethene
1,1,2‐trichloroethane
AM SS6 dup1504‐AN‐LU‐099
04‐Mar‐16
2016008035
AM SS61504‐AN‐LU‐098
04‐Mar‐16
2016008034
AM SS51504‐AN‐LU‐097
04‐Mar‐16
2016008033
AM SS41504‐AN‐LU‐096
04‐Mar‐16
2016008032
AM SS31504‐AN‐LU‐095
04‐Mar‐16
2016008031
Page 13 of 23

ANALYTICAL RESULTS
Report N°: M160563R1
Matrix: Passive Sampler
Method: MA‐5.WL.05 Vola le Organics
Sample units are expressed in µg total Test Started: 08‐Mar‐16
Analyte Name
PQL
Client ID
Sampled Date
Leeder ID
0.11
nd
nd
nd
nd
nd
nd
nd
nd
nd
nd
nd
nd
nd
10
0.24
nd
6
1.2
nd
nd
0.37
nd
nd
nd
nd
nd
nd
nd
nd
1.5
nd
nd
nd
nd
nd
nd
12
0.43
1.3
nd
nd
nd
nd
nd
nd
nd
nd
nd
nd
nd
nd
nd
nd
nd
nd
nd
nd
nd
nd
nd
0.51
nd
nd
nd
nd
nd
nd
nd
nd
2.4
nd
nd
nd
nd
nd
nd
0.14
0.14
0.580.051,1,1‐trichloroethane
0.05Toluene
0.05Tetrachloroethene
0.05propylbenzene
0.05n‐Pentane
0.05n‐Octane
0.05n‐Nonane
0.05Naphthalene
0.053‐Methylpentane
0.052‐Methylpentane
0.053‐Methylhexane
0.052‐Methylhexane
0.05Methylcyclohexane
0.05Methyl tert‐butyl ether
0.052‐Methyl butane
0.054‐Isopropyltoluene
0.05Isopropylbenzene
0.05Isopropanol
0.05n‐Hexane
0.05n‐Heptane
0.05Ethylcyclohexane
0.05Ethylbenzene
5n‐Dodecane
0.052,4‐dimethylpentane
0.05trans‐1,2‐Dichloroethene
0.05cis‐1,2‐Dichloroethene
0.051,1‐Dichloroethene
0.051,2‐Dichloroethane
0.051,1‐Dichloroethane
0.05Dichlorodifluoromethane
0.051,2‐Dibromoethane
0.05Dibromochloromethane
1n‐Decane
0.05Cyclohexane
0.05Chloromethane
0.05Chloroethane
0.05Carbon tetrachloride
0.05n‐Butylbenzene
0.052‐butanone(MEK)
0.05Benzene
AM SS21504‐AN‐LU‐072
04‐Mar‐16
2016008030
AM SS11504‐AN‐LU‐073
04‐Mar‐16
2016008029
Page 14 of 23

ANALYTICAL RESULTS
Report N°: M160563R1
Matrix: Passive Sampler
Method: MA‐5.WL.05 Vola le Organics
Sample units are expressed in µg total Test Started: 08‐Mar‐16
Analyte Name
PQL
Client ID
Sampled Date
Leeder ID
nd
430
1.4
nd
nd
nd
nd
1.6
4.9
nd
nd
nd
nd
nd
nd
nd
nd
nd0.05m&p‐Xylenes
0.05o‐Xylene
0.05Vinyl Chloride
0.05n‐Undecane
0.051,3,5‐Trimethylbenzene
0.051,2,4‐Trimethylbenzene
0.05Trichloromethane
0.05Trichloroethene
0.051,1,2‐trichloroethane
AM SS21504‐AN‐LU‐072
04‐Mar‐16
2016008030
AM SS11504‐AN‐LU‐073
04‐Mar‐16
2016008029
Page 15 of 23

ANALYTICAL RESULTS
Report N°: M160563R1
Matrix: Passive Sampler
Method: MA‐5.WL.05 Vola le Organics
Sample units are expressed in µg total Test Started: 08‐Mar‐16
Analyte Name
PQL
Client ID
Sampled Date
Leeder ID
nd
nd
nd
nd
nd
nd
nd
nd
nd
nd
nd
nd
nd
nd
nd
nd
nd
12
nd
nd
nd
0.57
nd
nd
nd
nd
nd
nd
nd
nd
2.8
nd
nd
nd
nd
nd
nd
nd
0.28
nd
nd
nd
nd
nd
nd
nd
nd
nd
nd
nd
nd
nd
nd
nd
nd
nd
nd
nd
nd
nd
nd
0.62
nd
nd
nd
nd
nd
nd
nd
nd
2.7
nd
nd
nd
nd
nd
nd
nd
0.11
nd
0.09
nd
nd
nd
nd
nd
nd
nd
nd
nd
nd
nd
nd
nd
nd
nd
nd
28
0.75
nd
nd
0.78
nd
nd
nd
nd
nd
nd
nd
nd
3.4
nd
nd
nd
0.26
nd
0.17
nd
0.40
nd
0.23
0.20
nd
nd
nd
nd
nd
nd
nd
nd
nd
nd
nd
nd
nd
nd
nd
nd
0.20
nd
4.7
3.9
nd
nd
nd
0.60
nd
nd
nd
nd
3.1
0.81
nd
nd
5.4
1.8
0.14
3.3
0.38
nd
0.20
0.11
nd
nd
nd
nd
nd
nd
nd
nd
nd
nd
nd
nd
nd
nd
nd
nd
0.13
nd
2.2
2.1
nd
nd
nd
nd
nd
nd
nd
nd
nd
0.52
nd
nd
2.4
1.1
0.09
3.1
0.29
nd
nd
nd
nd
nd
nd
nd
nd
nd
nd
nd
nd
nd
nd
nd
nd
nd
nd
nd
nd
nd
nd
0.91
nd
nd
nd
nd
nd
nd
nd
nd
5.5
nd
nd
nd
nd
nd
nd
nd
0.08
nd0.051,1,1‐trichloroethane
0.05Toluene
0.05Tetrachloroethene
0.05propylbenzene
0.05n‐Pentane
0.05n‐Octane
0.05n‐Nonane
0.05Naphthalene
0.053‐Methylpentane
0.052‐Methylpentane
0.053‐Methylhexane
0.052‐Methylhexane
0.05Methylcyclohexane
0.05Methyl tert‐butyl ether
0.052‐Methyl butane
0.054‐Isopropyltoluene
0.05Isopropylbenzene
0.05Isopropanol
0.05n‐Hexane
0.05n‐Heptane
0.05Ethylcyclohexane
0.05Ethylbenzene
5n‐Dodecane
0.052,4‐dimethylpentane
0.05trans‐1,2‐Dichloroethene
0.05cis‐1,2‐Dichloroethene
0.051,1‐Dichloroethene
0.051,2‐Dichloroethane
0.051,1‐Dichloroethane
0.05Dichlorodifluoromethane
0.051,2‐Dibromoethane
0.05Dibromochloromethane
1n‐Decane
0.05Cyclohexane
0.05Chloromethane
0.05Chloroethane
0.05Carbon tetrachloride
0.05n‐Butylbenzene
0.052‐butanone(MEK)
0.05Benzene
Trip Blank1504‐AN‐LU‐100
2016008036
AM SS6 dup1504‐AN‐LU‐099
04‐Mar‐16
2016008035
AM SS61504‐AN‐LU‐098
04‐Mar‐16
2016008034
AM SS51504‐AN‐LU‐097
04‐Mar‐16
2016008033
AM SS41504‐AN‐LU‐096
04‐Mar‐16
2016008032
AM SS31504‐AN‐LU‐095
04‐Mar‐16
2016008031
Page 16 of 23

ANALYTICAL RESULTS
Report N°: M160563R1
Matrix: Passive Sampler
Method: MA‐5.WL.05 Vola le Organics
Sample units are expressed in µg total Test Started: 08‐Mar‐16
Analyte Name
PQL
Client ID
Sampled Date
Leeder ID
nd
0.21
nd
nd
nd
1.5
nd
nd
0.06
nd
nd
nd
nd
nd
nd
nd
nd
0.05
nd
nd
nd
0.88
0.46
15
nd
0.94
2.1
nd
300
0.26
nd
nd
1.5
nd
0.09
0.18
nd
240
0.12
nd
nd
0.63
nd
0.08
0.13
nd
nd
nd
nd
nd
nd
nd
nd
nd0.05m&p‐Xylenes
0.05o‐Xylene
0.05Vinyl Chloride
0.05n‐Undecane
0.051,3,5‐Trimethylbenzene
0.051,2,4‐Trimethylbenzene
0.05Trichloromethane
0.05Trichloroethene
0.051,1,2‐trichloroethane
Trip Blank1504‐AN‐LU‐100
2016008036
AM SS6 dup1504‐AN‐LU‐099
04‐Mar‐16
2016008035
AM SS61504‐AN‐LU‐098
04‐Mar‐16
2016008034
AM SS51504‐AN‐LU‐097
04‐Mar‐16
2016008033
AM SS41504‐AN‐LU‐096
04‐Mar‐16
2016008032
AM SS31504‐AN‐LU‐095
04‐Mar‐16
2016008031
Page 17 of 23

ANALYTICAL RESULTS
Report N°: M160563R1
Matrix: Passive Sampler
Method: MA‐5.WL.05 Vola le Organics
Sample units are expressed in µg total Test Started: 08‐Mar‐16
Analyte Name
PQL
Client ID
Sampled Date
Leeder ID
nd
nd
nd
nd
nd
nd
nd
nd
nd
nd
nd
nd
nd
nd
nd
nd
nd
nd
nd
nd
nd
nd
nd
nd
nd
nd
nd
nd
nd
nd
nd
nd
nd
nd
nd
nd
nd
nd
nd
nd0.051,1,1‐trichloroethane
0.05Toluene
0.05Tetrachloroethene
0.05propylbenzene
0.05n‐Pentane
0.05n‐Octane
0.05n‐Nonane
0.05Naphthalene
0.053‐Methylpentane
0.052‐Methylpentane
0.053‐Methylhexane
0.052‐Methylhexane
0.05Methylcyclohexane
0.05Methyl tert‐butyl ether
0.052‐Methyl butane
0.054‐Isopropyltoluene
0.05Isopropylbenzene
0.05Isopropanol
0.05n‐Hexane
0.05n‐Heptane
0.05Ethylcyclohexane
0.05Ethylbenzene
5n‐Dodecane
0.052,4‐dimethylpentane
0.05trans‐1,2‐Dichloroethene
0.05cis‐1,2‐Dichloroethene
0.051,1‐Dichloroethene
0.051,2‐Dichloroethane
0.051,1‐Dichloroethane
0.05Dichlorodifluoromethane
0.051,2‐Dibromoethane
0.05Dibromochloromethane
1n‐Decane
0.05Cyclohexane
0.05Chloromethane
0.05Chloroethane
0.05Carbon tetrachloride
0.05n‐Butylbenzene
0.052‐butanone(MEK)
0.05Benzene
Blank
Method
2016008037
Page 18 of 23

ANALYTICAL RESULTS
Report N°: M160563R1
Matrix: Passive Sampler
Method: MA‐5.WL.05 Vola le Organics
Sample units are expressed in µg total Test Started: 08‐Mar‐16
Analyte Name
PQL
Client ID
Sampled Date
Leeder ID
nd
nd
nd
nd
nd
nd
nd
nd
nd0.05m&p‐Xylenes
0.05o‐Xylene
0.05Vinyl Chloride
0.05n‐Undecane
0.051,3,5‐Trimethylbenzene
0.051,2,4‐Trimethylbenzene
0.05Trichloromethane
0.05Trichloroethene
0.051,1,2‐trichloroethane
Blank
Method
2016008037
Matrix: Passive Sampler
Method: MA‐30.AIR.04 Total Recoverable Hydrocarbons
Sample units are expressed in mg/m³ Test Started: 08‐Mar‐16
Analyte Name
PQL
Client ID
Sampled Date
Leeder ID
15
0.75
0.31
0.95>C10‐C16
C6‐C10
AM SS21504‐AN‐LU‐072
04‐Mar‐16
2016008030
AM SS11504‐AN‐LU‐073
04‐Mar‐16
2016008029
Matrix: Passive Sampler
Method: MA‐30.AIR.04 Total Recoverable Hydrocarbons
Sample units are expressed in mg/m³ Test Started: 08‐Mar‐16
Analyte Name
PQL
Client ID
Sampled Date
Leeder ID
0.32
6.2
0.36
0.89
2.1
31
11
3.8
8.2
1.3>C10‐C16
C6‐C10
AM SS6 dup1504‐AN‐LU‐099
04‐Mar‐16
2016008035
AM SS61504‐AN‐LU‐098
04‐Mar‐16
2016008034
AM SS51504‐AN‐LU‐097
04‐Mar‐16
2016008033
AM SS41504‐AN‐LU‐096
04‐Mar‐16
2016008032
AM SS31504‐AN‐LU‐095
04‐Mar‐16
2016008031
Page 19 of 23

ANALYTICAL RESULTS
Report N°: M160563R1
Matrix: Radiello Tube
Method: MA‐30.AIR.04 Total Recoverable Hydrocarbons
Sample units are expressed in mg/m³ Test Started: 08‐Mar‐16
Analyte Name
PQL
Client ID
Sampled Date
Leeder ID
0.030
0.060
0.050
0.050
0.090
0.060
0.080
0.060
0.020
0.050
0.020
0.040>C10‐C16
C6‐C10
AM AA5(outside)698SB
04‐Mar‐16
2016008018
AM AA4(outside)697SB
04‐Mar‐16
2016008017
AM AA3 dup(inside)696SB
04‐Mar‐16
2016008016
AM AA3(inside)695SB
04‐Mar‐16
2016008015
AM AA2(inside)694SB
04‐Mar‐16
2016008014
AM AA1(inside)693SB
04‐Mar‐16
2016008013
Matrix: Passive Sampler
Method: MA‐30.AIR.03 Total Recoverable Hydrocarbons
Sample units are expressed in µg total Test Started: 08‐Mar‐16
Analyte Name
PQL
Client ID
Sampled Date
Leeder ID
370
23
8
305>C10‐C16
5C6‐C10
AM SS21504‐AN‐LU‐072
04‐Mar‐16
2016008030
AM SS11504‐AN‐LU‐073
04‐Mar‐16
2016008029
Matrix: Passive Sampler
Method: MA‐30.AIR.03 Total Recoverable Hydrocarbons
Sample units are expressed in µg total Test Started: 08‐Mar‐16
Analyte Name
PQL
Client ID
Sampled Date
Leeder ID
8
190
9
28
53
970
280
120
210
39
12
215>C10‐C16
5C6‐C10
Trip Blank1504‐AN‐LU‐100
2016008036
AM SS6 dup1504‐AN‐LU‐099
04‐Mar‐16
2016008035
AM SS61504‐AN‐LU‐098
04‐Mar‐16
2016008034
AM SS51504‐AN‐LU‐097
04‐Mar‐16
2016008033
AM SS41504‐AN‐LU‐096
04‐Mar‐16
2016008032
AM SS31504‐AN‐LU‐095
04‐Mar‐16
2016008031
Matrix: Passive Sampler
Method: MA‐30.AIR.03 Total Recoverable Hydrocarbons
Sample units are expressed in µg total Test Started: 08‐Mar‐16
Analyte Name
PQL
Client ID
Sampled Date
Leeder ID
nd
nd5>C10‐C16
5C6‐C10
Blank
Method
2016008037
Page 20 of 23

ANALYTICAL RESULTS
Report N°: M160563R1
Matrix: Radiello Tube
Method: MA‐30.AIR.03 Total Recoverable Hydrocarbons
Sample units are expressed in µg total Test Started: 08‐Mar‐16
Analyte Name
PQL
Client ID
Sampled Date
Leeder ID
47
38
63
30
120
36
110
39
29
28
30
235>C10‐C16
5C6‐C10
AM AA5(outside)698SB
04‐Mar‐16
2016008018
AM AA4(outside)697SB
04‐Mar‐16
2016008017
AM AA3 dup(inside)696SB
04‐Mar‐16
2016008016
AM AA3(inside)695SB
04‐Mar‐16
2016008015
AM AA2(inside)694SB
04‐Mar‐16
2016008014
AM AA1(inside)693SB
04‐Mar‐16
2016008013
Matrix: Radiello Tube
Method: MA‐30.AIR.03 Total Recoverable Hydrocarbons
Sample units are expressed in µg total Test Started: 08‐Mar‐16
Analyte Name
PQL
Client ID
Sampled Date
Leeder ID
690
99
66
180
61
170
73
180
55
860
380
4805>C10‐C16
5C6‐C10
AM Flux 6690SB
04‐Mar‐16
2016008024
AM Flux 5689SB
04‐Mar‐16
2016008023
AM Flux 4688SB
04‐Mar‐16
2016008022
AM Flux 3687SB
04‐Mar‐16
2016008021
AM Flux 2686SB
04‐Mar‐16
2016008020
AM Flux 1685SB
04‐Mar‐16
2016008019
Matrix: Radiello Tube
Method: MA‐30.AIR.03 Total Recoverable Hydrocarbons
Sample units are expressed in µg total Test Started: 08‐Mar‐16
Analyte Name
PQL
Client ID
Sampled Date
Leeder ID
340
400
440
430
nd
16
nd
nd5>C10‐C16
5C6‐C10
Blank
Method
2016008028
Trip Blank705SB
2016008027
AM Flux 7692SB
04‐Mar‐16
2016008026
AM Flux 6 dup691SB
04‐Mar‐16
2016008025
Page 21 of 23
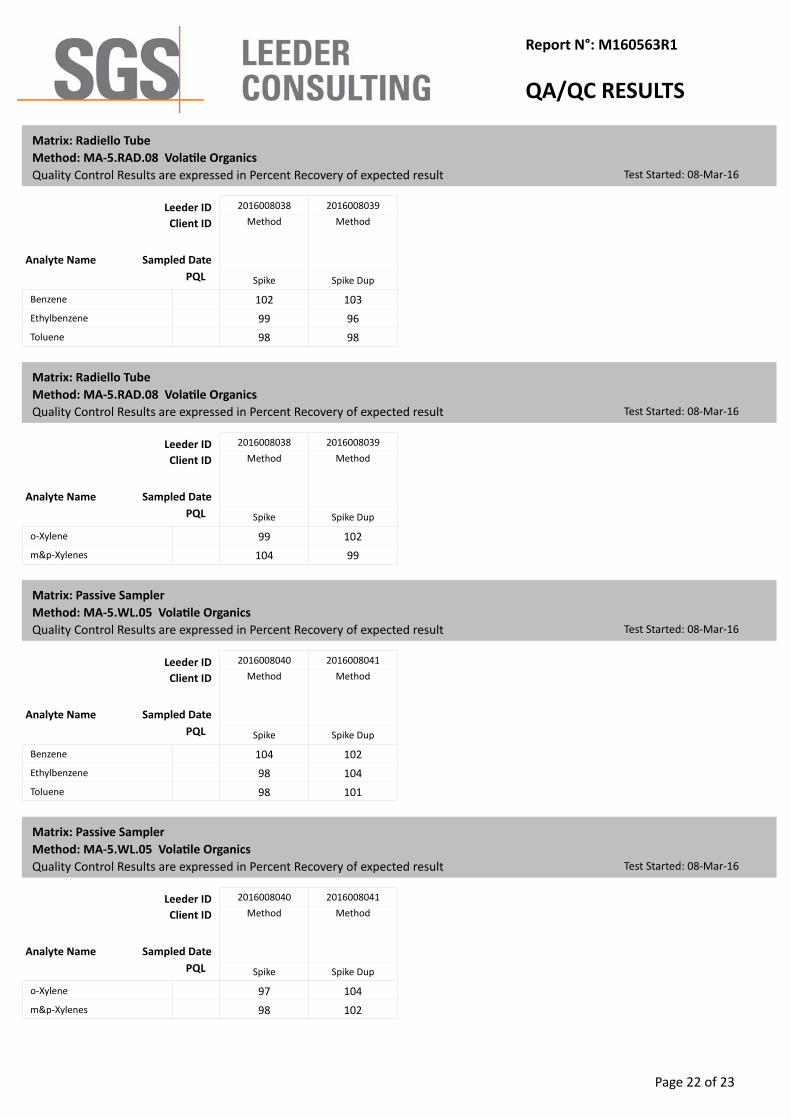
QA/QC RESULTS
Report N°: M160563R1
Matrix: Radiello Tube
Method: MA‐5.RAD.08 Vola le Organics
Quality Control Results are expressed in Percent Recovery of expected result Test Started: 08‐Mar‐16
Analyte Name
PQL
Client ID
Sampled Date
Leeder ID
102
99
98
103
96
98Toluene
Ethylbenzene
Benzene
Spike Dup
Method
2016008039
Spike
Method
2016008038
Matrix: Radiello Tube
Method: MA‐5.RAD.08 Vola le Organics
Quality Control Results are expressed in Percent Recovery of expected result Test Started: 08‐Mar‐16
Analyte Name
PQL
Client ID
Sampled Date
Leeder ID
99
104
102
99m&p‐Xylenes
o‐Xylene
Spike Dup
Method
2016008039
Spike
Method
2016008038
Matrix: Passive Sampler
Method: MA‐5.WL.05 Vola le Organics
Quality Control Results are expressed in Percent Recovery of expected result Test Started: 08‐Mar‐16
Analyte Name
PQL
Client ID
Sampled Date
Leeder ID
104
98
98
102
104
101Toluene
Ethylbenzene
Benzene
Spike Dup
Method
2016008041
Spike
Method
2016008040
Matrix: Passive Sampler
Method: MA‐5.WL.05 Vola le Organics
Quality Control Results are expressed in Percent Recovery of expected result Test Started: 08‐Mar‐16
Analyte Name
PQL
Client ID
Sampled Date
Leeder ID
97
98
104
102m&p‐Xylenes
o‐Xylene
Spike Dup
Method
2016008041
Spike
Method
2016008040
Page 22 of 23

Report N°: M160563R1
QUALIFIERS / NO TES FOR REPORTED RESULTS PQ L Practic al Quant ita ti on Lim it nd N ot Detect ed – The an a lyt e was no t d et ected above th e rep ort ed PQ L. is Insuffic ient Sample to per form thi s ana lys i s. T Tent at ive ident ific at ion based o n c omput er l ibr a ry search of mass spec tra . NC N ot ca lcul at ed and /or Result s below PQ L NV N o Vacuum , C an ister rece i ved ab ove standard a tmo spher ic p ressure nr N ot Request ed for ana ly sis . R R ejected Resul t – result s for th is ana ly sis fa il ed QC c heck s. SQ S em i‐Quanti ta tiv e r esu lt – quan tit at ion based o n a gener ic respon se fa cto r fo r t his c la ss of ana l yt e. IM Inappropr ia te method of an a lys i s for thi s comp ound U Un able t o p rov ide Qu a lity C ont rol data – high level s of co mpou nds i n sample int er fered wit h ana ly sis o f
QC r esult s . UF Un able t o p rov ide Qu a lity C ont rol data ‐ Sur ro ga t es fai led QC check s du e to samp le matr ix effects L Ana ly te d etect ed a t a leve l above th e lin ear r esp onse o f ca li bra t ion cur ve. E Estimat ed r esu lt. N ATA acc redi ta tio n d oes no t co ver estim at ed r esu lts. C1 These co mpou nds c o‐elut e . ‐‐ Par amet er N ot Determ ined CT E lev a ted c oncen tr at ion . R esult s repo rt ed fr om ca rbon tub e ana ly sis ** S amp le sho ws no n‐petroleu m hydroca rb on pro file
This document is issued, on the Client's behalf, by the Company under its General Conditions of Service available on request and accessible at http://www.sgs.com/en/Terms‐and‐Conditions/General‐Conditions‐of‐Services‐English.aspx .
The Client's attention is drawn to the limitation of liability, indemnification and jurisdiction issues defined therein. Any other holder of this document is advised that information contained hereon reflects the Company's findings at the time of its intervention only and within the limits of Client's instructions, if any. The Company's sole responsibility is to its Client and th is document does not exonerate parties to a transaction from exercising all their rights and obligations under
the transaction documents This report must not be reproduced, except in fu ll.
Page 23 of 23

APPENDIX ONE. CHAIN OF CUSTODY DOCUMENT

Passive Sam le Collection Unit 5, 18 Redland Drive
Mitcham VIC 3132 Page_of
.s~~ -
Ph: (03) 9874 1988 Fax: (03) 9874 1933 <;>. '
~· '· -Project Manager: Adrian Heggie -- ~ tMtJ,· r:..."'illllii f 1.• !C1
tlD Collected by: (Print and Sign) Adrian Heggie c
·c Company Parsons Brinckerhoff Email [email protected] Project Info Turn Around Time 0
-~ Address 680 George Street City SYDNEY Purchase Order Number: c
0 State NSW Post Code 2000 Suburb & State: Aust Motors Keswick Normal: _YES --- I... ~ Phone: (02) 9272 5693 Fax: Project Number: 2201557c Rapid: I... ~ Q)
~ u
Proiect Name: Kelvinator Keswick ::>pec1ry: __ \aays1 I... nJ I... 0 a. -0 I...
Field Sample l.D. Date of Time of Date of 0 "'O ~ Q)
Lab ID Time of Retrieval 0 ~
I... ..c Sampler l.D Analysis Required "'O ::l 0 ~
(Location) Deolovment Deolovment Retrieval .f: 0 $ 0 AM Flux 1 685SB 15-Feb-16 16:15 4-Mar-16 13:00 VOCs tor Radtejlo SD TUI :>es AM Flux 2 686SB 15-Feb-16 16:20 4-Mar-16 13:05 Adrian's analyte suite AM Flux 3 687SB 15-Feb-16 16:35 4-Mar-16 13:10 (i.e. PB's analyte suite) AM Flux4 688SB 15-Feb-16 16:45 4-Mar-16 13:15 and C6-C10 & C10-C16 AM Flux 5 689SB 15-Feb-16 17:00 4-Mar-16 13:20 Report mass on tube for
AM Flux 6 690SB 15-Feb-16 17:15 4-Mar-16 13:25 all samples plus
AM Flux 6 dup 691SB 15-Feb-16 17:15 4-Mar-16 13:25 concentrations for
AM Flux 7 692SB 16-Feb-16 17:20 4-Mar-16 13:25 Ambient Air (AA) samples AM AAl (inside) 693SB 16-Feb-16 10:55 4-Mar-16 13:30 AM AA2 (inside) 694SB 16-Feb-16 11:00 4-Mar-16 13:35 Provide chromatograms
AM AA3 (inside) 69558 16.:Feb-16 11:05 4-Mar-16 13:40 for samples please.
AM AA3 dup (inside) 696SB 16-Feb-16 11:05 4-Mar-16 13:40
AM AA4 (outside) 697SB 16-Feb-16 · 8:40 4-Mar-16 13:45 AM AAS {outside) 69858 16-Feb-16 8:55 4-Mar-16 13:50 TRIP BLANK -··"'. 705SB ' 1• . . . ,
Relinqui~By?n~ Date/nme 7-0.3-2016 RUr'' (e 'AJ:."te/Time hJi Air Temp and Weather Description:
·-?. ~A ~ l ~ . e~CJM.- ~ /k ff\~ Relinquished By: (Signature) Date/Time Received by: (Signature) Date/Time
1
'
·'

Passive Sam le Collection
Unit 5, 18 Redland Drive M. h VIC 3132
Page_of_ 1tc am
~ Ph: (03) 9874 1988 Fax: (03} 9874 1933 I
~ "-=--=-~~ ...
111;ci::i,~1::Pr
'M*rlr• -Project Manager: Adrian Heggie Collected by: (Print and Sign) Adrian Heggie bO
c Company Parsons Brinckerhoff Email [email protected] Project Info Turn Around Time
·c 0 +J
Address 680 George Street City SYDNEY Purchase Order Number: ·c: 0
State NSW Post Code 2000 Suburb & State: Keswick SA Normal: _YES -- I- ~ Phone: (02) 9272 5693 Fax: Project Number: 2201557c Rapid: I- < QJ
u Project Name: Keswick SA Specify: __ { days) < I- ca
I-. Q a. -0 0
~ I-
Field Sample l.D. Date of Time of Date of 0 "'C I- QJ
Lab ID Sampler l.D Time of Retrieval Analysis Required "'C +J 0 ..c ::J +J
{Location) Deployment Deployment Retrieval E 0 s 0
AMSSl 1504-AN-LU-073 15-Feb-16 14:00 4-Mar-16 11:00 VOCS f.or WM~_UJ Tu~es AM SS2 1504-AN-LU-072 15-Feb-16 13:35 4-Mar-16 11:08 Adrian's analyte suite I
AM 553 1504-AN-LU-095 15-Feb-16 14:10 4-Mar-16 11:13 (i.e. PB's analyte suite) AMSS4 1504-AN-LU-096 15-Feb-16 14:20 4-Mar-16 11:20 and C6-C10 & C10-C16 AMSS5 1504-AN-LU-097 15-Feb-16 14:30 4-Mar-16 11:30 Report mass on tube
AM SS6 1504-AN-LU-098 15-Feb-16 14:40 4-Mar-16 11:35 and concentrations for
AM SS6 dup 1504-AN-LU-099 15-Feb-16 14:40 4-Mar-16 11:35 samples with known
Trip Blank 1504-AN-LU-100 uptake rates
Relinqu~ By: (Signature) Qate/Time ·7-03-2~1G R=i ey:,~gnature} Ztime <!?hAb Air Temp and Weather Description:
~ - c L~ -::-A~- ·~ ·g, G~- ~~ ll~~"'L Relinquished By: (Signat<ire) Date/Time Received by: (Signature) Date/Time / { Notes:

APPENDIX TWO
CHROMATOGRAMS

Method blank
2016008013
2016008014
6.00 7.00 8.00 9.00 10.0011.0012.0013.0014.0015.0016.0017.00
10000
20000
30000
40000
50000
60000
70000
80000
90000
100000
110000
Time-->
Abundance
TIC: H160308a_voc_082.D\ data.ms
5.00 6.00 7.00 8.00 9.00 10.00 11.00 12.00 13.00 14.00 15.00 16.00 17.00
50000
100000
150000
200000
250000
300000
350000
400000
450000
500000
550000
600000
650000
700000
Time-->
Abundance
TIC: H160308a_voc_083.D\ data.ms
5.00 6.00 7.00 8.00 9.00 10.0011.0012.0013.0014.0015.0016.0017.00
50000
100000
150000
200000
250000
300000
350000
400000
450000
Time-->
Abundance
TIC: H160308a_voc_084.D\ data.ms

2016008015
2016008016
2016008017
5.00 6.00 7.00 8.00 9.00 10.00 11.00 12.00 13.00 14.00 15.00 16.00 17.00
100000
200000
300000
400000
500000
600000
700000
800000
900000
1000000
1100000
1200000
Time-->
Abundance
TIC: H160308a_voc_085.D\ data.ms
5.00 6.00 7.00 8.00 9.00 10.00 11.00 12.00 13.00 14.00 15.00 16.00 17.00
100000
200000
300000
400000
500000
600000
700000
800000
900000
1000000
1100000
1200000
Time-->
Abundance
TIC: H160308a_voc_086.D\ data.ms
5.00 6.00 7.00 8.00 9.00 10.00 11.00 12.00 13.00 14.00 15.00 16.00 17.00
20000
40000
60000
80000
100000
120000
140000
160000
180000
200000
220000
240000
260000
280000
300000
320000
340000
Time-->
Abundance
TIC: H160308a_voc_087.D\ data.ms

2016008018
2016008019
2016008020
5.00 6.00 7.00 8.00 9.00 10.00 11.00 12.00 13.00 14.00 15.00 16.00 17.00
20000
40000
60000
80000
100000
120000
140000
160000
180000
200000
220000
240000
260000
280000
300000
320000
340000
Time-->
Abundance
TIC: H160308a_voc_087.D\ data.ms
5.00 6.00 7.00 8.00 9.00 10.00 11.00 12.00 13.00 14.00 15.00 16.00 17.00
1000000
2000000
3000000
4000000
5000000
6000000
7000000
8000000
9000000
1e+07
1.1e+07
1.2e+07
Time-->
Abundance
TIC: H160308a_voc_089.D\ data.ms
5.00 6.00 7.00 8.00 9.00 10.0011.0012.0013.0014.0015.0016.0017.00
100000
200000
300000
400000
500000
600000
700000
800000
Time-->
Abundance
TIC: H160308a_voc_090.D\ data.ms

2016008021
2016008022
2016008023
5.00 6.00 7.00 8.00 9.00 10.0011.0012.0013.0014.0015.0016.0017.00
100000
200000
300000
400000
500000
600000
700000
800000
Time-->
Abundance
TIC: H160308a_voc_091.D\ data.ms
6.00 7.00 8.00 9.00 10.00 11.00 12.00 13.00 14.00 15.00 16.00 17.00
100000
200000
300000
400000
500000
600000
700000
800000
900000
1000000
1100000
Time-->
Abundance
TIC: H160308a_voc_092.D\ data.ms
6.00 7.00 8.00 9.00 10.00 11.00 12.00 13.00 14.00 15.00 16.00 17.00
100000
200000
300000
400000
500000
600000
700000
800000
900000
1000000
1100000
Time-->
Abundance
TIC: H160308a_voc_092.D\ data.ms

2016008024
2016008025
2016008026
5.00 6.00 7.00 8.00 9.00 10.0011.0012.0013.0014.0015.0016.0017.00
1000000
2000000
3000000
4000000
5000000
6000000
7000000
Time-->
Abundance
TIC: H160308a_voc_094.D\ data.ms
5.00 6.00 7.00 8.00 9.00 10.00 11.00 12.00 13.00 14.00 15.00 16.00 17.00
500000
1000000
1500000
2000000
2500000
3000000
3500000
4000000
4500000
5000000
5500000
6000000
Time-->
Abundance
TIC: H160308a_voc_095.D\ data.ms
5.00 6.00 7.00 8.00 9.00 10.0011.0012.0013.0014.0015.0016.0017.00
1000000
2000000
3000000
4000000
5000000
6000000
7000000
Time-->
Abundance
TIC: H160308a_voc_096.D\ data.ms

2016008027
6.00 7.00 8.00 9.00 10.0011.0012.0013.0014.0015.0016.0017.00
10000
20000
30000
40000
50000
60000
70000
80000
90000
100000
110000
120000
Time-->
Abundance
TIC: H160308a_voc_097.D\ data.ms

Appendix G
SURVEY OF NEWLY INSTALLED WELLS

7th March 2016 Our Ref: A036214.00PB Allotment 1 Anzac Hwy, Keswick Survey of Ground Water Wells Point Easting Northing Elevation Natural Description Number Surface KMW1D 278752.35 6130316.36 26.814 26.86 Ground water well KMW4 278782.67 6130369.43 26.769 26.84 Ground water well KMW5 278754.78 6130358.54 26.722 26.76 Ground water well KMW6 278744.76 6130404.26 26.194 26.17 Ground water well KMW7 278694.39 6130335.20 26.382 26.44 Ground water well Note: Coordinates are based on MGA 94 Grid, Zone 54 Elevations are based on AHD. Well Elevations refer to top of PVC pipe. Field surveyed on 01/03/2016. Please do not hesitate to contact me if you require any further information relating to the above. Yours faithfully ALEXANDER & SYMONDS PTY. LTD. BRENTON CARN Licensed Surveyor

Appendix H
PHOTOGRAPHS

Photograph 1. Drilling KMW1d in Ashford Road
Photograph 2. Drilling KMW1d in Ashford Road

Photograph 3. NHP property. Well KMW5 is located behind the steel picket fence in foreground
Photograph 4. Explorer Coachlines property. Well KMW7 is located at the end of the concrete

Photograph 5. Northern portion of the Australian Motors warehouse looking south. AM Flux 1 is near the left hand wall
Photograph 6. Northern portion of the Australian Motors warehouse looking south. AM Flux 6 is located between cars at the central yellow marked pole.