groundwater chemistry in faryab river water provides...
TRANSCRIPT

NORPLAN Course 2.1. Hydrochemical data interpretation.
Lecture 8
June 2014
David Banks, Holymoor Consultancy Ltd. / NORPLAN 1
Groundwater chemistry in Faryabby: David Banks, Hydrogeologist and thermogeologist
NORAD supported project in MRRD:Capacity Building and Institutional Cooperation in the field of Hydrogeology for Faryab
Province , Afghanistan
NORPLAN
River water provides clear evidence
of evapoconcentration
Maimana River
0
100
200
300
400
500
600
700
800
0.00 0.02 0.04 0.06 0.08 0.10 0.12 0.14 0.16Latitude north from origin (°)
Ele
ctr
ica
l co
nd
uc
tiv
ity
- fi
eld
(µ
S/
cm)
0
0.2
0.4
0.6
0.8
1
1.2
1.4
1.6
1.8
2
2.2
2.4
Dis
cha
rge
(m
3/s
)
Electrical conductivity (µS/cm) Discharge (m3/s)
River water provides clear
evidence of
evapoconcentration
River water provides clear
evidence of
evapoconcentration
Maimana River
0.9
1
1.1
1.2
1.3
1.4
1.5
1.6
1.7
0 0.02 0.04 0.06 0.08 0.1 0.12 0.14 0.16
Latitude north from origin (°)
Co
nce
ntr
ati
on
fa
cto
r
Ca
Mg
Na
K
Cl
SO4
Br
Sr
Li
B
As
Se
U
Cl
Na
Br
SO4
Mg
Sr
B
Se
U
Li
K
Ca
As
Maimana River
-8.2
-8.1
-8.0
-7.9
-7.8
-7.7
-7.6
-7.5
0.00 0.02 0.04 0.06 0.08 0.10 0.12 0.14 0.16
Latitude from origin (north)
δ1
8O
(‰
)
-47.8
-47.6
-47.4
-47.2
-47
-46.8
-46.6
-46.4
-46.2
δ2
H (
‰)
Maimana δ18O Maimana δ2H

NORPLAN Course 2.1. Hydrochemical data interpretation.
Lecture 8
June 2014
David Banks, Holymoor Consultancy Ltd. / NORPLAN 2
and stable isotopes provide clear evidence
of evapoconcentration
-80
-75
-70
-65
-60
-55
-50
-45
-40
-11 -10 -9 -8 -7 -6
δ18O (‰)
δ2
H (
‰)
Shirin Tagab River
Maimana River
Andkhoi groundwater
Bilchiragh groundwater
Gurziwan groundwater
Khani Chahar Baghgroundwater
Kohistan groundwater
Qaramqol groundwater
Qaysar groundwater
Qurgan groundwater
Shirin Tagab
River
Maimana River
Maimana
rainfall
Evaporation
Salinity
Salinity profiles appear
to show potential for
infiltration of fresher
river water into aquifers
...and this is confirmed by maps
Maimana area
Islam Qala area
Arsenic (As)
Only a single sample from Faryab exceededthe WHO (2011) guideline of 10 µg/L,from Khani Chahar Bagh district. Thenext highest concentration is a singlesample at 5.1 µg/L in Qurgan district.
There is a slight tendency to increasingconcentrations of arsenic ingroundwater to the north.
Arsenic
EC 1998 Directive:< 10 µg/L
WHO (2011): Provisional guideline< 10 µg/L
25-percentile in Faryab = 0.46 µg/L (N=132)
50-percentile in Faryab = 0.70 µg/L (N=132)
90-percentile in Faryab = 1.31 µg/L (N=132)
NORPLAN Course 2.1. Hydrochemical data interpretation.
Lecture 8
June 2014
David Banks, Holymoor Consultancy Ltd. / NORPLAN 3
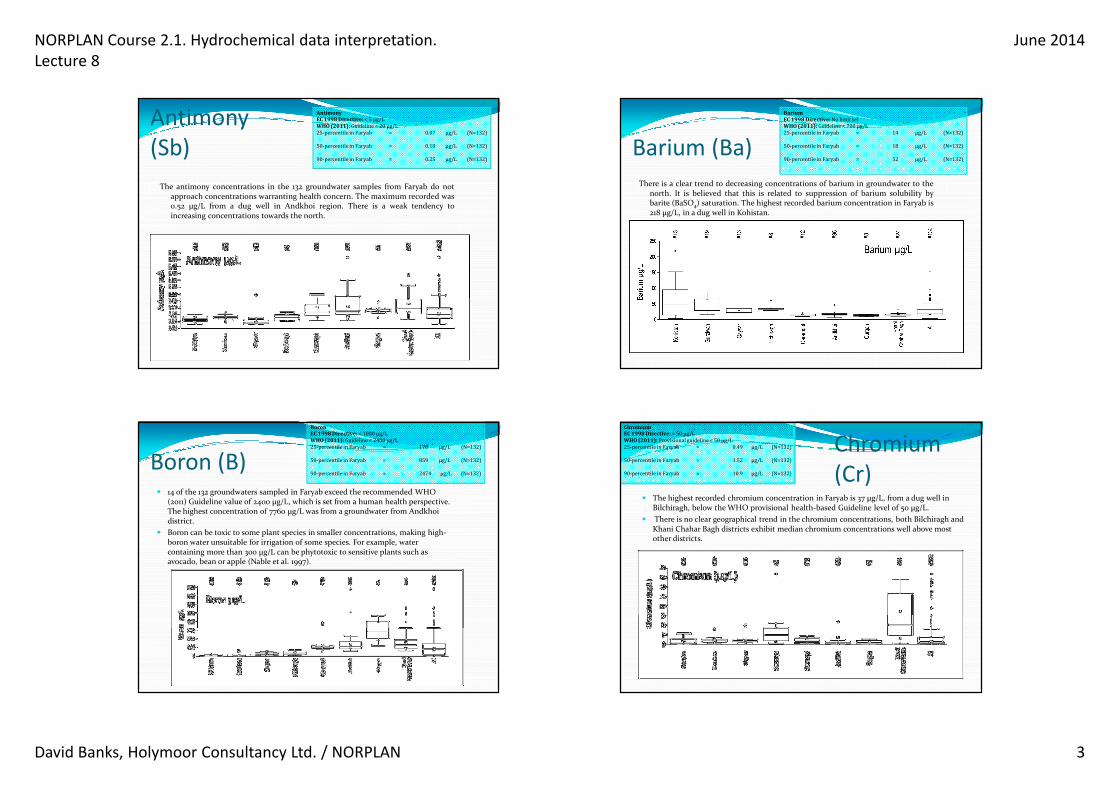
Antimony
(Sb)
The antimony concentrations in the 132 groundwater samples from Faryab do notapproach concentrations warranting health concern. The maximum recorded was0.52 µg/L from a dug well in Andkhoi region. There is a weak tendency toincreasing concentrations towards the north.
Antimony
EC 1998 Directive:< 5 µg/L
WHO (2011): Guideline < 20 µg/L
25-percentile in Faryab = 0.07 µg/L (N=132)
50-percentile in Faryab = 0.10 µg/L (N=132)
90-percentile in Faryab = 0.25 µg/L (N=132)Barium (Ba)
There is a clear trend to decreasing concentrations of barium in groundwater to thenorth. It is believed that this is related to suppression of barium solubility bybarite (BaSO4) saturation. The highest recorded barium concentration in Faryab is218 µg/L, in a dug well in Kohistan.
Barium
EC 1998 Directive:No limit set
WHO (2011): Guideline < 700 µg/L
25-percentile in Faryab = 14 µg/L (N=132)
50-percentile in Faryab = 18 µg/L (N=132)
90-percentile in Faryab = 52 µg/L (N=132)
Boron (B)� 14 of the 132 groundwaters sampled in Faryab exceed the recommended WHO
(2011) Guideline value of 2400 µg/L, which is set from a human health perspective. The highest concentration of 7760 µg/L was from a groundwater from Andkhoi district.
� Boron can be toxic to some plant species in smaller concentrations, making high-boron water unsuitable for irrigation of some species. For example, water containing more than 300 µg/L can be phytotoxic to sensitive plants such as avocado, bean or apple (Nable et al. 1997).
Boron
EC 1998 Directive:< 1000 µg/L
WHO (2011): Guideline < 2400 µg/L
25-percentile in Faryab = 178 µg/L (N=132)
50-percentile in Faryab = 859 µg/L (N=132)
90-percentile in Faryab = 2474 µg/L (N=132)
Chromium
(Cr)� The highest recorded chromium concentration in Faryab is 37 µg/L, from a dug well in
Bilchiragh, below the WHO provisional health-based Guideline level of 50 µg/L.
� There is no clear geographical trend in the chromium concentrations, both Bilchiragh and Khani Chahar Bagh districts exhibit median chromium concentrations well above most other districts.
Chromium
EC 1998 Directive:< 50 µg/L
WHO (2011): Provisional guideline< 50 µg/L
25-percentile in Faryab = 0.49 µg/L (N=132)
50-percentile in Faryab = 1.52 µg/L (N=132)
90-percentile in Faryab = 10.9 µg/L (N=132)
NORPLAN Course 2.1. Hydrochemical data interpretation.
Lecture 8
June 2014
David Banks, Holymoor Consultancy Ltd. / NORPLAN 4
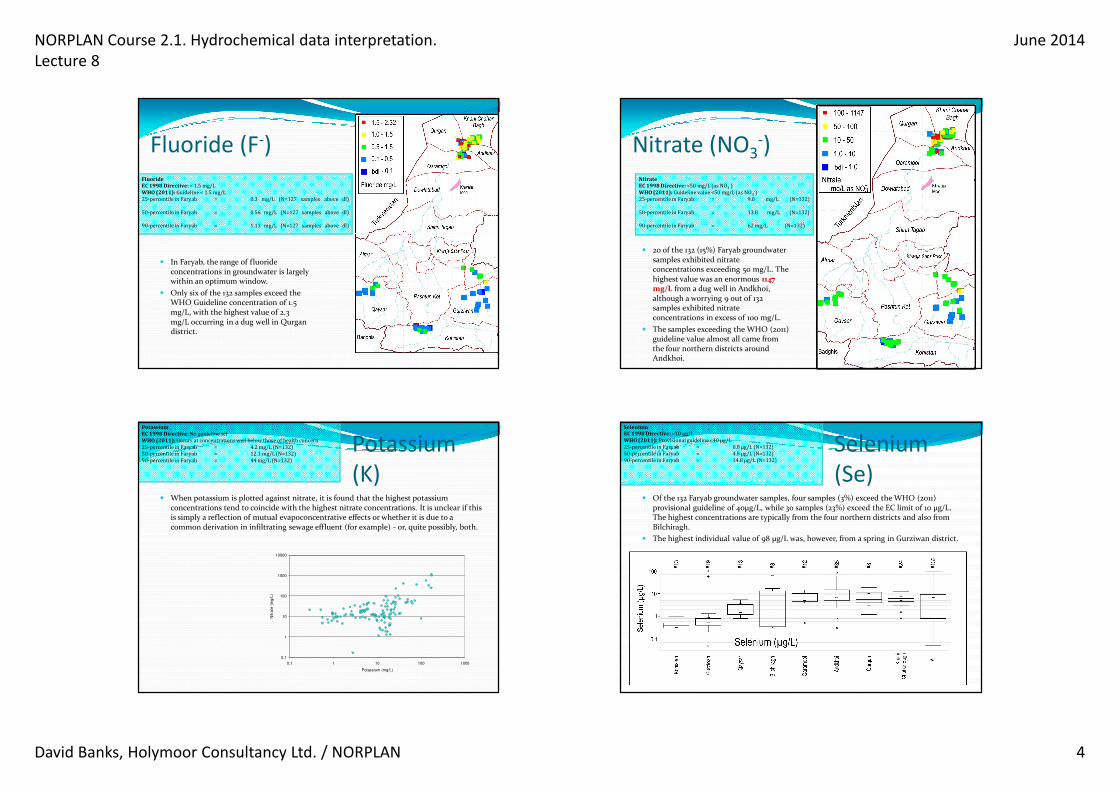
Fluoride (F-)
� In Faryab, the range of fluoride concentrations in groundwater is largely within an optimum window.
� Only six of the 132 samples exceed the WHO Guideline concentration of 1.5 mg/L, with the highest value of 2.3 mg/L occurring in a dug well in Qurgandistrict.
Fluoride
EC 1998 Directive:< 1.5 mg/L
WHO (2011): Guideline < 1.5 mg/L
25-percentile in Faryab = 0.3 mg/L (N=127 samples above dl)
50-percentile in Faryab = 0.56 mg/L (N=127 samples above dl)
90-percentile in Faryab = 1.13 mg/L (N=127 samples above dl)
Nitrate (NO3-)
� 20 of the 132 (15%) Faryab groundwater samples exhibited nitrate concentrations exceeding 50 mg/L. The highest value was an enormous 1147 mg/L from a dug well in Andkhoi, although a worrying 9 out of 132 samples exhibited nitrate concentrations in excess of 100 mg/L.
� The samples exceeding the WHO (2011) guideline value almost all came from the four northern districts around Andkhoi.
Nitrate
EC 1998 Directive:<50 mg/L (as NO3-)
WHO (2011): Guideline value <50 mg/L (as NO3-)
25-percentile in Faryab = 9.0 mg/L (N=132)
50-percentile in Faryab = 13.8 mg/L (N=132)
90-percentile in Faryab = 62mg/L (N=132)
Potassium
(K)� When potassium is plotted against nitrate, it is found that the highest potassium
concentrations tend to coincide with the highest nitrate concentrations. It is unclear if this is simply a reflection of mutual evapoconcentrative effects or whether it is due to a common derivation in infiltrating sewage effluent (for example) - or, quite possibly, both.
0.1
1
10
100
1000
10000
0.1 1 10 100 1000
Potassium (mg/L)
Nitr
ate
(m
g/L
)
Potassium
EC 1998 Directive:No guideline set
WHO (2011): Occurs at concentrationswell below those of health concern
25-percentile in Faryab = 4.2mg/L (N=132)
50-percentile in Faryab = 12.1 mg/L (N=132)
90-percentile in Faryab = 44mg/L (N=132)
Selenium
(Se)� Of the 132 Faryab groundwater samples, four samples (3%) exceed the WHO (2011)
provisional guideline of 40µg/L, while 30 samples (23%) exceed the EC limit of 10 µg/L. The highest concentrations are typically from the four northern districts and also from Bilchiragh.
� The highest individual value of 98 µg/L was, however, from a spring in Gurziwan district.
Selenium
EC 1998 Directive:<10 µg/L
WHO (2011): Provisional guideline<40 µg/L
25-percentile in Faryab = 0.8 µg/L (N=132)
50-percentile in Faryab = 4.8 µg/L (N=132)
90-percentile in Faryab = 14.8 µg/L (N=132)
NORPLAN Course 2.1. Hydrochemical data interpretation.
Lecture 8
June 2014
David Banks, Holymoor Consultancy Ltd. / NORPLAN 5
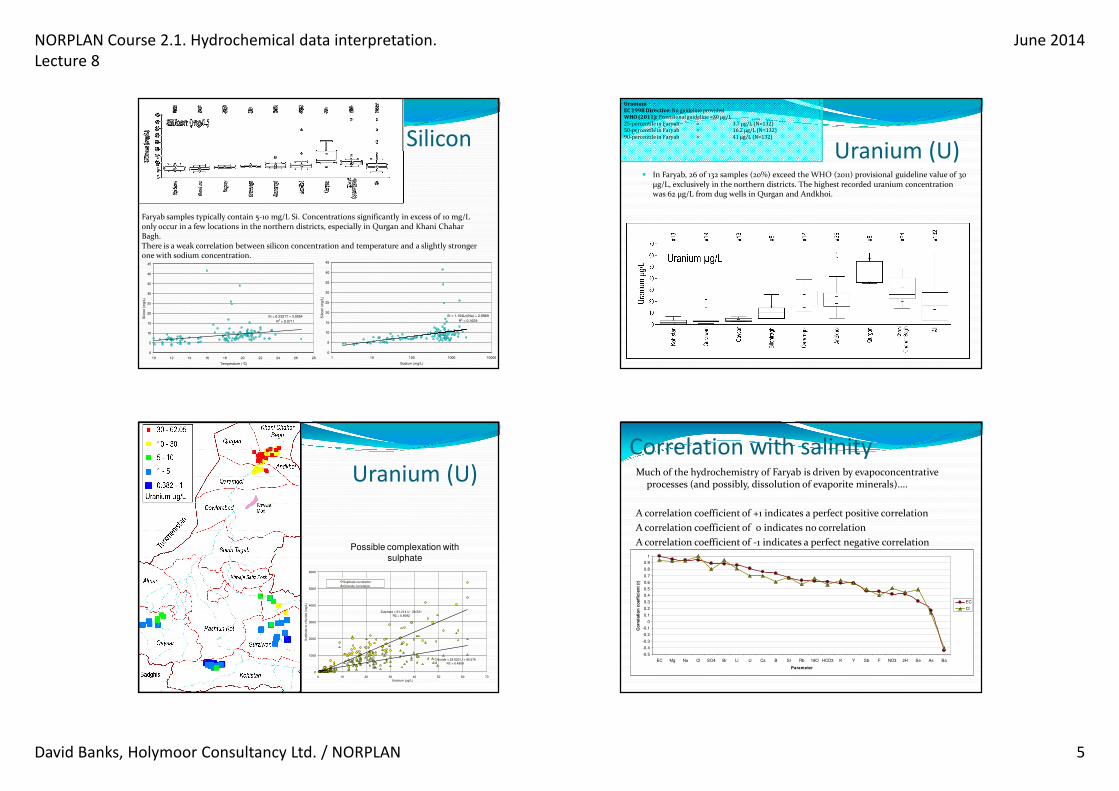
Silicon
Si = 0.3321T + 3.0054
R2 = 0.0711
0
5
10
15
20
25
30
35
40
45
10 12 14 16 18 20 22 24 26 28
Temperature (°C)
Sili
con (
mg
/L)
Si = 1.104Ln(Na) + 2.9869
R2 = 0.1629
0
5
10
15
20
25
30
35
40
45
1 10 100 1000 10000
Sodium (mg/L)
Sili
con (
mg
/L)
Faryab samples typically contain 5-10 mg/L Si. Concentrations significantly in excess of 10 mg/L only occur in a few locations in the northern districts, especially in Qurgan and Khani ChaharBagh.There is a weak correlation between silicon concentration and temperature and a slightly stronger one with sodium concentration.
Uranium (U)� In Faryab, 26 of 132 samples (20%) exceed the WHO (2011) provisional guideline value of 30
µg/L, exclusively in the northern districts. The highest recorded uranium concentration was 62 µg/L from dug wells in Qurgan and Andkhoi.
Uranium
EC 1998 Directive:No guidelineprovided
WHO (2011): Provisional guideline<30 µg/L
25-percentile in Faryab = 3.7 µg/L (N=132)
50-percentile in Faryab = 16.2 µg/L (N=132)
90-percentile in Faryab = 41 µg/L (N=132)
Uranium (U)
Sulphate = 61.214 U - 28.521
R2 = 0.8092
Chloride = 23.623 U + 95.576
R2 = 0.4909
0
1000
2000
3000
4000
5000
6000
0 10 20 30 40 50 60 70Uranium (µg/L)
Su
lph
ate
or
ch
lori
de
(m
g/L
)
Sulphate correlation
Chloride correlation
Possible complexation with sulphate
Correlation with salinityMuch of the hydrochemistry of Faryab is driven by evapoconcentrative
processes (and possibly, dissolution of evaporite minerals)....
A correlation coefficient of +1 indicates a perfect positive correlation
A correlation coefficient of 0 indicates no correlation
A correlation coefficient of -1 indicates a perfect negative correlation
-0.5
-0.4
-0.3
-0.2
-0.1
0
0.1
0.2
0.3
0.4
0.5
0.6
0.7
0.8
0.9
1
EC Mg Na Cl SO4 Br Li U Ca B Sr Rb 18O HCO3 K Y Sb F NO3 2H Se As Ba
Parameter
Co
rrela
tio
n c
oeff
icie
nt
(r)
EC
Cl