groundwater compartmentalisation: a water table height … · groundwater compartmentalisation: a...
TRANSCRIPT

Hydrology and Earth System Sciences, 10, 49–64, 2006www.copernicus.org/EGU/hess/hess/10/49/SRef-ID: 1607-7938/hess/2006-10-49European Geosciences Union
Hydrology andEarth System
Sciences
Groundwater compartmentalisation: a water table height andgeochemical analysis of the structural controls on the subdivision ofa major aquifer, the Sherwood Sandstone, Merseyside, UK
E. A. Mohamed and R. H. Worden
Department of Earth and Ocean Sciences, University of Liverpool, 4, Brownlow Street, Liverpool, L69 3GP, UK
Received: 19 April 2005 – Published in Hydrology and Earth System Sciences Discussions: 10 June 2005Revised: 26 October 2005 – Accepted: 3 December 2005 – Published: 8 February 2006
Abstract. Compartmentalisation, the subdivision of anaquifer into discrete and relatively isolated units, may beof critical importance for the protection of groundwater al-though it has been largely ignored in the groundwater litera-ture. The Lower Triassic Sherwood Sandstone, in north westof England, UK, may be a good example of an aquifer thathas been compartmentalised by numerous high angle faultswith displacements of up to 300 m. The study was initiatedto assess the local groundwater flow, the extent of seawaterinvasion and the controls on recharge in the aquifer and totry to understand whether the aquifer is broken into discretecompartments.
Maps and schematic cross-sections of groundwater headsfor the years 1993, and 2002 were prepared to trace anystructural controls on the groundwater heads across the area.Studying the contour maps and cross sections revealed that:1) there are substantial differences in groundwater headacross some of the NNW-SSE trending faults implying thatgroundwater flow is strongly limited by faults, 2) an anticlinein the east of the area acts as a groundwater divide and 3) thegroundwater head seems to follow the topography in someplaces, although steep changes in groundwater head occuracross faults showing that they locally control the ground-water head. The aquifer was thus provisionally subdividedinto several hydrogeological sub-basins based on groundwa-ter head patterns and the occurrence of major structural fea-tures (faults and a fold).
Using groundwater geochemistry data, contour maps ofchloride and sulphate concentration largely support the struc-tural sub-division of the area into hydrogeological sub-basins. Scrutiny of groundwater geochemical data, averagedfor each sub-basin, confirmed the degree of compartmental-isation and the occurrence of sealed faults. The variation ofthe geochemical composition of the groundwater not only re-
Correspondence to:E. A. Mohamed([email protected])
lates to the different, localised geochemical processes andseawater intrusion but also relates to compartmentalisationdue to faulting. Faults have limited the degree of mixingbetween the groundwater types thus retaining the specificcharacteristics of each sub-basin. Highly localised seawa-ter intrusion is mainly controlled by low permeability faultclose to the Irish Sea and Mersey estuary. There is effec-tively no invasion of seawater beyond the faults that lie clos-est to the coastline. Freshwater recharge to the aquifer seemsto be highly localised and mainly occurs by vertical percola-tion of rain and surface water rather than whole aquifer-scalegroundwater flow. This study provides a detailed understand-ing of the groundwater flow processes in Liverpool as an ex-ample of methods can be applied to groundwater manage-ment elsewhere.
1 Introduction
Groundwater locally provides more than 75% of public wa-ter supply in the UK and>35% in England and Wales as awhole. Protecting groundwater supplies is important in in-dustrialised areas; understanding recharge and how, and inwhat direction, water moves within an aquifer are importantsteps in developing long term practical strategies. There-fore, much work has focused on the protection of water sup-plies by determining the areas contributing recharge to water-supply wells and by specifying regulations to minimize theopportunity for contamination of the recharge water by ac-tivities at the land surface (Reilly and Pollock, 1993). Akey issue in this study is the degree of aquifer subdivision,known as compartmentalisation, into discrete portions sepa-rated by low permeability barriers. Compartmentalisation inaquifers may be a result of faulting where fault zones typi-cally have low permeability due to a combination of catacla-sis and entrainment of clay minerals on the fault plane result-ing in fault gouge. The thickness and degree of permeability
© 2006 Author(s). This work is licensed under a Creative Commons License.
50 E. A. Mohamed and R. H. Worden: Groundwater compartmentalisation of major aquifer
Ormiskirk Sandstone Fm
Wilmslow Fm
Chester Pebble Fm Sher
woo
d Sa
ndst
one
Tria
ssic
Dip
Mercia Mudstone
Manchester Marl Fm
Collyhurst Fm Perm
ian
Carboniferous
Fault line Fold
The studyarea
Permian & TriassicSandstones
0 5km
0
Croxte th fault
Ecc
lest
one
faul
tCross fault
Crosby fault
Kirkdale fault
River Mersey
Liverpool
Liverpool
Bay
4
Ince Blundell fault
Wirral
Boun
dary
fau
lt
Hillhouse fault
C
A
Knowsley Antic
line
Litherland fault
Formby
Cro
xtet
h fa
ult
8
13 5
Figure 1 (new version)
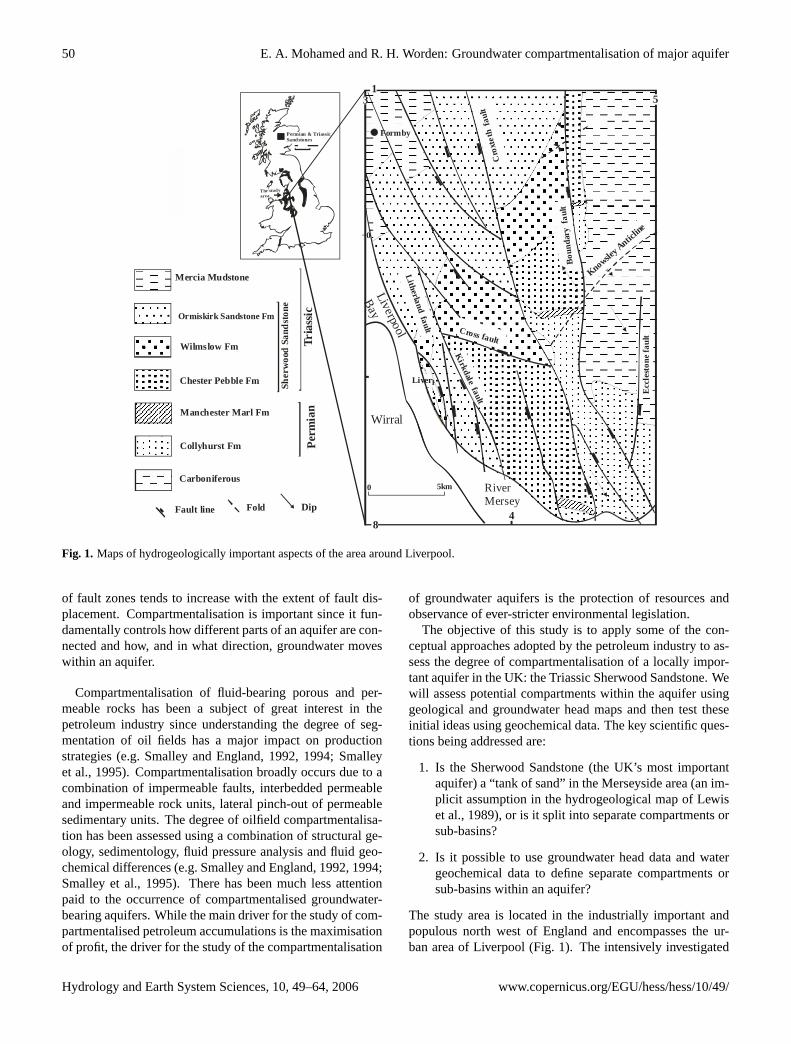
Fig. 1. Maps of hydrogeologically important aspects of the area around Liverpool.
of fault zones tends to increase with the extent of fault dis-placement. Compartmentalisation is important since it fun-damentally controls how different parts of an aquifer are con-nected and how, and in what direction, groundwater moveswithin an aquifer.
Compartmentalisation of fluid-bearing porous and per-meable rocks has been a subject of great interest in thepetroleum industry since understanding the degree of seg-mentation of oil fields has a major impact on productionstrategies (e.g. Smalley and England, 1992, 1994; Smalleyet al., 1995). Compartmentalisation broadly occurs due to acombination of impermeable faults, interbedded permeableand impermeable rock units, lateral pinch-out of permeablesedimentary units. The degree of oilfield compartmentalisa-tion has been assessed using a combination of structural ge-ology, sedimentology, fluid pressure analysis and fluid geo-chemical differences (e.g. Smalley and England, 1992, 1994;Smalley et al., 1995). There has been much less attentionpaid to the occurrence of compartmentalised groundwater-bearing aquifers. While the main driver for the study of com-partmentalised petroleum accumulations is the maximisationof profit, the driver for the study of the compartmentalisation
of groundwater aquifers is the protection of resources andobservance of ever-stricter environmental legislation.
The objective of this study is to apply some of the con-ceptual approaches adopted by the petroleum industry to as-sess the degree of compartmentalisation of a locally impor-tant aquifer in the UK: the Triassic Sherwood Sandstone. Wewill assess potential compartments within the aquifer usinggeological and groundwater head maps and then test theseinitial ideas using geochemical data. The key scientific ques-tions being addressed are:
1. Is the Sherwood Sandstone (the UK’s most importantaquifer) a “tank of sand” in the Merseyside area (an im-plicit assumption in the hydrogeological map of Lewiset al., 1989), or is it split into separate compartments orsub-basins?
2. Is it possible to use groundwater head data and watergeochemical data to define separate compartments orsub-basins within an aquifer?
The study area is located in the industrially important andpopulous north west of England and encompasses the ur-ban area of Liverpool (Fig. 1). The intensively investigated
Hydrology and Earth System Sciences, 10, 49–64, 2006 www.copernicus.org/EGU/hess/hess/10/49/

E. A. Mohamed and R. H. Worden: Groundwater compartmentalisation of major aquifer 51
Table 1. Regional stratigraphy of the bedrock underlying Liverpool and Greater Merseyside. Adapted from University of Birmingham, 1984and Tellam, 1994.
System Stage Lithostratigraphical Division Previous Division Thickness m Hydrogeological characters
QuaternaryFlandrian
Soil
1>−35 AquicludeAlluvium
Terrace deposits (sands and gravels)Shirdley Hill Sand Formation (blown sand)
Devensian Stockport Formation (till with glacial sands) 10–50 Aquiclude
Triassic
AnisianMersey Mudstone Mudstone unit Keuper Marl 405 Aquiclude
Group Tarporley Siltstone Fm Keuper Waterstone 30–60 Aquiclude
Scythian Sherwood Sandstone
Ormskirk Sandstone Fm Keuper Sandstone 181–295 Aquifer
Group
Wilmslow Sandstone Fm U. Mottled Sandstone 205–480 Aquifer
Chester Pebble Beds Fm.Bunter Pebble Beds
316–375 AquiferPebble Beds Unit
L. Mottled Sandstone Unit L. Mottled Sandstone 0–>80 Aquifer
PermianUpper Bold/Manchester Marl Fm Manchester Marl 10–225 Mixed aquifer-aquiclude
Lower Collyhurst Sandstone Fm Collyhurst Sandstone 283–720 Aquifer
Carboniferous Westphalian Stages A–D >1500 Aquiclude
area extends from Widnes to Liverpool and as far north asFormby.
Despite the local and national importance of the SherwoodSandstone aquifer, few previous studies substantially men-tioned the roles of lithology and geological structure as con-trols on groundwater geochemistry.
The occurrence and movement of groundwater in the dis-trict were discussed by Stephenson (1850) including the im-portance of fissures and the fact that there was a finite amountgroundwater. He also recognized the occurrence of seawa-ter intrusion into the aquifer. The role of regional topogra-phy as a control on groundwater contours for the Sherwoodaquifer (in the east of England) was discussed by Strahan inHull (1882). Significantly, Morton (1866) discussed the loca-tion of wells as a possible control on yield and water qualityand concluded that the highest yielding wells were locatedon faults. In contrast, Moore (1902) examined the porosityacross a fault plane in the Sherwood Sandstone aquifer on theadjacent Wirral peninsula, just southwest of the area of inter-est, and concluded that porosity-reduction occurred acrossfault planes since they were cemented by calcite and pyrite.Also a porosity-occluding clay-rich fault gouge was found intwo zones up to 0.5 m thick.
The Mersey Railway Tunnel, excavated through theaquifer, connects the Liverpool area to the Wirral (essentiallythe industrial town of Birkenhead) and it was recorded thatabstraction from the tunnel led to deterioration of groundwa-ter quality (Wedd et al., 1923).
The hydrogeology of the Sherwood Sandstone aquifer inthe Merseyside and Manchester areas was described in re-
ports for the Geological Survey by Taylor (1957) and Land(1964). Both authors presented maps with groundwater con-tours. The high degree of faulting in the aquifer and its pos-sible importance for internal boundaries occurring within thePermo-Triassic aquifer was noted by University of Birming-ham (1981). In an assessment of the saline intrusion intothe Sherwood Sandstone aquifer it was suggested that wher-ever fault movement was small the effect on the transmis-sivity might be small depending on the nature of the faultzone (University of Birmingham, 1984). Large displace-ment, however, may juxtapose impermeable strata againstpermeable strata leading to a significant local reduction ofthe effective hydraulic conductivity. Just outside of the stud-ied area, the Roaring Meg fault has low permeability and re-stricts saline groundwater movement (Tellam et al., 1986).However the published synthetic hydrogeological map of thearea has groundwater head contours that ignore all faultsand has seemingly been drawn on the assumption that theaquifer is not sub-divided into compartments (Lewis et al.,1989). Barker (1996) investigated the geochemistry and iso-tope of the saline-freshwater mixing zone beneath Liverpooland stated that the change in groundwater chemistry was dueto the presence of the fault and implies that it acts as a hydro-logical barrier to groundwater flow.
The main objectives of this study will be focused on therole of the structural geology of the area explicitly trying toestablish the impact of faults on groundwater conditions us-ing records of groundwater head and geochemistry variationsover the period 1993 to 2002.
www.copernicus.org/EGU/hess/hess/10/49/ Hydrology and Earth System Sciences, 10, 49–64, 2006

52 E. A. Mohamed and R. H. Worden: Groundwater compartmentalisation of major aquifer
RiverMersey
Liverpool
Bay
Wirral
( )a
3040
50
60
60
5040
7060
5040
40
60
70
80
70
70
4030
20
505060
40
70
10
20
10
4030
3
Formby
83
Liverpool9
0
60
10
0 5km
4
0 5km
4
9
RiverMersey
N
8
0
10
5( b )
Wirrel
Formby
Sampledwells
locations
Cro
xteth
fault
Ecc
lest
on
eW
est
fau
lt
Crosby
fault
Kirkdale
fault
Boundar
yfa
ult
Lith
erland
fault
Kno
wsley
Ant
iclin
e
Kingsw
ayfault
Cross fault
3
5 3
Fig. 2. (a)Topographic map with contours in meters,(b) Distribution of boreholes across the aquifer for which data have been used. Noticethe location of faults and the boreholes distribution.
2 Geology
2.1 General geology
Permo-Triassic sedimentary rocks represent the principleaquifer units in the area. The regional stratigraphy is rep-resented in Table 1 with the regional distribution of rocksat the surface given in Fig. 1. Permo-Triassic sedimentaryrocks rest unconformably over Upper Carboniferous well-indurated sandstones and mudstones that are typically con-sidered to denote the low permeability base of the aquifer.These older rock units crop out in the east and north east ofthe area (Fig. 1).
The Permo-Triassic sedimentary succession starts with theCollyhurst Sandstone Formation, which is red to grey incolour and fine to medium grained. The stratigraphically-equivalent Manchester Marl and Bold Formations con-formably overlie the Collyhurst Sandstones. The ManchesterMarl, in the north, is composed of calcareous siltstone orshale with thin bands of fossiliferous limestone, while theBold Formation, in the south, is made up of fine to very fine-grained sandstones.
The major sandstone-dominated unit that represents thebulk of the aquifer in the area, the Sherwood SandstoneGroup, overlies the Manchester Marl and Bold Formations.The base of this group is the Chester Pebble Formation. This
formation is made up of two units; the Lower Mottled Sand-stone Unit, composed of red and brown, fine to mediumgrained weakly cemented sandstone, followed by the Peb-ble Beds Unit, composed of red or yellow, cross laminated,coarse to medium grained pebbly sandstones. The overly-ing Wilmslow Sandstone Formation is characterised by soft,fine-grained sandstones. The Ormskirk Sandstone Formationhas two lithological units; a lower one directly overlying theWilmslow Formation consists of greyish-yellow to red sand-stone and upper one composed of medium and fine grainedsandstone.
The Upper Triassic Mercia Mudstone Formation, a majorargillaceous sequence overlying the Sherwood Sandstone, isconsidered to be the upper low-permeability boundary of theentire aquifer. It is composed of two units: the lower one be-ing the Tarporly Siltstone and the upper one being the MerciaMudstone.
The Quaternary system represents a very short length ofgeological time and is characterised in the area by a restricteddepositional thickness, which nevertheless is of hydrogeo-logical significance. Thicknesses of 5 to 10 m are com-mon, but significant parts of the area are without Quaternarycover (e.g. Liverpool, Kirkby, and Ormskirk; University ofBirmingham, 1984). Lithologically, these deposits are domi-nated by glacial tills and sands followed by well-sorted sands
Hydrology and Earth System Sciences, 10, 49–64, 2006 www.copernicus.org/EGU/hess/hess/10/49/

E. A. Mohamed and R. H. Worden: Groundwater compartmentalisation of major aquifer 53
0 5km
Wirral0
5
10
15
0
-5
-15
20
25
2515
10
5
30
35
10
3
0
48
3
Formby
Liverpool9
Liverp
ool
bay
A A`
B
B`
C C`
b ) Water table map2002
.b.
RiverMersey
5
0
-5
-10
-5
40
30
5
20
0
9
a ) Water table map1993
.
0 5km
RiverMersey
0
15
10
2530
15
10
5
20
25
0
-5-10
0
10
3
0
48
3
Wirral
Liverpool
Liverp
ool
bay
AA`
B
B`
CC`
Formby
5
-5
-5
5
Fig. 3. Water table height in meters relative to the ordinance datum (OD, mean annual sea level);(a) 1993, and(b) 2002. Contouring wasbased on the assumption employed during the drafting of the published hydrogeological map (Lewis et al., 1989) that the aquifer was auniform entity with no sub-compartments.
locally intercalated with peat beds. River alluvium of silt,sand and clay has mainly developed in the valley of the RiverAlt, where the recent estuarine alluvium of sand, silt and mudoccurs (University of Birmingham, 1984; Tellam, 1994).
2.2 Structural geology
The structural geology of the area is dominated by a varietyof faults as represented on published geological maps andcross sections from the British Geological Survey (and itspredecessors) and other published work (e.g. Morton, 1866;Wedd et al., 1923; Shackleton, 1953; University of Birming-ham, 1984).
Although faults dominate the geological structure fromthe hydrogeological perspective (Fig. 1), there is also a sub-tle low amplitude fold with its axis running approximatelynortheast to southwest. This fold is known as the Knowsleyanticline (Fig. 1) and it results in a general, low angle north-west dip over the northern part of the study area and south-east dip in the vicinity of Halewood, Speke and Widnes.There are other small syn- and anti-forms to the north of theKnowsley anticline but they have a very limited effect on thegeneral dip of the strata.
The area is intensively disrupted by numerous large faults.These generally trend north-northwest – south-southeast
with some smaller east-west cross faults. The faults are nor-mal with an average 60◦ dip (Jones et al., 1938). The throwsof these faults vary from a few meters to>300 m. Examplesof faults with large displacements are the Boundary fault, theCroxteth fault and the Eccleston West fault (Tellam, 1983;and Fig. 1). In the Sherwood Sandstone in the north ofEngland, there is a correlation between degree of displace-ment and fault zone thickness. Fault zones may either befilled with gouge or cataclasite depending on the lithologieson both side of the fault; some of the greatest faults in thearea are likely to have potentially impermeable fault zonesof >1 m thickness (e.g. Beach et al., 1997; Chadwick, 1997;Cowan, 1996; Rowe and Burley, 1997). These major faults(e.g. the Croxteth fault) have been implicated in controllingthe occurrence of minor shallow petroleum accumulation tothe north of the study area (Kent, 1948; Lees and Taitt, 1945)with the suggestion that the fault zones are effectively imper-meable. The faults that seem to cause the greatest geolog-ical complexity occur at the boundary between the Permo-Traissic and Carboniferous rocks (the Boundary fault, Fig. 1;University of Birmingham, 1984). Minor faults in the Qua-ternary deposits have been noted by Aitken (1871), Reade(1884) and Taylor (1958). Such faults are syndepositionaland have no significant effect on groundwater movement.
www.copernicus.org/EGU/hess/hess/10/49/ Hydrology and Earth System Sciences, 10, 49–64, 2006

54 E. A. Mohamed and R. H. Worden: Groundwater compartmentalisation of major aquifer
103
83
River Mersey
Wirral
Formby
Liverpool9
Liverpool
bay
A A`
B
B`
C C`
0 5km
-50
10
20
30
40
50
60
A A`
F
F
0 5 km
1993 water table2002 water table
F FaultFaultThrow
Ground level
Cro
xtet
h fa
ult
0
10
20
30
40
50
60B`B
F
F
F
F
F Ground level
0 5 km
Cross fault
Kirkdale fault
Croxteth fault
0
10
20
30
40
50
60C`C
F
F
F F
FGround level
0 5 km
E ccl
e sto
ne w
est
faul
t
Cro
xte t
h fa
u lt
Bou
n dar
y fa
ult
Elev
asio
n in
met
ers r
elat
ive
to O
D
Elev
asio
n in
met
ers r
elat
ive
to O
DEl
evas
ion
in m
eter
s rel
ativ
e to
OD
Figure 4 (new version)
Fig. 4. Schematic cross sections illustrated the variation of the water table height in meters across the faults in years 1993 and 2002. Thelocations of the cross sections are shown on the map.
2.3 Topography
Although the area has generally low relief, the bedrock to-pography is locally characterised by narrow, linear lows (upto about 30 m above sea level) separated by hills that reach upto about 70 m above sea level (Fig. 2a). These topographicfeatures broadly run northwest to southeast. Travelling fur-ther north, the narrow depression opens out to become a wideplane in the northwest area around Formby, the flood plainof the River Alt, with 10 m maximum elevations above sealevel.
3 Methods
In this study 75 groundwater head records and 78 ground-water geochemical analyses collected from 70 groundwaterwells (Fig. 2b) have been utilised for two discrete year pe-riods (1993, 2002). These groundwater head data and geo-chemical analyses were supplied from the UK Environmen-tal Agency (EA). Head data have been collected from a largenumber of boreholes in the area for more than 70 years al-
though the Environmental Agency has only recently been re-sponsible for collecting and monitoring these data. Head datahave been collected at least monthly from most of the moni-toring boreholes. The EA staff and the Nottingham EA lab-oratory followed recommended BSI sampling and analyticalmethods. Acidity, temperature, conductivity and total salin-ity were measured immediately after sampling. Previouslycleaned sample bottles were rinsed with the groundwater andthen filled to the top. Airtight caps were fitted to each bottleprior to transportation to the laboratory. Alkalinity titrationswere performed within a few hours of sampling. Ion chro-matography was used for the major anions, and atomic ab-sorption and ICP-techniques were used for the major cations.In order to check the quality of the data, all the groundwatergeochemical data that were used in this study were assessedfor charge balance using Geochemist Workbench. Ground-water analyses with a charge imbalance>5% were rejectedfrom the data set.
We concluded that automated geostatistical methods, idealfor gridded data but not suited to the irregular location ofsampling points in this study (Fig. 2b), would not be used
Hydrology and Earth System Sciences, 10, 49–64, 2006 www.copernicus.org/EGU/hess/hess/10/49/

E. A. Mohamed and R. H. Worden: Groundwater compartmentalisation of major aquifer 55
200
400
500
4000
4
9
b) Cl concentration 2002-
0 5km
1000
10000
1000
300
75
200
100
400
500
4
9
0
a) Cl concentration 1993-
0 5km
10000
1000
100
50
25
25
A
B
50
75
100
100
5004000
1000
200
10075 50
25
75
50
50
25
75
100
0
100
200
50 50
50
75 100
500
25
10
3
8
3
510
3
3
5
8
Formby Formby
DC
A
B
DC
Fig. 5. Aqueous chloride concentrations in mg/L contoured for;(a) 1993 and(b) 2002. Contouring of chloride concentration was based onthe assumption that the aquifer is not compartmentalised by the structure elements.
for contouring groundwater head variation and the geochem-ical data. Instead we have use manual contouring methodsto draw maps of water table elevation and groundwater geo-chemistry.
4 Results
4.1 Groundwater head variation in space and time
The groundwater head distribution maps from the years 1993and 2002 have been drawn using the available data frommonitoring boreholes. The groundwater head varied from30 m above mean annual sea level (ordinance datum; OD) toas much as 15 m below OD for the years listed above. Inthe first instance we followed the assumptions implicit in thepublished regional hydrogeological map (that the aquifer wasneither subdivided by faults nor constrained by folds into dis-crete compartments; Lewis et al., 1989) and freely contouredthe groundwater head across the entire area (Fig. 3). It isnoteworthy that the water contours drawn in this way have a
distinct, though imperfect, NNW-SSE lineation that accordsto the main fault pattern (Figs. 1 and 2b).
A number of schematic cross-sections representing topo-graphic and groundwater elevation across some of the mainfaults in the study area were prepared to trace any effect ofthe faults on groundwater head height across the fault lines(Fig. 4). These show that there are significant fluctuations ofgroundwater head height across some of the faults (Fig. 4).Schematic cross-sections illustrate the changes of groundwa-ter head in passing from one side of a fault to another forthe years 1993, and 2002. Cross-section A-A′, which tracksacross the Croxteth fault in the north, shows a very largechange of the groundwater head across the main fault, wherethe small faults have no significant effect on the groundwaterhead. Cross-section B-B′ also traverses the Croxteth fault,Litherland faults and other small faults to the west (Fig. 4).This clearly illustrates the dramatic change of groundwa-ter head across the Croxteth and Kirkdale faults. Further-more, cross-section A-A′, and B-B′ show that there is nosimple relationship between local topographic elevation andgroundwater head. These observations of groundwater head
www.copernicus.org/EGU/hess/hess/10/49/ Hydrology and Earth System Sciences, 10, 49–64, 2006

56 E. A. Mohamed and R. H. Worden: Groundwater compartmentalisation of major aquifer
100
200
300
4
9
300
400
500
1000
75
300
200
4
9
400
5001000
5050
100
75
50
0
50
200
100
75
50
25
5075
100
200
400
100
0
10050
75100
75
75
75
50
25
50
50
75
25
5050
75
100 200
300
200
10
3
8
3
510
3
3 5
8
Formby Formby
A
B
DC
A
B
DC
0 5km
b concentration) SO
20024
2-a concentration) SO
19934
2-
0 5km
Fig. 6. Aqueous sulphate concentrations in mg/L contoured;(a) 1993 and(b) 2002. Contouring of chloride concentration was based on theassumption that the aquifer is not compartmentalised by the structure elements.
displacement across faults, especially those contrary to thetopographic slope, are best interpreted in terms of the faultsrepresenting low permeability zones in the aquifer that havelimited the movement of groundwater. Cross-section C-C′
traverses the Eccleston West, Boundary and Croxteth faultsand other small faults in between (Fig. 4). Although thegroundwater head follows the topographic elevations, thereis a pronounced steep change of groundwater head across thefault lines implying the significant effect of faults on ground-water head in these southern parts of the study area.
4.2 Groundwater geochemistry
Chloride, as the geochemically most conservative elementin the natural waters, can give direct indication of the de-gree of mixing between different types of groundwaters andalso the existence of seawater intrusion, while sulphate maygive a useful insight into other non-conservative processescausing geochemical variations. This paper is not an in-depth study of the controls of geochemical variations in thisaquifer. Rather, the geochemical data are here used to assessthe degree of compartmentalisation.
Distribution maps of the concentrations of aqueous chlo-ride and sulphate (mg/l) from the chosen two years (1993 and2002) have been prepared (Figs. 5 and 6). These maps wereprepared following the initial assumption that the aquifer wasneither subdivided by faults nor constrained by folds intodiscrete compartments and freely contoured the chloride andsulphate concentrations across the entire area. Two cross sec-tions traversing the faults were constructed to illustrate thedegree of change in the chloride and sulphate concentrationsalong the faults (Figs. 7a and b).
As expected for groundwater in temperate climatic re-gions, chloride concentrations are relatively low (<100 mg/l)for much of the area for most of the time (Fig. 5). However,there are notable exceptions. The coastal strip near wherethe Mersey channel is at its narrowest has chloride concen-trations in excess of 1000 mg/l for some of the time and thearea is relatively elevated all of the time. Also the southeast-ern part of the aquifer has locally elevated chloride reachingup to 4000 mg/l. Noteworthy is an area slightly to the west ofthe centre of the area that has less dramatic chloride concen-trations but is also locally elevated above background. The
Hydrology and Earth System Sciences, 10, 49–64, 2006 www.copernicus.org/EGU/hess/hess/10/49/

E. A. Mohamed and R. H. Worden: Groundwater compartmentalisation of major aquifer 57
20406080
100120140160180200220
Cro
xtet
hfa
ult
Lith
erla
nffa
ult
Bou
ndar
yfa
ult
A B
20406080
100120140160180200
Cro
xtet
hfa
ultLi
ther
lanf
faul
t
Bou
ndar
yfa
ult
Up
to >
4000
mg/
l
C D
20406080
100120140160180200220
A B
Cro
xtet
hfa
ultLi
ther
lanf
faul
t
Bou
ndar
yfa
ult
Cro
xtet
hfa
ult
Lith
erla
nffa
ult
Bou
ndar
yfa
ult
Up
to >
400
mg/
l
C D
20406080
100120140
0 5km 0 5km
0 5km0 5km
(a)
(b)
160180200
20021993
20021993
mg/
lO
2S
4- m
g/l
O2
S4
-
Cl m
g/l
-
Cl m
g/l
-
Figure 7 (new version)
Fig. 7. Schematic cross sections illustrated the variation of the(a) chloride concentration across the faults in years 1993 and 2002 and(b) sulphate concentration across the faults in years 1993 and 2002. The locations of cross-sections showed on the maps (Figs. 6 and 7,respectively).
elevated groundwater salinity in some of the near-coastal re-gions is the result of seawater invasion.
Maps of the dissolved sulphate concentrations have somesimilarities to the chloride maps although they are not exactlythe same (Fig. 6). Sulphate is elevated in parts of the coastalstrip and just to the west of the centre of the study area butit is also relatively concentrated at the northern edge of thearea.
5 Discussion
5.1 Structural geology and groundwater head
For the two discrete years for which water table height con-tour maps have been prepared (Fig. 3) it is noteworthy thatwater table heights do not match topographic variations re-sulting in anomalously low and high water tables relative tothe overlying land surface. The water table reaches maxi-mum elevations in the north eastern part of the study area(more than 30 m above sea level) and broadly tends to de-crease toward the coastline and the Mersey estuary (Fig. 4).This reduction of the water table height towards the coast isnot steady across the whole area. There are sudden changesin the water table height over very short distances. In themiddle of northern area just west of the Croxteth fault wherethe water table drops from>5 m above sea level to as muchas 5m below sea level (Fig. 4). Therefore, the Croxteth faultis a fairly well pronounced groundwater barrier. To the mid-
dle of the block bounded to the east by the Croxteth fault,water table height does not follow the general reduction to-wards the coastline and instead rises to more than 25 m and30 m above sea level (Figs. 5a and b, respectively). This ele-vated groundwater table has a sharp western margin markedby the Kirkdale fault where the groundwater table falls to10 m below sea level in the direction of the Mersey estuary(Fig. 4). To the east of Croxteth fault, the water table eleva-tion follows the Knowsley anticline structure (Fig. 1). Thefold axis can be recognized as a groundwater divide wherethe water table falls away from the fold axis. In conclusion,the water table in this part of the aquifer (east of Croxtethfault) is to a fairly large extent unrelated to the regime inthe west of this fault. The block to the east of the Croxtethfault can be separated by the anticline axis into northern andsouthern parts. In the southern part, to the east of the Eccle-ston West fault a very sharp and dramatic drop of water tableheight occurs ultimately falling to below sea level (Fig. 4).In general, the variations in the water table contours seem tobe controlled by the regional fault and fold lines.
Following the analysis represented in Fig. 4, an alternativecontouring scheme was used for groundwater head for thetwo discrete year periods based on the assumptions that theCroxteth, Ecclestone West and linked Litherland-Kirkdalefaults are all low permeability zones strongly limited thegroundwater flow. The Knowsley anticline will also act asa local modifier of the groundwater movement and effec-tively act as a groundwater divide. On this modified basis
www.copernicus.org/EGU/hess/hess/10/49/ Hydrology and Earth System Sciences, 10, 49–64, 2006

58 E. A. Mohamed and R. H. Worden: Groundwater compartmentalisation of major aquifer
5
50
-5
5
10
15
20
25
30
0
5
0
-5
-10
-50
5
10
15
20
25
0
-5
510
3
0
4
RiverMersey
Wirral
0
Formby
Liverpool9
Liverp
ool
bay
35
a ) Water table map1993
.
10
5
15
20
20
15
10
-5
-10
3
0 5km
Fold
Fault
Contourlines
8
5
0
10
2530
25
10
5
0
-55
10
15
20
25
0
-5
5
10
3
0
48
3
RiverMersey
Wirral
0
Formby
Liverpool9
Liverp
ool
bay
b ) Water table map2002
.
4035
-5
10
15
20
5
-10
20
15
0
5
30
-15
15
15
20
20
10
0
0 5km
5
Fig. 8. Water table height in meters relative to the ordinance datum (OD, mean annual sea level);(a) 1993 and(b) 2002. The maps wereprepared using the same data as Fig. 3 but, in contrast to Lewis et al. (1989), contouring was based on the assumption that the aquifer iscompartmentalised by the Boundary, Croxteth, Litherland-Kirkdale and Ecclestone West faults and the Knowsley anticline (see Fig. 4).
the groundwater head map was tentatively re-contoured forthe two years assuming the aquifer was compartmentalisedby these geological structures (Fig. 8). Figure 8 can be com-pared to Fig. 3 to reveal the consequence of the recognitionof the low hydraulic conductivity fault zones. The head con-tours are distinctly interrupted in the vicinities of the Crox-teth, Ecclestone West and linked Litherland-Kirkdale faults.
The previous discussion shows that at least some of thefaults that dissect the regional Permo-Triassic SherwoodSandstone aquifer and represented on the geological map(Fig. 1) could be low permeability zones that have limitedthe movement of groundwater. The close similarity in thehydrogeological properties of the Permo-Triassic sandstoneformations suggest that low permeability characteristics offault zones are mainly due to the low permeability of thefilling materials. Note that the Sherwood Sandstone aquiferis hugely dominated by fine to coarse grained sandstones.Fault movement within the Sherwood Sandstone aquifer isunlikely to result in the dominant juxtaposition of intrafor-mational mudstones and sandstones. Fault zones in the Sher-
wood Sandstone will be dominated by cataclasis, grain sizediminution and possibly cementation (Beach et al., 1997;Chadwick, 1997; Cowan, 1996; Rowe and Burley, 1997).However, in the extreme east of the area, the Boundary Fault,with its great displacement (>300 m), juxtaposes the low per-meability, mudstone-rich Upper Carboniferous against theSherwood Sandstone, therefore it has probably got the lowestpermeability values (Moor, 1902; Tellam, 1983) and so willhave had greatest effect on groundwater movement.
On the basis of fault distribution patterns and water tableelevations, the aquifer could be subdivided into several hy-drogeological sub-basins with boundaries defined largely byfaults. However, the subtle regional fold (Fig. 1) may alsoinfluence groundwater movement patterns with groundwaterflow being away from the antiform axis. These sub-basins(Fig. 8) are thus defined by the fold axis and the most sig-nificant faults (those that have affected water table elevationmost extensively and those with the most significant impactson geological outcrop patterns. Hydrogeological sub-basin 1(B1) occupies the area to the north of the Knowsley anticline
Hydrology and Earth System Sciences, 10, 49–64, 2006 www.copernicus.org/EGU/hess/hess/10/49/

E. A. Mohamed and R. H. Worden: Groundwater compartmentalisation of major aquifer 59
510
0
48
RiverMersey
Wirral
Liverpool9
Liverpool
bay
50
25
50
75
100
4000
1000
100
25
5000
50
100
25
200
100
1000
50
75100
200
25
200
300400
500
10000
3
3
510
3
0
48
3
RiverMersey
Wirral
Liverpool9
Liverpool
bay
75
50 25
75
100
200
100
75
50
75
25
100
200
1000
300
50
75
100
200
300
4000
1000
25
50
75100
25
10000
50
400
50
75
75
Formby Formby
b) Cl concentration 2002-
0 5km
a) Cl concentration 1993-
0 5km
Fig. 9. Aqueous chloride concentration in mg/L contoured for(a) 1993 and(b) 2002. The maps were prepared using the same data asFig. 5 but, contouring was based on the assumption that the aquifer is compartmentalised by the Boundary, Croxteth, Litherland-Kirkdaleand Ecclestone West faults and the Knowsley anticline.
and is bounded by the Croxteth fault in the west and Bound-ary fault in the east. Sub-basin B2 lies to the south of theKnowsley anticline and is limited in the west by the southernextension of the Croxteth fault and the Carboniferous sedi-ments and Ecclestone West fault in the north and east. Sub-basin B3 lies to the east of the Eccleston West fault. Sub-basin B4 lies between the Croxteth fault to the east and theLitherland-Kirkdale faults to the west. Sub-basin B5 has itseastern margin defined by the linked Litherland and Kirkdalefaults. At this stage, the interpretation is somewhat tentativebeing based solely on water table elevations in relation totopography and fault patterns, structural geology (faults andfold) and outcrop patterns. Independent geochemical datawill now be employed to help ascertain the validity of theinterpretation of compartmentalisation.
5.2 Sub-basin definition and groundwater geochemistry
The previous analysis included no water geochemical evi-dence for the compartmentalisation of the aquifer into dis-crete sub-basins. Geochemical data should be capable of as-sessing the plausibility of the tentatively assigned sub-basins.
The initial contour maps of chloride and sulphate concen-tration (Figs. 5 and 6) have been redrawn and re-contoured(Figs. 9 and 10) using the new concept that the Croxteth,Ecclestone West and linked Litherland-Kirkdale faults limitwater movement and that the Knowsley anticline also actedas a barrier to movement (thus compare Figs. 9 and 10 toFigs. 5 and 6). Note that the Boundary fault is the effectiveeastern limit of the aquifer as it brings aquiclude Carbonifer-ous rocks against Permo-Triassic aquifer (Fig. 1).
Chloride distribution maps for the two years (Figs. 5 and9) reveal that the areas of very high chloride concentra-tion (that>1000 mg/l) predominantly lies very close to theMersey Estuary or the open sea. In the western part, the con-tours of chloride concentration run approximately NNW-SSEand are parallel to, and bounded to the east by, the linkedLitherland and Kirkdale faults. This seems to broadly con-cur with the definition of sub-basin B5. However, the veryhighest chloride concentrations in this area are constrainedto an area west of a small fault near the coast. This is alsothe area that has some of the lowest water table elevations(up to 15 m below sea level). This area is conceivably a
www.copernicus.org/EGU/hess/hess/10/49/ Hydrology and Earth System Sciences, 10, 49–64, 2006

60 E. A. Mohamed and R. H. Worden: Groundwater compartmentalisation of major aquifer
510
3
0
48
3
RiverMersey
Wirral
Liverpool9
Liverpool
bay
A) SO
19934
2-concentration
50100
5025
25
25
50
75
100
200
300400
25
50
75
100100
200
400
100
200
100
75
50
75
75
50
100
0 5km
500
100050
50
Formby
510
3
0
48
3
RiverMersey
Wirral
Liverpool9
Liverpool
bay
25
50
75
100
200
300
100
75
50
300
20025
50
10075
75
25
50
100
75
75
7550
75
50
100
0 5km
D) SO
20024
2-concentration
400
500
100025
50
75
Formby100
Fig. 10. Aqueous sulphate concentration in mg/L contoured for(a) 1993 and(b) 2002. The maps were prepared using the same data asFig. 6, but contouring was based on the assumption that the aquifer is compartmentalised by the Boundary, Croxteth, Litherland-Kirkdaleand Ecclestone West faults and the Knowsley anticline.
separate sub-basin (B6) and is likely to be defined by the faultthat runs west of, and sub-parallel to, the linked Litherlandand Kirkdale faults, which is known as the Kingsway fault(Fig. 2b). This fault was considered previously by (Barker,1996) to be a sealed fault that limits eastwards seawater inva-sion. In the extreme southeast of the area (near Widnes), theelevated chloride concentrations in the groundwater (locally>4000 mg/l) seem to be sharply defined. This represents theB3 sub-basin. It is possible that the locally elevated chlo-ride concentrations are limited to the west by the EcclestoneWest fault and Boundary fault (Figs. 5 and 9). Away from thecoast, there are some locally elevated chloride concentrationvalues not easily correlated with the values in neighbouringareas. In sub-basin B4 there is an area with chloride concen-trations>200 mg/l that is anomalous with respect to the re-mainder of the sub-basin. The Croxteth fault seems to definedifferences in chloride concentration between the tentativelyassigned sub-basins B1, B2 and B4, where the Litherland-Kirkdale faults define the differences in chloride concentra-tion between the tentatively assigned sub-basins B5 and B4.
The sulphate concentration contour maps have some simi-larities with chloride concentration contour maps (Figs. 6 and10). As for chloride, one of the areas with the highest sul-phate concentrations lie close to the Mersey River boundedby the linked Litherland and Kirkdale faults although sul-phate concentrations∼=1000 mg/l only occur very close to thecoast supporting the existence of a separate sub-basin in B5,here defined as B6 using the water geochemistry data (Figs. 6and 10). Based on the sulphate as well as the chloride con-centration data, in the extreme southeast of the area, sub-basin B3 is defined to the west by the Eccleston West faultand Boundary fault. To the middle of B4 is an area of anoma-lously high sulphate concentration (>200 mg/l; Figs. 6 and10). In the north of the study area, to the east of the Croxtethfault the sulphate concentration locally rises to>100 mg/lwhile to the west of the Croxteth fault the sulphate concentra-tion fall to <50 mg/l (Figs. 6 and 10). This seems to confirmthat the Croxteth fault is an effective seal between discretecompartments (B1, B2 and B4). The chloride and sulphateconcentration maps seem to support the Knowsley anticline
Hydrology and Earth System Sciences, 10, 49–64, 2006 www.copernicus.org/EGU/hess/hess/10/49/

E. A. Mohamed and R. H. Worden: Groundwater compartmentalisation of major aquifer 61
as a feature that effectively separates sub-basins B1 and B2(Figs. 6 and 10).
The maps of water geochemistry broadly support the no-tion of sub-basins although the initial sub-division of the areabased on water table and the occurrence of structural geo-logical features is not wholly confirmed. Initially assignedsub-basins B1to B5 seem to be broadly robust. An extra sub-basin to the western edge of B5 may be operative and hasbeen labelled B6.
The newly identified compartments to the aquifer are de-lineated in Fig. 11. In this figure the aquifer is divided intoareas (B1 to B6) that the water table head and geochemicaldata have identified. The compartments (B1 to B6) are seem-ingly isolated from each other. This has significant implica-tions for recharge patterns, pollution movement and publicwater supply issues.
The compartmentalisation of the aquifer based on con-toured maps of water table height (Fig. 8) and geochemistry(Figs. 9 and 10) can be tested further by examining individ-ual and averaged geochemical characteristics of each of thesenewly defined aquifer compartments. Although the faults arenot the main reason for the geochemical variation betweensub-basins, they can plausibly highlight any differences thatexist. The use of averaged geochemical parameters can givean overall view of any geochemical differences. Illustrationsemploying all the geochemical data are not particularly help-ful since the figure is very crowded and is not easy to inter-pret. These averaged data have been added to binary cross-plots (Fig. 12). The average geochemical parameters andstandard deviation cross-plots of each sub-basin (Fig. 12) in-dicate that the geochemical composition of groundwater insub-basins B1, B2 and B4 are fairly similar but sub-basinsB3, B5 and B6 are all quite different and seemingly unre-lated either to one another or to sub-basins B1, B2 and B4.The broadly similar geochemical compositions of waters insub-basins B1, B2 and B4 could be a result of similar geo-chemical processes in these parts of the aquifer leading tosimilar evolutionary pathways. The wide inland extension ofB3 sub-basin (Fig. 11) seems to result in a high degree ofmixing between saline and fresh groundwaters leading to thewide range of geochemical parameters (as reflected by themagnitude of the standard deviation values) in this sub-basin.In contrast, B6 sub-basin where the tendency for mixing be-tween saline- and fresh-groundwater is limited by the sealedfault (Kingsway fault, Fig. 11) the variation range of geo-chemical parameters is very limited (Fig. 12). The geochem-ical evolution of groundwater in B5 is seemingly unique andis not particularly related to any other sub-basin.
Sub-basin B4 has a small degree of overlap with B1 andB2 (Fig. 12a) possibly suggesting that there is limited wa-ter movement across the Croxteth fault. The notion that B4is discrete from B1 and B2 is largely supported by the geo-chemical data. B4 has moderately elevated sulphate concen-trations relative to B2 and moderately high magnesium con-centration relative to B1 and B2 (Fig. 12). There is some de-
Liverpool
Wirral
RiverMersey
Liverpoolbay
4
9
0
Boundary
fault
0 5km
Eccle
stone
fault
Cross fault
Kirkdale
faultC
roxte
thfa
ult
Litherland
fault
B2
B1
B3
B4
B5
B6
Formby
Chemistry basins
Kno
wsl
eyA
ntic
line
Fig. 11.Suggested division of hydrogeological sub-basins based onwater table height and water geochemical data.
gree of geochemical overlap between groundwater samplesfrom sub-basins B1 and B2 although there is a significantdifference between the cross-plotted data (Fig. 12) suggest-ing that these sub-basins are indeed discrete aquifers. B1has very low chloride and moderately low sulphate whereasB2 has moderately low chloride and very low sulphate. Inorder to differentiate between the geochemical evolution ofthe groundwaters in B1, B2 and B4 average sulphate andchloride cross-plots have been developed (Fig. 13). This fig-ure indicates that, the main recharge of the groundwater inthese three sub-basins seems to be the same, however, thegroundwater evolution in each sub-basin follows a differ-ent direction. In B1, both parameters are inversely corre-lated where the sulphate concentration increases in the sameway as chloride concentration. In B2 there is no correlationbetween the two parameters. High chloride anomalies arerecorded only in the samples close to the Mersey River inB2 (Fig. 11). In B4 sulphate and chloride concentrations are
www.copernicus.org/EGU/hess/hess/10/49/ Hydrology and Earth System Sciences, 10, 49–64, 2006

62 E. A. Mohamed and R. H. Worden: Groundwater compartmentalisation of major aquifer
300
250
200
150
100
50
00 50 100 150 200 250
B1B2
B4
B5
360
340
320
300
280
260
240
220
2001000 2000 3000 4000
B6
B3
Cl mg/l-
60
40
20
0150
B5B6
B2 B1B4
430
450
410
390
370
350100 120 140 160 180 200 220
B3
Mg
mg/
l2+
HCO mg/l3-
50 100 200 250
700
600
500
400
300
200
100
00 20 40 60 80 100
B6
B2 B1 B4B5
Na
mg/
l+
Ca mg/l++
B3
700
900
1100
1300
1500
650 750 850 950
(a)
(b)
(c)
Mg
mg/
l2+
N
am
g/l
+
Ca mg/l++
HCO mg/l3-
Cl mg/l-
mg/
lO
2S
4- m
g/l
O2
S4
-
Figure 12 (new version)
Fig. 12.Geochemical cross-plots;(a) average chloride concentrations vs. average sulphate concentrations(b) average magnesium concentra-tions vs. average bicarbonate concentrations,(c) average sodium concentrations vs. average calcium concentrations. Note, for simplificationthe very high chloride concentration samples (>4000 mg/l) in B6 were excluded in this graph as this sub-basin is separated from the othersby the Kingsway fault.
directly correlated which may be a result of them having arelated set of controls in this sub-basin.
The similarity in the overall groundwater geochemistry incompartments B1, B2 and B4 (Figs. 12 and 13), with theirown localised head variations, seems to support the conclu-sion that faults are zones of low hydraulic conductivity. Ifthere had been no barriers, then the regional movement ofwater in all three zones would likely have resulted in re-gional geochemical evolution patterns. Instead, the ground-water has broadly similar composition in all three discretecompartments and there has certainly not been regional scalechange resulting in differences along regional flow paths.
Therefore the degree of compartmentalisation of the majoraquifer in the area tested by the groundwater heads is broadlysupported well by the variation in the geochemical composi-tion of groundwater.
6 Significance
It has been known that petroleum accumulations are com-monly divided into discrete fluid compartments for a numberof years. The data typically used to assess the degree of com-partmentalisation include fluid pressure data, fluid contact(e.g. oil-water) depths, oil geochemistry, gas geochemistry,
Hydrology and Earth System Sciences, 10, 49–64, 2006 www.copernicus.org/EGU/hess/hess/10/49/

E. A. Mohamed and R. H. Worden: Groundwater compartmentalisation of major aquifer 63
associated water geochemistry, and the physical propertiesof petroleum (Smalley and England, 1992, 1994; Smalleyet al., 1995). By analogy we have here used water tableheight variations (equivalent to fluid pressure variations andfluid contact depths in oil fields) and water geochemistry data(equivalent to petroleum geochemistry data). This approachhas proved to be very effective in determining the degree ofcompartmentalisation in a near-surface aquifer. These dataare typically available from aquifers in developed regionsand the approach could be widely applied with only minorextra expense.
The compartmentalisation in the Sherwood sandstoneaquifer is primarily a result of the occurrence of a series ofmajor faults that traverse the sandstone-dominated bedrock.The faults have vertical displacements of up to several hun-dred meters and probably have meter-thick zones composedof low permeability fault gouge and cataclasite resultingfrom the ancient movements of the faults (Beach et al., 1997;Chadwick, 1997). Faults are also commonly implicated inthe lateral compartmentalisation of oil fields although verti-cal compartmentalisation in oil fields can also be the resultof stratification of permeable and impermeable sedimentaryunits, growth of diagenetically-cemented layers etc.
Why does the compartmentalisation of this coastal aquifermatter? The water table close to the coastline is, in some lo-cations, 10 m below sea level (as a result of anthropogenicactivities). However, the landward movement of seawaterin the aquifer has been locally limited by faults. Where thefaults are sub-parallel to the coastline the landward invasionis spatially restricted to the near-shore region of the aquifer.In stark contrast, where the faults are approximately perpen-dicular to the coastline, the landward invasion of seawateris more extensive since there is nothing preventing the ad-vance into the coastal aquifer. Managing groundwater re-sources is done most effectively with knowledge of compart-mentalisation and its controls. These would enable predic-tion of groundwater movements. Adopting the notion thatthe aquifer is merely a “tank of sand” (as is implicit in the re-gional hydrogeological map; Lewis et al., 1989) would leadto a whole host of errors in predicting occurrence and extentof saline intrusion.
The region in question has relatively high ground to theeast where the Sherwood sandstone sub-crop could poten-tially be a site of active recharge to the entire aquifer. Theexistence of groundwater compartments due to NNW-SSEoriented sealing faults suggests that this scenario is perhapsunlikely. The NNW-SSE sealing faults will restrict E-Wrecharge. Recharge of the aquifer is thus most likely via ver-tical percolation of rainfall. This is supported by the occur-rence of a water table high in the SW of the area (under alocal topographic high) and a long way from the relativelyhigh ground in the east.
One of the practical implications for the occurrenceof compartmentalisation is that any lateral spread ofcontaminants due to poor environmental protection will be
B1
0
50
100
150
200
250
0 25 50 75 100 125 150 175 200 225
B4
Cl mg/l-
B2B2 Samples near
to the Mersey River
High anomaly samples to the middle of the sub-basin
0
50
100
150
200
250
0 25 50 75 100 125 150 175 200 225
B4
Samples near to the Mersey River
High anomaly samples to the middle of the sub-basin
SO42-
mg/
l
Figure 13 (new version) Fig. 13. The cross plots of concentrations of sulphate versus chlo-
ride for the B1, B2 and B4 sub-basins samples.
spatially restricted to the local compartment. Point-sourcepollution is unlikely to spread to the entire aquifer.
7 Conclusions
1. Analysis of water table height variations and groundwa-ter geochemistry reveals different sub-basins, or com-partments, within the Triassic Sherwood Sandstoneaquifer in the Liverpool area in the UK.
2. NNW-SSE oriented geological faults, with vertical dis-placements of up to 300 m, traverse the Triassic andrepresent the vertical margins of discrete compartmentswithin the aquifer.
3. The combination of fluid pressure gradients (as repre-sented by water table height), water geochemistry dataand an appreciation of the dominant geological struc-tures in an aquifer (e.g. major faults) proved effectivein defining the degree of compartmentalisation in theaquifer.
4. Lateral influx of seawater is limited by the occurrence oflow hydraulic conductivity faults running sub-parallel tothe coastline in the west of the aquifer. These faults areperpendicular to the coastline in the south of the aquiferand have permitted more extensive landward invasion ofseawater.
5. Geochemical data show that mixing of groundwater be-tween different compartments is limited by NNW-SSEtrending faults. This reveals that lateral recharge of theaquifer from higher ground in the east will be limited.Recharge must be by vertical percolation thus spatiallylimiting the extent of any groundwater contaminationby anthropogenic activities.
www.copernicus.org/EGU/hess/hess/10/49/ Hydrology and Earth System Sciences, 10, 49–64, 2006

64 E. A. Mohamed and R. H. Worden: Groundwater compartmentalisation of major aquifer
Acknowledgements.The work was funded through a PhD awardfrom the Egyptian Education and Cultural Bureau, London. TheDepartment of Earth & Ocean Sciences at the University ofLiverpool is duly acknowledged. The authors would like to thankthe Environmental Agency staff J. Ingram and D. Billington forsupplying us with the data set used in this study.
Edited by: J. Carrera
References
Aitken, J.: On faults in drift at Stockport, Cheshire. Transactions ofthe Manchester, Geological Society, 10, 46–49, 1871.
Barker, A. P.: Isotopic studies of groundwater diagenesis. PhD The-sis, Leeds University, 139 p., 1996.
Beach, A., Brown, J. J., Welbon, A. L., McCallum, J. E., Brock-bank, P., and Knott, S.: Characteristics of fault zones in sand-stones from NW England: application to transmissibility, in:Petroleum geology of the Irish Sea and adjacent areas, editedby: Meadows, N. S., Trueblood, S. P., Hardman, M., and Cowan,G., Special Publication of the Geological Society, 124, 315–324,1997.
Chadwick, R. A.: Fault analysis of the Cheshire Basin, NW Eng-land, in: Petroleum geology of the Irish Sea and adjacent areas,edited by: Meadows, N. S., Trueblood, S. P., Hardman, M., andCowan, G., Special Publication of the Geological Society, 124,297–313, 1997.
Cowan, G.: The development of the North Morecambe gas field,East Irish Sea, UK, Petroleum Geoscience, 2, 43–52, 1996.
Hull, E.: The geology of the country around Prescot, Lancashire,3rd Ed. Mem. Geol. Surv. Gt. Brit., 1882.
Jones, R. C. B., Tonks, L. H., and Wright, W. B.: Wigan District,Mem. Geol. Surv. Gt. Brit., 1938.
Kent, P. E.: A deep borehole at Formby, Lancashire, GeologicalMagazine, 85, 22–35, 1948.
Land, D. R.: Hydrogeology of the southern part of the northwestregion, Geol. Surv. on file report, 1964.
Lees, G. and Taitt, A. H.: The geological results of the search foroilfields in Great Britain, Quart. J. Geological Soc., 101, 255–317, 1945.
Lewis, M. A., Doorgakant, P., Lawrence, A. M., Monkhous, R. A.,(section Leader), with the assistance of Riden, J. of Welsh Wa-ter and Eggboro, M. D., and other staff of North West Water:Hydrogeological map of Clwyd and the Cheshire basin, BritishGeological Survey, 1989.
Morton, G. H.: On the position of the wells for the supply of waterin the neighbourhood, Proc. Liverpool Geological Soc., 8, 241–267, 1866.
Moore, C. C.: A study of the volume composition of rocks and itsimportance to the geologist, Proc. Liverpool Geological Soc., 9,129–162, 1902.
Reade, T. M.: A section of the Trias at Vyrnwy Street Everton dis-playing evidence of lateral pressure, Proc. Liverpool GeologicalSoc., 5, 158–159, 1884.
Reilly, T. E. and Pollock, D. W.: Factors affecting areas controllingrecharge to wells in shallow aquifers, U.S. Geological SurveyWater Supply Paper 2412, 1993.
Rowe, J. and Burley, S. D.: Faulting and porosity modifica-tion in the Sherwood Sandstone at Alderley Edge, northeasternCheshire: an exhumed example of fault-related diagenesis, in:Petroleum geology of the Irish Sea and adjacent areas, edited by:Meadows, N. S., Trueblood, S. P., Hardman, M., and Cowan,G., Special Publication of the Geological Society, 124, 315–324,1997.
Shackleton, R. M.: Geology in a scientific study of Merseyside,edited by: W. Smith, Published for Brit. Assoc. by Uni. Press ofLiverpool, 1953.
Smalley, P. C. and England, W. A.: Assessing reservoir compart-mentalization during field appraisal: how geochemistry can help,SPE 25005, 1992.
Smalley, P. C. and England, W. A.: Reservoir compartmentalizationassessed with fluid compositional data, SPE Reservoir Engineer-ing, 175–180, 1994.
Smalley, P. C., Dodd, T. A., Stockden, I. L., Raheim, A., andMearns, E. W.: Compositional heterogeneities in oilfield forma-tion water: identifying them, using them, in: The geochemistryof reservoirs, edited by: Cubbitt, J. M. and England, W. A., Spe-cial Publication of the Geological Society, 86, 59–69, 1995.
Stephenson, R.: Report on the supply of water to the town of Liver-pool, Report to the Water Committee of Liverpool Town Council,1850.
Taylor, B. J.: Report on underground water resources: the Permo-Triassic area of south Lancashire, Unpub. Rep., Geol. Surv.Manchr. Office, 1957.
Taylor, B. J.: Cemented shear-planes in the Pleistocene middlesands of Lancashire and Cheshire, Proc. Yorkshire GeologicalSoc., 31, 359–365, 1958.
Tellam, J. H.: Hydrochemical studies of the Lower Mersey basinPermo-Triassic sandstone aquifer system. PhD Thesis, Birming-ham University, 1983.
Tellam, J. H.: The groundwater chemistry of the Lower MerseyBasin Permo-Triassic sandstone aquifer system, UK: 1980 andPre-industrialization-urbanisation, J. Hydrol., 161, 287–325,1994.
Tellam, J. H., Lloyd, J. W., and Walters, M.: The morphology of asaline groundwater body: its investigation, description and pos-sible explanation, J. Hydrol., 83, 1–21, 1986.
University of Birmingham: Lower Mersey Basin Saline Groundwa-ter Study, final report to the North West Water Authority by theUniversity of Birmingham, Summary report, 1981.
University of Birmingham: North Mersey Basin Saline Groundwa-ter Study, final report to the North West Water Authority by theUniversity of Birmingham, Summary report, 1984.
Wedd, G. B., Smith, B., Simmons, W. C., and Wary, D. A.: Thegeology of Liverpool, Mem. Geol. Surv. Eng. and Wales, 1923.
Hydrology and Earth System Sciences, 10, 49–64, 2006 www.copernicus.org/EGU/hess/hess/10/49/