groundwater environmental tracer data collected from the ... · data series 580. in cooperation...
TRANSCRIPT

U.S. Department of the InteriorU.S. Geological Survey
Data Series 580
In cooperation with the Lone Star Groundwater Conservation District
Groundwater Environmental Tracer Data Collected from the Chicot, Evangeline, and Jasper Aquifers in Montgomery County and Adjacent Counties, Texas, 2008

Front cover:Top left, CFC-11 (trichlorofluoromehtane) molecule.Bottom left, Sulfur hexafluoride molecule.Middle, U.S. Geoligical Survey scientist collects a sample for CFC analysis (in bucket). Right, Hydrogen isotope, tritium (3H).

Groundwater Environmental Tracer Data Collected from the Chicot, Evangeline, and Jasper Aquifers in Montgomery County and Adjacent Counties, Texas, 2008
By Timothy D. Oden
In cooperation with the Lone Star Groundwater Conservation District
Data Series 580
U.S. Department of the InteriorU.S. Geological Survey

U.S. Department of the InteriorKEN SALAZAR, Secretary
U.S. Geological SurveyMarcia K. McNutt, Director
U.S. Geological Survey, Reston, Virginia: 2011
This and other USGS information products are available at http://store.usgs.gov/ U.S. Geological Survey Box 25286, Denver Federal Center Denver, CO 80225
To learn about the USGS and its information products visit http://www.usgs.gov/ 1-888-ASK-USGS
Any use of trade, product, or firm names is for descriptive purposes only and does not imply endorsement by the U.S. Government.
Although this report is in the public domain, permission must be secured from the individual copyright owners to reproduce any copyrighted materials contained within this report.
Suggested citation:Oden, T.D., 2011, Groundwater environmental tracer data collected from the Chicot, Evangeline, and Jasper aquifers in Montgomery County and adjacent counties, Texas, 2008: U.S. Geological Survey Data Series 580, 37 p.

iii
ContentsAbstract ..........................................................................................................................................................1Introduction ....................................................................................................................................................1
Purpose and Scope .............................................................................................................................1Description of Study Area ..................................................................................................................1Hydrogeologic Setting ........................................................................................................................3
Methods ..........................................................................................................................................................3Sample Collection ................................................................................................................................3Analytical Methods ..............................................................................................................................6Quality Control ......................................................................................................................................6
Groundwater Environmental Tracer Data .................................................................................................6Summary .........................................................................................................................................................6References Cited ...........................................................................................................................................7Appendixes 1. Well-construction information for groundwater wells sampled in the Chicot,
Evangeline, and Jasper aquifers in Montgomery County and adjacent counties, Texas, 2008 ..................................................................................................................................10
2. Physicochemical data measured in groundwater samples collected from the Chicot, Evangeline, and Jasper aquifers in Montgomery County and adjacent counties, Texas, 2008 .................................................................................................................18
3. Dissolved-gas concentrations measured in groundwater samples collected from the Chicot, Evangeline, and Jasper aquifers in Montgomery County and adjacent counties, Texas, 2008 .................................................................................................................20
4. Sulfur hexafluoride and chlorofluorocarbons measured in groundwater samples collected from the Chicot, Evangeline, and Jasper aquifers in Montgomery County and adjacent counties, Texas, 2008 ........................................................................................23
5. Tritium measured in groundwater samples collected from the Chicot, Evangeline, and Jasper aquifers in Montgomery County and adjacent counties, Texas, 2008 .........28
6. Helium-4 measured in groundwater samples collected from the Chicot, Evangeline, and Jasper aquifers in Montgomery County and adjacent counties, Texas, 2008 .........30
7. Helium, tritium, and neon measured in groundwater samples collected from the Chicot, Evangeline, and Jasper aquifers in Montgomery County and adjacent county, Texas, 2008 ....................................................................................................................32
Figures 1. Map showing locations of wells sampled during March–September 2008 in
Montgomery County and adjacent counties, Texas ..............................................................2 2. Hydrogeologic section of the Gulf Coast aquifer system in Montgomery and Harris
Counties, Texas ............................................................................................................................4
Table 1. Geologic and hydrostratigraphic units of the Gulf Coast aquifer system in
Montgomery County and adjacent counties, Texas. ..............................................................5

iv
Conversion Factors, Datums, and Water-Quality Units
Inch/Pound to SI
Multiply By To obtain
Length
inch (in.) 2.54 centimeter (cm)
inch (in.) 25.4 millimeter (mm)
foot (ft) 0.3048 meter (m)
mile (mi) 1.609 kilometer (km)
Radioactivity
picocurie per liter (pCi/L) 0.037 Becquerel per liter (Bq/L)
picocurie per liter (pCi/L) 0.313 Tritium units (TU)
Temperature in degrees Celsius (°C) may be converted to degrees Fahrenheit (°F) as follows:
°F=(1.8×°C)+32
Datums
Vertical coordinate information is referenced to the National Geodetic Vertical Datum of 1929 (NGVD 29) and North American Vertical Datum of 1988 (NAVD 88).
Horizontal coordinate information is referenced to the North American Datum of 1927 (NAD 27).
Altitude, as used in this report, refers to distance above the vertical datum.
Water-Quality Units
Specific conductance is given in microsiemens per centimeter at 25 degrees Celsius (µS/cm).
Concentrations of chemical constituents in water are given either in milligrams per liter (mg/L), femtograms per kilogram (fg/kg), picograms per kilogram (pg/kg), picocuries per liter (pCi/L), cubic centimeters per gram at standard temperature and pressure water (cc/g STP H2O), and tritium units (TU).

Abstract The Gulf Coast aquifer system is the primary water sup-
ply for Montgomery County in southeastern Texas, includ-ing part of the Houston metropolitan area and the cities of Magnolia, Conroe, and The Woodlands Township, Texas. The U.S. Geological Survey, in cooperation with the Lone Star Groundwater Conservation District, collected environ-mental tracer data in the Gulf Coast aquifer system, primarily in Montgomery County. Forty existing groundwater wells screened in the Gulf Coast aquifer system were selected for sampling in Montgomery County (38 wells), Waller County (1 well), and Walker County (1 well). Groundwater-quality samples, physicochemical properties, and water-level data were collected once from each of the 40 wells during March–September 2008. Groundwater-quality samples were analyzed for dissolved gases and the environmental tracers sulfur hexafluoride, chlorofluorocarbons, tritium, helium-4, and helium-3/tritium. Water samples were collected and processed onsite using methods designed to minimize changes to the water-sample chemistry or contamination from the atmo-sphere. Replicate samples for quality assurance and quality control were collected with each environmental sample. Well-construction information and environmental tracer data for March–September 2008 are presented.
IntroductionBetween 2000 and 2010, the population of the Houston,
Tex., metropolitan area increased 26 percent, and in 2010 the population of the Houston area, which includes Harris, Montgomery, Fort Bend, and Galveston Counties, was about 5.9 million people (Texas State Data Center, 2010). Much of the growth has been to the north of Houston. Municipal and industrial water supplies are needed to support population growth in the newly developed areas, including historically predominately rural Montgomery County, where ground-water withdrawals have increased since 1980 (Texas Water Development Board, 2011). The Lone Star Groundwater Conservation District (LSGCD) was created in 2001 by
the 77th Texas Legislature and was charged with managing and protecting the groundwater resources of Montgomery County. The LSGCD has worked cooperatively with the U.S. Geological Survey (USGS) to monitor and appraise the Gulf Coast aquifer system, comprised of the Chicot, Evangeline, and Jasper aquifers, Burkeville confining unit, and Catahoula Sandstone. Annual groundwater-level measurements are recorded and periodic groundwater-level change maps are produced to provide short-term and long-term trends of the effects of groundwater withdrawal on the regional aquifer flow system. In 2003, the LSGCD set a maximum amount of sustainable yield for the Gulf Coast aquifer in Montgomery County equal to previously determined estimates of recharge. In 2007, as the LSGCD began planning for an alternative source of water to curtail groundwater withdrawals, the LSGCD required more detailed information on the rate of groundwater recharge to evaluate whether there is a consis-tent recharge value across Montgomery County and vertically within the aquifer system.
Purpose and Scope
This report presents the well-construction and water-quality data (environmental tracers) from discrete ground-water samples collected during March–September 2008 in Montgomery, Waller, and Walker Counties, Tex. Methods used to select sites and techniques used to collect and analyze the water-quality data are described. This report complements previous USGS investigations in the Gulf Coast aquifer system as described in Noble and others (1996) and Nolan and others (2007).
Description of Study Area
Most of the wells sampled were in Montgomery County in southeastern Texas, which includes part of the Houston met-ropolitan area and the municipalities of Magnolia, Conroe, and The Woodlands Township (Texas State Data Center, 2010). Of 40 existing groundwater wells from which samples were collected, 38 were in Montgomery County, 1 was in Waller County, and 1 was in Walker County (fig. 1). Montgomery
Groundwater Environmental Tracer Data Collected from the Chicot, Evangeline, and Jasper Aquifers in Montgomery County and Adjacent Counties, Texas, 2008
By Timothy D. Oden

2 Groundwater Environmental Tracer Data Collected from the Chicot, Evangeline, and Jasper Aquifers
Figure 1. Locations of wells sampled during March–September 2008 in Montgomery County and adjacent counties, Texas.
Brazos
Spring
Creek
Caney
CreekWest
Fork
SanJacinto
River
West Fork
SanJacinto
River
River
Lake
Creek
Lake Creek
105
45
249
59
150
30
90
19
6
Loop 336
105
290
45
156
45
190
75
30
1488
1774
LAKEHOUSTON
LAKECONROE
LAKELIVINGSTON
TS–60–53–720TS–60–53–719
TS–60–44–805TS–60–44–806
TS–60–54–807
TS–60–35–503
TS–60–26–901
TS–60–45–513
TS–60–34–301
YW–59–64–206 TS–60–63–110
TS–60–37–309
TS–60–54–702
TS–60–44–212
TS–60–55–710
YU–60–28–802
TS–60–45–114
TS–60–53–210
TS–60–43–514
TS–60–51–5xx
TS–60–52–1xx
TS–60–51–8XXB
TS–60–42–902
TS–60–53–516
TS–60–36–410
TS–60–35–907 TS–60–37–806
TS–60–37–909
TS–60–59–102
TS–60–51–809
TS–60–45–414TS–60–45–413
TS–60–54–805TS–60–54–806
TS–60–35–504
TS–60–35–505
TS–60–26–208
TS–60–43–511TS–60–45–716
TS–60–51–8XXA
Magnolia
The Woodlands
Conroe
WA
LK
ER
CO
UN
TY
SAN
JA
CIN
TO C
OU
NTY
GRIMES COUNTY
MO
NTG
OM
ERY CO
UN
TY
WALLER COUNTY
LIBERTY
COUNTY
HARRIS COUNTY
AUSTIN
WASH
INGTO
N
COUNTY
BRA
ZOS C
OU
NTY
CO
UN
TY
POLKCOUNTY
TEXASStudy area
Houston
LOCATION MAP
0 10 20 MILES
0 10 20 KILOMETERS
Base modified from U.S. Geological Survey, 1:100,000-scale digital data Universal Transverse Mercator projection Zone 15, North American Datum of 1927
95°15'95°30'95°45'96°00'96°15'
30°45'
30°30'
30°15'
30°00'
EXPLANATION
Monitor well, by aquifer from whichsamples were obtained—Number is State well number (appendix 1)ChicotEvangelineJasper
TS–60–59–102
TS–60–51–809
TS–60–36–410

Methods 3
County is forecasted to be one of the fastest growing counties in the Houston area, more than doubling its 2000 population of 373,000 by 2035 (Houston-Galveston Area Council, 2006). This rapid increase of population will likely result in appre-ciable land-use changes and a more suburban and urban land use, with a subsequent increased water demand. The topogra-phy of Montgomery County ranges from essentially flat near the larger streams and coastward to undulating rolling hills in the northern part of the county. Land-surface altitude ranges from about 79 feet (ft) above North American Vertical Datum of 1988 (NAVD 88) in the southeastern corner of the county to about 330 ft above NAVD 88 in the northwestern corner (U.S. Department of Agriculture, 1972). Montgomery County is entirely within the San Jacinto River drainage basin, which trends from the northwest to the southeast. Lake Conroe, a reservoir completed in 1973, is at the upper end of the West Fork San Jacinto River (fig. 1). Montgomery County has a humid subtropical climate characterized by hot and humid summers and cool winters. For the period 1947–2008, the average precipitation in the Houston area was 51.67 inches per year (National Climatic Data Center, 2010). During the last 61 years, many periods of drought have occurred (National Climatic Data Center, 2010).
Hydrogeologic Setting
The Gulf Coast aquifer system in Montgomery County consists of the Chicot aquifer, Evangeline aquifer, Burkeville confining unit, Jasper aquifer, and the underlying Catahoula Sandstone (table 1). The uppermost Chicot aquifer consists of Pleistocene- and Holocene-age unconsolidated sand, silt, and clay sediments; the Evangeline aquifer consists of Miocene- and Pliocene-age unconsolidated sand, silt, and clay sedi-ments, and the lowermost Jasper aquifer consists of Miocene-age unconsolidated sand, silt, and clay sediments (Baker, 1979). The Jasper aquifer is separated from the Evangeline aquifer by the Burkeville confining unit. The Catahoula sandstone consists of Miocene- and Oligocene-age sediments at the base of the Gulf Coast aquifer system and contains small amounts of freshwater in shallow restricted sands near the outcrop area to the north of the study area (Baker, 1979). The Catahoula Sandstone is the deepest freshwater source in Montgomery County (Popkin, 1971) (fig. 2). Detailed information on the hydrogeology of the area can be found in Popkin (1971), Baker (1979), Chowdhury and Turco (2006), Kasmarek and others (2010).
In the natural groundwater-flow system, water recharges the aquifers in the unconfined outcrop areas, moves downward and coastward through the interbedded sands, and discharges upward as diffuse upward leakage in the confined downdip areas (Kasmarek and others, 2010). Much of the water that infiltrates into the saturated zone flows through locally con-tinuous shallow sand layers and discharges into streams; the remainder of the water flows to intermediate and deep zones of the aquifer system southeastward of the outcrop, where it is captured and withdrawn by wells or naturally discharged by
upward leakage in topographic lows along the coast. On the basis of historical groundwater-level-change maps, major areas of withdrawal include the municipalities of Magnolia, Conroe, and The Woodlands Township. Compared to predevelop-ment conditions (prior to the 1890s; Kasmarek and Robinson, 2004), when the normal flow direction was from the northwest to southeast, the current areas experiencing groundwater-level declines have induced flow from the Chicot aquifer into the Evangeline aquifer. As development increased, the withdrawal of groundwater from wells increased to meet water demand, and the number of water wells increased. Withdrawal of water from a well creates a cone of depression in the saturated aquifer sediments, thereby increasing the gradient and radial flow of water towards the well. In this study area, the cumula-tive effect of groundwater withdrawn from all wells in Harris County and surrounding counties has resulted in water-level declines as individual cones of depression coalesced. This has resulted in areally extensive cones of depression with water levels as much as 200, 300, and 200 ft below National Geodetic Vertical Datum of 1929 or NAVD 88 in the Chicot, Evangeline, and Jasper aquifers, respectively (Kasmarek and others, 2010).
MethodsAll of the samples were collected in 2008 from wells
screened in the Gulf Coast aquifer system. Wells selected for sampling had to meet specific criteria, including the following: depth of well within targeted aquifer (Chicot, Evangeline, or Jasper, depending on well), short length of screened interval (less than 30 ft), and well cannot be completed in multiple aquifer units. After evaluating all wells that met these criteria, wells were selected to represent an areal distribution through-out Montgomery County (and adjacent small parts of Waller and Walker Counties). To the extent possible, wells with relatively short open intervals (less than 30 ft) were preferred for selection. Well depths ranged from 52 to 1,240 ft, with a median depth of 192 ft. Length of screened intervals for the wells ranged from 10 to 118 ft (appendix 1).
Sample Collection
Groundwater samples were collected using proce-dures described in the USGS “National Field Manual for the Collection of Water-Quality Data” (U.S. Geological Survey, variously dated) and provided by the USGS Chlorofluorocarbon Laboratory, Reston, Va. (U.S. Geological Survey, 2009). Groundwater-quality samples, physicochemical properties, and water-level data (when access allowed) were collected once from each site (fig. 1) during March–September 2008 (appendixes 2–7). Groundwater samples were analyzed for dissolved gases and the environmental tracers sulfur hexafluoride (SF6), chlorofluorocarbons (CFCs), tritium (3H), helium-4 (4He), and helium-3/tritium (3He/3H). Water levels in

4 Groundwater Environmental Tracer Data Collected from the Chicot, Evangeline, and Jasper Aquifers
Figure 2. Hydrogeologic section of the Gulf Coast aquifer system in Montgomery and Harris Counties, Texas (modified from Popkin, 1971, fig. 29).
MONTGOMERYCOUNTY
o
o
o
o
o
o
o
o
o
o
12
3
45
67
8910
A
A'HARRISCOUNTY
LOCATION MAP
Lower
Upper part of
Jasper
aquifer
Catahoula
Sandstone
Jackson
Group
Burkeville
confining unit
Chicot aquifer
Approximate landsurface
MO
NT
GO
ME
RY
CO
UN
TY
HA
RR
IS C
OU
NT
YSp
ring
Cre
ek
Lake
Cre
ek
Littl
e La
ke C
reek
Littl
e La
ke C
reek
Undifferentiated Pre-Miocene deposits
Evangeline aquifer
Jasper
part of
aquifer
0 2 4 6 8 10 MILES
VERTICAL SCALE GREATLY EXAGGERATED
0 2 4 6 8 10 KILOMETERS
A'A Well number on location map
1 2 3 4 5 6 7 8 9 10
(Miocene-age sediments)
(Miocene-age sediments)
(Pliocene- and Miocene- age sediments)
(Holocene- and Pleistocene-age sediments)
(Miocene- age sediments)
(Miocene-age sediments)
TS–6
0–26
–801
TS–6
0–35
–203
TS–6
0–36
–403
TS–6
0–44
–101
TS–6
0–44
–507
TS–6
0–44
–902
TS–6
0–53
–105
TS–6
0–53
–810
TS–6
0–53
–803
LJ–6
0–61
–602
SOUTHEAST
+ 400
NGVD 29
- 400
- 800
- 1,200
- 1,600
- 2,000
- 2,400
- 2,800
- 3,200
- 3,600
- 4,000
- 4,400
FEET+ 400
NGVD 29
- 400
- 800
- 1,200
- 1,600
- 2,000
- 2,400
- 2,800
- 3,200
- 3,600
- 4,000
- 4,400
NORTHWEST
FEET
NGVD 29, NATIONAL GEODETIC VERTICAL DATUM OF 1929

Methods 5
wells were measured manually at the time of sampling, when possible, by using an electric tape or steel tape. In some wells with pumps, when water levels were not obtained because of either a lack of access point or an obstruction in the well, the most recent water-level measurement stored in the USGS Groundwater Site Inventory (GWSI) database is listed in appendix 1.
Observation wells were pumped using an electric, por-table, submersible, positive displacement pump (Grundfos Redi-flo2, Redi-flo-3 or Fultz SP400R) constructed of stain-less steel and Teflon. When practical, the intake on the por-table submersible pump was set at a position about 10 times the diameter of the well above the top of the first screen in the well. Additionally, a stainless steel splitter was installed on top of the pump, above the check valve, allowing water to simul-taneously discharge for physicochemical properties monitor-ing and waste through Teflon or polyethylene tubing and to discharge for sample collection through a refrigeration-grade copper line. Water was pumped from domestic and municipal wells using existing pumps, and samples were collected at the
wellhead prior to installation of any pressure tanks or filtering or other treatment devices. Prior to any treatment, a connec-tion was made for purging and sampling by using a brass con-nector with compression fitting to refrigeration-grade copper tubing.
Prior to sample collection, one to three casing volumes were purged from the well, depending on well type, either observation or supply. For wells that are continuously pumped (or pumped regularly every few hours) such as those used for public supply, domestic supply, or industrial purposes, purging less than three casing volumes is permissible (U.S. Geological Survey, variously dated, chapter A4). The purge procedure removes stagnant water in the well, reduces chemical artifacts of well installation or well construction materials, or mitigates effects of infrequent pumping. After purging was complete, the physicochemical properties dissolved oxygen, pH, specific conductance, and water temperature were measured until readings were stable (U.S. Geological Survey, variously dated, appendix 2). Once readings stabilized, water samples were collected in new, pre-cleaned bottles. Water samples were
Table 1. Geologic and hydrostratigraphic units of the Gulf Coast aquifer system in Montgomery County and adjacent counties, Texas.
Wood and Gabrysch, 1965 Popkin, 1971
Holocene AlluviumBeaumont Clay
Montgomery FormationBentley Formation
Eocene Jackson Group
AlluviumBeaumont Clay
Montgomery FormationBentley Formation
Catahoula Sandstone
"Frio" Formation
Catahoula Sandstone
Anahuac Formation
Oakville Sandstone Jasper aquifer
Vicksburg Group
Jackson Group
Quate
rnar
y
Pleistocene
Oligocene
Tertia
ry
Willis Sand (?)
Heavily pumped layer
Zone 2
Fleming Formation
Zone 1
Geologic unitSystem Series Hydrostratigraphic unit
Evangeline aquifer
Fleming Formation
Ryder, 1988
Willis Sand
Goliad Sand
Chicot aquifer
Miocene
Pliocene Goliad Sand
Beaumont Clay and Alta Loma Sand
Burkeville confining unit
Catahoula Sandstone

6 Groundwater Environmental Tracer Data Collected from the Chicot, Evangeline, and Jasper Aquifers
collected and processed onsite using methods designed to minimize changes to the water-sample chemistry or contami-nation from the atmosphere. To prevent degradation of water samples and maintain the initial con centration of compounds between the time of sample collection and laboratory analyses, bottle lids were taped on, copper tubes were crimped shut, and samples were stored according to the laboratory protocols, which might include storing upside down, or storing either chilled or at room temperature.
All equipment used for the collection of the environ-mental tracers was cleaned with tap water and a native water rinse. The external parts of the submersible pump were rinsed with tap water and the interior of sample and discharge lines was rinsed with multiple volumes of native water prior to collection. The introduction of solvents, such as methanol, or detergents may impact the quality of the samples.
Analytical Methods
SF6 and CFCs analyses were done at the USGS
Chlorofluorocarbon Laboratory by using a purge-and-trap gas chromatography procedure with an electron capture detector (ECD) documented by Busenberg and Plummer (1992, 2000). 3He/3H analyses were done at the Noble Gas Laboratory of Lamont-Doherty Earth Observatory (LDEO) of Columbia University, Palisades, N.Y., using 3He-ingrowth with mass spectrometry for 3H (Clarke and others, 1976) and mass spec-trometry for 3He as described in Schlosser and others (1988) and Ekwurzel and others (1994). 3H analyses were done at the USGS Tritium Laboratory, Menlo Park, Calif., using elec-trolytic enrichment (Östlund and Werner, 1962) and liquid scintillation (Thatcher and others, 1977). Sample analysis for 4He and dissolved gases was done at the USGS Dissolved Gas Laboratory, Reston, using gas chromatography as described in Busenberg and others (1993) and Busenberg, and others (2001).
Quality Control
No blank samples were collected as part of this study due to the difficulty in preparation of tracer- and dissolved-gas-free water. For quality assurance, all samples were col-lected and analyzed as replicate samples, in accordance with standard procedure for collecting the environmental tracers specific to this report. A summary of replicate analyses and relative percent differences is not included in this report. Although samples were collected as replicate samples, all values were analyzed, reviewed and included in the deter-mination of apparent groundwater ages. Summary statistics for environmental tracers are not provided. The evaluation of an individual analyte in relation to its replicate, for example CFCs, is also dependent upon the SF
6 and/or 3He/3H result
provided. Even if a result for CFCs appears valid, it may be contradicted by evidence in one of the other environmental tracers.
Groundwater Environmental Tracer Data
Well-construction data for groundwater wells from which samples were collected and analyzed for dissolved gases and environmental tracer data in the Chicot, Evangeline, and Jasper aquifers in Montgomery County and adjacent counties are presented in appendix 1. Physicochemical data collected to help ensure that groundwater samples characterized water from the Chicot, Evangeline, and Jasper aquifers are presented in appendix 2. Dissolved-gas and environmental tracer data analyzed in groundwater samples collected from the Chicot, Evangeline and Jasper aquifers during March–September 2008 are presented in appendixes 3–7. Appendix 3 contains dissolved-gas data analyzed by the USGS Dissolved Gas Laboratory. Appendix 4 contains SF
6 and CFC data analyzed
by the USGS Chlorofluorocarbon Laboratory. Appendix 5 contains 3H data analyzed by the USGS Tritium Laboratory. Appendix 6 contains 4He data analyzed by the USGS Dissolved Gas Laboratory. Appendix 7 contains helium, tri-tium, and neon data analyzed by the Noble Gas Laboratory of LDEO of Columbia University.
Summary
The Gulf Coast aquifer system is the primary water sup-ply for Montgomery County in southeastern Texas, includ-ing part of the Houston, Texas, metropolitan area and the municipalities of Magnolia, Conroe, and The Woodlands Township, Texas. Montgomery County is forecasted to be one of the fastest growing counties in the Houston area, more than doubling its 2000 population of 373,000 by 2035. The U.S. Geological Survey (USGS), in cooperation with the Lone Star Groundwater Conservation District, conducted a study to appraise groundwater recharge in the Gulf Coast aquifer within Montgomery County and adjacent counties by using environmental tracers. The Gulf Coast aquifer system in Montgomery County consists of the Chicot, Evangeline, and Jasper aquifers, the Burkeville confining unit, and the underly-ing Catahoula Sandstone.
Of the 40 existing groundwater wells screened in the Gulf Coast aquifer system that were selected for sampling, 38 were in Montgomery County, 1 was in Waller County, and 1 was in Walker County. Groundwater-quality samples, physico-chemical properties, and water-level data were collected once from each of the 40 wells during March–September 2008. Groundwater-quality samples were analyzed for dissolved gases and the environmental tracers sulfur hexafluoride (SF
6),
chlorofluorocarbons (CFCs), tritium (3H), helium-4 (4He), and helium-3/tritium (3He/3H). Water samples were collected from wells using procedures described in the USGS “National Field Manual for the Collection of Water-Quality Data” and pro-vided by the USGS Chlorofluorocarbon Laboratory. Samples

References Cited 7
were collected and processed onsite using methods designed to minimize changes to the water-sample chemistry or con-tamination from the atmosphere. Samples were analyzed for SF
6 and CFCs at the USGS Chlorofluorocarbon Laboratory,
for 3H at the USGS Tritium Laboratory, for 3He/3H at the Noble Gas Laboratory of Lamont-Doherty Earth Observatory of Columbia University, and for 4He and dissolved gases at the USGS Dissolved Gas Laboratory. Sample procedures required replicate samples for quality assurance and quality control to be collected with each environmental sample; no blank samples were collected.
References Cited
Baker, E.T., Jr., 1979, Stratigraphic and hydrogeologic framework of part of the Coastal Plain of Texas: Texas Department of Water Resources Report 236, 43 p.
Busenberg, Eurybiades, and Plummer L.N., 1992, Use of chlo-rofluorocarbons (CCl3F and CCl2F2) as hydrologic tracers and age-dating tools—The alluvium and terrace system of Central Oklahoma: Water Resources Research, v. 28, no. 9, p. 2,257–2,283.
Busenberg, Eurybiades, and Plummer, L.N., 2000, Dating young ground water with sulfur hexafluoride—Natural and anthropogenic sources of sulfur hexafluoride: Water Resources Research, v. 36, no. 10, p. 3,011–3,030.
Busenberg, Eurybiades, Plummer, L.N., and Bartholomay, R.C., 2001, Estimated age and source of the young frac-tion of ground water at the Idaho National Engineering and Environmental Laboratory: U.S. Geological Survey Water-Resources Investigations Report 01–4265, 144 p.
Busenberg, Eurybiades, Weeks, E.P., Plummer, L.N., and Bartholomay, R.C., 1993, Age dating groundwater by use of chlorofluorocarbons (CCl3F and CCl2F2) and dis-tribution of chlorofluorocarbons in the unsaturated zone, Snake River Plain aquifer, Idaho National Engineering Laboratory, Idaho: U.S. Geological Survey Water-Resources Investigations Report 93–4054, 47 p.
Chowdhury, A.H., and Turco, M.J., 2006, Geology of the Gulf Coast aquifer, Texas, in Mace, R.E., Davidson, S.C., Angle, E.S., and Mullican, W.F., III, eds., Aquifers of the Gulf Coast of Texas: Texas Water Development Board Report 365, chap. 2, p. 23–50, accessed February 10, 2011, at http://www.twdb.state.tx.us/publications/reports/GroundWaterReports/GWReports/R365/ch02-Geology.pdf.
Clarke, W.B., Jenkins, W.J., and Top, Z., 1976, Determination of tritium by mass spectrometric measurements of 3He: Internation Journal of Applied Radiation and Isotopes, v. 27, no. 9, p. 515–522.
Ekwurzel, Brenda, Schlosser, Peter, Smethie, W.M., Jr., Plummer, L.N., Busenberg, Eurybiades, Michel, R.L., Weppernig, Ralf, and Stute, Martin, 1994, Dating of shallow groundwater—Comparison of the transient tracers 3H/3He, chlorofluorocarbons, and 85Kr: Water Resources Research, v. 30, no. 6, p. 1,693–1,708.
Houston Galveston Area Council, 2006, Houston-Galveston Area Council 2035 regional growth forecast: Houston, Tex., 20 p.
Kasmarek, M.C., Johnson, M.R., and Ramage, J.R., 2010, Water-level altitudes 2010 and water-level changes in the Chicot, Evangeline, and Jasper aquifers and compaction 1973–2009 in the Chicot and Evangeline aquifers, Houston-Galveston region, Texas: U.S. Geological Survey Scientific Investigations Map 3138, 17 p., 16 sheets, 1 appendix.
Kasmarek, M.C., and Robinson, J.L., 2004, Hydrogeology and simulation of ground-water flow and land-surface subsid-ence in the northern part of the Gulf Coast aquifer system, Texas: U.S. Geological Survey Scientific Investigations Report 2004–5102, 111 p.
National Climatic Data Center, 2010, Climate at a glance, Houston—Annual total precipitation, 1941–present: U.S. Department of Commerce, National Oceanic and Atmospheric Administration, accessed July 19, 2010, at http://www.ncdc.noaa.gov/oa/climate/research/cag3/v1.html.
Noble, J.E., Bush, P.W., Kasmarek, M.C., and Barbie, D.L, 1996, Estimated depth to water table and estimated rate of recharge in outcrops of the Chicot and Evangeline aqui-fers near Houston, Texas: U.S. Geological Survey Water-Resources Investigation Report 96–4018, 19 p.
Nolan, B.T., Healy, R.W., Taber, P.E., Perkins, Kimberlie, Hitt, K.J., and Wolock, D.M., 2007, Factors influencing ground-water recharge in the eastern United States: Journal of Hydrology v. 332, no. 1–2, p. 187–205.
Östlund, H.G., and Werner, E., 1962, Electrolytic enrich-ment of tritium and deuterium for natural tritium measure-ments—Tritium in the physical and biological sciences: Vienna, Austria, International Atomic Energy Agency, v. 1, p. 96–104.
Popkin, B.P., 1971, Groundwater resources of Montgomery County, Texas: Texas Water Development Board Report 136, 143 p.
Ryder, P.D., 1988, Hydrogeology and predevelopment flow in the Texas Gulf Coast aquifer systems: U.S. Geological Survey Water-Resources Investigations Report 87–4248, 109 p.
Schlosser, P., Stute, M., Dörr, H., Sonntag, C., and Münnich, K.O., 1988, Tritium/3He dating of shallow ground water: Earth and Planetary Science Letters, v. 89, p. 353–362.

8 Groundwater Environmental Tracer Data Collected from the Chicot, Evangeline, and Jasper Aquifers
Texas State Data Center, 2010, Estimates of the total popu-lations of counties and places in Texas for July 1, 2009 and January 1, 2010: Office of the State Demographer, Population Estimates and Projections Program, accessed February 14, 2011, at http://txsdc.utsa.edu/download/pdf/estimates/2009_txpopest_msa.pdf.
Texas Water Development Board, 2011, Historical water use information—Groundwater pumpage estimates: accessed March 14, 2011, at http://www.twdb.state.tx.us/wushistorical/DesktopDefault.aspx?PageID=2.
Thatcher, L.L., Janzer, V.J., and Edwards, K.W., 1977, Methods for determination of radioactive substances in water and fluvial sediments: U.S. Geological Survey Techniques of Water-Resources Investigations, book 5, chap. A5, 95 p.
U.S. Department of Agriculture, 1972, Soil survey of Montgomery County, Texas: U.S. Department of Agriculture, Soil Conservation Service and Forest Service, 102 p., available at http://soils.usda.gov/survey/online_surveys/texas/.
U.S. Geological Survey, variously dated, National field man-ual for the collection of water-quality data: U.S. Geological Survey Techniques of Water-Resources Investigations, book 9, chaps. A1–A9, accessed May 27, 2010, at http://pubs.water.usgs.gov/twri9A.
U.S. Geological Survey, 2009, The Reston Chlorofluorocarbon Laboratory: accessed May 27, 2010, at http://water.usgs.gov/lab/.
Wood, L.A., and Gabrysch, R.K., 1965, Analog model study of ground water in the Houston district, Texas: Texas Water Commission, Bulletin 6508, 103 p.

Appendixes 1–7

10 Groundwater Environmental Tracer Data Collected from the Chicot, Evangeline, and Jasper Aquifers
Appendix 1. Well-construction information for groundwater wells sampled in the Chicot, Evangeline, and Jasper aquifers in Montgomery County and adjacent counties, Texas, 2008.
[Station name refers to State well number (TS, Montgomery County; YU, Walker County; YW, Waller County); 4-digit identifiers are Groundwater Site Inventory components; NAVD 88, North American Vertical Datum of 1988; ft, feet; LSD, land-surface datum; in., inches; S, steel; P, polyvinyl chloride; U, unknown; --, data not available; SS, stainless steel; GI, galvanized iron; GS, galvanized steel]
Station name
Station number
Altitude of land
surface, NAVD 88
(ft)
Primary use of site
Pri-mary
use of water
Aquifer name
Well depth
(ft)
Water-level measure-ment date
Water level
below LSD (ft)
Date of construction
(C012) (C001) (C016) (C023) (C024) (C028) (C235) (C237) (C060)
TS–60–53–719 300824095274703 138 Observation Unused Chicot 120 3/12/2008 21.61 2/14/1991
TS–60–53–720 300824095274702 138 Observation Unused Chicot 85 3/13/2008 22.51 2/20/1991
TS–60–44–805 301505095343702 171 Observation Unused Chicot 161 3/17/2008 39 3/20/1991
TS–60–45–413 301948095290003 240 Observation Unused Chicot 109.5 3/19/2008 53.56 10/19/1989
TS–60–45–414 301948095290004 240 Observation Unused Chicot 80 3/19/2008 53.56 10/20/1989
TS–60–54–805 300833095173201 116 Observation Unused Chicot 165 3/21/2008 46.84 7/12/1991
TS–60–54–806 300833095173202 116 Observation Unused Chicot 128 3/24/2008 46.74 7/15/1991
TS–60–35–504 302636095422802 243 Observation Unused Evangeline 83 3/25/2008 13.60 3/5/1991
TS–60–35–505 302636095422803 243 Observation Unused Evangeline 60 3/25/2008 13.85 3/8/1991
TS–60–54–807 300833095173203 116 Observation Unused Chicot 66 3/26/2008 32.29 7/22/1991
TS–60–35–503 302636095422801 240 Observation Unused Evangeline 118 3/26/2008 13.50 3/1/1991
TS–60–44–806 301505095343703 171 Observation Unused Chicot 75 3/27/2008 37.73 3/22/1991
Appendix 1

Appendix 1 11
Appendix 1. Well-construction information for groundwater wells sampled in the Chicot, Evangeline, and Jasper aquifers in Montgomery County and adjacent counties, Texas, 2008—Continued.
Station name
Depth to top of cas-ing string
(ft)
Depth to bottom
of casing string
(ft)
Diameter of casing
string (in.)
Casing material
Depth to top of open
interval (ft)
Depth to bottom of open interval
(ft)
Diameter of open interval
(in.)
Type of material in open interval
Type of open
interval
(C012) (C077) (C078) (C079) (C080) (C083) (C084) (C087) (C086) (C085)
TS–60–53–719 0 88 6 S 100 120 4 S Screen
80 100 4 S
TS–60–53–720 0 58 6 S 65 85 4 S Screen
50 65 4 S
TS–60–44–805 0 138 6 P 141 161 4 P Screen
135 141 4 P
TS–60–45–413 0 99.5 4 P 99.5 109.5 4 P Screen
TS–60–45–414 0 70 4 P 70 80 4 P Screen
TS–60–54–805 0 139 6 S 146 165 4 S Screen
129 145 4 S
TS–60–54–806 0 106 6 S 108 128 4 S Screen
98 108 4 S
TS–60–35–504 0 59 6 P 63 83 4 P Screen
49 63 4 P
TS–60–35–505 0 39 6 P 40 60 4 P Screen
30 40 4 P
TS–60–54–807 0 56 6 S 56 66 6 S Screen
TS–60–35–503 0 97 6 P 98 118 4 P Screen
90 98 4 P
TS–60–44–806 0 53 6 P 55 75 4 P Screen
48 55 4 P

12 Groundwater Environmental Tracer Data Collected from the Chicot, Evangeline, and Jasper Aquifers
Appendix 1. Well-construction information for groundwater wells sampled in the Chicot, Evangeline, and Jasper aquifers in Montgomery County and adjacent counties, Texas, 2008—Continued.
Station name
Station number
Altitude of land
surface, NAVD 88
(ft)
Primary use of site
Primary use of water
Aquifer name
Well depth
(ft)
Water-level
measure-ment date
Water level
below LSD (ft)
Date of construc-
tion
(C012) (C001) (C016) (C023) (C024) (C028) (C235) (C237) (C060)
TS–60–26–901 303222095455301 312 Withdrawal Domestic Jasper 324 1/31/2008 115.19 10/26/2005
TS–60–26–208 303610095484501 410 Unused Unused Jasper 172 1/31/2008 146.72 8/1992
TS–60–45–513 301912095253701 195 Withdrawal Industrial Chicot 168 1/29/1977 38 1/29/1977
TS–60–34–301 302836095452701 380 Withdrawal Domestic Evangeline 52 3/17/1983 35 3/17/1983
YW–59–64–206 300542096045403 235 Withdrawal Public supply Jasper 1,240 1/23/2008 93.85 1967
TS–60–43–511 301904095414801 308 Withdrawal Public supply Evangeline 389 2/4/2008 223.54 9/1978
TS–60–63–110 300642095131701 90 Withdrawal Domestic Chicot 97 -- -- 1988
TS–60–37–309 302850095241801 390 Observation Unused Evangeline 61 -- -- 4/4/1978
TS–60–54–702 300958095221901 95 Withdrawal Industrial Chicot 95 -- -- 1983
TS–60–44–212 302014095343201 203 Withdrawal Public supply Evangeline 477 4/8/1989 70 4/8/1989
TS–60–55–710 300849095143301 112 Observation Unused Evangeline 600 7/16/2008 130.52 8/13/1991
YU–60–28–802 303143095334801 315 Observation Unused Jasper 181 7/17/2008 76.21 10/27/1989
TS–60–45–114 302040095281701 263 Withdrawal Irrigation Chicot 128 8/6/1984 51 8/6/1984

Appendix 1 13
Appendix 1. Well-construction information for groundwater wells sampled in the Chicot, Evangeline, and Jasper aquifers in Montgomery County and adjacent counties, Texas, 2008—Continued.
Station name
Depth to top of cas-ing string
(ft)
Depth to bottom
of casing string
(ft)
Diameter of casing
string (in.)
Casing material
Depth to top
of open interval
(ft)
Depth to bottom of open interval
(ft)
Diameter of open interval
(in.)
Type of material in open interval
Type of open interval
(C012) (C077) (C078) (C079) (C080) (C083) (C084) (C087) (C086) (C085)
TS–60–26–901 0 290 4 S 295 324 2.5 S Screen
285 295 2.5 S
TS–60–26–208 0 157 4 U 157 172 3 U Screen
TS–60–45–513 0 150 4 P 158 168 2.5 SS Screen
146 168 2.5 P
TS–60–34–301 0 37 2 37 47 2 P Screen
47 52 2 P
YW–59–64–206 0 10.75 U 1,111 1,229 -- U Screen
TS–60–43–511 0 347 7 S 347 389 4.5 SS Wire-wound screen
305 347 4.5 S
TS–60–63–110 0 95 85 95 -- U Screen
TS–60–37–309 0 51 4 P 51 61 -- U Screen
TS–60–54–702 0 90 4 P 80 90 4 P Screen
TS–60–44–212 0 436 5 P 457 477 2.5 U Screen
426 457 2.5 P
TS–60–55–710 -- -- -- U 570 600 4 S Screen
YU–60–28–802 0 171 4 P 171 181 4 P Screen
TS–60–45–114 0 118 4 P 118 128 2.5 S Wire-wound screen
107 128 2.5 GI

14 Groundwater Environmental Tracer Data Collected from the Chicot, Evangeline, and Jasper Aquifers
Appendix 1. Well-construction information for groundwater wells sampled in the Chicot, Evangeline, and Jasper aquifers in Montgomery County and adjacent counties, Texas, 2008—Continued.
Station name
Station number
Altitude of land
surface, NAVD 88
(ft)
Primary use of site
Primary use of water
Aquifer name
Well depth
(ft)
Water-level
measure-ment date
Water level
below LSD (ft)
Date of construc-
tion
(C012) (C001) (C016) (C023) (C024) (C028) (C235) (C237) (C060)
TS–60–53–210 301338095272301 125 Withdrawal Industrial Evangeline 222 2/24/1984 27 2/24/1984
TS–60–43–514 301917095413101 312 Withdrawal Public supply Jasper 1,050 2/4/2008 296.93 2003
TS–60–45–716 301614095284201 132 Withdrawal Recreations Evangeline 710 2/5/2008 260.30 5/30/1997
TS–60–42–902 301612095450901 281 Withdrawal Domestic Evangeline 212 7/23/1990 85 7/22/1990
TS–60–53–516 301228095272501 129 Observation Unused Evangeline 807 8/18/2008 370.48 5/21/1991
TS–60–36–410 302651095362901 205 Withdrawal Public supply Jasper 467 2/8/2008 130.39 3/27/1995
TS–60–35–907 302412095382101 238 Withdrawal Public supply Jasper 490 2/1/2008 175.48 5/14/1982
TS–60–37–806 302436095263501 280 Withdrawal Public supply Evangeline 350 1/31/2008 177.98 11/19/1984

Appendix 1 15
Appendix 1. Well-construction information for groundwater wells sampled in the Chicot, Evangeline, and Jasper aquifers in Montgomery County and adjacent counties, Texas, 2008—Continued.
Station name
Depth to top of casing
string (ft)
Depth to bottom
of casing string
(ft)
Diameter of casing string
(in.)
Casing material
Depth to top of open
interval (ft)
Depth to bottom of open interval
(ft)
Diameter of open interval
(in.)
Type of material in open interval
Type of open interval
(C012) (C077) (C078) (C079) (C080) (C083) (C084) (C087) (C086) (C085)
TS–60–53–210 0 210 4 P 212 222 2 S Screen
201 222 2 GI
TS–60–43–514 0 840 14 S 844 864 8.62 U Screen
744 844 8.62 S 874 886 8.62 U Screen
864 874 8.62 S 890 902 8.62 U Screen
886 890 8.62 S 930 940 8.62 U Screen
902 930 8.62 S 968 1,028 8.62 U Screen
940 968 8.62 S
1,028 1,050 8.62 S
TS–60–45–716 0 20 14 S 647 710 5 SS Screen
0 632 9 S
605 647 5 S
TS–60–42–902 0 182 4 P 192 212 2.5 P Perforated or slotted
177 212 2.5 P
TS–60–53–516 0 774 6 S 777 807 4 S Screen
747 777 4 S
TS–60–36–410 0 -- 5 U 444 465 -- U Screen
TS–60–35–907 0 470 6 S 470 490 4 SS Wire-wound screen
449 470 4 GI 480 490 4 SS Wire-wound screen
TS–60–37–806 0 330 4 S 330 350 3 SS Wire-wound screen
316 330 3 S

16 Groundwater Environmental Tracer Data Collected from the Chicot, Evangeline, and Jasper Aquifers
Appendix 1. Well-construction information for groundwater wells sampled in the Chicot, Evangeline, and Jasper aquifers in Montgomery County and adjacent counties, Texas, 2008—Continued.
Station name
Station number
Altitude of land
surface, NAVD 88
(ft)
Primary use of site
Primary use of water
Aquifer name
Well depth
(ft)
Water-level mea-surement
date
Water level
below LSD (ft)
Date of construc-
tion
(C012) (C001) (C016) (C023) (C024) (C028) (C235) (C237) (C060)
TS–60–37–909 302452095242001 280 Withdrawal Public supply Evangeline 515 1/31/2008 164.90 3/1985
TS–60–59–102 300658095443101 231 Withdrawal Public supply Evangeline 298 2/2/2007 108.03 12/21/2001
TS–60–51–809 300853095412701 195 Withdrawal Public supply Chicot 203 7/29/1994 59 7/27/1994
TS–60–51–8XXB 300849095412601 204 Withdrawal Public supply Chicot 203 -- -- --
TS–60–51–8XXA 300849095415701 212 Withdrawal Public supply Chicot 252 -- -- --
TS–60–52–1xx 301332095361901 216 Withdrawal Public supply Evangeline 440 -- -- --
TS–60–51–5xx 301057095421901 246 Withdrawal Public supply Evangeline 416 -- -- --

Appendix 1 17
Appendix 1. Well-construction information for groundwater wells sampled in the Chicot, Evangeline, and Jasper aquifers in Montgomery County and adjacent counties, Texas, 2008—Continued.
Station name
Depth to top of cas-ing string
(ft)
Depth to bottom
of casing string
(ft)
Diameter of casing
string (in.)
Casing material
Depth to top
of open interval
(ft)
Depth to bottom of open interval
(ft)
Diam-eter of open
interval (in.)
Type of mate-rial in open
interval
Type of open interval
(C012) (C077) (C078) (C079) (C080) (C083) (C084) (C087) (C086) (C085)
TS–60–37–909 0 470 4 U 500 515 3 U Screen
466 515 3 U
TS–60–59–102 0 275 6.88 GS 275 296 4.5 U Screen
296 298 4.5
TS–60–51–809 0 190 5 P 190 203 3 P Perforated or slotted
183 203 3 P
TS–60–51–8XXB -- -- -- U 183 -- -- U U
TS–60–51–8XXA -- -- -- U 232 -- -- U U
TS–60–52–1xx -- -- -- U 340 -- -- U U
TS–60–51–5xx -- -- -- U 384 -- -- U U

18 Groundwater Environmental Tracer Data Collected from the Chicot, Evangeline, and Jasper Aquifers
Appendix 2. Physicochemical data measured in groundwater samples collected from the Chicot, Evangeline, and Jasper aquifers in Montgomery County and adjacent counties, Texas, 2008.
[Station name refers to State well number (TS, Montgomery County; YU, Walker County; YW, Waller County); 5-digit numbers are National Water Information System parameter codes; mg/L, milligrams per liter; std, standard; µS/cm, microsiemens per centimeter at 25 degrees Celsius; °C, degrees Celsius; U, analyzed for, not detected; --, no sample; M, presence verified, not quantified; N, presumptive evidence of presence]
Station name
Station number
Sample date
Sample time
Dissolved oxygen (mg/L) (00300)
pH, std units (00400)
Specific con-ductance (µS/cm) (00095)
Water temperature
(°C) (00010)
Hydrogen sulfide,
presence/absence,
water unfiltered
(mg/L) (71875)
TS–60–53–719 300824095274703 3/12/2008 1415 3.9 5.7 627 23.3 U
TS–60–53–720 300824095274702 3/13/2008 1410 .7 8.2 602 29.1 U
TS–60–44–805 301505095343702 3/17/2008 1300 5.4 5.6 114 22.1 U
TS–60–45–413 301948095290003 3/19/2008 845 5.6 7.1 305 22.5 U
TS–60–45–414 301948095290004 3/19/2008 1215 5.6 6.7 270 24.6 --
TS–60–54–805 300833095173201 3/21/2008 1315 3.0 6.2 420 21.7 --
TS–60–54–806 300833095173202 3/24/2008 1200 2.1 6.1 466 21.5 --
TS–60–35–504 302636095422802 3/25/2008 1100 3.8 6.8 527 21.1 --
TS–60–35–505 302636095422803 3/25/2008 1330 3.6 6.0 173 20.6 --
TS–60–54–807 300833095173203 3/26/2008 900 3.6 6.8 529 21.5 --
TS–60–35–503 302636095422801 3/26/2008 1400 4.4 7.0 638 21.3 --
TS–60–44–806 301505095343703 3/27/2008 1230 3.2 5.8 648 23.0 --
TS–60–26–901 303222095455301 4/21/2008 1030 1.2 7.0 575 22.1 --
TS–60–26–208 303610095484501 4/21/2008 1400 .5 7.1 451 22.9 --
TS–60–45–513 301912095253701 4/22/2008 930 3.2 5.8 151 21.2 --
TS–60–34–301 302836095452701 4/22/2008 1330 1.6 7.0 600 22.5 --
YW–59–64–206 300542096045403 4/23/2008 1045 .4 7.6 1,270 30.9 M
TS–60–43–511 301904095414801 4/23/2008 1345 1.6 6.9 696 23.0 --
TS–60–63–110 300642095131701 4/24/2008 1530 .3 5.9 301 21.2 --
TS–60–37–309 302850095241801 4/28/2008 1200 .7 7.0 713 22.7 N
Appendix 2

Appendix 2 19
Appendix 2. Physicochemical data measured in groundwater samples collected from the Chicot, Evangeline, and Jasper aquifers in Montgomery County and adjacent counties, Texas, 2008—Continued.
Station name
Station number
Sample date
Sample time
Dissolved oxygen (mg/L) (00300)
pH, std units (00400)
Specific conduc-
tance (µS/cm) (00095)
Water tempera-
ture (°C)
(00010)
Hydrogen sulfide,
presence/ absence,
water unfiltered
(mg/L) (71875)
TS–60–54–702 300958095221901 4/30/2008 1030 1.4 5.5 114 23.1 --
TS–60–44–212 302014095343201 7/10/2008 1224 1.5 7.3 613 23.8 U
TS–60–55–710 300849095143301 7/16/2008 1630 .7 7.7 367 24.2 U
YU–60–28–802 303143095334801 7/17/2008 1620 .6 8.2 411 28.9 U
TS–60–45–114 302040095281701 7/18/2008 1135 5.6 5.2 93 23.2 U
TS–60–53–210 301338095272301 7/21/2008 935 4.0 7.2 458 22.3 U
TS–60–43–514 301917095413101 7/21/2008 1245 .9 7.2 575 27.9 --
TS–60–45–716 301614095284201 8/1/2008 845 1.3 7.5 588 25.4 M
TS–60–42–902 301612095450901 8/1/2008 1400 6.3 7.0 265 21.8 U
TS–60–53–516 301228095272501 8/18/2008 1530 .2 8.8 529 25.6 U
TS–60–36–410 302651095362901 9/2/2008 950 .4 7.0 517 23.1 U
TS–60–35–907 302412095382101 9/2/2008 1215 .7 7.1 551 24.3 U
TS–60–37–806 302436095263501 9/3/2008 1245 .3 7.0 688 22.6 --
TS–60–37–909 302452095242001 9/3/2008 1520 .3 7.1 708 23.2 --
TS–60–59–102 300658095443101 9/4/2008 915 5.3 7.4 410 22.2 --
TS–60–51–809 300853095412701 9/4/2008 1040 6.1 6.2 386 22.3 U
TS–60–51–8XXB 300849095412601 9/4/2008 1140 2.4 6.5 461 21.8 --
TS–60–51–8XXA 300849095415701 9/4/2008 1415 5.7 6.6 393 22.4 --
TS–60–52–1xx 301332095361901 9/5/2008 900 .3 7.5 460 22.2 --
TS–60–51–5xx 301057095421901 9/5/2008 1035 .4 7.3 615 23.5 --

20 Groundwater Environmental Tracer Data Collected from the Chicot, Evangeline, and Jasper Aquifers
Appendix 3
Appendix 3. Dissolved-gas concentrations measured in groundwater samples collected from the Chicot, Evangeline, and Jasper aquifers in Montgomery County and adjacent counties, Texas, 2008 (samples analyzed by the U.S. Geological Survey Dissolved Gas Laboratory, Reston, Virginia).
[Station name refers to State well number (TS, Montgomery County; YU, Walker County; YW, Waller County); mg/L, milligrams per liter; °C, degrees Celsius; cc STP/L, cubic centimeters at standard temperature and pressure per liter; <, less than; >, greater than; --, not determined]
Station name
Station number
Sample date
Sample time
Nitrogen (N2)
(mg/L)
Argon (Ar)
(mg/L)
Oxygen (O2)
(mg/L)
Carbon dioxide
(CO2) (mg/L)
Methane (CH4)
(mg/L)
Recharge tempera-
ture (°C)
Excess air in water sample
(cc STP/L)TS–60–53–719 300824095274703 3/12/2008 1415 18.56 0.64 2.86 132.12 <0.0005 16.3 2.8
TS–60–53–719 300824095274703 3/12/2008 1415 18.69 .64 3.00 131.55 <.0005 16.3 2.9
TS–60–53–720 300824095274702 3/13/2008 1410 14.87 .53 .20 0.40 .8389 23.5 1.0
TS–60–53–720 300824095274702 3/13/2008 1410 14.72 .53 .20 0.35 .9841 23.6 .9
TS–60–44–805 301505095343702 3/17/2008 1300 18.79 .66 5.06 94.30 <.0005 14.3 2.4
TS–60–44–805 301505095343702 3/17/2008 1300 18.93 .66 4.21 95.22 <.0005 14.2 2.5
TS–60–45–413 301948095290003 3/19/2008 845 18.83 .64 3.12 7.47 .0082 16.3 3.1
TS–60–45–413 301948095290003 3/19/2008 845 18.94 .65 2.70 9.57 .0072 16.1 3.2
TS–60–45–414 301948095290004 3/19/2008 1215 19.30 .64 4.69 58.95 <.0005 18.1 4.1a
TS–60–45–414 301948095290004 3/19/2008 1215 17.90 .61 4.37 69.15 <.0005 18.5 2.8
TS–60–54–805 300833095173201 3/21/2008 1315 20.58 .69 1.62 117.19 <.0005 14.0 4.1
TS–60–54–805 300833095173201 3/21/2008 1315 19.63 .68 1.56 116.94 <.0005 14.2 3.2
TS–60–54–806 300833095173202 3/24/2008 1200 20.07 .68 1.02 134.31 .0014 14.0 3.6
TS–60–54–806 300833095173202 3/24/2008 1200 19.56 .68 1.01 137.12 .0015 14.1 3.0
TS–60–35–504 302636095422802 3/25/2008 1100 18.11 .62 1.98 49.93 <.0005 17.7 2.8
TS–60–35–504 302636095422802 3/25/2008 1100 18.09 .62 1.96 49.88 <.0005 17.3 2.7
TS–60–35–505 302636095422803 3/25/2008 1330 19.59 .64 2.90 83.67 <.0005 18.7 4.6
TS–60–35–505 302636095422803 3/25/2008 1330 19.19 .63 2.87 81.76 <.0005 18.7 4.2
TS–60–35–503 302636095422801 3/26/2008 1400 16.96 .60 2.80 36.52 <.0005 18.5 1.9
TS–60–35–503 302636095422801 3/26/2008 1400 17.03 .60 2.61 36.65 <.0005 18.7 2.0
TS–60–54–807 300833095173203 3/26/2008 900 19.85 .66 .82 62.17 .0064 17.3 4.4
TS–60–54–807 300833095173203 3/26/2008 900 20.86 .69 .82 64.98 .0053 15.7 4.9
TS–60–44–806 301505095343703 3/27/2008 1230 20.58 .70 .89 119.88 <.0005 13.6 4.0
TS–60–44–806 301505095343703 3/27/2008 1230 20.17 .69 .60 116.06 <.0005 13.6 3.6
TS–60–26–208 303610095484501 4/21/2008 1400 19.19 .65 .25 21.10 <.0005 16.2 3.6
TS–60–26–208 303610095484501 4/21/2008 1400 18.98 .65 .25 20.80 <.0005 16.2 3.4
TS–60–26–901 303222095455301 4/21/2008 1030 18.30 .63 .23 32.68 .0049 17.2 2.9
TS–60–26–901 303222095455301 4/21/2008 1030 18.19 .63 .26 32.66 .0058 17.2 2.8
TS–60–45–513 301912095253701 4/22/2008 930 19.60 .68 3.22 94.40 <.0005 13.4 2.9
TS–60–45–513 301912095253701 4/22/2008 930 19.49 .68 3.20 95.05 <.0005 13.4 2.8

Appendix 3 21
Appendix 3. Dissolved-gas concentrations measured in groundwater samples collected from the Chicot, Evangeline, and Jasper aquifers in Montgomery County and adjacent counties, Texas, 2008 (samples analyzed by the U.S. Geological Survey Dissolved Gas Laboratory, Reston, Virginia)—Continued.
Station name
Station number
Sample date
Sample time
Nitrogen (N2)
(mg/L)
Argon (Ar)
(mg/L)
Oxygen (O2)
(mg/L)
Carbon dioxide
(CO2) (mg/L)
Methane (CH4)
(mg/L)
Re-charge
tempera-ture (°C)
Excess air in water sample
(cc STP/L)
TS–60–34–301 302836095452701 4/22/2008 1330 18.71 0.64 0.49 26.81 0.0230 15.9 2.9
TS–60–34–301 302836095452701 4/22/2008 1330 18.56 .64 .38 26.68 .0222 16.4 2.9
YW-59–64–206 300542096045403 4/23/2008 1045 8.23 .31 .07 20.86 >40 -- --
YW-59–64–206 300542096045403 4/23/2008 1045 8.08 .30 .07 20.85 >40 -- --
TS–60–43–511 301904095414801 4/23/2008 1345 17.57 .61 1.36 41.81 <.0005 17.6 2.2
TS–60–43–511 301904095414801 4/23/2008 1345 17.29 .61 1.27 45.63 <.0005 17.9 2.1
TS–60–63–110 300642095131701 4/24/2008 1530 19.70 .68 .26 106.26 .0012 13.9 3.1
TS–60–63–110 300642095131701 4/24/2008 1530 19.72 .68 .25 106.44 .0011 13.8 3.1
TS–60–37–309 302850095241801 4/28/2008 1200 20.71 .70 .56 43.48 <.0005 12.5 3.9
TS–60–37–309 302850095241801 4/28/2008 1200 20.41 .70 .46 43.99 <.0005 12.8 3.7
TS–60–54–702 300958095221901 4/30/2008 1030 20.78 .66 1.44 81.11 <.0005 18.9 5.8
TS–60–54–702 300958095221901 4/30/2008 1030 20.44 .66 1.51 79.67 <.0005 18.8 5.4
TS–60–44–212 302014095343201 7/10/2008 1224 20.58 .72 .25 20.02 .0015 11.1 3.1
TS–60–44–212 302014095343201 7/10/2008 1224 20.47 .71 .23 19.92 .0016 11.5 3.1
TS–60–44–212 302014095343201 7/10/2008 1224 20.40 .71 .25 19.96 .0012 11.5 3.1
TS–60–55–710 300849095143301 7/16/2008 1630 18.44 .64 .24 5.05 <.0005 15.7 2.5
TS–60–55–710 300849095143301 7/16/2008 1630 18.48 .64 .23 5.05 <.0005 15.7 2.5
YU–60–28–802 303143095334801 7/17/2008 1620 17.70 .62 .23 2.20 .0778 16.7 2.1
YU–60–28–802 303143095334801 7/17/2008 1620 17.62 .62 .24 3.10 .0750 16.9 2.1
TS–60–45–114 302040095281701 7/18/2008 1135 17.30 .61 3.89 96.76 <.0005 17.0 1.8
TS–60–45–114 302040095281701 7/18/2008 1135 16.74 .60 4.65 88.45 <.0005 17.2 1.3
TS–60–53–210 301338095272301 7/21/2008 935 19.52 .66 1.20 18.35 <.0005 16.0 3.7
TS–60–53–210 301338095272301 7/21/2008 935 19.61 .66 .52 19.22 <.0005 16.0 3.7
TS–60–43–514 301917095413101 7/21/2008 1245 20.15 .70 .26 25.23 .0124 11.7 3.0
TS–60–43–514 301917095413101 7/21/2008 1245 19.77 .69 .26 24.78 .0122 12.1 2.7
TS–60–45–716 301614095284201 8/1/2008 845 20.52 .72 .24 21.26 .0053 11.1 3.0
TS–60–45–716 301614095284201 8/1/2008 845 20.21 .71 .23 21.16 .0045 11.2 2.7
TS–60–42–902 301612095450901 8/1/2008 1400 19.41 .66 2.52 47.01 <.0005 15.9 3.6
TS–60–42–902 301612095450901 8/1/2008 1400 19.51 .66 3.25 46.65 <.0005 16.0 3.7
TS–60–53–516 301228095272501 8/18/2008 1530 20.06 .70 .21 1.10 2.3809 11.9 2.8
TS–60–53–516 301228095272501 8/18/2008 1530 20.04 .70 .23 1.38 2.3926 12.0 2.8

22 Groundwater Environmental Tracer Data Collected from the Chicot, Evangeline, and Jasper Aquifers
Appendix 3. Dissolved-gas concentrations measured in groundwater samples collected from the Chicot, Evangeline, and Jasper aquifers in Montgomery County and adjacent counties, Texas, 2008 (samples analyzed by the U.S. Geological Survey Dissolved Gas Laboratory, Reston, Virginia)—Continued.
Station name
Station number
Sample date
Sample time
Nitrogen (N2)
(mg/L)
Argon (Ar)
(mg/L)
Oxygen (O2)
(mg/L)
Carbon dioxide
(CO2) (mg/L)
Meth-ane
(CH4) (mg/L)
Recharge tempera-
ture (°C)
Excess air in water sample
(cc STP/L)
TS–60–36–410 302651095362901 9/2/2008 950 18.23 0.63 0.23 17.39 0.0111 16.9 2.7
TS–60–36–410 302651095362901 9/2/2008 950 18.24 .63 .23 17.44 .0109 16.5 2.6
TS–60–35–907 302412095382101 9/2/2008 1215 19.28 .67 .25 21.03 .0090 13.4 2.6
TS–60–35–907 302412095382101 9/2/2008 1215 19.65 .68 .26 21.32 .0089 13.3 2.9
TS–60–37–806 302436095263501 9/3/2008 1245 20.36 .65 1.06 38.35 .0038 18.5 a5.4
TS–60–37–806 302436095263501 9/3/2008 1245 17.13 .60 .22 37.45 .0039 18.8 2.1
TS–60–37–909 302452095242001 9/3/2008 1520 17.17 .59 .22 29.48 .0027 19.9 2.5
TS–60–37–909 302452095242001 9/3/2008 1520 17.19 .59 .22 29.40 .0023 2.1 2.6
TS–60–59–102 300658095443101 9/4/2008 915 17.91 .62 .83 14.17 <.0005 17.7 2.6
TS–60–59–102 300658095443101 9/4/2008 915 17.83 .61 .78 13.94 <.0005 18.2 2.7
TS–60–51–809 300853095412701 9/4/2008 1040 16.72 .60 1.55 67.56 <.0005 18.3 1.5
TS–60–51–809 300853095412701 9/4/2008 1040 16.70 .59 1.67 68.06 <.0005 18.6 1.6
TS–60–51–8XXB 300849095412601 9/4/2008 1140 16.59 .59 1.41 45.81 <.0005 18.4 1.4
TS–60–51–8XXB 300849095412601 9/4/2008 1140 16.64 .59 1.64 45.61 <.0005 18.4 1.5
TS–60–51–8XXA 300849095415701 9/4/2008 1415 16.80 .59 5.05 4.96 <.0005 18.5 1.7
TS–60–51–8XXA 300849095415701 9/4/2008 1415 16.91 .60 5.21 41.08 <.0005 18.2 1.7
TS–60–52–1xx 301332095361901 9/5/2008 900 19.23 .67 .25 8.97 .0014 13.9 2.7
TS–60–52–1xx 301332095361901 9/5/2008 900 19.31 .67 .25 8.99 .0010 13.5 2.7
TS–60–51–5xx 301057095421901 9/5/2008 1035 19.18 .65 .26 15.09 <.0005 15.8 3.3
TS–60–51–5xx 301057095421901 9/5/2008 1035 19.06 .65 .26 15.02 <.0005 15.7 3.1a Slight leak in bottle.

Appendix 4 23
Appendix 4
Appendix 4. Sulfur hexafluoride and chlorofluorocarbons measured in groundwater samples collected from the Chicot, Evangeline, and Jasper aquifers in Montgomery County and adjacent counties, Texas, 2008 (samples analyzed by the U.S. Geological Survey Chlorofluorocarbon Laboratory, Reston, Virginia).
[Station name refers to State well number (TS, Montgomery County; YU, Walker County; YW, Waller County); 5-digit numbers are National Water Informa-tion System parameter codes; fg/kg, femtogram per kilogram; CFC, chlorofluorocarbon; pg/kg, picogram per kilogram; U, analyzed for, not detected; B, bottle broken in transit or at laboratory; --, no sample]
Station name
Station number
Sample date
Sample time
Sulfur hexafluoride,
water, unfiltered
(fg/kg) (63149)
CFC–113, for age dating,
water, unfiltered
(pg/kg) (50283)
CFC–12, for age dating,
water, unfiltered
(pg/kg) (50282)
CFC–11, for age dating,
water, unfiltered
(pg/kg) (50281)
TS–60–53–719 300824095274703 3/12/2008 1416 28.8 U 1.4 1.4
TS–60–53–719 300824095274703 3/12/2008 1417 20.1 U 1.2 1.3
TS–60–53–720 300824095274702 3/13/2008 1411 105 U 120 1.1
TS–60–53–720 300824095274702 3/13/2008 1412 105 U 120 1.1
TS–60–44–805 301505095343702 3/17/2008 1301 16.7 .3 2.4 4.1
TS–60–44–805 301505095343702 3/17/2008 1302 16.2 .6 3.3 3.3
TS–60–45–413 301948095290003 3/19/2008 846 19.6 13 14 33
TS–60–45–413 301948095290003 3/19/2008 847 B 18 16 31
TS–60–45–414 301948095290004 3/19/2008 1216 38.4 20 130 190
TS–60–45–414 301948095290004 3/19/2008 1217 40.4 21 140 190
TS–60–45–414 301948095290004 3/19/2008 1218 -- 22 120 200
TS–60–54–805 300833095173201 3/21/2008 1316 31.4 1.1 18 19
TS–60–54–805 300833095173201 3/21/2008 1317 14.9 1.1 18 17
TS–60–54–806 300833095173202 3/24/2008 1201 18.9 1 20 13
TS–60–54–806 300833095173202 3/24/2008 1202 10.5 1 18 11
TS–60–35–504 302636095422802 3/25/2008 1101 53 .1 7.2 11
TS–60–35–504 302636095422802 3/25/2008 1102 52.5 U 7.4 12
TS–60–35–505 302636095422803 3/25/2008 1331 35.3 1.9 27 41
TS–60–35–505 302636095422803 3/25/2008 1332 37.2 1.7 39 39
TS–60–35–505 302636095422803 3/25/2008 1333 -- 1.5 26 38

24 Groundwater Environmental Tracer Data Collected from the Chicot, Evangeline, and Jasper Aquifers
Appendix 4. Sulfur hexafluoride and chlorofluorocarbons measured in groundwater samples collected from the Chicot, Evangeline, and Jasper aquifers in Montgomery County and adjacent counties, Texas, 2008 (samples analyzed by the U.S. Geological Survey Chlorofluorocarbon Laboratory, Reston, Virginia)—Continued.
Station name
Station number
Sample date
Sample time
Sulfur hexafluoride,
water, unfiltered
(fg/kg) (63149)
CFC–113, for age dating,
water, unfiltered
(pg/kg) (50283)
CFC–12, for age dating,
water, unfiltered
(pg/kg) (50282)
CFC–11, for age dating,
water, unfiltered
(pg/kg) (50281)
TS–60–54–807 300833095173203 3/26/2008 901 37.2 10 130 82
TS–60–54–807 300833095173203 3/26/2008 902 B 9 130 79
TS–60–54–807 300833095173203 3/26/2008 903 -- 8.1 120 72
TS–60–35–503 302636095422801 3/26/2008 1401 49.8 .8 1 10
TS–60–35–503 302636095422801 3/26/2008 1402 49.9 U .4 1
TS–60–35–503 302636095422801 3/26/2008 1403 -- U 1.2 2.9
TS–60–44–806 301505095343703 3/27/2008 1231 12 18 22 28
TS–60–44–806 301505095343703 3/27/2008 1232 24.3 25 22 41
TS–60–44–806 301505095343703 3/27/2008 1233 -- 25 22 29
TS–60–26–901 303222095455301 4/21/2008 1031 12.1 .3 4.1 2.6
TS–60–26–901 303222095455301 4/21/2008 1032 12.7 .4 2.9 5.4
TS–60–26–901 303222095455301 4/21/2008 1033 -- .4 2.8 1.4
TS–60–26–208 303610095484501 4/21/2008 1401 75.9 U .9 3.2
TS–60–26–208 303610095484501 4/21/2008 1402 86.2 U .9 3.4
TS–60–45–513 301912095253701 4/22/2008 931 23.8 .6 1.3 4.1
TS–60–45–513 301912095253701 4/22/2008 932 20.9 .6 3.3 11
TS–60–45–513 301912095253701 4/22/2008 933 -- .3 1.4 3.5
TS–60–34–301 302836095452701 4/22/2008 1331 31 1.9 11 16
TS–60–34–301 302836095452701 4/22/2008 1332 26.8 1.5 10 11
TS–60–34–301 302836095452701 4/22/2008 1333 -- 1.8 9.7 14
YW–59–64–206 300542096045403 4/23/2008 1046 11.9 .2 1.3 3.5
YW–59–64–206 300542096045403 4/23/2008 1047 8.35 U 1.4 3.1

Appendix 4 25
Appendix 4. Sulfur hexafluoride and chlorofluorocarbons measured in groundwater samples collected from the Chicot, Evangeline, and Jasper aquifers in Montgomery County and adjacent counties, Texas, 2008 (samples analyzed by the U.S. Geological Survey Chlorofluorocarbon Laboratory, Reston, Virginia)—Continued.
Station name
Station number
Sample date
Sample time
Sulfur hexafluoride,
water, unfiltered
(fg/kg) (63149)
CFC–113, for age dating,
water, unfiltered
(pg/kg) (50283)
CFC–12, for age dating,
water, unfiltered
(pg/kg) (50282)
CFC–11, for age dating,
water, unfiltered
(pg/kg) (50281)
TS–60–43–511 301904095414801 4/23/2008 1346 84.5 0.6 1.5 7.5
TS–60–43–511 301904095414801 4/23/2008 1347 86.3 .6 1.5 8
TS–60–63–110 300642095131701 4/24/2008 1531 19.4 1.2 15 8.3
TS–60–63–110 300642095131701 4/24/2008 1532 15.1 1.5 14 5.6
TS–60–37–309 302850095241801 4/28/2008 1201 23.6 2.3 13 15
TS–60–37–309 302850095241801 4/28/2008 1202 27 1.1 8.5 12
TS–60–37–309 302850095241801 4/28/2008 1203 -- 5.5 16 16
TS–60–54–702 300958095221901 4/30/2008 1031 63.8 12 78 140
TS–60–54–702 300958095221901 4/30/2008 1032 65.6 13 81 140
TS–60–44–212 302014095343201 7/10/2008 1225 13.8 1.1 1.7 5.1
TS–60–44–212 302014095343201 7/10/2008 1226 15.2 1.3 1.9 7.7
TS–60–55–710 300849095143301 7/16/2008 1631 60.6 3.2 2.5 7.7
TS–60–55–710 300849095143301 7/16/2008 1632 49.3 3.3 1.6 2.6
YU–60–28–802 303143095334801 7/17/2008 1621 66.4 10 27 4.8
YU–60–28–802 303143095334801 7/17/2008 1622 54.1 9.2 25 7.7
TS–60–45–114 302040095281701 7/18/2008 1136 28.5 6.9 170 81
TS–60–45–114 302040095281701 7/18/2008 1137 30.3 7.5 170 83
TS–60–53–210 301338095272301 7/21/2008 936 54.2 1.8 8.4 5.8
TS–60–53–210 301338095272301 7/21/2008 937 56.7 1.9 8 6.9
TS–60–53–210 301338095272301 7/21/2008 938 -- 3.1 9.9 13

26 Groundwater Environmental Tracer Data Collected from the Chicot, Evangeline, and Jasper Aquifers
Appendix 4. Sulfur hexafluoride and chlorofluorocarbons measured in groundwater samples collected from the Chicot, Evangeline, and Jasper aquifers in Montgomery County and adjacent counties, Texas, 2008 (samples analyzed by the U.S. Geological Survey Chlorofluorocarbon Laboratory, Reston, Virginia)—Continued.
Station name
Station number
Sample date
Sample time
Sulfur hexafluoride,
water, unfiltered
(fg/kg) (63149)
CFC–113, for age dating,
water, unfiltered
(pg/kg) (50283)
CFC–12, for age dating,
water, unfiltered
(pg/kg) (50282)
CFC–11, for age dating,
water, unfiltered
(pg/kg) (50281)
TS–60–43–514 301917095413101 7/21/2008 1246 18.1 1 0.9 U
TS–60–43–514 301917095413101 7/21/2008 1247 21.5 3.1 2.5 3.6
TS–60–43–514 301917095413101 7/21/2008 1248 -- 2 2.8 3.8
TS–60–45–716 301614095284201 8/1/2008 846 13 4.7 3 U
TS–60–45–716 301614095284201 8/1/2008 847 9.1 6 3.8 .1
TS–60–42–902 301612095450901 8/1/2008 1401 43.8 4.3 19 22
TS–60–42–902 301612095450901 8/1/2008 1402 42.5 3.8 20 22
TS–60–53–516 301228095272501 8/18/2008 1531 82.9 U 3.1 1.7
TS–60–53–516 301228095272501 8/18/2008 1532 79.8 U 3.4 2.1
TS–60–36–410 302651095362901 9/2/2008 951 10.2 .6 1.9 2.3
TS–60–36–410 302651095362901 9/2/2008 952 14.1 .6 1.5 2.4
TS–60–35–907 302412095382101 9/2/2008 1216 10.8 .6 1.6 2.8
TS–60–35–907 302412095382101 9/2/2008 1217 12.9 .4 1.6 1.9
TS–60–37–806 302436095263501 9/3/2008 1246 11.7 12 53 32
TS–60–37–806 302436095263501 9/3/2008 1247 14.7 4.4 2.1 3.3
TS–60–37–806 302436095263501 9/3/2008 1248 -- 2.3 3.1 4.4
TS–60–37–909 302452095242001 9/3/2008 1521 10.9 U .9 1.7
TS–60–37–909 302452095242001 9/3/2008 1522 6.1 U 1.5 3.1
TS–60–59–102 300658095443101 9/4/2008 916 42.8 1.4 1.9 3.4
TS–60–59–102 300658095443101 9/4/2008 917 41.2 1.6 8.7 8.8
TS–60–59–102 300658095443101 9/4/2008 918 -- U 1.7 3.6

Appendix 4 27
Appendix 4. Sulfur hexafluoride and chlorofluorocarbons measured in groundwater samples collected from the Chicot, Evangeline, and Jasper aquifers in Montgomery County and adjacent counties, Texas, 2008 (samples analyzed by the U.S. Geological Survey Chlorofluorocarbon Laboratory, Reston, Virginia)—Continued.
Station name
Station number
Sample date
Sample time
Sulfur hexafluoride,
water, unfiltered
(fg/kg) (63149)
CFC–113, for age dating,
water, unfiltered
(pg/kg) (50283)
CFC–12, for age dating,
water, unfiltered
(pg/kg) (50282)
CFC–11, for age dating,
water, unfiltered
(pg/kg) (50281)
TS–60–51–809 300853095412701 9/4/2008 1041 25.7 1.5 3.8 5
TS–60–51–809 300853095412701 9/4/2008 1042 18.3 1 3.9 5.8
TS–60–51–8XXB 300849095412601 9/4/2008 1141 25.4 U 1.8 3.1
TS–60–51–8XXB 300849095412601 9/4/2008 1142 28.8 U 3.1 2.9
TS–60–51–8XXB 300849095412601 9/4/2008 1143 -- .6 5.4 4.7
TS–60–51–8XXA 300849095415701 9/4/2008 1416 40.4 U 360 1.8
TS–60–51–8XXA 300849095415701 9/4/2008 1417 38.2 U 350 2.2
TS–60–52–1xx 301332095361901 9/5/2008 901 5.2 U 1.1 1.5
TS–60–52–1xx 301332095361901 9/5/2008 902 11.1 U 1.5 2.05
TS–60–51–5xx 301057095421901 9/5/2008 1036 54.4 U 1.1 .8
TS–60–51–5xx 301057095421901 9/5/2008 1037 62.8 2.7 2.3 2.6
TS–60–51–5xx 301057095421901 9/5/2008 1038 -- U 1.4 2.4

28 Groundwater Environmental Tracer Data Collected from the Chicot, Evangeline, and Jasper Aquifers
Appendix 5
Appendix 5. Tritium measured in groundwater samples collected from the Chicot, Evangeline, and Jasper aquifers in Montgomery County and adjacent counties, Texas, 2008 (samples analyzed by the U.S. Geological Survey Tritium Laboratory, Menlo Park, California).
[Station name refers to State well number (TS, Montgomery County; YU, Walker County; YW, Waller County); 07000, National Water Information parameter code; pCi/L, picocuries per liter; ssLc, sample specific critical level; R, radiochemical non-detect]
Station name
Station number
Sample date
Sample start time
Tritium, water,
unfiltered (pCi/L) (07000)
ssLcAnalysis
date
TS–60–53–719 300824095274703 3/12/2008 1415 R0.2 0.35 10/28/2009
TS–60–53–720 300824095274702 3/13/2008 1410 R-.1 .32 10/21/2009
TS–60–44–805 301505095343702 3/17/2008 1300 R0 .32 10/21/2009
TS–60–45–413 301948095290003 3/19/2008 845 .7 .32 10/21/2009
TS–60–45–414 301948095290004 3/19/2008 1215 5.5 .32 10/21/2009
TS–60–54–805 300833095173201 3/21/2008 1315 1.3 .32 10/21/2009
TS–60–54–806 300833095173202 3/24/2008 1200 R.2 .32 10/21/2009
TS–60–35–504 302636095422802 3/25/2008 1100 1.9 .32 10/21/2009
TS–60–35–505 302636095422803 3/25/2008 1330 7 .32 10/21/2009
TS–60–54–807 300833095173203 3/26/2008 900 .4 .32 10/21/2009
TS–60–35–503 302636095422801 3/26/2008 1400 R-.2 .32 10/21/2009
TS–60–44–806 301505095343703 3/27/2008 1230 .6 .32 10/21/2009
TS–60–26–901 303222095455301 4/21/2008 1030 R-.3 .32 10/21/2009
TS–60–26–208 303610095484501 4/21/2008 1400 R.1 .32 10/21/2009
TS–60–45–513 301912095253701 4/22/2008 930 R-.3 .38 10/28/2009
TS–60–34–301 302836095452701 4/22/2008 1330 R0 .38 10/28/2009
YW–59–64–206 300542096045403 4/23/2008 1045 R.1 .38 10/28/2009
TS–60–43–511 301904095414801 4/23/2008 1345 R0 .41 10/28/2009
TS–60–63–110 300642095131701 4/24/2008 1530 .5 .41 10/28/2009
TS–60–37–309 302850095241801 4/28/2008 1200 R.2 .35 10/28/2009

Appendix 5 29
Appendix 5. Tritium measured in groundwater samples collected from the Chicot, Evangeline, and Jasper aquifers in Montgomery County and adjacent counties, Texas, 2008 (samples analyzed by the U.S. Geological Survey Tritium Laboratory, Menlo Park, California)—Continued.
Station name
Station number
Sample date
Sample start time
Tritium, water,
unfiltered (pCi/L) (07000)
ssLcAnalysis
date
TS–60–54–702 300958095221901 4/30/2008 1030 9.4 0.38 10/28/2009
TS–60–44–212 302014095343201 7/10/2008 1224 .4 .35 10/28/2009
TS–60–55–710 300849095143301 7/16/2008 1630 .5 .32 11/7/2009
YU–60–28–802 303143095334801 7/17/2008 1620 R.2 .32 11/7/2009
TS–60–45–114 302040095281701 7/18/2008 1135 5.8 .32 11/7/2009
TS–60–53–210 301338095272301 7/21/2008 935 R.3 .32 11/7/2009
TS–60–43–514 301917095413101 7/21/2008 1245 R0 .35 11/7/2009
TS–60–45–716 301614095284201 8/1/2008 845 R.3 .35 11/7/2009
TS–60–42–902 301612095450901 8/1/2008 1400 R-.2 .35 11/7/2009
TS–60–53–516 301228095272501 8/18/2008 1530 R.1 .35 11/7/2009
TS–60–36–410 302651095362901 9/2/2008 950 .7 .32 11/7/2009
TS–60–35–907 302412095382101 9/2/2008 1215 .5 .32 11/7/2009
TS–60–37–806 302436095263501 9/3/2008 1245 R.2 .32 11/7/2009
TS–60–37–909 302452095242001 9/3/2008 1520 R.2 .32 11/7/2009
TS–60–59–102 300658095443101 9/4/2008 915 .8 .32 11/7/2009
TS–60–51–809 300853095412701 9/4/2008 1040 .5 .32 11/7/2009
TS–60–51–8XXB 300849095412601 9/4/2008 1140 .5 .38 10/28/2009
TS–60–51–8XXA 300849095415701 9/4/2008 1415 R.1 .32 11/7/2009
TS–60–52–1xx 301332095361901 9/5/2008 900 R.3 .38 10/28/2009
TS–60–51–5xx 301057095421901 9/5/2008 1035 R0 .38 10/28/2009

30 Groundwater Environmental Tracer Data Collected from the Chicot, Evangeline, and Jasper Aquifers
Appendix 6
Appendix 6. Helium-4 measured in groundwater samples collected from the Chicot, Evangeline, and Jasper aquifers in Montgomery County and adjacent counties, Texas, 2008 (samples analyzed by the U.S. Geological Survey Dissolved Gas Laboratory, Reston, Virginia).
[Station name refers to State well number (TS, Montgomery County; YU, Walker County; YW, Waller County); cc/g STP, cubic centimeter per gram at standard temperature and pressure; H
2O, water]
Station name
Station number
Sample date
Sample time
Helium-4, (cc/g STP H2O)
TS–60–53–719 300824095274703 3/12/2008 1415 71 x 10-9
TS–60–53–720 300824095274702 3/13/2008 1410 57 x 10-9
TS–60–44–805 301505095343702 3/17/2008 1300 63 x 10-9
TS–60–45–413 301948095290003 3/19/2008 845 73 x 10-9
TS–60–45–414 301948095290004 3/19/2008 1215 68 x 10-9
TS–60–54–805 300833095173201 3/21/2008 1315 62 x 10-9
TS–60–54–806 300833095173202 3/24/2008 1200 65 x 10-9
TS–60–35–504 302636095422802 3/25/2008 1100 69 x 10-9
TS–60–35–505 302636095422803 3/25/2008 1330 83 x 10-9
TS–60–54–807 300833095173203 3/26/2008 900 75 x 10-9
TS–60–35–503 302636095422801 3/26/2008 1400 61 x 10-9
TS–60–44–806 301505095343703 3/27/2008 1230 61 x 10-9
TS–60–26–901 303222095455301 4/21/2008 1030 78 x 10-9
TS–60–26–208 303610095484501 4/21/2008 1400 74 x 10-9
TS–60–45–513 301912095253701 4/22/2008 930 73 x 10-9
TS–60–34–301 302836095452701 4/22/2008 1330 86 x 10-9
YW–59–64–206 300542096045403 4/23/2008 1045 723 x 10-9
TS–60–43–511 301904095414801 4/23/2008 1345 80 x 10-9
TS–60–63–110 300642095131701 4/24/2008 1530 75 x 10-9
TS–60–37–309 302850095241801 4/28/2008 1200 73 x 10-9

Appendix 6 31
Appendix 6. Helium-4 measured in groundwater samples collected from the Chicot, Evangeline, and Jasper aquifers in Montgomery County and adjacent counties, Texas, 2008 (samples analyzed by the U.S. Geological Survey Dissolved Gas Laboratory, Reston, Virginia)—Continued.
Station name
Station number
Sample date
Sample time
Helium-4, (cc/g STP H2O)
TS–60–54–702 300958095221901 4/30/2008 1030 75 x 10-9
TS–60–44–212 302014095343201 7/10/2008 1224 219 x 10-9
TS–60–55–710 300849095143301 7/16/2008 1630 90 x 10-9
YU–60–28–802 303143095334801 7/17/2008 1620 76 x 10-9
TS–60–45–114 302040095281701 7/18/2008 1135 61 x 10-9
TS–60–53–210 301338095272301 7/21/2008 935 83 x 10-9
TS–60–43–514 301917095413101 7/21/2008 1245 313 x 10-9
TS–60–45–716 301614095284201 8/1/2008 845 198 x 10-9
TS–60–42–902 301612095450901 8/1/2008 1400 54 x 10-9
TS–60–53–516 301228095272501 8/18/2008 1530 458 x 10-9
TS–60–36–410 302651095362901 9/2/2008 950 144 x 10-9
TS–60–35–907 302412095382101 9/2/2008 1215 167 x 10-9
TS–60–37–806 302436095263501 9/3/2008 1245 83 x 10-9
TS–60–37–909 302452095242001 9/3/2008 1520 75 x 10-9
TS–60–59–102 300658095443101 9/4/2008 915 72 x 10-9
TS–60–51–809 300853095412701 9/4/2008 1040 63 x 10-9
TS–60–51–8XXB 300849095412601 9/4/2008 1140 61 x 10-9
TS–60–51–8XXA 300849095415701 9/4/2008 1415 65 x 10-9
TS–60–52–1xx 301332095361901 9/5/2008 900 219 x 10-9
TS–60–51–5xx 301057095421901 9/5/2008 1035 170 x 10-9

32 Groundwater Environmental Tracer Data Collected from the Chicot, Evangeline, and Jasper Aquifers
Appendix 7
Appendix 7. Helium, tritium, and neon measured in groundwater samples collected from the Chicot, Evangeline, and Jasper aquifers in Montgomery County and adjacent county, Texas, 2008 (samples analyzed by the Noble Gas Laboratory of Lamont-Doherty Earth Observatory of Columbia University, Palisades, New York).
[Station name refers to State well number (TS, Montgomery County; YU, Walker County); TU, tritium unit; 1σ, combined standard uncertainty; δ, delta; %, percent; cc STP/g, cubic centimeters at standard temperature and pressure per gram; H
2O, water; --, not analyzed; a, terrigenic helium; b, negative delta neon
value; c, high helium in tritium bulb; d, possible gas fractionation; e, helium broken; f, sampled pumped, high gas pressure; g, possible air contamination during sampling; h, delta helium and delta neon equal, gas loss during sampling or in situ; i, low tritium sample; j, improper seal on copper tube or ends deformed; k, no second sample received; l, sample cannot be dated, low tritium and high terrigenic helium concentrations indicate “old water”]
Station namea
Sample date
Sample time
Helium extraction
date
Helium measure-ment date
Channel 1 tritium
(TU)
Channel 1 tritium error (1σ)
Channel 2 tritium
(TU)
Channel 2 tritium error (1σ)
Tritium from bottle
sample (TU)
Tritium error from
bottle sample
(1σ)
TS–60–53–719 3/12/2008 1415 9/10/2008 9/12/2008 0.20 0.06 -- -- 0.04 0.05
TS–60–53–720 3/13/2008 1410 9/12/2008 10/2/2008 .32 .06 -- -- .07 .06
TS–60–44–805 3/17/2008 1300 9/10/2008 9/11/2008 .14 .06 -- -- .04 .05
TS–60–45–413 3/19/2008 845 -- -- .35 .07 -- -- .34 .05
TS–60–45–414 3/19/2008 1215 9/10/2008 9/11/2008 1.84 .07 -- -- 2.02 .07
TS–60–54–805 3/21/2008 1315 9/10/2008 9/12/2008 .52 .06 -- -- .60 .05
TS–60–54–806 3/24/2008 1200 9/10/2008 9/12/2008 .24 .05 -- -- .17 .05
TS–60–35–504 3/25/2008 1100 9/10/2008 9/11/2008 .00 .04 -- -- .83 .05
TS–60–35–505 3/25/2008 1330 9/12/2008 10/2/2008 -1.81 .09 -- -- 2.24 .06
TS–60–54–807 3/26/2008 900 9/10/2008 9/12/2008 .28 .05 -- -- .04 .04
TS–60–35–503 3/26/2008 1400 9/10/2008 9/12/2008 .12 .06 -- -- .05 .05
TS–60–44–806 3/27/2008 1230 9/12/2008 10/2/2008 -.02 .04 -- -- .38 .06

Appendix 7 33
Appendix 7. Helium, tritium, and neon measured in groundwater samples collected from the Chicot, Evangeline, and Jasper aquifers in Montgomery County and adjacent county, Texas, 2008 (samples analyzed by the Noble Gas Laboratory of Lamont-Doherty Earth Observatory of Columbia University, Palisades, New York)—Continued.
Station namea
δ Helium-3 uncorrected
(%)
δ Percent helium-3
error (1s)
Helium-4 (cc STP/g H20)
δ Helium-4, 1σ (+/- cc STP/g H20)
Neon (cc STP/g H20)
δ Neon, 1σ (+/- cc STP/g H20)
Lab comments
TS–60–53–719 -6.23 0.31 5.96E-08 2.20E-10 1.56E-07 8.10E-10 a,b
TS–60–53–720 -5.02 .02 5.91E-08 1.00E-10 2.31E-07 7.60E-10 a,c
TS–60–44–805 -7.39 .15 6.27E-08 9.00E-11 3.03E-07 1.41E-08 a,c,d
TS–60–45–413 -- -- -- -- -- -- e,f
TS–60–45–414 15.27 .15 5.68E-08 8.00E-11 28.713 1.313 d
TS–60–54–805 5.95 .30 5.98E-08 2.20E-10 5.16E-07 5.41E-09 d,g
TS–60–54–806 .03 .30 6.69E-08 2.50E-10 1.89E-07 1.03E-09 a
TS–60–35–504 18.49 .15 5.92E-08 8.00E-11 2.909E-07 1.362E-08 a
TS–60–35–505 42.32 .17 6.42E-08 1.10E-10 2.612E-07 8.700E-10 c,h
TS–60–54–807 .15 .31 6.01E-08 2.20E-10 2.55E-07 2.01E-09 d
TS–60–35–503 -10.54 .31 5.88E-08 2.20E-10 2.326E-07 1.370E-09 h,i
TS–60–44–806 2.73 .18 6.28E-08 1.10E-10 2.67E-07 8.80E-10 d

34 Groundwater Environmental Tracer Data Collected from the Chicot, Evangeline, and Jasper Aquifers
Appendix 7. Helium, tritium, and neon measured in groundwater samples collected from the Chicot, Evangeline, and Jasper aquifers in Montgomery County and adjacent county, Texas, 2008 (samples analyzed by the Noble Gas Laboratory of Lamont-Doherty Earth Observatory of Columbia University, Palisades, New York)—Continued.
Station namea
Sample date
Sample time
Helium extraction
date
Helium measure-ment date
Channel 1 tritium
(TU)
Channel 1 tritium error (1σ)
Channel 2 tritium
(TU)
Channel 2 tritium error (1σ)
Tritium from
bottle sample
(TU)
Tritium error from
bottle sample
(1σ)
TS–60–26–901 4/21/2008 1030 9/12/2008 10/2/2008 0.16 0.06 -- -- -0.32 0.05
TS–60–26–208 4/21/2008 1400 9/12/2008 10/2/2008 .04 .05 -- -- .08 .06
TS–60–45–513 4/22/2008 930 9/12/2008 10/2/2008 .15 .05 2.02 0.05 .06 .05
TS–60–34–301 4/22/2008 1330 9/12/2008 10/2/2008 .11 .06 -- -- .04 .05
TS–60–43–511 4/23/2008 1345 9/12/2008 10/2/2008 .19 .05 -- -- -.11 .05
TS–60–63–110 4/24/2008 1530 10/22/2008 12/22/2008 -- -- -- -- .08 .05
TS–60–37–309 4/28/2008 1200 -- -- -- -- .09 .06 .05 .05
TS–60–54–702 4/30/2008 1030 10/22/2008 12/22/2008 2.77 .08 -- -- 2.50 .07
TS–60–55–710 7/16/2008 1630 2/16/2009 6/1/2009 .08 .13 -- -- .10 .06
YU–60–28–802 7/17/2008 1620 2/16/2009 6/1/2009 -.08 .13 .08 .06 .09 .06
TS–60–45–114 7/18/2008 1135 2/16/2009 6/1/2009 1.57 .14 -- -- 1.72 .07
TS–60–53–210 7/21/2008 935 2/16/2009 6/1/2009 -.02 .13 .06 .05 .06 .05

Appendix 7 35
Appendix 7. Helium, tritium, and neon measured in groundwater samples collected from the Chicot, Evangeline, and Jasper aquifers in Montgomery County and adjacent county, Texas, 2008 (samples analyzed by the Noble Gas Laboratory of Lamont-Doherty Earth Observatory of Columbia University, Palisades, New York)—Continued.
Station namea
δ Helium-3
uncorrected (%)
δ Percent helium-3
error (1s)
Helium-4 (cc STP/g H20)
δ Helium-4, 1σ (+/- cc STP/g H20)
Neon (cc STP/g H20)
δ Neon, 1σ (+/- cc STP/g H20)
Lab comments
TS–60–26–901 -14.06 0.02 6.57E-08 1.20E-10 2.397E-07 8.000E-10 a,i
TS–60–26–208 -6.66 .02 6.90E-08 1.20E-10 2.584E-07 8.600E-10 a,i
TS–60–45–513 -11.43 .18 6.70E-08 1.10E-10 2.468E-07 8.200E-10 a,c
TS–60–34–301 -25.03 .18 7.67E-08 1.30E-10 2.380E-07 8.000E-10 a,i
TS–60–43–511 -23.25 .20 3.70E-08 7.00E-11 9.049E-08 3.000E-10 a,h,i
TS–60–63–110 -2.08 .46 6.38E-08 3.30E-10 2.480E-07 8.300E-10 j
TS–60–37–309 -- -- -- -- -- -- j,k
TS–60–54–702 40.14 .05 6.16E-08 3.10E-10 2.558E-07 8.400E-10 d
TS–60–55–710 -26.25 .18 8.78E-08 9.00E-11 2.596E-07 3.390E-09 a,i,l
YU–60–28–802 -26.08 .02 7.64E-08 6.00E-11 2.291E-07 2.600E-09 a,i,l
TS–60–45–114 32.1 .04 5.42E-08 3.00E-11 2.180E-07 2.570E-09
TS–60–53–210 -11.5 .23 7.23E-08 6.00E-11 2.593E-07 3.390E-09 a,i,l

36 Groundwater Environmental Tracer Data Collected from the Chicot, Evangeline, and Jasper Aquifers
Appendix 7. Helium, tritium, and neon measured in groundwater samples collected from the Chicot, Evangeline, and Jasper aquifers in Montgomery County and adjacent county, Texas, 2008 (samples analyzed by the Noble Gas Laboratory of Lamont-Doherty Earth Observatory of Columbia University, Palisades, New York)—Continued.
Station namea
Sample date
Sample time
Helium extraction
date
Helium measure-ment date
Channel 1 tritium
(TU)
Channel 1 tritium error (1σ)
Channel 2 tritium
(TU)
Channel 2 tritium error (1σ)
Tritium from
bottle sample
(TU)
Tritium error from
bottle sample
(1σ)
TS–60–45–716 8/1/2008 845 2/16/2009 6/1/2009 -0.02 0.12 -- -- 0.08 0.05
TS–60–42–902 8/1/2008 1400 2/16/2009 6/1/2009 .08 .13 -- -- .10 .06
TS–60–36–410 9/2/2008 950 2/16/2009 6/1/2009 -.01 .10 -- -- .07 .05
TS–60–35–907 9/2/2008 1215 2/18/2009 5/31/2009 -.08 .14 -- -- .01 .05
TS–60–37–806 9/3/2008 1245 2/18/2009 5/31/2009 .07 .15 -- -- .15 .06
TS–60–37–909 9/3/2008 1520 2/18/2009 5/31/2009 .23 .12 -- -- .04 .06
TS–60–59–102 9/4/2008 915 2/18/2009 6/1/2009 -.05 .13 -- -- .21 .06
TS–60–51–809 9/4/2008 1040 2/18/2009 6/1/2009 .00 .10 -- -- .07 .06
TS–60–51–8XXB 9/4/2008 1140 2/18/2009 6/1/2009 .02 .13 -- -- -.11 .06
TS–60–51–8XXA 9/4/2008 1415 2/18/2009 6/1/2009 -.01 .11 -- -- .07 .05
TS–60–51–5xx 9/5/2008 1035 2/19/2009 5/31/2009 .17 .14 -- -- .14 .06
a Samples from five wells not analyzed due to excess helium.
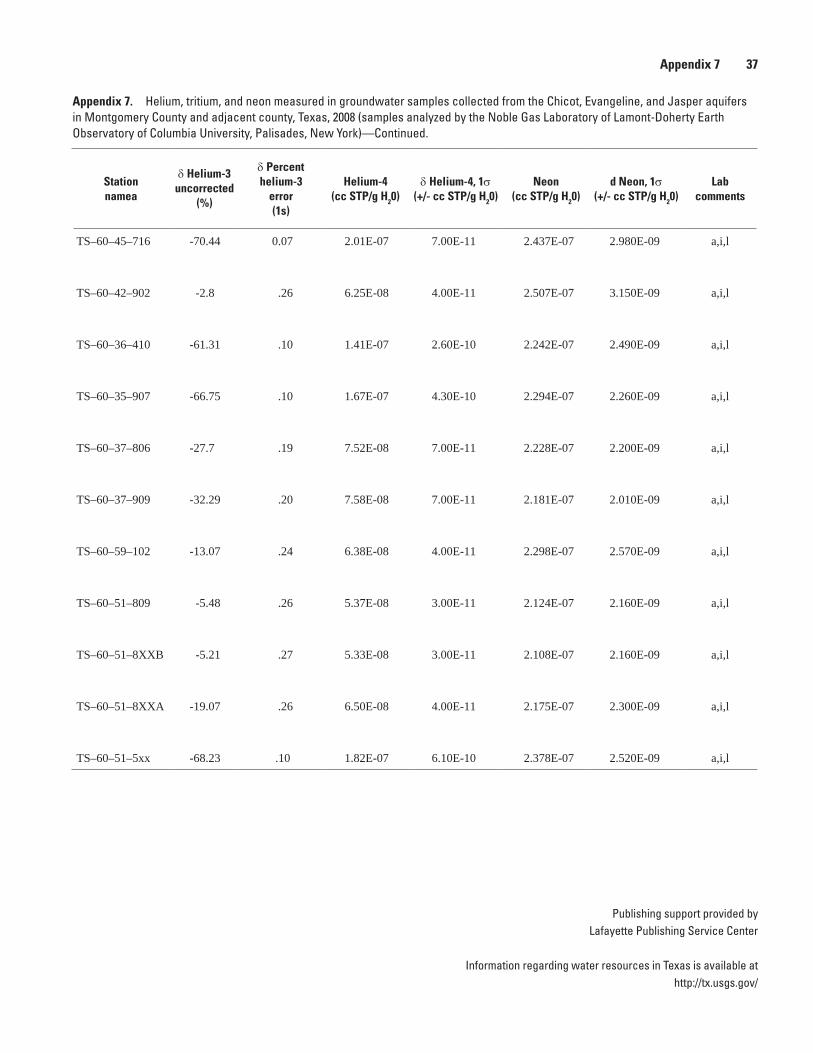
Appendix 7 37
Appendix 7. Helium, tritium, and neon measured in groundwater samples collected from the Chicot, Evangeline, and Jasper aquifers in Montgomery County and adjacent county, Texas, 2008 (samples analyzed by the Noble Gas Laboratory of Lamont-Doherty Earth Observatory of Columbia University, Palisades, New York)—Continued.
Station namea
δ Helium-3
uncorrected (%)
δ Percent helium-3
error (1s)
Helium-4 (cc STP/g H20)
δ Helium-4, 1σ (+/- cc STP/g H20)
Neon (cc STP/g H20)
d Neon, 1σ (+/- cc STP/g H20)
Lab comments
TS–60–45–716 -70.44 0.07 2.01E-07 7.00E-11 2.437E-07 2.980E-09 a,i,l
TS–60–42–902 -2.8 .26 6.25E-08 4.00E-11 2.507E-07 3.150E-09 a,i,l
TS–60–36–410 -61.31 .10 1.41E-07 2.60E-10 2.242E-07 2.490E-09 a,i,l
TS–60–35–907 -66.75 .10 1.67E-07 4.30E-10 2.294E-07 2.260E-09 a,i,l
TS–60–37–806 -27.7 .19 7.52E-08 7.00E-11 2.228E-07 2.200E-09 a,i,l
TS–60–37–909 -32.29 .20 7.58E-08 7.00E-11 2.181E-07 2.010E-09 a,i,l
TS–60–59–102 -13.07 .24 6.38E-08 4.00E-11 2.298E-07 2.570E-09 a,i,l
TS–60–51–809 -5.48 .26 5.37E-08 3.00E-11 2.124E-07 2.160E-09 a,i,l
TS–60–51–8XXB -5.21 .27 5.33E-08 3.00E-11 2.108E-07 2.160E-09 a,i,l
TS–60–51–8XXA -19.07 .26 6.50E-08 4.00E-11 2.175E-07 2.300E-09 a,i,l
TS–60–51–5xx -68.23 .10 1.82E-07 6.10E-10 2.378E-07 2.520E-09 a,i,l
Publishing support provided byLafayette Publishing Service Center
Information regarding water resources in Texas is available at http://tx.usgs.gov/

Oden—Groundw
ater Environmental Tracer Data Collected from
the Chicot, Evangeline, and Jasper Aquifers—DS 580
Printed on recycled paper