Water and water supply have been a hot topic in the news, and rightfully so considering how essential water is to our economies, our communities, our recreation. I am going to focus on a statewide perspective, some trends that help understand the broader context, but more importantly who is responsible for managing it. The short answer is all of us. I have a number of maps and graphs that will help paint a picture for you.
DNR Strategies
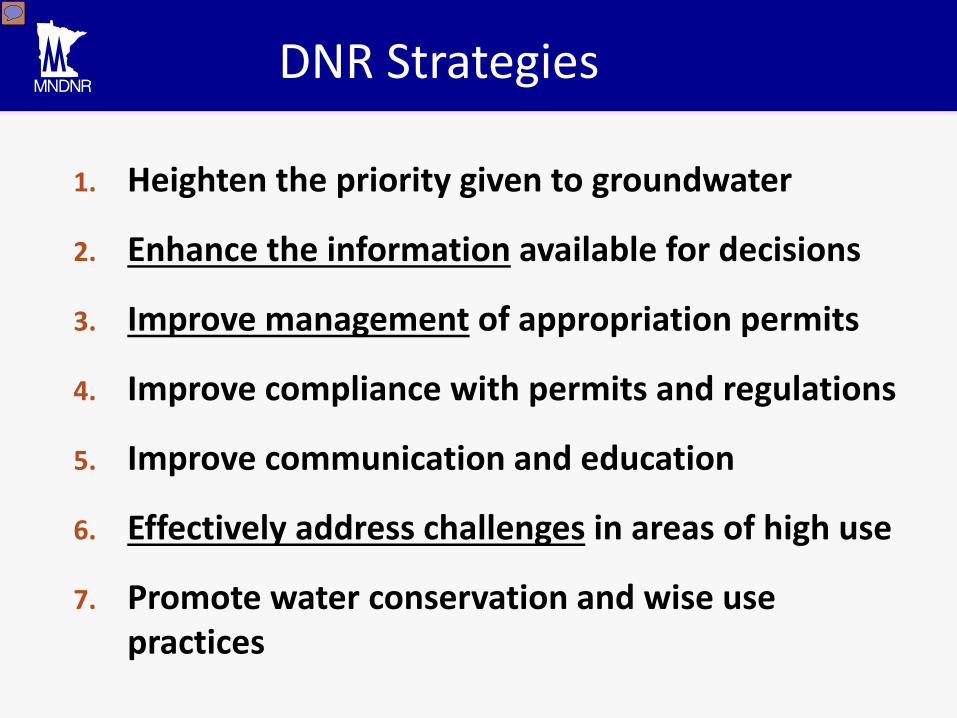
1. Heighten the priority given to groundwater
2. Enhance the information available for decisions
3. Improve management of appropriation permits
4. Improve compliance with permits and regulations
5. Improve communication and education
6. Effectively address challenges in areas of high use
7. Promote water conservation and wise use practices
Presenter
Presentation Notes
DNR identified 7 Core Strategies that we are using to improve and manage groundwater sustainably. These strategies can also be used by others to help guide their own efforts. Making this issue a higher priority, setting clear objectives and implementation strategies Technical understanding, deepen our knowledge about the relationships of surface waters and groundwater, enhanced monitoring networks and modelling Improve coordination among agencies, improve our evaluation process for permits, incorporate information about well head protection, source water protection, surface water management, contamination sources, population growth, etc… Improving compliance with permits and regulations is focused on making sure that people and organizations have the necessary permits and that water use is reported accurately. We need to enlist the help of others by improving our communication efforts and education about this poorly understood resource. We also recognize that some areas of the state are facing these challenges now or will be very soon. We have initiated three Groundwater Management Areas. We think it makes sense to bring the water users together to collectively understand the problem, the risk, the information and potential for change. We believe that some fairly simple measures for conservation and wise use can go a long way toward solving these problems. Minnesotan’s use a lot of water per capita. In other parts of the country people, businesses and communities are adapting and innovating. Some Minnesota communities and water users are also leading the way, but we need to do more.
Groundwater: At Risk of Overuse and Contamination
Presenter
Presentation Notes
The first part of the presentation will focus on what we are understanding about Minnesota’s groundwater resources. When it comes to water quantity, for the most part we are not in a crisis like California and other parts of the southwest. A pressing problem “urgency room” but not the emergency room When it comes to contamination there are in fact some parts of the state that are in a crisis. Communities have had to replace wells, or build expensive new treatment systems to deal with nitrates and other contamination issues. Individual homeowners are having issues, installing filtration systems.
0
50
100
150
200
250
300
350
Bill
ions
of G
allo
ns
Year
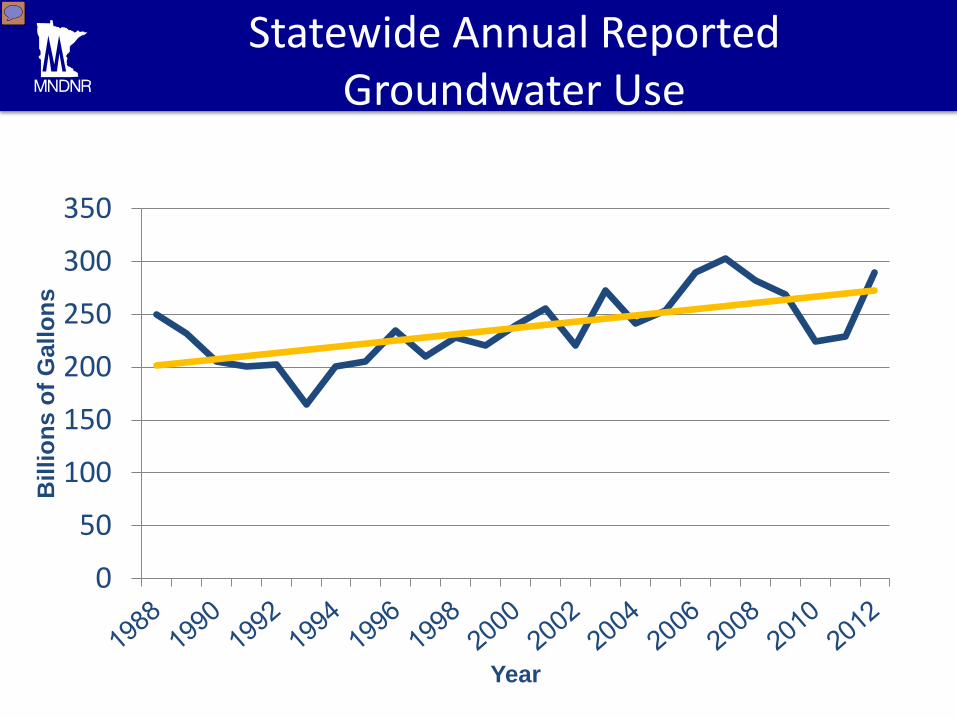
Statewide Annual Reported Groundwater Use
Presenter
Presentation Notes
On average we are using about 75 billion gallons more groundwater per year than we were 25 years ago, growing at about 3 billion gallons per year. Our water use fluctuates from year to year depending on the amount of summertime precipitation, which also illustrates that a large fraction of the water we use is for irrigation (including residential lawns, golf courses, crop and non-crop irrigation).
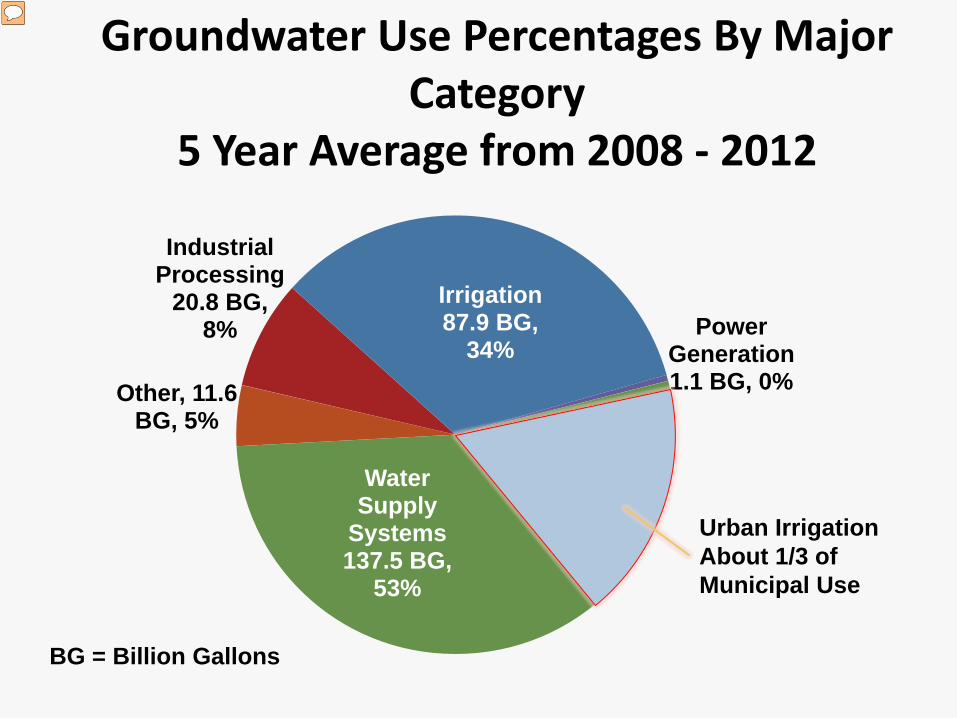
Groundwater Use Percentages By Major Category
5 Year Average from 2008 - 2012
BG = Billion Gallons
Other, 11.6 BG, 5%
Industrial Processing
20.8 BG, 8%
Irrigation 87.9 BG,
34% Power
Generation 1.1 BG, 0%
Water Supply
Systems 137.5 BG,
53%
Urban Irrigation About 1/3 of Municipal Use
Presenter
Presentation Notes
On average, a little more than half of the groundwater we use is for our water supply systems. These would largely be municipal or rural water suppliers. This water goes to homes and businesses to meet our potable water needs and also non-crop irrigation. Agricultural and non-agricultural irrigation accounts for about a third of the annual groundwater use. Industrial processing comes in at about 8%, and the rest goes to a variety of other use categories. You’ll note that power generation is a very small percentage for groundwater. Power generation relies heavily on river water for turbines and cooling. It’s important to note that groundwater supplies the base flow for many rivers in the state and ultimately the power generating facilities.
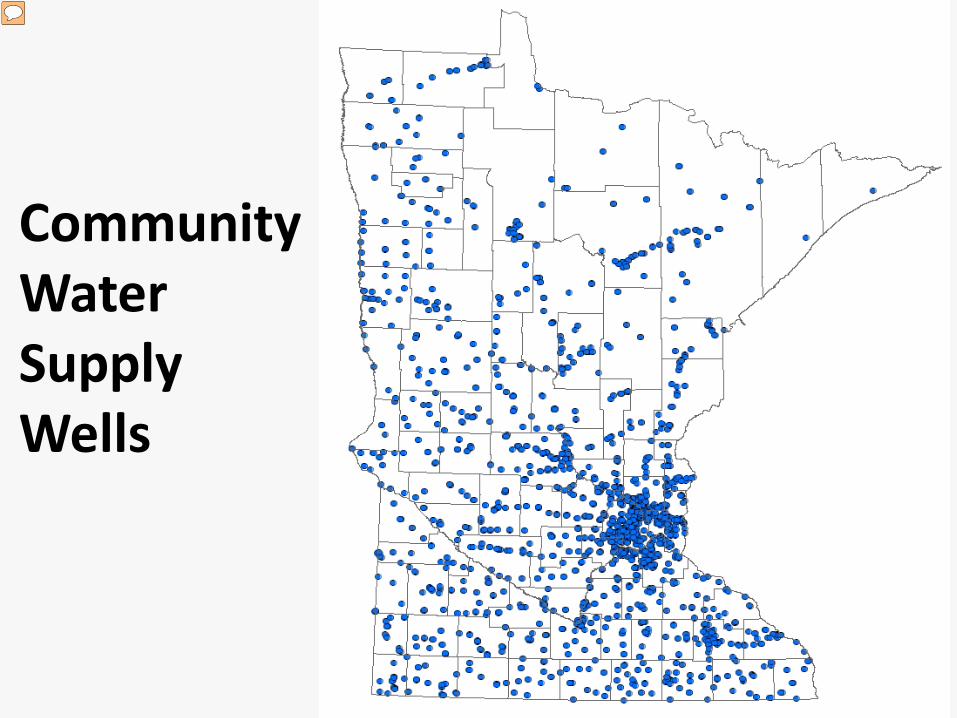
Community Water Supply Wells
Presenter
Presentation Notes
Every county in the state has at least one but public water supply well, most counties have dozens. In other words, its’ important everywhere. The MN Dept. of Health and DNR estimate that about 75% of Minnesotans rely on groundwater to meet their drinking water needs.
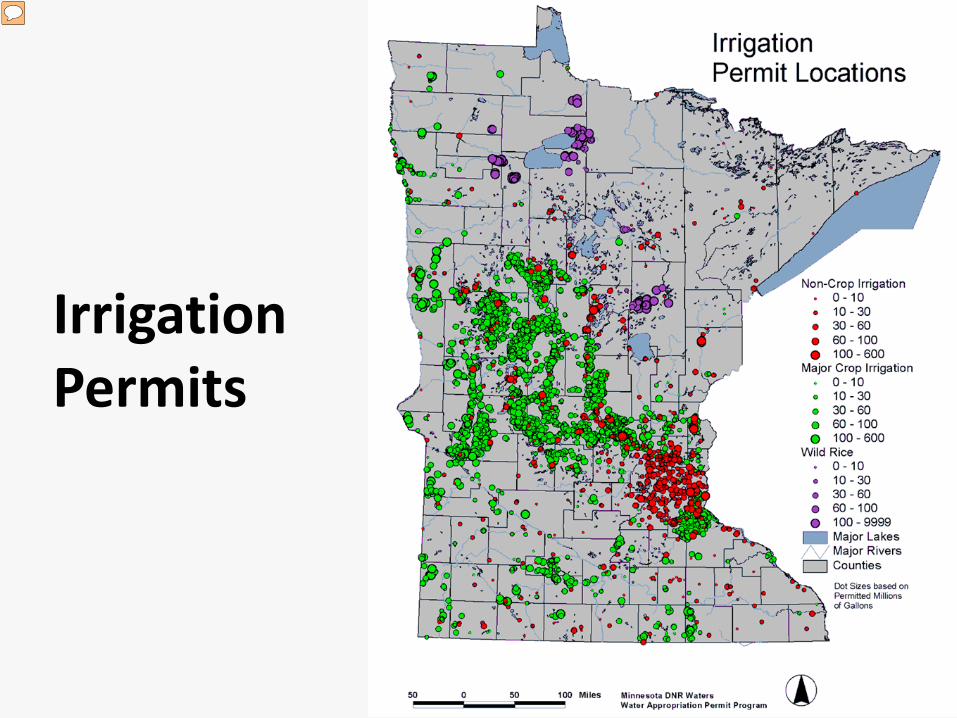
Irrigation Permits
Presenter
Presentation Notes
This map of irrigation permits really illustrates the extent and distribution of various types of irrigation uses, ranging from major crops, wild rice, non-crop irrigation. The local geology and soils play a major role influencing the demand for water. The use of groundwater for agricultural and other forms of irrigation is extremely important to those activities.
Presenter
Presentation Notes
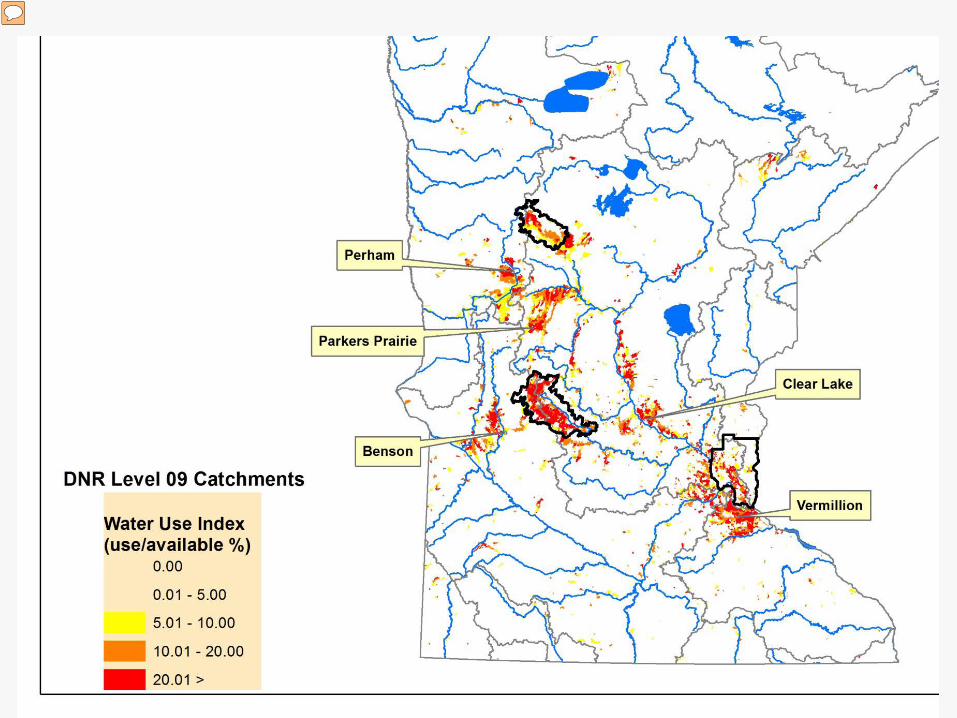
This map shows the relative intensity of water use. The darker the color the more intense the consumption of water in that watershed area. The result can be significant reduction in stream flows, lower water levels in lakes and wetlands. The map is not intended say there is a problem, but it does help us anticipate where problems are more likely to occur. Available Water = Mean Annual Flow Mean Annual Flow is a hydrologic indicator and influences ecological resources Water Use - Cumulative (from upstream catchments) reported use Mean Annual Flow - Mean Annual Flow is estimated using: stream gage data (90 gages), current and lagged annual precipitation, current and lagged average temperature, geographic coordinates, year, and drainage area. Index is average for years 2007-2011 Data available from 1989-2011
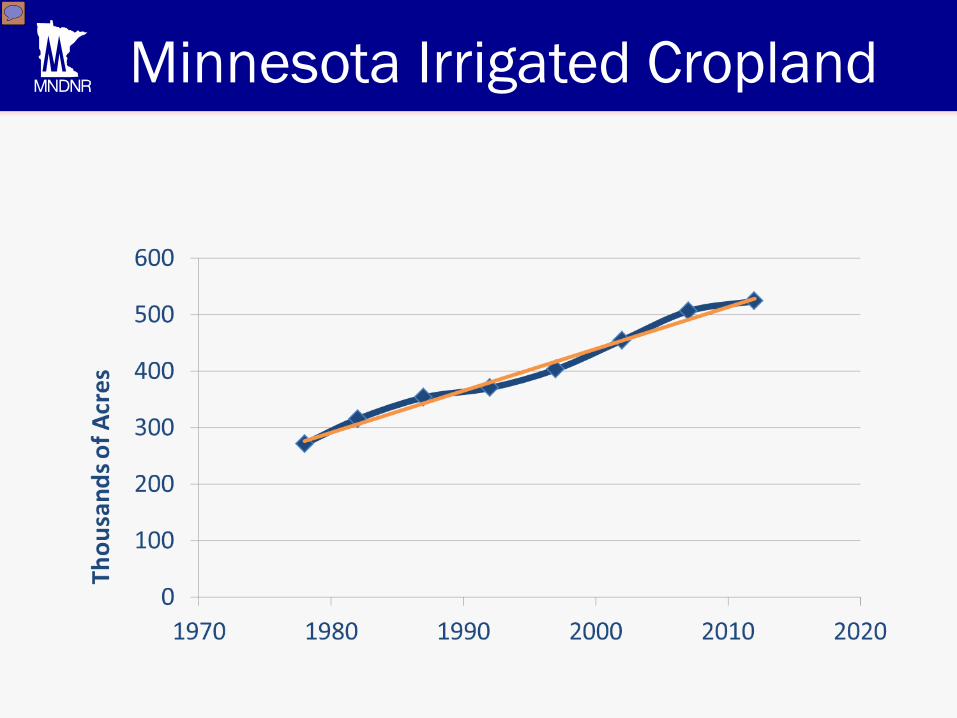
Minnesota Irrigated Cropland
Presenter
Presentation Notes
This graph illustrates one of the largest growing categories of water use. Over the past 37 years the irrigated acreage has nearly doubled.. While still a small percentage of total agricultural land (about 3% of the approximately 21.7 million acres), the use of water for irrigation tends to be concentrated in sandy soils that don’t hold water very well. The DNR received about 1,100 new permit applications for agricultural irrigation in 2013 and 2014 (see next slide). Permits average about 110 acres per application. This uptick in irrigation may have added about another 121,000 acres to the 2012 total.
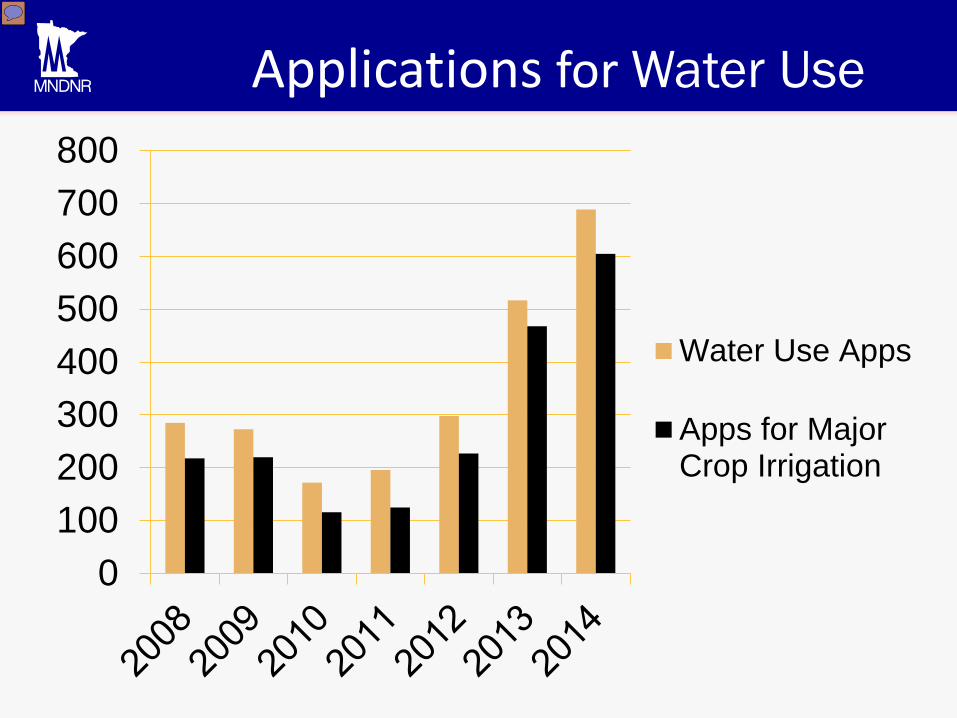
Applications for Water Use
0100200300400500600700800
Water Use Apps
Apps for MajorCrop Irrigation
Presenter
Presentation Notes
This graph shows that the demand for water is increasing, as evident by the number of new permit applications.
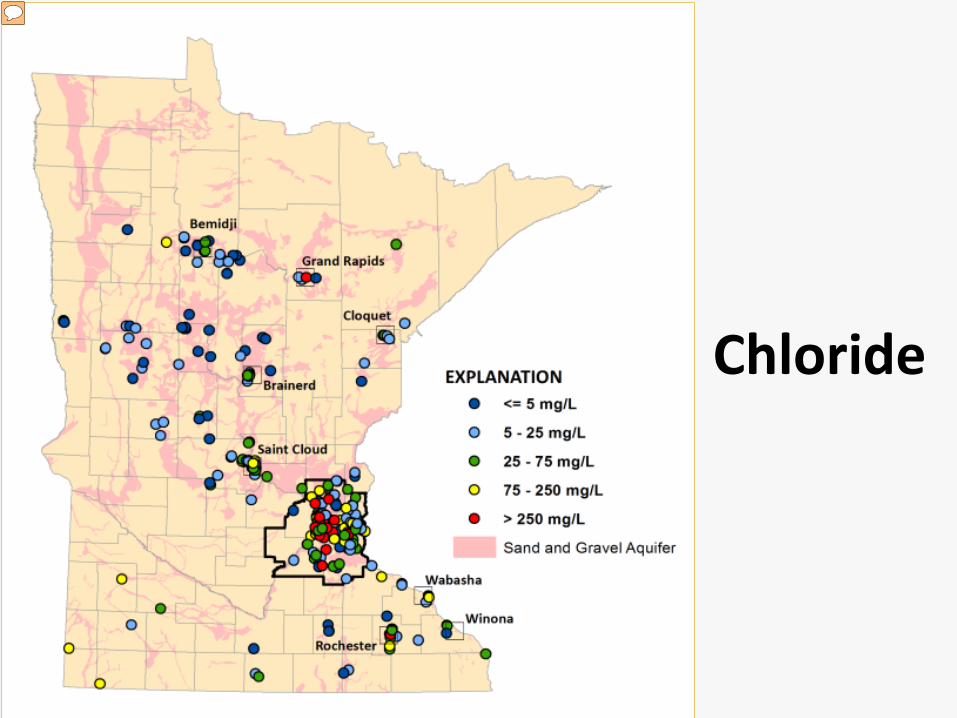
Chloride
Presenter
Presentation Notes
The use of groundwater isn’t the only issue, the quality of water is also at risk, which has implications for meeting our water supply needs. This map shows the concentration of chloride that is now showing up in groundwater. The primary source is road salt. Source: MPCA
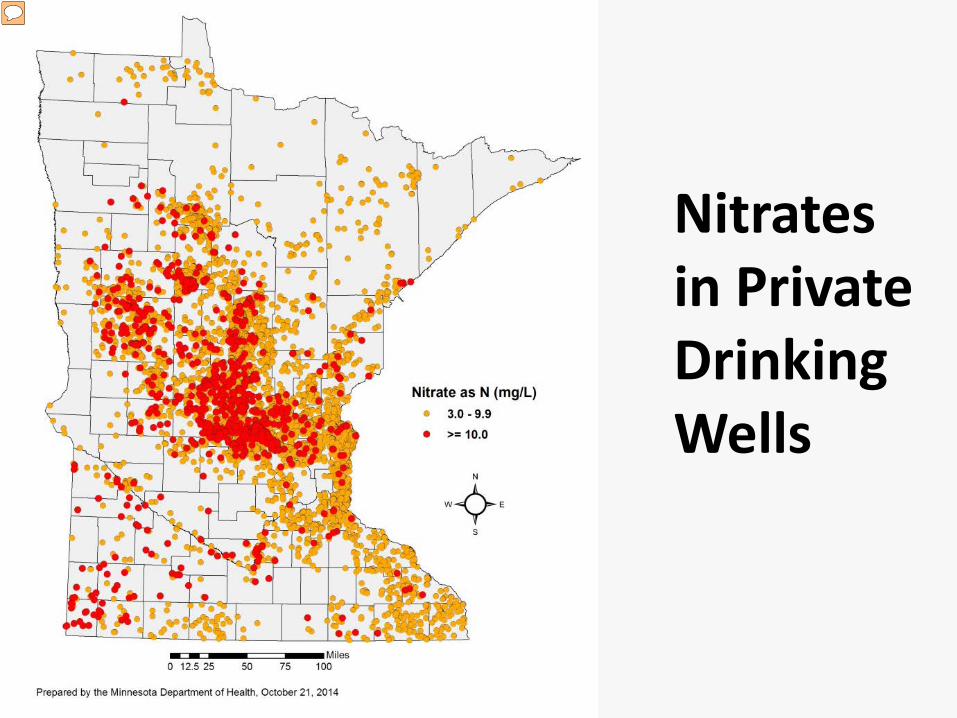
Nitrates in Private Drinking Wells
Presenter
Presentation Notes
This map shows nitrate detection in wells throughout Minnesota. These data are from new wells installed since 1990 that exceed 3 ppm nitrate (orange) or 10 ppm nitrate (red). It’s important to note that older wells may be more vulnerable to contamination since they predate the current well code. The red dots indicate nitrate concentrations that exceed the health risk limit for drinking water (10 mg/L). The orange dots represent nitrate levels that are above background (natural levels) but below the health risk limit. As mentioned the nitrate issues in groundwater are not uniformly distributed around the state, they tend to show up in areas with well drained soils (sands and gravels) and karst (fractured limestone of southeastern Minnesota). One of the greatest concerns for groundwater quality in Minnesota is nitrate. Many wells in vulnerable aquifers exceed the drinking water standard. Elevated nitrate is from human activities and can be reduced. This is why we have focused on nitrate.
Presenter
Presentation Notes
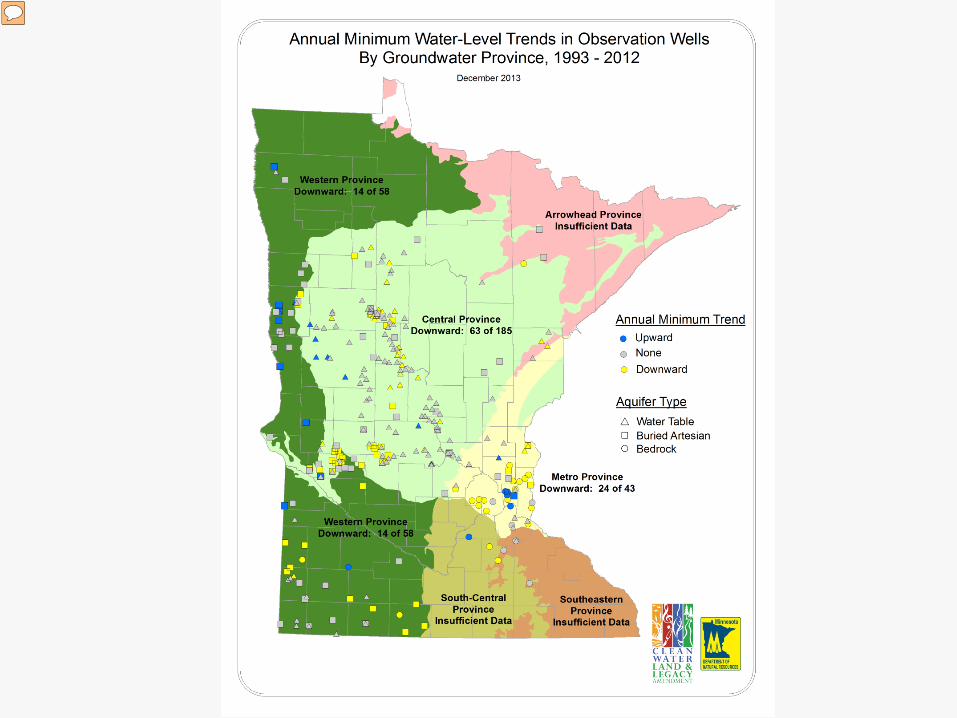
We know that there is a lot of variability, both in terms of our geologic setting and expression of water levels over time. This map depicts a fairly simple analysis of annual minimum water levels over the past 20 years. Each location was analyzed to determine if there is a statistically significant trend. Blue indicates an upward trend, yellow indicates a downward trend, and grey no trend. The shape indicates if the well is a water table well, buried artesian or bedrock. I would like to draw your attention to the yellow symbols. These yellow symbols are at least a moderate warning sign that we need to pay close attention and look more closely at what is happening. Also note the “insufficient data” in the Southeastern, South-Central and Arrowhead provinces – this means that we don’t have long enough records for our monitoring wells in these regions. What does this complex picture mean in terms of sustainability? There is no single statistical, analytical standard for evaluating sustainability. Is simply indicates that water levels are either going down or not, it does not ascribe a cause.
Water Rights and Water Responsibilities: An orientation to MN
Statutes and Rules
Presenter
Presentation Notes
This portion of the presentation is getting at responsibility for managing groundwater and the legislatures direction on sustainability. To understand responsibilities takes more than just a few minutes, but I hope that as I describe some of the laws and statutes you get a better understanding of state responsibilities and how they relate to thresholds for negative impacts.
Minnesota Water Rights
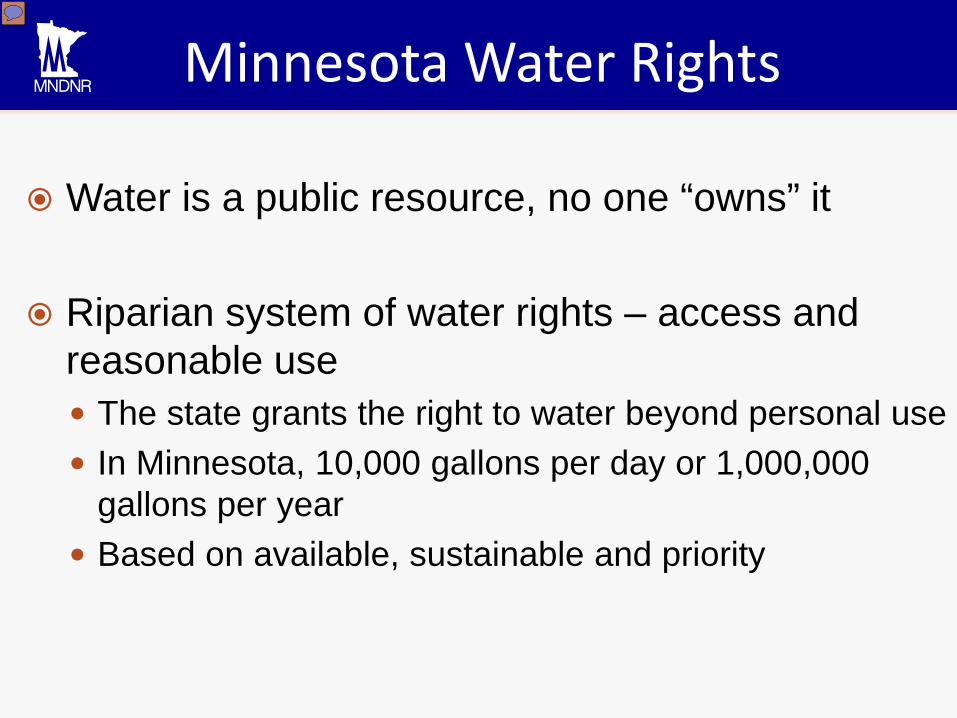
Water is a public resource, no one “owns” it Riparian system of water rights – access and
reasonable use The state grants the right to water beyond personal use In Minnesota, 10,000 gallons per day or 1,000,000
gallons per year Based on available, sustainable and priority
Presenter
Presentation Notes
To understand responsibility it helps to understand water rights. In Minnesota: The legislature has set the threshold for when a permit is required, which is use of more than 10,000 gpd or 1 MGY �There are also important standards that apply to permits, which include the priority (domestic use is higher than irrigation or industrial processing) but the use must also be sustainable.
103G.287. Subd. 3.Protection of groundwater supplies.
When establishing water appropriation limits to protect groundwater resources, the commissioner must consider the sustainability of the groundwater resource, including the current and projected water levels, water quality, whether the use protects ecosystems, and the ability of future generations to meet their own needs.
Presenter
Presentation Notes
The DNR has a responsibility to address this problem Limits = permits A permit is for a limited amount of water. When we issue a permit, we need to consider the sustainability of that resource. Permits do not establish a permanent right to water.
The commissioner may issue water use permits for appropriation from groundwater only if the commissioner determines that the groundwater use is sustainable to supply the needs of future generations and the proposed use will not harm ecosystems, degrade water, or reduce water levels beyond the reach of public water supply and private domestic wells constructed according to Minnesota Rules, chapter 4725.
103G.287. Subd. 5.Sustainability standard.
Groundwater appropriations that will have negative impacts to surface waters are subject to applicable provisions in section 103G.285.
103G.287. Subd. 2.Relationship to surface water resources.
If data are available, permits to appropriate water from natural and altered natural watercourses must be limited so that consumptive appropriations are not made from the watercourses during periods of specified low flows. The purpose of the limit is to safeguard water availability for in-stream uses and for downstream higher priority users located reasonably near the site of appropriation.
103G.285. Subd. 2.Natural and altered natural watercourses.
(a) Permits to appropriate water from water basins must be limited so that the collective annual withdrawals do not exceed a total volume of water amounting to one-half acre-foot per acre of water basin based on Minnesota Department of Conservation Bulletin No. 25, "An Inventory of Minnesota Lakes," published in 1968.
103G.285. Subd. 3.Water basins.
(b) As a condition to a surface water appropriation permit, the commissioner shall set a protective elevation for the water basin, below which an appropriation is not allowed. During the determination of the protective elevation, the commissioner shall consider:
(1) the elevation of important aquatic vegetation characteristics related to fish and wildlife habitat; (2) existing uses of the water basin by the public and riparian landowners; and (3) the total volume within the water basin and the slope of the littoral zone.
103G.285. Subd. 3 Water basins.
As part of an application for appropriation of water from a water basin less than 500 acres in surface area, the applicant shall obtain a statement of support with as many signatures as the applicant can obtain from property owners with property riparian to the water basin. The statement of support must:
(1) state support for the proposed appropriation; and (2) show the number of property owners whose signatures the applicant could not obtain.
103G.285. Subd. 4.Water basins less than 500 acres.
Permits issued after June 3, 1977, to appropriate water from streams designated trout streams by the commissioner's orders under section 97C.005 must be limited to temporary appropriations.
103G.222 REPLACEMENT OF WETLANDS. Subdivision 1. Requirements. (a) Wetlands must not be drained or filled, wholly or partially, unless replaced by restoring or creating wetland areas of at least equal public value Drain or drainage. "Drain" or "drainage" means any method for removing or diverting waters from wetlands. Methods include, but are not limited to, excavation of an open ditch, installation of subsurface drainage tile, filling, diking, or pumping.
Wetland Conservation Act (WCA)
Calcareous fens, as identified by the commissioner by written order published in the State Register, may not be filled, drained, or otherwise degraded, wholly or partially, by any activity, unless the commissioner, under an approved management plan, decides some alteration is necessary.
103G.223 Calcareous Fens
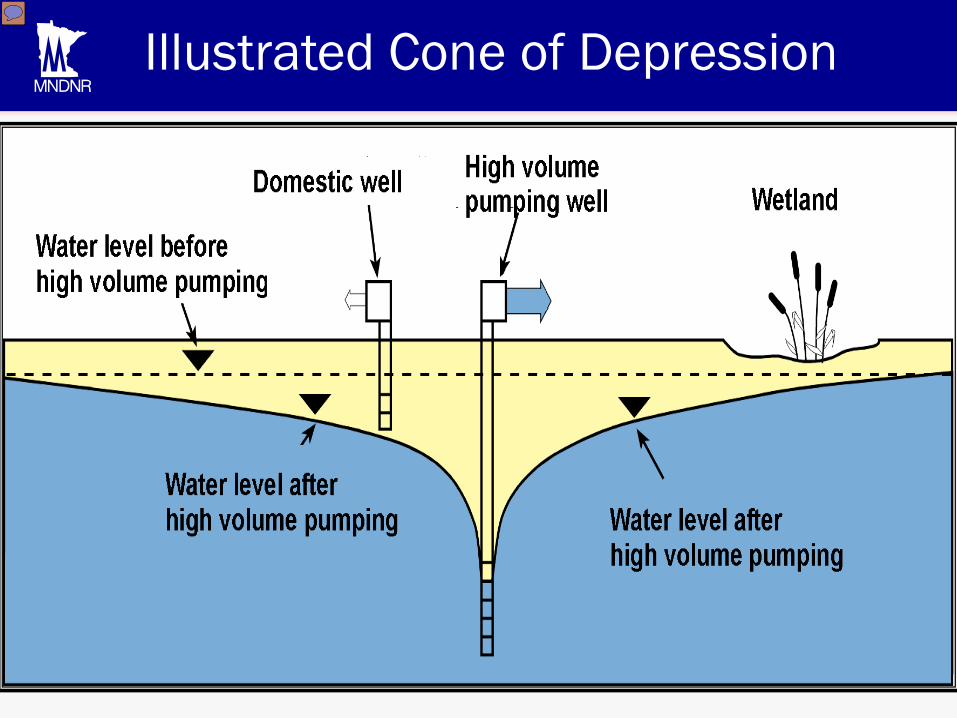
Illustrated Cone of Depression
Presenter
Presentation Notes
In a nutshell, it’s DNR’s job to determine if the cone of depression created by a water use will impact nearby domestic wells as shown here, or a surface water feature like a wetland, lake or stream. In addition, if you were to imagine some contaminated water in this picture, we have to consider how pumping will move the contaminants and potentially affect others, or surface waters. We also have to evaluate the long term effects of pumping on water levels
Presenter
Presentation Notes
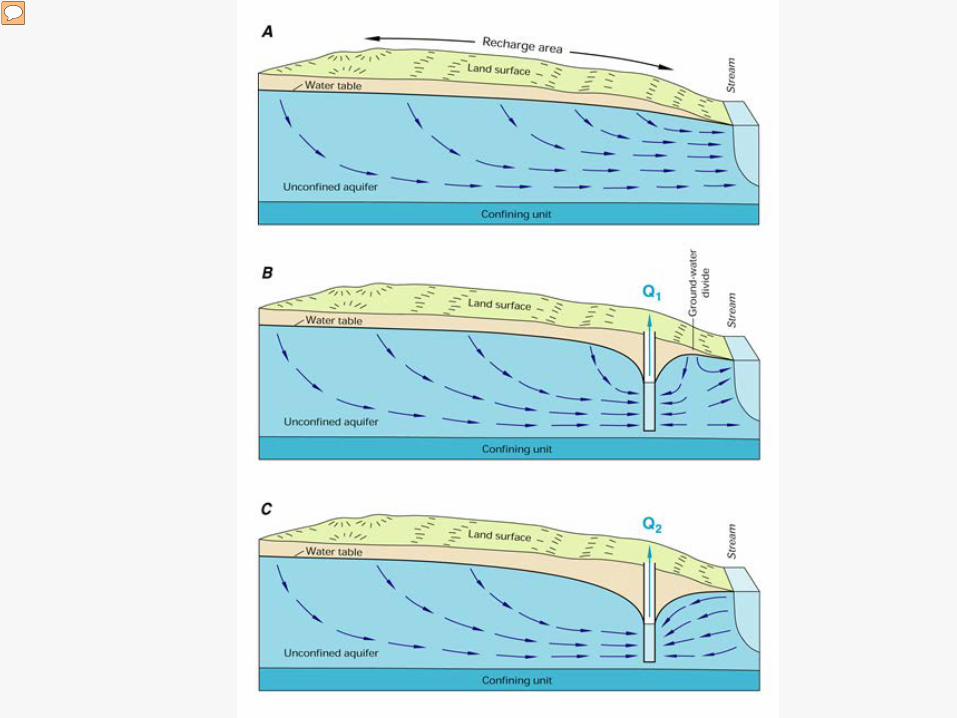
These three conceptual models illustrate a fairly simple scenario. The key here is how much water is diverted and how to estimate that amount. Scenario B is showing an example where pumping changes the amount of groundwater flowing toward the stream. This results in a diversion of flow. Scenario C is showing an example where a cone of depression in a water table aquifer actually reaches the stream. This would result in water flowing from the stream toward the pumping well.
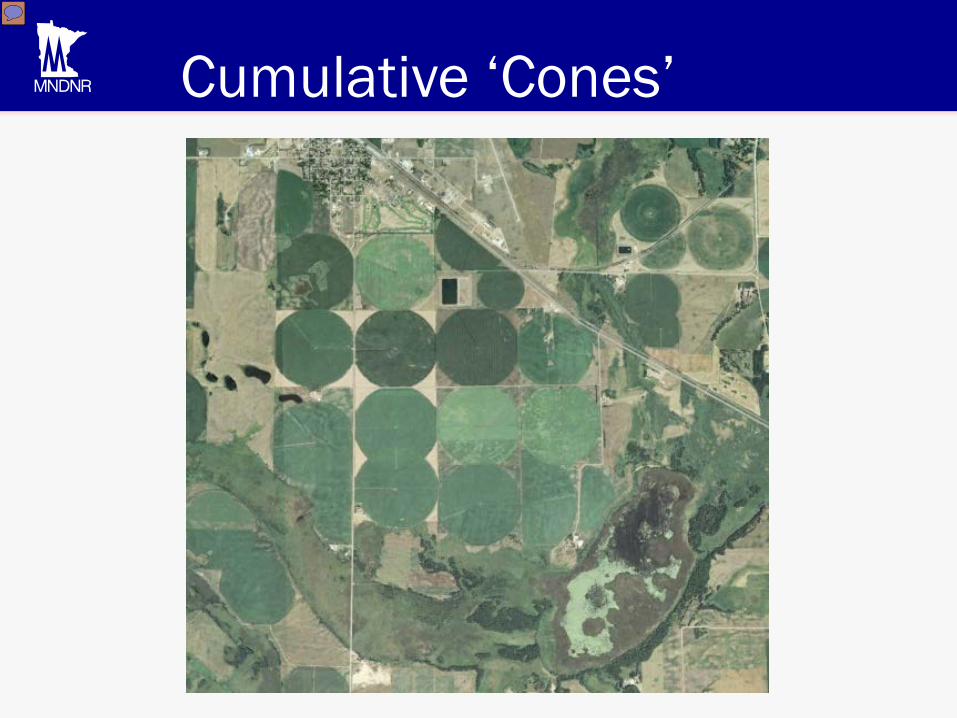
Cumulative ‘Cones’
Presenter
Presentation Notes
In practice, we are not typically dealing with just one cone of depression. As use increases, it’s really about looking at the cumulative cones of depression. Aerial photo showing the south side of Brooten, MN illustrates the concept of cumulative cones of depression from multiple uses, including a City, a golf course and agriculture. It illustrates the need to consider cumulative cones of depression and how they intersect and interact with surface waters, in this example a wetland complex along the bottom of the picture.
Presenter
Presentation Notes
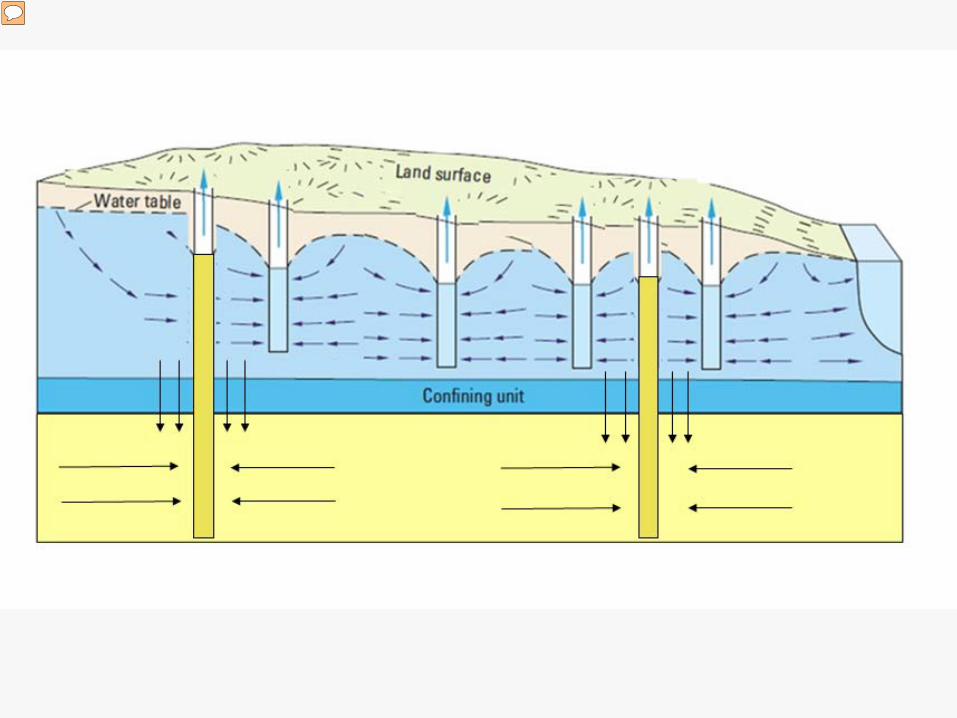
This conceptual diagram illustrates a more realistic example of the complexity associated with multiple appropriations from different locations and depths. The challenge then is to determine the hydrologic effect on the adjacent or nearby surface water. It’s important to keep in mind that geologic material, the extent and character of confining units, the distance, and the duration of pumping all play a role in determining the hydrologic effect on connected surface waters.
Presenter
Presentation Notes
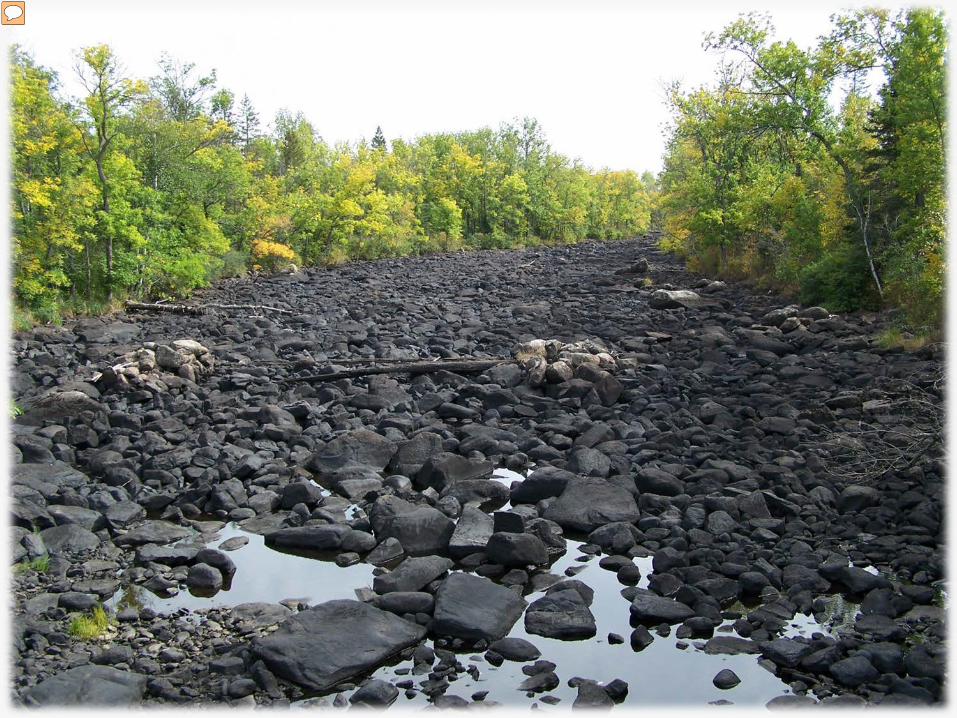
A key issue for determining how much can be allowed or how much is too much often has to do with interactions with surface waters. Low flows in particular are a critical period for streams and rivers, and can determine the type and abundance of fish, insects and other species that will be present.
…recommendations for statutory or rule definitions and thresholds for negative impacts to surface waters as described in ….
Report to the Legislature
Questions?
About groundwater issues and DNR’s groundwater responsibilities? What information will help you better understand the issues, this