groundwater management in asian cities: summary … · groundwater use and its associated problems...
TRANSCRIPT
Summary report of Sustainable Groundwater Management in Asia 39Sustainable Groundwater Management in Asian Cities
GROUNDWATER MANAGEMENT IN ASIAN CITIES: Summary of case studies
This section is the compilation of the summary reports of six case studies on groundwater management in seven Asian cities, namely Tianjin, China; Bandung, Indonesia; Colombo and Kandy, Sri Lanka; Bangkok, Thailand; Ho Chi Minh City, Viet Nam; and Osaka, Japan. The case studies, which were conducted by the research partners of the Research on Sustainable Water Management (SWMP), constituted the basis of the recommendations and analysis in the previous section.
Each case study consists of the facts and figures relevant to groundwater resource and its management followed by recommendations for future groundwater management, except the Osaka’s case that was studied as a reference. In the process of formulation of recommendations for Tianjin, Bandung, Bangkok, and Ho Chi Minh City, stakeholder meetings were held in each city to hear more diverse views and ideas from the participants with different backgrounds.
Summary report of Sustainable Groundwater Management in Asia
Note:The currency exchange rates of the currency of each country to USD as of 7 March 2006 are:
1 Chinese Yuan = 0.12447 USD1 Indonesian Rupiah = 0.000109 USD1 Sri Lanka Rupee = 0.0097 USD1 Thai Baht = 0.0258 USD1 Vietnamese Dong = 0.000062USD1 Japanese Yen = 0.00855 USD
Summary report of Sustainable Groundwater Management in Asia40 Sustainable Groundwater Management in Asian Cities
1-1. Geographical Location
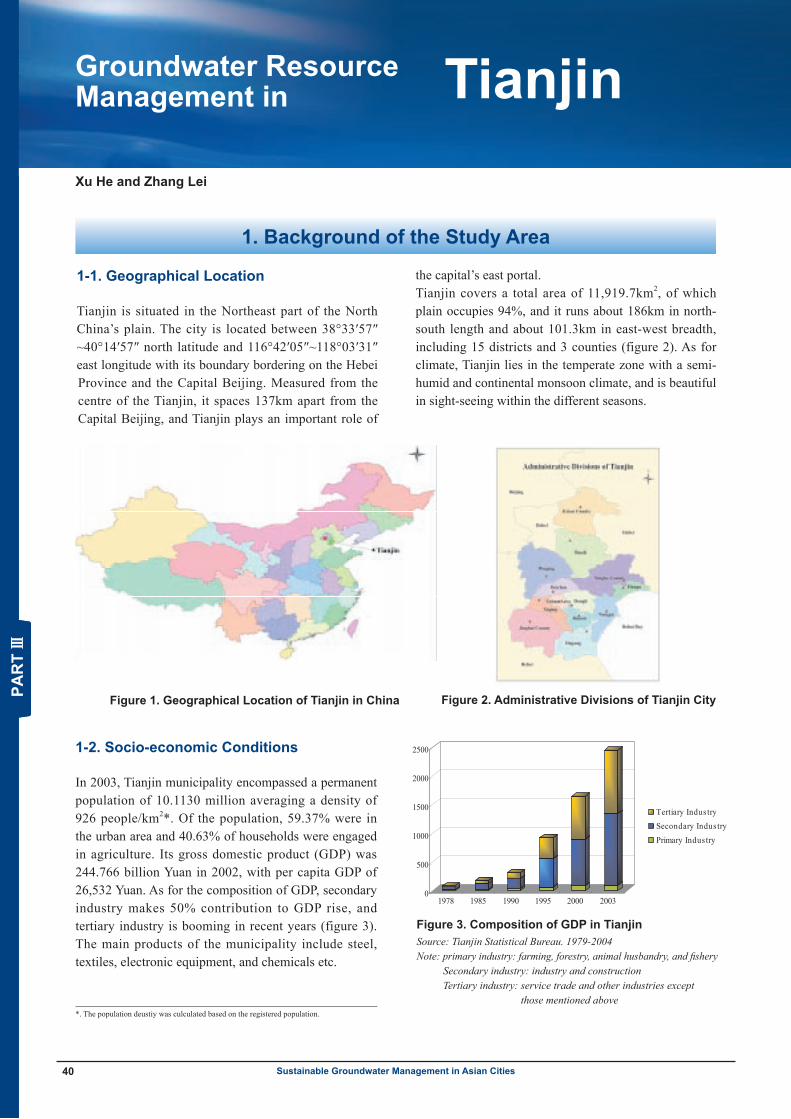
Tianjin is situated in the Northeast part of the North China’s plain. The city is located between 38°33′57″~40°14′57″ north latitude and 116°42′05″~118°03′31″ east longitude with its boundary bordering on the Hebei Province and the Capital Beijing. Measured from the centre of the Tianjin, it spaces 137km apart from the Capital Beijing, and Tianjin plays an important role of
the capital’s east portal.Tianjin covers a total area of 11,919.7km2, of which plain occupies 94%, and it runs about 186km in north-south length and about 101.3km in east-west breadth, including 15 districts and 3 counties (figure 2). As for climate, Tianjin lies in the temperate zone with a semi-humid and continental monsoon climate, and is beautiful in sight-seeing within the different seasons.
Groundwater ResourceManagement in Tianjin
1. Background of the Study Area
Figure 1. Geographical Location of Tianjin in China
1-2. Socio-economic Conditions
In 2003, Tianjin municipality encompassed a permanent population of 10.1130 million averaging a density of 926 people/km2*. Of the population, 59.37% were in the urban area and 40.63% of households were engaged in agriculture. Its gross domestic product (GDP) was 244.766 billion Yuan in 2002, with per capita GDP of 26,532 Yuan. As for the composition of GDP, secondary industry makes 50% contribution to GDP rise, and tertiary industry is booming in recent years (figure 3). The main products of the municipality include steel, textiles, electronic equipment, and chemicals etc.
Figure 2. Administrative Divisions of Tianjin City
Xu He and Zhang Lei
0
500
1000
1500
2000
2500
1978 1985 1990 1995 2000 2003
Tertiary IndustrySecondary IndustryPrimary Industry
Figure 3. Composition of GDP in Tianjin Source: Tianjin Statistical Bureau. 1979-2004Note: primary industry: farming, forestry, animal husbandry, and fishery Secondary industry: industry and construction Tertiary industry: service trade and other industries except
those mentioned above*. The population deustiy was culculated based on the registered population.
Summary report of Sustainable Groundwater Management in Asia
Summary report of Sustainable Groundwater Management in Asia 41Sustainable Groundwater Management in Asian Cities
1-3. Overview of Water Resources
The water resources in Tianjin are composed of surface water, transferred water, reused water, groundwater, and small amounts of seawater (table 1). Based on the 1991-1995 data, the average natural runoff volume is 1.045 billion m3, incoming volume is 2.168 billion m3, and the out-flowing volume amount to 1.988 billion m3. The volume transferred form the Luan River is 1 billion m3 technically. The total exploitable volume of groundwater is 0.827 billion m3, 0.702 billion m3
of which is of suitable water quality, mostly in areas outside the urban center.
Scarcity of water resources in Tianjin is very high, with per capita natural runoff resource volume being about 160m3, which makes Tianjin enter into the serious water-lack ranks in the whole China. So the state has to transfer the water from the other watersheds, mainly from the Luan River in the adjacent Hebei province, and in emergency, the water from the Yellow River is transtened to the city.
2. Groundwater Use and its Associated Problems
2-1. Outline of Groundwater
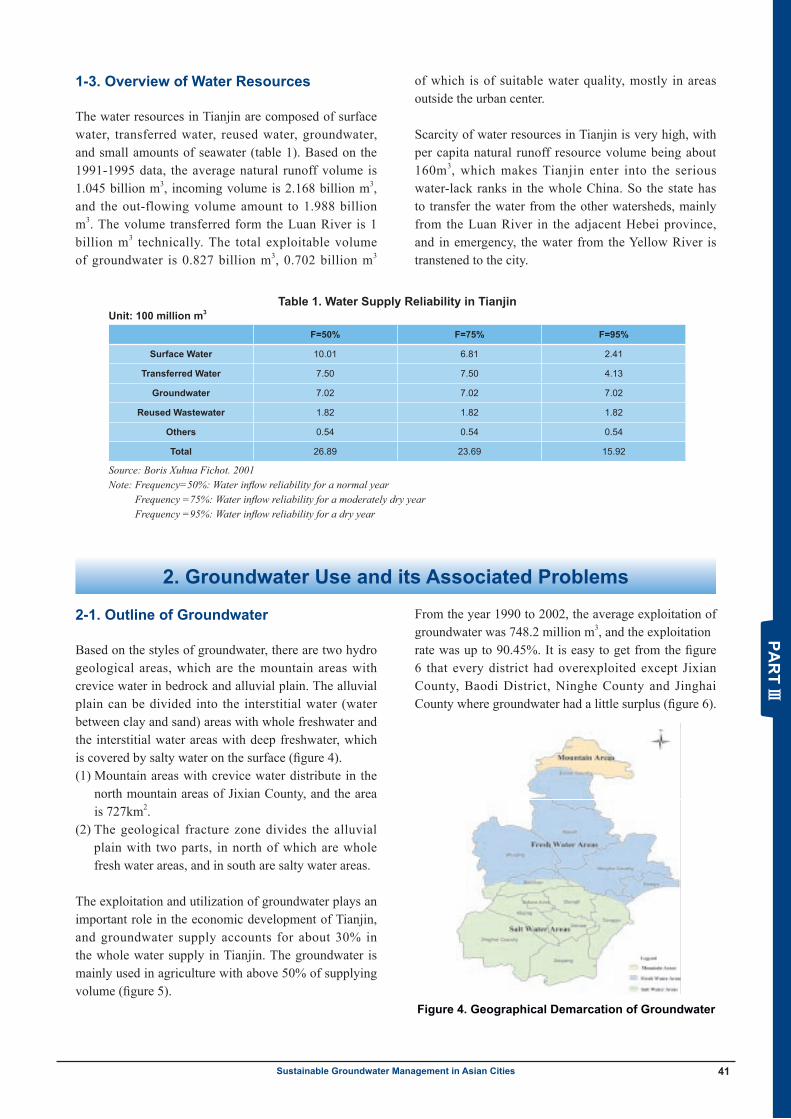
Based on the styles of groundwater, there are two hydro geological areas, which are the mountain areas with crevice water in bedrock and alluvial plain. The alluvial plain can be divided into the interstitial water (water between clay and sand) areas with whole freshwater and the interstitial water areas with deep freshwater, which is covered by salty water on the surface (figure 4).(1) Mountain areas with crevice water distribute in the
north mountain areas of Jixian County, and the area is 727km2.
(2) The geological fracture zone divides the alluvial plain with two parts, in north of which are whole fresh water areas, and in south are salty water areas.
The exploitation and utilization of groundwater plays an important role in the economic development of Tianjin, and groundwater supply accounts for about 30% in the whole water supply in Tianjin. The groundwater is mainly used in agriculture with above 50% of supplying volume (figure 5).
From the year 1990 to 2002, the average exploitation of groundwater was 748.2 million m3, and the exploitation rate was up to 90.45%. It is easy to get from the figure 6 that every district had overexploited except Jixian County, Baodi District, Ninghe County and Jinghai County where groundwater had a little surplus (figure 6).
Unit: 100 million m3
F=50% F=75% F=95%
Surface Water 10.01 6.81 2.41
Transferred Water 7.50 7.50 4.13
Groundwater 7.02 7.02 7.02
Reused Wastewater 1.82 1.82 1.82
Others 0.54 0.54 0.54
Total 26.89 23.69 15.92
Source: Boris Xuhua Fichot. 2001Note: Frequency=50%: Water inflow reliability for a normal year
Frequency =75%: Water inflow reliability for a moderately dry yearFrequency =95%: Water inflow reliability for a dry year
Table 1. Water Supply Reliability in Tianjin
Figure 4. Geographical Demarcation of Groundwater
Summary report of Sustainable Groundwater Management in Asia42 Sustainable Groundwater Management in Asian Cities
2-2. Overexploitation-induced Problems
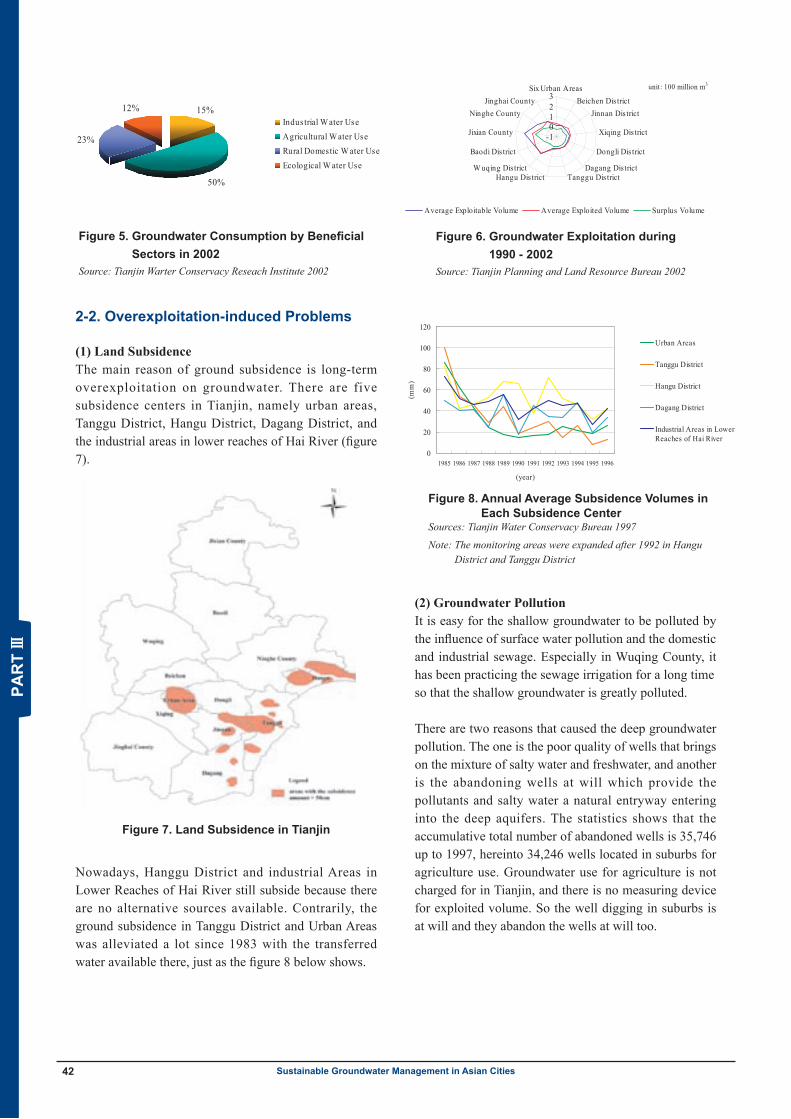
(1) Land SubsidenceThe main reason of ground subsidence is long-term overexploitation on groundwater. There are five subsidence centers in Tianjin, namely urban areas, Tanggu District, Hangu District, Dagang District, and the industrial areas in lower reaches of Hai River (figure 7).
Nowadays, Hanggu District and industrial Areas in Lower Reaches of Hai River still subside because there are no alternative sources available. Contrarily, the ground subsidence in Tanggu District and Urban Areas was alleviated a lot since 1983 with the transferred water available there, just as the figure 8 below shows.
(2) Groundwater PollutionIt is easy for the shallow groundwater to be polluted by the influence of surface water pollution and the domestic and industrial sewage. Especially in Wuqing County, it has been practicing the sewage irrigation for a long time so that the shallow groundwater is greatly polluted.
There are two reasons that caused the deep groundwater pollution. The one is the poor quality of wells that brings on the mixture of salty water and freshwater, and another is the abandoning wells at will which provide the pollutants and salty water a natural entryway entering into the deep aquifers. The statistics shows that the accumulative total number of abandoned wells is 35,746 up to 1997, hereinto 34,246 wells located in suburbs for agriculture use. Groundwater use for agriculture is not charged for in Tianjin, and there is no measuring device for exploited volume. So the well digging in suburbs is at will and they abandon the wells at will too.
unit: 100 million m3
-10123
Six Urban AreasBeichen Dis trict
Jinnan Dis trict
Xiqing Dis trict
Dongli Dis trict
Dagang Dis trictTanggu Dis trictHangu Dis trict
W uqing Dis trict
Baodi Dis trict
Jixian County
Ninghe CountyJinghai County
Average Exploitable Volume Average Exploited Volume Surplus Volume
Figure 5. Groundwater Consumption by Beneficial Sectors in 2002
Source: Tianjin Warter Conservacy Reseach Institute 2002
15%
50%
23%
12%Industrial W ater UseAgricultural Water UseRural Domestic W ater UseEcological W ater Use
Figure 6. Groundwater Exploitation during 1990 - 2002
Source: Tianjin Planning and Land Resource Bureau 2002
Map 3 Geographical Demarcation of Groundwater
Figure 7. Land Subsidence in Tianjin
0
20
40
60
80
100
120
1985 1986 1987 1988 1989 1990 1991 1992 1993 1994 1995 1996
(year)
(mm
)
Urban Areas
Tanggu District
Hangu District
Dagang District
Industrial Areas in LowerReaches of Hai River
Figure 8. Annual Average Subsidence Volumes in Each Subsidence Center
Sources: Tianjin Water Conservacy Bureau 1997
Note: The monitoring areas were expanded after 1992 in Hangu District and Tanggu District
Summary report of Sustainable Groundwater Management in Asia 43Sustainable Groundwater Management in Asian Cities
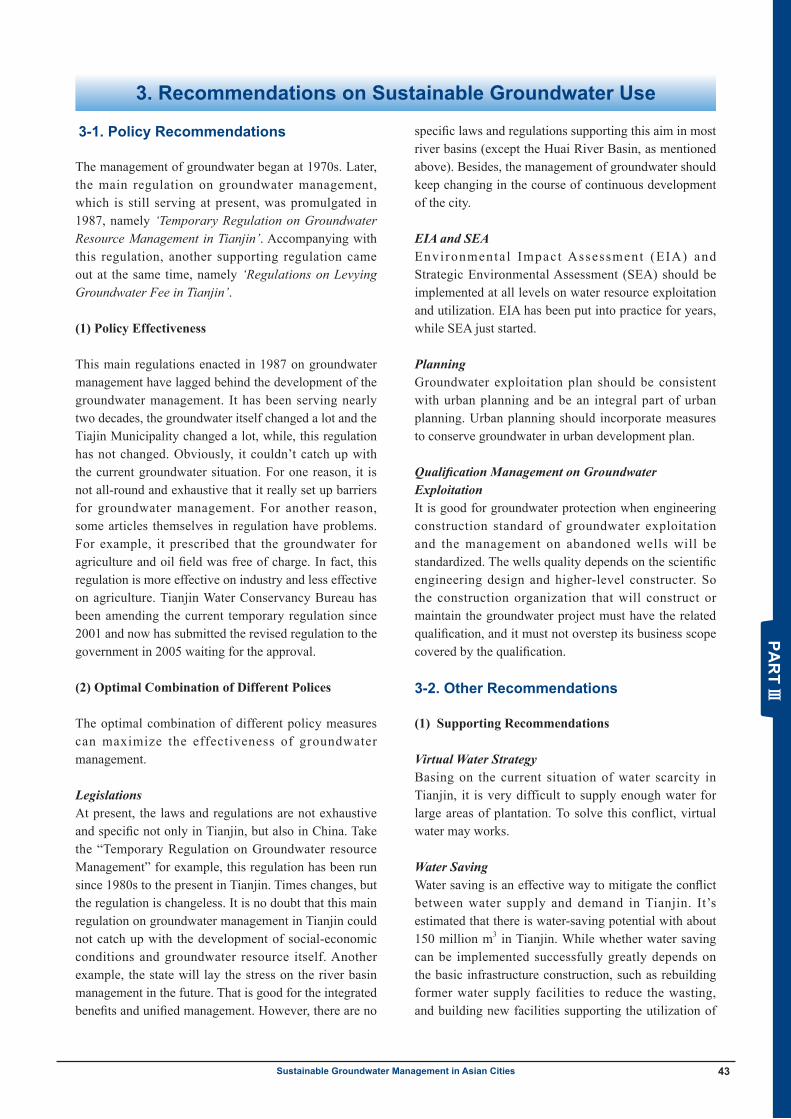
3-1. Policy Recommendations
The management of groundwater began at 1970s. Later, the main regulation on groundwater management, which is still serving at present, was promulgated in 1987, namely ‘Temporary Regulation on Groundwater Resource Management in Tianjin’. Accompanying with this regulation, another supporting regulation came out at the same time, namely ‘Regulations on Levying Groundwater Fee in Tianjin’.
(1) Policy Effectiveness
This main regulations enacted in 1987 on groundwater management have lagged behind the development of the groundwater management. It has been serving nearly two decades, the groundwater itself changed a lot and the Tiajin Municipality changed a lot, while, this regulation has not changed. Obviously, it couldn’t catch up with the current groundwater situation. For one reason, it is not all-round and exhaustive that it really set up barriers for groundwater management. For another reason, some articles themselves in regulation have problems. For example, it prescribed that the groundwater for agriculture and oil field was free of charge. In fact, this regulation is more effective on industry and less effective on agriculture. Tianjin Water Conservancy Bureau has been amending the current temporary regulation since 2001 and now has submitted the revised regulation to the government in 2005 waiting for the approval.
(2) Optimal Combination of Different Polices
The optimal combination of different policy measures can maximize the effectiveness of groundwater management.
LegislationsAt present, the laws and regulations are not exhaustive and specific not only in Tianjin, but also in China. Take the “Temporary Regulation on Groundwater resource Management” for example, this regulation has been run since 1980s to the present in Tianjin. Times changes, but the regulation is changeless. It is no doubt that this main regulation on groundwater management in Tianjin could not catch up with the development of social-economic conditions and groundwater resource itself. Another example, the state will lay the stress on the river basin management in the future. That is good for the integrated benefits and unified management. However, there are no
specific laws and regulations supporting this aim in most river basins (except the Huai River Basin, as mentioned above). Besides, the management of groundwater should keep changing in the course of continuous development of the city.
EIA and SEAEnvironmental Impact Assessment (EIA) and Strategic Environmental Assessment (SEA) should be implemented at all levels on water resource exploitation and utilization. EIA has been put into practice for years, while SEA just started.
PlanningGroundwater exploitation plan should be consistent with urban planning and be an integral part of urban planning. Urban planning should incorporate measures to conserve groundwater in urban development plan.
Qualification Management on Groundwater ExploitationIt is good for groundwater protection when engineering construction standard of groundwater exploitation and the management on abandoned wells will be standardized. The wells quality depends on the scientific engineering design and higher-level constructer. So the construction organization that will construct or maintain the groundwater project must have the related qualification, and it must not overstep its business scope covered by the qualification.
3-2. Other Recommendations
(1) Supporting Recommendations
Virtual Water StrategyBasing on the current situation of water scarcity in Tianjin, it is very difficult to supply enough water for large areas of plantation. To solve this conflict, virtual water may works.
Water SavingWater saving is an effective way to mitigate the conflict between water supply and demand in Tianjin. It’s estimated that there is water-saving potential with about 150 million m3 in Tianjin. While whether water saving can be implemented successfully greatly depends on the basic infrastructure construction, such as rebuilding former water supply facilities to reduce the wasting, and building new facilities supporting the utilization of
3. Recommendations on Sustainable Groundwater Use
Summary report of Sustainable Groundwater Management in Asia44 Sustainable Groundwater Management in Asian Cities
reclaimed water and rainwater etc.
Inner Water Transfer from North to South within TianjinIn the north there is fresh groundwater with exploitable potential, but in the south there is salty water covered with badly overexploitation, focusing on the deep fresh groundwater. So the groundwater resource should be balanced firstly within Tianjin through transferring water from north to south Tianjin.
Alternative Water Sources• Salty Water Utilization• Desalted Seawater• Reclaimed Wastewater• Rainwater and Flood Utilization• Transferred Water from North-to-South
(2) Economic Recommendations
Comprehensive Water FeeAs we know, the rational water fee should be the market-oriented. However, it should be necessary as well under the Chinese regime. Water fee should reflect the policy preference on water resources management, which should be the assistant measure to support the policy implementation.
Rationalized Groundwater FeeAt present groundwater fee is obviously low, which badly deviate from water resource value. Groundwater fee for industrial using is far lower than tap water, agricultural and rural domestic use are just levied a nominal fee or enjoy an exemption policy, which has undoubtedly encouraged groundwater exploitation. Thus, it is necessary to set up a rational water fee system to assist water management and comply with the economic rules.
Different Purpose, Different FeeIn addition, water fee should be different between different using purposes. For example, to encourage shallow groundwater and salty water utilization in salty water areas, fees on exploiting these kinds of water should be adjusted lower, and tap water for ground recharging should also be adjusted. Now tap-water fees contain an item of wastewater treatment fee. This fee is 0.6 Yuan per m3 for domestic user and 1.00 Yuan per m3 for the other users. The recharging is mainly depending on the tap water, but users who use tap water for recharging has to pay the same as other users. Since they do not generate wastewater, they don’t have to pay the fee covering cost of wastewater treatment.
3-3. Recommendations for Overcoming Barriers to Implementation
(1) Rational Institutional Framework
As we know, it’s hardly to divide the water effectively into ground part and surface part. Whether or not the groundwater resource can be used rationally has close relationship with rational management of the surface water resources. So we need unify the whole water resources management. While whether or not we can achieve this aim rests with its root, rational institutional framework. The rational framework can be separated into two sections at three main levels (national, river basin, provincial level), namely implementation administration section and supervisory department section for water resources management.
(2) Policy Making
Lack of water source is a big problem in alleviating the exploitation of groundwater process. We have to find the alternative water sources, such as transferred water, recycling water, and desalted seawater and so on. Saving water is still needed at the same time. So, related policies encouraging these activities should be made. For example, shallow freshwater and salty water resources are encouraging to be utilized by the government, while there are no related policies supporting this proposal. On the contrary, some policies block it instead of supporting. Or some preferential treatments should be given, such as preferential water price alike.
(3) Unifying the Water Management
Most of the water-related conflicts in Tianjin, such as water pollution and water scarcity, mostly result from the ‘scientific management shortage’ rather than ‘resource shortage’. In Tianjin, many administrative bodies get involved in the water affairs. Different bodies take charge of different parts. In fact, it is hardly possible to divide water effectively into the ground part and geothermal part, qualitative part and quantitative side with real clarity. So the highly efficient and unified water management system is eagerly needed
(4) Dialogues between Relevant Stakeholders
One of the reasons that the problems will arise in water resources management is the lack of intercommunication between relevant stakeholders. Different information brings on different policy so the conflict comes. Thus it is of great importance to communicate and harmonize
Summary report of Sustainable Groundwater Management in Asia 45Sustainable Groundwater Management in Asian Cities
between departments and stakeholders.
CITED REFERENCES
Boris Xuhua Fichot. 2001. Indicators for the Evaluation of Wastewater Discharge Policy in the Beijing Tianjin Region. Master Thesis, University of British Columbia
Tianjin Planning and Land Resource Bureau. 2002. Assessment of Groundwater Resources in Tianjin
Tianjin Statistical Bureau. Tianjin Statistical Yearbook (1986~2004). China Statistics Press & Beijing Info Press
Tianjin Water Conservancy Bureau. 1997. Plan of Groundwater resource Exploitation in Tianjin
Tianjin Water Conservancy Research Institute. 2002. Study on Countermeasures of Sustainable Development and Utilization of Water Resource in Tianjin
BIBLIOGRAPHY
Bai, X, and Imura. 2001. H, Towards Sustainable Urban Water Resources Management: A Case Study in Tianjin, China, Sustainable Development, Vol.9,p: 24-35, 2001
Hou, E. 2001. Nine Dragons, One River: The Role of Institutions in Developing Water Pricing Policy in Beijing, PRC, Master of Arts Thesis, School of Community and Regional Planning, University of British Columbia
Liu, C M; Yu, J.J; Kendy, E. 2001, Groundwater Exploitation and Its Impact on the Environment in the North China Plain, Water International, 26(2): 265-272
Pan, Y, and Huili Gong. 2004. Research on the Relation between Groundwater Exploitation and Subsidence in Tianjin Proper, Earth and Environment, Vol.32 No. 2 :36-39
State Statistical Bureau, China Statistical Yearbook (1986~2002), China Statistics Press
Tianjin Environmental Protection Bureau. Environmental Quality Report of Tianjin (1991~2003). Tianjin EPB
Tianjin Geological Survey Institute, Survey of Groundwater Sustainable Exploitation in North China’s Plain, 2003
Zhenggang Xin, and Jihong Zhang, Problems and Measures on Tianjin Groundwater Exploitation, Urban Environment and Ecology, Vol. 12, No. 6, 1999
[Internet Sources]Tianjin Statistical Information, http://www.stats-tj.gov.cn/Tianjin Water Conservancy Information, http://www.tjwcb.gov.cn/Water Resource and Environment, http://www.chinawater.nease.net/zhuzuo/szydl/index00.htmHai River Water Conservancy Information, http://www.hwcc.com.cn/Ministry of Water Resources, P.R.China, http://www.mwr.gov.cn/Water Information, http://www.waterinfo.com.cn/South-to-North Water Diversion, http://www.nsbd.gov.cn/http://www.51ehs.com/Article/ShowArticle.asp?ArticleID=11144http://www.cjw.com.cn/index/detail/20051222/46020.asphttp://www.cjw.com.cn/index/detail/20051206/45303.asphttp://www.tj.xinhuanet.com/ztbd/jieshui/http://2004.chinawater.com.cn/newscenter/flxw/szy/20030625/200306250114.asp
Summary report of Sustainable Groundwater Management in Asia46 Sustainable Groundwater Management in Asian Cities
1-2. Hydro-Geological Conditions
The groundwater basin in Bandung Metropolitan covers an area of 1,730 km2. It is bordered in the north by the Lembang Fault, in the west by impermeable tertiary rocks, and a surface water barrier lies in the south and east (Warsono 1985 in Harnandi and Iskandar 1998). The morphology of the study area can be classified into
three part. The center of the study area is characterized by a plain morphological unit and covers 25% of the study area, while a hilly morphological unit encircles the plain, accounting for 45% of the study area. Furthermore, volcanic cones are distributed over 20% of the study area. Based on groundwater quantity and quality, the study area is classified into two areas of groundwater potential, namely:
1-1. Administrative Area
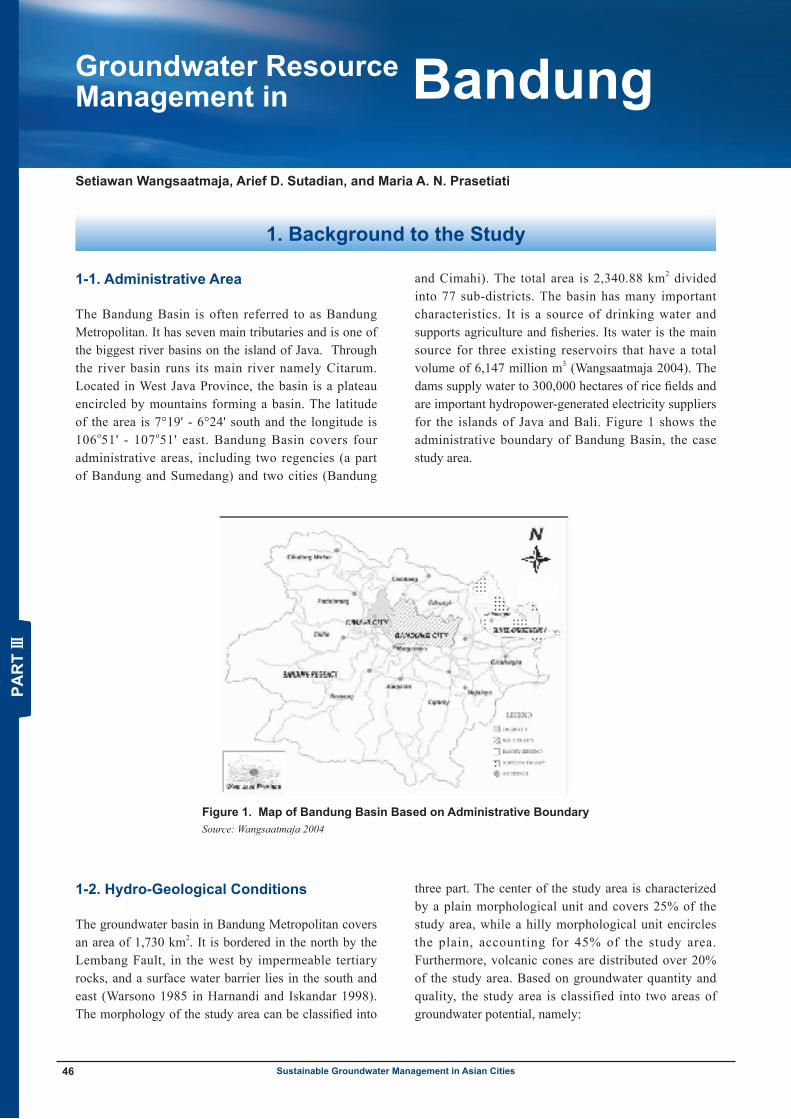
The Bandung Basin is often referred to as Bandung Metropolitan. It has seven main tributaries and is one of the biggest river basins on the island of Java. Through the river basin runs its main river namely Citarum. Located in West Java Province, the basin is a plateau encircled by mountains forming a basin. The latitude of the area is 7°19' - 6°24' south and the longitude is 106o51' - 107o51' east. Bandung Basin covers four administrative areas, including two regencies (a part of Bandung and Sumedang) and two cities (Bandung
and Cimahi). The total area is 2,340.88 km2 divided into 77 sub-districts. The basin has many important characteristics. It is a source of drinking water and supports agriculture and fisheries. Its water is the main source for three existing reservoirs that have a total volume of 6,147 million m3 (Wangsaatmaja 2004). The dams supply water to 300,000 hectares of rice fields and are important hydropower-generated electricity suppliers for the islands of Java and Bali. Figure 1 shows the administrative boundary of Bandung Basin, the case study area.
Groundwater ResourceManagement in Bandung
1. Background to the Study
Figure 1. Map of Bandung Basin Based on Administrative BoundarySource: Wangsaatmaja 2004
Summary Report of Bandung Case - 1 - February 2006 IGES – West Java EPA SWMP Project
Groundwater Management in Bandung
Dr. Setiawan Wangsaatmaja , Arief D. Sutadian , Maria A. N. Prasetiati
1. Background of Study
(1) Administrative Area Bandung Basin is often called as Metropolitan Bandung have 7 main tributaries sub river basin and one of the biggest River Basin in Java Island. At the River Basin runs its main river namely Citarum. Located in West Java Province, the basin is a plateau encircled by mountains forming a basin. That area is placed laterally southward between 7o19' - 6o24' south altitude and 106o51' - 107o51' east longitude. Bandung Basin covers four administrative areas including two regencies (a part of Bandung and Sumedang) and two cities (Bandung and Cimahi) with total area of 2,340.88 km2 and have 77 sub districts. Amongst its many importance’s are, source for drinking water, agriculture, fishery as well as main feeder for three existing reservoirs with total volume of 6,147 million m3 (Wangsaatmaja. 2004). The dams distribute water supply for 300,000 hectare of rice field and important energy supplier for Java and Bali Island.
Figure 1 Map of Bandung Basin Based on Administrative Boundary Source: Wangsaatmaja 2004
(2) Hydro-geological Conditions Groundwater Basin in Bandung Metropolitan has area 1.730 km2, bordered by The Lembang Fault in north side, in the Westside is impermeable tertiary rocks, whereas in the south and east part is surface water barrier�(Warsono 1985 in Harnandi and Iskandar 1998). Morphology of the study area can be classified into three groups, specifically plain morphology unit resides in the centre and covers 25% of the study area, hilly morphology unit that encircled the plain covers 45% of the study area morphology, and spread volcano cones covering 20% of the study area. Based on groundwater quantity and quality, study area is classified into 2 area of groundwater potential, namely: 1. Area with moderate potential of groundwater in shallow and deep aquifer 2. Area with moderate potential of groundwater in shallow aquifer and low potential in deep aquifer
(3) Population Number of population in Metropolitan Bandung is around 5.854.340 persons in 2003 and it is predicted will achieve 9,706,363 persons in 2025. The average density is 340 Person/km2. Population growth rate in Bandung Basin ranges from 1.74-3.7 % in 2003. There are still 467.760 families living in poverty earning less than Rp.200.000/month (USD 29/month), and approximately 20 % of total population have their income more than Rp.500.000/month (USD 50). Sundanesse ethnic represent original culture in this region, nevertheless, most of
Setiawan Wangsaatmaja, Arief D. Sutadian, and Maria A. N. Prasetiati
Summary report of Sustainable Groundwater Management in Asia
Summary report of Sustainable Groundwater Management in Asia 47Sustainable Groundwater Management in Asian Cities
1. Area with moderate groundwater potential in shallow and deep aquifers
2. Area with moderate groundwater potential in shallow aquifers and low potential in deep aquifers
1-3. Socio-economic Conditions
(1) PopulationThe population of Bandung Metropolitan was 6,080,981 in 2003 and it is predicted to increase to 9,706,363 in 2025. The average density is 2,597 people per km2. The population growth rate in the Bandung Basin ranged from 1.74% to 3.7% in 2003 (Rahmat 2004). There were still 1,763,100 families living in poverty, with poverty line1 less than Indonesian Rupiah (IDR) 102,912/month (Bandung City Statistical Agency and Planning Board of Bandung City 2003). Sundanese ethnic group represents the original culture in this region. Nevertheless, most of other ethnic groups in Indonesia also subsist in the Bandung Basin. Similar to other provinces in Indonesia, Islam represents the majority religion in the area, ahead of Christianity, Hinduism, Buddhism and other religions.
(2) Local Economic Condition and Major Economic Activities
In 2003, trade and industry excluding oil and petroleum contributed the largest portion of the Regional Gross Domestic Product (RGDP) based on current prices. Trade accounted for IDR 7,473,793 trillion and industry accounted for IDR 7,225,546 trillion, equal to 31.91% and 30.85% of the total RGDP respectively. Subsequently, transportation and communication accounted for 11.64%, and services were 10.79 % (Bandung City Statistical Agency 2003). In Bandung Regency, major earnings came from the processing industry (53.66%), followed by trade (17.41%) and agriculture (9.53%) (Bandung Regency Statistical Agency 2003). The same pattern can also be found in Cimahi City. In 2003, according to current prices, the industrial sector contributed around 68.08% of total
the city’s RGDP, followed by trade (15.19%), with construction ranking third followed by electric and water supply at around 4.28% (Cimahi City Statistical Agency 2003). Economic activity in Bandung Basin is concentrated in both the city and regency of Bandung, which is obvious from a comparison of the RGDP. The annual RGDP growth rate in the Bandung Basin reached 15.66%, whereas the highest growth rate occurred in Bandung City, at 19.56%. In 2003, the total RGDP for Bandung Metropolitan was IDR 56,262,565 trillion with the breakdown as follows: (1) Bandung City: IDR 23,420,125 trillion, with GDP per capita IDR 10,486,879, (2) Bandung Regency: IDR 23,833,127 triliion and GDP per capita achieved IDR 4,894,691, (3) Cimahi City: IDR 5,172,022 trillion and (4) Sumedang Regency: IDR 3,837,289 trillion (West Java Statistical Agency 2004).
1-4. Overview of Water Resources
(1) PrecipitationThe mean annual rainfall in the Bandung Basin varies from 1,000 mm in mid-regions to the south-east of Bandung City, to more than 3,500 mm in the north and less than 3,000 mm in the south. The wet season extends from November to April. The yearly rainfall intensity ranges between 1,700 – 3,500 mm with a mean value of 2,195 mm/year2. The average temperature is 22.6°C, and evapotranspiration value is 1,060 mm/year.
(2) Water Availability
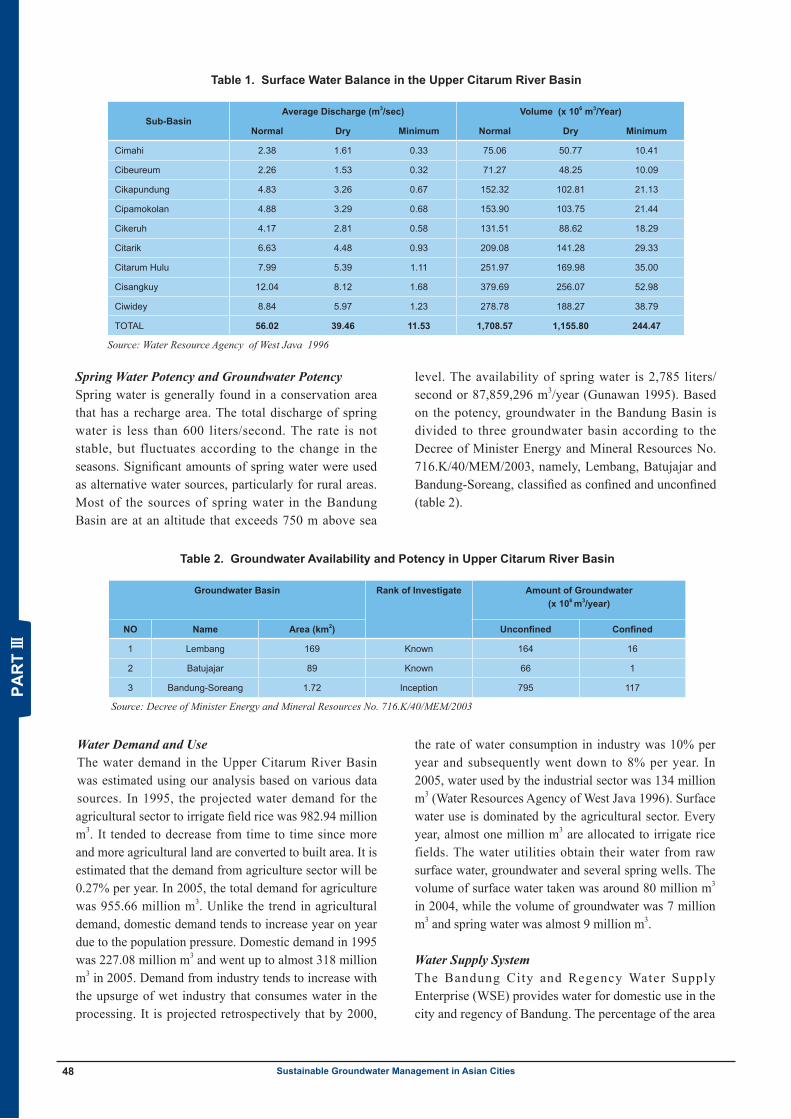
Surface Water PotencyThe existing conditions of surface water in the Upper Citarum River Basin remained sufficient, indicating the different amounts under normal and minimum conditions. When the amount of surface water under normal conditions is 1.70857 billion m3, the amount of surface water under minimum conditions will be 244.47 million m3 (table 1).
1. This method is calculated by minimum expenses for food and non food requirement per capita per month2. Based on data from Metrological and Geophysics Bureau 1955 - 2003
Summary report of Sustainable Groundwater Management in Asia48 Sustainable Groundwater Management in Asian Cities
Spring Water Potency and Groundwater PotencySpring water is generally found in a conservation area that has a recharge area. The total discharge of spring water is less than 600 liters/second. The rate is not stable, but fluctuates according to the change in the seasons. Significant amounts of spring water were used as alternative water sources, particularly for rural areas. Most of the sources of spring water in the Bandung Basin are at an altitude that exceeds 750 m above sea
level. The availability of spring water is 2,785 liters/second or 87,859,296 m3/year (Gunawan 1995). Based on the potency, groundwater in the Bandung Basin is divided to three groundwater basin according to the Decree of Minister Energy and Mineral Resources No. 716.K/40/MEM/2003, namely, Lembang, Batujajar and Bandung-Soreang, classified as confined and unconfined (table 2).
Water Demand and UseThe water demand in the Upper Citarum River Basin was estimated using our analysis based on various data sources. In 1995, the projected water demand for the agricultural sector to irrigate field rice was 982.94 million m3. It tended to decrease from time to time since more and more agricultural land are converted to built area. It is estimated that the demand from agriculture sector will be 0.27% per year. In 2005, the total demand for agriculture was 955.66 million m3. Unlike the trend in agricultural demand, domestic demand tends to increase year on year due to the population pressure. Domestic demand in 1995 was 227.08 million m3 and went up to almost 318 million m3 in 2005. Demand from industry tends to increase with the upsurge of wet industry that consumes water in the processing. It is projected retrospectively that by 2000,
the rate of water consumption in industry was 10% per year and subsequently went down to 8% per year. In 2005, water used by the industrial sector was 134 million m3 (Water Resources Agency of West Java 1996). Surface water use is dominated by the agricultural sector. Every year, almost one million m3 are allocated to irrigate rice fields. The water utilities obtain their water from raw surface water, groundwater and several spring wells. The volume of surface water taken was around 80 million m3 in 2004, while the volume of groundwater was 7 million m3 and spring water was almost 9 million m3.
Water Supply SystemThe Bandung City and Regency Water Supply Enterprise (WSE) provides water for domestic use in the city and regency of Bandung. The percentage of the area
Groundwater Basin Rank of Investigate Amount of Groundwater(x 106 m3/year)
NO Name Area (km2) Unconfined Confined
1 Lembang 169 Known 164 16
2 Batujajar 89 Known 66 1
3 Bandung-Soreang 1.72 Inception 795 117
Source: Decree of Minister Energy and Mineral Resources No. 716.K/40/MEM/2003
Table 2. Groundwater Availability and Potency in Upper Citarum River Basin
Sub-BasinAverage Discharge (m3/sec) Volume (x 106 m3/Year)
Normal Dry Minimum Normal Dry Minimum
Cimahi 2.38 1.61 0.33 75.06 50.77 10.41
Cibeureum 2.26 1.53 0.32 71.27 48.25 10.09
Cikapundung 4.83 3.26 0.67 152.32 102.81 21.13
Cipamokolan 4.88 3.29 0.68 153.90 103.75 21.44
Cikeruh 4.17 2.81 0.58 131.51 88.62 18.29
Citarik 6.63 4.48 0.93 209.08 141.28 29.33
Citarum Hulu 7.99 5.39 1.11 251.97 169.98 35.00
Cisangkuy 12.04 8.12 1.68 379.69 256.07 52.98
Ciwidey 8.84 5.97 1.23 278.78 188.27 38.79
TOTAL 56.02 39.46 11.53 1,708.57 1,155.80 244.47
Source: Water Resource Agency of West Java 1996
Table 1. Surface Water Balance in the Upper Citarum River Basin
Summary report of Sustainable Groundwater Management in Asia 49Sustainable Groundwater Management in Asian Cities
2. Groundwater Use and Associated Problems
2-1. The Pressure on Groundwater Use
The biggest consumers of groundwater in this area are the domestic and industrial sectors. From the data available, it is noted that over 50% of the water required for industrial processes in Bandung Metropolitan is supplied by groundwater. The lack of infrastructure provided by the water utilities increases the demand for groundwater. In addition, in several areas, the city and regency WSE also use groundwater for domestic water supply. The industrial sector seldom uses surface water. The reason is that more investment is required for the construction of raw water treatment plant than that for providing groundwater infrastructure. Another problem preventing the establishment of a water treatment plant is the lack of available land. In terms of operation and maintenance, it is more expensive to used treated surface water as the quality of groundwater is better than that of surface water. It is important to be noted that the types of industry that dominate in each cluster are wet industries, particularly textiles, so the water consumption is automatically expected to be higher. There is no specific institution that provides raw water to industry, so industry has no choice but to use groundwater in its activities. Another factor that increases reliance on groundwater is that groundwater is relatively inexpensive, compared to other water source
including those supplied by the municipality or regency. Therefore, many residents prefer to use groundwater rather than other sources. Groundwater continues to be more reliable than other sources, also because its flow is not affected by peak times, unlike water supply from the city or regency WSE that often overload in peak hours. At present, there is no accurate data on how many m3
are extracted by residents for domestic purposes in Bandung Metropolitan. Unlike the mechanism for the use of groundwater by industry, the use of groundwater for domestic purposes is not subject to the fifty-meter restriction for drilling down to extract water, nor is it subject to the restriction of 100 m3 per month on the use of groundwater.
2-2. Trends in Groundwater Use
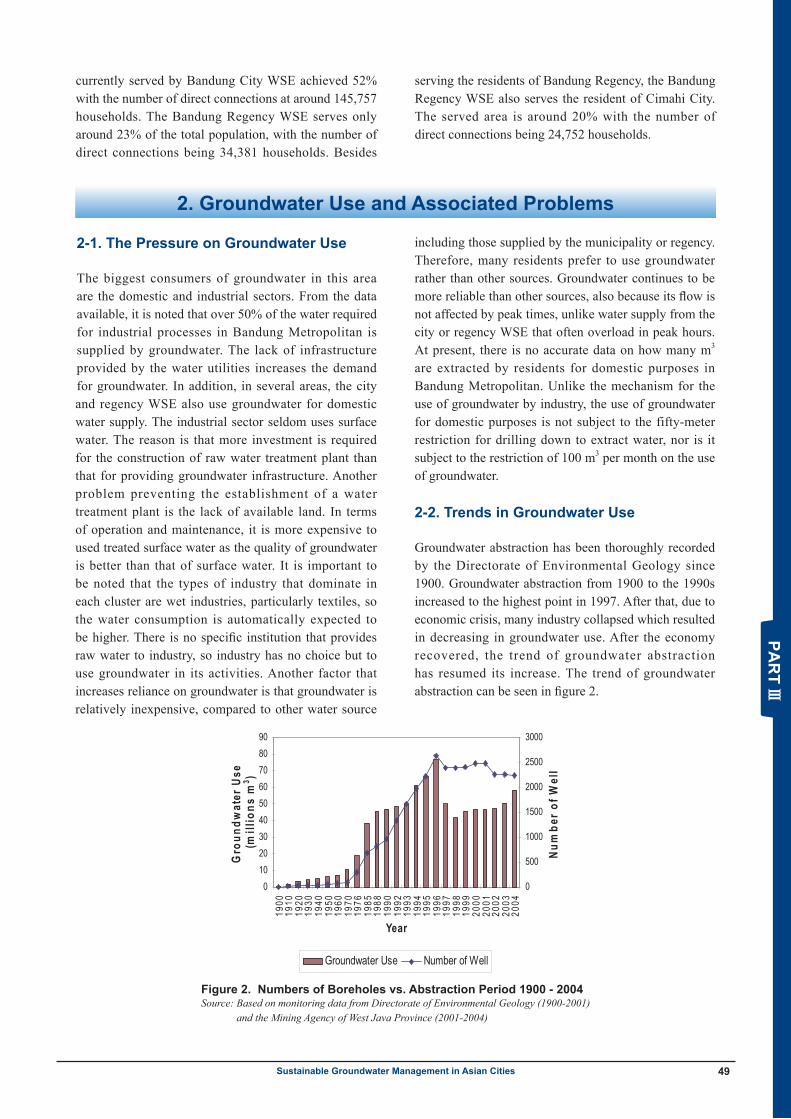
Groundwater abstraction has been thoroughly recorded by the Directorate of Environmental Geology since 1900. Groundwater abstraction from 1900 to the 1990s increased to the highest point in 1997. After that, due to economic crisis, many industry collapsed which resulted in decreasing in groundwater use. After the economy recovered, the trend of groundwater abstraction has resumed its increase. The trend of groundwater abstraction can be seen in figure 2.
Figure 2. Numbers of Boreholes vs. Abstraction Period 1900 - 2004Source: Based on monitoring data from Directorate of Environmental Geology (1900-2001)
and the Mining Agency of West Java Province (2001-2004)
Summary Report of Bandung Case - 4 - February 2006 IGES – West Java EPA SWMP Project
0102030405060708090
1900
1910
1920
1930
1940
1950
1960
1970
1976
1985
1988
1990
1992
1993
1994
1995
1996
1997
1998
1999
2000
2001
2002
2003
2004
Year
Gro
undw
ater
Use
(m
illio
ns m
3 )
0
500
1000
1500
2000
2500
3000
Num
ber o
f Wel
l
Groundwater Use Number of Well
Figure 2 Numbers of Boreholes vs. Abstraction Period 1900 - 2004 Source: West Java of Mining Agency and Directorate of Environmental Geology 1990 - 2004
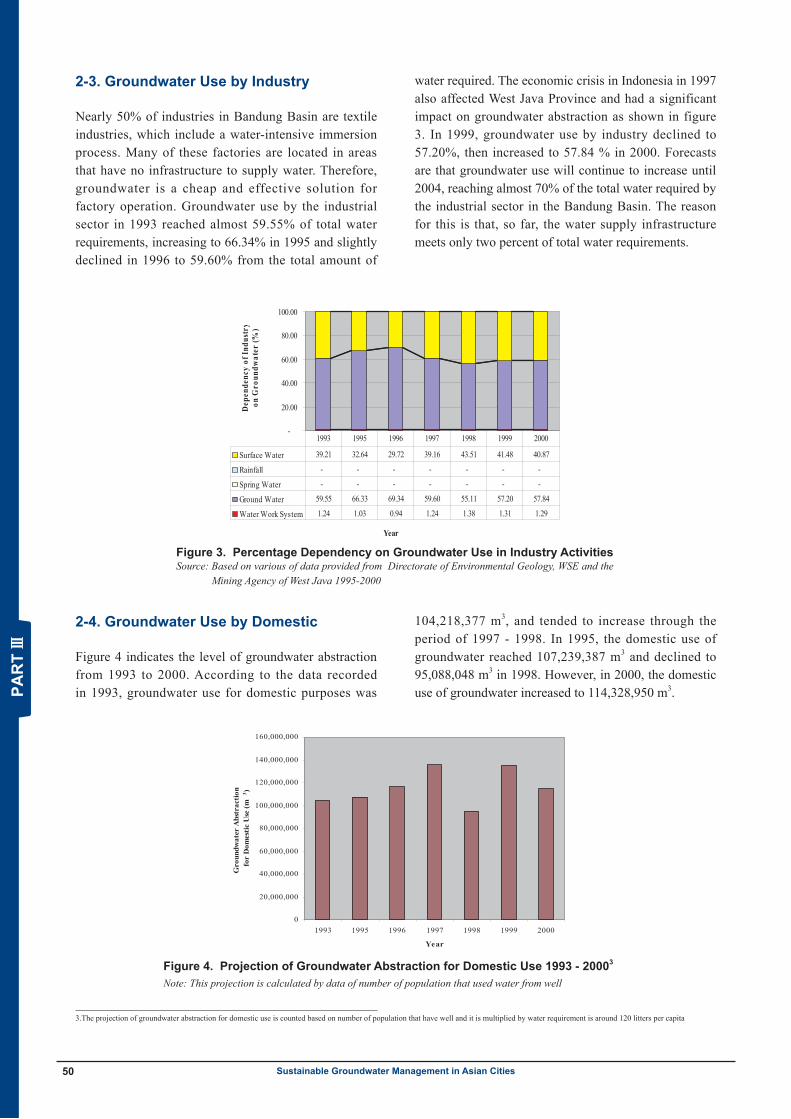
(3) Groundwater Industrial Use Nearly 50% of those industries operate in textile processing including immersing process which require great amount of water. Many of them are located in areas that have no water supply infrastructure, thus groundwater becoming cheap and effective solution in operating the factory. The groundwater use for industrial sector in 1993 reached almost 59.55 % of total water requirement, increasing to 66.34 % in 1995 and a bit decreasing in 1996, almost 59.60 % from total amount of water required. Economic crisis in Indonesia including West Java Province took place in 1997 have a significant impact to groundwater abstraction as shown in following figure. In 1999 groundwater usage for industry decrease to 57.20 %, and went up into app. 57.84 % in 2000, and predicted until in 2004, groundwater usage is continuously increasing, giving almost 70 % contribution of total water required by industrial sector in Bandung Basin because till now water work system only covering under 2 percentage of total water need.
-
20.00
40.00
60.00
80.00
100.00
Year
Dep
ende
ncy
of In
dust
ryon
Gro
undw
ater
(%)
Surface Water 39.21 32.64 29.72 39.16 43.51 41.48 40.87
Rainfall - - - - - - -
Spring Water - - - - - - -
Ground Water 59.55 66.33 69.34 59.60 55.11 57.20 57.84
Water Work System 1.24 1.03 0.94 1.24 1.38 1.31 1.29
1993 1995 1996 1997 1998 1999 2000
Figure 3 Percentage Dependency Groundwater Use at Industry Activities
(4) Groundwater Domestic Use This following table describes how much groundwater abstraction from 1993 to 2000. Recorded Data in 1993 groundwater use for domestic purpose was 104,218,377 m3 and tend to increase though during period of 1997 -1998 rather slow down. In 1995 groundwater domestic use reached 107,239,387 m3 and went down become 95,088,048 m3 in 1998. It is strongly estimated, that decreasing caused by economical crisis too, and so many residents deaden its consumption. But for the next year the groundwater domestic use increased back over 134,634,849 m3 in 2000.
currently served by Bandung City WSE achieved 52% with the number of direct connections at around 145,757 households. The Bandung Regency WSE serves only around 23% of the total population, with the number of direct connections being 34,381 households. Besides
serving the residents of Bandung Regency, the Bandung Regency WSE also serves the resident of Cimahi City. The served area is around 20% with the number of direct connections being 24,752 households.
Summary report of Sustainable Groundwater Management in Asia50 Sustainable Groundwater Management in Asian Cities
2-4. Groundwater Use by Domestic
Figure 4 indicates the level of groundwater abstraction from 1993 to 2000. According to the data recorded in 1993, groundwater use for domestic purposes was
104,218,377 m3, and tended to increase through the period of 1997 - 1998. In 1995, the domestic use of groundwater reached 107,239,387 m3 and declined to 95,088,048 m3 in 1998. However, in 2000, the domestic use of groundwater increased to 114,328,950 m3.
Figure 3. Percentage Dependency on Groundwater Use in Industry ActivitiesSource: Based on various of data provided from Directorate of Environmental Geology, WSE and the
Mining Agency of West Java 1995-2000
Summary Report of Bandung Case - 4 - February 2006 IGES – West Java EPA SWMP Project
0102030405060708090
1900
1910
1920
1930
1940
1950
1960
1970
1976
1985
1988
1990
1992
1993
1994
1995
1996
1997
1998
1999
2000
2001
2002
2003
2004
Year
Gro
undw
ater
Use
(m
illio
ns m
3 )
0
500
1000
1500
2000
2500
3000
Num
ber o
f Wel
l
Groundwater Use Number of Well
Figure 2 Numbers of Boreholes vs. Abstraction Period 1900 - 2004 Source: West Java of Mining Agency and Directorate of Environmental Geology 1990 - 2004
(3) Groundwater Industrial Use Nearly 50% of those industries operate in textile processing including immersing process which require great amount of water. Many of them are located in areas that have no water supply infrastructure, thus groundwater becoming cheap and effective solution in operating the factory. The groundwater use for industrial sector in 1993 reached almost 59.55 % of total water requirement, increasing to 66.34 % in 1995 and a bit decreasing in 1996, almost 59.60 % from total amount of water required. Economic crisis in Indonesia including West Java Province took place in 1997 have a significant impact to groundwater abstraction as shown in following figure. In 1999 groundwater usage for industry decrease to 57.20 %, and went up into app. 57.84 % in 2000, and predicted until in 2004, groundwater usage is continuously increasing, giving almost 70 % contribution of total water required by industrial sector in Bandung Basin because till now water work system only covering under 2 percentage of total water need.
-
20.00
40.00
60.00
80.00
100.00
Year
Dep
ende
ncy
of In
dust
ryon
Gro
undw
ater
(%)
Surface Water 39.21 32.64 29.72 39.16 43.51 41.48 40.87
Rainfall - - - - - - -
Spring Water - - - - - - -
Ground Water 59.55 66.33 69.34 59.60 55.11 57.20 57.84
Water Work System 1.24 1.03 0.94 1.24 1.38 1.31 1.29
1993 1995 1996 1997 1998 1999 2000
Figure 3 Percentage Dependency Groundwater Use at Industry Activities
(4) Groundwater Domestic Use This following table describes how much groundwater abstraction from 1993 to 2000. Recorded Data in 1993 groundwater use for domestic purpose was 104,218,377 m3 and tend to increase though during period of 1997 -1998 rather slow down. In 1995 groundwater domestic use reached 107,239,387 m3 and went down become 95,088,048 m3 in 1998. It is strongly estimated, that decreasing caused by economical crisis too, and so many residents deaden its consumption. But for the next year the groundwater domestic use increased back over 134,634,849 m3 in 2000.
Figure 4. Projection of Groundwater Abstraction for Domestic Use 1993 - 20003 Note: This projection is calculated by data of number of population that used water from well
Summary Report of Bandung Case - 5 - February 2006 IGES – West Java EPA SWMP Project
0
20,000,000
40,000,000
60,000,000
80,000,000
100,000,000
120,000,000
140,000,000
160,000,000
1993 1995 1996 1997 1998 1999 2000
Year
Gro
undw
ater
Abs
trac
tion
for
Dom
estic
Use
(m3 )
Figure 4 Percentage Dependency Groundwater Domestic Use 1993 - 2000
(5) Associated Groundwater ProblemWater Table Depletion Static ground water table in Bandung basin according to data from monitoring wells in some periods of years, have changed significantly, from positive artesian (flowing) to negative artesian (pumping). For example, positive arthesis distinguished in Dayeuhkolot-Bojongsoang area was +4.0 meter above ground level in 1920, but in 1960 the water table depleting to +3.9 meter above ground level. In mid 1970’s, ground water table has changed to -2 m below ground level and decreasing to 40 – 80 m below ground level 1990. Same phenomenon occurs in one of area in Cimahi City area, one of monitoring well that has been observed since 1920, which initially has positive artesis with pressure +19 meter. In the mid 1950’s, the pressure decreased and in the early 1980’s the pressure reduced and start into pumping phase with pressure -3 meter under soil level. In 1985, the ground water table has reached -10 meter under soil level, and in 1995, the ground water table perceived penetrating into - 40 meter under soil level.
-120.00
-100.00
-80.00
-60.00
-40.00
-20.00
0.00
Jan-9
0Ju
l-90
Jan-9
1Ju
l-91
Jan-9
2Ju
l-92
Jan-9
3Ju
l-93
Jan-9
4Ju
l-94
Jan-9
5Ju
l-95
Jan-9
6Ju
l-96
Jan-9
7Ju
l-97
Jan-9
8Ju
l-98
Jan-9
9Ju
l-99
Jan-2
000
Jul-2
000
Jan-2
001
Jul-2
001
Jan-2
002
Jul-2
002
Jan-2
003
Jul-2
003
Jan-2
004
Jul-2
004
Year
Wat
er ta
ble
(mbg
)
B.T.Nasional PTBintang Agung PT IBintang Agung PT IIBintang Agung PT IIIBintang Agung PT IVBSSM PTCentral Georgete PTGistex PTHintex PTIndokaha Shoes PT/Kahatex PT IIIKahatex PT IKahatex PT IIKahatex PT IVPapyrus Sakti PTSafilindo PTUltra Jaya PT IUltra Jaya PT IIBojong KunciBojong SalamCipedungMajalayaKahatex PT IKahatex PT IIKahatex PT IIIKahatex PT IV (TB)Kahatex PT V (TB)Kahatex PT VI (TB)Kahatex PT VII (TB)Polyfin Canggih PTSunsonindo PT
Figure 5 Water Table Depletion in Several Monitoring Well Source: Satrion, Directorate of Environmental Geology 1990-2004
The ground water level also monitored by Automatic Water table Recorder (AWLR) at 30 monitoring wells in study area. Geology Environmental Office identified the change of ground water table until July 2004. Areas with deepest depletion of static groundwater level forming cone of depression are Cijerah with over 20 m depletion during 1997-2004 period, Cimanggung with more than 60 m depletion over the past decade (1994-2004) (Satrio, DEG 2004). In Rancaekek, measured at PT. Kahatex deep well, the groundwater has depleted more than 60 m throughout the past decade, and in Leuwigajah Industrial Estate, the depletion reaches 40 m during 1994-2004.
2-3. Groundwater Use by Industry
Nearly 50% of industries in Bandung Basin are textile industries, which include a water-intensive immersion process. Many of these factories are located in areas that have no infrastructure to supply water. Therefore, groundwater is a cheap and effective solution for factory operation. Groundwater use by the industrial sector in 1993 reached almost 59.55% of total water requirements, increasing to 66.34% in 1995 and slightly declined in 1996 to 59.60% from the total amount of
water required. The economic crisis in Indonesia in 1997 also affected West Java Province and had a significant impact on groundwater abstraction as shown in figure 3. In 1999, groundwater use by industry declined to 57.20%, then increased to 57.84 % in 2000. Forecasts are that groundwater use will continue to increase until 2004, reaching almost 70% of the total water required by the industrial sector in the Bandung Basin. The reason for this is that, so far, the water supply infrastructure meets only two percent of total water requirements.
3.The projection of groundwater abstraction for domestic use is counted based on number of population that have well and it is multiplied by water requirement is around 120 litters per capita
Summary report of Sustainable Groundwater Management in Asia 51Sustainable Groundwater Management in Asian Cities
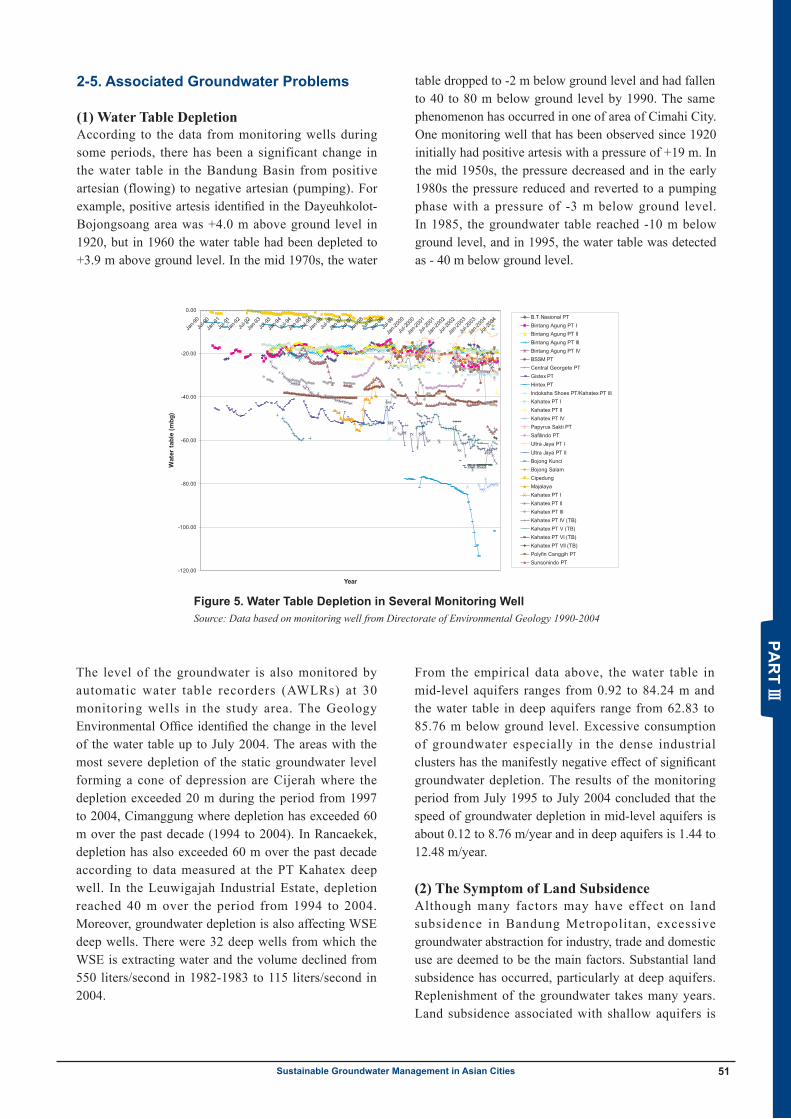
Figure 5. Water Table Depletion in Several Monitoring WellSource: Data based on monitoring well from Directorate of Environmental Geology 1990-2004
Summary Report of Bandung Case - 5 - February 2006 IGES – West Java EPA SWMP Project
0
20,000,000
40,000,000
60,000,000
80,000,000
100,000,000
120,000,000
140,000,000
160,000,000
1993 1995 1996 1997 1998 1999 2000
Year
Gro
undw
ater
Abs
trac
tion
for
Dom
estic
Use
(m3 )
Figure 4 Percentage Dependency Groundwater Domestic Use 1993 - 2000
(5) Associated Groundwater ProblemWater Table Depletion Static ground water table in Bandung basin according to data from monitoring wells in some periods of years, have changed significantly, from positive artesian (flowing) to negative artesian (pumping). For example, positive arthesis distinguished in Dayeuhkolot-Bojongsoang area was +4.0 meter above ground level in 1920, but in 1960 the water table depleting to +3.9 meter above ground level. In mid 1970’s, ground water table has changed to -2 m below ground level and decreasing to 40 – 80 m below ground level 1990. Same phenomenon occurs in one of area in Cimahi City area, one of monitoring well that has been observed since 1920, which initially has positive artesis with pressure +19 meter. In the mid 1950’s, the pressure decreased and in the early 1980’s the pressure reduced and start into pumping phase with pressure -3 meter under soil level. In 1985, the ground water table has reached -10 meter under soil level, and in 1995, the ground water table perceived penetrating into - 40 meter under soil level.
-120.00
-100.00
-80.00
-60.00
-40.00
-20.00
0.00
Jan-9
0Ju
l-90
Jan-9
1Ju
l-91
Jan-9
2Ju
l-92
Jan-9
3Ju
l-93
Jan-9
4Ju
l-94
Jan-9
5Ju
l-95
Jan-9
6Ju
l-96
Jan-9
7Ju
l-97
Jan-9
8Ju
l-98
Jan-9
9Ju
l-99
Jan-2
000
Jul-2
000
Jan-2
001
Jul-2
001
Jan-2
002
Jul-2
002
Jan-2
003
Jul-2
003
Jan-2
004
Jul-2
004
Year
Wat
er ta
ble
(mbg
)
B.T.Nasional PTBintang Agung PT IBintang Agung PT IIBintang Agung PT IIIBintang Agung PT IVBSSM PTCentral Georgete PTGistex PTHintex PTIndokaha Shoes PT/Kahatex PT IIIKahatex PT IKahatex PT IIKahatex PT IVPapyrus Sakti PTSafilindo PTUltra Jaya PT IUltra Jaya PT IIBojong KunciBojong SalamCipedungMajalayaKahatex PT IKahatex PT IIKahatex PT IIIKahatex PT IV (TB)Kahatex PT V (TB)Kahatex PT VI (TB)Kahatex PT VII (TB)Polyfin Canggih PTSunsonindo PT
Figure 5 Water Table Depletion in Several Monitoring Well Source: Satrion, Directorate of Environmental Geology 1990-2004
The ground water level also monitored by Automatic Water table Recorder (AWLR) at 30 monitoring wells in study area. Geology Environmental Office identified the change of ground water table until July 2004. Areas with deepest depletion of static groundwater level forming cone of depression are Cijerah with over 20 m depletion during 1997-2004 period, Cimanggung with more than 60 m depletion over the past decade (1994-2004) (Satrio, DEG 2004). In Rancaekek, measured at PT. Kahatex deep well, the groundwater has depleted more than 60 m throughout the past decade, and in Leuwigajah Industrial Estate, the depletion reaches 40 m during 1994-2004.
2-5. Associated Groundwater Problems
(1) Water Table DepletionAccording to the data from monitoring wells during some periods, there has been a significant change in the water table in the Bandung Basin from positive artesian (flowing) to negative artesian (pumping). For example, positive artesis identified in the Dayeuhkolot-Bojongsoang area was +4.0 m above ground level in 1920, but in 1960 the water table had been depleted to +3.9 m above ground level. In the mid 1970s, the water
table dropped to -2 m below ground level and had fallen to 40 to 80 m below ground level by 1990. The same phenomenon has occurred in one of area of Cimahi City. One monitoring well that has been observed since 1920 initially had positive artesis with a pressure of +19 m. In the mid 1950s, the pressure decreased and in the early 1980s the pressure reduced and reverted to a pumping phase with a pressure of -3 m below ground level. In 1985, the groundwater table reached -10 m below ground level, and in 1995, the water table was detected as - 40 m below ground level.
The level of the groundwater is also monitored by automatic water table recorders (AWLRs) at 30 monitoring wells in the study area. The Geology Environmental Office identified the change in the level of the water table up to July 2004. The areas with the most severe depletion of the static groundwater level forming a cone of depression are Cijerah where the depletion exceeded 20 m during the period from 1997 to 2004, Cimanggung where depletion has exceeded 60 m over the past decade (1994 to 2004). In Rancaekek, depletion has also exceeded 60 m over the past decade according to data measured at the PT Kahatex deep well. In the Leuwigajah Industrial Estate, depletion reached 40 m over the period from 1994 to 2004. Moreover, groundwater depletion is also affecting WSE deep wells. There were 32 deep wells from which the WSE is extracting water and the volume declined from 550 liters/second in 1982-1983 to 115 liters/second in 2004.
From the empirical data above, the water table in mid-level aquifers ranges from 0.92 to 84.24 m and the water table in deep aquifers range from 62.83 to 85.76 m below ground level. Excessive consumption of groundwater especially in the dense industrial clusters has the manifestly negative effect of significant groundwater depletion. The results of the monitoring period from July 1995 to July 2004 concluded that the speed of groundwater depletion in mid-level aquifers is about 0.12 to 8.76 m/year and in deep aquifers is 1.44 to 12.48 m/year.
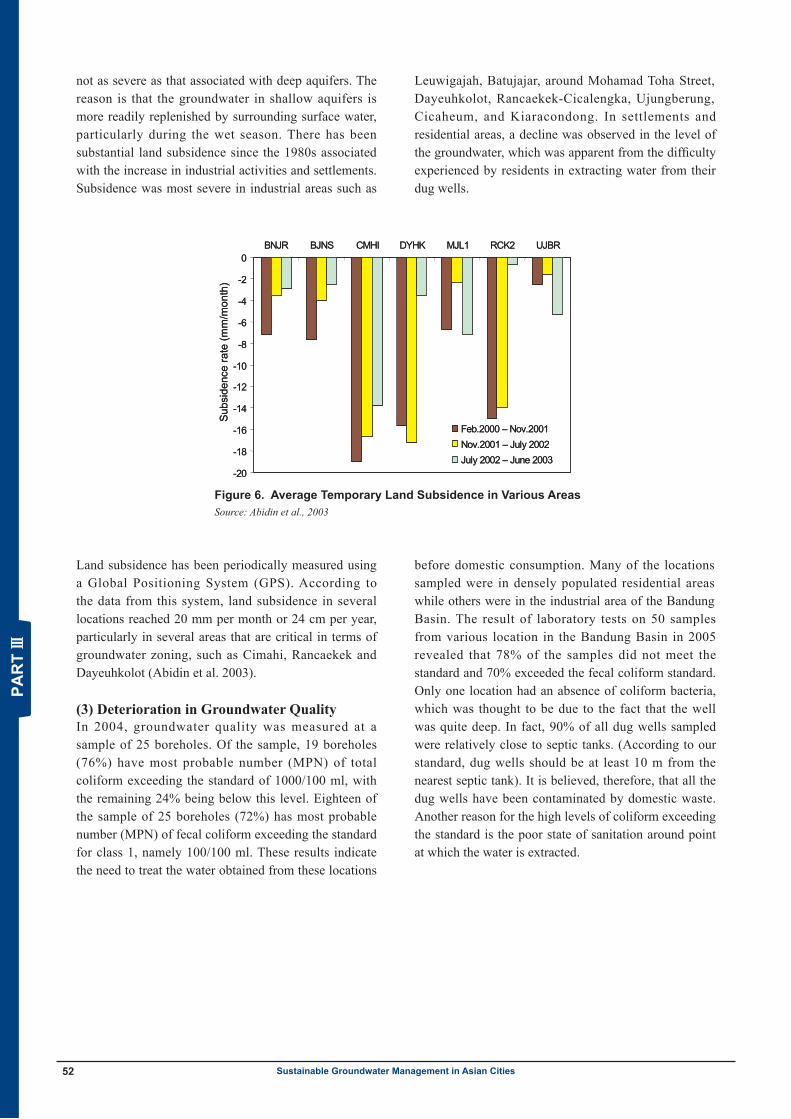
(2) The Symptom of Land SubsidenceAlthough many factors may have effect on land subsidence in Bandung Metropolitan, excessive groundwater abstraction for industry, trade and domestic use are deemed to be the main factors. Substantial land subsidence has occurred, particularly at deep aquifers. Replenishment of the groundwater takes many years. Land subsidence associated with shallow aquifers is
Summary report of Sustainable Groundwater Management in Asia52 Sustainable Groundwater Management in Asian Cities
Figure 6. Average Temporary Land Subsidence in Various AreasSource: Abidin et al., 2003
Summary Report of Bandung Case - 6 - February 2006 IGES – West Java EPA SWMP Project
-20
-18
-16
-14
-12
-10
-8
-6
-4
-2
0BNJR BJNS CMHI DYHK MJL1 RCK2 UJBR
Feb.2000 – Nov.2001Nov.2001 – July 2002July 2002 – June 2003
Subs
iden
ce ra
te (m
m/m
onth
)
-20
-18
-16
-14
-12
-10
-8
-6
-4
-2
0BNJR BJNS CMHI DYHK MJL1 RCK2 UJBR
Feb.2000 – Nov.2001Nov.2001 – July 2002July 2002 – June 2003
Subs
iden
ce ra
te (m
m/m
onth
)
Moreover, ground water depletion also affects WSE deep wells. There were 32 deep wells along the rail and it was effecting the decreasing of WSE water extraction, from 550 liters/second in 1982-1983 to 115 liters / second in 2004.
From the empirical data above, ground water table in middle aquifer ranges from 0,92–84,24 meter and deep aquifer ranges from 62,83 – 85,76 m below ground level. Excessive ground water consumption especially in dense industrial cluster manifestly have negative effect of significant ground water depletion, meanwhile result of monitoring period from July 2004 until July 1995 concluded that rapidity of ground water depletion in middle aquifer is about 0.12 - 8.76 meter/year and in deep aquifer is about 1.44 – 12.48 meter/year.
(6) Land Subsidence Symptom Although many factors causing of land subsidence in Metropolitan Bandung, yet groundwater abstraction excessively for industry, trading, domestic uses are the main factor. Land subsidence very significantly happened, particularly at deep aquifer. The source of groundwater coming from recharge area which located quite far and the flowing into discharge area need time till years. Land subsidence of shallow aquifer was not as terrible as deep aquifer. That thing can be happened because of groundwater more filled by surrounding surface water particularly in wet season. Drastic land subsidence happened since 1980’s in line with grow up of industrial and settlement activities. Therefore, the beast of land subsidence happened in industrial area such as Leuwigajah, Batujajar, around Mohamad Toha Street, Dayeuhkolot, Rancaekek-Cicalengka, Ujungberung, Cicaheum, and Kiaracondong. At settlement and housing, decreasing happened at shallow groundwater level, seen of difficult resident looking for groundwater from their dug well.
Figure 6 Various of Land Subsidence Average Temporary in Several Area Source: Abidin et. all, 2003
Measurement land subsidence have been periodically conducted by using Global Positioning System (GPS), took information that land subsidence for several location can achieve 20 mm per month or equivalent 24 cm per year particularly at several area which entering critical zone such as Cimahi, Rancaekek and Dayeuhkolot (Abidin et. al, 2003).
(7) Groundwater Quality Deterioration In 2004, of 25 points sample is indicated 19 boreholes have most probable number of total coliform over 1000/100 ml or it is about 76 %, while the rest 24 % is still below the standard stated. Most probable number fecal coliform of 25 sample’s location is indicated 18 among (72 %) are over standard stated for class 1 namely 100/100 ml. This matter showing that treatment to water for drinking water requirement in particular at those locations above need to be done before that water will be consumed by domestic. If considering based on sampling locations, hence locations with most probable number of high number coliform bacteria and exceed water standard reside at dense area such as settlement area as well some of them represent industrial area in Bandung Basin at the time being. The result of laboratory to 50 tested samples which located in Bandung Basin in 2005 showing that 78 % of those samples did not fulfill standard and 70 % exceeding fecal coliform standard. Only was one location of samplings which did not show absence of coliform bacterial. It was estimated that condition caused by well was quite deep. In fact, all of those samples almost 90 % have distance between dug well and septic tank relatively is close (according our standard of distance between and septic tank should be over 10
not as severe as that associated with deep aquifers. The reason is that the groundwater in shallow aquifers is more readily replenished by surrounding surface water, particularly during the wet season. There has been substantial land subsidence since the 1980s associated with the increase in industrial activities and settlements. Subsidence was most severe in industrial areas such as
Leuwigajah, Batujajar, around Mohamad Toha Street, Dayeuhkolot, Rancaekek-Cicalengka, Ujungberung, Cicaheum, and Kiaracondong. In settlements and residential areas, a decline was observed in the level of the groundwater, which was apparent from the difficulty experienced by residents in extracting water from their dug wells.
Land subsidence has been periodically measured using a Global Positioning System (GPS). According to the data from this system, land subsidence in several locations reached 20 mm per month or 24 cm per year, particularly in several areas that are critical in terms of groundwater zoning, such as Cimahi, Rancaekek and Dayeuhkolot (Abidin et al. 2003).
(3) Deterioration in Groundwater QualityIn 2004, groundwater quality was measured at a sample of 25 boreholes. Of the sample, 19 boreholes (76%) have most probable number (MPN) of total coliform exceeding the standard of 1000/100 ml, with the remaining 24% being below this level. Eighteen of the sample of 25 boreholes (72%) has most probable number (MPN) of fecal coliform exceeding the standard for class 1, namely 100/100 ml. These results indicate the need to treat the water obtained from these locations
before domestic consumption. Many of the locations sampled were in densely populated residential areas while others were in the industrial area of the Bandung Basin. The result of laboratory tests on 50 samples from various location in the Bandung Basin in 2005 revealed that 78% of the samples did not meet the standard and 70% exceeded the fecal coliform standard. Only one location had an absence of coliform bacteria, which was thought to be due to the fact that the well was quite deep. In fact, 90% of all dug wells sampled were relatively close to septic tanks. (According to our standard, dug wells should be at least 10 m from the nearest septic tank). It is believed, therefore, that all the dug wells have been contaminated by domestic waste. Another reason for the high levels of coliform exceeding the standard is the poor state of sanitation around point at which the water is extracted.
Summary report of Sustainable Groundwater Management in Asia 53Sustainable Groundwater Management in Asian Cities
Year Policy Level
1945 Fundamental Act of 1945 (UUD 45)Natural resources, including water resources are considered a public good that must be managed fairly, and used for the benefit of Indonesian people.
National
1970 President Decree No. 64 of 1972 Regarding Groundwater administration Governor has authority to issue a license for groundwater use
National
1974 Act Number 11 Year 1974 on Watering• Groundwater is a public good that has a social function and shall be used optimally for the wellbeing of
the people. • Authorization for water management is divided into two bodies i.e. all water except groundwater becomes
the responsibility of Minister of Watering, while groundwater is the responsibility of the Mining Department/Minister of Mining.
National
1980 Monitoring Research by Geology Environment Office (Under Minister of Mining and Energy) National
1982 Central Government through Government Law on Water Arrangement 11 of 1982 National
1982 Governor Decree No 181/SK.1624-Bapp/82 of 1982Land Use Planning for the Bandung Basin for the Relocation of Industry and Infrastructure for water utilities
Provincial
1990 Plan of Determination of Zoning by Geology Environment Office (Under Minister of Mining and Energy)
National
1994 Minister of Mining and Energy Decree No. 02P/101/M.PE/1994Recommendation for Zoning in the Bandung Basin
National
1995 Directorate Environment Geology Decree 005.K/10/DDJG/1995Technical Guidance for Groundwater Management
National
Provincial Regulation No.9 of 1995 Regarding Groundwater Controlling and Surface Water Provincial
Local Regulation No. 43 of 1995 Regarding Permit for Groundwater Controlling
Local
1997 Act Number 18/1997 on Local Tax and Retribution, Tax on surface water and groundwater usage is classified as second state government tax
National
1998 Bandung City Government Rule Number 3 Year 1998 Tax charged at the maximum rate of 20%.
Local
1999 Act No. 22 of 1999For Decentralization, groundwater management is the responsibility of the Local Government
National
2000 Act Number 34 Year 2000 on Amendment of Indonesian Republic Act Number 18 Year 1997Several mechanisms changed for collecting tax. Act 18/1997 stated that the Local Government has the authority to collect taxes for Groundwater Abstraction, whilst according to Act 34/2000 Article 2, the collection of such taxes forms part of Provincial Government Revenue.
National
Minister of Mining and Energy Decree No. 1451.K/MEM/2000Technical Guidance for Groundwater Potency Evaluation and Appendix 2 on Technical Guidance for Groundwater Planning and Usage
2001 In 2001, West Java Province Government issued Province Regulation Number 16/2001 Relates to Groundwater Management
Provincial
2002 To support provincial regulation number 16 of 2000, West Java Governor Decree Number 23/2002 on the Guidance for the Implementation of Provincial Legislation Law Number 16/2000 was issued in 2002.
Provincial
Regulation Number 8/2002 issued by Bandung City has similar substance to provincial regulation. Domestic use below 100 m3 per month with a depth ranging from 40 to 60 m does not need a license for an abstraction well.
Local
2003 West Java Governor Decree Number 29/2003 issued as basic for groundwater usage tax calculation. There are three main considerations: water is a natural resource, water should be conserved and the price of raw water
Provincial
2004 Water Resources Act No. 7 of 2004 National
Cimahi Regulation Number 16 of 2004 on Groundwater Management Local
Act 32 of 2004 on Revised of Decentralization, The substance is to return the authority for groundwater from the local government to the provincial government.
National
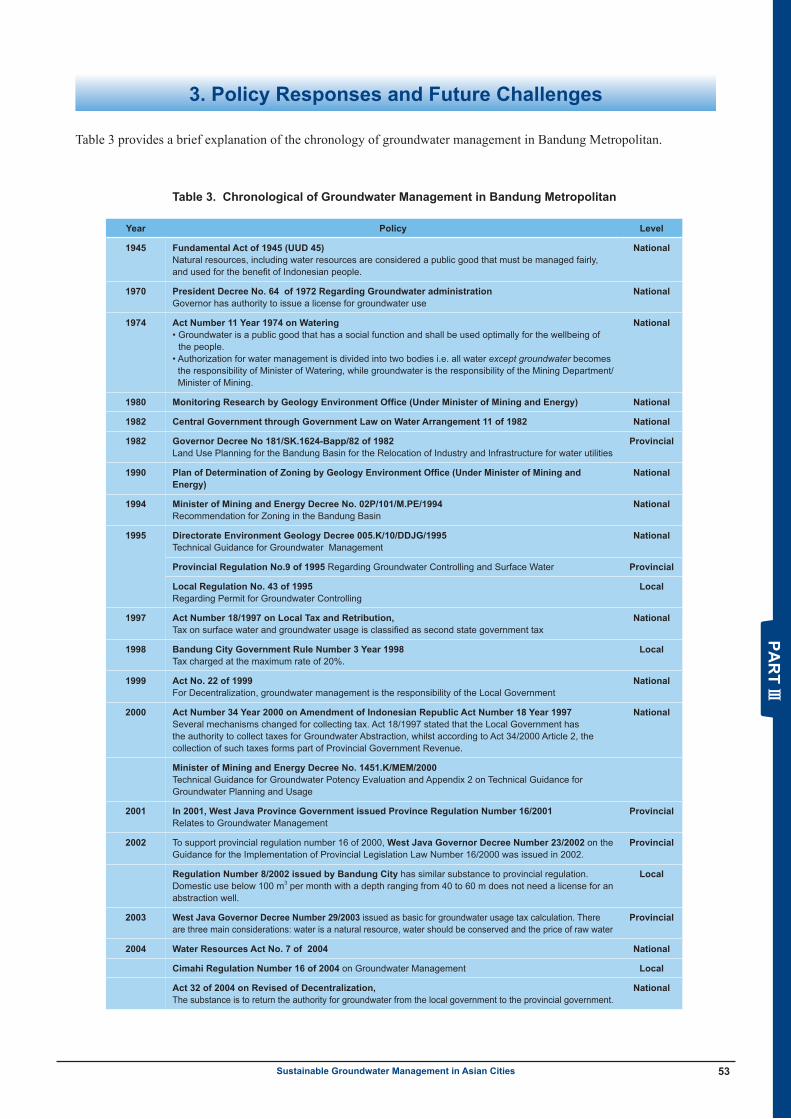
Table 3. Chronological of Groundwater Management in Bandung Metropolitan
3. Policy Responses and Future Challenges
Table 3 provides a brief explanation of the chronology of groundwater management in Bandung Metropolitan.
Summary report of Sustainable Groundwater Management in Asia54 Sustainable Groundwater Management in Asian Cities
Measures Date Implemented Effectiveness Deficiencies
Using of License 1974 N/A Unregistered wells still exist particularly in industry
Zoning Area1. Critical Area2. Vulnerable Area3. Safe Area
1994 N/A Water table depletion is still happening in critical areas
Groundwater Usage Charge 1974 N/A No charge for domestic use as water is a public resource
Abandonment of Groundwater Wells by WSE 1990 N/A Groundwater sources are still used by WSE for certain areas
Plan for Industry Relocation 1990 High costs
Groundwater License Requirement Based on Technical Aspects:1. Depth and Length of Strainer2. Discharge of Pipe Diameter3. Power of Pumping Equipment4. Depth of Well5. Pizzometer Pipe Diameter6. Depth of Aquifer Extracted
1995 Effective
Limiting Groundwater Abstraction 1995 Water table depletion continues.
Groundwater Charge 1995 Effective for industrial use but not effective for domestic use
No charge for domestic use
Metering 1995 80 % Not all wells are metered.
Decentralization (Hand Over Groundwater Management Authority from Centre to Provincial and Local Government)
1999
Stopping a New License for Certain Areas 2000 Water table depletion continues.
Land Use Regulation 2000 Uncoordinated land use planning between provincial and local level
Groundwater Tax Based on Natural, Conservation and Raw Water Price
2001 Effective for industrial use but not effective for domestic use
No charge for domestic use
Establish Monitoring Well Water table depletion continues.
Introduction of Recycle and Reuse Technology 2000 Not effective No incentive for industries that have complied with the initiative
Reporting of Groundwater Extraction Effective for determining how much groundwater has been extracted for industrial use
Introduce Recharge Wells for Both Domestic and Industrial Use Particularly in Conservation Areas
1995 N/A Only 5% of people residing in the conservation area complied with this regulation.
Groundwater Data and Information System 2002 Not updated
Closing Unregistered Wells Effective
Note: This table was created based on the Stakeholders Meeting, Bandung Case, January 2006
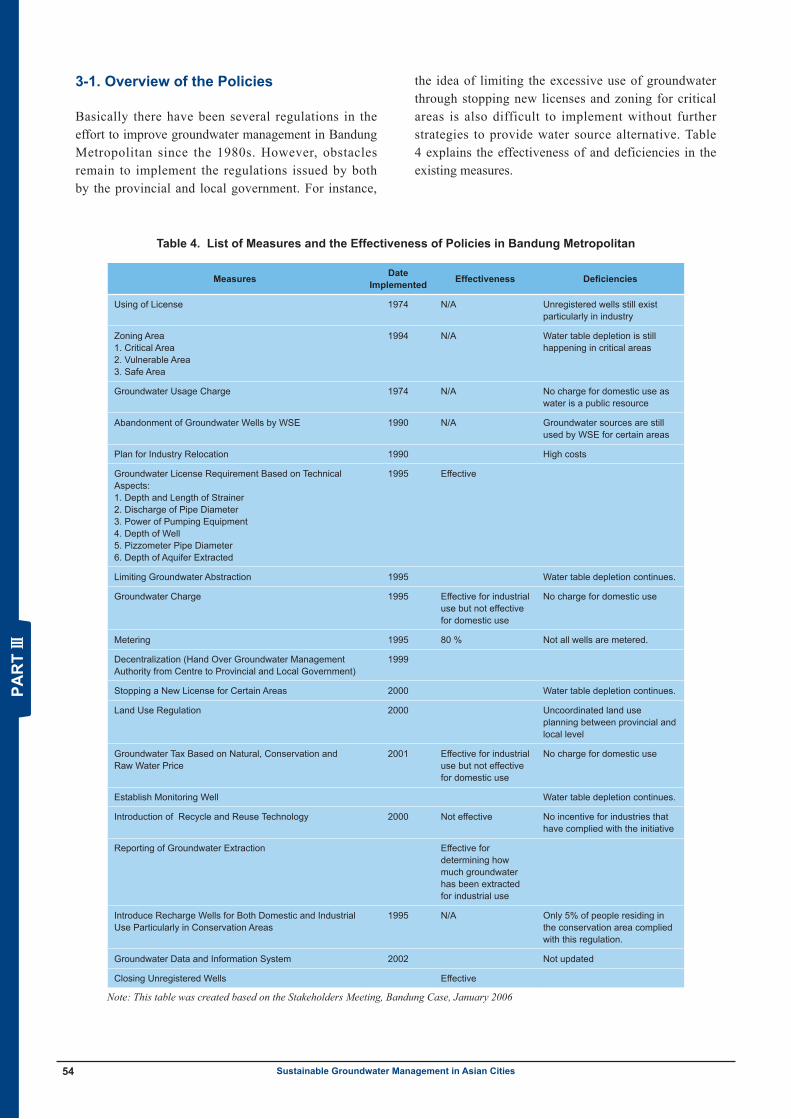
Table 4. List of Measures and the Effectiveness of Policies in Bandung Metropolitan
3-1. Overview of the Policies
Basically there have been several regulations in the effort to improve groundwater management in Bandung Metropolitan since the 1980s. However, obstacles remain to implement the regulations issued by both by the provincial and local government. For instance,
the idea of limiting the excessive use of groundwater through stopping new licenses and zoning for critical areas is also difficult to implement without further strategies to provide water source alternative. Table 4 explains the effectiveness of and deficiencies in the existing measures.
Summary report of Sustainable Groundwater Management in Asia 55Sustainable Groundwater Management in Asian Cities
3-2. Challenges to Improving Groundwater Management
The dependency of industry on groundwater is one of the constraints faced by groundwater management. This dependency is associated with the lack of infrastructure provided by WSE. According to the most recent data, the amount of clean water that WSE supplied to the industrial sector was only about 3.5 million m3 in 2003, which is just 1% of the volume required by industry. This means that almost all water required by the industrial sector comes from groundwater.
Another factor influencing the scarcity of groundwater is the condition of groundwater recharge area. Groundwater recharge can be interpreted as the addition to the groundwater from an external area to the saturated water column. Generally, groundwater is replenished from rainfall, rivers and human intervention such as an artificial recharge well. One of the main factors influencing groundwater depletion is significant changes in the land cover from natural terrain to built areas. These changes can disturb the hydrological function in the upper Citarum watershed. The influences will get worse if the changes in land use occur in the recharge area. According to the analysis by Geology and Environment Directorate, 1996, concerning the recharge areas in the Bandung basin, there are 21 sites of recharge areas in the upstream of the Citarum watershed that are classified as the main recharge area accounting for 60,881.31 hectares or 26% of the total recharge area. In addition, the Chaffy recharge area accounts for 67, 911.89 hectares or 29%, and an additional recharge area accounts for 56,069.66 hectares or 24%. Despite this, there are also releases from charging areas equal to 38, 970.4 hectares (16.6%) (Directorate of Environmental Geology and Planning Board of West Java 1996). Generally, the recharge mechanism in a shallow aquifer in the Bandung Basin is a direct process, irrespective of whether it is a natural or human intervention, and it occurs either instantaneously or over the period of a week. The process of recharging mid-level aquifers and deep aquifers occurs directly or indirectly. Direct processes occur in the main recharge area and indirect processes occur in almost every watershed area. This condition is due to the isometric height from the deep groundwater located under shallow groundwater. It means that the shallow aquifer is first recharged, then the water continues to the mid-level and deep aquifer through leakage.
The groundwater management problem in the Bandung Basin has many dimensions, one of which is providing
alternative source of water for industrial use. Looking at the groundwater control mechanism in the Bandung Basin, licensing is still considered the main tool for controlling groundwater abstraction. This mechanism would not work with the bare minimum awareness of the stakeholders about the importance of groundwater conserva t ion and weak law enforcement and monitoring. The fact is that in the Bandung Basin, many unregistered deep wells have been found. There are no incentives such as tax compensation for industries that recycle water. The result is that many industries are not interested in water conservation, making it extremely difficult to control groundwater extraction in the Bandung Basin.
The failure of water utilities to supply raw water and to extend the coverage area has also become a trigger for the groundwater problem. The coverage as a percentage by WSE is 37.75% (50% for Bandung City, 23% for Bandung Regency, 7% for Sumedang Regency and 20% for Cimahi City). The raw water for WSE comes mostly from surface water with the biggest service provided for domestic use. Industry still depends on groundwater, and since industries are self-regulating, groundwater control becomes difficult.
The future challenge for groundwater management is to alter the mechanism of water provision that currently applies. Tax based on a calculation of water value provision provided is divided into three components. The mechanism provided a price below that which applied to WSE. Simulated calculations concerning the costliest component indicated that the price that must be paid according to the current mechanism of water provision is much cheaper than the tariff released by WSE. Under this mechanism, the price for 1 to 500 m3 is IDR 1,038 per m3, the price for 500 to 1,500 m3 is IDR 1,668 per m3, the price for 1,500 to 3,000 m3 is IDR 2,298 per m3, the price for 3,000 to 5,000 m3 is IDR 3,138 per m3. In comparison the tariff for WSE is IDR 1,750 to 9,600 per m3 for usage by the industrial sector.
3-3. Issues from the Stakeholders’ Meeting
The stakeholders’ meeting conducted on 12 January 2006 discussed several issues present and future due to barriers and deficiencies in groundwater management in Bandung Metropolitan. The biggest challenge in handling the problem is how to comply with the enacted laws and regulations. There are policies and regulations that have been issued to preserve the groundwater, yet they are difficult to implement. As we discussed prior to the meeting, the failure to make optimum use
Summary report of Sustainable Groundwater Management in Asia56 Sustainable Groundwater Management in Asian Cities
Issues and Concerns
Excessive groundwater abstraction
Water table depletion
Land subsidence Symptom in Certain Area
Lack of alternative water sources
Lack of water infrastructure for domestic use
Water loss of WSE
Monitoring of actual groundwater use
Permits from the building development office does not consider water resource limitations
Groundwater abstraction exceeding groundwater replenishment
Changes in land coverage from recharge water area to built-up area
Lack of public awareness of the environmental function of groundwater
Poor controlling of groundwater usage
Lack of law enforcement
No agency specifically dealing with industrial water supply
Price of groundwater cheaper than WSE price
Unregistered wells particularly for industrial use
Lack of database system
Deterioration of groundwater particularly in shallow aquifers (domestic use)
Licensing does not consider water source availability
Improper land use planning
Limited natural resources
Differing perceptions concerning groundwater sources between stakeholders
Note: This table was created based on the Stakeholders Meeting, Bandung Case, January 2006
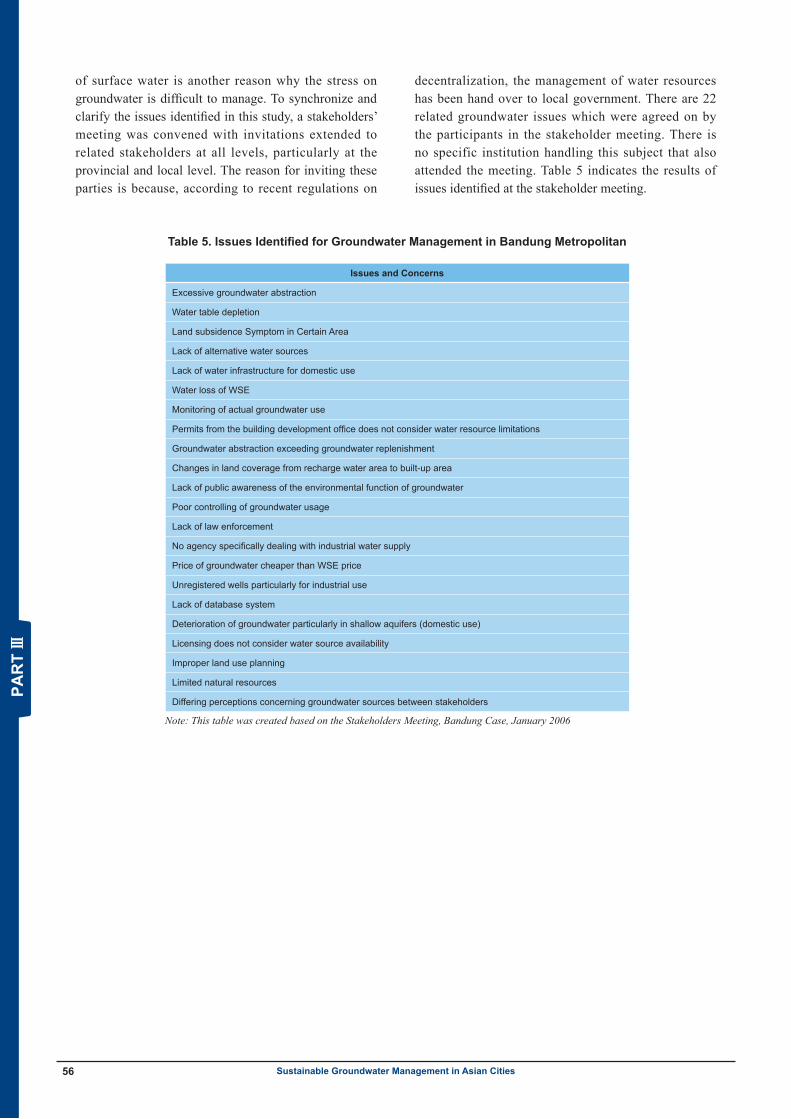
Table 5. Issues Identified for Groundwater Management in Bandung Metropolitan
of surface water is another reason why the stress on groundwater is difficult to manage. To synchronize and clarify the issues identified in this study, a stakeholders’ meeting was convened with invitations extended to related stakeholders at all levels, particularly at the provincial and local level. The reason for inviting these parties is because, according to recent regulations on
decentralization, the management of water resources has been hand over to local government. There are 22 related groundwater issues which were agreed on by the participants in the stakeholder meeting. There is no specific institution handling this subject that also attended the meeting. Table 5 indicates the results of issues identified at the stakeholder meeting.
Summary report of Sustainable Groundwater Management in Asia 57Sustainable Groundwater Management in Asian Cities
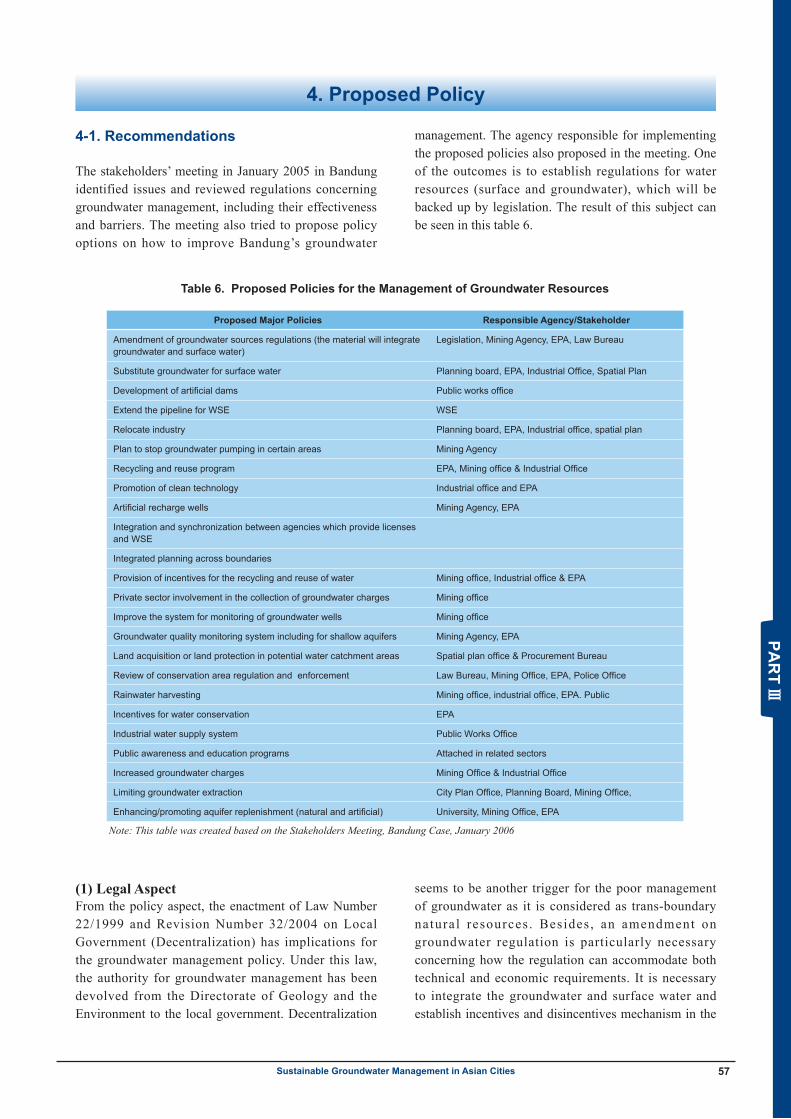
Proposed Major Policies Responsible Agency/Stakeholder
Amendment of groundwater sources regulations (the material will integrate groundwater and surface water)
Legislation, Mining Agency, EPA, Law Bureau
Substitute groundwater for surface water Planning board, EPA, Industrial Office, Spatial Plan
Development of artificial dams Public works office
Extend the pipeline for WSE WSE
Relocate industry Planning board, EPA, Industrial office, spatial plan
Plan to stop groundwater pumping in certain areas Mining Agency
Recycling and reuse program EPA, Mining office & Industrial Office
Promotion of clean technology Industrial office and EPA
Artificial recharge wells Mining Agency, EPA
Integration and synchronization between agencies which provide licenses and WSE
Integrated planning across boundaries
Provision of incentives for the recycling and reuse of water Mining office, Industrial office & EPA
Private sector involvement in the collection of groundwater charges Mining office
Improve the system for monitoring of groundwater wells Mining office
Groundwater quality monitoring system including for shallow aquifers Mining Agency, EPA
Land acquisition or land protection in potential water catchment areas Spatial plan office & Procurement Bureau
Review of conservation area regulation and enforcement Law Bureau, Mining Office, EPA, Police Office
Rainwater harvesting Mining office, industrial office, EPA. Public
Incentives for water conservation EPA
Industrial water supply system Public Works Office
Public awareness and education programs Attached in related sectors
Increased groundwater charges Mining Office & Industrial Office
Limiting groundwater extraction City Plan Office, Planning Board, Mining Office,
Enhancing/promoting aquifer replenishment (natural and artificial) University, Mining Office, EPA
Note: This table was created based on the Stakeholders Meeting, Bandung Case, January 2006
Table 6. Proposed Policies for the Management of Groundwater Resources
4. Proposed Policy
4-1. Recommendations
The stakeholders’ meeting in January 2005 in Bandung identified issues and reviewed regulations concerning groundwater management, including their effectiveness and barriers. The meeting also tried to propose policy options on how to improve Bandung’s groundwater
management. The agency responsible for implementing the proposed policies also proposed in the meeting. One of the outcomes is to establish regulations for water resources (surface and groundwater), which will be backed up by legislation. The result of this subject can be seen in this table 6.
(1) Legal AspectFrom the policy aspect, the enactment of Law Number 22/1999 and Revision Number 32/2004 on Local Government (Decentralization) has implications for the groundwater management policy. Under this law, the authority for groundwater management has been devolved from the Directorate of Geology and the Environment to the local government. Decentralization
seems to be another trigger for the poor management of groundwater as it is considered as trans-boundary natural resources . Besides , an amendment on groundwater regulation is particularly necessary concerning how the regulation can accommodate both technical and economic requirements. It is necessary to integrate the groundwater and surface water and establish incentives and disincentives mechanism in the
Summary report of Sustainable Groundwater Management in Asia58 Sustainable Groundwater Management in Asian Cities
official regulations, so that industry will engage in clean technology, implement reuse and recycling programs and perform rainfall harvesting subsequently. The substances of these outcomes will be brought before parliament or legislators as draft legislation about the management of water resources at both the provincial and local levels. Consistency in enforcing the existing or amended policies to be issued and the imposition of penalties, such as the cancellation of industrial licenses for exceeding the limits for groundwater abstraction, has the unanimous agreement of all stakeholders.
(2) Economic MeasuresSeveral recommended policies were proposed at the stakeholders’ meeting. These included incentives and disincentives for industrial use, increased groundwater levies or taxes for industrial use so that the water becomes more expensive than the charge for WSE.
(3) Technical MeasuresIn perspect ive of groundwater ut i l izat ion and management, a review needs to be done with the aim of maintaining and recovering the groundwater level, so that the capacity of aquifers can be sustained. Policy alternatives for changing the water source from groundwater to surface water, particularly for industrial use, need to be considered. Another alternative is to relocate industrial cluster to other areas designated as industrial estates. In this case, however, relocating industry to another location where there is abundant surface water will also require development of the infrastructure. This option has significant weaknesses in implementation, i.e. a high level of investment as well as the politic and social costs that the government has to bear.
Appropriate available technology for recycling is another alternative that can be implemented by industry to meets its water requirements. Consistency and support from the government in the implementation is the key to the success of this programme.
(4) Informative MeasuresThrough public awareness and education such as the Save Water Movement, the government at each level should promote water saving and disseminate the problems associated with both groundwater and surface water.
(5) Support MeasuresSeveral recommendations have also been proposed to cope with groundwater problems: Establish a proper groundwater monitoring system to deal with quantity
and quality, land acquisition for conservation area thereby enhancing both natural and artificial recharge aquifers, and establish trans-boundary integrated planning.
References Abidin, H. Z., R. Djaja, H. Andreas, M. Gamal, D. Murdohardono, and H. Rajiyowiryono. 2002. Penurunan muka tanah di Cekungan Bandung pada periode (2000–2002). Hasil estimasi metode survey GPS (Land subsidence in the Bandung Basin (2000–2002). Result of GPS survey estimates). Jurnal Teknologi Mineral.
Badan Pusat Statistik Kota Bandung (BPSKB) (Bandung City Statistical Agency) and Badan Perencanaan Daerah Kota Bandung (BPSKB) (Planning Board of Bandung City). 2002. Indikator kemiskinan Kota Bandung tahun 2002 (Poverty indicators of Bandung City year of 2002). Katalog BPS 1414.3273. ISBN 979.486.7072
Badan Pusat Statistik Kota Bandung (BPSKB) (Bandung City Statistical Agency). 2003. Kota Bandung dalam angka tahun 2003 (Bandung city in figure year of 2003). Katalog BPS 1401.3273. Publication Number 3273.01. Badan Pusat Statistika Kota Bandung (Bandung City Statistical Agency).
Badan Pusat Statistik Kabupaten Bandung (BPSKB) (Bandung Regency Statistical Agency). 2003. Kabupaten Bandung dalam angka tahun 2003 (Bandung regency in figure year of 2003). Badan Pusat Statistika Kabupaten Bandung (Bandung regency Statistical Agency).
Badan Pusat Statistik Kota Cimahi (BPSKC) (Cimahi City Statistical Agency). 2003. Cimahi City dalam angka tahun 2003 (Cimahi city in figure year of 2003). Badan Pusat Statistika Kota Cimahi (Cimahi City Statistical Agency).
Badan Pusat Statistik Propinsi Jawa Barat (BPSJB) (West Java Provincial Statistical Agency). 2004. Nilai produk domestik regional bruto Propinsi Jawa Barat berdasarkan harga konstan dan harga berlaku (Gross Regional Domestic Product for each city of West Java based on constant and market price. Badan Pusat Statistika Propinsi Jawa Barat (West Java Provincial Statistical Agency).
Dinas Pekerjaan Umum Pengairan (Water Resources Agency of West Java). 1996. Penanggulangan kelangkaan air di Cekungan Bandung (Handling of water scarcity in Bandung Basin). Bandung: Pemerintah Propinsi Jawa Barat (Government of West Java Provincial).
Direktorat Tata Lingkungan Geologi dan Kawasan Pertambangan (DTLGKP)(Directorate of Environmental Geology) and Badan Perencanaan Daerah Propinsi Jawa Barat (BPDPJB) (Planning Board of West Java Province). 1996. Identifikasi dan pengendalian pembangunan di daerah resapan (Identification and control of development in recharge area). Final report. Bandung: Departemen Pertambangan dan Energi, Direktorat Jenderal Geologi dan Sumberdaya Mineral.
Gunawan, H. 1995. Analisis terhadap pokok-pokok pertimbangan dalam rangka perumusan kebijakan pengelolaan dan pemanfaatan air tanah: Kasus Cekungan Bandung (Policy analysis on groundwater management and usage: Case study of Bandung Basin). Master’s thesis. Bandung: Bandung Institute of Technology.
Harnandi, D. dan Iskandar, N. 1998. Konservasi air tanah Cekungan Bandung (Groundwater conservation in the Bandung Basin and its
Summary report of Sustainable Groundwater Management in Asia 59Sustainable Groundwater Management in Asian Cities
surroundings). Bandung: Direktorat Tata Lingkungan Geologi dan Kawasan Pertambangan.(DTLGKP) (Directorate of Environmental Geology).
Rahmat, A. 2004. Kajian terhadap struktur ruang Bandung Metropolitan (Study on space structure in Bandung Metropolitan). Workshop of dynamics, problems and its developments of Bandung Basin. Bandung: Bandung: Direktorat Tata Lingkungan Geologi dan Kawasan Pertambangan (DTLGKP) (Directorate of Environmental Geology).
Surat Keputusan Menteri Pertambangan dan Energi (Decree of Minister Energy and Mineral Resources) No. 716.K/40/MEM/2003 on Groundwater Basin in island of Java and Madura. Bandung: Direktorat Tata Lingkungan Geologi dan Kawasan Pertambangan.(DTLGKP) (Directorate of Environmental Geology).
Wangsaatmaja, S. 2004. Perubahan tata guna lahan terhadap rezim aliran air dan sanitasi lingkungan (Land use change impacts on surface water regime and environmental sanitation: Case analysis of the Upper Citarum Watershed). Dissertation. Bandung: Bandung Institute of Technology.
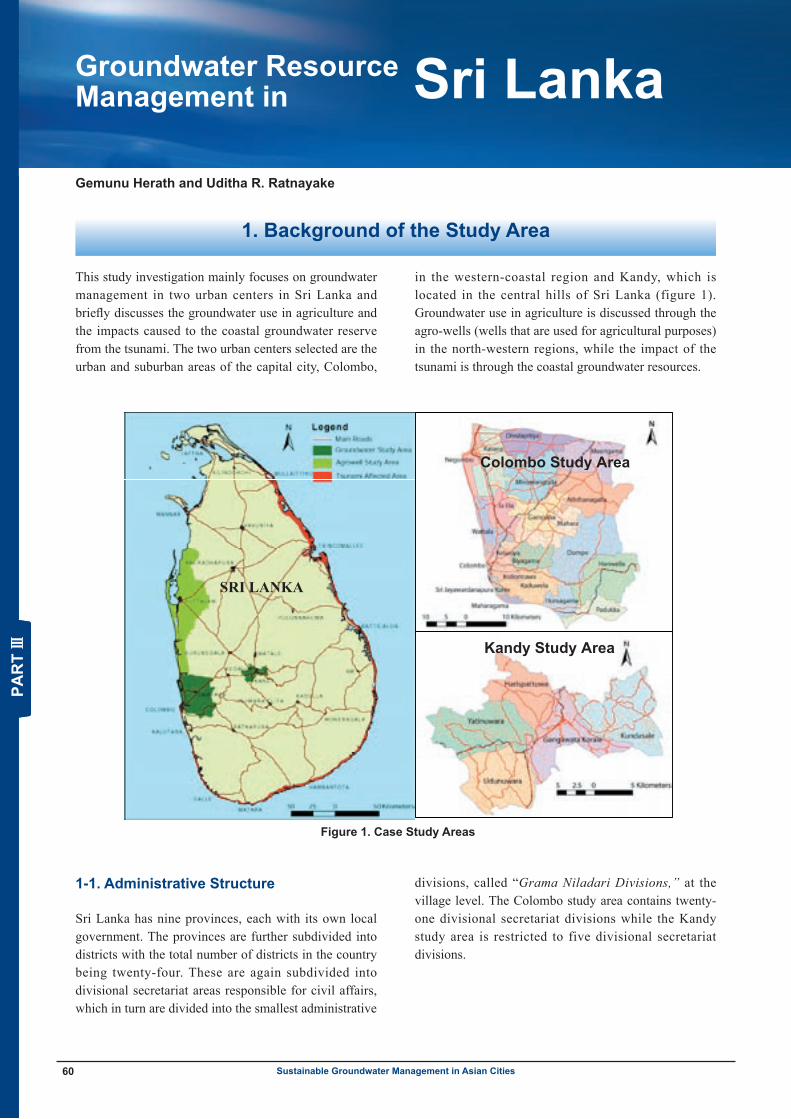
Summary report of Sustainable Groundwater Management in Asia60 Sustainable Groundwater Management in Asian Cities
Groundwater ResourceManagement in Sri Lanka
1-1. Administrative Structure
Sri Lanka has nine provinces, each with its own local government. The provinces are further subdivided into districts with the total number of districts in the country being twenty-four. These are again subdivided into divisional secretariat areas responsible for civil affairs, which in turn are divided into the smallest administrative
divisions, called “Grama Niladari Divisions,” at the village level. The Colombo study area contains twenty-one divisional secretariat divisions while the Kandy study area is restricted to five divisional secretariat divisions.
This study investigation mainly focuses on groundwater management in two urban centers in Sri Lanka and briefly discusses the groundwater use in agriculture and the impacts caused to the coastal groundwater reserve from the tsunami. The two urban centers selected are the urban and suburban areas of the capital city, Colombo,
in the western-coastal region and Kandy, which is located in the central hills of Sri Lanka (figure 1). Groundwater use in agriculture is discussed through the agro-wells (wells that are used for agricultural purposes) in the north-western regions, while the impact of the tsunami is through the coastal groundwater resources.
1. Background of the Study Area
1
The Study of the Management of Groundwater Resources in Sri Lanka Gemunu Herath and Uditha Ratnayake
1. Outline of Study Area
This investigation, “The Study of Management of Groundwater Resources in Sri Lanka” is part of the Sustainable Water Management Policy Project that is a collaboration between IGES and the Department of Civil Engineering at the University of Peradeniya, in Peradeniya, Sri Lanka. The investigation mainly focuses on groundwater management in two urban centers in the island and briefly discusses the groundwater use in agriculture and the impacts caused to the coastal groundwater reserve from the tsunami. The two urban centers selected are the urban and suburban areas of the capital city, Colombo, in the western-coastal region and Kandy, which is located in the central hills of Sri Lanka (figure 1). Groundwater use in agriculture is discussed through the agro-wells (wells that are used for agricultural purposes) in the north-western regions, while the impact of the tsunami is through the coastal groundwater resources.
Figure 1. Case Study Areas (1) Administrative Structure Sri Lanka has nine provinces, each with its own local government. The provinces are further subdivided into districts with the total number of districts in the country being twenty-four. These are again subdivided into divisional secretariat areas responsible for civil affairs, which in turn are divided into the smallest administrative divisions, called “Grama Niladari Divisions,” at the village level. The Colombo study area contains twenty divisional secretariat divisions while the Kandy study area is restricted to five divisional secretariat divisions.
(2) Topography, Geology and Climate Sri Lanka has a central mountainous region rising up to 2500 meters above mean sea level, with the highest elevations covered by virgin forests and grasslands and surrounding plains, which rise to about 50 to 100
Colombo Study Area
Kandy Study Area
SRI LANKA
Figure 1. Case Study Areas
Gemunu Herath and Uditha R. Ratnayake
Summary report of Sustainable Groundwater Management in Asia
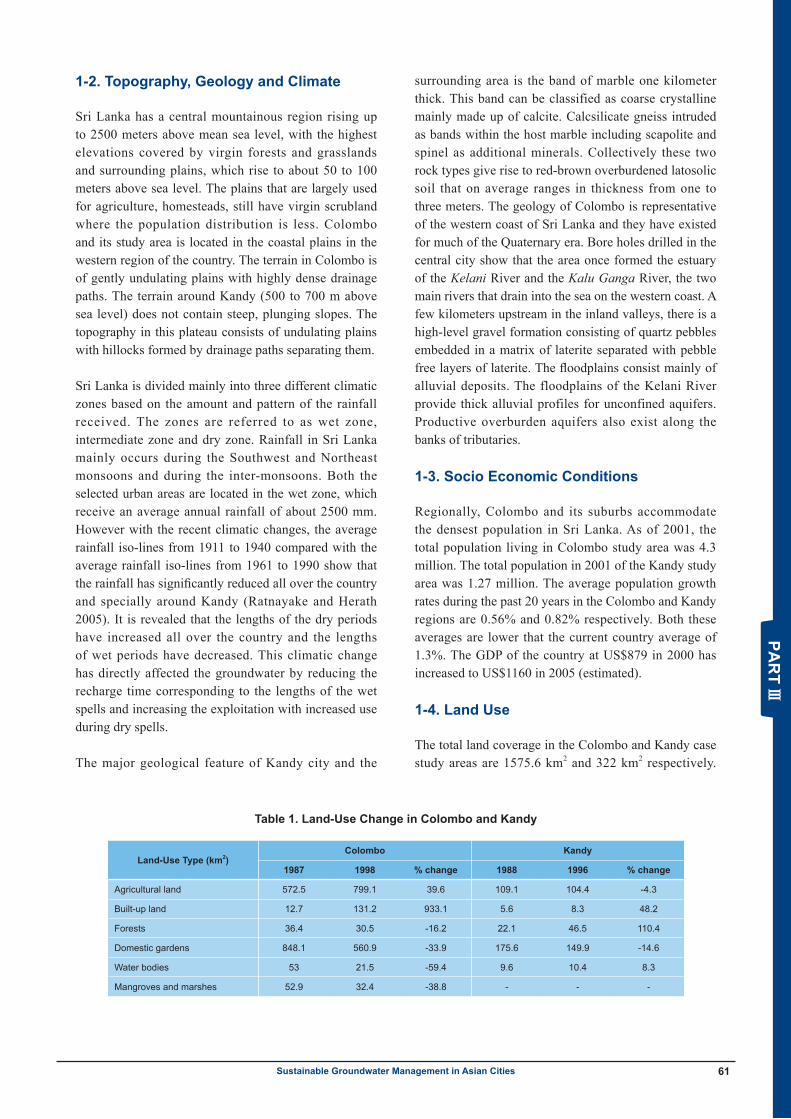
Summary report of Sustainable Groundwater Management in Asia 61Sustainable Groundwater Management in Asian Cities
1-2. Topography, Geology and Climate
Sri Lanka has a central mountainous region rising up to 2500 meters above mean sea level, with the highest elevations covered by virgin forests and grasslands and surrounding plains, which rise to about 50 to 100 meters above sea level. The plains that are largely used for agriculture, homesteads, still have virgin scrubland where the population distribution is less. Colombo and its study area is located in the coastal plains in the western region of the country. The terrain in Colombo is of gently undulating plains with highly dense drainage paths. The terrain around Kandy (500 to 700 m above sea level) does not contain steep, plunging slopes. The topography in this plateau consists of undulating plains with hillocks formed by drainage paths separating them.
Sri Lanka is divided mainly into three different climatic zones based on the amount and pattern of the rainfall received. The zones are referred to as wet zone, intermediate zone and dry zone. Rainfall in Sri Lanka mainly occurs during the Southwest and Northeast monsoons and during the inter-monsoons. Both the selected urban areas are located in the wet zone, which receive an average annual rainfall of about 2500 mm. However with the recent climatic changes, the average rainfall iso-lines from 1911 to 1940 compared with the average rainfall iso-lines from 1961 to 1990 show that the rainfall has significantly reduced all over the country and specially around Kandy (Ratnayake and Herath 2005). It is revealed that the lengths of the dry periods have increased all over the country and the lengths of wet periods have decreased. This climatic change has directly affected the groundwater by reducing the recharge time corresponding to the lengths of the wet spells and increasing the exploitation with increased use during dry spells.
The major geological feature of Kandy city and the
surrounding area is the band of marble one kilometer thick. This band can be classified as coarse crystalline mainly made up of calcite. Calcsilicate gneiss intruded as bands within the host marble including scapolite and spinel as additional minerals. Collectively these two rock types give rise to red-brown overburdened latosolic soil that on average ranges in thickness from one to three meters. The geology of Colombo is representative of the western coast of Sri Lanka and they have existed for much of the Quaternary era. Bore holes drilled in the central city show that the area once formed the estuary of the Kelani River and the Kalu Ganga River, the two main rivers that drain into the sea on the western coast. A few kilometers upstream in the inland valleys, there is a high-level gravel formation consisting of quartz pebbles embedded in a matrix of laterite separated with pebble free layers of laterite. The floodplains consist mainly of alluvial deposits. The floodplains of the Kelani River provide thick alluvial profiles for unconfined aquifers. Productive overburden aquifers also exist along the banks of tributaries.
1-3. Socio Economic Conditions
Regionally, Colombo and its suburbs accommodate the densest population in Sri Lanka. As of 2001, the total population living in Colombo study area was 4.3 million. The total population in 2001 of the Kandy study area was 1.27 million. The average population growth rates during the past 20 years in the Colombo and Kandy regions are 0.56% and 0.82% respectively. Both these averages are lower that the current country average of 1.3%. The GDP of the country at US$879 in 2000 has increased to US$1160 in 2005 (estimated).
1-4. Land Use
The total land coverage in the Colombo and Kandy case study areas are 1575.6 km2 and 322 km2 respectively.
Land-Use Type (km2)Colombo Kandy
1987 1998 % change 1988 1996 % change
Agricultural land 572.5 799.1 39.6 109.1 104.4 -4.3
Built-up land 12.7 131.2 933.1 5.6 8.3 48.2
Forests 36.4 30.5 -16.2 22.1 46.5 110.4
Domestic gardens 848.1 560.9 -33.9 175.6 149.9 -14.6
Water bodies 53 21.5 -59.4 9.6 10.4 8.3
Mangroves and marshes 52.9 32.4 -38.8 - - -
Table 1. Land-Use Change in Colombo and Kandy
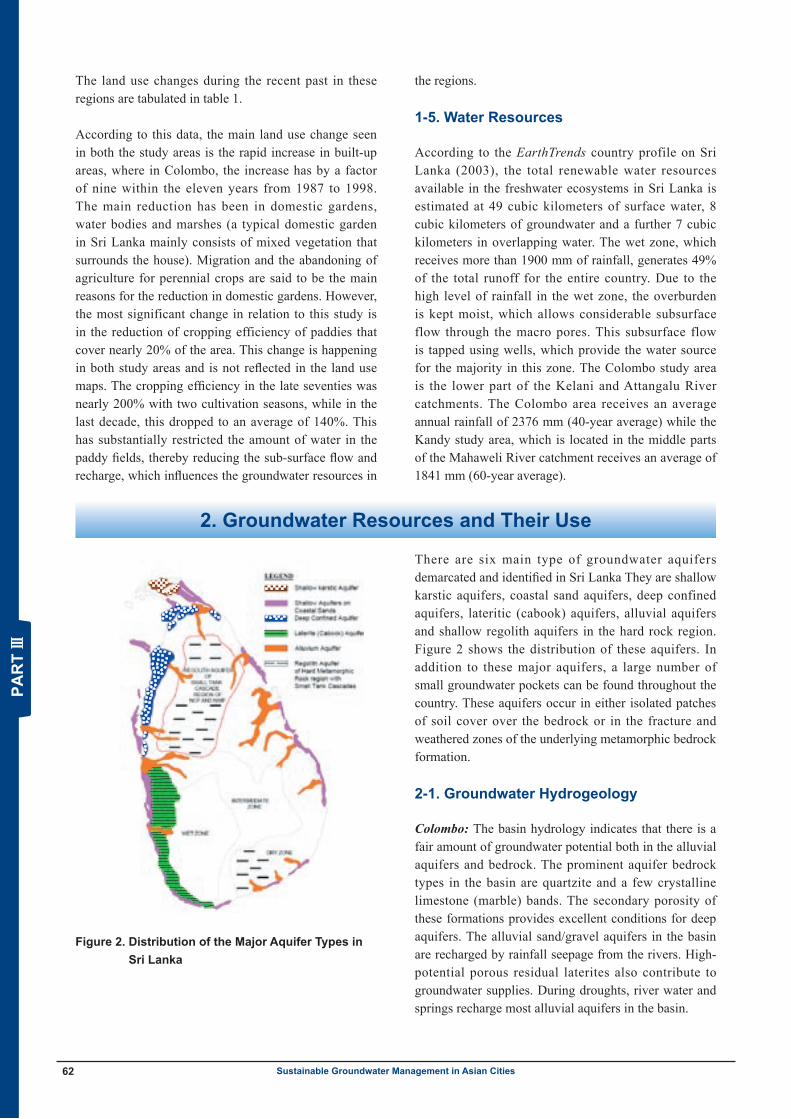
Summary report of Sustainable Groundwater Management in Asia62 Sustainable Groundwater Management in Asian Cities
The land use changes during the recent past in these regions are tabulated in table 1.
According to this data, the main land use change seen in both the study areas is the rapid increase in built-up areas, where in Colombo, the increase has by a factor of nine within the eleven years from 1987 to 1998. The main reduction has been in domestic gardens, water bodies and marshes (a typical domestic garden in Sri Lanka mainly consists of mixed vegetation that surrounds the house). Migration and the abandoning of agriculture for perennial crops are said to be the main reasons for the reduction in domestic gardens. However, the most significant change in relation to this study is in the reduction of cropping efficiency of paddies that cover nearly 20% of the area. This change is happening in both study areas and is not reflected in the land use maps. The cropping efficiency in the late seventies was nearly 200% with two cultivation seasons, while in the last decade, this dropped to an average of 140%. This has substantially restricted the amount of water in the paddy fields, thereby reducing the sub-surface flow and recharge, which influences the groundwater resources in
the regions.
1-5. Water Resources
According to the EarthTrends country profile on Sri Lanka (2003), the total renewable water resources available in the freshwater ecosystems in Sri Lanka is estimated at 49 cubic kilometers of surface water, 8 cubic kilometers of groundwater and a further 7 cubic kilometers in overlapping water. The wet zone, which receives more than 1900 mm of rainfall, generates 49% of the total runoff for the entire country. Due to the high level of rainfall in the wet zone, the overburden is kept moist, which allows considerable subsurface flow through the macro pores. This subsurface flow is tapped using wells, which provide the water source for the majority in this zone. The Colombo study area is the lower part of the Kelani and Attangalu River catchments. The Colombo area receives an average annual rainfall of 2376 mm (40-year average) while the Kandy study area, which is located in the middle parts of the Mahaweli River catchment receives an average of 1841 mm (60-year average).
2. Groundwater Resources and Their Use
There are six main type of groundwater aquifers demarcated and identified in Sri Lanka They are shallow karstic aquifers, coastal sand aquifers, deep confined aquifers, lateritic (cabook) aquifers, alluvial aquifers and shallow regolith aquifers in the hard rock region. Figure 2 shows the distribution of these aquifers. In addition to these major aquifers, a large number of small groundwater pockets can be found throughout the country. These aquifers occur in either isolated patches of soil cover over the bedrock or in the fracture and weathered zones of the underlying metamorphic bedrock formation.
2-1. Groundwater Hydrogeology
Colombo: The basin hydrology indicates that there is a fair amount of groundwater potential both in the alluvial aquifers and bedrock. The prominent aquifer bedrock types in the basin are quartzite and a few crystalline limestone (marble) bands. The secondary porosity of these formations provides excellent conditions for deep aquifers. The alluvial sand/gravel aquifers in the basin are recharged by rainfall seepage from the rivers. High-potential porous residual laterites also contribute to groundwater supplies. During droughts, river water and springs recharge most alluvial aquifers in the basin.
3
Water bodies 53 21.5 -59.4 9.6 10.4 8.3Mangroves and marshes 52.9 32.4 -38.8 - - -
According to this data, the main land use change seen in both the study areas is the rapid increase in built-up areas, where in Colombo, the increase has by a factor of nine within the eleven years from 1987 to 1998. The main reduction has been in domestic gardens, water bodies and marshes (a typical domestic garden in Sri Lanka mainly consists of mixed vegetation that surrounds the house). Migration and the abandoning of agriculture for perennial crops are said to be the main reasons for the reduction in domestic gardens. However, the most significant change in relation to this study is in the reduction of cropping efficiency of paddies that cover nearly 20% of the area. This change is happening in both study areas and is not reflected in the land use maps. The cropping efficiency in the late seventies was nearly 200% with two cultivation seasons, while in the last decade, this dropped to an average of 140%. This has substantially restricted the amount of water in the paddy fields, thereby reducing the sub-surface flow and recharge, which influences the groundwater resources in the regions.
(5) Water Resources According to the EarthTrends country profile on Sri Lanka (2003), the total renewable water resources available in the freshwater ecosystems in Sri Lanka is estimated at 49 cubic kilometers of surface water, 8 cubic kilometers of groundwater and a further 7 cubic kilometers in overlapping water. The wet zone, which receives more than 1900 mm of rainfall, generates 49% of the total runoff for the entire country. Due to the high level of rainfall in the wet zone, the overburden is kept moist, which allows considerable subsurface flow through the macro pores. This subsurface flow is tapped using wells, which provide the water source for the majority in this zone. The Colombo study area is the lower part of the Kelani and Attangalu River catchments. The Colombo area receives an average annual rainfall of 2376 mm (40-year average) while the Kandy study area, which is located in the middle parts of the Mahaweli River catchment receives an average of 1841 mm (60-year average).
2. Groundwater Resources and Their Use
There are six main type of groundwater aquifers demarcated and identified in Sri Lanka They are shallow karstic aquifers, coastal sand aquifers, deep confined aquifers, lateritic (cabook) aquifers, alluvial aquifers and shallow regolith aquifers in the hard rock region. Figure 2 shows the distribution of these aquifers. In addition to these major aquifers, a large number of small groundwater pockets can be found throughout the
country. These aquifers occur in either isolated patches of soil cover over the bedrock or in the fracture and weathered zones of the underlying metamorphic bedrock formation.
(1) Groundwater Hydrogeology Colombo: The basin hydrology indicates that there is a fair amount of groundwater potential both in the alluvial aquifers and bedrock. The prominent aquifer bedrock types in the basin are quartzite and a few crystalline limestone (marble) bands. The secondary porosity of these formations provides excellent conditions for deep aquifers. The alluvial sand/gravel aquifers in the basin are recharged by rainfall seepage from the rivers. High-potential porous residual laterites also contribute to groundwater supplies. During droughts, river water and springs recharge most alluvial aquifers in the basin.
Kandy: Groundwater in Kandy exists mostly in the form of semi-confined aquifers in the first 100 meters of the bedrock.
Figure 2. Distribution of the
Major Aquifer Types in Sri Figure 2. Distribution of the Major Aquifer Types in
Sri Lanka
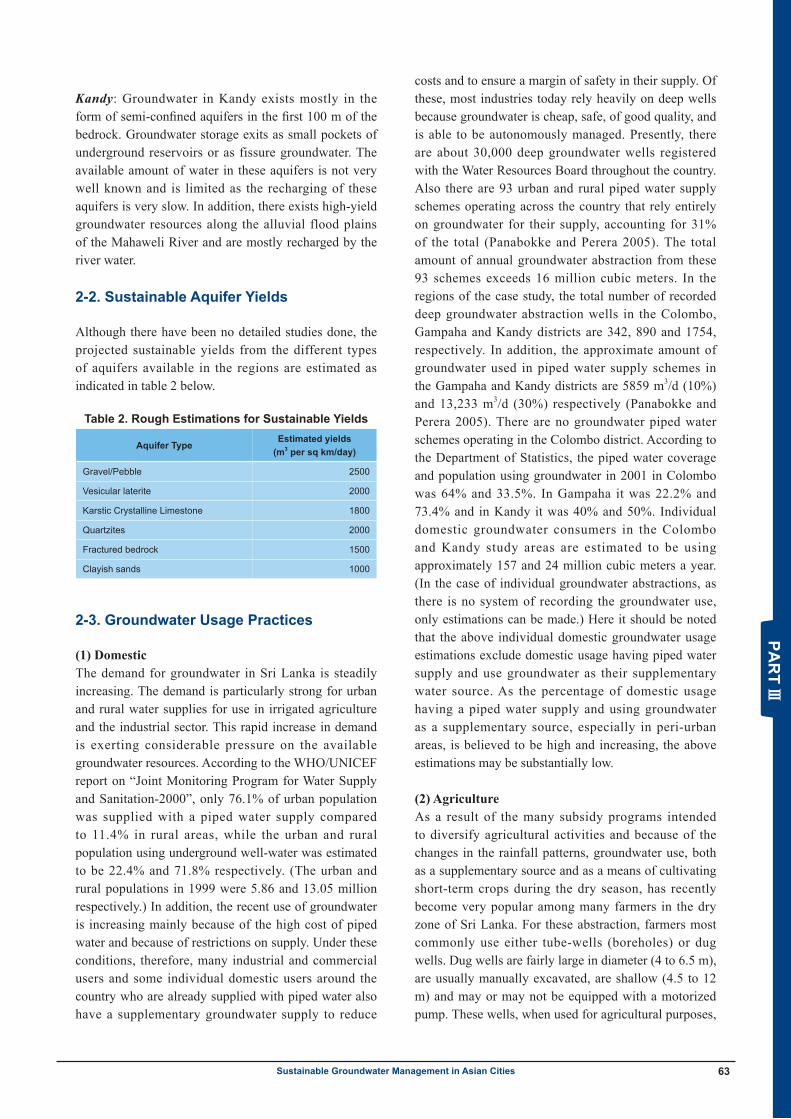
Summary report of Sustainable Groundwater Management in Asia 63Sustainable Groundwater Management in Asian Cities
Kandy: Groundwater in Kandy exists mostly in the form of semi-confined aquifers in the first 100 m of the bedrock. Groundwater storage exits as small pockets of underground reservoirs or as fissure groundwater. The available amount of water in these aquifers is not very well known and is limited as the recharging of these aquifers is very slow. In addition, there exists high-yield groundwater resources along the alluvial flood plains of the Mahaweli River and are mostly recharged by the river water.
2-2. Sustainable Aquifer Yields
Although there have been no detailed studies done, the projected sustainable yields from the different types of aquifers available in the regions are estimated as indicated in table 2 below.
2-3. Groundwater Usage Practices
(1) Domestic The demand for groundwater in Sri Lanka is steadily increasing. The demand is particularly strong for urban and rural water supplies for use in irrigated agriculture and the industrial sector. This rapid increase in demand is exerting considerable pressure on the available groundwater resources. According to the WHO/UNICEF report on “Joint Monitoring Program for Water Supply and Sanitation-2000”, only 76.1% of urban population was supplied with a piped water supply compared to 11.4% in rural areas, while the urban and rural population using underground well-water was estimated to be 22.4% and 71.8% respectively. (The urban and rural populations in 1999 were 5.86 and 13.05 million respectively.) In addition, the recent use of groundwater is increasing mainly because of the high cost of piped water and because of restrictions on supply. Under these conditions, therefore, many industrial and commercial users and some individual domestic users around the country who are already supplied with piped water also have a supplementary groundwater supply to reduce
costs and to ensure a margin of safety in their supply. Of these, most industries today rely heavily on deep wells because groundwater is cheap, safe, of good quality, and is able to be autonomously managed. Presently, there are about 30,000 deep groundwater wells registered with the Water Resources Board throughout the country. Also there are 93 urban and rural piped water supply schemes operating across the country that rely entirely on groundwater for their supply, accounting for 31% of the total (Panabokke and Perera 2005). The total amount of annual groundwater abstraction from these 93 schemes exceeds 16 million cubic meters. In the regions of the case study, the total number of recorded deep groundwater abstraction wells in the Colombo, Gampaha and Kandy districts are 342, 890 and 1754, respectively. In addition, the approximate amount of groundwater used in piped water supply schemes in the Gampaha and Kandy districts are 5859 m3/d (10%) and 13,233 m3/d (30%) respectively (Panabokke and Perera 2005). There are no groundwater piped water schemes operating in the Colombo district. According to the Department of Statistics, the piped water coverage and population using groundwater in 2001 in Colombo was 64% and 33.5%. In Gampaha it was 22.2% and 73.4% and in Kandy it was 40% and 50%. Individual domestic groundwater consumers in the Colombo and Kandy study areas are estimated to be using approximately 157 and 24 million cubic meters a year. (In the case of individual groundwater abstractions, as there is no system of recording the groundwater use, only estimations can be made.) Here it should be noted that the above individual domestic groundwater usage estimations exclude domestic usage having piped water supply and use groundwater as their supplementary water source. As the percentage of domestic usage having a piped water supply and using groundwater as a supplementary source, especially in peri-urban areas, is believed to be high and increasing, the above estimations may be substantially low.
(2) Agriculture As a result of the many subsidy programs intended to diversify agricultural activities and because of the changes in the rainfall patterns, groundwater use, both as a supplementary source and as a means of cultivating short-term crops during the dry season, has recently become very popular among many farmers in the dry zone of Sri Lanka. For these abstraction, farmers most commonly use either tube-wells (boreholes) or dug wells. Dug wells are fairly large in diameter (4 to 6.5 m), are usually manually excavated, are shallow (4.5 to 12 m) and may or may not be equipped with a motorized pump. These wells, when used for agricultural purposes,
Aquifer TypeEstimated yields
(m3 per sq km/day)
Gravel/Pebble 2500
Vesicular laterite 2000
Karstic Crystalline Limestone 1800
Quartzites 2000
Fractured bedrock 1500
Clayish sands 1000
Table 2. Rough Estimations for Sustainable Yields
Summary report of Sustainable Groundwater Management in Asia64 Sustainable Groundwater Management in Asian Cities
are commonly known as agro-wells in the country. With the Government and NGO-assisted subsidy schemes, the growth in agro-wells is progressing at a rapid pace. At the end of 2000, the total number of agro-wells stood at 50,456, while in 1985, there were only 500 (Kikuchi et. al. 2003). This rapid, haphazard expansion of agro-wells without appropriate assessment of the factors, such as the hydrogeological environment is expected to
create many problems. As farmers are used to abstrating groundwater at rates typically ranging between 27 m3/hr and 45 m3/hr (Premaratne and Liyanapatabendi 1994), these high pumping rates are believed to be the most likely potential cause of conflicts because of overexploitation of the groundwater resources, either on a local or regional scale.
3. Problems Associated with Groundwater
In Sri Lanka, over the past 30 to 50 years, there have been two state agencies involved in groundwater studies, investigations and development of the resource. They are the Water Resources Board (WRB) and the National Water Supply and Drainage Board (NWS&DB). In addition, a few private drilling companies and donor funded projects have also been engaged in the investigation and development of the resource. In terms of monitoring and data collection, these organizations collect data primarily for their own use, although some is shared with other agencies and some is released to the public. However, this collected data is limited only to deep wells constructed by the organizations. In most cases, the information is restricted to the drill log, the initial water levels and the initial water quality. There is no data available on wells constructed by other private drilling companies, NGOs or by other international organizations. Also, there is no groundwater-related monitoring whatsoever in Sri Lanka and there has been no effort to demarcate recharge areas either. Therefore, the effects of developments taking place in recharge areas are largely unknown.
3-1. Issues in the Main Study Areas
The history of well construction in Sri Lanka is indicative of the success rates. NWS&DB is responsible for the rural and urban water supply for domestic use and is currently the largest organization that develops groundwater in the country. According to the well construction unit of NWS&DB, production wells that yield less than 20 liters per minute and the hand-operated tube wells that yield less than 4 liters per minute are classified as failures. According to this classification, the success rate of wells during the construction stage is currently about 80%. Some wells go dry in short time while others have little reduction in yield and continue at a lesser yield. Usually, after about five to eight years, a well will achieve a steady state. If a well fails to continue to function at the rates mentioned above, it will be classified as a failed well. Usually the
success rate achieved at this stage is about 65%. The rate is slightly higher for dry-zone wells maintained by the community, which stay at about 70%. The lower success rate achieve by wells maintained by the local government is attributed to poor maintenance and excessive groundwater abstraction.
The WRB currently has a fair amount of data and experience related to groundwater exploitation. Personal communication has revealed that the reasons for the exact failure modes are not commonly known because one would require a borehole camera to investigate, and this facility is not available in the country. Clogging is one of the major reasons suspected when water in the fracture zone is abstracted. Collapsing sidewalls is another reason for failures, especially in other types of aquifers. In a few cases, the wells recovered after frequent flushing. Occasionally, the fracture zone has a very low recharge rate or the exposure to the recharge boundary may have a very small area. Therefore, at the beginning the well will yield acceptable rates due to the available storage. However, the yield will later drop because of the low rate of recharge. A siphon action within the fracture zone is also a possible cause, and once the water level drops due to pumping, thereby causing the siphon to fail, the yield will drop.
Though there are various opinions concerning the country’s groundwater issues, the lack of data and the wide range of abstraction across a range of aquifer environments make the problem studying the aquifers very complicated. Therefore, the quantity and quality-related issues experienced in the study areas are discussed in a more general form.
Quantity-related issues: Most of the quantity problems experienced in the study areas occur either in the coastal aquifers, vesicular laterite aquifers or in semi-confined rock aquifers. Of these, the major aquifer found is hard rock type and current problems associated with these aquifers are very much localized. In addition, there is a
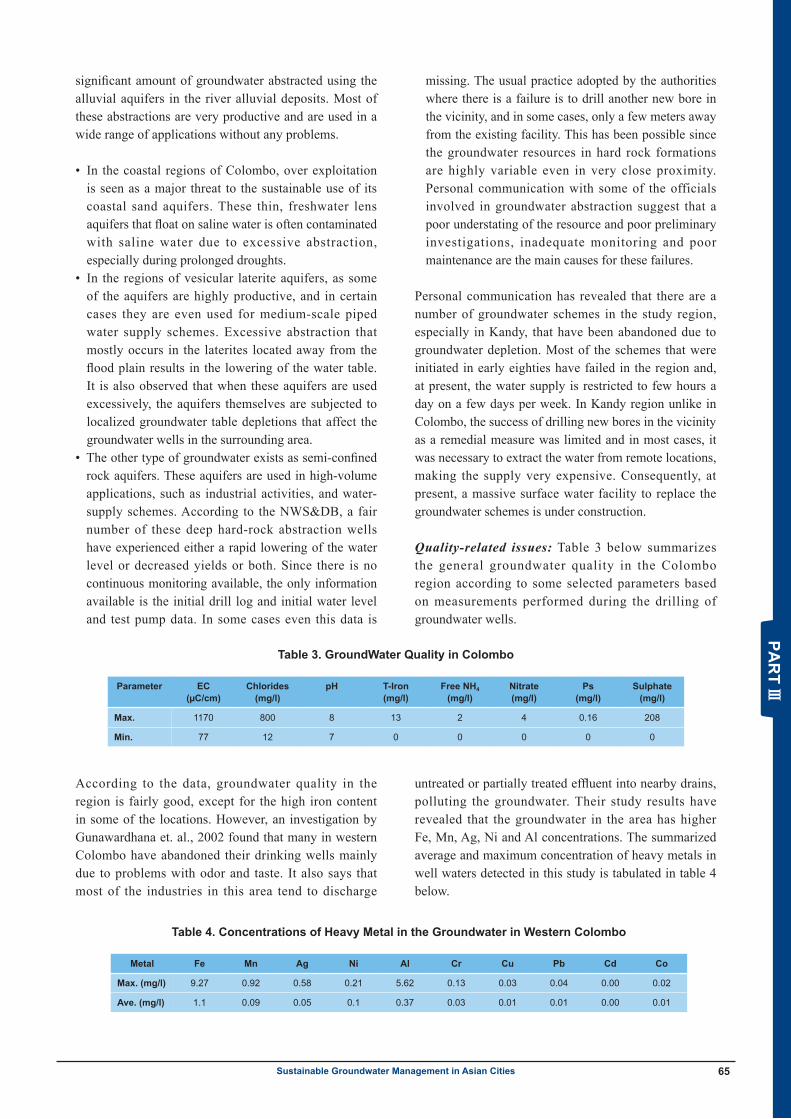
Summary report of Sustainable Groundwater Management in Asia 65Sustainable Groundwater Management in Asian Cities
significant amount of groundwater abstracted using the alluvial aquifers in the river alluvial deposits. Most of these abstractions are very productive and are used in a wide range of applications without any problems.
• In the coastal regions of Colombo, over exploitation is seen as a major threat to the sustainable use of its coastal sand aquifers. These thin, freshwater lens aquifers that float on saline water is often contaminated with saline water due to excessive abstraction, especially during prolonged droughts.
• In the regions of vesicular laterite aquifers, as some of the aquifers are highly productive, and in certain cases they are even used for medium-scale piped water supply schemes. Excessive abstraction that mostly occurs in the laterites located away from the flood plain results in the lowering of the water table. It is also observed that when these aquifers are used excessively, the aquifers themselves are subjected to localized groundwater table depletions that affect the groundwater wells in the surrounding area.
• The other type of groundwater exists as semi-confined rock aquifers. These aquifers are used in high-volume applications, such as industrial activities, and water-supply schemes. According to the NWS&DB, a fair number of these deep hard-rock abstraction wells have experienced either a rapid lowering of the water level or decreased yields or both. Since there is no continuous monitoring available, the only information available is the initial drill log and initial water level and test pump data. In some cases even this data is
missing. The usual practice adopted by the authorities where there is a failure is to drill another new bore in the vicinity, and in some cases, only a few meters away from the existing facility. This has been possible since the groundwater resources in hard rock formations are highly variable even in very close proximity. Personal communication with some of the officials involved in groundwater abstraction suggest that a poor understating of the resource and poor preliminary investigations, inadequate monitoring and poor maintenance are the main causes for these failures.
Personal communication has revealed that there are a number of groundwater schemes in the study region, especially in Kandy, that have been abandoned due to groundwater depletion. Most of the schemes that were initiated in early eighties have failed in the region and, at present, the water supply is restricted to few hours a day on a few days per week. In Kandy region unlike in Colombo, the success of drilling new bores in the vicinity as a remedial measure was limited and in most cases, it was necessary to extract the water from remote locations, making the supply very expensive. Consequently, at present, a massive surface water facility to replace the groundwater schemes is under construction.
Quality-related issues: Table 3 below summarizes the general groundwater quality in the Colombo region according to some selected parameters based on measurements performed during the drilling of groundwater wells.
According to the data, groundwater quality in the region is fairly good, except for the high iron content in some of the locations. However, an investigation by Gunawardhana et. al., 2002 found that many in western Colombo have abandoned their drinking wells mainly due to problems with odor and taste. It also says that most of the industries in this area tend to discharge
untreated or partially treated effluent into nearby drains, polluting the groundwater. Their study results have revealed that the groundwater in the area has higher Fe, Mn, Ag, Ni and Al concentrations. The summarized average and maximum concentration of heavy metals in well waters detected in this study is tabulated in table 4 below.
Parameter EC(µC/cm)
Chlorides(mg/l)
pH T-Iron(mg/l)
Free NH4
(mg/l)Nitrate(mg/l)
Ps(mg/l)
Sulphate(mg/l)
Max. 1170 800 8 13 2 4 0.16 208
Min. 77 12 7 0 0 0 0 0
Table 3. GroundWater Quality in Colombo
Metal Fe Mn Ag Ni Al Cr Cu Pb Cd Co
Max. (mg/l) 9.27 0.92 0.58 0.21 5.62 0.13 0.03 0.04 0.00 0.02
Ave. (mg/l) 1.1 0.09 0.05 0.1 0.37 0.03 0.01 0.01 0.00 0.01
Table 4. Concentrations of Heavy Metal in the Groundwater in Western Colombo
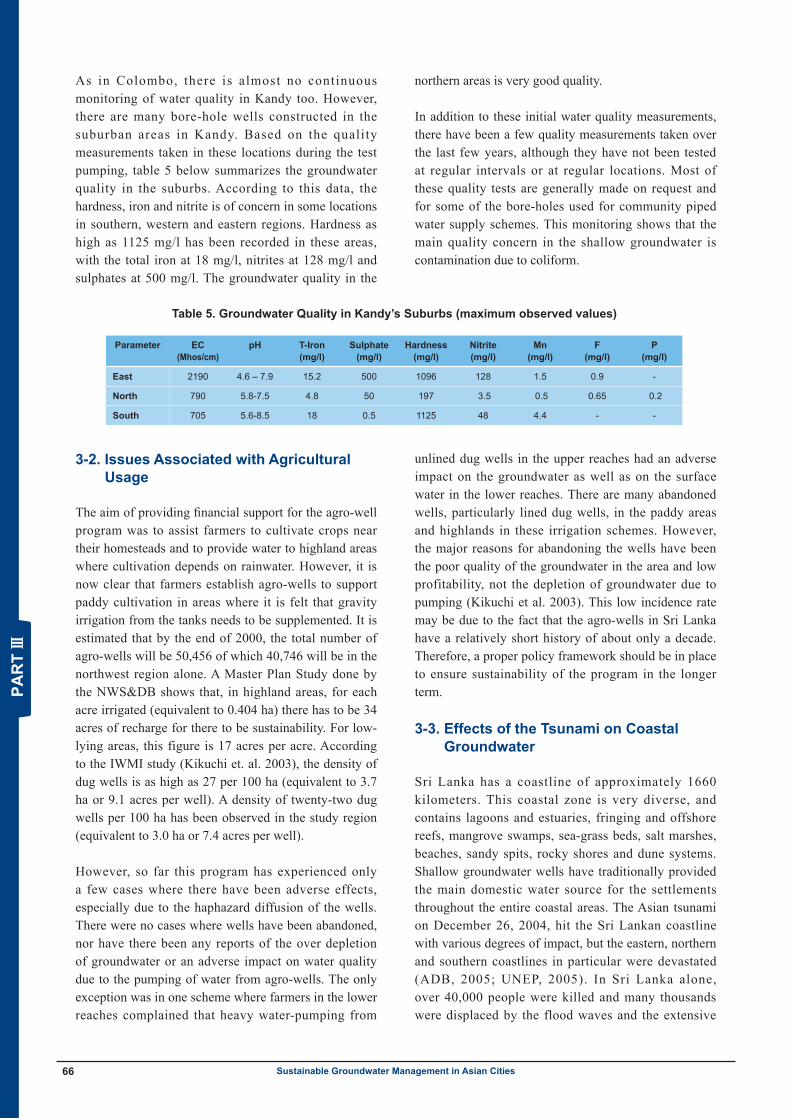
Summary report of Sustainable Groundwater Management in Asia66 Sustainable Groundwater Management in Asian Cities
As in Colombo, there is almost no continuous monitoring of water quality in Kandy too. However, there are many bore-hole wells constructed in the suburban areas in Kandy. Based on the quality measurements taken in these locations during the test pumping, table 5 below summarizes the groundwater quality in the suburbs. According to this data, the hardness, iron and nitrite is of concern in some locations in southern, western and eastern regions. Hardness as high as 1125 mg/l has been recorded in these areas, with the total iron at 18 mg/l, nitrites at 128 mg/l and sulphates at 500 mg/l. The groundwater quality in the
northern areas is very good quality.
In addition to these initial water quality measurements, there have been a few quality measurements taken over the last few years, although they have not been tested at regular intervals or at regular locations. Most of these quality tests are generally made on request and for some of the bore-holes used for community piped water supply schemes. This monitoring shows that the main quality concern in the shallow groundwater is contamination due to coliform.
3-2. Issues Associated with Agricultural Usage
The aim of providing financial support for the agro-well program was to assist farmers to cultivate crops near their homesteads and to provide water to highland areas where cultivation depends on rainwater. However, it is now clear that farmers establish agro-wells to support paddy cultivation in areas where it is felt that gravity irrigation from the tanks needs to be supplemented. It is estimated that by the end of 2000, the total number of agro-wells will be 50,456 of which 40,746 will be in the northwest region alone. A Master Plan Study done by the NWS&DB shows that, in highland areas, for each acre irrigated (equivalent to 0.404 ha) there has to be 34 acres of recharge for there to be sustainability. For low-lying areas, this figure is 17 acres per acre. According to the IWMI study (Kikuchi et. al. 2003), the density of dug wells is as high as 27 per 100 ha (equivalent to 3.7 ha or 9.1 acres per well). A density of twenty-two dug wells per 100 ha has been observed in the study region (equivalent to 3.0 ha or 7.4 acres per well).
However, so far this program has experienced only a few cases where there have been adverse effects, especially due to the haphazard diffusion of the wells. There were no cases where wells have been abandoned, nor have there been any reports of the over depletion of groundwater or an adverse impact on water quality due to the pumping of water from agro-wells. The only exception was in one scheme where farmers in the lower reaches complained that heavy water-pumping from
unlined dug wells in the upper reaches had an adverse impact on the groundwater as well as on the surface water in the lower reaches. There are many abandoned wells, particularly lined dug wells, in the paddy areas and highlands in these irrigation schemes. However, the major reasons for abandoning the wells have been the poor quality of the groundwater in the area and low profitability, not the depletion of groundwater due to pumping (Kikuchi et al. 2003). This low incidence rate may be due to the fact that the agro-wells in Sri Lanka have a relatively short history of about only a decade. Therefore, a proper policy framework should be in place to ensure sustainability of the program in the longer term.
3-3. Effects of the Tsunami on Coastal Groundwater
Sri Lanka has a coastline of approximately 1660 kilometers. This coastal zone is very diverse, and contains lagoons and estuaries, fringing and offshore reefs, mangrove swamps, sea-grass beds, salt marshes, beaches, sandy spits, rocky shores and dune systems. Shallow groundwater wells have traditionally provided the main domestic water source for the settlements throughout the entire coastal areas. The Asian tsunami on December 26, 2004, hit the Sri Lankan coastline with various degrees of impact, but the eastern, northern and southern coastlines in particular were devastated (ADB, 2005; UNEP, 2005). In Sri Lanka alone, over 40,000 people were killed and many thousands were displaced by the flood waves and the extensive
Parameter EC(Mhos/cm)
pH T-Iron(mg/l)
Sulphate(mg/l)
Hardness(mg/l)
Nitrite(mg/l)
Mn(mg/l)
F(mg/l)
P(mg/l)
East 2190 4.6 – 7.9 15.2 500 1096 128 1.5 0.9 -
North 790 5.8-7.5 4.8 50 197 3.5 0.5 0.65 0.2
South 705 5.6-8.5 18 0.5 1125 48 4.4 - -
Table 5. Groundwater Quality in Kandy’s Suburbs (maximum observed values)
Summary report of Sustainable Groundwater Management in Asia 67Sustainable Groundwater Management in Asian Cities
property damage. In addition, most of the natural ecosystem along the coast was destroyed and the entire infrastructure facilities in this coastal belt were totally devastated. Immediately after the tsunami, it was estimated that over 60,000 groundwater wells (mostly dug wells) throughout the affected coastal zone and in some places almost up to 1.5 kilometers inland were damaged or destroyed. Many of them were left unable to provide water that was fit for human consumption or even fit for bathing or washing (ADB et al., 2005; UNEP 2005). The damage to the wells ranged from filling them with debris, sewage and saltwater to salt water intrusion from the stagnant saline water collected in local depressions. Many water supply schemes catering the domestic needs were also affected due to breaches in the water distribution pipelines and the filling of wells with debris and saltwater. In addition, the characteristics and quality of soil and water resources in the coastal areas were changed by the flow of seawater over the soil surface, the stagnation of saline and possibly polluted water in local depressions and the disruption and loss of the coastline. According to a study by Jayaweera et. al., a few days after the tsunami, the contaminated wells had COD levels of 128 mg/l, total and fecal coliform levels exceeding 30 and 7pfu/100ml, and conductivity levels
of over 3000 µS/cm.
The two most common methods adopted to clean up wells soon after the tsunami was to empty the contaminated water either by means of pumping or by manual cleaning and disinfection using bleaching powder (hypochlorite). These restoration effects encountered a range of problems, as most of the people involved lacked specialized knowledge. Most of the cleaned wells were reported to remain saline, even after repeated cleaning and emptying. In addition, wells collapsed during the cleaning process, and the presence of contaminants from other sources of pollution potentially caused health hazards that previously did not present a significant problem (Jayaweera et al. 2005; Villholth et al. 2005). These experiences made very clear the necessity of a well-coordinated integrated plan to restore the groundwater after the effects of the tsunami and to implement relief measures. In this regard, the IWMI, through some monitoring (Villholth et al. 2005), has suggested a set of possible guidelines to follow with respect to the cleaning of wells after a tsunami. The guidelines include short-term as well as long-term measures.
Though Sri Lanka is blessed with good water resources when one considers the total aggregate water availability, the variations over space and time, from the historical perspective, demand a proper management strategy. However, there have been a number of recent warning signals pointing to increasing water resource issues in Sri Lanka. Competition and water shortages are increasing as a result of the highly variable rainfall and growing demand for water. Watersheds are being degraded, resulting in soil erosion, the sedimentation of reservoirs, landslides and more serious floods and droughts. Water pollution from domestic, agricultural and industrial sources is contaminating the surface water and groundwater and affecting the environment and public health. Excessive groundwater abstraction is occurring in some areas, affecting long term sustainability. With the technical assistance from the Asian Development Bank, the Government of Sri Lanka formulated the first draft of a ‘National Water Resource Policy’ in 2000. This proposed comprehensive water policy devoted an entire subsection to the management of groundwater resources with the objective of promoting sustainable development of the resources.
At present the Water Resources Board (WRB), National Water Supply and Drainage Board (NWS&DB) and the Agriculture Development Authority (ADA) are all engaged in investigations into and development of groundwater resources in Sri Lanka. However, none of these agencies are responsible for the management of the groundwater resources of the country, in terms of the quantity and quality aspects, and there is no legislative basis for the proper assessment planning or management of groundwater. In addition, adequate financial and human resources are also not being provided.
The major deficiencies in the present groundwater management setup that have been identified under the proposed water policy are listed below (Water Resources Council and Secretariat 2000).
• Ownership, and therefore management responsibility, of the groundwater is not clearly defined in legislation.
• Responsibility for investigation into, development of and regulation of groundwater is not formally assigned to any agency. A number of agencies are involved in various aspects of groundwater investigation and development as a consequence of other mandates. In
4. Policy Responses and Future Challenges
Summary report of Sustainable Groundwater Management in Asia68 Sustainable Groundwater Management in Asian Cities
some cases, there is no proper legal basis.• There is no coordinated groundwater information
program. Many studies have been undertaken and considerable data exists, but it has not been consolidated and is not being used to any great extent in management decisions.
• Even when a considerable body of information on seasonal behavior and quality is available, there is no institutional authority for control or regulation of the resource.
• There is no groundwater planning system. Problems and issues are being dealt with on an ad hoc basis. The vital linkage between surface and groundwater is being largely ignored and the consequences of the lack of groundwater regulation are affecting surface water management.
• There is no legal basis for groundwater allocation. Be ing an essen t ia l ly unregula ted resource , groundwater is being exploited in a haphazard and, in some cases, hasty manner, Excessive groundwater abstraction is occurring in some places, with significant costs for existing (and sometimes vulnerable) users.
• There is no public information or awareness program regarding groundwater. The resource is widely misunderstood, even by decision-makers. Although there is significant local impact due to the lack of groundwater management, local stakeholders bias the information and means of involvement.
However, during this study, several issues were identified as urgent challenges to be immediately addressed. Among those, the most important issue is the establishment of a single authority responsible for overseeing management of the groundwater resource. As there are several agencies involved in groundwater development, nobody takes responsibility for managing the groundwater resources. Often, this has been the main reason for the present groundwater problems.
Some of the observed groundwater problems in the recent past suggest that groundwater development in
Sri Lanka has now reached a stage where it is useless to speak of sustainable development of the country’s groundwater resources without a supporting research effort to diagnose and troubleshoot both existing and emerging problems, and without properly managing and guiding the ongoing groundwater activities in the country. Therefore another prime need at the present stage is the establishment of an appropriate research plan to promote both short and long-term research and investigations programs. Funding for this may come by establishing a fund through levying a groundwater charge for heavy uses. Further, as there are no present programs available for either monitoring the changes in the quality or quantity of groundwater, the actual state of groundwater in the country is very uncertain. Therefore, in the absence of these information sources, establishing a proper monitoring network and using it as a comprehensive and reliable information system is essential. Without this initiative, the groundwater resources of a country is often poorly understood and over-exploited by both the decision-makers and the users of the groundwater.
At present, information about groundwater resources in this country is not readily accessible. There is no coordinated groundwater information program, although some studies have been undertaken in the past. This data has not been consolidated, and even in its scattered form, it is not used to any significant extent in management decisions. Therefore, through publications that possibly come out periodically, the presently available information on the different aquifers and the management issues need to be taken to the general user and managers at the district level in a readily understood manner. The information should be easy to understand to increase awareness and to obtain support in managing the resources. Also, guidelines for the safe and sustainable use of groundwater should also be framed for all types of aquifers in this country. The guidelines should be widely disseminated to both the local and district provincial agencies and other end-users.
1. Establish principles for groundwater management through an awareness of natural replenishment rates and through an identification of the long-term damage arising from pollution or depletion, thereby minimizing resource depletion. To achieve sustainable management of groundwater resources, the unique characteristics of specific aquifers need
to be recognized. In particular, the rate of aquifer replenishment and the sensitivity of aquifers to depletion and contamination need to be taken into account in groundwater planning and allocation.
2. Establish a single authority for the management o f g r o u n d w a t e r r e s o u r c e s a n d m a k e t h a t agency responsible for the coordination and the
5. Proposed Policy Recommendations
Summary report of Sustainable Groundwater Management in Asia 69Sustainable Groundwater Management in Asian Cities
decentralizing all issues related to groundwater management thereby enhancing the information on groundwater resources.
3. Issue guidelines for the safe and sustainable exploitation and use of groundwater for all types of aquifers in this country. Disseminate the guidelines widely. Drilling technology needs to be improved and needs to set standards for drilling companies.
4. Initially, start a registration program for heavy groundwater users. Thereafter, establish a well licensing program to track groundwater development.
5. One main reason for the failure of the proposed water policy in Sri Lanka in 2000 was the poor level of consultation with the stakeholders. Therefore, it is necessary to have strong participation from the community and water users, and to promote awareness to facilitate the planning and management of groundwater resources.
6. Surface and groundwater resources need to be managed and allocated in a fully coordinated manner.
7. Areas sensitive to groundwater should be identified and demarcated with immediate effect.
8. An integrated approach should be taken in the management of surface and groundwater. This may involve education and other means of encouraging water users to use surface water when it is available and to save groundwater for use during periods when there is deficient surface water.
9. In most cases , the exploi ta t ion of shal low groundwater is through small-scale domestic and agricultural wells. While each of these wells use only a small amount of water, their cumulative impact can be considerable. It is considered impractical to regulate these small wells through water entitlements. Therefore steps must be taken to somehow control the over-use of shallow aquifers and thus to safeguard the water supplies of existing users of shallow wells.
10. Reliable information is essential for the sound management of water resources . However, information on groundwater availability and quality is currently very limited and it is necessary to enhance the collection of groundwater data and management of information.
11. A strategic approach needs to be adopted in relation to groundwater information. Research, assessment and ongoing monitoring need to be undertaken both on a widespread, reconnaissance basis and more intensively, in priority aquifers and in areas of declared water management and areas sensitive to groundwater.
References
Asian Development Bank (ADB), Japan Bank for International Cooperation and World Bank, 2005. Sri Lanka – 2005, Post-Tsunami Recovery Program. Preliminary Damage and Needs Assessment. Colombo, Sri Lanka. Jan. 10-28, 2005. http://www.adb.org/Tsunami/sri-lankaassessment.asp
Balendran, V.S., Sirimanne, C.H.L. and S. Arumugam. 1968. Groundwater in Jaffna. Water Resources Board, Colombo. 35p.
“Earthtrends” 2003, Water Resources and Freshwater Ecosystems Country Profile Sri Lanka. World Resource Institute web page: http://earthtrends.wri.org/text/water-resources/country-profile-167.html
Genawardhana W D D H, Jayaweera M W and Kasturiarachchi J C. 2002. Heavy Metal Levels in Groundwater in the Ratmalana-Moratuwa Industrial Area: A comprehensive survey carried out in 2002, Research Sessions, Department of Civil Engineering, University of Moratuwa, Sri Lanka.
Jayaweera Mahesh, Ajith de Alwis and Suren Wijeyekoon. 2005. Final Report on the Rapid Environmental Assessment on Post-Tsunami Brown Environment in Sri Lanka, Department of Civil Engineering, University of Moratuwa, Sri Lanka, 47-51.
Kikuchi, M., Weligamage, P., Barker, R., Samad, M., Kono, H. and Somaratne, H.M. 2003. Agro-Well and Pump Diffusion in the Dry Zone of Sri Lanka: Past Trends, Present Status and Future Prospects. Research Report 66. Colombo, Sri Lanka: International Water Management Institute.
Panabokke, C.R. and Perera, A.P.G.R.L. 2005. Groundwater Resources of Sri Lanka. Report, Water Resources Board 2A, Gregory’s Avenue, Colombo-7 Sri Lanka January, 2005
Premanath K.L.L. and Liyanapatabendi Tissa. 1994. Groundwater Depletion due to Agro-Wells in proceedings of the 20th WEDC Conference on affordable water supply and sanitation Colombo, Sri Lanka, 11-13
Publications Division, Department of Census and Statistics, Ministry of Interior Colombo – Sri Lanka. Sri Lanka Statistical Data Sheet Year 2004
Ratnayake U R and Herath G B B. 2005. “Recent Changes in Water Cycle and its Effect on Natural disasters and Eco Systems of Sri Lanka” in Proceedings of “Prearatory Workshop on Sri Lanka National Water Development Report – for UN-WWAP”, Wattala, Sri Lanka
Sri Lanka Department of Census and Statistics. http://www.statistics.gov.lk
Water Resources Council and Secretariat, Government of Sri Lanka. 2000. National Water Resources Policy and Institutional Arrangements, Draft Proposal.
WHO/UNICEF Joint Monitoring Program for water supply and sanitation (July 2004); Coverage Estimates of Improved Drinking Water. wssinfo.org
Villholth K G, Amerasinghe P H, Jeyakumar P, Panabokke C R, Woolley O, Weerasinghe M D, Amalraj N, Prathepaan S, Bürgi N,
Summary report of Sustainable Groundwater Management in Asia70 Sustainable Groundwater Management in Asian Cities
Sarath Lionelrathne D M D, Indrajith N G, and Pathirana S R K. 2005. Tsunami Impact on Shallow Groundwater and Associated Water Supply on the East Coast of Sri Lanka: A post-tsunami well recovery support initiative and an assessment of groundwater salinity in three areas of Batticaloa and Ampara District in Eastern Sri Lanka International Water Management Institute http://www.iwmi.org
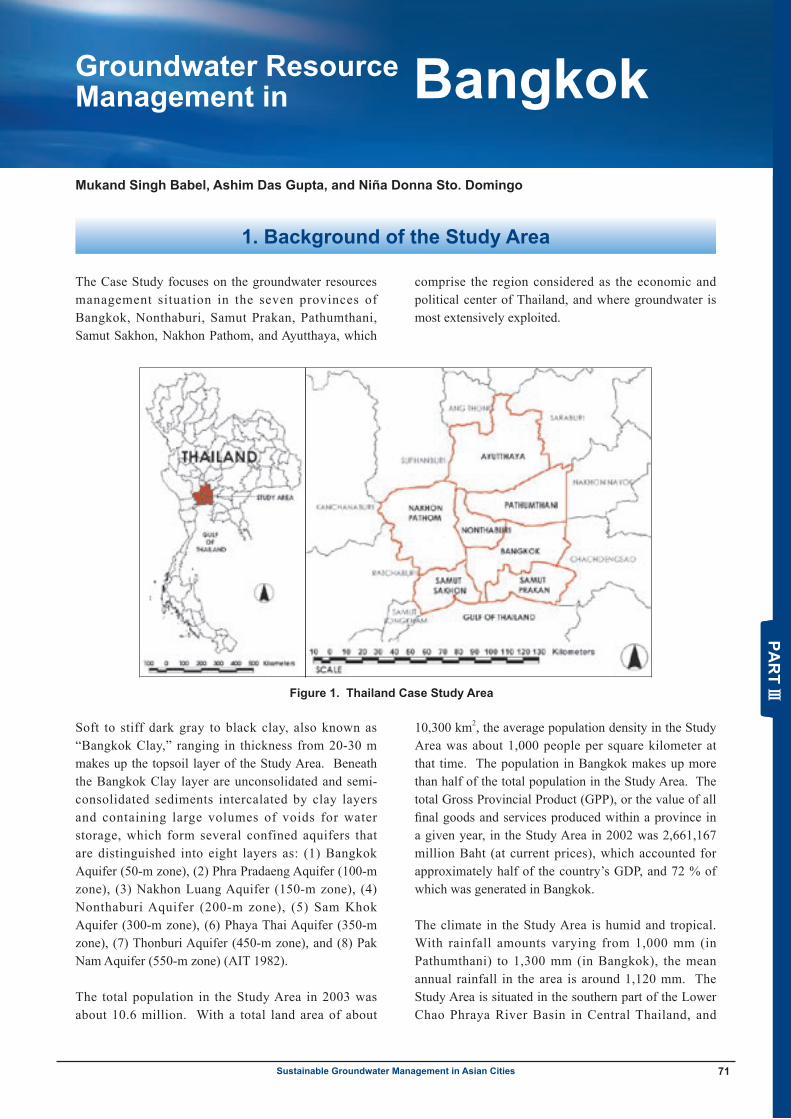
Summary report of Sustainable Groundwater Management in Asia 71Sustainable Groundwater Management in Asian Cities
Soft to stiff dark gray to black clay, also known as “Bangkok Clay,” ranging in thickness from 20-30 m makes up the topsoil layer of the Study Area. Beneath the Bangkok Clay layer are unconsolidated and semi-consolidated sediments intercalated by clay layers and containing large volumes of voids for water storage, which form several confined aquifers that are distinguished into eight layers as: (1) Bangkok Aquifer (50-m zone), (2) Phra Pradaeng Aquifer (100-m zone), (3) Nakhon Luang Aquifer (150-m zone), (4) Nonthaburi Aquifer (200-m zone), (5) Sam Khok Aquifer (300-m zone), (6) Phaya Thai Aquifer (350-m zone), (7) Thonburi Aquifer (450-m zone), and (8) Pak Nam Aquifer (550-m zone) (AIT 1982).
The total population in the Study Area in 2003 was about 10.6 million. With a total land area of about
10,300 km2, the average population density in the Study Area was about 1,000 people per square kilometer at that time. The population in Bangkok makes up more than half of the total population in the Study Area. The total Gross Provincial Product (GPP), or the value of all final goods and services produced within a province in a given year, in the Study Area in 2002 was 2,661,167 million Baht (at current prices), which accounted for approximately half of the country’s GDP, and 72 % of which was generated in Bangkok.
The climate in the Study Area is humid and tropical. With rainfall amounts varying from 1,000 mm (in Pathumthani) to 1,300 mm (in Bangkok), the mean annual rainfall in the area is around 1,120 mm. The Study Area is situated in the southern part of the Lower Chao Phraya River Basin in Central Thailand, and
The Case Study focuses on the groundwater resources management situation in the seven provinces of Bangkok, Nonthaburi, Samut Prakan, Pathumthani, Samut Sakhon, Nakhon Pathom, and Ayutthaya, which
comprise the region considered as the economic and political center of Thailand, and where groundwater is most extensively exploited.
Groundwater ResourceManagement in Bangkok
1. Background of the Study Area
Figure 1. Thailand Case Study Area
Thailand Case Study Summary Report 1 January 2006 IGES SWMP Project
Groundwater Managment in Bangkok ����������������������������������������������������������������
1 The Study Area
The Case Study focuses on the groundwater resources management situation in the seven provinces of Bangkok, Nonthaburi, Samut Prakan, Pathumthani, Samut Sakhon, Nakhon Pathom, and Ayutthaya, which comprise the region considered as the economic and political center of Thailand, and where groundwater is most extensively exploited.
Figure 1. Thailand Case Study Area.
Soft to stiff dark gray to black clay, also known as “Bangkok Clay,” ranging in thickness from 20-30 m makes up the topsoil layer of the Study Area. Beneath the Bangkok Clay layer are unconsolidated and semi-consolidated sediments intercalated by clay layers and containing large volumes of voids for water storage, which form several confined aquifers that are distinguished into eight layers as: (1) Bangkok Aquifer (50-m zone), (2) Phra Pradaeng Aquifer (100-m zone), (3) Nakhon Luang Aquifer (150-m zone), (4) Nonthaburi Aquifer (200-m zone), (5) Sam Khok Aquifer (300-m zone), (6) Phaya Thai Aquifer (350-m zone), (7) Thonburi Aquifer (450-m zone), and (8) Pak Nam Aquifer (550-m zone) (AIT, 1982).
The total population in the Study Area in 2003 was about 10.6 million. With a total land area of about 10,300 km2, the average population density in the Study Area was about 1,000 people per square kilometer at that time. The population in Bangkok makes up more than half of the total population in the Study Area. The total Gross Provincial Product (GPP), or the value of all final goods and services produced within a province in a given year, in the Study Area in 2002 was 2,661,167 million Baht (at current prices), which accounted for approximately half of the country’s GDP, and 72 % of which was generated in Bangkok.
The climate in the Study Area is humid and tropical. With rainfall amounts varying from 1,000 mm (in Pathumthani) to 1,300 mm (in Bangkok), the mean annual rainfall in the area is around 1,120 mm. The Study Area is situated in the southern part of the Lower Chao Phraya River Basin in
Mukand Singh Babel, Ashim Das Gupta, and Niña Donna Sto. Domingo
Summary report of Sustainable Groundwater Management in Asia
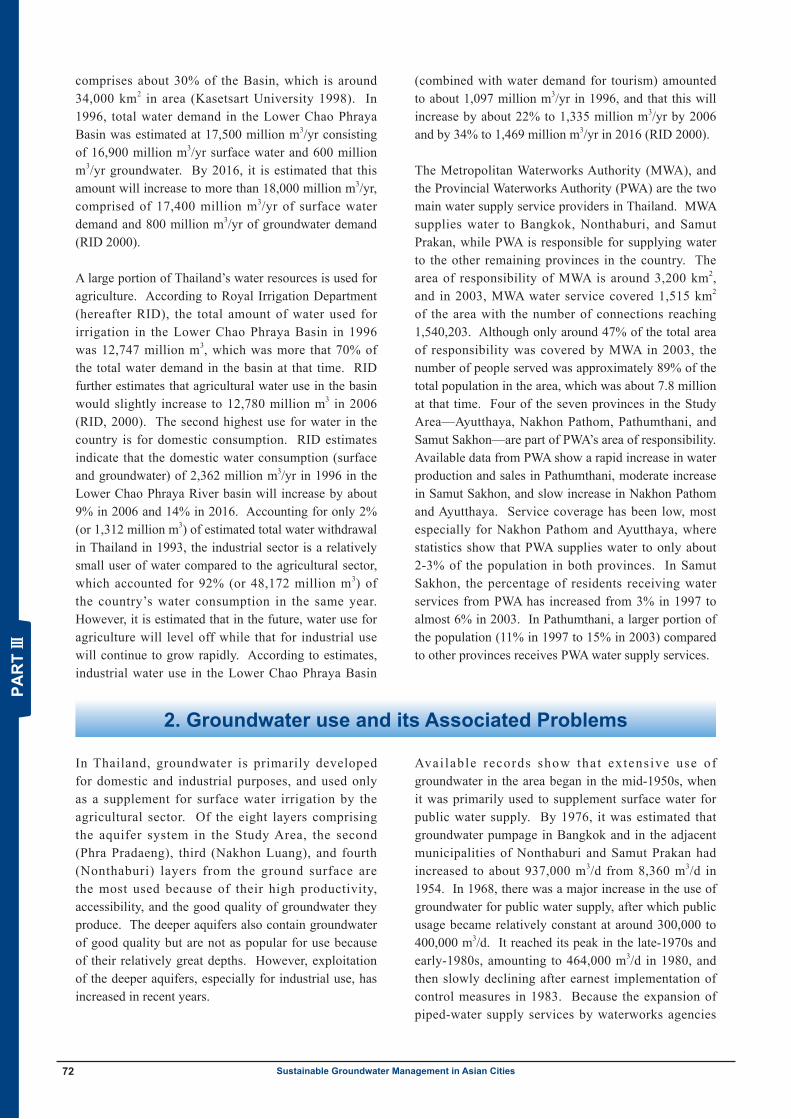
Summary report of Sustainable Groundwater Management in Asia72 Sustainable Groundwater Management in Asian Cities
comprises about 30% of the Basin, which is around 34,000 km2 in area (Kasetsart University 1998). In 1996, total water demand in the Lower Chao Phraya Basin was estimated at 17,500 million m3/yr consisting of 16,900 million m3/yr surface water and 600 million m3/yr groundwater. By 2016, it is estimated that this amount will increase to more than 18,000 million m3/yr, comprised of 17,400 million m3/yr of surface water demand and 800 million m3/yr of groundwater demand (RID 2000). A large portion of Thailand’s water resources is used for agriculture. According to Royal Irrigation Department (hereafter RID), the total amount of water used for irrigation in the Lower Chao Phraya Basin in 1996 was 12,747 million m3, which was more that 70% of the total water demand in the basin at that time. RID further estimates that agricultural water use in the basin would slightly increase to 12,780 million m3 in 2006 (RID, 2000). The second highest use for water in the country is for domestic consumption. RID estimates indicate that the domestic water consumption (surface and groundwater) of 2,362 million m3/yr in 1996 in the Lower Chao Phraya River basin will increase by about 9% in 2006 and 14% in 2016. Accounting for only 2% (or 1,312 million m3) of estimated total water withdrawal in Thailand in 1993, the industrial sector is a relatively small user of water compared to the agricultural sector, which accounted for 92% (or 48,172 million m3) of the country’s water consumption in the same year. However, it is estimated that in the future, water use for agriculture will level off while that for industrial use will continue to grow rapidly. According to estimates, industrial water use in the Lower Chao Phraya Basin
(combined with water demand for tourism) amounted to about 1,097 million m3/yr in 1996, and that this will increase by about 22% to 1,335 million m3/yr by 2006 and by 34% to 1,469 million m3/yr in 2016 (RID 2000).
The Metropolitan Waterworks Authority (MWA), and the Provincial Waterworks Authority (PWA) are the two main water supply service providers in Thailand. MWA supplies water to Bangkok, Nonthaburi, and Samut Prakan, while PWA is responsible for supplying water to the other remaining provinces in the country. The area of responsibility of MWA is around 3,200 km2, and in 2003, MWA water service covered 1,515 km2 of the area with the number of connections reaching 1,540,203. Although only around 47% of the total area of responsibility was covered by MWA in 2003, the number of people served was approximately 89% of the total population in the area, which was about 7.8 million at that time. Four of the seven provinces in the Study Area—Ayutthaya, Nakhon Pathom, Pathumthani, and Samut Sakhon—are part of PWA’s area of responsibility. Available data from PWA show a rapid increase in water production and sales in Pathumthani, moderate increase in Samut Sakhon, and slow increase in Nakhon Pathom and Ayutthaya. Service coverage has been low, most especially for Nakhon Pathom and Ayutthaya, where statistics show that PWA supplies water to only about 2-3% of the population in both provinces. In Samut Sakhon, the percentage of residents receiving water services from PWA has increased from 3% in 1997 to almost 6% in 2003. In Pathumthani, a larger portion of the population (11% in 1997 to 15% in 2003) compared to other provinces receives PWA water supply services.
In Thailand, groundwater is primarily developed for domestic and industrial purposes, and used only as a supplement for surface water irrigation by the agricultural sector. Of the eight layers comprising the aquifer system in the Study Area, the second (Phra Pradaeng), third (Nakhon Luang), and fourth (Nonthaburi) layers from the ground surface are the most used because of their high productivity, accessibility, and the good quality of groundwater they produce. The deeper aquifers also contain groundwater of good quality but are not as popular for use because of their relatively great depths. However, exploitation of the deeper aquifers, especially for industrial use, has increased in recent years.
Avai lable records show that extensive use of groundwater in the area began in the mid-1950s, when it was primarily used to supplement surface water for public water supply. By 1976, it was estimated that groundwater pumpage in Bangkok and in the adjacent municipalities of Nonthaburi and Samut Prakan had increased to about 937,000 m3/d from 8,360 m3/d in 1954. In 1968, there was a major increase in the use of groundwater for public water supply, after which public usage became relatively constant at around 300,000 to 400,000 m3/d. It reached its peak in the late-1970s and early-1980s, amounting to 464,000 m3/d in 1980, and then slowly declining after earnest implementation of control measures in 1983. Because the expansion of piped-water supply services by waterworks agencies
2. Groundwater use and its Associated Problems
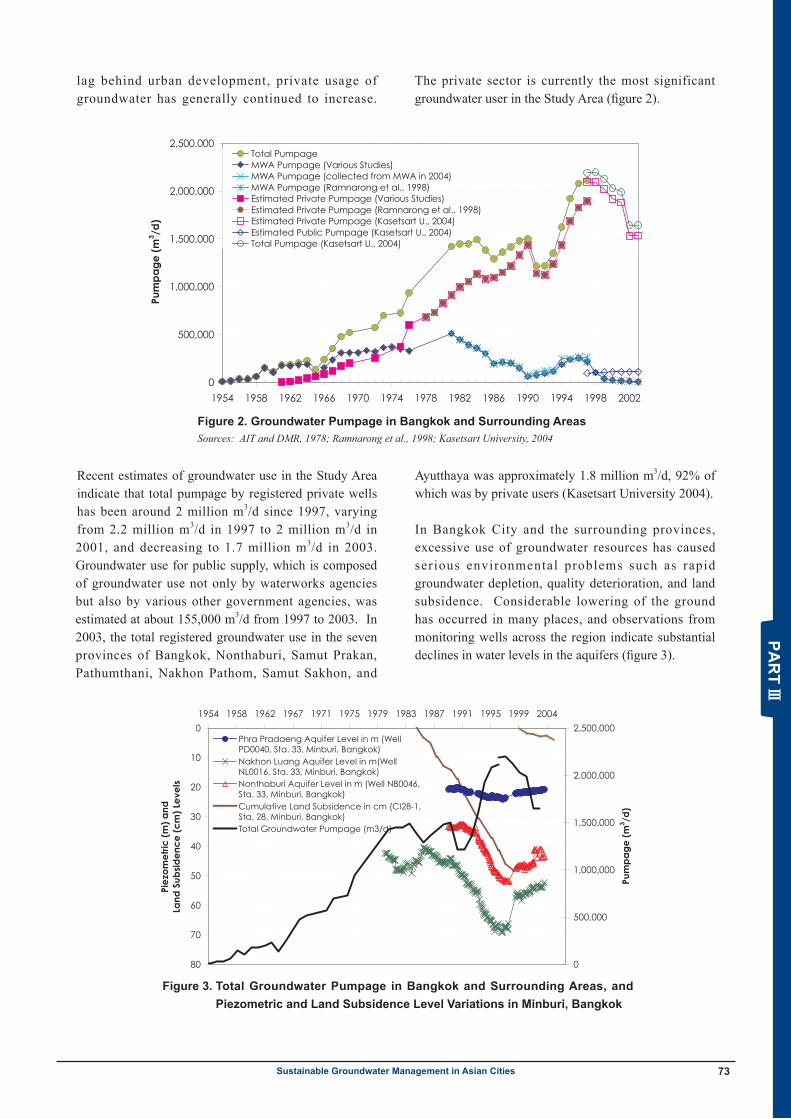
Summary report of Sustainable Groundwater Management in Asia 73Sustainable Groundwater Management in Asian Cities
lag behind urban development, private usage of groundwater has generally continued to increase.
The private sector is currently the most significant groundwater user in the Study Area (figure 2).
Recent estimates of groundwater use in the Study Area indicate that total pumpage by registered private wells has been around 2 million m3/d since 1997, varying from 2.2 million m3/d in 1997 to 2 million m3/d in 2001, and decreasing to 1.7 million m3/d in 2003. Groundwater use for public supply, which is composed of groundwater use not only by waterworks agencies but also by various other government agencies, was estimated at about 155,000 m3/d from 1997 to 2003. In 2003, the total registered groundwater use in the seven provinces of Bangkok, Nonthaburi, Samut Prakan, Pathumthani, Nakhon Pathom, Samut Sakhon, and
Ayutthaya was approximately 1.8 million m3/d, 92% of which was by private users (Kasetsart University 2004).
In Bangkok City and the surrounding provinces, excessive use of groundwater resources has caused serious environmental problems such as rapid groundwater depletion, quality deterioration, and land subsidence. Considerable lowering of the ground has occurred in many places, and observations from monitoring wells across the region indicate substantial declines in water levels in the aquifers (figure 3).
Figure 2. Groundwater Pumpage in Bangkok and Surrounding Areas Sources: AIT and DMR, 1978; Ramnarong et al., 1998; Kasetsart University, 2004
Thailand Case Study Summary Report 3 January 2006 IGES SWMP Project
and Samut Prakan had increased to about 937,000 m3/d from 8,360 m3/d in 1954. In 1968, there was a major increase in the use of groundwater for public water supply, after which public usage became relatively constant at around 300,000 to 400,000 m3/d. It reached its peak in the late-1970s and early-1980s, amounting to 464,000 m3/d in 1980, and then slowly declining after earnest implementation of control measures in 1983. Because the expansion of piped-water supply services by waterworks agencies lag behind urban development, private usage of groundwater has generally continued to increase. The private sector is currently the most significant groundwater user in the Study Area (Figure 2).
0
500,000
1,000,000
1,500,000
2,000,000
2,500,000
1954 1958 1962 1966 1970 1974 1978 1982 1986 1990 1994 1998 2002
Pum
page
(m3 /d
)Total PumpageMWA Pumpage (Various Studies) MWA Pumpage (collected from MWA in 2004)MWA Pumpage (Ramnarong et al., 1998)Estimated Private Pumpage (Various Studies)Estimated Private Pumpage (Ramnarong et al., 1998)Estimated Private Pumpage (Kasetsart U., 2004)Estimated Public Pumpage (Kasetsart U., 2004)Total Pumpage (Kasetsart U., 2004)
Figure 2. Groundwater Pumpage in Bangkok and Surrounding Areas. (Sources: AIT and DMR, 1978; Ramnarong et al., 1998; Kasetsart University, 2004)
Recent estimates of groundwater use in the Study Area indicate that total pumpage by registered private wells has been around 2 million m3/d since 1997, varying from 2.2 million m3/d in 1997 to 2 million m3/d in 2001, and decreasing to 1.7 million m3/d in 2003. Groundwater use for public supply, which is composed of groundwater use not only by waterworks agencies but also by various other government agencies, was estimated at about 155,000 m3/d from 1997 to 2003. In 2003, the total registered groundwater use in the seven provinces of Bangkok, Nonthaburi, Samut Prakan, Pathumthani, Nakhon Pathom, Samut Sakhon, and Ayutthaya was approximately 1.8 million m3/d, 92% of which was by private users (Kasetsart University, 2004).
In Bangkok City and the surrounding provinces, excessive use of groundwater resources has caused serious environmental problems such as rapid groundwater depletion, quality deterioration, and land subsidence. Considerable lowering of the ground has occurred in many places, and observations from monitoring wells across the region indicate substantial declines in water levels in the aquifers (Figure 3).
Thailand Case Study Summary Report 4 January 2006 IGES SWMP Project
0
10
20
30
40
50
60
70
80
1954 1958 1962 1967 1971 1975 1979 1983 1987 1991 1995 1999 2004
Piez
omet
ric (m
) and
La
nd S
ubsid
ence
(cm
) Lev
els
0
500,000
1,000,000
1,500,000
2,000,000
2,500,000
Pum
page
(m3 /d
)
Phra Pradaeng Aquifer Level in m (WellPD0040, Sta. 33, Minburi, Bangkok)Nakhon Luang Aquifer Level in m(WellNL0016, Sta. 33, Minburi, Bangkok)Nonthaburi Aquifer Level in m (Well NB0046,Sta. 33, Minburi, Bangkok)Cumulative Land Subsidence in cm (CI28-1,Sta. 28, Minburi, Bangkok)Total Groundwater Pumpage (m3/d)
Figure 3. Total Groundwater Pumpage in Bangkok and Surrounding Areas, and Piezometric and Land Subsidence Level Variations in Minburi, Bangkok.
Land subsidence has been a continuing problem in the Bangkok region for the past four decades, and the provinces comprising the Study Area has been identified by the Department of Groundwater Resources (DGR) as Critical Zones seriously affected by groundwater problems. The occurrence of land subsidence in the Study Area has been attributed to the extensive decline in groundwater levels, which in turn is due to excessive groundwater extraction rates. In 1969, land subsidence was given widespread attention when many indications were being observed in the Bangkok area (AIT, 1982). Protrusions of well casings in Bangkok indicated around half a meter of subsidence in central Bangkok in 1978 (Figure 4) (AIT, 1981).
Figure 4. Subsidence in Bangkok from the first leveling by the RTSD in 1978. (Source: AIT, 1981)
Figure 3. Total Groundwater Pumpage in Bangkok and Surrounding Areas, and Piezometric and Land Subsidence Level Variations in Minburi, Bangkok
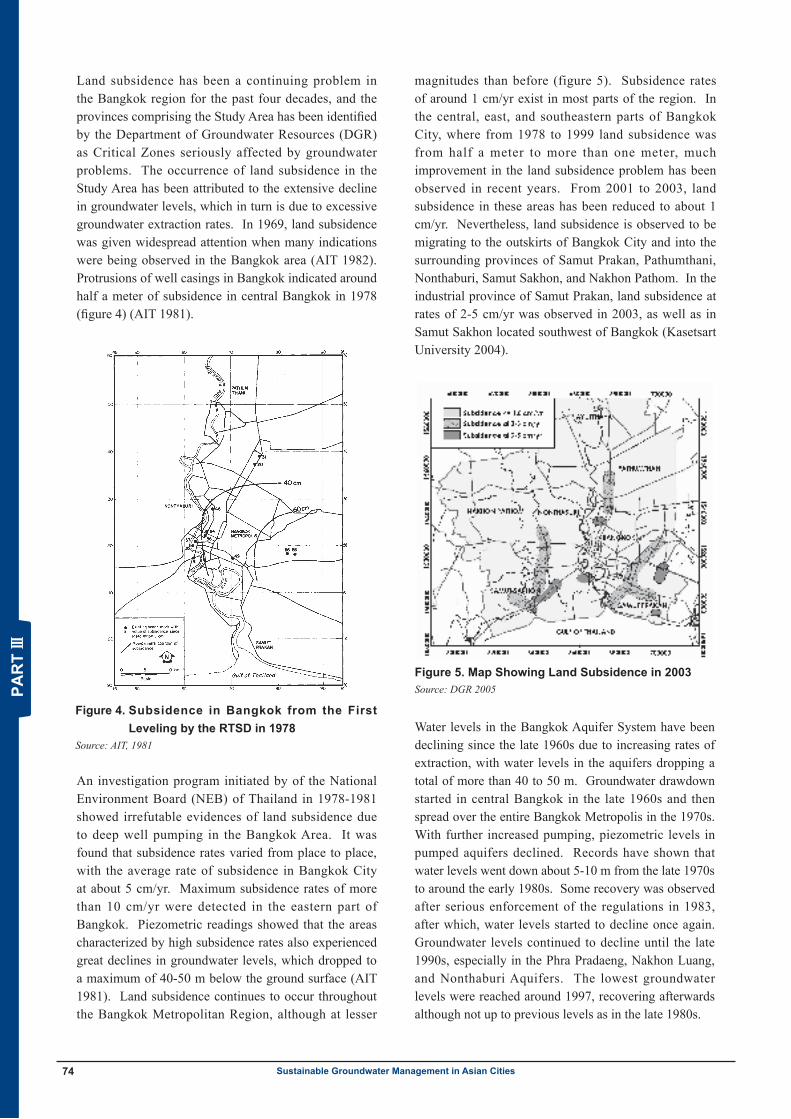
Summary report of Sustainable Groundwater Management in Asia74 Sustainable Groundwater Management in Asian Cities
Land subsidence has been a continuing problem in the Bangkok region for the past four decades, and the provinces comprising the Study Area has been identified by the Department of Groundwater Resources (DGR) as Critical Zones seriously affected by groundwater problems. The occurrence of land subsidence in the Study Area has been attributed to the extensive decline in groundwater levels, which in turn is due to excessive groundwater extraction rates. In 1969, land subsidence was given widespread attention when many indications were being observed in the Bangkok area (AIT 1982). Protrusions of well casings in Bangkok indicated around half a meter of subsidence in central Bangkok in 1978 (figure 4) (AIT 1981).
An investigation program initiated by of the National Environment Board (NEB) of Thailand in 1978-1981 showed irrefutable evidences of land subsidence due to deep well pumping in the Bangkok Area. It was found that subsidence rates varied from place to place, with the average rate of subsidence in Bangkok City at about 5 cm/yr. Maximum subsidence rates of more than 10 cm/yr were detected in the eastern part of Bangkok. Piezometric readings showed that the areas characterized by high subsidence rates also experienced great declines in groundwater levels, which dropped to a maximum of 40-50 m below the ground surface (AIT 1981). Land subsidence continues to occur throughout the Bangkok Metropolitan Region, although at lesser
magnitudes than before (figure 5). Subsidence rates of around 1 cm/yr exist in most parts of the region. In the central, east, and southeastern parts of Bangkok City, where from 1978 to 1999 land subsidence was from half a meter to more than one meter, much improvement in the land subsidence problem has been observed in recent years. From 2001 to 2003, land subsidence in these areas has been reduced to about 1 cm/yr. Nevertheless, land subsidence is observed to be migrating to the outskirts of Bangkok City and into the surrounding provinces of Samut Prakan, Pathumthani, Nonthaburi, Samut Sakhon, and Nakhon Pathom. In the industrial province of Samut Prakan, land subsidence at rates of 2-5 cm/yr was observed in 2003, as well as in Samut Sakhon located southwest of Bangkok (Kasetsart University 2004).
Water levels in the Bangkok Aquifer System have been declining since the late 1960s due to increasing rates of extraction, with water levels in the aquifers dropping a total of more than 40 to 50 m. Groundwater drawdown started in central Bangkok in the late 1960s and then spread over the entire Bangkok Metropolis in the 1970s. With further increased pumping, piezometric levels in pumped aquifers declined. Records have shown that water levels went down about 5-10 m from the late 1970s to around the early 1980s. Some recovery was observed after serious enforcement of the regulations in 1983, after which, water levels started to decline once again. Groundwater levels continued to decline until the late 1990s, especially in the Phra Pradaeng, Nakhon Luang, and Nonthaburi Aquifers. The lowest groundwater levels were reached around 1997, recovering afterwards although not up to previous levels as in the late 1980s.
Thailand Case Study Summary Report 4 January 2006 IGES SWMP Project
0
10
20
30
40
50
60
70
80
1954 1958 1962 1967 1971 1975 1979 1983 1987 1991 1995 1999 2004
Piez
omet
ric (m
) and
La
nd S
ubsid
ence
(cm
) Lev
els
0
500,000
1,000,000
1,500,000
2,000,000
2,500,000
Pum
page
(m3 /d
)
Phra Pradaeng Aquifer Level in m (WellPD0040, Sta. 33, Minburi, Bangkok)Nakhon Luang Aquifer Level in m(WellNL0016, Sta. 33, Minburi, Bangkok)Nonthaburi Aquifer Level in m (Well NB0046,Sta. 33, Minburi, Bangkok)Cumulative Land Subsidence in cm (CI28-1,Sta. 28, Minburi, Bangkok)Total Groundwater Pumpage (m3/d)
Figure 3. Total Groundwater Pumpage in Bangkok and Surrounding Areas, and Piezometric and Land Subsidence Level Variations in Minburi, Bangkok.
Land subsidence has been a continuing problem in the Bangkok region for the past four decades, and the provinces comprising the Study Area has been identified by the Department of Groundwater Resources (DGR) as Critical Zones seriously affected by groundwater problems. The occurrence of land subsidence in the Study Area has been attributed to the extensive decline in groundwater levels, which in turn is due to excessive groundwater extraction rates. In 1969, land subsidence was given widespread attention when many indications were being observed in the Bangkok area (AIT, 1982). Protrusions of well casings in Bangkok indicated around half a meter of subsidence in central Bangkok in 1978 (Figure 4) (AIT, 1981).
Figure 4. Subsidence in Bangkok from the first leveling by the RTSD in 1978. (Source: AIT, 1981) Figure 4. Subsidence in Bangkok from the First Leveling by the RTSD in 1978
Source: AIT, 1981
Thailand Case Study Summary Report 5 January 2006 IGES SWMP Project
An investigation program initiated by of the National Environment Board (NEB) of Thailand in 1978-1981 showed irrefutable evidences of land subsidence due to deep well pumping in the Bangkok Area. It was found that subsidence rates varied from place to place, with the average rate of subsidence in Bangkok City at about 5 cm/yr. Maximum subsidence rates of more than 10 cm/yr were detected in the eastern part of Bangkok. Piezometric readings showed that the areas characterized by high subsidence rates also experienced great declines in groundwater levels, which dropped to a maximum of 40-50 m below the ground surface (AIT, 1981). Land subsidence continues to occur throughout the Bangkok Metropolitan Region, although at lesser magnitudes than before (Figure 5). Subsidence rates of around 1 cm/yr exist in most parts of the region. In the central, east, and southeastern parts of Bangkok City, where from 1978 to 1999 land subsidence was from half a meter to more than one meter, much improvement in the land subsidence problem has been observed in recent years. From 2001 to 2003, land subsidence in these areas has been reduced to about 1 cm/yr. Nevertheless, land subsidence is observed to be migrating to the outskirts of Bangkok City and into the surrounding provinces of Samut Prakan, Pathumthani, Nonthaburi, Samut Sakhon, and Nakhon Pathom. In the industrial province of Samut Prakan, land subsidence at rates of 2-5 cm/yr was observed in 2003, as well as in Samut Sakhon located southwest of Bangkok (Kasetsart University, 2004).
Figure 5. Map showing land subsidence in 2003. (Source: DGR 2005)
Water levels in the Bangkok Aquifer System have been declining since the late 1960s due to increasing rates of extraction, with water levels in the aquifers dropping a total of more than 40 to 50 m. Groundwater drawdown started in central Bangkok in the late 1960s and then spread over the entire Bangkok Metropolis in the 1970s. With further increased pumping, piezometric levels in pumped aquifers declined. Records have shown that water levels went down about 5-10 m from the late 1970s to around the early 1980s. Some recovery was observed after serious enforcement of the regulations in 1983, after which, water levels started to decline once again. Groundwater levels continued to decline until the late 1990s, especially in the Phra Pradaeng, Nakhon Luang, and Nonthaburi Aquifers. The lowest groundwater levels were reached around 1997, recovering afterwards although not up to previous levels as in the late 1980s.
As for groundwater quality, recent analysis of monitoring data from DGR has shown elevated concentrations of chloride (increased salinity) for the three most popularly used aquifers (Phra Pradaeng, Nakhon Luang, and Nonthaburi) especially in areas near the Gulf of Thailand in Samut Prakan province and along the Chao Phraya River (Kasetsart University, 2004).
Figure 5. Map Showing Land Subsidence in 2003 Source: DGR 2005
Summary report of Sustainable Groundwater Management in Asia 75Sustainable Groundwater Management in Asian Cities
As for groundwater quality, recent analysis of monitoring data from DGR has shown elevated concentrations of chloride (increased salinity) for the three most popularly used aquifers (Phra Pradaeng,
Nakhon Luang, and Nonthaburi) especially in areas near the Gulf of Thailand in Samut Prakan province and along the Chao Phraya River (Kasetsart University 2004).
Since the emergence of various problems associated with groundwater in the Study Area in the 1960s and 70s the government has implemented numerous measures to mitigation these problems. These policies and regulations, which are of various types, include:
A. Regulatory measures
■ Comprehensive law for groundwater. A specific law concerning groundwater in Thailand came about in 1977 when Groundwater Act, B.E. 2520 (1977) was enacted (JICA et al. 1999). The Act came into effect in 1978, and it has been amended twice—in 1992, and in 2003. It contains provisions for controlling the exploration and drilling for groundwater, the use of groundwater, the recharging of aquifers through wells, and the protection and conservation of groundwater resources in the country.
■ Designation of groundwater regions and critical zones. To control groundwater use and mitigate environmental problems associated with it, areas most severely affected by groundwater-related problems such as land subsidence and groundwater depletion were designated as the Critical Zones where more control over private and public groundwater activities were instituted.
■ Licensing for well-drilling and groundwater use. Under the Groundwater Act, the government initiated licensing for the installation of wells and private groundwater use. Licenses were required to extract groundwater, and pumpage limits were instituted through these permits.
■ Groundwater use metering. The installation of well meters was enforced in 1985 in support of the use charges that the government started to levy from private users at that time.
■ Establishment of groundwater quality standards. To promote groundwater and environmental quality conservation, standards for groundwater for drinking purposes were established through the Groundwater Act, and in 2000, groundwater quality standards for the conservation of environmental quality were issued (PCD 2004).
B. Economic measures
■ Implementation of groundwater use charges. Groundwater Use Charges were first implemented in 1985 in the six provinces of Bangkok, Nonthaburi, Pathumthani, Ayutthaya, Samut Prakan, and in parts of Samut Sakhon, where Bt1.00 was charged for every cubic meter of groundwater used. By 1994, the charge was increased to 3.50 Bt/m3, and the government began to charge for groundwater use in the whole country. Between 2000 and 2003, groundwater charge was gradually increased in the Critical Zone from 3.50 Bt/m3 (July 2000) to 8.50 Bt/m3 (April 2003).
■ Implementation of preservation charges. The Ministry of Natural Resources and Environment (MONRE), based on the 2003 amendment of the Groundwater Act, has recently imposed the Groundwater Preservation Charge for all groundwater users in the Critical Zone. Starting at 1.00 Bt/m3 (1 September 2004), the charge is set to increase to 8.50 Bt/m3 in 2006, leveling off at that rate beyond 1 July 2006. Because of the institution of the Charge, the total cost per cubic meter of groundwater use in the Critical Zone has become relatively high, which has helped in limiting the exploitation of groundwater in the area. Total groundwater charge is expected to increase from 9.50 Bt/m3 in 2004, to 12.50 Bt/m3 by mid-2005, and to 17 Bt/m3 by July 2006 and beyond, which is deterring groundwater users in the area, especially those using large amounts such as industries, from using groundwater for their water supply.
■ Levying surcharges and penalizing violators of regulations.
C. Supporting Measures
■ Groundwater monitoring system. The Bangkok Groundwater Monitoring Network was established under the comprehensive study programme on groundwater and land subsidence from 1978-1981, and it is used to collect data on groundwater levels, land subsidence, and groundwater quality in the
3. Policy Responses and Future Challenges
Summary report of Sustainable Groundwater Management in Asia76 Sustainable Groundwater Management in Asian Cities
various aquifers in the Study Area.
■ Groundwater database system. The Groundwater Database System was established in 1995 through the JICA study on “Management of Groundwater and Land Subsidence in the Bangkok Metropolitan Area and its Vicinity” (JICA, 1995).
D. Other Measures
■ Artificial recharge of aquifers. The government is also presently considering the implementation of technical measures to mitigate the problems due to groundwater overexploitation in the Study Area, which include artificial recharge of the depleted aquifers.
■ Public awareness programs. Also, DGR has launched public awareness programs to educate the population about the proper use of groundwater resources in the country through publication of various brochures and booklets.
Fifty years of groundwater management efforts in Thailand have seen the enforcement of a wide range of measures aimed at keeping groundwater exploitation in the country under control. Although many of them have resulted in the alleviation of groundwater problems, some have been found to be not as effective as expected. Various interrelated factors hinder effective implementation of these policies and measures.
A major barrier towards proper control over excessive and illegal use of groundwater resources in the Study Area is lack of institutional thrust from concerned authorities resulting into ineffective implementation of laws and regulations. Despite the existence of laws requiring licenses for all private groundwater-related activities in the country, illegal private wells still exist. Shortage in the number of DGR Inspectors and budgetary constraints limit the authorities’ abilities to ensure that all private well users are registered with DGR. Many groundwater wells remain un-metered even with the existence of a regulation requiring the installation of meters for wells more than 15 m deep. Although this regulation has allowed authorities more accurate quantification of groundwater use and has ensured that users pay for exactly how much they extract and not exceed allowable amounts, the effectiveness of this control measure has been limited by the fact that not all registered users comply with it. Although groundwater users will have to pay for the full permitted amounts (even if they actually use less) when their wells
are un-metered, this has not driven them to abide by the regulations, because perhaps the existing system of groundwater-use reporting, wherein well owners report their monthly use to DGR, who in turn bills them for their consumption, does not really incite groundwater users to do so.
Lack of monetary as well as human resources add to the difficulties of the authorities in strictly enforcing groundwater management regulations, as they are unable to conduct proper monitoring of groundwater activities in the country. Regular inspections of registered wells and groundwater users could not be conducted as often as necessary, groundwater monitoring stations could not be properly maintained, and a more efficient system for metering and charge collection could not be established. The Groundwater Database System has allowed convenient access, by groundwater managers and decision-makers, to groundwater resources-related information in the Bangkok Region necessary in assessing the status of the resource and formulating proper management measures. However, the full potential of the Groundwater Database System is currently not being realized due to lack of maintenance and updating. Budget constraints have also hindered the regular maintenance, rehabilitation, and expansion of the Groundwater Monitoring System, which has enabled the collection of important information about the aquifers as well as the land subsidence situation in Bangkok and surrounding provinces.
Some inappropriate legislation may also be considered as hindrances to effective implementation of regulatory measures. For instance, the legal definition of groundwater as being water occurring beneath the ground at depths exceeding 15, 20, or 30 m (depending on the region in the country), which still stands today even after two amendments of the Groundwater Act, keeps the use of groundwater from shallow aquifers all over the country largely unregulated. Also, groundwater use charges are not levied for agricultural groundwater use. Furthermore, although ignorance of the law is never a good reason for not following it, some groundwater users are just truly uninformed of the regulations for using groundwater resources in the country. Furthermore, perhaps lack of discipline of groundwater users, which may be further encouraged by the weak resolve of the authorities to enforce regulations and impose penalties, is another factor that hinders the strict implementation of groundwater management measures in the country and in the Study Area. Punishment for lawbreakers range from a fine of not more than Bt 20,000 to six months of imprisonment, and
Summary report of Sustainable Groundwater Management in Asia 77Sustainable Groundwater Management in Asian Cities
penalties are charged for late payment of groundwater charges, but the effectiveness of penalties and fines imposed upon violators of regulations has been limited possibly due to the relatively meager fines and that inspections for discovering violations and enforcing the penalties are not conducted enough.
Finally, possibly one of the most serious barriers to effective implementation of existing policies and the introduction of improved measures is lack of alternative sources of water that are suitable for the needs of industries, which are the largest groundwater users in the Study Area. Sufficient and reliable piped-water supplies for domestic consumption are also lacking, especially in areas located far from city and town centers, such that private business and homeowners have no other option but to develop groundwater resources for their water
supplies. This also limits the effectiveness of levying charges for groundwater use in controlling private groundwater abstraction since without alternative sources of water consumers have no choice but to continue using groundwater despite increased costs.
With the introduction of new ideas and concepts such as effective resources use and integrated water resources management, the formerly supply-driven approach to groundwater resources development and management in Thailand has been shifting towards management based on scientific/academic knowledge. Project studies have been initiated and conducted in recent years as the responsible authorities (DGR) seek to better understand and learn more about the occurrence of groundwater resources and its associated problems in the country.
In the Stakeholders Meeting conducted in July 2005, policies and measures for the mitigation of groundwater-related problems and improving groundwater resources management in the Study Area were drafted. The recommendations included direct control, economic, supporting, technical, and informative measures such as:
■ Firm implementation of regulations. Illegal use of groundwater may be curbed through institution of stiffer penalties and at the same time ensuring that proper mechanisms for enforcing these penalties are in place. Another approach would be for DGR to pardon currently unregistered groundwater users and ask them to register with the authorities afterwards.
■ Stricter limits on industrial water/groundwater use. Reduction of water/groundwater use by the industries may be advanced through provision of incentives for recycle and reuse of water as well as the promotion of clean technologies.
■ Relocation of large groundwater users, such as industries, outside the Critical Zone.
■ Establishment of an authority that will extract groundwater for water supply. Increased control over groundwater extraction without actually curtailing its use may be achieved through the establishment of an agency that will extract groundwater and supply water in the Study Area.
■ Further increase of Groundwater Use Charges. Wi th the imp lemen ta t ion o f Groundwate r Preservation Charges in the Study Area, total charges
for groundwater have become more comparable with public water supply rates, such that the impact of further increasing groundwater use charges in terms of lessening groundwater use will now be more marked.
■ Charging for agricultural groundwater use. It was also suggested that agro-wells, which are currently exempted from paying Groundwater Use Charges, now be charged for groundwater use.
■ Modifying Groundwater Preservation Charge rates. A flat rate for Groundwater Preservation Charge is currently in place in the Study Area. It was suggested that a study be conducted to develop a progressive Groundwater Preservation Charge rate based on use amounts and the groundwater resources conditions in each area. In addition, groundwater stakeholders in the area should be better informed of the purposes and objectives for collecting Groundwater Preservation Charges.
■ Implementation of Polluters Pay Principle (PPP).
■ Establishing a groundwater market.
■ Artificial recharge of aquifers. Increasing groundwater recharge through artificial and natural means to facilitate recovery of piezometric heads in the aquifers was also proposed. Although several projects have been conducted about the feasibility of artificial recharge in the Study Area, it is yet to be implemented by DGR. Recharging water into aquifers through a system of wells will not only help increase piezometric levels, it will also assist
4. Proposed Policy Options for Sustainable Groundwater Use
Summary report of Sustainable Groundwater Management in Asia78 Sustainable Groundwater Management in Asian Cities
in mitigating saline water intrusion by creating a freshwater barrier protecting the groundwater.
■ Encouraging public participation. The public must be made aware of the groundwater situation in their areas, and they must be given opportunities to actively participate in the development and enforcement of solutions to problems resulting from groundwater use.
■ Updating/redefinition of the Critical Zone. Updating of the Critical Zone in accordance with the master plans of MWA and PWA must be considered for more reasonable and realistic implementation of mitigation and control measures in the Study Area.
■ Improving monitoring of groundwater activities. A good system for regular inspection and monitoring of groundwater wells in the area must be established. Regular inspections must be conducted to prevent illegal well drilling and the use of groundwater without the use of meters, and authorities must be firm at meting out punishments to violators. These targets may be achieved through the involvement of the private sector in groundwater use monitoring and charge collection. The industries themselves may also assist the authorities in establishing the telemetry system, which will help in monitoring abstraction by large users of groundwater.
■ Improving Groundwater Monitoring and Database systems using the Groundwater Development Fund (GDF). The GDF may be used to improve and maintain the groundwater monitoring and database systems, and for establishing a telemetry system. However, present regulations make it difficult for stakeholders and even DGR to use the GDF. Thus, the amendment of the Groundwater Act or relevant regulations regarding the use of the Groundwater Development Fund may be required. Regular data collection must be conducted to update and maintain the Groundwater Database System at DGR. Data consistency must be ensured, and access to the database by groundwater managers and users alike must be improved. Links between stakeholders and authorities in terms of database use and information exchange must be established, and data exchange between provincial and central groundwater offices must be enhanced for regular updating of the database.
■ Development of alternative water sources. The Thai government may also develop alternative water sources to supply water to industries, which are the biggest users of groundwater in the Study Area.
■ Water demand management. Instead of further
developing supplies, the authorities may promote water demand management, which involves the judicious and efficient use of water. Systematic use of the resource and/or the conjunctive use of groundwater and surface water may be promoted to minimize groundwater extraction.
■ Capaci ty -bui ld ing for nat ional and loca l groundwater managers. Local groundwater management capacities must be developed, possibly through the conduct of seminars and trainings, because it is anticipated that groundwater use will continue to increase in the future, and that problems will continue to occur unless proper controls are implemented.
■ Conduct of further studies about groundwater management issues.
Ensuring that proposed new or improved measures are developed based on sound technical, scientific, and socio-economic information, is vital for effective implementation of policy improvements for sustainable groundwater resources management in the Study Area. Also, it is essential that the authorities obtain the cooperation of groundwater users in the Study Area to make sure that they respect and abide by promulgated regulations. Most importantly, proper implementation of improved policies for groundwater management in the Study Area requires the dedication and commitment of responsible government agencies as promulgation of recommendations into actual national laws and policies requires much time and effort from the concerned authorities.
Cited References
Asian Institute of Technology (AIT). 1981. Investigation of Land Subsidence Caused by Deep Well Pumping in the Bangkok Area: Comprehensive Report 1978-1981. Research Report No. 91 submitted to the Office of the National Environment Board. Bangkok: Asian Institute of Technology.
---. 1982. Groundwater Resources in Bangkok Area: Development and Management Study; Comprehensive Report 1978-1982. AIT Research Report no. 137 submitted to the Office of the National Environment Board. Bangkok: Asian Institute of Technology.
Asian Institute of Technology (AIT) and Department of Mineral Resources (DMR). 1978. Groundwater Resources in Bangkok Area: Development and Management Study; Phase 1: Final Report. AIT Research Report no. 98 submitted to the Office of the National Environment Board. Bangkok: AIT and DMR.
Department of Groundwater Resources (DGR). 2005. Groundwater crisis and land subsidence in Bangkok. < http://conserve.dgr.go.th/landsub_bkk.pdf > (Accessed 26 September 2005).
Summary report of Sustainable Groundwater Management in Asia 79Sustainable Groundwater Management in Asian Cities
Japan International Cooperation Agency (JICA), Department of Energy Development and Promotion (DEDP) and Japanese Institute of Irrigation and drainage (JIID). 1999. Water Resources Laws in Thailand. Bangkok: JICA, DEDP, and JIID.
Japan International Cooperation Agency (JICA). 1995. The Study on Management of Groundwater and Land Subsidence in the Bangkok Metropolitan Area and Its Vicinity. Final Report submitted to the Department of Mineral Resources. Bangkok: JICA.
Kasetsart University. 1998. English Informations. Water Resources Information of 25 River Basins of Thailand. <http://www.eng.ku.ac.th/~irre/E25BASIN.HTM> (Accessed 3 December 2004).
---. 2004. Effect of Groundwater Over-Pumping Mitigation: Mathematical Model Study. Final Project Report submitted to the Department of Groundwater Resources. Bangkok: s. n.
Pollution Control Department (PCD). 2004. Water Quality Standards.<http://www.pcd.go.th/info_serv/en_reg_std_water.html> (Accessed 8 November 2004).
Ramnarong V., Buapeng, S., Chutsanatat, S., and Lorpensri, A. 1998. Groundwater Crisis and Land Subsidence in Bangkok Metropolitan Region. DMR Report No 3/1998. Bangkok: Department of Mineral Resources.
Royal Irrigation Department (RID). 2000. Final Report on Chao Phraya Basin Water Management Project. Final Report. Bangkok: PAL Consultants Co. Ltd.
Other References
Achalabhuti, C. 1974. Petroleum Geology of the Gulf of Thailand. In Proceedings of the Circum-Pacific Energy and Mineral Resources Conference, Honolulu, Hawaii.
Chuamthaisong, C. 1980. Lithology of Aquifers and Water-Bearing Properties in the Lower Central Plain. Bangkok: Department of Mineral Resources.
Chulalongkorn University. 1999. Thailand Population Data. <http://www.chula.ac.th/college/cps/thaidata/thailand_data.html> (Accessed 15 November 2004).
---. 2000. Master Plan and Conceptual Design of Artificial Recharge Project for Environmental Prevention. Executive Summary Report submitted to the Department of Mineral Resources. Bangkok: Chulalongkorn University.
Cox, J. B. 1968. A review of engineering properties of the recent marine clays in Southeast Asia. AIT Research Report No. 6. Bangkok: Asian Institute of Technology.
Department of Groundwater Resources (DGR). (No Date). Grand Opening of “Master Plan of Groundwater Management and Development.” News and Announcement. <http://www.dgr.go.th/Eng/News&Event/GWmasterplan.htm> (Accessed 9 January 2006).
Department of Mineral Resources (DMR). 2000. Groundwater Management System Improvement Project. Final Report. Bangkok: DMR.
Food and Agriculture Organization (FAO). 1997. AQUASTAT—
FAO’s Information System on Water and Agriculture. Thailand.<http://www.fao.org/ag/agl/aglw/aquastat/countries/thailand/index.stm> (Accessed 3 December 2004).
Metropolitan Waterworks Authority. 1970. Water Supplies and Distribution, Metropolitan Bangkok, Thailand. Master Plan, Camp, Dresser and McKee.
Muktabhant, C., Teerawwong, P. and Tengamnuay, V. 1966. Engineering Properties of Bangkok Subsoils. Bangkok: Chulalongkorn University.
Piancharoen, C. and Chuamthaisong, C. 1976. Groundwater of Bangkok Metropolis, Thailand, Proceedings of the International Hydrogeological Conference, Budapest.
Poland, J.F. 1969. Land subsidence and Aquifer System Compaction, Santa Clara Valley, California, U.S.A. In Proceedings of Tokyo Symposium on Land Subsidence, Tokyo. 1: 285-294.
Pollution Control Department (PCD). (No date). (NEQA 1992) Pollution Prevention and Mitigation Policy in accordance with the Policy and Perspective Plan for Enhancement and Conservation of the National Environmental Quality 1997-2016. Water Pollution. <http://www.pcd.go.th/info_serv/en_reg_polwater.html> (Accessed 12 October 2004).
Ramnarong, V. 1983. Environmental impacts of heavy groundwater development in Bangkok, Thailand. In Proceedings of International Conference on Groundwater and Man, Sydney. 2: 345-350.
---. 1999. Evaluation of groundwater management in Bangkok: positive and negative. In Groundwater in the urban environment: proceedings of the XXVII IAH Congress on Groundwater in the Urban Environment, edited by John Chilton, 51-62. Rotterdam: A.A. Balkema.
Ramnarong, V. and Buapeng, S. 1989. Groundwater Consumption in Bangkok and Its Vicinity, Present and Future. Paper presented at the workshop on “Bangkok Land Subsidence—What's Next?,” June 22-23 , in Bangkok, Thailand. ---. 1991. Mitigation of Groundwater Crisis and Land Subsidence in Bangkok. Journal of Thai Geoscience, No. 2: 125-137.
Scott Christensen and Areenya Boon-long. 1993. Institutional Problems in Water Allocation: Challenges for New Legislation. Thailand Development Research Institute (TDRI) Quarterly Review Vol.8 No.3: 3-8.
Sethaputra, S., Panayotou, T., and Wangwacharakul, V. 1990. Water Resources: Shortage Amidst Abundance. Thailand Development Research Institute (TDRI) Quarterly Review Vol.5 No.3: 12-19.
United Nations Economic and Social Commission for Asia and the Pacific (UNESCAP). (No date). Local Government in Asia and the Pacific: A Comparative Study. Country Paper: Thailand. <http://www.unescap.org/huset/lgstudy/country/thailand/thai.html#cat> (Accessed 23 March 2005).
---. 1991. Assessment of Water Resources and Water Demand by User Sectors in Thailand. Report No. 1068. New York: United Nations.
---. 1998. Sources and Nature of Water Quality Problems in Asia and the Pacific. Report No. 1875. New York: United Nations.
Summary report of Sustainable Groundwater Management in Asia80 Sustainable Groundwater Management in Asian Cities
---. 1999. Water Quality of Selected Rivers in Asia: Protection and Rehabilitation. Report No. 1956. Bangkok: United Nations.
---. 2000. Wastewater Management Policies and Practices in Asia and the Pacific. Water Resources Series No. 79. Bangkok: United Nations.
United Nations Environment Programme (UNEP). 2000. Bangkok City State of the Environment Report – 2001. <http://www.rrcap.unep.org/reports/soe/bangkoksoe2001.cfm> (Accessed 20 October 2004).
---. (No date). Bangkok City State of the Environment Report – 2003. <http://www.rrcap.unep.org/reports/soe/bangkoksoe.cfm> (Accessed 11 November 2004).
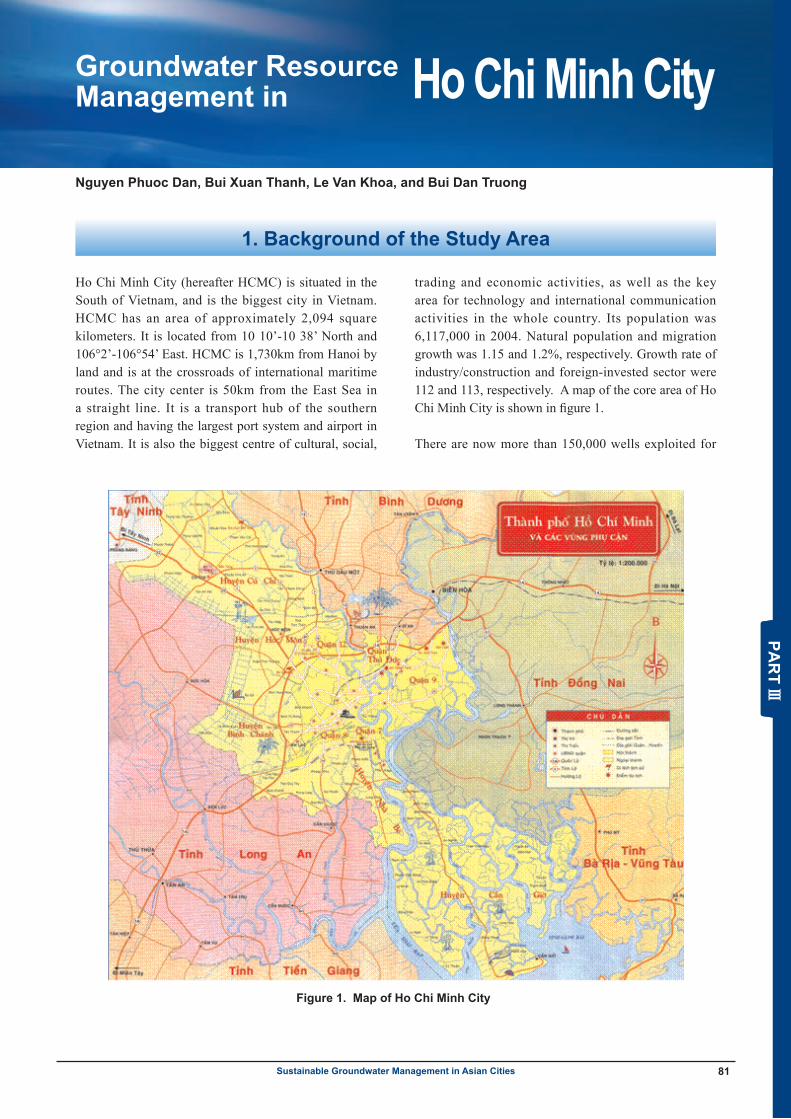
Summary report of Sustainable Groundwater Management in Asia 81Sustainable Groundwater Management in Asian Cities
Ho Chi Minh City (hereafter HCMC) is situated in the South of Vietnam, and is the biggest city in Vietnam. HCMC has an area of approximately 2,094 square kilometers. It is located from 10 10’-10 38’ North and 106°2’-106°54’ East. HCMC is 1,730km from Hanoi by land and is at the crossroads of international maritime routes. The city center is 50km from the East Sea in a straight line. It is a transport hub of the southern region and having the largest port system and airport in Vietnam. It is also the biggest centre of cultural, social,
trading and economic activities, as well as the key area for technology and international communication activities in the whole country. Its population was 6,117,000 in 2004. Natural population and migration growth was 1.15 and 1.2%, respectively. Growth rate of industry/construction and foreign-invested sector were 112 and 113, respectively. A map of the core area of Ho Chi Minh City is shown in figure 1.
There are now more than 150,000 wells exploited for
Groundwater ResourceManagement in Ho Chi Minh City
1. Background of the Study Area
Figure 1. Map of Ho Chi Minh City
1
GROUND WATER RESOURCE MANAGEMENT IN HO CHI MINH CITY
N.P. Dan , B.X. Thanh, L.V. Khoa and B.D. Truong
Introduction
Ho Chi Minh City (hereafter HCMC) is situated in the South of Vietnam, and is the biggest city in Vietnam. HCMC has an area of approximately 2,094 square kilometers. It is located from 10 10’-10 38’ North and 106o2’-106o54’ East. HCMC is 1,730km from Hanoi by land and is at the crossroads of international maritime routes. The city center is 50km from the East Sea in a straight line. It is a transport hub of the southern region and having the largest port system and airport in Vietnam. It is also the biggest centre of cultural, social, trading and economic activities, as well as the key area for technology and international communication activities in the whole country. Itspopulation was 6,117,000 in 2004. Natural population and migration growth was 1.15 and 1.2%, respectively. Growth rate of industry/construction and foreign-invested sector were 112 and 113, respectively. A map of the core area of Ho Chi Min City is shown in figure 1.
Figure 1. Map of Ho Chi Min City
There are now more than 150,000 wells exploited for drinking and industrial purposes in HCMC. Total used groundwater quantity is estimated about 530,000 m3/day, of which 100,000 m3/day is supplied for drinking purpose. Department of Science, Technology and Environment (DOSTE) of
Nguyen Phuoc Dan, Bui Xuan Thanh, Le Van Khoa, and Bui Dan Truong
Summary report of Sustainable Groundwater Management in Asia
Summary report of Sustainable Groundwater Management in Asia82 Sustainable Groundwater Management in Asian Cities
drinking and industrial purposes in HCMC. Total used groundwater quantity is estimated about 530,000 m3/day, of which 100,000 m3/day is supplied for drinking purpose. Department of Science, Technology and Environment (DOSTE) of HCMC (2001) reported that
current exploitation rate of all three aquifers has reached to limited value (about 500,000 m3/day). This results in the high descent of water table. It was observed that the water table has been lowered by 4 – 5 m during the last 5 years in Thu Duc and Go Vap Districts.
2. Water use
2-1. Public Water Supply
The water supply system of HCMC, built in 1879 (the French colony) and have been improved several times. Saigon water treatment plant located in Thu Duc District was set-up and run at the capacity of 480,000 m3/day in 1966. Thu Duc water treatment plaut has been upgraded several times and the present capacity is 750,000 m3/day. Hoc Mon groundwater treatment plant with capacity of 60,000 m3/day was started running in December 1993.
The socio-economic development plan of HCMC People’s Committee for period 2001–2020 (VIWASE 2004) shows that the quantity of piped water increases to 1,670,000 m3/day; 2,180,000 m3/day and 3,290,000 m3/day in the year 2004, 2010 and 2020, respectively.
2-2. Rain Water Utilization
In Can Gio District, rain water is one of the main domestic water resources. Every month, ship transports 5000 m3 from HCMC to Can Gio so water demand is about 3 - 4 l/capita.day. HCMC’s water supply company is planning to install water network for this area through the route of Nha Be – Can Gio districts.
2-3. Groundwater
Three of five aquifers in HCMC territory play important role in water supply for HCMC, namely, Pleistocene aquifer (20–50m); Upper-Pliocene (50–100m) and lower-Pliocene aquifer (100–140m). At present, there are more than 150,000 wells exploited for drinking and industrial purposes in HCMC (Chan 2004). The Union for Geology No.8 (2001) assessed that the sustainable groundwater use limit rate of all three aquifers was about 500,000m3/day.
The ratio of groundwater exploitation will be 21 % of the total in year of 2010 and 15% in year of 2020. Groundwater is currently important resource for the development of the city for now (32–42% of water supply) and will continue to be in future. In practice, water table descent has been observed in some monitoring wells. Furthermore, the groundwater is under threat due to contamination of the shallow aquifer (Pleistocene) and over exploitation of domestic and industrial wells.
3. State of Groundwater and its Associated Problems
3-1. The Exploitation Rate
Groundwater in HCMC has been exploited for domestic and industrial uses from the beginning of 20th century. The survey of Department of Industry (2000) reported that HCMC had 95,828 wells with the different diameters and depths at the end of 1999 and about 150,000 wells, equivalent to over 530,000 m3/day, in 2003 (Nga 2004). The number of wells exploited in the aquifer is presented as follows:
Holocene aquifer: There were over 60 wells (about 120 m3/day) located mostly in Can Gio District. This aquifer has small water reserve and only been exploited for household uses.
Pleistocene aquifer (20-50 m deep): There were over 120,000 wells (over 277,000 m3/day), in which included about 20,000 wells in the Upper Pliocene aquifer and 5 wells in the Lower Pliocene aquifer. The groundwater is fresh, with low pH and higher iron and ammonia.
Pliocene aquifer (40-80 m deep for the Upper Pliocene and 50-100 m for the Lower Pliocene): A lot of big industrial wells are located in this aquifer with capacity over 245,000 m3/day.
Most of wells in HCMC are in the Pleistocene aquifer and Pliocene aquifers (99.9% total number of surveyed wells). These wells are mainly located in the inner
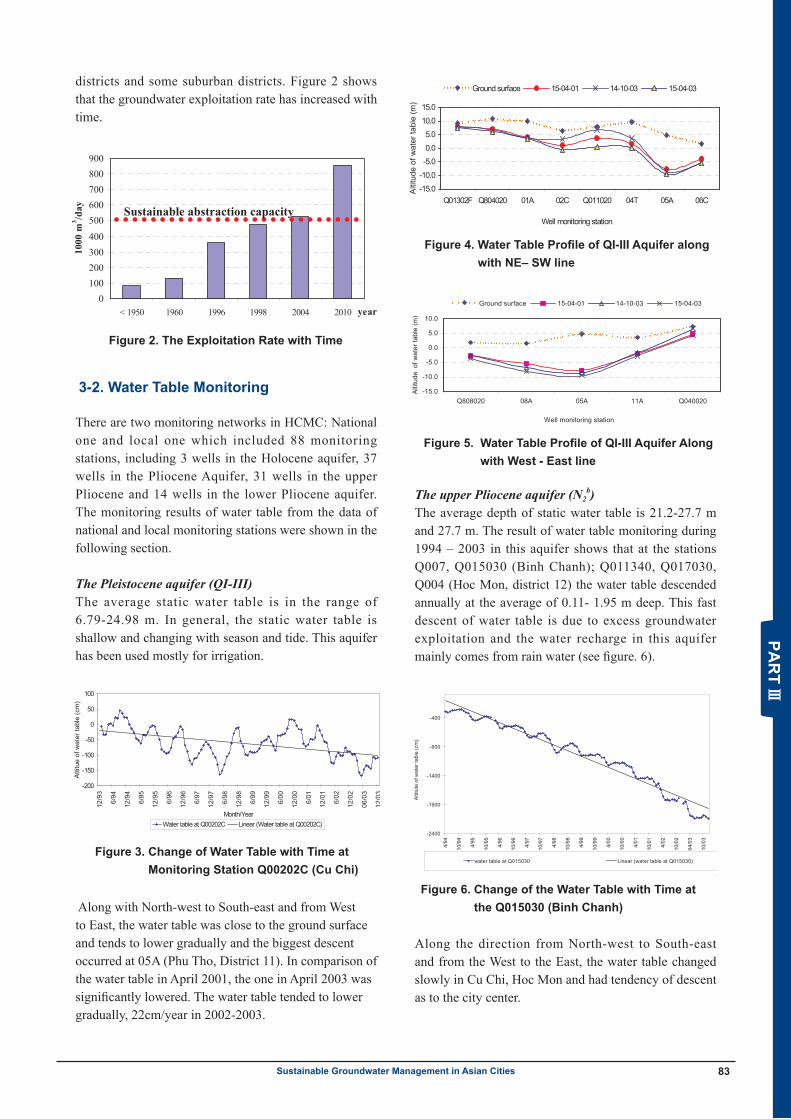
Summary report of Sustainable Groundwater Management in Asia 83Sustainable Groundwater Management in Asian Cities
districts and some suburban districts. Figure 2 shows that the groundwater exploitation rate has increased with time.
3-2. Water Table Monitoring
There are two monitoring networks in HCMC: National one and local one which included 88 monitoring stations, including 3 wells in the Holocene aquifer, 37 wells in the Pliocene Aquifer, 31 wells in the upper Pliocene and 14 wells in the lower Pliocene aquifer. The monitoring results of water table from the data of national and local monitoring stations were shown in the following section.
The Pleistocene aquifer (QI-III) The average static water table is in the range of 6.79-24.98 m. In general, the static water table is shallow and changing with season and tide. This aquifer has been used mostly for irrigation.
Along with North-west to South-east and from West to East, the water table was close to the ground surface and tends to lower gradually and the biggest descent occurred at 05A (Phu Tho, District 11). In comparison of the water table in April 2001, the one in April 2003 was significantly lowered. The water table tended to lower gradually, 22cm/year in 2002-2003.
The upper Pliocene aquifer (N2b)
The average depth of static water table is 21.2-27.7 m and 27.7 m. The result of water table monitoring during 1994 – 2003 in this aquifer shows that at the stations Q007, Q015030 (Binh Chanh); Q011340, Q017030, Q004 (Hoc Mon, district 12) the water table descended annually at the average of 0.11- 1.95 m deep. This fast descent of water table is due to excess groundwater exploitation and the water recharge in this aquifer mainly comes from rain water (see figure. 6).
Along the direction from North-west to South-east and from the West to the East, the water table changed slowly in Cu Chi, Hoc Mon and had tendency of descent as to the city center.
Figure 4. Water Table Profile of QI-III Aquifer along with NE– SW line
3
Pliocene aquifer (40-80 m deep for the Upper Pliocene and 50-100 m for the Lower Pliocene): A lot of big industrial wells are located in this aquifer with capacity over 245,000 m3/day.
Figure 2. The exploitation rate with time
Most of wells in HCMC are in the Pleistocene aquifer and Pliocene aquifers (99.9% total number of surveyed wells). These wells are mainly located in the inner districts and some suburban districts. Fig 2 shows that the groundwater exploitation rate has increased with time which is appropriate to the increase of number of wells.
(2) Water Table Monitoring
There are two monitoring networks in HCMC: National one and local one which included 88 monitoring stations, including 3 wells in the Holocene aquifer, 37 wells in the Pliocene Aquifer, 31 wells in the upper Pliocene and 14 wells in the lower Pliocene aquifer. The monitoring results of water table from the data of national and local monitoring stations were shown in the following section.
The Pleistocene aquifer (QI-III)
The average static water table is in the range of 6.79-24.98 m. In general, the static water table is shallow and changing with season and tide. This aquifer has been used mostly for irrigation.
-200
-150
-100
-50
0
50
100
12/9
3
6/94
12/9
4
6/95
12/9
5
6/96
12/9
6
6/97
12/9
7
6/98
12/9
8
6/99
12/9
9
6/00
12/0
0
6/01
12/0
1
6/02
12/0
2
06/0
3
12/0
3
Month/Year
Attit
ue o
f wat
er ta
ble
(cm
)
Water table at Q00202C Linear (Water table at Q00202C)
Figure 3. Change of water table with time at monitoring station Q00202C (Cu Chi)
Along with North-west to South-east and from West to East, the water table was close to the ground surface and tends to lower gradually and the biggest descent occurred at 05A (Phu Tho, District 11). In comparison of the water table in April 2001, the one in April-2003 was significantly lowered. The water table tended to lower gradually, 22cm/year in 2002-2003.
-15.0
-10.0
-5.0
0.0
5.0
10.0
15.0
Q01302F Q804020 01A 02C Q011020 04T 05A 06C
Well monitoring station
Alti
tude
of w
ater
tabl
e (m
)
Ground surface 15-04-01 14-10-03 15-04-03
Figure 4. Water table profile of QI-III aquifer along with NE– SW line
-15.0
-10.0
-5.0
0.0
5.0
10.0
Q808020 08A 05A 11A Q040020
Well monitoring station
Altit
ude
of w
ater
tabl
e (m
)
Ground surface 15-04-01 14-10-03 15-04-03
Figure 5. Water table profile of QI-III aquifer along with West - East line
0100200300400
500600700800900
< 1950 1960 1996 1998 2004 2010 year
1000
m3 /d
ay Sustainable abstraction capacity
3
Pliocene aquifer (40-80 m deep for the Upper Pliocene and 50-100 m for the Lower Pliocene): A lot of big industrial wells are located in this aquifer with capacity over 245,000 m3/day.
Figure 2. The exploitation rate with time
Most of wells in HCMC are in the Pleistocene aquifer and Pliocene aquifers (99.9% total number of surveyed wells). These wells are mainly located in the inner districts and some suburban districts. Fig 2 shows that the groundwater exploitation rate has increased with time which is appropriate to the increase of number of wells.
(2) Water Table Monitoring
There are two monitoring networks in HCMC: National one and local one which included 88 monitoring stations, including 3 wells in the Holocene aquifer, 37 wells in the Pliocene Aquifer, 31 wells in the upper Pliocene and 14 wells in the lower Pliocene aquifer. The monitoring results of water table from the data of national and local monitoring stations were shown in the following section.
The Pleistocene aquifer (QI-III)
The average static water table is in the range of 6.79-24.98 m. In general, the static water table is shallow and changing with season and tide. This aquifer has been used mostly for irrigation.
-200
-150
-100
-50
0
50
100
12/9
3
6/94
12/9
4
6/95
12/9
5
6/96
12/9
6
6/97
12/9
7
6/98
12/9
8
6/99
12/9
9
6/00
12/0
0
6/01
12/0
1
6/02
12/0
2
06/0
3
12/0
3
Month/Year
Attit
ue o
f wat
er ta
ble
(cm
)
Water table at Q00202C Linear (Water table at Q00202C)
Figure 3. Change of water table with time at monitoring station Q00202C (Cu Chi)
Along with North-west to South-east and from West to East, the water table was close to the ground surface and tends to lower gradually and the biggest descent occurred at 05A (Phu Tho, District 11). In comparison of the water table in April 2001, the one in April-2003 was significantly lowered. The water table tended to lower gradually, 22cm/year in 2002-2003.
-15.0
-10.0
-5.0
0.0
5.0
10.0
15.0
Q01302F Q804020 01A 02C Q011020 04T 05A 06C
Well monitoring station
Alti
tude
of w
ater
tabl
e (m
)
Ground surface 15-04-01 14-10-03 15-04-03
Figure 4. Water table profile of QI-III aquifer along with NE– SW line
-15.0
-10.0
-5.0
0.0
5.0
10.0
Q808020 08A 05A 11A Q040020
Well monitoring stationAl
titud
e o
f wat
er ta
ble
(m)
Ground surface 15-04-01 14-10-03 15-04-03
Figure 5. Water table profile of QI-III aquifer along with West - East line
0100200300400
500600700800900
< 1950 1960 1996 1998 2004 2010 year
1000
m3 /d
ay Sustainable abstraction capacity
3
Pliocene aquifer (40-80 m deep for the Upper Pliocene and 50-100 m for the Lower Pliocene): A lot of big industrial wells are located in this aquifer with capacity over 245,000 m3/day.
Figure 2. The exploitation rate with time
Most of wells in HCMC are in the Pleistocene aquifer and Pliocene aquifers (99.9% total number of surveyed wells). These wells are mainly located in the inner districts and some suburban districts. Fig 2 shows that the groundwater exploitation rate has increased with time which is appropriate to the increase of number of wells.
(2) Water Table Monitoring
There are two monitoring networks in HCMC: National one and local one which included 88 monitoring stations, including 3 wells in the Holocene aquifer, 37 wells in the Pliocene Aquifer, 31 wells in the upper Pliocene and 14 wells in the lower Pliocene aquifer. The monitoring results of water table from the data of national and local monitoring stations were shown in the following section.
The Pleistocene aquifer (QI-III)
The average static water table is in the range of 6.79-24.98 m. In general, the static water table is shallow and changing with season and tide. This aquifer has been used mostly for irrigation.
-200
-150
-100
-50
0
50
100
12/9
3
6/94
12/9
4
6/95
12/9
5
6/96
12/9
6
6/97
12/9
7
6/98
12/9
8
6/99
12/9
9
6/00
12/0
0
6/01
12/0
1
6/02
12/0
2
06/0
3
12/0
3
Month/Year
Attit
ue o
f wat
er ta
ble
(cm
)
Water table at Q00202C Linear (Water table at Q00202C)
Figure 3. Change of water table with time at monitoring station Q00202C (Cu Chi)
Along with North-west to South-east and from West to East, the water table was close to the ground surface and tends to lower gradually and the biggest descent occurred at 05A (Phu Tho, District 11). In comparison of the water table in April 2001, the one in April-2003 was significantly lowered. The water table tended to lower gradually, 22cm/year in 2002-2003.
-15.0
-10.0
-5.0
0.0
5.0
10.0
15.0
Q01302F Q804020 01A 02C Q011020 04T 05A 06C
Well monitoring station
Alti
tude
of w
ater
tabl
e (m
)
Ground surface 15-04-01 14-10-03 15-04-03
Figure 4. Water table profile of QI-III aquifer along with NE– SW line
-15.0
-10.0
-5.0
0.0
5.0
10.0
Q808020 08A 05A 11A Q040020
Well monitoring station
Altit
ude
of w
ater
tabl
e (m
)
Ground surface 15-04-01 14-10-03 15-04-03
Figure 5. Water table profile of QI-III aquifer along with West - East line
0100200300400
500600700800900
< 1950 1960 1996 1998 2004 2010 year
1000
m3 /d
ay Sustainable abstraction capacity
Figure 2. The Exploitation Rate with Time
3
Pliocene aquifer (40-80 m deep for the Upper Pliocene and 50-100 m for the Lower Pliocene): A lot of big industrial wells are located in this aquifer with capacity over 245,000 m3/day.
Figure 2. The exploitation rate with time
Most of wells in HCMC are in the Pleistocene aquifer and Pliocene aquifers (99.9% total number of surveyed wells). These wells are mainly located in the inner districts and some suburban districts. Fig 2 shows that the groundwater exploitation rate has increased with time which is appropriate to the increase of number of wells.
(2) Water Table Monitoring
There are two monitoring networks in HCMC: National one and local one which included 88 monitoring stations, including 3 wells in the Holocene aquifer, 37 wells in the Pliocene Aquifer, 31 wells in the upper Pliocene and 14 wells in the lower Pliocene aquifer. The monitoring results of water table from the data of national and local monitoring stations were shown in the following section.
The Pleistocene aquifer (QI-III)
The average static water table is in the range of 6.79-24.98 m. In general, the static water table is shallow and changing with season and tide. This aquifer has been used mostly for irrigation.
-200
-150
-100
-50
0
50
100
12/9
3
6/94
12/9
4
6/95
12/9
5
6/96
12/9
6
6/97
12/9
7
6/98
12/9
8
6/99
12/9
9
6/00
12/0
0
6/01
12/0
1
6/02
12/0
2
06/0
3
12/0
3
Month/Year
Atti
tue
of w
ater
tabl
e (c
m)
Water table at Q00202C Linear (Water table at Q00202C)
Figure 3. Change of water table with time at monitoring station Q00202C (Cu Chi)
Along with North-west to South-east and from West to East, the water table was close to the ground surface and tends to lower gradually and the biggest descent occurred at 05A (Phu Tho, District 11). In comparison of the water table in April 2001, the one in April-2003 was significantly lowered. The water table tended to lower gradually, 22cm/year in 2002-2003.
-15.0
-10.0
-5.0
0.0
5.0
10.0
15.0
Q01302F Q804020 01A 02C Q011020 04T 05A 06C
Well monitoring station
Alti
tude
of w
ater
tabl
e (m
)
Ground surface 15-04-01 14-10-03 15-04-03
Figure 4. Water table profile of QI-III aquifer along with NE– SW line
-15.0
-10.0
-5.0
0.0
5.0
10.0
Q808020 08A 05A 11A Q040020
Well monitoring station
Alti
tude
of w
ater
tabl
e (m
)
Ground surface 15-04-01 14-10-03 15-04-03
Figure 5. Water table profile of QI-III aquifer along with West - East line
0100200300400
500600700800900
< 1950 1960 1996 1998 2004 2010 year
1000
m3 /d
ay Sustainable abstraction capacity
Figure 3. Change of Water Table with Time at Monitoring Station Q00202C (Cu Chi)
Figure 5. Water Table Profile of QI-III Aquifer Along with West - East line
4
The upper Pliocene aquifer (N2b)
The average depth of static water table is 21.2-27.7 m and 27.7 m. The result of water table monitoring during 1994 – 2003 in this aquifer shows that at the stations Q007, Q015030 (Binh Chanh); Q011340, Q017030, Q004 (Hoc Mon, district 12) the water table descended annually at the average of 0.11- 1.95 m deep. This fast descent of water table is due to excess groundwater exploitation and the water recharge in this aquifer mainly comes from rain water (see fig. 6).
-2400
-1900
-1400
-900
-400
4/94
10/9
4
4/95
10/9
5
4/96
10/9
6
4/97
10/9
7
4/98
10/9
8
4/99
10/9
9
4/00
10/0
0
4/01
10/0
1
4/02
10/0
2
04/0
3
10/0
3
Month/Year
Atti
tute
of w
ater
tabl
e (c
m)
water table at Q015030 Linear (water table at Q015030)
Figure 6. Change of the water table with time at the Q015030 (Binh Chanh)
Along the direction from North-west to South-east and from the West to the East, the water table changed slowly in Cu Chi, Hoc Mon and had tendency of descent as to the City Center.
-40
-30
-20
-10
0
10
20
Q80404
T01
B02T
Q0113
40
Q01934
005B 04
C06D
Monitoring stations
Attit
ute
of w
ater
tabl
e (m
)
G round surface 15-04-01 15-04-03 15-10-03
Figure 7. Graph of water table with NW – SE (Layer N2b)
-30-25-20-15-10-505
10
Q003340 Q007030 05B 11B Q014340Well monitoring station
Alti
tude
of w
ater
tabl
e (m
)
15-04-01 15-04-03 14-10-03 Ground surface
Figure 8. Graph of water table with W – E (Layer N2b)
The lower Pliocene aquifer (N2a)
In general, the static water table of this aquifer is similar to that of the upper Pliocene (N2b). The
monitoring data from 1994-2003 shows that the water table descended annually at the average depth of 0.3 m and 1.4 m at Station Q011040 (Hoc Mon) and Q80404Z (Cu Chi), respectively. It may be due to excess groundwater exploitation (see Fig 9).
-1800-1600-1400-1200-1000
-800-600-400-200
0200
1/91
7/91
1/92
7/92
1/93
7/93
1/94
7/94
1/95
7/95
1/96
7/96
1/97
7/97
1/98
7/98
1/99
7/99
1/00
7/00
1/01
7/01
1/02
7/02
01/0
307
/03
Month/Year
Attit
ute
of w
ater
tabl
e (c
m)
Water table at Q011040 Linear (Water table at Q011040)
Figure 9. Change of the water table at the Q011040 well monitoring station
Figure 6. Change of the Water Table with Time at the Q015030 (Binh Chanh)
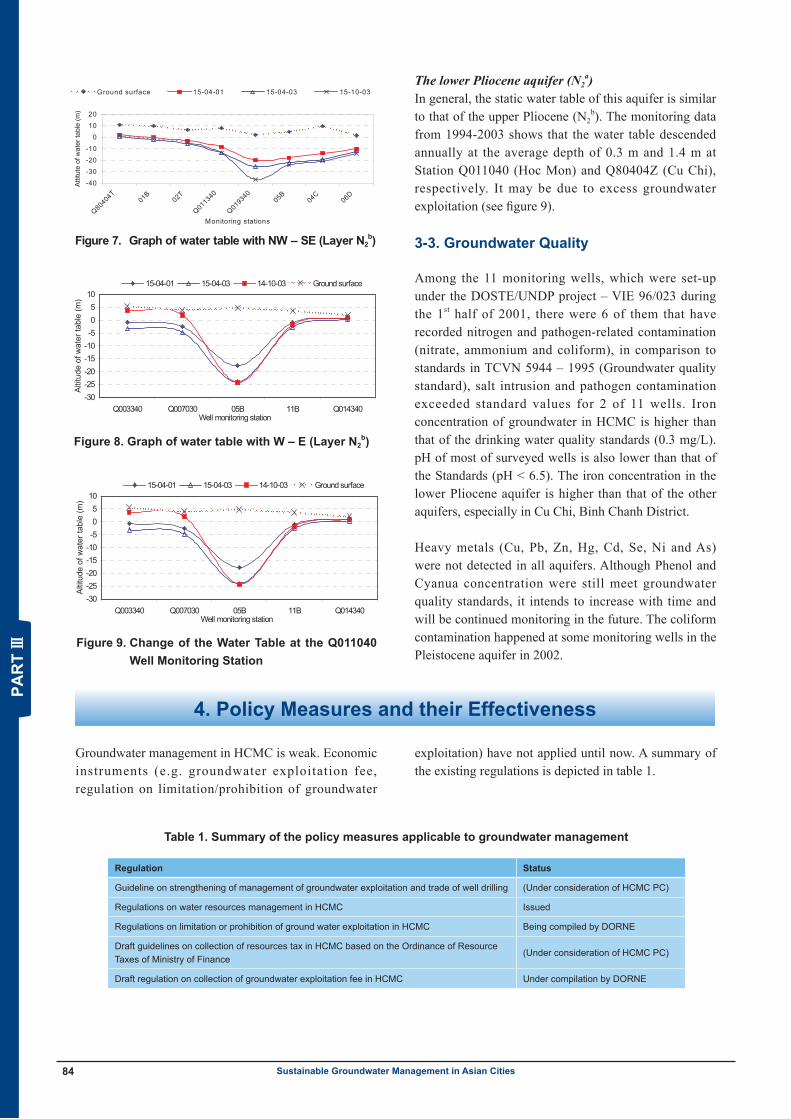
Summary report of Sustainable Groundwater Management in Asia84 Sustainable Groundwater Management in Asian Cities
The lower Pliocene aquifer (N2a)
In general, the static water table of this aquifer is similar to that of the upper Pliocene (N2
b). The monitoring data from 1994-2003 shows that the water table descended annually at the average depth of 0.3 m and 1.4 m at Station Q011040 (Hoc Mon) and Q80404Z (Cu Chi), respectively. It may be due to excess groundwater exploitation (see figure 9).
3-3. Groundwater Quality
Among the 11 monitoring wells, which were set-up under the DOSTE/UNDP project – VIE 96/023 during the 1st half of 2001, there were 6 of them that have recorded nitrogen and pathogen-related contamination (nitrate, ammonium and coliform), in comparison to standards in TCVN 5944 – 1995 (Groundwater quality standard), salt intrusion and pathogen contamination exceeded standard values for 2 of 11 wells. Iron concentration of groundwater in HCMC is higher than that of the drinking water quality standards (0.3 mg/L). pH of most of surveyed wells is also lower than that of the Standards (pH < 6.5). The iron concentration in the lower Pliocene aquifer is higher than that of the other aquifers, especially in Cu Chi, Binh Chanh District.
Heavy metals (Cu, Pb, Zn, Hg, Cd, Se, Ni and As) were not detected in all aquifers. Although Phenol and Cyanua concentration were still meet groundwater quality standards, it intends to increase with time and will be continued monitoring in the future. The coliform contamination happened at some monitoring wells in the Pleistocene aquifer in 2002.
4. Policy Measures and their Effectiveness
4
The upper Pliocene aquifer (N2b)
The average depth of static water table is 21.2-27.7 m and 27.7 m. The result of water table monitoring during 1994 – 2003 in this aquifer shows that at the stations Q007, Q015030 (Binh Chanh); Q011340, Q017030, Q004 (Hoc Mon, district 12) the water table descended annually at the average of 0.11- 1.95 m deep. This fast descent of water table is due to excess groundwater exploitation and the water recharge in this aquifer mainly comes from rain water (see fig. 6).
-2400
-1900
-1400
-900
-400
4/94
10/9
4
4/95
10/9
5
4/96
10/9
6
4/97
10/9
7
4/98
10/9
8
4/99
10/9
9
4/00
10/0
0
4/01
10/0
1
4/02
10/0
2
04/0
3
10/0
3
Month/Year
Atti
tute
of w
ater
tabl
e (c
m)
water table at Q015030 Linear (water table at Q015030)
Figure 6. Change of the water table with time at the Q015030 (Binh Chanh)
Along the direction from North-west to South-east and from the West to the East, the water table changed slowly in Cu Chi, Hoc Mon and had tendency of descent as to the City Center.
-40
-30
-20
-10
0
10
20
Q80404
T01
B02T
Q0113
40
Q01934
005B 04
C06D
Monitoring stations
Attit
ute
of w
ater
tabl
e (m
)
G round surface 15-04-01 15-04-03 15-10-03
Figure 7. Graph of water table with NW – SE (Layer N2b)
-30-25-20-15-10-505
10
Q003340 Q007030 05B 11B Q014340Well monitoring station
Alti
tude
of w
ater
tabl
e (m
)
15-04-01 15-04-03 14-10-03 Ground surface
Figure 8. Graph of water table with W – E (Layer N2b)
The lower Pliocene aquifer (N2a)
In general, the static water table of this aquifer is similar to that of the upper Pliocene (N2b). The
monitoring data from 1994-2003 shows that the water table descended annually at the average depth of 0.3 m and 1.4 m at Station Q011040 (Hoc Mon) and Q80404Z (Cu Chi), respectively. It may be due to excess groundwater exploitation (see Fig 9).
-1800-1600-1400-1200-1000
-800-600-400-200
0200
1/91
7/91
1/92
7/92
1/93
7/93
1/94
7/94
1/95
7/95
1/96
7/96
1/97
7/97
1/98
7/98
1/99
7/99
1/00
7/00
1/01
7/01
1/02
7/02
01/0
307
/03
Month/Year
Attit
ute
of w
ater
tabl
e (c
m)
Water table at Q011040 Linear (Water table at Q011040)
Figure 9. Change of the water table at the Q011040 well monitoring station
4
The upper Pliocene aquifer (N2b)
The average depth of static water table is 21.2-27.7 m and 27.7 m. The result of water table monitoring during 1994 – 2003 in this aquifer shows that at the stations Q007, Q015030 (Binh Chanh); Q011340, Q017030, Q004 (Hoc Mon, district 12) the water table descended annually at the average of 0.11- 1.95 m deep. This fast descent of water table is due to excess groundwater exploitation and the water recharge in this aquifer mainly comes from rain water (see fig. 6).
-2400
-1900
-1400
-900
-400
4/94
10/9
4
4/95
10/9
5
4/96
10/9
6
4/97
10/9
7
4/98
10/9
8
4/99
10/9
9
4/00
10/0
0
4/01
10/0
1
4/02
10/0
2
04/0
3
10/0
3
Month/Year
Atti
tute
of w
ater
tabl
e (c
m)
water table at Q015030 Linear (water table at Q015030)
Figure 6. Change of the water table with time at the Q015030 (Binh Chanh)
Along the direction from North-west to South-east and from the West to the East, the water table changed slowly in Cu Chi, Hoc Mon and had tendency of descent as to the City Center.
-40
-30
-20
-10
0
10
20
Q80404
T01
B02T
Q0113
40
Q01934
005B 04
C06D
Monitoring stations
Attit
ute
of w
ater
tabl
e (m
)
G round surface 15-04-01 15-04-03 15-10-03
Figure 7. Graph of water table with NW – SE (Layer N2b)
-30-25-20-15-10-505
10
Q003340 Q007030 05B 11B Q014340Well monitoring station
Alti
tude
of w
ater
tabl
e (m
)
15-04-01 15-04-03 14-10-03 Ground surface
Figure 8. Graph of water table with W – E (Layer N2b)
The lower Pliocene aquifer (N2a)
In general, the static water table of this aquifer is similar to that of the upper Pliocene (N2b). The
monitoring data from 1994-2003 shows that the water table descended annually at the average depth of 0.3 m and 1.4 m at Station Q011040 (Hoc Mon) and Q80404Z (Cu Chi), respectively. It may be due to excess groundwater exploitation (see Fig 9).
-1800-1600-1400-1200-1000
-800-600-400-200
0200
1/91
7/91
1/92
7/92
1/93
7/93
1/94
7/94
1/95
7/95
1/96
7/96
1/97
7/97
1/98
7/98
1/99
7/99
1/00
7/00
1/01
7/01
1/02
7/02
01/0
307
/03
Month/Year
Attit
ute
of w
ater
tabl
e (c
m)
Water table at Q011040 Linear (Water table at Q011040)
Figure 9. Change of the water table at the Q011040 well monitoring station
Groundwater management in HCMC is weak. Economic instruments (e.g. groundwater exploitation fee, regulation on limitation/prohibition of groundwater
exploitation) have not applied until now. A summary of the existing regulations is depicted in table 1.
Regulation Status
Guideline on strengthening of management of groundwater exploitation and trade of well drilling (Under consideration of HCMC PC)
Regulations on water resources management in HCMC Issued
Regulations on limitation or prohibition of ground water exploitation in HCMC Being compiled by DORNE
Draft guidelines on collection of resources tax in HCMC based on the Ordinance of Resource Taxes of Ministry of Finance
(Under consideration of HCMC PC)
Draft regulation on collection of groundwater exploitation fee in HCMC Under compilation by DORNE
Table 1. Summary of the policy measures applicable to groundwater management
Figure 9. Change of the Water Table at the Q011040 Well Monitoring Station
Figure 7. Graph of water table with NW – SE (Layer N2b)
4
The upper Pliocene aquifer (N2b)
The average depth of static water table is 21.2-27.7 m and 27.7 m. The result of water table monitoring during 1994 – 2003 in this aquifer shows that at the stations Q007, Q015030 (Binh Chanh); Q011340, Q017030, Q004 (Hoc Mon, district 12) the water table descended annually at the average of 0.11- 1.95 m deep. This fast descent of water table is due to excess groundwater exploitation and the water recharge in this aquifer mainly comes from rain water (see fig. 6).
-2400
-1900
-1400
-900
-400
4/94
10/9
4
4/95
10/9
5
4/96
10/9
6
4/97
10/9
7
4/98
10/9
8
4/99
10/9
9
4/00
10/0
0
4/01
10/0
1
4/02
10/0
2
04/0
3
10/0
3
Month/Year
Atti
tute
of w
ater
tabl
e (c
m)
water table at Q015030 Linear (water table at Q015030)
Figure 6. Change of the water table with time at the Q015030 (Binh Chanh)
Along the direction from North-west to South-east and from the West to the East, the water table changed slowly in Cu Chi, Hoc Mon and had tendency of descent as to the City Center.
-40
-30
-20
-10
0
10
20
Q80404
T01
B02T
Q0113
40
Q01934
005B 04
C06D
Monitoring stations
Attit
ute
of w
ater
tabl
e (m
)
G round surface 15-04-01 15-04-03 15-10-03
Figure 7. Graph of water table with NW – SE (Layer N2b)
-30-25-20-15-10-505
10
Q003340 Q007030 05B 11B Q014340Well monitoring station
Alti
tude
of w
ater
tabl
e (m
)
15-04-01 15-04-03 14-10-03 Ground surface
Figure 8. Graph of water table with W – E (Layer N2b)
The lower Pliocene aquifer (N2a)
In general, the static water table of this aquifer is similar to that of the upper Pliocene (N2b). The
monitoring data from 1994-2003 shows that the water table descended annually at the average depth of 0.3 m and 1.4 m at Station Q011040 (Hoc Mon) and Q80404Z (Cu Chi), respectively. It may be due to excess groundwater exploitation (see Fig 9).
-1800-1600-1400-1200-1000
-800-600-400-200
0200
1/91
7/91
1/92
7/92
1/93
7/93
1/94
7/94
1/95
7/95
1/96
7/96
1/97
7/97
1/98
7/98
1/99
7/99
1/00
7/00
1/01
7/01
1/02
7/02
01/0
307
/03
Month/Year
Attit
ute
of w
ater
tabl
e (c
m)
Water table at Q011040 Linear (Water table at Q011040)
Figure 9. Change of the water table at the Q011040 well monitoring station
Figure 8. Graph of water table with W – E (Layer N2b)
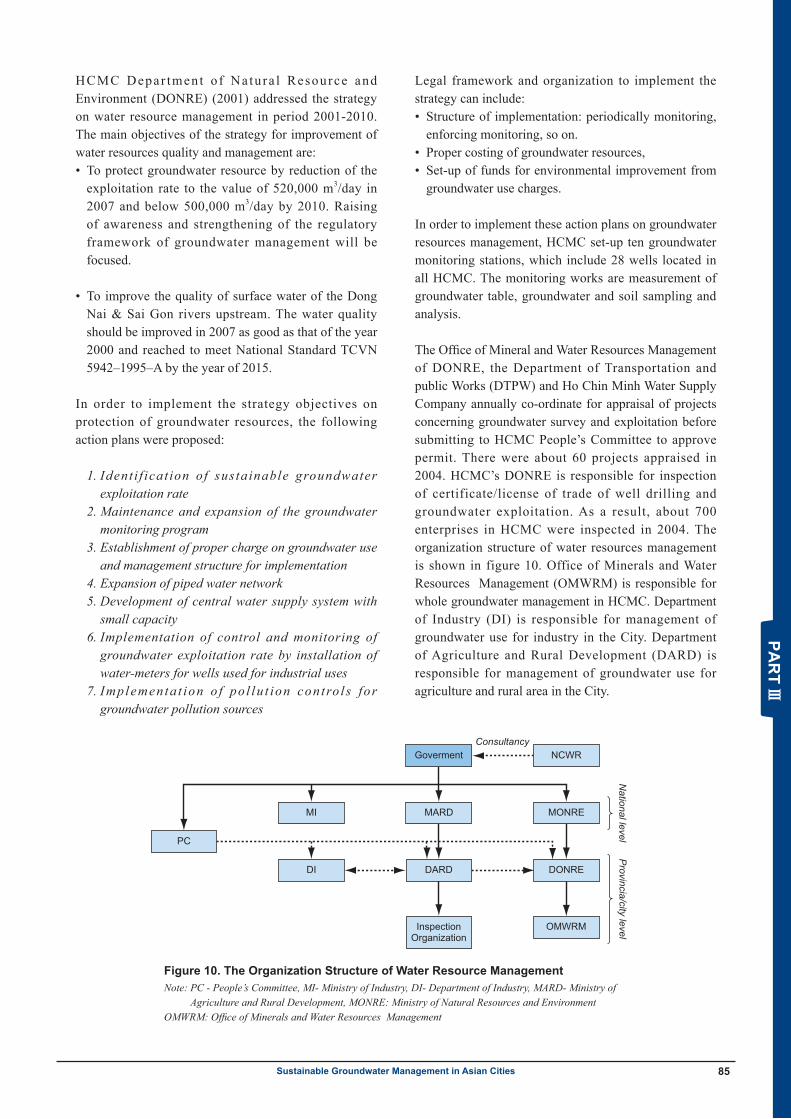
Summary report of Sustainable Groundwater Management in Asia 85Sustainable Groundwater Management in Asian Cities
HCMC Depar tment o f Na tura l Resource and Environment (DONRE) (2001) addressed the strategy on water resource management in period 2001-2010. The main objectives of the strategy for improvement of water resources quality and management are:• To protect groundwater resource by reduction of the
exploitation rate to the value of 520,000 m3/day in 2007 and below 500,000 m3/day by 2010. Raising of awareness and strengthening of the regulatory framework of groundwater management will be focused.
• To improve the quality of surface water of the Dong Nai & Sai Gon rivers upstream. The water quality should be improved in 2007 as good as that of the year 2000 and reached to meet National Standard TCVN 5942–1995–A by the year of 2015.
In order to implement the strategy objectives on protection of groundwater resources, the following action plans were proposed:
1. Ident i f icat ion of sustainable groundwater exploitation rate
2. Maintenance and expansion of the groundwater monitoring program
3. Establishment of proper charge on groundwater use and management structure for implementation
4. Expansion of piped water network 5. Development of central water supply system with
small capacity 6. Implementation of control and monitoring of
groundwater exploitation rate by installation of water-meters for wells used for industrial uses
7. Implementa t ion o f po l lu t ion con tro l s for groundwater pollution sources
Legal framework and organization to implement the strategy can include:• Structure of implementation: periodically monitoring,
enforcing monitoring, so on. • Proper costing of groundwater resources, • Set-up of funds for environmental improvement from
groundwater use charges.
In order to implement these action plans on groundwater resources management, HCMC set-up ten groundwater monitoring stations, which include 28 wells located in all HCMC. The monitoring works are measurement of groundwater table, groundwater and soil sampling and analysis.
The Office of Mineral and Water Resources Management of DONRE, the Department of Transportation and public Works (DTPW) and Ho Chin Minh Water Supply Company annually co-ordinate for appraisal of projects concerning groundwater survey and exploitation before submitting to HCMC People’s Committee to approve permit. There were about 60 projects appraised in 2004. HCMC’s DONRE is responsible for inspection of certificate/license of trade of well drilling and groundwater exploitation. As a result, about 700 enterprises in HCMC were inspected in 2004. The organization structure of water resources management is shown in figure 10. Office of Minerals and Water Resources Management (OMWRM) is responsible for whole groundwater management in HCMC. Department of Industry (DI) is responsible for management of groundwater use for industry in the City. Department of Agriculture and Rural Development (DARD) is responsible for management of groundwater use for agriculture and rural area in the City.
Consultancy
National level
Provincia/city level
Goverment
MI
DI
PC
NCWR
MONRE
DONRE
OMWRM
MARD
DARD
InspectionOrganization
Figure 10. The Organization Structure of Water Resource ManagementNote: PC - People’s Committee, MI- Ministry of Industry, DI- Department of Industry, MARD- Ministry of
Agriculture and Rural Development, MONRE: Ministry of Natural Resources and EnvironmentOMWRM: Office of Minerals and Water Resources Management
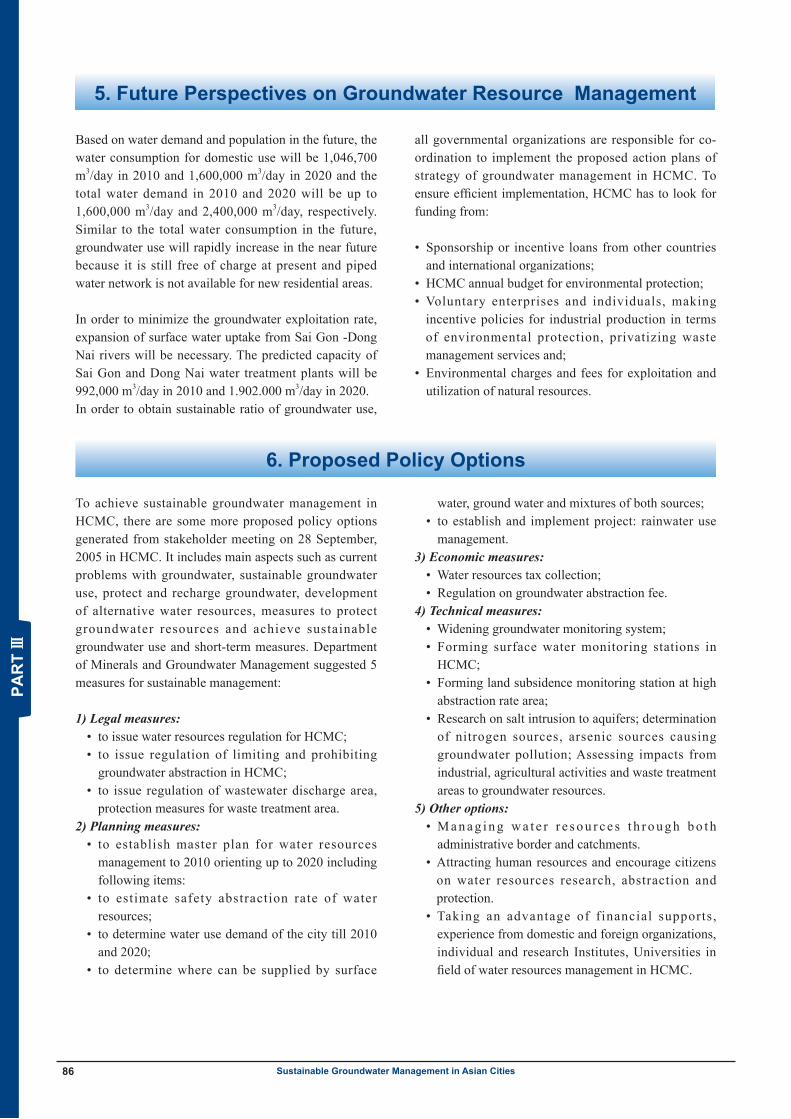
Summary report of Sustainable Groundwater Management in Asia86 Sustainable Groundwater Management in Asian Cities
Based on water demand and population in the future, the water consumption for domestic use will be 1,046,700 m3/day in 2010 and 1,600,000 m3/day in 2020 and the total water demand in 2010 and 2020 will be up to 1,600,000 m3/day and 2,400,000 m3/day, respectively. Similar to the total water consumption in the future, groundwater use will rapidly increase in the near future because it is still free of charge at present and piped water network is not available for new residential areas.
In order to minimize the groundwater exploitation rate, expansion of surface water uptake from Sai Gon -Dong Nai rivers will be necessary. The predicted capacity of Sai Gon and Dong Nai water treatment plants will be 992,000 m3/day in 2010 and 1.902.000 m3/day in 2020. In order to obtain sustainable ratio of groundwater use,
all governmental organizations are responsible for co-ordination to implement the proposed action plans of strategy of groundwater management in HCMC. To ensure efficient implementation, HCMC has to look for funding from:
• Sponsorship or incentive loans from other countries and international organizations;
• HCMC annual budget for environmental protection;• Voluntary enterprises and individuals, making
incentive policies for industrial production in terms of environmental protection, privatizing waste management services and;
• Environmental charges and fees for exploitation and utilization of natural resources.
5. Future Perspectives on Groundwater Resource Management
6. Proposed Policy Options
To achieve sustainable groundwater management in HCMC, there are some more proposed policy options generated from stakeholder meeting on 28 September, 2005 in HCMC. It includes main aspects such as current problems with groundwater, sustainable groundwater use, protect and recharge groundwater, development of alternative water resources, measures to protect groundwater resources and achieve sustainable groundwater use and short-term measures. Department of Minerals and Groundwater Management suggested 5 measures for sustainable management:
1) Legal measures:• to issue water resources regulation for HCMC;• to issue regulation of limiting and prohibiting
groundwater abstraction in HCMC;• to issue regulation of wastewater discharge area,
protection measures for waste treatment area.2) Planning measures:
• to establish master plan for water resources management to 2010 orienting up to 2020 including following items:
• to estimate safety abstraction rate of water resources;
• to determine water use demand of the city till 2010 and 2020;
• to determine where can be supplied by surface
water, ground water and mixtures of both sources;• to establish and implement project: rainwater use
management.3) Economic measures:
• Water resources tax collection;• Regulation on groundwater abstraction fee.
4) Technical measures:• Widening groundwater monitoring system;• Forming surface water monitoring stations in
HCMC;• Forming land subsidence monitoring station at high
abstraction rate area;• Research on salt intrusion to aquifers; determination
of nitrogen sources, arsenic sources causing groundwater pollution; Assessing impacts from industrial, agricultural activities and waste treatment areas to groundwater resources.
5) Other options:• M a n a g i n g w a t e r r e s o u r c e s t h r o u g h b o t h
administrative border and catchments.• Attracting human resources and encourage citizens
on water resources research, abstraction and protection.
• Taking an advantage of financial supports, experience from domestic and foreign organizations, individual and research Institutes, Universities in field of water resources management in HCMC.
Summary report of Sustainable Groundwater Management in Asia 87Sustainable Groundwater Management in Asian Cities
HCMC environmental management strategies up to the year 2010, approved by HCMC People’s Committee in 2001, mentioned the following points as urgent issues of water resource management of the city:
• Overexploitation of groundwater which has limited reserve
• The surface water source of Sai Gon and Dong Nai rivers becomes gradually polluted
• The close relationship between surface water and ground water in water exploitation and water recharging balance.
The main objective is groundwater management is preservation of the resources through reasonable exploitation and use. To attain the objective, it is planned that the abstraction volume should be controled less than 500,000 m3/day, which can minimize the bad impacts on ground water such as:
• Ground water contamination• Salt destruction• Drawdown of ground water level• Land subsidence
Now the groundwater abstraction rate met the sustainable groundwater level so it is the time for both technical and managerial options taken. The appropriate groundwater resources law should be established for easy management.
To achieve sustainable groundwater management, it should be involved the roles of HCMC People’s committee, responsible state organizations, institutes/university, industries and public community.
References
Binnie Black & Veatch. 2002. Feasibility Study on Sanitation and Urban Upgrading of Tan Hoa – Lo Gom Canal Basin, Work Bank, 2002.
Chan, N.D. 2004. Set-up of ground water flow modeling to assess potential water reserve and determination of artificial recharge to the Upper Pliocene in HCMC. Master Thesis – HCMC University of Technology, 2004.
Department of Science, Technology and Environment (DOSTE). 2001a. The reports of environmental monitoring program under DOSTE/UNDP project – VIE 96/023, 2001, HCMC.
-----. 2001b. Strategy on water resource management of HCMC. In the report of Strategy on Environmental Management in HCMC, 2001.
Ho Chi Minh City People’s Committee (HCMPC). 2000. Master plan of sewerage of HCMC till 2020, 2000.
-----. 2005. Economy of HCMC, 30 Years of Construction and Development (1975-2005), 2005.
Institute for Hyrometeorology in the South of Viet Nam (HIS). 2003. Annual Monitoring Report.
Institute of Tropical Technology and Environmental Protection (ITTIP). 2000. Survey of industrial pollution in HCMC and proposal of management measures to mitigate polltion.
Nga, N.V. 2004. Report of situation of inspection of groundwater exploitation in HCMC. Office of Minerals and Water Resources Management-DONRE, 2004.
Statistical Office of Ho Chi Minh City (SO) (2004). Statistical Yearbooks from 1999-2004.
Union for Geology and Hydrology in the South (UGHS). 2001. Groundwater use and planning in Ho Chi Minh City. HCMC Department of Industry, 2001.
Viet, P and Lien, D.H. 2004. Regulation and Laws on Water Resource Use and Management. National Political editor, Hanoi, 2004.
Vietnam Water Supply and Environment Company (VIWASE). 2004. Master Plan for Water Supply System of HCMC and Development Trend to the year 2030.
Conclusion
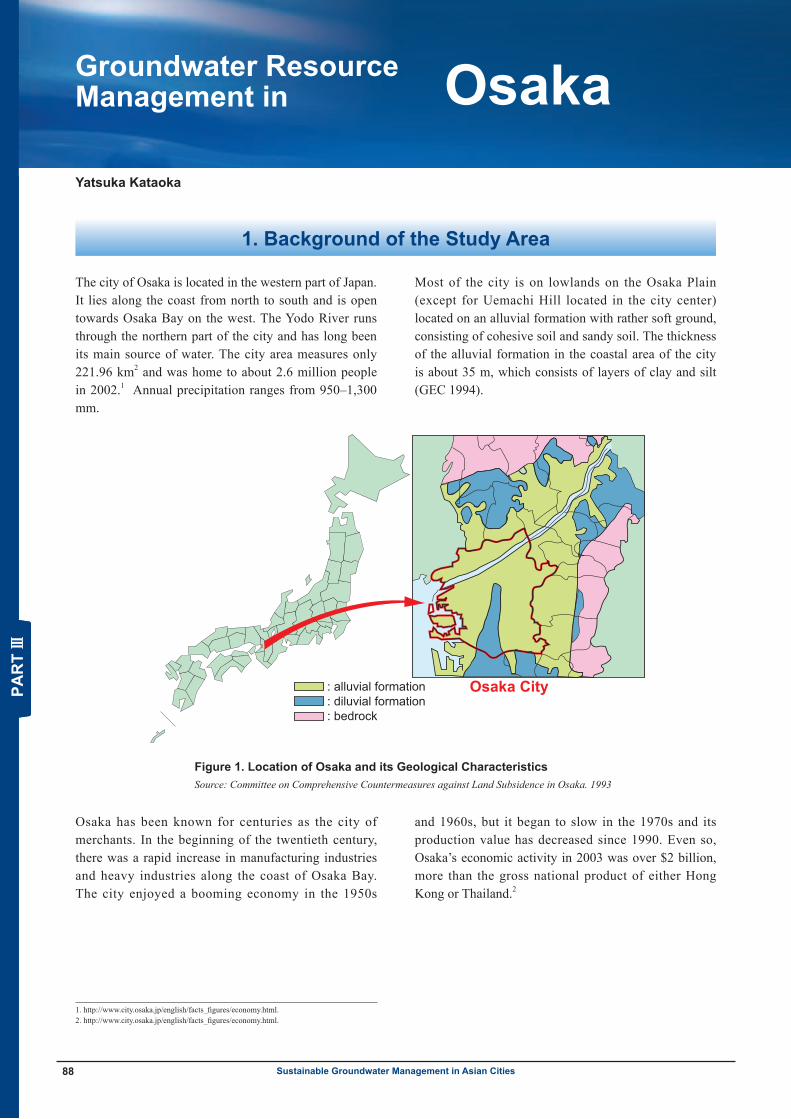
Summary report of Sustainable Groundwater Management in Asia88 Sustainable Groundwater Management in Asian Cities
Osaka has been known for centuries as the city of merchants. In the beginning of the twentieth century, there was a rapid increase in manufacturing industries and heavy industries along the coast of Osaka Bay. The city enjoyed a booming economy in the 1950s
and 1960s, but it began to slow in the 1970s and its production value has decreased since 1990. Even so, Osaka’s economic activity in 2003 was over $2 billion, more than the gross national product of either Hong Kong or Thailand.2
The city of Osaka is located in the western part of Japan. It lies along the coast from north to south and is open towards Osaka Bay on the west. The Yodo River runs through the northern part of the city and has long been its main source of water. The city area measures only 221.96 km2 and was home to about 2.6 million people in 2002.1 Annual precipitation ranges from 950–1,300 mm.
Most of the city is on lowlands on the Osaka Plain (except for Uemachi Hill located in the city center) located on an alluvial formation with rather soft ground, consisting of cohesive soil and sandy soil. The thickness of the alluvial formation in the coastal area of the city is about 35 m, which consists of layers of clay and silt (GEC 1994).
Groundwater ResourceManagement in Osaka
Summary report of Sustainable Groundwater Management in Asia
1. Background of the Study Area
Figure 1. Location of Osaka and its Geological CharacteristicsSource: Committee on Comprehensive Countermeasures against Land Subsidence in Osaka. 1993
Yatsuka Kataoka
: alluvial formation : diluvial formation : bedrock
Osaka City
1. http://www.city.osaka.jp/english/facts_figures/economy.html.2. http://www.city.osaka.jp/english/facts_figures/economy.html.
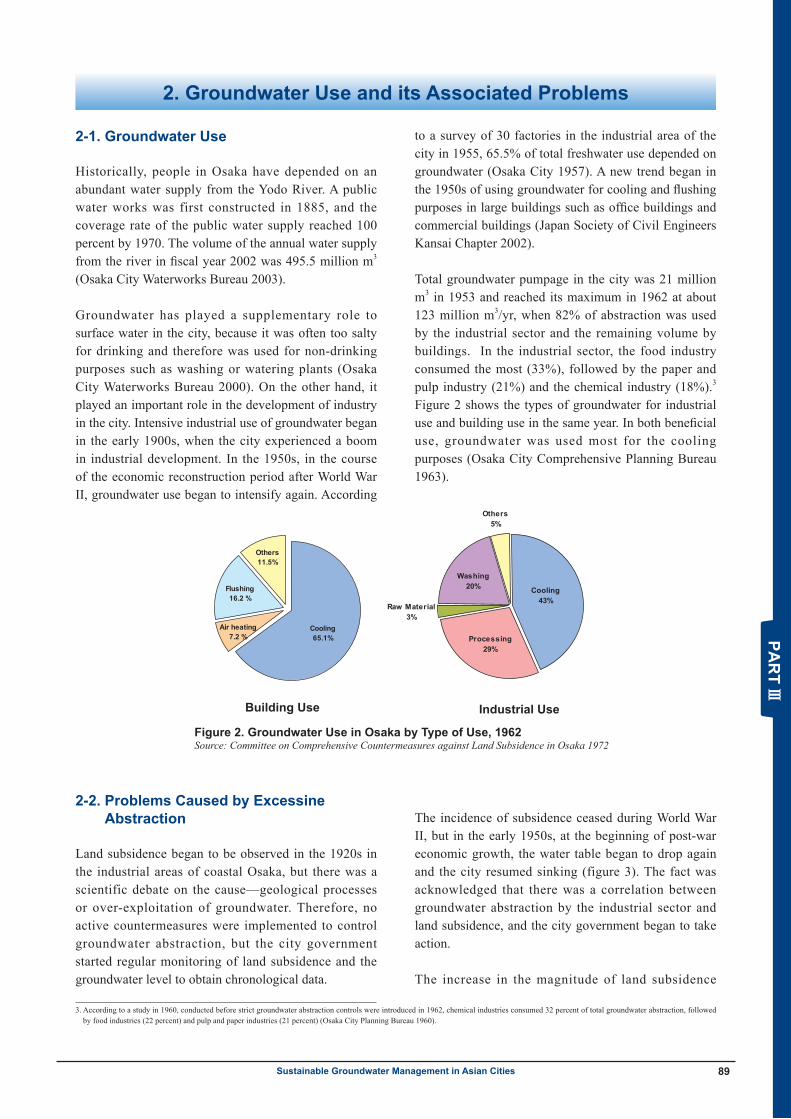
Summary report of Sustainable Groundwater Management in Asia 89Sustainable Groundwater Management in Asian Cities
2. Groundwater Use and its Associated Problems
2-1. Groundwater Use
Historically, people in Osaka have depended on an abundant water supply from the Yodo River. A public water works was first constructed in 1885, and the coverage rate of the public water supply reached 100 percent by 1970. The volume of the annual water supply from the river in fiscal year 2002 was 495.5 million m3 (Osaka City Waterworks Bureau 2003).
Groundwater has played a supplementary role to surface water in the city, because it was often too salty for drinking and therefore was used for non-drinking purposes such as washing or watering plants (Osaka City Waterworks Bureau 2000). On the other hand, it played an important role in the development of industry in the city. Intensive industrial use of groundwater began in the early 1900s, when the city experienced a boom in industrial development. In the 1950s, in the course of the economic reconstruction period after World War II, groundwater use began to intensify again. According
to a survey of 30 factories in the industrial area of the city in 1955, 65.5% of total freshwater use depended on groundwater (Osaka City 1957). A new trend began in the 1950s of using groundwater for cooling and flushing purposes in large buildings such as office buildings and commercial buildings (Japan Society of Civil Engineers Kansai Chapter 2002).
Total groundwater pumpage in the city was 21 million m3 in 1953 and reached its maximum in 1962 at about 123 million m3/yr, when 82% of abstraction was used by the industrial sector and the remaining volume by buildings. In the industrial sector, the food industry consumed the most (33%), followed by the paper and pulp industry (21%) and the chemical industry (18%).3 Figure 2 shows the types of groundwater for industrial use and building use in the same year. In both beneficial use, groundwater was used most for the cooling purposes (Osaka City Comprehensive Planning Bureau 1963).
2-2. Problems Caused by Excessine Abstraction
Land subsidence began to be observed in the 1920s in the industrial areas of coastal Osaka, but there was a scientific debate on the cause—geological processes or over-exploitation of groundwater. Therefore, no active countermeasures were implemented to control groundwater abstraction, but the city government started regular monitoring of land subsidence and the groundwater level to obtain chronological data.
The incidence of subsidence ceased during World War II, but in the early 1950s, at the beginning of post-war economic growth, the water table began to drop again and the city resumed sinking (figure 3). The fact was acknowledged that there was a correlation between groundwater abstraction by the industrial sector and land subsidence, and the city government began to take action.
The increase in the magnitude of land subsidence
Figure 2. Groundwater Use in Osaka by Type of Use, 1962Source: Committee on Comprehensive Countermeasures against Land Subsidence in Osaka 1972
3. According to a study in 1960, conducted before strict groundwater abstraction controls were introduced in 1962, chemical industries consumed 32 percent of total groundwater abstraction, followed by food industries (22 percent) and pulp and paper industries (21 percent) (Osaka City Planning Bureau 1960).
Building Use Industrial Use
Cooling65.1%
Air heating7.2 %
Others11.5%
Flushing16.2 %
Raw Material3%
Others5%
Cooling43%
Washing20%
Processing29%

Summary report of Sustainable Groundwater Management in Asia90 Sustainable Groundwater Management in Asian Cities
resulted in various hindrances to the development of the city. As the land base sank, the height of dykes became lower and they lost their ability to protect the city from flooding. This resulted in a worsening of the negative impacts of flooding, especially during typhoons. The city had to spend about $2.5 billion (in 2000 prices) between 1955 and 1969 to reinforce dykes, raise bridges, and develop a drainage system (Committee on Comprehensive Countermeasures against Land Subsidence in Osaka 1972). Industries also had to invest in reconstruction and build their own dykes to protect themselves from flooding. Even so, damage to city infrastructure such as bridges and railway stations intensified. Such tangible evidence of the damage caused by land subsidence raised public awareness of the problem.
3. Policy Responses
Vol. 6, No. 2 Sustainable Groundwater Management in Asian Cities: Lessons from Osaka 2006
3
3.3. Dropping groundwater levels and land subsidence issues
Land subsidence began to be observed in the 1920s in the industrial areas of coastal Osaka, but there was a scientific debate on the cause—geological processes or over-exploitation of groundwater. Therefore, no active countermeasures were implemented to control groundwater abstraction, but the city government started regular monitoring of land subsidence and the groundwater level to obtain chronological data.
The incidence of subsidence ceased during World War II, but in the early 1950s, at the beginning of post-war economic growth, the water table began to drop again and the city resumed sinking. The fact was acknowledged that there was a correlation between groundwater abstraction by the industrial sector and land subsidence, and the city government began to take action.
The increase in the magnitude of land subsidence resulted in various hindrances to the development of the city. As the land base sank, the height of dykes became lower and they lost their ability to protect the city from flooding. This resulted in a worsening of the negative impacts of flooding, especially during typhoons. The city had to spend about $2.5 billion (in 2000 prices) between 1955 and 1969 to reinforce dykes, raise bridges, and develop a drainage system (Committee on Comprehensive Countermeasures against Land Subsidence in Osaka 1972). Industries also had to invest in reconstruction and build their own dykes to protect themselves from flooding. Even so, damage to city infrastructure such as bridges and railway stations intensified. Such tangible evidence of the damage caused by land subsidence raised public awareness of the problem.
Source: Committee on Comprehensive Countermeasures against Land Subsidence in Osaka 1993. *In 1965 prices. Figure 3. Land subsidence and industrial output value in Osaka
**At Nishi-4 (Torishima, Konohana-ku).
Indu
stria
l out
put v
alue
(tril
lions
of y
en)*
Cum
ulat
ive
subs
iden
ce d
epth
(m)*
*
Subsidencedepth
Management measures in Osaka started to work in controlling land subsidence by reducing groundwater abstraction. As figure 4 shows, there are two lines of management according to use: (1) industries and (2) buildings. The main element of groundwater control
was regulations on abstraction, which were supported by provision of alternative water resources and financial and technical assistance to take the actions necessary to reduce groundwater use.
Vol. 6, No. 2 International Review for Environmental Strategies 2006
4
Industrial Water LawLaw Concerning the Regulation of
Pumping-Up of Groundwater Use in Buildings (Building Water Law)
restriction of abstraction in designated areas
ban of abstraction in designated areasprovision of water supply for industries (Industrial Water Supply Works: IWSW)
provision of financial and technical assistance for introduction of water saving technologies(water reuse and recycling tech.)
IndustryBuildings (office and
commercial buildings)
subsidies from the national government
3.4. Limiting groundwater abstraction to counter land subsidence
Management measures in Osaka started to work in controlling land subsidence by reducing groundwater abstraction. As figure 4 shows, there are two lines of management according to use: (1) industries and (2) buildings. The main element of groundwater control was regulations on abstraction, which were supported by provision of alternative water resources and financial and technical assistance to take the actions necessary to reduce groundwater use.
Figure 4. Outline of the types of groundwater management in Osaka
a. Regulation of groundwater abstraction
The main element of effective groundwater management is regulation of groundwater abstraction. For the industrial sector, a national law, named the Industrial Water Law, was enacted in 1956. Even so, because groundwater is regarded as an exclusive right of landowners there was hesitation to regulate groundwater abstraction at that time. In one sense the law was a breakthrough for groundwater control, but as a tool for controlling groundwater abstraction it was very weak, because it only applied to new wells, not existing ones.
Another significant feature of the law was that it had the dual purposes of industrial development and controlling land subsidence in the designated area, and it set construction of plants for industrial water supply works (IWSW), a new scheme of water supply exclusively for the industrial sector, as one of the terms of groundwater control.
Regarding groundwater abstraction for use in buildings, the Osaka city government enacted the Osaka City Land Subsidence Control Ordinance in 1959 and tried to regulate well abstraction in five wards (ku) under the same conditions as the Industrial Water Law. Therefore, the ordinance did not apply to existing wells either.
Consequently, both the Industrial Water Law and the ordinance failed to effectively control groundwater abstraction, and land subsidence intensified. At Kujyo Station, located in the coastal area
Figure 4. Outline of the Types of Groundwater Management in Osaka
3-1. Regulation of Groundwater Abstraction
The main element of effective groundwater management is regulation of groundwater abstraction. For the industrial sector, a national law, named the Industrial Water Law, was enacted in 1956. Even so, because groundwater is regarded as an exclusive right of landowners there was hesitation to regulate groundwater abstraction at that time. In one sense the law was a breakthrough for groundwater control, but as a tool for controlling groundwater abstraction it was very weak, because it only applied to new wells, not existing ones.
Another significant feature of the law was that it had the dual purposes of industrial development and controlling land subsidence in the designated area, and it set construction of plants for industrial water supply works (IWSW), a new scheme of water supply exclusively for the industrial sector, as one of the terms of groundwater control.
Regarding groundwater abstraction for use in buildings, the Osaka city government enacted the Osaka City Land Subsidence Control Ordinance in 1959 and tried to regulate well abstraction in five wards (ku) under the
Figure 3. Land subsidence and industrial output value in Osaka
Source: Committee on Comprehensive Countermeasures against Land Subsidence in Osaka 1993.
*In 1965 prices. **At Nishi-4 (Torishima, Konohana-ku).
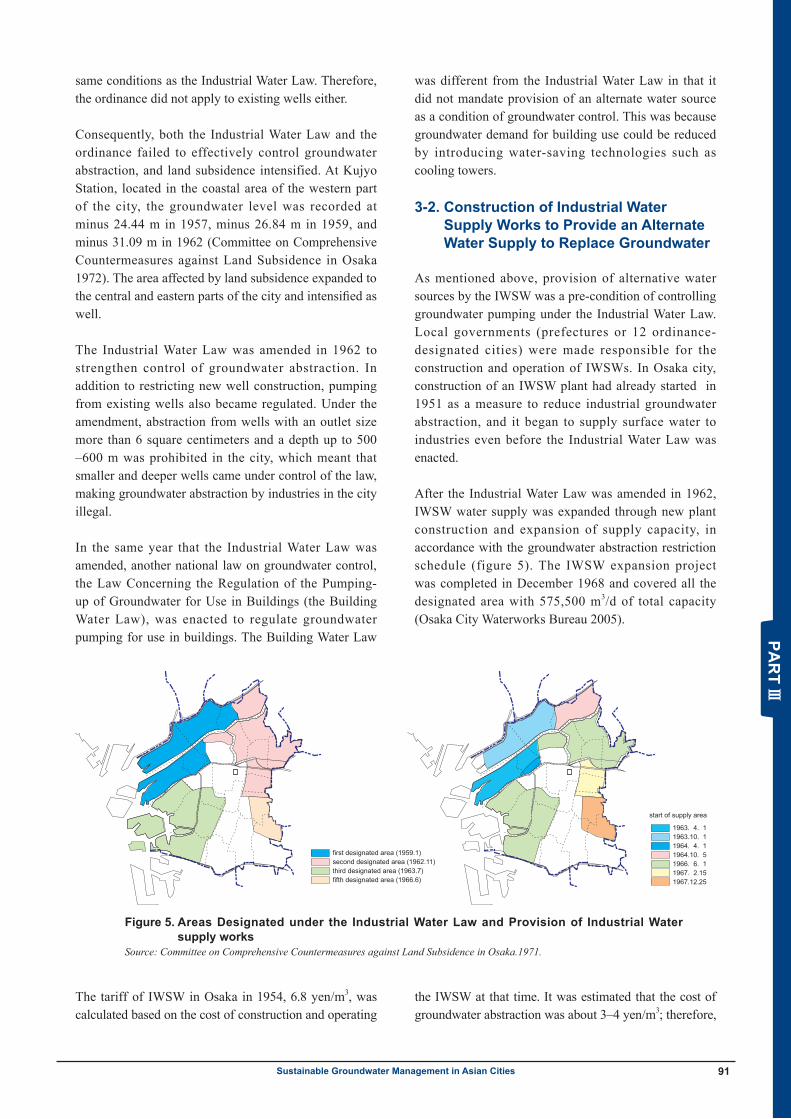
Summary report of Sustainable Groundwater Management in Asia 91Sustainable Groundwater Management in Asian Cities
same conditions as the Industrial Water Law. Therefore, the ordinance did not apply to existing wells either.
Consequently, both the Industrial Water Law and the ordinance failed to effectively control groundwater abstraction, and land subsidence intensified. At Kujyo Station, located in the coastal area of the western part of the city, the groundwater level was recorded at minus 24.44 m in 1957, minus 26.84 m in 1959, and minus 31.09 m in 1962 (Committee on Comprehensive Countermeasures against Land Subsidence in Osaka 1972). The area affected by land subsidence expanded to the central and eastern parts of the city and intensified as well.
The Industrial Water Law was amended in 1962 to strengthen control of groundwater abstraction. In addition to restricting new well construction, pumping from existing wells also became regulated. Under the amendment, abstraction from wells with an outlet size more than 6 square centimeters and a depth up to 500–600 m was prohibited in the city, which meant that smaller and deeper wells came under control of the law, making groundwater abstraction by industries in the city illegal.
In the same year that the Industrial Water Law was amended, another national law on groundwater control, the Law Concerning the Regulation of the Pumping-up of Groundwater for Use in Buildings (the Building Water Law), was enacted to regulate groundwater pumping for use in buildings. The Building Water Law
was different from the Industrial Water Law in that it did not mandate provision of an alternate water source as a condition of groundwater control. This was because groundwater demand for building use could be reduced by introducing water-saving technologies such as cooling towers.
3-2. Construction of Industrial Water Supply Works to Provide an Alternate Water Supply to Replace Groundwater
As mentioned above, provision of alternative water sources by the IWSW was a pre-condition of controlling groundwater pumping under the Industrial Water Law. Local governments (prefectures or 12 ordinance-designated cities) were made responsible for the construction and operation of IWSWs. In Osaka city, construction of an IWSW plant had already started in 1951 as a measure to reduce industrial groundwater abstraction, and it began to supply surface water to industries even before the Industrial Water Law was enacted.
After the Industrial Water Law was amended in 1962, IWSW water supply was expanded through new plant construction and expansion of supply capacity, in accordance with the groundwater abstraction restriction schedule (figure 5). The IWSW expansion project was completed in December 1968 and covered all the designated area with 575,500 m3/d of total capacity (Osaka City Waterworks Bureau 2005).
Figure 5. Areas Designated under the Industrial Water Law and Provision of Industrial Water supply works
Source: Committee on Comprehensive Countermeasures against Land Subsidence in Osaka.1971.
first designated area (1959.1)second designated area (1962.11)third designated area (1963.7)fifth designated area (1966.6)
1963. 4. 11963.10. 11964. 4. 11964.10. 51966. 6. 11967. 2.151967.12.25
start of supply area
The tariff of IWSW in Osaka in 1954, 6.8 yen/m3, was calculated based on the cost of construction and operating
the IWSW at that time. It was estimated that the cost of groundwater abstraction was about 3–4 yen/m3; therefore,
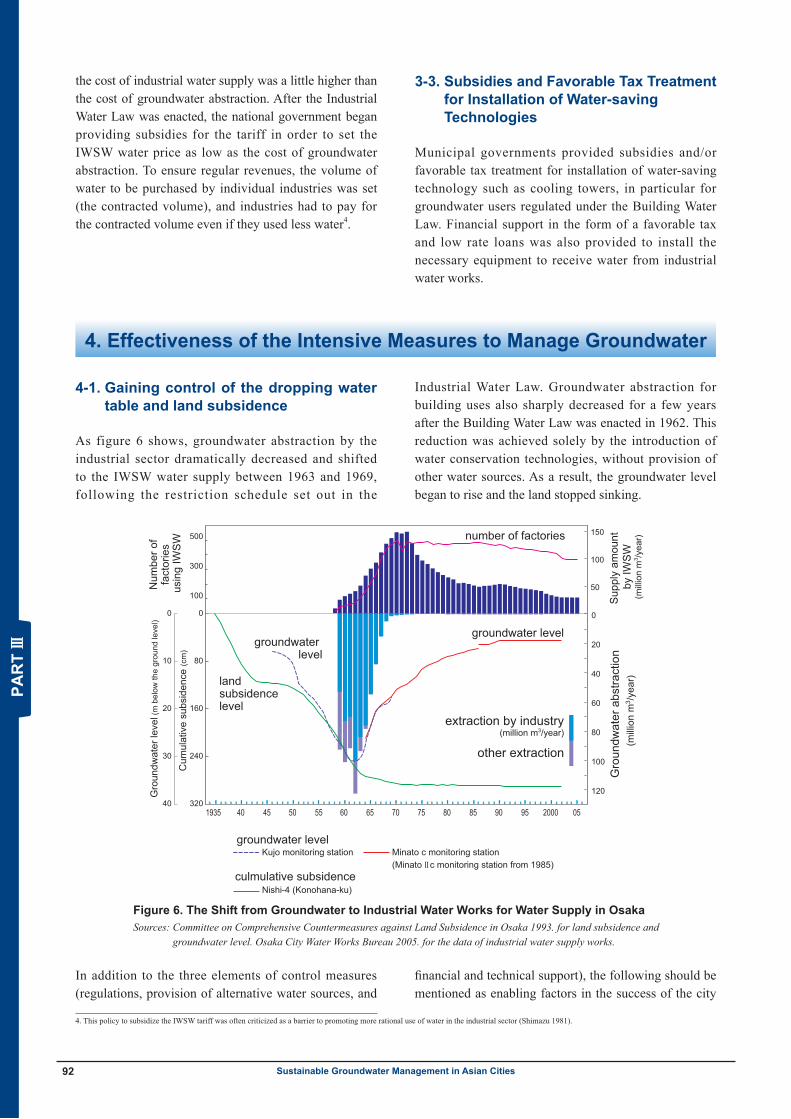
Summary report of Sustainable Groundwater Management in Asia92 Sustainable Groundwater Management in Asian Cities
4-1. Gaining control of the dropping water table and land subsidence
As figure 6 shows, groundwater abstraction by the industrial sector dramatically decreased and shifted to the IWSW water supply between 1963 and 1969, following the restriction schedule set out in the
Industrial Water Law. Groundwater abstraction for building uses also sharply decreased for a few years after the Building Water Law was enacted in 1962. This reduction was achieved solely by the introduction of water conservation technologies, without provision of other water sources. As a result, the groundwater level began to rise and the land stopped sinking.
the cost of industrial water supply was a little higher than the cost of groundwater abstraction. After the Industrial Water Law was enacted, the national government began providing subsidies for the tariff in order to set the IWSW water price as low as the cost of groundwater abstraction. To ensure regular revenues, the volume of water to be purchased by individual industries was set (the contracted volume), and industries had to pay for the contracted volume even if they used less water4.
3-3. Subsidies and Favorable Tax Treatment for Installation of Water-saving Technologies
Municipal governments provided subsidies and/or favorable tax treatment for installation of water-saving technology such as cooling towers, in particular for groundwater users regulated under the Building Water Law. Financial support in the form of a favorable tax and low rate loans was also provided to install the necessary equipment to receive water from industrial water works.
4. Effectiveness of the Intensive Measures to Manage Groundwater
Figure 6. The Shift from Groundwater to Industrial Water Works for Water Supply in Osaka Sources: Committee on Comprehensive Countermeasures against Land Subsidence in Osaka 1993. for land subsidence and
groundwater level. Osaka City Water Works Bureau 2005. for the data of industrial water supply works.
In addition to the three elements of control measures (regulations, provision of alternative water sources, and
financial and technical support), the following should be mentioned as enabling factors in the success of the city
0
20
40
60
80
100
120
150
100
50
500
300
100
0
80
160
240
320
0
10
20
30
40
Sup
ply
amou
nt b
y IW
SW
(mill
ion
m3 /y
ear)
Num
ber o
f fa
ctor
ies
usin
g IW
SW
Cum
ulat
ive
subs
iden
ce (c
m)
Gro
undw
ater
abs
tract
ion
(mill
ion
m3 /y
ear)
Gro
undw
ater
leve
l (m
bel
ow th
e gr
ound
leve
l)
groundwater level
groundwater level
number of factories
landsubsidence level
extraction by industry (million m3/year)
other extraction
1935 40 45 50 55 60 65 70 75 80 85 90 95 2000 05
groundwater levelKujo monitoring station
culmulative subsidence Nishi-4 (Konohana-ku)
Minato c monitoring station(Minato II c monitoring station from 1985)
4. This policy to subsidize the IWSW tariff was often criticized as a barrier to promoting more rational use of water in the industrial sector (Shimazu 1981).
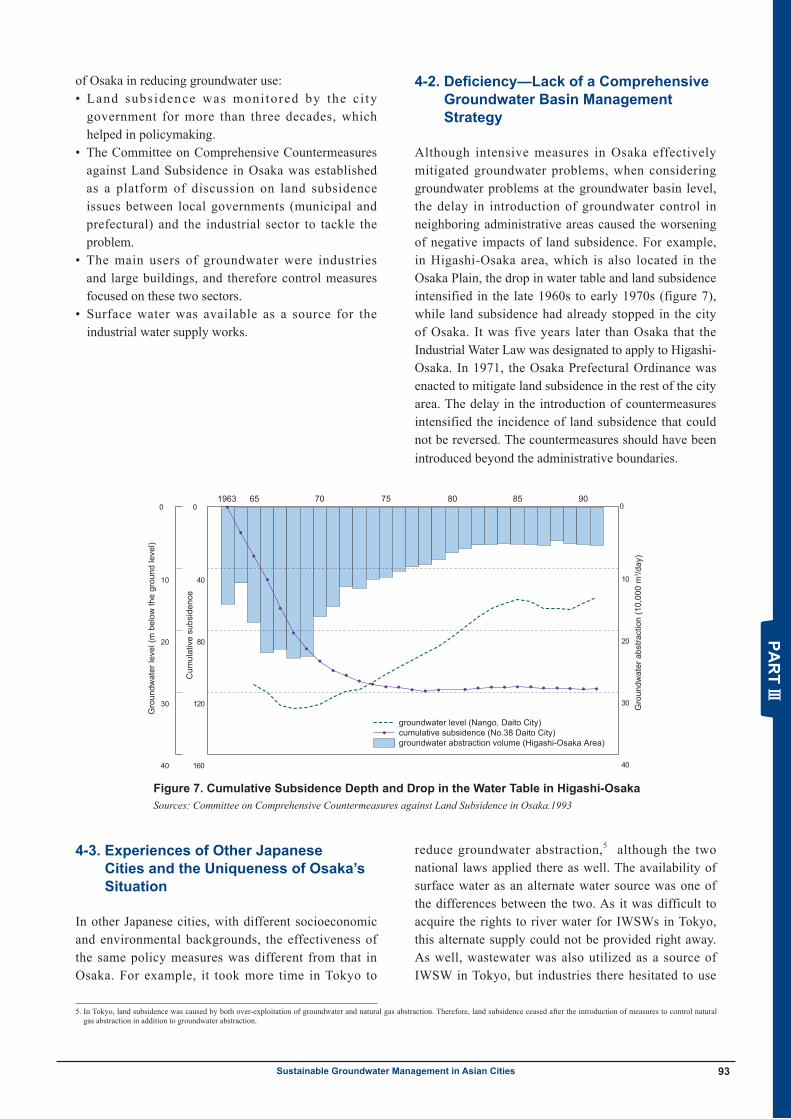
Summary report of Sustainable Groundwater Management in Asia 93Sustainable Groundwater Management in Asian Cities
of Osaka in reducing groundwater use:• Land subsidence was monitored by the ci ty
government for more than three decades, which helped in policymaking.
• The Committee on Comprehensive Countermeasures against Land Subsidence in Osaka was established as a platform of discussion on land subsidence issues between local governments (municipal and prefectural) and the industrial sector to tackle the problem.
• The main users of groundwater were industries and large buildings, and therefore control measures focused on these two sectors.
• Surface water was available as a source for the industrial water supply works.
4-2. Deficiency—Lack of a Comprehensive Groundwater Basin Management Strategy
Although intensive measures in Osaka effectively mitigated groundwater problems, when considering groundwater problems at the groundwater basin level, the delay in introduction of groundwater control in neighboring administrative areas caused the worsening of negative impacts of land subsidence. For example, in Higashi-Osaka area, which is also located in the Osaka Plain, the drop in water table and land subsidence intensified in the late 1960s to early 1970s (figure 7), while land subsidence had already stopped in the city of Osaka. It was five years later than Osaka that the Industrial Water Law was designated to apply to Higashi-Osaka. In 1971, the Osaka Prefectural Ordinance was enacted to mitigate land subsidence in the rest of the city area. The delay in the introduction of countermeasures intensified the incidence of land subsidence that could not be reversed. The countermeasures should have been introduced beyond the administrative boundaries.
1963 65 70 75 80 85 900
10
20
30
40
0
10
20
30
40
0
40
80
120
160
Cum
ulat
ive
subs
iden
ce
Gro
undw
ater
leve
l (m
bel
ow th
e gr
ound
leve
l)
Gro
undw
ater
abs
tract
ion
(10,
000
m3 /d
ay)
groundwater level (Nango, Daito City)cumulative subsidence (No.38 Daito City)groundwater abstraction volume (Higashi-Osaka Area)
Figure 7. Cumulative Subsidence Depth and Drop in the Water Table in Higashi-OsakaSources: Committee on Comprehensive Countermeasures against Land Subsidence in Osaka.1993
5. In Tokyo, land subsidence was caused by both over-exploitation of groundwater and natural gas abstraction. Therefore, land subsidence ceased after the introduction of measures to control natural gas abstraction in addition to groundwater abstraction.
4-3. Experiences of Other Japanese Cities and the Uniqueness of Osaka’s Situation
In other Japanese cities, with different socioeconomic and environmental backgrounds, the effectiveness of the same policy measures was different from that in Osaka. For example, it took more time in Tokyo to
reduce groundwater abstraction,5 although the two national laws applied there as well. The availability of surface water as an alternate water source was one of the differences between the two. As it was difficult to acquire the rights to river water for IWSWs in Tokyo, this alternate supply could not be provided right away. As well, wastewater was also utilized as a source of IWSW in Tokyo, but industries there hesitated to use
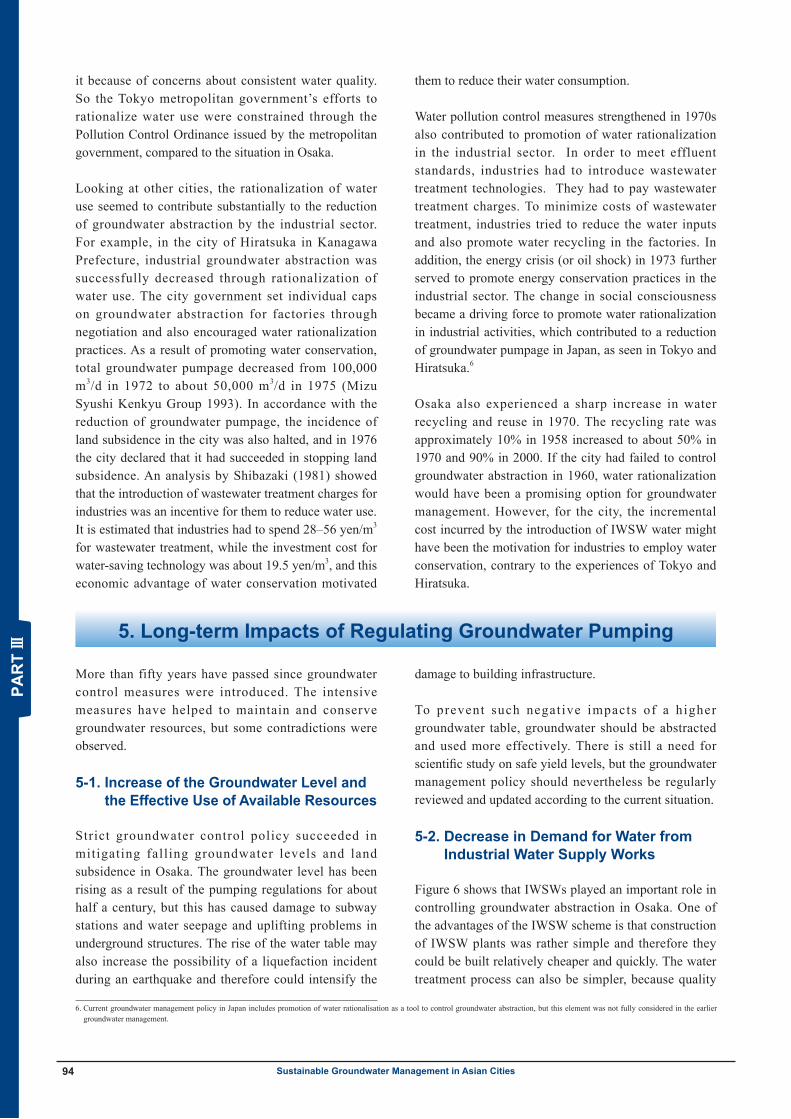
Summary report of Sustainable Groundwater Management in Asia94 Sustainable Groundwater Management in Asian Cities
5. Long-term Impacts of Regulating Groundwater Pumping
it because of concerns about consistent water quality. So the Tokyo metropolitan government’s efforts to rationalize water use were constrained through the Pollution Control Ordinance issued by the metropolitan government, compared to the situation in Osaka.
Looking at other cities, the rationalization of water use seemed to contribute substantially to the reduction of groundwater abstraction by the industrial sector. For example, in the city of Hiratsuka in Kanagawa Prefecture, industrial groundwater abstraction was successfully decreased through rationalization of water use. The city government set individual caps on groundwater abstraction for factories through negotiation and also encouraged water rationalization practices. As a result of promoting water conservation, total groundwater pumpage decreased from 100,000 m3/d in 1972 to about 50,000 m3/d in 1975 (Mizu Syushi Kenkyu Group 1993). In accordance with the reduction of groundwater pumpage, the incidence of land subsidence in the city was also halted, and in 1976 the city declared that it had succeeded in stopping land subsidence. An analysis by Shibazaki (1981) showed that the introduction of wastewater treatment charges for industries was an incentive for them to reduce water use. It is estimated that industries had to spend 28–56 yen/m3 for wastewater treatment, while the investment cost for water-saving technology was about 19.5 yen/m3, and this economic advantage of water conservation motivated
them to reduce their water consumption.
Water pollution control measures strengthened in 1970s also contributed to promotion of water rationalization in the industrial sector. In order to meet effluent standards, industries had to introduce wastewater treatment technologies. They had to pay wastewater treatment charges. To minimize costs of wastewater treatment, industries tried to reduce the water inputs and also promote water recycling in the factories. In addition, the energy crisis (or oil shock) in 1973 further served to promote energy conservation practices in the industrial sector. The change in social consciousness became a driving force to promote water rationalization in industrial activities, which contributed to a reduction of groundwater pumpage in Japan, as seen in Tokyo and Hiratsuka.6
Osaka also experienced a sharp increase in water recycling and reuse in 1970. The recycling rate was approximately 10% in 1958 increased to about 50% in 1970 and 90% in 2000. If the city had failed to control groundwater abstraction in 1960, water rationalization would have been a promising option for groundwater management. However, for the city, the incremental cost incurred by the introduction of IWSW water might have been the motivation for industries to employ water conservation, contrary to the experiences of Tokyo and Hiratsuka.
More than fifty years have passed since groundwater control measures were introduced. The intensive measures have helped to maintain and conserve groundwater resources, but some contradictions were observed.
5-1. Increase of the Groundwater Level and the Effective Use of Available Resources
Strict groundwater control policy succeeded in mitigating falling groundwater levels and land subsidence in Osaka. The groundwater level has been rising as a result of the pumping regulations for about half a century, but this has caused damage to subway stations and water seepage and uplifting problems in underground structures. The rise of the water table may also increase the possibility of a liquefaction incident during an earthquake and therefore could intensify the
damage to building infrastructure.
To prevent such negative impacts of a higher groundwater table, groundwater should be abstracted and used more effectively. There is still a need for scientific study on safe yield levels, but the groundwater management policy should nevertheless be regularly reviewed and updated according to the current situation. 5-2. Decrease in Demand for Water from
Industrial Water Supply Works
Figure 6 shows that IWSWs played an important role in controlling groundwater abstraction in Osaka. One of the advantages of the IWSW scheme is that construction of IWSW plants was rather simple and therefore they could be built relatively cheaper and quickly. The water treatment process can also be simpler, because quality
6. Current groundwater management policy in Japan includes promotion of water rationalisation as a tool to control groundwater abstraction, but this element was not fully considered in the earlier groundwater management.
Summary report of Sustainable Groundwater Management in Asia 95Sustainable Groundwater Management in Asian Cities
Vol. 6, No. 2 International Review for Environmental Strategies 2006
10
The main reason for the decrease in demand for IWSW water was the increase in the rate of water recycling and reuse, as seen in figure 9. In the case of Osaka, as mentioned earlier, industries had to pay more for IWSW water. In addition, industries had to pay a tariff on sewage, and the city also introduced a progressive charging system for sewage, with large water users having to pay more than those that consumed less. At the same time, there was an additional charge on sewage based on wastewater quality (biological oxygen demand and chemical oxygen demand) introduced in 1974 (Takahashi 1992). This pricing system was designed as a water pollution control measure, but it also contributed to water rationalization by industries. In addition, national water policy encouraged water recycling and reuse in the industrial sector through financial and technical support to try to find a balance between limited water resources and growing water demands. Rationalization of water use in industry itself is a very good trend, but the current situation of IWSWs shows that groundwater management should be designed more closely linked with plans of other areas of water management such as surface water development, improvement of water efficiency, and pollution control. The IWSW experience also tells us that countermeasures to control groundwater should be flexible enough to cope with changes in water demand as a result of changes in social and economic conditions.
Figure 8. Progressive rate of sewage charges in Osaka
Source: Takahashi 1992.
1
2
3
4
5
6
7
8
9
- 10m3
11- 2
0m3
21- 30
m3
31- 5
0m3
51- 1
00m3
101-
200m3
201-5
00m3
501-
1000m
3
1001
- 5000
m3
more tha
n 5000
m3
1977.4 -1981.3
1981.4 -1984.3
1984.4 -2001.3
2002.4 -
1965.4 - 1968.9
1972.11 -1974.11
control is less restricted than treating water for drinking (Aya and Matsumoto 2003). In other Japanese cities, IWSW plants were constructed for more effective water supply to industries rather than to control groundwater abstraction.
Figure 6 also shows, however, that the volume of IWSW water supply has been decreasing since 1974. As a result, IWSW revenues have also decreased. As a part of management restructuring, downsizing of supply capacity and even a plant shutdown were conducted. Since 1973, with permission of the Ministry of Economy, Trade and Industry, the Osaka IWSW began to supply water to the city government’s facility in order to sell more of their water. Currently, 23 percent of the total IWSW water supply in Osaka is sold for non-industrial use (Osaka City Waterworks Bureau 2005). The IWSW capacity utilization rate is now only 50 percent, and the rate would be less than 40 percent if it were based on the average supply amount,. As the IWSW was originally built for the industrial sector, it is not easy to sell the water for other uses. This challenge is a common management problem for IWSWs in Japan.
The main reason for the decrease in demand for IWSW water was the increase in the rate of water recycling and reuse, as seen in figure 8. In the case of Osaka, as mentioned earlier, industries had to pay more for IWSW water. In addition, industries had to pay a tariff on sewage, and the city also introduced a progressive charging system for sewage, with large water users having to pay more than those that consumed less. At the same time, there was an additional charge on sewage based on wastewater quality (biological oxygen demand and chemical oxygen demand) introduced in 1974 (Takahashi 1992). This pricing system was designed as a water pollution control measure, but it also contributed to water rationalization by industries. In addition, national water policy encouraged water recycling and reuse in the industrial sector through financial and technical support to try to find a balance between limited water resources and growing water demands. Rationalization of water use in industry itself is a very good trend, but the current situation of IWSWs shows that groundwater management should be designed more closely linked with plans of other areas of water management such as surface water development, improvement of water efficiency, and pollution control. The IWSW experience also tells us that countermeasures to control groundwater should be flexible enough to cope with changes in water demand as a result of changes in social and economic conditions.
5-3. Potential demand for groundwater
After a half century of implementing control measures, it appears that groundwater is a resource that can be safely utilized again, and it is worth considering how to utilize surplus groundwater in Osaka without causing problems. On the other hand, the current trend of groundwater use in neighboring cities with less strict groundwater controls shows that the city needs to consider groundwater management in a bigger context of overall water management in the region.
Recently, groundwater use by private water supply schemes for specific users, called senyo-suido, has been increasing in Osaka Prefecture. Senyo-suido is defined in the Waterworks Law as waterworks “for individual specific users of which the number is more than 101 persons and/or the maximum supply amount per day exceeds 20 m3.” Individual waterworks were often introduced for domestic use in areas without public water supply, but the recent trend shows an increase in individual waterworks using groundwater as their primary source. Large users of public water supply, such as hotels, fitness clubs, hospitals, and retail stores, are the main owners (users) of senyo-suido, and one of the major reasons why they use it is the lower cost of water. Under the current tariff structure for municipal water supply, heavy users have to pay more than individual
Figure 8. Progressive Rate of Sewage Charges in OsakaSources: Takahashi 1992.
Summary report of Sustainable Groundwater Management in Asia96 Sustainable Groundwater Management in Asian Cities
customers. Consequently, a decrease of water demand from heavy users can directly affect the business of a municipal water supply plant, and it is presently a big problem for public water supply schemes, because it threatens the economic viability of public waterworks.
In 2003, for example, 23 commercial-scale utility customers in Osaka Prefecture introduced their own water supply systems (based primarily on groundwater), the largest number compared to other prefectures. This resulted in a loss of revenue from April 2003 to March 2004 for the Prefectural Public Waterworks estimated at 350 million yen (Osaka Prefecture 2004). The city of Kusatsu in Shiga Prefecture, faced with an increase of groundwater use by commercial-scale users, reduced the tariff for large users (Okuno 2004). In addition, the city decided to publish the names of heavy water users who intended to stop or greatly reduce their purchases from
the public water supply scheme.
Groundwater should be effectively utilized where it is available. As the case of groundwater use in individual water works illustrates, the expansion of groundwater use can affect the economic viability of the existing water supply scheme. If public water supply provides cheaper water to heavy users in order to keep them using the public supply scheme, then there may be a risk of wasteful water use.
One of the possible solutions to the problem is to introduce a charge system for groundwater abstraction, although more discussion is needed on how to calculate the appropriate price. In Japan, however, groundwater abstraction rights belong to those who own the land, in principle, making it difficult to charge a groundwater use fee.
Without any control measures, groundwater is easily depleted by over-exploitation. On the other hand, if properly managed, groundwater is a very reliable resource that provides various benefits.
This case study of groundwater management in Osaka provides several lessons for future policymaking in Asian cities. For example, the study shows that the provision of alternative resources with strict regulation of groundwater pumping can effectively reduce pumpage volume. Under a critical state of groundwater resources in the course of industrial development, the intensive measures implemented in Osaka might be useful. As a long-term result, however, as the experience of the city revealed, intensive control of groundwater can increase the availability of the resource and allow its use again under proper control. In Bangkok, groundwater abstraction has been reduced to control the dropping groundwater level and land subsidence, but the city should not take the same path as Osaka in the future. While concentrating on controlling groundwater abstraction, it may be necessary to examine how to sustainably utilize groundwater, and this should include studies of past experiences elsewhere. Such a medium- and long-term perspective of management should be incorporated into policymaking and implementation.
The importance of demand management should also be more emphasized in groundwater management. The sharp decrease of water demand in the industrial sector in Osaka, which caused management problems for the
local IWSW showed a great potential for rationalization of water use as a groundwater management measure. However, encouragement of water conservation practices in the industrial sector is not well incorporated in groundwater management in Asian cities, or such an effort has been promoted in the other area of water management. In order to reduce water inputs, efficient utilization is a very primary but important element of management of limited water resources, including groundwater. User fees or taxes are one of the tools that can control water demand. Altering water demand is very crucial for the management of other water sources, and therefore more comprehensive or integrated water management policy design should be promoted to avoid unnecessary wastefulness and damage to water resources.
References
Aya H., and K. Matsumoto. 2003. Water for sustainable development of industry—Role and contributions of industrial water supply works in Japan (in Japanese). Kogyo Yosui (Japan Industrial Water Association) 537:2–12.
Committee on Comprehensive Countermeasures against Land Subsidence in Osaka. 1972. Osaka jiban chinka taisaku shi. Osaka [History of countermeasures against land subsidence in osaka]. Isshindo Insatsu.
———. 1993. 30 syunen kinen shi [Commemorative publication of 30 years anniversary of the Committee]. Osaka: Kinki Insatsu.
Global Environment Centre Foundation (GEC). 1994. Osaka-shi kogai taisaku-shi [Record of pollution control in Osaka City]. Osaka: Kinki
6. Conclusion
Summary report of Sustainable Groundwater Management in Asia 97Sustainable Groundwater Management in Asian Cities
Insatsu Pro.
Japan Society of Civil Engineers Kansai Chapter. 2002. Chikasui seigyo ga jiban chinka ni oyobosu eikyo hyoka [Assessment of the impact on the geo-environment by groundwater control]. Japan Society of Civil Engineers Kansai Chapter. Osaka.
Japan Water Works Association. 2005. Chikasui riyo senyo suido no kakudai ni kansuru hokokusyo [Report on increasing individual water works that use groundwater as a source], http://www.jwwa.or.jp/pdf/senyou_suidou.pdf (accessed August 30, 2005).
Mizu Shigen Syushi Group. 1993. Chikasui shigen no hyoka to kanri [Evaluation and management of groundwater resource] . In Mizu Syushi Kenkyu Group ed. Chikasui shigen kankyo ron—Sono riron to jissen [Theory and practice of conservation of groundwater resource], 273–311. Tokyo: Kyoritsu Syuppan.
Okuno, T. 2004. Oguchi suido riyosya no chikasui tenkan wo yokuseisuru mokuteki de jisshishita Kusatsu Suido Jigyo Secchi Joreito no kaisei keii ni tsuite [Amendment of an ordinance on Kusatsu water works for prevent heavy water users from transferring their water source to groundwater from public water works]. Journal of Japan Water Works Association 73 (5): 32–37.
Osaka City. 1957. Kogyo yosuido jigyo-hi hojyokin kofu shinsei syo [Application for the subsidy to construction of industrial water supply works to the Minister of International Trade and Industry].
Osaka City Comprehensive Planning Bureau. 1963. Jiban chinka ni kansuru shiryo [Document on land subsidence].
Osaka City Environment and Sewage Bureau. 2004. Jimu jigyo gaiyo FY 2003 [Annual business report FY 2003].
Osaka City Planning Bureau. 1960. Jiban chinka ni kansuru shiryo [Document on land subsidence].
Osaka City Waterworks Bureau. 2000. Water supply in Osaka.
———. 2003. Environment report FY 2002.
———. 2005. Osaka shi kogyo yosuido 50 nenshi [History of 50 years of the Osaka city industrial water supply works].
Osaka Prefecture. 2004. Chikasui wo suigen to suru senyo suido mondai ni tsuite [Individual water supply with groundwater as a source], http://www.pref.osaka.jp/suido/jouhou/hyoka/1602hyok/8sensui.pdf (accessed November 10, 2005).
Research and Statistic Department of Ministry of International Trade and Industry. 1960. Census of Manufactures — Report on Industrial land and Water FY1958. Tokyo: Research Statistic Department of Ministry of International Trade and Industry.
Research and Statistic Department of Ministry of Economy, Trade and Industry. 2002. Census of Manufactures — Report on Industrial land and Water FY2000. Tokyo: Research and Statistic Department of Ministry of Economy, Trade and Industry.
Shimazu, T. 1981. Mizu ha amatte iru, mizu jyuyo no jittai wo tsuku—Kogyo-toshi Fukuyama no mizu mondai [Abundance of water —what is a reality of water demand — water issues in Fukuyama city]. Gijyutsu to Ningen 10 (7): 116–119.
Shibazaki, T. 1981. Chikasui riyo hozen no shinkyokumen, sono chiho bunsanka to tayo-ka ni taioshite [New dimension of groundwater conservation — corresponding to localization and diversification]. In Gendai no Mizu Mondai (Julist Zokan Sogo Tokusyu 23), 57–64. Tokyo: Yuhikaku.
Takahashi, T. 1992. Osaka-shi ni okeru gesuido shiyoryo seido ni tsuite [Wastewater treatment charge in Osaka city]. in Osakashi Gesuido 20 syunen kinen gyoumu kenkyu ronbunsyu. Osaka: Osaka City Sewerage Engineering Association.
2108-11 Kamiyamaguchi, Hayama, Kanagawa 240-0115, Japan
Tel: +81-46-855-3700, Fax: +81-46-855-3709URL: http//www.iges.or.jp/en/fw/index.html
E-mail: [email protected]
©IGES 2006.3