groundwater potentials estimation of a basement terrain
TRANSCRIPT
Open Journal of Modern Hydrology, 2016, 6, 222-229 http://www.scirp.org/journal/ojmh
ISSN Online: 2163-0496 ISSN Print: 2163-0461
DOI: 10.4236/ojmh.2016.64018 September 16, 2016
Groundwater Potentials Estimation of a Basement Terrain Using Pumping Test Data for Parts of Sanga Local Government Area, Kaduna State, Northwestern Nigeria
Hamidu Hassan1, Sidi Muhammad Waru2, Garga Ali Bukar3, Kana Muhammad Abdullahi4
1Department of Geology, Usmanu Danfodiyo University, Sokoto, Nigeria 2Department of Geology, University of Maiduguri, Maiduguri, Nigeria 3Department of Civil and Water Resources Engineering, University of Maiduguri, Maiduguri, Nigeria 4Department of Geology, Ahmadu Bello University, Samaru Zaria, Nigeria
Abstract Aquifers derived from the crystalline basement rocks for parts of Sanga Local Gov-ernment area of Kaduna State, Nigeria consist of clay, silt, sand, gravel and laterite materials which may be in various proportions. Using Cooper-Jacobs non-equilibrium graphical method, the hydraulic properties were estimated from pumping test data of 18 boreholes. Conductivity varies from 1.02 × 10⁻² m/s to 4.07 × 10⁻² m/s and trans-missivity varies from 1.14 × 10⁻¹ m2/s to 4.40 × 10⁻¹ m2/s. The values of specific ca-pacity range between 1.03 × 10⁻¹ m2/s/m and 9.00 × 10⁻² m2/s/m, and these values in-dicate that the aquifers in the area have low to moderate ground water potentials. The low yield range of between 0.45 l/s and 1.00 l/s recorded in the area shows the heterogeneous and anisotropy nature of the basement aquifer system in terms of groundwater discharge. On the average, the boreholes assessed have potentials to sustain local to regional supply provided the best drilling method and materials are used and well completion properly done.
Keywords Pumping Test, Heterogeneous, Anisotropy, Conductivity, Discharge, Sanga
1. Introduction
Sanga local government is located at the extreme southern part of Kaduna state. It shears boundary with Nasarawa State Southward and covers a total land area of about
How to cite this paper: Hassan, H., Waru, S.M., Bukar, G.A. and Abdullahi, K.M. (2016) Groundwater Potentials Estimation of a Basement Terrain Using Pumping Test Data for Parts of Sanga Local Government Area, Kaduna State, Northwestern Nigeria. Open Journal of Modern Hydrology, 6, 222- 229. http://dx.doi.org/10.4236/ojmh.2016.64018 Received: February 25, 2016 Accepted: September 13, 2016 Published: September 16, 2016 Copyright © 2016 by authors and Scientific Research Publishing Inc. This work is licensed under the Creative Commons Attribution International License (CC BY 4.0). http://creativecommons.org/licenses/by/4.0/
Open Access
H. Hassan et al.
223
1402 Km2 with a population of 149,333 [1]. Being a Rural Local Government with no pipe borne water, the populace depends, to a greater extent, on surface water sources made of streams with sources from nearby spring, perennial rivers that sustain flow throughout the year and streams and rivers whose flow cease at the peak of the dry season. The surface sources are prone to pollution and contamination. The groundwa-ter sources are mainly Dug wells and Boreholes. Based on the statistic given by Kaduna State ministry of water resources [2], Sanga Local Government has a total of 128 bore-holes; this serves a population of about 18,300 while projected population of 179,354 by the year 2015 is to be without enough portable water supplies, with majority of its pop-ulation relying on surface water that is not protected from pollution or through the di-rect harvesting of rainwater during the wet season, a process that is not sustained for a longer period and unreliable. This water deficit can only be made up by the groundwa-ter sources. [3] pointed out that the low yield of boreholes in the crystalline complex was attributed to thinness of the weathered regolith, interconnectivity of the fractures in fractured layers and the geology of the underlying rock materials. This research work is aimed at assessing the groundwater potentials of the area through the use of hydrau-lic properties determined from borehole pumping test data in the area of study.
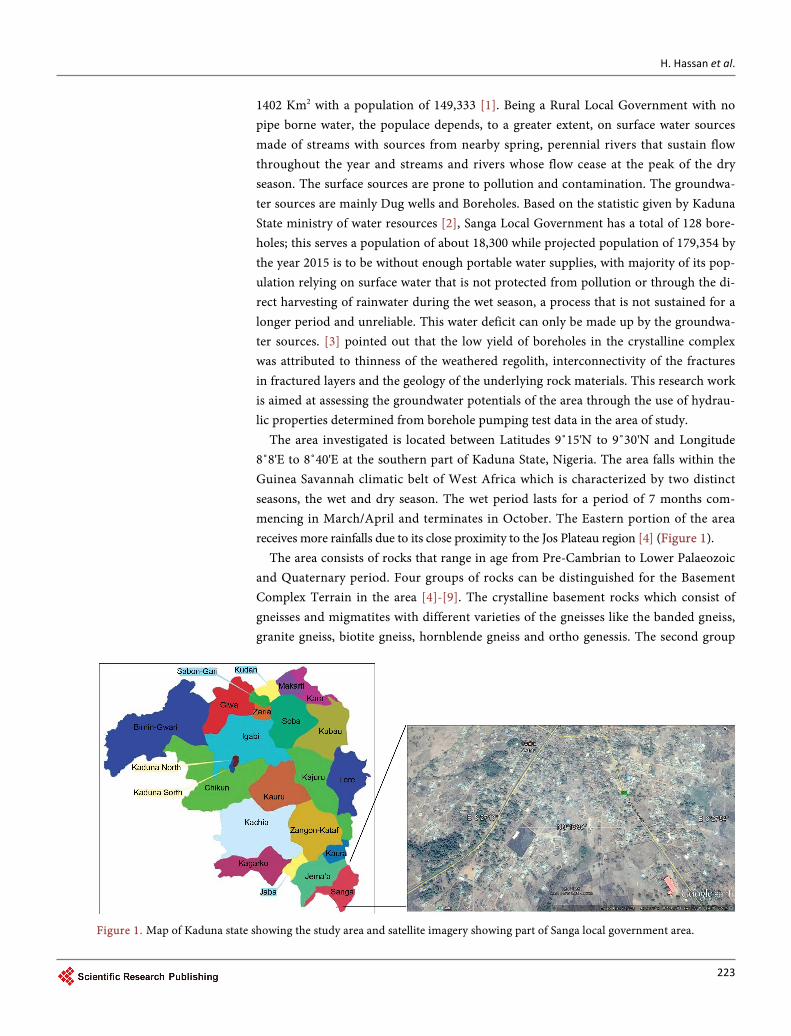
The area investigated is located between Latitudes 9˚15'N to 9˚30'N and Longitude 8˚8'E to 8˚40'E at the southern part of Kaduna State, Nigeria. The area falls within the Guinea Savannah climatic belt of West Africa which is characterized by two distinct seasons, the wet and dry season. The wet period lasts for a period of 7 months com-mencing in March/April and terminates in October. The Eastern portion of the area receives more rainfalls due to its close proximity to the Jos Plateau region [4] (Figure 1).
The area consists of rocks that range in age from Pre-Cambrian to Lower Palaeozoic and Quaternary period. Four groups of rocks can be distinguished for the Basement Complex Terrain in the area [4]-[9]. The crystalline basement rocks which consist of gneisses and migmatites with different varieties of the gneisses like the banded gneiss, granite gneiss, biotite gneiss, hornblende gneiss and ortho genessis. The second group
Figure 1. Map of Kaduna state showing the study area and satellite imagery showing part of Sanga local government area.
H. Hassan et al.
224
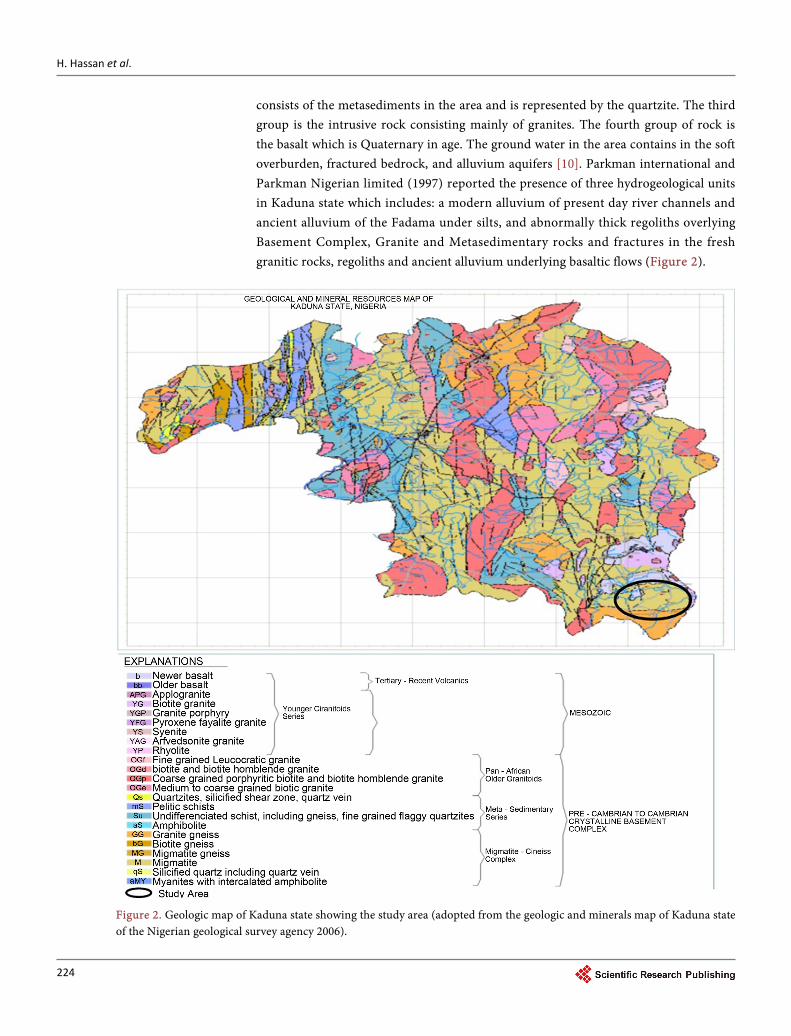
consists of the metasediments in the area and is represented by the quartzite. The third group is the intrusive rock consisting mainly of granites. The fourth group of rock is the basalt which is Quaternary in age. The ground water in the area contains in the soft overburden, fractured bedrock, and alluvium aquifers [10]. Parkman international and Parkman Nigerian limited (1997) reported the presence of three hydrogeological units in Kaduna state which includes: a modern alluvium of present day river channels and ancient alluvium of the Fadama under silts, and abnormally thick regoliths overlying Basement Complex, Granite and Metasedimentary rocks and fractures in the fresh granitic rocks, regoliths and ancient alluvium underlying basaltic flows (Figure 2).
Figure 2. Geologic map of Kaduna state showing the study area (adopted from the geologic and minerals map of Kaduna state of the Nigerian geological survey agency 2006).
H. Hassan et al.
225
2. Data and Methods 2.1. Data
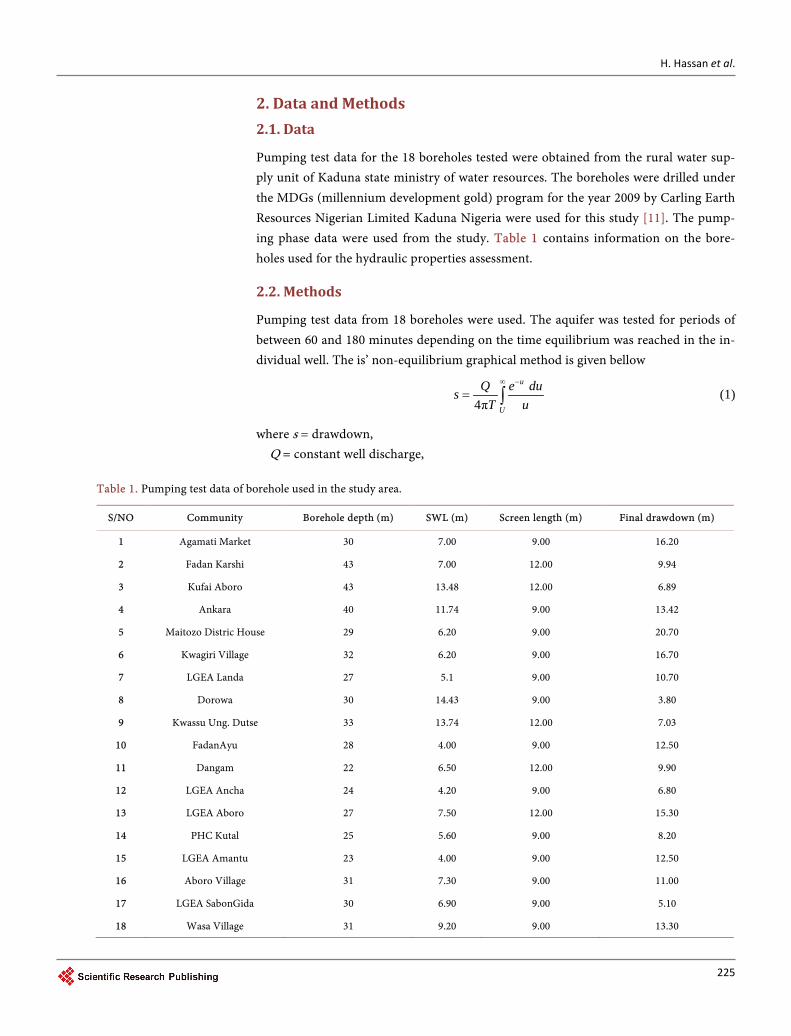
Pumping test data for the 18 boreholes tested were obtained from the rural water sup-ply unit of Kaduna state ministry of water resources. The boreholes were drilled under the MDGs (millennium development gold) program for the year 2009 by Carling Earth Resources Nigerian Limited Kaduna Nigeria were used for this study [11]. The pump-ing phase data were used from the study. Table 1 contains information on the bore-holes used for the hydraulic properties assessment.
2.2. Methods
Pumping test data from 18 boreholes were used. The aquifer was tested for periods of between 60 and 180 minutes depending on the time equilibrium was reached in the in-dividual well. The is’ non-equilibrium graphical method is given bellow
4π
u
U
Q e dusT u
∞ −
= ∫ (1)
where s = drawdown, Q = constant well discharge,
Table 1. Pumping test data of borehole used in the study area.
S/NO Community Borehole depth (m) SWL (m) Screen length (m) Final drawdown (m)
1 Agamati Market 30 7.00 9.00 16.20
2 Fadan Karshi 43 7.00 12.00 9.94
3 Kufai Aboro 43 13.48 12.00 6.89
4 Ankara 40 11.74 9.00 13.42
5 Maitozo Distric House 29 6.20 9.00 20.70
6 Kwagiri Village 32 6.20 9.00 16.70
7 LGEA Landa 27 5.1 9.00 10.70
8 Dorowa 30 14.43 9.00 3.80
9 Kwassu Ung. Dutse 33 13.74 12.00 7.03
10 FadanAyu 28 4.00 9.00 12.50
11 Dangam 22 6.50 12.00 9.90
12 LGEA Ancha 24 4.20 9.00 6.80
13 LGEA Aboro 27 7.50 12.00 15.30
14 PHC Kutal 25 5.60 9.00 8.20
15 LGEA Amantu 23 4.00 9.00 12.50
16 Aboro Village 31 7.30 9.00 11.00
17 LGEA SabonGida 30 6.90 9.00 5.10
18 Wasa Village 31 9.20 9.00 13.30
H. Hassan et al.
226
u = well function, T = Transmissivity, r = radius of well. This was used for the estimation of transmissivity (T) and Storage (S) but assuming a
small radius for the well, and a fairly long pumping time, Equation (1) above was sim-plified [12] to
2.304
QTsπ
=∆
Measured in (m2/s) (2)
where ∆s = drawdown over one long cycle. In determining the slope ∆s early times were excluded because for early time ap-
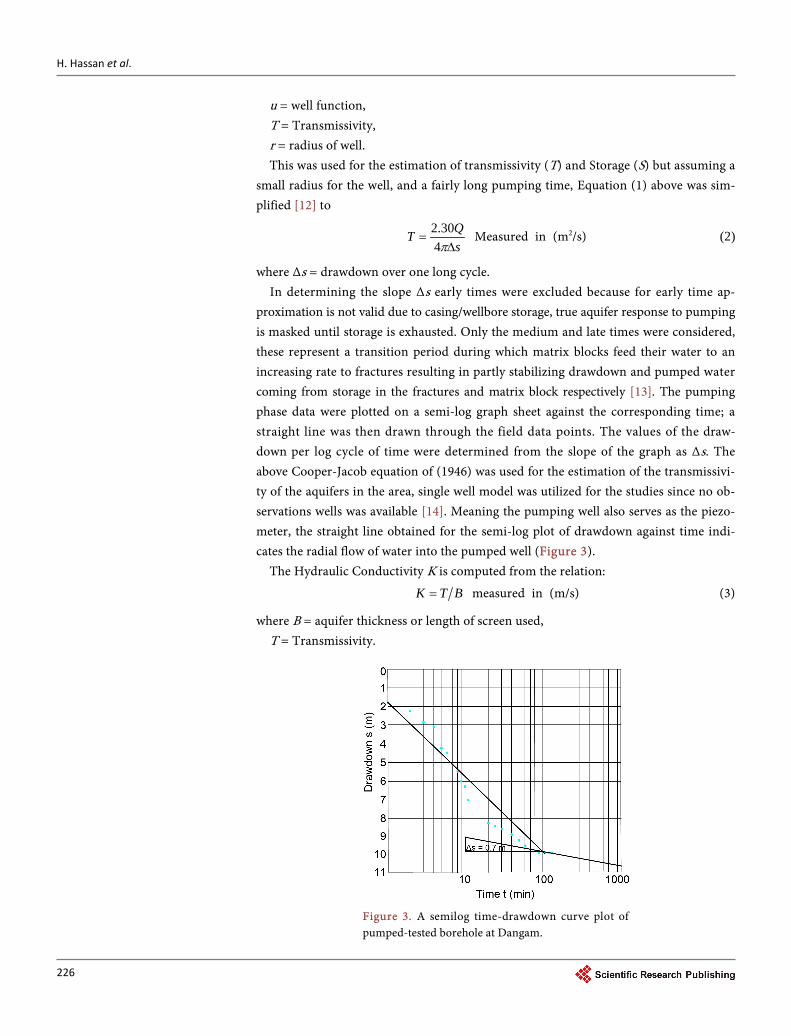
proximation is not valid due to casing/wellbore storage, true aquifer response to pumping is masked until storage is exhausted. Only the medium and late times were considered, these represent a transition period during which matrix blocks feed their water to an increasing rate to fractures resulting in partly stabilizing drawdown and pumped water coming from storage in the fractures and matrix block respectively [13]. The pumping phase data were plotted on a semi-log graph sheet against the corresponding time; a straight line was then drawn through the field data points. The values of the draw-down per log cycle of time were determined from the slope of the graph as ∆s. The above Cooper-Jacob equation of (1946) was used for the estimation of the transmissivi-ty of the aquifers in the area, single well model was utilized for the studies since no ob-servations wells was available [14]. Meaning the pumping well also serves as the piezo-meter, the straight line obtained for the semi-log plot of drawdown against time indi-cates the radial flow of water into the pumped well (Figure 3).
The Hydraulic Conductivity K is computed from the relation:
K T B= measured in (m/s) (3)
where B = aquifer thickness or length of screen used, T = Transmissivity.
Figure 3. A semilog time-drawdown curve plot of pumped-tested borehole at Dangam.
H. Hassan et al.
227
While Specific capacity was computed from the equation
Q s Measured in m3/s (4)
where Q = borehole yield or discharge, s = total drawdown recorded in pumped well.
3. Results and Discussion
Transmissivity recorded in the area ranges between 1.14 × 10⁻¹ and 4.40 × 10⁻¹ with an average of 2.18 × 10⁻¹ while the hydraulic conductivity ranges between 1.02 × 10⁻² and 4.07 × 10⁻² with an average of 2.18 × 10⁻². Hydraulic conductivity obtained falls within the range given in Table 2 and Table 3, this shows that the composition of materials of the aquifer is heterogeneous in nature comprising of finer clay, silt, gravel and fractured basement rocks with average to low yield.
Reduction as well as break in discharge experience during pumping, is an indication of the heterogenic and anisotropic nature of the basement aquifer in the study area. The low to average Transmissivity value of 2.18 × 10⁻² m2/s of the aquifer is attributed to the decrease in aquifer thickness and saturation. High average Drawdown recorded values
Table 2. Aquifer characteristic in the study area.
S/N Community Discharge
Q (l/s) Transmissivity
T (m2/s) Hydraulic conductivity
K (m/s) Specific capacity
m2/s/m Drawdown per log cycle
∆s (m)
1 Agamati Market 0.50 1.31 × 10⁻¹ 1.10 × 10⁻² 3.10 × 10⁻² 0.70
2 Fadan Karshi 0.86 1.43 × 10 1.20 × 10⁻¹ 9.00 × 10⁻² 0.11
3 Kufai Aboro 0.84 4.40 × 10⁻¹ 3.66 × 10⁻² 4.00 × 10⁻² 0.20
4 Ankara 0.68 2.07 × 10⁻² 2.30 × 10⁻² 5.10 × 10⁻² 0.60
5 Maitozo District Head
House 0.60 3.04 × 10⁻¹ 3.05 × 10⁻² 3.00 × 10⁻² 0.40
6 Kwagiri Village 1.00 2.30 × 10⁻¹ 2.54 × 10⁻² 6.00 × 10⁻² 0.80
7 LGEA Landa 0.75 2.30 × 10⁻¹ 2.54 × 10⁻² 7.01 × 10⁻² 0.60
8 Dorowa 0.70 3.00 × 10⁻¹ 3.20 × 10⁻² 1.84 × 10⁻¹ 0.45
9 Kwassu Ung. Dutse 0.50 2.61 × 10⁻¹ 2.20 × 10⁻² 7.11 × 10⁻² 0.35
10 Fadan Ayu 0.64 1.60 × 10⁻¹ 1.74 × 10⁻² 5.12 × 10⁻² 0.70
11 Dangam 0.70 1.83 × 10⁻¹ 1.53 × 10⁻² 7.07 × 10⁻² 0.70
12 LGEA Ancha 0.70 3.22 × 10⁻¹ 3.60 × 10⁻² 1.03 × 10⁻¹ 0.40
13 LGEA Aboro 0.60 1.22 × 10⁻¹ 1.02 × 10⁻² 4.00 × 10⁻² 0.70
14 PHC Kutal 0.45 2.10 × 10⁻¹ 2.30 × 10⁻² 5.50 × 10⁻² 0.40
15 LGEA Amantu 0.50 1.14 × 10⁻¹ 1.30 × 10⁻² 4.00 × 10⁻² 0.80
16 Aboro Village 0.70 2.60 × 10⁻¹ 2.85 × 10⁻² 4.02 × 10⁻¹ 0.50
17 LGEA SabonGida 0.80 4.00 × 10⁻¹ 4.07 × 10⁻² 2.00 × 10⁻¹ 0.40
18 Wasa Village 0.50 1.14 × 10⁻¹ 1.30 × 10⁻² 4.00 × 10⁻² 0.80
H. Hassan et al.
228
Table 3. Summary of aquifer properties for the 18 boreholes in the area of study.
Aquifer property Transmissivity T (m2/s) Hydraulic conductivity k (/m/s)
Minimum 1.14 × 10⁻¹ 1.02 × 10⁻²
Maximum 4.40 × 10⁻¹ 4.07 × 10⁻²
Mean 2.18 × 10⁻¹ 2.18 × 10⁻²
obtained shows the aquifer to be poor in terms of both recharge and discharge of groundwater; this is also an indication of the inefficiency of the aquifer as a transmit-ting medium. It is evidently clear also that the low yields range of between 0.45 to 1.00 l/s recorded, high level of drawdown recorded and poor aquifer properties obtained for the area, indicated that the aquifers in this area are predominantly made of fine clayey or Silty materials which are derived from the in situ chemical decomposition of the basement rock which are generally characterised with low permeability and poor water yield. The value range of conductivity obtained in this study fall within the range of 10−3 to 10−1 as given by [12] for clay, sand and gravel mixtures (till). Similarly poor per-formance of the fractured aquifer in the area can be attributed to low fracture density with poor conduit connectivity which characterise most basement aquifers. Although they yields obtained can sustain water abstraction by hand pump for small population, it will not be sufficient for a higher populated community with greater water demand.
4. Conclusion
The area is characterised by low to moderate groundwater resources, since this is the readily available portable source of water available, there is a need for this resource to be properly harness by carrying out an in-depth investigation on the groundwater re-sources reserve in the area. Similarly it is strongly recommended that a longer duration of pumping test period of about 24 hours should be adopted in the future so that a better assessment of the aquifer productivity and water potentials can be fully properly determined. The use of modern technology and scientific methods such as groundwater modelling will assist in giving the clear picture of the subsurface and understanding of the groundwater resources of the area. It will also give the chance to water managers to properly plan for the present and future water demand for the fast growing population in the area before the provision of pipe borne water is realised in the area.
Acknowledgements
They authors wish to thanks the staffs management of Kaduna state ministry of Water resources for making available the pumping test results and other relevant inform that has assisted in the facilitating this study.
References [1] Nigerian Population Commission (2007) Official Gazette 2006 Population Census, Nigeria.
Vol. 94, Abuja, Nigeria.
[2] Kaduna State Ministry of Water Resources (2008) Baseline Survey and Inventory of Bore-
H. Hassan et al.
229
holes in Kaduna State. Teamwork Global Associates, Kaduna.
[3] Hamidu, H., Garba, M.L., Kana, M.A. and Yelwa, N.A. (2014) Causes of Low Groundwater Yield of Boreholes in Crystalline Basement Complex: a Case Study of Gwantu Town and Environs Southern Part of Kaduna State Nigeria. Water Resources Journal of the Nigerian Association of Hydrogeologists, 24, 20-33.
[4] Jacobson, R. and Webb, J.S. (1946) The Pegmatite of Central Nigeria Geol. Survey of Nige-ria Bulletin No. 17S.
[5] McCurry, P. (1976) The Geology of the Precambrian to Lower Paleozoic Rocks of Northern Nigeria. A Review. In: Kogbe, C.A., Ed., Geology of Nigeria, Elizabeth Pub. Co., Ibadan, Nigeria, 15-38.
[6] Okezie, C.N. (1970) Interim Report on the Geology of the Basement Complex of the 1:100.000 Sheet 167 Kafanchan S.W. Unpublished GSN Report No. 1347.
[7] Nehikhare, J.I. (1971) Geology of Western half of 1:100.000 Sheet 188 (Jema’a) Geology Survey of Nigeria. Unpublished Report No. 1472.
[8] Macleod, W.N. (1971) The Geology of the Jos Plateau with 1:100,000 Sheets 147, 148, 168, 169, 189 and 190. GSN, Bulletin No. 32.
[9] Young, B. (1962) Report on the Basement Complex Geology of the Eastern Half of the 1:100,000 Sheet 189 (Kurra). Unpublished GSN Report No. 1323.
[10] Parkman International and Parkman Nigeria Limited (1997) State-Wide Water Resources Master Plan, Kaduna State.
[11] Kaduna State Water Board (2009) Analysis of Meteorological Data. Hydrological Depart-ment, Kaduna State Water Board, Kaduna.
[12] Bouwer, H. (1978) Groundwater Hydrology, McGraw-Hill Book, New York, 480.
[13] Kruseman, G.P. and de Ridder, N.A. (2000) Analysis and Evaluation of Pumping Test Data. 2nd Edition, International Institute for Land Reclamation and Improvement, 372.
[14] Cooper, H.H. and Jacob, C.E. (1946) A Generalized Graphical Method for Evaluating For-mation Constants and Summarizing Well-field History. Trans-America Geophysical Un-ion, 27, 526-534.
Submit or recommend next manuscript to SCIRP and we will provide best service for you:
Accepting pre-submission inquiries through Email, Facebook, LinkedIn, Twitter, etc. A wide selection of journals (inclusive of 9 subjects, more than 200 journals) Providing 24-hour high-quality service User-friendly online submission system Fair and swift peer-review system Efficient typesetting and proofreading procedure Display of the result of downloads and visits, as well as the number of cited articles Maximum dissemination of your research work
Submit your manuscript at: http://papersubmission.scirp.org/