groundwater quality on a waste disposal area due to sand ... · 1departamento de petrologia e...
TRANSCRIPT
Groundwater quality on a waste disposal area due to sand mining activities in São Paulo State, Brazil
D. M. Bonotto1 & E. G. de Oliveira2 1Departamento de Petrologia e Metalogenia, Instituto de Geociências e Ciências Exatas-UNESP, Rio Claro, Brazil 2Departamento de Geologia Aplicada, Instituto de Geociências e Ciências Exatas-UNESP, Rio Claro, Brazil
Abstract
This investigation reports the results of a study realized in an area related to the development of sand mining activities, which belongs to Sibelco Mineração Ltd. The site is located around Analândia municipality, nearly in the center of São Paulo State, Brazil. Hydrochemical analyses of groundwater were realized under different periods of time, with the aim of evaluating the possibility of release of several constituents to the liquid phase, which may be a source of pollution of the surface hydrological resources and of the deeper Guarani aquifer. This is because the site is located at the recharge area of Guarani aquifer and some tributaries from Corumbataí river may also be suffering contamination, implying on the impoverishment of the water quality that are very important resources in the region, as they are extensively used for drinking purposes, among others. Keywords: sand mining activities, water quality, groundwater, elemental concentrations, trace and heavy metals, São Paulo State.
1 Introduction
The São Paulo State in Brazil, due to its advanced stage of agricultural and industrial growth, has a great diversity of problems related to the interaction between the society and the environment. The sand mining activities in Depressão Periférica geomorphological province are presently very important, because potentially they can be a source of anthropogenic impacts, since several
Environmental Health and Biomedicine 279
www.witpress.com, ISSN 1743-3525 (on-line) WIT Transactions on Biomedicine and Health, Vol 15, © 2011 WIT Press
doi:10.2495/EHR110251

chemicals are used for the treatment of natural sand like HCl, H2SO4, NaOH and Na2SiO4, generating mine tailings that can pollute the surface and underground hydrological resources. This study focuses one area belonging to Sibelco Mineração Ltd., located about 5-6 km from Analândia city, nearly in the center of São Paulo State (Fig. 1). The knowledge of the concentrations of dissolved elements and compounds is needed in order to establish their background values and to predict their potential increase in future years. Thus, the purpose of this paper is to compare the values obtained for various parameters in groundwater from the studied area with those defined by the national standards for drinking water.
Figure 1: Location of the Analândia city at São Paulo State, Brazil, and simplified geological map of area studied. Modified from [1–3].
280 Environmental Health and Biomedicine
www.witpress.com, ISSN 1743-3525 (on-line) WIT Transactions on Biomedicine and Health, Vol 15, © 2011 WIT Press

2 General features of the area studied
The area is situated within the Corumbataí river basin that occurs in an eroded belt in the cuestas zone of the Depressão Periférica geomorphological province [4]. The Corumbataí river basin extends over an area of about 1,581 km2. It is a sub-basin of the giant Paraná sedimentary basin, whose area is about 1,000,000 km2 in Brazilian surface [5]. Several stratigraphic units of the Paraná basin (Paleozoic - Cenozoic) crop-out in it as described by [3], where the main lithologies include: the Lower and Upper units from Pirambóia Formation, the Botucatu Formation and the weathered cover developed over Pirambóia Formation (red-yellow latosols). The Lower unit from Pirambóia Formation consists of a consolidated whitish sandstone (after washing) with well-preserved sedimentary structures, whose thickness is more than 80 m, the retention after grinding is greater on the 0.125 mm-size sieve, and the Fe oxide mineral content is low. The occurrence of small clay lenses of variable lateral size is very common in this unit. The Upper unit from Pirambóia Formation is a light pink saprolite characterized by thin sedimentary structures and very brittle sandstone located above the water table, whose concentration of Fe oxide is also low and the dominant particle-size after milling is in the range 0.125-0.25 mm. A 1-30 cm thick stone line profile [6] occurring as an irregular replica of the topography divides the Upper unit from Pirambóia Formation and the above located mantle of weathering, which is constituted by tabular blocks of sandstones cemented by black coloured limonite, dark red ferruginous concretions, small tablets of limonite cementing sandstone, SiO2 pebbles, weathered yellowish sandstone and major concentration of heavy minerals (hematite, magnetite and ilmenite). The Botucatu Formation is represented in the area by weathered sandstones with high content of Fe oxide and particle-size predominantly in the range 0.5-1 mm. The weathered cover developed over Pirambóia Formation includes: peat soil, creep soil, and soil above the stone line. The peat soil is light grey-black colored, and occurs from the point of the discharge of the water table up to the contour level corresponding to that of the local streams. The creep soil is very clayey (12-20%), occurs on the steep ground, being characterized by a red-brownish color, values of Fe oxide content of about 5000 ppm, and presence of limonite concretions between 2 and 6 m depth. The soil above the stone line is yellow-orangish colored, its thickness may attain 18 m, occurs where the ground slope is smooth, has a clay content varying between 7 and 18%, and a higher Fe oxide content near the surface due to the laterization, which diminishes with increasing depth, rising again at the stone line position. The area investigated in this study is inserted within the Taipas stream sub-basin of the Corumbataí river basin (Fig. 1). The Taipas stream is the main drainage in the area; its name changes to Ponte Funda current, about 1 km upstream from the sand mining area. Its general flow direction is NE-SW, flowing towards SW up to the confluence with the Corumbataí River. Its average
Environmental Health and Biomedicine 281
www.witpress.com, ISSN 1743-3525 (on-line) WIT Transactions on Biomedicine and Health, Vol 15, © 2011 WIT Press

discharge is 337.49 L/s, decreasing approximately 10% during the drier months. It also controls the groundwater flow as demonstrates the piezometric lines direction characterized by a gradient increase at the channel position (Fig. 2). The mean ground slope of Taipas stream is 2.0% and slightly lower (1.3%) in front of the sand mining area, where the groundwater flow lines exhibit the following characteristics (Fig. 2): a) hydraulic gradient ranging from 0.10 (10% or 6o) to 0.15 (15% or 8o); b) main direction of the flow vectors varying from N-S to NW-SE.
Figure 2: Piezometric map and location of decantation pools and tanks at the studied area.
However, some distortions occur in the groundwater flow lines, mainly between the monitoring wells 2 and 8, which are caused by two dominant factors: 1. Existence of a fault line that created a more permeable zone in this region, responsible by the water table lowering in monitoring well 8. Actually, such deformation extends from the area between wells 2 and 8 up to the monitoring well 7, along the fault. This faulting fits the regional pattern despite being masked by the weathered cover developed over Pirambóia Formation. 2. Sedimentary character of the flow net, i.e. it occurs in the Lower unit from Pirambóia Formation that controls its direction. Thus, there is no complete subordination to the hydraulic gradient, but also to the less permeable and more
Monitoring Well
Decantation Tank and Pool
6
Scale
200 40 60m
3
C
A
625
Road
Stream
Buildings
Mining Front
626637
650
640
630 6
ANAL
ÂNDI
A 4
KM
660
5 4
B1
B2
1
665
Piezometric Curve
Flow Line
630
TAIPAS
628
629
7
754.000 - N
630
2
5
660
8 650
632
228.500 - E6
640
635
7
Stream
282 Environmental Health and Biomedicine
www.witpress.com, ISSN 1743-3525 (on-line) WIT Transactions on Biomedicine and Health, Vol 15, © 2011 WIT Press
compact characters of this unit. This aspect is reinforced by the lower inflexion of the flow lines towards Taipas stream, where occurs the groundwater discharge. The flow lines in Fig. 2 also indicate that the zones of lower altitude (630-650 m) exhibit higher permeability and lower hydraulic gradient than the areas situated at the more elevated altitudes (650-665 m).
3 Material and methods
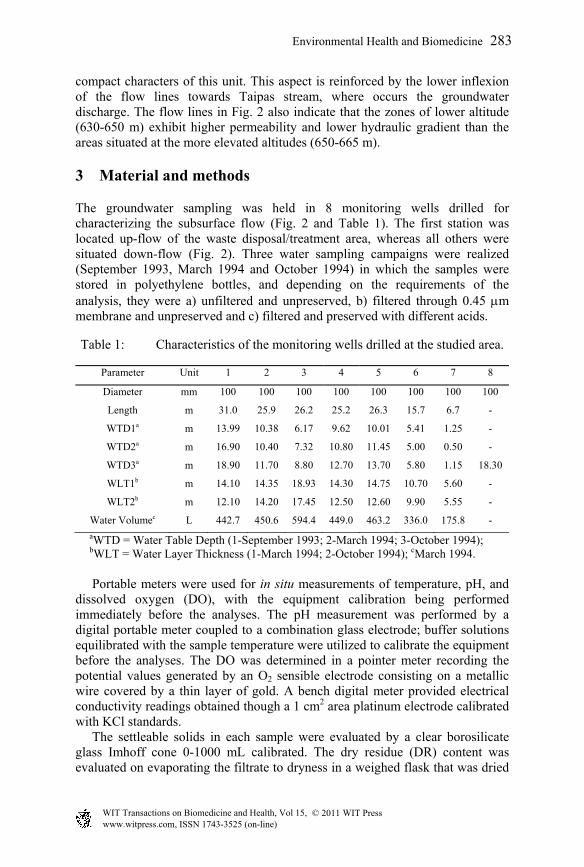
The groundwater sampling was held in 8 monitoring wells drilled for characterizing the subsurface flow (Fig. 2 and Table 1). The first station was located up-flow of the waste disposal/treatment area, whereas all others were situated down-flow (Fig. 2). Three water sampling campaigns were realized (September 1993, March 1994 and October 1994) in which the samples were stored in polyethylene bottles, and depending on the requirements of the analysis, they were a) unfiltered and unpreserved, b) filtered through 0.45 m membrane and unpreserved and c) filtered and preserved with different acids.
Table 1: Characteristics of the monitoring wells drilled at the studied area.
Parameter Unit 1 2 3 4 5 6 7 8
Diameter mm 100 100 100 100 100 100 100 100
Length m 31.0 25.9 26.2 25.2 26.3 15.7 6.7 -
WTD1a m 13.99 10.38 6.17 9.62 10.01 5.41 1.25 -
WTD2a m 16.90 10.40 7.32 10.80 11.45 5.00 0.50 -
WTD3a m 18.90 11.70 8.80 12.70 13.70 5.80 1.15 18.30
WLT1b m 14.10 14.35 18.93 14.30 14.75 10.70 5.60 -
WLT2b m 12.10 14.20 17.45 12.50 12.60 9.90 5.55 -
Water Volumec L 442.7 450.6 594.4 449.0 463.2 336.0 175.8 -
aWTD = Water Table Depth (1-September 1993; 2-March 1994; 3-October 1994); bWLT = Water Layer Thickness (1-March 1994; 2-October 1994); cMarch 1994. Portable meters were used for in situ measurements of temperature, pH, and dissolved oxygen (DO), with the equipment calibration being performed immediately before the analyses. The pH measurement was performed by a digital portable meter coupled to a combination glass electrode; buffer solutions equilibrated with the sample temperature were utilized to calibrate the equipment before the analyses. The DO was determined in a pointer meter recording the potential values generated by an O2 sensible electrode consisting on a metallic wire covered by a thin layer of gold. A bench digital meter provided electrical conductivity readings obtained though a 1 cm2 area platinum electrode calibrated with KCl standards. The settleable solids in each sample were evaluated by a clear borosilicate glass Imhoff cone 0-1000 mL calibrated. The dry residue (DR) content was evaluated on evaporating the filtrate to dryness in a weighed flask that was dried
Environmental Health and Biomedicine 283
www.witpress.com, ISSN 1743-3525 (on-line) WIT Transactions on Biomedicine and Health, Vol 15, © 2011 WIT Press

to constant weight at 180C, with the increase in flask weight representing DR [7]. The BOD (Biochemical Oxygen Demand) was measured by the dilution method, employing high purity distilled water provided by Barnstead Mega-Pure One Liter Water Still. For this purpose, the dissolved oxygen (DO) content remaining in six portions of each well-mixed sample transferred to different 300-mL glass-stopped bottles was evaluated after a 5-day incubation period. The DO values measured potentiometrically by using a DO probe were plotted against the sample volume taken, yielding a straight line that allowed obtain the BOD data. The chemical oxygen demand (COD) was evaluated by the dichromate reflux method [7], using aliquots acidified to pH=2 with concentrated H2SO4. Standard analytical techniques consisting on colorimetry and inductively-coupled plasma spectrometry were used for determining the following metals in the water samples: Fe, Al, Ca, Pb, Mg, Ni and Ag. The amount of Pb, Al and Fe in the samples collected in September 1993 and March 1994 was estimated colorimetrically by Hach DR/2000 spectrophotometer [8]. Lead ions in basic solution reacted with dithizone to form a pink to red lead-dithizonate complex, extracted with chloroform and read at 515 nm. The aluminon method that utilizes ascorbic acid provided the measurements for aluminum, read at 522 nm. The 1,10 phenanthroline indicator formed an orange color in proportion to the iron concentration, which was read at 510 nm. All other analyses were realized by inductively-coupled plasma spectrometry [9] that exhibits a lower detection limit than colorimetry. Tables 2-4 report the results of the measurements.
Table 2: Analytical data of the groundwater samples collected in 09/06/1993.
Parameter Unit 1 2 3 4 5 6 7
Temperature oC 30 27 29 29 30 30 26
DO mg/L 2.6 7.6 8.9 6.5 4.0 7.7 4.1
pH - 6.85 5.95 6.30 6.07 6.17 6.13 6.42
Conductivity S/cm 510.0 25.1 21.1 66.2 55.0 101.9 84.4
Iron mg/L 3.00 0.02 0.06 <0.02 <0.02 <0.02 0.60
Aluminum mg/L 3.30 0.10 0.10 0.10 0.10 0.10 2.20
Calcium mg/L 3.50 0.50 0.90 0.80 1.70 8.20 3.20
Lead mg/L 0.10 0.10 0.10 0.10 0.10 0.10 0.10
Magnesium mg/L 1.50 0.20 0.30 0.20 0.70 2.30 0.60
Nickel mg/L <0.02 0.02 0.09 0.02 0.02 <0.02 0.02
Silver mg/L 0.10 0.10 0.10 0.10 0.10 0.10 0.10
COD mg/L 36.80 18.40 9.20 9.20 9.20 27.60 9.20
BOD mg/L 44.75 19.00 6.84 8.68 8.30 9.52 11.36
Dry residue mg/L 364 46 28 568 44 62 118
Settleable solids mg/L 47.72 0.01 1.04 0.01 1.20 0.03 382.93
284 Environmental Health and Biomedicine
www.witpress.com, ISSN 1743-3525 (on-line) WIT Transactions on Biomedicine and Health, Vol 15, © 2011 WIT Press

Table 3: Analytical data of the groundwater samples collected in 03/31/1994.
Parameter Unit 1 2 3 4 5 6 7
DO mg/L 5.1 2.0 4.8 3.7 3.5 4.1 3.2
pH - 6.51 5.65 5.97 6.30 6.37 5.86 6.31
Conductivity S/cm 356.0 33.2 27.6 89.0 69.7 105.1 79.5
Iron mg/L 0.05 0.10 <0.02 0.03 <0.02 <0.02 <0.02
Aluminum mg/L 0.10 0.10 0.10 0.10 0.10 0.10 0.10
Calcium mg/L 1.50 0.60 0.60 1.20 1.40 8.30 4.50
Lead mg/L 0.10 0.10 0.10 0.10 0.10 0.10 0.10
Magnesium mg/L 0.70 0.30 0.30 0.30 0.70 2.50 0.80
Nickel mg/L <0.02 0.02 0.02 0.02 0.02 <0.02 0.02
Silver mg/L 0.10 0.10 0.10 0.10 0.10 0.10 0.10
COD mg/L 6.48 4.33 4.32 17.44 16.28 2.32 19.76
BOD mg/L 6.11 0.94 3.29 5.64 4.23 1.87 3.29
Dry residue mg/L 200 60 16 16 80 100 112
Settleable solids mg/L 0.70 49.95 0.75 3.10 1.55 0.30 0.60
Table 4: Analytical data of the groundwater samples collected in 10/14/1994.
Parameter Unit 1 2 3 4 5 6 7 8
Temperature oC 27 26 25 25 25 25 24 25
DO mg/L 3.2 5.8 7.3 7.3 6.4 7.4 7.0 7.0
pH - 6.29 5.20 5.87 5.60 5.71 5.50 6.42 5.80
Conductivity S/cm 312.0 50.0 18.7 107.0 101.0 103.0 82.0 49.2
Iron mg/L 0.80 0.01 <0.01 <0.01 <0.01 0.04 0.08 0.01
Aluminum mg/L 1.07 0.02 0.01 0.03 0.02 0.05 0.37 0.06
Calcium mg/L 1.77 0.92 0.66 0.90 1.74 8.05 5.12 1.66
Lead mg/L 0.01 0.01 0.01 0.01 0.01 0.01 0.02 0.02
Magnesium mg/L 0.74 0.48 0.27 0.29 0.82 2.57 0.91 0.82
Nickel mg/L <0.02 0.02 0.02 0.02 0.02 <0.02 0.02 0.02
Silver mg/L 0.10 0.10 0.10 0.10 0.10 0.10 0.10 0.10
COD mg/L 6.24 <1.00 <1.00 6.24 12.49 <1.00 6.24 <1.00
BOD mg/L <5.0 <5.0 <5.0 <5.0 12.5 <5.0 <5.0 <5.0
Dry residue mg/L 216 40 26 102 67 90 48 32
Settleable solids mg/L 0.10 0.01 0.01 0.01 0.10 0.01 0.10 0.01
Environmental Health and Biomedicine 285
www.witpress.com, ISSN 1743-3525 (on-line) WIT Transactions on Biomedicine and Health, Vol 15, © 2011 WIT Press

4 Discussion
The permissible concentration limits in Class 2 Brazilian fresh waters as established by National Register CONAMA 20 (published on 18 June 1986) is given in Table 5 and will be used as reference values to compare all data reported here.
Table 5: Permissible concentration limits in Class 2 Brazilian fresh waters established by national register CONAMA 20 published on 18 June 1986.
PARAMETER UNIT VALUE pH - between 6 and 9
Settleable solids mL/L 1a
Total Dissolved Solids (~DR) mg/L < 500 DO mg/L > 5
BOD mg/L 5 Lead mg/L 0.03
Soluble Iron mg/L 0.3 Nickel mg/L 0.025 Silver mg/L 0.01
Aluminum mg/L 0.1 aFor the release of effluents. The highest value found for the settleable solids corresponded to 383 mg/L (Table 2). Under the most pessimistic assumption, if they would have the water density (1 g/mL), then, it would be possible estimate 0.38 mL/L for the settleable solids that is below the guidance value of 1 mL/L for this parameter (Table 5). The total dissolved solids exceeded the CONAMA guideline values in one sampling campaign (September 1993) of monitoring well 4, however, it is within the analytical uncertainty of the technique (10-15%). The conductivity was always higher at bore 1 in all sampling campaigns. In general, higher total dissolved solids content also imply on more elevated conductivity values in water bodies and such trend was verified at bore 1 in the last two monitoring programs. The National Register CONAMA 20 did not establish guidance levels for calcium and magnesium. The highest Ca and Mg contents were found at monitoring well 6, respectively, 8.0-8.3 mg/L and 2.3-2.6 mg/L. No health-based guideline value is proposed for hardness due to Ca and Mg in drinking-water by WHO [10]. Depending on the interaction of other factors, such as pH and alkalinity, water with hardness above approximately 200 mg/L may cause scale deposition in the treatment works, distribution system and pipework and tanks within buildings [10]. The data reported here are well below this value. Some pH values are lower than the minimum of 6, as given in Table 5, and could be attributed to occasional anthropogenic inputs. The lowest value was 5.2 at monitoring well 2, whose sampling occurred in October 1994. However, the
286 Environmental Health and Biomedicine
www.witpress.com, ISSN 1743-3525 (on-line) WIT Transactions on Biomedicine and Health, Vol 15, © 2011 WIT Press
low values of conductivity (50 S/cm) and dry residue (40 mg/L) in this bore do not favor the enhanced presence of the cation Na+ and anions SO4
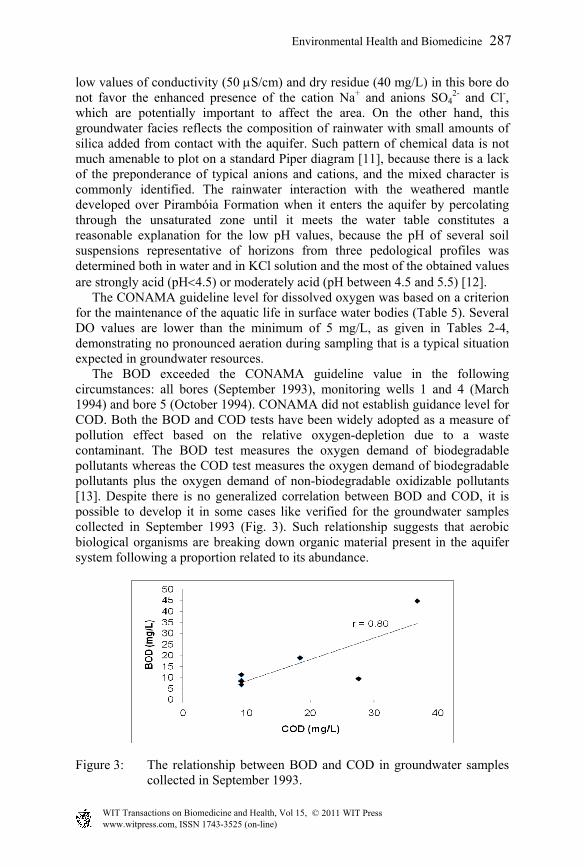
2- and Cl-, which are potentially important to affect the area. On the other hand, this groundwater facies reflects the composition of rainwater with small amounts of silica added from contact with the aquifer. Such pattern of chemical data is not much amenable to plot on a standard Piper diagram [11], because there is a lack of the preponderance of typical anions and cations, and the mixed character is commonly identified. The rainwater interaction with the weathered mantle developed over Pirambóia Formation when it enters the aquifer by percolating through the unsaturated zone until it meets the water table constitutes a reasonable explanation for the low pH values, because the pH of several soil suspensions representative of horizons from three pedological profiles was determined both in water and in KCl solution and the most of the obtained values are strongly acid (pH4.5) or moderately acid (pH between 4.5 and 5.5) [12]. The CONAMA guideline level for dissolved oxygen was based on a criterion for the maintenance of the aquatic life in surface water bodies (Table 5). Several DO values are lower than the minimum of 5 mg/L, as given in Tables 2-4, demonstrating no pronounced aeration during sampling that is a typical situation expected in groundwater resources. The BOD exceeded the CONAMA guideline value in the following circumstances: all bores (September 1993), monitoring wells 1 and 4 (March 1994) and bore 5 (October 1994). CONAMA did not establish guidance level for COD. Both the BOD and COD tests have been widely adopted as a measure of pollution effect based on the relative oxygen-depletion due to a waste contaminant. The BOD test measures the oxygen demand of biodegradable pollutants whereas the COD test measures the oxygen demand of biodegradable pollutants plus the oxygen demand of non-biodegradable oxidizable pollutants [13]. Despite there is no generalized correlation between BOD and COD, it is possible to develop it in some cases like verified for the groundwater samples collected in September 1993 (Fig. 3). Such relationship suggests that aerobic biological organisms are breaking down organic material present in the aquifer system following a proportion related to its abundance.
Figure 3: The relationship between BOD and COD in groundwater samples collected in September 1993.
Environmental Health and Biomedicine 287
www.witpress.com, ISSN 1743-3525 (on-line) WIT Transactions on Biomedicine and Health, Vol 15, © 2011 WIT Press

The Ag detection limit (0.10 mg/L) in all sampling campaigns was above the CONAMA guidance level (0.01 mg/L). Ni exceeded the reference value in one sampling campaign (September 1993) of monitoring well 3, without a reasonable explanation. The Pb detection limit (0.10 mg/L) in the sampling campaigns held in September 1993 and March 1994 was above the CONAMA guideline value (0.03 mg/L). However, Pb was always below this reference value in the sampling campaign held in October 1994. Fe always exceeded the CONAMA guidance level in monitoring well 1, the same occurring with Al in the sampling campaigns held in the wettest seasons (September 1993 and October 1994). Groundwater providing from this borehole often exhibited high turbidity possibly caused by some pre-filter leakage. Such assumption is reinforced by the enhanced Fe and Al contents in bore 1 relatively to others, as well by its location up-flow of the waste disposal/treatment area (Fig. 2). However, some anthropogenic inputs of these constituents are evidenced at monitoring well 7 during the sampling campaigns held in the wettest seasons, when the water table raised. This is supported by the fact that bore 7 was situated down-flow of the waste disposal/treatment area in a zone dominated by higher permeability and lower hydraulic gradient.
5 Conclusion
Hydrogeochemical monitoring held in eight bores drilled for characterizing the subsurface flow in a waste disposal/treatment area coupled to the development of Sand mining activities in São Paulo State, Brazil, allowed identify some anthropogenic inputs. BOD, Fe and Al contents in several groundwater samples have exceeded the permissible concentration limits in Class 2 Brazilian fresh waters as established by National Register CONAMA 20 published on 18 June 1986). The enhanced levels of these parameters is possibly related to the use of several organic and inorganic chemicals for the treatment of natural sand, which have generated mine tailings able to pollute the aquifer system occurring in the area. The BOD, Fe and Al levels decreased from September 1993 to October 1994 at a monitoring well situated in a zone dominated by higher permeability and lower hydraulic gradient. However, further monitoring programs would be needed for clarifying if the concentration decrease has been caused by natural attenuation processes, different rainfall regime, human action or others factors. This is because the site is located at the recharge area of Guarani aquifer and can also contaminate some tributaries from Corumbataí River, which are very important hydrological resources in the region.
References
[1] IG (Instituto Geológico), Formações geológicas de superfície-Folha Geológica de Corumbataí-Fl. SF-23-Y-A-12, 1:50000. Instituto Geológico, São Paulo, 1984.
[2] IPT (Instituto de Pesquisa Tecnológica do Estado de São Paulo), Mapa Geológico do Estado de São Paulo. São Paulo, Monografias, 1981.
288 Environmental Health and Biomedicine
www.witpress.com, ISSN 1743-3525 (on-line) WIT Transactions on Biomedicine and Health, Vol 15, © 2011 WIT Press

[3] Tandel, R.Y., Caracterização do arenito Pirambóia da Fazenda São João em Analândia, SP, e sua utilização industrial, USP, São Paulo, 75 pp., 1993.
[4] Penteado, M.M., Geomorfologia do setor centro-ocidental da Depressão Periférica paulista. Série teses e monografias, 22, IGEOG/USP, São Paulo, 1976.
[5] França, A.B. & Potter, P.E., Stratigraphy, Depositional Environment and Reservoir Analysis from Itararé Group, Paraná basin (Part 1). Petrobrás Geociences Bulletin, 2 (2/4), pp. 147-192, 1988.
[6] Lecomte, P., Stone line profiles: importance in geochemical exploration, J. Geochem. Explor., 30, pp. 35-61, 1988.
[7] APHA (American Public Health Association), Standard methods for the examination of water and wastewater. 17th edn, Washington, 1989.
[8] HACH, Water Analysis Handbook, 2nd edn, Hach Company: Loveland, 1992.
[9] Nollet, L.M.L., Handbook of Water Analysis, 2nd edn, Taylor & Francis Group: New York, 2007.
[10] Guidelines for drinking water quality; WHO (World Health Organization), Online. www.who.int/water_ sanitation_health/ dwq/ gdwq3/en/
[11] Piper, A.M., A graphic procedure in the geochemical interpretation of water analyses, Trans.Amer.Geophysical Union, 25, pp.914-928, 1944.
[12] Jiménez-Rueda, J.R., Comments about some mineralogical data and pH values of soil suspensions from Pirambóia Formation, 1994.
[13] Sawyer, C.N., McCarty, P.L. & Parkin, G.F., Chemistry for Environmental Engineering and Science, 5th edn, McGraw-Hill: New York, 2003.
Environmental Health and Biomedicine 289
www.witpress.com, ISSN 1743-3525 (on-line) WIT Transactions on Biomedicine and Health, Vol 15, © 2011 WIT Press