groundwater resource description
TRANSCRIPT
NSW Department of Planning, Industry and Environment | dpie.nsw.gov.au
DARLING ALLUVIUM WATER RESOURCE PLAN
Groundwater Resource Description
Darling Alluvium Water Resource Plan
Published by NSW Department of Planning, Industry and Environment
Title: Groundwater Resource Description
Subtitle: Darling Alluvium Water Resource Plan
First published: July 2019
NOTE: On 1 July 2019, NSW Department of Industry became part of NSW Department of Planning, Industry and
Environment. Any references to Department of Industry in this document, except where made in a historical context, can
be taken to refer to Department of Planning, Industry and Environment.
Department reference number: INT18/35157
More information
Andrew McCallum / NSW Department of Industry / Parramatta
© State of New South Wales through Department of Industry 2019. You may copy, distribute, display, download and otherwise freely deal with this publication for any purpose, provided that you attribute the Department of Industry as the owner. However, you must obtain permission if you wish to charge others for access to the publication (other than at cost); include the publication in advertising or a product for sale; modify the publication; or republish the publication on a website. You may freely link to the publication on a departmental website. Disclaimer: The information contained in this publication is based on knowledge and understanding at the time of writing (July 2019) and may not be accurate, current or complete. The State of New South Wales (including the NSW Department of Industry), the author and the publisher take no responsibility, and will accept no liability, for the accuracy, currency, reliability or correctness of any information included in the document (including material provided by third parties). Readers should make their own inquiries and rely on their own advice when making decisions related to material contained in this publication.
Groundwater Resource Description
NSW Department of Industry | INT18/35157 | i
Contents Glossary ............................................................................................................................................ iv
1 Introduction ................................................................................................................................ 1
2 History of Groundwater Management ........................................................................................ 2
2.1 Early groundwater management ........................................................................................ 2
2.2 NSW water reforms ............................................................................................................ 4
2.3 Darling Alluvium .................................................................................................................. 4
3 Regional Setting ........................................................................................................................ 6
3.1 Topography ........................................................................................................................ 6
3.2 Climate ............................................................................................................................... 9
3.2.1 Rainfall ........................................................................................................................ 9
3.2.2 Evaporation ............................................................................................................... 10
3.2.3 Temperature .............................................................................................................. 10
3.3 Land use ........................................................................................................................... 13
4 Geology ................................................................................................................................... 15
4.1 Upper Darling Alluvium ..................................................................................................... 15
4.2 Lower Darling Alluvium ..................................................................................................... 15
5 Hydrogeology ........................................................................................................................... 19
5.1 Regional context ............................................................................................................... 19
5.2 Upper Darling Alluvium ..................................................................................................... 19
5.3 Lower Darling Alluvium ..................................................................................................... 19
5.4 Connection with surface water ......................................................................................... 20
6 Groundwater Dependent Ecosystems ..................................................................................... 23
7 Groundwater Quality ................................................................................................................ 26
7.1 Upper Darling Alluvium ..................................................................................................... 26
7.2 Lower Darling Alluvium ..................................................................................................... 27
8 Groundwater Management ...................................................................................................... 28
8.1 Access rights .................................................................................................................... 28
8.2 Extraction limits ................................................................................................................ 29
8.3 Available water determinations ......................................................................................... 30
8.4 Groundwater accounts ..................................................................................................... 31
8.5 Groundwater take ............................................................................................................. 31
8.6 Groundwater dealings ...................................................................................................... 37
8.6.1 Temporary ................................................................................................................. 37
8.6.2 Permanent ................................................................................................................. 37
9 Groundwater Monitoring .......................................................................................................... 38
10 Groundwater Behaviour ....................................................................................................... 42
Groundwater Resource Description
NSW Department of Industry | INT18/35157 | ii
10.1 Introduction ....................................................................................................................... 42
10.2 Example hydrograph ........................................................................................................ 42
10.3 Representative hydrographs ............................................................................................ 43
10.4 Contour and change maps ............................................................................................... 47
References ...................................................................................................................................... 50
Figures Figure 1 Bourke, Menindee and Mildura average monthly rainfall 1989 – 2017 ............................... 9
Figure 2 Bourke, Menindee and Mildura rainfall residual mass graph 1989 – 2017 ....................... 10
Figure 3 Bourke, Menindee and Mildura average monthly evaporation 1989 – 2017 .................... 10
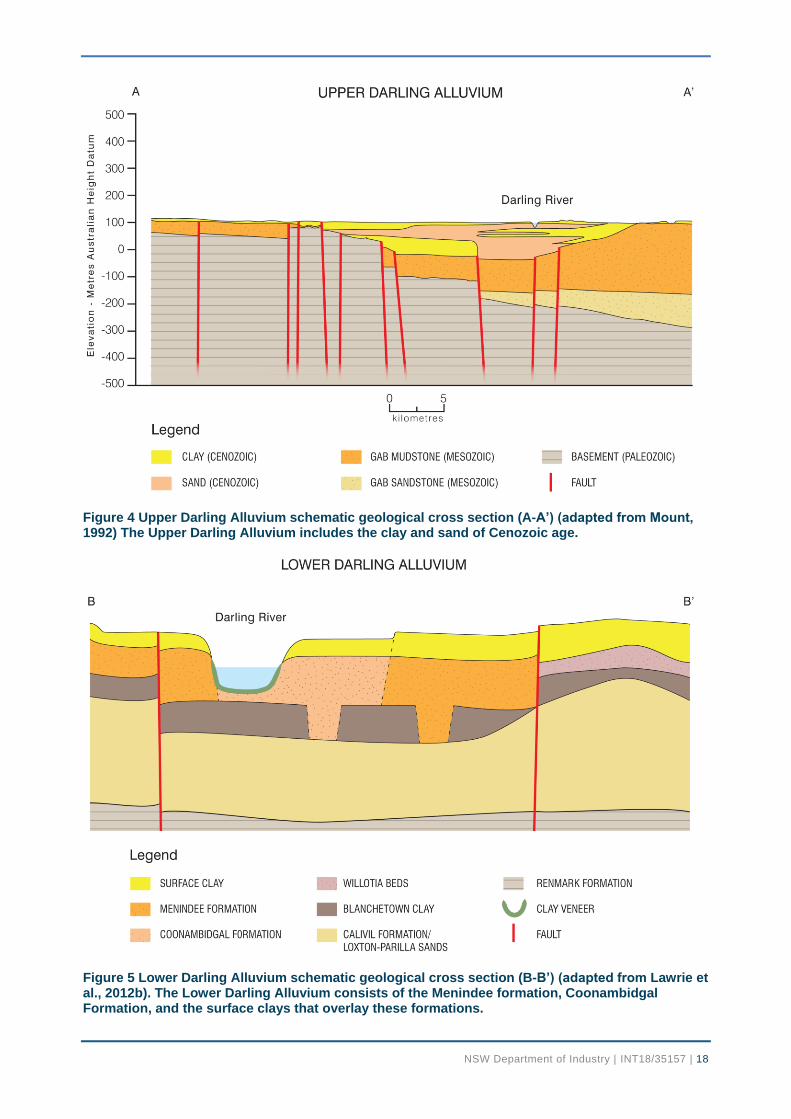
Figure 4 Upper Darling Alluvium schematic geological cross section (A-A’) (adapted from Mount,
1992) The Upper Darling Alluvium includes the clay and sand of Cenozoic age. .......................... 18
Figure 5 Lower Darling Alluvium schematic geological cross section (B-B’) (adapted from Lawrie et
al., 2012b). The Lower Darling Alluvium consists of the Menindee formation, Coonambidgal
Formation, and the surface clays that overlay these formations. .................................................... 18
Figure 6 Upper Darling Alluvium annual extraction compared to the LTAAEL ............................... 30
Figure 7 Lower Darling Alluvium annual extraction compared to the LTAAEL ............................... 30
Figure 8 Pre and post water sharing plan metered extraction for Upper Darling Alluvium (not
including extraction for town water supply) ..................................................................................... 31
Figure 9 Pre and post water sharing plan metered extraction for Lower Darling Alluvium (not
including extraction for Curlwaa Groundwater Interception Scheme) ............................................. 32
Figure 10 Schematic diagram of different types of aquifers ............................................................ 39
Figure 11 Example of a groundwater hydrograph identifying trends in groundwater responses to
pumping and climate. ...................................................................................................................... 42
Figure 12 Hydrographs for monitoring bore site GW036934 – Near Bourke .................................. 45
Figure 13 Hydrographs for monitoring bore site GW036848 – Between Louth and Tilpa............... 45
Figure 14 Hydrographs for monitoring bore site GW036839 – Near Wilcannia .............................. 45
Figure 15 Hydrographs for monitoring bore site GW087805 – Near Menindee .............................. 46
Figure 16 Hydrographs for monitoring bore site GW036812 – Downstream of Menindee ............. 46
Figure 17 Hydrographs for monitoring bore site GW088052 – Near Wentworth ............................ 46
Maps Map 1 Location of the Darling Alluvium Water Resource Plan area ................................................. 3
Map 2 Elevations across the catchment ........................................................................................... 7
Map 3 Surface water features in the catchment ............................................................................... 8
Map 4 Average annual rainfall in the catchment ............................................................................. 11
Map 5 Average annual evaporation in the catchment ..................................................................... 12
Map 6 Land use in the catchment ................................................................................................... 14
Map 7 Surface geology of the catchment. Note: GAB = Great Artesian Basin; LFB = Lachlan Fold
Belt; KFB = Kanmantoo Fold Belt; AFB = Adelaide Fold Belt. ........................................................ 16
Map 8 Indicative locations of schematic cross sections A-A’ and B-B’ for the Darling Alluvium ..... 17
Groundwater Resource Description
NSW Department of Industry | INT18/35157 | iii
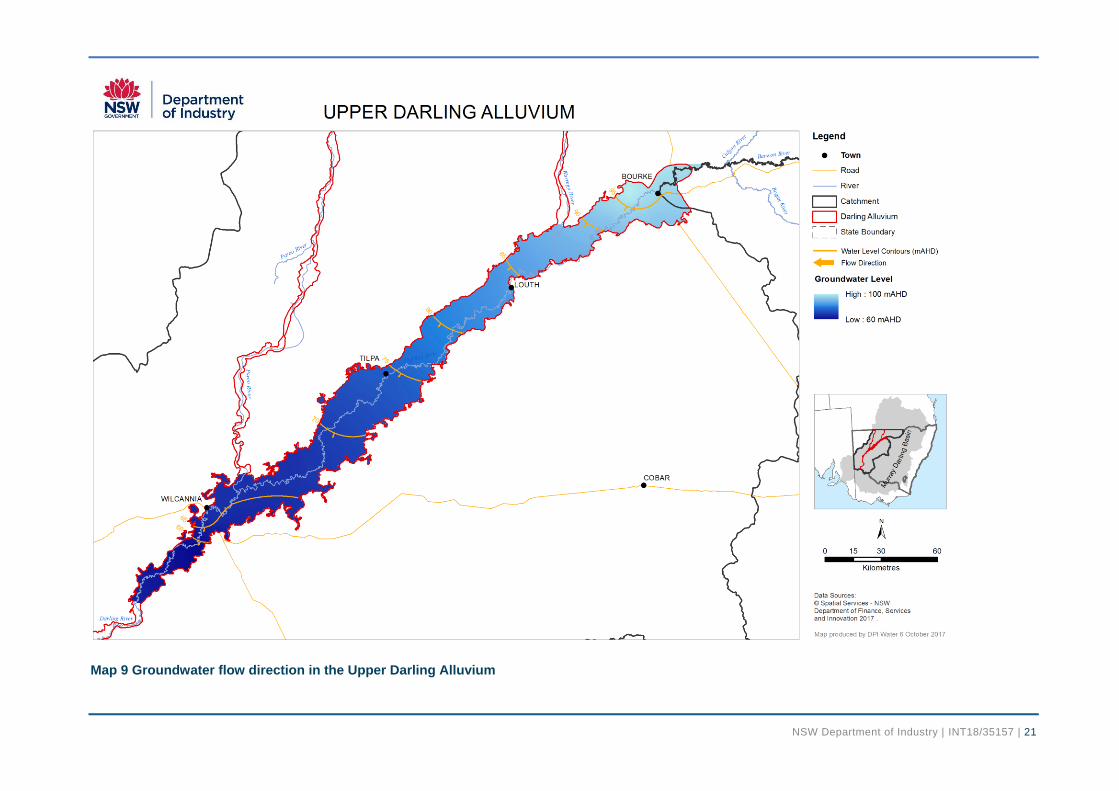
Map 9 Groundwater flow direction in the Upper Darling Alluvium ................................................... 21
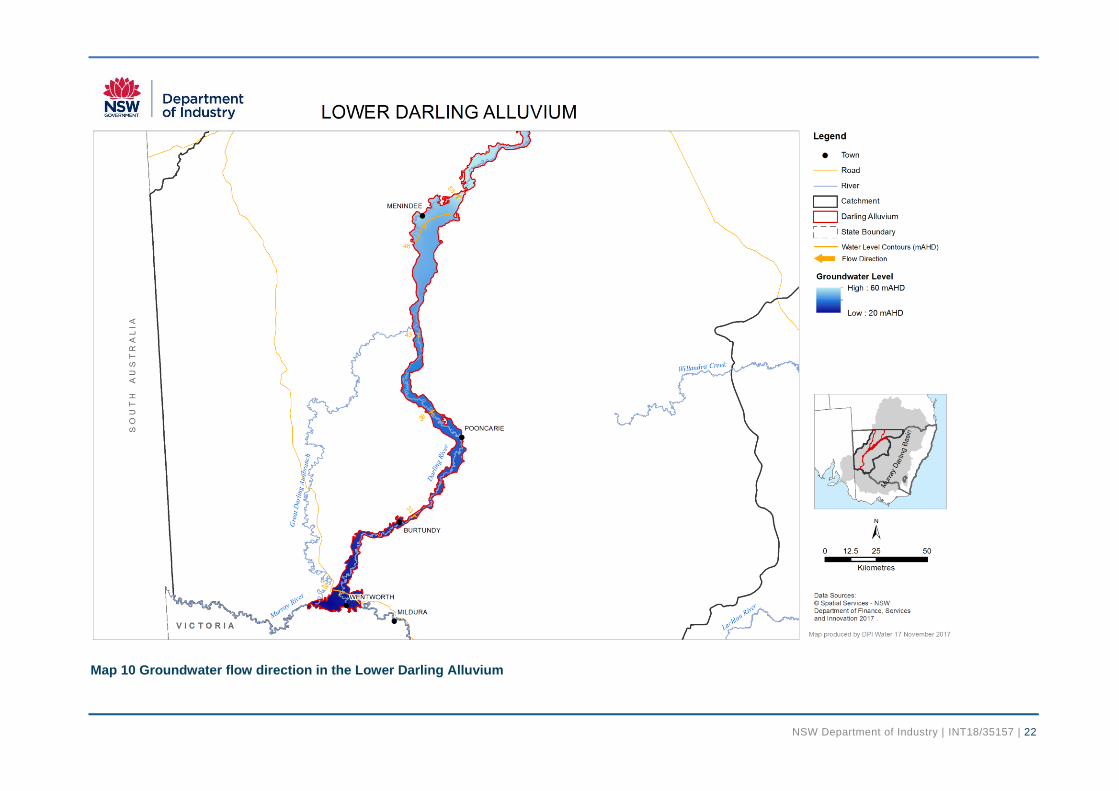
Map 10 Groundwater flow direction in the Lower Darling Alluvium ................................................. 22
Map 11 Ecological value for high probability groundwater dependent vegetation ecosystems in and
around the Upper Darling Alluvium ................................................................................................. 24
Map 12 Ecological value for high probability groundwater dependent vegetation ecosystems in and
around the Lower Darling Alluvium ................................................................................................. 25
Map 13 Registered bores in Upper Darling Alluvium ...................................................................... 33
Map 14 Registered bores in Lower Darling Alluvium ...................................................................... 34
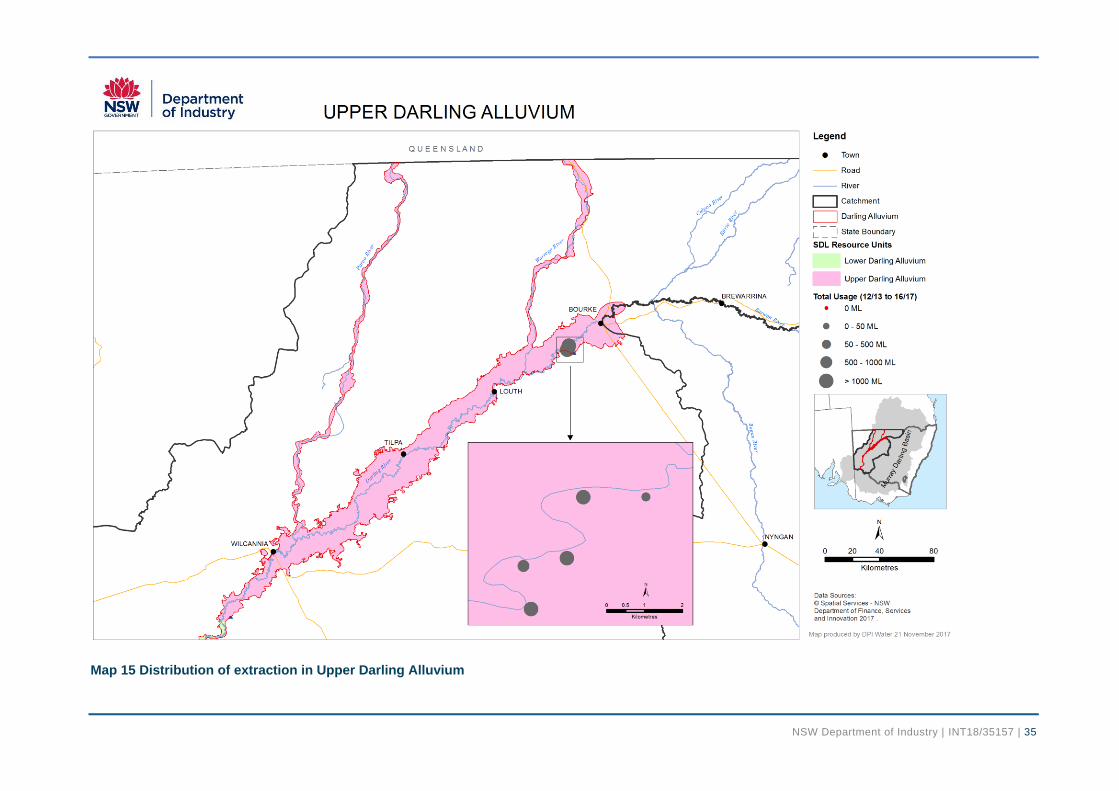
Map 15 Distribution of extraction in Upper Darling Alluvium ........................................................... 35
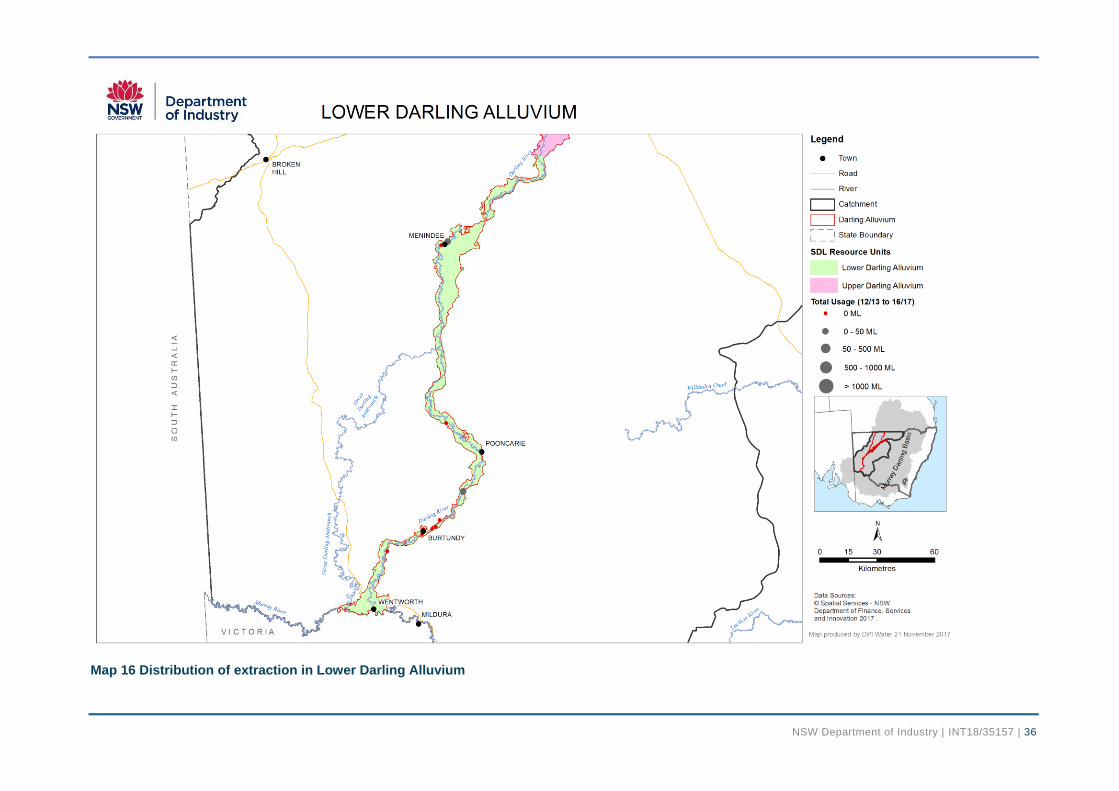
Map 16 Distribution of extraction in Lower Darling Alluvium ........................................................... 36
Map 17 Monitoring bores in Upper Darling Alluvium ....................................................................... 40
Map 18 Monitoring bores in Lower Darling Alluvium ....................................................................... 41
Map 19 Locations of representative hydrographs for Darling Alluvium ........................................... 44
Map 20 Change in groundwater level from 2005-06 to 2015-16 in the Upper Darling Alluvium ..... 48
Map 21 Change in groundwater level from 2005-06 to 2015-16 in the Lower Darling Alluvium ..... 49
Tables Table 1 Land use in the catchment ................................................................................................. 13
Table 2 Access licence share components in the Darling Alluvium Water Resource Plan area (at
February 2019) ............................................................................................................................... 28
Table 3 LTAAEL (ML/year, as per the three relevant Water Sharing Plans from 2011 and 2012) for
the Upper Darling Alluvium and Lower Darling Alluvium compared to the SDL.............................. 29
Darling Alluvium Resource Description
NSW Department of Industry | INT18/35157 | iv
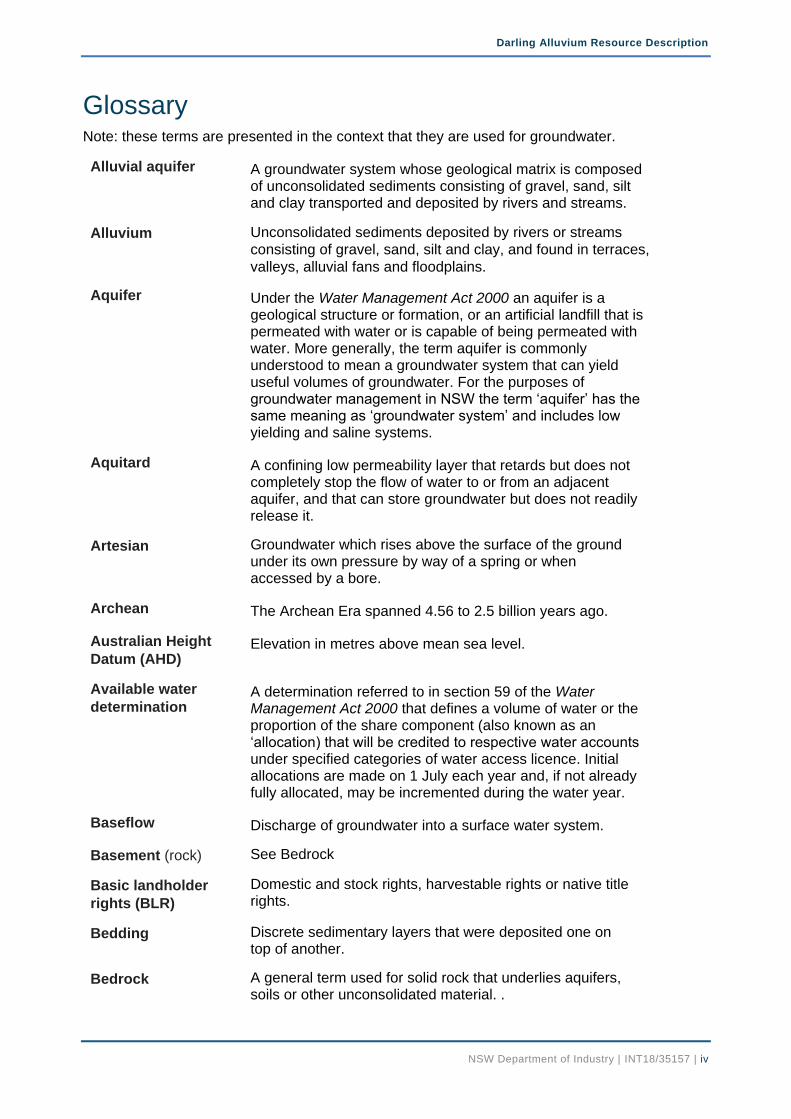
Glossary Note: these terms are presented in the context that they are used for groundwater.
Alluvial aquifer A groundwater system whose geological matrix is composed of unconsolidated sediments consisting of gravel, sand, silt and clay transported and deposited by rivers and streams.
Alluvium Unconsolidated sediments deposited by rivers or streams
consisting of gravel, sand, silt and clay, and found in terraces,
valleys, alluvial fans and floodplains.
Aquifer Under the Water Management Act 2000 an aquifer is a geological structure or formation, or an artificial landfill that is permeated with water or is capable of being permeated with water. More generally, the term aquifer is commonly understood to mean a groundwater system that can yield useful volumes of groundwater. For the purposes of groundwater management in NSW the term ‘aquifer’ has the same meaning as ‘groundwater system’ and includes low yielding and saline systems.
Aquitard A confining low permeability layer that retards but does not completely stop the flow of water to or from an adjacent aquifer, and that can store groundwater but does not readily release it.
Artesian Groundwater which rises above the surface of the ground under its own pressure by way of a spring or when accessed by a bore.
Archean The Archean Era spanned 4.56 to 2.5 billion years ago.
Australian Height
Datum (AHD) Elevation in metres above mean sea level.
Available water
determination A determination referred to in section 59 of the Water Management Act 2000 that defines a volume of water or the proportion of the share component (also known as an ‘allocation) that will be credited to respective water accounts under specified categories of water access licence. Initial allocations are made on 1 July each year and, if not already fully allocated, may be incremented during the water year.
Baseflow Discharge of groundwater into a surface water system.
Basement (rock) See Bedrock
Basic landholder
rights (BLR)
Domestic and stock rights, harvestable rights or native title rights.
Bedding Discrete sedimentary layers that were deposited one on top of another.
Bedrock A general term used for solid rock that underlies aquifers, soils or other unconsolidated material. .
Darling Alluvium Resource Description
NSW Department of Industry | INT18/35157 | v
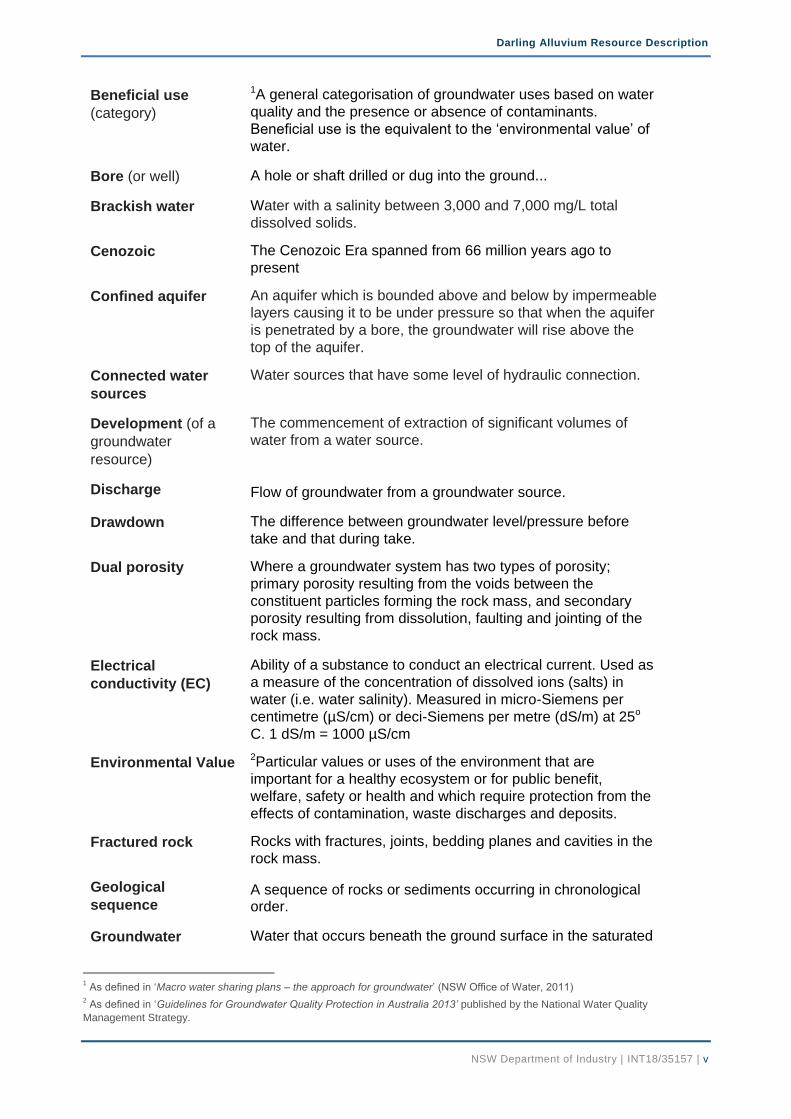
Beneficial use
(category)
1A general categorisation of groundwater uses based on water
quality and the presence or absence of contaminants.
Beneficial use is the equivalent to the ‘environmental value’ of
water.
Bore (or well) A hole or shaft drilled or dug into the ground...
Brackish water Water with a salinity between 3,000 and 7,000 mg/L total
dissolved solids.
Cenozoic The Cenozoic Era spanned from 66 million years ago to
present
Confined aquifer An aquifer which is bounded above and below by impermeable
layers causing it to be under pressure so that when the aquifer
is penetrated by a bore, the groundwater will rise above the
top of the aquifer.
Connected water
sources
Water sources that have some level of hydraulic connection.
Development (of a
groundwater
resource)
The commencement of extraction of significant volumes of
water from a water source.
Discharge Flow of groundwater from a groundwater source.
Drawdown The difference between groundwater level/pressure before
take and that during take.
Dual porosity Where a groundwater system has two types of porosity;
primary porosity resulting from the voids between the
constituent particles forming the rock mass, and secondary
porosity resulting from dissolution, faulting and jointing of the
rock mass.
Electrical
conductivity (EC)
Ability of a substance to conduct an electrical current. Used as
a measure of the concentration of dissolved ions (salts) in
water (i.e. water salinity). Measured in micro-Siemens per
centimetre (µS/cm) or deci-Siemens per metre (dS/m) at 25o
C. 1 dS/m = 1000 µS/cm
Environmental Value 2Particular values or uses of the environment that are
important for a healthy ecosystem or for public benefit,
welfare, safety or health and which require protection from the
effects of contamination, waste discharges and deposits.
Fractured rock Rocks with fractures, joints, bedding planes and cavities in the
rock mass.
Geological
sequence A sequence of rocks or sediments occurring in chronological order.
Groundwater Water that occurs beneath the ground surface in the saturated
1 As defined in ‘Macro water sharing plans – the approach for groundwater’ (NSW Office of Water, 2011)
2 As defined in ‘Guidelines for Groundwater Quality Protection in Australia 2013’ published by the National Water Quality
Management Strategy.
Darling Alluvium Resource Description
NSW Department of Industry | INT18/35157 | vi
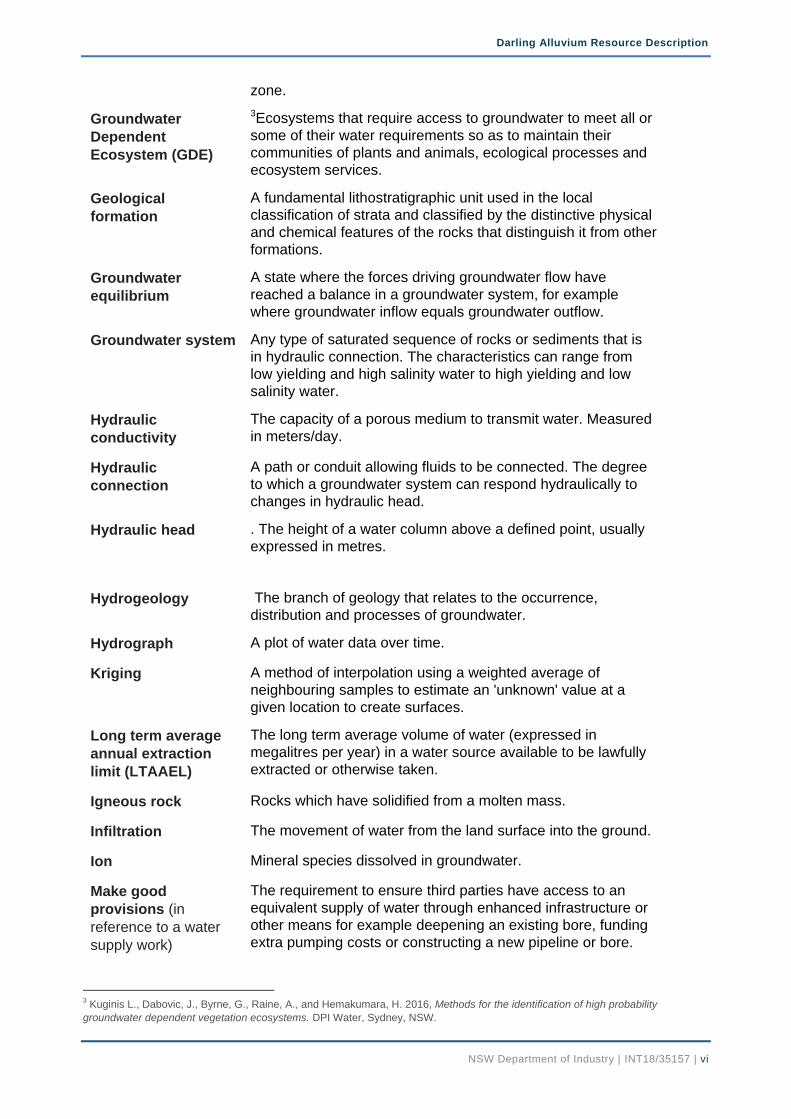
zone.
Groundwater
Dependent
Ecosystem (GDE)
3Ecosystems that require access to groundwater to meet all or
some of their water requirements so as to maintain their
communities of plants and animals, ecological processes and
ecosystem services.
Geological
formation
A fundamental lithostratigraphic unit used in the local
classification of strata and classified by the distinctive physical
and chemical features of the rocks that distinguish it from other
formations.
Groundwater
equilibrium
A state where the forces driving groundwater flow have
reached a balance in a groundwater system, for example
where groundwater inflow equals groundwater outflow.
Groundwater system Any type of saturated sequence of rocks or sediments that is
in hydraulic connection. The characteristics can range from
low yielding and high salinity water to high yielding and low
salinity water.
Hydraulic
conductivity
The capacity of a porous medium to transmit water. Measured
in meters/day.
Hydraulic
connection
A path or conduit allowing fluids to be connected. The degree
to which a groundwater system can respond hydraulically to
changes in hydraulic head.
Hydraulic head . The height of a water column above a defined point, usually
expressed in metres.
Hydrogeology The branch of geology that relates to the occurrence,
distribution and processes of groundwater.
Hydrograph A plot of water data over time.
Kriging A method of interpolation using a weighted average of
neighbouring samples to estimate an 'unknown' value at a
given location to create surfaces.
Long term average
annual extraction
limit (LTAAEL)
The long term average volume of water (expressed in
megalitres per year) in a water source available to be lawfully
extracted or otherwise taken.
Igneous rock Rocks which have solidified from a molten mass.
Infiltration The movement of water from the land surface into the ground.
Ion Mineral species dissolved in groundwater.
Make good
provisions (in
reference to a water
supply work)
The requirement to ensure third parties have access to an
equivalent supply of water through enhanced infrastructure or
other means for example deepening an existing bore, funding
extra pumping costs or constructing a new pipeline or bore.
3 Kuginis L., Dabovic, J., Byrne, G., Raine, A., and Hemakumara, H. 2016, Methods for the identification of high probability
groundwater dependent vegetation ecosystems. DPI Water, Sydney, NSW.
Darling Alluvium Resource Description
NSW Department of Industry | INT18/35157 | vii
Management zone A defined area within a water source where a particular set of
water sharing rules applies.
Mesozoic The Mesozoic Era spanned 252 to 66 million years ago
Metamorphic rock Rocks that result from partial or complete recrystallisation in
the solid state of pre-existing rocks under conditions of
temperature and pressure.
Minimal impact
considerations
Factors that need to be assessed to determine the potential
effect of aquifer interference activities on groundwater and its
dependent assets.
Monitoring bore A specially constructed bore used to measure groundwater
level or pressure and groundwater quality at a specific depth.
Not intended to supply water.
Ongoing take The take of groundwater that occurs after part or all of the
principal activity has ceased. For example extraction of
groundwater (active take) entering completed structures,
groundwater filling abandoned underground workings (passive
take) or the evaporation of water (passive take) from an
abandoned excavation that has filled with groundwater.
Outcrop Rocks which are exposed at the land surface.
Piezometric or
Potentiometric head
The pressure or hydraulic head of the groundwater at a
particular depth in the ground. In unconfined aquifers this is
the same as the water table.
Palaeozoic The Palaeozoic Era spanned 541 to 252 million years ago.
Perched water table A local water table of very limited extent which is separated
from the underlying groundwater by an unsaturated zone.
Permeability The capacity of earth materials to transmit a fluid.
Porous rock Consolidated sedimentary rock containing voids, pores or
other openings in the rock (such as joints, cleats and/or
fractures.
Pre-development Prior to development of a groundwater resource.
Proterozoic The Proterozoic Era spanned 2.5 billion to 541 million years
ago.
Recharge The addition of water into a groundwater system by infiltration,
flow or injection from sources such as rainfall, overland flow,
adjacent groundwater sources, irrigation, or surface water
sources.
Recovery The rise of groundwater levels or pressures after groundwater
take has ceased. Where water is being added, recovery will be
a fall.
Recovery decline Where groundwater levels or pressures do not fully return to
the previous level after a period of groundwater removal or
addition.
Darling Alluvium Resource Description
NSW Department of Industry | INT18/35157 | viii
Reliable water
supply
4Rainfall of 350mm or more per annum (9 out of 10 years); or
a regulated river, or unregulated rivers where there are flows
for at least 95% of the time (i.e. the 95th percentile flow of
each month of the year is greater than zero) or 5th order and
higher rivers; or groundwater aquifers (excluding
miscellaneous alluvial aquifers, also known as small storage
aquifers) which have a yield rate greater than 5L/s and total
dissolved solids of less than 1,500mg/L.
River Condition
Index (RCI)
This is a spatial tool used to measure and monitor the long
term trend of river condition, but also reports on instream
values and risk to instream values from extraction and
geomorphic disturbance.
Salinity The concentration of dissolved minerals in water, usually
expressed in EC units or milligrams of total dissolved solids
per litre.
Salt A mineral which in a liquid will readily dissociate into its
component ionic species for example NaCl into Na+ and Cl-
ions.
Saturated zone Area below the water table where all soil spaces, pores,
fractures and voids are filled with water.
Sedimentary rock A rock formed by consolidation of sediments deposited in
layers, for example sandstone, siltstone and limestone.
Share component An entitlement to water specified on an access licence,
expressed as a unit share or for specific purpose licences a
volume in megalitres (eg. local water utility, major water utility
and domestic and stock).
Sustainable
Diversion Limits
The volume of water that can be taken from a Sustainable
Diversion Limit resource unit as defined under the Murray
Darling Basin Plan 2012.
Unassigned water Exists where current water requirements (including licensed
volumes and water to meet basic landholder rights) are less
than the extraction limit for a water source.
Unconfined aquifer A groundwater system usually near the ground surface, which
is in connection with atmospheric pressure and whose upper
level is represented by the water table.
Unconsolidated
sediment
Particles of gravel, sand, silt or clay that are not bound or
hardened by mineral cement, pressure, or thermal alteration of
the grains.
Unsaturated zone Area above the water table where soil spaces, pores, fractures
and voids are not completely filled with water.
Water balance A calculation of all water entering and leaving a system.
Water resource plan 5A plan made under the Commonwealth Water Act 2007 that
outlines how a particular area of the Murray–Darling Basin’s water
4 As defined by Strategic Regional Land Use Plans
5 https://www.mdba.gov.au/basin-plan-roll-out/water-resource-plans 21/03/17
Darling Alluvium Resource Description
NSW Department of Industry | INT18/35157 | ix
resources will be managed to be consistent with the Murray–
Darling Basin Plan. These plans set out the water sharing rules and
arrangements relating to issues such as annual limits on water
take, environmental water, managing water during extreme events
and strategies to achieve water quality standards and manage
risks.
Water sharing plan 6A plan made under the Water Management Act 2000 which
set out the rules for sharing water between the environment
and water users within whole or part of a water management
area or water source.
Water source Defined under the Water Management Act 2000 as ‘The whole
or any part of one or more rivers, lakes or estuaries, or one or
more places where water occurs naturally on or below the
surface of the ground and includes the coastal waters of the
State. Individual water sources are more specifically defined in
water sharing plans.
Water table Upper surface of groundwater at atmospheric pressure, below
which the ground is saturated.
Water year Twelve month period from 1 July to 30 June.
Yield The amount of water that can be supplied over a specific
period.
6 As defined in ‘Macro water sharing plans – the approach for groundwater’ (NSW Office of Water, 2011)
NSW Department of Industry | INT18/35157 | 1
1 Introduction The NSW Government is developing water resource plans as part of implementing the Murray-Darling Basin Plan 2012 (the Basin Plan). Water resource plans align Basin-wide and state-based water resource management in each water resource plan area. The water resource plans recognise and build on the existing water planning and management frameworks that have been established in NSW.
Under the Basin Plan, individual water resources are known as sustainable diversion limit (SDL) resource units and each water resource plan covers a number of SDL resource units within an area.
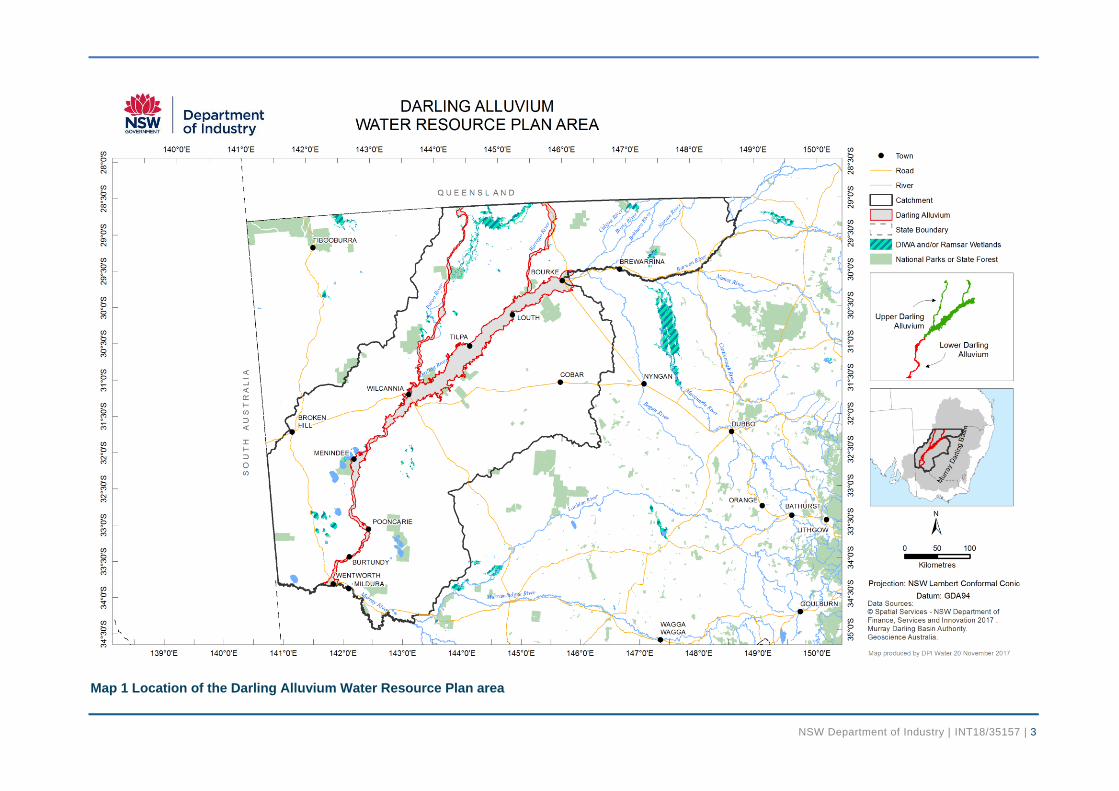
The Darling Alluvium Water Resource Plan area (Darling Alluvium) is shown in Figure 1. It is located within the Intersecting Streams Water Resource Plan area and the Lower Darling component of the New South Wales Murray and Lower Darling Water Resource Plan area (the catchment). The catchment (as defined above) covers more than 275,000 km² and represents approximately 26 percent of the Murray-Darling Basin.
The groundwater resources of the Darling Alluvium includes the alluvial deposits associated with the Darling, Paroo and Warrego Rivers. The Darling Alluvium extends from near Bourke via Wilcannia to the state border at Wentworth.
The Darling Alluvium (GW7 - Murray-Darling Basin reference number) is composed of two SDL resource units: the Upper Darling Alluvium (GS42) and the Lower Darling Alluvium (GS23) (Map 1). These two SDL resource units correspond to four groundwater sources currently covered by three water sharing plans. They are the:
Warrego Alluvial Groundwater Source and Paroo Alluvial Groundwater Source managed
under the Water Sharing Plan for the Intersecting Streams Unregulated and Alluvial
Water Sources 2011,
Upper Darling Alluvial Groundwater Source managed under the Water Sharing Plan for
the Barwon-Darling Unregulated and Alluvial Water Sources 2012, and the
Lower Darling Alluvial Groundwater Source managed under the Water Sharing Plan for
the Lower Murray-Darling Unregulated and Alluvial Water Sources 2011.
This report describes the location, climate and physical attributes of the Darling Alluvium groundwater resources, and explains their geological and hydrogeological context, environmental assets, groundwater quality and management. It also presents the current status of these groundwater resources including groundwater rights, accounts, dealings, take and groundwater behaviour.
NSW Department of Industry | INT18/35157 | 2
2 History of Groundwater Management
2.1 Early groundwater management The Water Act 1912 (WA 1912) was introduced at a time when the development of water resources for agriculture and regional development were the priority of government (DLWC, 1999). Under the WA 1912, water entitlement was linked to land rights and licences for bores and wells were granted for a fixed term with no restriction on the volume that could be extracted. Bore licences were initially required only for bores greater than 30 metres (m) depth in the western half of NSW.
After World War II, there was a drive to expand irrigation and promote economic development in inland NSW. In 1955, the WA 1912 was amended to require all bores to be licensed irrespective of depth or location.
By the 1970s, the rapid expansion of the irrigation industry, increasing competition for water resources and extended periods of drought were affecting the reliability of water supplies in inland NSW.
Acknowledging that groundwater was a finite resource, from 1972 to 1983 new irrigation licences were issued based on the size of the area being irrigated. These licences had to be renewed every five years, but still had no volumetric limit on extraction (Gates et al, 1997).
From 1984, all new high yield bores and wells (greater than 20 megalitres (ML/year)) except those in the Great Artesian Basin, were given a volumetric entitlement and old area based licences were progressively converted. Volumetric entitlements were generally issued based on historical usage, property area or bore capacity.
From 1986, comprehensive volumetric groundwater allocation policies were introduced throughout the State.
The objectives were to more effectively manage development in those groundwater systems where the resource was fully committed and to encourage the use of groundwater where it was underutilised.
NSW Department of Industry | INT18/35157 | 3
Map 1 Location of the Darling Alluvium Water Resource Plan area
NSW Department of Industry | INT18/35157 | 4
2.2 NSW water reforms In 1994, the Council of Australian Governments (COAG) endorsed a strategic framework for reform of the Australian water industry. The framework included identifying and recovering the costs of water management and supply from beneficiaries, recognising the environment as a water user through formal allocations and ensuring that water rights could move by trade to where they would generate the highest value.
By the late 1990s, NSW had embarked on a major program of water policy reforms. This included the development of the NSW State Groundwater Policy Framework Document, the NSW Groundwater Quality Protection Policy, and an assessment of risk to the State’s groundwater systems from over-extraction and/or contamination. The NSW State Groundwater Dependent Ecosystems Policy was released in 2002.
The 1990s policy reforms drove the development of the Water Management Act 2000 (WMA 2000). The WMA 2000 establishes water for the environment as a priority while also providing licence holders with more security through perpetual licences and greater opportunities to trade through the separation of water access rights from the land.
The WMA 2000 considers other users of water such as groundwater dependent ecosystems, and aquifer interference activities; cumulative impacts; climate change; Aboriginal cultural rights and connectivity between groundwater and surface water. The WMA 2000 also sets up the framework for developing statutory plans to manage water.
Water sharing plans are the principle tool for managing the State’s water resources including groundwater. These ten year plans manage groundwater resources at the ‘water source’ scale, define the long term average annual extraction limit (LTAAEL), establish rules for sharing groundwater between users and the environment, establish basic landholder rights and set rules for water trading.
Priority for developing water sharing plans was based on the groundwater systems identified by the risk assessment as being at highest risk. The first groundwater sharing plans in the Murray-Darling Basin commenced between 2006 and 2008 across six large alluvial groundwater systems in the Murray-Darling Basin. Access to groundwater was reduced to the extraction limit over the ten year plan using an approach that recognised historical extraction.
Since 2007, water sharing plans for unregulated rivers and groundwater systems in NSW have been completed using a 'macro' approach to cover most of the remaining water sources across NSW. Each groundwater macro plan covers a number of a particular type of groundwater system (for example, fractured rock).
In 2008, two embargo orders covering the remaining inland groundwater resources were made under the WA 1912 on new applications for groundwater licences. These embargoes remained in effect until the commencement of water sharing plans for the groundwater sources that they covered.
In 2012, the ‘NSW Aquifer Interference Policy’ was released. The purpose of this Policy is to explain the water licensing and assessment requirements for aquifer interference activities under the WMA 2000 and other relevant legislative frameworks.
2.3 Darling Alluvium Groundwater quality in the Darling Alluvium is generally saline with the exception of narrow shallow lenses of freshwater along the Darling River and its tributaries, the Paroo and Warrego Rivers. Therefore, groundwater based development in the Darling Alluvium has been limited.
From 2000 to 2011/2012, the Darling Alluvium was managed under the WA 1912 in two Groundwater Management Areas. These were then known as the Lower Darling Alluvium (Wilcannia to Buronga) Groundwater Management Area 045 and the Upper Darling Alluvium was part of the Central West Alluvial Aquifers Groundwater Management Area 038).
NSW Department of Industry | INT18/35157 | 5
In the early 2000s, droughts and periods of low surface water availability there was growing demand from surface water users to access the fresh groundwater lenses.
Water access during this period was managed by issuing a limited number of groundwater licences to those surface water users with established permanent plantings along the river. Extraction was only permitted during periods of no flow in the river (i.e. zero surface water allocation) and was managed through annual allocation announcements. Pumping was restricted to groundwater with electrical conductivity (EC) values of less than 3,000.
A series of embargoes limited access to groundwater in local areas during this period (e.g. for the Water Shortage Zone extending from below Wilcannia to Wentworth) culminating in the state-wide embargo in 2008 on the issue of new groundwater licences, mentioned above. The embargo was current until it was replaced by the relevant water sharing plans.
Groundwater in the Upper Darling Alluvium has been managed under the Water Sharing Plan for the Barwon-Darling Unregulated and Alluvial Water Sources 2012 since October 2012 and the Water Sharing Plan for the Intersecting Streams Unregulated and Alluvial Water Sources 2011 since November 2011.
Groundwater in the Lower Darling Alluvium has been managed under the Water Sharing Plan for the Lower Murray-Darling Unregulated and Alluvial Water Sources 2011 since January 2012.
NSW Department of Industry | INT18/35157 | 6
3 Regional Setting
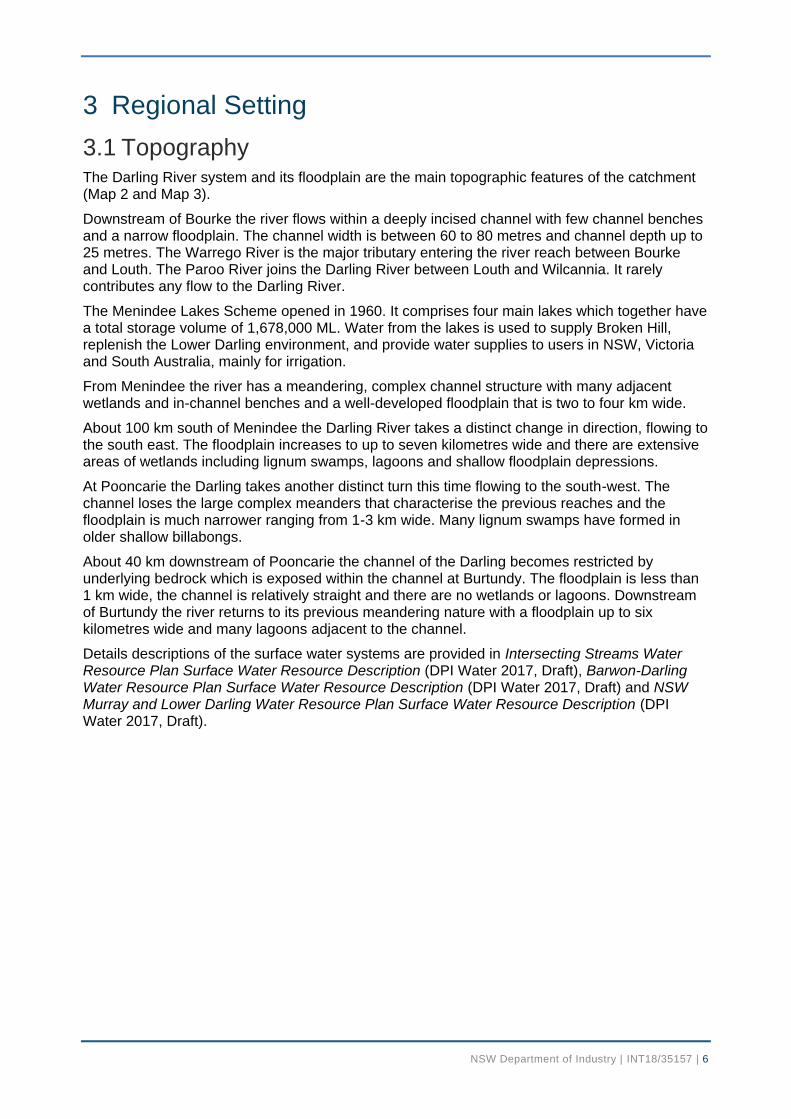
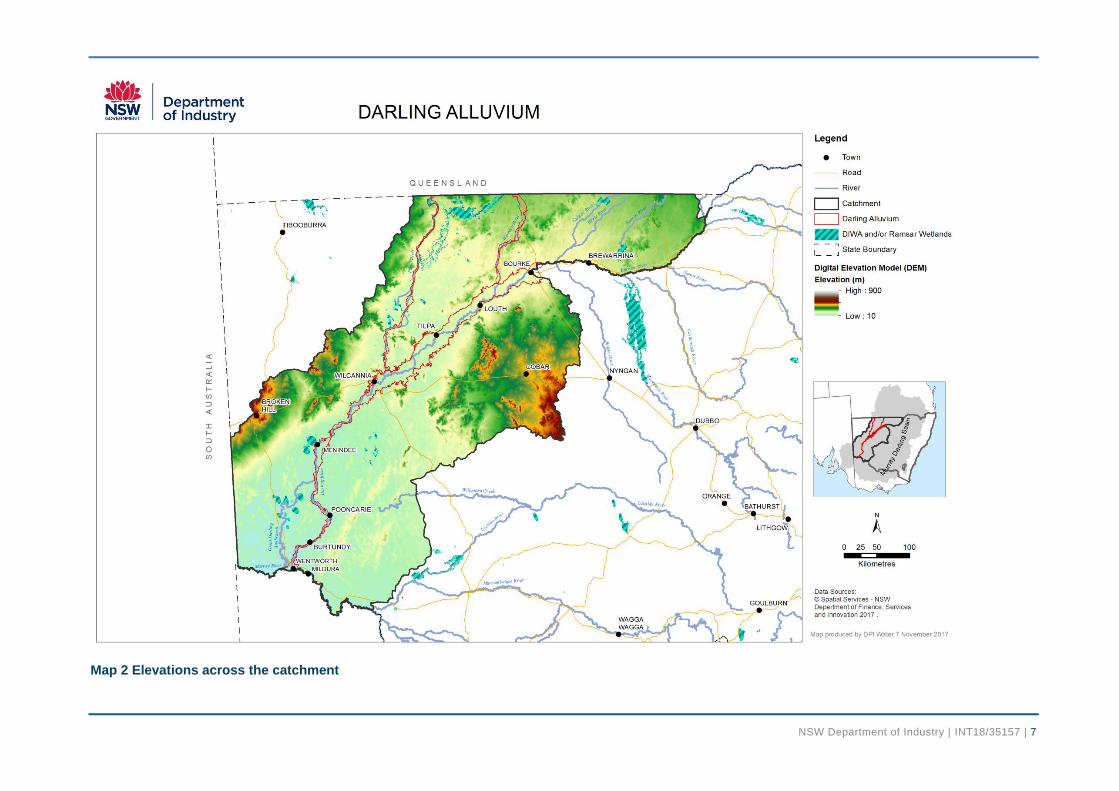
3.1 Topography The Darling River system and its floodplain are the main topographic features of the catchment (Map 2 and Map 3).
Downstream of Bourke the river flows within a deeply incised channel with few channel benches and a narrow floodplain. The channel width is between 60 to 80 metres and channel depth up to 25 metres. The Warrego River is the major tributary entering the river reach between Bourke and Louth. The Paroo River joins the Darling River between Louth and Wilcannia. It rarely contributes any flow to the Darling River.
The Menindee Lakes Scheme opened in 1960. It comprises four main lakes which together have a total storage volume of 1,678,000 ML. Water from the lakes is used to supply Broken Hill, replenish the Lower Darling environment, and provide water supplies to users in NSW, Victoria and South Australia, mainly for irrigation.
From Menindee the river has a meandering, complex channel structure with many adjacent wetlands and in-channel benches and a well-developed floodplain that is two to four km wide.
About 100 km south of Menindee the Darling River takes a distinct change in direction, flowing to the south east. The floodplain increases to up to seven kilometres wide and there are extensive areas of wetlands including lignum swamps, lagoons and shallow floodplain depressions.
At Pooncarie the Darling takes another distinct turn this time flowing to the south-west. The channel loses the large complex meanders that characterise the previous reaches and the floodplain is much narrower ranging from 1-3 km wide. Many lignum swamps have formed in older shallow billabongs.
About 40 km downstream of Pooncarie the channel of the Darling becomes restricted by underlying bedrock which is exposed within the channel at Burtundy. The floodplain is less than 1 km wide, the channel is relatively straight and there are no wetlands or lagoons. Downstream of Burtundy the river returns to its previous meandering nature with a floodplain up to six kilometres wide and many lagoons adjacent to the channel.
Details descriptions of the surface water systems are provided in Intersecting Streams Water Resource Plan Surface Water Resource Description (DPI Water 2017, Draft), Barwon-Darling Water Resource Plan Surface Water Resource Description (DPI Water 2017, Draft) and NSW Murray and Lower Darling Water Resource Plan Surface Water Resource Description (DPI Water 2017, Draft).
NSW Department of Industry | INT18/35157 | 7
Map 2 Elevations across the catchment
NSW Department of Industry | INT18/35157 | 8
Map 3 Surface water features in the catchment
NSW Department of Industry | INT18/35157 | 9
3.2 Climate
3.2.1 Rainfall
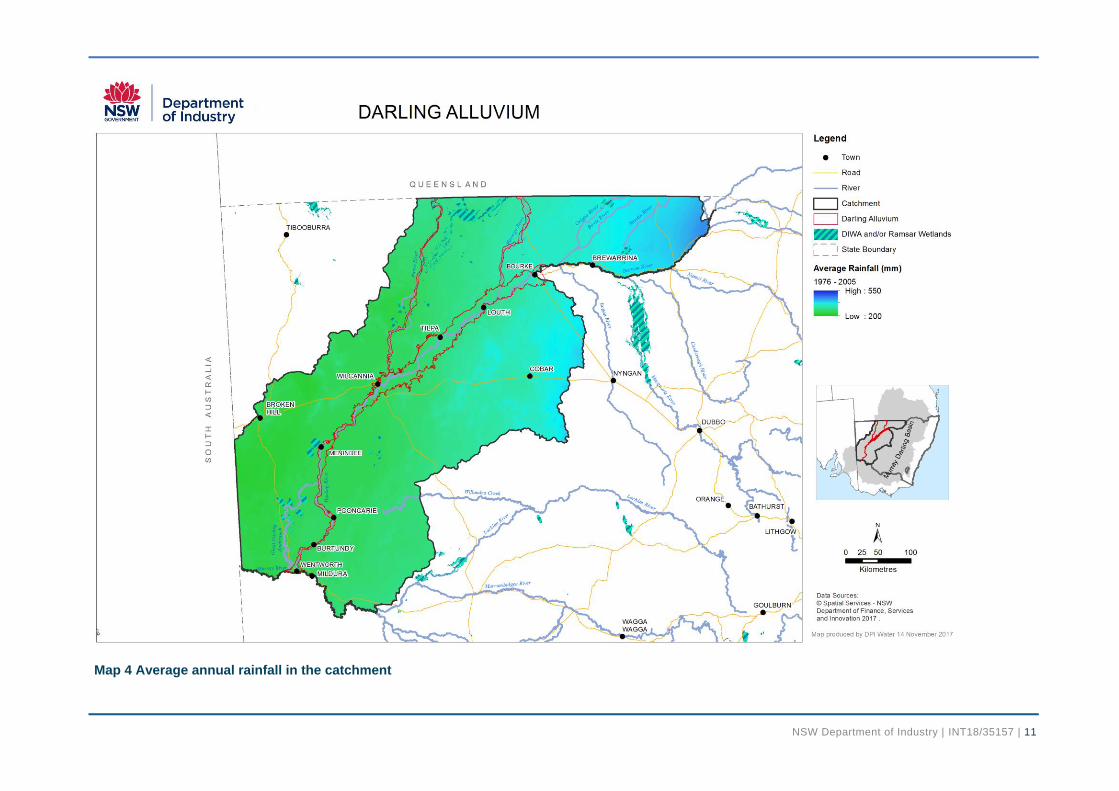
Annual rainfall in the catchment ranges from approximately 550 mm in the north-east to approximately 200 mm in the south-west. The lower parts of the catchment receive some of the lowest rainfall in NSW (Map 4).
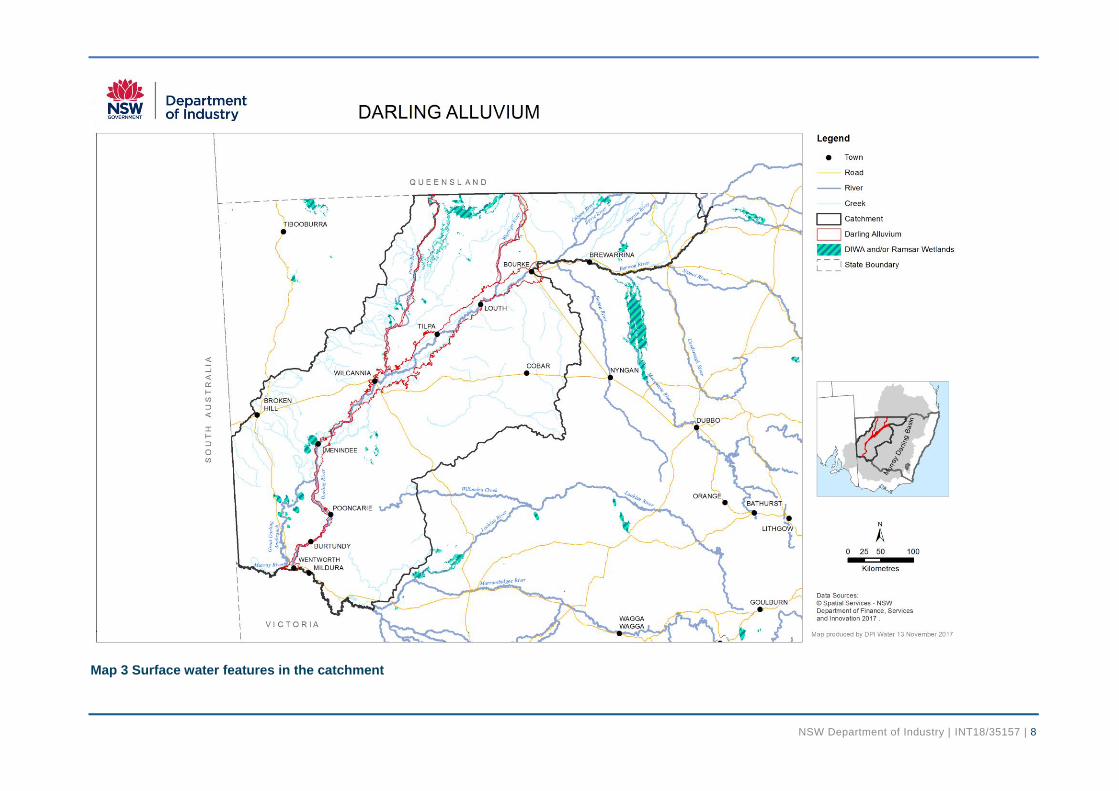
In the north, rainfall is seasonally dependent. At Bourke, average monthly rainfall is approximately 40 mm in summer and 15 mm in winter (Figure 1). Average total annual rainfall is approximately 370 mm. Localised summer storms may cause flash flooding and erosion, and winter flooding may also occur if soils remain saturated after summer rains.
By contrast, in the south, rainfall is less seasonal and lower overall. At Mildura, average monthly rainfall is approximately 30 mm in summer and 15 mm in winter (Figure 1). Average total annual rainfall is approximately 280 mm.
Figure 1 Bourke, Menindee and Mildura average monthly rainfall 1989 – 2017
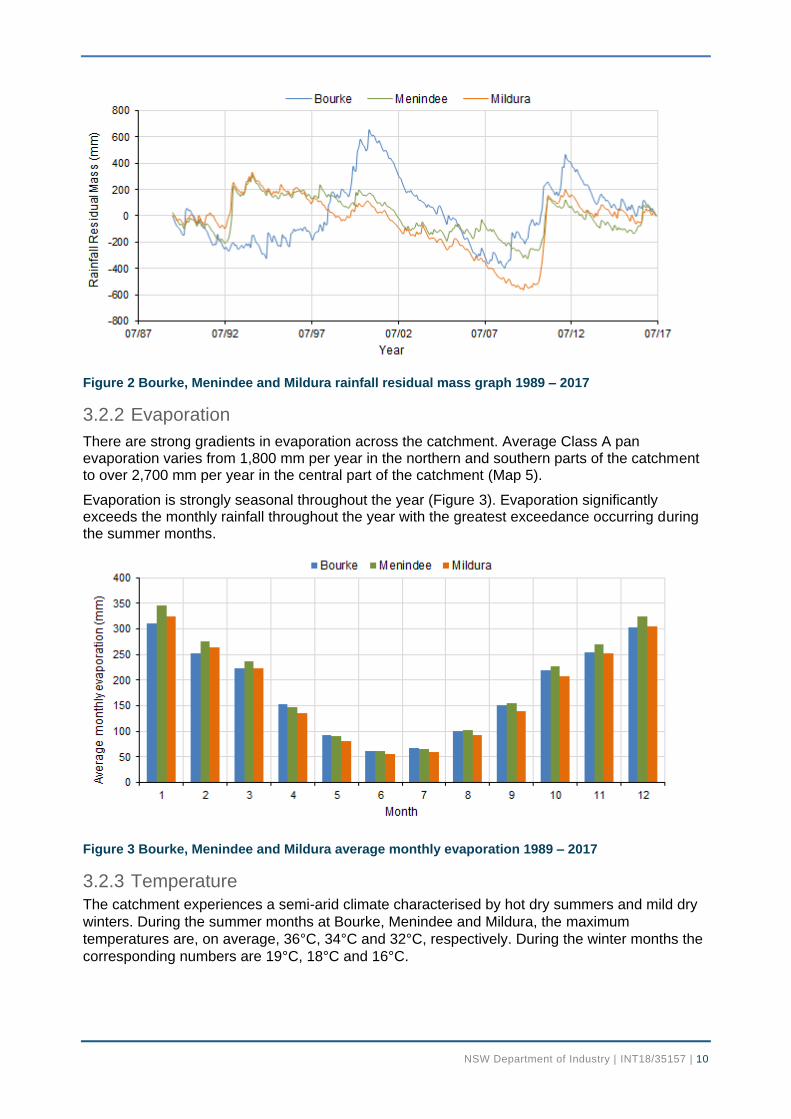
Residual rainfall plots have been constructed for the catchment using daily data sourced from the Scientific Information for Land Owners (SILO) database. The rainfall residual mass graph plots the cumulative difference from the monthly average rainfall and provides a visual representation of the rainfall history in an area. A falling trend indicates a period of lower than average rainfall, a rising trend showing periods of above average rainfall.
Figure 2 shows the residual mass graph of average monthly rainfall from July 1989 to June 2017 at Bourke, Menindee and Mildura. This period corresponds to the period of groundwater monitoring in the Darling Alluvium discussed below in Section 10. The variation at Bourke is much greater compared to Menindee or Mildura. Below average rainfall occurred during the Millennium Drought.
NSW Department of Industry | INT18/35157 | 10
Figure 2 Bourke, Menindee and Mildura rainfall residual mass graph 1989 – 2017
3.2.2 Evaporation
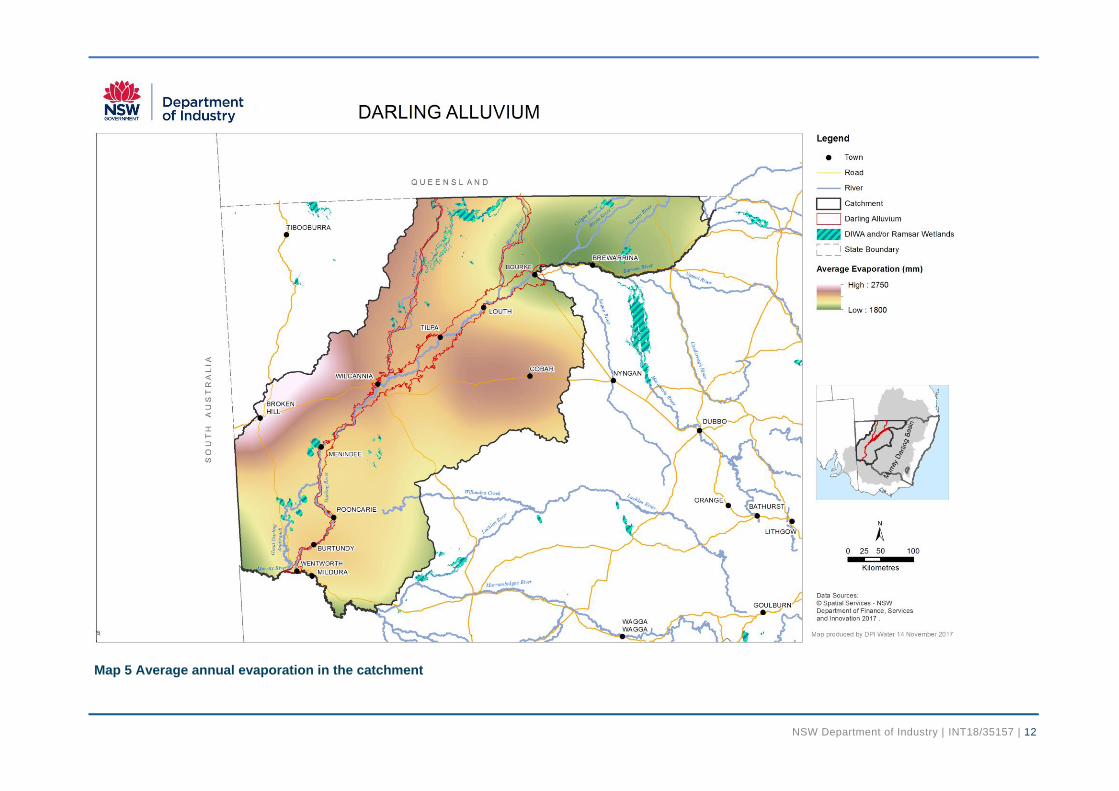
There are strong gradients in evaporation across the catchment. Average Class A pan evaporation varies from 1,800 mm per year in the northern and southern parts of the catchment to over 2,700 mm per year in the central part of the catchment (Map 5).
Evaporation is strongly seasonal throughout the year (Figure 3). Evaporation significantly exceeds the monthly rainfall throughout the year with the greatest exceedance occurring during the summer months.
Figure 3 Bourke, Menindee and Mildura average monthly evaporation 1989 – 2017
3.2.3 Temperature
The catchment experiences a semi-arid climate characterised by hot dry summers and mild dry
winters. During the summer months at Bourke, Menindee and Mildura, the maximum
temperatures are, on average, 36°C, 34°C and 32°C, respectively. During the winter months the
corresponding numbers are 19°C, 18°C and 16°C.
NSW Department of Industry | INT18/35157 | 11
Map 4 Average annual rainfall in the catchment
NSW Department of Industry | INT18/35157 | 12
Map 5 Average annual evaporation in the catchment
NSW Department of Industry | INT18/35157 | 13
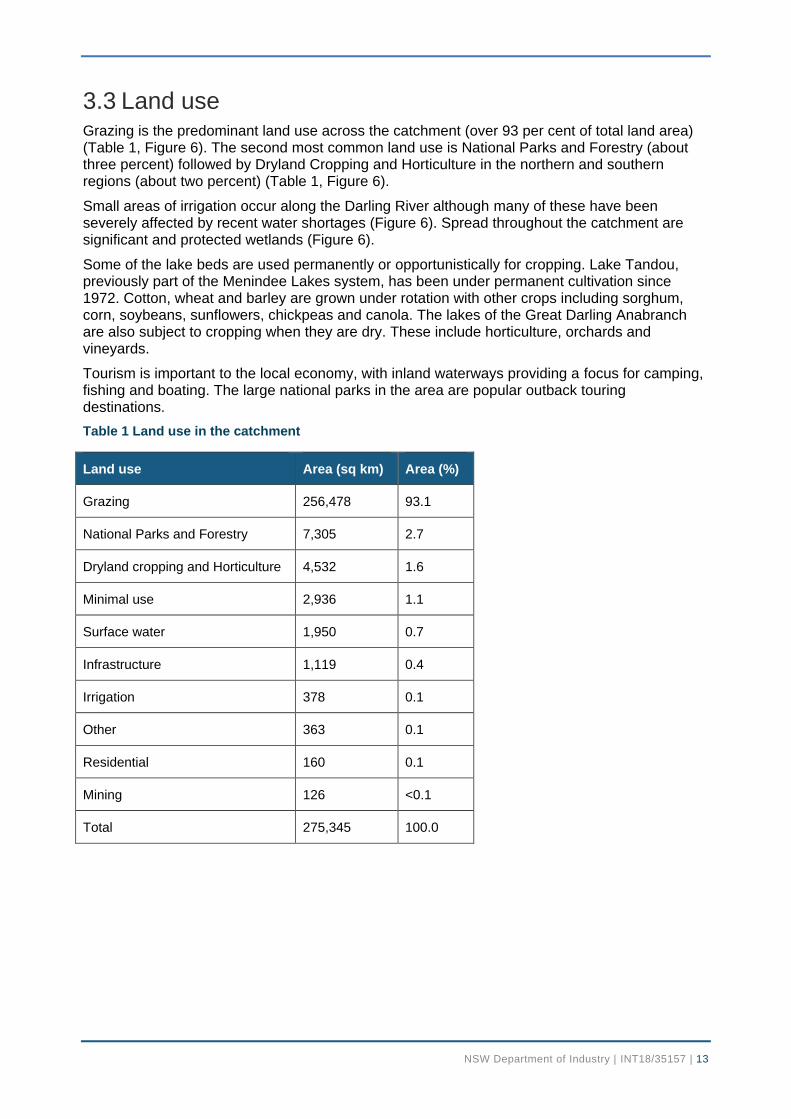
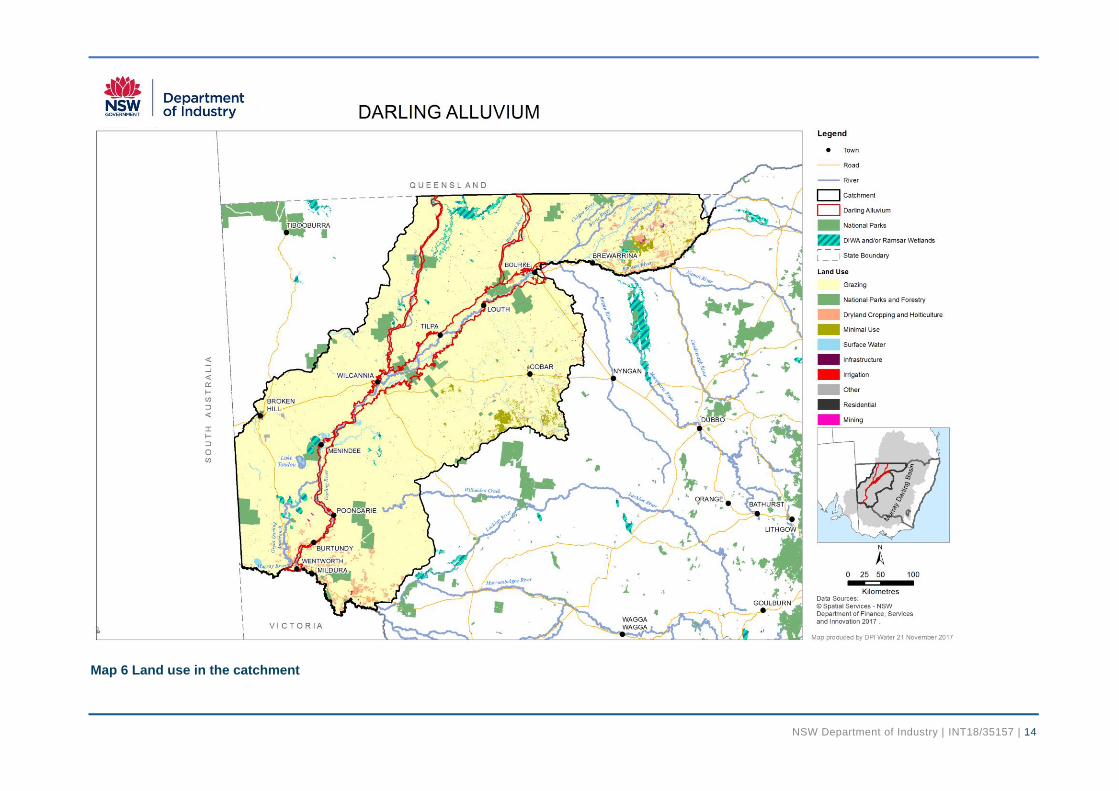
3.3 Land use Grazing is the predominant land use across the catchment (over 93 per cent of total land area) (Table 1, Figure 6). The second most common land use is National Parks and Forestry (about three percent) followed by Dryland Cropping and Horticulture in the northern and southern regions (about two percent) (Table 1, Figure 6).
Small areas of irrigation occur along the Darling River although many of these have been severely affected by recent water shortages (Figure 6). Spread throughout the catchment are significant and protected wetlands (Figure 6).
Some of the lake beds are used permanently or opportunistically for cropping. Lake Tandou, previously part of the Menindee Lakes system, has been under permanent cultivation since 1972. Cotton, wheat and barley are grown under rotation with other crops including sorghum, corn, soybeans, sunflowers, chickpeas and canola. The lakes of the Great Darling Anabranch are also subject to cropping when they are dry. These include horticulture, orchards and vineyards.
Tourism is important to the local economy, with inland waterways providing a focus for camping, fishing and boating. The large national parks in the area are popular outback touring destinations.
Table 1 Land use in the catchment
Land use Area (sq km) Area (%)
Grazing 256,478 93.1
National Parks and Forestry 7,305 2.7
Dryland cropping and Horticulture 4,532 1.6
Minimal use 2,936 1.1
Surface water 1,950 0.7
Infrastructure 1,119 0.4
Irrigation 378 0.1
Other 363 0.1
Residential 160 0.1
Mining 126 <0.1
Total 275,345 100.0
NSW Department of Industry | INT18/35157 | 14
Map 6 Land use in the catchment
NSW Department of Industry | INT18/35157 | 15
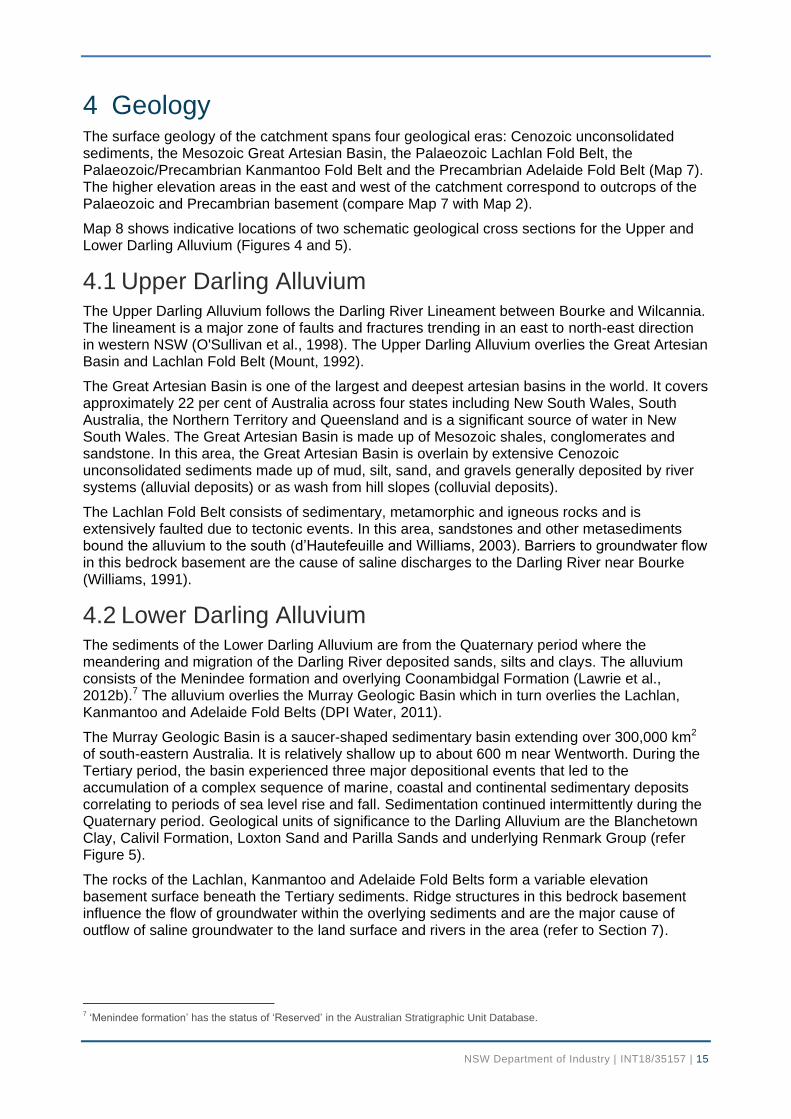
4 Geology The surface geology of the catchment spans four geological eras: Cenozoic unconsolidated sediments, the Mesozoic Great Artesian Basin, the Palaeozoic Lachlan Fold Belt, the Palaeozoic/Precambrian Kanmantoo Fold Belt and the Precambrian Adelaide Fold Belt (Map 7). The higher elevation areas in the east and west of the catchment correspond to outcrops of the Palaeozoic and Precambrian basement (compare Map 7 with Map 2).
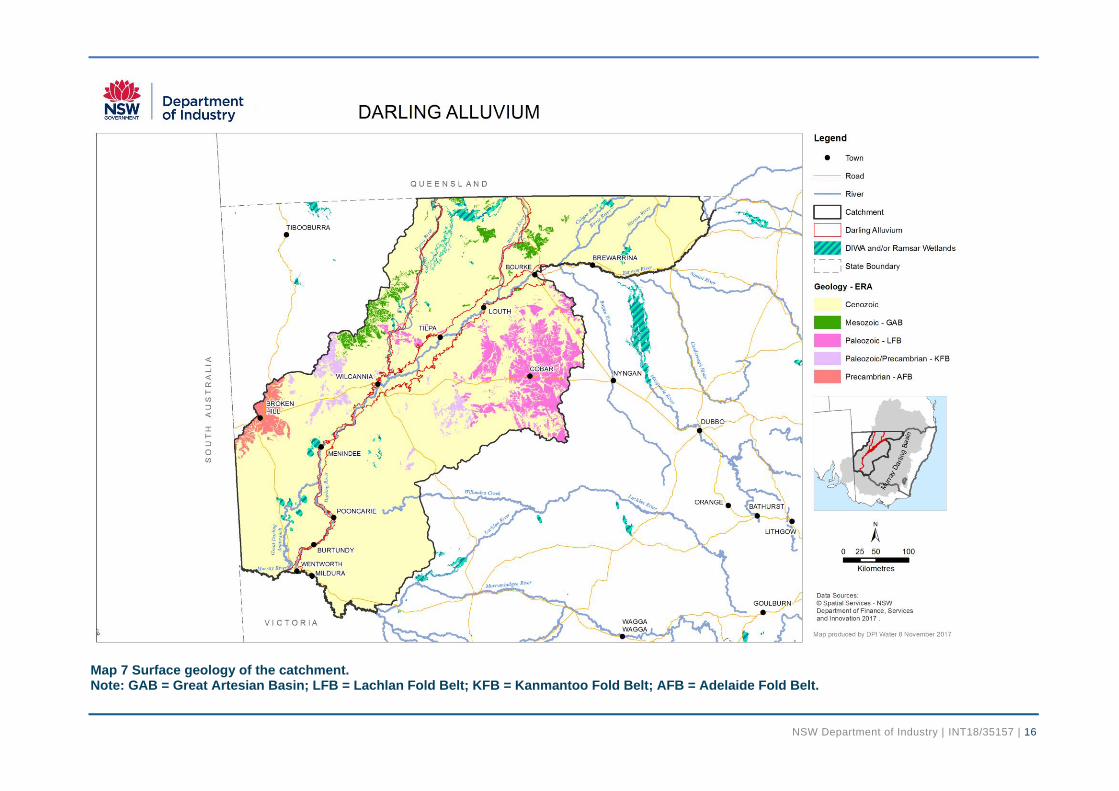
Map 8 shows indicative locations of two schematic geological cross sections for the Upper and Lower Darling Alluvium (Figures 4 and 5).
4.1 Upper Darling Alluvium The Upper Darling Alluvium follows the Darling River Lineament between Bourke and Wilcannia. The lineament is a major zone of faults and fractures trending in an east to north-east direction in western NSW (O'Sullivan et al., 1998). The Upper Darling Alluvium overlies the Great Artesian Basin and Lachlan Fold Belt (Mount, 1992).
The Great Artesian Basin is one of the largest and deepest artesian basins in the world. It covers approximately 22 per cent of Australia across four states including New South Wales, South Australia, the Northern Territory and Queensland and is a significant source of water in New South Wales. The Great Artesian Basin is made up of Mesozoic shales, conglomerates and sandstone. In this area, the Great Artesian Basin is overlain by extensive Cenozoic unconsolidated sediments made up of mud, silt, sand, and gravels generally deposited by river systems (alluvial deposits) or as wash from hill slopes (colluvial deposits).
The Lachlan Fold Belt consists of sedimentary, metamorphic and igneous rocks and is extensively faulted due to tectonic events. In this area, sandstones and other metasediments bound the alluvium to the south (d’Hautefeuille and Williams, 2003). Barriers to groundwater flow in this bedrock basement are the cause of saline discharges to the Darling River near Bourke (Williams, 1991).
4.2 Lower Darling Alluvium The sediments of the Lower Darling Alluvium are from the Quaternary period where the meandering and migration of the Darling River deposited sands, silts and clays. The alluvium consists of the Menindee formation and overlying Coonambidgal Formation (Lawrie et al., 2012b).7 The alluvium overlies the Murray Geologic Basin which in turn overlies the Lachlan, Kanmantoo and Adelaide Fold Belts (DPI Water, 2011).
The Murray Geologic Basin is a saucer-shaped sedimentary basin extending over 300,000 km2 of south-eastern Australia. It is relatively shallow up to about 600 m near Wentworth. During the Tertiary period, the basin experienced three major depositional events that led to the accumulation of a complex sequence of marine, coastal and continental sedimentary deposits correlating to periods of sea level rise and fall. Sedimentation continued intermittently during the Quaternary period. Geological units of significance to the Darling Alluvium are the Blanchetown Clay, Calivil Formation, Loxton Sand and Parilla Sands and underlying Renmark Group (refer Figure 5).
The rocks of the Lachlan, Kanmantoo and Adelaide Fold Belts form a variable elevation basement surface beneath the Tertiary sediments. Ridge structures in this bedrock basement influence the flow of groundwater within the overlying sediments and are the major cause of outflow of saline groundwater to the land surface and rivers in the area (refer to Section 7).
7 ‘Menindee formation’ has the status of ‘Reserved’ in the Australian Stratigraphic Unit Database.
NSW Department of Industry | INT18/35157 | 16
Map 7 Surface geology of the catchment. Note: GAB = Great Artesian Basin; LFB = Lachlan Fold Belt; KFB = Kanmantoo Fold Belt; AFB = Adelaide Fold Belt.
NSW Department of Industry | INT18/35157 | 17
Map 8 Indicative locations of schematic cross sections A-A’ and B-B’ for the Darling Alluvium
NSW Department of Industry | INT18/35157 | 18
Figure 4 Upper Darling Alluvium schematic geological cross section (A-A’) (adapted from Mount, 1992) The Upper Darling Alluvium includes the clay and sand of Cenozoic age.
Figure 5 Lower Darling Alluvium schematic geological cross section (B-B’) (adapted from Lawrie et al., 2012b). The Lower Darling Alluvium consists of the Menindee formation, Coonambidgal Formation, and the surface clays that overlay these formations.
NSW Department of Industry | INT18/35157 | 19
5 Hydrogeology
5.1 Regional context The Darling Alluvium consists of the Cenozoic sediments associated with the Lower and Upper Darling River and the Paroo and Warrego Rivers. The valley fill alluvial sediments are comprised of unconsolidated clay, silt, sand and gravel and are unconfined or semi-confined in nature.
The narrow alluvium surrounding the Paroo and Warrego Rivers widens out where these meet the alluvium of the Darling River. While the geometry of the alluvium varies from Bourke to Wilcannia, there is no break in the sedimentation and groundwater flow is continuous across the boundary between the Upper to Lower Darling Alluvium.
The Upper Darling Alluvium mainly sits over and adjacent to the Great Artesian Basin, Lachlan Fold Belt and Kanmantoo Fold Belt. These units have very different geological characteristics with permeabilities generally orders of magnitude lower than the alluvium. The alluvium is not hydraulically connected to these units.
The Lower Darling Alluvium (and the southern extent of the Upper Darling Alluvium) sits over and adjacent to the sediments of the Murray Geologic Basin. These sediments have similar geological characteristics with permeabilities of the same order of magnitude as the alluvium. The alluvium is hydraulically connected to these sediments.
Maps 7 and 8 show that water in the Darling Alluvium generally follows the elevation of the land surface and the flow of the Darling River.
5.2 Upper Darling Alluvium The Upper Darling Alluvium is typically conceptualised as comprising of a shallow and a deep aquifer system. The shallow system corresponds to sediments of the Narrabri formation and the deeper aquifer system to the Gunnedah and Cubbaroo formations.8
The shallow aquifer system occurs to depths of 25 m below ground level. It has varied levels of salinity depending on its connection to the river and the underlying Murray Geologic Basin. A freshwater lens near the river is accessed for consumptive use. Yields from the shallow aquifer system vary but tend to be generally less than 6 L/s.
The deeper aquifer system occurs to depths of 120 m below ground level, with a pre-Cenozoic paleaochannel that runs roughly parallel with the modern Darling River. These systems are naturally saline and not accessed for consumptive use, although they are accessed by a salt interception scheme near Bourke.
Conceptually, recharge processes occurring include: direct rainfall, flood infiltration, river leakage and inflow from surrounding and underlying Murray Basin sediments. Given the low rainfall, high evaporation and little irrigation, recharge from direct rainfall is likely to be minimal.
Near Bourke, due to a bedrock constriction, water discharges into the river during low flows. This discharge is the target of the salt interception scheme. Water is also lost from the alluvium by abstraction for consumptive use.
5.3 Lower Darling Alluvium Unlike the Upper Darling Alluvium, most of the Lower Darling Alluvium is vertically and laterally bounded by the unconsolidated sediments of the Murray Geologic Basin rather than bedrock. These sediments are not considered part of the younger Lower Darling Alluvium but part of the older Murray Geological Basin. For further information on these, refer to the report entitled NSW
8 The ‘Narrabri formation’, ‘Gunnedah formation’ and ‘Cubbaroo formation’ are not recognised as official units in the Australian
Stratigraphic Unit Database: http://dbforms.ga.gov.au/www/geodx.strat_units.int.
NSW Department of Industry | INT18/35157 | 20
Murray Darling Basin Porous Rock Water Resource Plan Groundwater Resource Description (DoI Water 2019,).
The sediments of the Lower Darling Alluvium vary in thickness from 5 to 35 m below ground level and have low yields of generally less than 5 L/s.
Conceptually, recharge processes occurring are the same as for the Upper Darling Alluvium. It has been observed near Menindee (and possibly applicable elsewhere, also) that a clay veneer and mineral precipitation occurs in the bed and banks of the river (Lawrie et al., 2012b). These act as impediments to river leakage during low-flow conditions. Groundwater chemistry indicates that leakage is episodic and linked to high-flow events where scouring of the banks can occur (Lawrie et al., 2012b).
Loss of water from the alluvium occurs as water moves into the underlying sands of the Murray Geologic Basin via erosional holes in the confining aquitard and where faults allow for lateral leakage into the surrounding sedimentary formations (Lawrie et al., 2012b). Discharge to the river from the alluvial system likely also occurs near Wentworth. Finally, water is abstracted for consumptive use.
5.4 Connection with surface water The Darling Alluvium is hydraulically connected to the Darling River. During large river flow events, the river recharges the shallow aquifer system, giving rise to the freshwater lens present in the near-river aquifer. During low river flow conditions, at some locations depending on geology and topography, the aquifer discharges into the river.
Groundwater levels generally mound near the river, confirming the regional significance of water moving from the river to the underlying and surrounding alluvial systems (Lawrie et al., 2012b).
The Darling River is considered to be hydraulically connected with both the Upper and Lower Darling Alluvium. However, due to the depth and width of the alluvium, impacts to the river from groundwater pumping are subdued and/or delayed.
While this lag time is acknowledged in setting the extraction limit of the resource, from a water management perspective the Darling Alluvium is considered “less highly connected” (as opposed to “highly connected”) to the Darling River.
There is no data available on the connection of the ephemeral flows of the Paroo and Warrego Rivers and the groundwater within their associated alluvium.
NSW Department of Industry | INT18/35157 | 21
Map 9 Groundwater flow direction in the Upper Darling Alluvium
NSW Department of Industry | INT18/35157 | 22
Map 10 Groundwater flow direction in the Lower Darling Alluvium
NSW Department of Industry | INT18/35157 | 23
6 Groundwater Dependent Ecosystems Groundwater dependant ecosystems are defined as ‘ecosystems that require access to groundwater to meet all or some of their water requirements so as to maintain their communities of plants and animals, ecological processes and ecosystem services’ (modified from Richardson et al. 2011).
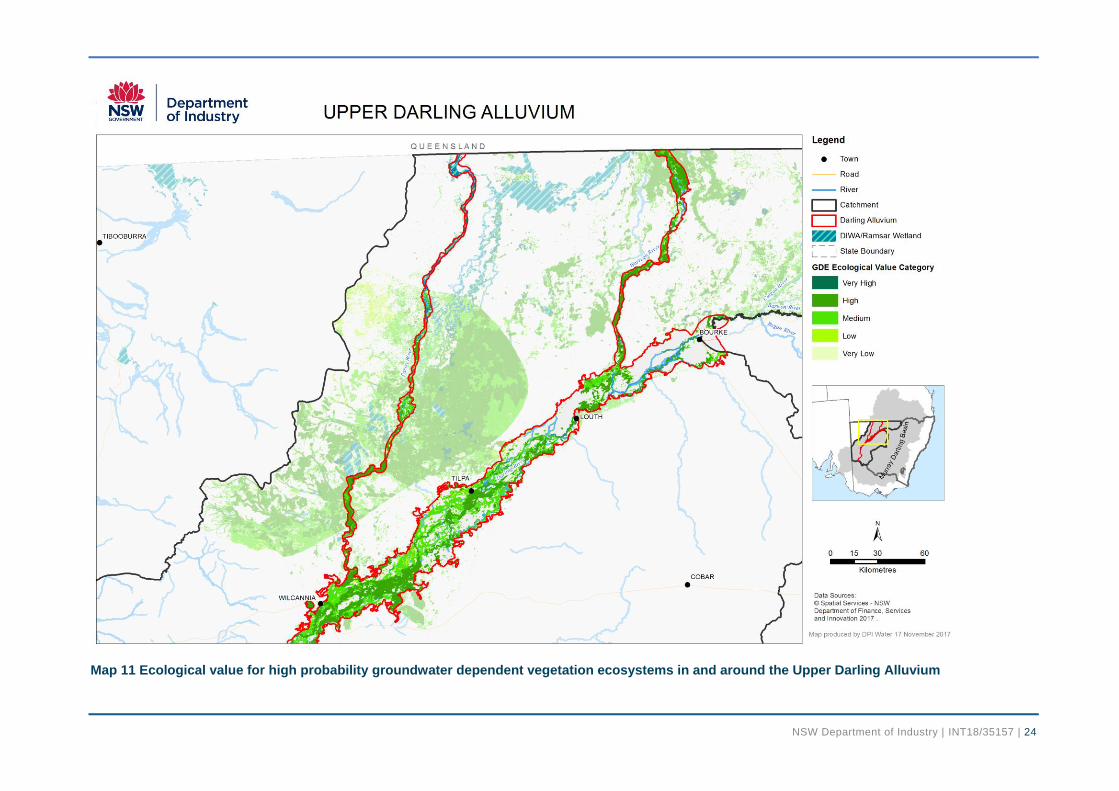
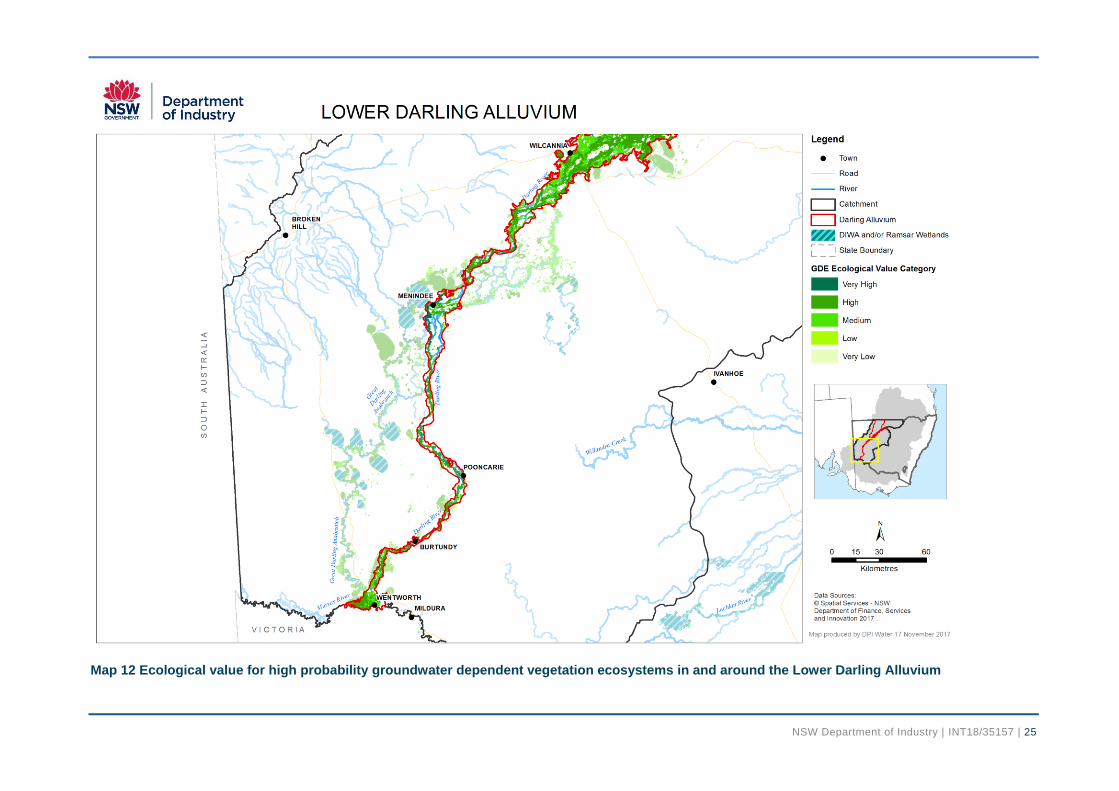
DPI Water has developed a method for the identification of high probability groundwater dependent vegetation ecosystems (Kuginis et al. 2016) and their associated ecological value (Dabovic et al. in prep). This process has identified a number of vegetation GDEs in the catchment. The expected ecological value of vegetation GDEs are shown in Maps 11 and 12.
From this identification process, the GDE ecological values in and around the Darling Alluvium are mainly classified as high and medium. There are limited areas of very high value in this groundwater source.
The method for GDE identification (Kuginis et al., 2016) identifies that the Darling Alluvium is dominated by the vegetation GDE communities of River Red Gum woodland wetlands, Lignum wetlands, freshwater wetlands, Black Box woodlands, Canegrass swamps, Coolabah-River Coobah-Lignum woodland wetlands and chenopod shrublands. These communities are characterised by having endangered ecological communities, DIWA/Ramsar wetlands (Paroo wetlands and associated Menindee wetlands), extensive connected riparian corridors and basin target vegetation species (MDBA, 2014) of Black Box, Lignum and River Red Gums.
The riparian communities provide vital habitat to nesting species and contributes to ecosystem function of instream ecosystems. Generally the GDE communities with high ecological value have large vegetation patches, are highly connected (such as riparian corridors) and have a moderate number of threatened species present especially in the wetland areas.
NSW Department of Industry | INT18/35157 | 24
Map 11 Ecological value for high probability groundwater dependent vegetation ecosystems in and around the Upper Darling Alluvium
NSW Department of Industry | INT18/35157 | 25
Map 12 Ecological value for high probability groundwater dependent vegetation ecosystems in and around the Lower Darling Alluvium
NSW Department of Industry | INT18/35157 | 26
7 Groundwater Quality Water quality describes the condition of water within a water source and its related suitability for different purposes. The water quality characteristic of a groundwater system influences how that water is used by humans, i.e. for town water or stock and domestic supply, or for commercial purposes such as farming and irrigation. If water quality is not maintained, it can impact on the environment as well as the commercial and recreational value of a groundwater resource.
One measure of quality most relevant to the end use is the level of salt present in groundwater, or groundwater salinity. This is indicated by measuring the electrical conductivity (EC) and is generally reported in microsiemens per centimetre (μS/cm).
In NSW, groundwater salinity levels can range from that of rainwater (<250 μS/cm) to greater than that of sea water (~60,000 μS/cm). Groundwater with salinity suitable for a range of productive uses is generally found in the large unconsolidated alluvial systems associated with the major rivers.
Changes in land use, impact of industry, seasonal variations, longer-term changes in climate, and groundwater extraction can each affect groundwater quality.
In the Upper and Lower Darling Alluvium, groundwater monitoring bores were sampled by NSW Government for water quality upon construction, and in some areas periodically for a number of years after construction. Groundwater has been analysed for major ions, pH and electrical conductivity (EC) and the results are stored in the NSW Government’s KiWQM database.
The Australian Nuclear Science and Technology Organisation (Meredith et al. 2016, and references therein) and Geoscience Australia (Lawrie et al. 2012a-c) provide more recent information on groundwater quality in localised parts of the Upper and Lower Darling Alluvium.
7.1 Upper Darling Alluvium Groundwater EC in the Upper Darling Alluvium ranges from a fresh value of about 300μS/cm to a saline 52,000 μS/cm.
Fresh groundwater in the alluvium is due to rapid recharge mainly via the channel floor of the Darling River during high river flow and through the adjacent floodplain during flood events. Saline groundwater in the alluvium is due to evapo-concentration of the shallow groundwater table during relatively long dry periods and sediment mineral weathering (Meredith et al. 2013, 2015).
Saline groundwater discharges from the alluvium into the Darling River where features in the bedrock basement influences the flow of groundwater within the overlying sediments (see Section 4).
Accordingly, shallow groundwater close to the Darling River has a chemical composition similar to that of the river water (after Meredith et al. 2009, 2016). In contrast, deeper groundwater close to the Darling River can be saline due to the mixing of shallow recently recharged fresh water with the discharge of more regionally saline groundwater (Meredith et al. 2013).
Groundwater discharge during drier times and low river flow conditions contribute essentially the entire volume of river water, i.e., the river flow is baseflow (Meredith et al. 2009).
The discharge of saline groundwater is significant at Glen Villa, about 30 kilometres west of Bourke, and is managed via the Upper Darling Salt Interception Scheme. This scheme pumps saline groundwater into a salt management basin to help maintain the health of the river’s aquatic ecosystems, improve water quality for downstream town usage, and enable salinity offsets for irrigation agriculture (MDBA 2011b).
NSW Department of Industry | INT18/35157 | 27
7.2 Lower Darling Alluvium Groundwater EC in the Lower Darling Alluvium ranges from a fresh value of about 230 μS/cm to a hypersaline 109,000 μS/cm.
The most saline groundwaters that have been measured occur at the inlet to Menindee Lake and at the lower end of the Darling River immediately north of Wentworth. A major groundwater study at Menindee during 2010 and 2011 recorded EC values of 253 μS/cm to 45,100 μS/cm and found that the average salinity increases with increasing depth (Lawrie et al. 2012a-c).
Fresh groundwater exists in unconfined alluvium within a few kilometres from the Darling River, its tributaries, and adjacent lakes Menindee and Wetherell, from which it is directly and rapidly recharged. The fresh groundwater thus has a chemical composition similar to that of the surface waters although is commonly slightly alkaline. Recharge is spatially controlled by the variable absence of a confining aquitard (Lawrie et al. 2012b, c).
The fresh groundwater is surrounded by semi-confined to confined, brackish to saline, regional groundwater which has evolved at greater depths and more distally from the surface waters. This is mainly via sediment mineral weathering in the alluvium (Lawrie et al. 2012b, c).
The Curlwaa Salt Interception Scheme manages saline groundwater near Wentworth. Under this scheme groundwater is pumped into a salt management basin to control water table elevations and reduce the risk of salinisation to the irrigation district (MDBA 2011a).
NSW Department of Industry | INT18/35157 | 28
8 Groundwater Management Whilst the Darling Alluvium forms a large laterally continuous and hydraulically connected system, for management purposes it has been subdivided into two separate management units.
Groundwater in the Upper Darling Alluvium is managed under the:
Water Sharing Plan for the Intersecting Streams Unregulated Alluvial Water Sources
2011
Water Sharing Plan for the Barwon-Darling Unregulated and Alluvial Water Sources
2012.
Groundwater in the Lower Darling Alluvium is managed under the:
Water Sharing Plan for the Lower Murray-Darling Unregulated and Alluvial Water
Sources 2011.
The two SDL resource units correspond to four groundwater sources managed by these three water sharing plans.
The Upper Darling Alluvium mainly sits over and adjacent to the management units of the Great Artesian Basin, Lachlan Fold Belt and Kanmantoo Fold Belt. These units have very different geological characteristics and are not considered to be hydraulically connected in a resource management sense to the groundwater resources in the alluvium. Groundwater in these management units is managed under the Water Sharing Plan for the NSW Great Artesian Basin Shallow Groundwater Sources 2011 and Water Sharing Plan for the NSW Murray Darling Basin Porous Rock Groundwater Sources 2011.
The Lower Darling Alluvium (and southern extent of the Upper Darling Alluvium) sits over and adjacent to the sediments of the Murray Geologic Basin. These sediments have similar geological characteristics and are considered to be hydraulically connected to the groundwater resources in the alluvium. Groundwater in these management units is managed under the Water Sharing Plan for the NSW Murray Darling Basin Porous Rock Groundwater Sources 2011.
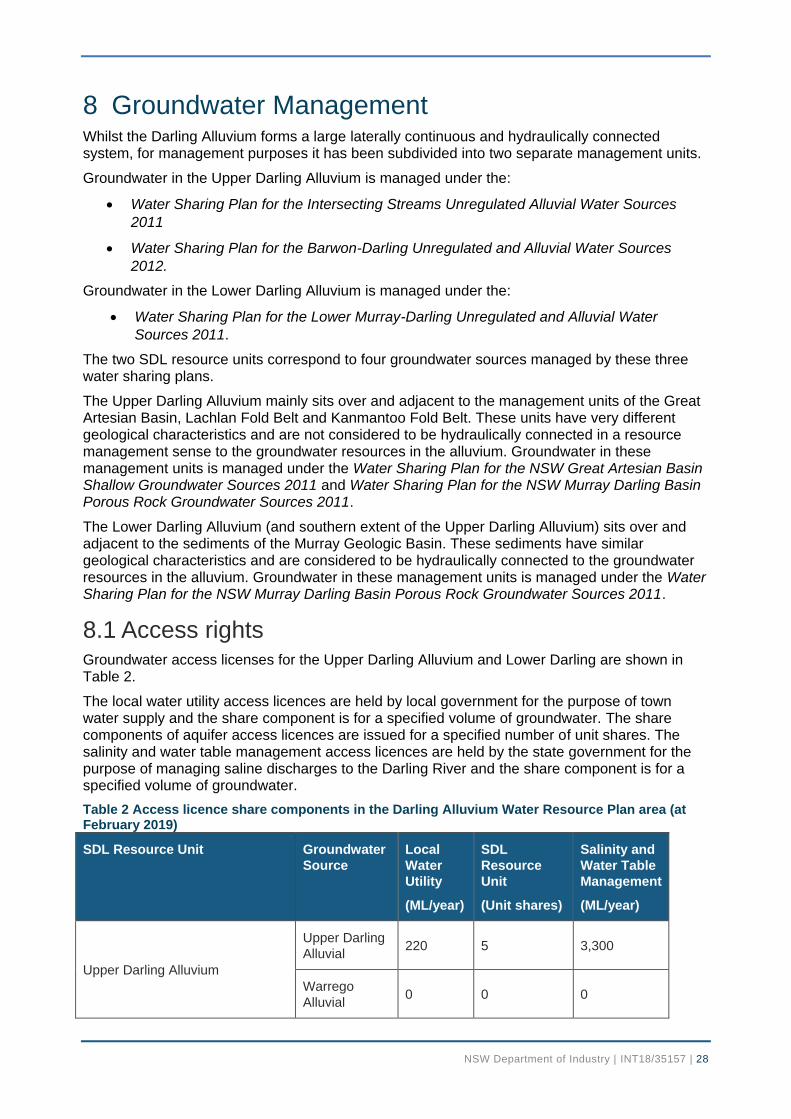
8.1 Access rights Groundwater access licenses for the Upper Darling Alluvium and Lower Darling are shown in Table 2.
The local water utility access licences are held by local government for the purpose of town water supply and the share component is for a specified volume of groundwater. The share components of aquifer access licences are issued for a specified number of unit shares. The salinity and water table management access licences are held by the state government for the purpose of managing saline discharges to the Darling River and the share component is for a specified volume of groundwater.
Table 2 Access licence share components in the Darling Alluvium Water Resource Plan area (at February 2019)
SDL Resource Unit Groundwater
Source
Local
Water
Utility
(ML/year)
SDL
Resource
Unit
(Unit shares)
Salinity and
Water Table
Management
(ML/year)
Upper Darling Alluvium
Upper Darling
Alluvial 220 5 3,300
Warrego
Alluvial 0 0 0
NSW Department of Industry | INT18/35157 | 29
SDL Resource Unit Groundwater
Source
Local
Water
Utility
(ML/year)
SDL
Resource
Unit
(Unit shares)
Salinity and
Water Table
Management
(ML/year)
Paroo Alluvial 0 0 0
Lower Darling Alluvium Lower Darling
Alluvial 0 928 0
1
TOTAL 220 933 3,300
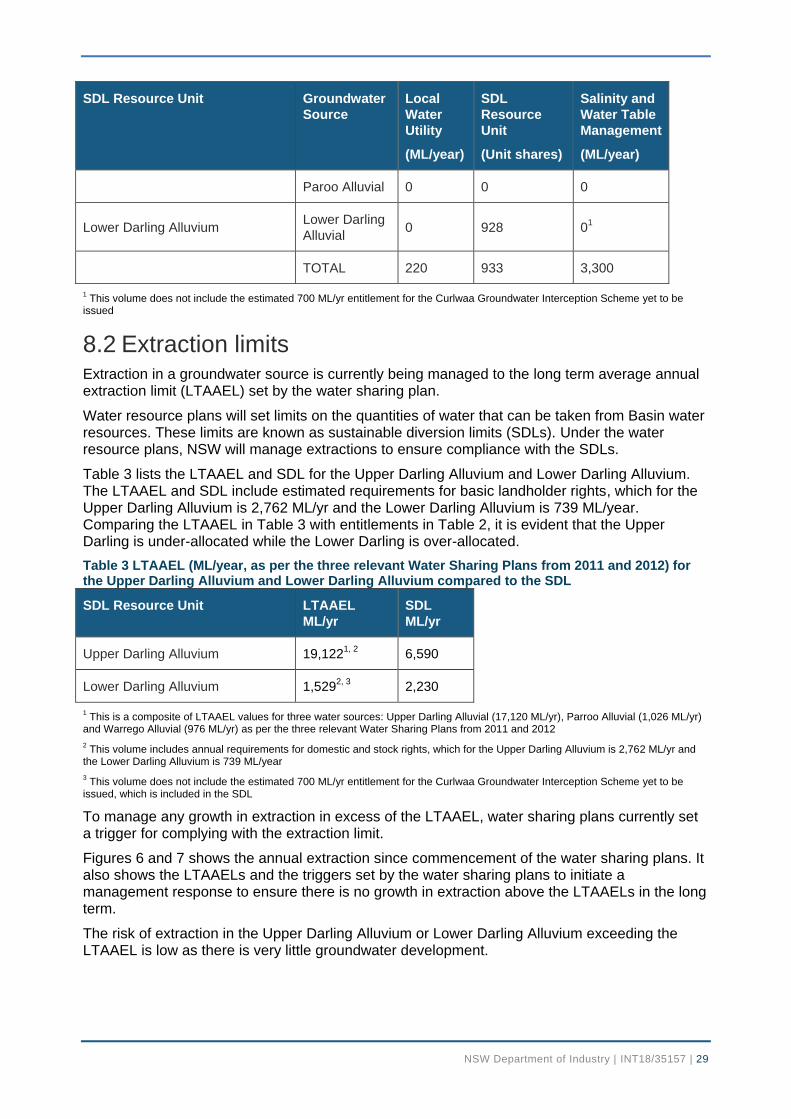
1 This volume does not include the estimated 700 ML/yr entitlement for the Curlwaa Groundwater Interception Scheme yet to be
issued
8.2 Extraction limits Extraction in a groundwater source is currently being managed to the long term average annual extraction limit (LTAAEL) set by the water sharing plan.
Water resource plans will set limits on the quantities of water that can be taken from Basin water resources. These limits are known as sustainable diversion limits (SDLs). Under the water resource plans, NSW will manage extractions to ensure compliance with the SDLs.
Table 3 lists the LTAAEL and SDL for the Upper Darling Alluvium and Lower Darling Alluvium. The LTAAEL and SDL include estimated requirements for basic landholder rights, which for the Upper Darling Alluvium is 2,762 ML/yr and the Lower Darling Alluvium is 739 ML/year. Comparing the LTAAEL in Table 3 with entitlements in Table 2, it is evident that the Upper Darling is under-allocated while the Lower Darling is over-allocated.
Table 3 LTAAEL (ML/year, as per the three relevant Water Sharing Plans from 2011 and 2012) for the Upper Darling Alluvium and Lower Darling Alluvium compared to the SDL
SDL Resource Unit LTAAEL
ML/yr
SDL
ML/yr
Upper Darling Alluvium 19,1221, 2
6,590
Lower Darling Alluvium 1,5292, 3
2,230
1 This is a composite of LTAAEL values for three water sources: Upper Darling Alluvial (17,120 ML/yr), Parroo Alluvial (1,026 ML/yr)
and Warrego Alluvial (976 ML/yr) as per the three relevant Water Sharing Plans from 2011 and 2012
2 This volume includes annual requirements for domestic and stock rights, which for the Upper Darling Alluvium is 2,762 ML/yr and
the Lower Darling Alluvium is 739 ML/year
3 This volume does not include the estimated 700 ML/yr entitlement for the Curlwaa Groundwater Interception Scheme yet to be
issued, which is included in the SDL
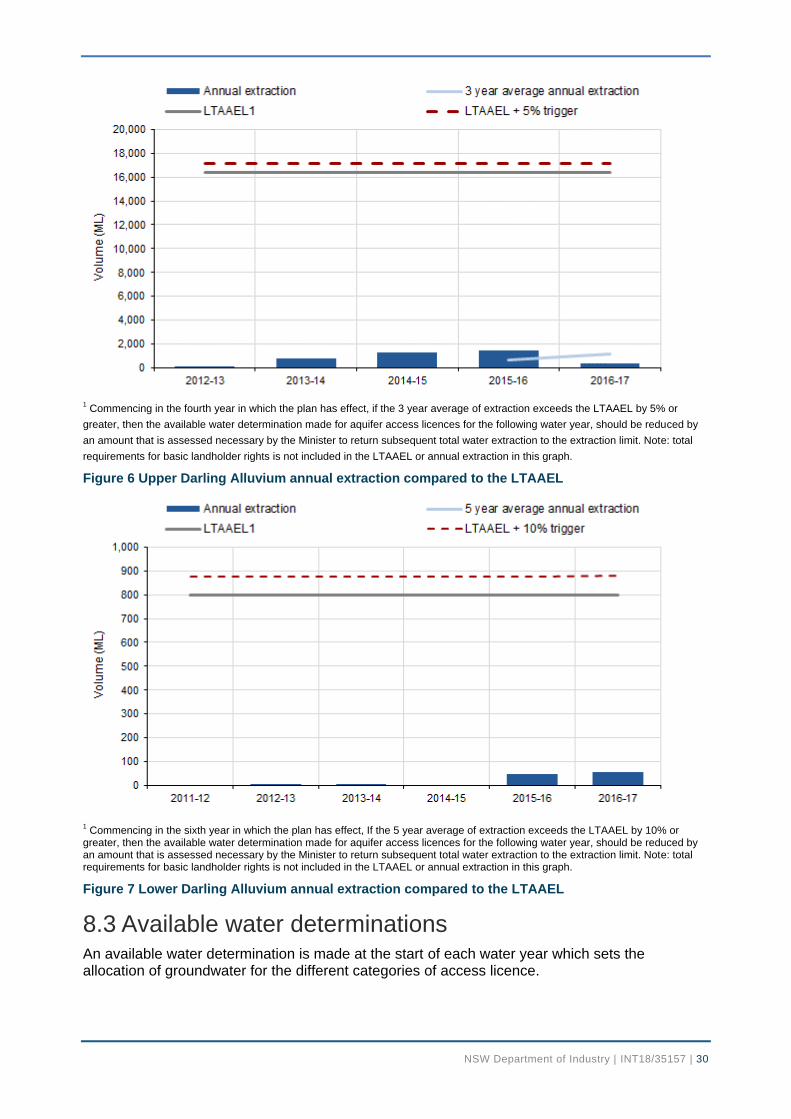
To manage any growth in extraction in excess of the LTAAEL, water sharing plans currently set a trigger for complying with the extraction limit.
Figures 6 and 7 shows the annual extraction since commencement of the water sharing plans. It also shows the LTAAELs and the triggers set by the water sharing plans to initiate a management response to ensure there is no growth in extraction above the LTAAELs in the long term.
The risk of extraction in the Upper Darling Alluvium or Lower Darling Alluvium exceeding the LTAAEL is low as there is very little groundwater development.
NSW Department of Industry | INT18/35157 | 30
1 Commencing in the fourth year in which the plan has effect, if the 3 year average of extraction exceeds the LTAAEL by 5% or
greater, then the available water determination made for aquifer access licences for the following water year, should be reduced by
an amount that is assessed necessary by the Minister to return subsequent total water extraction to the extraction limit. Note: total
requirements for basic landholder rights is not included in the LTAAEL or annual extraction in this graph.
Figure 6 Upper Darling Alluvium annual extraction compared to the LTAAEL
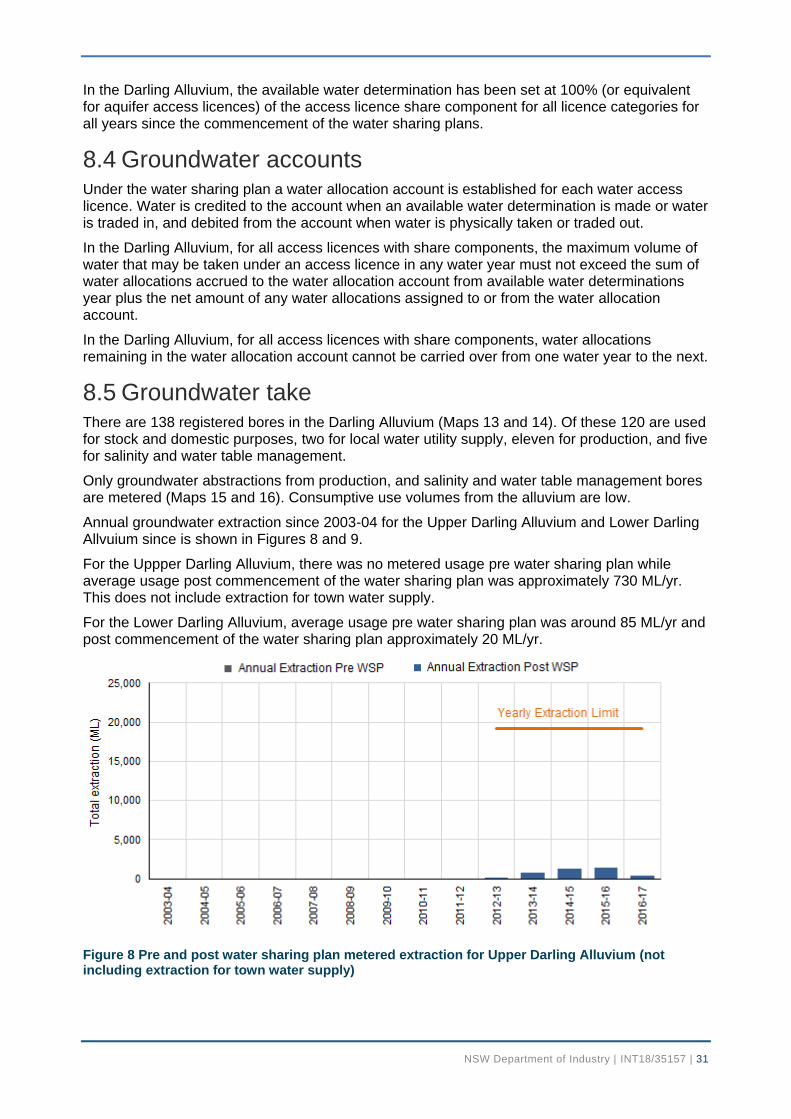
1 Commencing in the sixth year in which the plan has effect, If the 5 year average of extraction exceeds the LTAAEL by 10% or
greater, then the available water determination made for aquifer access licences for the following water year, should be reduced by an amount that is assessed necessary by the Minister to return subsequent total water extraction to the extraction limit. Note: total requirements for basic landholder rights is not included in the LTAAEL or annual extraction in this graph.
Figure 7 Lower Darling Alluvium annual extraction compared to the LTAAEL
8.3 Available water determinations An available water determination is made at the start of each water year which sets the allocation of groundwater for the different categories of access licence.
NSW Department of Industry | INT18/35157 | 31
In the Darling Alluvium, the available water determination has been set at 100% (or equivalent for aquifer access licences) of the access licence share component for all licence categories for all years since the commencement of the water sharing plans.
8.4 Groundwater accounts Under the water sharing plan a water allocation account is established for each water access licence. Water is credited to the account when an available water determination is made or water is traded in, and debited from the account when water is physically taken or traded out.
In the Darling Alluvium, for all access licences with share components, the maximum volume of water that may be taken under an access licence in any water year must not exceed the sum of water allocations accrued to the water allocation account from available water determinations year plus the net amount of any water allocations assigned to or from the water allocation account.
In the Darling Alluvium, for all access licences with share components, water allocations remaining in the water allocation account cannot be carried over from one water year to the next.
8.5 Groundwater take There are 138 registered bores in the Darling Alluvium (Maps 13 and 14). Of these 120 are used for stock and domestic purposes, two for local water utility supply, eleven for production, and five for salinity and water table management.
Only groundwater abstractions from production, and salinity and water table management bores are metered (Maps 15 and 16). Consumptive use volumes from the alluvium are low.
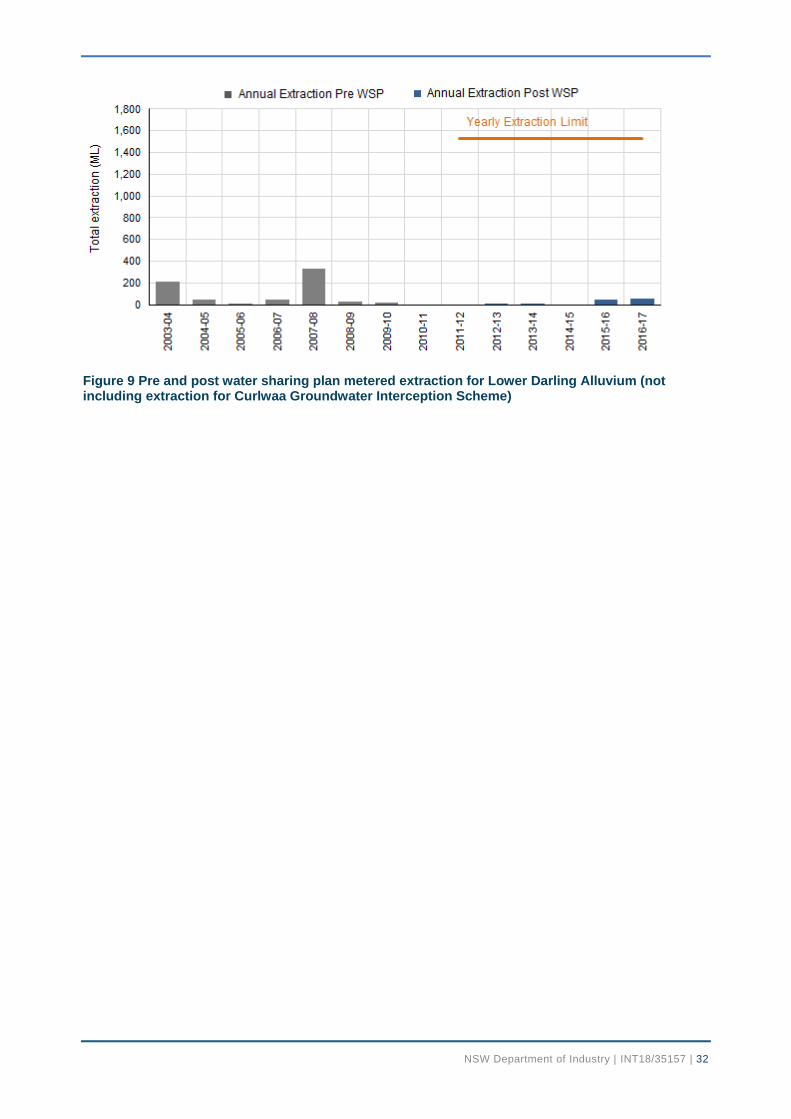
Annual groundwater extraction since 2003-04 for the Upper Darling Alluvium and Lower Darling Allvuium since is shown in Figures 8 and 9.
For the Uppper Darling Alluvium, there was no metered usage pre water sharing plan while average usage post commencement of the water sharing plan was approximately 730 ML/yr. This does not include extraction for town water supply.
For the Lower Darling Alluvium, average usage pre water sharing plan was around 85 ML/yr and post commencement of the water sharing plan approximately 20 ML/yr.
Figure 8 Pre and post water sharing plan metered extraction for Upper Darling Alluvium (not including extraction for town water supply)
NSW Department of Industry | INT18/35157 | 32
Figure 9 Pre and post water sharing plan metered extraction for Lower Darling Alluvium (not including extraction for Curlwaa Groundwater Interception Scheme)
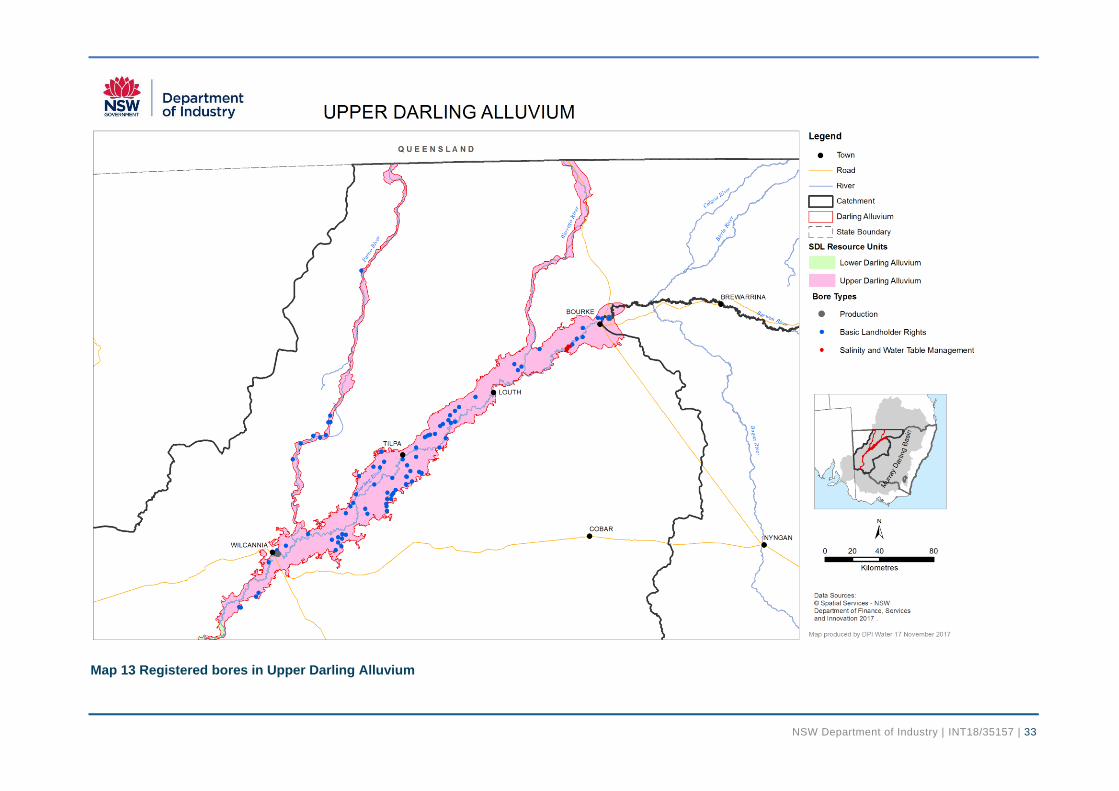
NSW Department of Industry | INT18/35157 | 33
Map 13 Registered bores in Upper Darling Alluvium

NSW Department of Industry | INT18/35157 | 34
Map 14 Registered bores in Lower Darling Alluvium
NSW Department of Industry | INT18/35157 | 35
Map 15 Distribution of extraction in Upper Darling Alluvium
NSW Department of Industry | INT18/35157 | 36
Map 16 Distribution of extraction in Lower Darling Alluvium
NSW Department of Industry | INT18/35157 | 37
8.6 Groundwater dealings Under the Water Management Act 2000, dealings are permitted in access licences, shares, account water and the nomination of supply works.
8.6.1 Temporary
The most common type of dealings between groundwater licences across the state is allocation assignments (temporary trades) made under section 71T of the Water Management Act 2000.
There have been no temporary trades in the Upper Darling Alluvium or Lower Darling Alluvium since the commencement of the water sharing plans.
8.6.2 Permanent
Other dealings for groundwater licences are made under sections 71M (licence transfer), 71N (term licence transfer), 71P (subdivision/consolidation) and 71Q (assignment of shares) and 71W (nomination of works) of the Water Management Act 2000.
Dealings that can result in a change in the potential volume that can be extracted from a location and therefore have the potential to cause third party impacts are subject to a hydrogeological assessment and may be approved subject to conditions being placed on the nominated work or combined approvals such as bore extraction limits to minimise potential impact on neighbouring bores. 71M trades are a change in ownership only and have no potential for additional, third party impacts.
There have been three 71M trades in the Lower Darling Alluvium since the commencement of the water sharing plans. There have been no other permanent trades in the Upper Darling Alluvium or Lower Darling Alluvium.
NSW Department of Industry | INT18/35157 | 38
9 Groundwater Monitoring DPI Water monitors groundwater level, pressure and quality through its network of groundwater observation bores across New South Wales. The groundwater monitoring network plays an important role in:
assessing groundwater conditions
managing groundwater, including groundwater access and extraction
providing data for the development of groundwater sharing plans.
Figure 10 shows a generalised conceptualisation of a layered groundwater system illustrating how the water level height in bores in an area can vary depending on the depth of the screened interval of the bore.
Groundwater systems typically include a number of aquifers which may be confined or unconfined. An unconfined aquifer is an aquifer whose upper water surface (water table) is at atmospheric pressure.
A confined aquifer is most often saturated with water and is overlain by impermeable material (aquitard) causing the water to be under pressure. If the hydraulic head of groundwater is plotted and contoured on a map this is referred to as the potentiometric surface.
Figure 10 also illustrates the difference between stock and domestic, production and monitoring bores. Stock and domestic bores are often constructed into the shallowest aquifer and have a relatively small diameter and limited extraction capacity. As they are typically shallow they can be more susceptible to climatic fluctuations in water levels and influence from surrounding pumping.
Production bores are generally much larger diameter and have significantly larger extraction capacity. They are usually constructed into the deepest most productive part of a groundwater system and can be screened in multiple aquifers.
Monitoring bores are designed to monitor a specific aquifer for water level and water quality and are generally relatively small diameter. At some monitoring bore locations there are multiple monitoring bores which are screened at different depths to observe the hydraulic relationship between different aquifers.
Figure 10 illustrates how the water level in some of the monitoring bores can be at different levels to nearby production and stock bores because the monitoring bores are screened at a single depth and the water level represents the water table or hydraulic head at that depth. Whereas the water level in a multiple screened production bore is a composite water level influenced by the hydraulic head in all screened aquifers.
Groundwater level and pressure data collected from monitoring bores can be plotted and analysed at a water source scale to assess long and short term changes in the system, this data is used to identify areas where there may be a potential management issue.
Across the Upper Darling Alluvium there are 128 active monitoring bores at 94 sites (Map 17) while across the Lower Darling Alluvium there are 133 active monitoring bores at 113 sites (Map 18).
Groundwater levels have been monitored in the Darling Alluvium region since the mid-1980s. The sites are manually monitored every four to eight weeks.
Data is available for 38 monitoring bores at 21 sites in real-time via telemetry from: http://realtimedata.water.nsw.gov.au/water.stm
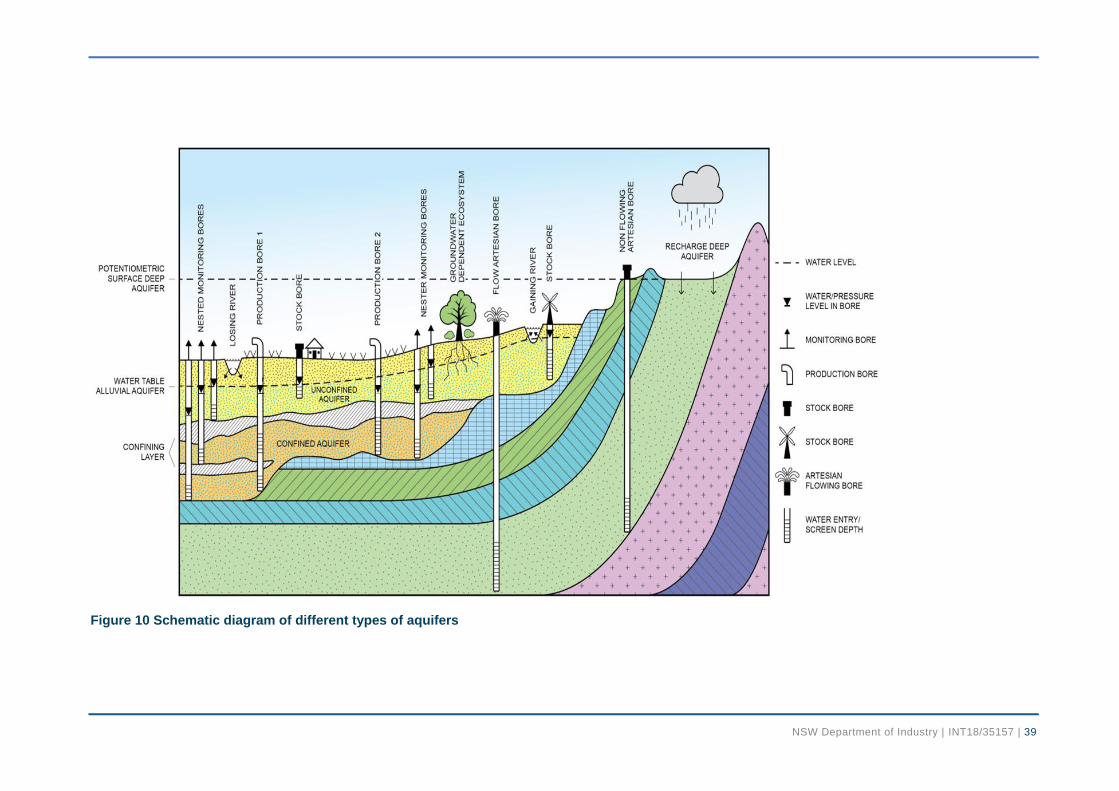
NSW Department of Industry | INT18/35157 | 39
Figure 10 Schematic diagram of different types of aquifers
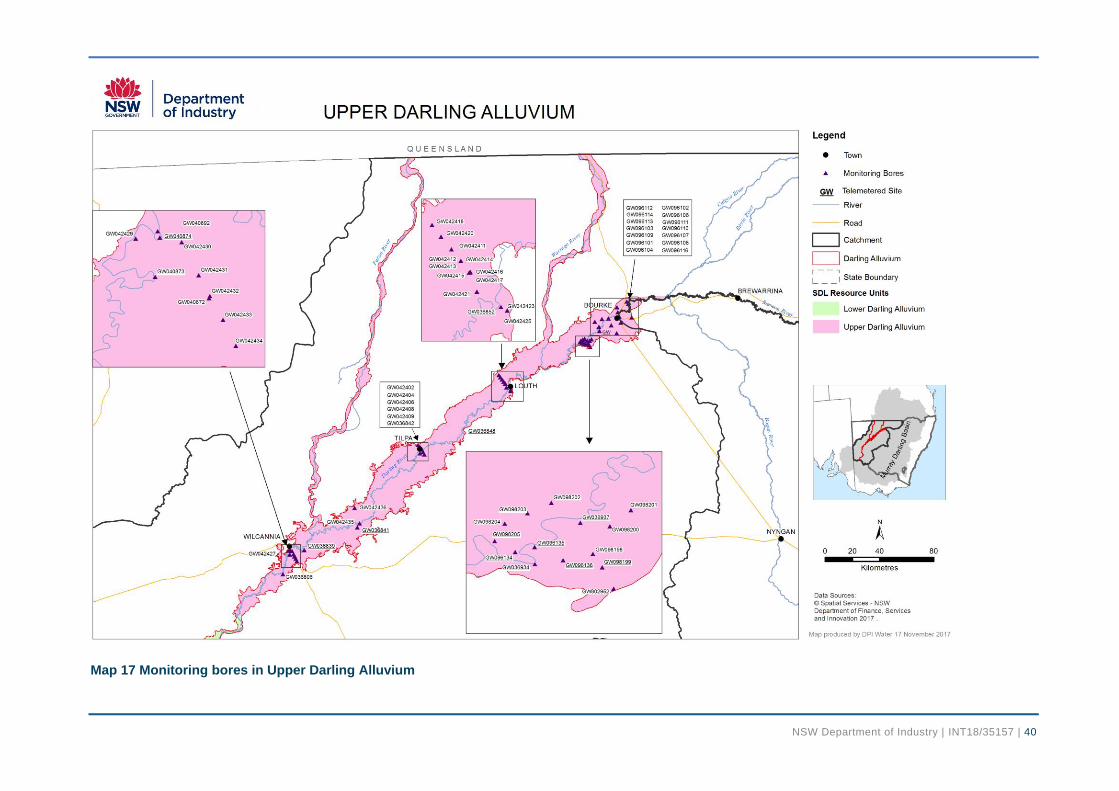
NSW Department of Industry | INT18/35157 | 40
Map 17 Monitoring bores in Upper Darling Alluvium
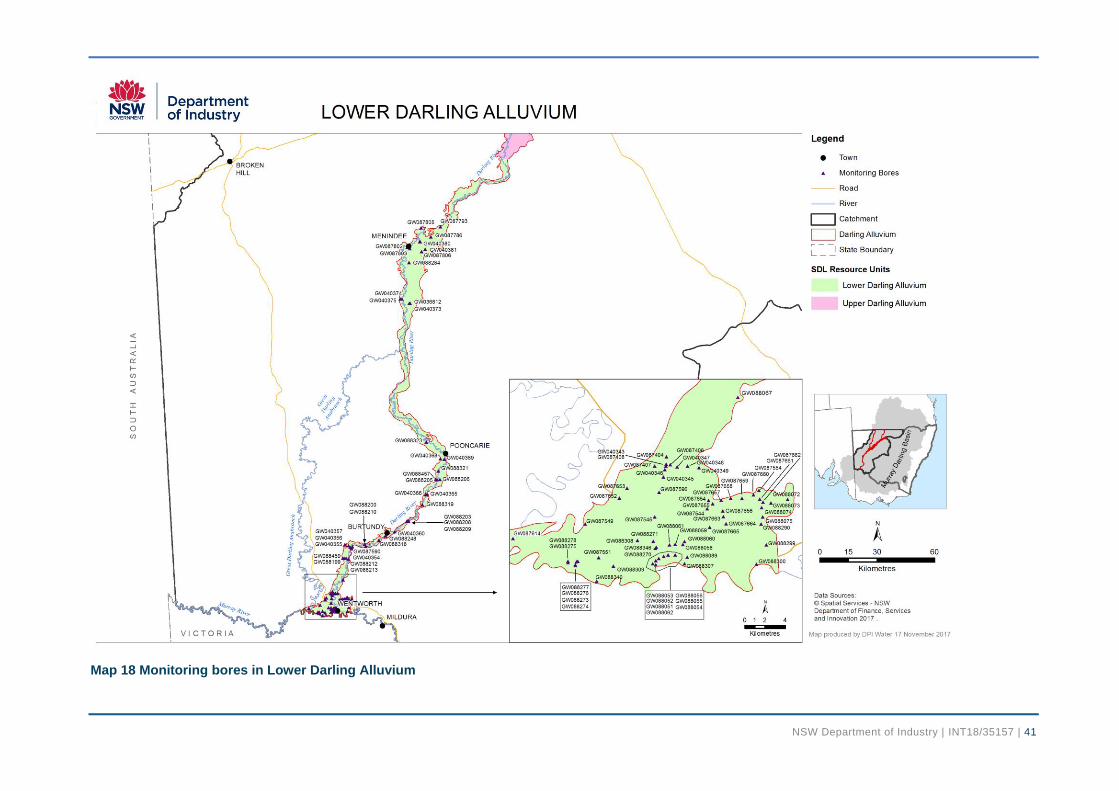
NSW Department of Industry | INT18/35157 | 41
Map 18 Monitoring bores in Lower Darling Alluvium
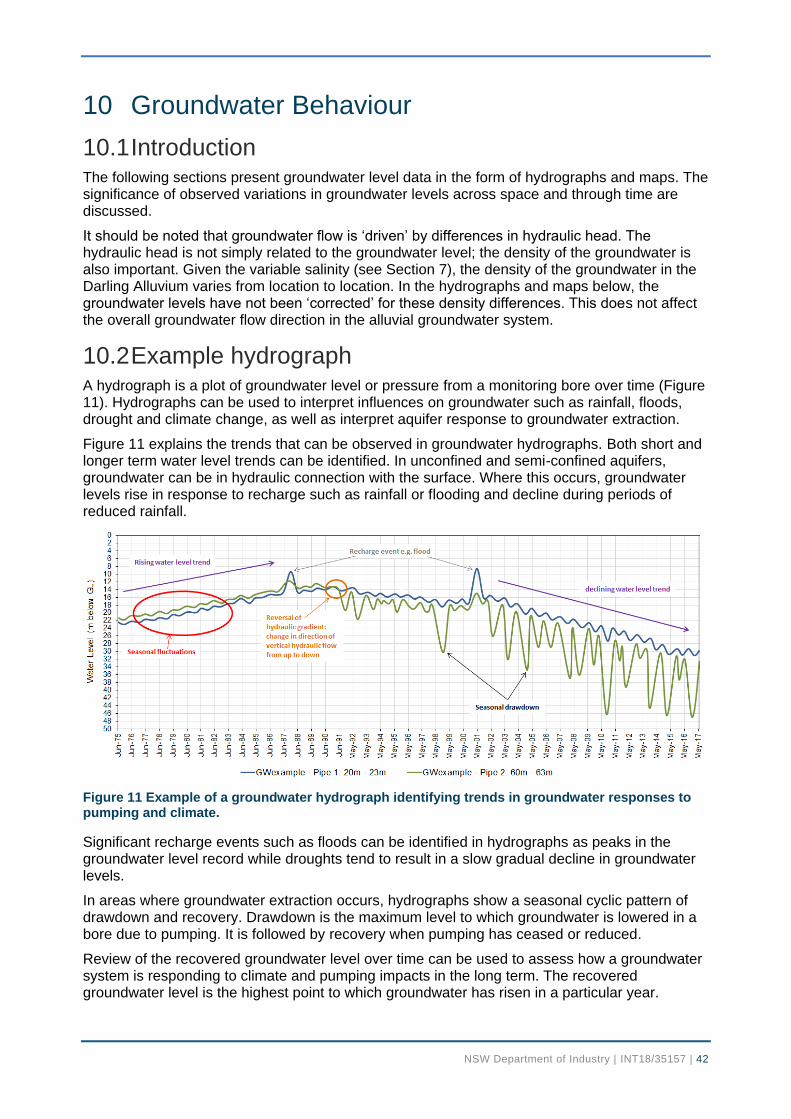
NSW Department of Industry | INT18/35157 | 42
10 Groundwater Behaviour
10.1 Introduction The following sections present groundwater level data in the form of hydrographs and maps. The significance of observed variations in groundwater levels across space and through time are discussed.
It should be noted that groundwater flow is ‘driven’ by differences in hydraulic head. The hydraulic head is not simply related to the groundwater level; the density of the groundwater is also important. Given the variable salinity (see Section 7), the density of the groundwater in the Darling Alluvium varies from location to location. In the hydrographs and maps below, the groundwater levels have not been ‘corrected’ for these density differences. This does not affect the overall groundwater flow direction in the alluvial groundwater system.
10.2 Example hydrograph A hydrograph is a plot of groundwater level or pressure from a monitoring bore over time (Figure 11). Hydrographs can be used to interpret influences on groundwater such as rainfall, floods, drought and climate change, as well as interpret aquifer response to groundwater extraction.
Figure 11 explains the trends that can be observed in groundwater hydrographs. Both short and longer term water level trends can be identified. In unconfined and semi-confined aquifers, groundwater can be in hydraulic connection with the surface. Where this occurs, groundwater levels rise in response to recharge such as rainfall or flooding and decline during periods of reduced rainfall.
Figure 11 Example of a groundwater hydrograph identifying trends in groundwater responses to pumping and climate.
Significant recharge events such as floods can be identified in hydrographs as peaks in the groundwater level record while droughts tend to result in a slow gradual decline in groundwater levels.
In areas where groundwater extraction occurs, hydrographs show a seasonal cyclic pattern of drawdown and recovery. Drawdown is the maximum level to which groundwater is lowered in a bore due to pumping. It is followed by recovery when pumping has ceased or reduced.
Review of the recovered groundwater level over time can be used to assess how a groundwater system is responding to climate and pumping impacts in the long term. The recovered groundwater level is the highest point to which groundwater has risen in a particular year.
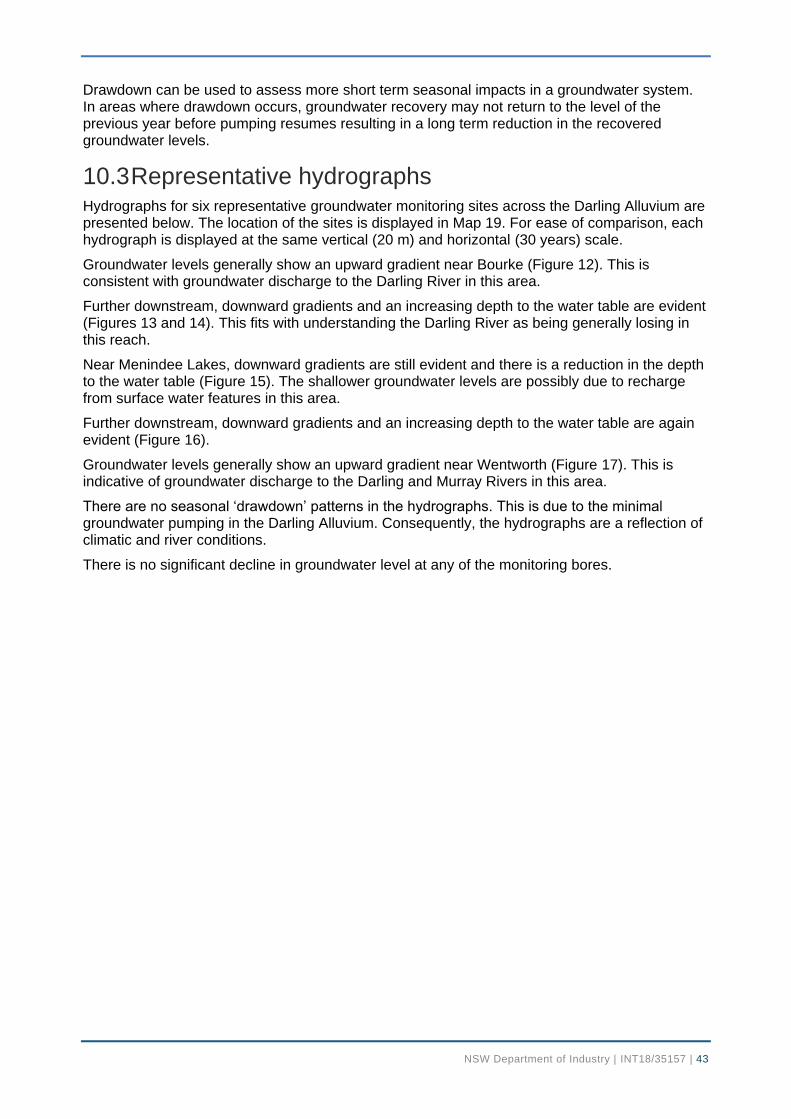
NSW Department of Industry | INT18/35157 | 43
Drawdown can be used to assess more short term seasonal impacts in a groundwater system. In areas where drawdown occurs, groundwater recovery may not return to the level of the previous year before pumping resumes resulting in a long term reduction in the recovered groundwater levels.
10.3 Representative hydrographs Hydrographs for six representative groundwater monitoring sites across the Darling Alluvium are presented below. The location of the sites is displayed in Map 19. For ease of comparison, each hydrograph is displayed at the same vertical (20 m) and horizontal (30 years) scale.
Groundwater levels generally show an upward gradient near Bourke (Figure 12). This is consistent with groundwater discharge to the Darling River in this area.
Further downstream, downward gradients and an increasing depth to the water table are evident (Figures 13 and 14). This fits with understanding the Darling River as being generally losing in this reach.
Near Menindee Lakes, downward gradients are still evident and there is a reduction in the depth to the water table (Figure 15). The shallower groundwater levels are possibly due to recharge from surface water features in this area.
Further downstream, downward gradients and an increasing depth to the water table are again evident (Figure 16).
Groundwater levels generally show an upward gradient near Wentworth (Figure 17). This is indicative of groundwater discharge to the Darling and Murray Rivers in this area.
There are no seasonal ‘drawdown’ patterns in the hydrographs. This is due to the minimal groundwater pumping in the Darling Alluvium. Consequently, the hydrographs are a reflection of climatic and river conditions.
There is no significant decline in groundwater level at any of the monitoring bores.
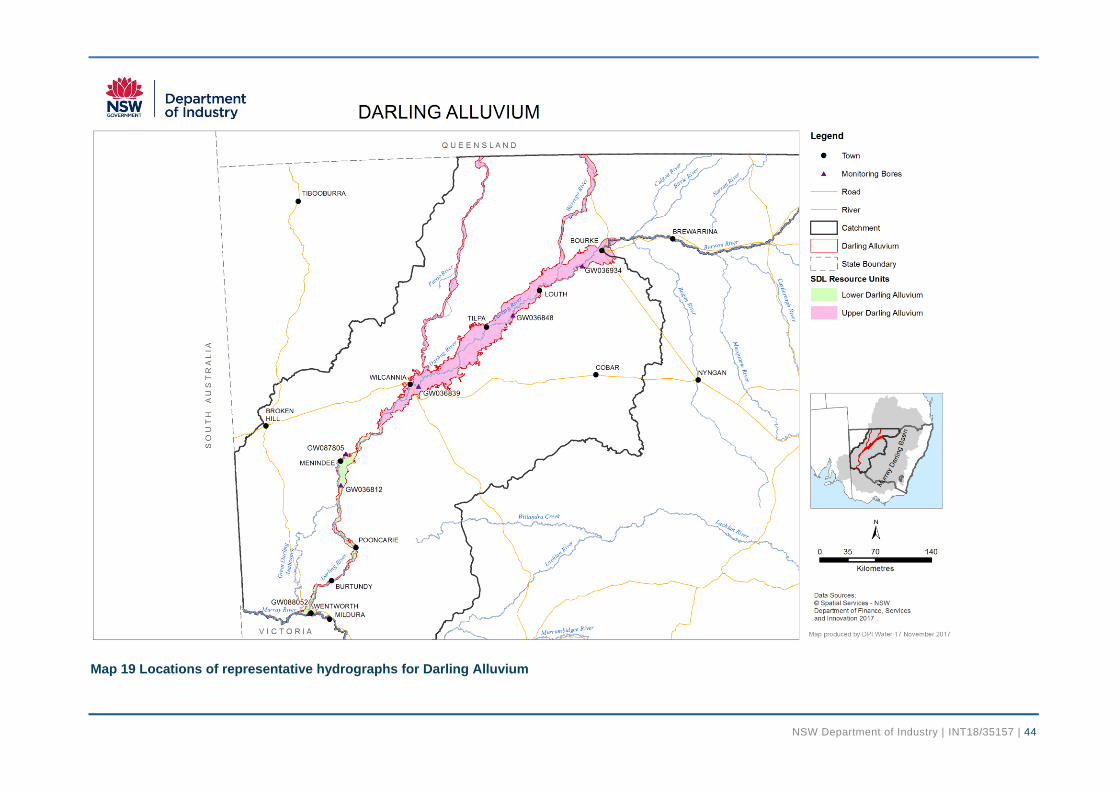
NSW Department of Industry | INT18/35157 | 44
Map 19 Locations of representative hydrographs for Darling Alluvium
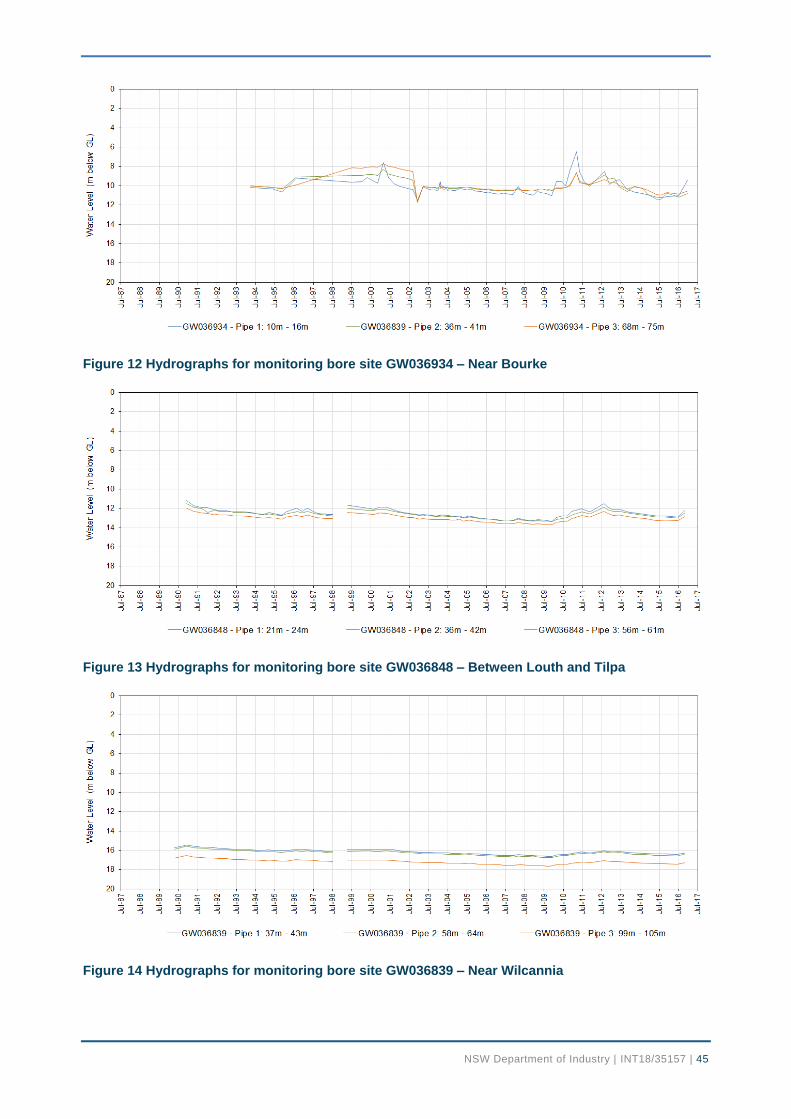
NSW Department of Industry | INT18/35157 | 45
Figure 12 Hydrographs for monitoring bore site GW036934 – Near Bourke
Figure 13 Hydrographs for monitoring bore site GW036848 – Between Louth and Tilpa
Figure 14 Hydrographs for monitoring bore site GW036839 – Near Wilcannia
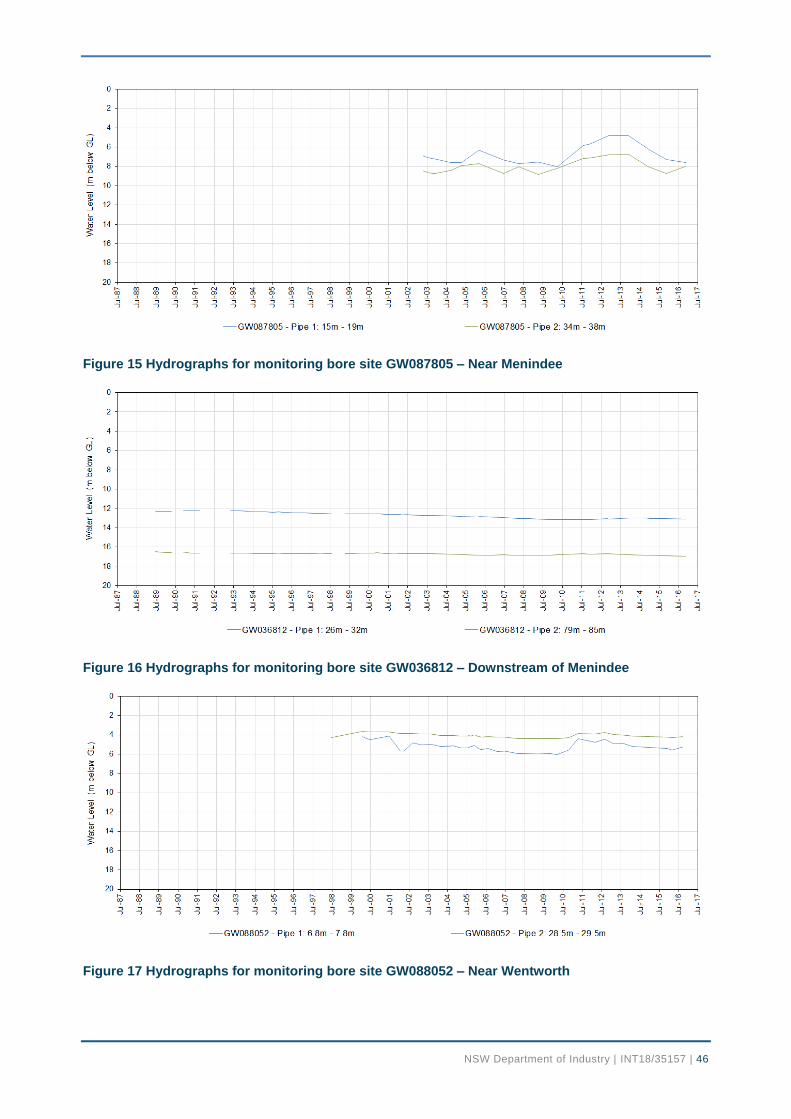
NSW Department of Industry | INT18/35157 | 46
Figure 15 Hydrographs for monitoring bore site GW087805 – Near Menindee
Figure 16 Hydrographs for monitoring bore site GW036812 – Downstream of Menindee
Figure 17 Hydrographs for monitoring bore site GW088052 – Near Wentworth
NSW Department of Industry | INT18/35157 | 47
10.4 Contour and change maps Groundwater level contour maps are used to display the distribution of groundwater levels or pressures from a specific aquifer and indicate groundwater flow direction which is perpendicular to the contour lines.
As seen in Maps 8 and 9, the Darling Alluvium generally follows the elevation of the land surface and the flow of the Darling River (see Section 5). These maps were created using the highest water level recorded in the shallow aquifer system during the winter of water year 2015-16. Contours are displayed in metres Australian Height Datum (m AHD) which provides a reference level for the measurement of groundwater level that is independent of topography.
The Darling Alluvium has been minimally developed (see Section 8). As such, there is no ‘pre-development’ state from which comparisons can be made as is typically done in the larger alluvial systems. Instead, the highest water level recorded in shallow aquifer system during the winter of water year 2005-06 has been compared to the equivalent in 2015-16 (Map 20 and 21).
The resulting contour maps show that there have been small groundwater water level changes in the Darling Alluvium over this 10 year period. There have been increases or declines of around 1-2 m. Across all monitoring bores, there was an average decline of 0.2 m for the 10 year period.
Given the low level of development it abstraction is not a major driver of groundwater level change. The observed changes are instead likely driven by seasonal climate conditions. Relative responses in particular monitoring bores reflect the hydraulic properties of the monitored interval and its proximity to recharge and discharge zones.
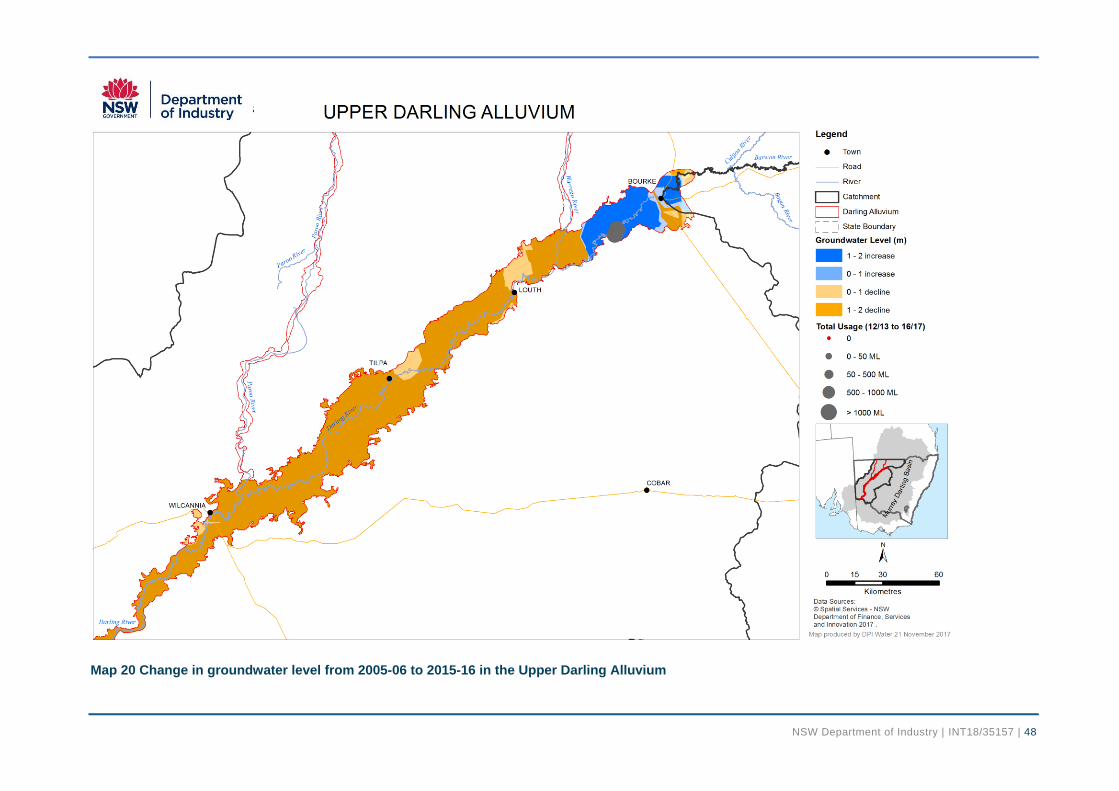
NSW Department of Industry | INT18/35157 | 48
Map 20 Change in groundwater level from 2005-06 to 2015-16 in the Upper Darling Alluvium
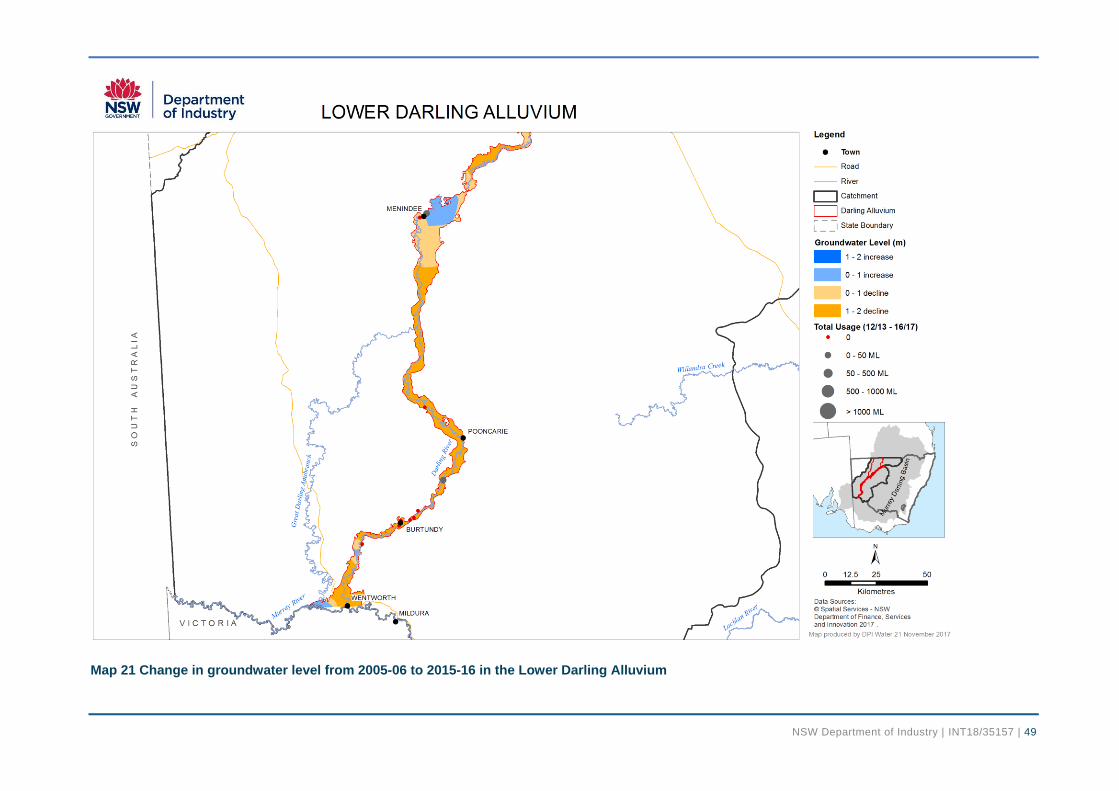
NSW Department of Industry | INT18/35157 | 49
Map 21 Change in groundwater level from 2005-06 to 2015-16 in the Lower Darling Alluvium
NSW Department of Industry | INT18/35157 | 50
References Abraham, J., Hostetler, S. & Brodie, R.C. 2012b. Broken Hill Managed Aquifer Recharge (BHMAR)
Project. Securing Broken Hill’s water supply: assessment of conjunctive water supply options involving managed aquifer recharge and/or groundwater extraction at Menindee Lakes. Geological and hydrogeological framework and conceptual model. Geoscience Australia Record 2012/12, 689 p.
Aquatic Ecosystems Task Group 2012, Aquatic Ecosystems Toolkit. Module 3: Guidelines for Identifying High Ecological Value Aquatic Ecosystems (HEVAE), Australian Government Department of Sustainability, Environment, Water, Population and Communities, Canberra. http://www.environment.gov.au/topics/water/commonwealth-environmental-water-office/monitoring-and-evaluation/aquatic-ecosystems
Australian and New Zealand Environment and Conservation Council (ANZECC) 2000. National Water Quality Management Strategy – Paper No.4: Australian and New Zealand Guidelines for Fresh and Marine Water Quality Volume 1- The Guidelines. Commonwealth of Australia.
Barnett B, Townley LR, Post V, Evans RE, Hunt RJ, Peeters L, Richardson S, Werner AD, Knapton A and Boronkay A. 2012. Australian groundwater modelling guidelines – Waterlines Report Serioe No. 82 June 2012. National Water Commission, Commonwealth of Australia.
Broadstock B. 2009. Impact of groundwater pumping on river systems: a conceptual model of a shallow, highly connected aquifer-stream system for regulated and unregulated rivers. NSW Office of Water, NSW Government.
Bureau of Meteorology (BOM). 2008. Climate data online; Maps - average conditions. Commonwealth of Australia. http://www.bom.gov.au/climate/averages/maps.shtml
Christensen, N.B., Smith, M., Brodie, R.C. and Schoning, G. 2012c. Broken Hill Managed Aquifer Recharge (BHMAR) Project. Securing Broken Hill’s water supply: assessment of conjunctive water supply options involving managed aquifer recharge and/or groundwater extraction at Menindee Lakes. Assessment of potential groundwater resources and underground storage options in the Darling Floodplain. Geoscience Australia Record 2012/14, 876 p.
CSIRO and SKM 2010. The groundwater SDL methodology for the Murray-Darling Basin Plan. CSIRO: Water for a Healthy Country National Research Flagship. Murray Darling Basin Authority, Commonwealth of Australia.
Dabovic J., Raine A., Dobbs L. and Byrne G. In prep. A method to assign ecological value to high probability groundwater dependent vegetation ecosystems in NSW. NSW Department of Primary Industries - Water. NSW Government.
Department of Land and Water Conservation 1999. A proposal for updated and consolidated water management legislation for New South Wales – a white paper. NSW Government.
Department of Water 2016. Understanding Salinity. Western Australian Government. http://www.water.wa.gov.au/water-topics/water-quality/managing-water-quality/understanding-salinity
Department of Primary Industries – Water (DPI Water). 2015. Macro water sharing plans – the approach for groundwater: A report to assist community consultation. NSW Government.
Department of Science, Information Technology and Innovation (DSITI), 2016. Scientific Information for Land Owners (SILO) climate data – Patched point data. Queensland Government. https://www.longpaddock.qld.gov.au/silo/ppd/
Dowsley K., Fawcett J., Helm L. and Currie D. 2012. Atlas of Groundwater Dependant Ecosystems (GDE Atlas), Phase 2 - Task Report 5: Identifying and mapping GDEs. Sinclair Knight Merz and CSIRO. Commissioned by the Natural Resource Commission. Commonwealth of Australia.
Gallant J., Dowling T., Read A., Wilson N. and Tickle P. 2009. 1 second SRTM Level 2 Derived Digital Surface Model v1.0. Geoscience Australia, Commonwealth of Australia.
NSW Department of Industry | INT18/35157 | 51
Gates G., and O’Keefe V. 1997 (unpublished), A brief paper on groundwater management in NSW. Department of Land and Water Conservation, NSW Government.
Healey, M, Raine, A, Lewis, A, Hossain, B, Hancock, F, Sayers, J and Dabovic, J Draft, Applying the High Ecological Value Aquatic Ecosystem (HEVAE) Framework to Water Management Needs in NSW, DPI Water, Sydney.
Johnson A. 1967. Specific yield — compilation of specific yields for various materials. U.S. Geological Survey Water Supply Paper 1662-D, United States of America.
Kuginis L., Dabovic J., Byrne G., Raine A. and Hemakumara H. 2016. Methods for the identification of high probability groundwater dependent vegetation ecosystems. Department of Primary Industries - Water, NSW Government.
Lawrie, K.C., Brodie R.S., Tan, K.P., Gibson, D., Magee, J., Clarke, J.D.A., Halas, L., Gow, L., Somerville, P., Apps, H.E., Christensen, N.B., Brodie, R.C., Abraham, J., Smith, M., Page, D., Dillon, P., Vanderzalm, J., Miotlinski, K., Hostetler, S., Davis, A., Ley-Cooper, A.Y., Schoning, G., Barry, K. and Levett, K. 2012a. Broken Hill Managed Aquifer Recharge (BHMAR) Project. Securing Broken Hill’s water supply: assessment of conjunctive water supply options involving managed aquifer recharge and/or groundwater extraction at Menindee Lakes. Data acquisition, processing, analysis and interpretation methods. Geoscience Australia Record 2012/11, 828 p.
Lawrie, K.C., Brodie R.S., Tan, K.P., Gibson, D., Magee, J., Clarke, J.D.A., Halas, L., Gow, L., Somerville, P., Apps, H.E., Smith, M., Christensen, N.B., Abraham, J., Hostetler, S. & Brodie, R.C. 2012b. Broken Hill Managed Aquifer Recharge (BHMAR) Project. Securing Broken Hill’s water supply: assessment of conjunctive water supply options involving managed aquifer recharge and/or groundwater extraction at Menindee Lakes. Geological and hydrogeological framework and conceptual model. Geoscience Australia Record 2012/12, 689 p.
Lawrie, K.C., Brodie R.S., Tan, K.P., Somerville, P., Gibson, D., Magee, J., Clarke, J.D.A., Abraham, J., Gow, L., Halas, L., Apps, H.E., Hostetler, S., Christensen, N.B., Smith, M., Brodie, R.C. and Schoning, G. 2012c. Broken Hill Managed Aquifer Recharge (BHMAR) Project. Securing Broken Hill’s water supply: assessment of conjunctive water supply options involving managed aquifer recharge and/or groundwater extraction at Menindee Lakes. Assessment of potential groundwater resources and underground storage options in the Darling Floodplain. Geoscience Australia Record 2012/14, 876 p.
Mount T. J. 1992. Yanda Creek Salt Inflows Project, Bourke NSW. Hydrogeological Framework Studies 1991 - 92. DWR TSD TS 92.032
MDBA. 2011b. Upper Darling – salt interception scheme. Murray Darling Basin Authority fact sheet. Available online (29/8/2017): < http://www.mdba.gov.au/publications/brochures-factsheets/upper-darling-salt-interception-scheme >
Meredith, K.T., Han, L.F., Hollins, S.E., Cendon, D.I., Jacobsen, G.E. & Baker, A. 2016. Evolution of chemical and isotopic composition of inorganic carbon in a complex semi-arid zone environment: Consequences for groundwater dating using radiocarbon. Geochimica et Cosmochimica Acta 188, pp. 352-367.
Meredith, K.T., Hollins, S.E., Hughes, C.E., Cendon, D.I., Chisari, R., Griffiths, A. & Crawford, J. 2015. Evaporation and concentration gradients created by episodic river recharge in a semi-
arid zone aquifer: insights from Cl-, 18O, 2H, and 3H. Journal of Hydrology 529, pp. 1070-1078.
Meredith, K.T., Hollins, S.E., Hughes, C.E., Cendon, D.I., Hankin, S. & Stone, D.J.M. 2009. Temporal variation in stable isotopes (18O and 2H) and major ion concentrations within the Darling River between Bourke and Wilcannia due to variable flows, saline groundwater influx and evaporation. Journal of Hydrology 378, pp. 313-324.
NSW Department of Industry | INT18/35157 | 52
Meredith, K., Moriguti, T., Tomascak, P., Hollins, S. & Nakamura, E. 2013. The lithium, boron and strontium isotopic systematics of groundwaters from an arid aquifer system: implications for recharge and weathering processes. Geochimica et Cosmochimica Acta 112, pp. 20-31.
NSW Office of Water 2011. Water reform in the NSW Murray-Darling Basin; Summary of regional water reform and environmental water recovery in NSW 1996-2011. NSW Government.
Richardson, S, Irvine, E, Froend, R, Boon, P, Barber, S & Bonneville, B 2011, Australian groundwater-dependent ecosystem toolbox part 1: assessment framework, Waterlines report, National Water Commission, Canberra.
Smart R. 2016. User guide for land use of Australia 2010-2011. Australian Bureau of Agricultural and Resource Economics and Sciences, Commonwealth of Australia. http://www.agriculture.gov.au/abares/aclump/pages/land-use/data-download.aspx
U.S. Geological Survey (USGS) 2016. The USGS Water Science School - Groundwater quality. United States of America. http://water.usgs.gov/edu/earthgwquality.html
Winter C., Harvey J., Franke O. and Alley W. 1998. Groundwater and Surface Water a Single Resource – U.S. Geological Survey Circular 1139. United States of America.