group financial results for the year ended 31...
TRANSCRIPT

1
Announcement
Group Financial Results for the year ended 31 December 2017
Nicosia, 27 March 2018
This announcement contains inside information for the purposes of Article 7 of the Market Abuse Regulation (EU) 596/2014.
2
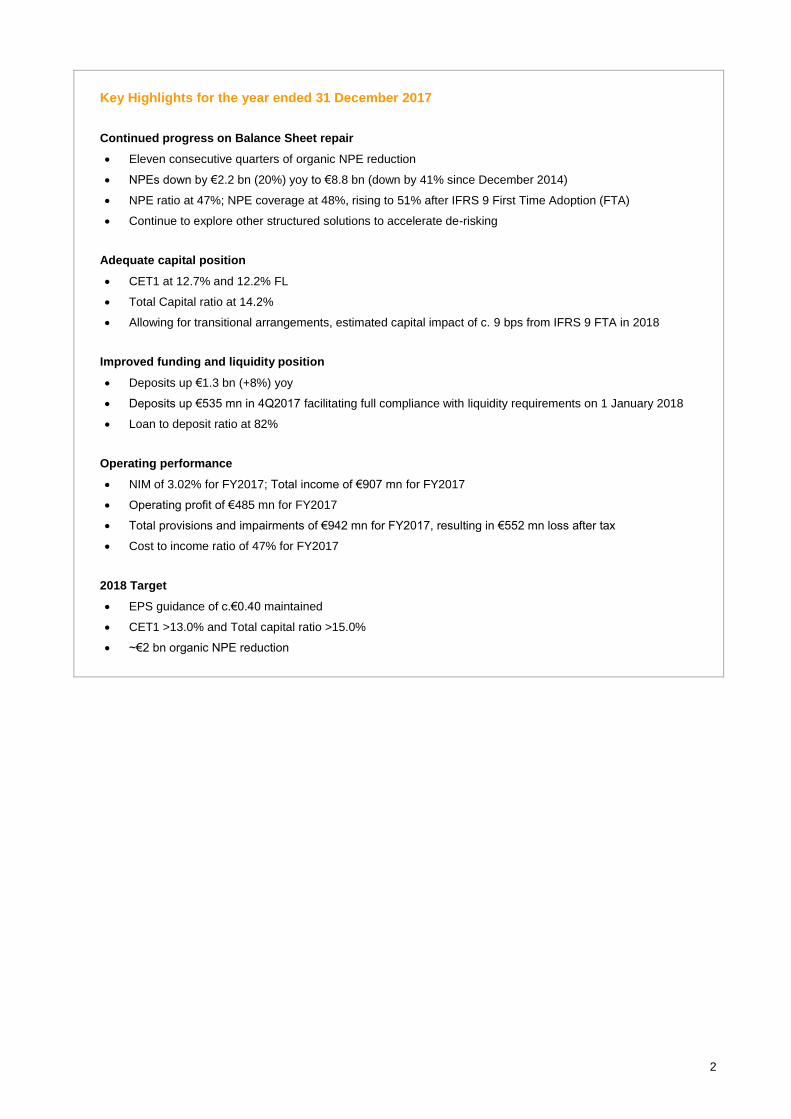
Key Highlights for the year ended 31 December 2017
Continued progress on Balance Sheet repair
Eleven consecutive quarters of organic NPE reduction
NPEs down by €2.2 bn (20%) yoy to €8.8 bn (down by 41% since December 2014)
NPE ratio at 47%; NPE coverage at 48%, rising to 51% after IFRS 9 First Time Adoption (FTA)
Continue to explore other structured solutions to accelerate de-risking
Adequate capital position
CET1 at 12.7% and 12.2% FL
Total Capital ratio at 14.2%
Allowing for transitional arrangements, estimated capital impact of c. 9 bps from IFRS 9 FTA in 2018
Improved funding and liquidity position
Deposits up €1.3 bn (+8%) yoy
Deposits up €535 mn in 4Q2017 facilitating full compliance with liquidity requirements on 1 January 2018
Loan to deposit ratio at 82%
Operating performance
NIM of 3.02% for FY2017; Total income of €907 mn for FY2017
Operating profit of €485 mn for FY2017
Total provisions and impairments of €942 mn for FY2017, resulting in €552 mn loss after tax
Cost to income ratio of 47% for FY2017
2018 Target
EPS guidance of c.€0.40 maintained
CET1 >13.0% and Total capital ratio >15.0%
~€2 bn organic NPE reduction

3
A. Financial Results – Statutory Basis
Audited Consolidated Income Statement for the year ended 31 December 2017
2017 2016
€000 €000
Turnover 1,165,177 1,234,098
Interest income 811,031 890,298
Interest expense (228,291) (204,116)
Net interest income 582,740 686,182
Fee and commission income 190,577 176,865
Fee and commission expense (10,179) (10,207)
Net foreign exchange gains 45,409 43,471
Net gains on financial instrument transactions and disposal/ dissolution of subsidiaries 2,964 63,373
Insurance income net of claims and commissions 50,401 44,432
Net (losses)/ gains from revaluation and disposal of investment properties (4,061) 4,974
Net gains on disposal of stock of property 30,447 1,361
Other income 19,052 14,905
907,350 1,025,356
Staff costs (228,212) (287,172)
Special levy on deposits on credit institutions in Cyprus (22,846) (19,968)
Other operating expenses (297,979) (222,987)
358,313 495,229
Gain on derecognition of loans and advances to customers and changes in expected cash flows
173,443 63,315
Provisions for impairment of loans and advances to customers and other customer credit losses
(952,926) (433,609)
Impairment of other financial instruments (6,459) (11,293)
Impairment of non-financial instruments (58,972) (36,220)
(Loss)/ profit before share of profit from associates and joint ventures (486,601) 77,422
Share of profit from associates and joint ventures 8,957 8,194
(Loss)/ profit before tax (477,644) 85,616
Income tax (76,681) (18,385)
(Loss)/ profit after tax for the year (554,325) 67,231
Attributable to:
Owners of the Company/ Bank (551,852) 63,656
Non-controlling interests (2,473) 3,575
(Loss)/ profit for the year (554,325) 67,231
Basic and diluted (losses)/earnings per share attributable to the owners of the Company/ Bank (€ cent)
(123.7) 14.3

4
A. Financial Results – Statutory Basis (continued)
Audited Consolidated Balance Sheet as at 31 December 2017
2017 2016
Assets €000 €000
Cash and balances with central banks 3,393,934 1,506,396
Loans and advances to banks 1,192,633 1,087,837
Derivative financial assets 18,027 20,835
Investments 739,293 373,879
Investments pledged as collateral 290,129 299,765
Loans and advances to customers 14,602,454 15,649,401
Life insurance business assets attributable to policyholders 518,678 499,533
Prepayments, accrued income and other assets 228,507 269,911
Stock of property 1,641,422 1,427,272
Investment properties 19,646 38,059
Property and equipment 279,814 280,893
Intangible assets 165,952 146,963
Investments in associates and joint ventures 118,113 109,339
Deferred tax assets 383,498 450,441
Non-current assets held for sale 6,500 11,411
Total assets 23,598,600 22,171,935
Liabilities
Deposits by banks 495,308 434,786
Funding from central banks 930,000 850,014
Repurchase agreements 257,322 257,367
Derivative financial liabilities 50,892 48,625
Customer deposits 17,849,919 16,509,741
Insurance liabilities 605,448 583,997
Accruals, deferred income and other liabilities 444,602 335,925
Subordinated loan stock 302,288 -
Deferred tax liabilities 46,113 45,375
Total liabilities 20,981,892 19,065,830
Equity
Share capital 44,620 892,294
Share premium 2,794,358 552,618
Capital reduction reserve - 1,952,486
Revaluation and other reserves 273,708 218,678
Accumulated losses (527,128) (544,930)
Equity attributable to the owners of the Company/ Bank 2,585,558 3,071,146
Non-controlling interests 31,150 34,959
Total equity 2,616,708 3,106,105
Total liabilities and equity 23,598,600 22,171,935

5
B. Financial Results – Underlying Basis
Unaudited Consolidated Income Statement
€ mn FY2017 FY2016 4Q2017 3Q2017 2Q2017 1Q2017 (4q vs 3q)
+%
(FY)
yoy +%
Net interest income 583 686 129 138 160 156 -7% -15%
Net fee and commission income 180 167 47 45 45 43 5% 8%
Net foreign exchange gains and net gains on other financial instruments and disposal/ dissolution of subsidiaries
48 48 16 9 12 11 68% 0%
Insurance income net of claims and commissions 50 44 11 14 15 10 -23% 13%
Net gains from revaluation and disposal of investment properties and on disposal of stock of properties
27 6 5 12 1 9 -59% 317%
Other income 19 12 6 5 4 4 43% 64%
Total income 907 963 214 223 237 233 -4% -6%
Staff costs (228) (224) (60) (57) (57) (54) 5% 1%
Other operating expenses (171) (153) (43) (43) (44) (41) 0% 12%
Special levy and contribution to Single Resolution Fund
(23) (20) (6) 1 (6) (12) - 14%
Total expenses (422) (397) (109) (99) (107) (107) 9% 6%
Operating profit 485 566 105 124 130 126 -15% -14%
Provision charge (779) (370) (50) (73) (592) (64) -31% 111%
Impairments of other financial and non-financial assets
(65) (47) (27) (2) (4) (32) - 38%
Provisions for litigation and regulatory matters (98) (18) (25) (38) (18) (17) -37% 447%
Total provisions and impairments (942) (435) (102) (113) (614) (113) -10% 116%
Share of profit from associates and joint ventures 9 8 4 1 2 2 189% 9%
(Loss)/ profit before tax and restructuring costs
(448) 139 7 12 (482) 15 -40% -423%
Tax (77) (16) (1) (4) (66) (6) -70% 352%
Loss/ (profit) attributable to non-controlling interests
2 (4) 3 0 (1) (0) - -169%
(Loss)/ profit after tax and before restructuring costs
(523) 119 9 8 (549) 9 17% -541%
Advisory, VEP and other restructuring costs (29) (114) (8) (7) (7) (7) 24% -74%
Net gain on disposal of non-core assets - 59 - - - - - -100%
(Loss)/ profit after tax (552) 64 1 1 (556) 2 -26% -967%
Key Performance Ratios FY2017 FY2016 4Q2017 3Q2017 2Q2017 1Q2017 (4q vs 3q)
+
(FY)
yoy +
Net Interest Margin (annualised) 3.02% 3.47% 2.57% 2.86% 3.38% 3.33% -29 bps -45 bps
Cost to income ratio 47% 41% 51% 44% 45% 46% +7 p.p. +6 p.p.
Cost to income ratio excluding special levy and contribution to Single Resolution Fund
44% 39% 48% 45% 43% 41% +3 p.p. +5 p.p.
Operating profit return on average assets (annualised)
2.1% 2.5% 1.8% 2.2% 2.3% 2.3% -0.4 p.p. -0.4 p.p.
Basic (losses)/earnings per share attributable to the owners of the Company/Bank (€ cent)
(123.72) 14.27 0.20 0.27 (124.63) 0.48 (0.07) (137.99)
* p.p. = percentage points, bps = basis points, 100 basis points (bps) = 1 percentage point

6
B. Group Financial Results – Underlying Basis (continued)
Unaudited Consolidated Balance Sheet
€ mn 31.12.2017 31.12.2016 +%
Cash and balances with central banks 3,394 1,506 125%
Loans and advances to banks 1,193 1,088 10%
Debt securities, treasury bills and equity investments 1,029 674 53%
Net loans and advances to customers 14,602 15,649 -7%
Stock of property 1,641 1,427 15%
Other assets 1,740 1,828 -5%
Total assets 23,599 22,172 6%
Deposits by banks 495 435 14%
Funding from central banks 930 850 9%
Repurchase agreements 257 257 0%
Customer deposits 17,850 16,510 8%
Subordinated loan stock 302 - -
Other liabilities 1,148 1,014 13%
Total liabilities 20,982 19,066 10%
Shareholders’ equity 2,586 3,071 -16%
Non-controlling interests 31 35 -11%
Total equity 2,617 3,106 -16%
Total liabilities and equity 23,599 22,172 6%
Key Balance Sheet figures and ratios 31.12.2017 31.12.2016 +
Gross loans (€ mn) 18,755 20,130 -7%
Accumulated provisions (€ mn) 4,204 4,519 -7%
Customer deposits (€ mn) 17,850 16,510 8%
Loan to deposit ratio (net) 82% 95% -13 p.p.
90+ DPD ratio 37% 41% -4 p.p.
90+ DPD provisioning coverage ratio 61% 54% +7 p.p.
NPE ratio 47% 55% -8 p.p.
NPE provisioning coverage ratio 48% 41% +7 p.p.
Quarterly average interest earning assets (€ mn) 19,826 19,060 4 %
Leverage ratio 10.4% 13.2% -2.8 p.p.
Capital ratios and risk weighted assets 31.12.2017 31.12.2016 +
Common Equity Tier 1 capital ratio (CET1) (transitional) 12.7% 14.5% -1.8 p.p.
CET1 (fully loaded) 12.2% 13.9% -1.7 p.p.
Total capital ratio 14.2% 14.6% -4 bps
Risk weighted assets (€ mn) 17,260 18,865 -9%
* p.p. = percentage points, bps = basis points, 100 basis points (bps) = 1 percentage point

7
B. Group Financial Results – Underlying Basis (continued)
B.1. Unaudited reconciliation of Income Statement for the year ended 31 December 2017 between statutory and underlying bases
€ mn Underlying
Basis Reclassification
Statutory Basis
Net interest income 583 - 583
Net fee and commission income 180 - 180
Net foreign exchange gains and net gains on other financial instruments and disposal/ dissolution of subsidiaries 48 - 48
Insurance income net of claims and commissions 50 - 50
Net gains from revaluation and disposal of investment properties and on disposal of stock of properties 27 - 27
Other income 19 - 19
Total income 907 - 907
Total expenses (422) (127) (549)
Operating profit 485 (127) 358
Provisions (779) - (779)
Impairments of other financial and non-financial instruments (65) - (65)
Provisions for litigation and regulatory matters (98) 98 -
Share of profit from associates and joint ventures 9 - 9
Loss before tax and restructuring costs (448) (29) (477)
Tax (77) - (77)
Loss attributable to non-controlling interests 2 - 2
Loss after tax and before restructuring costs (523) (29) (552)
Advisory and other restructuring costs (29) 29 -
Loss after tax (552) - (552)
The reclassification difference between the underlying and statutory bases relates to €127 mn expenses (€98 mn relate to Provisions for litigation and regulatory matters and €29 mn to Advisory and other restructuring costs), which for the purpose of management reporting are monitored and reported below the operating profit.
8
B. Group Financial Results – Underlying Basis (continued)
B.2. Balance Sheet Analysis
B.2.1 Capital Base
Shareholders’ equity totalled €2,586 mn at 31 December 2017, compared to €2,562 mn at 30 September 2017 and to €3,071 mn at 31 December 2016. The Common Equity Tier 1 capital (CET1) ratio (transitional basis) improved to
12.7% at 31 December 2017, compared to 12.4% at 30 September 2017 and 14.5% at 31 December 2016. During FY2017 the CET1 ratio was negatively affected by the additional provision charge in 2Q2017 and the deferred tax asset phasing-in, despite the reduction in Risk - Weighted Assets (RWA). Adjusting for Deferred Tax Assets, the CET1 ratio on a fully-loaded basis totalled 12.2% at 31 December 2017, compared to 11.9% at 30 September 2017 and 13.9% at 31
December 2016. As at 31 December 2017, the Total Capital ratio stood at 14.2%, compared to 13.8% at 30 September 2017, positively affected mainly by the issuance of £30 mn Tier 2 Capital Loan by the UK subsidiary.
The Group’s minimum phased-in CET1 capital ratio requirement for 2017 was 9.50%, comprising a 4.50% Pillar I requirement, a 3.75% Pillar II requirement and the Capital Conservation Buffer (CCB) of 1.25% applicable for 2017. Following the Supervisory Review and Evaluation Process (SREP) performed by the ECB in 2017, and based on the confirmation received in December 2017, the Pillar II requirement applicable from 1 January 2018 has been reduced to 3.00% from 3.75%. As a result, the Group’s minimum phased-in CET1 capital ratio has been reduced to 9.375% from 9.50%, comprising a 4.50% Pillar I requirement, a 3.00% Pillar II requirement and the CCB of 1.875% applicable as from 1 January 2018. The ECB has also provided revised lower non-public guidance for an additional Pillar II CET1 buffer. The Group CET1 ratio remains comfortably above this combined Pillar II requirement and guidance.
The overall Total Capital Ratio requirement for 2017 was 13.00%, comprising a Pillar I requirement of 8.00% (of which up to 1.50% can be in the form of Additional Tier 1 (AT1) capital and up to 2.00% in the form of Tier 2 capital), a Pillar II requirement of 3.75% (in the form of CET1), and the CCB of 1.25% applicable for 2017. Following the final 2017 SREP decision, the overall Total Capital Ratio requirement has been reduced to 12.875% from 13.00%, comprising an 8.00% Pillar I requirement, a 3.00% Pillar II requirement and the CCB of 1.875% applicable as from 1 January 2018.
The Group continues to explore opportunities, subject to market conditions, to raise up to 1.5% of AT1 in the near term to further strengthen the Group’s capital base. In preparation for a potential issuance of AT1 capital instruments and following the approval of the Cypriot courts in July 2017 and December 2017, the Bank proceeded with the full reduction of its capital reduction reserve of €1.3 bn, in order to eliminate the Bank’s accumulated losses of €0.6 bn, thus creating retained earnings of €0.7 bn. The reduction of capital did not have any impact on regulatory capital or the total equity position of the Bank or the Group. The retained earnings will provide the basis for the calculation of distributable items under the Capital Requirements Regulation (EU) No. 575/2013 (‘CRR’). The CRR provides that coupons on AT1 capital instruments may only be paid out of distributable items. Distributable items for the purposes of the CRR are determined, in part, by reference to retained earnings. At 31 December 2017, the Bank had €0.7 bn in distributable items. The Bank is currently under a dividend distribution prohibition which will continue in 2018 following the final 2017 SREP decision received in December 2017. However, based on the decision, such prohibition will not apply to the payment of coupons on any AT1 capital instruments issued by the Bank. Both the retained earnings and distributable items of the Bank will partly decrease as a result of the IFRS 9 implementation on 1 January 2018.
IFRS 9 - Financial Instruments The Group IFRS 9 implementation has been largely completed by 1 January 2018. The new accounting standard requires the impact on the implementation date, 1 January 2018, to be recognised through equity rather than the income statement. As a result, the impact on transition, 1 January 2018, will affect the equity of the Group and not the income statement. The Group’s IFRS 9 preliminary impact
on transition, which is subject to change due to final parameter calibrations, is
assessed to a decrease of shareholders’ equity of c.€300 mn and is primarily driven by credit impairment provisions. This estimated reduction in shareholders’ equity equates to a decrease in the tangible net asset value at 31 December 2017 of €0.67 per share. The Group will implement the transitional arrangements for regulatory capital purposes which result in only 5% of the estimated IFRS 9 impact affecting the capital ratios during 2018. Allowing for IFRS 9 transitional arrangements the impact is a decrease of c.9 bps on Group capital ratios. On a transitional basis and on a fully phased-in basis after the period of transition is complete, the impact of IFRS 9 is expected to be manageable and within the Group’s capital plans.

9
B. Group Financial Results – Underlying Basis (continued)
B.2. Balance Sheet Analysis (continued)
B.2.1 Capital Base (continued)
Default Definition According to the European Banking Authority (EBA) guidelines that govern the CRR default definition, issued in January 2017, the default definition will gradually evolve to align with the Non-Performing Exposure (NPE) definition by 1 January 2021. The Group, in line with regulatory discussions, intends to early adopt changes that will almost align the EBA CRR definition with the NPE definition as from 1 January 2018. This will result in an increase in RWA, equivalent to a decrease of c.40 bps on CET1 ratio and a decrease of c.50 bps on total capital ratio based on 31 December 2017 figures.
B.2.2 Funding and Liquidity
Funding
Funding from Central Banks
At 31 December 2017, the Bank’s funding from central banks totalled €930 mn, which relates wholly to ECB funding, compared to ECB funding at 30 September 2017 of €830 mn and funding from central banks at 31 December 2016 of €850 mn, which comprised Emergency Liquidity Assistance (ELA) of €200 mn and ECB funding of €650 mn. The ECB funding of €930 mn at the year-end comprises €830 mn of funding through Targeted Longer-Term Refinancing Operations (TLTRO II) and €100 mn of funding through Main Refinancing Operations (MRO). The Bank fully repaid ELA in January 2017.
Deposits
Group customer deposits totalled €17,850 mn at 31 December 2017, compared to €17,315 mn at 30 September 2017 and €16,510 mn at 31 December 2016. Group customer deposits increased by €535 mn or 3% during the quarter, with customer deposits in Cyprus increasing by €393 mn or 3%. Cyprus deposits stood at €15,983 mn at 31 December 2017, accounting for 90% of Group customer deposits. The Bank’s deposit market share in Cyprus reached 33.3% at 31 January 2018. Customer deposits accounted for 76% of total assets at 31 December 2017. The Loan to Deposit ratio (L/D) stood at 82% at 31 December 2017, down from 85% at 30 September 2017, compared to a high of 151% at 31 March 2014. The 3 p.p. qoq reduction in L/D ratio mainly relates to the increase in deposits during the quarter.
Subordinated Loan Stock In December 2017, the Bank’s subsidiary in the UK issued a £30 mn unsecured and subordinated Tier 2 Capital Loan. In January 2017, the Bank accessed the debt capital markets and issued a €250 mn unsecured and subordinated Tier 2 Capital Note.
Liquidity
At 31 December 2017 the Group Liquidity Coverage Ratio (LCR) stood at 190% (compared to 141% at 30 September 2017, and 49% at 31 December 2016) and was in compliance with the minimum regulatory requirement of 80% (which increased to 100% on 1 January 2018). The Net Stable Funding Ratio (NSFR ratio) was not introduced on 1 January 2018, as opposed to what was expected. The minimum requirement of NSFR will be 100%. At 31 December 2017 the Group’s NSFR, on the basis of Basel ΙΙΙ standards, stood at 111% (compared to 107% at 30 September 2017 and 95% at 31 December 2016).

10
B. Group Financial Results – Underlying Basis (continued)
B.2. Balance Sheet Analysis (continued)
B.2.2 Funding and Liquidity (continued) Liquidity (continued)
At 31 December 2017 the Bank was not in compliance with all the local regulatory liquidity requirements set by the Central Bank of Cyprus (CBC) with respect to its operations in Cyprus. On 1 January 2018, the local regulatory liquidity requirements were abolished, in accordance with the Capital Requirements Regulation (CRR). In December 2017, the CBC introduced a macroprudential measure in the form of a liquidity add-on that was imposed on top of the LCR which became effective on 1 January 2018. The objective of the measure is to ensure that there will be a gradual release of the excess liquidity arising from the lower liquidity requirements under the LCR compared to the ones under the local regulatory liquidity requirements previously in place. The add-on applies stricter outflow and inflow rates on some of the parameters used in the calculation of the LCR than the ones defined in the Commission Delegated Regulation (EU) 2015/61 as well as additional liquidity requirements in the form of outflow rates on other items that are not subject to any outflow rates as per the Regulation. The measure will be implemented in two stages. The first stage requires stricter outflow and inflow rates which are applicable from 1 January 2018 until 30 June 2018. The second stage requires more relaxed outflow and inflow rates compared to the initial ones, and are applicable from 1 July 2018 until 31 December 2018. More specifically, there will be a reduction of 50% of the LCR add-on rates on 1 July 2018. The additional liquidity requirement is expected to be implemented up to 31 December 2018. The CBC may propose to modify or extend the period of application of this macroprudential measure depending on the results of the follow-up of the banks’ actions on how the excess liquidity is utilised. The Group and the Bank are currently in compliance with the LCR including the LCR add-on.
B.2.3 Loans
Group gross loans totalled €18,755 mn at 31 December 2017, compared to €19,253 mn at 30 September 2017 and €20,130 mn at 31 December 2016. Gross loans in Cyprus totalled €16,814 mn at 31 December 2017 and accounted for 90% of Group gross loans. The Bank is the single largest credit provider in Cyprus with a market share of 39.5% at 31 January 2018. Gross loans in the UK amounted to €1,621 mn at 31 December 2017 and accounted for 9% of Group total gross loans. New loan originations for the Group reached €2,231 mn for FY2017 (of which €1,653 mn were granted in Cyprus and €578 mn by the UK subsidiary), exceeding new lending in FY2016 by 53%.
At 31 December 2017, the Group net loans and advances to customers totalled €14,602 mn (30 September 2017: €14,833 mn; 31 December 2016: €15,649 mn). At 31 December 2017, there were no net loans and advances to customers which were classified as held for sale in line with IFRS 5, compared to net loans and advances to customers with carrying value of €374 mn which were classified as held for sale in line with IFRS 5 at 30 September 2017.
B.2.4 Loan portfolio quality
Tackling the Group’s loan portfolio quality remains the top priority for management. The Group continues to make steady progress across all asset quality metrics and the loan restructuring activity continues. The Group has been successful in engineering restructuring solutions across the spectrum of its loan portfolio.
NPEs as defined by the EBA were reduced by €2.2 bn or 20% during FY2017 to €8,804 mn at 31 December 2017,
accounting for 47% of gross loans, compared to 48% at 30 September 2017 and 55% at 31 December 2016.

11
B. Group Financial Results – Underlying Basis (continued)
B.2. Balance Sheet Analysis (continued)
B.2.4 Loan portfolio quality (continued)
The provisioning coverage ratio of NPEs stood at 48% at 31 December 2017, compared to 49% at 30 September 2017 and 41% at 31 December 2016. When taking into account tangible collateral at fair value, NPEs are fully covered. The 31 December 2017 NPE provisioning coverage ratio increases from 48% to 51% upon IFRS 9 first time adoption.
31.12.2017 30.09.2017
€ mn
% of gross
loans € mn
% of gross
loans
NPEs as per EBA definition 8,804 46.9% 9,164 47.6%
Of which: - NPEs with forbearance measures, no arrears 1,619 8.6% 1,406 7.3%
The Group has recorded significant organic NPE reductions for eleven consecutive quarters and expects the organic reduction of NPEs to continue during the coming quarters. In parallel the Group continues to be actively exploring alternative avenues to accelerate this reduction. As part of this ongoing assessment to optimise the accelerated reduction of NPEs, the gross value of c.€450 mn of the loan portfolio classified as held for sale as at 30 September 2017, is no longer classified as such as per IFRS 5. These loans are now being considered by the Group in other structured solutions to accelerate de-risking, potentially in the near term, in one or more transactions.
Loans in arrears for more than 90 days (90+ DPD) were reduced by €1.4 bn or 17% in FY2017. The decrease was
the result of restructuring activity, debt for asset swaps and write offs. 90+ DPD stood at €6,905 mn at 31 December 2017, accounting for 37% of gross loans (90+ DPD ratio), at the same levels as at 30 September 2017 and compared to 41% at 31 December 2016. The provisioning coverage ratio of 90+ DPD stood at 61% at 31 December 2017, compared to 62% at 30 September 2017 and 54% at 31 December 2016. When taking into account tangible collateral at fair value, 90+ DPD loans are fully covered.
31.12.2017 30.09.2017
€ mn % of gross
loans € mn
% of gross loans
90+ DPD 6,905 36.8% 7,182 37.3%
Comprising:
- Loans with arrears for over 90 days but not impaired 1,385 7.4% 1,397 7.3%
- Impaired loans 5,520 29.4% 5,785 30.0%
Of which:
- impaired with no arrears 402 2.1% 342 1.8%
- impaired with arrears less than 90 days 162 0.9% 43 0.2%

12
B. Group Financial Results – Underlying Basis (continued)
B.2. Balance Sheet Analysis (continued)
B.2.5. Real Estate Management Unit
The Real Estate Management Unit (REMU) on-boarded €164 mn of assets in 4Q2017 (up by 30% qoq) and €520 mn of
assets in FY2017 via the execution of debt for asset swaps. The focus for REMU is increasingly shifting from on-boarding of assets resulting from debt for asset swaps towards the disposal of these assets. The Group completed disposals of €54 mn in 4Q2017, compared to €64 mn in 3Q2017 and disposals of €258 mn in FY2017. In addition, in 2Q2017 the Group disposed of a property with carrying value €10 mn, previously classified as investment property. In January 2018, the Group completed additional disposals of €8 mn. During the year 2017 and January 2018, the Group executed sale-purchase agreements (SPAs) with contract value of €335 mn and in addition signed SPAs for disposals of assets with contract value of €58 mn.
As at 31 December 2017, assets held by REMU had a carrying value of €1.6 bn.
Assets held by REMU (Group) (€ mn)
FY2017 4Q2017 FY2016
Opening balance 1,427 1,548 542
On-boarded assets 520 164 1,086
Sales (258) (54) (166)
Closing balance 1,641 1,641 1,427
Analysis by type and country Cyprus Greece Romania Total
31 December 2017 (€ mn)
Residential properties 146 29 0 175
Offices and other commercial properties 288 39 9 336
Manufacturing and industrial properties 113 34 0 147
Hotels 78 0 - 78
Land (fields and plots) 837 6 5 848
Properties under construction 57 - - 57
Total 1,519 108 14 1,641
Cyprus Greece Romania Total
31 December 2016 (€ mn)
Residential properties 90 37 9 136
Offices and other commercial properties 256 56 12 324
Manufacturing and industrial properties 82 53 1 136
Hotels 74 1 - 75
Land (fields and plots) 739 6 10 755
Properties under construction 1 - - 1
Total 1,242 153 32 1,427

13
B. Group Financial Results – Underlying Basis (continued)
B.2. Balance Sheet Analysis (continued)
B.2.6 Non-core overseas exposures
The remaining non-core overseas net exposures (including both on-balance sheet and off-balance sheet exposures) at 31 December 2017 are as follows:
€ mn 31 December 2017 31 December 2016
Greece 193 283
Romania 79 149
Serbia 9 42
Russia 31 44
The Group continues its efforts for further deleveraging and disposal of non-essential assets and operations in Greece, Romania and Russia. In accordance with the Group’s strategy to exit from overseas non-core operations, the operations of the branch in Romania are expected to be terminated, subject to the completion of deregistration formalities with respective authorities. Most of the remaining assets and liabilities of the branch in Romania with third parties have been transferred to other entities of the Group. In addition to the above, at 31 December 2017 there were overseas exposures of €168 mn in Greece (compared to exposures of €169 mn in Greece as at 30 September 2017), not identified as non-core exposures, since they are considered by management as exposures arising in the normal course of business.

14
B. Group Financial Results – Underlying Basis (continued)
B.3. Income Statement Analysis
B.3.1 Total income
€ mn FY2017 FY2016 4Q2017 3Q2017 2Q2017 1Q2017 (4q vs 3q)
+%
(FY)
yoy
+%
Net interest income 583 686 129 138 160 156 -7% -15%
Net fee and commission income 180 167 47 45 45 43 5% 8%
Net foreign exchange gains and net gains on other financial instruments and disposal/ dissolution of subsidiaries
48 48 16 9 12 11 68% 0%
Insurance income net of claims and commissions 50 44 11 14 15 10 -23% 13%
Net gains from revaluation and disposal of investment properties and on disposal of stock of properties
27 6 5 12 1 9 -59% 317%
Other income 19 12 6 5 4 4 43% 64%
Non-interest income 324 277 85 85 77 77 1% 17%
Total income 907 963 214 223 237 233 -4% -6%
Net Interest Margin (annualised) 3.02% 3.47% 2.57% 2.86% 3.38% 3.33% -29 bps -45bps
Average interest earning assets (€ mn) 19,301 19,752 19,826 19,157 18,996 19,027 3% -2%
* p.p. = percentage points, bps = basis points, 100 basis points (bps) = 1 percentage point Net interest income (NII) and net interest margin (NIM) for FY2017 amounted to €583 mn and 3.02% respectively,
down by 15% compared to €686 mn a year earlier. The NII and NIM for 4Q2017 amounted to €129 mn and 2.57% respectively, compared to €138 mn and 2.86% in 3Q2017. The decline reflects the cost of liquidity compliance, lower volume on loans and pressure on lending rates, primarily from the legacy portfolio. Average interest earning assets for FY2017 amounted to €19,301 mn, down by 2% yoy, largely due to debt for asset
swaps and the elevated provision charges in 2Q2017. Average interest earning assets for 4Q2017 amounted to €19,826 mn, up by 3%, compared to €19,157 mn the previous quarter, due to increased liquid assets. Non-interest income for FY2017 amounted to €324 mn, mainly comprising net fee and commission income of €180 mn,
net insurance income of €50 mn and net foreign exchange income and net gains on financial instruments and disposal/ dissolution of subsidiaries of €48 mn. Non-interest income for FY2017 increased by 17% yoy, largely driven by the increase in gains from REMU sales and the new and increased commission charges introduced in 4Q2016. Non-interest income for 4Q2017 was €85 mn, up by 1% qoq, comprising primarily net fee and commission income of €47 mn and net insurance income of €11 mn. The remaining component of non-interest income for 4Q2017 was a profit of €27 mn (compared to €26 mn for the previous quarter), which includes a net gain of €6 mn on the disposal of assets by REMU (compared to €12 mn for the previous quarter). Total income for FY2017 amounted to €907 mn, compared to €963 mn for FY2016 (6% decrease yoy), with the
reduction reflecting the yoy reduction in NII. Total income for 4Q2017 amounted to €214 mn, compared to €223 mn for 3Q2017.

15
B. Group Financial Results – Underlying Basis (continued)
B.3. Income Statement Analysis (continued)
B.3.2 Total expenses
€ mn FY2017 FY2016 4Q2017 3Q2017 2Q2017 1Q2017 (4q vs 3q) + (FY)
Yoy +
Staff costs (228) (224) (60) (57) (57) (54) 5% 1%
Other operating expenses (171) (153) (43) (43) (44) (41) 0% 12%
Total operating expenses (399) (377) (103) (100) (101) (95) 3% 6%
Special levy and contribution to Single Resolution Fund (SRF)
(23) (20) (6) 1 (6) (12) - 14%
Total expenses (422) (397) (109) (99) (107) (107) 9% 6%
Cost to income ratio 47% 41% 51% 44% 45% 46% +7 p.p. +6 p.p.
Cost to income ratio excluding special levy and contribution to Single Resolution Fund
44% 39% 48% 45% 43% 41% +3 p.p. +5 p.p.
Total expenses for FY2017 were €422 mn, 54% of which related to staff costs (€228 mn), 41% to other operating
expenses (€171 mn) and 5% to special levy and contribution to SRF (€23 mn). Total expenses for 4Q2017 were €109 mn, up by 9% qoq, mainly due to the positive impact from the reversal of the SRF contribution during 3Q2017. Staff costs and other operating expenses amounted to €60 mn and €43 mn respectively, compared to €57 mn and €43 mn respectively during the previous quarter. The 5% qoq increase in staff costs is mainly due to the effect of the current collective agreement with the staff union and year-end actuarial valuations. During the quarter, the special levy and SRF contribution amounted to €6 mn, comprising the special levy. The 2017 annual SRF contribution of c.€6 mn was reversed during 3Q2017, following the amendment of the Law on the Imposition of Special Credit Institution Tax Law to allow the offsetting of the SRF contribution with the special levy charge. The cost to income ratio for FY2017 was 47%, compared to 41% for FY2016, principally reflecting lower interest income. The cost to income ratio for 4Q2017 was 51%, compared to 44% in 3Q2017.

16
B. Group Financial Results – Underlying Basis (continued)
B.3. Income Statement Analysis (continued)
B.3.3 (Loss)/profit before tax and restructuring costs
€ mn FY2017 FY2016 4Q2017 3Q2017 2Q2017 1Q2017 (4q vs 3q)
+%
(FY)
yoy
+%
Operating profit 485 566 105 124 130 126 -15% -14%
Provision charge (779) (370) (50) (73) (592) (64) -31% 111%
Impairments of other financial and non-financial assets
(65) (47) (27) (2) (4) (32) - 38%
Provisions for litigation and regulatory matters (98) (18) (25) (38) (18) (17) -37% 447%
Total provisions and impairments (942) (435) (102) (113) (614) (113) -10% 116%
Share of profit from associates and joint ventures 9 8 4 1 2 2 189% 9%
(Loss)/profit before tax and restructuring costs
(448) 139 7 12 (482) 15 -40% -423%
Operating profit for FY2017 was €485 mn, compared to €566 mn for FY2016 (down by 14% yoy). The decrease mainly
reflects the lower net interest income. Operating profit for 4Q2017 was €105 mn, compared to €124 mn the previous quarter. Provisions for FY2017 totalled €779 mn, up by 111% yoy, following the additional provisions of c.€500 mn in 2Q2017.
The elevated provisioning levels in 2Q2017 reflect changes in the Bank’s provisioning assumptions as a result of the Group’s reconsideration of its strategy to more actively explore other innovative strategic solutions to further accelerate balance sheet de-risking. Provisions for 4Q2017 amounted to €50 mn, down by 31% qoq. The provisioning charge for FY2017 accounted for 4.0% of gross loans, compared to an annualised provisioning charge of 4.1% for 9M2017. An amount of c.€500 mn reflecting the one-off effect of the change in the provisioning assumptions is included in the cost of risk, but for the 9M2017 is not annualised. At 31 December 2017, accumulated provisions, including fair value adjustment on initial recognition and provisions for off-balance sheet exposures, totalled €4,204 mn (compared to €4,470 mn at 30 September 2017 and €4,519 mn at 31 December 2016) and accounted for 22.4% of gross loans (compared to 23.2% at 30 September 2017 and to 22.4% at 31 December 2016). The decrease of accumulated provisions in 4Q2017 of €266 mn is mainly affected by write offs during the quarter. Impairments of other financial and non-financial assets for FY2017 totalled €65 mn, compared to €47 mn for FY2016
(up by 38% yoy), primarily affected by impairment charges relating to legacy exposures and legacy stock of properties in Cyprus and Greece. The 4Q2017 charge of €27 mn (compared to a charge of €2 mn in 3Q2017) includes an impairment loss on legacy properties in Cyprus and Greece. During 3Q2017, the charge was partly offset by a reversal of €15 mn of impairment charges relating to legacy exposures following recent developments.
Provisions for litigation and regulatory matters for FY2017 amounted to €98 mn, primarily relating to redress
provisions for the UK operations and a fine imposed by the Cyprus Commission for the Protection of Competition. Provisions for litigation and regulatory matters for 4Q2017 amounted to €25 mn. The charge for 3Q2017 amounted to €38 mn and was primarily driven by redress provisions for the UK operations, following further analysis of the customer remediation implications from a pilot exercise which completed in 3Q2017.

17
B. Group Financial Results – Underlying Basis (continued)
B.3. Income Statement Analysis (continued)
B.3.4 (Loss)/profit after tax
€ mn FY2017 FY2016 4Q2017 3Q2017 2Q2017 1Q2017 (4q vs 3q)
+%
(FY)
yoy
+%
(Loss)/profit before tax and restructuring costs
(448) 139 7 12 (482) 15 -40% -423%
Tax (77) (16) (1) (4) (66) (6) -70% 352%
Loss/(profit) attributable to non-controlling interests
2 (4) 3 0 (1) (0) - -169%
(Loss)/profit after tax and before restructuring costs
(523) 119 9 8 (549) 9 17% -541%
Advisory, VEP and other restructuring costs (29) (114) (8) (7) (7) (7) 24% -74%
Net gain on disposal of non-core assets - 59 - - - - - -100%
(Loss)/profit after tax (552) 64 1 1 (556) 2 -26% -967%
The tax charge for FY2017 totalled €77 mn compared to €16 mn in FY2016. The tax charge for 4Q2017 totalled €1 mn
compared to €4 mn in 3Q2017 and €66 mn in 2Q2017. The elevated tax charge in 2Q2017 reflects the reduction of Deferred Tax Assets (DTA) of €62 mn, following the increase in provisions for impairment of loans and advances to customers and evaluation of the recoverability assessment of the DTA balance. Loss after tax and before restructuring costs for FY2017 totalled €523 mn, compared to a profit after tax and before
restructuring costs of €119 mn for FY2016. Profit after tax and before restructuring costs for 4Q2017 was €9 mn, compared to €8 mn for 3Q2017 and compared to a loss after tax and before restructuring costs of €549 mn for 2Q2017. Advisory, VEP and other restructuring costs for FY2017 totalled €29 mn, compared to €114 mn for FY2016 (down by
74% yoy). The elevated levels in the previous year relate mainly to the Voluntary Exit Plan (VEP). Advisory and other restructuring costs for 4Q2017 were €8 mn, compared to €7mn for 3Q2017. Net gain on disposal of non-core assets for FY2016 of €59 mn related mainly to the gain on disposal of the investment
in Visa Europe. Loss after tax attributable to the owners of the Company for FY2017 was €552 mn, compared to a profit after tax of €64
mn for FY2016. Profit after tax attributable to the owners of the Company for 4Q2017 was €1 mn, at the same level as the previous quarter, compared to a loss after tax of €556 mn for 2Q2017.
18
C. Operating Environment
Economic recovery in Cyprus accelerated in 2017 and the medium term outlook is favourable driven by an improving labour market, broadening investments and increasing resilience. Cyprus continues to face challenges primarily in relation to public and private indebtedness and non-performing exposures, but while more remains to be done, considerable progress has been achieved.
Real GDP in Cyprus increased by 3.9% in 2017 according to the Statistical Service of the Republic of Cyprus (the Statistical Service), compared with a 3.4% increase the previous year. In the labour market, the unemployment rate dropped to 11% on average in the year from 13% the year before, according to the Statistical Service. Average consumer inflation was marginally positive at 0.5% after four years of deflation (Statistical Service). In the public sector the budget surplus increased significantly and the trend in the public debt to GDP ratio appears to be reversing downwards. Also, in the banking sector funding conditions continued to improve against a backdrop of favourable developments regarding non-performing exposures.
The growth momentum is expected to be maintained in the medium term. Real GDP is expected to grow by 3.6% in 2018 and by 2.9% in 2019, slowing towards 2.5% by 2022 according to the International Monetary Fund (IMF) (Cyprus country report, December 2017). Growth will be supported by private consumption and investment expenditures and by an improving and robust labour market. On the supply side, growth is expected to be driven by favourable developments in the tourism sector and robust performance in business services. Tourism remains robust and continues to benefit from geopolitical uncertainties in competing destinations. Tourist arrivals in 2017 reached 3.7 mn persons, an all-time high, and revenues reached an estimated €2.6 bn or c.13.7% of GDP.
The budget surplus increased to 1.9% of GDP in 2017 according to estimates by the IMF, from 0.5% the previous year. The budget is expected to generate sizeable surpluses in the medium term (IMF). The debt to GDP ratio is estimated at 97.5% in 2017 according to the Statistical Service, and it is expected to decline to 75% by 2022 (IMF). Debt remains affordable with interest charges at 2.6% of GDP in 2016-2017, compared with 3.3% of GDP in 2013 (IMF). The government used favourable conditions in debt markets to issue a new €850 mn 7-year bond in June 2017 yielding 2.8% to pre-finance borrowing needs through to the end of 2018, and to smooth its repayment schedule beyond 2018.
In the banking sector there have been significant improvements in funding conditions and asset quality. Total deposits increased marginally by 0.8% in the year, with resident deposits increasing by 3.3%. Loan deleveraging continued in the year with total loans outstanding dropping by 7.1% and loans to residents dropping by 4.8% (CBC).
Cyprus’ consistent fiscal outperformance and favourable outlook indicate a more rapid reversal in the public debt ratio and the ratio of non-performing loans, than previously expected. The outlook over the medium term is generally positive according to the IMF and the European Commission, while the economy continues to face challenges. Upside factors relate to a longer period of low oil prices, further improvement of economic fundamentals in the euro area and stronger investment spending as property prices are stabilising and as projects in tourism, energy and public works are being implemented. Downside risks to this outlook are associated with the still high levels of non-performing loans, and public debt ratio, and with a possible deterioration of the external environment.
In this context of a strengthening economy and narrowing imbalances, the Cyprus sovereign has benefited from a series of upgrades. Most recently in March 2018, S&P Global Ratings affirmed its long-term sovereign rating at BB+, only one notch below investment grade, and maintained its outlook to ‘positive’. Ιn October 2017, Fitch Ratings upgraded its Long-Term Issuer Default ratings to ‘BB’ from ‘BB-’ with positive outlook. In July 2017, Moody’s Investors Service upgraded the long-term issuer rating of the Cyprus sovereign to Ba3 from B1 to reflect Cyprus’ economic recovery and maintained its outlook to positive. Moody’s Investors Service reiterated its credit rating and positive outlook on the Cyprus sovereign in a February 2018 update. The key drivers for rating upgrades have been stronger economic performance than expected, progress in the banking sector and consistent fiscal outperformance.

19
D. Business Overview
As the Cypriot operations account for 90% of gross loans and 90% of customer deposits, the Group’s financial performance is highly correlated to the economic and operating conditions in Cyprus and will consequently benefit from the country’s recovery. Most recently in October 2017, Standard and Poor’s assigned the Bank 'B/B' long- and short-term issuer credit ratings with positive outlook. The Bank currently has a long-term deposit rating from Moody’s Investors Service of Caa1 with a positive outlook and a long-term issuer default rating from Fitch Ratings Limited of B- with stable outlook. The key drivers for the ratings were the improvement in the Bank’s financial fundamentals mainly in asset quality, and its funding position.
Tackling the Bank’s loan portfolio quality is of utmost importance for the Group. During the year an internal
reorganisation of the Restructuring and Recoveries Division (RRD) was implemented with the aim of boosting resources on both the Retail and SME portfolios of RRD in order to further improve pace and sustainability in these portfolios. Additionally, the Group has created an incremental servicing engine powered by Pepper Cyprus Limited, to support the Bank in resolving non-performing loans from its SME and retail portfolios. The strategic focus of the Group is to reshape its business model to grow in the core Cypriot market through prudent new lending and carefully developing the UK franchise. The Bank’s capital position remains adequate and
the Group expects to continue to be able to support the recovery of the Cyprus economy through the provision of new lending. Growth in new lending in Cyprus is focused on selected industries that are more in line with the Bank's target risk profile, such as tourism, trade, professional services, information/communication technologies, energy, education and green projects. The Bank is currently looking to carefully expand its UK operations, remaining consistent with the Group’s overall credit appetite and regulatory environment. With selective presence in London and Birmingham and a predominantly retail funded franchise, the UK strategy is to support its core proposition in the property market, specifically targeting the professional buy-to-let market and further expanding its mortgage business and its savings, current accounts and trade-related products for SMEs, professionals and Cypriot residents. Aiming at supporting investments by SMEs and mid-caps to boost the Cypriot economy and create new jobs for young people, the Bank continues to provide joint financed schemes. To this end, the Bank continues its partnership with the European Investment Bank (EIB), the European Investment Fund (EIF), the European Bank for Reconstruction and Development (EBRD) and the Cyprus Government. Management is also placing emphasis on diversifying income streams by boosting fee income from international transaction services, wealth management and insurance. The Group’s insurance companies, EuroLife Ltd and General Insurance of Cyprus Ltd operating in the sectors of life and general insurance respectively, are leading players in the insurance business in Cyprus, with such businesses providing a recurring income, further diversifying the Group’s income streams. The insurance income net of insurance claims for FY2017 amounted to €50 mn, up by 13% yoy, compared to €44 mn for FY2016, contributing to 16% of non-interest income. In order to further improve its funding structure, the Bank is stepping up its efforts to manage the deposit mix to ensure continued compliance with liquidity requirements, taking advantage of the increased customer confidence
towards the Bank, as well as improving macroeconomic conditions.

20
E. Strategy and Outlook
The Group remains on track for implementing its strategic objectives aiming to become a stronger, safer and a more focused institution capable of supporting the recovery of the Cypriot economy and delivering appropriate
shareholder returns in the medium term. The key pillars of the Group’s strategy are to:
Materially reduce the level of delinquent loans
Further improve the funding structure
Maintain an appropriate capital position by internally generating capital
Focus on the core Cyprus market and the UK operations
Achieve a lean operating model
Deliver value to shareholders and other stakeholders
KEY PILLARS PLAN OF ACTION
1. Materially reduce the level of delinquent loans
• Sustain momentum in restructuring
• Focus on terminated portfolios (in Recovery Unit) – “accelerated consensual foreclosures”
• Real estate management via REMU
• Explore alternative accelerating NPE reduction measures such as NPE sales, securitisations etc.
2. Further improve the funding structure
• Focus on shape and cost of deposit franchise
• Increase loan pool for the Additional Credit Claim framework of ECB
• Further diversify funding sources
3. Maintain an appropriate capital position • Internally generate capital
• Potential AT1 issuance
4. Focus on core markets
• Targeted lending in Cyprus into promising sectors to fund recovery
• New loan origination, while maintaining lending yields
• Revenue diversification via fee income from international business, wealth, and insurance
• Careful expansion of UK franchise by leveraging the UK subsidiary
5. Achieve a lean operating model
• Implementation of digital transformation program underway, aimed at enhancing productivity distribution channels and reducing operating costs over time
6. Deliver returns • Deliver appropriate medium term risk-adjusted returns

21
E. Strategy and Outlook (continued)
The table below shows the Group’s performance against the 2018 Target and the Medium Term Guidance.
Group Key Performance Indicators7
Actual
Dec-2016
Actual
Dec 2017 2018 Target
Medium-Term
Guidance
Asset Quality
NPE ratio 55% 47%
<40%
~€2 bn organic
reduction
<25%
NPE coverage ratio 41% 48% >50% >50%
Cost of Risk (Provisioning charge)1 1.7% 4.0%
1 <1.0% <1.0%
Capital
CET1 Ratio 14.5% 12.7% >13%2,3
>13%2,3
Total Capital Ratio 14.6% 14.2% >15%2,3
>15%2,3
Profitability
Total income € 963 mn € 907 mn >€800 mn Total income to
grow in excess
of cost4 Cost to Income ratio 41% 47% <50%
4
Net fee and commission income / total
income 17%
5 20% >20% >20%
Balance Sheet Total assets €22.2 bn €23.6 bn ~€23 bn >€25 bn
Earnings per share EPS (€ cent) 14.27 (123.72) ~406
1 An amount of c.€500 mn reflecting the one-off effect of the change in the provisioning assumptions is included in the cost of risk.
2 Allowing for IFRS 9 transitional arrangements for regulatory capital purposes in line with European Union Regulation (2018: 5%, 2019:
15%, 2020: 30%, 2021: 50% and 2022: 75%).
3 Including the impact of the adoption of the changes aligning the EBA CRR default definition with the NPE definition.
4 Excluding the special levy and SRF contribution.
5 The net fee and commission income over total income for FY2016 excludes non-recurring fees of ~€7 mn.
6 The 2018 target for the earnings per share (EPS) does not include the impact of trades or any unplanned or unforeseen events.
7 The NIM and the Net Loans to Deposits (L/D) targets have been removed. A new target on Total Income has been included in the key
metrics considering the focus of the Group on total revenue generation and the shift of income to other lines of the Income Statement.
The L/D ratio has been removed as it is not considered representative following the efforts of the Group to comply with the LCR ratio
including the LCR add-on.
22
F. Definitions & Explanations
Accelerated phase-in period
Following the Regulation (EU) 2016/445 of the ECB of 14 March 2016 on the exercise of options and discretions available in Union law (ECB/2016/4), the DTA phase-in period was reduced from 10 to 5 years, with effect as from the reporting of 31 December 2016. The applicable rate of the DTA phase-in is 60% for 2017, 80% for 2018 and 100% for 2019 (fully phased-in).
Accumulated provisions
Comprise (i) provisions for impairment of customer loans and advances, (ii) the fair value adjustment on initial recognition of loans acquired from Laiki Bank, and (iii) provisions for off-balance sheet exposures disclosed on the balance sheet within other liabilities.
Advisory, VEP and other restructuring costs
Comprise mainly: 1) fees of external advisors in relation to: (i) disposal of operations and non-core assets, (ii) customer loan restructuring activities which are not part of the effective interest rate and (iii) the listing on the London Stock Exchange and 2) voluntary exit plan cost.
AT1 AT1 (Additional Tier 1) is defined in accordance with Articles 51 and 52 of the Capital
Requirements Regulation (EU) No 575/2013. CET1 capital ratio (transitional basis)
CET1 capital ratio (transitional basis) is defined in accordance with the Basel II requirements.
CET1 fully loaded
CET1 fully loaded is defined in accordance with the Capital Requirements Regulation (EU) No 575/2013.
Contribution to SRF Relates to the contribution made to the Single Resolution Fund. Cost to Income ratio
Cost-to-income ratio comprises total expenses (as defined) divided by total income (as defined).
Data from the Statistical Service of the Republic of Cyprus
The latest data was published on 9 March 2018.
Deferred Tax Asset adjustments
The DTA adjustments relate to Deferred Tax Assets totalling €384 mn and recognised on tax losses totalling €3.1 bn and can be set off against future profits of the Bank until 2028 at a tax rate of 12.5%. There are tax losses of c.€8.5 bn for which no deferred tax asset has been recognised. The recognition of deferred tax assets is supported by the Bank’s business forecasts and takes into account the recoverability of the deferred tax assets within their expiry period.
Earnings per Share (EPS)
The 2018 target for the earnings per share (EPS) does not include the impact of any unplanned or unforeseen risk reduction trades, or macro events.
ECB European Central Bank ELA Emergency Liquidity Assistance Gross loans Gross loans are reported before the fair value adjustment on initial recognition relating to loans
acquired from Laiki Bank (calculated as the difference between the outstanding contractual amount and the fair value of loans acquired) amounting to €668 mn at 31 December 2017 (compared to €721 mn at 30 September 2017).
Group
The Group consists of Bank of Cyprus Holdings Public Limited Company, “BOC Holdings”, its subsidiary Bank of Cyprus Public Company Limited, the “Bank” and the Bank’s subsidiaries.

23
F. Definitions & Explanations (continued) Leverage ratio The leverage ratio is the ratio of tangible total equity to total assets for the relevant period. Loans in arrears for more than 90 days (90+ DPD)
Loans in arrears for more than 90 days (90+ DPD) are defined as loans past-due for more than 90 days and loans that are impaired (impaired loans are those (i) for which a provision for impairment has been recognised on an individual basis or (ii) for which incurred losses existed at their initial recognition or (iii) customers in Debt Recovery).
Loans in arrears for more than 90 days (90+ DPD) ratio
90+ DPD ratio means loans in arrears for more than 90 days (90+ DPD) (as defined) divided by gross loans (as defined).
(Loss)/profit after tax and before restructuring costs
(Loss)/profit after tax excludes advisory, VEP and other restructuring costs, as well as net gains on disposal of non-core assets.
Market Shares Both deposit and loan market shares are based on data from the Central Bank of Cyprus.
Net fee and commission income over total income
Net fee and commission income over total income is the net fee and commission income divided by the total income (as defined). The ratio of 17% for 2016 excludes non-recurring fees of ~€7 mn.
Net Interest Margin
Net interest margin is calculated as the net interest income (annualised) divided by the average interest earning assets. Interest earning assets include: cash and balances with central banks, plus loans and advances to banks, plus net customer loans and advances, plus investments (excluding equities and mutual funds) and derivatives.
Net loans and advances
Loans and advances net of accumulated provisions.
Net loan to deposit ratio
Net loan to deposits ratio is calculated as the net loans and advances to customers divided by customer deposits, including loans and deposits held for sale.
Net Stable Funding Ratio (NSFR)
The NSFR is calculated as the amount of “available stable funding” (ASF) relative to the amount of “required stable funding” (RSF), on the basis of Basel III standards. Its calculation is a SREP requirement. EBA is working on finalising the NSFR and enforcing it as a regulatory ratio.
Non-performing exposures (NPEs)
In 2014 the EBA published its reporting standards on forbearance and non-performing exposures (NPEs). According to the EBA standards, a loan is considered an NPE if: (i) the debtor is assessed as unlikely to pay its credit obligations in full without the realisation of the collateral, regardless of the existence of any past due amount or of the number of days past due, or (ii) the exposures are impaired i.e. in cases where there is a specific provision, or (iii) there are material exposures which are more than 90 days past due, or (iv) there are performing forborne exposures under probation for which additional forbearance measures are extended, or (v) there are performing forborne exposures under probation that present more than 30 days past due within the probation period. The NPEs are reported before the deduction of accumulated provisions (as defined).
NPE ratio NPEs ratio is calculated as the NPEs as per EBA (as defined) divided by gross loans (as
defined). Operating profit Comprises profit before total provisions and impairments (as defined), share of profit from
associates and joint ventures, tax, profit attributable to non-controlling interests, advisory, VEP and other restructuring costs, and net gains on disposal of non-core assets (where applicable).
Operating profit return on average assets
Operating profit return on average assets is calculated as the operating profit divided by the average of total assets for the relevant period.

24
F. Definitions & Explanations (continued)
Phased-in Capital Conservation Buffer (CCB)
In accordance with the legislation in Cyprus which has been set for all credit institutions, the applicable rate of the CCB is 1.25% for 2017, 1.875% for 2018 and 2.5% for 2019 (fully phased-in).
Provision charge The provision charge comprises provisions for impairments of customer loans, net of gain/(loss)
on derecognition of loans and advances to customers and changes in expected cash flows. Provisioning charge (cost of risk)
Provisioning charge (cost of risk) (year to date) is calculated as the provisions for impairment of customer loans and provisions for off-balance sheet exposures, net of gain on derecognition of loans and advances to customers and changes in expected cash flows divided by average gross loans (the average balance calculated as the average of the opening balance and the closing balance). An amount of c.€500 mn reflecting the one-off effect of the change in the provisioning assumptions is included in the cost of risk, but for the 9M2017 is not annualised.
Provisioning coverage ratio for 90+ DPD
Provisioning coverage ratio for 90+ DPD is calculated as the accumulated provisions (as defined) over 90+ DPD (as defined).
Provisioning coverage ratio for NPEs
Provisioning coverage ratio for NPEs is calculated as accumulated provisions (as defined) over NPEs (as defined).
Quarterly average interest earning assets
Average of interest earning assets as at the beginning and end of the relevant quarter. Interest earning assets include: cash and balances with central banks, plus loans and advances to banks, plus net customer loans and advances, plus investments (excluding equities and mutual funds) and derivatives.
Qoq Quarter on quarter change Special levy Relates to the special levy on deposits of credit institutions in Cyprus.
The remaining component of non-interest income
Comprises net foreign exchange gains, net gains on other financial instrument transactions and disposal/ dissolution of subsidiaries, net gains/(losses) from revaluation and disposal of investment properties and on disposal of stock of properties, and other income.
Total Capital ratio Total capital ratio is defined in accordance with the Capital Requirements Regulation (EU) No
575/2013. Total expenses Total expenses comprise staff costs, other operating expenses and the special levy and
contribution to the Single Resolution Fund. It does not include restructuring costs (advisory, VEP and other restructuring costs). Restructuring costs amount to €29.3 mn, €20.7 mn, €13.8 mn, €7.3 mn and €114.3 mn for the year ended 31 December 2017, the nine months ended 30 September 2017, the six months ended 30 June 2017, the three months ended 31 March 2017 and for the year ended 31 December 2016, respectively.
Total income Total income comprises net interest income and non-interest income. It does not include net
gains on disposal of non-core assets. Net gains on disposal of non-core assets was €0 mn and €59 mn for the year ended 31 December 2017 and for the year ended 31 December 2016, respectively.
Total provisions and impairments
Total provisions and impairments comprise provision charge (as defined), plus provisions for litigation and regulatory matters plus impairments of other financial and non-financial assets.
Underlying basis Statutory basis adjusted for certain items as detailed in the Basis of Presentation. Write offs Loans together with the associated provisions are written off when there is no realistic prospect
of future recovery. Partial write-offs, including non-contractual write-offs, may occur when it is considered that there is no realistic prospect for the recovery of the contractual cash flows. In addition, write-offs may reflect restructuring activity with customers and are part of the terms of the agreement and subject to satisfactory performance.
Yoy Year on year change

25
Basis of Presentation This announcement covers the results of Bank of Cyprus Holdings Public Limited Company, “BOC Holdings” or “the Company”, its subsidiary Bank of Cyprus Public Company Limited, the “Bank” and together with the Bank’s subsidiaries, the “Group”, for the year ended 31 December 2017. At 31 December 2016, the Bank was listed on the CSE and the Athens Exchange. On 18 January 2017, BOC Holdings, incorporated in Ireland, was introduced in the Group structure as the new holding company of the Bank. On 19 January 2017, the total issued share capital of BOC Holdings was admitted to listing and trading on the LSE and the CSE. As a result of this corporate change, the comparative information for 2016 and as at 31 December 2016 is presented for the Bank together with its subsidiaries. Financial information presented in this announcement is being published for the purposes of providing an overview of Group financial results for the year ended 31 December 2017. The financial information in this announcement does not constitute statutory financial statements of BOC Holdings within the meaning of section 340 of the Companies Act 2014. The Group statutory financial statements for the year ended 31 December 2017, upon which the auditors have given an unqualified report, are expected to be published today and delivered to the Registrar of Companies of Ireland within 28 days of 30 September 2018. The Board of Directors approved the Group statutory financial statements for the year ended 31 December 2017 on 26 March 2018. BOC Holdings’ statutory financial statements for the purposes of Chapter 4 of Part 6 of the Companies Act 2014 of Ireland for the period 11 July 2016 to 31 December 2016, upon which the auditors have given an unqualified audit report (with emphasis of matter on material uncertainty related to going concern), were published on 27 April 2017 and were annexed to the annual return and delivered to the Registrar of Companies of Ireland. Statutory basis: Audited statutory information is set out on pages 3-4. However, a number of factors have had a
significant effect on the comparability of the Group’s financial position and results. Accordingly, the results are also presented on an underlying basis. Underlying basis: The statutory results are adjusted for certain items (as described on page 7) to allow a comparison of
the Group’s underlying performance, as set out on pages 5-6. This announcement and the presentation for the Group Financial Results for the year ended 31 December 2017 have been posted on the Group’s website www.bankofcyprus.com (Investor Relations/Financial Results). Definitions: The Group uses a number of definitions in the discussion of its business performance and financial position
which are set out in section F.
The Group Financial Results for the year ended 31 December 2017 are presented in Euro (€) and all amounts are rounded as indicated. A comma is used to separate thousands and a dot is used to separate decimals.

26
Forward Looking Statements This document contains certain forward-looking statements which can usually be identified by terms used such as “expect”, “should be”, “will be” and similar expressions or variations thereof. These forward-looking statements include, but are not limited to, statements relating to the Group’s intentions, beliefs or current expectations and projections about the Group’s future results of operations, financial condition, liquidity, performance, prospects, anticipated growth, provisions, impairments, strategies and opportunities. By their nature, forward-looking statements involve risk and uncertainty because they relate to events, and depend upon circumstances, that will or may occur in the future. Factors that could cause actual business, strategy and/or results to differ materially from the plans, objectives, expectations, estimates and intentions expressed in such forward-looking statements made by the Group include, but are not limited to: general economic and political conditions in Cyprus and other EU Member States, interest rate and foreign exchange fluctuations, legislative, fiscal and regulatory developments and information technology, litigation and other operational risks. Should any one or more of these or other factors materialise, or should any underlying assumptions prove to be incorrect, the actual results or events could differ materially from those currently being anticipated as reflected in such forward looking statements. The forward-looking statements made in this document are only applicable as from the date of publication of this document. Except as required by any applicable law or regulation, the Group expressly disclaims any obligation or undertaking to release publicly any updates or revisions to any forward looking statement contained in this document to reflect any change in the Group’s expectations or any change in events, conditions or circumstances on which any statement is based.
Contacts
For further information please contact: Investor Relations
+ 357 22 122239 [email protected]
The Bank of Cyprus Group is the leading banking and financial services group in Cyprus, providing a wide range of
financial products and services which include retail and commercial banking, finance, factoring, investment banking, brokerage, fund management, private banking, life and general insurance. The Bank of Cyprus Group operates through a total of 123 branches, of which 121 operate in Cyprus, 1 in Romania and 1 in the United Kingdom. Bank of Cyprus also has representative offices in Russia, Ukraine and China. The Bank of Cyprus Group employs 4,355 staff worldwide. At 31 December 2017, the Group’s Total Assets amounted to €23.6 bn and Total Equity was €2.6 bn. The Bank of Cyprus Group comprises Bank of Cyprus Holdings Public Limited Company, its subsidiary Bank of Cyprus Public Company Limited and its subsidiaries.