group presentation - bucher industries · group presentation july 2014 5 . medium-term earnings...
TRANSCRIPT

Group presentation
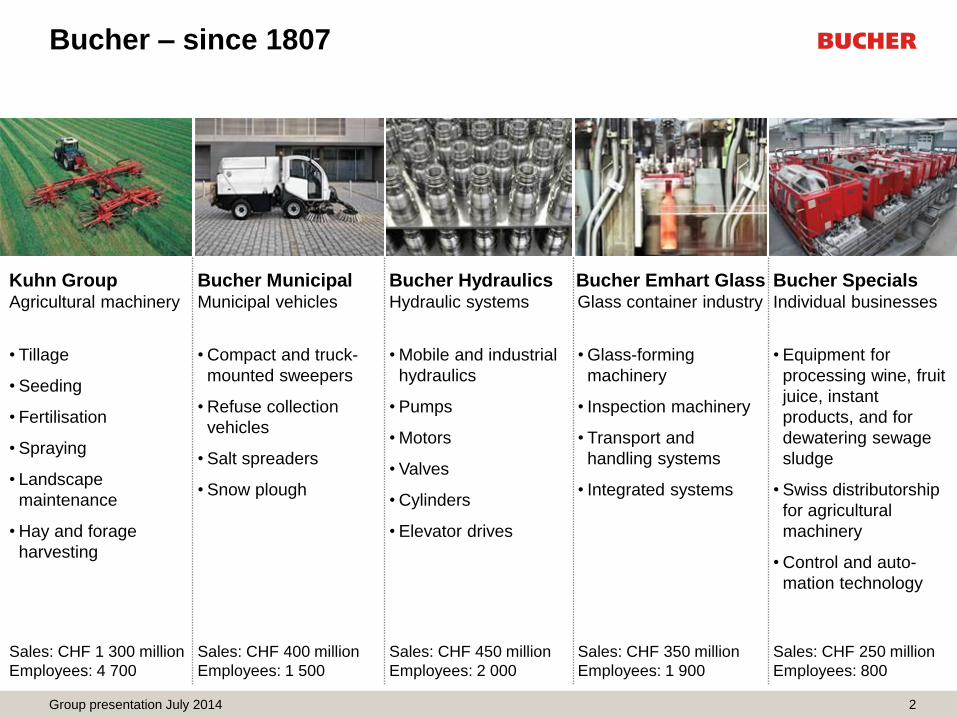
Bucher – since 1807
2
Kuhn Group Agricultural machinery
Bucher Municipal Municipal vehicles
Bucher Hydraulics Hydraulic systems
Bucher Emhart Glass Glass container industry
Bucher Specials Individual businesses
• Tillage
• Seeding
• Fertilisation
• Spraying
• Landscape
maintenance
• Hay and forage
harvesting
• Compact and truck-
mounted sweepers
• Refuse collection
vehicles
• Salt spreaders
• Snow plough
• Mobile and industrial
hydraulics
• Pumps
• Motors
• Valves
• Cylinders
• Elevator drives
• Glass-forming
machinery
• Inspection machinery
• Transport and
handling systems
• Integrated systems
• Equipment for
processing wine, fruit
juice, instant
products, and for
dewatering sewage
sludge
• Swiss distributorship
for agricultural
machinery
• Control and auto-
mation technology
Sales: CHF 1 300 million
Employees: 4 700
Sales: CHF 400 million
Employees: 1 500
Sales: CHF 450 million
Employees: 2 000
Sales: CHF 350 million
Employees: 1 900
Sales: CHF 250 million
Employees: 800
Group presentation July 2014
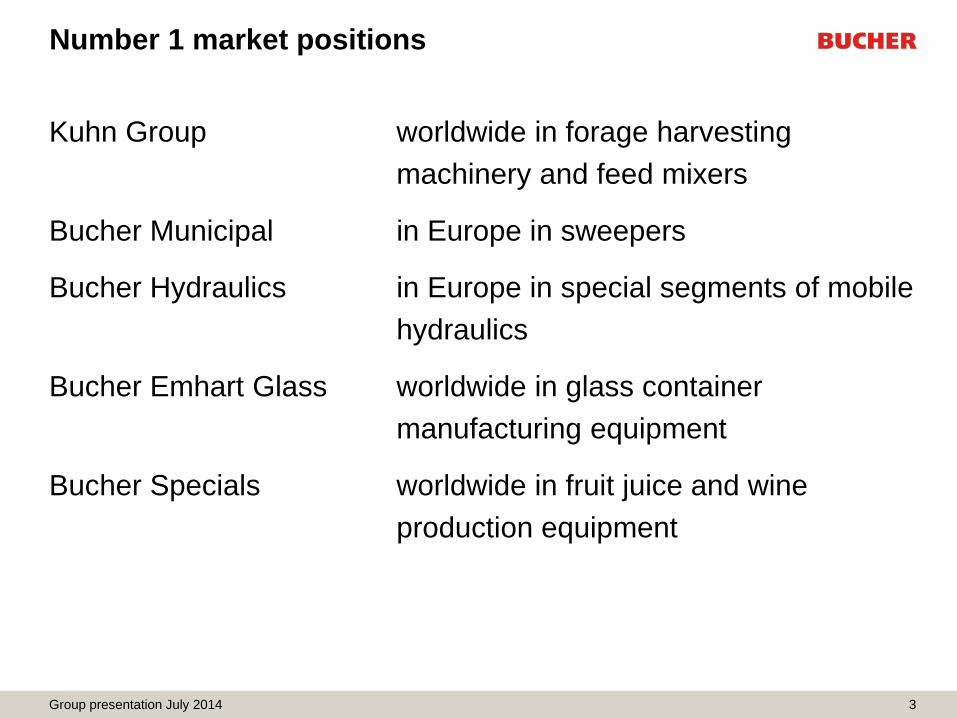
Number 1 market positions
Kuhn Group worldwide in forage harvesting
machinery and feed mixers
Bucher Municipal in Europe in sweepers
Bucher Hydraulics in Europe in special segments of mobile
hydraulics
Bucher Emhart Glass worldwide in glass container
manufacturing equipment
Bucher Specials worldwide in fruit juice and wine
production equipment
3 Group presentation July 2014
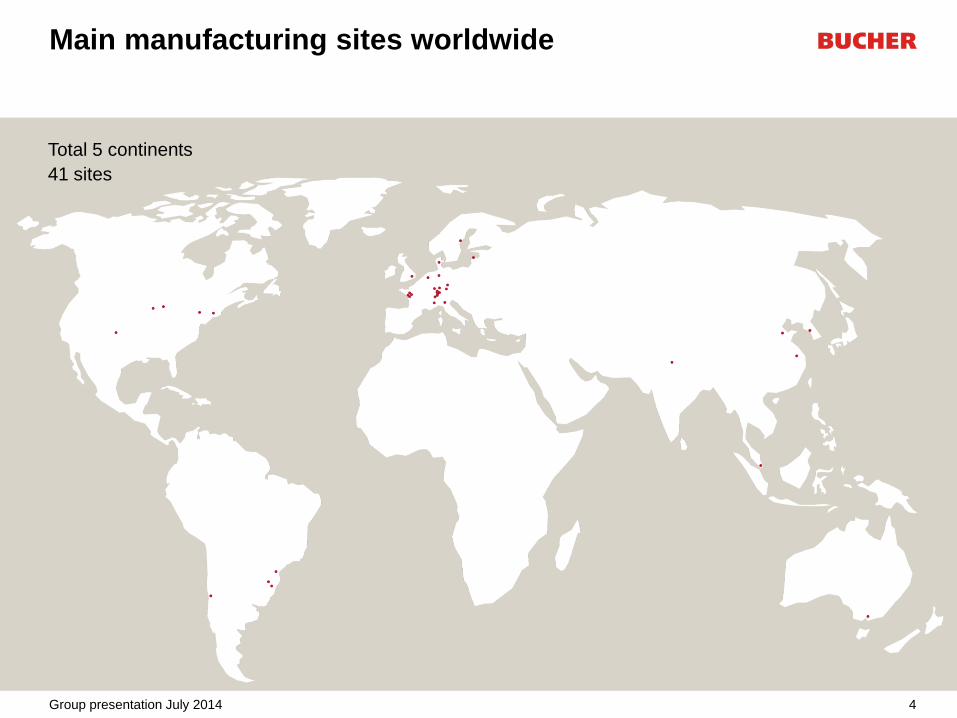
Main manufacturing sites worldwide
4
Total 5 continents
41 sites
Group presentation July 2014
Group strategy
• Increase in company value (RONOA > WACC)
• Diversified group focused on mechanical and vehicle engineering
• Strengthening of existing operating segments
– Continuous product innovation
– Operational efficiency with flexible structures
– Internal growth and targeted acquisitions
• Clear, central functions
– Strategy and operations reviews
– Treasury, Controlling, Tax, Legal, M&A, Investments, Communication
– Management and remuneration systems
• Solid balance sheet for long-term industrial independence
5 Group presentation July 2014

Medium-term earnings targets
6
EBIT margin 2009 2010 2011 20121) 2013 targets
Kuhn Group 7.53) 9.2 11.3 12.5 14.9 11
Bucher Municipal 3.9 7.3 7.0 9.3 8.6 8
Bucher Hydraulics 4.33) 9.9 8.7 9.0 9.4 11
Bucher Emhart Glass 4.0 1.22) 4.5 0.32) 4.8 9
Bucher Specials 5.3 4.6 6.1 8.1 10.0 9
Bucher Industries 5.23) 7.4 8.1 8.9 10.7 9
Group, divisions and independent businesses
RONOA after tax 11.43) 12.4 17.0 17.0 19.3 >16
3) Before impairment changes
2) After restructuring costs of CHF 9 million in 2012 and CHF 5 million in 2010
1) 2012: retrospective restatement owing to first application of IAS 19 (revised)
Group presentation July 2014

Group at a glance 2013
• Favourable market environment
– Good conditions at high level for agricultural machinery
– Low but stable demand for municipal vehicles
– Upturn in demand and sales growth through acquisitions at Bucher Hydraulics and
Bucher Specials
– Subdued first half, picking up in second half in glass-forming machinery
– Good market conditions in fruit juice processing equipment
• Entry into automation technology through takeover of Jetter AG by public
offering; at year-end Bucher held 77.35% of the equity
• Best result in the company’s history
– EBIT margin of 10.7%
– Profit for the year of CHF 196 million
– Earnings per share increase by 27% to CHF 19.64
7 Group presentation July 2014

Group at a glance 2013 (continued)
• Continuity in investments
– CHF 137 million for internal growth
– CHF 63 million for acquisitions at Bucher Hydraulics and Bucher Specials
• Solid financial situation
– Operating free cash flow of CHF 92 million
– Zero net debt at the end of 2013
– Increase in equity ratio from 39% to 44%
– Great financial scope for internal and external growth
8 Group presentation July 2014
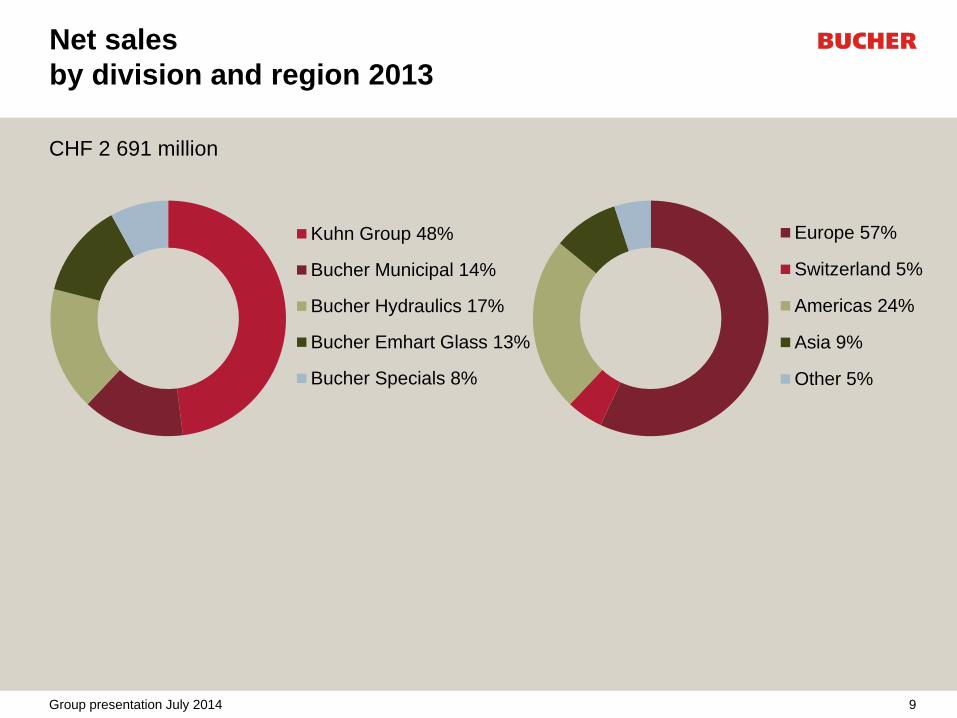
Net sales
by division and region 2013
CHF 2 691 million
Kuhn Group 48%
Bucher Municipal 14%
Bucher Hydraulics 17%
Bucher Emhart Glass 13%
Bucher Specials 8%
Europe 57%
Switzerland 5%
Americas 24%
Asia 9%
Other 5%
9 Group presentation July 2014

Numer of employees
by region 2013
Total 10 916 employees1)
Europe 55%
Switzerland 9%
Americas 21%
Asia 12%
Other 3%
1) Expressed as full time equivalents
10 Group presentation July 2014

Key figures
CHF million Change in
2013 2012 % %2) %3)
Order Intake 2 718 2 490 9.1 9.0 6.6
Net sales 2 691 2 609 3.1 3.0 0.8
Order book 850 795 6.9 6.5 3.3
Operating profit (EBITDA)1)
as % of net sales
371
13.8
307
11.8
20.9
Operating profit (EBIT)1)
as % of net sales
287
10.7
232
8.9
23.9
Profit for the year1)
as % of net sales
196
7.3
156
6.0
25.8
Employees at 31 December 10 916 10 166 7.4 2.1
Average employees during year 10 788 10 383 3.9 0.7
2) Adjusted for currency effects 3) Adjusted for currency, acquisition and disposal effects
1) 2012: retrospective restatement owing to first application of IAS 19 (revised)
11 Group presentation July 2014
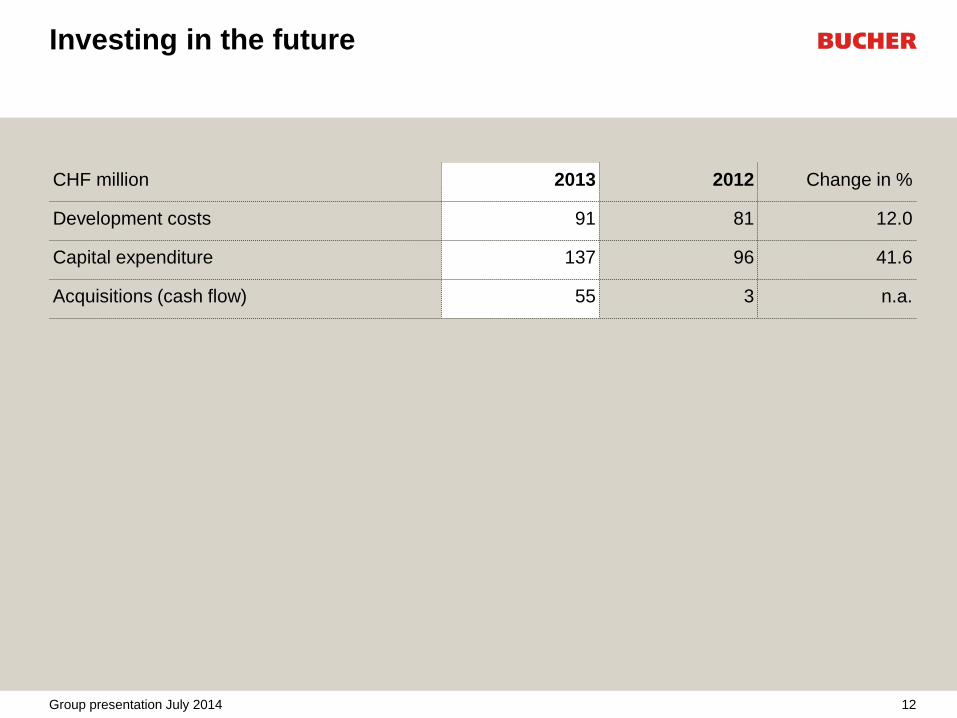
Investing in the future
CHF million 2013 2012 Change in %
Development costs 91 81 12.0
Capital expenditure 137 96 41.6
Acquisitions (cash flow) 55 3 n.a.
12 Group presentation July 2014

Results by division
CHF million 2013 20121)
EBIT EBIT margin EBIT EBIT margin
Kuhn Group 191 14.9% 153 12.5%
Bucher Municipal 33 8.6% 39 9.3%
Bucher Hydraulics 42 9.4% 37 9.0%
Bucher Emhart Glass 17 4.8% 1 0.3%
Bucher Specials 24 10.0% 17 8.1%
Other/consolidation -20 -15
Bucher Industries 287 10.7% 232 8.9%
1) 2012: retrospective restatement owing to first application of IAS 19 (revised)
13 Group presentation July 2014
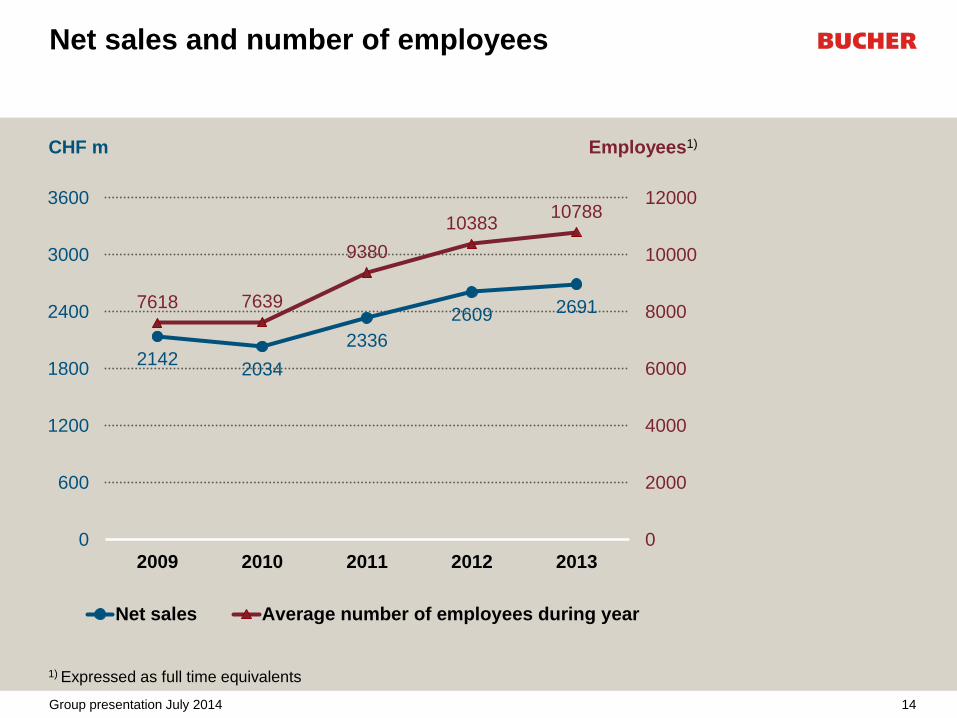
2691 2609
2336
2034 2142
10788 10383
9380
7639 7618
0
2000
4000
6000
8000
10000
12000
0
600
1200
1800
2400
3000
3600
20132012201120102009
Net sales Average number of employees during year
Net sales and number of employees
Employees1) CHF m
1) Expressed as full time equivalents
14 Group presentation July 2014
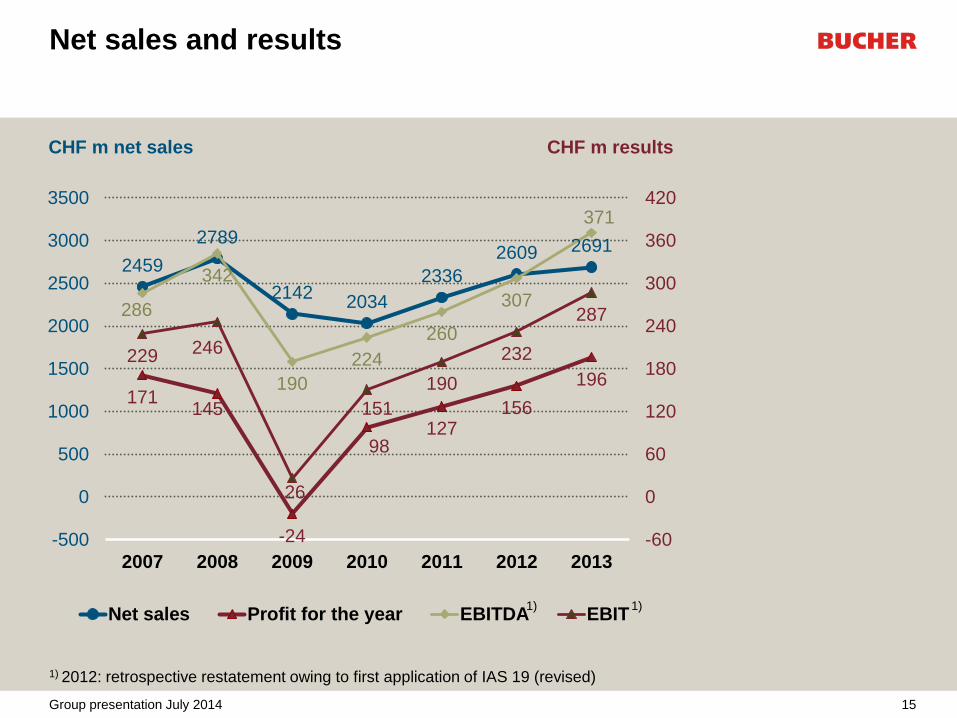
2691 2609
2336
2034 2142
2789
2459
196
156 127
98
-24
145 171
371
307
260
224
190
342
286 287
232
190
151
26
246 229
-60
0
60
120
180
240
300
360
420
-500
0
500
1000
1500
2000
2500
3000
3500
2013201220112010200920082007
Net sales Profit for the year EBITDA EBIT
Net sales and results
CHF m results
CHF m net sales
1) 2012: retrospective restatement owing to first application of IAS 19 (revised)
1) 1)
15 Group presentation July 2014
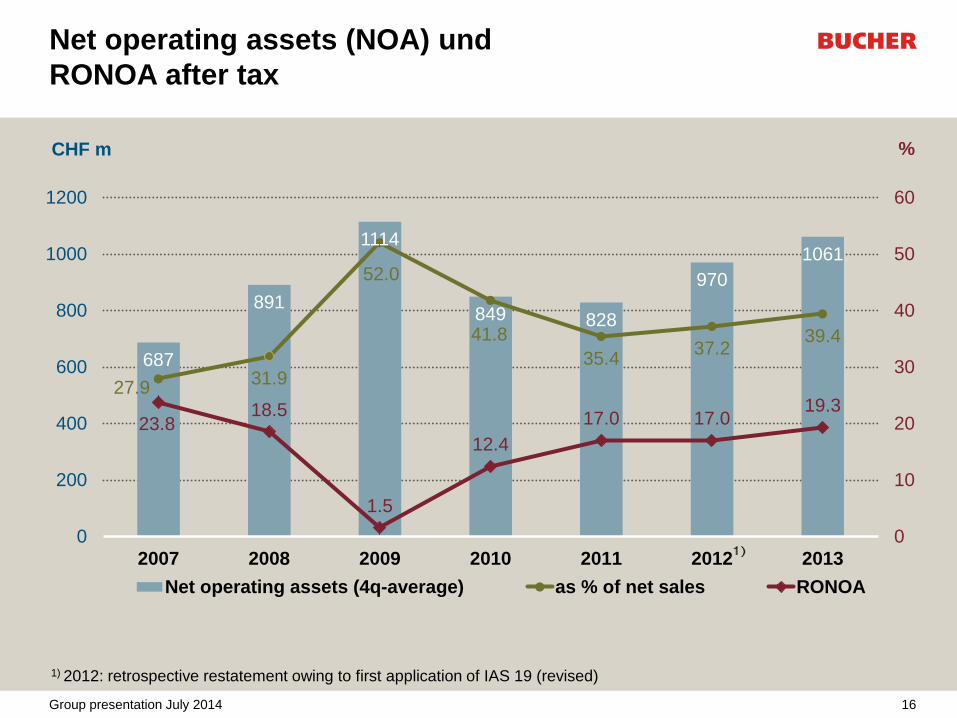
Net operating assets (NOA) und
RONOA after tax
1061
970
828 849
1114
891
687
39.4 37.2
35.4
41.8
52.0
31.9 27.9
19.3 17.0 17.0
12.4
1.5
18.5 23.8
0
10
20
30
40
50
60
0
200
400
600
800
1000
1200
2013201220112010200920082007
Net operating assets (4q-average) as % of net sales RONOA
CHF m
1) 2012: retrospective restatement owing to first application of IAS 19 (revised)
%
16 Group presentation July 2014
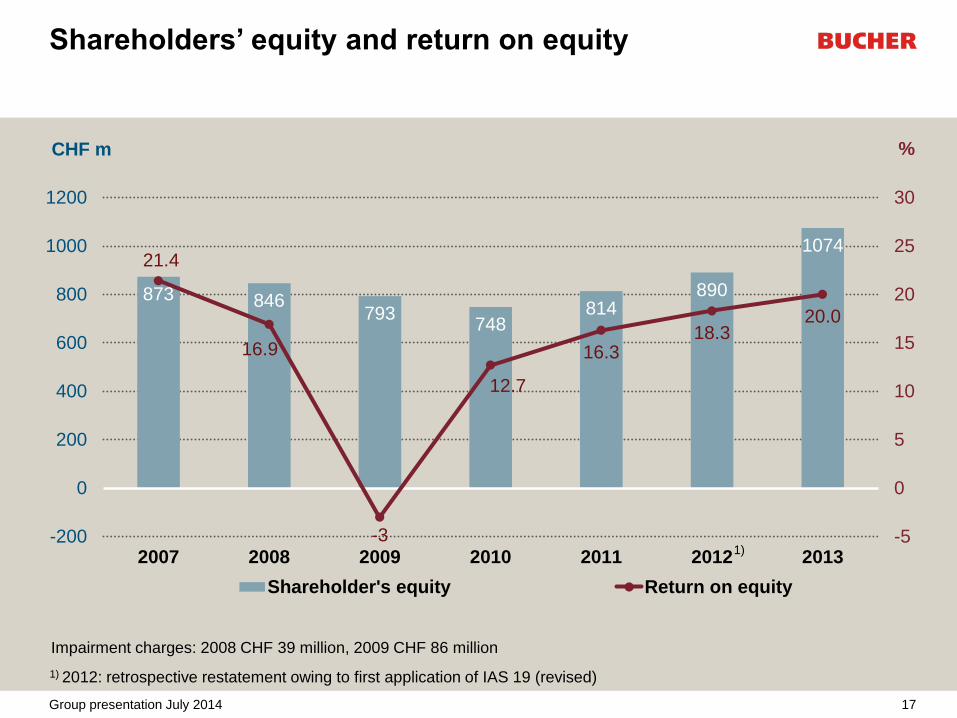
Shareholders’ equity and return on equity
1074
890 814
748 793
846 873
20.0 18.3
16.3
12.7
-3
16.9
21.4
-5
0
5
10
15
20
25
30
-200
0
200
400
600
800
1000
1200
2013201220112010200920082007
Shareholder's equity Return on equity
CHF m
1) 2012: retrospective restatement owing to first application of IAS 19 (revised)
Impairment charges: 2008 CHF 39 million, 2009 CHF 86 million
%
1)
17 Group presentation July 2014
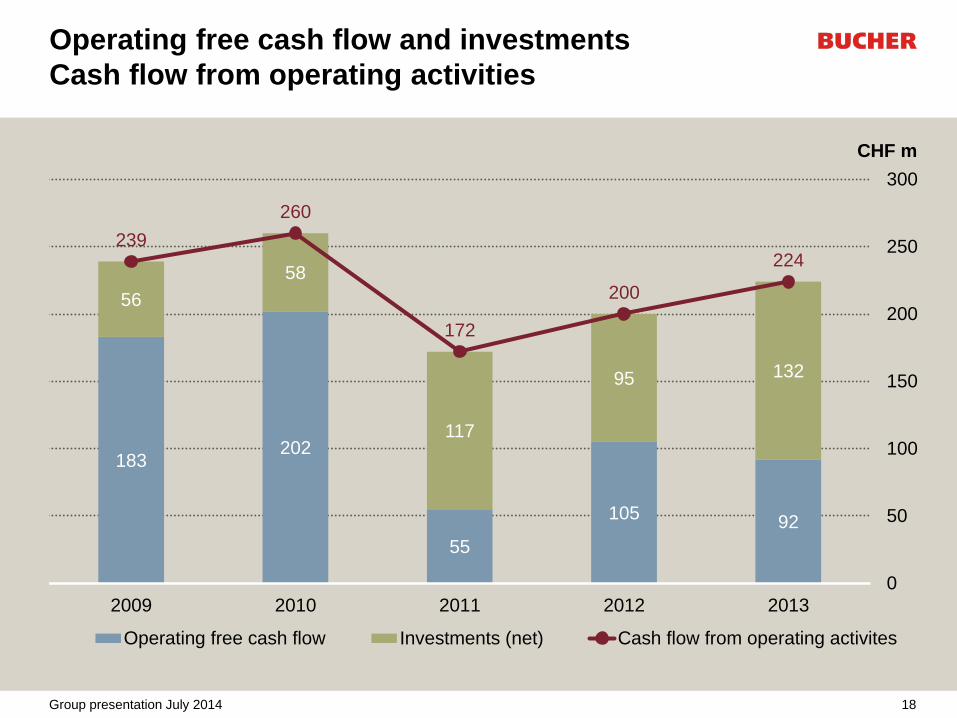
Operating free cash flow and investments
Cash flow from operating activities
18 Group presentation July 2014
CHF m
183 202
55
105 92
56
58
117
95 132
239
260
172
200
224
0
50
100
150
200
250
300
2009 2010 2011 2012 2013
Operating free cash flow Investments (net) Cash flow from operating activites
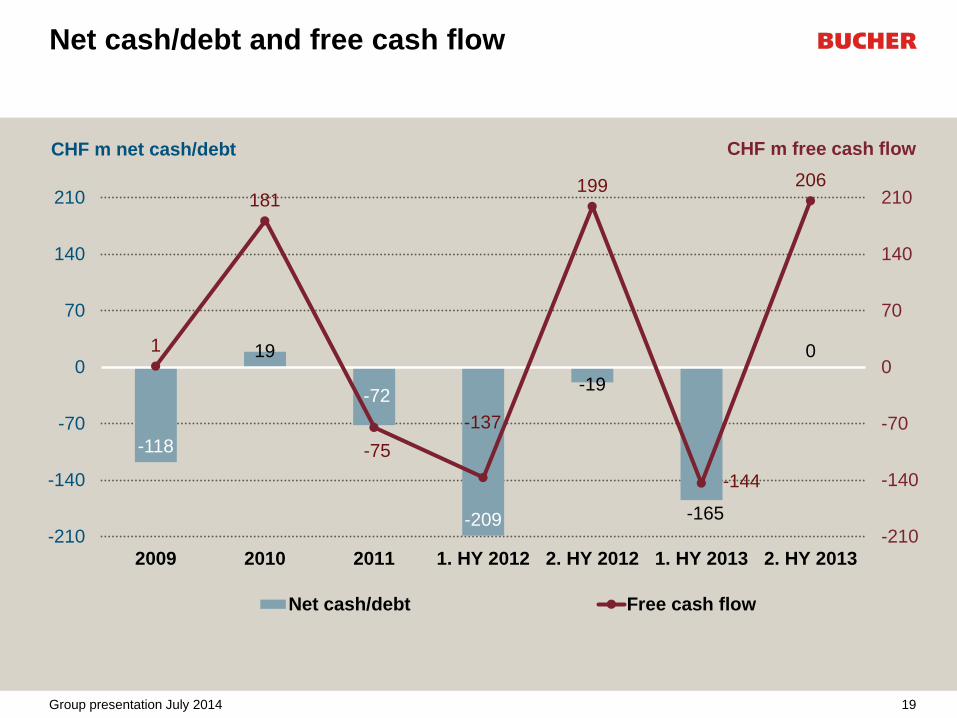
Net cash/debt and free cash flow
0
-165
-19
-209
-72
19
-118
206
-144
199
-137
-75
181
1
-210
-140
-70
0
70
140
210
-210
-140
-70
0
70
140
210
2. HY 20131. HY 20132. HY 20121. HY 2012201120102009
Net cash/debt Free cash flow
CHF m net cash/debt CHF m free cash flow
19 Group presentation July 2014
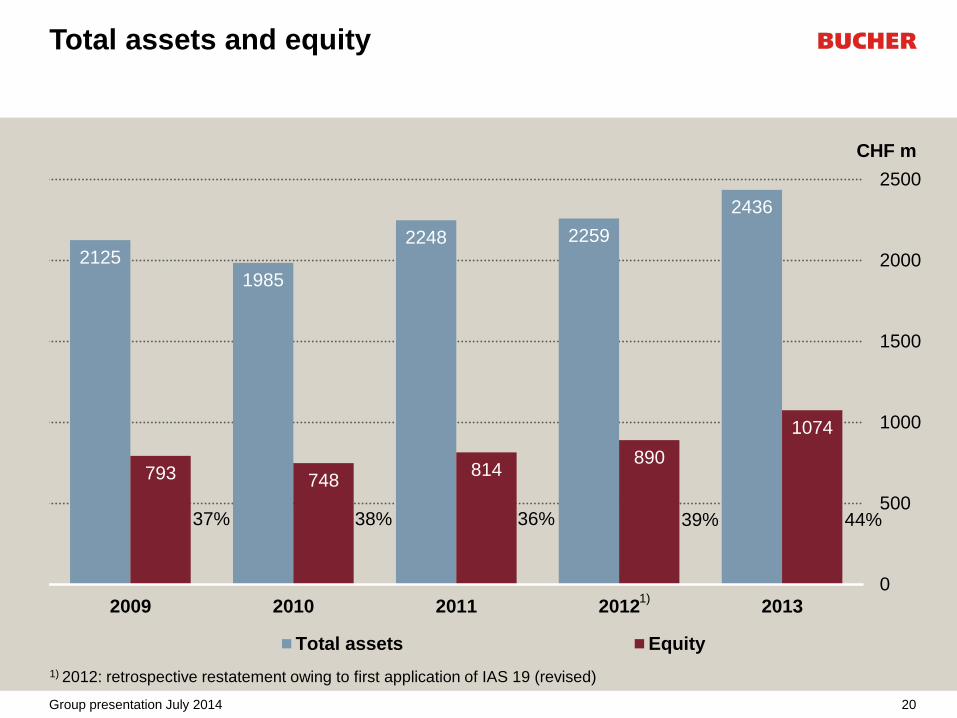
Total assets and equity
2125
1985
2248 2259
2436
793 748 814
890
1074
0
500
1000
1500
2000
2500
2009 2010 2011 2012 2013
Total assets Equity
44%
1) 2012: retrospective restatement owing to first application of IAS 19 (revised)
37% 38% 36% 39%
CHF m
1)
20 Group presentation July 2014

Shareholders’ equity / Intangible assets
21 Group presentation July 2014
793 748
814
890
1074
165 135
174 159 181 60 53 75 73 80
0
200
400
600
800
1000
1200
2009 2010 2011 2012 2013
Shareholders' equity Intangible assets Thereof goodwill
1) 2012: retrospective restatement owing to first application of IAS 19 (revised)
CHF m
1)
Group outlook for 2014
• No significant change in economic environment anticipated
• Confident mood in market segments served by Bucher Industries
– Agricultural machinery: slight decline in demand at very high level
– Municipal vehicles: positive outlook thanks to major order from Moscow
– Hydraulic systems and glass-forming machinery: continuation of positive development
of business
– Bucher Specials expects buoyant demand to continue, with additional boost from
acquisition of Jetter automation technology
• For Group overall, increase in sales and moderate decrease in profitability
compared with record figures in 2013
22 Group presentation July 2014
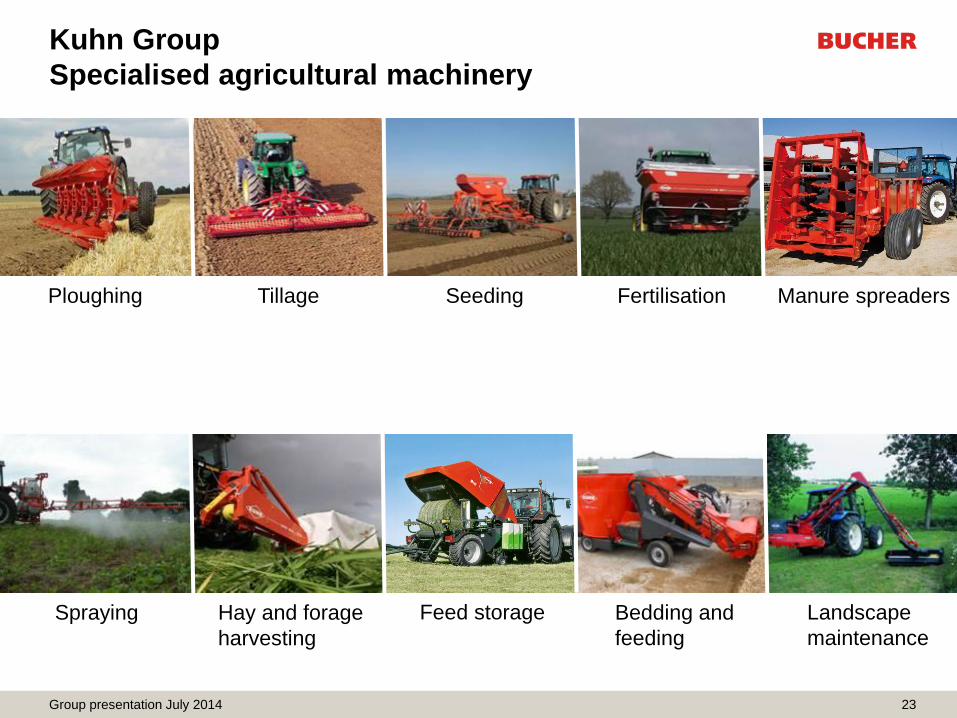
Kuhn Group
Specialised agricultural machinery
23
Ploughing Seeding Fertilisation Manure spreaders
Spraying Landscape
maintenance
Bedding and
feeding
Feed storage Hay and forage
harvesting
Tillage
Group presentation July 2014
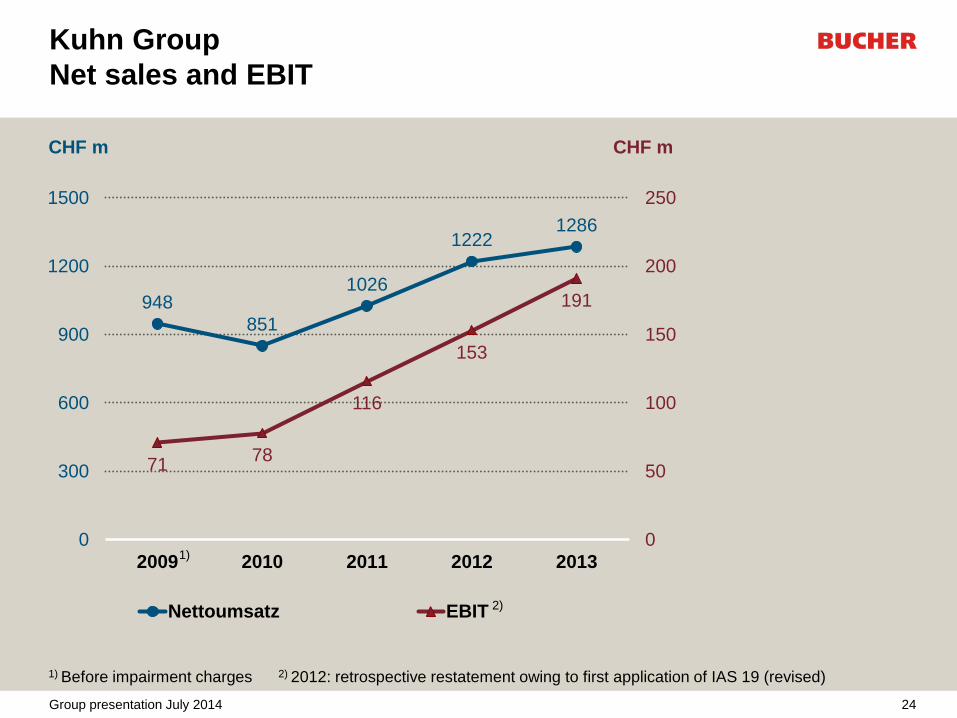
1286 1222
1026
851
948 191
153
116
78 71
0
50
100
150
200
250
0
300
600
900
1200
1500
20132012201120102009
Nettoumsatz EBIT
1) Before impairment charges 2) 2012: retrospective restatement owing to first application of IAS 19 (revised)
Kuhn Group
Net sales and EBIT
CHF m CHF m
1)
2)
24 Group presentation July 2014
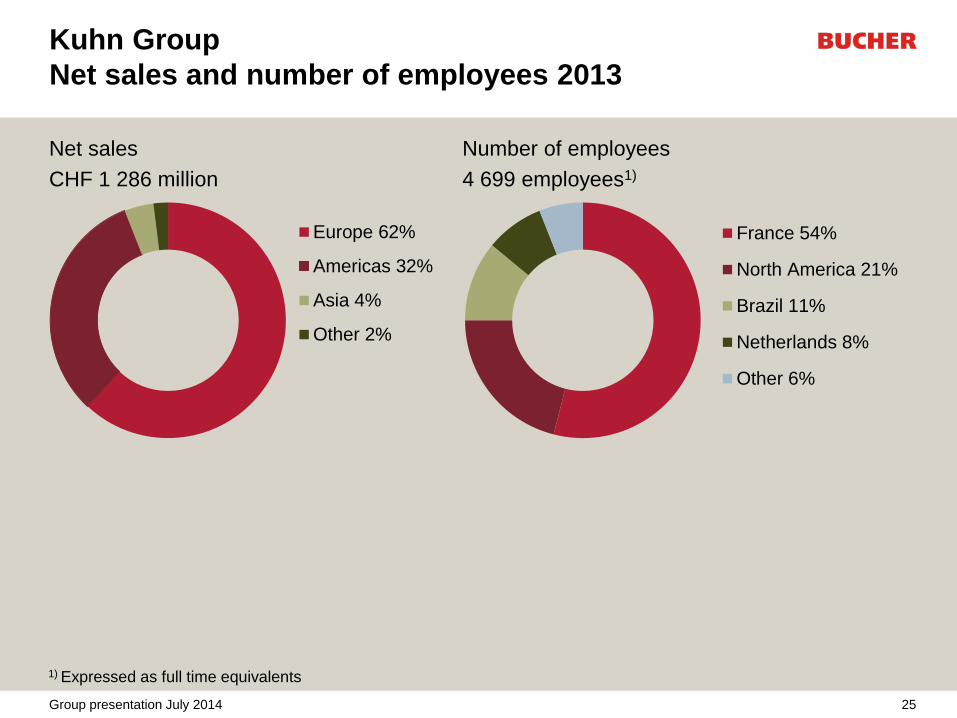
Kuhn Group
Net sales and number of employees 2013
Net sales Number of employees
CHF 1 286 million 4 699 employees1)
Europe 62%
Americas 32%
Asia 4%
Other 2%
France 54%
North America 21%
Brazil 11%
Netherlands 8%
Other 6%
1) Expressed as full time equivalents
25 Group presentation July 2014
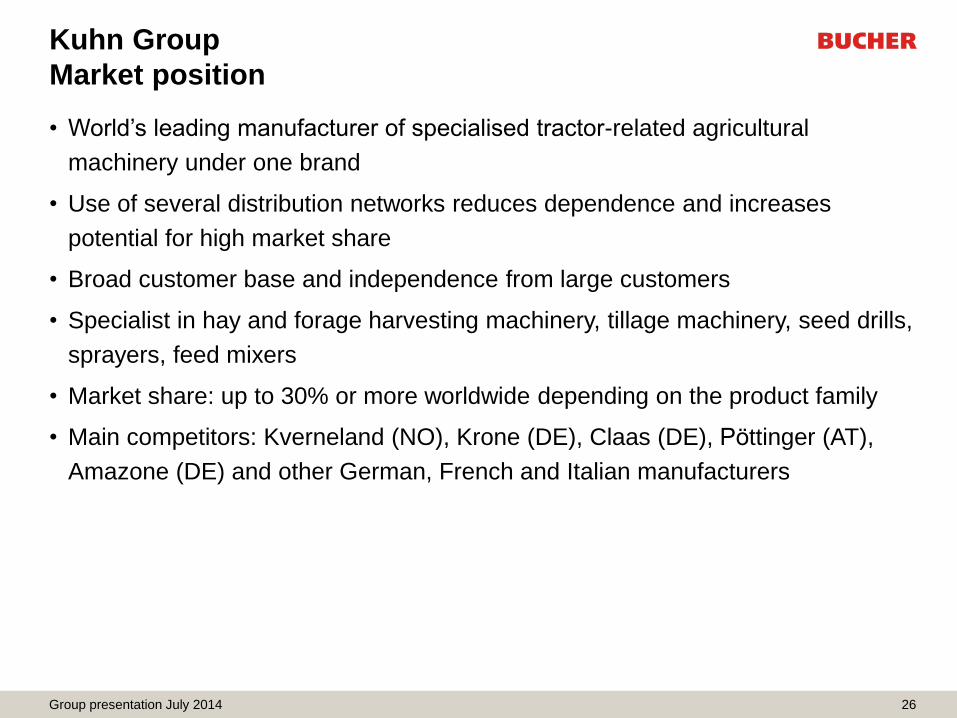
Kuhn Group
Market position
• World’s leading manufacturer of specialised tractor-related agricultural
machinery under one brand
• Use of several distribution networks reduces dependence and increases
potential for high market share
• Broad customer base and independence from large customers
• Specialist in hay and forage harvesting machinery, tillage machinery, seed drills,
sprayers, feed mixers
• Market share: up to 30% or more worldwide depending on the product family
• Main competitors: Kverneland (NO), Krone (DE), Claas (DE), Pottinger (AT),
Amazone (DE) and other German, French and Italian manufacturers
26 Group presentation July 2014

Kuhn Group
Complete product range under one brand
27
Competitors Hay and forage Hedge Feed Tillage equipment Seeders Sprea- Spray- Trac- Harvesters
mow-
ers
tedders rakes
balers cutters mixers driven non-driven drilling precision ders ers
tors selfpropelled
Kuhn Group
John Deere
CNH
AGCO
Claas Renault
Krone
Amazone
Pöttinger
Kubota/KVE Gallignani Kubota
Exel / Hardi
Lemken
Horsch
Väderstad
Kongskilde
Lely/Welder
Sulky
Monosem
Group presentation July 2014
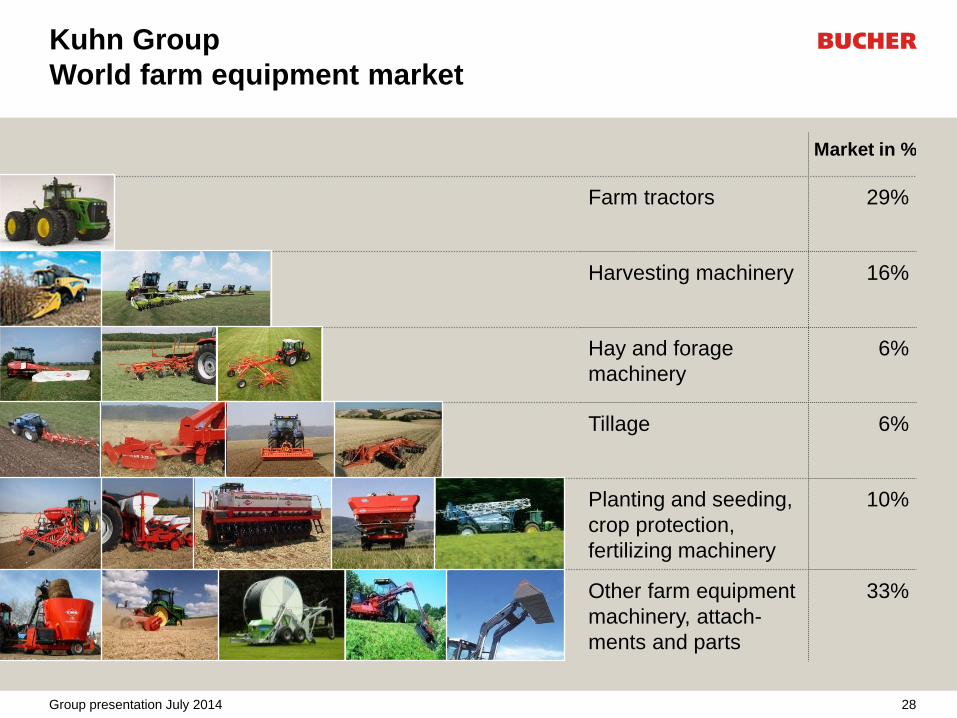
Kuhn Group
World farm equipment market
Market in %
Farm tractors 29%
Harvesting machinery 16%
Hay and forage
machinery
6%
Tillage 6%
Planting and seeding,
crop protection,
fertilizing machinery
10%
Other farm equipment
machinery, attach-
ments and parts
33%
28 Group presentation July 2014
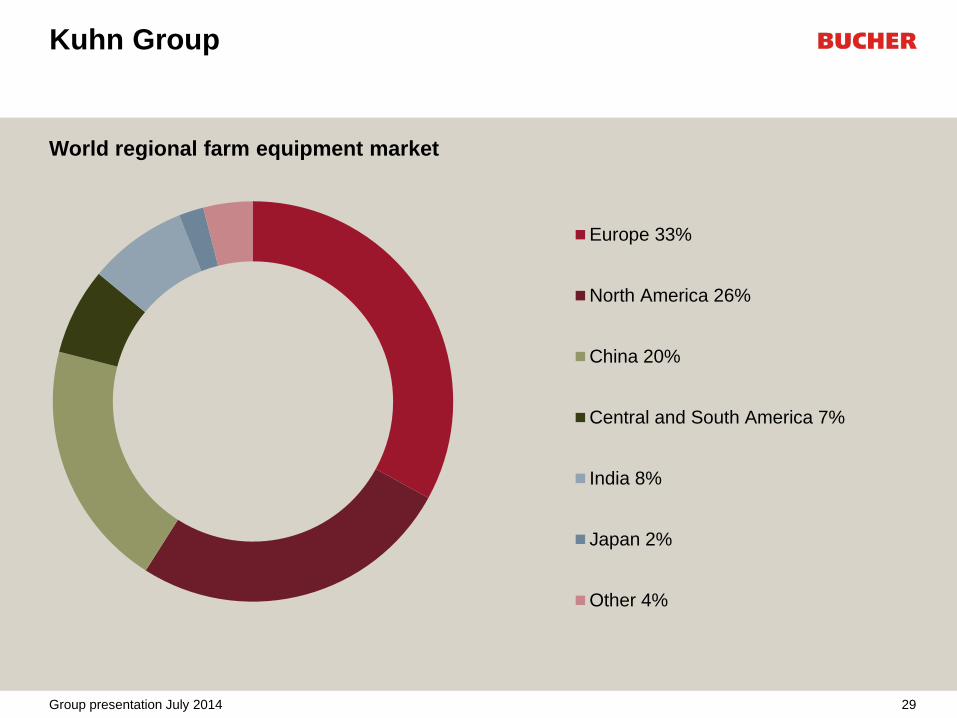
Kuhn Group
World regional farm equipment market
29
Europe 33%
North America 26%
China 20%
Central and South America 7%
India 8%
Japan 2%
Other 4%
Group presentation July 2014

Kuhn Group
2013 highlights
• Positive market trend
– Despite downward trend, prices for agricultural produce remained at a high level in long-
term comparison
– Investment confidence among farmers remained high
– Delay in growth cycle in springtime, later recovering to large extent
• Successful integration of acquired companies strengthens market position and
profitability
• Excellent profitability thanks to various operational factors
• Acquisition of Montana, Brazil, specialists in self-propelled crop sprayers, and
fertilising equipment, completed at the end of March 2014
• High investments in infrastructure, growth and customer training
30 Group presentation July 2014
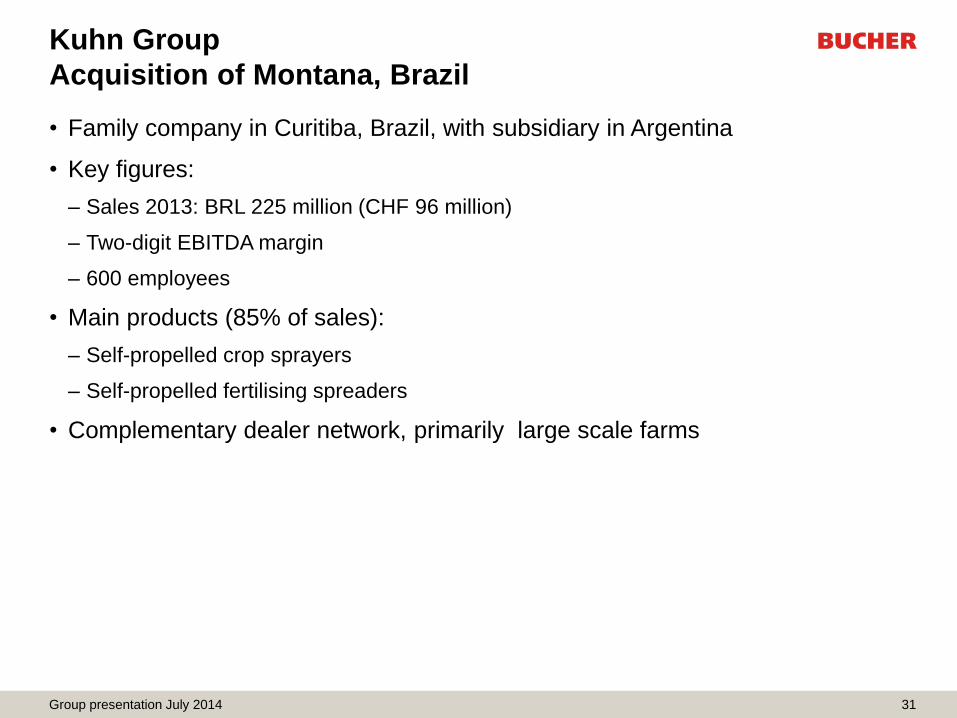
Kuhn Group
Acquisition of Montana, Brazil
• Family company in Curitiba, Brazil, with subsidiary in Argentina
• Key figures:
– Sales 2013: BRL 225 million (CHF 96 million)
– Two-digit EBITDA margin
– 600 employees
• Main products (85% of sales):
– Self-propelled crop sprayers
– Self-propelled fertilising spreaders
• Complementary dealer network, primarily large scale farms
31 Group presentation July 2014

Montana
32
Self-propelled
crop sprayers
Self-propelled fertilising equipment
Manufacturing site in Curitiba, Brasilien
Group presentation July 2014

Kuhn Group
Outlook for 2014
• Good long-term prospects
• Market environment still positive, but slight fall in demand
– Favourable income situation for farmers continuing, but slightly lower year on year
– Main markets: America positive overall, Western Europe with lower demand
• Integration of the acquisition, Montana, Brazil, strengthens market position
• Sales slightly higher than previous year and moderate fall in high level of
profitability after record margin in previous year
33 Group presentation July 2014

Bucher Municipal
Sweepers and winter maintenance equipment
34
Compact sweepers Truck-mounted sweepers
Spreaders Refuse collection vehicles
Group presentation July 2014
383
424
380 373 387
33
39
26 27 25
0
10
20
30
40
50
60
0
100
200
300
400
500
600
20132012201120102009
Net sales EBIT
1) Before restructuring costs 2) 2012: retrospective restatement owing to first application of IAS 19 (revised)
Bucher Municipal
Net sales and EBIT
CHF m CHF m
1)
2)
35 Group presentation July 2014
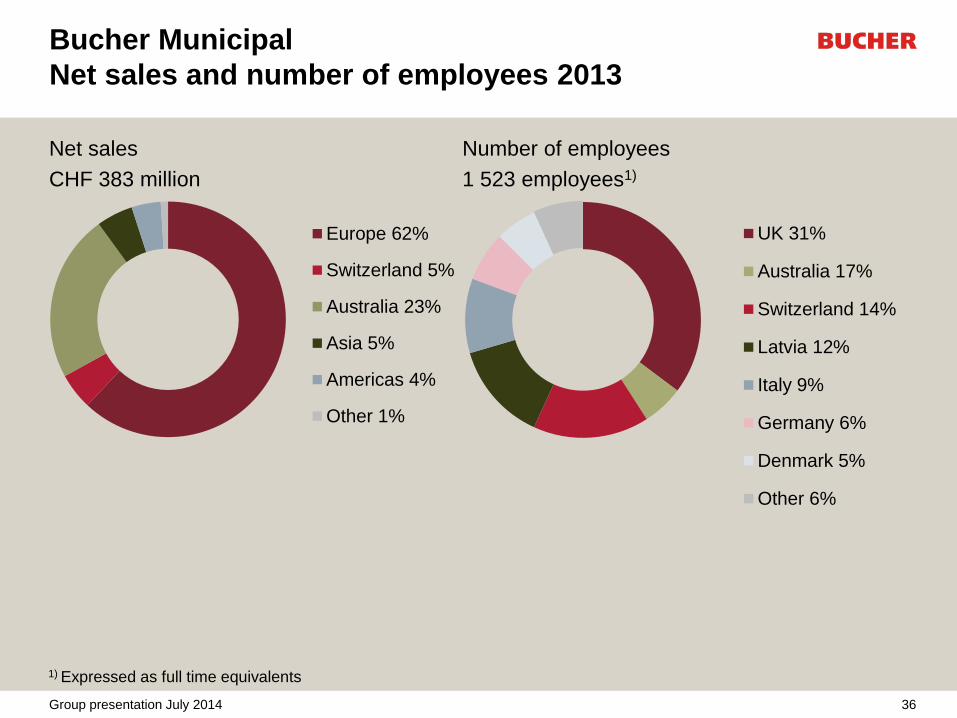
Bucher Municipal
Net sales and number of employees 2013
Net sales Number of employees
CHF 383 million 1 523 employees1)
Europe 62%
Switzerland 5%
Australia 23%
Asia 5%
Americas 4%
Other 1%
UK 31%
Australia 17%
Switzerland 14%
Latvia 12%
Italy 9%
Germany 6%
Denmark 5%
Other 6%
1) Expressed as full time equivalents
36 Group presentation July 2014

Bucher Municipal
Market position
• Market leader in Europe and Australia
• Market shares: Europe Australia
– Compact sweepers: 22% 48%
– Truck-mounted sweepers: 56% 77%
– Refuse collection vehicles: --- 50%
– Winter maintenance equipment: 28% ---
• Complete product line for municipal applications in Europe
• Main competitors: Aebi-Schmidt (DE), Ravo (NL)*, Scarab (UK)*, Hako (DE),
Boschung (CH), Faun (DE) and Elgin (USA)
* Fayat Group
37 Group presentation July 2014

Bucher Municipal
Complete product range
38
Competitors Sweepers Specialised
range
Spreaders
1m3 2m3 4m3 5m3 6m3 8m3 mounted towed
Bucher Municipal
Aebi-Schmidt (DE)
Boschung (CH)
Hako (DE)
Faun (DE)
Fayat Group (FR) *
Elgin (USA)
Dulevo (DE)
Brock (DE)
Tennant (USA)
Epoke (DK)
Acometis (FR)
* Ravo, Scarab, Mathieu
Group presentation July 2014
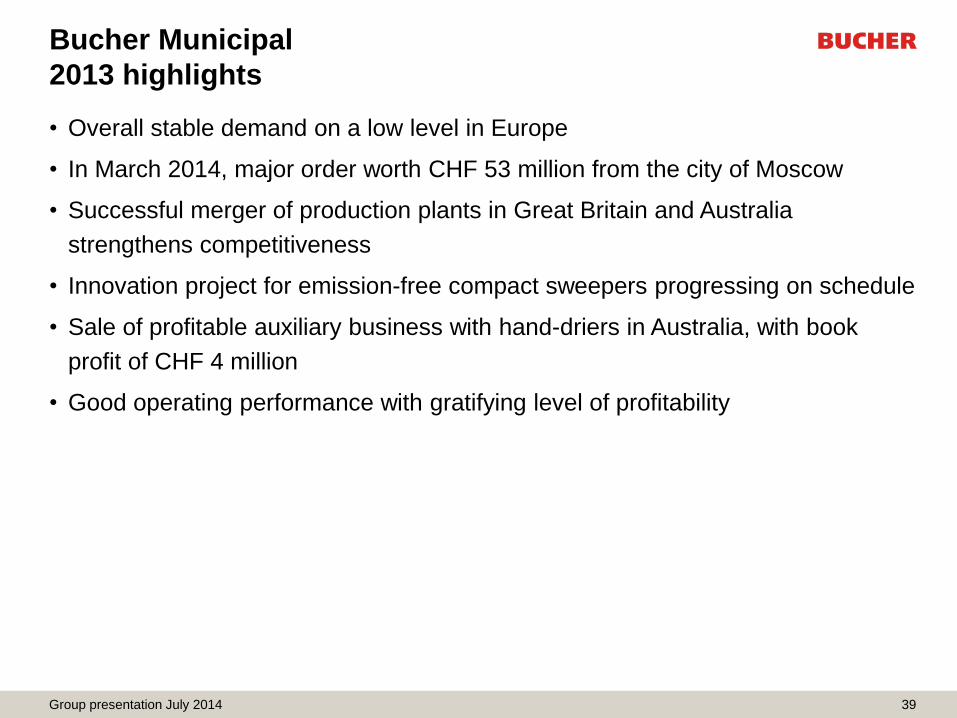
Bucher Municipal
2013 highlights
• Overall stable demand on a low level in Europe
• In March 2014, major order worth CHF 53 million from the city of Moscow
• Successful merger of production plants in Great Britain and Australia
strengthens competitiveness
• Innovation project for emission-free compact sweepers progressing on schedule
• Sale of profitable auxiliary business with hand-driers in Australia, with book
profit of CHF 4 million
• Good operating performance with gratifying level of profitability
39 Group presentation July 2014
Bucher Municipal
Outlook 2014
• Major order from city of Moscow ensures good performance in 2014
• First tentative signs of recovery in Southern Europe
• Start of production in Kaluga, Russia, with local manufacture of spreaders
• Marked increase in sales and modest improvement in operating profit
40 Group presentation July 2014

Bucher Hydraulics
Customised drive systems
41
Materials
handling
High-voltage
switch gear
Construction
equipment
Dyna-Lift Elevator
technology
Marine/offshore
Industry Agricultural
machinery
Mining /
tunnelling
Municipal
vehicles
Energy
technology
Lift gates
Group presentation July 2014
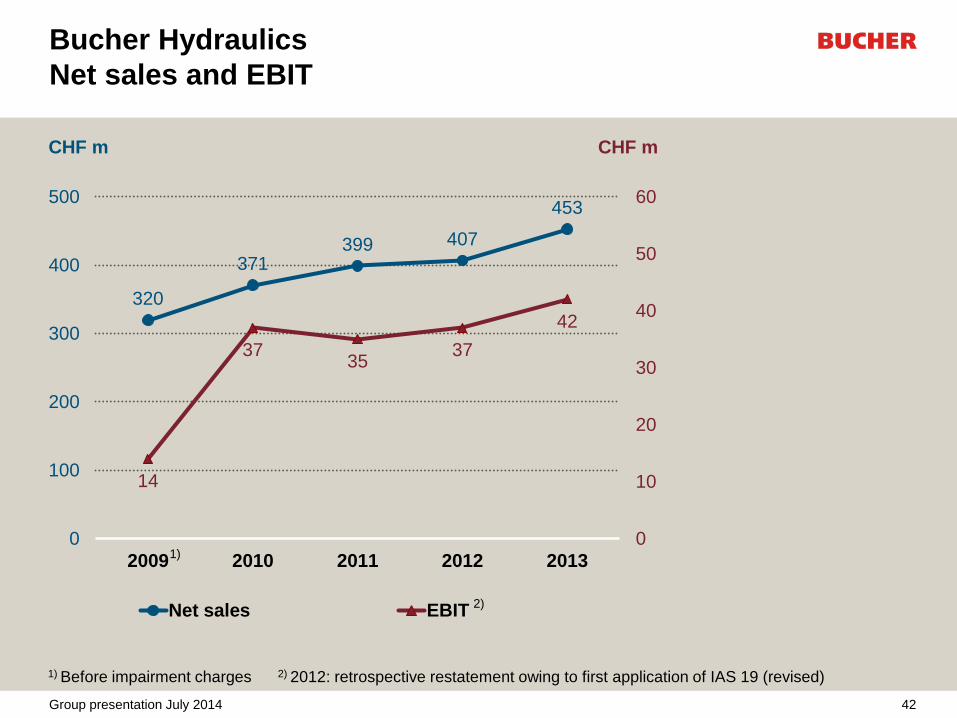
453
407 399 371
320
42
37 35
37
14
0
10
20
30
40
50
60
0
100
200
300
400
500
20132012201120102009
Net sales EBIT
Bucher Hydraulics
Net sales and EBIT
CHF m CHF m
1)
2)
1) Before impairment charges 2) 2012: retrospective restatement owing to first application of IAS 19 (revised)
42 Group presentation July 2014

Bucher Hydraulics
Net sales and number of employees 2013
Net sales Number of employees
CHF 453 million 1 984 employees1)
Europe 64%
Switzerland 4%
Americas 25%
Asia 7%
Germany 39%
Switzerland 23%
North America 16%
Italy 9%
Asia 8%
Brazil 3%
Other 2%
1) Expressed as full time equivalents
43 Group presentation July 2014

Bucher Hydraulics
Market position
• Leading specialist in mobile, industrial and elevator hydraulics across Europe
• Presence built up in the USA and Brazil
• Market share: 10% to 20% across Europe in specialised areas of hydraulic
engineering
• Focus on customised drive solutions
• Main competitors: Bosch-Rexroth (DE), Sauer Danfoss (USA), Parker Hannifin
(USA), Eaton Vickers (USA), Hydac (DE), Hawe (DE), Husco (USA), Denison
(USA), and a large number of further German and Italian manufacturers
44 Group presentation July 2014

Bucher Hydraulics
Complete product range
Pumps Valves Motors &
cylinders
Accessories Power
packs
Competitors
Pis-
ton
Vane Gear Indu-
strial
(Cetop)
Ser-
vo
Direc-
tional-
spool
Car-
tridge
Mani-
folds
Spe-
cial
Gea
r
Pis-
ton
Cylin-
ders
Elec-
tro-
nics
Accu-
mulat-
ors
Fil-
ters
Other Com-
pact
Con-
trac-
ting
Bucher Hydraulics
Parker (USA)
Eaton (USA)
Rexroth (DE)
Sauer Danfoss (DE)
Hydac (DE)
HAWE (DE)
Brevini Group (IT)
Walvoil (IT)
Argo-Hytos (DE)
Moog (USA)
Concentric (SE)
Husco (USA)
Sun Hydraulics (USA)
Hydraforce (USA)
45 Group presentation July 2014
50
60
70
80
90
100
110
120
130
140
150
1986 1989 1992 1995 1998 2001 2004 2007 2010 2013
Hydraulics Engineering Bucher Hydraulics
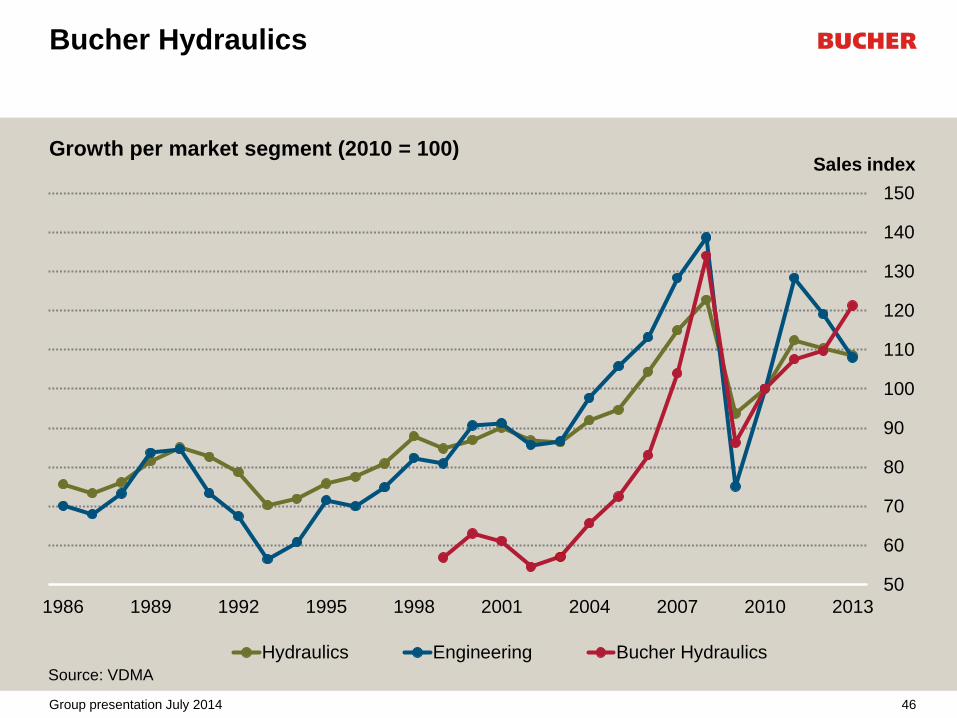
Bucher Hydraulics
46
Sales index Growth per market segment (2010 = 100)
Source: VDMA
Group presentation July 2014

Bucher Hydraulics
2013 highlights
• Varied market environment
– Western Europe: market positive in mobile machinery, weakening in construction
machinery and industrial hydraulics
– USA: good level of demand sustained, preparation for series production in 2014 for
globally active customers
– China: government reins in construction activity
• Smooth integration of acquisition Ölhydraulik Altenerding, Germany, with
synergies in second half of year
• Entry into the Brazilian market through takeover of Eco Sistemas Hydráulica,
Porto Alegre
• Good operating performance with increase in sales, operating profit and EBIT
margin
47 Group presentation July 2014

Bucher Hydraulics
Outlook for 2014
• Positive development of business to continue
– Developments in Germany decisive for hydraulics sales in Europe
– Continuation of good level of demand expected in USA
• Series production in Europe and North America underpins sales development
• Development of new platform in Brazil offers short- and medium-term growth
opportunities
• Slight increase in sales and further improvement in operating profit expected
48 Group presentation July 2014
Bucher Emhart Glass
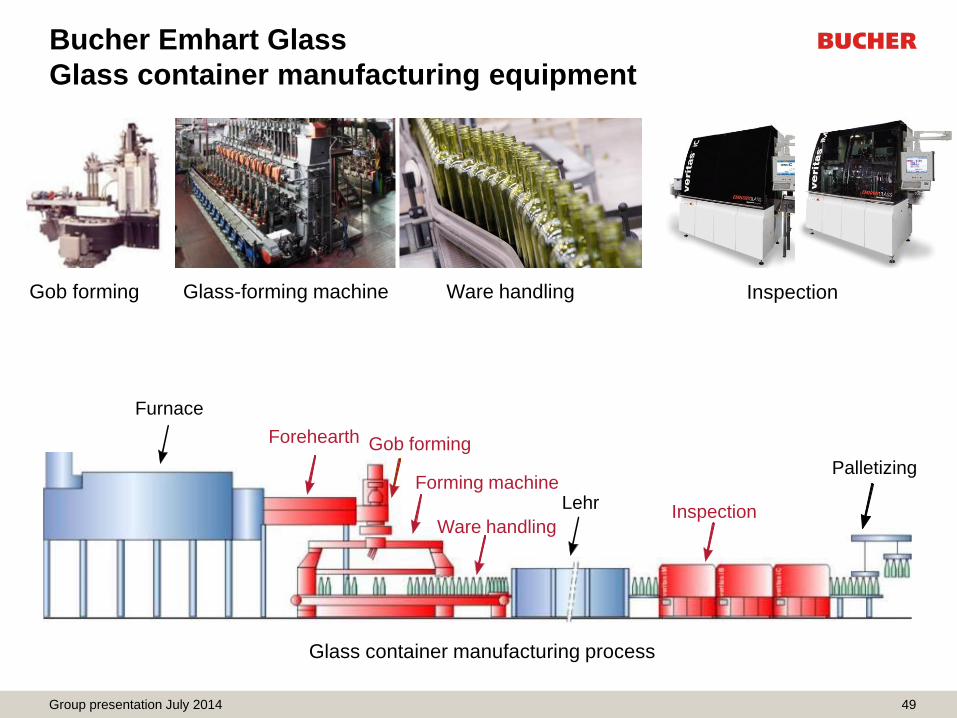
Glass container manufacturing equipment
49
Lehr
Forehearth
Furnace
Lehr
Palletizing
Inspection
Gob forming
Ware handling
Forming machine
Glass container manufacturing process
Gob forming Glass-forming machine Ware handling Inspection
Group presentation July 2014

347 367
345
259
304
17
10
15
8
12
0
10
20
30
40
50
0
100
200
300
400
500
20132012201120102009
Net sales EBIT
Bucher Emhart Glass
Net sales and EBIT
CHF m CHF m
1)
2)
1) Before restructuring costs 2) 2012: retrospective restatement owing to first application of IAS 19 (revised)
1)
50 Group presentation July 2014

Bucher Emhart Glass
Net sales and number of employees 2013
Net sales Number of employees
CHF 347 m 1 864 employees1)
Europe 38%
Asia 36%
Americas 19%
Africa 6%
Other 1%
China 56%
Sweden 15%
Americas 13%
Malaysia 7%
Switzerland 4%
Other 5%
1) Expressed as full time equivalents
51 Group presentation July 2014
Bucher Emhart Glass
Market position
• World’s leading supplier of machinery, equipment and services for glass
container manufacturers
• Market share: 50% worldwide for glass forming machines and services; 25%
worldwide for inspection systems
• Global partnership with Owens-Illinois (USA), the world’s biggest manufacturer
of glass containers
• Main competitors: Verallia (FR), Bottero (IT), BDF (IT), Heye International (DE)
for glass-forming machinery; Tiama (FR), Iris (FR) for inspection machinery
52 Group presentation July 2014
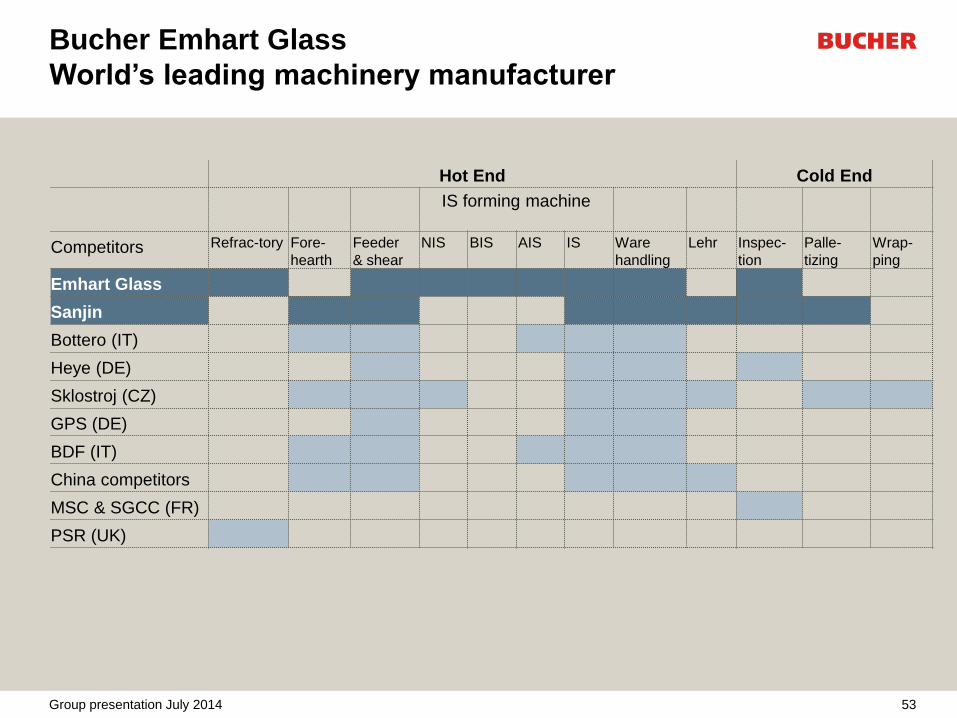
Bucher Emhart Glass
World’s leading machinery manufacturer
53
Hot End Cold End
IS forming machine
Competitors Refrac-tory Fore-
hearth
Feeder
& shear
NIS BIS AIS IS Ware
handling
Lehr Inspec-
tion
Palle-
tizing
Wrap-
ping
Emhart Glass
Sanjin
Bottero (IT)
Heye (DE)
Sklostroj (CZ)
GPS (DE)
BDF (IT)
China competitors
MSC & SGCC (FR)
PSR (UK)
Group presentation July 2014

Bucher Emhart Glass
Glass consumption per capita
54 Group presentation July 2014
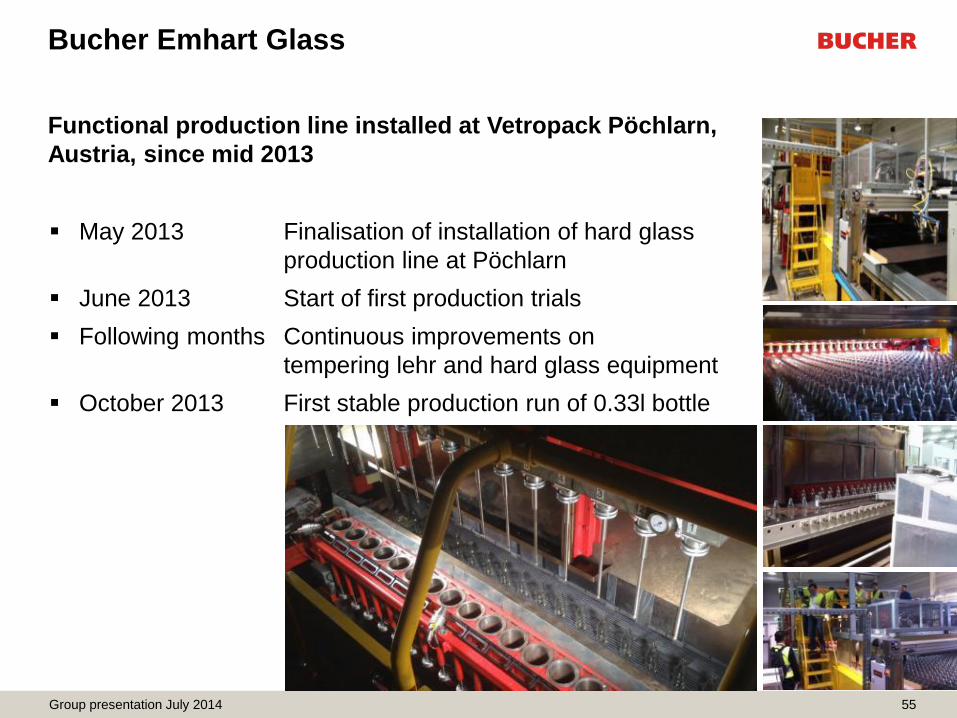
Functional production line installed at Vetropack Pöchlarn,
Austria, since mid 2013
May 2013 Finalisation of installation of hard glass
production line at Pöchlarn
June 2013 Start of first production trials
Following months Continuous improvements on
tempering lehr and hard glass equipment
October 2013 First stable production run of 0.33l bottle über län
55
Bucher Emhart Glass
Group presentation July 2014

Bucher Emhart Glass
56
Inte
rnal P
ressure
(bar)
Samples
Burst pressure after 25 filling line trips
Typical result - Hardglass bottles with significant strength increase over
annealed bottles
0
5
10
15
20
25
30
35
40
45
1 2 3 4 5 6 7 8 9 10 11 12 13 14 15 16 17 18 19 20
200g Hardglass
200g Annealed
300g Annealed
Group presentation July 2014

Bucher Emhart Glass
Milestones until full market launch of first bottle
57
March 2015: Full market launch of 0.33l and 1.0l bottle with advertisement and promotion
2013 2014
Nov Dec Jan Feb Mrz Apr Mai Jun Jul Aug Sep Okt Nov Dec
Process
Optimization
Installation
Qualification
15 000 Process
validation
50 000
Qua-
rantine
10 000 filling
& internal
consumption
test
50 000
production
Quarantine
Filling & pre-market
test/launch
50 000 per month
Group presentation July 2014
Bucher Emhart Glass
2013 highlights
• Marked project-related fluctuations in capacity utilisation
• Varied market development
– Demand trend hesitant in first half and then positive in second half
– Slump in demand in China
• First commercial tempered glass system to Vetropack started operations at end
of year
• Realignment of capacities and leverage of worldwide presence
– Expansion of capacity in USA and Europe
– Expanded capacity in Malaysia came on stream ahead of plan
– Start of component sourcing from division’s own plants in Malaysia and China
– Completion of project expected by end of 2015/ beginning of 2016
• Worldwide cooperation agreement with Owens-Illinois came into force in
September
58 Group presentation July 2014
Bucher Emhart Glass
Outlook for 2014
• Market environment expected to be comparable with previous year
– Continuation of good level of demand in USA
– Recovery in Europe
– Stable spare part and service business
– Persistent weakness of Asian markets, especially in China
• Control systems, spare parts and new machines for Owens-Illinois could
provide growth momentum
• Savings arising from the realignment project improve profitability
• Increase in sales and further improvement in operating profit
59 Group presentation July 2014
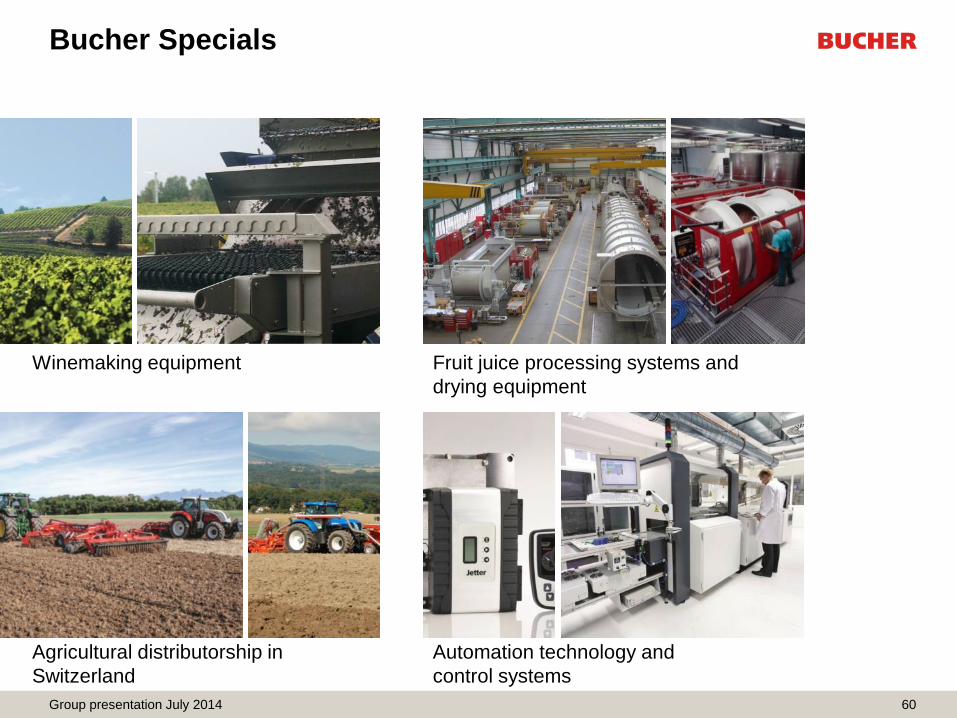
Bucher Specials
60
Winemaking equipment
Agricultural distributorship in
Switzerland
Automation technology and
control systems
Fruit juice processing systems and
drying equipment
Group presentation July 2014

244
206 201 187 188
24
17
12
9 10
0
5
10
15
20
25
30
35
0
50
100
150
200
250
300
20132012201120102009
Net sales EBIT
Bucher Specials
Net sales and EBIT
CHF m CHF m
1)
1) 2012: retrospective restatement owing to first application of IAS 19 (revised)
61 Group presentation July 2014

Bucher Specials
Net sales and number of employees 2013
Net sales Number of employees
CHF 244 m 785 employees1)
Europe 44%
Switzerland 37%
Americas 10%
Asia 7%
Other 2%
France 37%
Germany 29%
Switzerland 27%
Chile 3%
Italy 2%
Other 2%
1) Expressed as full time equivalents
62 Group presentation July 2014
Bucher Vaslin
Market position
• World market leader in winemaking equipment
• Strong global distributor network
• Specialised production facilities in France and Chile
• Market share: 35% to 45% worldwide
• Main competitors: Pera (FR), Della Toffola (IT), Diemme (IT), and further Italian
and German manufacturers
63 Group presentation July 2014
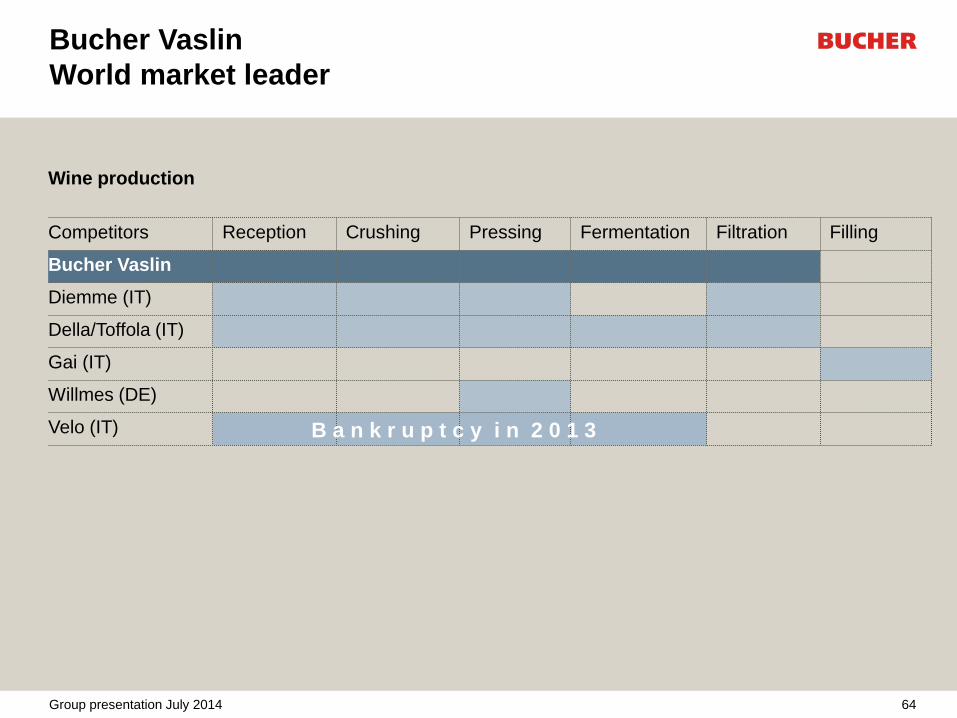
Bucher Vaslin
World market leader
64
Wine production
Competitors Reception Crushing Pressing Fermentation Filtration Filling
Bucher Vaslin
Diemme (IT)
Della/Toffola (IT)
Gai (IT)
Willmes (DE)
Velo (IT) B a n k r u p t c y i n 2 0 1 3
Group presentation July 2014

-15%
-10%
-5%
0%
5%
10%
15%
20%
25%
30%
35%
0
5
10
15
20
25
30
35
40
45
50
US
A
Fra
nce
Italy
Sp
ain
Ge
rma
ny
Au
stria
Gre
ece
Po
rtug
al
Sw
itze
rlan
d
Russia
*
Chin
a *
CAGR million hl
2006 2007 2008 2009 2010 2011 prov. 2012 FC 2013 CAGR 06 - 13F
-15%
-10%
-5%
0%
5%
10%
15%
20%
25%
30%
35%
0
5
10
15
20
25
30
35
40
45
50
Arg
entin
a
Ch
ile
Bra
zil
South
Afric
a
Austra
lia
Ne
w Z
eala
nd
CAGR million hl
Bucher Vaslin
Wine production
65
Source: OIV, SAWIS
Northern hemisphere Southern hemisphere
* CAGR 06 - 11
Group presentation July 2014
Bucher Unipektin
Market position
• World market leader in fruit, berry and vegetable juice processing equipment
• Market share: 35% to 50% worldwide
• Entry into beer filtration market with Bucher Filtrox Systems
• Established product range for dewatering of municipal sewage and industrial
sludges
• Main competitors: Flottweg (DE), GEA (DE), Alfa Laval (SE) und Andritz (AT)
66 Group presentation July 2014

Bucher Unipektin
World market leader
67
Juice production
Competitors Reception Milling Mash
heating
Dejuicing Pasteuri-
zation
Filtration Adsorp-
tion
Evapo-
ration
Bucher Unipektin
Flottweg (DE)
Bauer & Partners (PL)
GEA Group (DE)
Alfa Laval (SE)
Schmidt-Bretten (DE)
Bellmer (DE)
Kaimi (CN)
Group presentation July 2014
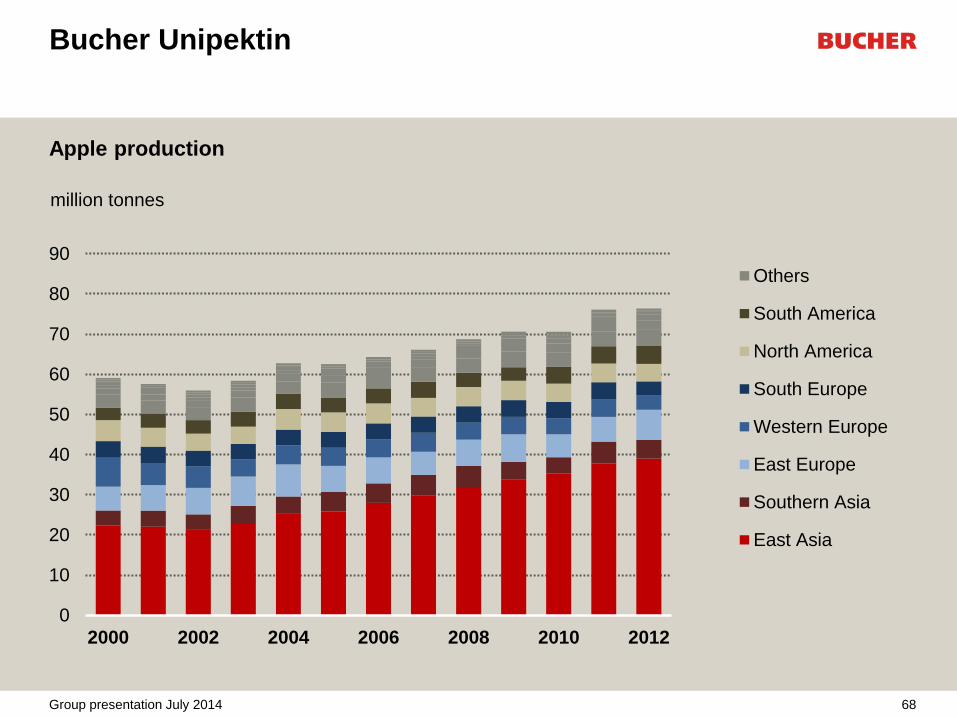
Bucher Unipektin
Apple production
68
0
10
20
30
40
50
60
70
80
90
2000 2002 2004 2006 2008 2010 2012
million tonnes
Others
South America
North America
South Europe
Western Europe
East Europe
Southern Asia
East Asia
Group presentation July 2014

Bucher Landtechnik
Market position (in Switzerland)
• Distributorship of tractors and agricultural machinery
• Well established among farmers and distributors
• Professional distributor network and high quality of service
• Wide range of tractors (New Holland, Case, Steyr), attachments (Kuhn) and
wheel loaders (Weidemann)
• Market share: 20% to 30%
• Main competitors
– Tractors: John Deere, AGCO, SDF, Claas
– Attachments: Pöttinger, Kverneland, Amazone, Lemken, Rabe, Krone, Fella
69 Group presentation July 2014
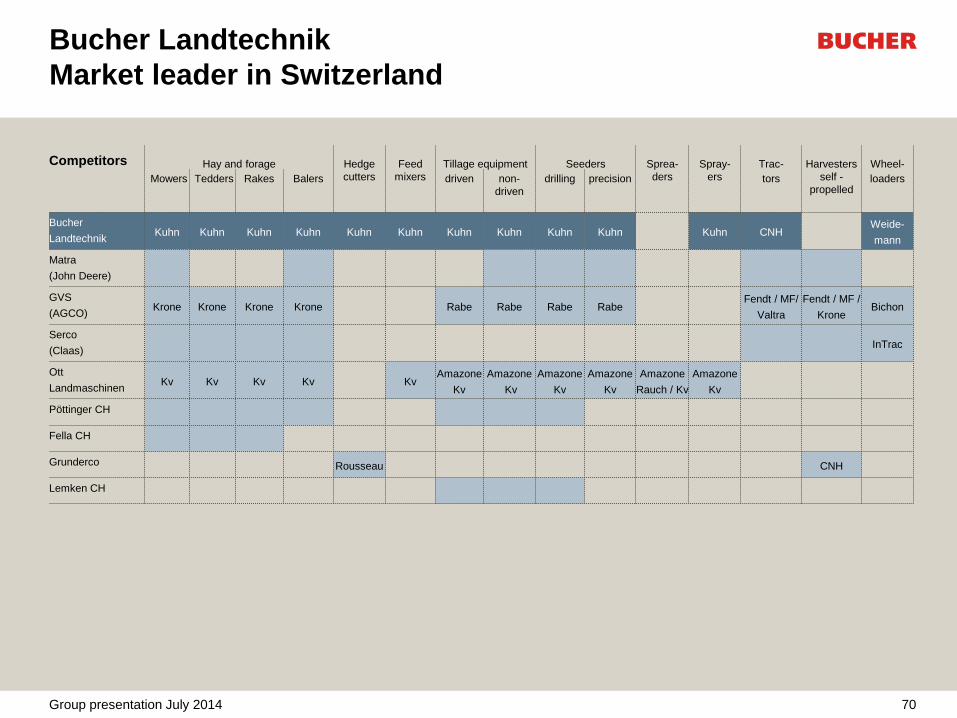
Bucher Landtechnik
Market leader in Switzerland
70
Competitors Hay and forage Hedge Feed Tillage equipment Seeders Sprea- Spray- Trac- Harvesters Wheel-
Mowers Tedders Rakes Balers cutters mixers driven non-
driven
drilling precision ders ers tors self -
propelled loaders
Bucher
Landtechnik Kuhn Kuhn Kuhn Kuhn Kuhn Kuhn Kuhn Kuhn Kuhn Kuhn Kuhn CNH
Weide-
mann
Matra
(John Deere)
GVS
(AGCO) Krone Krone Krone Krone Rabe Rabe Rabe Rabe
Fendt / MF/
Valtra
Fendt / MF /
Krone Bichon
Serco
(Claas) InTrac
Ott
Landmaschinen Kv Kv Kv Kv Kv
Amazone
Kv
Amazone
Kv
Amazone
Kv
Amazone
Kv
Amazone
Rauch / Kv
Amazone
Kv
Pöttinger CH
Fella CH
Grunderco Rousseau CNH
Lemken CH
Group presentation July 2014
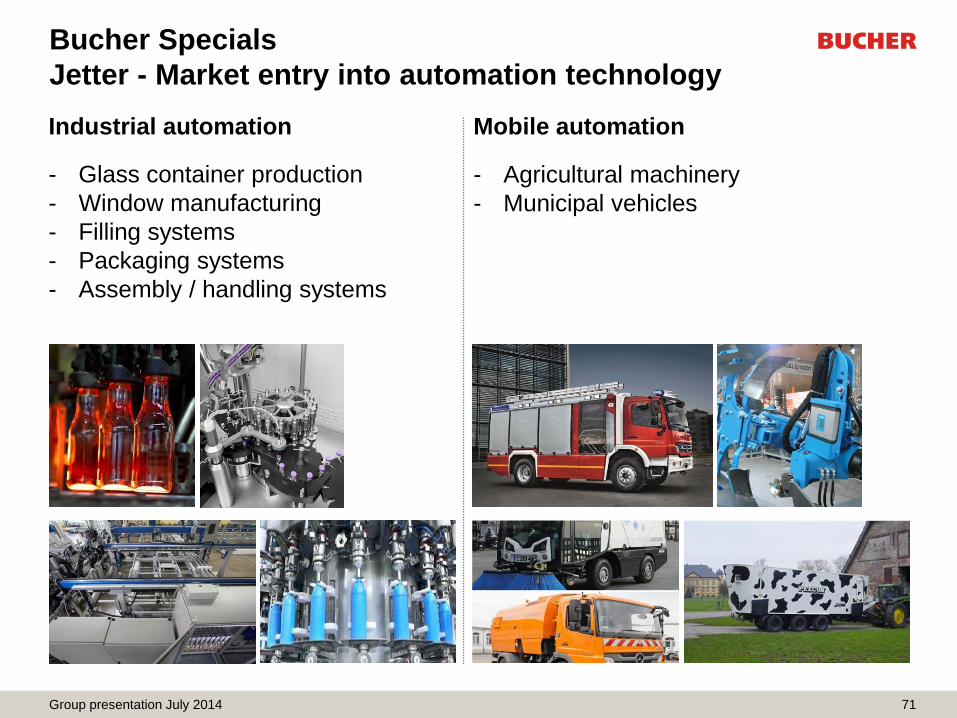
Bucher Specials
Jetter - Market entry into automation technology
71
Industrial automation Mobile automation
- Glass container production
- Window manufacturing
- Filling systems
- Packaging systems
- Assembly / handling systems
- Agricultural machinery
- Municipal vehicles
Group presentation July 2014
Bucher Specials
2013 highlights
• Stable market environment overall
– Upturn in demand for winemaking equipment
– Positive performance in equipment for fruit juice processing, dewatering sewage sludge
and beer filtration
– Sales of equipment for dewatering sewage sludge exceeded CHF 10 million for the first
time
– Buoyant market for the Swiss distributorship for agricultural machinery
– Contribution to sales from automation technology not yet significant; consolidated as of
November
• Operational improvements through streamlining in administrative area and
investments in logistics
• Gratifying rise in sales and operating profit
72 Group presentation July 2014

Bucher Specials
Outlook for 2014
• Market outlook
– Continuation of brisk demand for winemaking equipment
– Stabilization on high level in fruit juice processing equipment
– Increase in projects for dewatering sewage sludge and beer filtration
– Swiss distributorship for agricultural machinery at a high level, but declining
– Strong, acquisition-related sales growth through consolidation of Jetter automation
technology
• Bucher Specials expects strong growth in sales and operating profit
73 Group presentation July 2014
