group presentation - bucherindustries.com · group presentation october 2009 page 3 kuhn group....
TRANSCRIPT

Group presentation October 2009 Page 1
Group presentation

Group presentation October 2009 Page 2
Technology group founded in 1807
• Group specialised in mechanical and vehicle engineering• Strategy of technology and market leadership
- product innovation- sales network and high service levels- good price/performance ratios for customers- taking advantage of industry consolidation
• Markets offering considerable growth and earnings potential • Clear divisional structure with decentralised profit responsibility• Group-wide strategic and financial management• Bucher Industries is a long term oriented industrial group

Group presentation October 2009 Page 3
Kuhn Group
Machinery for hay and forage harvesting, bedding and feeding, tillage, seeding, fertilisation and spraying
Sales CHF 1 100 m Employees 3 600
Bucher Municipal
Municipal vehicles for cleaning and removing snow from public and private traffic areas
Sales CHF 600 m Employees 1 500
Bucher Process
Machinery and equip- ment for wine and fruit juice production, plus a range of drying systems
Sales CHF 200 m Employees 500
Bucher Hydraulics
Custom hydraulic drive and control systems for mobile and industrial hydraulic applications
Sales CHF 500 m Employees 1 700
Emhart Glass
Machinery, com- ponents, systems and services for the glass container industry
Sales CHF 400 m Employees 1 100
Five divisions

Group presentation October 2009 Page 4
No. 1 market positions
• Kuhn Group worldwide in fodder harvesting machinery and feed mixers
• Bucher Municipal in Europe in street sweepers• Bucher Process worldwide in fruit juice and
wine production plants• Bucher Hydraulics in Europe in special segments of mobile
hydraulics• Emhart Glass worldwide in glass container production
equipment
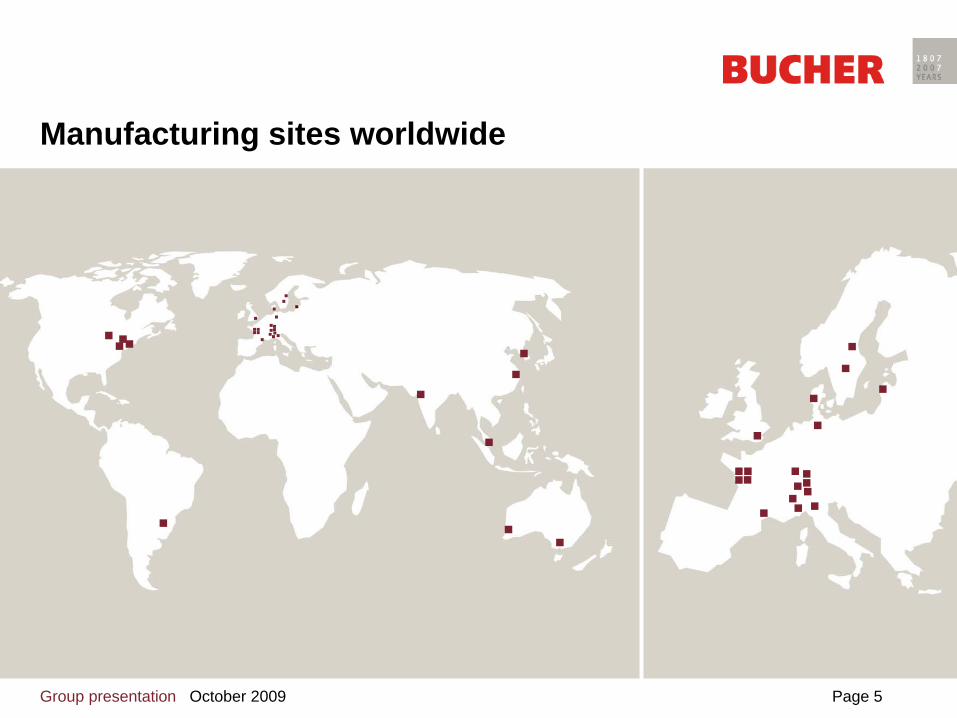
Group presentation October 2009 Page 5
Manufacturing sites worldwide

Group presentation October 2009 Page 6
Group’s short- to medium-term strategy
• Strengthening the existing five divisions, primarily through organic growth and secondarily through selective acquisitions
• Concentrating on improving operational efficiency- Weathering the downturn as best as possible- Getting ready for the next upswing- EBIT margin as the key indicator of operating performance- RONOA after tax as the most important financial indicator
• Maintaining a solid balance sheet and adequate liquidity to allow rapid action
Group presentation October 2009 Page 7
Group and division earnings targets
EBIT margin Targets 2008 2007 2006 2005 2004
Kuhn Group 11 12.4 11.6 **9.3 8.4 8.3
Bucher Municipal 8 *7.4 6.6 5.4 4.2 2.2
Bucher Process 9 12.4 10.9 7.6 5.9 4.1
Bucher Hydraulics 11 *11.3 15.1 12.6 9.9 8.6
Emhart Glass 9 8.4 7.9 7.0 5.2 6.9
Bucher Industries 9 8.8 9.3 5.9 6.0 5.6
* before impairment charges ** restructuring
Group and divisions
RONOA after tax >16 18.5 23.8 14.3 14.8 12.1
Group presentation October 2009 Page 8
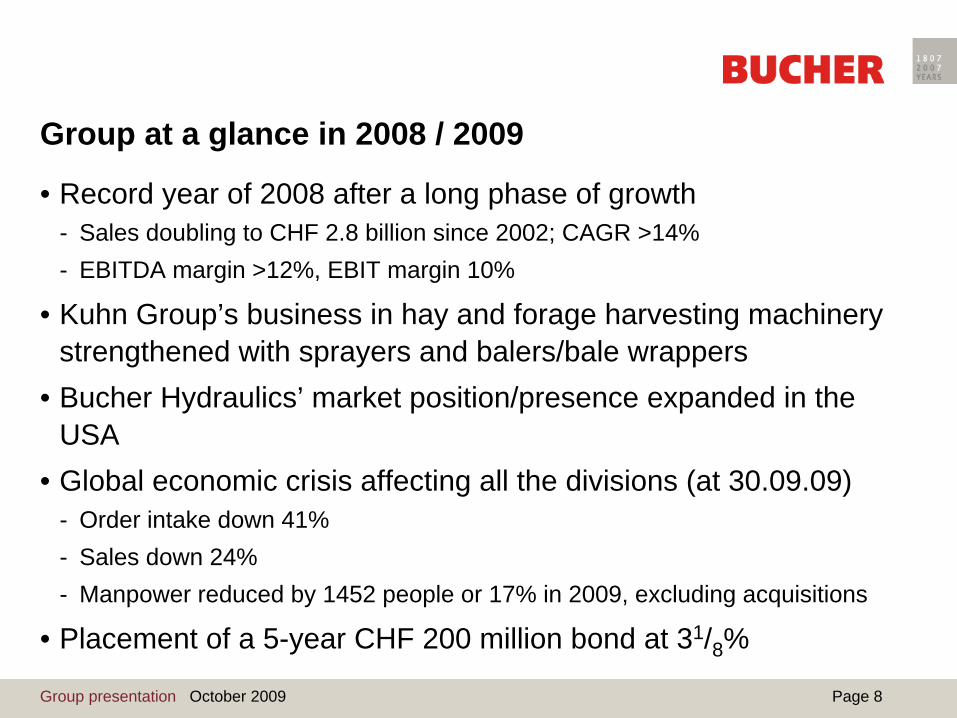
Group at a glance in 2008 / 2009
• Record year of 2008 after a long phase of growth- Sales doubling to CHF 2.8 billion since 2002; CAGR >14%- EBITDA margin >12%, EBIT margin 10%
• Kuhn Group’s business in hay and forage harvesting machinery strengthened with sprayers and balers/bale wrappers
• Bucher Hydraulics’ market position/presence expanded in the USA
• Global economic crisis affecting all the divisions (at 30.09.09)- Order intake down 41%- Sales down 24%- Manpower reduced by 1452 people or 17% in 2009, excluding acquisitions
• Placement of a 5-year CHF 200 million bond at 31/8 %
Group presentation October 2009 Page 9
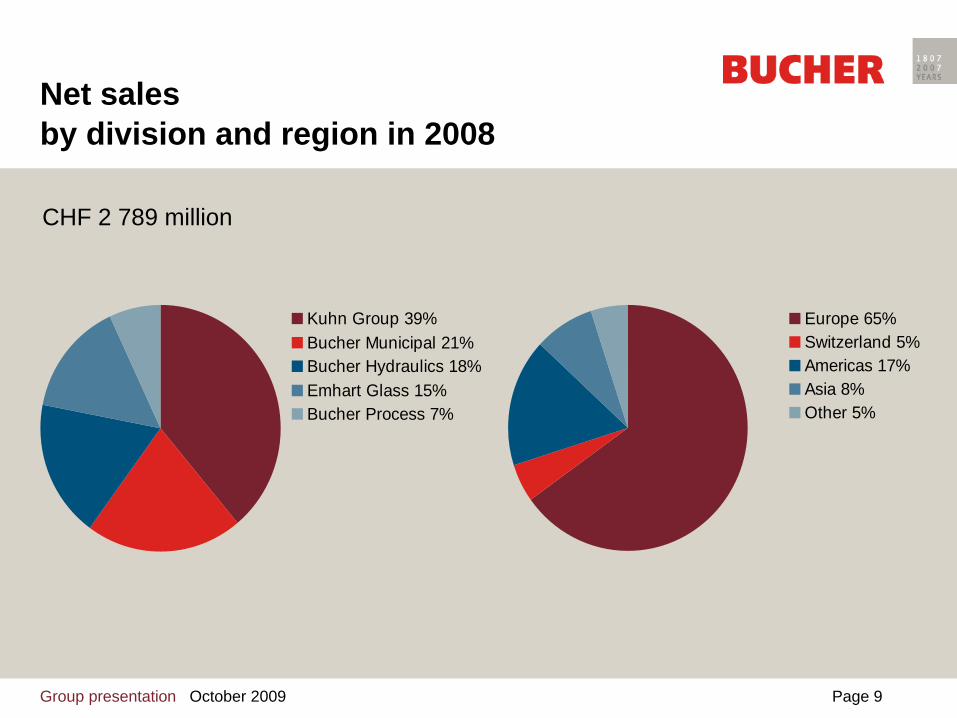
Net sales by division and region in 2008
CHF 2 789 million
Kuhn Group 39%Bucher Municipal 21%Bucher Hydraulics 18%Emhart Glass 15%Bucher Process 7%
Europe 65%Switzerland 5%Americas 17%Asia 8%Other 5%

Group presentation October 2009 Page 10
Number of employees by region in 2008
France 34%North America 14%Switzerland 13%Germany 9%United Kingdom 6%Sweden 6%Brazil 5%Italy 4%Australia 3%Asia 3%Other 3%
Group presentation October 2009 Page 11
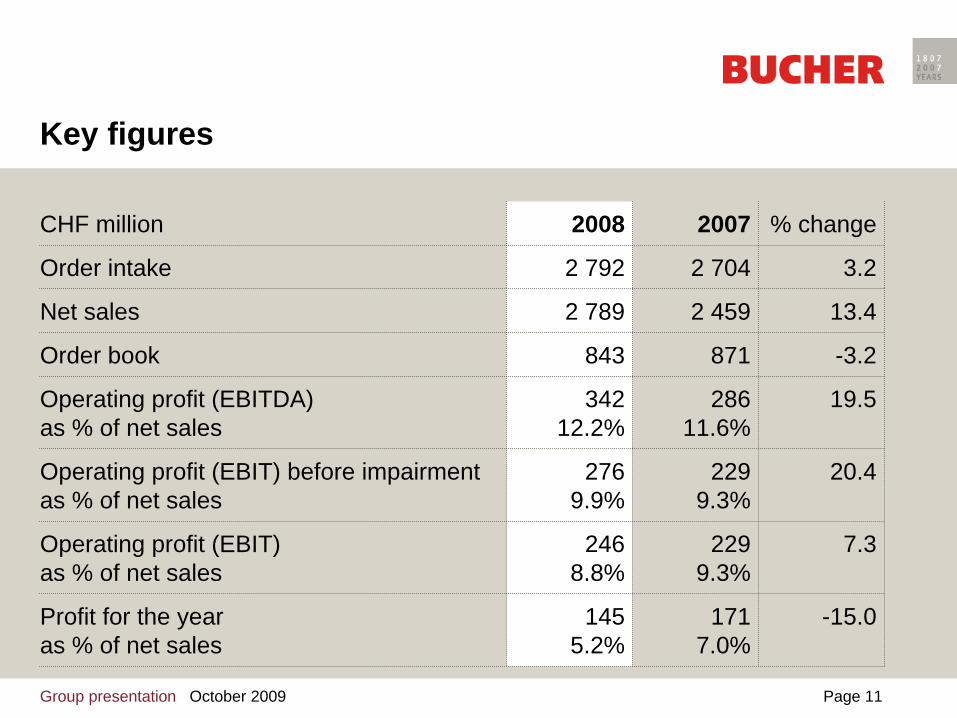
Key figures
CHF million 2008 2007 % change
Order intake 2 792 2 704 3.2
Net sales 2 789 2 459 13.4
Order book 843 871 -3.2
Operating profit (EBITDA) as % of net sales
34212.2%
286 11.6%
19.5
Operating profit (EBIT) before impairmentas % of net sales
2769.9%
2299.3%
20.4
Operating profit (EBIT) as % of net sales
2468.8%
229 9.3%
7.3
Profit for the year as % of net sales
1455.2%
171 7.0%
-15.0

Group presentation October 2009 Page 12
Investing in the future
CHF million 2008 2007 % change
Development expenses 78 71 9.8
Capital expenditure on property, plant and equipment 131 131 -0.2
Acquisitions 152 30

Group presentation October 2009 Page 13
Division results
2008 2007CHF million EBIT EBIT margin EBIT EBIT marginKuhn Group 137 12.4% 108 11.6%
Bucher Municipal* 4338
7.4%6.6% 37 6.6%
Bucher Process 24 12.4% 19 10.9%
Bucher Hydraulics* 5631
11.3%6.3% 59 15.1%
Emhart Glass 35 8.4% 33 7.9%
Other/consolidation -19 -27
Bucher Industries* 276246
9.9%8.8% 229 9.3%
* Before / after impairment charges

Group presentation October 2009 Page 14
Net sales and number of employees
CHF m Empl.
2789
8176
0
500
1000
1500
2000
2500
3000
200820072006200520040
1500
3000
4500
6000
7500
9000
Net sales Number of employees

Group presentation October 2009 Page 15
Net sales and results
CHF m CHF m
27892459
20871948
1641 342286
18516614891 118 124
237229
86 96
171 145
540
500
1000
1500
2000
2500
3000
200820072006200520040
100
200
300
400
500
600
Net sales EBITDA EBIT Profit for the year

Group presentation October 2009 Page 16
503567
605687
891
14.3
23.818.5
14.812.1
0100200300400500600700800900
1000
200820072006200520040
5
10
15
20
25
30
35
40
Net operating assets Return on net operating assets
Net operating assets (NOA) and return on net operating assets after tax (RONOA)
CHF m %
Group presentation October 2009 Page 17
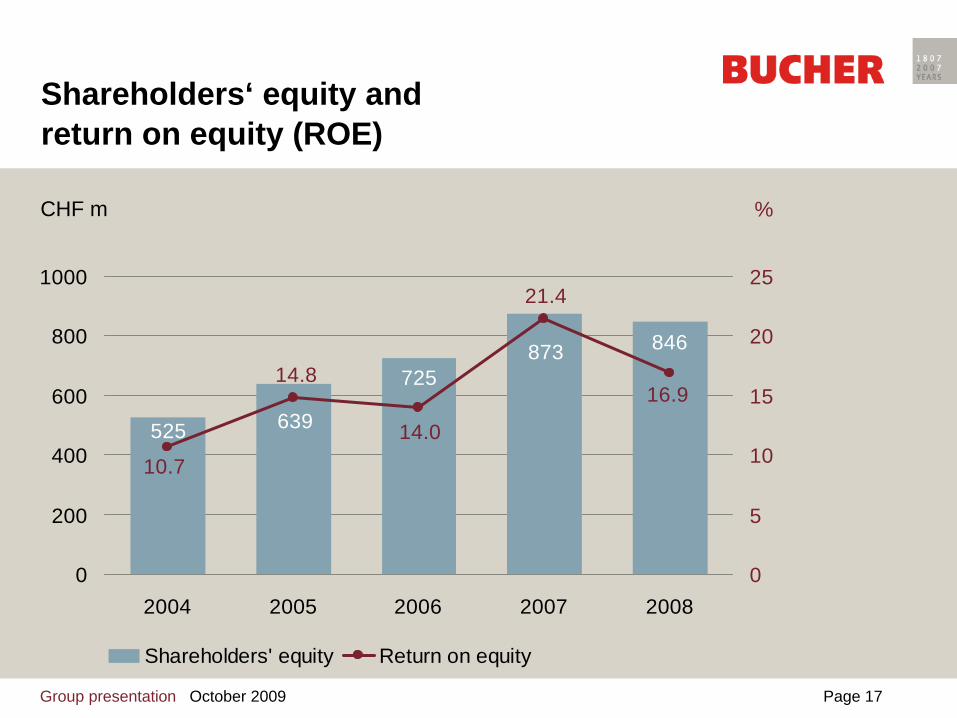
Shareholders‘ equity and return on equity (ROE)
873 846
725
525 639 14.0
21.4
16.914.8
10.7
0
200
400
600
800
1000
200820072006200520040
5
10
15
20
25
Shareholders' equity Return on equity
CHF m %

Group presentation October 2009 Page 18
Operating free cash flow
-15
43
101
62
120
-40-20020406080100120
2004 2005 2006 2007 2008
CHF m

Group presentation October 2009 Page 19
Net liquidity and free cash flow
9269
173 164
-111
104 1
-223
2
121
-250-200-150-100
-500
50100150200
20082007200620052004-250-200-150-100-50050100150200
Net liquidity Free cash flow
Net liquidity CHF m
Free cash flow CHF m

Group presentation October 2009 Page 20
14941675
18402130 2068
525 639 725873 846
0
500
1000
1500
2000
2500
2004 2005 2006 2007 2008Total assets Shareholders' equity
Total assets and Shareholders’ equity
CHF m
35.2% 38.1% 39.4% 41.0% 40.9%

Group presentation October 2009 Page 21
Shareholders’ equity / Intangible assets
525639
725
873 846
49 79 62 79131
25 47 45 61 89
0
200
400
600
800
1000
2004 2005 2006 2007 2008
Shareholders' equity Intangible assets thereof goodwill
CHF m

Group presentation October 2009 Page 22
Group outlook for 2009
• Continuing uncertainty surrounding forecasts and currencies• Eastern Europe, Russia and Brazil hard hit, along with the main
sales markets of Western Europe and the USA• Customers facing problems financing projects, leading to delays,
downsizing and cancellations• Performance additionally weighed down by importers, dealers
and OEMs running down their inventories• All divisions expected to remain operationally profitable• Impairment charges of CHF 50-100 million possible• Sales expected to decline by 25-30%• An operating and net profit for the year before impairment, but
significantly down on last year

Group presentation October 2009 Page 23
Spraying Landscapemaintenance
Bedding & feedingFeed storageHay & forageharvesting
Kuhn GroupSpecialised agricultural machinery
Ploughing Seeding Fertilisation Manure spreadersTillage

Group presentation October 2009 Page 24
Kuhn GroupNet sales and EBIT
CHF m CHF m
0
200
400
600
800
1000
1200
2004 2005 2006 2007 20080
25
50
75
100
125
150
Net sales EBIT

Group presentation October 2009 Page 25
Europe 73%Americas 24%Asia 2%Other 1%
Kuhn Group Net sales and number of employees 2008
Net salesCHF 1 106 m
Number of employees3 384 persons
France 67%North America 16%Brasil 13%Other 4%

Group presentation October 2009 Page 26
Kuhn Group Market position
• World’s leading manufacturer of specialised agricultural machinery under one brand
• Use of several distribution networks reduces dependence and increases potential for high market share
• Broad customer base and independence from large customers• Specialist in hay and silage making machinery, soil preparation
machinery, seed drills, sprayers, feed mixers• Market share: up to 30% or more worldwide depending on the
product family• Main competitors: Kverneland (NO), Krone (DE), Claas (DE),
Pöttinger (AT), Amazone (DE) and other German, French and Italian manufacturers

Group presentation October 2009 Page 27
Kuhn Group Complete product range under one brand
Competitors Hay and forage hedge feed tillage equipment seeders sprea- spray- trac- harvestersmowers tedders rakes balers cutters mixers driven non-driven drilling precision ders ers tors selfpropelled
Kuhn GroupJohn DeereCNHAGCOClaas Renault
KroneAmazonePöttingerKvernelandExel / HardiLemkenHorschVäderstadKongskildeLelySulkyMonosem
Group presentation October 2009 Page 28
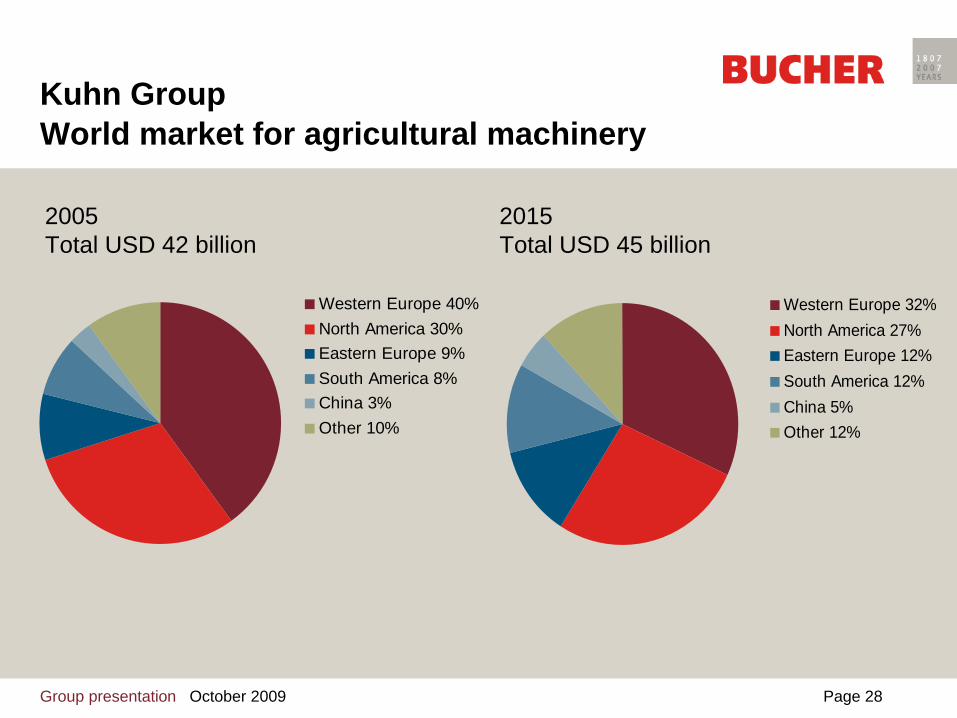
Kuhn GroupWorld market for agricultural machinery
Western Europe 32%North America 27%Eastern Europe 12%South America 12%China 5%Other 12%
Western Europe 40%North America 30%Eastern Europe 9%South America 8%China 3%Other 10%
2005Total USD 42 billion
2015Total USD 45 billion

Group presentation October 2009 Page 29
Kuhn Group 2008 / 2009 highlights
• Very good performance in 2008- CHF 1.1 billion in sales, up 26% in local currency- Order intake up 24% in local currency despite the crisis in the fourth quarter- High profitability: EBIT of CHF 137 million, up 27%; EBIT margin of 12.4%
• Product portfolio selectively strengthened by acquisitions- Blanchard: sprayers (2008 sales: EUR 25 million) - Geldrop: balers and bale wrappers (2008 sales: EUR 117 million)
• Agricultural machinery also affected by the 2009 downturn- Performance weighed down by credit crisis, currencies and low milk prices - Elevated inventories in the dealer network required adjustment in production- Marked drop in sales and order intake
• Manpower reduced by 18% in 2009, excluding acquisitions

Group presentation October 2009 Page 30
Kuhn Group Outlook for 2009
• Weak economic conditions and sluggish lending- Affecting all regions, in particular Eastern Europe, Russia and North
America - Milk and meat prices likely to have bottomed out at a low level- Reduced production in the second half due to destocking by dealers
• Lower profitability due to the shift in the product mix towards small batches of complex machinery
• Flexible cost structures allowing capacity to be adjusted without high restructuring costs
• Long-term future prospects for agriculture are intact • Considerably lower sales and EBIT margin expected

Group presentation October 2009 Page 31
Bucher MunicipalSweepers and winter maintenance equipment
Compact sweepers Truck mounted sweepers
Spreaders Refuse collection vehiclesSnow blowers

Group presentation October 2009 Page 32
Bucher Municipal Net sales and EBIT
CHFm
0
100
200
300
400
500
600
2004 2005 2006 2007 20080
10
20
30
40
50
60
Net sales EBIT
CHFm
* before impairment charges
*

Group presentation October 2009 Page 33
Bucher MunicipalNet sales and number of employees 2008
Net salesCHF 579 m
Number of employees1 569 persons
UK 30%Switzerland 22%Australia 18%Germany 11%Italy 6%Latvia 5%Denmark 5%Other 3%
Europe 62%Switzerland 16%Australia 13%Asia 6%Other 3%

Group presentation October 2009 Page 34
Bucher Municipal Market position
• Europe’s leading manufacturer of compact and truck mounted sweepers, large snow removal equipment for roads and airports
• Market share in Europe:compact sweepers 35%truck-mounted sweepers 60%
• Complete product line for municipal applications• Main competitors: Schmidt (DE), Ravo (NL), Elgin (USA),
Scarab (UK), Hako (DE), Boschung (CH) and Faun (DE)

Group presentation October 2009 Page 35
Bucher MunicipalComplete product range
SB = snow blowersSS = snow sweepersRWS = runway sweepers
Competitors Sweepers Airport Spreaders1m3 2m3 4m3 5m3 6m3 8m3 SB SS RWS mounted towed
Bucher (CH)Johnston (UK)Schmidt (DE)Boschung (CH)Hako (DE)Aebi MFH (CH)Faun (DE)Elgin (USA)Scarab (UK)Epoke (DK)Acometis (FR)

Group presentation October 2009 Page 36
Bucher Municipal 2008 / 2009 highlights
• Good performance at record levels in 2008- High sales of CHF 579 million and lower order intake of CHF 528 million- Operating EBIT margin of 7.4%, outpacing the industry average- Good demand in Europe and Australia, along with export successes in Thailand- Winter maintenance business fuelled by snowy winter- Continued expansion of the Latvian assembly and component plant
• Municipal vehicle business also hit by the economic crisis- Private sweeper fleet operators rapidly halting capital spending- Local authorities acting cautiously in anticipation of lower tax revenues- High pricing pressure due to manufacturers’ overcapacity
• Continuation of development projects- New generation of sweepers with a common parts strategy- Prototype of fuel-cell-driven compact sweeper tested in Switzerland
Group presentation October 2009 Page 37
Bucher Municipal Outlook for 2009
• No signs of a rapid recovery in demand- No impact of government economic stimulus programmes felt so far;
growing trend towards covert national protectionism- Effects of lower tax revenues in 2010 unclear- Private sweeper fleet operators remaining cautious- A few major contracts seem to be open for tenders- Positive side effects of the harsh winter 2008/9 should be felt
• Manpower reduced by 10% in 2009• Assembly to be transferred and Latvian operations expanded in
Q1 2010 with restructuring costs of approx. CHF 10 million• Following the absolute record high in 2008, sales are expected
to be considerably lower with reduced profitability

Group presentation October 2009 Page 38
Bucher ProcessWine and fruit juice production equipment
Destemmers Pneumatic tank presses CF filtration systems Reverse osmosis systems
Ultrafiltration systemsHydraulic presses EvaporatorsMills
Group presentation October 2009 Page 39
0
25
50
75
100
125
150
175
200
2004 2005 2006 2007 2008-5
0
5
10
15
20
25
30
35
Net sales EBIT
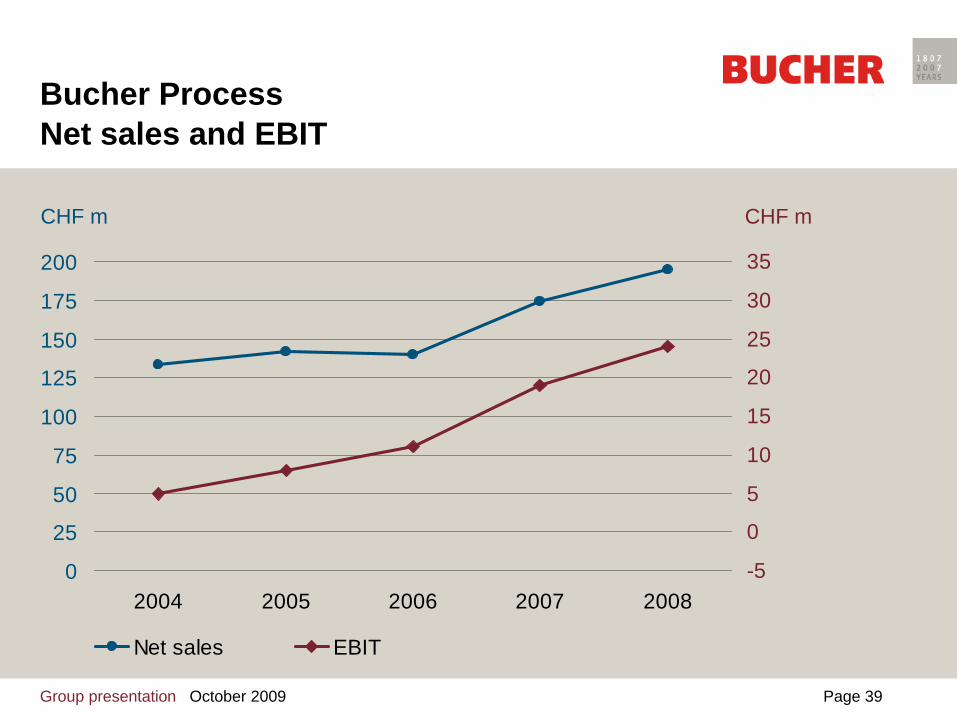
Bucher ProcessNet sales and EBIT
CHF m CHF m

Group presentation October 2009 Page 40
Bucher Process Net sales and number of employees 2008
Europe 68%Switzerland 3%Americas 16%Asia 10%Other 6%
Net salesCHF 195 m
Number of employees533 persons
France 68%Switzerland 16%Chile 6%Italy 4%North America 2%Other 4%

Group presentation October 2009 Page 41
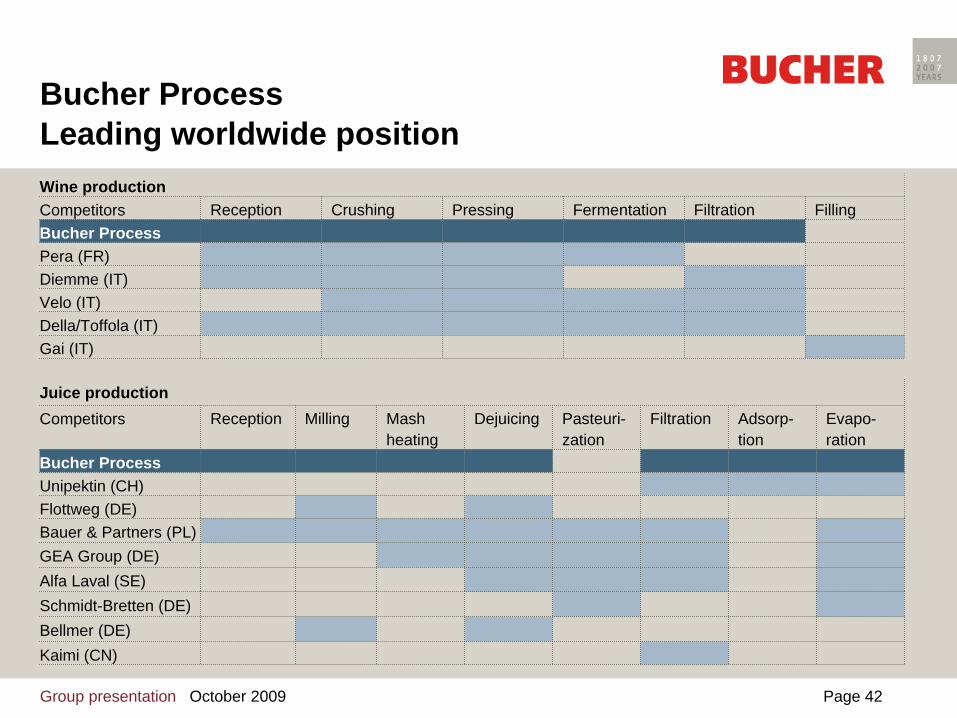
Bucher Process Market position
• World market leader in fruit, berry and vegetable juice processing equipment
• World market leader in wine making equipment• Market share: 35% to 50% worldwide• Development of a new business segment for municipal sludge
dewatering• Main competitors: Flottweg (DE), GEA (DE), Unipectin (CH)
and Filtrox (CH) in fruit juice equipment; Pera (FR), Della Toffola (IT), Diemme (IT), Velo (IT) and other Italian and German manufacturers in wine making equipment
Group presentation October 2009 Page 42
Bucher ProcessLeading worldwide position
Juice productionCompetitors Reception Milling Mash
heatingDejuicing Pasteuri-
zationFiltration Adsorp-
tionEvapo- ration
Bucher ProcessUnipektin (CH)Flottweg (DE)Bauer & Partners (PL)GEA Group (DE)Alfa Laval (SE)Schmidt-Bretten (DE)Bellmer (DE)Kaimi (CN)
Wine productionCompetitors Reception Crushing Pressing Fermentation Filtration FillingBucher ProcessPera (FR)Diemme (IT)Velo (IT)Della/Toffola (IT)Gai (IT)
Group presentation October 2009 Page 43
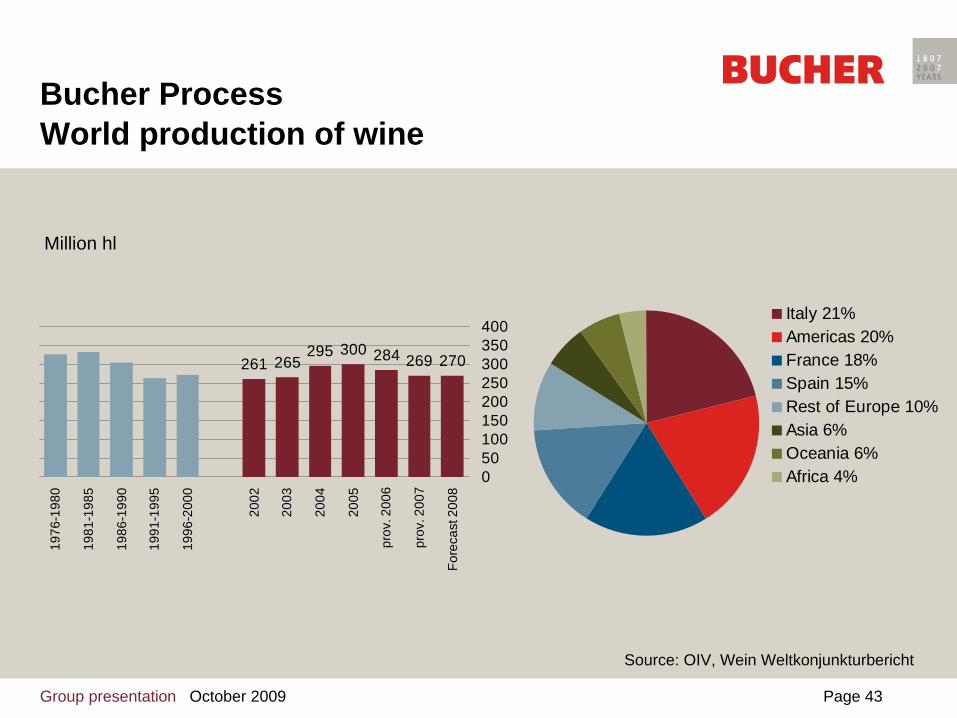
Italy 21%Americas 20%France 18%Spain 15%Rest of Europe 10%Asia 6%Oceania 6%Africa 4%
Bucher ProcessWorld production of wine
Million hl
270269284300295265261
050100150200250300350400
1976
-198
0
1981
-198
5
1986
-199
0
1991
-199
5
1996
-200
0
2002
2003
2004
2005
prov
. 200
6
prov
. 200
7
Fore
cast
200
8
Source: OIV, Wein Weltkonjunkturbericht

Group presentation October 2009 Page 44
Bucher ProcessWorld apple production 1960 - 2006
0
10
20
30
40
50
60
70
1960 1970 1980 1990 2000 2006
other
South America
Americas
Asia
Europe
Juice production: approx. 70% concentrate, 20% fresh juice, 10% cider
2006 juice production

Group presentation October 2009 Page 45
Bucher Process 2008 / 2009 highlights
• The division enjoyed a record year in 2008- Sales of CHF 195 million and an EBIT margin of 12.4%- Solid demand for winemaking equipment in the main markets- Southern hemisphere severely hit by the onset of the financial crisis- Excellent handling of the major orders worth CHF 40 million to supply
equipment for producing apple juice concentrate to the UK and China - New orders for sludge dewatering equipment
• Downsizing and holding up in 2009 - Transfer of wine press and filter production from the small facilities in Italy
and France to the main Chalonnes plant in France- Importance of preserving expertise for the anticipated rebound in
winemaking equipment in the period 2010−2013

Group presentation October 2009 Page 46
Bucher Process Outlook for 2009
• Expected to be a difficult year for the division- Projects delayed because of restrictive lending practices- Subsidies announced in Europe for winemaking equipment delaying capital-
spending decisions for 2009, but having a positive impact from 2010- Capital spending curbed by falling prices of apple juice concentrate- No major projects for apple juice concentrate (2008: CHF 40 million)
• Increasing success with sludge dewatering equipment; 2009 sales should reach CHF 5 million
• Manpower reduced by 10% through measures such as transferring production of winemaking equipment
• Considerably lower sales and an operating profit expected, despite the seasonal first-half loss
Group presentation October 2009 Page 47
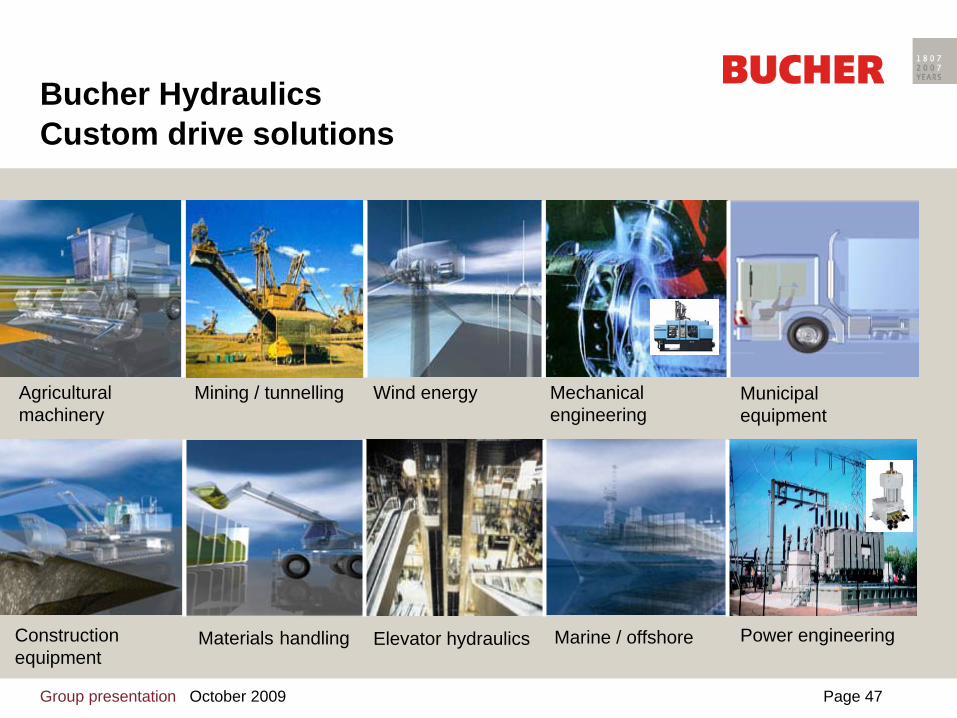
Materials handling Marine / offshore
Mechanical engineering
Elevator hydraulics Power engineering
Agricultural machinery
Mining / tunnelling
Construction equipment
Municipal equipment
Wind energy
Bucher HydraulicsCustom drive solutions

Group presentation October 2009 Page 48
0
100
200
300
400
500
2004 2005 2006 2007 20080
20
40
60
80
100
Net sales EBIT
Bucher HydraulicsNet sales and EBIT
CHF m CHF m
* before impairment charges
*
Group presentation October 2009 Page 49
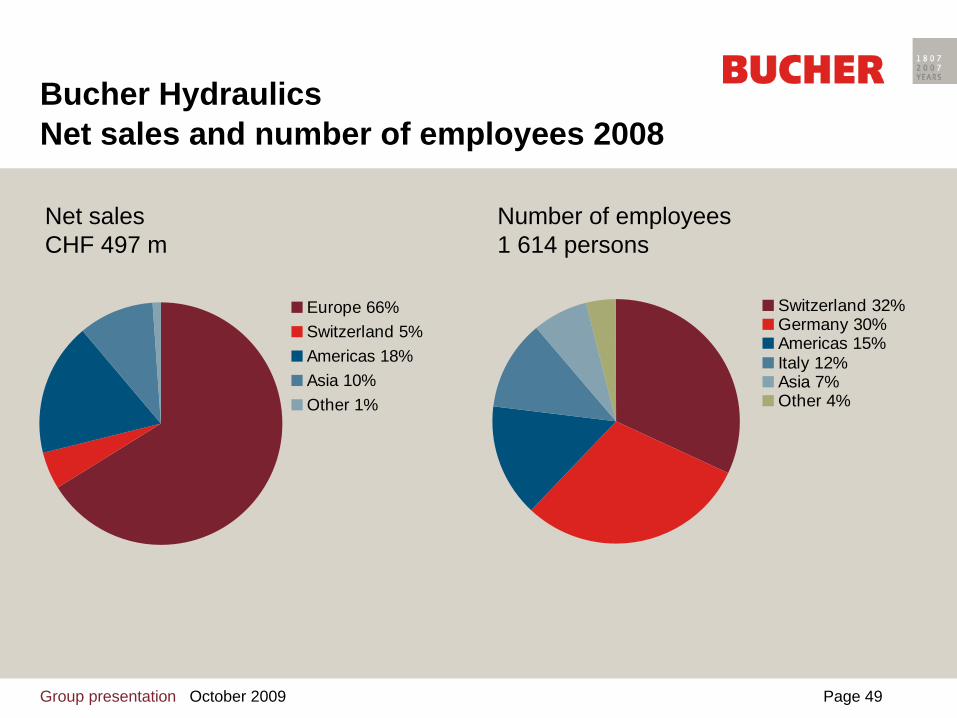
Bucher Hydraulics Net sales and number of employees 2008
Europe 66%Switzerland 5%Americas 18%Asia 10%Other 1%
Switzerland 32%Germany 30%Americas 15%Italy 12%Asia 7%Other 4%
Net salesCHF 497 m
Number of employees1 614 persons

Group presentation October 2009 Page 50
Bucher Hydraulics Market position
• Leading specialist in mobile, industrial and elevator hydraulics across Europe; built up presence in USA
• Market share: 10% to 20% in specialised areas of hydraulic engineering
• Focused on customised drive solutions • Main competitors: Bosch-Rexroth (DE), Sauer Danfoss (USA),
Parker Hannifin (USA), Eaton Vickers (USA), Hydac (DE), Husco (USA), Denison (USA) and a large number of other German and Italian manufacturers

Group presentation October 2009 Page 51
Bucher Hydraulics Leading european position
Pumps Valves Motors & Cylinders
Accessoires Power Packs
Competitors Pis- ton
Vane Gear Indu- strial (Cetop)
Ser- vo
Direc- tional- spool
Car- tridge
Mani- folds
Spe- cial
Gear Pis- ton
Cylin- ders
Elec- tro- nics
Accu- mulat ors
Fil- ters
Other Com- pact
Con- trac- ting
Bucher HydraulicsParker (USA)Eaton (USA)Rexroth (DE)Sauer Danfoss (DE)Hydac (DE)HAWE (DE)Brevini Group (IT)Walvoil (IT)Argo-Hytos (DE)
Moog (USA)Haldex (SE)
Husco (USA)
Sun Hydraulics (USA)Hydraforce (USA)

Group presentation October 2009 Page 52
50
100
150
200
250
1980 1982 1984 1986 1988 1990 1992 1994 1996 1998 2000 2002 2004 2006 2008
Hydraulik Engineering Bucher Hydraulics
Bucher HydraulicsSegment growth rates
Revenue index
Source: VDMA
Group presentation October 2009 Page 53
Bucher Hydraulics 2008 / 2009 highlights
• Very good performance for three quarters and a massive slump in the fourth quarter of 2008- All important market segments except agricultural machinery affected- Capacities fully utilised and in some cases strained until October 2008
• Position expanded in the USA- Integration of Monarch Hydraulics Inc. since the beginning of 2008- Purchase of Command Controls Corp. (US cartridge valves) late in 2008
• Agricultural machinery segment now affected too in 2009• Slump in order intake (-50%) less severe than the industry
average • Manpower reduced by more than 26% up to the end of
September 2009
Group presentation October 2009 Page 54
Bucher Hydraulics Outlook for 2009
• No significant recovery expected this year- Operations as a component supplier depend directly on customers’
performance- Customers’ destocking is nearing an end- All market segments incl. agricultural machinery affected by the sharp
downturn
• Order intake should stabilise at a very low level• Uncertain forecasts because the timing and extent of the
recovery remain very difficult to gauge• Further downsizing measures cannot be ruled out, but will be
undertaken judiciously to preserve expertise • Considerably lower sales and operating profit expected for 2009
Group presentation October 2009 Page 55
Lehr
Emhart Glass Glass container manufacturing equipment
Forehearth
Glass container manufacturing process
Furnace
Lehr
Palletizing
Gob forming Glas forming machine Ware handling Inspection
Inspection
Gob forming
Ware handling
Forming machine

Group presentation October 2009 Page 56
Emhart Glass Net sales and EBIT
CHF m CHF m
0
100
200
300
400
500
2004 2005 2006 2007 20080
10
20
30
40
50
Net sales EBIT

Group presentation October 2009 Page 57
Emhart Glass Net sales and number of employees 2008
Net salesCHF 418 m
Number of employees1 058 persons
Sweden 44%Americas 31%Asia 7%Switzerland 7%Italy 3%Germany 2%Other 4%
Europa 51%Americas 20%Asia 15%Middle East/Africa 12%Other 2%

Group presentation October 2009 Page 58
Emhart Glass Market position
• World’s leading supplier of machinery, equipment and services for glass container manufacturers
• Market share: 45% worldwide for glass forming machines and services; 25% worldwide for inspection systems
• Main competitors: Owens-Illinois (USA), Saint Gobain (FR), Bottero (IT), BDF (IT), Heye International (DE) in glass forming machinery; Saint Gobain Cinematique (FR), MSC (FR) in inspection systems

Group presentation October 2009 Page 59
Emhart GlassWorldwide leading manufacturer
Hot End Cold EndIS forming machine
Competitors Batch charger
Melter(Furnace)
Fore- hearth
Feeder & shear
NIS AIS IS Warehandling
Lehr Inspec- tion
Palle- tizing
Wrap- ping
Emhart GlassBottero (IT)BDF (IT)O-I (USA)Sklostroj (CZ)
GPS (DE)Heye (DE)Sorg (DE)Sheppee (UK)
China competitorsMSC (FR)SGCC (FR)Symplex (DE)

Group presentation October 2009 Page 60
Emhart Glass Glass consumption per capita
The high correlation between GNI and glass consumption fosters growth in Eastern Europe & Asia.
0
10
20
30
40
50
60
70
80
90
100
5 10 15 20 25 30 35 40
GNI PPP per capita [kUSD]
Gla
ss C
onta
iner
Pro
duct
ion
[kg/
capi
ta]
Portugal
Australia
France
Italy
Spain GermanyBulgaria
UA E
AustriaUS
Benelux+Nordic+Ireland
Switzerland
South Korea
JapanGreece
Czech
UKVenezuela
Ukraine
Mexico South Africa
PolandChile
RussiaBelarus
Rem. CISChina
India
Nigeria
West European Ø 44kg/cap
World Ø23 kg/cap
VietnamIndonesia
Phil
Egypt
Major "Old World" Wine Markets
Major Beer Producer Markets"New World" Wine and
Beer Markets
Brazil
Algeria Turkey
Tunesia
Source: World Glass File, various

Group presentation October 2009 Page 61
Emhart Glass 2008 / 2009 highlights
• Good operating performance in 2008- Sales of CHF 418 million at the record 2007 level and EBIT at CHF 35 million- Strong demand with good glass container prices- Heavy capital spending on expanding and modernising glass container
manufacturing facilities- Very high and constant capacity utilisation rate
• Development reinforced by R&D centre- Tempered glass machines on track; optimisation for industrial viability- New inspection machine replacing three previous models
• Malaysian assembly plant commissioned in early 2009• Marked slowdown in demand necessitated a 16% reduction in
manpower

Group presentation October 2009 Page 62
Emhart Glass Outlook for 2009
• Lower capital spending in the glass container industry- Glass container prices now falling after the price rise in 2008- High capacity expansion by customers in previous years- Considerable impediments to financing capital-intensive projects- Projects deferred, scaled back and cancelled
• Eastern Europe, Russia and South America harder hit than Western Europe, the Middle East and Asia
• Sales performance supported by the high proportion of spare parts business
• Further-reaching downsizing measures cannot be ruled out due to the dim market outlook for 2010
• Lower sales and reduced profitability expected