group presentation - sesa.it · conxi palmero -investor relation ... revenues for eu 15.1 mn (fy17)...
TRANSCRIPT

Group PresentationSTAR Conference
March 27th-28th, 2018

Group Overview
ICT Market Trend
Group Results as of January 31th, 2018
Historical Financials Results (Track Record 2011-2018E)
Governance and Investors Information
Annexes (Consolidated Financial Statements)
2
Alessandro Fabbroni - Chief Executive Officer
Conxi Palmero - Investor Relation Manager
Group Structure
3
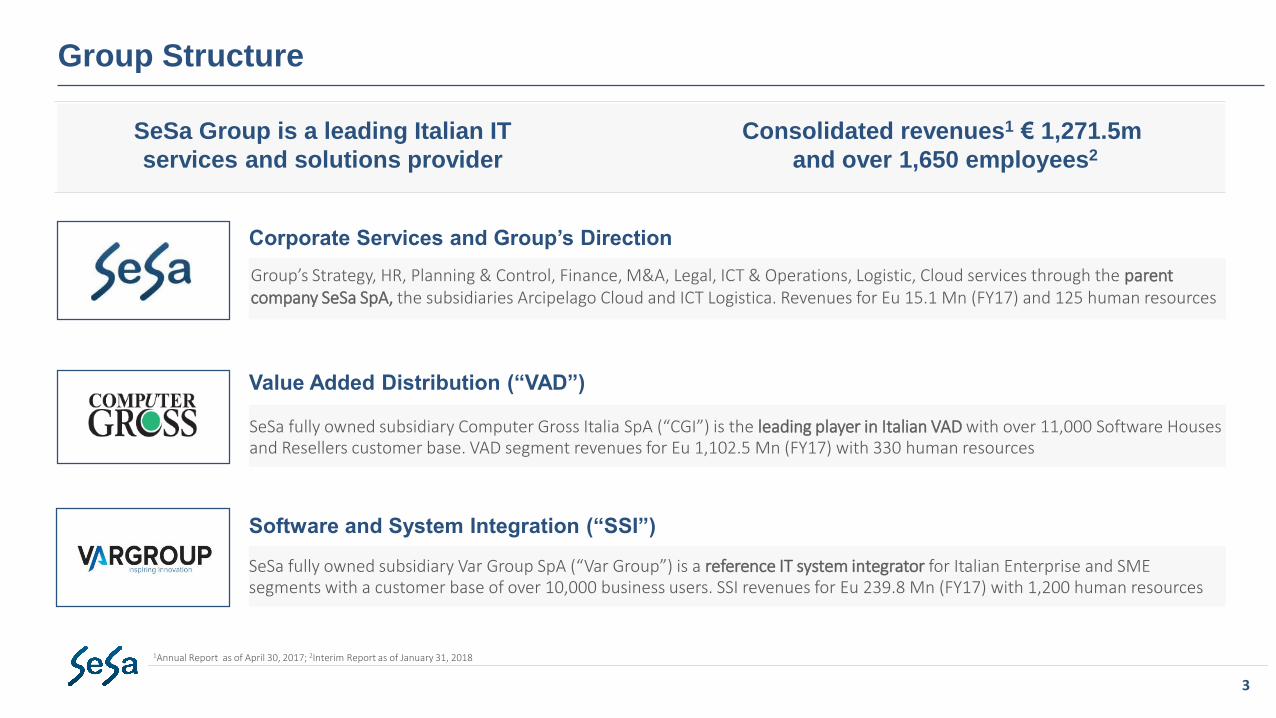
SeSa fully owned subsidiary Computer Gross Italia SpA (“CGI”) is the leading player in Italian VAD with over 11,000 Software Houses and Resellers customer base. VAD segment revenues for Eu 1,102.5 Mn (FY17) with 330 human resources
Value Added Distribution (“VAD”)
SeSa fully owned subsidiary Var Group SpA (“Var Group”) is a reference IT system integrator for Italian Enterprise and SME segments with a customer base of over 10,000 business users. SSI revenues for Eu 239.8 Mn (FY17) with 1,200 human resources
Software and System Integration (“SSI”)
Consolidated revenues1 € 1,271.5m
and over 1,650 employees2
Group’s Strategy, HR, Planning & Control, Finance, M&A, Legal, ICT & Operations, Logistic, Cloud services through the parent company SeSa SpA, the subsidiaries Arcipelago Cloud and ICT Logistica. Revenues for Eu 15.1 Mn (FY17) and 125 human resources
SeSa Group is a leading Italian IT
services and solutions provider
1Annual Report as of April 30, 2017; 2Interim Report as of January 31, 2018
Corporate Services and Group’s Direction

Business Model and Investment Case
• Continuous and sustainable growth since ’73, leveraging major IT trends and over-performing the Italian market:
- Organic: new distribution agreements and lines of business/services
- M&A: strategic acquisitions as human capital integration
Steady growth
• Italian SME & Enterprise reference player
- IT innovation partner for Italian SME & Enterprise segments, thanks to its technology integration services
- Skills and solutions on the most innovative areas of IT also thanks to Sesa Group successful external growth
Our positioning: Italian gateway to the digital technology
• Strategic partner of Global IT Vendors (“IT Titans”): Cisco, Citrix, DellEMC, HP, HPE, IBM, Lenovo, Lexmark, Microsoft, Oracle, Samsung
• Focus on value-added segments: Software Enterprise, Networking, Server, Storage, Cloud.
Strong partnerships
• Over 1,650 highly qualified peoplespecialized in the main innovative IT areas (cloud, security, digital solutions, analytics, IoT)
• Proprietary Datacenter for cloud programs and services to customers
Human Capital
4
RevenuesEu 1,271.5m
EBITDAEu 57.9 Mn
EATEu 27.1 Mn
EPSEu 1.62
CAGR 2011-2017+9.3%
CAGR 2011-2017+9.1%
CAGR 2011-2017+14.7%
CAGR 2015-2017+7.6%
Strong FinancialLong Term Track Record1
Source: 2011 – 2017 Group’s Financial Statements

Reference Strategic Partner and Service Integrator of the IT Global Vendors
5
Strategic partner and Service Integrator of the IT Global Vendors with a successful
relationship and long term partnershipswith a wide Vendors’ base
The long-term partnerships with the IT Titans represents the main driver of
Group’s organic growth and a relevant competitive entry barrier
Progressive introduction of several trend setter cloud and software enterprise
Vendors (analytics, security, collaboration)
IT Titans: the international consultancy firm Canalys identifies as IT “Titans” the following key players leading the Information Technology industry worldwide: Apple, Cisco, EMC,Google, HP, IBM, Intel, Juniper Network, Lenovo, Microsoft, Oracle, Salesforce, Samsung and SAP
…along side with ”IT Titans”

Continuous Growth Since 90s
6
mainly organic thanks to new distribution agreements
(+5.0% YoY in the nine-month period as of January 31, 2018)
Continuous growth since ’90s over-performing the reference Italian market
Over 2011-20179.3% Revenue CAGR*
FY20173.4% Revenue Growth*
* Group’s Consolidated sales and other revenues in Eu Mn; (**) Over new 20 emerging Vendors (security, analytics, cloud) Distribution Agreements over last 12M: Nutanix, Sophos, Tableau, Bitdefender, Mongo DB, Rubrik
New trend setterVendors (**)
E) Average of Analysts Consensus for the year ending April 30, 2018 (source: Banca IMI and Intermonte Sim, March 2018)
7 24 4275
148185
261
339366
402
476522
546570 579
604
665
747
812 832
948
1,060
1,2301,271
1,326(E)
1994 1995 1996 1997 1998 1999 2000 2001 2002 2003 2004 2005 2006 2007 2008 2009 2010 2011 2012 2013 2014 2015 2016 2017 2018

Leadership in Italian VAD Market
VAD Market Share by segment
Servers, Systems, Storage
51%49%
Enterprise Software Networking Packaged Services
38%62% 71%29% 65%35%
7
Computer Gross Italia Others
43.3%
12.8% 10.6%6.6%
26.7%
0%
10%
20%
30%
40%
50%
ComputerGross Italia
Tech Data Esprinet Ingram MicroItalia
Others
2017 VAD Market ShareCGI is leader in Italian VAD market, with a 43.3% market share in 2017*. Total
VAD revenues and other income of Eu 1,102.5 Mn as of April 30, 2017 (+1.9% YoY,
9% CAGR 2011-2017)
Customer base of over 11,000 Software Houses, System Integrators and Resellers
CGI is the largest Italian distributor in the value-added segments (Storage,
Software Enterprise, Networking, Server and IT Services) with 330 people (high
skilled on Vendor solutions), based on a successful relationship with 100 major
Vendors (track record without termination of any relevant Vendor agreement
over the past 10 years) and 15 local branches over Italian territory
* Source Sirmi March 2018

IT Strategic Partner for Italian SME & Enterprise
8
* SSI breakdown of revenues per Business Unit (FY as of April 30, 2018E)
VAR Group is a leading Italian Software and System Integration (“SSI”) player for Enterprise & SME segments (representing 32% of total Italian IT market with, Eu 6.0 Bn in 2018E – source Sirmi)
SSI revenues reached Eu 239.8 Mn as of April 30, 2017. Over 10,000 SMEs and Enterprises customer base, operating in the major Italian Industries: Automotive, Fashion, Food, Furniture, Mechanics, Paper, Retail, Wine
IT innovation partner for Italian SME & Enterprise thanks to its technical skills and solutions (1,200 qualified human resources), enhanced by a capillary coverage of Italian territory (main Italian industrial districts)
Full offering of integrated IT solutions to customers under 4 main business units: Business Technology Solutions (40% of SSI revenues), Managed and Security Services (20% of SSI revenues), ERP & Industry solutions (35% of SSI revenues) and Digital Solutions (5% of SSI revenues). Growing focus on Managed Services and ERP & Industry Solutions
Full offering of Cloud services to customers (SaaS, PaaS, IaaS), trough the EmpoliHeadquarters datacenter. Bespoke finance and technical solutions to provide customers technology as a service
R&D focusing on most innovative areas of IT to provide customers with new integrated applications (Artificial Intelligence, IOT, Wearable, Augmented Virtual Reality, 3D Printing)
BUSINESS TECHNOLOGY
SOLUTIONS
40%*
MANAGED & SECURITY
SERVICES
20%*
ERP & INDUSTRY SOLUTIONS
35%*
DIGITAL SOLUTIONS
5%*
• Technology Hardware and Software Integration
• Maintenance, IT Services & Solutions
• Cloud Saas, Iaas, Business Continuity• Datacenter monitoring, NOC• SOC, Security & Cyber Risk Services
• ERP Solutions, International (SAP, Microsoft Dynamics) and Own Proprietary
• Industry Solutions for Italian SME’s districts
• Digital Marketing & Communications• Digital Business and Technology
Integration• Digital Transformation• Data Analytics
Human Capital and Competitive Advantages
9
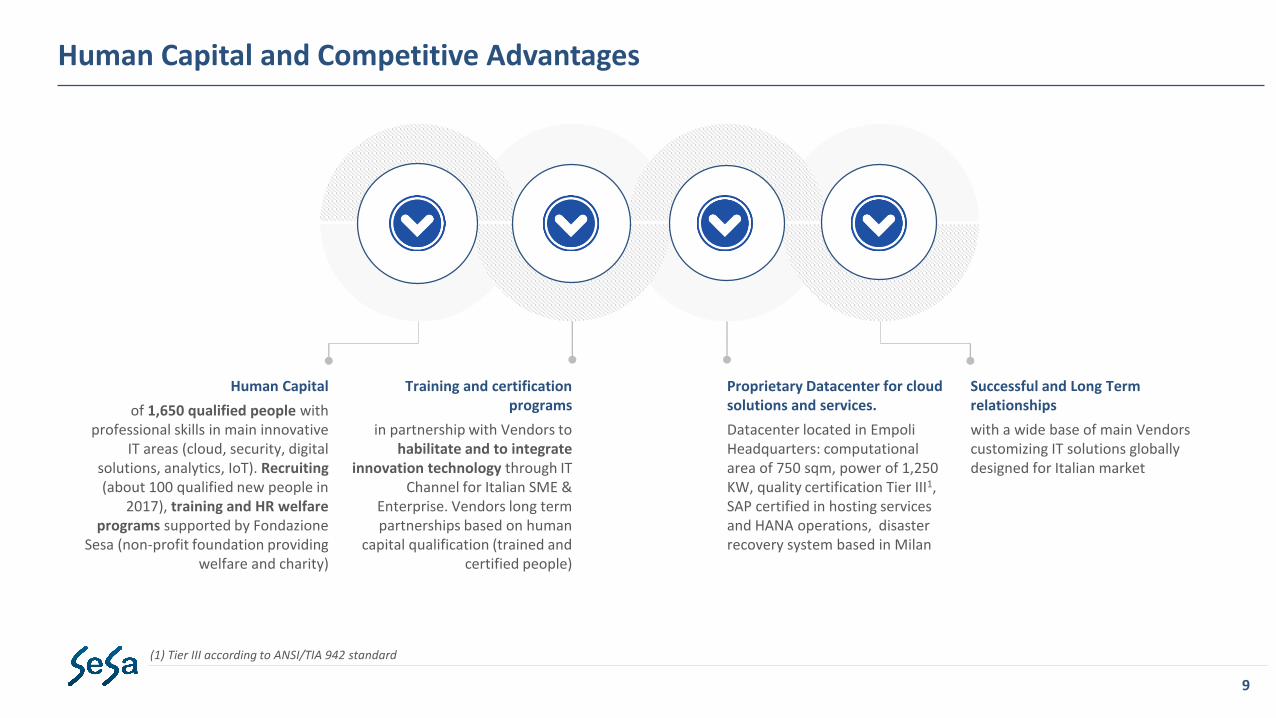
(1) Tier III according to ANSI/TIA 942 standard
Human Capital
of 1,650 qualified people with professional skills in main innovative
IT areas (cloud, security, digital solutions, analytics, IoT). Recruiting (about 100 qualified new people in
2017), training and HR welfare programs supported by Fondazione
Sesa (non-profit foundation providing welfare and charity)
Training and certification programs
in partnership with Vendors to habilitate and to integrate
innovation technology through IT Channel for Italian SME &
Enterprise. Vendors long term partnerships based on human
capital qualification (trained and certified people)
Proprietary Datacenter for cloud solutions and services.
Datacenter located in EmpoliHeadquarters: computational area of 750 sqm, power of 1,250 KW, quality certification Tier III1, SAP certified in hosting services and HANA operations, disaster recovery system based in Milan
Successful and Long Term relationships
with a wide base of main Vendors customizing IT solutions globally designed for Italian market

Annual Financial Track Record 2011-2017
10
Source: 2011 – 2017 Group’s Financial Statement
Revenues
2011-17+9.3%
Group Revenues and Other Income
Eu 1.271.5 Mn
(+3.4% YoY)
Ebitda
2011-17+9.1% up by 16 bp YoY
Group Ebitda
Eu 57.9 Mn
(+7.2% YoY)
Ebitda Margin
4.55%
Net Profit
2011-17+14.7% up by 9 bp YoY
Group Net Profit After Taxes before minority interest
Eu 27.1 Mn
EAT margin
2.13%
EPS
2015-2017+7.6%
EPS
Eu 1.62
+4.5% YoY
CA
GR

Group Overview
ICT Market Trend
Group Results as of January 31th, 2018
Historical Financials Results (Track Record 2011-2018E)
Governance and Investors Information
Annexes (Consolidated Financial Statements)
11
Alessandro Fabbroni - Chief Executive Officer
Conxi Palmero - Investor Relation Manager

Italian IT Market 2013-2019E
12
Italian IT market grew by 1.6% in 2016 and by 1.9% in 2017, after an average 3% annual decline trend over 2013-2015 period
Total market value equal to Eu 18.8 Bn in 2017, with significant contribution (32%) by SME and Enterprise segments
Cloud and Managed Services segments (where SeSaGroup operates) over-perform Italian IT average market trend:
• Cloud Computing expected to grow by a 20% average annual rate, over the 2016-18 period
• Managed Services expected to grow over a 6%average annual rate, over 2016-18 period
6,593 6,427 5,885 6,006 6,044 6,087 6,131
3,951 3,8803,857 3,847 3,832 3,819 3,816
3,710 3,5573,474 3,423 3,436 3,470 3,510
4,7644,750
4,970 5,192 5,503 5,909 6,352
0
2000
4000
6000
8000
10000
12000
14000
16000
18000
20000
2 0 1 3 2 0 1 4 2 0 1 5 2 0 1 6 2 0 1 7 E 2 0 1 8 E 2 0 1 9 E
Hardware Software Project Services Management Services
Source Sirmi, March 2018
-4.1%+1.6% +1.9%
+2.5%19,019
18,61618,188 18,470
18,81719,288 19,812
-2.1% -2.3%
+2.7%
IT Italian market (2016-2019E) in Eu MnItalian IT market trends
CAGR 2015-2019E 2.4%

Global ICT market trend 2015-2021E
13
(1) Source: Gartner Market Databook
Global spending on Security Solutions embracing IT Services, Enterprise Software and Data CenterInfrastructure expected to accelerate over the next years, achieving a 4.8% CAGR in 2015-2021 period, with total revenues of nearly USD 105 Bn (1)
IT Managed Services expected to growth by an average 5% annual rate over the 2018-2021 period
Enterprise Software represents the most dynamic area of global ICT market (over 8% CAGR over the 2016-2021 period) driven by the innovation in security, analytics and data management areas. New vendors will significantly contribute to the segment growth
Cloud Computing spending expected to grow at over 6 times the average rate of IT from 2015 through 2020 (source IDC, 2017)
Global IT market trends Global IT market (2015-2021) in USD Bn
171 170 -0,4% 178 +4.4% 179 +0.2% 179 -0.2% 178 -0.3% 178 -0.2%
310326
5.3%
3558.9%
3899.5%
4218.4%
4558.1%
4917.8%
646631-2.4
6675.7%
7045.6%
7100.9%
7130.4%
7150.3%
866894
3.2%
9334.3%
9855.5%
1,0304.6%
1,0794.7%
1,1314.8%
1,3941,376-1.3%
1,3931.3%
1,4272.4%
1,4431.1%
1,4631.4%
1,4881.7%
0
500
1000
1500
2000
2500
3000
3500
4000
4500
2015 2016 2017 2018 2019 2020 2021
Data Center Systems Enterprise Software Devices IT Services Communications Services
CAGR 2016-2021E 3.3%
3,387 3,3983,527
3,6833,784
3,8894,003
+0.3%
+4.5%+3.8%
+2.8%+3.0%
+2.7%

Focus on IT market trends
14
Global IT Technology Evolution Distribution Role System Integration Role
GLOBAL KEY MARKET TRENDS
SESA GROUP
• Global Major Vendors business model consolidation
• New emerging segments of IT (Cloud, Security, Collaboration, IoT) with a fragmented landscape: trend setter Vendors and new comers (source GTDC, London January 2018)
• Vendors require higher specialized distribution to leverage the new trends of IT (skills, services portfolio and channel enablement capability)
• Vendors require the recruiting of new types of SPs1 (MSPs2, CMSPs3, ISVs4) and their ecosystems that represent the new IT trends adopters
• Customers IT spending driven by new ITtrends: digital solutions, analytics,security, cloud and IoT as key points of ITcorporate innovation
• Cloud adoption and as a service modelfrom capital expense to operating expense
• Enforcing the partnership with major Vendors (datacenter, enterprise software, networking) habilitating the new IT trends for Italian SME and Enterprise, through a wider solutions portfolio
• Scouting of new Vendors in the emerging IT segments (cloud, security, analytics, IoT): over 20 new Vendors distribution agreements over the last 12 Months
• To consolidate market share on VAD by strengthening the partnership with major Global Vendors
• To penetrate in the IT emerging segments with new Vendors agreements focused on the innovative IT trends (cloud & security)
• To develop a new cloud market place and to recruit and educate new qualified human resources
• Full offering of integrated IT solutions (enlarging managed & security services, ERP & Industry Solutions and Digital Solutions)
• Enabling customers on embracing new technologies (education and R&D)
• Offering of Cloud services and as a services applications to customers.
1SPs: Service Providers; 2MSPs: Managed Service Providers; 3CMSPs: Cloud Managed Service Providers; 4ISVs: Independent SW Vendors

Group Overview
ICT Market Trend
Group Results as of January 31th, 2018
Historical Financials Results (Track Record 2011-2018E)
Governance and Investors Information
Annexes (Consolidated Financial Statements)
15
Alessandro Fabbroni - Chief Executive Officer
Conxi Palmero - Investor Relation Manager

0
2
4
6
8
10
12
14
16
18
20
22
24
Jan 31 2017 Jan 31 2018
16
EBITDA Eu Mn
Group Interim Results (9M) as of January 31, 2018
Group Revenues Eu Mn (*)
+5.0% +8.3%
Net profit after taxes Eu Mn (**)
+11.2%
20.3
22.6
(*) Sales and other revenues as of January 31, 2018 (9-Months period) (**) Net profit before minority interests
826.5
173.2
0
200
400
600
800
1000
Jan 31 2017 Jan 31 2018
VAD SSI
0
5
10
15
20
25
30
35
40
45
50
Jan 31 2017 Jan 31 2018
220.2
833.3
4.48%
4.62%
2.15%
2.28%
945.0992.6
42.4
45.9
Revenues by Segment
Jan 312017
Jan 312018
EBITDA by Segment
Jan 312017
Jan 312018
75.8%
22.2%
2.0%
81.8%
17.1%
1.1%
VAD SSI Corporate
78.2%
20.7%
1.1%
63.3%
33.9%
2.8%
VAD SSI Corporate

Segment Informations Three – months period as of Jan 2018
In Euro Mn VAD SSI Corporate Group*
Total Revenues and Other Income
363.4 89.3 4.3 427.7
Change YoY 6.3% 26.2% 7.0% 9.7%
Gross Margin 30.7 47.1 4.2 74.3
Opex (17.2) (40.9) (3.9) (54.2)
Ebitda 13.5 6.2 0.4 20.0
Ebitda Margin 3.72% 6.96% 8.26% 4.69%
Change YoY 4.7% 43.9% -56.0% 11.2%
D&A (0.7) (1.1) (0.0) (1.8)
PPA-related amort. (0.1) (0.5) (0.0) (0.5)
Provisions** (1.4) (0.8) (0.5) (2.7)
Ebit 11.3 3.9 (0.2) 15.0
Ebit Margin 3.11% 4.39% -4.86% 3.50%
Change YoY -2.0% 37.7% -149% 1.2%
Profit form companies valued at equity
0.4 (0.4) - 0.0
Net Financial Charges
0.0 (0.4) (0.0) (0.3)
Income Taxes (3.3) (1.3) 0.0 (4.5)
Net Profit 8.5 1.9 (0.2) 10.2
Eat Margin 2.33% 2.16% -4.28% 2.38%
Change YoY 17.6% 17.7% -157% 11.2%
Group Net profit 8.5 1.0 (0.2) 9.3
Change YoY 18.7% 4.8% -154% 9.6%
17
3-Month (Q3) as of January 31, 2018 YoY
9M 2018 results: consolidated revenues up by 5.0% YoY, Ebitda up by 8.3%, EAT up by 11.2%; strong contribution of SSI Segment (revenues up by 27.2%, Ebitda up by 65.4%, EAT up by 129%) thanks to revenues development in the valued added areas of business (managed & security services, digital consulting, ERP software solutions)
Q3 2018 results: consolidated revenues up by 9.7% YoY, Ebitda up by 11.2%, EAT up by 11.2%; positive contribution of VAD segment (revenues up by 6.3% YoY, Ebitda up by 4.7%, EAT up by 17.6%) that reported a significant upturn compared to the First Half of the Fiscal Year
9-Month as of January 31, 2018 YoY
Three – months period as of Jan 2017
VAD SSI Corporate Group*
341.9 70.7 4.0 389.8
26.1 35.9 3.9 61.4
(13.2) (31.5) (3.1) (43.3)
12.9 4.3 0.8 18.0
3.77% 6.11% 20.06% 4.62%
(0.6) (0.8) (0.0) (1.4)
(0.0) (0.4) (0.0) (0.4)
(0.7) (0.3) (0.4) (1.4)
11.5 2.8 0.4 14.8
3.37% 4.02% 10.65% 3.79%
- (0.1) 0.0 (0.1)
(1.2) (0.1) 0.0 (1.3)
(3.2) (1.0) (0.1) (4.3)
7.2 1.6 0.3 9.1
2.10% 2.32% 8.09% 2.35%
7.2 1.0 0.3 8.4
Segment Informations Nine – months period as of Jan 31 2018
In Euro Mn VAD SSI Corporate Group*
Total Revenues and Other Income
833.3 220.2 11.9 992.6
Change YoY 0.8% 27.2% 9.4% 5.0%
Gross Margin 68.5 125.2 11.6 185.6
Opex (39.4) (109.6) (10.3) (139.7)
Ebitda 29.1 15.6 1.3 45.9
Ebitda Margin 3.49% 7.07% 10.68% 4.62%
Change YoY -9.6% 65.4% 53.7% 8.3%
D&A (2.1) (2.8) (0.1) (5.0)
PPA-related amort. (0.1) (1.4) (0.0) (1.5)
Provisions** (2.9) (1.3) (0.9) (5.1)
Ebit 24.0 10.1 0.2 34.3
Ebit Margin 2.88% 4.60% 2.07% 3.46%
Change YoY -13.3% 83.4% -39.0% 2.3%
Profit form companies valued at equity
0.8 (0.3) 0.0 0.5
Net Financial Charges
(1.5) (0.7) 0.0 (2.3)
Income Taxes (6.4) (3.3) (0.3) (10.0)
Net Profit 16.8 5.8 0.0 22.6
Eat Margin 2.02% 2.63% 0.13% 2.28%
Change YoY -4.8% 129% -90.6% 11.2%
Group Net profit 16.8 3.3 0.0 20.1
Change YoY -4.5% 162% -80.0% 5.6%
Nine – months period as of Jan 31 2017
VAD SSI Corporate Group*
826.5 173.2 10.9 945.0
65.9 93.0 10.4 157.2
(33.7) (83.6) (9.5) (114.8)
32.2 9.4 0.8 42.4
3.89% 5.44% 7.60% 4.48%
(1.7) (2.0) (0.1) (3.8)
(0.0) (1.1) (0.0) (1.1)
(2.8) (0.8) (0.4) (3.9)
27.7 5.5 0.4 33.6
3.35% 3.19% 3.72% 3.55%
0.0 0.0 0.0 0.1
(2.2) (0.9) 0.0 (3.1)
(7.8) (2.2) (0.3) (10.3)
17.7 2.5 0.2 20.3
2.14% 1.46% 1.47% 2.15%
17.6 1.3 0.2 19.0
Group Interim Results (9M) as of January 31, 2018 by segment
(*) Group’s results gross of intercompany eliminations (**) Included non monetary items

Group Financial Results (9M) as of January 31, 2018
18
Group Net Financial Position (NFP) (Eu Mn)
(*) Group Equity including minority interests, Interim Report as of January 31 2018 (**) Last 12 Months Rolling period from Feb 1, 2017 to Jan 31, 2018
Consolidated NFP as of January 31, 2018 equal to Eu20.6 Mn (net debt) improved by Eu 8.1 Mn (up 28.1%) YoY compared to January 31, 2017
Eu 8.1 Mn annual improvement in NFP driven by strong operating cash flow** (Eu 61 Mn Ebitda) and higher NWC efficiency (Eu 4.6 Mn), net of Capex over the period (eu 14.9 Mninvestment in infrastructure and eu 17.3 Mn in company acquisitions) and a Eu 9.5 Mn dividend distribution
NFP Jan 312017
EBITDA NWC INTEREST M&A DIVIDEND TAX CAPEX TREASURY OTHERS NFP Jan 312018
(1.4)10.5
14.9 0.6 20.6
3.8
(61.0) (4.6)
28.7
9.5
17.3
Cas
h F
low
Gen
era
tio
n (
Eu M
n)
+28.1%
28.7
0
5
10
15
20
25
30
Jan 31 2017 Jan 31 2018
20.6
Group Shareholders Equity (Eu Mn)*
0
50
100
150
200
Jan 31 2017 Jan 31 2018
+8.1%
192.8 208.5

Group External Growth
19
Target Overview Investment rationale
Group 2015-2018 Main Acquisitions
VA
DSS
I
Accadis (2016) 1st Italian Hitachi HDS VAD Distributor
ICOS (2017) 6th Italian VAD Distributor
Additional Customers (CSP, MSP, MCSP, SI) & Vendors
Focus on Enterprise Software, Cloud Computing and Datacenter Solutions
Financial Highlights
Accadis: additional Revenues~ Eu 15 Mn
Ebitda expected~ Eu 0.5 Mn
ICOS:additional Revenues ~ Eu 50 Mn
Ebitda Eu 1.5 Mn
Tech Value S.p.A (Jan 2018)
Globo Informatica (Mar 2017)
Yarix (Nov 2016)
ERP & Industry Solutions: BMS (Jul2015), Apra (Jul 2015), Sailing (Jul
2016), Var Prime (Nov 2016)
Industry 4.0 software and services
Digital Consulting SVCS
Security services and consulting
ERP & lndustry solutions to reach market leadership on SME and lower Enterprise
Revenues ~ Eu 20 Mn, Ebitda ~ Eu 2.0 Mn
Revenues ~ Eu 6 Mn, Ebitda~ Eu 1.2 Mn
Revenues~ Eu 5 Mn, Ebitda ~ Eu 0.6 Mn
Revenues~ Eu 45 Mn, Ebitda ~ Eu 6 Mn
Ebitda Margin of the acquired companies between 10% and 15%
External Growth to support Group’s strategy aiming at developing service solutions and valued-added areas of business
Long-term Commitment of management team of the acquired companies, through Earn Out incentive plans in order to accelerate the long term improvement of the KPIs of the business
Last 2 significant acquisitions:
- 51% stake of ICOS SpA (Nov 2017), a VAD with Eu 50 Mn of annual revenues and Ebitda for Eu 1.5 Mn
- 51% stake of Tech-Value SpA (Jan 2018), a company focused on PLM software and solutions to engineering intensive SMEs (1,000 Italian SME customers) with annual revenues of Eu 20 Mn and Ebitda for Eu 2 Mn

Group Overview
ICT Market Trend
Group Results as of January 31th, 2018
Historical Financials Results (Track Record 2011-2018E)
Governance and Investors Information
Annexes (Consolidated Financial Statements)
20
Alessandro Fabbroni - Chief Executive Officer
Conxi Palmero - Investor Relation Manager

11.9
17.2
20.621.7* 22.6
25.127.1
29.2(E)
5
10
15
20
25
30
Apr 302011
Apr 302012
Apr 302013
Apr 302014
Apr 302015
Apr 302016
Apr 302017
Apr 302018E
34.4
41.344.2
49.5* 51.654.0
57.963.5(E)
5
15
25
35
45
55
65
Apr 302011
Apr 302012
Apr 302013
Apr 302014
Apr 302015
Apr 302016
Apr 302017
Apr 302018E
25.3
34.7 35.0
39.9*41.4
43.7 44.848.1(E)
5
10
15
20
25
30
35
40
45
50
Apr 30 2011
Apr 30 2012
Apr 30 2013
Apr 30 2014
Apr 30 2015
Apr 30 2016
Apr 30 2017
Apr 30 2018E
Group Annual Economic Results 2011-2018E
21
(*) 2014 results adjusted for non-recurring MTA listing costs (746k gross of taxes) (**) Sales and other revenues; (***) Net Profit before the minority interests E) Average of Analysts Consensus for the year ending April 30, 2018(source: Banca IMI, Intermonte Sim, March 2018)
+4.3%YoY(E)
+7.5%YoY(E)
+9.7% YoY(E)
+7.8% YoY(E)
Revenues ** (Eu Mn)
747 812 832948*
1,060
1,2301,271
1,326(E)
50
250
450
650
850
1050
1250
Apr 302011
Apr 302012
Apr 302013
Apr 302014
Apr 302015
Apr 302016
Apr 302017
Apr 302018E
CAGR + 8.5%
EBIT (Eu Mn, % on revenues)
3.6%
4.4%4.9%
5.2%
5.3%
5.1%
4.6%
4.8%
4.6%
3.6%3.9%
3.8%
4.2%
4.3%
3.4%
3.5%
1.6%
2.1%
2.5%
2.3%2.1%
2.0%
2.2%
2.1%
CAGR + 9.2%
CAGR + 9.6% CAGR + 13.7%
EBITDA (Eu Mn, % on revenues)
Net profit *** (Eu Mn, % on revenues)
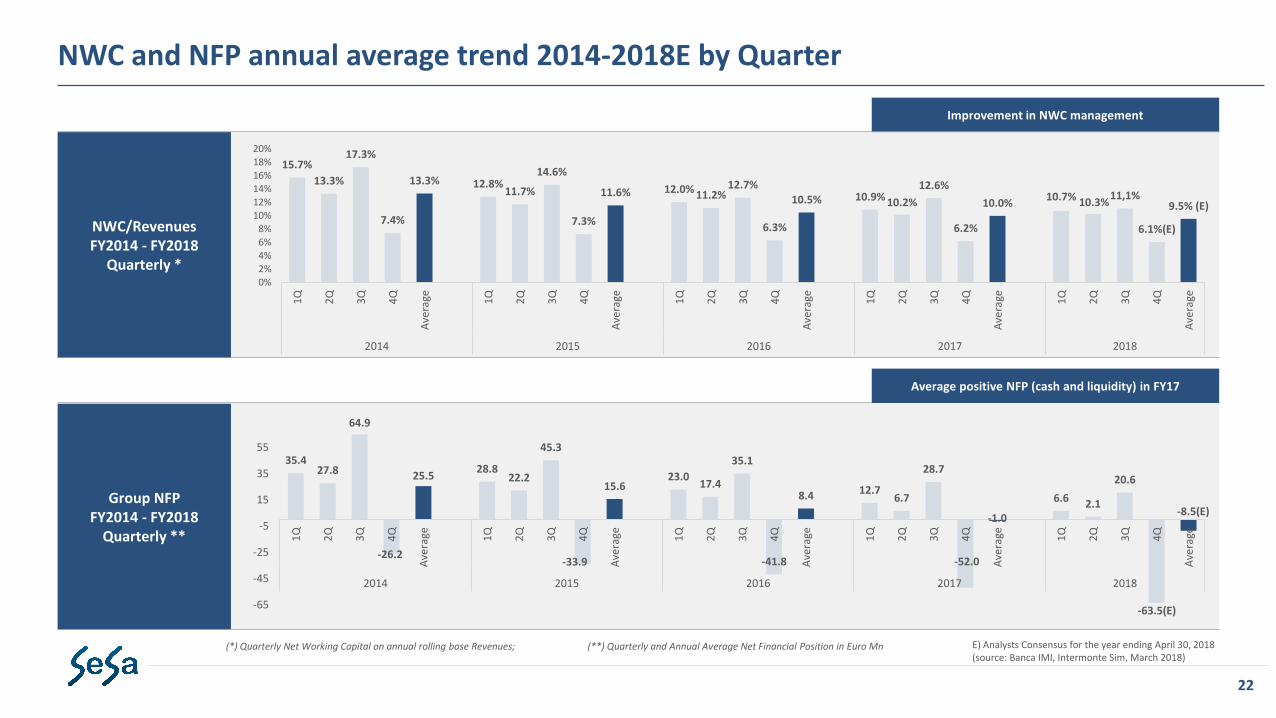
NWC and NFP annual average trend 2014-2018E by Quarter
22
Improvement in NWC management
NWC/RevenuesFY2014 - FY2018
Quarterly *
Group NFP FY2014 - FY2018
Quarterly **
(*) Quarterly Net Working Capital on annual rolling base Revenues; (**) Quarterly and Annual Average Net Financial Position in Euro Mn
Average positive NFP (cash and liquidity) in FY17
15.7%
13.3%
17.3%
7.4%
13.3% 12.8%11.7%
14.6%
7.3%
11.6% 12.0% 11.2%12.7%
6.3%
10.5% 10.9% 10.2%
12.6%
6.2%
10.0%10.7% 10.3%
11,1%
6.1%(E)
9.5% (E)
0%
2%4%
6%8%
10%
12%14%
16%18%20%
1Q
2Q
3Q
4Q
Ave
rage 1Q
2Q
3Q
4Q
Ave
rage 1Q
2Q
3Q
4Q
Ave
rage 1Q
2Q
3Q
4Q
Ave
rage 1Q
2Q
3Q
4Q
Ave
rage
2014 2015 2016 2017 2018
35.427.8
64.9
-26.2
25.528.8
22.2
45.3
-33.9
15.623.0
17.4
35.1
-41.8
8.4 12.76.7
28.7
-52.0
-1.0
6.6 2.1
20.6
-63.5(E)
-8.5(E)
-65
-45
-25
-5
15
35
55
1Q
2Q
3Q
4Q
Ave
rage 1Q
2Q
3Q
4Q
Ave
rage 1Q
2Q
3Q
4Q
Ave
rage 1Q
2Q
3Q
4Q
Ave
rage 1Q
2Q
3Q
4Q
Ave
rage
2014 2015 2016 2017 2018
E) Analysts Consensus for the year ending April 30, 2018 (source: Banca IMI, Intermonte Sim, March 2018)

Group Annual Financial Results 2011-2018E
23
(*) Group’s Equity before the minority interestsE) Analysts Consensus for the year ending April 30, 2018
(source: Banca IMI, Intermonte Sim, March 2018)
53.5
4.2
(20.7)(26.2)
(33.9)
(41.8)
(51.9)
(63.5)(E)-70
-50
-30
-10
10
30
50
70
Apr 302011
Apr 302012
Apr 302013
Apr 302014
Apr 302015
Apr 302016
Apr 302017
Apr 302018E
Net Financial Position (Eu Mn)
Strong Free Cash Flow Generation
Feb 2013 IPO
67.8
84.0
129.9
143.9
160.4
179.4
199.0
221.7(E)
5
55
105
155
205
Apr 302011
Apr 302012
Apr 302013
Apr 302014
Apr 302015
Apr 302016
Apr 302017
Apr 302018E
Group Shareholders Equity* (Eu Mn)
CAGR + 18.4%
Net Financial Position (Cash/Net Liquidity) equal to Eu 51.9 Mn as of April 30, 2017 (up Eu 10.1 Mn compared to April 30, 2016)
Eu 8.7 Mn Annual Dividend paid on September 2017 (Eu 7.4 Mn paid on September 2016) based on a 32% pay out ratio of Consolidated Net Profit after taxes (30% pay out ratio as of April 30, 2016)

Group Overview
ICT Market Trend
Group Results as of January 31th, 2018
Historical Financials Results (Track Record 2011-2018E)
Governance and Investors Information
Annexes (Consolidated Financial Statements)
24
Alessandro Fabbroni - Chief Executive Officer
Conxi Palmero - Investor Relation Manager

16.1%26.9%
51.2%
73.4%
151.2%
173.5%
18.5% 19.6%
35.7%22.4%
41.5%47.0%
18.1%
20.6% 33.7%
19.9%
36.2%42.5%
0%
20%
40%
60%
80%
100%
120%
140%
160%
180%
200%
IPO 2013 2014 2015 2016 2017 16.03.2018
SeSa SpA FTSE Italia All-Shares FTSE MIB
SeSa Stock Trend IndexSesa (Euro) 2015 2016 2017 2018
Stock Market (1) MTA MTA - Star MTA - Star MTA - Star
Stock market price (Jan 31 of every Fiscal Year) 13.28 14.42 18.68 26.80
DPS - Dividend per share (*) 0.45 0.45 0.48 0.56
Total Dividend (Eu Mn) 6.984 6.964 7.408 8.677
Pay Out Ratio (2) 32% 31% 30% 32%
Outstanding Shares (Jan 31 of every Fiscal Year) (Mn) 14.85 15.65 15.49 15.49
Market Capitaliz. (Jan 31 of every Fiscal Year) (Mn) 197.2 225.7 289.4 415.3
Market to Book Value (**) 1.3 1.3 1.5 2.0
Dividend Yield (as of January 31) (***) 3.4% 3.1% 2.6% 2.1%
2014 2015 2016 2017
EPS as of April 30 (****) 1.48 1.40 1.55 1.62
EPS diluted as of April 30 (*****) 1.40 1.39 1.54 1.62
1) Listing on AIM market following the merger with Made In Italy 1 SpA (SPAC under Italian law listed on AIM) completed on February 1, 2013. Listing on MTA Stock Exchange on October 23, 2013. Transition on MTA STAR segment on February 16 2015
2) Dividend/Consolidated Net Profit after taxes as of April 30 of every Fiscal Year
Key Investor Information
25
*) Dividend paid in the following year counting on the current year **) Market Capitalisation as of January 31 of every Year/Consolidated Group equity***) Dividend per share/market value per share as of January 31 of every Year****) Consolidated net profit/average number of ordinary shares net of treasury shares in portfolio*****) Consolidated net profit/average number of ordinary shares net of treasury shares in portfolio and inclusive of impact resulting from Stock Options/Grants Plans, warrants and/or convertible bonds. At the time of writing there are no warrants nor any kind of convertible bonds outstanding
Bloomberg (March 16th, 2018)

Shareholders N. of shares % of the total share capital
ITH SpA 8,183,323 52.814%
Franklin Templeton 753,000 4.860%
Norges Bank 464,208 2.996%
Amiral Gestion 463,037 2.988%
ITH S.p.A.52.814%
Market36.092%
Franklin Templeton
4.860%
NorgesBank
2.996%
AmiralGestion2.988%
Treasury Shares 0.250%
Shareholders & Management Team
26
SeSa shares are listed in the MTA Italian Stock Exchange since October 23, 2013 (transition on MTA STAR Segment on February 16, 2015)
Total 15,494,590 outstanding ordinary shares
Main Shareholders (according to Consob 120 Annex)
The share capital of the holding company ITH SpA includes the Group’s Founders and Management Team Group’s Management Team with industry and business development experience:
• Chairman Paolo Castellacci, 70 years old, Sesa Group Founder • Chief Executive Officer Alessandro Fabbroni, 45 years old, joined Sesa
Group in 2008 • Vice Chairman Giovanni Moriani, 60 years old, joined Sesa Group in 1980 • Vice Chairman Moreno Gaini, 55 years old, joined Sesa Group in 1982

STAR segment governance requirements
27
Sesa is listed in the MTA STAR segment of Borsa Italiana(Italian Stock Exchange) dedicated to mid-size companies
with a capitalization lower than Euro 1.0 Bn, which voluntarily adhere to and comply with several
requirements:
High transparency and high disclosure requirements;
High liquidity (free float of minimum 35%);
Corporate Governance in line with international standards
Sesa is fully compliant with the Code of self-discipline (Corporate Governance Code). SeSaBoard of Directors consists of 8 members of which 4 Executive Directors, 3 non executive Independent Directors, 1 non executive Director
Main STAR “status” requirements
Interim financial statements available to the public within 45 days from the quarter. Semi annual interim financial report by 60 day from the end of the 1 half
1
Favorable auditor’s report on their latest separate and consolidated annual financial statements
2
Consolidated annual financial statements not challenged by Consob3
Bi-lingual publication on the website (Italian and English) post interim financial statements, annual financial reports, half-year financial reports, consolidated annual financial statements (together with any other information specified by Borsa Italiana in the Instructions)
4
Mandatory presence of a qualified Investor Relations Manager and a “specialist” (eg. an intermediary charged (a) to display continuously bids and asks subject to certain limits, (b) produce researches on the issuer and (C) organize meetings between the management and professional investors)
5
Adoption of the organizational, operational and control models provided by art.6 of Legislative Decree 231/2011
6
Application of a Corporate Governance Code in relation to: (i) composition of the Board of Directors, (ii) the role and functions of non-executive and independent Directors, (iii) the creation and working of internal committees of the Board of Directors, (iv) remuneration of Directors, (v) appointment of a control and risk committee
7

Group Overview
ICT Market Trend
Group Results as of January 31th, 2018
Historical Financials Results (Track Record 2011-2018E)
Governance and Investors Information
Annexes (Consolidated Financial Statements)
28
Annexes - Consolidated Financial Statements
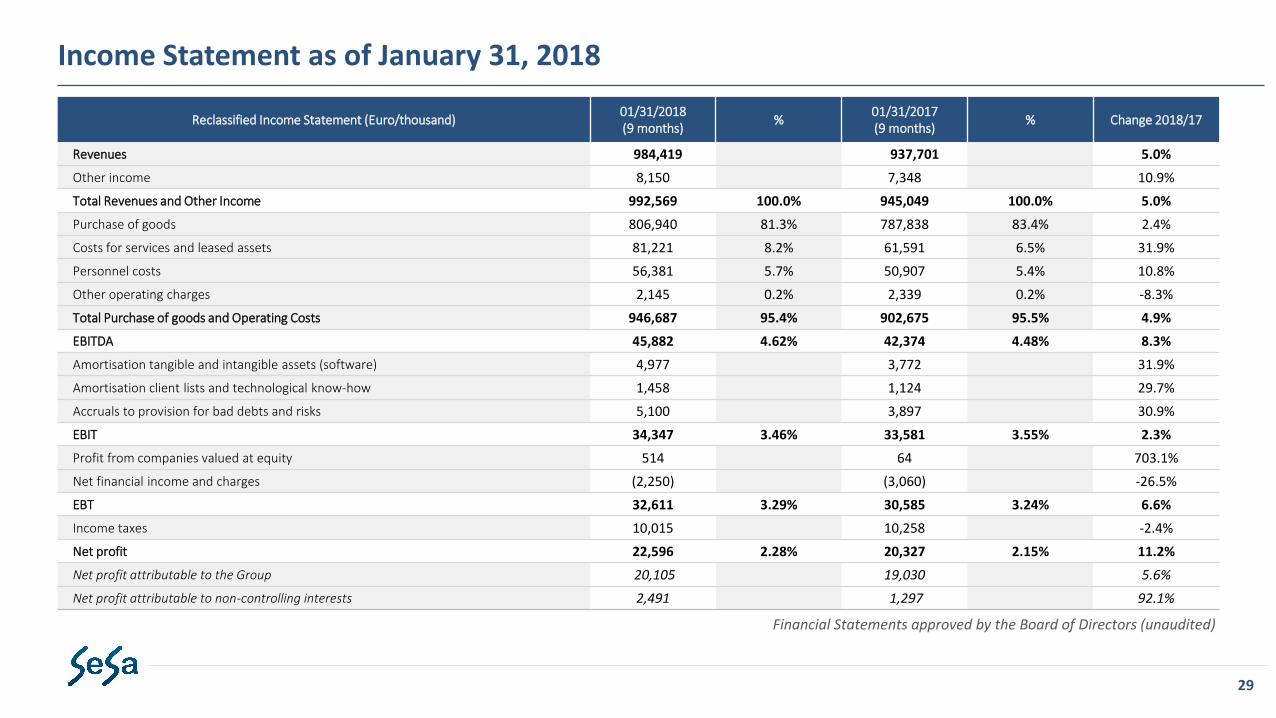
Reclassified Income Statement (Euro/thousand)01/31/2018(9 months)
%01/31/2017(9 months)
% Change 2018/17
Revenues 984,419 937,701 5.0%
Other income 8,150 7,348 10.9%
Total Revenues and Other Income 992,569 100.0% 945,049 100.0% 5.0%
Purchase of goods 806,940 81.3% 787,838 83.4% 2.4%
Costs for services and leased assets 81,221 8.2% 61,591 6.5% 31.9%
Personnel costs 56,381 5.7% 50,907 5.4% 10.8%
Other operating charges 2,145 0.2% 2,339 0.2% -8.3%
Total Purchase of goods and Operating Costs 946,687 95.4% 902,675 95.5% 4.9%
EBITDA 45,882 4.62% 42,374 4.48% 8.3%
Amortisation tangible and intangible assets (software) 4,977 3,772 31.9%
Amortisation client lists and technological know-how 1,458 1,124 29.7%
Accruals to provision for bad debts and risks 5,100 3,897 30.9%
EBIT 34,347 3.46% 33,581 3.55% 2.3%
Profit from companies valued at equity 514 64 703.1%
Net financial income and charges (2,250) (3,060) -26.5%
EBT 32,611 3.29% 30,585 3.24% 6.6%
Income taxes 10,015 10,258 -2.4%
Net profit 22,596 2.28% 20,327 2.15% 11.2%
Net profit attributable to the Group 20,105 19,030 5.6%
Net profit attributable to non-controlling interests 2,491 1,297 92.1%
Financial Statements approved by the Board of Directors (unaudited)
Income Statement as of January 31, 2018
29
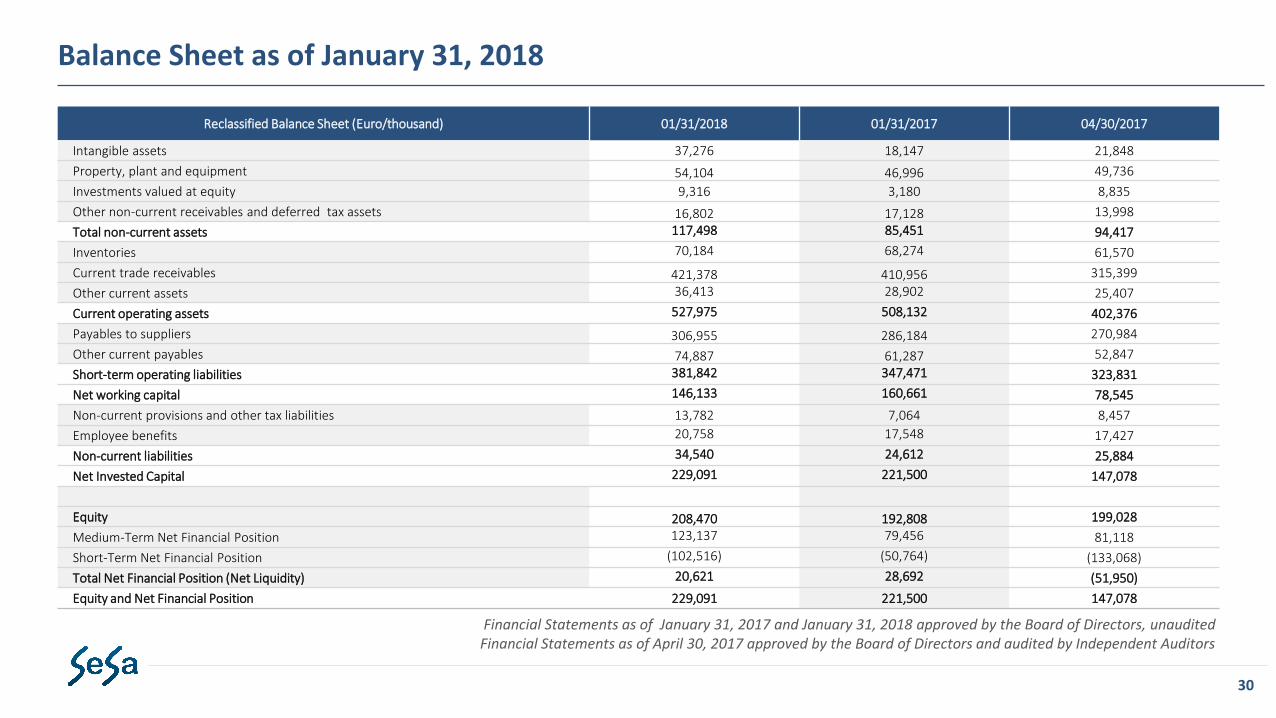
Reclassified Balance Sheet (Euro/thousand) 01/31/2018 01/31/2017 04/30/2017
Intangible assets 37,276 18,147 21,848
Property, plant and equipment 54,104 46,996 49,736
Investments valued at equity 9,316 3,180 8,835
Other non-current receivables and deferred tax assets 16,802 17,128 13,998
Total non-current assets 117,498 85,451 94,417
Inventories 70,184 68,274 61,570
Current trade receivables 421,378 410,956 315,399
Other current assets 36,413 28,902 25,407
Current operating assets 527,975 508,132 402,376
Payables to suppliers 306,955 286,184 270,984
Other current payables 74,887 61,287 52,847
Short-term operating liabilities 381,842 347,471 323,831
Net working capital 146,133 160,661 78,545
Non-current provisions and other tax liabilities 13,782 7,064 8,457
Employee benefits 20,758 17,548 17,427
Non-current liabilities 34,540 24,612 25,884
Net Invested Capital 229,091 221,500 147,078
Equity 208,470 192,808 199,028
Medium-Term Net Financial Position 123,137 79,456 81,118
Short-Term Net Financial Position (102,516) (50,764) (133,068)
Total Net Financial Position (Net Liquidity) 20,621 28,692 (51,950)
Equity and Net Financial Position 229,091 221,500 147,078
Balance Sheet as of January 31, 2018
Financial Statements as of January 31, 2017 and January 31, 2018 approved by the Board of Directors, unaudited Financial Statements as of April 30, 2017 approved by the Board of Directors and audited by Independent Auditors
30

Reclassified Income Statement (Euro/thousand) 04/30/2017 % 04/30/2016 %Change2017/16
Revenues 1,260,275 1,223,485 3.0%
Other income 11,194 6,117 83.0%
Total Revenues and Other Income 1,271,469 100.0% 1,229,602 100.0% 3.4%
Purchase of goods 1,055,182 83.0% 1,041,977 84.7% 1.3%
Costs for services and leased assets 85,106 6.7% 71,305 5.8% 19.4%
Personnel costs 70,107 5.5% 59,004 4.8% 18.8%
Other operating charges 3,189 0.3% 3,307 0.3% -3.6%
Total Purchase of goods and Operating Costs 1,213,584 95.4% 1,175,593 95.6% 3.2%
EBITDA 57,885 4.55% 54,009 4.39% 7.2%
Amortisation tangible and intangible assets (software) 5,289 3,600 46.9%
Amortisation client lists and technological know-how 1,557 1,169 33.2%
Accruals to provision for bad debts and risks 6,253 5,556 12.5%
EBIT 44,786 3.52% 43,684 3.55% 2.5%
Profit from companies valued at equity 172 462 -62.8%
Net financial income and charges (4,621) (6,443) -28.3%
EBT 40,337 3.17% 37,703 3.07% 7.0%
Income taxes 13,239 12,648 4.7%
Net profit 27,098 2.13% 25,055 2.04% 8.2%
Net profit attributable to the Group 25,043 23,964 4.5%
Net profit attributable to non-controlling interests 2,055 1,091 88.4%
Income Statement as of April 30, 2017
Financial Statements approved by the Board of Directors (audited by Independent Auditors)
31

Reclassified Balance Sheet (Euro/thousand) 04/30/2017 04/30/2016Change2017/16
Intangible assets 21,848 17,251 4,597
Property, plant and equipment 49,736 44,437 5,299
Investments valued at equity 8,835 3,938 4,897
Other non-current receivables and deferred tax assets 13,998 16,340 (2,342)
Total non-current assets 94,417 81,966 12,451
Inventories 61,570 59,079 2,491
Current trade receivables 315,399 306,474 8,925
Other current assets 25,407 23,487 1,920
Current operating assets 402,376 389,040 13,336
Payables to suppliers 270,984 261,673 9,311
Other current payables 52,847 49,719 3,128
Short-term operating liabilities 323,831 311,392 12,439
Net working capital 78,545 77,648 897
Non-current provisions and other tax liabilities 8,457 6,175 2,282
Employee benefits 17,427 15,836 1,591
Non-current liabilities 25,884 22,011 3,873
Net Invested Capital 147,078 137,603 9,475
Equity 199,028 179,414 19,614
Medium-Term Net Financial Position 81,118 65,103 16,015
Short-Term Net Financial Position (133,068) (106,914) (26,154)
Total Net Financial Position (Net Liquidity) (51,950) (41,811) (10,139)
Equity and Net Financial Position 147,078 137,603 9,475
Balance Sheet as of April 30, 2017
Financial Statements approved by the Board of Directors (audited by Independent Auditors)
32

Disclaimer
This document has been prepared by Sesa SpA (“SeSa” or the “Company”) and by its subsidiaries (hereinafter «SeSa Group») solely for this presentation and does not represent anyinvestment research , recommendation, consulting or suggestion, concerning the Company or its shares or any other securities/financial instruments issued by the Company. Thispresentation can not be employed in a public offer or investment solicitation. As a result, the Company, its directors, employees, contractors, and consultants do not accept anyliability in relation to any loss or damage, costs or expenses suffered by any person who relies on the information contained in this document or otherwise arising from the use of thesame and any such liability is expressly disclaimed.
The Company does not assume any responsibility for the accuracy, sufficiency and completeness of the information contained in this document or in respect of any errors, omissions,inaccuracies contained in it. The presentation at any time is subject to updates and modifications by the Company. However, SeSa does not assume any obligation to communicateor otherwise make known any changes and updates. The document is not intended as, nor should it be regarded as a complete and comprehensive description of the Company anddoes not necessarily contain all the information that the recipients may consider relevant in relation to the Company. The provision of the Document does not give the recipient anyright to access more information.
Sesa Manager in Charge and the officers preparing the Company financial reports hereby certify pursuant to paragraph 2 of art. 154-bis of Legislative Decree no. 58 of February 24,1998, that the accounting disclosures of this document are consistent with the accounting documents, ledgers and entries.
This presentation contains forward-looking statements regarding future events and results of the Company that are based on the current expectations, projections and assumptions of the management of the Company. These declarations, being based on expectations, estimates, forecasts and projections, are subject to risks, uncertainties and other factors that depend on circumstances beyond the company's control and are not guarantees of future performance: the results or actual performance may therefore be different, even significantly, from historical and / or from those obtained and the Company does not assume any liability with respect thereto.
Reproduction, redistribution or transmission to third parties, or part, of this document are forbidden. Participation in the presentation or receipt of this document constitutes youracceptance of the terms and restrictions above.
33