group quarterly statement as at 30 · pdf filecash and cash equivalents include ticket monies...
TRANSCRIPT
2016 GROUP QUARTERLY STATEMENT AS AT 30 SEPTEMBER
CONTENT
BUSINESS PERFORMANCE 1
OVERVIEW OF KEY GROUP FIGURES 3
EARNINGS PERFORMANCE 5
FINANCIAL POSITION 7
CASH FLOW 8
SIGNIFICANT EVENTS IN THE REPORTING PERIOD 9
EVENTS AFTER THE BALANCE SHEET DATE 9
OUTLOOK 10
Consolidated balance sheet 11 Consolidated income statement 13 Consolidated statement of changes in shareholders’ equity 15 Consolidated cash flow statement (short form) 16 Contact, Publishers’ notes, Disclaimer 17
II

Group Quarterly Statement
SUCCESSFUL BUSINESS PERFORMANCE OVER THE FIRST NINE MONTHS OF 2016
Continuous growth trend in the Ticketing segment with double-digit volume and revenue growth
Live Entertainment segment with a moderate business development still slightly after a record year in 2015
Normalised EBITDA roughly on a par with the previous year
Temporary negative effects on earnings from the increase in the number of consoli-dated companies as a result of acquisitions and business expansion in South America
The Ticketing segment delivered again an unchanged growth momentum. In the first nine months of fiscal year 2016 online ticket volume increased organically by 12.5% to almost 25 million tickets. Due to the expansion in South America and Scandinavia total online ticket volume grew by 19.7% to 26.5 million. With double-digit revenue growth of 11.6% to EUR 240.3 million the Ticketing segment remains fully in line with expectations. Normalised EBITDA improved by 8.9% to EUR 82.3 million. Despite a disproportionate earnings contribution from organic growth in online ticketing, EBITDA growth was subdued by temporary earnings pressure, totalling at EUR 2.6 million, due to ongoing business integration and the expansion into South America. Furthermore, previous years’ earnings level was supported by foreign exchange gains of EUR 1.8 million versus the current year. On a pro-forma basis (adjusted for foreign exchange effects and temporary dilution from international expansion) revenue growth would have been at 10.0% and normalised EBITDA growth at 14.8% versus the first nine months in fiscal year 2015.
Against record year 2015 the Live Entertainment segment continued to perform slightly better than expected. For the first nine months of fiscal year 2016, revenue declined by 7.1% to EUR 340.3 million (previous year: EUR 366.4 million). The current performance in revenue is due to a lower number of major tours in comparison to the previous year. Based on this development and temporary earnings dilution from the expansion in the number of consolidated companies EBITDA decreased by 19.6% to EUR 25.4 million. Earnings development in Live Entertainment thus remains above the originally expected trend of a 30% decline in fiscal year 2016.
1

Group Quarterly Statement
The business performance of the Ticketing segment and Live Entertainment segment over the first nine months in 2016 resulted in almost stable CTS Group revenue of EUR 576.2 million versus EUR 577.5 million in previous years period. Despite temporary earnings pressure and a guided decline in Live Entertainment EBITDA, normalised Group EBITDA slightly increased to EUR 107.7 million (previous year: EUR 107.2 million) due to an undisputed growth dynamic in online ticketing.
EBIT fell by 0.8% to EUR 84.0 million due to higher scheduled amortisation and amortisation from purchase price allo-cations, as well as increased special effects to be normalised from planned and completed acquisitions. The financial result decreased primarily on account of the expansion of the number of consolidated companies. Earnings per share (EUR 0.48) was thus slightly down on the previous year.
Corporate management of the CTS Group still expects a solid performance for the financial year 2016. Thanks to the continuous expansion of the product and service portfolio, ongoing internationalisation and the systematic implementa-tion of the e-commerce strategy, corporate management believes that the CTS Group is excellently positioned to turn opportunities that arise into profitable medium- and long-term growth.
2

Group Quarterly Statement
OVERVIEW OF KEY GROUP FIGURES
TICKETING 01.01.2016 - 30.09.2016
01.01.2015 - 30.09.2015 Change
[EUR’000] [EUR’000] [EUR’000] [in %]
Revenue 240,329 215,348 24,981 11.6
EBITDA 81,656 75,342 6,314 8.4
EBITDA margin 34.0% 35.0% -1.0 pp
normalised EBITDA 82,313 75,598 6,715 8.9
normalised EBITDA margin 34.3% 35.1% -0.8 pp
EBIT 59,759 55,039 4,720 8.6
EBIT margin 24.9% 25.6% -0.7 pp
normalised EBIT before amortisation from purchase price allocation 68,537 63,387 5,150 8.1
normalised EBIT margin 28.5% 29.4% -0.9 pp
LIVE ENTERTAINMENT 01.01.2016 - 30.09.2016
01.01.2015 - 30.09.2015 Change
[EUR’000] [EUR’000] [EUR’000] [in %]
Revenue 340,306 366,379 -26,073 -7.1
EBITDA 25,387 31,561 -6,174 -19.6
EBITDA margin 7.5% 8.6% -1.1 pp
normalised EBITDA 25,387 31,561 -6,174 -19.6
normalised EBITDA margin 7.5% 8.6% -1.1 pp
EBIT 24,264 29,694 -5,430 -18.3
EBIT margin 7.1% 8.1% -1.0 pp
normalised EBIT before amortisation from purchase price allocation 24,412 30,078 -5,666 -18.8
normalised EBIT margin 7.2% 8.2% -1.0 pp
3
Group Quarterly Statement
CTS GROUP 01.01.2016 - 30.09.2016
01.01.2015 - 30.09.2015 Change
[EUR’000] [EUR’000] [EUR’000] [in %]
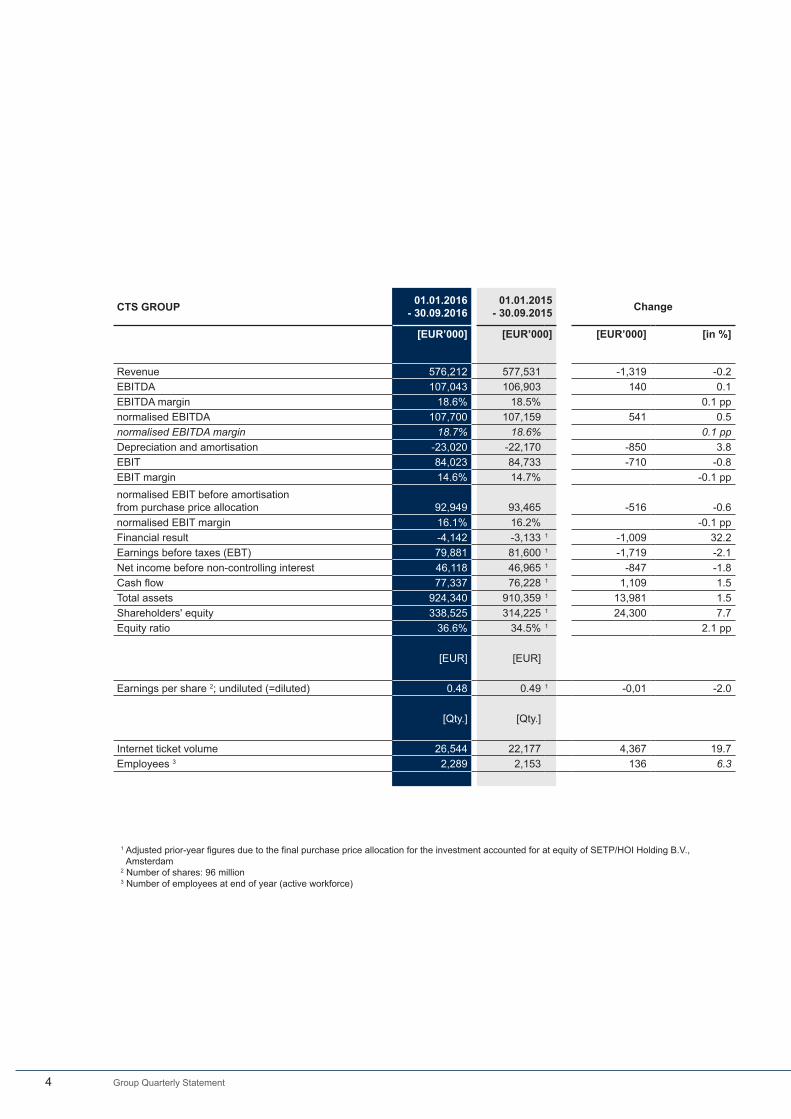
Revenue 576,212 577,531 -1,319 -0.2
EBITDA 107,043 106,903 140 0.1
EBITDA margin 18.6% 18.5% 0.1 pp
normalised EBITDA 107,700 107,159 541 0.5
normalised EBITDA margin 18.7% 18.6% 0.1 pp
Depreciation and amortisation -23,020 -22,170 -850 3.8
EBIT 84,023 84,733 -710 -0.8
EBIT margin 14.6% 14.7% -0.1 pp
normalised EBIT before amortisation from purchase price allocation 92,949 93,465 -516 -0.6
normalised EBIT margin 16.1% 16.2% -0.1 pp
Financial result -4,142 -3,133 1 -1,009 32.2
Earnings before taxes (EBT) 79,881 81,600 1 -1,719 -2.1
Net income before non-controlling interest 46,118 46,965 1 -847 -1.8
Cash flow 77,337 76,228 1 1,109 1.5
Total assets 924,340 910,359 1 13,981 1.5
Shareholders' equity 338,525 314,225 1 24,300 7.7
Equity ratio 36.6% 34.5% 1 2.1 pp
[EUR] [EUR]
Earnings per share 2; undiluted (=diluted) 0.48 0.49 1 -0,01 -2.0
[Qty.] [Qty.]
Internet ticket volume 26,544 22,177 4,367 19.7
Employees 3 2,289 2,153 136 6.3
1 Adjusted prior-year figures due to the final purchase price allocation for the investment accounted for at equity of SETP/HOI Holding B.V., Amsterdam
2 Number of shares: 96 million3 Number of employees at end of year (active workforce)
4

Group Quarterly Statement
REVENUE GROWTH
In the Ticketing segment revenue rose by 11.6%. The main reason for this increase is the internet ticket volume growth from 22.2 million by 4.4 million (+19.7%) to 26.5 million (thereof 1.6 million tickets from newly acquired subsidi-aries). The share of revenue generated by foreign subsidiaries was at 50.3% (previous year: 48.2%).
Due to a lack of major events (e.g. AC/DC and Herbert Grönemeyer) revenue in the Live Entertainment segment mainly decreased by -7.1% as expected compared to prior period.
In the CTS Group, revenue almost matched the previous years’ level.
NORMALISED EBITDA / EBITDA
Normalised EBITDA in the Ticketing segment increased by EUR 6.715 million (+8.9%). The growth in online ticket volume both nationally and internationally contributed significantly to this increase in earnings. The expansion of ticket-ing in South America and the increase in the number of consolidated companies through acquisitions resulted in tem-porary negative effects on earnings of approximately EUR 2.6 million during the reporting period. Furthermore, there was a lack of income from foreign currency conversion compared to the same period in the previous year. Normalised EBITDA margin was at 34.3% at the previous year level (35.1%). The share of normalised EBITDA attributable to for-eign companies increased year-on-year from 29.8% to 32.6% in the current reporting period.
EBITDA im Segment Live Entertainment decreased by EUR 6.174 million (-19.6%). The decrease resulted primarily from the lack of profit contributions from major events and the increase in the number of consolidated companies.The EBITDA margin decreased to 7.5% compared to 8.6% in the same period last year.
Normalised CTS Group EBITDA increased by EUR 541 thousand or 0.5%. The normalised EBITDA margin was at 18.7% on prior year level. Foreign subsidiaries accounted for 30.6% of normalised EBITDA (previous year: 24.9%).
AMORTISATION
The rise in amortisation of EUR 849 thousand was the result of an increase in scheduled amortisation and amortisation from purchase price allocations.
EARNINGS PERFORMANCE
5

Group Quarterly Statement
FINANCIAL RESULT
The financial result includes EUR 1.119 million in financial income (previous year: EUR 873 thousand), EUR 4.964 mil-lion in financial expenses (previous year: EUR 4.036 million), EUR -458 thousand in income from affiliated companies and associates accounted for at equity (previous year: EUR 13 thousand) and income from participations EUR 161 thousand (previous year: EUR 17 thousand). As a result of the full consolidation of companies which have previously been accounted for at equity, the difference between the equity value for the former shares and their fair value as at the acquisition date had to be recognized as a financial expense pursuant to IFRS 3.42 in the reporting period.
EARNINGS BEFORE TAX (EBT) / CONSOLIDATED NET INCOME / EPS
EBT decreased by EUR 1.719 million. After deduction of tax expenses and non-controlling interest, consolidated net income amounted to EUR 46.118 million (previous year: EUR 46.965 million). Earnings per share (EPS) amounted to EUR 0.48, slightly below prior-year level.
PERSONNEL
On average over the year to date, the companies in the CTS Group had a total of 2,284 employees on their payroll, including 371 part-time workers. Of that total, 1,651 are employed in the Ticketing segment (previous year: 1,549 employees) and 633 in the Live Entertainment segment (previous year: 595 employees). The increase in the number of employees in the Ticketing segment was mainly attributable to technological development and the expansion of the number of companies included in consolidation. The increase in the Live Entertainment segment resulted primarily from temporary staff working part-time for the operation of the Lanxess Arena and Arena Berlin and the expansion of the number of companies included in consolidation.
6
Group Quarterly Statement
MAIN CHANGES IN ASSETS
Cash and cash equivalents in the CTS Group declined by EUR 177.101 million. The cash outflow relates among other things to the seasonal reduction of ticket monies paid in the Ticketing segment and to realisation and settlement of events in the Live Entertainment. Futhermore, the dividend payment to shareholders in the second quarter 2016 and the repayment of loans result to additonal cash outflows.
Cash and cash equivalents include ticket monies from presales for events in subsequent quarters (ticket monies not yet invoiced in the Ticketing segment), which are reported under other financial liabilities at EUR 176.020 million (31.12.2015: EUR 237.498 million); other financial assets also include receivables relating to ticket monies from pre-sales in the Ticketing segment (EUR 36.209 million; 31.12.2015: EUR 40.963 million).
The decrease in short-term other financial assets (EUR -5.555 million) mainly results from the decrease in receiva-bles relating to ticket revenue from presales in the Ticketing segment (EUR -4.754 million) and factoring receivables ( EUR -3.787 million). In contrast, there was a rise in receivables from compensation claims and other financial assets.
Goodwill increased mainly due to the preliminary purchase price allocation of the acquired companies in the Ticketing segment and Live Entertainment (EUR +6.928 million).
MAIN CHANGES ON THE SHAREHOLDERS’ EQUITY AND LIABILITY SIDE
The short-term liabilities decreased by EUR 162.348 million whereas the long-term liabilities increased by EUR 3.856 million.
The reduction in short-term liabilities mainly results due to lower reduction of advanced payments received in the Live Entertainment segment (EUR -75.621 million) and lower liabilities in respect of ticket monies not yet invoiced in the Ticketing segment (EUR -61.478 million). Due to the strong fourth quarter at the end of each year, there is usually a large amount of liabilities for ticket monies not yet invoiced, which is then reduced over the course of the following year, when the events are held and invoiced.
The increase in long-term liabilities results primarily due to higher pension provisions.
Shareholders’ equity declined by EUR 15.647 million to EUR 338.525 million. The positive net income is offset by dividend payments to shareholders, currency differences and purchase price obligations in respect of put options of non-controlling interests recognised in shareholders’ equity according to IAS 32.
FINANCIAL POSITION
7

Group Quarterly Statement
The amount of cash and cash equivalents shown in the cash flow statement corresponds to the cash and cash equiv-alents stated in the balance sheet. Compared to the closing date of 31 December 2015, cash and cash equivalents decreased by EUR 177.101 million to EUR 323.715 million.
In comparison with the closing date at 30 September 2015 cash and cash equivalents increased by EUR 6.561 million to EUR 323.715 million.
Cash flow from operating activities increased by EUR 8.000 million from EUR -115.697 million to EUR -107.697 million. Positive cash flow effects from receivables and other assets as well as the change in liabilities (liabilities for ticket monies not yet invoiced in the Ticketing segment and a lower reduction of advanced payments received in the Live Entertainment segment) are offset by negative cash flow effects from paid income taxes.
A lower reduction of liabilities for ticket monies compared to previous year led to a positive cash flow effect. The higher reduction in ticket monies liabilities in the first nine month 2015 resulted from a high number of major tours. The higher increase in other liabilities is the result of purchase price obligations in respect of put options of non-controlling interests. The increase in paid income taxes relates to advance tax payments in the reporting period for the previous year as well as higher prepayments for the current financial year 2016.
Negative cash flow from investing activities increased year-on-year by EUR -6.566 million to EUR -24.765 million. The increase in cash flow from investing activities mainly results from higher investments in intangible assets and in property, plant and equipment as well as payments related to newly acquired companies.
The negative cash flow from financing activities decreased year-on-year by EUR 15.156 million to EUR -45.051 million. This was mainly the result of lower redemptions of financial loans.
The changes in net increase/decrease in cash and cash equivalents due to currency translation of EUR -5.002 million resulted mainly from the appreciation of the Swiss franc in the same period last year.
With its current funds, the CTS Group is able to meet its financial commitments and to finance its planned investments and ongoing operations from its own funds.
CASH FLOW
8

Group Quarterly Statement
MEDUSA Music Group GmbH, Bremen, was granted approval by the Federal Cartel Office (Bundeskartellamt) on 8 July 2016 for its acquisition of the residual 50% stake in SETP/HOI Holding B.V., Amsterdam, and its subsidiaries. Since 1943, Holiday on Ice is one of the world’s most established show and entertainment companies and has made a name for itself all over the world with its spectacular ice shows. Assets and liabilities were recognised at the fair value in the provisional purchase price allocation. At the time of initial consolidation, intangible assets (trademark and cus-tomer base) were recognised with a fair value of EUR 1.480 million. Deferred tax liabilities of EUR 370 thousand were recorded on the temporary difference arising from the remeasurement of the intangible assets. Cash and cash equiva-lents of EUR 221 thousand were taken over in the course of acquisition of this company. Since its initial consolidation HOI-Group contributed with EUR -417 thousand to CTS Group earnings.
In an agreement concluded on 31 October 2016, the companies CTS Eventim AG & Co. KGaA, Munich (hereinafter: CTS KGaA), Ringier AG, Zurich, and Tamedia AG, Zurich (with its subsidiary Starticket AG, Zollikon) entered into a partnership. Within the scope of this partnership, Ticketcorner Holding AG, Rümlang – in which CTS KGaA and Ring-ier AG, Zürich, each hold a 50% stake in – and Tamedia AG, Zurich, will hold stakes of 75% and 25% respectively in Ticket corner AG, Rümlang. Ticketcorner AG, Rümlang, and Starticket AG, Zollikon, will appear together on the market in future and offer their services jointly. The merger is still subject to the approval of the Swiss Competition Commission. Once approval has been granted, the merger is scheduled to be completed in the first half of 2017. This merger will give rise to a Swiss ticketing group with a wide reach, innovative services, high-performance platforms, mobile apps and scanning solutions for event customers. By taking this step, the two partners seek to confront increasingly stiff competition in the ticketing business from international providers, swift technological development and the growing importance of direct sales.
SIGNIFICANT EVENTS IN THE REPORTING PERIOD
EVENTS AFTER THE BALANCE SHEET DATE
9

Group Quarterly Statement
The CTS Group continues to anticipate solid business performance in the current financial year, with the business model in robust and sustainable shape. Online ticketing and international expansion continue to drive growth. The CTS Group also sees a great deal of growth potential in South America, besides successful completion of the ticketing pro-cess for the Olympic Games in Rio de Janeiro. CTS EVENTIM has already established an excellent position in Brazil thanks to the successfully launched joint venture with Sony Music Entertainment.
In addition, it continues to constantly review strategic opportunities in Europe for cooperation and acquisitions in the international ticketing and live entertainment market.
In the Ticketing segment, the focus will remain on the systematic implementation of the profitable e-commerce strat-egy. The continuous improvement of the online stores is another cornerstone of constant growth in this segment. The trend towards the usage of online services on mobile devices is becoming increasingly important. Constant improve-ment in the analysis of ticket portal user data allows services to be tailored to customers’ demands. In EVENTIM Analyt-ics, the CTS Group also possesses a tool that enables organisers to significantly boost the efficiency of their marketing strategy. By continuing to develop new innovations, products and services, CTS EVENTIM will further expand its posi-tion as the world’s second-largest ticketing provider.
In the wake of 2015’s record-breaking result with an unusually high number of major tours, business performance in the Live Entertainment segment is only expected to be moderate in the current financial year. The large network of subsidiaries and participations in the Live Entertainment segment will also be expanded moving forward. We believe that we are very well positioned in the Live Entertainment segment thanks to our portfolio of venues and a unique offer-ing of appealing music, cultural, sporting and leisure events. In the Live Entertainment segment, both acquisitions and share purchases of existing associated companies and subsidiaries are planned as part of a strategic and geographic market expansion.
There are no significant changes in the reporting period compared to the informaiton on the expected development of the CTS Group stated in the outlook of the 2015 Annual Report.
The statements made in the reisk and opportunities report included int eh 2015 Annual Report remain valid.
OUTLOOK
10

Group Quarterly Statement | Consolidated Balance Sheet (IFRS)
CONSOLIDATED BALANCE SHEET AS AT 30 SEPTEMBER 2016 (IFRS)
ASSETS 30.09.2016 31.12.2015
[EUR] [EUR]
Current assetsCash and cash equivalents 323,715,257 500,816,217
Marketable securities and other investments 4,308,756 5,877,799
Trade receivables 31,850,525 34,001,185
Receivables from affiliated and associated companies accounted for at equity 4,794,192 4,746,267
Inventories 4,018,559 2,074,026
Payments on account 22,905,548 27,842,808
Receivables from income tax 5,829,415 4,984,630
Other financial assets 53,597,021 59,151,666Other non-financial assets 15,989,627 11,812,594
Total current assets 467,008,900 651,307,192
Non-current assetsProperty, plant and equipment 25,084,997 20,573,962
Intangible assets 108,337,957 107,513,493
Investments 3,137,802 2,965,734
Investments in associates accounted for at equity 15,608,216 19,485,832
Loans 166,770 190,835
Trade receivables 2,504 22,264
Receivables from affiliated and associated companies accounted for at equity 986,600 1,533,917
Marketable securities and other investments 1,000,000 1,000,000
Other financial assets 3,746,350 3,429,159
Other non-financial assets 573,952 26,015
Goodwill 285,150,474 278,222,458Deferred tax assets 13,534,977 12,208,485
Total non-current assets 457,330,599 447,172,154
Total assets 924,339,499 1,098,479,346
11

Group Quarterly Statement | Consolidated Balance Sheet (IFRS)
SHAREHOLDERS‘ EQUITY AND LIABILITIES 30.09.2016 31.12.2015
[EUR] [EUR]
Current liabilitiesShort-term financial liabilities 31,566,947 16,621,451
Trade payables 66,621,604 79,942,316
Payables to affiliated and associated companies accounted for at equity 1,345,098 597,675
Advance payments received 78,203,081 153,824,211
Other provisions 8,197,068 10,711,870
Tax provisions 17,154,637 27,492,725
Other financial liabilities 180,995,026 245,656,555Other non-financial liabilities 41,193,417 52,778,505
Total current liabilities 425,276,878 587,625,308
Non-current liabilitiesMedium- and long-term financial liabilities 133,827,555 132,562,780
Other financial liabilities 754,842 766,845
Other non-financial liabilities 41,183 0
Pension provisions 12,712,831 9,914,857Deferred tax liabilities 13,201,661 13,438,090
Total non-current liabilities 160,538,072 156,682,572
Shareholders' equityShare capital 96,000,000 96,000,000
Capital reserve 1,890,047 1,890,047
Statutory reserve 7,200,000 7,200,000
Retained earnings 202,548,625 225,961,993
Treasury stock -52,070 -52,070
Non-controlling interest 32,049,126 20,880,626
Total comprehensive income -3,247,917 -1,905,806Currency differences 2,136,738 4,196,676
Total shareholders' equity 338,524,549 354,171,466
Total shareholders' equity and liabilities 924,339,499 1,098,479,346
12

Group Quarterly Statement | Consolidated Income Statement (IFRS)
01.01.2016 - 30.09.2016
01.01.2015 - 30.09.2015 Change
[EUR] [EUR] [EUR]
Revenue 576,211,889 577,531,375 -1,319,486
Cost of sales -401,109,436 -409,817,787 8,708,351
Gross profit 175,102,453 167,713,588 7,388,865
Selling expenses -56,265,448 -53,459,044 -2,806,404
General administrative expenses -39,917,534 -35,930,556 -3,986,978
Other operating income 13,150,664 12,946,486 204,178Other operating expenses -8,047,086 -6,537,675 -1,509,411
Operating profit (EBIT) 84,023,049 84,732,799 -709,750
Income / expenses from participations 161,078 16,532 144,546
Income / expenses from investments in associates accounted for at equity -458,021 13,074 1 -471,095
Financial income 1,119,053 873,205 245,848Financial expenses -4,964,114 -4,035,821 -928,293
Earnings before tax (EBT) 79,881,045 81,599,789 1 -1,718,744
Taxes -26,440,866 -26,010,956 -429,910
Net income before non-controlling interest 53,440,179 55,588,833 1 -2,148,654
Thereof attributable to non-controlling interest -7,322,291 -8,623,496 1,301,205
Net income after non-controlling interest 46,117,888 46,965,337 1 -847,449
Earnings per share (in EUR); undiluted (= diluted) 0.48 0.49 1
Average number of shares in circulation; undiluted (= diluted) 96 million 96 million
1 Adjusted prior-year figures due to the final purchase price allocation for the investment accounted for at equity of SETP/HOI Holding B.V., Amsterdam
CONSOLIDATED INCOME STATEMENT FOR THE PERIOD FROM 1 JANUARY TO 30 SEPTEMBER 2016 (IFRS)
13
Group Quarterly Statement | Consolidated Income Statement (IFRS)
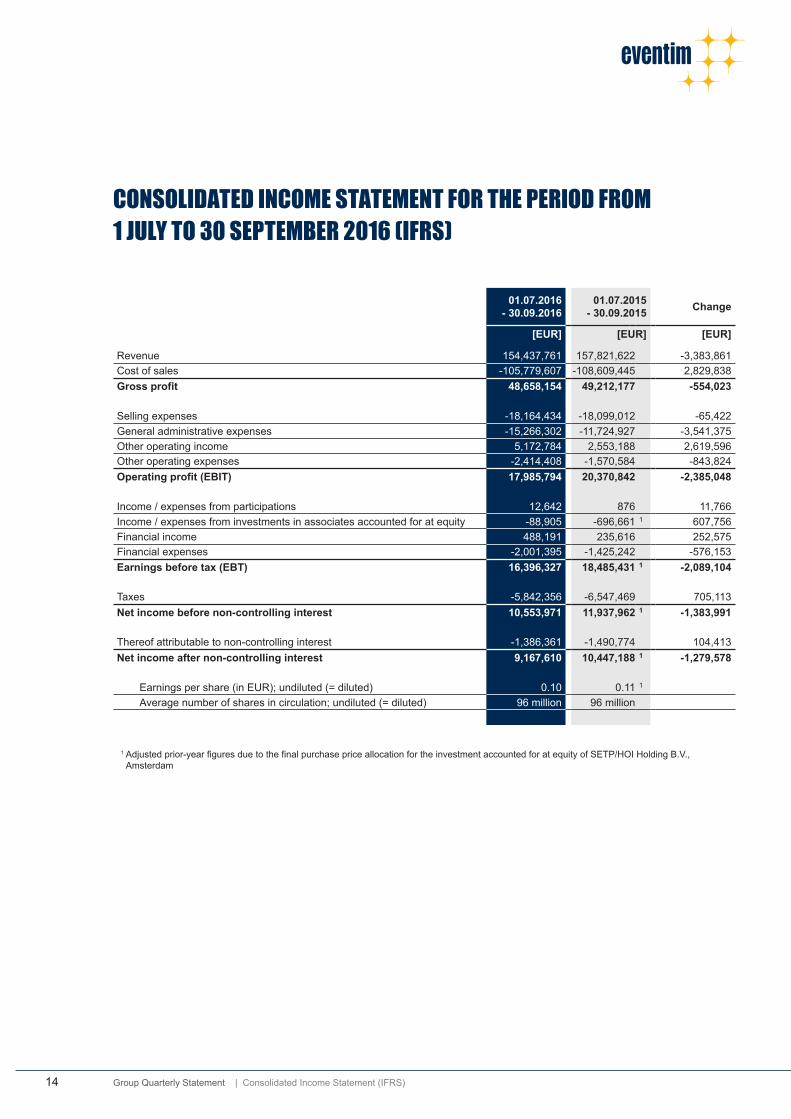
01.07.2016 - 30.09.2016
01.07.2015 - 30.09.2015 Change
[EUR] [EUR] [EUR]
Revenue 154,437,761 157,821,622 -3,383,861
Cost of sales -105,779,607 -108,609,445 2,829,838
Gross profit 48,658,154 49,212,177 -554,023
Selling expenses -18,164,434 -18,099,012 -65,422
General administrative expenses -15,266,302 -11,724,927 -3,541,375
Other operating income 5,172,784 2,553,188 2,619,596Other operating expenses -2,414,408 -1,570,584 -843,824
Operating profit (EBIT) 17,985,794 20,370,842 -2,385,048
Income / expenses from participations 12,642 876 11,766
Income / expenses from investments in associates accounted for at equity -88,905 -696,661 1 607,756
Financial income 488,191 235,616 252,575Financial expenses -2,001,395 -1,425,242 -576,153
Earnings before tax (EBT) 16,396,327 18,485,431 1 -2,089,104
Taxes -5,842,356 -6,547,469 705,113
Net income before non-controlling interest 10,553,971 11,937,962 1 -1,383,991
Thereof attributable to non-controlling interest -1,386,361 -1,490,774 104,413
Net income after non-controlling interest 9,167,610 10,447,188 1 -1,279,578
Earnings per share (in EUR); undiluted (= diluted) 0.10 0.11 1
Average number of shares in circulation; undiluted (= diluted) 96 million 96 million
1 Adjusted prior-year figures due to the final purchase price allocation for the investment accounted for at equity of SETP/HOI Holding B.V., Amsterdam
CONSOLIDATED INCOME STATEMENT FOR THE PERIOD FROM 1 JULY TO 30 SEPTEMBER 2016 (IFRS)
14

Group Quarterly Statement | Consolidated Statement of changes in Shareholders‘ Equity (IFRS)
Share capitalCapital reserve
Statutory reserve Retained earnings
Treasury stock
Non-controlling interest
Other com-prehensive
incomeCurrency
differences
Total shareholders'
equity
[EUR] [EUR] [EUR] [EUR] [EUR] [EUR] [EUR] [EUR] [EUR]
Status 01.01.2015 96,000,000 1,890,047 5,218,393 178,109,800 -52,070 18,854,562 -1,920,518 2,188,682 300,288,896Change in the scope of consolidation 0 0 0 -760,062 0 -199,788 0 0 -959,850
Dividends to non- controlling interest 0 0 0 0 0 -4,259,821 0 0 -4,259,821
Dividends to shareholders of CTS KGaA 0 0 0 -38,396,520 0 0 0 0 -38,396,520
Consolidated net income 0 0 0 46,965,337 1 0 8,623,496 0 0 55,588,833 1
Available-for-sale financial assets 0 0 0 0 0 0 -318 0 -318
Cash flow hedges 0 0 0 0 0 0 21,943 0 21,943
Foreign exchange differences 0 0 0 0 0 753,730 0 2,316,785 3,070,515
Remeasurement of the net defined benefit obliga-tion for pension plans 0 0 0 0 0 -618,355 -510,641 0 -1,128,996
Status 30.09.2015 96,000,000 1,890,047 5,218,393 185,918,555 1 -52,070 23,153,824 -2,409,534 4,505,467 314,224,682 1
Status 01.01.2016 96,000,000 1,890,047 7,200,000 225,961,993 -52,070 20,880,626 -1,905,806 4,196,676 354,171,466Change in the scope of consolidation 0 0 0 -25,157,595 0 7,356,317 0 0 -17,801,278
Allocation to earnings reserve 0 0 0 -217,663 0 0 0 0 -217,663
Dividends to non- controlling interest 0 0 0 0 0 -2,698,682 0 0 -2,698,682
Dividends to shareholders of CTS KGaA 0 0 0 -44,155,998 0 0 0 0 -44,155,998
Consolidated net income 0 0 0 46,117,888 0 7,322,291 0 0 53,440,179
Available-for-sale financial assets 0 0 0 0 0 0 -37,129 0 -37,129
Cash flow hedges 0 0 0 0 0 2,902 45,654 0 48,556
Foreign exchange differences 0 0 0 0 0 -46,622 0 -2,059,938 -2,106,560
Remeasurement of the net defined benefit obliga-tion for pension plans 0 0 0 0 0 -767,706 -1,350,636 0 -2,118,342
Status 30.09.2016 96,000,000 1,890,047 7,200,000 202,548,625 -52,070 32,049,126 -3,247,917 2,136,738 338,524,549
1 Adjusted prior-year figures due to the final purchase price allocation for the investment accounted for at equity of SETP/HOI Holding B.V., Amsterdam
CONSOLIDATED STATEMENT OF CHANGES IN SHAREHOLDERS’ EQUITY (IFRS)
15

Group Quarterly Statement | Consolidated Cash Flow Statement (IFRS)
CONSOLIDATED CASH FLOW STATEMENT FOR THE PERIOD FROM 1 JANUARY TO 30 SEPTEMBER 2016 (IFRS) (SHORT FORM)
01.01.2016 - 30.09.2016
01.01.2015 - 30.09.2015 Change
[EUR] [EUR] [EUR]
Net income after non-controlling interest 46,117,888 46,965,337 1 -847,449
Non-controlling interest 7,322,291 8,623,496 -1,301,205
Depreciation and amortisation on fixed assets 23,019,857 22,170,592 849,265
Changes in pension provisions 2,797,975 1,998,856 799,119Deferred tax expenses / income -1,921,320 -3,530,660 1,609,340
Cash flow 77,336,691 76,227,621 1 1,109,070Other non-cash transactions 1,768,736 -30,577 1,799,313
Book profit / loss from disposal of fixed assets -839,722 3,078 -842,800
Interest expenses / Interest income 2,068,679 2,600,763 -532,084
Income tax expenses 28,362,186 29,541,616 -1,179,430
Interest received 716,657 710,405 6,252
Interest paid -2,122,819 -2,446,066 323,247
Income tax paid -39,162,020 -16,072,354 -23,089,666
Increase (-) / decrease (+) in inventories -211,661 651,155 -862,816
Increase (-) / decrease (+) in payments on account 4,956,994 2,224,424 2,732,570
Increase (-) / decrease (+) in marketable securities and other investments 1,569,042 -778,133 2,347,175
Increase (-) / decrease (+) in receivables and other assets 9,626,664 -971,489 10,598,153
Increase (+) / decrease (-) in provisions -2,159,370 -352,849 -1,806,521Increase (+) / decrease (-) in liabilities -189,607,237 -207,004,556 17,397,319
Cash flow from operating activities -107,697,180 -115,696,962 7,999,782Cash flow from investing activities -24,765,333 -18,198,983 -6,566,350Cash flow from financing activities -45,050,516 -60,206,369 15,155,853Net increase / decrease in cash and cash equivalents -177,513,029 -194,102,314 16,589,285
Net increase / decrease in cash and cash equivalents due to currency translation 412,069 5,414,082 -5,002,013
Cash and cash equivalents at beginning of period 500,816,217 505,842,631 -5,026,414
Cash and cash equivalents at end of period 323,715,257 317,154,399 6,560,858
Composition of cash and cash equivalentsCash and cash equivalents 323,715,257 317,154,399 6,560,858
Cash and cash equivalents at end of period 323,715,257 317,154,399 6,560,858
1 Adjusted prior-year figures due to the final purchase price allocation for the investment accounted for at equity of SETP/HOI Holding B.V., Amsterdam
16

CONTACT:
CTS EVENTIM AG & Co. KGaA Contrescarpe 75 A 28195 Bremen Phone: +49 (0) 421 / 36 66 - 0 Fax: +49 (0) 421 / 36 66 - 2 90 www.eventim.de [email protected]
PUBLISHERS’ NOTES PUBLISHED BY:
CTS EVENTIM AG & Co. KGaA Contrescarpe 75 A 28195 Bremen Phone: +49 (0) 421 / 36 66 - 0 Fax: +49 (0) 421 / 36 66 - 2 90
EDITORIAL OFFICE:
CTS EVENTIM AG & Co. KGaA
ARTWORK:
SECHSBAELLE, Bremen www.sechsbaelle.de
COVER PICTURE:
EVENTIM Apollo © Joseph Okpako
DISCLAIMER
This Group interim report contains forecasts based on assumptions and estimates by the management of CTS KGaA. These statements based on assumptions and estimates are in the form of forward-looking statements using terms such as ‘believe’, ‘assume’, ‘expect’ and the like. Even though management believes that these assumptions and estimates are correct, it is possible that actual results in the future may deviate materially from such assumptions and estimates due to a variety of factors. The latter may include changes in the macroeconomic environment, in the statutory and regulatory framework in Germany and the EU, and changes within the industry. CTS KGaA does not provide any guar-antee or accept any liability or responsibility for any divergence between future developments and actual results, on the one hand, and the assumptions and estimates expressed in this Group interim report. CTS KGaA has no intention and undertakes no obligation to update forward-looking statements in order to adjust them to actual events or developments occurring after the date of this report.
The German version of the Group interim report takes priority over the English translation in the event of any discrepancies. Both language versions can be downloaded at http://www.eventim.de/tickets.html?affiliate=EVE&fun=tdoc&doc=eventim/default/info/en/investor/investorFinancialReportDownload.
17
