group revenue up retail sales up - ted baker/media/files/t/ted-baker/results-and-reports/... · our...
TRANSCRIPT
1
23 March 2017
Ted Baker Plc (“Ted Baker”, the “Group”)
Annual Results for the 52 weeks ended 28 January 2017
Highlights:
2017 2016 Change
Group Revenue £531.0m £456.2m 16.4%
Profit Before Tax and Exceptional Items £65.8m £58.7m 12.1%
Profit Before Tax £61.3m £58.7m 4.4%
Adjusted EPS 114.0p 100.6p 13.3%
Basic EPS 105.7p 100.6p 5.1%
Total Dividend 53.6p 47.8p 12.1%
Group revenue up 16.4% (10.8% in constant currency) to £531.0m
Retail sales up 15.0% (9.2% in constant currency) to £400.7m
o UK and Europe retail sales up 10.7% (8.4% in constant currency) to £279.5m
o US and Canada retail sales up 28.3% (13.0% in constant currency) to £103.4m
o E-commerce sales up 35.1% (32.3% in constant currency) to £72.3m
Wholesale sales up 20.9% (15.9% in constant currency) to £130.3m
Licence income up 26.8% to £18.2m
Proposed final dividend of 38.8p bringing total dividend to 53.6p, an increase of 12.1%
Ray Kelvin CBE, Founder and Chief Executive, said:
“I am pleased to report another good year of progress in Ted Baker’s expansion as a global lifestyle brand. We have continued to trade well and develop despite a backdrop of on-going external challenges across our global markets. This success reflects the strength and appeal of the brand as well as the outstanding quality of our collections. Our Spring/Summer collections have been well received and we have a clear strategy for continued growth across both established and newer markets. This is underpinned by controlled distribution across channels as well as the design, quality and attention to detail that are at the core of everything we do. The success of the Ted Baker brand is testament to the skill and talent of our commitTED teams across the globe. I would like to take this opportunity to thank them for their hard work during the year. The Group’s business model as well as the strength of the brand, our team and collections support confidence in Ted Baker’s further development and growth.”

2
This document contains inside information.
Enquiries:
Ted Baker Plc Tel: 020 7796 4133 on 23 March 2017 only
Ray Kelvin CBE, Founder & Chief Executive Tel: 020 7255 4800 thereafter
Lindsay Page, Chief Operating Officer & Group Finance Director
Charles Anderson, Company Secretary & Finance Director
Hudson Sandler Tel: 020 7796 4133
Alex Brennan
Fern Duncan
www.tedbaker.com
www.tedbakerplc.com
Media images available for download at:
http://www.tedbakerplc.com/ted/en/mediacentre/imagelibrary
Notes to editors:
Ted Baker Plc – “No Ordinary Designer Label”
Ted Baker is a global lifestyle brand that operates through three main distribution channels: retail, which includes
e-commerce; wholesale; and licensing, which includes territorial and product licences.
We distribute through our own and licensed retail outlets, leading department stores and selected independent
stores in the UK and Europe, North America, the Middle East, Asia and Australasia.
The brand continues to go from strength to strength driven along in part by its unconventional approach to
product and design. Never forgetting its roots as a shirt specialist but always with an eye on the future Ted is
continuously innovating through its collections, store environments and now with digital and social media
initiatives that foster a truly omnichannel view for its growing and highly engaged global audience.
Ted Baker has 490 stores and concessions worldwide, comprising of 192 in the UK, 98 in Europe, 111 in the US
and Canada, 80 in the Middle East, Africa and Asia and 9 in Australasia.
The brand offers a wide range of collections including: Menswear; Womenswear; Global; Phormal; Endurance;
Accessories; Bedding; Childrenswear; Crockery; Eyewear; Footwear; Fragrance and Skinwear; Gifting and
Stationery; Jewellery; Lingerie and Sleepwear; Luggage; Neckwear; Rugs; Suiting; Technical Accessories; Tiles;
and Watches.

3
Strategic Report
Chairman’s Statement
I am pleased to report that Group revenue increased by 16.4% (10.8% in constant currency)1 to £531.0m
(2016: £456.2m) and profit before tax and exceptional items2 increased by 12.1% to £65.8m (2016: £58.7m)2
for the 52 weeks ended 28 January 2017 (the “period”). This good performance reflects the strength of the
Ted Baker brand and business model and was achieved despite a backdrop of on-going external factors
which have impacted trading across all of our markets. In particular, we have seen increased levels of
promotional activity and a fall in international tourism in North America, and the trading environment
continued to be challenging in Asia.
The retail channel performed well, with retail sales including e-commerce up 15.0% (9.2% in constant
currency)1 to £400.7m (2016: £348.4m) on an increase in average square footage of 8.5%. Our e-commerce
business is an integral and increasingly important component within our retail proposition and has performed
very well, delivering strong sales growth of 35.1% (32.3% in constant currency)1 to £72.3m (2016: £53.5m).
We continued our geographic expansion with openings across the UK and Europe, North America and Asia
and we continue to invest and build brand awareness in our newer markets for the long-term development of
the brand.
The wholesale channel delivered a strong performance, with sales up 20.9% (15.9% in constant currency)1 to
£130.3m (2016: £107.7m). This reflects a good performance from our UK wholesale business, which includes
the supply of goods to our licensed stores and our export business, as well as a strong performance from our
North American wholesale business.
Our territorial and product licences delivered strong performances, as licence income increased by 26.8% to
£18.2m (2016: £14.4m). During the period, our licence partners opened stores and concessions in
Azerbaijan, Dubai, Egypt, Indonesia, Mexico and Taiwan. We also opened our first stores in Bahrain and
Vietnam and are pleased with their performances so far.
During the period, we successfully launched the next phase of the Microsoft Dynamics AX system across our
North American business. We will continue the roll-out of the next phases of the project to our other territories
over the coming months, which will allow us to enhance efficiency, streamline our operations and support the
evolution of the business.
In October 2016, we took our first delivery of inventory into our new European distribution centre in the
UK and have successfully transitioned one of our legacy warehouses into this facility with the remaining two
to complete in the coming months. The European distribution centre will handle all operations for our retail,
wholesale and e-commerce businesses across the UK and Europe, supporting our long-term growth strategy.
Having completed the purchase of the iconic Ugly Brown Building in the prior period, the Group continues to
consider its expansion and development opportunities. The Group has extended the term of its option to
purchase 50% of neighbouring Block A to 31 May 2017.
Financial Results
Group revenue for the period increased by 16.4% (10.8% in constant currency)1 to £531.0m (2016: £456.2m).
The Group gross margin increased to 61.0% (2016: 59.9%) as a result of improved full price sell-through in
our retail channel and an improved mix of wholesale sales to trustee customers, as well as some foreign
exchange benefits.
Profit before tax and exceptional items2 increased by 12.1% to £65.8m (2016: £58.7m) and profit before tax
increased by 4.4% to £61.3m (2016: £58.7m). Adjusted basic earnings per share, which excludes exceptional
items, increased by 13.3% to 114.0p (2016: 100.6p) and basic earnings per share increased by 5.1% to
105.7p (2016: 100.6p).
Exceptional items in the period of £4.5m (2016: £nil) include a provision for lease commitments relating to the
Group’s legacy warehouses of £2.9m along with £0.7m of other closure costs and £0.9m in respect of closure
costs for a concept store in London. There were no exceptional items in the previous period.

4
The Group’s net borrowing position at the end of the period was £95.2m (2016: £84.6m). This reflects the
secured term loan of £58.5m (2016: £60.0m) used to purchase The Ugly Brown Building and other net debt of
£36.7m (2016: £24.6m). The increase in other net debt reflects the on-going capital expenditure during the
period and increased working capital in line with the Group’s growth.
Dividends
The Board is recommending a final dividend of 38.8p per share (2016: 34.6p), making a total for the period of
53.6p per share (2016: 47.8p per share), an increase of 12.1% on the prior period. Subject to approval by
shareholders at the Annual General Meeting to be held on 13 June 2017, the final dividend will be paid on 23
June 2017 to shareholders on the register on 19 May 2017.
People
I would like to take this opportunity to thank all of my colleagues across the world for their continued hard
work and commitment. The performance in the period is testament to our talented teams, whose commitment
and passion are key to our success as we continue to grow the business and develop Ted Baker as a global
lifestyle brand.
Current Trading and Outlook
Retail
In the UK and Europe, we plan to open a new store in each of Oxford and Paris, an outlet in Gloucester and
our first Dutch outlet in Roermond, along with further concessions in the UK, France, Germany and the
Netherlands. We will continue to invest in our e-commerce sites to enhance customer experience.
In North America, we will continue to develop our presence with plans to open stores in Los Angeles and
Houston, and relocate our Miami Aventura store. We also plan to open new concessions in Canada with a
premium department store.
In Asia, we remain focused on building brand awareness, where we are still in the relatively early stages of
investment. In line with our development strategy in this territory, we have relocated a store in Tokyo and plan
to open a further store in Shanghai and new concessions in Japan and South Korea.
Wholesale
We anticipate further growth across our wholesale businesses, which should result in high single-digit sales
growth (in constant currency)1 in the coming period.
Licence Income
Our product and territorial licences continue to perform well, with further store openings planned in Australia,
Dubai, Kuwait, Lebanon, Mexico, Qatar, Saudi Arabia and Turkey along with our first store in India.
Group
Trading across our markets continues to be impacted by on-going external factors. We have a clear strategy
for the continued expansion of Ted Baker as a global lifestyle brand across both established and newer
markets. This is underpinned by our controlled distribution across channels as well as the design, quality and
attention to detail that are at the core of everything we do.
To deliver our expansion plans, capital expenditure in the new financial period is planned to be at £35.0m
(2017: £43.8m). This relates to continued investment in the new European distribution centre, further store
openings and refurbishments, and the on-going investment in new IT systems across the business.
Ted Baker’s business model, as well as the strength of the brand and collections, support our confidence in
the Group’s continued development and further growth.
We intend to make our trading statement covering trading from the start of the financial period in mid-June
2017.
David Bernstein CBE
Non-Executive Chairman
23 March 2017

5
Notes: 1 Constant currency variances are calculated by applying the previous financial period foreign exchange rates to current
period results in overseas subsidiaries to remove the impact of exchange rate fluctuations. 2 Exceptional items are excluded from profit before tax and exceptional items due to these items being one-off and material
in nature.
The Directors believe these measures provide a consistent and comparable view of the underlying performance of the
Group’s on-going business.

6
Business Model and Strategy
Business model
Ted Baker has grown steadily from its origins as a single shirt specialist store in Glasgow to the global
lifestyle brand it is today. In order to protect the ethos and persona for which we have gained an
enviable reputation, we always ask ourselves the question: “Would Ted do it that way?”
Product
Ted Baker is a quintessentially British brand with a quirky yet commercial fashion offering that prides
itself in always being able to satisfy the needs of our customer. Our approach is focused on unwavering
attention to detail and firm commitment to quality.
We offer a wide range of collections including: Menswear; Womenswear; Global; Phormal; Endurance; Accessories; Bedding; Childrenswear; Crockery; Eyewear; Footwear; Fragrance and Skinwear; Gifting and Stationery; Jewellery; Lingerie and Sleepwear; Luggage; Neckwear; Rugs; Suiting; Technical Accessories; Tiles; and Watches.
The menswear collection is a reflection of popular contemporary culture, with a sense of style and
humour mixed in. It also includes our Phormalwear range, offering a number of distinctive suiting
collections that combine heritage British tailoring with a modern outlook. The womenswear collection is a
fresh and feminine mix of European elegance with London flair, and is a celebration of beauty,
individuality and exquisite attention to detail.
Distribution channels
The brand operates through three main distribution channels: retail, which includes e-commerce;
wholesale; and licensing, which includes territorial and product licences. We want our customer to enjoy
a seamless experience regardless of how they choose to shop and interact with the brand.
The retail channel comprises stores, concessions and e-commerce, which is now an integral part of our
retail experience. We operate stores and concessions across the UK, Europe, North America and Asia,
and localised e-commerce sites for the UK, Europe, US, Canada and Australia. We also have e-
commerce businesses with some of our concession partners.
Stores and concessions are designed to showcase the brand’s unique style of retail theatre and to
ensure our customers enjoy a welcoming and pleasurable shopping experience. Each store boasts a
fully bespoke design that’s full of innovative and distinctive touches.
E-commerce enables us to offer our customers access to an extended product range and provides us
with a means to talk directly with our customers and engage them with the brand in non-traditional ways.
We focus on ensuring that we provide a user-friendly online brand and shopping experience across
multiple devices.
The wholesale business in the UK serves countries across the world, primarily in the UK and Europe, as
well as supplying products to stores operated by our territorial licence partners. In addition, we operate a
wholesale business in North America serving the US and Canada. Our wholesale partners (“Trustees”)
are custodians of our collections and uphold our brand integrity by ensuring that their retail environment
and brand adjacencies are in keeping with the profile and positioning of the brand. We have built up
strong relationships with some of the best independent retailers and department stores around the
world.
We operate both territorial and product licences. Our licence partners are all experts in their field and
share our passion for unwavering attention to detail and firm commitment to quality. Territorial licences cover specific countries or regions in Asia, Australasia, Europe, the Middle East and North America, where our partners operate licensed retail stores and, in some territories, wholesale operations.
Product licences cover: Bedding; Childrenswear; Crockery; Eyewear; Footwear; Fragrance and Skinwear; Gifting and Stationery; Jewellery; Lingerie and Sleepwear; Luggage; Neckwear; Rugs; Suiting; Technical Accessories; Tiles; and Watches.
7
Geographic reach
Ted Baker is a truly global lifestyle brand with 490 stores and concessions worldwide, comprising of 192
in the UK, 98 in Europe, 111 in the US and Canada, 80 in the Middle East, Africa, and Asia and 9 in
Australasia.
The Group opened its first shop in the UK in Glasgow in 1988 and has since established itself in all the
major fashion centres in the UK. We have also built a growing presence in Europe with stores and
concessions in Belgium, France, Germany, Ireland, the Netherlands, Portugal, and Spain. Our e-
commerce and wholesale businesses complement our locations in Europe.
In 1998, the Group opened its first store in North America in New York. Since then, the Group has
established a presence across the USA from the East to West coasts and into Canada through both own
stores and concessions. In addition, the Group has a standalone e-commerce site in North America that
is localised to each of Canada and the US, and a rapidly growing wholesale business.
As part of our strategy to invest for the longer-term development of the brand, we have launched the
brand in Asia with stores and concessions in China, Hong Kong, Japan and Korea. We also understand
the growing desire of our customers to buy our products online and trade on renowned local websites in
this region.
Through our territorial licences we also trade in many other countries across Africa, Australasia and the
Middle East.
Strategy Our strategy is to enhance our position as a leading global lifestyle brand by the continuous
development of three main elements of our business model:
considered extension of the Ted Baker collections to achieve our brand growth potential. We
review our collections continually to ensure we anticipate and react to trends and meet our
customers’ expectations. In addition, we look for opportunities to extend the breadth of collections
and enhance our offer;
controlled distribution through three main channels: retail; wholesale; and licensing. We consider
each new opportunity to ensure it is right for the brand and will deliver margin led growth; and
further international growth through carefully managed development of overseas markets. We
continue to manage growth in existing territories while considering new territories for expansion.
Underlying our strategy is an emphasis on design, product quality and attention to detail, delivered by
the passion, commitment and skill of our teams, licence partners and wholesale customers.

8
Key Performance Indicators We review the on-going performance of the business using key performance indicators.
The Key Performance Indicators (“KPI’s”) that the Directors judge to be most effective in assessing
progress against the Group’s objectives and strategy have been detailed below and are considered
throughout the Strategic Report.
1 Constant currency variances are calculated by applying the previous financial period foreign exchange rates to
current period results in overseas subsidiaries to remove the impact of exchange rate fluctuations
2 Operating contribution is defined as operating profit as a percentage of revenue 3 Excludes licensed partner stores 4 Operating cashflow per share is defined as net cash generated from operating activities divided by the weighted
number of ordinary shares (diluted)
5 Working capital comprises inventories, trade and other receivables and trade and other payables
Key Performance Indicator 52 weeks ended
28 January 2017
52 weeks ended
30 January 2016
Variance Constant
currency
variance1
Group Revenue £531.0m £456.2m 16.4% 10.8%
Gross margin 61.0% 59.9%
Profit before tax (excluding
exceptional items) as a % of
revenue
12.4% 12.9%
Operating contribution (excluding
exceptional items) %2 12.6% 13.0%
Operating contribution (including
exceptional items) %2 11.8% 13.0%
Retail Revenue £400.7m £348.4m 15.0% 9.2%
E-Commerce £72.3m £53.5m 35.1% 32.3%
Gross margin 66.1% 64.8%
Average square footage3 387,373 357,096 8.5%
Closing square footage3 395,088 377,830 4.6%
Sales per square foot excluding e-
commerce £848 £826 2.7% (3.2%)
Wholesale Revenue £130.3m £107.7m 20.9% 15.9%
Gross margin 45.1% 43.8%
Licence
income Revenue £18.2m £14.4m 26.8%
Group Operating cashflow per share4 118.4p 93.3p 26.9%
Working capital5 £136.8m £113.5m 20.5%
9
Business Review
Distribution channels
The brand operates through three main distribution channels: retail, which includes e-commerce;
wholesale; and licensing, which includes territorial and product licences. As part of our strategy we look
to further develop each of these routes to market, whilst ensuring the controlled distribution of our
product.
Retail
Our retail channel comprises stores, concessions and e-commerce, which is now an integral part of our
retail experience. We operate stores and concessions across the UK, Europe, North America and Asia,
and localised e-commerce sites for the UK, Europe, US, Canada and Australia. We also have e-
commerce businesses with some of our concession partners.
The retail division performed well, with sales up 15.0% (9.2% in constant currency)1 to £400.7m (2016:
£348.4m) despite a challenging trading environment across our global markets. The growth was driven
by continued investments in new and existing stores and a strong e-commerce performance, where
sales grew by 35.1% (32.3% in constant currency)1 to £72.3m (2016: £53.5m) and represented 18.0%
(2016: 15.4%) of our total retail sales.
We continue to develop our retail proposition with further investment in each of our e-commerce sites,
aiming to provide a more relevant customer experience through improved design, performance and
personalised content. During the period, we launched our first language specific e-commerce sites for
France and Germany and have been pleased with their performance.
Average retail square footage rose by 8.5% over the period to 387,373 sq ft (2016: 357,096 sq ft). Total
retail square footage at 28 January 2017 was 395,088 sq ft (2016: 377,830 sq ft), an increase of 4.6%
on the prior period. Retail sales excluding e-commerce per square foot rose 2.7% (-3.2% in constant
currency)1 to £848 (2016: £826).
The retail gross margin increased to 66.1% (2016: 64.8%), primarily reflecting an improved full price sell-
through in our retail channel, as well as some foreign exchange benefits.
Retail operating costs increased 24.3% (17.0% in constant currency)1 to £203.3m (2016: £163.5m) and
as a percentage of retail sales, increased to 50.7% (2016: 46.9%). An element of the increase in retail
operating costs is due to dual running costs arising from the new European distribution centre, and
some store pre-opening costs in our North American market.
Wholesale
Our wholesale business in the UK serves countries across the world, primarily in the UK and Europe, as
well as supplying products to stores operated by our territorial licence partners. In addition, we operate a
wholesale business in North America serving the US and Canada.
Group wholesale sales increased by 20.9% (15.9% in constant currency)1 to £130.3m (2016: £107.7m),
reflecting a good performance from our UK wholesale business, with sales increasing by 10.4% to
£86.1m (2016: £78.0m), and a strong performance from our North American wholesale business, with
sales increasing by 48.8% (30.7% in constant currency)1 to £44.2m (2016: £29.7m).
The wholesale gross margin increased to 45.1% (2016: 43.8%), which was principally the result of a
greater proportion of wholesale sales to our trustee partners which carry a higher margin, as well as
some foreign exchange benefits.
Licence income
We operate both territorial and product licences. Our licence partners are all experts in their field and share our passion for unwavering attention to detail and firm commitment to quality. Our territorial licences cover specific countries or regions in Asia, Australasia, Europe, the Middle East and North America, where our partners operate licensed retail stores and, in some territories, wholesale operations.

10
Our product licences cover: Bedding; Childrenswear; Crockery; Eyewear; Footwear; Fragrance and Skinwear; Gifting and Stationery; Jewellery; Lingerie and Sleepwear; Luggage; Neckwear; Rugs; Suiting; Technical Accessories; Tiles; and Watches. Both territorial and product licences delivered good performances, with licence income up 26.8% to £18.2m (2016: £14.4m). There were notable performances from our product licencees in Childrenswear, Eyewear, Footwear, Homeware, Skinwear and Suiting.
In July 2016, we opened our first store in Vietnam with our new licence partner Maison, and we are encouraged by the performance to date. In November 2016, we opened our first store in Bahrain, and are pleased by the performance so far.
Collections
Ted Baker Womenswear delivered a good performance with sales up 19.7% to £304.3m (2016:
£254.1m). Womenswear represented 57.3% of total sales (2016: 55.7%).
Ted Baker Menswear performed well with sales up 12.2% to £226.7m (2016: £202.1m). Menswear
represented 42.7% of total sales in the period (2016: 44.3%).

11
Geographic Performance
United Kingdom and Europe
52 weeks
ended 28
January 2017
52 weeks
ended 30
January 2016
Variance Constant
currency
variance1
Total retail revenue* £279.5m £252.5m 10.7% 8.4%
E-commerce revenue £61.1m £46.8m 30.6% 29.8%
Average square footage* 246,826 236,685 4.3%
Closing square footage* 250,624 244,007 2.7%
Sales per square foot including e-
commerce sales £1,132 £1,067 6.1% 3.9%
Sales per square foot excluding e-
commerce sales £885 £869 1.8% (0.8%)
Wholesale revenue £86.1m £78.0m 10.4%
Own stores 36 38
Concessions 237 224
Outlets 14 13
Partner stores 3 3
Total 290 278
* Excludes licensed partner stores
Retail sales in UK and Europe increased by 10.7% to £279.5m (2016: £252.5m) (8.4% in constant
currency)1 despite tough trading conditions and the impact of terrorism in northern Europe.
Our e-commerce business performed very well during the period with sales increasing by 30.6% to
£61.1m (2016: £46.8m). E-commerce sales are an integral part of the retail proposition in the UK and
European markets. We launched our first language specific sites for France and Germany and are
pleased with their performance.
As a percentage of UK and Europe retail sales, e-commerce sales represented 21.9% (2016: 18.5%).
During the period, we opened an outlet in Madrid, Spain and further concessions with premium department stores in the UK, France, Germany and Spain. We closed two stores, one in the UK and one in France. We are pleased with the performance of the new openings and remain positive about further growth opportunities for our brand in these markets.
Sales from our UK wholesale division increased by 10.4% to £86.1m (2016: £78.0m) reflecting a good
performance from sales to Trustees, which include our wholesale export business and the supply of
product to our retail licence partners.
North America
52 weeks
ended 28
January 2017
52 weeks
ended 30
January 2016
Variance Constant
currency
variance1
Total retail revenue* £103.4m £80.6m 28.3% 13.0%
E-commerce revenue £9.8m £6.6m 48.5% 31.2%
Average square footage * 112,110 94,496 18.6%
Closing square footage * 116,590 106,471 9.5%
Sales per square foot including e-
commerce sales £922 £853 8.1% (4.7%)
Sales per square foot excluding e-
commerce sales £835 £784 6.5% (6.1%)
Wholesale revenue £44.2m £29.7m 48.8% 30.7%
Own stores 31 25

12
Concessions 55 55
Outlets 11 10
Partner Stores 14 7
Total 111 97
* Excludes licensed partner stores
We are very pleased with our progress across both the retail and wholesale channels in North America,
despite well documented challenges facing the North American retail market, which has seen increased
levels of promotional activity and a fall in international tourism. This has resulted in a challenging
environment not only for our stores but also for our key trading partners. However, we remain confident
that the Ted Baker brand is becoming more established and continuing to gain recognition in this
territory.
Sales from our retail division in North America increased by 28.3% to £103.4m (2016: £80.6m) (13.0%
in constant currency)1. During the period, we continued our expansion with new stores in Atlanta, Miami,
New York, Seattle and relocated our Dallas store, and we opened new stores in Calgary, Ottawa and an
outlet in Vancouver. We also opened seven concessions in Mexico with our licence partner. We closed
one store in New York.
Our e-commerce businesses delivered strong performances with sales increasing 48.5% to £9.8m
(31.2% in constant currency)1. As a percentage of North America retail sales, e-commerce sales
represent 9.5% (2016: 8.2%).
Sales from our North American wholesale business increased by 48.8% to £44.2m (2016: £29.7m)
(30.7% in constant currency)1 reflecting the brand’s increased appeal and recognition in this territory.
Middle East, Asia, Africa and Australasia
52 weeks
ended 28
January
2017
52 weeks
ended 30
January
2016
Variance Constant
currency
variance1
Total retail revenue £17.8m £15.4m 15.6% 2.6%
E-commerce revenue £1.4m -
Average square footage * 28,438 25,915 9.7%
Closing square footage * 27,874 27,352 1.9%
Sales per square foot including e-
commerce sales £625 £593 5.4%
(6.5%)
Sales per square foot excluding e-
commerce sales
£576
£593
(2.9%)
(14.0%)
Own stores 8 8
Concessions 15 8
Outlets 3 3
Partner stores 63 54
Total 89 73
* Excludes licensed partner stores
We continue to develop the Ted Baker brand across the Middle East, Asia and Australasia through our
retail and licensing channels.
We remain positive about the long-term opportunities in Asia. However, as has been widely reported,
the trading environment continues to be challenging. Retail sales in Asia increased 15.6% to £17.8m
(2016: £15.4m) (2.6% in constant currency)1. In Hong Kong, we relocated one store; in China, we
opened a store in Beijing and four further concessions; and in Japan, we opened three concessions and
closed one store in Tokyo, which has been relocated since the period end. During the period, we
launched online concession businesses in China and Japan, and we are pleased with the early reaction
to these sites.

13
During the period, our Middle Eastern licence partners performed particularly well and opened stores in
each of Azerbaijan, Dubai and Egypt and our first store in Bahrain. Our South East Asian licence partner
opened a store in Indonesia, and a new licence partner store opened in Vietnam. We opened two stores
in Taiwan and closed one. As at 28 January 2017, our licence partners operated 54 stores and
concessions across the Middle East, South East Asia, and Africa (2016: 45).
The joint venture with our Australasian licence partner, Flair Industries Pty Ltd, continued to perform
well. As at 28 January 2017, we operated 9 stores in Australasia (2016: 9 stores).
Notes: 1 Constant currency variances are calculated by applying the previous financial period foreign exchange rates to
current period results in overseas subsidiaries to remove the impact of exchange rate fluctuations.
The Directors believe this measure provides a consistent and comparable view of the underlying performance of the
Group’s on-going business.

14
Financial Review Revenue and Gross Margin
Group revenue increased by 16.4% (10.8% in constant currency)1 to £531.0m (2016: £456.2m), driven
by a 15.0% (9.2% in constant currency)1 increase in retail sales to £400.7m (2016: £348.4m) and a
20.9% (15.9% in constant currency)1 increase in wholesale sales to £130.3m (2016: £107.7m).
The gross margin for the Group increased to 61.0% (2016: 59.9%) as a result of improved full price sell-
through in our retail channel and an improved mix of wholesale sales to trustee customers, as well as
some foreign exchange benefits.
Operating Expenses Pre-Exceptional items2
Distribution costs increased by 22.7% (15.5% in constant currency)1 to £208.2m (2016: £169.8m) and
as a percentage of sales increased to 39.2% (2016: 37.2%). An element of the increase in distribution
costs is due to dual running costs arising from the new European distribution centre, and some store
pre-opening costs in our North American market.
Administration expenses excluding exceptional costs2 increased by 14.2% (10.6% in constant
currency)1 to £65.6m (2016: £57.4m). Excluding the employee performance related bonus of £nil (2016:
£2.7m), administration expenses rose by 19.8% due to growth of our central functions, both in the UK
and overseas, and the continued deployment of our information technology infrastructures to support
our growth.
Dual running costs incurred in respect of our new European distribution centre and the systems roll-out
were £4.0m in the period.
Profit Before Tax
Profit before tax and exceptional items2 increased by 12.1% to £65.8m (2016: £58.7m) and profit before
tax increased by 4.4% to £61.3m (2016: £58.7m).
Exceptional Items
Exceptional items in the period of £4.5m (2016: £nil) include a provision for lease commitments relating
to the Group’s legacy warehouses of £2.9m along with £0.7m of other closure costs and £0.9m in
respect of closure costs for a concept store in London. There were no exceptional items in the previous
period.
Finance Income and Expenses
Net interest payable during the period was £2.9m (2016: £1.4m). The increase was largely due to
interest payable on the term loan that financed the purchase of the freehold of The Ugly Brown Building.
The net foreign exchange gain during the period of £1.1m (2016: £nil) was due to the translation of
monetary assets and liabilities denominated in foreign currencies following the devaluation of sterling
that followed the UK’s EU referendum result.
Taxation
The Group tax charge for the period was £14.7m (2016: £14.4m), an effective tax rate of 24.0% (2016:
24.6%). This effective tax rate is higher than the UK tax rate for the period of 20% largely due to higher
overseas tax rates and to the non-recognition of losses in overseas territories where the businesses are
still in their development phase. The UK corporation tax rate will reduce to 19% from 1 April 2017 and
17% from 1 April 2020.
Our closing UK deferred tax assets and liabilities have been measured at 19% based on the corporation
tax rate at which they are anticipated to unwind and overseas deferred tax assets and liabilities have
been measured at the applicable overseas tax rates.
Our future effective tax rate is expected to be higher than the UK tax rate as a result of a growing
proportion of overseas profits arising in jurisdictions with higher tax rates than the UK.
Cash Flow
The net decrease in cash and cash equivalents of £13.5m (2016: £5.9m) primarily reflected an increase
in working capital and further capital expenditure to support our long-term development.

15
Total working capital, which comprises inventories, trade and other receivables and trade and other
payables, increased by £23.3m to £136.8m (2016: £113.5m). This was mainly driven by an increase in
inventories of £33.2m to £158.5m (2016: £125.3m) reflecting the growth of our business, stock on hand
for our wholesale customers and licence partners, and earlier phasing of stock deliveries at the end of
the financial period due to the timing of Chinese New Year, which fell at the end of the period. In addition
to this, inventory has increased due to the impact of foreign exchange rates on the translation of
inventory in overseas subsidiaries.
Income taxes paid decreased by £2.5m to £10.6m (2016: £13.1m). This was largely due to accelerated
tax deductions on US store openings and refurbishments.
Group capital expenditure of £43.8m (2016: £89.5m including £58.0m relating to the purchase of The
Ugly Brown Building) relates to the opening and refurbishment of stores, concessions and outlets, the fit-
out of our new European distribution centre and the on-going investment in business-wide IT systems to
support our continued growth.
The Group’s net borrowing position at the end of the period was £95.2m (2016: £84.6m).
Shareholder Return
Basic earnings per share increased by 5.1% to 105.7p (2016: 100.6p). Adjusted earnings per share,
which exclude exceptional items2, increased by 13.3% to 114.0p (2016: 100.6p).
The proposed final dividend of 38.8p per share will make a total for the period of 53.6p per share (2016:
47.8p per share), an increase of 12.1% on the previous period.
Operating cash flow per share was 118.4p (2016: 93.3p) and reflected an increase in cash generated
from operating activities.
Borrowing Facilities
During the period, the Group agreed an extension of its multi-currency revolving credit facility with The
Royal Bank of Scotland and Barclays. A new agreement was signed on 31 May 2016 which increased
the Group’s committed borrowing facility from £85m to £110m expiring in March 2018. The increase is a
function of the growth in our business and is necessary to fund capital expenditure to support the
Group’s long-term strategy.
In the prior period, the Group entered into a five year £60m secured term loan, in addition to the existing
multi-currency revolving credit facility with The Royal Bank of Scotland and Barclays. The term loan is
amortised over fifteen years and the proceeds were used to finance the purchase of The Ugly Brown
Building.
The facility and term loan contain appropriate financial covenants that are tested on a quarterly basis.
The Group monitors actual and prospective compliance with these on a regular basis.
Treasury Risk Management
The most significant exposure to foreign exchange fluctuation relates to purchases made in foreign
currencies, principally the US Dollar and the Euro.
A proportion of the Group’s purchases are hedged in accordance with the Group’s risk management
policy, which allows for foreign currency to be hedged for up to 24 months in advance. The balance of
purchases is hedged naturally as the business operates internationally and income is generated in the
local currencies.
In June 2016, ahead of the UK referendum on Brexit, the Group extended its hedging arrangements for
US Dollars to April 2018. At the balance sheet date, the Group has hedged its projected commitments in
respect of the period ending 27 January 2018 as well as a proportion of its requirements for the
following period.
The Group is exposed to movements in UK interest rates as both the revolving credit facility and term
loan accrue interest based on LIBOR plus a fixed margin.

16
During the period, the Group entered into interest rate swap agreements, fixing £30.0m of the floating
rate net debt.
Notes:
1 Constant currency variances are calculated by applying the previous financial period foreign exchange rates to
current period results in overseas subsidiaries to remove the impact of exchange rate fluctuations. 2 Exceptional items are excluded from profit before tax and exceptional items due to these items being one-off and
material in nature.
3 Exceptional items are excluded from adjusted earnings per share due to these items being one-off and material in
nature.
The Directors believe these measures provide a consistent and comparable view of the underlying performance of
the Group’s on-going business.

17
Principal Risks and Uncertainties
The Board is ultimately responsible for the Group’s system of risk management and internal control and
for reviewing their effectiveness. The Board confirms that there is an on-going process for identifying,
evaluating and managing the significant risks faced by the Group, which has been in place for the period
and up to the date of approval of these financial statements, and that this process is regularly reviewed
by the Board. However, such systems are designed to manage rather than eliminate the risk of failure to
achieve business objectives, and can provide only reasonable and not absolute assurance against
material misstatement or loss.
In order to help manage these risks and uncertainties, the Board has delegated responsibility for
monitoring the effectiveness of the Group’s systems of internal control and risk management to the Audit
Committee.
In addition, the Group has established a Risk Committee that includes the Finance Director and various
members of the Executive Committee and heads of department. The Risk Committee reviews the risk
management and control process in each key business area on an on-going basis, and provides a
platform for management to drive improvement across the business. The Risk Committee considers:
• the authority, resources and co-ordination of those involved in the identification, assessment
and management of significant risks faced by the Group;
• the response to the significant risks which have been identified by management and others;
• the maintenance of a controlled environment directed towards the proper management of risk;
and
• the annual reporting procedures.
Having considered the key risks inherent in the business and the system of control necessary to
manage such risks, the Finance Director presents the Risk Committee’s findings to the Board on a
regular basis. In addition, the Chief Executive reports to the Board on changes in the business and the
external environment which affect significant risks.
On behalf of the Board, the Audit Committee has reviewed the effectiveness of the system of risk
management and internal control during the period. In particular, it has reviewed and updated the
process for identifying and evaluating the significant risks affecting the business and the policies and
procedures by which these risks are managed. Management is responsible for the identification and
evaluation of significant risks applicable to their areas of the business together with the design and
operation of suitable internal controls. These risks are assessed on a continual basis and may be
associated with a variety of internal or external sources including control breakdowns, disruption in
information systems, competition, natural catastrophe and regulatory requirements, and also by
reference to the Group’s five year strategic and financial plan. During the period the Board has placed
significant focus on risk management. As such, during the period the Audit Committee engaged
PricewaterhouseCoopers LLP (“PwC”) to undertake a detailed review of the Group’s risk framework and
internal audit function via in-depth interviews with senior management and key stakeholders across the
Group.
The Group has an independent internal audit function whose findings are regularly reviewed by the
Board and the Executive Committee. The Audit Committee monitors and reviews the effectiveness of
the internal audit activities.
The Chief Operating Officer provides the Board with monthly financial information which includes key
performance indicators.
The Board has carried out a robust assessment of the principal risks facing the Group, including those
that would threaten its business model, future performance, solvency or liquidity. Although not
exhaustive, the following list highlights some of the principal risks identified by the Group (which are not
shown in order of importance). Additional risks and uncertainties not presently known, or currently
considered to be less material, may also have an adverse effect on the Group:

18
Issue Potential impact Mitigation
Strategic Risks
Brand and Reputational Risk
The strength and reputation of the Ted Baker brand is important to the business. There is a risk that our brand may be undermined or damaged by our actions or those of our partners or supply chain.
We carefully consider each new partner with whom we do business. Such partners are subject to due diligence and are monitored on an on-going basis to ensure they remain appropriate to the brand. Our dedicated social media team closely monitors social media channels and addresses any reputational issues in accordance with our protocol.
Development of Overseas Markets
Failure in growing the international business through franchise operations, licencees and e-commerce. Risk that the Group fails to prioritise the right territories or investment or fails to support these markets with systems and supply chain capability.
We perform extensive due diligence on all potential partners and territories and to assess our appropriate routes to market. We operate in a range of international markets, which helps to mitigate over-reliance and exposure to any one territory.
Fashion and Design
As with all fashion brands there is a risk that our offer will not satisfy the needs of our customers or we fail to correctly identify trends in an increasingly competitive market, resulting in lower sales and reduced market share.
We maintain a high level of market awareness and an understanding of consumer trends and fashion to ensure that we remain able to respond to changes in consumer preference. We use customer data to develop targeted marketing and promotional activity. We continue to focus on product design, quality and attention to detail.
External Events
External events may occur which may affect the global, economic and financial environment in which we operate. These events can affect our suppliers, customers and partners, increasing our cost base and adversely affecting our revenue.
These risk factors are monitored closely on an on-going basis ensuring that we are prepared for and can react to changes in the external environment, allowing us to reduce our exposure as early as possible. The geographic spread of our business and supply chain also helps to mitigate these risks.
Brexit
The UK’s decision to leave the European Union has increased the level of economic and consumer uncertainty.
The Group and its external advisers continue to carefully monitor the potential impact of Brexit. Our presence in a range of international markets helps mitigate the impact of this risk.
Operational Risks
Supply Chain
If garments do not reach us on time and to specification, there is a risk of a loss of revenue and customer confidence. Over reliance on key suppliers could also have an impact on our business.
Our supply chain is diversified across a number of suppliers in different regions, reducing reliance on a small number of key suppliers. Suppliers are treated as key business partners and we work closely with them to mitigate these risks. The Group continues to improve and evolve its supply chain.
Infrastructure
There is a risk of operational problems, including disruption to the infrastructure that supports our business, which may lead to a loss of revenue, data and inventory.
The business continuity plan is constantly reviewed and updated by the Risk Committee. In addition, business disruption is covered by our insurance policies.
19
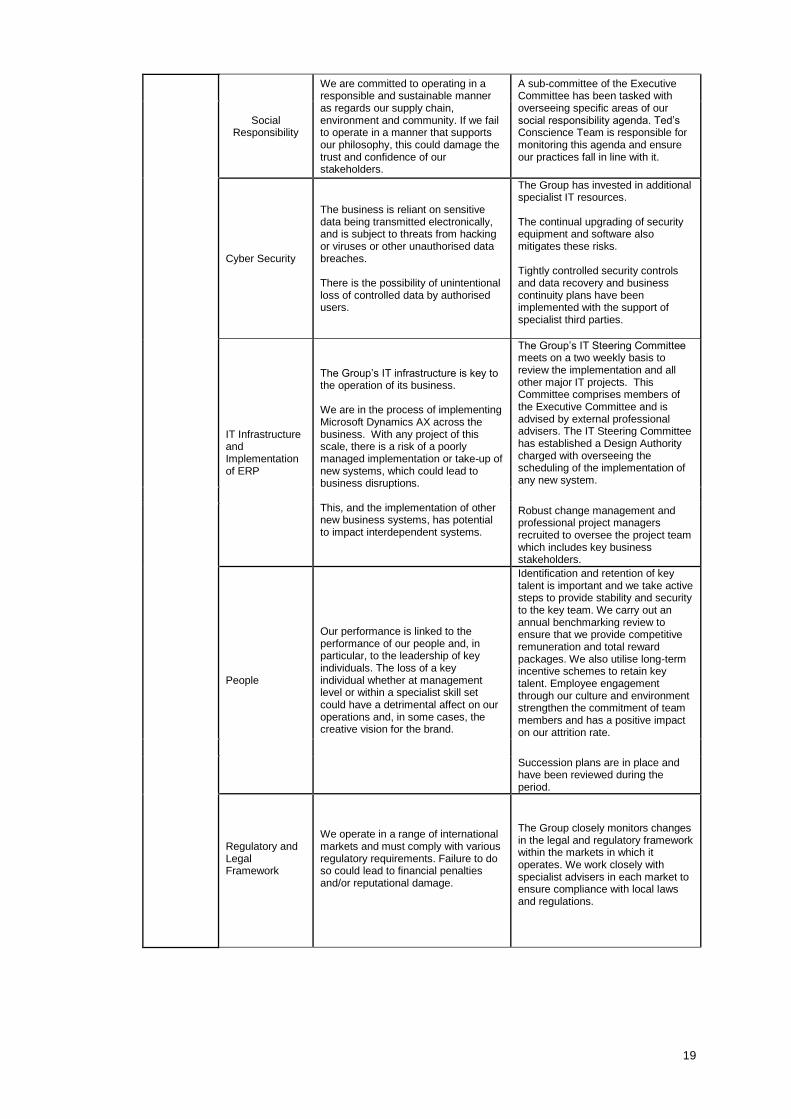
Social Responsibility
We are committed to operating in a responsible and sustainable manner as regards our supply chain, environment and community. If we fail to operate in a manner that supports our philosophy, this could damage the trust and confidence of our stakeholders.
A sub-committee of the Executive Committee has been tasked with overseeing specific areas of our social responsibility agenda. Ted’s Conscience Team is responsible for monitoring this agenda and ensure our practices fall in line with it.
Cyber Security
The business is reliant on sensitive data being transmitted electronically, and is subject to threats from hacking or viruses or other unauthorised data breaches. There is the possibility of unintentional loss of controlled data by authorised users.
The Group has invested in additional specialist IT resources. The continual upgrading of security equipment and software also mitigates these risks. Tightly controlled security controls and data recovery and business continuity plans have been implemented with the support of specialist third parties.
IT Infrastructure and Implementation of ERP
The Group’s IT infrastructure is key to the operation of its business. We are in the process of implementing Microsoft Dynamics AX across the business. With any project of this scale, there is a risk of a poorly managed implementation or take-up of new systems, which could lead to business disruptions. This, and the implementation of other new business systems, has potential to impact interdependent systems.
The Group’s IT Steering Committee meets on a two weekly basis to review the implementation and all other major IT projects. This Committee comprises members of the Executive Committee and is advised by external professional advisers. The IT Steering Committee has established a Design Authority charged with overseeing the scheduling of the implementation of any new system.
Robust change management and professional project managers recruited to oversee the project team which includes key business stakeholders.
People
Our performance is linked to the performance of our people and, in particular, to the leadership of key individuals. The loss of a key individual whether at management level or within a specialist skill set could have a detrimental affect on our operations and, in some cases, the creative vision for the brand.
Identification and retention of key talent is important and we take active steps to provide stability and security to the key team. We carry out an annual benchmarking review to ensure that we provide competitive remuneration and total reward packages. We also utilise long-term incentive schemes to retain key talent. Employee engagement through our culture and environment strengthen the commitment of team members and has a positive impact on our attrition rate.
Succession plans are in place and have been reviewed during the period.
Regulatory and Legal Framework
We operate in a range of international markets and must comply with various regulatory requirements. Failure to do so could lead to financial penalties and/or reputational damage.
The Group closely monitors changes in the legal and regulatory framework within the markets in which it operates. We work closely with specialist advisers in each market to ensure compliance with local laws and regulations.
20
Infringement of the Group’s Intellectual Property
Unauthorised use of the Group’s designs, trademarks and other intellectual property rights could damage the Ted Baker brand and the Group’s reputation.
The Group, with its external advisers, rigorously manages and defends its intellectual property. The Group deals with counterfeit goods in accordance with its robust enforcement strategy.
Financial Risks
Currency, Interest, Credit and Counterparty Credit Risks, including Financial Covenants under the Group’s credit facilities
In the course of its operations, we are exposed to these financial risks which, if they were to arise, may have material financial impacts on the Group.
The Group’s policies for dealing with these risks are discussed in detail in Note 23 to the financial statements.
Foreign Exchange
The Group is exposed to fluctuations in the exchange rates of key currencies.
The Group’s Foreign Exchange strategy is closely managed by the Finance Director and the Group’s external advisers. The Group has adopted a hedging policy to mitigate short-term foreign exchange risk.
Viability statement
In accordance with provision C.2.2 of the UK Corporate Governance Code dated September 2014 (the
“Code”) the Directors have assessed the viability of the Group over a five year period, taking into
account the Group’s current position and the potential impact of the principal risks documented above.
The Group operates a five year plan, which is updated and reviewed annually by the Board. Within the
five year plan, detailed scenario planning and stress testing has been carried out over a five year period.
The Directors therefore consider the five year period to 30 January 2022 to be the appropriate period to
assess the viability and prospects of the Group with a high level of certainty.
The Directors’ assessment has been further enhanced by analysing the current and future risks,
controls and assurances available, resulting in a clear picture of the risk profile across the whole
business. The principal risks, including specific operational risks, that could affect the future viability of
the Group over the next five years are identified in the Principal Risks and Uncertainties section.
In making this assessment the Directors have considered the resilience of the Group to the occurrence
of these risks in severe but plausible scenarios, taking into account the effectiveness of any mitigating
actions. In addition, the Board has considered the impact on the Group’s cash flows, headroom,
covenants and other key financial ratios having stress tested the potential impact of these scenarios,
both individually and in combination.
Sensitivity analysis was also used to stress test the Group’s strategic plan and to confirm that sufficient
headroom would remain available under the Group’s credit facilities. The Board considers that under
each scenario tested the mitigating actions would be effective and sufficient to ensure the continued
viability of the Group. For the reasons stated above, based on the robust assessment undertaken, the
Directors confirm they have a reasonable expectation that the Group will be able to continue in
operation, and meet its liabilities as they fall due, over the period of assessment.
Going Concern The Directors have reviewed the Group’s budgets and long-term projections. After making enquiries, the
Directors have a reasonable expectation that the Company and the Group have adequate resources to
continue in operational existence for 12 months from the approval of these accounts. For this reason,
they continue to adopt the going concern basis in preparing the financial statements.
21
The Strategic Report was approved by the Board of Directors on 23 March 2017 and signed on its
behalf by:
Charles Anderson
Finance Director and Company Secretary 23 March 2017
Registered Office: The Ugly Brown Building, 6a St. Pancras Way, London NW1 0TB Company No: 03393836
22
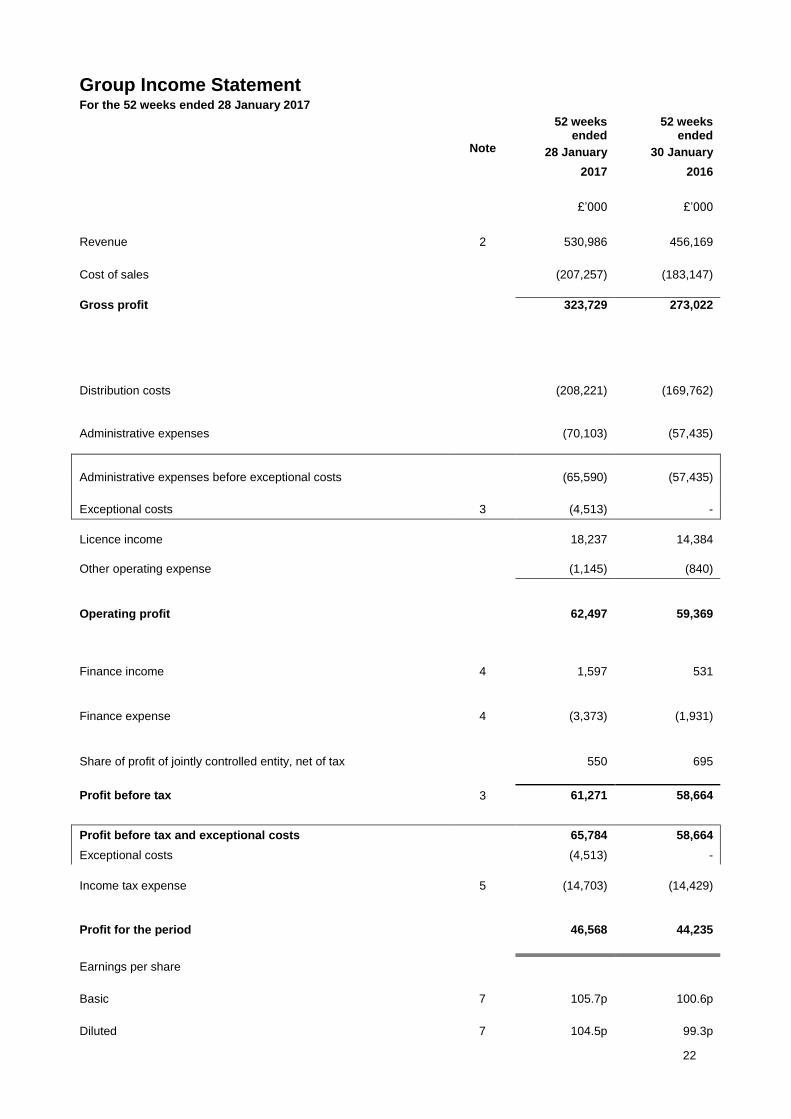
Group Income Statement For the 52 weeks ended 28 January 2017
Note
52 weeks ended
52 weeks ended
28 January 30 January
2017 2016
£’000 £’000
Revenue 2 530,986 456,169
Cost of sales
(207,257) (183,147)
Gross profit 323,729 273,022
Distribution costs
(208,221)
(169,762)
Administrative expenses
(70,103) (57,435)
Administrative expenses before exceptional costs
(65,590) (57,435)
Exceptional costs 3 (4,513) -
Licence income 18,237 14,384
Other operating expense (1,145) (840)
Operating profit
62,497 59,369
Finance income 4 1,597 531
Finance expense 4 (3,373) (1,931)
Share of profit of jointly controlled entity, net of tax
550 695
Profit before tax 3 61,271 58,664
Profit before tax and exceptional costs 65,784 58,664
Exceptional costs (4,513) -
Income tax expense
5
(14,703)
(14,429)
Profit for the period
46,568 44,235
Earnings per share
Basic 7 105.7p 100.6p
Diluted 7 104.5p 99.3p
23
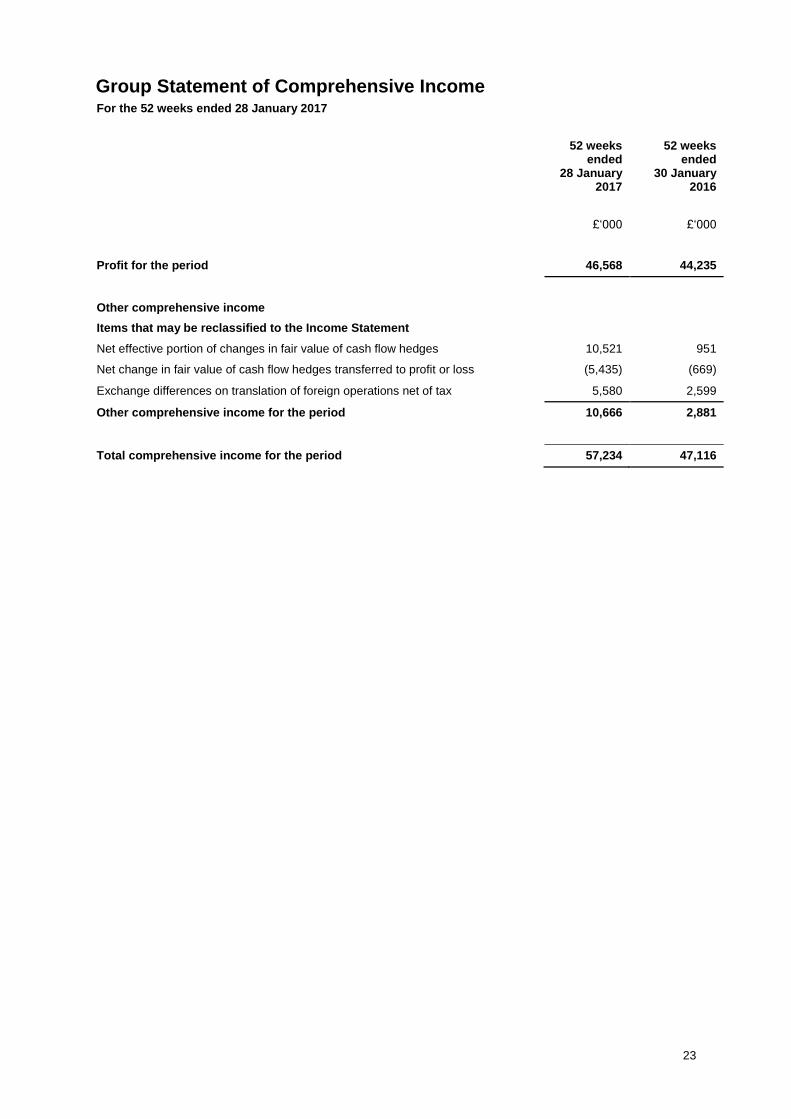
Group Statement of Comprehensive Income For the 52 weeks ended 28 January 2017
52 weeks ended
28 January 2017
52 weeks ended
30 January 2016
£‘000 £‘000
Profit for the period 46,568 44,235
Other comprehensive income
Items that may be reclassified to the Income Statement
Net effective portion of changes in fair value of cash flow hedges 10,521 951
Net change in fair value of cash flow hedges transferred to profit or loss (5,435) (669)
Exchange differences on translation of foreign operations net of tax 5,580 2,599
Other comprehensive income for the period 10,666 2,881
Total comprehensive income for the period 57,234 47,116
24
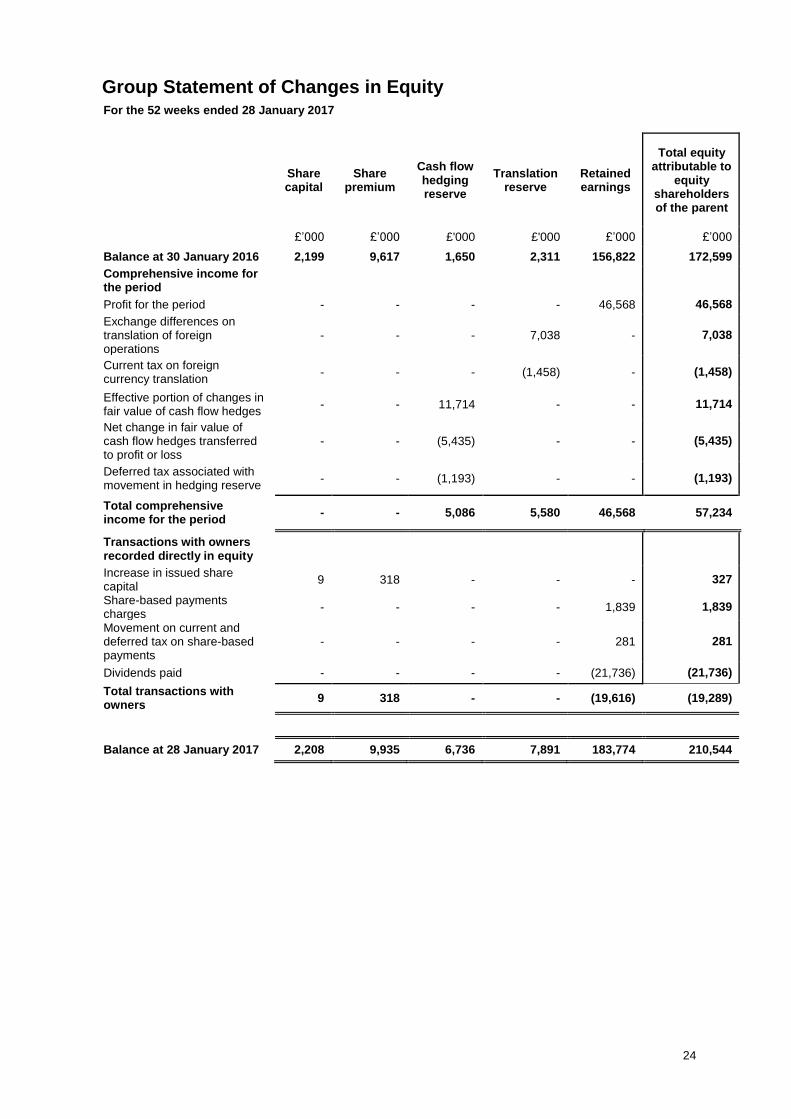
Group Statement of Changes in Equity
For the 52 weeks ended 28 January 2017
Share capital
Share premium
Cash flow hedging reserve
Translation reserve
Retained earnings
Total equity attributable to
equity shareholders of the parent
£’000 £’000 £'000 £'000 £’000 £’000
Balance at 30 January 2016 2,199 9,617 1,650 2,311 156,822 172,599
Comprehensive income for the period
Profit for the period - - - - 46,568 46,568
Exchange differences on translation of foreign operations
- - - 7,038 - 7,038
Current tax on foreign currency translation
- - - (1,458) - (1,458)
Effective portion of changes in fair value of cash flow hedges
- - 11,714 - - 11,714
Net change in fair value of cash flow hedges transferred to profit or loss
- - (5,435) - - (5,435)
Deferred tax associated with movement in hedging reserve
- - (1,193) - - (1,193)
Total comprehensive income for the period
- - 5,086 5,580 46,568 57,234
Transactions with owners recorded directly in equity
Increase in issued share capital
9 318 - - - 327
Share-based payments charges
- - - - 1,839 1,839
Movement on current and deferred tax on share-based payments
- - - - 281 281
Dividends paid - - - - (21,736) (21,736)
Total transactions with owners
9 318 - - (19,616) (19,289)
Balance at 28 January 2017 2,208 9,935 6,736 7,891 183,774 210,544
25
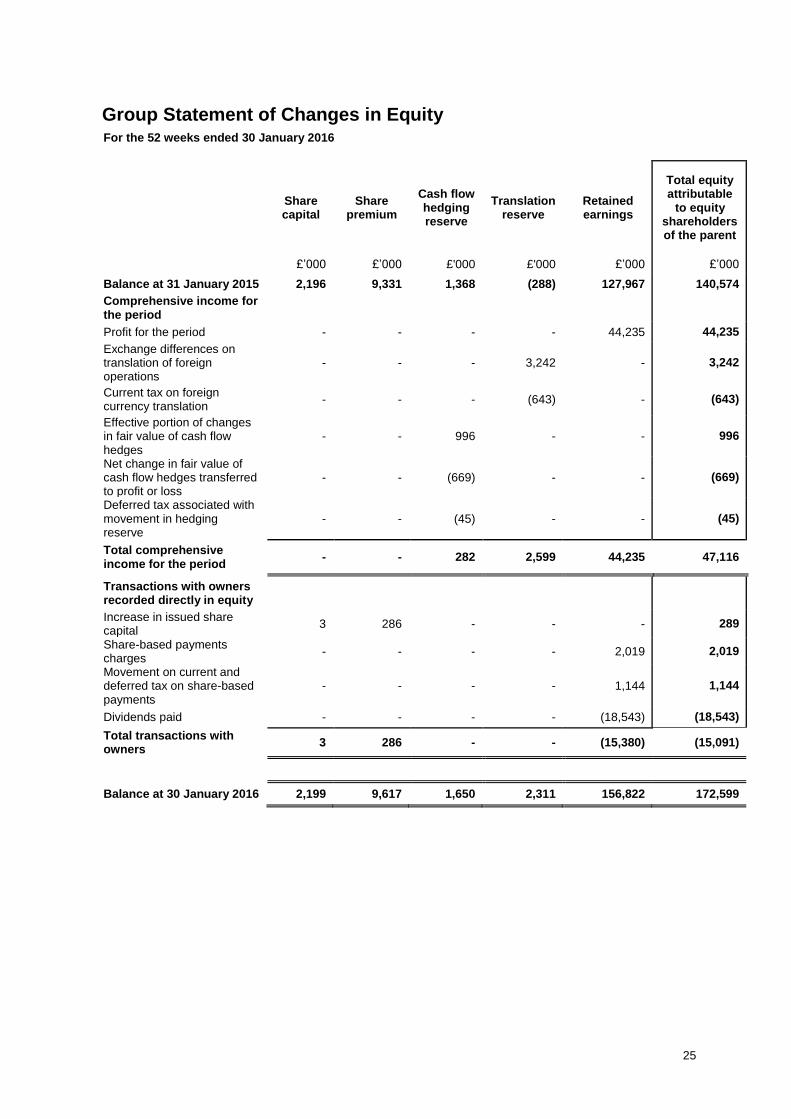
Group Statement of Changes in Equity
For the 52 weeks ended 30 January 2016
Share capital
Share premium
Cash flow hedging reserve
Translation reserve
Retained earnings
Total equity attributable
to equity shareholders of the parent
£’000 £’000 £'000 £'000 £’000 £’000
Balance at 31 January 2015 2,196 9,331 1,368 (288) 127,967 140,574
Comprehensive income for the period
Profit for the period - - - - 44,235 44,235
Exchange differences on translation of foreign operations
- - - 3,242 - 3,242
Current tax on foreign currency translation
- - - (643) - (643)
Effective portion of changes in fair value of cash flow hedges
- - 996 - - 996
Net change in fair value of cash flow hedges transferred to profit or loss
- - (669) - - (669)
Deferred tax associated with movement in hedging reserve
- - (45) - - (45)
Total comprehensive income for the period
- - 282 2,599 44,235 47,116
Transactions with owners recorded directly in equity
Increase in issued share capital
3 286 - - - 289
Share-based payments charges
- - - - 2,019 2,019
Movement on current and deferred tax on share-based payments
- - - - 1,144 1,144
Dividends paid - - - - (18,543) (18,543)
Total transactions with owners
3 286 - - (15,380) (15,091)
Balance at 30 January 2016 2,199 9,617 1,650 2,311 156,822 172,599

26
Company Statement of Changes in Equity For the 52 weeks ended 28 January 2017
Share capital
Share
premium
Other reserves
Retained
earnings
Total equity
£’000 £’000 £’000 £’000 £’000
Balance at 30 January 2016 2,199 9,617 19,060 38,697 69,573
Profit for the period - - - 27,246 27,246
Transactions with owners recorded
directly in equity
Increase in issued share capital 9 318 - - 327
Share-based payments charges - - - 219 219
Share-based payments charges for
awards granted to subsidiary employees - - 1,620 - 1,620
Dividends paid - - - (21,736) (21,736)
Total transactions with owners 9 318 1,620 (21,517) (19,570)
Balance at 28 January 2017 2,208 9,935 20,680 44,426 77,249

27
Company Statement of Changes in Equity For the 52 weeks ended 30 January 2016
Share capital
Share
premium
Other reserves
Retained
earnings
Total equity
£’000 £’000 £’000 £’000 £’000
Balance at 31 January 2015 2,196 9,331 17,287 32,978 61,792
Profit for the period - - - 24,016 24,016
Transactions with owners recorded
directly in equity
Increase in issued share capital 3 286 - - 289
Share-based payments charges - - - 246 246
Share-based payments charges for
awards granted to subsidiary
employees - - 1,773 - 1,773
Dividends paid - - - (18,543) (18,543)
Total transactions with owners 3 286 1,773 (18,297) (16,235)
Balance at 30 January 2016 2,199 9,617 19,060 38,697 69,573

28
Group and Company Balance Sheet At 28 January 2017
Note Group Group Company Company
28-Jan-17 30-Jan-16 28-Jan-17 30-Jan-16
£’000 £’000 £’000 £’000
Intangible assets 8 24,445 17,247 - -
Property, plant and equipment 9 144,354 123,397 - -
Investments in subsidiary
- - 23,102 21,482
Investment in equity accounted investee
1,897 1,641 - -
Deferred tax assets
4,446 6,313 - -
Prepayments
401 414 - -
Non-current assets
175,543 149,012 23,102 21,482
Inventories 158,500 125,323 - -
Trade and other receivables 59,251 49,303 51,932 47,486
Amount due from equity accounted investee 653 563 - -
Derivative financial assets 8,974 2,850 - -
Cash and cash equivalents 21,401 13,295 2,238 615
Current assets
248,779 191,334 54,170 48,101
Trade and other payables (80,995) (61,088) (23) (10)
Bank overdraft (58,074) (37,869) - -
Term loan (6,000) (1,500) - -
Income tax payable (10,327) (8,382) - -
Provisions for liabilities and charges (915) - - -
Derivative financial liabilities (616) (352) - -
Current liabilities
(156,927) (109,191) (23) (10)
Deferred tax liability (2,349) (56) - -
Provisions for liabilities and charges (2,002) - - -
Term loan (52,500) (58,500) - -
Non-current liabilities
(56,851) (58,556) - -
Net assets
210,544 172,599 77,249 69,573
Equity
Share capital 2,208 2,199 2,208 2,199
Share premium 9,935 9,617 9,935 9,617
Other reserves 6,736 1,650 20,680 19,060
Translation reserve 7,891 2,311 - -
Retained earnings 183,774 156,822 44,426 38,697
Total equity attributable to equity shareholders of the parent company
210,544 172,599 77,249 69,573
Total equity
210,544 172,599 77,249 69,573

29
These financial statements were approved by the Board of Directors on 23 March 2017 and were signed on its
behalf by:
Lindsay Page
Director
Company number: 03393836
30
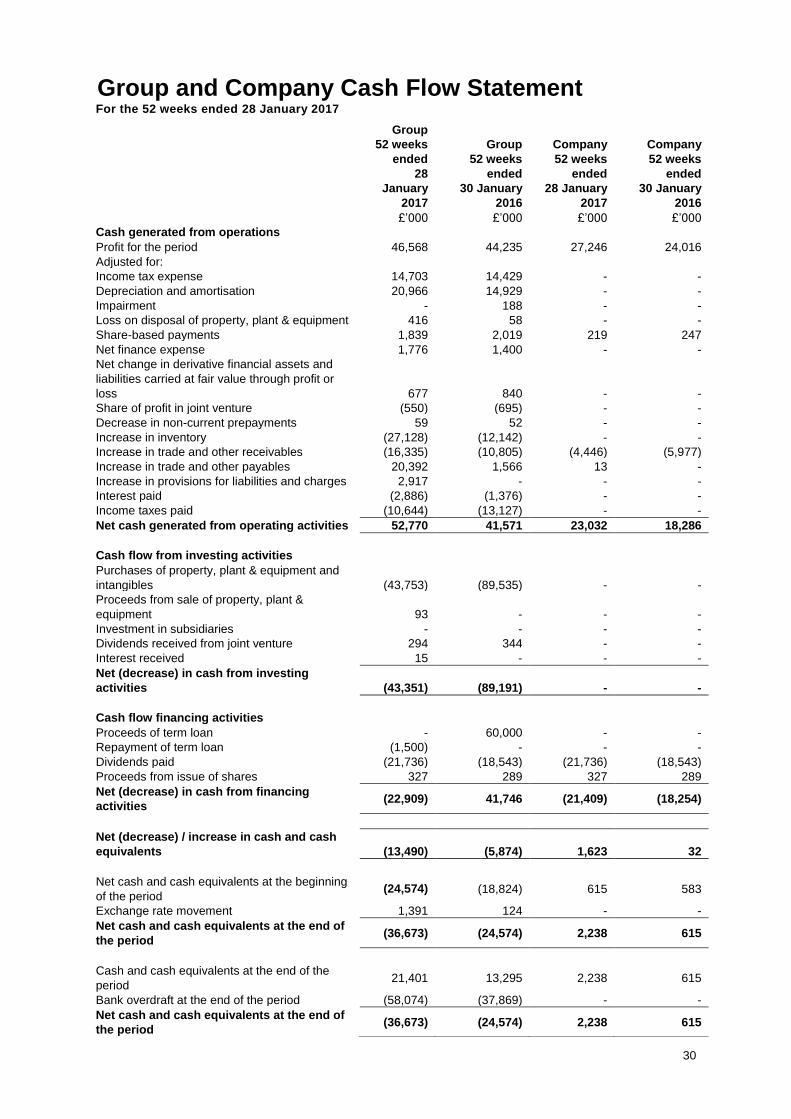
Group and Company Cash Flow Statement
For the 52 weeks ended 28 January 2017
Group
52 weeks
ended
28
January
2017
Group
52 weeks
ended
30 January
2016
Company
52 weeks
ended
28 January
2017
Company
52 weeks
ended
30 January
2016
£’000 £’000 £’000 £’000
Cash generated from operations
Profit for the period 46,568 44,235 27,246 24,016
Adjusted for:
Income tax expense 14,703 14,429 - -
Depreciation and amortisation 20,966 14,929 - -
Impairment - 188 - -
Loss on disposal of property, plant & equipment 416 58 - -
Share-based payments 1,839 2,019 219 247
Net finance expense 1,776 1,400 - -
Net change in derivative financial assets and
liabilities carried at fair value through profit or
loss 677 840 - -
Share of profit in joint venture (550) (695) - -
Decrease in non-current prepayments 59 52 - -
Increase in inventory (27,128) (12,142) - -
Increase in trade and other receivables (16,335) (10,805) (4,446) (5,977)
Increase in trade and other payables 20,392 1,566 13 -
Increase in provisions for liabilities and charges 2,917 - - -
Interest paid (2,886) (1,376) - -
Income taxes paid (10,644) (13,127) - -
Net cash generated from operating activities 52,770 41,571 23,032 18,286
Cash flow from investing activities
Purchases of property, plant & equipment and
intangibles (43,753) (89,535) - -
Proceeds from sale of property, plant &
equipment 93 - - -
Investment in subsidiaries - - - -
Dividends received from joint venture 294 344 - -
Interest received 15 - - -
Net (decrease) in cash from investing
activities (43,351) (89,191) - -
Cash flow financing activities
Proceeds of term loan - 60,000 - -
Repayment of term loan (1,500) - - -
Dividends paid (21,736) (18,543) (21,736) (18,543)
Proceeds from issue of shares 327 289 327 289
Net (decrease) in cash from financing
activities (22,909) 41,746 (21,409) (18,254)
Net (decrease) / increase in cash and cash
equivalents (13,490) (5,874) 1,623 32
Net cash and cash equivalents at the beginning
of the period (24,574) (18,824) 615 583
Exchange rate movement 1,391 124 - -
Net cash and cash equivalents at the end of
the period (36,673) (24,574) 2,238 615
Cash and cash equivalents at the end of the
period 21,401 13,295 2,238 615
Bank overdraft at the end of the period (58,074) (37,869) - -
Net cash and cash equivalents at the end of
the period (36,673) (24,574) 2,238 615

31
Notes to the Financial Statements 1. Summary of Significant Accounting Policies
Basis of preparation
EU law (IAS Regulation EC 1606/2002) requires that the Group financial statements, for the 52 weeks ended 28 January 2017 are prepared in accordance with International Financial Reporting Standards (IFRSs) adopted for use in the EU (“adopted IFRSs”). This financial information has been prepared on the basis of the recognition and measurement requirements of adopted IFRSs as at 28 January 2017. This financial information does not constitute the Group’s statutory accounts for the 52 weeks ended 28 January 2017 or 30 January 2016. The annual financial information presented in this annual results announcement for the 52 weeks ended 28 January 2017 is based on, and is consistent with, that in the Group’s audited financial statements for the 52 weeks ended 28 January 2017, and those financial statements will be delivered in May 2017. The auditor’s report on those financial statements is unqualified and does not contain any statement under Section 498 (2) or (3) of the Companies Act 2006. Statutory accounts for 30 January 2016 have been delivered to the Registrar of Companies. The auditor has reported on those accounts; their reports were i) unqualified and, ii) did not contain statements under Section 498 (2) or (3) of the Companies Act 2006. Going concern
The Group’s business activities, together with the factors likely to affect its future development, performance and position are set out on pages 3 to 16. The financial position of the Group, its cash flows, liquidity position and borrowing facilities are described in the Chairman’s Statement on pages 3 to 5. In addition, the financial statements includes the Group’s objectives, policies and processes for managing its capital; its financial risk management objectives; details of its financial instruments and hedging activities; and its exposures to credit risk and liquidity risk. The Group meets its day-to-day working capital requirements through a committed overdraft facility expiring on 29 March 2018 which is a multi-currency revolving credit facility with The Royal Bank of Scotland and Barclays. The facility will be used to the extent necessary to fund working capital and capital expenditure to support the Group’s growth strategy. The Group’s forecasts and projections, taking into account reasonably possible changes in trading performance, show that the Group has sufficient financial resources. As a consequence the Directors have a reasonable expectation that the Company and the Group are well placed to manage their business risks and to continue in operational existence for the twelve months from the date of signing the financial statements, despite the current uncertain global economic outlook. Accordingly, the Directors continue to adopt the going concern basis in preparing the consolidated financial statements. Non-GAAP performance measures
Exceptional items are those items which, in the opinion of the Directors, should be excluded in order to provide a consistent and comparable view of the underlying performance of the Group’s on-going business. Generally this will include those items that are largely one-off and material in nature. Exceptional items are identified and presented on a consistent basis each period and a reconciliation of profit before tax and exceptional items to profit before tax is included in the financial statements. Exceptional items in the period included:
costs in relation to the closure of the Group’s legacy warehouses in the UK. The Directors believe this
cost to be one-off in nature as the Group do not close existing warehouses or move to new warehouses
regularly;
costs in relation to the closure of a concept store in London. The Directors believe this cost to be one-off
in nature as the Group does not open concept stores frequently.
There were no exceptional items in the prior period. Exceptional items and their related tax impacts are added back/deducted from profit attributable to the owners of the Company to arrive at adjusted earnings per share. The Directors believe that the profit before exceptional items and adjusted earnings per share measures provide useful information for shareholders on the underlying performance of the business as these exceptional items are one-off and material in nature. These measures are also consistent with how underlying business performance is measured internally. The exceptional profit before tax measure is not a recognised profit measure under IFRS and may not be directly comparable with adjusted profit measures used by other companies.

32
Constant Currency variances are calculated by applying the previous financial period foreign exchange rates to current period results in overseas subsidiaries to remove the impact of exchange rate fluctuations. The Directors believe this provides a consistent and comparable view of the underlying performance of the Group’s on-going business. Significant accounting policies
No new standards, amendments or interpretations, effective for the first time for the period beginning on or after 31 January 2016 have had a material impact on the Group or Company. IFRS 15, ‘Revenue from Contracts with Customers’ which is effective from 1 January 2018 has been considered by the Group and it was concluded this will not be significant to the Group’s financial statements in the future. At the balance sheet date there are a number of new standards and amendments to existing standards in issue but not yet effective. None of these is expected to have a significant effect on the financial statements of the Group or Company, except the following, set out below: IFRS 9, ‘Financial instruments’, which is effective for periods beginning on or after 1 January 2018, replaces IAS 39 and addresses the classification, measurement and recognition of financial assets and financial liabilities. This was endorsed by the EU in November 2016 and as such the impact on the Group is currently being assessed. IFRS 16, ‘Leases’ addresses the definition of a lease, recognition and measurement of leases and establishes principles for reporting useful information to users of financial statements about the leasing activities of both lessees and lessors. A key change arising from IFRS 16 is that most operating leases will be accounted for on balance sheet for lessees. The standard replaces IAS 17 ‘Leases’, and related interpretations. The standard is effective for annual periods beginning on or after 1 January 2019. The quantitative impact of IFRS 16 on the Group’s net assets and results is being assessed. IFRS 16 is expected to have a material impact on the balance sheet as both assets and liabilities will increase and is also expected to have a material impact on key components within the income statements because operating lease rental charges will be replaced by depreciation and finance costs. IFRS 16 will not have any impact on the underlying commercial performance of the Group or the cash flow generated in the period. The Group does not consider that any other standards, amendments or interpretations issued by the IASB, but not yet applicable, will have a significant impact on the financial statements in future years.
33
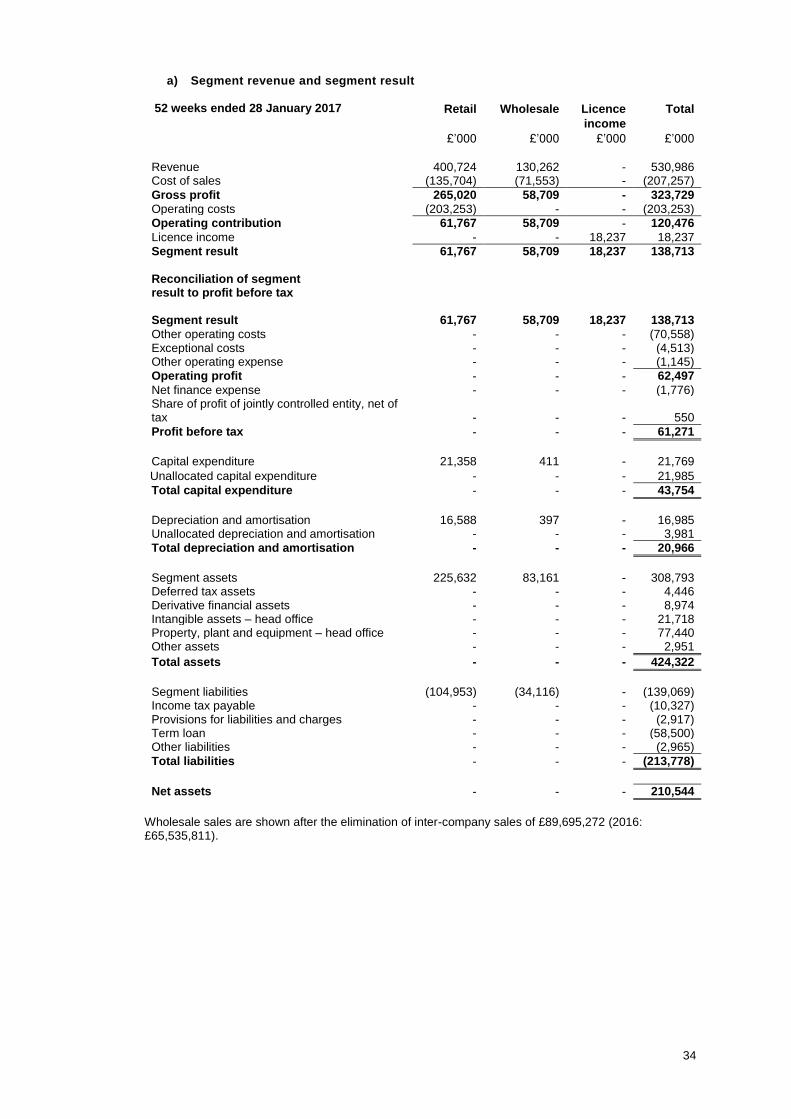
2. Segment information
The Group has three reportable segments; retail, wholesale and licence income. For each of the three segments, the Executive Committee reviews internal management reports on a four weekly basis. The accounting policies of the reportable segments are described in the Group’s financial statements. Information regarding the results of each reportable segment is included below. Performance for the retail segment is measured based on operating contribution, whereas performance of the wholesale segment is measured based on gross profit and performance of the licence segment is measured based on royalty income, as included in the internal management reports that are reviewed by the Board. Segment results before exceptional items are used to measure performance as management believes that such information is the most relevant in evaluating the performance of certain segments relative to other entities that operate within these industries. Inter-segment pricing is determined on an arm’s length basis.
34
a) Segment revenue and segment result
52 weeks ended 28 January 2017 Retail Wholesale Licence
income
Total
£’000 £’000 £’000 £’000
Revenue 400,724 130,262 - 530,986 Cost of sales (135,704) (71,553) - (207,257)
Gross profit 265,020 58,709 - 323,729
Operating costs (203,253) - - (203,253)
Operating contribution 61,767 58,709 - 120,476
Licence income - - 18,237 18,237
Segment result 61,767 58,709 18,237 138,713
Reconciliation of segment result to profit before tax Segment result 61,767 58,709 18,237 138,713
Other operating costs - - - (70,558) Exceptional costs - - - (4,513) Other operating expense - - - (1,145)
Operating profit - - - 62,497
Net finance expense - - - (1,776) Share of profit of jointly controlled entity, net of tax - - - 550
Profit before tax - - - 61,271
Capital expenditure 21,358 411 - 21,769
Unallocated capital expenditure - - - 21,985
Total capital expenditure - - - 43,754
Depreciation and amortisation 16,588 397 - 16,985 Unallocated depreciation and amortisation - - - 3,981
Total depreciation and amortisation - - - 20,966
Segment assets 225,632 83,161 - 308,793 Deferred tax assets - - - 4,446 Derivative financial assets - - - 8,974 Intangible assets – head office - - - 21,718 Property, plant and equipment – head office - - - 77,440 Other assets - - - 2,951
Total assets - - - 424,322
Segment liabilities (104,953) (34,116) - (139,069) Income tax payable - - - (10,327) Provisions for liabilities and charges - - - (2,917) Term loan - - - (58,500) Other liabilities - - - (2,965)
Total liabilities - - - (213,778)
Net assets - - - 210,544
Wholesale sales are shown after the elimination of inter-company sales of £89,695,272 (2016: £65,535,811).

35
52 weeks ended 30 January 2016 Retail Wholesale Licence
income
Total
£’000 £’000 £’000 £’000
Revenue 348,433 107,736 - 456,169 Cost of sales (122,557) (60,590) - (183,147)
Gross profit 225,876 47,146 - 273,022 Operating costs (163,484) - - (163,484)
Operating contribution 62,392 47,146 - 109,538
Licence income - - 14,384 14,384
Segment result 62,392 47,146 14,384 123,922
Reconciliation of segment result to profit before tax Segment result 62,392 47,146 14,384 123,922
Other operating costs - - - (63,713) Exceptional costs - - - - Other operating expense - - - (840)
Operating profit - - - 59,369
Net finance expense - - - (1,400) Share of profit of jointly controlled entity, net of tax - - - 695
Profit before tax - - - 58,664
Capital expenditure 19,386 1,153 - 20,539
Unallocated capital expenditure - - - 68,994
Total capital expenditure - - - 89,533
Depreciation and amortisation 11,966 258 - 12,224 Unallocated depreciation and amortisation - - - 2,705
Total depreciation and amortisation - - - 14,929
Segment assets 186,826 60,468 - 247,294 Deferred tax assets - - - 6,313 Derivative financial assets - - - 2,850 Intangible assets – head office - - - 14,199 Property, plant and equipment – head office - - - 67,072 Other assets - - - 2,618
Total assets - - - 340,346
Segment liabilities (75,232) (23,726) - (98,958) Income tax payable - - - (8,382) Term loan - - - (60,000) Other liabilities - - - (407)
Total liabilities - - - (167,747)
Net assets - - - 172,599

36
b) Geographical information
UK US Rest of
World
Total
£’000 £’000 £’000 £’000
52 weeks ended 28 January 2017
Revenue 316,542 130,941 83,503 530,986
Non-current assets* 118,879 34,571 17,647 171,097
52 weeks ended 30 January 2016
Revenue 291,804 99,931 64,434 456,169
Non-current assets* 103,642 25,578 13,479 142,699
*Non-current assets exclude deferred tax assets.
c) Revenue by collection
52 weeks ended
28 January
2017
52 weeks ended
30 January
2016
£’000 £’000
Menswear 226,731 202,083
Womenswear 304,255 254,086
530,986 456,169
3. Profit before tax
Profit before tax is stated after charging/(crediting):
52 weeks ended
28 January
2017
52 weeks ended
30 January
2016
£’000 £’000
Depreciation and amortisation 20,966 14,929
Impairment of property, plant and equipment - 188
Exceptional costs 4,513 -
Leasehold properties & concession rentals*
Fixed lease payments 56,558 41,171
Variable rental and commission payments 36,125 29,724
Loss on sale of property, plant & equipment and intangibles 416 58
Auditor remuneration:
Audit of these financial statements 12 11
Amounts receivable by the Company’s auditor and its associates
in respect of:
Audit of financial statements of subsidiaries of the Company 300 205
Interim financial statements review 17 17
Audit related assurance services 21 20
Taxation compliance and other advisory services 10 114
*Disclosed above are the costs charged in the period relating to leasehold properties and concession arrangements. These are either fixed in nature or variable based on revenue levels for a particular store or concession, where relevant, excluding e-commerce sales with concession partners.
Exceptional costs in the period of £4.5m (2016: £nil) include a provision for lease commitments relating
to the Group’s legacy warehouses of £2.9m along with £0.7m of other closure costs and £0.9m in
respect of closure costs for a concept store in London.
There were no amounts recognised as exceptional costs or income during the 52 weeks ended 30 January 2016.
4. Finance income and expenses

37
52 weeks ended
28 January
2017
52 weeks ended
30 January
2016
£’000 £’000
Finance income
- Interest receivable 15 -
- Foreign exchange gains 1,582 531
1,597 531
Finance expenses
- Interest payable (2,933) (1,430)
- Foreign exchange losses (440) (501)
(3,373) (1,931)
5. Income tax expense
a) The tax charge comprises
52 weeks ended
28 January
2017
52 weeks ended
30 January
2016
£’000 £’000
Current tax
United Kingdom Corporation Tax 12,343 11,609
Overseas Tax 3,625 5,060
eferred tax
United Kingdom Corporation Tax 977 46
Overseas Tax (1,038) (854)
Prior period (over)/under provision
Current tax (4,481) (2,854)
Deferred tax 3,277 1,422
14,703 14,429
The movements in prior period current and deferred tax provisions are largely a result of accelerated tax
relief claims on fixed assets in the US (2016: movements largely due to accelerated capital allowances
in the UK).

38
b) Deferred tax movement by type
52 weeks ended
28 January
2017
52 weeks ended
30 January
2016
£’000 £’000
Property, plant & equipment (464) (107)
Share-based payments (49) 336
Overseas losses 379 412
Inventory (41) (65)
Other 236 232
61 808
c) Factors affecting the tax charge for the period
The tax assessed for the period is higher than the tax calculated at domestic rates applicable to profits
in the respective countries. The differences are explained below.
52 weeks ended
28 January
2017
52 weeks ended
30 January
2016
£’000 £’000
Profit before tax 61,271 58,664
Profit multiplied by the standard rate in the UK – 20%, (2016:
standard rate in the UK of 20.16%) 12,254 11,827
Income not taxable/expenses not deductible for tax purposes 675 759
Overseas losses not recognised 1,494 678
Movement in current and deferred tax on share awards and
options 31 30
Prior period over provision (1,204) (1,432)
Effect of rate change on corporation tax - 41
Difference due to overseas tax rates 1,453 2,526
Total income tax expense 14,703 14,429
d) Deferred and current tax recognised directly in equity
52 weeks ended
28 January
2017
52 weeks ended
30 January
2016
£’000 £’000
Current tax credit on share awards and options (554) (190)
Deferred tax charge / (credit) on share awards and options 273 (954)
Deferred tax charge associated with movement in hedging
reserve 1,193 45
Current tax charge associated with foreign exchange movements in reserves 1,458 643
2,370 (456)
There will be a reduction in the UK corporation tax rate to 19% from 1 April 2017 and to 17% from 1 April
2020.
As the deferred tax assets and liabilities should be recognised based on the corporation tax rate at
which they are anticipated to unwind, the assets and liabilities on UK operations have been recognised
at a rate of 19%. Those assets and liabilities arising on foreign operations have been recognised at the
applicable overseas tax rates.

39
6. Dividends per share
52 weeks ended
28 January
2017
52 weeks ended
30 January
2016
£’000
£’000
Final dividend paid for prior period of 34.6p per ordinary
share (2016: 29.0p)
15,215 12,739
Interim dividend paid of 14.8p per ordinary share (2016:
13.2p)
6,521 5,804
21,736 18,543
A final dividend in respect of 2017 of 38.8p per share, amounting to a dividend payable of £17,137,466
is to be proposed at the Annual General Meeting on 13 June 2017.
7. Earnings per share
52 weeks ended
28 January
2017
52 weeks ended
30 January
2016
Number of shares: No. No.
Weighted number of ordinary shares outstanding 44,034,459 43,950,203
Effect of dilutive options 516,310 612,138
Weighted number of ordinary shares outstanding – diluted 44,550,769 44,562,341
Earnings: £’000 £’000
Profit for the period basic and diluted 46,568 44,235
Profit for the period adjusted * 50,178 44,235
Basic earnings per share 105.7p 100.6p
Adjusted earnings per share * 114.0p 100.6p
Diluted earnings per share 104.5p 99.3p
Adjusted diluted earnings per share* 112.6p 99.3p
Diluted earnings per share and adjusted diluted earnings per share have been calculated using additional ordinary shares of 5p each available under the Ted Baker Sharesave Scheme and the Ted Baker Plc Long-Term Incentive Plan 2013. There were no share related events after the balance sheet date that may affect earnings per share. * Adjusted profit for the period and adjusted earnings per share are shown before the net exceptional costs (net of tax) of £3.6m (2016: £nil).

40
8. Intangible assets
Key money Computer
software
Computer
software under
development
Total
£’000 £’000 £’000 £’000
Cost
At 30 January 2016 879 8,361 10,649 19,889
Additions / transfers - 5,134 4,205 9,339
Disposals (351) - - (351)
Exchange rate movement 96 124 - 220
At 28 January 2017 624 13,619 14,854 29,097
Amortisation
At 30 January 2016 - 2,642 - 2,642
Charge for the period - 1,925 - 1,925
Disposals - - - -
Exchange rate movement - 85 - 85
At 28 January 2017 - 4,652 - 4,652
Net book value
At 30 January 2016 879 5,719 10,649 17,247
At 28 January 2017 624 8,967 14,854 24,445
Key money Computer
software
Computer
software under
development
Total
£’000 £’000 £’000 £’000
Cost
At 31 January 2015 865 3,669 9,278 13,812
Additions / transfers - 4,634 1,371 6,005
Exchange rate movement 14 58 - 72
At 30 January 2016 879 8,361 10,649 19,889
Amortisation
At 31 January 2015 - 957 - 957
Charge for the period - 1,652 - 1,652
Exchange rate movement - 33 - 33
At 30 January 2016 - 2,642 - 2,642
Net book value
At 31 January 2015 865 2,712 9,278 12,855
At 30 January 2016 879 5,719 10,649 17,247

41
The key money brought forward relates to the right to lease stores that have a guaranteed residual value. The guaranteed value arises because the next tenants based on current market conditions are required to pay these amounts to the Group. Due to the nature of this, the assets are considered recoverable and no amortisation is charged each period as the residual value of the asset is considered to be in excess of the carrying value. The current market rate rents, for both stores included within the intangible assets, continue to be above the rent under the lease terms and hence no decline in values is foreseen.
Additions included within computer software relate to the Microsoft Dynamics AX systems and further
development of our e-commerce platforms. Additions included within the computer software under
development category relate to the Microsoft Dynamics AX system and are stated net of transfers to
computer software. Transfers from the computer software under development category in the period
amounted to £5,134,000 (2016: £4,634,000) whilst additions into this category were £9,339,000 (2016:
£6,005,000).
9. Property, plant and equipment
Freehold
land &
buildings
Leasehold
improvements
Fixtures,
fittings &
office
equipment
Motor
vehicles
Assets
under
construction
Total
£’000 £’000 £’000 £’000 £’000 £’000
Cost
At 30 January 2016 57,973 87,384 69,813 110 3,308 218,588
Additions / transfers - 23,816 8,038 1 2,560 34,415
Disposals - (1,538) (986) - - (2,524)
Exchange rate movement - 6,351 3,298 - 336 9,985
At 28 January 2017 57,973 116,013 80,163 111 6,204 260,464
Depreciation
At 30 January 2016 32 45,120 49,934 105 - 95,191
Charge for the period 451 10,562 8,026 2 - 19,041
Disposals - (1,466) (898) - - (2,364)
Impairment - - - - - -
Exchange rate movement - 2,438 1,804 - - 4,242
At 28 January 2017 483 56,654 58,866 107 - 116,110
Net book value
At 30 January 2016 57,941 42,264 19,879 5 3,308 123,397
At 28 January 2017 57,490 59,359 21,297 4 6,204 144,354
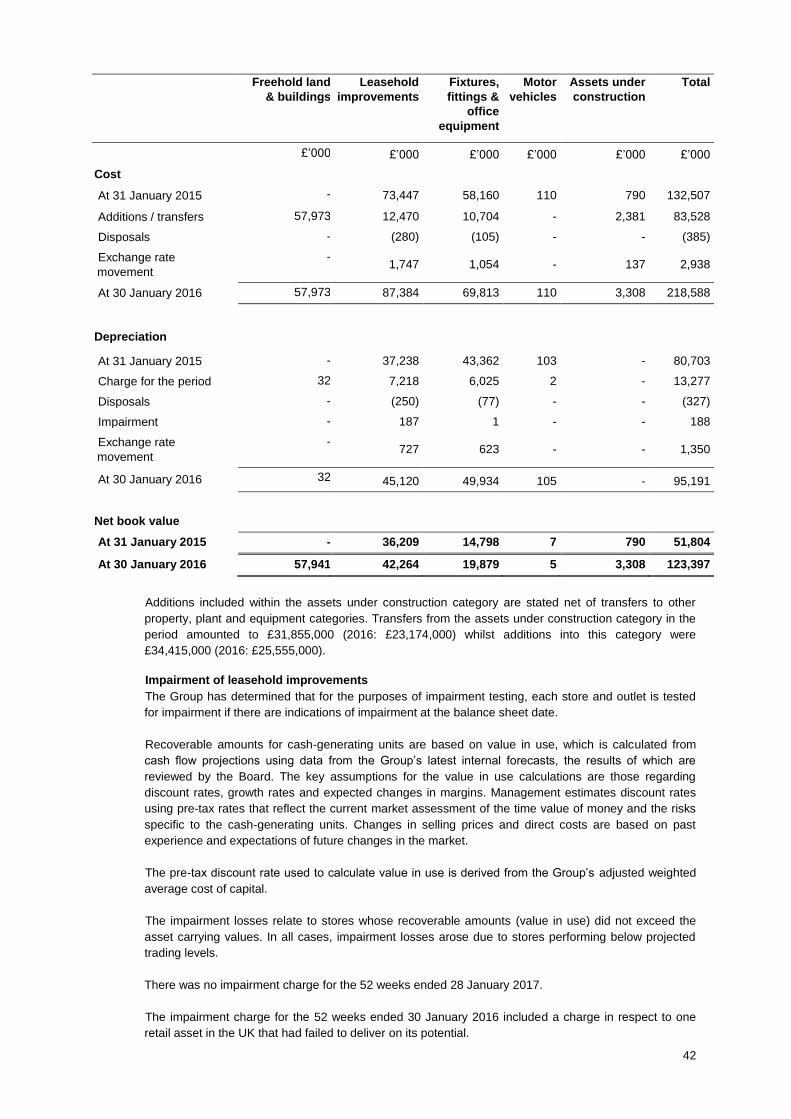
42
Freehold land
& buildings
Leasehold
improvements
Fixtures,
fittings &
office
equipment
Motor
vehicles
Assets under
construction
Total
£’000 £’000 £’000 £’000 £’000 £’000
Cost
At 31 January 2015 - 73,447 58,160 110 790 132,507
Additions / transfers 57,973 12,470 10,704 - 2,381 83,528
Disposals - (280) (105) - - (385)
Exchange rate
movement
- 1,747 1,054 - 137 2,938
At 30 January 2016 57,973 87,384 69,813 110 3,308 218,588
Depreciation
At 31 January 2015 - 37,238 43,362 103 - 80,703
Charge for the period 32 7,218 6,025 2 - 13,277
Disposals - (250) (77) - - (327)
Impairment - 187 1 - - 188
Exchange rate
movement
- 727 623 - - 1,350
At 30 January 2016 32 45,120 49,934 105 - 95,191
Net book value
At 31 January 2015 - 36,209 14,798 7 790 51,804
At 30 January 2016 57,941 42,264 19,879 5 3,308 123,397
Additions included within the assets under construction category are stated net of transfers to other
property, plant and equipment categories. Transfers from the assets under construction category in the
period amounted to £31,855,000 (2016: £23,174,000) whilst additions into this category were
£34,415,000 (2016: £25,555,000).
Impairment of leasehold improvements
The Group has determined that for the purposes of impairment testing, each store and outlet is tested
for impairment if there are indications of impairment at the balance sheet date.
Recoverable amounts for cash-generating units are based on value in use, which is calculated from
cash flow projections using data from the Group’s latest internal forecasts, the results of which are
reviewed by the Board. The key assumptions for the value in use calculations are those regarding
discount rates, growth rates and expected changes in margins. Management estimates discount rates
using pre-tax rates that reflect the current market assessment of the time value of money and the risks
specific to the cash-generating units. Changes in selling prices and direct costs are based on past
experience and expectations of future changes in the market.
The pre-tax discount rate used to calculate value in use is derived from the Group’s adjusted weighted
average cost of capital.
The impairment losses relate to stores whose recoverable amounts (value in use) did not exceed the
asset carrying values. In all cases, impairment losses arose due to stores performing below projected
trading levels.
There was no impairment charge for the 52 weeks ended 28 January 2017.
The impairment charge for the 52 weeks ended 30 January 2016 included a charge in respect to one
retail asset in the UK that had failed to deliver on its potential.

43
10. Related Parties
The Group considers its Executive and Non-Executive Directors as key management and their
compensation therefore comprises a related-party transaction.
Total compensation in respect of key management for the year was as follows:
52 weeks ended
28 January
2017
52 weeks ended
30 January
2016
£’000 £’000
Salaries & short-term benefits 2,582 1,513
Contributions to money-purchase pension schemes 53 53
Share-based payment charges 427 480
3,062 2,046
Directors of the Company and their immediate relatives control 35.4% per cent of the voting shares of
the Company.
At 28 January 2017, No Ordinary Designer Label Limited (“NODL”), the main trading company owed
Ted Baker Plc £51,932,000 (2016: £47,486,000). NODL was owed £136,813,000 (2016: £55,931,000)
from the other subsidiaries within the Group.
Transactions between subsidiaries were priced on an arm’s length basis.
The Group has a 50% interest in the ordinary share capital of No Ordinary Retail Company Pty, a
company incorporated in Australia, through its wholly owned subsidiary No Ordinary Designer Label
Limited. As at 28 January 2017, the joint venture owed £653,000 to the main trading company (2016:
£563,000). In the period the value of sales made to the joint venture by the Group was £2,696,000
(2016: £2,427,000).
Ray Kelvin and Lindsay Page are both directors of, and shareholders in, THAT Bournemouth Company Limited, THAT TopCo Limited and THAT Bournemouth Big Hotel Limited and as such, these entities are a related party of the Company for the purposes of Chapter 11 of the Listing Rules.
During the period the Group provided design services to THAT Bournemouth Company Limited for which licence income fees were charged of £192,000 (2016: £170,000). No amounts were outstanding as at 28 January 2017 (2016: £nil).
During the period the main trading company provided office space to THAT TopCo Limited for which
rental charges were made of £34,560 and other miscellaneous charges of £3,446 (2016: £nil). No
amounts were outstanding as at 28 January 2017 (2016: £nil).
During the period the main trading company supplied services to THAT Bournemouth Big Hotel Limited
for which charges were made of £16,551 (2016: £nil). No amounts were outstanding as at 28 January
2017 (2016: £nil).