growing pains latin america in - center for global … · growing pains latin americain center for...
TRANSCRIPT

growing painsin
latin america
11630-00_FM_rev2.qxd 6/2/09 3:49 PM Page i

11630-00_FM_rev2.qxd 6/2/09 3:49 PM Page ii
growing painsin
latin america
center for global developmentWashington, D.C.
An Economic Growth Framework as Applied to Brazil, Colombia, Costa Rica,
Mexico, and Peru
Liliana Rojas-SuarezEditor
11630-00_FM_rev2.qxd 6/2/09 3:49 PM Page iii
Copyright © 2009
center for global development1800 Massachusetts Avenue, N.W., Washington, DC 20036
www.cgdev.org
Growing Pains in Latin America: An Economic Growth Framework as Applied to Brazil, Colombia, Costa Rica, Mexico, and Peru
may be ordered from:brookings institution press
c/o HFS, P.O. Box 50370, Baltimore, MD 21211-4370Tel.: 800/537-5487; 410/516-6956; Fax: 410/516-6998; Internet: www.brookings.edu
All rights reserved. No part of this publication may be reproduced or transmitted in any form or by any means without permission in writing from
the Center for Global Development.
Library of Congress Cataloging-in-Publication dataGrowing pains in Latin America : an economic growth framework as applied to Brazil, Colombia, Costa Rica, Mexico, and Peru / Liliana Rojas-Suarez, editor.
p. cm.Includes bibliographical references and index.ISBN 978-1-933286-31-0 (pbk. : alk. paper)1. Latin America—Economic policy. 2. Latin America—Economic conditions. I. Rojas-Suarez, Liliana. II. Title.HC125.G69 2009338.98—dc22 2009015007
9 8 7 6 5 4 3 2 1
The paper used in this publication meets minimum requirements of theAmerican National Standard for Information Sciences—Permanence of Paper
for Printed Library Materials: ANSI Z39.48-1992.
Typeset in Adobe Garamond
Composition by Circle GraphicsColumbia, Maryland
Printed by Versa PressEast Peoria, Illinois
11630-00_FM_rev2.qxd 6/4/09 5:26 PM Page iv
The Center for Global Development is an independent, nonprofit policy research organization dedicatedto reducing global poverty and inequality and to making globalization work for the poor. Through a com-bination of research and strategic outreach, the Center actively engages policymakers and the public toinfluence the policies of the United States, other rich countries, and such institutions as the World Bank,the IMF, and the World Trade Organization to improve the economic and social development prospectsin poor countries. The Center’s Board of Directors bears overall responsibility for the Center and includesdistinguished leaders of nongovernmental organizations, former officials, business executives, and some ofthe world’s leading scholars of development. The Center receives advice on its research and policy pro-grams from the Board and from an Advisory Group that comprises respected development specialists andadvocates.
The Center’s president works with the Board, the Advisory Group, and the Center’s senior staff in set-ting the research and program priorities and approves all formal publications. The Center is supported byan initial significant financial contribution from Edward W. Scott Jr. and by funding from philanthropicfoundations and other organizations.
Board of Directors
Edward W. Scott Jr.Chair
Nancy BirdsallPresident
Susan B. Levine*Vice Chair
Bernard Aronson*C. Fred BergstenJessica P. EinhornDavid GergenThomas R. Gibian*Bruns Grayson*José Angel Gurría TreviñoJames A. Harmon
Enrique V. IglesiasKassahun KebedeM. Peter McPhersonNgozi Okonjo-IwealaThe Honorable Paul H.O’NeillJohn T. Reid*Dani Rodrik**William D. RuckelshausS. Jacob ScherrBelinda StronachLawrence H. Summers***Adam Waldman*
Honorary Members
John L. HennessySir Colin LucasRobert S. McNamaraAmartya K. SenJoseph E. Stiglitz
*Member of the Executive Committee**Ex officio, chair of Advisory Group***On leave
Advisory Group
Masood AhmedAbhijit BanerjeePranab BardhanJere BehrmanThomas CarothersAnne CaseKemal DervisEsther DufloPeter EvansDavid de Ferranti
Kristin ForbesCarol GrahamJ. Bryan HehirSimon JohnsonAnne KruegerCarol LancasterDavid LiptonNora LustigMark MedishDeepa Narayan
Rohini PandeKenneth PrewittDani RodrikDavid RothkopfFederico SturzeneggerRobert H. WadeKevin WatkinsJohn WilliamsonNgaire WoodsErnesto Zedillo
11630-00_FM_rev2.qxd 6/2/09 3:49 PM Page v

11630-00_FM_rev2.qxd 6/2/09 3:49 PM Page vi
Preface ix
Acknowledgments xiii
1 Introduction: A New Approach to Growth in Latin America 1Liliana Rojas-Suarez
2 Helping Reforms Deliver Growth in Latin America: A Framework for Analysis 38CGD Task Force
3 Pro- and Anti-Market Reforms in Democratic Brazil 68Armando Castelar Pinheiro, Regis Bonelli, and Samuel de Abreu Pessôa
4 Colombia’s Efforts at Achieving Inclusive and Sustainable Growth 111Roberto Steiner, Irene Clavijo, and Natalia Salazar
5 Political and Institutinoal Obstacles to Reform in Costa Rica 153Jorge Cornick and Albreto Trejos
Contents
vii
11630-00_FM_rev2.qxd 6/2/09 3:49 PM Page vii
viii contents
6 How Can Reforms Help Deliver Growth in Mexico? 192Gerardo Esquivel and Fausto Hernández-Trillo
7 Helping Reforms Deliver Inclusive Growth in Peru 236Eduardo Morón, Juan Francisco Castro, and Cynthia Sanborn
Contributors 295
Index 297
11630-00_FM_rev2.qxd 6/2/09 3:49 PM Page viii
At the Center for Global Development, we aim to generate ideas andpolicy recommendations that will improve the well-being of the
majority of the poor and near poor in the developing world. Of all regions,Latin America stands out for the variety of development models its govern-ments have implemented over the last half century, often inspired by theregion’s leading thinkers and often following deep economic crises thatreversed short-term advances in income growth and poverty alleviation. Thisvaried experience—and the lessons it offers to policymakers in Latin Amer-ica and to rich-world development institutions—are therefore of particularinterest to us at the Center.
In this book, Liliana Rojas-Suarez and other close students of Latin Ameri-can economies ask key questions: Why, despite the impressive macroeconomicand other reforms of the last two decades, have most countries in the regionbeen unable to generate higher growth on a sustained basis? What can individ-ual countries do to help reforms deliver growth and a better distribution of itsbenefits? How should policymakers respond to the increasing discontent amonglarge segments of the population with the results of market-based reforms?
This book stands firmly in the spirit of the development policy approachmost recently propounded in the 2008 report of the Spence Commission onGrowth: every country needs to forge its own practical approaches by adhering
Preface
ix
11630-00_FM_rev2.qxd 6/2/09 3:49 PM Page ix
to just a few principles. Policymakers should eschew any universal model andinstead adapt and continuously adjust policies to their own country’s circum-stances. Growing Pains in Latin America also complements an earlier CGD bookon Latin America, Fair Growth, in which my coauthors and I suggest a set oftools from which policymakers can pick and choose depending on country con-ditions. The emphasis on fairness as a fundamental objective in Fair Growth isreinforced in this new book, which argues that growth cannot be sustained if itsgains are not broadly shared by the population.
To address country-specific questions while benefiting from lessons at theregional level, Liliana Rojas-Suarez with Simon Johnson (an MIT professor anda member of CGD’s advisory group) organized a task force including theregion’s top scholars and economic policy practitioners to consider the impactof policy reforms on growth, poverty, and inequality. The group developed aregion-specific framework, building on three characteristics that distinguishLatin America from other regions: It is the most democratic, it is the mostfinancially open (more so than East Asia, which is more open on trade), and ithas the greatest economic and social inequality. This framework is then appliedin case studies of Brazil, Colombia, Costa Rica, Mexico, and Peru.
The resulting country-specific recommendations are a good example of thekind of work reflected in the Center’s tag line: independent research and practi-cal ideas for global prosperity. The book provides proposals that, while inno-vative and challenging, are also doable. Their practicality reflects broadconsultation in each country with private sector representatives, academiciansand other analysts, and the highest-level policymakers.
The book’s applied analytical framework will interest not only policymakersin Latin America but also development policy experts in the rich world, includ-ing the bilateral aid agencies (especially those in the United States, Canada, andSpain, which take special interest in Latin America) and in multilateral financialinstitutions (particularly the World Bank, the International Monetary Fund,and the Inter-American Development Bank). Policy advisors in these institu-tions face the challenge to strike an appropriate balance between consistency, onthe one hand, and the need to adapt to country circumstances, on the other.
The framework sets forth five necessary foundations for sustainable growth:secure property rights, sufficiently equal opportunities for broad segments of thepopulation, sufficient economic and political competition, macroeconomic sta-bility, and broad sharing among the population of the benefits from growth. Byidentifying which of these foundations needs to be strengthened in a specificcountry, policymakers can craft country-specific approaches to alleviate themost critical constraints. For example, Mexico is particularly constrained byinadequate economic competition in key sectors, such as telecommunications.Enhancing the powers and autonomy of the Federal Competition Commission,creating specialized courts in competition and regulatory cases, and other efforts
x preface
11630-00_FM_rev2.qxd 6/2/09 3:49 PM Page x
to improve an adequate implementation of antimonopoly laws are thereforeimportant. Peru faces challenges in the broad sharing of the benefits of growth.Deep reforms of the state and the political system are essential so that legislationcan be passed, and policies executed, that will reach the poor, especially in therural areas. Colombia, on the other hand, has an activist judicial system thatintervenes excessively in granting social benefits to the population, to the pointthat the government faces unremitting fiscal pressures. To help support macro-economic stability, a key policy recommendation in Colombia involves creatingincentives for the Constitutional Court to curtail its ability to tamper with eco-nomic matters.
While the analyses and recommendations differ significantly from country tocountry, they build on a common framework, and the reader will find someimportant commonalities. For example, there is an emphasis in all case studieson the political logic of incremental reform. Even when a major revamping isseen as essential, the studies call for pilot efforts designed to build constituenciesthat will support reform. Another common thread is the attention given toinstitutional strengthening, from reform of congresses, political parties, andelectoral processes to the overhaul of judiciary systems and of mechanisms andinstitutions that determine competition policies.
I hope that this brief introduction will whet the reader’s appetite to dig intothe rest of this important book and that the framework and the case studies itcontains will provide the basis for lively and informed policy discussions—andbetter policy design—in Latin America itself and in the rich-world developmentinstitutions that aim to support Latin America’s drive to overcome its growingpains and enter a period of sustained, and shared, growth.
We are grateful to the Open Society Institute, the Tinker Foundation, and theAndean Finance Corporation, whose support helped make this book possible.
Nancy BirdsallPresident
Center for Global Development
Washington, D.C.May 2009
preface xi
11630-00_FM_rev2.qxd 6/2/09 3:49 PM Page xi

11630-00_FM_rev2.qxd 6/2/09 3:49 PM Page xii
This book is the result of the collective efforts of many people, and I amgrateful to all of them. I would first like to acknowledge the members of
the CGD Task Force for their hard work in developing the analytical frame-work that is presented in chapter 2: Mauricio Cárdenas, Javier Corrales, Joséde Gregorio, Augusto de la Torre, Eduardo Lora, Carmen Pagés, ErnestoStein, Kurt Weyland, and Jeromin Zettelmeyer. My special gratitude goes toSimon Johnson who was my cochair in this endeavor and a continuous sourceof ideas, enthusiasm, and leadership.
I am also deeply grateful to all of the authors of the case studies presented inchapters 3 to 7. They were all willing to apply the CGD framework to theirown country experiences, organize discussion seminars, and write more draftsthan they care to remember. Their contributions are the heart and soul of thisbook.
Many commentators and discussants contributed significantly to improvethe quality of this project. At different stages, the book benefited from com-ments and suggestions by Mauricio Cárdenas, Miguel Castilla, Eduardo Fer-nandez Arias, Francis Fukuyama, David Holiday, Eduardo Lora, Nora Lustig,Guillermo Perry, Nancy Truitt, George Vickers, John Williamson, and partic-ipants in workshops organized by the Economic Commission for Latin Amer-ica and the Caribbean in Santiago, the Universidad Pacífico in Lima, the
Acknowledgments
xiii
11630-00_FM_rev2.qxd 6/2/09 3:49 PM Page xiii
Fundaçao Getúlio Vargas in Rio de Janeiro, the Costa Rican Investment Pro-motion Agency in San José, El Colegio de México, and the Centro de Investi-gación y Docencia Económica in México City.
I owe my gratitude to many CGD colleagues. Leda Basombrío, CarlosGallardo, Verónica Gonzales, Emily Paul, and Sebastián Sotelo providedinsightful research assistant support. As always, our communications teamplayed an integral role in helping to bring this project to conclusion. Thank youvery much to Lawrence MacDonald, Heather Haines, and John Osterman fortheir invaluable support. With his usual proficiency, Michael Treadway bril-liantly edited the entire manuscript.
This book would not have seen the light of day without the support of theOpen Society Institute, the Tinker Foundation, and the Andean Finance Cor-poration. Their intellectual engagement throughout this research project isgreatly appreciated. Thanks are also due to El Fondo de Cultura Económica, amost prestigious editorial house in Latin America. Thanks to the Fondo’sendorsement, the Spanish version of this book is already in the process of beingpublished.
Finally, my deep thanks to Nancy Birdsall for her continuous support of thisproject, her comments and suggestions throughout the endeavor, and her deepbelief that Latin America can indeed rise to its potential.
xiv acknowledgments
11630-00_FM_rev2.qxd 6/2/09 3:49 PM Page xiv
1
Before the eruption of the severe global economic and financial crisis in thethird quarter of 2008, all of the countries of Latin America had been expe-
riencing positive rates of economic growth for five consecutive years. Five years ofcontinuous growth, with no economic or financial crisis, might sound unimpres-sive in a global context where even a deep crisis in East Asia in the late 1990s pro-duced only a relatively short pause in an otherwise sustained path of rapid growth.But for Latin America, long known as the world’s most economically and finan-cially volatile region,1 five consecutive years of generalized positive growth was anachievement not seen since the 1970s.
Although recent growth in GDP has indeed been high by the region’s stan-dards over the last three decades, growth in income per capita has not been suffi-
Introduction: A New Approach to Growthin Latin Americaliliana rojas-suarez
1
The author would like to acknowledge the very helpful comments and suggestions of Nancy Bird-sall, Mauricio Cárdenas, Augusto de la Torre, Francis Fukuyama, Eduardo Lora, and participants inworkshops organized by the Economic Commission for Latin America and the Caribbean, the Uni-versidad Pacífico in Lima, the Fundação Getúlio Vargas in Rio de Janeiro, the Costa Rican Invest-ment Promotion Agency in San Jose, and El Colegio de México and the Centro de Investigación yDocencia Económica in Mexico City. The excellent research assistance and valuable comments ofLeda Basombrio were essential contributions. The errors that remain are, of course, the author’s soleresponsibility.
1. See, for example, Hausmann and Gavin (1996), Caballero (2001), and Guidotti, Rojas-Suarez,and Zahler (2004).
11630-01_CH01_rev2.qxd 6/2/09 4:04 PM Page 1
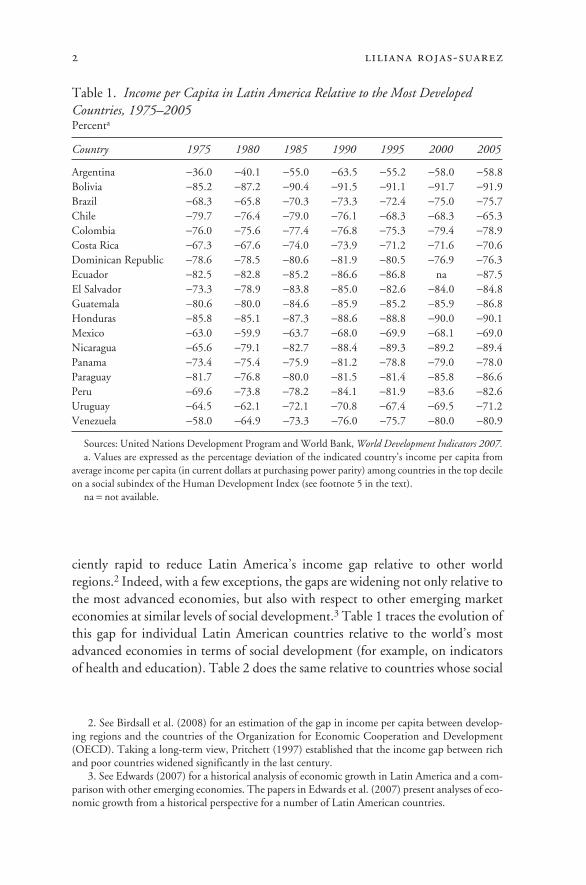
ciently rapid to reduce Latin America’s income gap relative to other worldregions.2 Indeed, with a few exceptions, the gaps are widening not only relative tothe most advanced economies, but also with respect to other emerging marketeconomies at similar levels of social development.3 Table 1 traces the evolution ofthis gap for individual Latin American countries relative to the world’s mostadvanced economies in terms of social development (for example, on indicatorsof health and education). Table 2 does the same relative to countries whose social
2 liliana rojas-suarez
2. See Birdsall et al. (2008) for an estimation of the gap in income per capita between develop-ing regions and the countries of the Organization for Economic Cooperation and Development(OECD). Taking a long-term view, Pritchett (1997) established that the income gap between richand poor countries widened significantly in the last century.
3. See Edwards (2007) for a historical analysis of economic growth in Latin America and a com-parison with other emerging economies. The papers in Edwards et al. (2007) present analyses of eco-nomic growth from a historical perspective for a number of Latin American countries.
Table 1. Income per Capita in Latin America Relative to the Most Developed Countries, 1975–2005Percenta
Country 1975 1980 1985 1990 1995 2000 2005
Argentina −36.0 −40.1 −55.0 −63.5 −55.2 −58.0 −58.8Bolivia −85.2 −87.2 −90.4 −91.5 −91.1 −91.7 −91.9Brazil −68.3 −65.8 −70.3 −73.3 −72.4 −75.0 −75.7Chile −79.7 −76.4 −79.0 −76.1 −68.3 −68.3 −65.3Colombia −76.0 −75.6 −77.4 −76.8 −75.3 −79.4 −78.9Costa Rica −67.3 −67.6 −74.0 −73.9 −71.2 −71.6 −70.6Dominican Republic −78.6 −78.5 −80.6 −81.9 −80.5 −76.9 −76.3Ecuador −82.5 −82.8 −85.2 −86.6 −86.8 na −87.5El Salvador −73.3 −78.9 −83.8 −85.0 −82.6 −84.0 −84.8Guatemala −80.6 −80.0 −84.6 −85.9 −85.2 −85.9 −86.8Honduras −85.8 −85.1 −87.3 −88.6 −88.8 −90.0 −90.1Mexico −63.0 −59.9 −63.7 −68.0 −69.9 −68.1 −69.0Nicaragua −65.6 −79.1 −82.7 −88.4 −89.3 −89.2 −89.4Panama −73.4 −75.4 −75.9 −81.2 −78.8 −79.0 −78.0Paraguay −81.7 −76.8 −80.0 −81.5 −81.4 −85.8 −86.6Peru −69.6 −73.8 −78.2 −84.1 −81.9 −83.6 −82.6Uruguay −64.5 −62.1 −72.1 −70.8 −67.4 −69.5 −71.2Venezuela −58.0 −64.9 −73.3 −76.0 −75.7 −80.0 −80.9
Sources: United Nations Development Program and World Bank, World Development Indicators 2007.a. Values are expressed as the percentage deviation of the indicated country’s income per capita from
average income per capita (in current dollars at purchasing power parity) among countries in the top decileon a social subindex of the Human Development Index (see footnote 5 in the text).
na = not available.
11630-01_CH01_rev2.qxd 6/2/09 4:04 PM Page 2
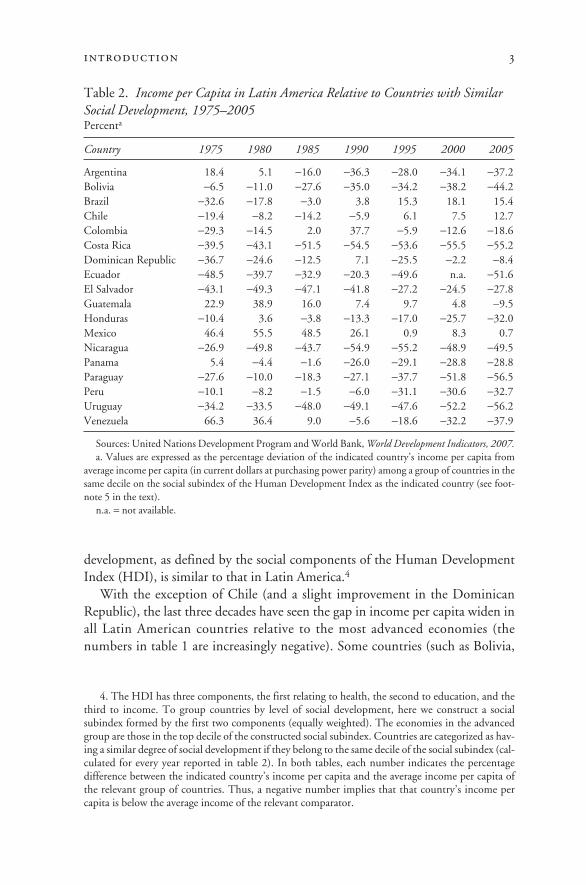
development, as defined by the social components of the Human DevelopmentIndex (HDI), is similar to that in Latin America.4
With the exception of Chile (and a slight improvement in the DominicanRepublic), the last three decades have seen the gap in income per capita widen inall Latin American countries relative to the most advanced economies (thenumbers in table 1 are increasingly negative). Some countries (such as Bolivia,
introduction 3
4. The HDI has three components, the first relating to health, the second to education, and thethird to income. To group countries by level of social development, here we construct a socialsubindex formed by the first two components (equally weighted). The economies in the advancedgroup are those in the top decile of the constructed social subindex. Countries are categorized as hav-ing a similar degree of social development if they belong to the same decile of the social subindex (cal-culated for every year reported in table 2). In both tables, each number indicates the percentagedifference between the indicated country’s income per capita and the average income per capita ofthe relevant group of countries. Thus, a negative number implies that that country’s income percapita is below the average income of the relevant comparator.
Table 2. Income per Capita in Latin America Relative to Countries with SimilarSocial Development, 1975–2005Percenta
Country 1975 1980 1985 1990 1995 2000 2005
Argentina 18.4 5.1 −16.0 −36.3 −28.0 −34.1 −37.2Bolivia −6.5 −11.0 −27.6 −35.0 −34.2 −38.2 −44.2Brazil −32.6 −17.8 −3.0 3.8 15.3 18.1 15.4Chile −19.4 −8.2 −14.2 −5.9 6.1 7.5 12.7Colombia −29.3 −14.5 2.0 37.7 −5.9 −12.6 −18.6Costa Rica −39.5 −43.1 −51.5 −54.5 −53.6 −55.5 −55.2Dominican Republic −36.7 −24.6 −12.5 7.1 −25.5 −2.2 −8.4Ecuador −48.5 −39.7 −32.9 −20.3 −49.6 n.a. −51.6El Salvador −43.1 −49.3 −47.1 −41.8 −27.2 −24.5 −27.8Guatemala 22.9 38.9 16.0 7.4 9.7 4.8 −9.5Honduras −10.4 3.6 −3.8 −13.3 −17.0 −25.7 −32.0Mexico 46.4 55.5 48.5 26.1 0.9 8.3 0.7Nicaragua −26.9 −49.8 −43.7 −54.9 −55.2 −48.9 −49.5Panama 5.4 −4.4 −1.6 −26.0 −29.1 −28.8 −28.8Paraguay −27.6 −10.0 −18.3 −27.1 −37.7 −51.8 −56.5Peru −10.1 −8.2 −1.5 −6.0 −31.1 −30.6 −32.7Uruguay −34.2 −33.5 −48.0 −49.1 −47.6 −52.2 −56.2Venezuela 66.3 36.4 9.0 −5.6 −18.6 −32.2 −37.9
Sources: United Nations Development Program and World Bank, World Development Indicators, 2007.a. Values are expressed as the percentage deviation of the indicated country’s income per capita from
average income per capita (in current dollars at purchasing power parity) among a group of countries in thesame decile on the social subindex of the Human Development Index as the indicated country (see foot-note 5 in the text).
n.a. = not available.
11630-01_CH01_rev2.qxd 6/2/09 4:04 PM Page 3
4 liliana rojas-suarez
5. Improved financial regulatory and supervisory frameworks, freer trade arrangements, andimprovements in macroeconomic management are cited as key reforms.
6. Not even the most optimistic analysts, however, saw all countries in the same favorable posi-tion as of late 2008. For example, the majority of experts (optimistic and otherwise) viewed the weakfundamentals in Venezuela as self-generated problems that had been building long before the cur-rent international crisis.
Ecuador, Honduras, and Nicaragua) have seen a steady deterioration in relativeincome per capita, while in others (such as Argentina, Brazil, Colombia, El Sal-vador, and Uruguay) some improvement took place in the early to mid-1990s butwas later reversed. Of all the countries considered, Nicaragua’s income per capitarelative to that in advanced countries has deteriorated the most (by 24 percentagepoints) over the entire period, closely followed by Argentina and Venezuela(almost 23 percentage points in each).
A similar result emerges when we compare the Latin American countries withtheir peers in terms of social development. By 2005 only Chile and Brazil hadachieved incomes per capita above the corresponding average for this group ofcountries. A closer look at individual countries reveals even more disappointingresults. For example, Mexico, which by the mid-1970s had an income per capitawell above the average for its peers, has been steadily losing ground ever since, sothat by 2005 it had fallen back close to the average. Even more dramatic are thecases of Argentina, Guatemala, Panama, and Venezuela. In all these countriesincome per capita relative to their peers’ average has declined significantly, froman above-average position in 1975 to a sharply below-average position by 2005.
The deep international financial crisis taking place at this writing raises increas-ing concerns about the sustainability of even the modest recent gains. Views dif-fer on the relative ability of Latin America to weather the current crisis. Someanalysts remain optimistic, arguing that the reforms and policy decisions of thelast decade and a half in many countries in the region will help them absorb theadverse shock without drastic disruptions. These analysts recognize that LatinAmerica will not be insulated from the global crisis and that the region’s growthis almost certain to slow significantly, but they argue that the reforms and policiesof the 1990s and early 2000s,5 especially those that contributed to improvedmacroeconomic indicators—better fiscal positions, lower external debt, and largeaccumulations of foreign exchange reserves—will spare most countries in theregion from a major crisis in their own economies.6
Other analysts paint a more skeptical picture. Without denying the benefits ofthe reform efforts, they argue that when properly measured to control for cyclicalfluctuations (such as a temporary increase in fiscal revenue in many countries, dueto temporary increases in commodity prices), fiscal stances in the region are notparticularly strong on a permanent, “structural” basis. Indeed, the argument is that
11630-01_CH01_rev2.qxd 6/2/09 4:04 PM Page 4
in many countries, fiscal vulnerabilities to external shocks in the period 2003–07remained practically as large as in the 1990s.7 In this view the possibility of a seri-ous crisis in some Latin American countries cannot be ruled out.8 Despite thesediverging views, experts find common ground in recognizing the enormous dif-ferences among countries in the region. For example, even analysts with oppositepoints of view regarding Latin America’s prospects as a region praise Chile’sdomestic growth capacity as well as its ability to face sudden adverse externalshocks. At the other extreme, a large majority of analysts do not find Venezuela’scurrent economic, social, and political conditions to be conducive to sustainablegrowth.
This book tackles a complex issue that looks far beyond the current crisis: Whatcan Latin American countries do to accelerate economic growth while ensuringits sustainability? The issue is complex because many countries in the region havealready undertaken a significant number of reforms and policies in a variety ofareas, yet positive results, in terms of rapid and sustained economic growth, haveremained for the most part elusive. An additional, and perhaps more important,complexity arises from the fact that large segments of the population, deeply dis-contented with the results of market-based policies, are unwilling to support addi-tional efforts at reform. As will become evident throughout the book, “inaction,”“paralysis,” and “impasse” are terms frequently used to describe the current stateof problems facing a number of countries in the region.
A large and growing literature, briefly discussed below, already examinesboth the theory of growth acceleration and the diagnostics of growth in devel-oping countries; there are, in addition, a host of empirical studies of LatinAmerica as a whole and of specific countries.9 What, then, does this book add tothe discussion? In a nutshell, this book’s major contribution is twofold. First, itapproaches the subject matter by developing a straightforward and simple ana-lytical framework especially designed for Latin America. Second, and related to thefirst, it uses this framework to advance specific policy recommendations for a
introduction 5
7. Among supporters of this view are Izquierdo, Ottonello, and Talvi (2008).8. Supporters of this view argue that the favorable external environment that Latin America faced
from 2003 through mid-2008—unprecedentedly high export prices, rapid growth in the global econ-omy, and benign financial conditions—explain the lion’s share of the region’s improved economicperformance during that period. These external conditions led to an “endogenous” increase in fiscalrevenue and thus to an improvement in reported fiscal balances. However, as the external environ-ment deteriorates, fiscal revenue will decrease, exposing the underlying fiscal vulnerabilities. Thesevulnerabilities are viewed as particularly important in those countries where increases in fiscal expen-diture (financed by temporary increases in revenue) focused mostly on current rather than invest-ment spending. Some of the case studies in this book raise this issue as a serious problem thatweakened the foundations for growth.
9. See, for example, Birdsall et al. (2008), where the emphasis is on policies to achieve growth andimproved equity in Latin America.
11630-01_CH01_rev2.qxd 6/2/09 4:04 PM Page 5
sample of countries on how to proceed with the reform process, taking intoaccount the specific local conditions (economic, social, and political) that character-ize those countries.
The book is the collective effort of many authors, all of them experts in the eco-nomics and politics of growth in Latin America. Some of them participated in theTask Force that constructed the book’s analytical framework, which is summa-rized below and fully presented in chapter 2. Although simple and intuitive, theframework is capable of dealing with the many ingredients that shape the processof economic growth in the region: from the macroeconomic stance to the qualityof political institutions; from productivity to income inequality; from advances indemocracy to popular resistance to further reform. Most important, the frame-work specifically avoids applying a straitjacket to the region’s problems: the partic-ularities and uniqueness of each country are highlighted wherever the frameworkis applied.
A second group of experts formed teams to apply the framework to each of fivecountries in the region: Brazil, Colombia, Costa Rica, Mexico, and Peru. Largeand small, and representing various parts of the region, these five countries clearlyillustrate both the commonalities and the sharp differences within Latin America.The resulting analyses are presented in chapters 3 through 7. In each chapter theemphasis is on specific recommendations for policy actions that are doable, in boththe economic and the political sense.
The rest of this introductory chapter has four sections. The first discussessome essential economic and political characteristics that distinguish Latin Amer-ica from other world regions and that had to be taken into account in construct-ing the analytical framework. The next section walks the reader through the mainelements of the analytical framework, emphasizing the differences between it andother approaches in the literature. The third section summarizes the most impor-tant results obtained from applying the framework to the five countries listedabove. The chapter concludes with some final thoughts about the relevance of thelessons from the country studies for other countries and the region as a whole.
What Is Different about Latin America? Some Key Stylized Facts
In creating an analytical framework tailored specifically to Latin America, we con-sidered it important to identify some key features that distinguish the region fromother developing areas of the world. Of course, Latin America shares many com-mon features with the rest of the developing world, and countries within LatinAmerica differ significantly among themselves, but three particular features areshared by most countries in the region. The first is of an economic nature: LatinAmerica is the most financially open of the world’s developing regions. The sec-ond is political: Latin America is also the world’s most democratic developingregion. The third encompasses both the economic and the social arenas: Latin
6 liliana rojas-suarez
11630-01_CH01_rev2.qxd 6/2/09 4:04 PM Page 6
America is also the world region with the greatest economic and social inequality.This section will explore all three of these features and the constraints they imposeon achieving sustained growth.
Latin America Is the World’s Most Financially Open Developing Region
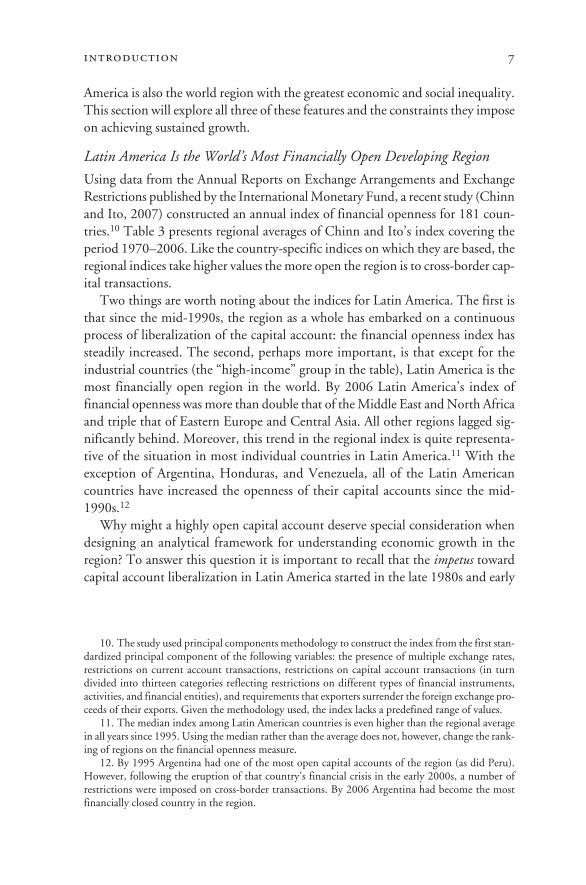
Using data from the Annual Reports on Exchange Arrangements and ExchangeRestrictions published by the International Monetary Fund, a recent study (Chinnand Ito, 2007) constructed an annual index of financial openness for 181 coun-tries.10 Table 3 presents regional averages of Chinn and Ito’s index covering theperiod 1970–2006. Like the country-specific indices on which they are based, theregional indices take higher values the more open the region is to cross-border cap-ital transactions.
Two things are worth noting about the indices for Latin America. The first isthat since the mid-1990s, the region as a whole has embarked on a continuousprocess of liberalization of the capital account: the financial openness index hassteadily increased. The second, perhaps more important, is that except for theindustrial countries (the “high-income” group in the table), Latin America is themost financially open region in the world. By 2006 Latin America’s index offinancial openness was more than double that of the Middle East and North Africaand triple that of Eastern Europe and Central Asia. All other regions lagged sig-nificantly behind. Moreover, this trend in the regional index is quite representa-tive of the situation in most individual countries in Latin America.11 With theexception of Argentina, Honduras, and Venezuela, all of the Latin Americancountries have increased the openness of their capital accounts since the mid-1990s.12
Why might a highly open capital account deserve special consideration whendesigning an analytical framework for understanding economic growth in theregion? To answer this question it is important to recall that the impetus towardcapital account liberalization in Latin America started in the late 1980s and early
introduction 7
10. The study used principal components methodology to construct the index from the first stan-dardized principal component of the following variables: the presence of multiple exchange rates,restrictions on current account transactions, restrictions on capital account transactions (in turndivided into thirteen categories reflecting restrictions on different types of financial instruments,activities, and financial entities), and requirements that exporters surrender the foreign exchange pro-ceeds of their exports. Given the methodology used, the index lacks a predefined range of values.
11. The median index among Latin American countries is even higher than the regional averagein all years since 1995. Using the median rather than the average does not, however, change the rank-ing of regions on the financial openness measure.
12. By 1995 Argentina had one of the most open capital accounts of the region (as did Peru).However, following the eruption of that country’s financial crisis in the early 2000s, a number ofrestrictions were imposed on cross-border transactions. By 2006 Argentina had become the mostfinancially closed country in the region.
11630-01_CH01_rev2.qxd 6/2/09 4:04 PM Page 7
Tab
le 3
.Fi
nanc
ial O
penn
ess I
ndic
es b
y W
orld
Reg
ion,
197
0–20
06a
Reg
ion
1970
1975
1980
1985
1990
1995
2000
2005
2006
Eas
t Asi
a an
d Pa
cific
−0.4
4−0
.41
−0.3
20.
01−0
.05
0.32
−0.1
7−0
.10
−0.1
3E
aste
rn E
urop
e an
d C
entr
al A
sia
−1.1
3−1
.13
−1.8
0−1
.46
−0.7
8−0
.09
−0.3
00.
360.
46H
igh-
inco
me
coun
trie
s0.
210.
300.
610.
851.
081.
731.
701.
851.
85La
tin
Am
eric
a an
d C
arib
bean
0.13
−0.0
6−0
.13
−0.9
6−0
.78
0.17
0.66
1.06
1.03
Lati
n A
mer
ica
0.21
−0.0
10.
07−1
.09
−0.8
20.
361.
091.
581.
54C
arib
bean
−0.2
2−0
.36
−1.3
5−0
.71
−0.7
1−0
.17
−0.1
30.
120.
11M
iddl
e E
ast a
nd N
orth
Afr
ica
−1.0
3−0
.78
−0.4
7−0
.35
−0.3
80.
060.
330.
510.
60So
uth
Asi
a−1
.05
−1.2
3−1
.24
−1.0
0−1
.00
−0.1
6−0
.47
−0.4
2−0
.42
Sub-
Saha
ran
Afr
ica
−0.9
3−0
.63
−0.9
0−0
.83
−0.8
6−0
.55
−0.5
2−0
.47
−0.5
3
Sour
ce: C
hinn
and
Ito
(200
7).
a. A
hig
her
valu
e in
dica
tes
grea
ter
open
ness
of t
he c
apit
al a
ccou
nt.
11630-01_CH01_rev2.qxd 6/2/09 4:04 PM Page 8
1990s, when, in an attempt to end the region’s “paralysis” following the 1982 debtcrisis, the Brady Plan first allowed for the securitization of governments’ externalliabilities (beginning with Mexico in 1989). Since then, a highly liquid market forinternational bonds and other securities issued by Latin American countries andother emerging markets has developed, displacing unsecuritized bank lending asa major source of portfolio flows to the region.13 Two basic differences betweeninternational bank loans and international bonds are central for understandingthe importance of international securitization for the achievement of sustainedgrowth in Latin America.14 The first is that a well-developed secondary marketexists for international bonds, but not for unsecuritized bank loans. The secondis that, in contrast to the institutions now well established for negotiations involv-ing internationally active banks, concerted arrangements among bondholders todeal with collective action problems in cases of sovereign default are still in theearly stages. (The inclusion of collective action clauses in recent bond issues by anumber of emerging market countries is a step in the right direction.) Together,the existence of this well-developed secondary market for international bonds andthe absence of pre-established arrangements for default on those bonds imply thatany news affecting investors’ perceptions of a country’s capacity or willingness toservice its debt is reflected immediately in bond prices. A key measure here is thespread between the yield on bonds issued by a given country and the yield on U.S.Treasury bonds of corresponding maturity. If both bonds are denominated inU.S. dollars (or in euros, as some recent bond issues have been), both are free ofexchange rate risk, and the spread between them can be considered a measure ofcountry or default risk.
When investors’ perceptions of risk deteriorate significantly for a given coun-try, the yield and the spread on that country’s external debt increase sharply, rais-ing the country’s financing costs and severely limiting the availability of externalsources of finance. Because an increase in spreads constitutes a market signal of anincrease in country risk, it quickly translates into higher domestic interest rates.15
Since the financial system in most Latin American countries is dominated by
introduction 9
13. This process started with the emergence of the Brady bonds. We explicitly emphasize herethe process of international securitization rather than the more general process of financial integra-tion. Although the latter is often the focus when describing the depth of countries’ participation ina wide variety of cross-border flows as well as structural processes (such as the role of foreign banksin the region), countries in the region increasingly resort to the international bond market, ratherthan more traditional loans from international banks, to meet their financing needs.
14. I previously presented this argument in Rojas-Suarez (2003) to explain the importance ofinternational securitization for the conduct of monetary policy in Latin America.
15. For evidence on how country risk affects domestic interest rates in Latin America, see Rojas-Suarez and Sotelo (2007).
11630-01_CH01_rev2.qxd 6/2/09 4:04 PM Page 9
short-term instruments, domestic interest rates at all maturities are affected, withadverse implications for investment and economic growth.16
This transmission mechanism from international to domestic interest rates isreinforced by two additional characteristics of the region’s economies. The first isthat national saving rates remain very low, and local financial markets remainunderdeveloped. Indeed, a recent study by Gutierrez (2007) shows that the aver-age national saving rate for the region has remained at the low (20 to 23 percent)levels observed in the 1960s and 1970s. In this context, domestic sources offinance are very limited and thus cannot offset the severe curtailment of externalfinancing that often follows a deterioration in investors’ perceptions of creditwor-thiness.17 Thus, in countries with “freer” capital accounts, domestic interest ratesare likely to be strongly influenced by international perceptions of country cred-itworthiness.
The second characteristic is that in sharp contrast to its financial openness,most of Latin America (with the notable exception of most of the Central Amer-ican countries) remains relatively closed in terms of trade flows, and exports remainhighly concentrated in commodities.18 Although the situation has improved inrecent years, standard indicators of trade openness, such as the simple ratio of
10 liliana rojas-suarez
16. In addition, the experience in Latin America shows that, to a large extent, private debt can beconsidered a contingent liability of the government. Historically, when the private sector has encoun-tered severe difficulties, governments have often “absorbed” its liabilities into the public sectoraccounts. Thus, it is difficult in practice for investors to distinguish between government risk andprivate sector risk. In this context, adverse shocks increase the perceived risk of liabilities issued byboth the public and the private sector. This, of course, pushes interest rates up.
17. At any point in time, a country’s given stock of debt (both domestic and external) becomesriskier if the country’s capacity to roll over maturing debt decreases sharply. If, following a suddenadverse shock, increased perceptions of default lead to an increase in spreads and a severe reductionin market access, the country’s overall capacity to service its existing obligations decreases. Domesticinterest rates increase as domestic holders of the country’s liabilities perceive the deterioration of bor-rowers’ capacity to meet payments. Notice that this transmission mechanism from default risk todomestic interest rates operates even if the country has a flexible exchange rate system. The reason isthat even a large depreciation of the currency cannot generate external resources quickly enough tooffset a sharp decrease in the availability of foreign sources of finance. This problem, of course, isgreater, the larger the stock of debt and the shorter the maturity structure. It is precisely the recogni-tion of limited capacity of domestic financial and capital markets, in the context of an open capitalaccount, that has encouraged a number of governments in recent years to accumulate large stocks ofinternational reserves and to buy back expensive external debt and issue new debt at better terms(lower rates and longer maturities).
18. Some extreme examples of commodity concentration are Ecuador and Venezuela; on theother hand, countries like Brazil, Costa Rica, El Salvador, and Mexico are diversifying significantlyinto manufacturing exports, which now exceed 50 percent of all goods exports in those countries. Acritical problem associated with the lack of trade diversification is the high volatility that character-izes commodity prices. The events of 2007–08 provide the most recent example. After dramaticallyincreasing during 2007 and the first half of 2008, prices of a number of commodities exported by theregion fell sharply in the second half of 2008. At this writing, it is still too early to assess whetherthe region will face a significant adverse terms of trade shock, compounding the adverse effects of thecapital account shock associated with the U.S.-led global financial crisis.
11630-01_CH01_rev2.qxd 6/2/09 4:04 PM Page 10
exports plus imports to GDP, show that the region has a long way to go to reachthe level of openness of East Asia and the industrial countries.19 This characteris-tic implies that export flows have very limited scope to mitigate the lack of financ-ing resulting from a severe adverse shock to the capital account, even if that shockis accompanied by a significant depreciation of local currencies.
The message, therefore, is clear: to maximize the growth benefits from accessto international capital markets, liberalized capital accounts need to be accompa-nied by macroeconomic stability at all times. Any deviation will quickly result inreduced perceptions of the country’s creditworthiness, a wider spread on the coun-try’s external debt, and higher domestic interest rates, to the detriment of invest-ment and growth.
Increased access to international capital markets is by no means a panacea,however; it also brings potential risks. As the current international financial crisishas demonstrated, sudden reversals of capital inflows not related to local develop-ments can dramatically affect countries’ growth prospects. Self-insurance policies,such as the accumulation of foreign exchange reserves and fiscal stabilization fundsthat build up resources during economic booms to be used in harder times, needto be important components of a strong macroeconomic agenda.
In spite of the current deep uncertainties in the international capital markets,there are no indications that Latin America will cease to be the world’s most finan-cially open developing region any time in the foreseeable future.20 As mentionedabove, very low national saving rates imply that most countries in the region needexternal sources of funding to finance growth, and this need will remain in placelong after the current turmoil ends.21 Hence countries in the region simply cannot
introduction 11
19. Of course, the region has made important progress in reducing tariffs and (in some countries)nontariff restrictions, and these policies help explain the sustained improvement in the region’s tradeopenness in the last two decades. The point advanced here, however, is that Latin America needs alarge, dynamic, competitive, and diversified export sector to help offset the severe impact on growthfrom a deterioration in investors’ perceptions of countries’ creditworthiness. This is also the reasonwhy we prefer the simple ratio of exports plus imports to GDP as the appropriate indicator of tradeopenness, rather than other more sophisticated indicators such as that advanced by Sachs and Warner(1995) and updated by Wacziarg and Horn Welch (2003). Those indicators do not include somekey factors that restrict trade openness, such as the lack of adequate infrastructure and bureaucraticcustoms arrangements (see Birdsall and Rojas-Suarez 2004).
20. In recent years external government liabilities of a number of countries in Latin America haveachieved investment grade ratings by international credit rating agencies. Some other governmentshave placed the achievement of investment grade among their top priorities. Moreover, a number ofcountries in the region depend on inflows from foreign direct investment, and this type of flow isquite sensitive to the extent to which cross-border flows (including transfers of dividend payments)are free of encumbrances. In this context it is safe to state that open capital accounts are “here to stay”in most countries in the region.
21. Most studies of the relationship between saving and growth conclude that sustained growthis needed for saving rates to increase (although some others, such as Gutierrez, 2007, find an ambigu-ous causality). Thus, increasing saving rates in Latin America is a long-term process. In the short andthe medium term, savings from abroad, in the form of foreign direct investment and portfolio flows,are perceived by policymakers in many countries in the region as an engine of growth.
11630-01_CH01_rev2.qxd 6/2/09 4:04 PM Page 11
afford important deviations from macroeconomic stability (including the estab-lishment of self-insurance policies to deal with the vagaries of international capi-tal markets) if they are to achieve sustained growth. Add to this the region’srepeated experience with hyperinflation and financial crises in the 1980s and1990s, and it becomes apparent that Latin America has less room for macroeco-nomic mistakes than most other regions.22
Latin America Is the Developing World’s Most Democratic Region
The indices of the strength of democratic institutions often used in country com-parisons differ in their definition and measurement of democracy. Some indicesadopt a relatively narrow concept, focusing on the rights of citizens to vote freelyin fair elections between competing parties; others define democracy more broadly,to include indicators of the degree of “participation” and the development of a“political culture,” where citizens actively and freely take part in public debate, electrepresentatives, and join political parties. Two of the best known indices of democ-racy are those of Freedom House and the Economist Intelligence Unit (EIU); thelatter is the broadest measure of democracy among those that cover the majority ofcountries in the world.23
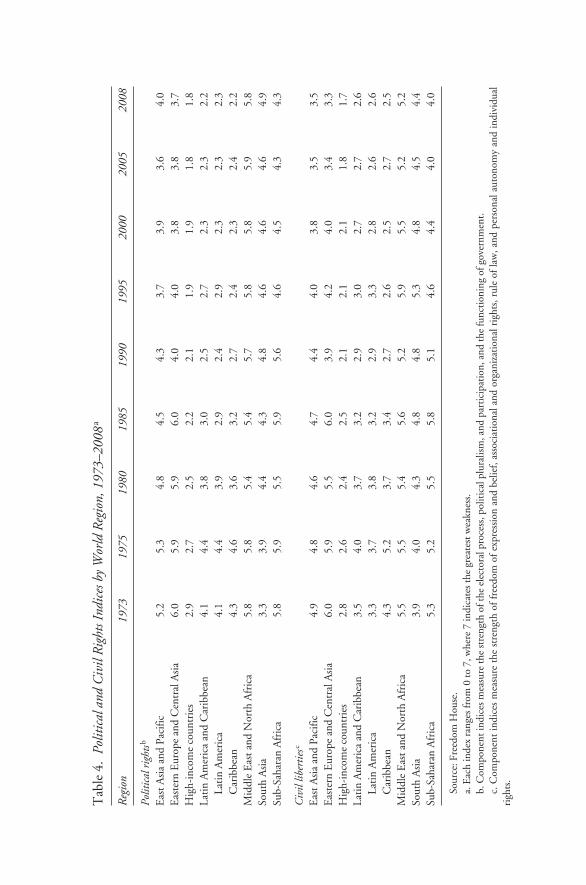
Despite their differences in definition and measurement, Latin America standsout on both these measures as the most democratic region in the developingworld. Table 4 presents regional averages of two indices from Freedom House’sdemocracy survey: the index of civil liberties and the index of political rights.24
The former is a narrow index that concentrates on the freedom and rights ofexpression, belief, and association of individuals, as well as on respect for the ruleof law. The latter is a broader index that seeks to measure the quality of the elec-toral process, the strength of political pluralism and participation, and the abilityof the government to implement democratically based decisions. Both indicesrange from 0 to 7, where a lower number indicates fewer or smaller obstacles todemocracy. Data for both indices are available for the period 1973–2008.
Both indices show that democracy has improved significantly in Latin Amer-ica from the 1970s to the present, and that as of 2008 Latin America enjoyed the
12 liliana rojas-suarez
22. Although this volume does not focus on the issue of volatility (which would require an entirebook in itself ), macroeconomic stability (broadly defined to include self-insurance policies) is essen-tial to contain the high volatility of economic and financial indicators that have characterized theregion and that have been shown to be detrimental to growth. Indeed, unless countries have adequatemacroeconomic and self-insurance policies, freer capital markets can lead to higher economic andfinancial volatility.
23. In addition, the United Nations Development Program (UNDP) has an “Electoral Democ-racy Index,” but it is constructed for Latin America only and therefore does not allow for regionalcomparisons. Also, the index has been calculated only until 2002. In any case, the results for individ-ual countries on the UNDP index are similar to those of the other indices considered here.
24. The regional averages are simple averages. The classification of countries by region followsthe World Bank’s World Development Indicators.
11630-01_CH01_rev2.qxd 6/2/09 4:04 PM Page 12
Tab
le 4
.Po
litic
al a
nd C
ivil
Rig
hts I
ndic
es b
y W
orld
Reg
ion,
197
3–20
08a
Reg
ion
1973
1975
1980
1985
1990
1995
2000
2005
2008
Polit
ical
rig
htsb
Eas
t Asi
a an
d Pa
cific
5.2
5.3
4.8
4.5
4.3
3.7
3.9
3.6
4.0
Eas
tern
Eur
ope
and
Cen
tral
Asi
a6.
05.
95.
96.
04.
04.
03.
83.
83.
7H
igh-
inco
me
coun
trie
s2.
92.
72.
52.
22.
11.
91.
91.
81.
8La
tin
Am
eric
a an
d C
arib
bean
4.1
4.4
3.8
3.0
2.5
2.7
2.3
2.3
2.2
Lati
n A
mer
ica
4.1
4.4
3.9
2.9
2.4
2.9
2.3
2.3
2.3
Car
ibbe
an4.
34.
63.
63.
22.
72.
42.
32.
42.
2M
iddl
e E
ast a
nd N
orth
Afr
ica
5.8
5.8
5.4
5.4
5.7
5.8
5.8
5.9
5.8
Sout
h A
sia
3.3
3.9
4.4
4.3
4.8
4.6
4.6
4.6
4.9
Sub-
Saha
ran
Afr
ica
5.8
5.9
5.5
5.9
5.6
4.6
4.5
4.3
4.3
Civ
il lib
ertie
sc
Eas
t Asi
a an
d Pa
cific
4.9
4.8
4.6
4.7
4.4
4.0
3.8
3.5
3.5
Eas
tern
Eur
ope
and
Cen
tral
Asi
a6.
05.
95.
56.
03.
94.
24.
03.
43.
3H
igh-
inco
me
coun
trie
s2.
82.
62.
42.
52.
12.
12.
11.
81.
7La
tin
Am
eric
a an
d C
arib
bean
3.5
4.0
3.7
3.2
2.9
3.0
2.7
2.7
2.6
Lati
n A
mer
ica
3.3
3.7
3.8
3.2
2.9
3.3
2.8
2.6
2.6
Car
ibbe
an4.
35.
23.
73.
42.
72.
62.
52.
72.
5M
iddl
e E
ast a
nd N
orth
Afr
ica
5.5
5.5
5.4
5.6
5.2
5.9
5.5
5.2
5.2
Sout
h A
sia
3.9
4.0
4.3
4.8
4.8
5.3
4.8
4.5
4.4
Sub-
Saha
ran
Afr
ica
5.3
5.2
5.5
5.8
5.1
4.6
4.4
4.0
4.0
Sour
ce: F
reed
om H
ouse
.a.
Eac
h in
dex
rang
es fr
om 0
to 7
, whe
re 7
indi
cate
s th
e gr
eate
st w
eakn
ess.
b. C
ompo
nent
indi
ces
mea
sure
the
stre
ngth
of t
he e
lect
oral
pro
cess
, pol
itic
al p
lura
lism
, and
par
tici
pati
on, a
nd th
e fu
ncti
onin
g of
gov
ernm
ent.
c. C
ompo
nent
indi
ces
mea
sure
the
str
engt
h of
fre
edom
of
expr
essi
on a
nd b
elie
f, as
soci
atio
nal a
nd o
rgan
izat
iona
l rig
hts,
rul
e of
law
, and
per
sona
l aut
onom
y an
d in
divi
dual
righ
ts.
11630-01_CH01_rev2.qxd 6/2/09 4:04 PM Page 13
highest average level of democracy of any developing region.25 Of course, the cen-tral reason behind the improvement is the abandonment of military regimes inLatin America. Whereas in the 1970s twelve of the eighteen Latin American coun-tries had a military government, there has been none in the region since 1991.26
Other indices, such as the new EIU Index of Democracy, first estimated for 2006,confirm this result and provide additional information about the depth of democ-racy. For example, although the region as a whole ranks high for the quality of itselectoral processes, the extent of political participation and the development of apolitical culture are still very low. As stated by Kekic (2007) of the EIU, a demo-cratic political culture requires not only a politically engaged citizenry, but alsothe willingness of losing parties to accept the judgment of the voters and allow thepeaceful transfer of power. The EIU gives very low ratings on political culture toBolivia, Ecuador, and Nicaragua.
A similar result is obtained by the Polity IV Index, which assesses in a singleindex both the quality of democracy and the autocratic authority of govern-ments.27 Once again, Latin America as a whole stands out as the most democraticregion in the developing world. By this index, Ecuador and Venezuela had thelowest scores in the region in 2007, and Costa Rica and Uruguay the highest. Thedifferences in scores indicate that not all democracies are alike in Latin America—a fact that will become evident in the country analyses presented in chapters 3through 7.
Like its financial openness, Latin America’s overall improvement on these indi-cators of democracy needs to be taken into account when designing an analyticalframework linking policy reforms and growth. Some economic reforms might notbe sustainable, even if they deliver growth, if a significant proportion of voters donot share in the benefits of that growth or in other reform outcomes. A disgrun-tled population can use its newly acquired voice to express its dissatisfactionthrough the electoral process, the legislature, and other forums. As has been widelydocumented (see, for example, Birdsall, de la Torre, and Menezes, 2008), there isan important (and in some countries increasing) risk of a backlash against “mar-kets” and, by association, against the market-based policies and reforms imple-
14 liliana rojas-suarez
25. Over the last thirty years, Latin America and South Asia have traded places in terms of thedegree of democracy. In the 1970s South Asia was the most democratic region in the developingworld, according to the Freedom House political rights index, but democracy has been weakening inalmost every country in this region since then, and South Asia is now the second-least democraticregion of the developing world, after the Middle East and North Africa.
26. General Augusto Pinochet led the last military government in Latin America, that of Chile,which ended in 1991.
27. The Polity Index (an index of the Polity Project; www.systemicpeace.org/polity/polity4.htm) consists of six measures that document key qualities of executive recruitment, con-straints on executive authority, and political competition. It also documents changes in the institu-tionalized qualities of governing authorities.
11630-01_CH01_rev2.qxd 6/2/09 4:04 PM Page 14
mented in the region since the early 1990s. Chapter 2 discusses the relationshipbetween democracy and the reform process in more detail.28
Indeed, results for 2007 from Latinobarómetro, a well-known regional surveyof public opinion, indicate that about half of Latin Americans are dissatisfiedwith the “workings of the market system.”29 As figure 1 shows, public supportfor free markets has been declining since the late 1990s. Dissatisfied citizens wantgreater government intervention in economic activities and increased social pro-tections. The declining trend in the number of “market supporters” is consistentwith the fact that over the last few years, several “leftist” presidential candidateshave scored victories over candidates more openly supportive of market-basedpolicies.30
As of this writing, the deep financial and economic crisis in the United Statesand other industrial countries is exacerbating concerns about a potential backlashagainst market-based reforms and policies in Latin America. Although the crisishas appropriately underscored the need for major changes in the global financialregulatory and supervisory framework, a number of politicians (and some ana-lysts) around the world are using the opportunity presented by the crisis to fulmi-nate against markets in general. Thus, rather than advancing proposals on how toimprove the functioning of markets through adequate regulation and counter-cyclical policies, these critics often focus solely on increased restrictions on thescope of market activity.
Given the global economic slowdown that is accompanying the financial cri-sis, Latin America is likely to face, over the next few years, a significant deteriora-tion of the international environment in which it operates, affecting both financialand trade flows. The result may be a sharp reduction in economic growth in theregion, a rise in unemployment, and thus the potential for even further populardiscontent with market-based reform. This discontent runs the risk of inducingnot only an abandonment of the future reform agenda, but even a reversal of poli-cies and reforms already in place that have helped generate growth. Under thesecircumstances, time is of the essence, to allow the gains from growth—howevermodest—to be shared more broadly among the population. These considerations
introduction 15
28. Przeworski, Alvarez, and Cheibub (2000) is an important reference in the literature on therelationship between democracy and development.
29. Corporación Latinobarómetro (2007).30. Three of the five countries where Latinobarómetro finds increased support for democracy—
Bolivia, Ecuador, and Nicaragua—are precisely the countries that the EIU index classifies as leastdemocratic (together with Venezuela). This apparent paradox can be resolved by noting that the lowscore obtained by these three countries on the EIU index is due to very low levels of “political cul-ture” (as described in the text). However, the current presidents of Bolivia, Ecuador, and Nicaraguarepresent constituencies that have previously felt excluded from government, which explains theimproved support for a democratic system highlighted by the Latinobarómetro survey.
11630-01_CH01_rev2.qxd 6/2/09 4:04 PM Page 15
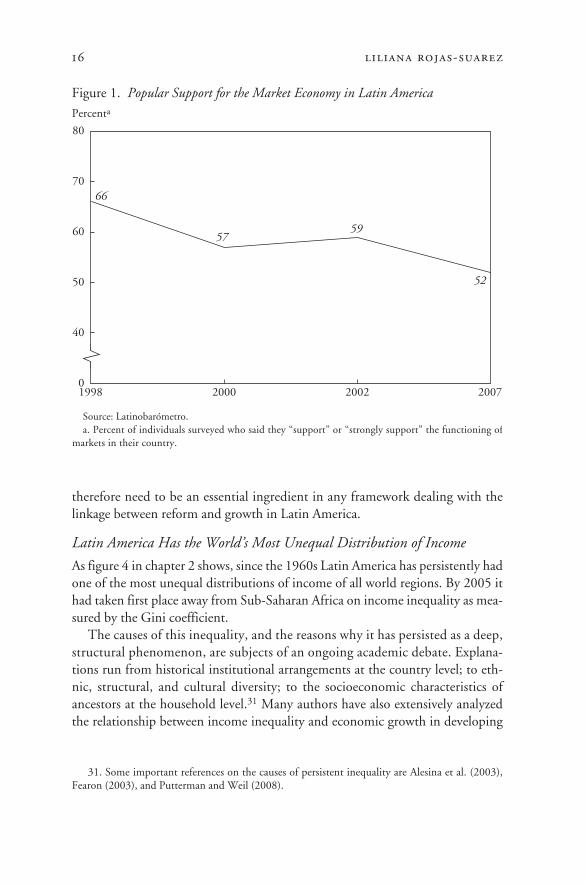
Figure 1. Popular Support for the Market Economy in Latin America
therefore need to be an essential ingredient in any framework dealing with thelinkage between reform and growth in Latin America.
Latin America Has the World’s Most Unequal Distribution of Income
As figure 4 in chapter 2 shows, since the 1960s Latin America has persistently hadone of the most unequal distributions of income of all world regions. By 2005 ithad taken first place away from Sub-Saharan Africa on income inequality as mea-sured by the Gini coefficient.
The causes of this inequality, and the reasons why it has persisted as a deep,structural phenomenon, are subjects of an ongoing academic debate. Explana-tions run from historical institutional arrangements at the country level; to eth-nic, structural, and cultural diversity; to the socioeconomic characteristics ofancestors at the household level.31 Many authors have also extensively analyzedthe relationship between income inequality and economic growth in developing
16 liliana rojas-suarez
31. Some important references on the causes of persistent inequality are Alesina et al. (2003),Fearon (2003), and Putterman and Weil (2008).
Percenta
Source: Latinobarómetro. a. Percent of individuals surveyed who said they “support” or “strongly support” the functioning of
markets in their country.
40
50
60
7066
5759
52
80
01998 2000 2002 2007
11630-01_CH01_rev2.qxd 6/2/09 4:04 PM Page 16
countries,32 identifying the channels through which inequality might adverselyaffect growth.33 As Birdsall (2007) concluded in a recent review of the literature,the evidence suggests that inequality above some level is likely to reduce growth.This finding by itself should be a matter of concern for policymakers in LatinAmerica, given its highly unequal income distribution.34
There are also a number of reasons why high income inequality, together withinequality of land ownership and education, might act to deter the implementa-tion of pro-growth reforms and policies. A prominent study in the Latin Americancontext is that by Birdsall et al. (2008). These issues will be developed further inchapter 2. Suffice it to emphasize here that, among all regions in the developingworld, Latin America has the unique combination of being the most democraticand the most unequal. Together these two characteristics affect the policymakingprocess, influence policy options, and contribute to explaining the results pre-sented in figure 1. No analytical framework aimed at achieving sustainable growthin Latin America can ignore these characteristics.
The Analytical Framework
This section briefly explains the main elements of this study’s analytical frame-work, described further in chapter 2, and the differences between it and alterna-tive methodologies used to analyze the linkages between policy reforms andgrowth. What sets the analytical framework presented in this book apart from oth-ers in the literature is that it incorporates the three features, discussed above, thatdistinguish Latin America from its developing peers: its greater financial openness,its greater strength of democratic institutions, and its greater inequality. Thisframework is called the CGD Framework in later chapters.
Although the framework as designed is Latin America–specific, that does notimply that it does not build on previous analysis. Indeed, it is important to recog-nize its most important commonality with other contributions to the literature,namely, the search for “foundations for economic growth.” As in a number of
introduction 17
32. Some literature reviews include Birdsall (2007) and World Bank (2006).33. For example, Birdsall (2007) concludes from a review of the literature that high inequality
affects growth in developing countries through three channels: through the interaction of inequalitywith imperfect markets for capital and information; by discouraging the evolution of economic andpolitical institutions consistent with accountable governments (which in turn allow for an adequateinvestment climate); and by undermining the civic and social life that sustains effective collectivedecision making. An example of the last channel is the correlation observed between income inequal-ity and criminal violence (see, for example, Fajnzylber, Lederman, and Loayza, 2002).
34. Citing a study by Cornia, Addison, and Kiiski (2004), Birdsall cautiously (because of seriousmeasurement problems) identifies a Gini coefficient of 0.45 as a threshold level. As the Gini coeffi-cient increases, the effect of income distribution on growth is reportedly more negative. As figure 4in chapter 2 shows, the regional income Gini coefficient for Latin America has fluctuated around 0.5.
11630-01_CH01_rev2.qxd 6/2/09 4:04 PM Page 17
other analyses, the fundamental question asked here is the following: What are themain foundations that encourage the accumulation of physical and human capi-tal as well as improvements in productivity—the three factors that lead to eco-nomic growth?35
Researchers have tried to answer this question using several differentapproaches.36 For example, the identification of growth foundations is at the coreof the recent literature on institutions. Following North (1991), institutions canbe broadly defined as the set of formal rules and informal conventions that shapeincentives for economic and social behavior. In this literature, pro-growth insti-tutions are those that ensure an adequate structure of rewards for those who pro-vide labor and capital; that secure property rights and contract enforcement for alleconomic agents; that promote competition as a means of providing incentivesfor productivity growth; and that allow for relatively equal access to economicopportunity.37 From a policy perspective, the question is then how to achieve suchoutcomes. As noted by Zettelmeyer (2006), a number of analysts as well as multi-lateral organizations have answered this question by promoting what are nowknown as “second generation” reforms, so called because they complement thereforms encompassed in the earlier “Washington consensus” (Williamson, 1990)by addressing the deep constraints to growth more directly. An example of thistype of reform is reform of the judicial system, whose inefficiencies and lack ofindependence from political pressures in many countries undermine respect forthe rule of law, the enforcement of contracts, and the protection of property rights.At the empirical level, indicators of the “quality of institutions” are being usedto assess the impact of institutions on economic growth.38 Quite often the analy-sis takes the form of cross-country regressions of the type pioneered by Barro(1991).39
More recently, the approach developed by Hausmann, Rodrik, and Velasco(2005) addresses the issue of growth foundations by arguing that countries needto identify the single most important binding constraint on economic growth andthen focus on removing it. These authors argue that the presence of multiple dis-tortions in an economy makes it very difficult, if not impossible, to identify andavoid the unintended adverse consequences of a reform agenda covering a variety
18 liliana rojas-suarez
35. José De Gregorio, a member of the Task Force that produced the analytical framework, posesthe question in this precise form in De Gregorio (2005).
36. A good survey of the literature on reforms and growth as applied to Latin America is con-tained in Zettelmeyer (2006).
37. See, for example, Acemoglu, Johnson, and Robinson (2005) and Easterly and Levine (2003).38. Commonly used indicators of institutional quality are the governance indicators constructed
by Kaufmann, Kraay, and Mastruzzi (2008), the measures of economic freedom developed by theCato Institute and the Heritage Foundation, and the measures of political institutional quality fromthe Polity IV database by Marshall and Jaggers (2007).
39. See, for example, De Gregorio and Lee (2003) and Blyde and Fernandez-Arias (2004).
11630-01_CH01_rev2.qxd 6/2/09 4:04 PM Page 18
of economic areas: reforming one area might worsen existing distortions in otherareas. The authors ground their alternative framework in economic first princi-ples, arguing that capital accumulation and entrepreneurship are the basic foun-dations for economic growth. Thus, insufficient investment, and therefore loweconomic activity, can be explained by either financing costs that are too high orprivate returns to investment that are too low. From these two potential restric-tions on growth, the authors build a “decision tree” for policymakers.
For example, if the problem is a high cost of finance, it could be due to eitherinsufficient access to international capital markets or insufficient local sourcesof finance. If the latter is the obstacle, it may be because of either low domesticsaving or problems with intermediating saving, and so on. This process ofbranching down the decision tree continues until policymakers are satisfied thatthe truly binding constraint has been identified. In the authors’ view, this sim-ple approach will facilitate getting the right diagnosis of impediments forgrowth, from which the appropriate recommendations for policy reform willlogically follow.40
The Hausmann-Rodrik-Velasco approach is appealing in its simplicity andfor explicitly recognizing that policy and reform recommendations need to takeinto account that different countries face different circumstances. However, amajor criticism is that in most countries, constraints are present at every forkof the decision tree. In other words, there may be not one or a few but manybinding constraints, with no particular reason (at least at the theoretical level)to prioritize any over the others. This leaves policymakers with little basis forchoosing among a large set of possible policy actions.41 In contrast, as will bediscussed below, the framework in this book and its application to a numberof countries show the intricacies, interrelations, and complementarities of alarge number of constraints (political, social, and economic) that Latin Amer-ican countries face simultaneously. Moreover, from the recommendationsdeveloped in chapters 3 through 7, the reader will find that dealing with iden-tified constraints entails a policy and reform agenda that is multidimensionaland layered.
The quest for sound analysis of the foundations of growth and an associatedreform strategy that is adequate to individual countries’ circumstances is far
introduction 19
40. In the authors’ view, because the resulting list of policy and reform recommendations to dealwith the binding constraint will be relatively short and focused, it will also be relatively simple to tracethe potential effects of those reforms in other areas of the economy, thus minimizing unintendedadverse consequences.
41. In their assessment of the Hausmann-Rodrik-Velasco framework (as applied by World Bankeconomists in twelve pilot studies), Leipziger and Zagha (2006) could not reach definitive conclu-sions. In their view the growth diagnostics approach, while providing a framework for formulatinghypotheses on growth constraints, “provides neither the hypotheses nor the empirical tools for test-ing them” (Leipziger and Zagha, 2006, p. 2).
11630-01_CH01_rev2.qxd 6/2/09 4:04 PM Page 19
from over. In 2008 the Commission on Growth and Development (2008) pub-lished its “Growth Report,” also known as the Spence Report after the commis-sion’s chairman Michael Spence. The focus of the report was on learning fromsuccessful growth experiences, defined as episodes where countries grew at anaverage annual rate of 7 percent or more over at least a twenty-five-year period.From an analysis of thirteen such experiences, the report identified a number ofpolicy and reform ingredients that appeared to be necessary for sustained growth;among these was significant public investment in infrastructure, health, andeducation. But the report refrained from offering either a recipe based on theidentified ingredients or a specific growth strategy applicable to all countries. Inthe authors’ view, the right combination of ingredients—as well as their timing,sequencing, and quantities—varies so much across countries that it should beleft in the hands of skilled and experienced leaders and policymakers in eachcountry.
In this context of an already large amount of work on growth and reform, howdoes the framework in this book deal with the identification of growth founda-tions in Latin America, and with the empirical design of policies and reforms toimpact those foundations? In brief, the framework is developed in four buildingblocks. The first is to identify the foundations for growth that apply in Latin Amer-ica, taking into account the particular features that distinguish Latin America fromother developing regions. This is perhaps the most important difference of thepresent framework from others aimed at linking reform and growth. The secondbuilding block is to ask, based on the existing literature on reform in Latin Amer-ica, whether alternative reforms and policies have the potential to affect (positivelyor negatively) the identified foundations. The third building block is to developa taxonomy of the types of obstacles—economic, social, or political—that specificcountries might face that can prevent reforms from having a positive impact onone or several of the foundations. The last building block, of a completely empir-ical nature, is to address those obstacles, either head on or by finding legitimateways to work around them.42
Since the framework is fully developed in chapter 2, it is unnecessary todescribe it in detail here. However, it will be useful to discuss briefly how thefoundations for growth in Latin America were identified. As stated above, theidentification process was guided by Latin America’s unique status as the mostfinancially open, most democratic, and at the same time most unequal region ofthe developing world.
20 liliana rojas-suarez
42. In contrast to the Hausmann-Rodrik-Velasco approach, the framework in this book does nottry to identify one or two binding obstacles. Instead, as will be seen below, the empirical search is for“weak growth foundations” and the policies and reforms that can strengthen them. As can be seenfrom the empirical studies in this book, the obstacles to effective implementation of policies andreforms can truly be multidimensional.
11630-01_CH01_rev2.qxd 6/2/09 4:04 PM Page 20
Latin America’s greater financial openness reflects past decisions on the partof policymakers in the region to let market forces, through the behavior of theinternational capital markets, assess the performance of their economies. Recog-nizing that growth and development require external sources of finance, policy-makers throughout Latin America pay considerable attention to internationalmarket signals. One such signal is the Global Emerging Market Bond Index(EMBI Global) spread, which is broadly used as a measurement of investors’perceptions of risk in individual countries. That is why, with a few exceptions(most notably Argentina and Venezuela), the trend in Latin America since themid-1990s has been toward removing capital controls and obstacles to foreigndirect investment in a number of economic sectors (including, quite promi-nently, the banking sector). Even in the midst of the international financial crisistaking place at this writing, there is no indication that the vast majority of LatinAmerican countries are considering reimposing restrictions on cross-borderfinancial transactions.
These circumstances imply that, in general, the policy choice has been formarket-based growth. This has allowed the international capital markets to playa significant role in assessing the appropriateness of policies and reforms, reward-ing the implementation of policies and reforms that strengthen the functioningof the markets while penalizing those that constrain it. The first three foundationsfor growth in Latin America, therefore, generate incentives for the adequate func-tioning and behavior of markets and market participants. These three founda-tions, which are in line with those proposed by supporters of the institutionalapproach, are
• secure property rights for the majority of the population, so that individualsand firms can benefit from their investments;
• sufficiently equal opportunities for broad segments of the society, which essen-tially means lowering barriers to entry to individuals and firms without politicalconnections or great wealth—in other words, leveling the playing field for market-based interactions; and
• sufficient economic and political competition, to avoid capture of the state bypowerful elites.
As we have seen, however, liberalization of capital accounts and exposure tointernational capital markets also mean that for growth to be sustainable,macroeconomic stability is a must. Achieving such stability requires the imple-mentation of self-insurance policies by both the fiscal (stabilization funds andactive debt management strategies) and the monetary authorities (accumula-tion of reserves) to deal with the vagaries of the international capital markets.As discussed above, in Latin America, with its combination of high financialopenness, limited trade openness, underdeveloped local financial markets, andlow national saving rates, capital inflows are likely to reverse course at the firstsign of economic instability. Add to this the region’s long history of economic
introduction 21
11630-01_CH01_rev2.qxd 6/2/09 4:04 PM Page 21
and financial crisis (including periods of hyperinflation and the total collapseof banking systems), and the need for the fourth growth foundation becomesclear:
• macroeconomic stability, to ensure that sufficient public funds are allocatedto pro-growth reform efforts and that the reform process will not be interruptedto deal with macroeconomic crises.In other words, in Latin America macroeconomic stability is more than just a pol-icy objective; it becomes a foundation that is needed for any other policy or reformto deliver growth. Recognizing the crucial need to maintain macroeconomic sta-bility if growth in the region is to be sustained, for purposes of the framework theTask Force upgraded macroeconomic stability from a policy goal to a foundationfor growth.
Latin America’s unique status as both the most democratic and the mostunequal region in the developing world formed the basis for the inclusion of a fifthand last foundation in the growth framework. As discussed above, these twofeatures have together played a key role in slowing or distorting countries’ market-based reform agendas (and at times stopping them altogether).
How does one reconcile the need for well-functioning markets with the dis-content of large segments of the population with the workings of the marketsystem? Clearly, this clash between what the region needs and what many of itspeople seem to want threatens sustained growth. To resolve this conflict, the fifthfoundation for sustained growth in Latin America calls for
• broad sharing among the population of the benefits from growth, to ensure thatmarket-based reforms and policies conducive to growth are sustainable.As will be discussed below, the experiences of several Latin American countriesshow that this foundation has often remained weak during the implementation ofpro-growth reform agendas. Birdsall et al. (2008) also emphasize this point andtherefore recommend, as part of their toolkit to promote fair growth in Latin Amer-ica, the implementation of well-designed programs to reach the poor and themiddle class.
The five foundations cannot be prioritized; all must be built simultaneously.Without the first three, there cannot be market-based growth, but without thelast two, no acceleration of growth can be sustainable. The rest of the frame-work builds on these foundations to guide policymakers in assessing thestrengths and weaknesses of the foundations in their individual countries andin identifying policies and reforms that can fortify these foundations. At thesame time, the framework stresses that the local conditions specific to eachcountry—economic, social, and political—are essential to determine whetherreforms and policies are needed to directly affect a certain foundation or foun-dations, or to deal with obstacles that prevent reforms from reaching the foun-dations in the first place.
22 liliana rojas-suarez
11630-01_CH01_rev2.qxd 6/2/09 4:04 PM Page 22
Everything else that the reader needs to know about the framework is devel-oped in chapter 2. The next section discusses some of the results achieved whenthe framework was actually applied to a sample of five Latin American countries.
Applying the Framework: What Did We Learn?
The analyses and results from applying the framework to Brazil, Colombia, CostaRica, Mexico, and Peru are the subject of chapters 3 through 7. As the reader willdiscover, the studies provide a wealth of knowledge for understanding the link-ages between reforms and growth in each country. In applying the framework, thechapters’ authors not only identified the local constraints that had preventedreforms from being implemented or from being effective, but also explained howthese constraints came to be.
Throughout their analyses, the authors deal with a number of fascinating andintriguing questions, such as the following: Why, in Brazil, despite great advancesin reducing inflation, improving the fiscal stance, and reducing the external debt,does macroeconomic stability remain one of the weakest foundations for growth?Why, in Peru, where the constitution gives considerable formal authority to Con-gress, do legislators very often choose not to legislate or even to deliberate on majorpolicy issues? How, in Costa Rica, did it come to pass that a road that everybodyagrees is needed, and that faces no financing constraints, still has not been built?The answers to these and many other questions contribute significantly to ourunderstanding of the dynamic of the reform process and the reasons for its suc-cesses and failures in each country.
Most important, each case study provides very specific policy recommenda-tions intended to answer the following question: how to proceed with a reformagenda conducive to sustainable growth? Each case study is thus truly unique. Thevariety of reforms that the authors have chosen to focus on, in the context of theframework, is as large as it is rich. The detailed recommendations that they pres-ent are equally rich and varied.
Thus, rather than summarizing the findings of each case study, which wouldfail to do justice to the authors’ efforts, the rest of this section discusses some ofthe key issues that the authors tackle when applying the analytical framework totheir countries. All of the studies base their analysis in the reform period thatstarted in Latin America in the early 1990s and that, at different paces and inten-sities, continues today.
Have Reforms Been Able to Strengthen the Growth Foundations?
With the analytical framework as their guide, each of the country studies dis-tinguishes between the foundations that reforms aimed to strengthen and thosethat were actually strengthened (or weakened). Of course, the policymakers in
introduction 23
11630-01_CH01_rev2.qxd 6/2/09 4:04 PM Page 23
charge of the design and implementation of reforms did not have in mind thefoundations-based framework utilized in this book, but it is not hard to identifyintentions and outcomes ex post.
All the country studies assessed that, albeit with different intensities, the reformprocess of the 1990s aimed at directly strengthening two of the growth founda-tions: macroeconomic stability and economic competition. This is not surprising,because these two foundations coincide with some of the central recommenda-tions of the Washington consensus, which most countries in the region embracedin the 1990s following either a period of deep crisis (Brazil, Mexico, and Peru) ora period of very slow growth (Colombia).43
Strengthening the broad sharing of the benefits from growth was also animportant policy objective in two countries in the sample, Colombia and Brazil,but for different reasons. In Colombia, efforts to contain the drug cartels and tofacilitate a peace agreement with the country’s guerilla movements led to the writ-ing of a new constitution in 1991. Under that constitution, expenditure on healthand education was significantly expanded, and the population was grantedincreased access to the judicial system and the political process. Thus, broadeningthe beneficiaries of the growth process was seen as a means of restoring peace inan unsettled domestic security situation. Brazil likewise enacted a new constitution,in 1988, but for the purpose of solidifying democracy and ending twenty years offiscal centralism. Under the new constitution a large number of public expenditureitems were created or expanded, to encourage a broader sharing of the benefits fromgrowth. Particularly important were the creation of an unemployment insurancesystem and the generation of income transfers through social assistance programs.44
Although a number of countries aimed at leveling the playing field for marketparticipants (the equality of opportunities foundation) through reforms that lib-eralized markets (trade and financial reforms, for example), improving propertyrights was not a direct policy objective. In some cases (the pension reforms inColombia and Peru, for example) reform did contribute to enhancing propertyrights ex post, but this was not a central objective.
Objectives and outcomes, however, differed significantly across countries. Insome cases the reforms indeed contributed to enhancing some of the growth foun-
24 liliana rojas-suarez
43. Costa Rica did not experience a crisis in the late 1980s or the 1990s. Having recovered fromthe 1982 debt crisis that plagued the entire region, the country saw a decent pace of growth in theearly 1990s, but with high inflation and a large public debt. Extensive government intervention in eco-nomic activity, including a state monopoly on banking, was perceived as generating important ineffi-ciencies that constrained the activities of the private sector, and therefore as an obstacle to growth.
44. In an effort to improve the sharing of growth benefits, in recent years an increasing numberof countries in the region have been implementing targeted antipoverty programs, such as conditionalcash transfers, which allow poor families to receive a certain amount of money under a “social con-tract,” in which the beneficiaries agree to send their children to school regularly or to bring them tohealth centers. Two well-known programs of this kind are the Oportunidades program in Mexicoand Bolsa Familia in Brazil.
11630-01_CH01_rev2.qxd 6/2/09 4:04 PM Page 24
dations; in others, however, attempts to enhance a foundation either missed thegoal or had the undesirable effect of weakening other foundations. A few exam-ples will illustrate these outcomes, focusing first on the positive ones.
Examples That Improved the Growth Foundations
All of the case studies identified foundations that were actually strengthenedfollowing reform. With the exception of the study on Mexico, all the studies alsoagreed that economic (but not necessarily political) competition had improved,albeit to different degrees in different countries. This success is largely attributedto important advances in trade and financial liberalization, as well as the establish-ment of adequate regulatory and supervisory authorities.45 In the case of Brazil, anumber of regulations limiting entry and competition, such as widespread pricecontrols, were eliminated, and a new competition law and revamped antitrustagencies were put in place. As the study of Costa Rica emphasizes, trade liberal-ization there has shifted the country’s comparative advantage from land to humancapital, so that there is now strong competition for human resources, to the ben-efit of workers. In some countries, such as Brazil, Colombia, and Peru, privatiza-tion involving the breakup of public monopolies was also assessed as contributingto improved competition. In contrast, certain privatizations, discussed below andin the chapters on Costa Rica and Mexico, were perceived more as a problem thanas a solution.
Most of the studies also agreed that the financial, trade, and regulatory reformshad contributed to leveling the playing field, thus improving the equal opportuni-ties foundation. The study of Costa Rica is vocal in underlining the positive effectsof trade openness and diversification on equalizing and improving opportunities.For example, underqualified workers—notably women in the textile sector—havefound employment in manufacturing, where before they had access only to lower-productivity jobs. Meanwhile professionals in some fields have been able to findprivate sector jobs where in the past only public sector jobs were available to them,and entrepreneurs have found external sources of finance willing to take risks thatthe local financial markets would not have taken. A number of other reforms werealso assessed as having effectively contributed to equalizing opportunities. Forexample, in Brazil, minimum age requirements and a new rule for calculatingbenefits (the fator previdenciário) made eligibility for pensions more similar forpoor and rich workers.
Although all the case studies pointed to improved macroeconomic indicators,one of the most interesting findings is that only the study on Peru strongly assertedthat the reform process has indeed strengthened the macroeconomic stability
introduction 25
45. In the Mexican case, it is recognized that the trade reform successfully contributed to eco-nomic competition. However, these gains are assessed as being largely offset by important deficien-cies in the privatization process.
11630-01_CH01_rev2.qxd 6/2/09 4:04 PM Page 25
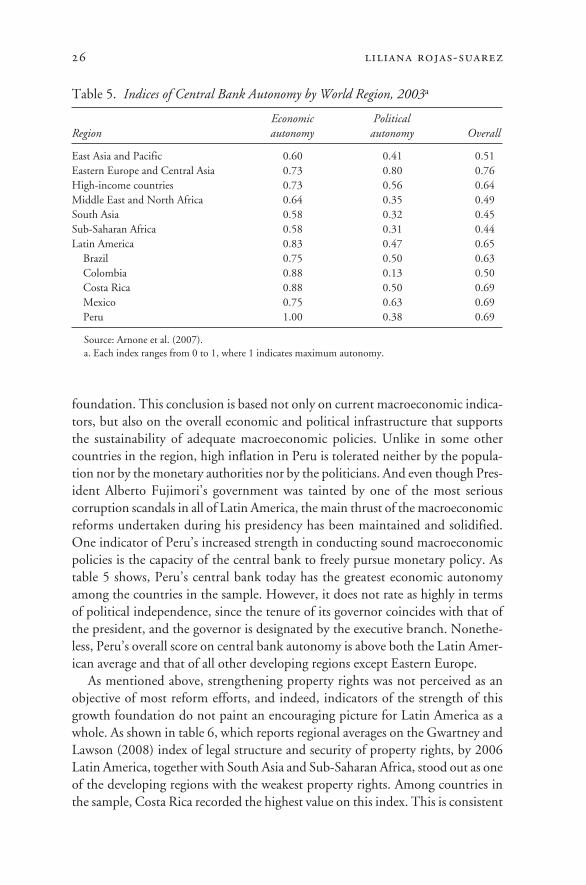
foundation. This conclusion is based not only on current macroeconomic indica-tors, but also on the overall economic and political infrastructure that supportsthe sustainability of adequate macroeconomic policies. Unlike in some othercountries in the region, high inflation in Peru is tolerated neither by the popula-tion nor by the monetary authorities nor by the politicians. And even though Pres-ident Alberto Fujimori’s government was tainted by one of the most seriouscorruption scandals in all of Latin America, the main thrust of the macroeconomicreforms undertaken during his presidency has been maintained and solidified.One indicator of Peru’s increased strength in conducting sound macroeconomicpolicies is the capacity of the central bank to freely pursue monetary policy. Astable 5 shows, Peru’s central bank today has the greatest economic autonomyamong the countries in the sample. However, it does not rate as highly in termsof political independence, since the tenure of its governor coincides with that ofthe president, and the governor is designated by the executive branch. Nonethe-less, Peru’s overall score on central bank autonomy is above both the Latin Amer-ican average and that of all other developing regions except Eastern Europe.
As mentioned above, strengthening property rights was not perceived as anobjective of most reform efforts, and indeed, indicators of the strength of thisgrowth foundation do not paint an encouraging picture for Latin America as awhole. As shown in table 6, which reports regional averages on the Gwartney andLawson (2008) index of legal structure and security of property rights, by 2006Latin America, together with South Asia and Sub-Saharan Africa, stood out as oneof the developing regions with the weakest property rights. Among countries inthe sample, Costa Rica recorded the highest value on this index. This is consistent
26 liliana rojas-suarez
Table 5. Indices of Central Bank Autonomy by World Region, 2003a
Economic PoliticalRegion autonomy autonomy Overall
East Asia and Pacific 0.60 0.41 0.51Eastern Europe and Central Asia 0.73 0.80 0.76High-income countries 0.73 0.56 0.64Middle East and North Africa 0.64 0.35 0.49South Asia 0.58 0.32 0.45Sub-Saharan Africa 0.58 0.31 0.44Latin America 0.83 0.47 0.65
Brazil 0.75 0.50 0.63Colombia 0.88 0.13 0.50Costa Rica 0.88 0.50 0.69Mexico 0.75 0.63 0.69Peru 1.00 0.38 0.69
Source: Arnone et al. (2007).a. Each index ranges from 0 to 1, where 1 indicates maximum autonomy.
11630-01_CH01_rev2.qxd 6/2/09 4:04 PM Page 26
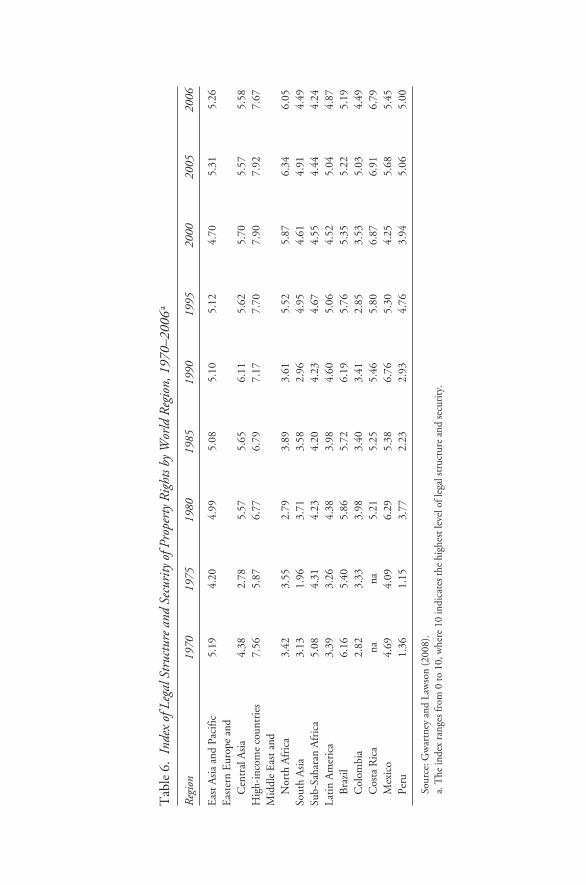
Tab
le 6
.In
dex
of L
egal
Str
uctu
re a
nd S
ecur
ity o
f Pro
pert
y R
ight
s by
Wor
ld R
egio
n, 1
970–
2006
a
Reg
ion
1970
1975
1980
1985
1990
1995
2000
2005
2006
Eas
t Asi
a an
d Pa
cific
5.19
4.20
4.99
5.08
5.10
5.12
4.70
5.31
5.26
Eas
tern
Eur
ope
and
Cen
tral
Asi
a4.
382.
785.
575.
656.
115.
625.
705.
575.
58H
igh-
inco
me
coun
trie
s7.
565.
876.
776.
797.
177.
707.
907.
927.
67M
iddl
e E
ast a
nd
Nor
th A
fric
a3.
423.
552.
793.
893.
615.
525.
876.
346.
05So
uth
Asi
a3.
131.
963.
713.
582.
964.
954.
614.
914.
49Su
b-Sa
hara
n A
fric
a5.
084.
314.
234.
204.
234.
674.
554.
444.
24La
tin
Am
eric
a3.
393.
264.
383.
984.
605.
064.
525.
044.
87B
razi
l6.
165.
405.
865.
726.
195.
765.
355.
225.
19C
olom
bia
2.82
3.33
3.98
3.40
3.41
2.85
3.53
5.03
4.49
Cos
ta R
ica
nana
5.21
5.25
5.46
5.80
6.87
6.91
6.79
Mex
ico
4.69
4.09
6.29
5.38
6.76
5.30
4.25
5.68
5.45
Peru
1.36
1.15
3.77
2.23
2.93
4.76
3.94
5.06
5.00
Sour
ce: G
war
tney
and
Law
son
(200
8).
a. T
he in
dex
rang
es fr
om 0
to 1
0, w
here
10
indi
cate
s th
e hi
ghes
t lev
el o
f leg
al s
truc
ture
and
sec
urit
y.
11630-01_CH01_rev2.qxd 6/2/09 4:04 PM Page 27
28 liliana rojas-suarez
with the assessment by the authors of the country study that Costa Rica’s institu-tional framework is strong and has actually been getting stronger since the begin-ning of the reform efforts of the 1990s. Especially strong are those institutions,related to the country’s trade agreements, that helped to consolidate the guaran-tees against undue uncompensated expropriation that the constitution grants toboth local firms and foreigners. In Peru, despite some important setbacks associ-ated with both corruption and inefficiency of the legal and judicial systems, thebroad indicator of security of property rights has improved over time; however, itremains quite low. Mexico and Brazil are cases of particular concern; by 2006 theproperty rights indicator in both countries was well below its level of 1990.Colombia’s deficiencies in this area are also apparent: that country reports the low-est value on this indicator among the countries in the sample. As will be discussedbelow, weaknesses in this foundation are an important reason why the authors ofmost of the case studies include proposals to reform the judiciary system amongtheir recommendations.
When Unintended or Undesirable Results Happen: Examples of Weakened Foundations
Together the analyses in the case studies provide a comprehensive explanationof why some foundations for growth were weakened rather than strengthened dur-ing the reform process. There are several possible reasons for this outcome. First,a given foundation may simply have been disregarded during the reform process,despite factors signaling its deterioration over time; these can be described as“missing foundations.” Second, a reform attempting to strengthen a foundationmay have failed to deliver and instead weakened the foundation. Third, reformsaimed at strengthening one foundation may have had the unintended consequenceof weakening other foundations. Each of the case studies presents vivid discus-sions of all three plausible explanations. This subsection briefly describes someexamples:
• In Peru, the broad sharing of the benefits from growth was the missingfoundation during the reform process of the 1990s and early 2000s. At thenational level, poverty rates have started to decrease significantly only since2004, but to a large extent this success can be attributed to the economic boombrought on by high commodity prices. Moreover, the recent reduction inpoverty rates has not been sufficiently inclusive. As the authors of the Peruchapter—Eduardo Morón, Juan Francisco Castro, and Cynthia Sanborn—show, although economic growth has reduced income inequality on a nationalbasis, urban-rural disparities are widening: the incidence of poverty in Peru’surban areas declined from 37 percent in 2004 to 26 percent in 2007, but thatin rural areas declined only from 70 percent to 65 percent in the same period.More worrisome is the authors’ view that the reduction in poverty cannot beattributed to particular past reform efforts; this leaves poverty and inequality
11630-01_CH01_rev2.qxd 6/2/09 4:04 PM Page 28
highly vulnerable to future developments in the economic cycle. Especially inthe context of the current global crisis, Peru’s gains in poverty reduction runthe risk of being reversed. Not surprisingly, the authors focus their recommen-dations on reforms that aim directly at broadening the benefits from growthon a permanent basis.
• Improving the efficiency and allocation of resources, thereby strengtheningthe foundation for economic competition, was an explicit aim of Mexico’s extensiveprivatization program of the 1980s and 1990s. Although some analysts havepraised the program’s overall benefits (see Chong and López-de-Silanes, 2005),major problems were associated with certain key privatizations. As GerardoEsquivel and Fausto Hernández-Trillo discuss in their chapter, the privatiza-tion of the public telephone company Telmex (Teléfonos Mexicanos) was imple-mented without an appropriate institutional framework and resulted in predatorybehavior and the use of monopoly power. The National Highways ConcessionProgram of the 1990s also failed to meet expectations, and the Mexican govern-ment had to embark on an extremely costly road recovery program. Since the largelosses associated with the highway bailouts were socialized, this reform also had anegative impact on the broad sharing of the benefits of growth foundation. Boththese cases provide clear examples of reforms that aimed at but failed to strengthengrowth foundations.
• The study of the Brazilian experience by Armando Castelar Pinheiro, RegisBonelli, and Samuel de Abreu Pessôa reveals a number of reforms that actuallyweakened the macroeconomic stability foundation in that country. The interplaybetween democratization and Brazil’s highly unequal income distribution resultedin increased demand by large segments of the population for policies and reformsto redirect government expenditures toward the poor. However, the ability ofcurrent beneficiaries to veto cuts in existing expenditures, in the context of a frag-mented party system, resulted in an overall increase in current government expen-diture and transfers, rather than a redistribution of a constant level of expenditure.A major challenge for policymakers ever since Brazil’s democratization has beenhow to finance increased government expenditure. At first, inflation providedthe financing source. When the eruption of hyperinflation—and the subsequentpolicies to correct the problem—in the late 1980s made apparent the unsustain-ability of this strategy, the government instead relied on expanding the net publicdebt. When the Russian crisis of the late 1990s spread to other emerging markets,including Brazil, exposing the extreme economic fragilities associated with highexternal debt ratios, the Brazilian government turned to raising existing taxes andcreating new ones; many of these were quite distortionary, especially for financialintermediation. By 2007 the total tax burden had reached 37 percent of GDP,12 percentage points higher than the average during 1968–86. However, theincrease in public consumption was so large that even higher taxes were not enough,and public investment, particularly in infrastructure, was severely curtailed.
introduction 29
11630-01_CH01_rev2.qxd 6/2/09 4:04 PM Page 29
Overall public investment declined from an average of 8 percent of GDP in1968–78 to a meager 2.7 percent by 2003–05. A growth decomposition exerciseincluded in the Brazil chapter reveals, not surprisingly, that physical capital accu-mulation has been negative over the last decade.46 Thus, since the early 1990s,even as Brazil has implemented policies and reforms, such as price stability andflexible exchange rates, designed to strengthen the macroeconomic stability foun-dation, electoral incentives have led politicians to implement a poorly conceivedstructure of public spending, greatly skewed toward current expenditures at theexpense of public investment. This type of expenditure policy, combined with anextremely high tax burden on investment and financial intermediation and a largepublic debt (both for the purpose of financing public consumption), has keptBrazil’s macroeconomic stability foundation quite fragile.
• Another example of a weakened foundation in Brazil is the lack of protec-tion of property rights in spite of reforms of the judiciary and the legal system. Onceagain, in the context of a highly unequal income distribution in a society wheredemocratization has given greater voice to the disenfranchised, there are strongpolitical incentives to overlook the law as a way to attenuate income disparities.For example, it has become accepted practice for supposedly landless peasants totrespass on rural land, and for supposedly homeless families to trespass on urbanland. The desire to reduce the country’s stark income inequality also motivatesjudges to bias their contract enforcement decisions to favor the poorer party. Thisweakened enforcement of the law is a serious constraint on the property rightsfoundation (as reflected in the low value of the index in table 6) and a severe obsta-cle to productive private investment.
• The case of Colombia presents some clear examples of reforms that strength-ened some growth foundations while weakening others. Policies and reformsaimed at broadening the beneficiaries of growth through fiscal decentralization,the enhancement of social expenditures, and improved access to the judicial sys-tem resulted in deep-rooted fiscal costs that have at least partly offset the benefitsof other policies aimed at strengthening macroeconomic stability. As RobertoSteiner, Irene Clavijo, and Natalia Salazar observe in their chapter on Colombia,a key part of the problem is that the 1990 constitution commits the nation tobuilding a welfare state, a provision somewhat at odds with the market-orientedreforms being introduced at the same time. The constitution also granted theConstitutional Court very broad powers, and the result has been a very activist
30 liliana rojas-suarez
46. Growth decomposition exercises were conducted for all case studies, and the results are shownin the individual chapters. A particular characteristic of Brazil is that economic growth in the lastdecade can be mostly explained by a recovery of total factor productivity from the sharp decline dur-ing the “lost decade” that followed the debt crisis of 1982. Accumulation of human capital deceler-ated in the most recent decade while physical capital actually contracted.
11630-01_CH01_rev2.qxd 6/2/09 4:04 PM Page 30
judicial system. For example, the court has intervened in the determination ofpublic sector wages, has allowed citizens to claim health benefits far beyond thoseprovided for under the health care law, and has extended to all pensioners bene-fits that were supposed to compensate only some retirees whose pensions had notbeen fully adjusted for inflation. All these interventions have imposed large fiscalcosts on the government—the cost of the pension decision alone has been esti-mated at 12.5 percent of GDP. Clearly, the court has taken the notion of equal-ity too far, and its decisions have severely affected the government’s ability toundertake prudent fiscal management and have even compromised financial sec-tor stability. Another, truly frightening example involves the 1998 crisis affectingthe country’s mortgage banks. To provide support to low-income borrowers, thegovernment forced banks to temporarily accept properties returned by debtors inexchange for the complete write-off of their mortgage. Basing its decision on anoverly broad concept of equality, the Constitutional Court extended this benefitto all debtors.
• In some ways the case of Costa Rica contrasts with that of Colombia. Thereform of the Costa Rican public sector sought to reduce the role of the state-centered system in order to improve macroeconomic stability and enhance economic competition through increased private sector involvement. But theimplementation of this reform actually weakened political competition and thebroad sharing of the benefits of growth. How did this happen? As Jorge Cornickand Alberto Trejos explain in their chapter on Costa Rica, the public sector wasdownsized without any clear definition of priorities among different governmententities and programs; instead, budgetary restrictions were imposed across thewhole of the public sector, and public servants were encouraged to leave. Thebest, the youngest, and the brightest did just that. For those who stayed, the prideof working as a public servant was dramatically curtailed as they were hit by atriple whammy: first, the perception became widespread that they were the “low-quality” workers in the economy; second, budget allocations for many projectswere sharply reduced; and third, a complicated system of checks and balancesintended to control corruption instead tended to criminalize even honest mis-takes, complicating interactions between the private sector and the government.Checks and balances are certainly essential to the appropriate functioning of anygovernment, but the systems put in place in Costa Rica were poorly designed,generating serious obstacles to the execution of projects. Unfortunately, thegovernment branches most affected were those most important to the broadersharing of the benefits of growth: education, public infrastructure, and socialassistance. The weakening of this key growth foundation contributed to thesolidification of an antireform political party. In the context of a legislative sys-tem where any congressman can delay, and ultimately stop, the approval of a billby recourse to the Supreme Court, the antireform party, although small, has beenable to block the passage of needed reforms. Legislative paralysis thus goes hand
introduction 31
11630-01_CH01_rev2.qxd 6/2/09 4:04 PM Page 31
in hand with ineffective political competition—a negative outcome for an impor-tant growth foundation.
The Proposals
The examples presented above provide just a flavor of the issues and problemsdiscussed in the country chapters in this book. As the reader can easily infer, thediscussions in all the chapters provide fertile ground for advancing policy recom-mendations, and the authors took this task to heart. Keeping within the parame-ters of the book’s analytical framework, all the recommendations aim at enhancingthe identified growth foundations. Once again, to avoid repetition, the rest of thissection briefly summarizes some of the most important proposals. Also, given thevariety of areas tackled in the proposals, the focus here is on a common theme inall chapters: the area of institutional strengthening. Another common theme is therecognition that the implementation of recommendations requires delicate polit-ical economy balancing acts.
• How to better share the benefits from growth in Peru? In addition to propos-als to reform the education system (what the authors identify as a missing reform),Morón and his coauthors suggest that deep reforms of the state and the politicalsystem are essential so that legislation can be passed, and policies executed, thatwill reach the poor, especially in the country’s rural areas. An important compo-nent of the diagnosis with respect to reform of the state is that lack of implemen-tation capacity—reflected in a shortage of professional civil servants—constrainsthe process of fiscal and political decentralization, which in turn delays and evenprevents the execution of much-needed projects, especially in infrastructure andthe delivery of social services. Recommendations include introducing a merit-based career path for new public servants; programming budgetary expansions ina results-based format; and consolidating small geographic units into fewer, largerones. As the authors emphasize, in the face of managerial constraints it would beeasier to distribute public resources and monitor their utilization if the focus wereon seven to ten macroregional governments rather than on the twenty-five exist-ing regions. For this purpose, the authors encourage the creation of a pilot macro-region as a way of demonstrating the potential benefits of consolidation.
• Although Peru’s existing political parties are weak and fragmented, reformof the political system is more easily said than done, because politicians face fewincentives to modify the existing structure once elected. Contributing to the prob-lem is the fact that parties revolve around personalities rather than programs orideology and have few roots in society. Party weakness, in turn, translates intomembers of Congress lacking technical capacities or political incentives to holdgovernment accountable and to appropriately represent their constituencies.Morón and his coauthors offer several recommendations to strengthen the partysystem, from enhancing the electoral authority, to strengthening the monitoringof compliance with the existing party law, to building a well-endowed congres-
32 liliana rojas-suarez
11630-01_CH01_rev2.qxd 6/2/09 4:04 PM Page 32
sional research service available to all members. But because the Congress lacksincentives for internal discipline, external vigilance of its activities is the indispen-sable force for change. In this regard a central recommendation is to enhance thecapacity of nongovernmental research and advocacy organizations of different ori-entations, and of the independent media, to monitor public agencies, try to holdpoliticians accountable, and educate the general public so as to improve the qual-ity of citizen demands.
• Reforming competition policy is one of the central recommendations in thechapter on Mexico. Although a law was passed in 2006 enhancing the powers ofthe Federal Competition Commission (FCC), the judicial and legal systems con-tinue to be major obstacles. Through a number of judicial protection mechanisms(called amparos), decisions by the FCC can be delayed for prolonged periods.Moreover, legal deficiencies have limited the collection of fines in cases wheremonopoly practices have been detected. Thus, among their specific recommen-dations, Esquivel and Hernández-Trillo call for full autonomy (including finan-cial autonomy) for the FCC, to allow it to avoid capture by other governmentagencies, and for the creation of specialized courts in competition and regulatorycases (similar to Chile’s Tribunal for the Defense of Free Competition). Thesemeasures aim at improving transparency and accountability on the part of thosein charge of implementing the antimonopoly laws, thereby generating incentivesto avoid unnecessary delays in executing the law.
• Reforms of the judicial system are also proposed in the Brazil case study, inthis case to secure property rights, which the authors assess as extremely weak, withcontracts constantly breached and rulings delayed by politically motivated judges.Among the authors’ specific proposals are the following: adopt performance indi-cators as a criterion for promoting judges, replacing the current practice of pro-motion by seniority (one proposed indicator is the percentage of a judge’sdecisions that are confirmed on appeal); impose discipline on the executive (by farthe leading litigator in judicial proceedings in Brazil) in its use of appeals for thepurpose of delaying expenditure; index judicially imposed obligations and debt tothe SELIC (the policy-determined interest rate) so as to reduce financial incen-tives to delay final court rulings; and raise public awareness of the consequencesof poor judicial performance for economic development and social equity.
• A key recommendation of Steiner and his coauthors is to curtail the abilityof Colombia’s Constitutional Court to tamper with economic matters in generaland with macroeconomic stability in particular. As mentioned above, an extremeinterpretation of the concept of “fairness” has resulted in excessive judicial activism,to the detriment of macroeconomic stability. Recognizing that the court is atremendously popular institution, and one that contributes to social cohesion, theColombian team advances three recommendations aimed at providing incentivesfor the court to encourage the strengthening of all of the growth foundations. Thefirst is to reduce the politicization of court magistrates by allowing them to run
introduction 33
11630-01_CH01_rev2.qxd 6/2/09 4:04 PM Page 33
for a second term, after a cool-off period of perhaps five years has elapsed; thiswould replace the current system under which magistrates may not be reelectedbut face practically no restrictions on their involvement elsewhere in politics aftercompletion of their tenure. The second recommendation is to seek a consensualdefinition by all powers of what constitutes an adequate health care plan and othersocial services, so that judges cannot decree the provision of services beyond whatis in the agreed plans. To make this consensual agreement sustainable, the defini-tions in the plans should be enhanced as the country achieves higher levels ofdevelopment (which would also need to be defined). The third recommendationwould implement a process by which the Constitutional Court reviews laws assoon as they are approved. If a law were then overturned on procedural grounds,this would happen before it becomes operational.
• Finally, the authors of the Costa Rica chapter view as central a reform of thatcountry’s legislative system that would enhance all of the growth foundations, butparticularly the broad sharing of the benefits of growth. Congressional rules that usedto work adequately in a two-party system have proved ineffective, leading toreform paralysis in the current context where a minority antireform party formspart of the political landscape. Some of the legislative reforms the authors proposeto deal with these obstacles include the following: setting a deadline by which theCongress must vote on proposed laws; granting the executive limited power todeclare certain bills urgent, to shorten the decision time (a practice followed inChile); creating alternative ways for representatives to put forward their positions,place them on the record, and propose amendments, without causing the longdelays to which the current procedures are subject; and requiring a quorum onlyfor votes and not for debate. Citing the success of the CAFTA referendum in late2007, Cornick and Trejos stress the advantages of such referenda: a vote happenson a fixed date without the possibility of filibustering, and the results are bindingand widely viewed as legitimate. Recognizing the high costs of this second-best(or third-best?) alternative for passing growth-enhancing reforms, the authorspropose that consideration of this mechanism take place at the same time thatnational elections occur.
Some Concluding Remarks
It is hoped that this introductory chapter has increased readers’ appetite to getimmersed in the complex, sometimes intriguing, sometimes disturbing, butalways fascinating interactive process of reform and growth that started in LatinAmerica in the late 1980s and early 1990s and continues to evolve today. Inthe chapters that follow, the reader will find well-thought-out—and thought-provoking—answers to a number of important questions: Why did two similarreforms generate very different outcomes in different countries? How did polit-ical interests interact with the technical design of reforms in individual coun-
34 liliana rojas-suarez
11630-01_CH01_rev2.qxd 6/2/09 4:04 PM Page 34
tries? Why, given the current state of development of Latin American countries,is it neither useful nor practical to advance recommendations at a very generallevel? Most important, what should be done to enhance the foundations for sus-tained growth? Although the detailed and specific reform agendas proposed inthe individual case studies can at times be daunting, the reader will be left witha feeling of optimism, as the solutions proposed are not only well conceived butdoable. Indeed, in keeping with the analytical framework that has guided thisbook, the recommendations focus on finding solutions to deal with existingobstacles—directly when possible, and with second-best policies and incentiveswhen necessary.
Although the specific recommendations for reforms and policies differ substan-tially from country to country, two commonalities in the process of implementingreforms emerge from all the country studies. The first is an emphasis on incremen-tal reform. Even in those cases where a major revamping is recommended (forexample, in competition policy in Mexico, or the reform of the state in Peru), theproposals are not for “big bang” reforms. Instead the authors call for “pilot proj-ects,” designed to build constituencies that will support and endorse furtherchange and reform, and to enhance the ability of the media and nongovernmen-tal organizations to educate public opinion and monitor the government’s andpoliticians’ actions. The second commonality, related to the first, is the need forenhanced communication between governments and civil societies, focusing onpersuasion and collaboration rather than the top-down imposition of policies andreforms. To return to where this introduction started, the emphasis on reformthrough agreement and negotiation rather than by decree is fully consistent withthe reality of Latin America today as the most financially open, most demo-cratic, but also most unequal region in the developing world. Under these con-ditions, the way to move forward with reform, while at the same timepreventing (and in some cases containing) a backlash against market-orientedreforms and possible civil unrest, is to encourage much greater collaborationbetween governments and civil societies than was perceived as necessary in theearly days of reform.
References
Acemoglu, Daron, Simon Johnson, and James A. Robinson. 2005. “Institutions as a Funda-mental Cause of Long-Run Growth.” In Philippe Aghion and Steven N. Durlauf, eds.,Handbook of Economic Growth, Vol. 1A. Amsterdam: Elsevier.
Alesina, Alberto, Arnaud Devleeschauwer, William Easterly, Sergio Kurlat, and RomainWacziarg. 2003. “Fractionalization.” Journal of Economic Growth 8, no. 2 (June): 155–94.
Arnone, Marco, Bernard J. Laurens, Jean-François Segalotto, and Martin Sommer. 2007.“Central Bank Autonomy: Lessons from Global Trends.” IMF Working Paper WP/07/88.Washington: International Monetary Fund (July)
Barro, Robert. 1991. “Economic Growth in a Cross Section of Countries.” Quarterly Journalof Economics 106, no. 2. (May): 407–43
introduction 35
11630-01_CH01_rev2.qxd 6/2/09 4:04 PM Page 35
Birdsall, Nancy. 2007. “Income Distribution: Effects on Growth and Development.” Work-ing Paper 118. Washington: Center for Global Development (April).
Birdsall, Nancy, and Liliana Rojas-Suarez. 2004. “Regionalism for Financing Development:The Unexploited Potential.” In Nancy Birdsall and Liliana Rojas-Suarez, eds., FinancingDevelopment: The Power of Regionalism. Washington: Center for Global Development(September).
Birdsall, Nancy, Augusto de la Torre, and Rachel Menezes. 2008. Fair Growth: Economic Poli-cies for Latin America’s Poor and Middle-Income Majority. Washington: Center for GlobalDevelopment and Inter-American Dialogue.
Blyde, Juan S., and Eduardo Fernandez-Arias. 2004. “Why Does Latin America Grow MoreSlowly?” Economic and Social Studies Series RE1-04-016. Washington: Inter-AmericanDevelopment Bank.
Caballero, Ricardo. 2001. “Macroeconomic Volatility in Reformed Latin America.” Inter-American Development Bank, Washington (January).
Chinn, Menzie D., and Hiro Ito. 2007. “A New Measure of Financial Openness.” Universityof Wisconsin (May)
Chong, Alberto, and Florencio López-de-Silanes, 2005. “Privatization in Mexico.” In Privati-zation in Latin America: Myths and Reality. Stanford University Press and Inter-AmericanDevelopment Bank.
Commission on Growth and Development. 2008. The Growth Report: Strategies for SustainedGrowth and Inclusive Development. Washington: World Bank.
Cornia, Giovanni Andrea, Tony Addison, and Sampsa Kiiski. 2004. “Income DistributionChanges and Their Impact in the Post-Second World War Period.” In Giovanni AndreaCornia, ed., Inequality, Growth and Poverty in an Era of Liberalization and Globalization.Oxford University Press.
Corporación Latinobarómetro. 2007. Informe Latinobarómetro 2007 (November). www.latinobarometro.org.
De Gregorio, José. 2005. “Sustained Growth in Latin America.” Economic Policy Papers 13.Santiago: Central Bank of Chile (May).
De Gregorio, José, and Jong-Wha Lee. 2003. “Growth and Adjustment in East Asia and LatinAmerica.” Working Paper 245. Santiago: Central Bank of Chile.
Easterly, William, and Ross Levine. 2003. “Tropics, Germs and Crops: The Role of Endow-ments in Economic Development.” Journal of Monetary Economics 50, no. 1: 3–39.
Edwards, Sebastian. 2007. “Crises and Growth: A Latin American Perspective.” Working Paper13019. Cambridge, Mass.: National Bureau of Economic Research (April).
Edwards, Sebastian, Gerardo Esquivel, and Graciela Marquez, eds. 2007. The Decline of LatinAmerican Economies: Growth, Institutions and Crises. University of Chicago Press.
Fajnzylber, Pablo, Daniel Lederman, and Norman Loayza. 2002. “Inequality and ViolentCrime.” Journal of Law and Economics 45, no. 1 (April): 1–40.
Fearon, James D. 2003. “Ethnic Structure and Cultural Diversity by Country.” Journal ofEconomic Growth 8, no. 2 (June): 195–222.
Guidotti, Pablo, Liliana Rojas-Suarez, and Roberto Zahler. 2004. “Designing Financial Regu-latory Policies that Work for Latin America: The Role of Markets and Institutions: Viewsfrom the Latin American Shadow Financial Regulatory Committee.” Journal of FinancialStability 1, no. 2 (December): 199–228.
Gutierrez, Mario. 2007. “Savings in Latin America after the Mid 1990s: Determinants, Constraintsand Policies.” Serie Macroeconomía del Desarrollo 57. Santiago, Chile: CEPAL (January)
Gwartney, James, and Robert Lawson. 2008. Economic Freedom of the World: 2008 AnnualReport. www.freetheworld.org.
36 liliana rojas-suarez
11630-01_CH01_rev2.qxd 6/2/09 4:04 PM Page 36
Hausmann, Ricardo, and Michael Gavin. 1996. “Securing Stability and Growth in a Shock-Prone Region: The Policy Challenge for Latin America.” Working Paper 315. Washington:Inter-American Development Bank (January).
Hausmann, Ricardo, Dani Rodrik, and Andrés Velasco. 2005. “Growth Diagnostics.” HarvardUniversity.
Izquierdo, A., P. Ottonello, and E. Talvi. 2008. “If Latin America Were Chile: A Comment onStructural Fiscal Balances and Public Debt.” Inter-American Development Bank, Washington.
Kaufmann, Daniel, Aart Kray, and Massimo Mastruzzi. 2008. “World Wide GovernanceIndicators.” World Bank, Washington (June).
Kekic, Laza. 2007. “The Economist Intelligence Unit’s Index of Democracy.” In The World in2007. London: The Economist.
Leipziger, Danny, and Roberto Zagha. 2006. “Getting out of the Rut: Applying Growth Diag-nostics at the World Bank.” Finance and Development 43, no. 1 (March): 16–17.
Marshall, Monty, and Keith Jaggers. 2007. “Polity IV Data Set” (www.systemicpeace.org/polity/polity4.htm).
North, Douglas. 1991. “Institutions.” Journal of Economic Perspectives 5, no. 1: 97–112.Pritchett, Lant. 1997. “Divergence, Big Time.” Journal of Economic Perspectives 11, no. 3: 3–17.Przeworski, Adam, Michael E. Alvarez, and Jose Antonio Cheibub. 2000. Democracy and
Development: Political Institutions and Well-Being in the World, 1950–1990. Cambridge Uni-versity Press.
Putterman, Louis, and David N. Weil. 2008. “Post-1500 Population Flows and the Long RunDeterminants of Economic Growth and Inequality.” Working Paper 14448. Cambridge,Mass.: National Bureau of Economic Research.
Rojas-Suarez, Liliana. 2003. “Monetary Policy and Exchange Rates: Guiding Principles for aSustainable Regime.” In Pedro-Pablo Kuczynski and John Williamson, eds., After the Wash-ington Consensus: Restarting Growth and Reforms in Latin America. Washington: Institute forInternational Economics (March).
Rojas-Suarez, Liliana, and Sebastian Sotelo. 2007. “The Burden of Debt: An Exploration ofInterest Rate Behavior in Latin America.” Contemporary Economic Policy 25, no. 3 (July):387–414.
Sachs, Jeffrey, and Andrew Warner. 1995. “Economic Reform and the Process of Global Inte-gration.” Brookings Papers on Economic Activity, no. 1: 1–118.
Wacziarg, Romain, and Karen Horn Welch. 2003. “Trade Liberalization and Growth: NewEvidence.” Working Paper 10152. Cambridge, Mass.: National Bureau of EconomicResearch (November).
Williamson, John. 1990. “What Washington Means by Policy Reform.” Chapter 2 in JohnWilliamson, ed., Latin American Adjustment: How Much Has Happened? Washington: Insti-tute for International Economics.
World Bank. 2006. World Development Report 2006: Equity and Development. Washington.Zettelmeyer, Jeromin. 2006. “Growth and Reforms in Latin America: A Survey of Facts and
Arguments.” IMF Working Paper WP/06/210. Washington: International Monetary Fund(September).
introduction 37
11630-01_CH01_rev2.qxd 6/2/09 4:04 PM Page 37
38
Growth in Latin America: The Facts
From at least the early 1950s through the 1970s, much of Latin America experi-enced a remarkable stretch of relatively rapid economic growth.1 This growth wasimpressive but ultimately proved unsustainable. Under the weight of governmentdebt and associated problems, and in the face of a significant adverse global shock,growth declined sharply throughout Latin America in the 1980s. The early 1990sbrought recovery, but this was quickly interrupted by the economic and financialcrises that plagued the region during the second half of that decade and the early2000s. From 2004 to 2007, growth rates increased significantly. However, as dis-cussed in chapter 1, in the context of the global financial crisis that started in 2008,many Latin American countries are once again experiencing a serious economicslowdown.
Income per capita is the standard measure of how overall economic perform-ance affects people. Figure 1, taken from Zettelmeyer (2006), traces the logarithmof income per capita in a number of Latin American countries from 1960 to 2005.
Helping Reforms Deliver Growth in LatinAmerica: A Framework for Analysiscgd task force
2
The CGD Task Force was chaired by Simon Johnson and Liliana Rojas-Suárez. The Task Forcemembers were Mauricio Cárdenas, Javier Corrales, José De Gregorio, Augusto de la Torre, EduardoLora, Carmen Pages, Ernesto Stein, Kurt Weyland, and Jeromin Zettelmeyer.
1. The data are less reliable before the 1950s, making it impossible to say exactly when this growthphase began. The 1930s were a period of global depression, which encompassed most of Latin Amer-ica also. The long growth period likely started sometime in the 1940s.
11630-02_CH02_rev2.qxd 6/2/09 4:36 PM Page 38
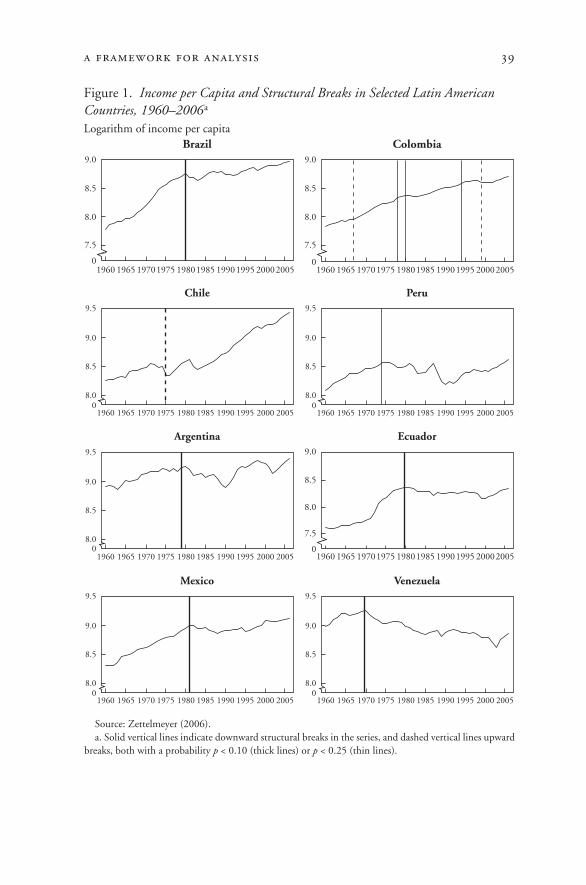
a framework for analysis 39
Figure 1. Income per Capita and Structural Breaks in Selected Latin AmericanCountries, 1960–2006a
Source: Zettelmeyer (2006). a. Solid vertical lines indicate downward structural breaks in the series, and dashed vertical lines upward
breaks, both with a probability p < 0.10 (thick lines) or p < 0.25 (thin lines).
Logarithm of income per capitaBrazil
1960
7.5
0
8.0
8.5
9.0
1965 19701975 19801985 19901995 20002005
Chile
1960
8.00
8.5
9.0
9.5
1965 1970 1975 1980 1985 1990 1995 2000 2005
Argentina
1960
8.00
8.5
9.0
9.5
1965 1970 1975 1980 1985 1990 1995 2000 2005
Mexico
1960
8.00
8.5
9.0
9.5
1965 1970 1975 1980 1985 1990 1995 2000 2005
Colombia
1960
7.5
0
8.0
8.5
9.0
1965 19701975 19801985 19901995 20002005
Peru
1960
8.00
8.5
9.0
9.5
1965 1970 1975 1980 1985 1990 1995 2000 2005
Ecuador
1960
7.5
0
8.0
8.5
9.0
1965 19701975 19801985 19901995 20002005
Venezuela
1960
8.00
8.5
9.0
9.5
1965 1970 1975 1980 1985 1990 1995 2000 2005
11630-02_CH02_rev2.qxd 6/2/09 4:36 PM Page 39
Dashed vertical lines indicate the beginnings of growth accelerations—periodswhen growth rates were significantly higher than in the previous period—and solidlines, periods of deceleration.2 These graphs present a vivid picture, which statisti-cal analysis confirms: although the details vary from country to country, incomegrowth per capita in Latin America clearly accelerated in the 1960s and 1970s andthen decelerated in the 1980s and 1990s.3 It remains to be seen whether a new andstatistically significant period of growth acceleration can be identified in somecountries in at least some part of the 2000s. As the discussion in chapter 1 indi-cates, with the exception of Chile (and a slight improvement in the DominicanRepublic), the last three decades have seen the gap in income per capita widen inall Latin American countries relative to the most advanced economies.
Of course, decelerations of growth and even outright economic crises are farfrom uncommon around the world (see Berg et al., 2006, and Jones and Olken,2005). Recent decades have seen sharp slowdowns of various kinds in places asdisparate as the former Soviet bloc and East Asia. In most of these cases oneobserves, first, a period of confusion and disorganization, often followed by theadoption of reforms that seek to address what are perceived to be the underlyingproblems—excessive state control of the economy or weak corporate governance,for example. The details of the reform packages vary, of course, according to whatis politically feasible or regarded as a priority, but the desire to reform is a nearlyuniversal feature.
Latin America is no exception to this pattern, and the lags observed in theregion between the crises of the early 1980s and the attempted reforms of the late1980s and 1990s were completely within the range of experience elsewhere. Buttwo other characteristics typify most of the reform initiatives in Latin America:economic growth remained volatile after the reforms were implemented, and anygains from growth were not shared by large segments of the population. Thesecontinuing problems spurred calls in a number of countries, not for more reform,but rather for the undoing of some of the reforms that had been achieved.4
Reform remains controversial in Eastern Europe and East Asia, but in bothregions, most countries have found their way onto strong growth paths in the pastdecade. In contrast, Latin America has seen lower average growth rates and highervolatility of growth than any developing region except Sub-Saharan Africa. It isimportant not to exaggerate the differences between Latin America and the moresuccessful developing regions, but a gap does appear to be opening up between
40 cgd task force
2. The solid and dashed lines represent structural breaks in the time series. The procedure usedto identify such breaks is performed in stages, one break at a time, and is based on the work of Baiand Perron (1998, 2003); the specifics of the procedure can be found in Berg et al. (2006).
3. However, as Berg et al. (2006) note, the high volatility of output in the region makes it diffi-cult in some countries to identify the decelerations in the 1980s and the accelerations in the 1990s.
4. The important exception is Chile, which launched its reforms even before the regionwide cri-sis of the 1980s but intensified its efforts soon after.
11630-02_CH02_rev2.qxd 6/2/09 4:36 PM Page 40
a framework for analysis 41
these regions of similar income per capita and comparable economic potential (seechapter 1).
With so many Latin Americans experiencing such a meager payoff from reform,patience with reform is wearing thin among important social groups. And if reformshould falter, the risk is real that Latin America will fall further behind. How-ever, reports of a generalized political backlash against the market economy and market-oriented reform should be taken with caution. As box 1 shows, one of theimportant differences among countries in Latin America is in the composition ofthe main political actors. Although a turn toward the left has been seen in somecountries, there are nevertheless important differences in ideology and governancebetween, for example, the current government of Venezuela and that of Uruguay.Meanwhile Chile’s government coalition seems, until recently at least, to havebeen ably accommodating social demands, and the latest elections in Peru are asignal of the urgent need to start incorporating those demands in the politicalagenda. These are but a few examples of the extent to which the political scenevaries dramatically from country to country, whether in terms of the ideologicalleanings of government leaders, or of the extent to which wide sectors of the pop-ulation have been included in the debate, or of the main demands being debated.
Where Did All the Reform Go? Factors Breaking the Linkbetween Reform and Growth
The effort at reform in Latin America has been genuine, and it has been long-lived,stretching from the 1980s through the 1990s and continuing into the presentdecade, although with different timing in different countries. Figure 2 shows howcountries have performed in terms of the best available single indicator of struc-tural reform across the region, that of Lora (2001). The index reflects advances infive types of reform: trade, financial, privatization, tax, and labor reform.Although the index leaves out a number of other reforms that have been and arebeing implemented in many countries—reform of the social sectors and of insti-tutions in particular—it does show that the pace of change was rapid in the 1990sbut slowed significantly in the 2000s.5 As suggested by Lora (2007), reform of thestate, in its multiple institutional facets, has been proceeding since the 1980s in anumber of countries, but slowly; also, in contrast to the more traditional reforms,reforms of the state have tended to be implemented piecemeal rather than bundled.6
5. Lora and Panizza (2002) suggest that the pace of reform was at its most rapid between 1989and 1994, with Chile again an exception. For an analysis of the early period of reforms, see Edwards(1995).
6. In Lora’s (2007) view the unbundling of institutional reforms reflects the attempt of govern-ments to exploit political opportunities for reform whenever they become available, in the expecta-tion that the process would continue.
11630-02_CH02_rev2.qxd 6/2/09 4:36 PM Page 41
42 cgd task force
Box 1. A Rereading of the Politics of Market Reform in the 2000s: Things AreNot That Bad
The anti-market forces that have gained political ground across South America since1998 are far more heterogeneous than meets the eye. Indeed, these forces agglomerateseveral quite different varieties of discontent with the market. Some are clearly inimicalto market reform, whereas others represent political demands that could be accommo-dated by “reforming the reforms” rather than reversing them.
The various leftist movements that have come to power since the late 1990sinclude, in different proportions, all of the following distinct, but not mutuallyexclusive, species:
• Anti-establishment revolutionaries. This is the old radical left that has never likedthe status quo. Their main slogan, “¡Que se vayan todos!” became the vox populi duringthe 1999 constitutional assembly in Venezuela, the 2001 financial crisis in Argentina,and the 2003 crisis in Bolivia.
• Rent seekers: These are the old protectionists prominent among business and laborgroups, and the patronage-seeking politicians who lost ground with the reforms of the1990s and are looking for an opportunity to regain control of the state. Their slogan is“Down with globalization and FTAs!” An example is the opposition in 2006–07 inCosta Rica to CAFTA (the Central American Free Trade Agreement), where a popularreferendum was needed in late 2007 to ratify the agreement into law.
• Nationalists: This group opposed the foreign policy of many Latin American coun-tries, launched in the 1990s, of close realignment with the United States, in the pursuitof free trade and aggressive drug interdiction, and with the International MonetaryFund, because of its perceived micromanagement of national legislation and strict con-ditionalities. Since 2001, following the 9/11 terrorist attacks and the Argentine finan-cial crisis, both the United States and the IMF appear to these groups—whose slogan is“Down with imperialism!”—to have become far more hard-line.
• Pro-transparency forces: These groups wish to see more institutional transparencyin the conduct of government affairs: more participation in budget decisions, less cor-ruption, more accountability for decision-makers, better-functioning courts, greatertransparency in party and campaign finance, and so on. Their slogan is “Down withcorruption!”
• Pro-access forces: These groups want more access to the market, through lowerprices for privatized services, lower interest rates, and expanded credit opportunities forlow-income groups. They advocate dismantling the oligopolies that were created orallowed to survive in the 1990s, making tax systems less onerous on consumers, andexpanding the number of well-paying private sector jobs. Their slogan is “Down withinequity!”
• Big spenders: These groups want to spend more on old-fashioned progressive poli-cies, such as social services (education and health in particular) and infrastructure andenergy development. Their slogan is “We need to invest in our future!”
• Identity promoters: The focus of these groups is on ending the system of de factoethnic apartheid that still prevails in many countries, especially in the Andes, and giv-ing these long-neglected ethnic minorities greater political representation and power.Their slogan is “Multiculturalism starts at home!”
(continued)
11630-02_CH02_rev2.qxd 6/2/09 4:36 PM Page 42
a framework for analysis 43
Box 1. A Rereading of the Politics of Market Reform in the 2000s: Things AreNot That Bad (continued)
The story of the 2000s is one of struggle among these various market discontents, atleast as much as between them and the pro-market forces. Once in office, leftist leadershave confronted serious internal conflicts among these various forces that got themelected. These different factions have disagreed not just about what to do about markets(the first three groups versus the last four), but also about which other priorities to pur-sue (the last four groups among themselves).
The main reason for this dissension is that many of these forms of discontent areincompatible with one another. Clearly, the first two groups, and to a lesser extent thethird, are the most serious enemies of market reform. But it is not clear that the othersare completely adverse to market reform. Rather, they present demands that are moresupplementary to than incompatible with market forces. This means that theirdemands could in principle be met while, simultaneously, market reforms are beingpursued—compromise with these groups need not derail the reform agenda.
Figure 2 also shows the extent of variation across countries in terms of the tim-ing, speed, and depth of reform. Chile was clearly among the first countries topursue market-oriented reforms, so that by 1985 it was already ahead of the pack.Argentina and Peru, in contrast, started their reforms much later and in a muchdifferent fashion: the steep increase in the index in these countries in the late1980s and early 1990s is a good illustration of what has come to be known as“shock therapy,” whereas Chile, and later Brazil, followed a much more gradualapproach. Venezuela and Peru are examples of countries that did not followthrough with reform: starting from much the same, mostly unreformed position,Venezuela has lagged behind Peru and remains among the least aggressivelyreforming countries.
As a first step toward building an analytical framework for assessing the pre-conditions for successful reform, we identify here two possible general explana-tions for why the reforms implemented in Latin America have not producedunambiguously sustainable growth in income per capita. The first is that some ofthe reforms were not aimed at improving growth in income directly and imme-diately, but had other objectives instead. The second is that the reforms didattempt to generate growth but were thwarted by one or more obstacles, whichmay have taken different forms in different countries.
Not All Reforms Were Pro-Growth . . .
It is certainly the case that some of Latin America’s reforms were not really aimedat accelerating growth of “measured” income per capita, at least in the short or themedium term, but instead were intended to improve living standards directly, by
11630-02_CH02_rev2.qxd 6/2/09 4:36 PM Page 43
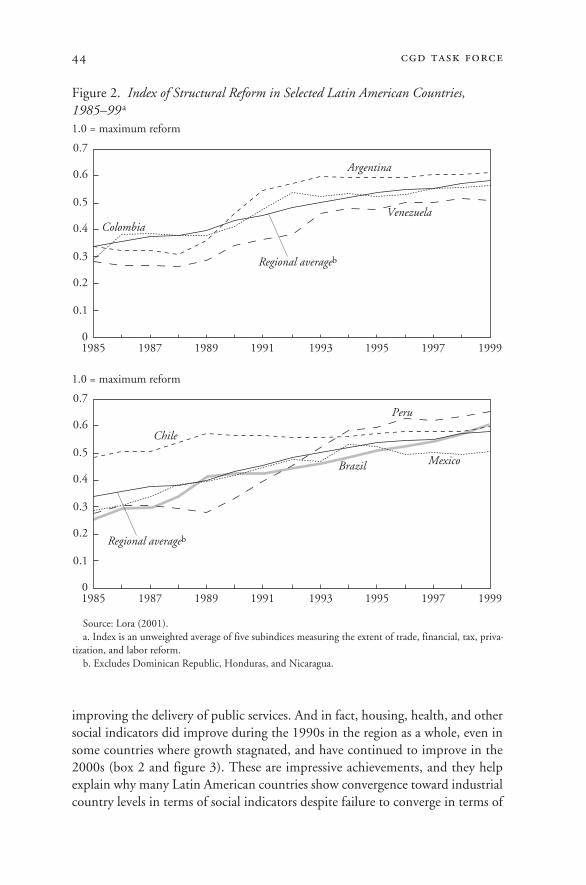
improving the delivery of public services. And in fact, housing, health, and othersocial indicators did improve during the 1990s in the region as a whole, even insome countries where growth stagnated, and have continued to improve in the2000s (box 2 and figure 3). These are impressive achievements, and they helpexplain why many Latin American countries show convergence toward industrialcountry levels in terms of social indicators despite failure to converge in terms of
44 cgd task force
Figure 2. Index of Structural Reform in Selected Latin American Countries,1985–99 a
Source: Lora (2001). a. Index is an unweighted average of five subindices measuring the extent of trade, financial, tax, priva-
tization, and labor reform.b. Excludes Dominican Republic, Honduras, and Nicaragua.
1.0 = maximum reform
0
0.1
0.2
0.3
0.4
0.5
0.6
0.7
1985 1987 1989 1991 1993 1995 1997 1999
Argentina
ColombiaVenezuela
Regional averageb
1.0 = maximum reform
0
0.1
0.2
0.3
0.4
0.5
0.6
0.7
1985 1987 1989 1991 1993 1995 1997 1999
Chile
Brazil Mexico
Peru
Regional averageb
11630-02_CH02_rev2.qxd 6/2/09 4:36 PM Page 44
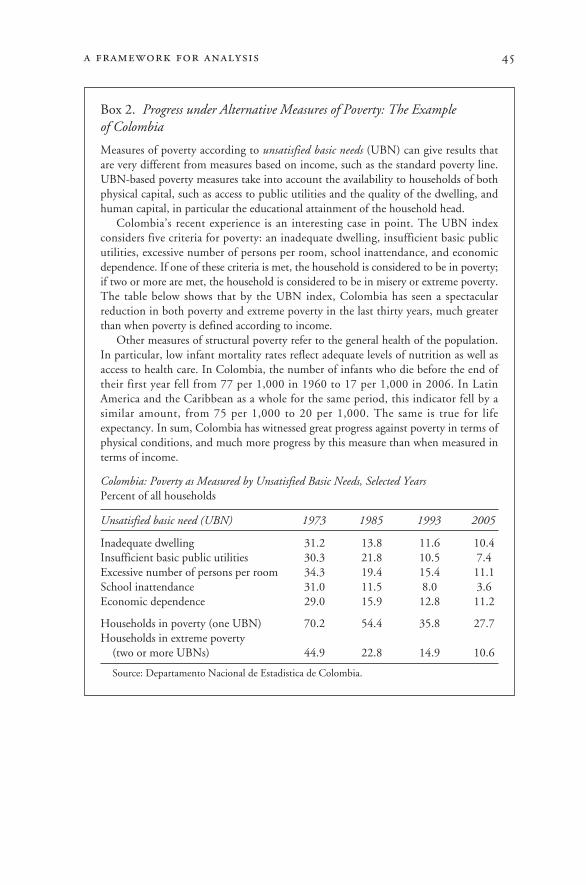
a framework for analysis 45
Box 2. Progress under Alternative Measures of Poverty: The Example of Colombia
Measures of poverty according to unsatisfied basic needs (UBN) can give results thatare very different from measures based on income, such as the standard poverty line.UBN-based poverty measures take into account the availability to households of bothphysical capital, such as access to public utilities and the quality of the dwelling, andhuman capital, in particular the educational attainment of the household head.
Colombia’s recent experience is an interesting case in point. The UBN indexconsiders five criteria for poverty: an inadequate dwelling, insufficient basic publicutilities, excessive number of persons per room, school inattendance, and economicdependence. If one of these criteria is met, the household is considered to be in poverty;if two or more are met, the household is considered to be in misery or extreme poverty.The table below shows that by the UBN index, Colombia has seen a spectacularreduction in both poverty and extreme poverty in the last thirty years, much greaterthan when poverty is defined according to income.
Other measures of structural poverty refer to the general health of the population.In particular, low infant mortality rates reflect adequate levels of nutrition as well asaccess to health care. In Colombia, the number of infants who die before the end oftheir first year fell from 77 per 1,000 in 1960 to 17 per 1,000 in 2006. In LatinAmerica and the Caribbean as a whole for the same period, this indicator fell by asimilar amount, from 75 per 1,000 to 20 per 1,000. The same is true for lifeexpectancy. In sum, Colombia has witnessed great progress against poverty in terms ofphysical conditions, and much more progress by this measure than when measured interms of income.
Colombia: Poverty as Measured by Unsatisfied Basic Needs, Selected YearsPercent of all households
Unsatisfied basic need (UBN) 1973 1985 1993 2005
Inadequate dwelling 31.2 13.8 11.6 10.4Insufficient basic public utilities 30.3 21.8 10.5 7.4Excessive number of persons per room 34.3 19.4 15.4 11.1School inattendance 31.0 11.5 8.0 3.6Economic dependence 29.0 15.9 12.8 11.2
Households in poverty (one UBN) 70.2 54.4 35.8 27.7Households in extreme poverty
(two or more UBNs) 44.9 22.8 14.9 10.6
Source: Departamento Nacional de Estadistica de Colombia.
11630-02_CH02_rev2.qxd 6/2/09 4:36 PM Page 45
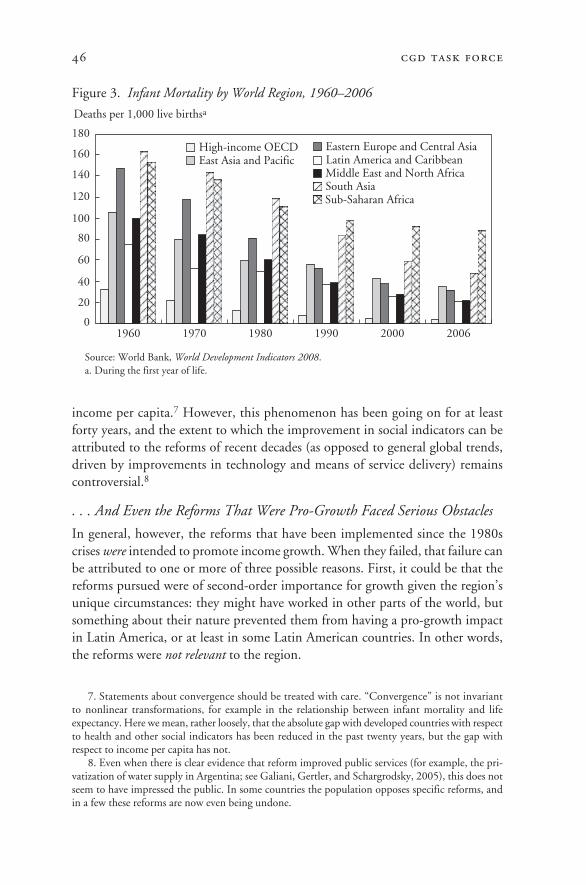
income per capita.7 However, this phenomenon has been going on for at leastforty years, and the extent to which the improvement in social indicators can beattributed to the reforms of recent decades (as opposed to general global trends,driven by improvements in technology and means of service delivery) remainscontroversial.8
. . . And Even the Reforms That Were Pro-Growth Faced Serious Obstacles
In general, however, the reforms that have been implemented since the 1980scrises were intended to promote income growth. When they failed, that failure canbe attributed to one or more of three possible reasons. First, it could be that thereforms pursued were of second-order importance for growth given the region’sunique circumstances: they might have worked in other parts of the world, butsomething about their nature prevented them from having a pro-growth impactin Latin America, or at least in some Latin American countries. In other words,the reforms were not relevant to the region.
46 cgd task force
7. Statements about convergence should be treated with care. “Convergence” is not invariantto nonlinear transformations, for example in the relationship between infant mortality and lifeexpectancy. Here we mean, rather loosely, that the absolute gap with developed countries with respectto health and other social indicators has been reduced in the past twenty years, but the gap withrespect to income per capita has not.
8. Even when there is clear evidence that reform improved public services (for example, the pri-vatization of water supply in Argentina; see Galiani, Gertler, and Schargrodsky, 2005), this does notseem to have impressed the public. In some countries the population opposes specific reforms, andin a few these reforms are now even being undone.
Figure 3. Infant Mortality by World Region, 1960–2006
Source: World Bank, World Development Indicators 2008. a. During the first year of life.
Deaths per 1,000 live birthsa
0
60
40
20
80
100
120
140
160
180
1960 1970 1980 1990 2000 2006
High-income OECDEast Asia and Pacific
Eastern Europe and Central AsiaLatin America and CaribbeanMiddle East and North Africa
Sub-Saharan AfricaSouth Asia
11630-02_CH02_rev2.qxd 6/2/09 4:36 PM Page 46
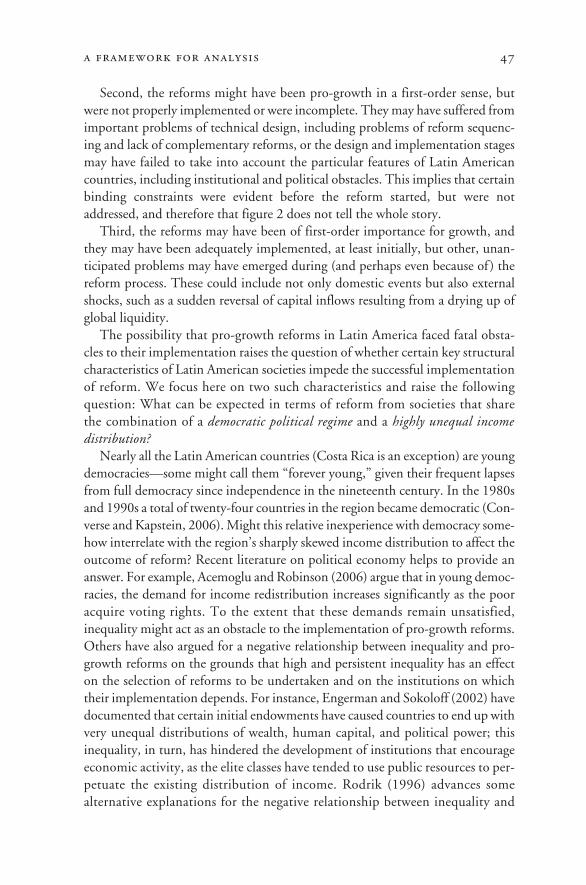
Second, the reforms might have been pro-growth in a first-order sense, butwere not properly implemented or were incomplete. They may have suffered fromimportant problems of technical design, including problems of reform sequenc-ing and lack of complementary reforms, or the design and implementation stagesmay have failed to take into account the particular features of Latin Americancountries, including institutional and political obstacles. This implies that certainbinding constraints were evident before the reform started, but were notaddressed, and therefore that figure 2 does not tell the whole story.
Third, the reforms may have been of first-order importance for growth, andthey may have been adequately implemented, at least initially, but other, unan-ticipated problems may have emerged during (and perhaps even because of) thereform process. These could include not only domestic events but also externalshocks, such as a sudden reversal of capital inflows resulting from a drying up ofglobal liquidity.
The possibility that pro-growth reforms in Latin America faced fatal obsta-cles to their implementation raises the question of whether certain key structuralcharacteristics of Latin American societies impede the successful implementationof reform. We focus here on two such characteristics and raise the followingquestion: What can be expected in terms of reform from societies that sharethe combination of a democratic political regime and a highly unequal income distribution?
Nearly all the Latin American countries (Costa Rica is an exception) are youngdemocracies—some might call them “forever young,” given their frequent lapsesfrom full democracy since independence in the nineteenth century. In the 1980sand 1990s a total of twenty-four countries in the region became democratic (Con-verse and Kapstein, 2006). Might this relative inexperience with democracy some-how interrelate with the region’s sharply skewed income distribution to affect theoutcome of reform? Recent literature on political economy helps to provide ananswer. For example, Acemoglu and Robinson (2006) argue that in young democ-racies, the demand for income redistribution increases significantly as the pooracquire voting rights. To the extent that these demands remain unsatisfied,inequality might act as an obstacle to the implementation of pro-growth reforms.Others have also argued for a negative relationship between inequality and pro-growth reforms on the grounds that high and persistent inequality has an effecton the selection of reforms to be undertaken and on the institutions on whichtheir implementation depends. For instance, Engerman and Sokoloff (2002) havedocumented that certain initial endowments have caused countries to end up withvery unequal distributions of wealth, human capital, and political power; thisinequality, in turn, has hindered the development of institutions that encourageeconomic activity, as the elite classes have tended to use public resources to per-petuate the existing distribution of income. Rodrik (1996) advances somealternative explanations for the negative relationship between inequality and
a framework for analysis 47
11630-02_CH02_rev2.qxd 6/2/09 4:36 PM Page 47
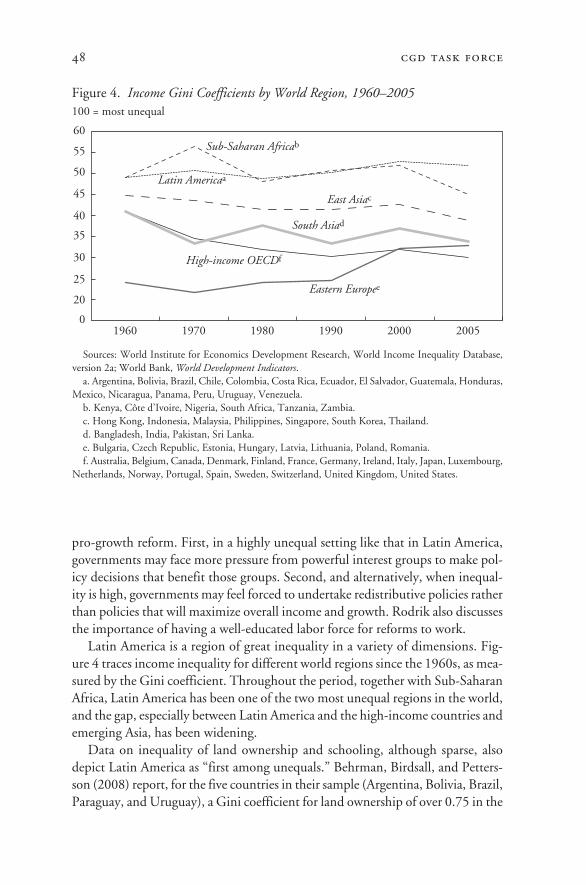
pro-growth reform. First, in a highly unequal setting like that in Latin America,governments may face more pressure from powerful interest groups to make pol-icy decisions that benefit those groups. Second, and alternatively, when inequal-ity is high, governments may feel forced to undertake redistributive policies ratherthan policies that will maximize overall income and growth. Rodrik also discussesthe importance of having a well-educated labor force for reforms to work.
Latin America is a region of great inequality in a variety of dimensions. Fig-ure 4 traces income inequality for different world regions since the 1960s, as mea-sured by the Gini coefficient. Throughout the period, together with Sub-SaharanAfrica, Latin America has been one of the two most unequal regions in the world,and the gap, especially between Latin America and the high-income countries andemerging Asia, has been widening.
Data on inequality of land ownership and schooling, although sparse, alsodepict Latin America as “first among unequals.” Behrman, Birdsall, and Petters-son (2008) report, for the five countries in their sample (Argentina, Bolivia, Brazil,Paraguay, and Uruguay), a Gini coefficient for land ownership of over 0.75 in the
48 cgd task force
Figure 4. Income Gini Coefficients by World Region, 1960–2005
Sources: World Institute for Economics Development Research, World Income Inequality Database, version 2a; World Bank, World Development Indicators.
a. Argentina, Bolivia, Brazil, Chile, Colombia, Costa Rica, Ecuador, El Salvador, Guatemala, Honduras, Mexico, Nicaragua, Panama, Peru, Uruguay, Venezuela.
b. Kenya, Côte d’Ivoire, Nigeria, South Africa, Tanzania, Zambia.c. Hong Kong, Indonesia, Malaysia, Philippines, Singapore, South Korea, Thailand.d. Bangladesh, India, Pakistan, Sri Lanka.e. Bulgaria, Czech Republic, Estonia, Hungary, Latvia, Lithuania, Poland, Romania. f. Australia, Belgium, Canada, Denmark, Finland, France, Germany, Ireland, Italy, Japan, Luxembourg,
Netherlands, Norway, Portugal, Spain, Sweden, Switzerland, United Kingdom, United States.
100 = most unequal
0
30
25
20
35
40
45
50
55
60
1960 1970 1980 1990 2000 2005
High-income OECDf
East Asiac
Eastern Europee
Latin Americaa
Sub-Saharan Africab
South Asiad
11630-02_CH02_rev2.qxd 6/2/09 4:36 PM Page 48
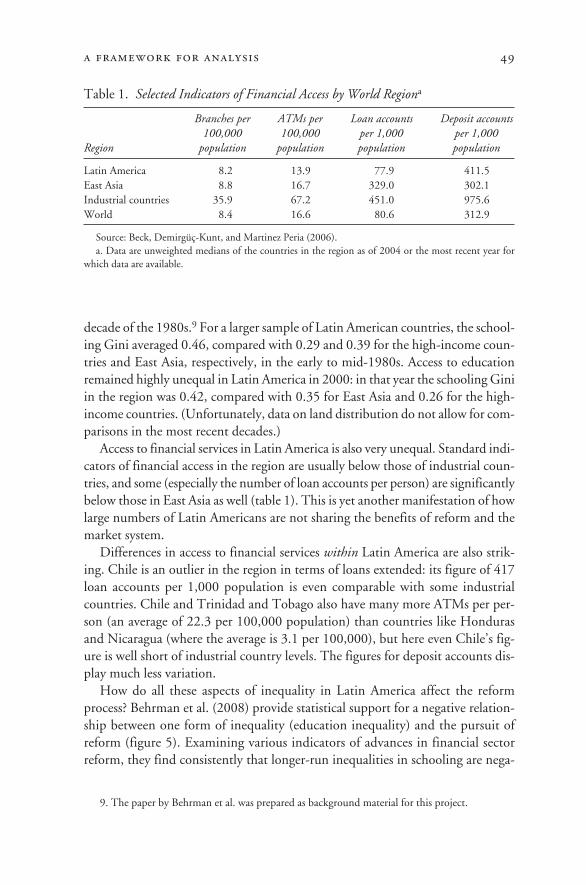
decade of the 1980s.9 For a larger sample of Latin American countries, the school-ing Gini averaged 0.46, compared with 0.29 and 0.39 for the high-income coun-tries and East Asia, respectively, in the early to mid-1980s. Access to educationremained highly unequal in Latin America in 2000: in that year the schooling Giniin the region was 0.42, compared with 0.35 for East Asia and 0.26 for the high-income countries. (Unfortunately, data on land distribution do not allow for com-parisons in the most recent decades.)
Access to financial services in Latin America is also very unequal. Standard indi-cators of financial access in the region are usually below those of industrial coun-tries, and some (especially the number of loan accounts per person) are significantlybelow those in East Asia as well (table 1). This is yet another manifestation of howlarge numbers of Latin Americans are not sharing the benefits of reform and themarket system.
Differences in access to financial services within Latin America are also strik-ing. Chile is an outlier in the region in terms of loans extended: its figure of 417loan accounts per 1,000 population is even comparable with some industrialcountries. Chile and Trinidad and Tobago also have many more ATMs per per-son (an average of 22.3 per 100,000 population) than countries like Hondurasand Nicaragua (where the average is 3.1 per 100,000), but here even Chile’s fig-ure is well short of industrial country levels. The figures for deposit accounts dis-play much less variation.
How do all these aspects of inequality in Latin America affect the reformprocess? Behrman et al. (2008) provide statistical support for a negative relation-ship between one form of inequality (education inequality) and the pursuit ofreform (figure 5). Examining various indicators of advances in financial sectorreform, they find consistently that longer-run inequalities in schooling are nega-
a framework for analysis 49
9. The paper by Behrman et al. was prepared as background material for this project.
Table 1. Selected Indicators of Financial Access by World Regiona
Branches per ATMs per Loan accounts Deposit accounts 100,000 100,000 per 1,000 per 1,000
Region population population population population
Latin America 8.2 13.9 77.9 411.5East Asia 8.8 16.7 329.0 302.1Industrial countries 35.9 67.2 451.0 975.6World 8.4 16.6 80.6 312.9
Source: Beck, Demirgüç-Kunt, and Martinez Peria (2006).a. Data are unweighted medians of the countries in the region as of 2004 or the most recent year for
which data are available.
11630-02_CH02_rev2.qxd 6/2/09 4:36 PM Page 49
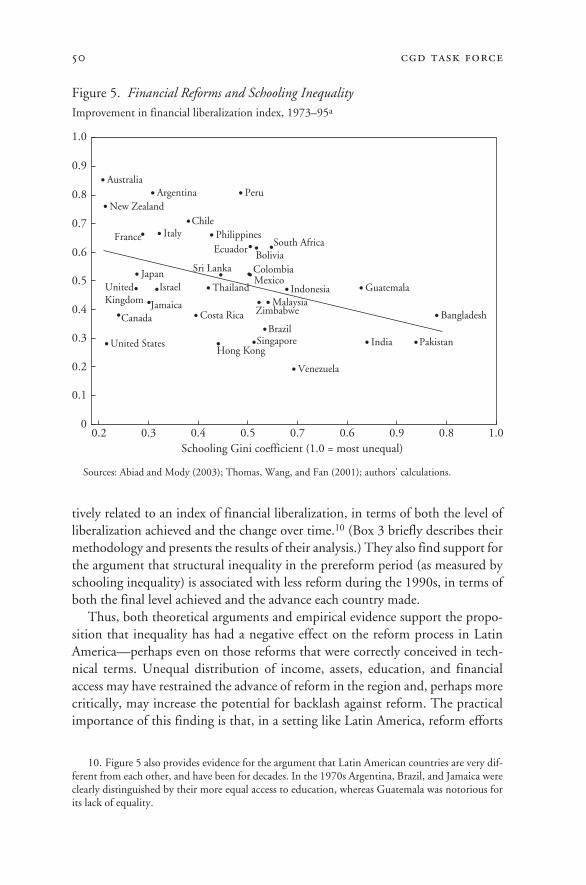
tively related to an index of financial liberalization, in terms of both the level ofliberalization achieved and the change over time.10 (Box 3 briefly describes theirmethodology and presents the results of their analysis.) They also find support forthe argument that structural inequality in the prereform period (as measured byschooling inequality) is associated with less reform during the 1990s, in terms ofboth the final level achieved and the advance each country made.
Thus, both theoretical arguments and empirical evidence support the propo-sition that inequality has had a negative effect on the reform process in LatinAmerica—perhaps even on those reforms that were correctly conceived in tech-nical terms. Unequal distribution of income, assets, education, and financialaccess may have restrained the advance of reform in the region and, perhaps morecritically, may increase the potential for backlash against reform. The practicalimportance of this finding is that, in a setting like Latin America, reform efforts
50 cgd task force
10. Figure 5 also provides evidence for the argument that Latin American countries are very dif-ferent from each other, and have been for decades. In the 1970s Argentina, Brazil, and Jamaica wereclearly distinguished by their more equal access to education, whereas Guatemala was notorious forits lack of equality.
Figure 5. Financial Reforms and Schooling Inequality
Sources: Abiad and Mody (2003); Thomas, Wang, and Fan (2001); authors’ calculations.
Improvement in financial liberalization index, 1973–95a
0.6
0.4
0.8
1.0
0.2 0.4 0.7 0.9 1.00.3 0.5 0.6 0.8
0.7
0.5
0.3
0.9
0.2
0
0.1
Schooling Gini coefficient (1.0 = most unequal)
ArgentinaAustralia
Bangladesh
Bolivia
BrazilCanada
Chile
Colombia
Costa Rica
EcuadorFrance
Guatemala
Hong KongIndia
IndonesiaIsrael
Italy
Jamaica
Japan
Malaysia
Mexico
New Zealand
Pakistan
Peru
Philippines
Singapore
South Africa
Sri Lanka
ThailandUnitedKingdom
United States
Venezuela
Zimbabwe
11630-02_CH02_rev2.qxd 6/2/09 4:36 PM Page 50
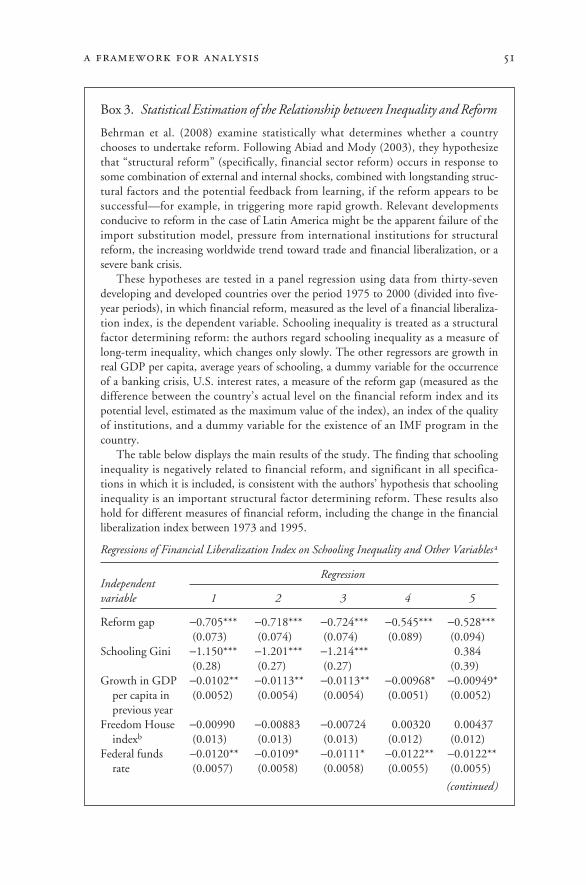
a framework for analysis 51
Box 3. Statistical Estimation of the Relationship between Inequality and Reform
Behrman et al. (2008) examine statistically what determines whether a countrychooses to undertake reform. Following Abiad and Mody (2003), they hypothesizethat “structural reform” (specifically, financial sector reform) occurs in response tosome combination of external and internal shocks, combined with longstanding struc-tural factors and the potential feedback from learning, if the reform appears to besuccessful—for example, in triggering more rapid growth. Relevant developmentsconducive to reform in the case of Latin America might be the apparent failure of theimport substitution model, pressure from international institutions for structuralreform, the increasing worldwide trend toward trade and financial liberalization, or asevere bank crisis.
These hypotheses are tested in a panel regression using data from thirty-sevendeveloping and developed countries over the period 1975 to 2000 (divided into five-year periods), in which financial reform, measured as the level of a financial liberaliza-tion index, is the dependent variable. Schooling inequality is treated as a structuralfactor determining reform: the authors regard schooling inequality as a measure oflong-term inequality, which changes only slowly. The other regressors are growth inreal GDP per capita, average years of schooling, a dummy variable for the occurrenceof a banking crisis, U.S. interest rates, a measure of the reform gap (measured as thedifference between the country’s actual level on the financial reform index and itspotential level, estimated as the maximum value of the index), an index of the qualityof institutions, and a dummy variable for the existence of an IMF program in thecountry.
The table below displays the main results of the study. The finding that schoolinginequality is negatively related to financial reform, and significant in all specifica-tions in which it is included, is consistent with the authors’ hypothesis that schoolinginequality is an important structural factor determining reform. These results alsohold for different measures of financial reform, including the change in the financialliberalization index between 1973 and 1995.
Regressions of Financial Liberalization Index on Schooling Inequality and Other Variables a
Independent Regression
variable 1 2 3 4 5
Reform gap −0.705*** −0.718*** −0.724*** −0.545*** −0.528***(0.073) (0.074) (0.074) (0.089) (0.094)
Schooling Gini −1.150*** −1.201*** −1.214*** 0.384(0.28) (0.27) (0.27) (0.39)
Growth in GDP −0.0102** −0.0113** −0.0113** −0.00968* −0.00949*per capita in (0.0052) (0.0054) (0.0054) (0.0051) (0.0052)previous year
Freedom House −0.00990 −0.00883 −0.00724 0.00320 0.00437indexb (0.013) (0.013) (0.013) (0.012) (0.012)
Federal funds −0.0120** −0.0109* −0.0111* −0.0122** −0.0122**rate (0.0057) (0.0058) (0.0058) (0.0055) (0.0055)
(continued)
11630-02_CH02_rev2.qxd 6/2/09 4:36 PM Page 51
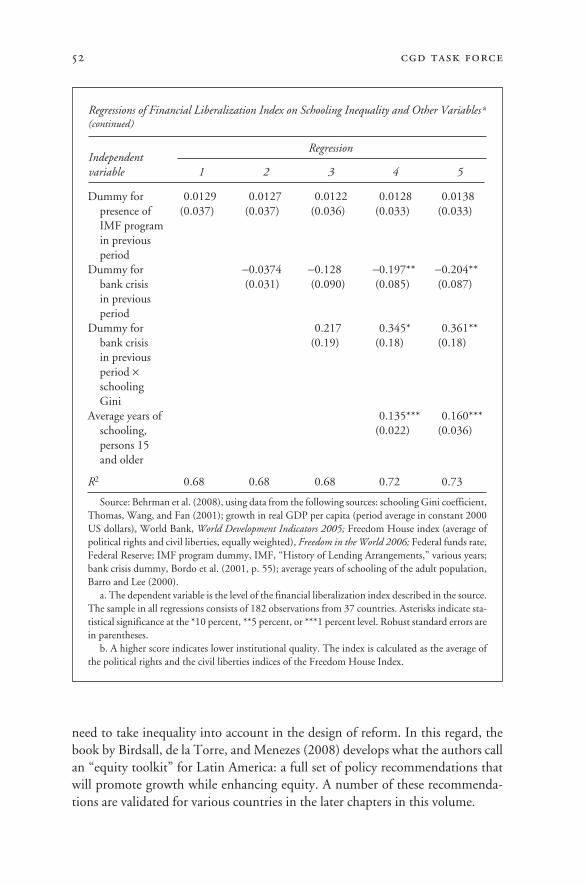
52 cgd task force
Regressions of Financial Liberalization Index on Schooling Inequality and Other Variables a
(continued)
Independent Regression
variable 1 2 3 4 5
Dummy for 0.0129 0.0127 0.0122 0.0128 0.0138presence of (0.037) (0.037) (0.036) (0.033) (0.033)IMF program in previous period
Dummy for −0.0374 −0.128 −0.197** −0.204**bank crisis (0.031) (0.090) (0.085) (0.087)in previous period
Dummy for 0.217 0.345* 0.361**bank crisis (0.19) (0.18) (0.18)in previous period ×schooling Gini
Average years of 0.135*** 0.160***schooling, (0.022) (0.036)persons 15 and older
R2 0.68 0.68 0.68 0.72 0.73
Source: Behrman et al. (2008), using data from the following sources: schooling Gini coefficient,Thomas, Wang, and Fan (2001); growth in real GDP per capita (period average in constant 2000US dollars), World Bank, World Development Indicators 2005; Freedom House index (average ofpolitical rights and civil liberties, equally weighted), Freedom in the World 2006; Federal funds rate,Federal Reserve; IMF program dummy, IMF, “History of Lending Arrangements,” various years;bank crisis dummy, Bordo et al. (2001, p. 55); average years of schooling of the adult population,Barro and Lee (2000).
a. The dependent variable is the level of the financial liberalization index described in the source.The sample in all regressions consists of 182 observations from 37 countries. Asterisks indicate sta-tistical significance at the *10 percent, **5 percent, or ***1 percent level. Robust standard errors arein parentheses.
b. A higher score indicates lower institutional quality. The index is calculated as the average ofthe political rights and the civil liberties indices of the Freedom House Index.
need to take inequality into account in the design of reform. In this regard, thebook by Birdsall, de la Torre, and Menezes (2008) develops what the authors callan “equity toolkit” for Latin America: a full set of policy recommendations thatwill promote growth while enhancing equity. A number of these recommenda-tions are validated for various countries in the later chapters in this volume.
11630-02_CH02_rev2.qxd 6/2/09 4:36 PM Page 52
Finally, a note of caution. Identifying inequality (especially education inequal-ity) as a constraint on reform does not imply that it is only the poor and the lesseducated who resist reform. Inequality is just one of the constraints (others are dis-cussed below) that have prevented reforms from delivering sustainable growth andraising income per capita. It is therefore not surprising to find that there are nosignificant differences in discontent with the outcome of reforms across groupswith different amounts of education. Data from Latinobarómetro support thiscontention.11
A Proposed Framework for Analyzing Reforms and Growth inLatin America
The discussion thus far makes clear the need to explore in a systematic way theparticular factors that have either supported or obstructed the implementation ofpro-growth reforms or made them more or less effective. This section develops aframework for analyzing the relationship between reforms and growth in theregion. Chapter 1 discussed the differences between alternative approaches andthe one presented here. The objective is to construct a framework that will allowresearchers and policymakers to do the following:
• identify mechanisms through which alternative reforms can (or cannot)deliver sustained growth in Latin American countries
• understand the factors specific to Latin America that generate issues forappropriate design, problems for implementation, and other local constraints—political, social, or institutional—that affect how reforms can deliver growth
• derive at least some preliminary conclusions about why certain reforms inthe past did not lead to growth, in order to advance feasible policy recommenda-tions for the future
• focus attention on the political economy of inequality and access in thereform process, and
• most important, serve as an instrument for further assessments of the reformprocess in individual countries and for cross-country comparisons.
Pulling together the evidence and analytical discussion in the first two sectionsof this chapter, the framework is formed by four blocks, each one answering oneof the following questions:
• What are the foundations for growth—the first-order underlying issues—inLatin America?
a framework for analysis 53
11. We are indebted to Pedro Dal Bo for arguments explaining the lack of support for reformamong the more educated segments of the population. Data from Latinobarómetro (www.latino-barómetro.org) show that in some countries, such as Bolivia, Colombia, El Salvador, Nicaragua, andPeru, the more educated are even slightly less enthusiastic about the results of privatization than the lesseducated. However, these rankings vary from year to year and should therefore be viewed with caution.
11630-02_CH02_rev2.qxd 6/2/09 4:36 PM Page 53
• How, at the analytical level, can individual reforms impact the foundationsfor growth?
• What local features of the economy and society in individual countries actas potential constraints and obstacles, breaking the link from reforms to growth?
• How can these constraints and obstacles be addressed, either head on or byfinding legitimate ways to work around them? Are there alternative reforms thatcan more effectively address the same purpose? Are there any private sectorarrangements that can serve to reduce, contain, or appropriately get past theseobstacles?
The rest of this section develops each of these four blocks. The third andfourth blocks explicitly recognize that countries in the region differ significantlyone from another in terms of economic and social development as well as polit-ical features. Some of these differences are evident from the earlier discussion. Acentral point behind the conceptual framework is that major differences betweencountries imply that reforms will act differently and result in different outcomesin different countries—hence regional generalizations have limited usefulness.To exemplify the application of the framework to individual reforms and coun-tries, the discussion makes reference to the existing literature on reform in theregion.
What Are the Foundations for Growth in Latin America?
As discussed in chapter 1, this framework identifies economic growth withmarket-based growth. Although this definition by no means precludes a sensiblerole for government (and indeed, government interventions to deal with mar-ket imperfections are encouraged), the Task Force acknowledged that the LatinAmerican experience with government-led growth has been disappointing andthat such a model is not advisable for the region. Moreover, in the context of anopen capital account (the type of regime chosen by most countries in the regionsince the late 1980s), the adequate functioning of a market economy is a neces-sary condition for the sustainability of growth gains (see chapter 1 for furtherdiscussion).
The Task Force identified five foundations for market-based growth in LatinAmerica. The first three are essential for the appropriate functioning of any mar-ket economy. The last two are more specifically a concern in Latin America. Byrecognizing the region’s specific features and its long history of economic, social,and political crises, the foundations try to capture the essential need for eco-nomic stability and social inclusion for growth to be sustained. The five foun-dations are
• Secure property rights for the population, so that people can expect to bene-fit from their investments and cannot be unexpectedly expropriated by the stateor by the politically powerful.
54 cgd task force
11630-02_CH02_rev2.qxd 6/2/09 4:36 PM Page 54
• Sufficiently equal opportunities for broad segments of the society, so as tolevel the playing field in market-based interactions. Broadly speaking, this meanslowering barriers to entry into business to people without political connections orlarge stocks of wealth. This is distinct from the first foundation: a person mighthave secure property rights but no way to access new market opportunities, forexample because regulatory requirements create a high fixed cost of doing busi-ness, or because ordinary citizens cannot raise capital through bank loans or inother ways. Problems with this foundation are apparent in Latin America, where,as discussed above, lack of access has been an important manifestation of inequal-ity, which in turn constrains pro-growth reform.
• Sufficient economic and political competition to avoid capture of the state byelites of one kind or another. This is distinct from the first two foundations,because even if ordinary people have secure property rights and meaningful oppor-tunities, the considerable resources of the state might still be funneled toward arelatively few favored individuals or companies. Recent research on a wide rangeof countries indicates that political connections of various kinds remain impor-tant and a major brake on development.
• Latin America’s frequent economic and financial crises during the 1980sand since have often resulted in sharp recessions and in the need for fiscal adjust-ment to restore macroeconomic balance. These adjustments, in turn, haverequired drastic cuts in social expenditure and in vital infrastructure spending,with adverse consequences for the poor and for long-term growth. Although themajor economies in the world can sometimes get away with maintaining largemacroeconomic imbalances for prolonged periods (the United States being acurrent example), the characteristics and history of Latin America imply thatinvestors will tend to flee at the first sign of trouble, deepening the financial dif-ficulties and exacerbating the crisis. Thus, macroeconomic stability is a key foun-dation for sustained growth in Latin America, necessary to ensure that sufficientpublic funds are allocated to pro-growth reform efforts and, conversely, that thereform process does not have to be interrupted to deal with macroeconomicimbalances.
• Given the recent history in Latin America of discontent with the outcomeof reform (box 1) and disillusion with various alternative development models, afifth foundation for growth is the need for broad sharing of the benefits of growthamong the population. Realistically, only a minority of the population will everwant to make the kind of productive investments for which the first three foun-dations are of primary importance—in all societies, most people work as employ-ees or in small-scale independent activities, or are outside the labor force, living aspensioners or students or other dependents. Yet these people, too, need to bene-fit from reform if there is not to be a serious political backlash against it—and thisis true whether reform succeeds or fails in restoring economic growth. If GDP per
a framework for analysis 55
11630-02_CH02_rev2.qxd 6/2/09 4:36 PM Page 55
capita grows but most people see no increase in their real income, they maybecome opponents of reform, and their opposition may lead to consequences thatundermine the sustainability of growth.
The importance of this last foundation cannot be overstressed. As discussedabove, important segments of the population in a number of Latin Americancountries today are voting for redistributive policies. Taking these demands intoaccount is essential for long-term growth.
Before leaving this subsection, an important clarification is needed. Althoughthe framework emphasizes the central role of the identified foundations inachieving sustained growth in Latin America, the Task Force fully acknowledgesthat there can be episodes where growth is ignited without improvement in anyof the foundations. For example, a sharp improvement in the terms of trade canspark growth—indeed, this has happened several times in the region, includingduring 2003–08. The Task Force maintains, however, that for such growthaccelerations to be sustainable, the foundations for growth identified above needto improve.
How Do Reforms Impact the Foundations for Growth?
Every reform affects economic growth differently. Therefore any analysis of thepotential for reform to have an impact on the foundations for growth requires alist of reforms to be considered. However, the list of all the reforms that have beenor might someday be implemented in Latin America is certain to be both long andvaried, and each of these reforms will cover a number of different issues and activ-ities and thus can be disaggregated further.
The Task Force strongly believes that the task of identifying which particularreforms are needed to strengthen the growth foundations in a given countryshould be left up to the country itself. In the chapters that follow, experts fromfive countries in the region each choose a set of reforms to analyze for theircountry. These reforms will, of course, include some that have already beenimplemented and some that have not but that are considered essential for thefuture. The Task Force makes no presumption about what reforms are best forwhat countries, and it certainly does not presume that a common set of policiesis right for all countries in the region. However, to illustrate the workings of theframework, we offer the following, necessarily incomplete, classification:
• reforms that directly improve the workings of the market: trade, financial,labor, pension, privatization, and land titling (these include adequate regulation,including consumer protection and antidumping arrangements)
• reforms oriented toward the provision of social services: education, health,and the social safety net
• reforms of economic and financial infrastructure: central bank indepen-dence, decentralization, tax collection, budgetary institutions, customs, registries,regulatory agencies, and supervisory authorities
56 cgd task force
11630-02_CH02_rev2.qxd 6/2/09 4:36 PM Page 56
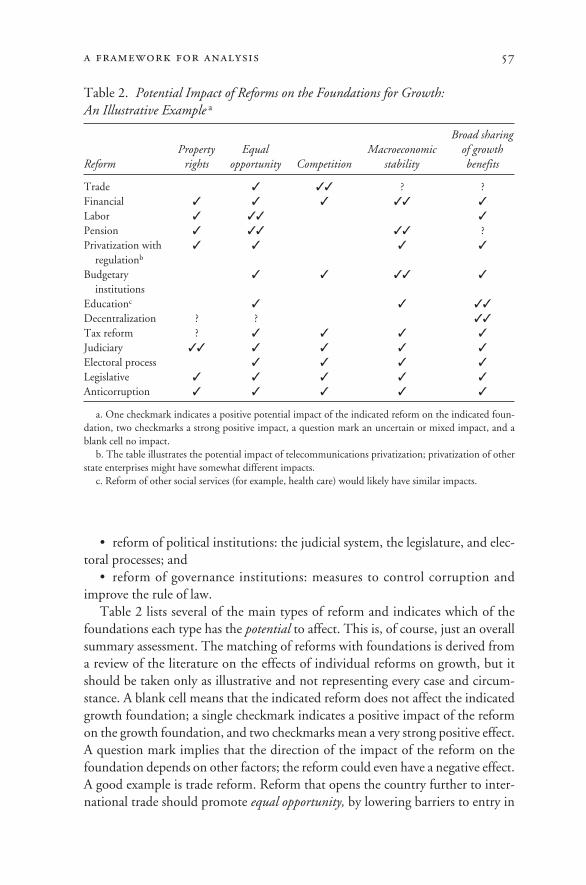
a framework for analysis 57
Table 2. Potential Impact of Reforms on the Foundations for Growth: An Illustrative Example a
Broad sharingProperty Equal Macroeconomic of growth
Reform rights opportunity Competition stability benefits
Trade ✓ ✓✓ ? ?Financial ✓ ✓ ✓ ✓✓ ✓
Labor ✓ ✓✓ ✓
Pension ✓ ✓✓ ✓✓ ?Privatization with ✓ ✓ ✓ ✓
regulationb
Budgetary ✓ ✓ ✓✓ ✓
institutionsEducationc ✓ ✓ ✓✓
Decentralization ? ? ✓✓
Tax reform ? ✓ ✓ ✓ ✓
Judiciary ✓✓ ✓ ✓ ✓ ✓
Electoral process ✓ ✓ ✓ ✓
Legislative ✓ ✓ ✓ ✓ ✓
Anticorruption ✓ ✓ ✓ ✓ ✓
a. One checkmark indicates a positive potential impact of the indicated reform on the indicated foun-dation, two checkmarks a strong positive impact, a question mark an uncertain or mixed impact, and ablank cell no impact.
b. The table illustrates the potential impact of telecommunications privatization; privatization of otherstate enterprises might have somewhat different impacts.
c. Reform of other social services (for example, health care) would likely have similar impacts.
• reform of political institutions: the judicial system, the legislature, and elec-toral processes; and
• reform of governance institutions: measures to control corruption andimprove the rule of law.
Table 2 lists several of the main types of reform and indicates which of thefoundations each type has the potential to affect. This is, of course, just an overallsummary assessment. The matching of reforms with foundations is derived froma review of the literature on the effects of individual reforms on growth, but itshould be taken only as illustrative and not representing every case and circum-stance. A blank cell means that the indicated reform does not affect the indicatedgrowth foundation; a single checkmark indicates a positive impact of the reformon the growth foundation, and two checkmarks mean a very strong positive effect.A question mark implies that the direction of the impact of the reform on thefoundation depends on other factors; the reform could even have a negative effect.A good example is trade reform. Reform that opens the country further to inter-national trade should promote equal opportunity, by lowering barriers to entry in
11630-02_CH02_rev2.qxd 6/2/09 4:36 PM Page 57
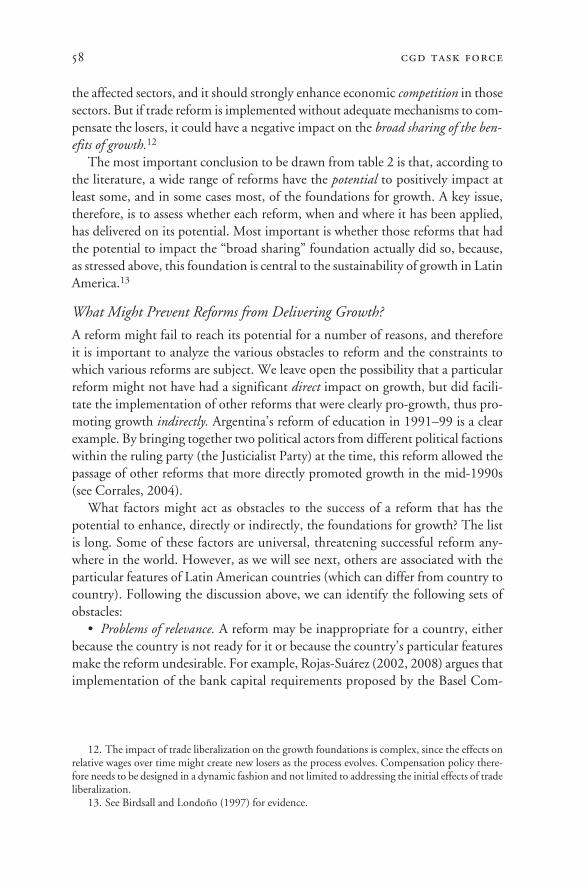
the affected sectors, and it should strongly enhance economic competition in thosesectors. But if trade reform is implemented without adequate mechanisms to com-pensate the losers, it could have a negative impact on the broad sharing of the ben-efits of growth.12
The most important conclusion to be drawn from table 2 is that, according tothe literature, a wide range of reforms have the potential to positively impact atleast some, and in some cases most, of the foundations for growth. A key issue,therefore, is to assess whether each reform, when and where it has been applied,has delivered on its potential. Most important is whether those reforms that hadthe potential to impact the “broad sharing” foundation actually did so, because,as stressed above, this foundation is central to the sustainability of growth in LatinAmerica.13
What Might Prevent Reforms from Delivering Growth?
A reform might fail to reach its potential for a number of reasons, and thereforeit is important to analyze the various obstacles to reform and the constraints towhich various reforms are subject. We leave open the possibility that a particularreform might not have had a significant direct impact on growth, but did facili-tate the implementation of other reforms that were clearly pro-growth, thus pro-moting growth indirectly. Argentina’s reform of education in 1991–99 is a clearexample. By bringing together two political actors from different political factionswithin the ruling party (the Justicialist Party) at the time, this reform allowed thepassage of other reforms that more directly promoted growth in the mid-1990s(see Corrales, 2004).
What factors might act as obstacles to the success of a reform that has thepotential to enhance, directly or indirectly, the foundations for growth? The listis long. Some of these factors are universal, threatening successful reform any-where in the world. However, as we will see next, others are associated with theparticular features of Latin American countries (which can differ from country tocountry). Following the discussion above, we can identify the following sets ofobstacles:
• Problems of relevance. A reform may be inappropriate for a country, eitherbecause the country is not ready for it or because the country’s particular featuresmake the reform undesirable. For example, Rojas-Suárez (2002, 2008) argues thatimplementation of the bank capital requirements proposed by the Basel Com-
58 cgd task force
12. The impact of trade liberalization on the growth foundations is complex, since the effects onrelative wages over time might create new losers as the process evolves. Compensation policy there-fore needs to be designed in a dynamic fashion and not limited to addressing the initial effects of tradeliberalization.
13. See Birdsall and Londoño (1997) for evidence.
11630-02_CH02_rev2.qxd 6/2/09 4:36 PM Page 58
mittee on Bank Supervision (the so-called Basel II requirements) would be inap-propriate for the Latin American region because, among other reasons, the riskassessment techniques proposed in Basel II would tend to intensify the procycli-cality of bank credit. This would increase the fragility of the countries’ financialsystems rather than reduce it as intended by Basel II.
• Problems of design. A reform may fail to properly align incentives with desiredoutcomes. In other words, even if the reform is intended to have a positive impacton one or several of the growth foundations, it might not create the correct incen-tives for this to occur. This could happen for a number of reasons:
• Technical inadequacies. The list of examples is quite long. A good illus-tration is the case of pension reform in Bolivia. This reform replaced an anti-quated, overly generous pay-as-you-go system with a very ungenerous, fullyfunded system, creating a strong incentive for workers (who could choosebetween the two systems) to retire under the old system. The huge fiscal expen-diture that resulted had a negative effect on the macroeconomic stability foun-dation. Peru’s pension reform provides another example: here increasingcoverage was not made part of the reform, which thus missed an opportunityto impact another foundation, the broader sharing of the benefits of growth(see Morón, 2006).
• Lack of needed sequencing. The experience with trade reform in severalLatin American countries provides examples of this common design problem.In most of these countries (Chile being a notable exception), the capitalaccount was liberalized simultaneously with the current account. In a contextof fixed exchange rates, this lack of proper sequencing resulted in a real appre-ciation, which eroded the potential gains from trade.14 Another classic exam-ple of inadequate sequencing in the region, first identified by Díaz-Alejandro(1985), is the liberalization of financial markets before an appropriate supervi-sory framework is put in place. A number of authors identify this problem asan important factor explaining the eruption of banking crises in Latin Amer-ica in the 1980s and 1990s (see, for example, Hausmann and Rojas-Suarez,1996).
• Lack of complementary reforms. This is another common problem in manycountries in Latin America. A good example here is the need for adequatebudgetary institutions to complement decentralization. As discussed in Wies-ner (2003) and Tanzi (1995), a number of decentralization efforts in the regionduring the 1990s generated only limited growth gains and instead contributedto fiscal instability.
• Lack of adequate adaptation. Sometimes a reform that has worked else-where (typically in industrial countries) has failed in Latin America because it
a framework for analysis 59
14. See, for example, Devlin, Ffrench-Davis, and Griffith-Jones (1995).
11630-02_CH02_rev2.qxd 6/2/09 4:36 PM Page 59
was not properly adapted to the particular features of Latin Americaneconomies. For example, the bank capital requirements suggested by the BaselCommittee call for banks to hold capital equivalent to at least 8 percent ofassets. This requirement usually works well in industrial countries, but the rec-ommended ratio might prove too low for the more risky financial environ-ments of Latin American countries.• Obstacles from local conditions. Even if a reform is correctly designed, at least
initially, features of the local environment may pose barriers to its appropriateimplementation or its effectiveness. These obstacles include
• Institutional constraints. For example, privatization might fail to delivergrowth if the agency in charge of regulating the privatized entities lacks suffi-cient power to promote and protect competition. Torero, Schroth, and Pasco-Font (2004) note that the privatization of telecommunications in Peru broughtabout important improvements for consumers in terms of coverage, quality,and price of the services. However, the telecommunications regulatory agencystill lacks authority over the licensing of operators or their rights to use spec-trum, as well as capacity to exercise merger control. These tools are essential topromoting competition in the sector, and their absence undermines the com-petition foundation.
• Adverse political dynamics, including lack of legitimacy of the reform. Thisconstraint relates to the demands of different segments of the population asthese express themselves through political interest groups. As was stated inbox 1, some of these demands are consistent with pro-growth reform. Others,however—most notably those calling for expropriation and trade protection—clearly run counter to strengthening the foundations of growth. For exam-ple, domestic protectionist interests in Brazil mobilized themselves moreeffectively than did the pro-liberalization forces and succeeded in preventingtrade reform (see Abreu, 2004). Expropriation directly violates the propertyrights foundation, and protectionism undermines both competition andequal opportunity.
• Insufficient implementation capacity. In many Latin American countriesthe public sector has too few personnel with the skills, especially managementskills, needed to implement reform effectively. Decentralization is one of thereforms most affected by this obstacle, because subnational governments areeven more prone than the central government to such skill shortages.15
• Inequality of income, assets, and education. Inequality was identified aboveas both an important constraint on implementing pro-growth reform or itscomponents and a threat to the effectiveness of reform once implemented. An
60 cgd task force
15. As discussed by Daughters and Harper (2007), lack of implementation capacity is one of themajor obstacles to successful decentralization in many Latin American countries.
11630-02_CH02_rev2.qxd 6/2/09 4:36 PM Page 60
example relevant to a number of countries in the region is the constraint oneffective bank supervision, and therefore on macroeconomic stability, derivedfrom the concentration of wealth. The concentration of assets in the hands ofa relatively few very wealthy individuals makes it easier for banks to engage inlending to insiders.16
These obstacles are not always independent of each other, but rather can interact.In some cases problems of design can reflect insufficient analysis or even bad advice,whereas in others the implementation of a poorly designed policy can be the resultof capture by particular political interests, or of institutional deficiencies.
How Can Constraints and Obstacles Be Overcome? Are There Alternative Initiatives?
Once the constraints and obstacles to reform have been identified, the questionthen becomes what to do about them. This is the core of the analysis presented inthe next five chapters. Just to provide a flavor of what is to come, here we providea few very succinct examples of proposals already found in the literature. Some areof general relevance, while others apply to individual country experiences.
Dealing with Problems of Design
• To hedge against external shocks in economies with liberalized trade systems,commodity exports can be taxed during boom periods and the proceeds used tofinance a special fund to counter excessive volatility and to finance incentives forlocal export diversification and innovation. The copper stabilization fund in Chileis considered a successful tool in this regard.17
• Since the specific recommendations of the Basel Committee for BankingSupervision are considered inappropriate for Latin America, at least in the shortrun, some have suggested that countries in the region implement ex ante loan-lossprovisions,18 as a mechanism to improve the quality of the banking system, andrely more on this supervisory tool than on capital requirements (Rojas-Suárez,2002, 2008).
• To reap the potential gains from decentralization, countries can design clearrules within the transfer system, with special emphasis on how the funds are dis-tributed among different regional and local governments.19
a framework for analysis 61
16. See De Juan (1996).17. Because economic stability is considered essential for decreasing poverty and inequality,
Birdsall et al. (2008) also include stabilization funds in their equity toolkit.18. Ex ante loan-loss provisions require that provisioning increase in good times. In bad times,
when nonperforming loans increase, the accumulated funds can be used to offset the weakening ofbank capital.
19. Daughters and Harper (2007) assess the quality of the transfer systems and other achieve-ments in the decentralization efforts of fourteen Latin American countries.
11630-02_CH02_rev2.qxd 6/2/09 4:36 PM Page 61
• To help deepen domestic capital markets so that they play a more centralrole in raising investment and economic growth, pension funds can be allowed tobroaden their investment base. One way to do this is through innovative finan-cial instruments that cater to the investment needs of Latin America, in a mannercompatible with investors’ demand for adequate returns and the safety of theirinvestments. For this purpose a variety of new instruments have been proposed bythe Latin American Shadow Financial Regulatory Committee (2005).
• Countries should not mimic the usual tax mix of industrial countries, butinstead take into account the importance of the informal sector. As an example,Artana (2004) proposes a specific tax structure for the case of the DominicanRepublic.
• The proper design of a fiscal budgetary institution requires introducingtransparency rules at the same time that fiscal rules are introduced. Filc andScartascini (2004) summarize progress at the country level in designing proce-dures and practices according to which fiscal budgets are drafted, discussed, andimplemented in the region.
Dealing with Obstacles Arising from Local Conditions
When confronted with an institutional or political constraint, the first-bestsolution is obviously to remove the constraint. But this might not be feasiblein the short run. Hence, the following recommendations fall in the category ofsecond-best arrangements:
• Countries can organize a process aimed at constructing a private-public sec-tor alliance to develop a consensus about long-term strategies that would result inboth private and public welfare gains. Examples are public-private partnershipsfor deepening financial systems, and strategies to support the private sector inovercoming obstacles for improved competitiveness.
• To overcome the constraints imposed by an inadequate judicial system onbank credit to small firms, countries can collect and disseminate informationthrough private credit bureaus. These and other proposals to improve access tofinancial services in Latin America are contained in Secretaría General Iberoamer-icana (2006).
• To reduce social exclusion from pension funds in Peru, the governmentcould introduce noncontributory pensions for older workers in extreme poverty.Although this would increase government spending, it should be considered as apreemptive measure to bolster the political sustainability of the pension reform(see Morón, 2006).
• To stimulate societal demand for education reform, evaluation results can beused in a transparent way both for teacher selection and for determining accept-ance to universities. In addition, to minimize bureaucratic resistance to producing,analyzing, and disseminating school tests, a dedicated unit could be created for thatpurpose that is independent of the ministry of education (see Corrales, 2004).
62 cgd task force
11630-02_CH02_rev2.qxd 6/2/09 4:36 PM Page 62
• International tax agreements can help overcome political resistance tochanges in the status quo. As Artana (2004) notes, in the Dominican Republic,trade liberalization under CAFTA (the Central American Free Trade Agreement)created an important fiscal loss that everyone involved (political parties, variousbusiness organizations) knew needed to be repaired.
• In Brazil, to reduce the incentives for politicians to use the courts as a toolto advance their political interests, increased use could be made of the ADC (AçãoDeclaratória de Constitucionalidade, or Direct Action of Constitutionality),which allows the Supreme Court to declare the constitutionality of normative lawsand acts, with binding effect over the lower courts (see Sousa, 2007).
Some Lessons from the Framework
The following parting thoughts summarize what the Task Force learned, in theprocess of designing the framework described in this chapter, about the linkagesbetween reforms and growth in Latin American countries:
• A most important conclusion is that the framework can indeed be a power-ful tool for designing and implementing pro-growth reforms. As the followingchapters will show, the application of the framework to specific country experi-ences yields a systematic identification of constraints and obstacles that have pre-vented reforms from maximizing their growth potential. The chapters show thatthe framework helped in generating country-specific recommendations to over-come these problems.
• In setting the stage for developing the framework, the Task Force concludedthat many social demands that could be read as opposing reforms could insteadbe seen as complementary to market-led growth (box 1). For example, pro-accessand pro-transparency movements call for less inequity and less corruption, bothof which positively affect long-term growth. The strength of these demands variesfrom country to country and needs to be taken into account when designingreforms. After all, some reforms, especially those dealing with institutions (suchas judicial reform), may find fertile ground for their appropriate implementationin countries with pro-growth social demands.
• The existing literature and the discussion in the following chapters showthat most of the reforms of the 1990s had the potential to positively affect thefoundations for growth. However, in many cases the reforms as actually imple-mented only weakly addressed the first-order problems that undermine growthin Latin American countries. In particular, as Birdsall et al. (2008) emphasize,the extreme inequality and widespread poverty in many of these countries,both of which are associated with educational shortfalls and the concentrationof resources in the hands of a few, received too little emphasis—the “broadsharing” foundation, essential for growth in Latin America, was not properlyaddressed. To put this in the language of property rights: the problem was not
a framework for analysis 63
11630-02_CH02_rev2.qxd 6/2/09 4:36 PM Page 63
how to improve average property rights or even marginal property rights, butrather how to improve the property rights, broadly construed, of people livingon the fringes of society.
• Instead, in most countries in the region, the emphasis was on designing andimplementing reforms that had proved effective in societies with much greateraccess and less poverty and inequality, such as in Western Europe and East Asia.In those societies, pushing for better functioning of the state, or even just lower-ing inflation and opening the economy to trade, created meaningful opportuni-ties (and higher real wages) for a broad cross section of society. In contrast, whensuch reforms were implemented in Latin America, the relatively well educated andpeople with significant initial resources gained, but the rest of society experiencedlittle or no increase in real earnings (although they did see some real improvementin access to health care, clean water, and decent housing). In other words, socialindicators converged, but incomes did not. This disparity of outcomes explainsmuch of the emerging reform fatigue and the potential (and in some places actual)backlash against reform.
• The underlying issues of inequality and poverty were not effectivelyaddressed, not because policymakers were unaware of the issues, but ratherbecause these are very hard problems given Latin America’s existing power struc-tures and economic and political institutions. These problems can be addressed,but the past fifty years have shown that progress on these fundamental issues isdifficult. It remains so today, although, as stated above, support for improvingequity is perhaps stronger than in the past. Countries are trying to improve equityin different ways. In some, expropriation and unilateral repudiation of contractsare likely to undermine property rights and make growth less likely, and a returnto greater state control of the economy is unlikely to produce sustainable growth.In other countries, however, the potential for organized, market-based efforts forbroadening opportunities has started to develop.
• Some lessons from other emerging markets can be encouraging for LatinAmerica. Growth per se does not necessarily lead to better institutions. But growthof the kind seen in parts of Asia has generally created the kind of constituenciesthat favor further reform. Institutional change has come about, in large part,because broad-based homegrown groups have flourished, and because they havedemanded better protection, greater access, and other institutional improvements,which in turn feed back to sustain growth.
• As the country case studies in the next five chapters will show, problems ofdesign sometimes weakened the capacity of reforms to affect the foundationsfor growth. These problems reflected a combination of technical inadequacies,sequencing problems, and lack of necessary complementary reforms. But the TaskForce believes that the more important problems facing reform had to do withinstitutional and political obstacles. In some cases the main problem was politicalcapture of some key institutions; in others, the force of certain special interests was
64 cgd task force
11630-02_CH02_rev2.qxd 6/2/09 4:36 PM Page 64
the stumbling block; in still others, extreme inequality emerged as a major obsta-cle. Lack of capacity to carry through the needed actions also seems to have playeda crucial role.
• The country studies will also show the importance of complementaritybetween reforms. For example, many reforms failed to realize their growth poten-tial partly because of deficiencies in the judicial system.
• Although the Task Force emphasizes the importance of country-level dif-ferences for the design and implementation of policies, it is necessary to con-tinue examining lessons from other parts of the world for their relevance toLatin America. One such lesson is that emerging Asia has made substantialprogress since 1960 using a strategy of promoting manufactured exports to cre-ate new constituencies for further reform. The middle-income countries thathave acceded to the European Union—such as Portugal and Spain in the1980s—have made similar progress starting from higher levels of income thanthose in Asia, and thus their experience may prove more relevant to LatinAmerica.
References
Abiad, Abdul, and Ashoka Mody. 2003. “Financial Reform: What Shakes It? What Shapes It?”IMF Working Paper WP/03/70. Washington: International Monetary Fund.
Abreu, Marcelo de Paiva. 2004. “Trade Liberalization and the Political Economy of Protectionin Brazil since 1987.” Special Initiative on Trade and Integration, INTAL-ITD WorkingPaper. Washington: Inter-American Development Bank.
Acemoglu, Daron, and James Robinson. 2006. Economic Origins of Democracy and Dictatorship.Cambridge University Press.
Artana, Daniel. 2004. “República Dominicana: Análisis del Proyecto de Reforma Tributaria.”Chemonics-AID (July).
Bai, Jushan, and Pierre Perron. 1998. “Estimating and Testing Linear Models with MultipleStructural Changes.” Econometrica 66, no. 1 (January): 47–78.
———. 2003. “Computation and Analysis of Multiple Structural Change Models.” Journal ofApplied Econometrics 18: 1–22.
Barro, Robert J., and Jong-Wha Lee. 2000. “International Data on Educational Attainment:Updates and Implications.” CID Working Paper 42. Cambridge, Mass.: Center for InternationalDevelopment at Harvard University.
Beck, Thorsten, Asli Demirgüç-Kunt, and Maria Soledad Martinez Peria. 2006. “ReachingOut: Access to and Use of Banking Services across Countries.” Policy Research WorkingPaper WPS3754. Washington: World Bank (October).
Behrman, Jere, Nancy Birdsall, and Gunilla Pettersson. 2008. “Schooling Inequality and Finan-cial Reform in Latin America.” Center for Global Development, Washington.
Berg, Andrew, Jonathan D. Ostry, Marcos Souto, and Jeromin Zettelmeyer. 2006. “Estimat-ing Multiple Structural Breaks on GDP Growth Series.” International Monetary Fund,Washington.
Birdsall, Nancy, and Juan Luis Londoño. 1997. “Asset Inequality Matters: An Assessment ofthe World Bank’s Approach to Poverty Reduction.” American Economic Review Papers andProceedings 87, no. 2: 32–37.
a framework for analysis 65
11630-02_CH02_rev2.qxd 6/2/09 4:36 PM Page 65
Birdsall, Nancy, Augusto de la Torre, and Rachel Menezes. 2008. Fair Growth: Economic Poli-cies for Latin America’s Poor and Middle-Income Majority. Washington: Center for GlobalDevelopment and Inter-American Dialogue.
Bordo, Michael, Barry Eichengreen, Daniella Klingebiel, and Maria Soledad Martinez-Peria.2001. “Is the Crisis Problem Growing More Severe?” Economic Policy 32: 51–82.
Converse, Nathan, and Ethan Kapstein. 2006. “The Economics of Young Democracies: Poli-cies and Performance.” Working Paper 85. Washington: Center for Global Development(March).
Corrales, Javier. 2004. “Multiple Preferences, Variable Strengths: The Politics of EducationReform in Argentina.” In Joan Nelson and Robert Kaufman, eds., Crucial Needs, WeakIncentives: Social Sector Reform, Democratization, and Globalization in Latin America.Woodrow Wilson Center Press and Johns Hopkins University Press.
Daughters, Robert, and Leslie Harper. 2007. “Fiscal and Political Decentralization Reforms.”In Eduardo Lora, ed., The State of State Reform in Latin America. Inter-American Develop-ment Bank and Stanford University Press.
De Juan, Aristóbulo. 1996. “The Roots of Banking Crises: Microeconomic Issues and Super-vision and Regulation.” In Ricardo Hausmann and Liliana Rojas-Suarez, eds., Banking Crisesin Latin America. Washington: Inter-American Development Bank.
Devlin, Robert, Ricardo Ffrench-Davis, and Stephanie Griffith-Jones. 1995. “Surges in CapitalFlows and Development: An Overview of Policy Issues.” In R. Ffrench Davis and S. Griffith-Jones, eds., Coping with Capital Surges: The Return of Finance to Latin America. Boulder, Colo.:Lynne Rienner Publishers.
Díaz-Alejandro, Carlos. 1985. “Good-Bye Financial Repression, Hello Financial Crash.” Jour-nal of Development Economics 19, nos. 1–2 (September–October): 1–24.
Edwards, Sebastian. 1995. Crisis and Reform in Latin America: From Despair to Hope. OxfordUniversity Press.
Engerman, Stanley L., and Kenneth L. Sokoloff. 2002. “Factor Endowments, Inequality andPaths of Development among New World Economies.” Working Paper 9259. Cambridge,Mass.: National Bureau of Economic Research.
Filc, Gabriel, and Carlos Scartascini. 2004. “Budget Institutions and Fiscal Outcomes: TenYears of Inquiry on Fiscal Matters at the Research Department.” Inter-American Develop-ment Bank, Washington.
Galiani, Sebastián, Paul Gertler, and Ernesto Schargrodsky. 2005. “Water for Life: The Impactof the Privatization of Water Services on Child Mortality.” Journal of Political Economy 113,no. 1: 83–120.
Hausmann, Ricardo, and Liliana Rojas-Suárez, eds. 1996. Banking Crises in Latin America.Washington: Inter-American Development Bank.
Jones, Benjamin, and Benjamin Olken. 2005. “The Anatomy of Start-Stop Growth.” Work-ing Paper 11753. Cambridge, Mass.: National Bureau of Economic Research.
Latin American Shadow Financial Regulatory Committee. 2005. “Putting Pension Funds toWork in Latin America: New Financial Instruments to Help Deepen Financial Markets.”Statement no. 13 (July 14).
Lora, Eduardo. 2001. “Structural Reforms in Latin America: What Has Been Reformed andHow to Measure It.” IADB Research Department Working Paper 466. Washington: Inter-American Development Bank.
———. 2007. The State of State Reform in Latin America. Inter-American Development Bankand Stanford University Press.
Lora, Eduardo, and Ugo Panizza. 2002. “Structural Reforms in Latin America under Scrutiny.”IADB Research Department Working Paper 470. Washington: Inter-American DevelopmentBank.
66 cgd task force
11630-02_CH02_rev2.qxd 6/2/09 4:36 PM Page 66
Morón, Eduardo. 2006. “La Reforma Previsional Pendiente en el Perú.” Universidad del Pacífico.Rodrik, Dani. 1996. “Understanding Economic Policy Reform.” Journal of Economic Litera-
ture 34, no. 1: 9–41.Rojas-Suárez, Liliana. 2002. “Can International Capital Standards Strengthen the Soundness
of Banks in Emerging Markets?” Capco Institute Journal of Financial Transformation (July):51–63.
———. 2008. “Domestic Financial Regulations in Developing Countries: Can They Effec-tively Limit the Impact of Capital Account Volatility”? In Joseph Stiglitz and J. A. Ocampo,eds., Capital Market Liberalization and Development. Oxford University Press.
Secretaría General Iberoamericana (SEGIB). 2006. “La Extensión del Crédito y los ServiciosFinancieros: Obstáculos, Propuestas y Buenas Prácticas.” Madrid (September).
Sousa, Mariana. 2007. “A Brief Overview of Judicial Reform in Latin America: Objectives,Challenges and Accomplishments.” In Eduardo Lora, ed., The State of State Reform in LatinAmerica. Inter-American Development Bank and Stanford University Press.
Tanzi, Vito. 1995. “Fiscal Federalism and Decentralization: A Review of Some Efficiency andMacroeconomic Aspects.” In Michael Bruno and Boris Pleskovic, eds., Annual World BankConference on Development Economics. Washington: World Bank.
Thomas, Vinod, Yan Wang, and Xibo Fan. 2001. “Measuring Education Inequality: GiniCoefficients of Education for 140 Countries, 1960–2000.” Journal of Education Planningand Administration 17, no. 1: 5–33.
Torero, Máximo, Enrique Schroth, and Alberto Pasco-Font. 2004. “The Impact of Telecom-munications Privatization in Peru on the Welfare of Urban Consumers.” Economía 4: 91.
Wiesner, E. 2003. Fiscal Federalism in Latin America: From Entitlements to Markets. Washing-ton: Inter-American Development Bank.
Zettelmeyer, Jeromin. 2006. “Growth and Reforms in Latin America: A Survey of Facts andArguments.” IMF Working Paper WP/06/210. Washington: International Monetary Fund(September).
a framework for analysis 67
11630-02_CH02_rev2.qxd 6/2/09 4:36 PM Page 67
68
This chapter is motivated by a riddle: why, after implementing so manyreforms over the last quarter century, has Brazil fared so poorly at accelerat-
ing economic growth? There are two possible answers. The first is that the reformswere well chosen and well targeted but faced serious obstacles in meeting thegrowth objective. They may have been poorly implemented or incomplete, per-haps because of problems of design (poor sequencing or lack of complementaryreforms, for instance), or because they were sidetracked by problems not initiallyforeseen or that emerged during, or were even caused by, the reform process itself.This explanation fits the facts in Brazil’s case: the process of market-orientedreform did face implementation problems, for example in the regulation of infra-structure, and it does remain incomplete in several areas, from education to judi-cial reform.
The other explanation hinges on the reforms themselves: although pursuedforcefully, they may have targeted the wrong foundations, failing to address thosethat were actually constraining growth. This may have occurred, for instance, ifthe reforms were selected to foster goals other than accelerating growth. Thisdescription, too, fits the Brazilian case, not so much because the reforms as a whole
Pro- and Anti-Market Reforms in Democratic Brazilarmando castelar pinheiro, regis bonelli, and samuel de abreu pessôa
3
We thank Liliana Rojas-Suarez, John Williamson, José De Gregorio, and other participants atCGD’s “Helping Reforms Deliver Growth in Latin America” workshop for helpful comments on anearlier version of this paper. A longer version of this paper including a technical annex and a list ofacronyms is available on CGD’s website, www.cgdev.org.
11630-03_CH03_rev2.qxd 6/2/09 4:02 PM Page 68
aimed at the wrong foundations, but rather because several of the reforms weremore concerned with distribution than with growth, while others did seek to fos-ter growth but did not do so in a market-oriented way. More important, thereforms that pursued these other goals were not neutral with respect to growth butactually compromised the foundations for growth. In short, even as policymakerswere, with one hand, fighting inflation, opening the economy, eliminating restric-tions on business practices, and privatizing, with the other hand they were activelypursuing what we call anti-market reforms: changes in legal norms and policiesthat discouraged investment and productivity growth. These reforms seriouslyweakened the link between market-oriented reform and growth. As a result, thereforms as a whole, while reducing the burden of regulation, at the same timeenhanced the role of the state in directly allocating resources, by expanding pub-lic expenditure, and weakened property rights.
One can point to several examples of this parallel reform agenda. The 1988constitution sought to enhance political competition and equality of opportunity,but it also contained some clearly nationalist and statist provisions: it establishedpublic monopolies in telecommunications, oil, and the distribution of natural gas;created barriers to foreign ownership in mining and electricity; and reduced con-tract flexibility in labor markets. In addition, the stabilization plans of the 1980sand 1990s relied on price freezes that breached financial contracts and, in the caseof the 1990 plan, blatantly disregarded property rights. More recently, a large pri-mary fiscal surplus contributed to stabilizing the public debt-GDP ratio, but itcoexisted with a huge expansion in taxes and current expenditure. Income trans-fer programs helped spread the benefits of growth, but these were structured insuch a way that they discouraged participation in the social security system. Amore independent judiciary increased protection against arbitrary governmentdecisions, but, by pursuing distributive goals rather than imposing the rule of law,judges have often weakened contract and property rights.
We regard the expansion in public expenditure, the change in its composition(a decline in public investment and a rise in current outlays), and the concomi-tant increase in the tax burden as the most harmful of Brazil’s anti-market reforms,because of the consequences for macroeconomic stability. Looking forward, pri-ority should be given to a fiscal reform aimed at reducing current expenditure andthe tax burden, while creating the fiscal space needed for an increase in publicinfrastructure investment. Implementation of such a reform will require overcom-ing political barriers of various sorts. Part of the rise in current public spendingstemmed from new obligations enshrined in the 1988 constitution or created inthe following years, which were perceived as necessary for securing citizenshiprights and the stability of democratic institutions. The new constitution alsoended twenty years of fiscal centralism, eventually causing a major expansion instate and municipal revenue and fiscal spending that will be hard to reverse, giventhat political support for spending reduction is weak.
brazil 69
11630-03_CH03_rev2.qxd 6/2/09 4:02 PM Page 69
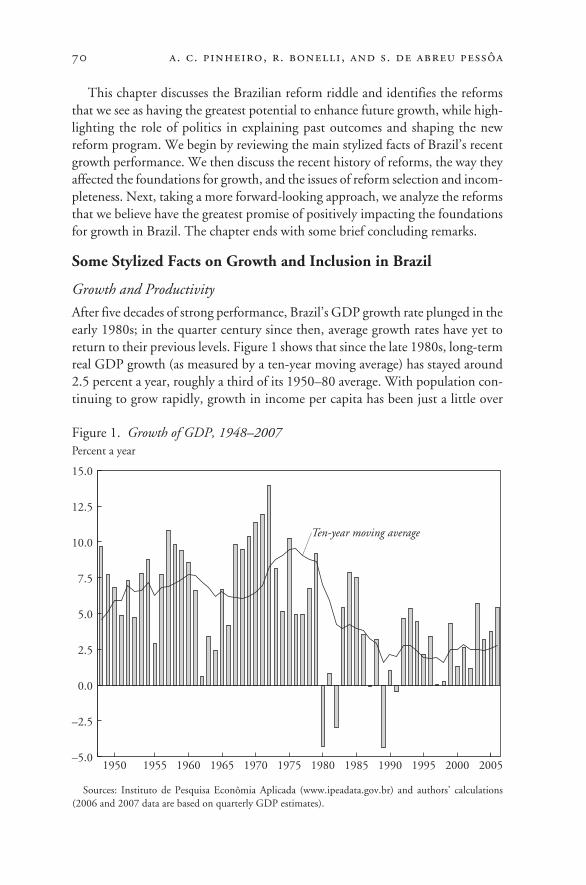
This chapter discusses the Brazilian reform riddle and identifies the reformsthat we see as having the greatest potential to enhance future growth, while high-lighting the role of politics in explaining past outcomes and shaping the newreform program. We begin by reviewing the main stylized facts of Brazil’s recentgrowth performance. We then discuss the recent history of reforms, the way theyaffected the foundations for growth, and the issues of reform selection and incom-pleteness. Next, taking a more forward-looking approach, we analyze the reformsthat we believe have the greatest promise of positively impacting the foundationsfor growth in Brazil. The chapter ends with some brief concluding remarks.
Some Stylized Facts on Growth and Inclusion in Brazil
Growth and Productivity
After five decades of strong performance, Brazil’s GDP growth rate plunged in theearly 1980s; in the quarter century since then, average growth rates have yet toreturn to their previous levels. Figure 1 shows that since the late 1980s, long-termreal GDP growth (as measured by a ten-year moving average) has stayed around2.5 percent a year, roughly a third of its 1950–80 average. With population con-tinuing to grow rapidly, growth in income per capita has been just a little over
70 a. c. pinheiro, r. bonelli, and s. de abreu pessôa
Sources: Instituto de Pesquisa Econômia Aplicada (www.ipeadata.gov.br) and authors’ calculations (2006 and 2007 data are based on quarterly GDP estimates).
Percent a year
Ten-year moving average
1950 1960 1970 1980 20051955 1965 1975 2000199519901985–5.0
–2.5
0.0
2.5
5.0
7.5
10.0
12.5
15.0
Figure 1. Growth of GDP, 1948–2007
11630-03_CH03_rev2.qxd 6/2/09 4:02 PM Page 70
1 percent a year. Having outperformed most other Latin American countries fromthe 1950s through the 1970s, Brazil has been performing below average sincethen. In particular, Brazil has been comparatively unsuccessful in exploiting theexceptionally favorable external conditions—including strong demand for certaincommodities produced by Brazil, as well as low international interest rates—thatcharacterized the mid-2000s.
This comparison highlights the contrasts among three main subperiods since1950. The first, from 1950 to 1980, was marked by rapid output growth, withBrazil outpacing other countries in the region, which nonetheless also did well.The second, from 1981 to 1994, combined a sharp deceleration in growth withpoor performance on other macroeconomic indicators, particularly inflation,which was very high. This subperiod was also marked by a less favorable externalenvironment, which led to a contraction in growth throughout the region, withfew exceptions. The most recent subperiod, 1995–2007, encompasses the post-stabilization years, which were marked by low inflation and a more open and lessregulated economy, not only in Brazil but also in most other Latin Americancountries.
The mediocre economic record in this last period suggests that either the struc-tural reforms implemented in the 1990s had only a limited impact on GDPgrowth, or other factors hampered their effect. What might have hindered Brazil’sgrowth? Apparently not a lack of demand. Indeed, whenever economic activityhas accelerated in recent years, price pressures forced a deceleration in the follow-ing years, suggesting that the economy had been operating at close to full capac-ity. This would imply that Brazil’s inability to grow more rapidly has been due tosupply constraints. Which of these were most critical? We examine this questionby applying a supply-side, Solow-type decomposition to GDP growth in each ofthe three subperiods, assuming a Cobb-Douglas function:
where yt, kt, At, and ht are, respectively, GDP per worker, the capital-labor ratio,total factor productivity (TFP), and average labor force schooling at time t. (Seethe longer version of this chapter on the CGD website for more detail on thedecomposition.)
Table 1 shows that the rapid GDP growth of 1951–80 reflected a combina-tion of rising employment and a substantial increase in labor productivity. Inturn, roughly two-thirds of the latter was generated by the increment in the econ-omy’s capital-labor ratio, with almost all the remainder stemming from TFPgrowth. Remarkably, human capital accumulation contributed virtually nothingto the expansion of output during this high-growth period. Most of the growth
H h ht t t= ( )[ ] =−
⎡⎣⎢
⎤⎦⎥
−exp exp ,φ ηψ
ψ1
1
y A k Ht t t t= −α α1
brazil 71
11630-03_CH03_rev2.qxd 6/2/09 4:02 PM Page 71
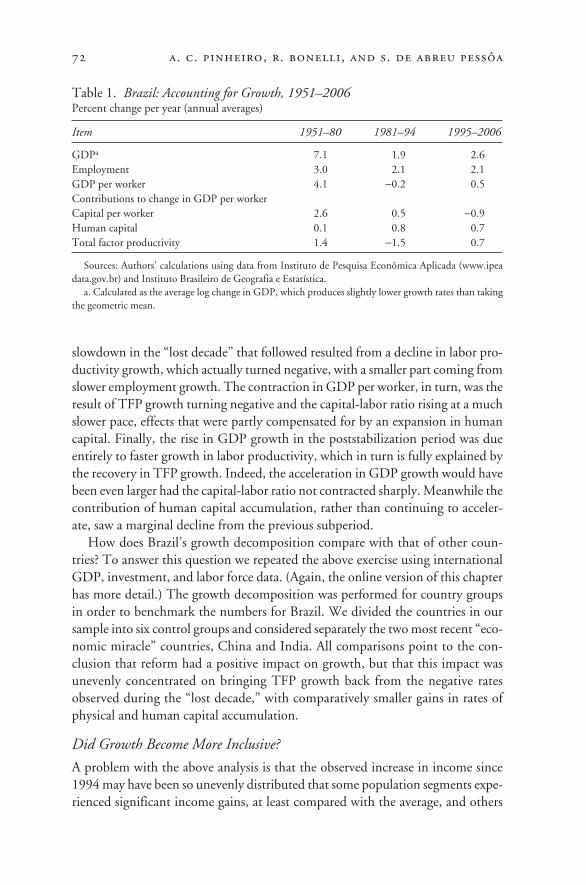
72 a. c. pinheiro, r. bonelli, and s. de abreu pessôa
slowdown in the “lost decade” that followed resulted from a decline in labor pro-ductivity growth, which actually turned negative, with a smaller part coming fromslower employment growth. The contraction in GDP per worker, in turn, was theresult of TFP growth turning negative and the capital-labor ratio rising at a muchslower pace, effects that were partly compensated for by an expansion in humancapital. Finally, the rise in GDP growth in the poststabilization period was dueentirely to faster growth in labor productivity, which in turn is fully explained bythe recovery in TFP growth. Indeed, the acceleration in GDP growth would havebeen even larger had the capital-labor ratio not contracted sharply. Meanwhile thecontribution of human capital accumulation, rather than continuing to acceler-ate, saw a marginal decline from the previous subperiod.
How does Brazil’s growth decomposition compare with that of other coun-tries? To answer this question we repeated the above exercise using internationalGDP, investment, and labor force data. (Again, the online version of this chapterhas more detail.) The growth decomposition was performed for country groupsin order to benchmark the numbers for Brazil. We divided the countries in oursample into six control groups and considered separately the two most recent “eco-nomic miracle” countries, China and India. All comparisons point to the con-clusion that reform had a positive impact on growth, but that this impact wasunevenly concentrated on bringing TFP growth back from the negative ratesobserved during the “lost decade,” with comparatively smaller gains in rates ofphysical and human capital accumulation.
Did Growth Become More Inclusive?
A problem with the above analysis is that the observed increase in income since1994 may have been so unevenly distributed that some population segments expe-rienced significant income gains, at least compared with the average, and others
Table 1. Brazil: Accounting for Growth, 1951–2006Percent change per year (annual averages)
Item 1951–80 1981–94 1995–2006
GDPa 7.1 1.9 2.6Employment 3.0 2.1 2.1GDP per worker 4.1 −0.2 0.5Contributions to change in GDP per workerCapital per worker 2.6 0.5 −0.9Human capital 0.1 0.8 0.7Total factor productivity 1.4 −1.5 0.7
Sources: Authors’ calculations using data from Instituto de Pesquisa Econômica Aplicada (www.ipeadata.gov.br) and Instituto Brasileiro de Geografia e Estatística.
a. Calculated as the average log change in GDP, which produces slightly lower growth rates than takingthe geometric mean.
11630-03_CH03_rev2.qxd 6/2/09 4:02 PM Page 72
none. Determining whether this is in fact the case becomes especially importantgiven that some reforms in Brazil aimed not at accelerating growth, but preciselyat improving the income distribution or reducing poverty. Thus an importantquestion is whether growth in the postreform period, although slow, was at leastmore equitable than before.
The prereform period can fairly be characterized as anti-poor: from 1960 to1990 the share of total income accruing to the poorest half of the populationdeclined by 6 percentage points, while the share going to the richest 20 percentincreased by 11 percentage points (Barros and Mendonça, 1995). In the yearsthat followed, however, growth was clearly pro-poor: the share of the poorest halfin total income rose from 11.5 percent in 1990 to 14.0 percent in 2005. Mean-while the proportion of households living in poverty dropped from 36 percentto 23 percent, and the Gini coefficient, a standard measure of inequality, fellfrom 0.61 to 0.57.
Growth also became more inclusive over time, being especially pro-poor in2001–05, even though household income per capita grew by only 2.5 percent ayear. This highlights the fact that greater inclusiveness resulted mainly from theimprovement in income distribution, as revealed by the decline in the Gini coef-ficient from 0.60 to 0.57. Depending on the indicator adopted, between 70 and90 percent of the reduction in poverty can be attributed to improvement in theincome distribution. Barros et al. (2007) analyze the factors responsible for thisdrop in inequality and conclude that it resulted in equal measure from increasesin labor and in nonlabor income. This contrasts with the finding of Kakwani,Neri, and Son (2006) of a large increase in nonlabor income, with the rise in laborincome playing a subsidiary role.1
A problem with the above results is that changes in the income per capita ofdifferent groups in society may have been measured incorrectly. The poor and thenonpoor have different consumption baskets, and therefore using a single con-sumer price index to deflate changes in nominal income for all households maybias the results. This problem becomes particularly important following the kindof reforms adopted in Brazil, notably trade liberalization, which not onlyexpanded access to a broader set of goods but also produced large swings in rela-tive prices, including those of foodstuffs. Carvalho Filho and Chamon (2006) tryto account for this by looking directly at household food expenditure in the 1990s:they find that this category of spending fell at all income levels. Assuming that theshare of food in total expenditure varies according to Engel’s Law, they concludethat the increase in mean household income must have been much larger than thatrecorded by the national household surveys and the national accounts. The over-
brazil 73
1. This difference stems in part from the fact that Barros et al. used the Gini coefficient, whichattributes greater weight to the middle of the distribution than the social welfare function used byKakwani et al., which “mixes” the Gini and Theil indices.
11630-03_CH03_rev2.qxd 6/2/09 4:02 PM Page 73
statement of consumer price inflation and the consequent underestimation ofincome growth resulted from the introduction of new products in the consump-tion basket and from the substitution effect stemming from relative price changesand were particularly strong for the lower income deciles.2
However, there are reasons for concern looking forward. For one thing, asnoted by Carvalho Filho and Chamon (2006), the gains stemming from relativeprice changes are one-time gains that will not be repeated. For another, reformdoes not seem to have increased Brazil’s historically low elasticity of poverty withrespect to average income: Ferreira, Leite, and Ravallion (2007) estimate this elas-ticity to be 1.09, about half the value obtained in the literature for the averagedeveloping country. Our own results, summarized in table 2, confirm that find-ing. We added data for 2005 and 2006 to Ferreira et al.’s dataset and estimatedthe following equation with household data:
where Ht is the share of the poor in total population, yt is average family income,and Gt is the Gini coefficient. The estimated coefficient on average family incomeis somewhat lower than 1 in absolute value, and that on the Gini is about 2. Adummy for the period 1994–2006, interacted with ln(yt /yt−1), yielded insignifi-cant results, which we interpret to mean that, despite recent improvements, thereis no statistically significant evidence of an increase in Brazil’s growth elasticity ofpoverty.
A final reason for concern is that social spending in Brazil, although high, ismostly neutral in distributive terms. Thus, although the income distribution hasimproved since the mid-1990s, the large rise in current public spending explainsa comparatively limited share of this gain, and that only recently, when better-targeted programs were implemented. One reason is that the new spending addedto rather than substituted for already existing programs, so that public subsidiesto well-off families, notably through the social security system, were kept in placeand in some cases even increased. Although monetary transfers other than pen-sions account for an important share of gross income among households in thebottom quintile of the household income distribution, they account for a rela-tively small part of total public social spending.
The other main reason why growth in public spending contributed relativelylittle to improving the income distribution is that it was financed mainly by an
ln ln ln , ( )H
H
y
y
G
Gt
t
t
t
t
tt
− − −= + + +
10 1
12
1
1β β β ε
74 a. c. pinheiro, r. bonelli, and s. de abreu pessôa
2. This result is not surprising when one considers more closely the specific changes introducedin the 1990s. Reforms in this period focused on disassembling much of the policy apparatus inher-ited from the postwar era, one important feature of which was a strong anti-poor bias, partly stem-ming from adverse relative prices. In this way, the observed welfare gain over the 1990s can beinterpreted as partly the result of the unwinding of previous noninclusive policies.
11630-03_CH03_rev2.qxd 6/2/09 4:02 PM Page 74
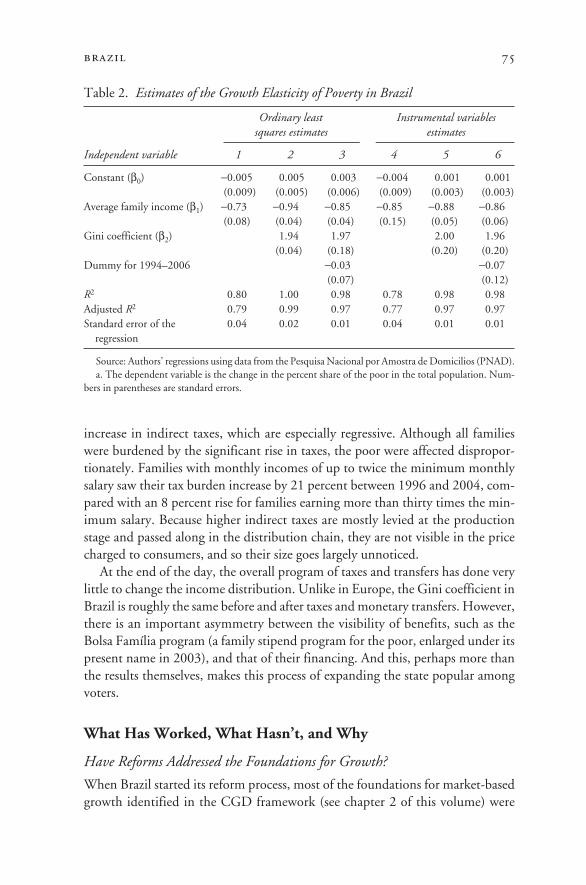
increase in indirect taxes, which are especially regressive. Although all familieswere burdened by the significant rise in taxes, the poor were affected dispropor-tionately. Families with monthly incomes of up to twice the minimum monthlysalary saw their tax burden increase by 21 percent between 1996 and 2004, com-pared with an 8 percent rise for families earning more than thirty times the min-imum salary. Because higher indirect taxes are mostly levied at the productionstage and passed along in the distribution chain, they are not visible in the pricecharged to consumers, and so their size goes largely unnoticed.
At the end of the day, the overall program of taxes and transfers has done verylittle to change the income distribution. Unlike in Europe, the Gini coefficient inBrazil is roughly the same before and after taxes and monetary transfers. However,there is an important asymmetry between the visibility of benefits, such as theBolsa Família program (a family stipend program for the poor, enlarged under itspresent name in 2003), and that of their financing. And this, perhaps more thanthe results themselves, makes this process of expanding the state popular amongvoters.
What Has Worked, What Hasn’t, and Why
Have Reforms Addressed the Foundations for Growth?
When Brazil started its reform process, most of the foundations for market-basedgrowth identified in the CGD framework (see chapter 2 of this volume) were
brazil 75
Table 2. Estimates of the Growth Elasticity of Poverty in Brazil
Ordinary least Instrumental variables squares estimates estimates
Independent variable 1 2 3 4 5 6
Constant (β0) −0.005 0.005 0.003 −0.004 0.001 0.001(0.009) (0.005) (0.006) (0.009) (0.003) (0.003)
Average family income (β1) −0.73 −0.94 −0.85 −0.85 −0.88 −0.86(0.08) (0.04) (0.04) (0.15) (0.05) (0.06)
Gini coefficient (β2) 1.94 1.97 2.00 1.96(0.04) (0.18) (0.20) (0.20)
Dummy for 1994–2006 −0.03 −0.07(0.07) (0.12)
R2 0.80 1.00 0.98 0.78 0.98 0.98Adjusted R2 0.79 0.99 0.97 0.77 0.97 0.97Standard error of the 0.04 0.02 0.01 0.04 0.01 0.01
regression
Source: Authors’ regressions using data from the Pesquisa Nacional por Amostra de Domicilios (PNAD).a. The dependent variable is the change in the percent share of the poor in the total population. Num-
bers in parentheses are standard errors.
11630-03_CH03_rev2.qxd 6/2/09 4:02 PM Page 75
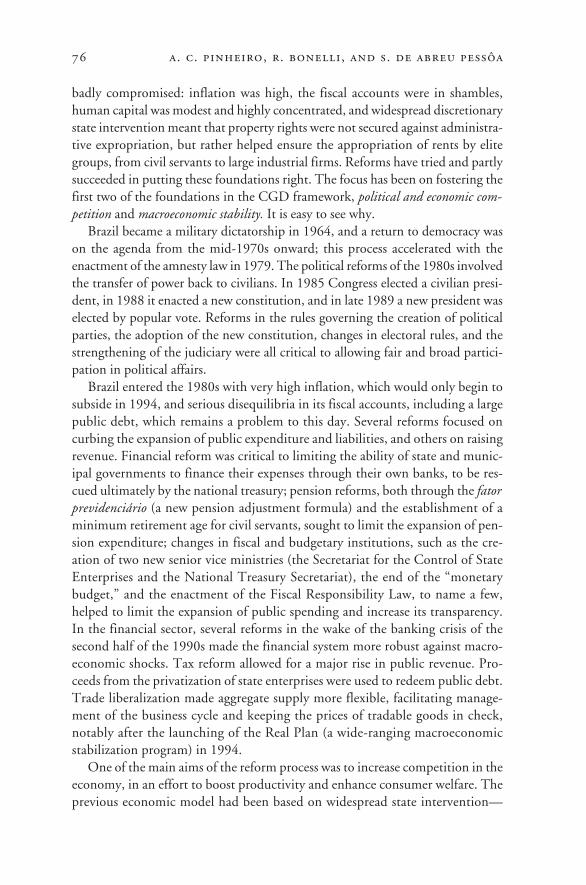
badly compromised: inflation was high, the fiscal accounts were in shambles,human capital was modest and highly concentrated, and widespread discretionarystate intervention meant that property rights were not secured against administra-tive expropriation, but rather helped ensure the appropriation of rents by elitegroups, from civil servants to large industrial firms. Reforms have tried and partlysucceeded in putting these foundations right. The focus has been on fostering thefirst two of the foundations in the CGD framework, political and economic com-petition and macroeconomic stability. It is easy to see why.
Brazil became a military dictatorship in 1964, and a return to democracy wason the agenda from the mid-1970s onward; this process accelerated with theenactment of the amnesty law in 1979. The political reforms of the 1980s involvedthe transfer of power back to civilians. In 1985 Congress elected a civilian presi-dent, in 1988 it enacted a new constitution, and in late 1989 a new president waselected by popular vote. Reforms in the rules governing the creation of politicalparties, the adoption of the new constitution, changes in electoral rules, and thestrengthening of the judiciary were all critical to allowing fair and broad partici-pation in political affairs.
Brazil entered the 1980s with very high inflation, which would only begin tosubside in 1994, and serious disequilibria in its fiscal accounts, including a largepublic debt, which remains a problem to this day. Several reforms focused oncurbing the expansion of public expenditure and liabilities, and others on raisingrevenue. Financial reform was critical to limiting the ability of state and munic-ipal governments to finance their expenses through their own banks, to be res-cued ultimately by the national treasury; pension reforms, both through the fatorprevidenciário (a new pension adjustment formula) and the establishment of aminimum retirement age for civil servants, sought to limit the expansion of pen-sion expenditure; changes in fiscal and budgetary institutions, such as the cre-ation of two new senior vice ministries (the Secretariat for the Control of StateEnterprises and the National Treasury Secretariat), the end of the “monetarybudget,” and the enactment of the Fiscal Responsibility Law, to name a few,helped to limit the expansion of public spending and increase its transparency.In the financial sector, several reforms in the wake of the banking crisis of thesecond half of the 1990s made the financial system more robust against macro-economic shocks. Tax reform allowed for a major rise in public revenue. Pro-ceeds from the privatization of state enterprises were used to redeem public debt.Trade liberalization made aggregate supply more flexible, facilitating manage-ment of the business cycle and keeping the prices of tradable goods in check,notably after the launching of the Real Plan (a wide-ranging macroeconomicstabilization program) in 1994.
One of the main aims of the reform process was to increase competition in theeconomy, in an effort to boost productivity and enhance consumer welfare. Theprevious economic model had been based on widespread state intervention—
76 a. c. pinheiro, r. bonelli, and s. de abreu pessôa
11630-03_CH03_rev2.qxd 6/2/09 4:02 PM Page 76
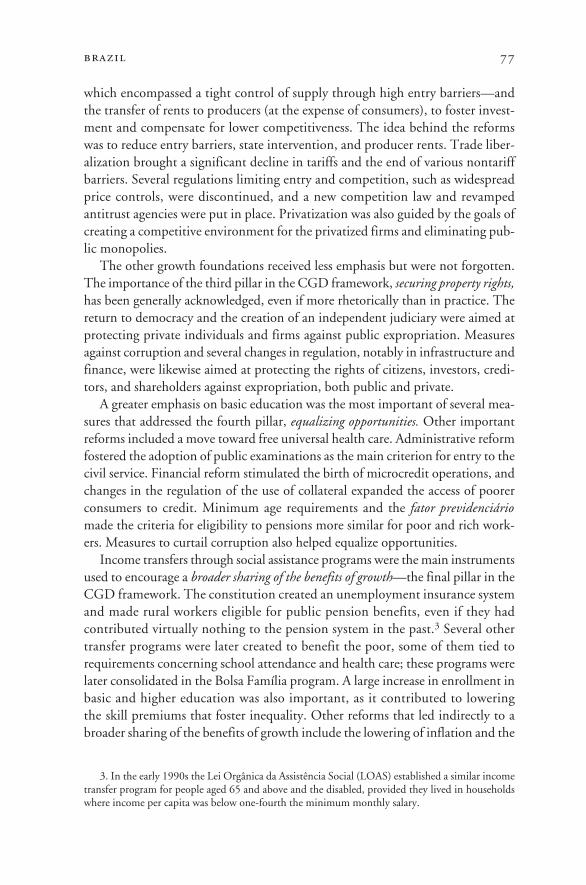
which encompassed a tight control of supply through high entry barriers—andthe transfer of rents to producers (at the expense of consumers), to foster invest-ment and compensate for lower competitiveness. The idea behind the reformswas to reduce entry barriers, state intervention, and producer rents. Trade liber-alization brought a significant decline in tariffs and the end of various nontariffbarriers. Several regulations limiting entry and competition, such as widespreadprice controls, were discontinued, and a new competition law and revampedantitrust agencies were put in place. Privatization was also guided by the goals ofcreating a competitive environment for the privatized firms and eliminating pub-lic monopolies.
The other growth foundations received less emphasis but were not forgotten.The importance of the third pillar in the CGD framework, securing property rights,has been generally acknowledged, even if more rhetorically than in practice. Thereturn to democracy and the creation of an independent judiciary were aimed atprotecting private individuals and firms against public expropriation. Measuresagainst corruption and several changes in regulation, notably in infrastructure andfinance, were likewise aimed at protecting the rights of citizens, investors, credi-tors, and shareholders against expropriation, both public and private.
A greater emphasis on basic education was the most important of several mea-sures that addressed the fourth pillar, equalizing opportunities. Other importantreforms included a move toward free universal health care. Administrative reformfostered the adoption of public examinations as the main criterion for entry to thecivil service. Financial reform stimulated the birth of microcredit operations, andchanges in the regulation of the use of collateral expanded the access of poorerconsumers to credit. Minimum age requirements and the fator previdenciáriomade the criteria for eligibility to pensions more similar for poor and rich work-ers. Measures to curtail corruption also helped equalize opportunities.
Income transfers through social assistance programs were the main instrumentsused to encourage a broader sharing of the benefits of growth—the final pillar in theCGD framework. The constitution created an unemployment insurance systemand made rural workers eligible for public pension benefits, even if they hadcontributed virtually nothing to the pension system in the past.3 Several othertransfer programs were later created to benefit the poor, some of them tied torequirements concerning school attendance and health care; these programs werelater consolidated in the Bolsa Família program. A large increase in enrollment inbasic and higher education was also important, as it contributed to loweringthe skill premiums that foster inequality. Other reforms that led indirectly to abroader sharing of the benefits of growth include the lowering of inflation and the
brazil 77
3. In the early 1990s the Lei Orgânica da Assistência Social (LOAS) established a similar incometransfer program for people aged 65 and above and the disabled, provided they lived in householdswhere income per capita was below one-fourth the minimum monthly salary.
11630-03_CH03_rev2.qxd 6/2/09 4:02 PM Page 77
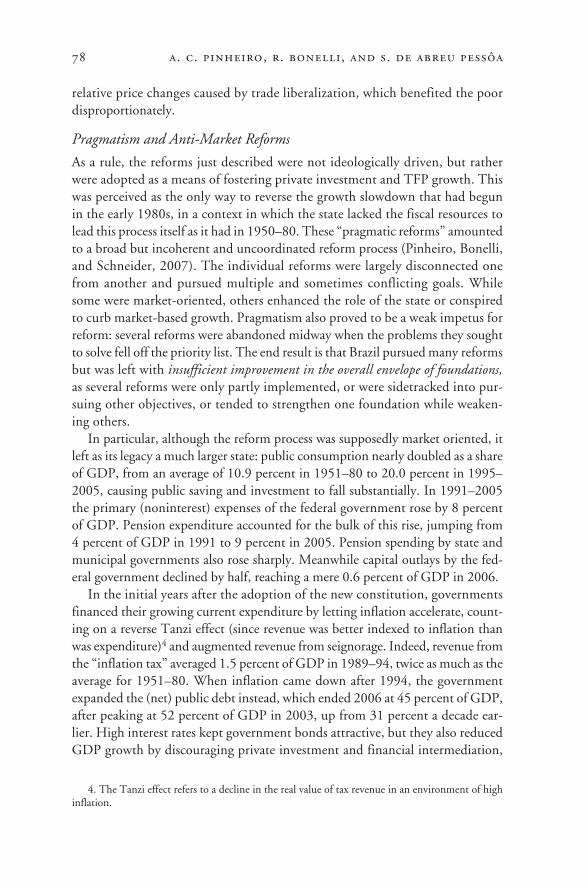
relative price changes caused by trade liberalization, which benefited the poordisproportionately.
Pragmatism and Anti-Market Reforms
As a rule, the reforms just described were not ideologically driven, but ratherwere adopted as a means of fostering private investment and TFP growth. Thiswas perceived as the only way to reverse the growth slowdown that had begunin the early 1980s, in a context in which the state lacked the fiscal resources tolead this process itself as it had in 1950–80. These “pragmatic reforms” amountedto a broad but incoherent and uncoordinated reform process (Pinheiro, Bonelli,and Schneider, 2007). The individual reforms were largely disconnected onefrom another and pursued multiple and sometimes conflicting goals. Whilesome were market-oriented, others enhanced the role of the state or conspiredto curb market-based growth. Pragmatism also proved to be a weak impetus forreform: several reforms were abandoned midway when the problems they soughtto solve fell off the priority list. The end result is that Brazil pursued many reformsbut was left with insufficient improvement in the overall envelope of foundations,as several reforms were only partly implemented, or were sidetracked into pur-suing other objectives, or tended to strengthen one foundation while weaken-ing others.
In particular, although the reform process was supposedly market oriented, itleft as its legacy a much larger state: public consumption nearly doubled as a shareof GDP, from an average of 10.9 percent in 1951–80 to 20.0 percent in 1995–2005, causing public saving and investment to fall substantially. In 1991–2005the primary (noninterest) expenses of the federal government rose by 8 percentof GDP. Pension expenditure accounted for the bulk of this rise, jumping from4 percent of GDP in 1991 to 9 percent in 2005. Pension spending by state andmunicipal governments also rose sharply. Meanwhile capital outlays by the fed-eral government declined by half, reaching a mere 0.6 percent of GDP in 2006.
In the initial years after the adoption of the new constitution, governmentsfinanced their growing current expenditure by letting inflation accelerate, count-ing on a reverse Tanzi effect (since revenue was better indexed to inflation thanwas expenditure)4 and augmented revenue from seignorage. Indeed, revenue fromthe “inflation tax” averaged 1.5 percent of GDP in 1989–94, twice as much as theaverage for 1951–80. When inflation came down after 1994, the governmentexpanded the (net) public debt instead, which ended 2006 at 45 percent of GDP,after peaking at 52 percent of GDP in 2003, up from 31 percent a decade ear-lier. High interest rates kept government bonds attractive, but they also reducedGDP growth by discouraging private investment and financial intermediation,
78 a. c. pinheiro, r. bonelli, and s. de abreu pessôa
4. The Tanzi effect refers to a decline in the real value of tax revenue in an environment of highinflation.
11630-03_CH03_rev2.qxd 6/2/09 4:02 PM Page 78
in addition to feeding back into higher public spending through increased inter-est payments.
When borrowing was no longer feasible, governments turned to raising taxes.The federal government, in particular, boosted its tax proceeds by creating newtaxes and raising rates on social contributions (this revenue is not shared with stateand municipal governments). These efforts had three important effects. First, theycounterbalanced the decentralization promoted by the constitution and, indeed,brought about some recentralization. Second, as no compensating tax reduc-tion occurred in the states and municipalities, the total tax burden rose to newhighs: from a relatively stable 25 percent in 1968–86, the tax share of GDProse to 31 percent in 1995–2002, 33 percent in 2003–05, and 37 percent in2007. Third, the complexity of the tax system also increased. The number of sep-arate taxes increased over time, and so did their rates. Some are applied cumula-tively, some share the same tax base, and others have rates that vary regionally.The end result is a complex, unstable, costly, and regressive tax system that is dif-ficult to monitor. Among other things, the system greatly distorts relative prices,increases transaction costs, fosters movement to the informal sector, discouragesfinancial intermediation, encourages rent seeking, shifts resources into tax plan-ning, and concentrates income.
The surge in public consumption was so large that notwithstanding the risein debt and taxes, it could only be accommodated through a significant declinein capital expenditure: total public investment, which includes investment byfederal state-owned enterprises, dropped from 7.9 percent of GDP in 1968–78to 2.7 percent in 2003–05.5 Infrastructure was especially hard hit, with publicinvestment in this area (again including state-owned enterprises) declining byabout 4 percent of GDP between 1971–80 and 2001–03, which was not com-pensated by a rise in private outlays. One consequence has been a deteriorationin infrastructure capital, with negative effects on productivity growth and incomedistribution.
Thus, Brazil’s failure to achieve a greater acceleration of growth in the post-reform period resulted from a combination of reform failures: some reforms didnot go far enough, others were not implemented at all, and still others actuallycompromised rather than strengthened the foundations for growth. Table 3provides a scorecard of the positive and negative influences of these variousreforms on the five foundations discussed above. To summarize:
• Democratization has fostered political competition, a broader sharing of thebenefits of growth, and more equal opportunity. Compared with most of the1951–80 period, however, it has reduced the security of property rights, despitegreater protection against administrative expropriation, and indirectly weakened
brazil 79
5. Reclassifications resulting from privatization account for about 1 percent of GDP.
11630-03_CH03_rev2.qxd 6/2/09 4:02 PM Page 79
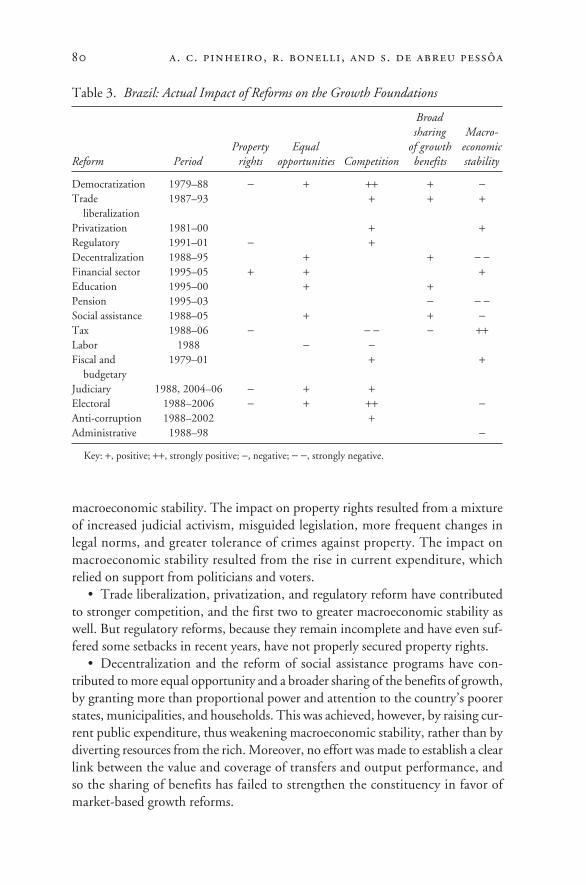
macroeconomic stability. The impact on property rights resulted from a mixtureof increased judicial activism, misguided legislation, more frequent changes inlegal norms, and greater tolerance of crimes against property. The impact onmacroeconomic stability resulted from the rise in current expenditure, whichrelied on support from politicians and voters.
• Trade liberalization, privatization, and regulatory reform have contributedto stronger competition, and the first two to greater macroeconomic stability aswell. But regulatory reforms, because they remain incomplete and have even suf-fered some setbacks in recent years, have not properly secured property rights.
• Decentralization and the reform of social assistance programs have con-tributed to more equal opportunity and a broader sharing of the benefits of growth,by granting more than proportional power and attention to the country’s poorerstates, municipalities, and households. This was achieved, however, by raising cur-rent public expenditure, thus weakening macroeconomic stability, rather than bydiverting resources from the rich. Moreover, no effort was made to establish a clearlink between the value and coverage of transfers and output performance, andso the sharing of benefits has failed to strengthen the constituency in favor ofmarket-based growth reforms.
80 a. c. pinheiro, r. bonelli, and s. de abreu pessôa
Table 3. Brazil: Actual Impact of Reforms on the Growth Foundations
Broad sharing Macro-
Property Equal of growth economic Reform Period rights opportunities Competition benefits stability
Democratization 1979–88 − + ++ + −Trade 1987–93 + + +
liberalizationPrivatization 1981–00 + +Regulatory 1991–01 − +Decentralization 1988–95 + + − −Financial sector 1995–05 + + +Education 1995–00 + +Pension 1995–03 − − −Social assistance 1988–05 + + −Tax 1988–06 − − − − ++Labor 1988 − −Fiscal and 1979–01 + +
budgetaryJudiciary 1988, 2004–06 − + +Electoral 1988–2006 − + ++ −Anti-corruption 1988–2002 +Administrative 1988–98 −
Key: +, positive; ++, strongly positive; −, negative; − −, strongly negative.
11630-03_CH03_rev2.qxd 6/2/09 4:02 PM Page 80
• A similar argument can be made regarding pension reform. The changesenshrined in the constitution have greatly expanded public spending and have dis-proportionately benefited the better off, by providing more favorable retirementconditions to civil servants and formal sector workers. Although some of the laterreforms went in the opposite direction, the net effect on the growth foundationswas negative.
• Fiscal and budgetary reforms, changes in the education and financial sectors,and anti-corruption measures have had positive effects on the foundations thatwere not offset by significant negative effects. In particular, the fiscal and anti-corruption reforms have made political competition fairer, and the education andfinancial reforms contributed to equality of opportunities, by focusing on accessof the poor to basic education and to financial services (such as microcredit).
• Judicial and electoral reforms have made political competition fairer andhelped equalize opportunity, notably in the political sphere. But neither reformhas contributed to strengthening the security of property rights, and the partyfragmentation that has resulted from electoral reform has created collective actionproblems that favor the expansion and increased inefficiency of public expendi-ture, as explored later in this chapter.
• Labor regulations introduced by the 1988 constitution benefited mostlyformal sector workers, at the expense of informal and unskilled workers.6 Hencethis reform tended to reduce both equality of opportunities and economiccompetition.
• Tax reform, although a perennial theme in policy discussions in Brazil, hasconsistently focused on increasing revenue rather than the pursuit of a morerational system that would encourage investment. This has led to uneven compe-tition between formal and informal sector firms, lowering productivity growth.Moreover, much of the more recent rise in taxes has occurred through an expan-sion in indirect taxes, which harm the poor disproportionately.
The incompleteness of reform to date was a more or less natural outcome ofthe pragmatic approach taken to reform. One reason why market-orientedreforms went as far as they did is that they were perceived as instrumental in sus-taining price stabilization, a popular policy goal. Once this link weakened, so didthe drive for greater economic liberalization. Thus, although it has not stoppedaltogether, Brazil’s reform process has greatly decelerated since 2000. The onlynoteworthy exceptions have been the enactment of a new bankruptcy law, theintroduction of more stringent rules for the retirement of civil servants, and areform of the judicial system. But these were partly offset by a partial reversal of
brazil 81
6. The World Bank’s Doing Business indicators reveal that labor laws in Brazil restrict contractflexibility and increase the cost of hiring and firing workers more than in most other countries, butthis only benefits half of the labor force, while making it more difficult for the other half to get a jobor enter the formal sector.
11630-03_CH03_rev2.qxd 6/2/09 4:02 PM Page 81
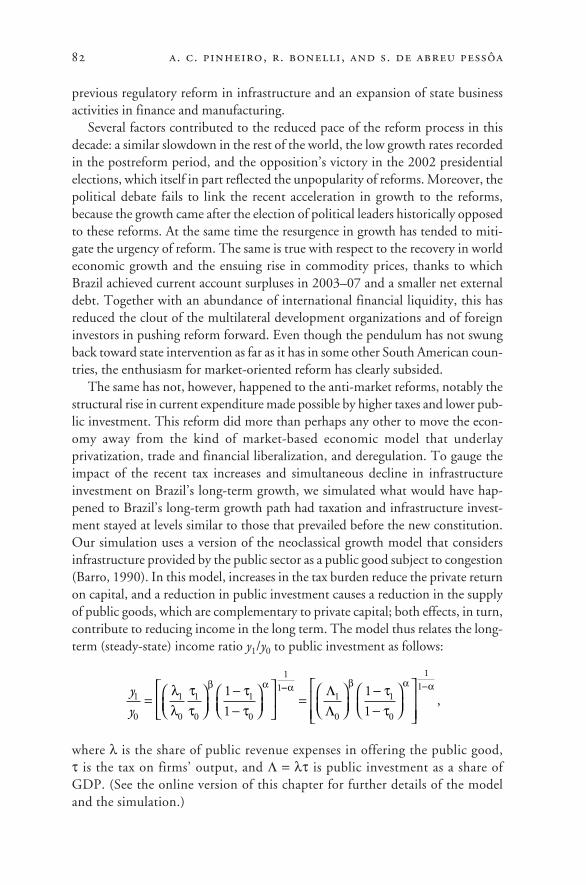
previous regulatory reform in infrastructure and an expansion of state businessactivities in finance and manufacturing.
Several factors contributed to the reduced pace of the reform process in thisdecade: a similar slowdown in the rest of the world, the low growth rates recordedin the postreform period, and the opposition’s victory in the 2002 presidentialelections, which itself in part reflected the unpopularity of reforms. Moreover, thepolitical debate fails to link the recent acceleration in growth to the reforms,because the growth came after the election of political leaders historically opposedto these reforms. At the same time the resurgence in growth has tended to miti-gate the urgency of reform. The same is true with respect to the recovery in worldeconomic growth and the ensuing rise in commodity prices, thanks to whichBrazil achieved current account surpluses in 2003–07 and a smaller net externaldebt. Together with an abundance of international financial liquidity, this hasreduced the clout of the multilateral development organizations and of foreigninvestors in pushing reform forward. Even though the pendulum has not swungback toward state intervention as far as it has in some other South American coun-tries, the enthusiasm for market-oriented reform has clearly subsided.
The same has not, however, happened to the anti-market reforms, notably thestructural rise in current expenditure made possible by higher taxes and lower pub-lic investment. This reform did more than perhaps any other to move the econ-omy away from the kind of market-based economic model that underlayprivatization, trade and financial liberalization, and deregulation. To gauge theimpact of the recent tax increases and simultaneous decline in infrastructureinvestment on Brazil’s long-term growth, we simulated what would have hap-pened to Brazil’s long-term growth path had taxation and infrastructure invest-ment stayed at levels similar to those that prevailed before the new constitution.Our simulation uses a version of the neoclassical growth model that considersinfrastructure provided by the public sector as a public good subject to congestion(Barro, 1990). In this model, increases in the tax burden reduce the private returnon capital, and a reduction in public investment causes a reduction in the supplyof public goods, which are complementary to private capital; both effects, in turn,contribute to reducing income in the long term. The model thus relates the long-term (steady-state) income ratio y1/y0 to public investment as follows:
where λ is the share of public revenue expenses in offering the public good, τ is the tax on firms’ output, and Λ = λτ is public investment as a share ofGDP. (See the online version of this chapter for further details of the modeland the simulation.)
y
y1
0
1
0
1
0
1
0
111
1= ⎛
⎝⎜⎞⎠⎟
−−
⎛⎝⎜
⎞⎠⎟
⎡
⎣⎢
⎤
⎦⎥
λλ
ττ
ττ
β α −− −=
⎛⎝⎜
⎞⎠⎟
−−
⎛⎝⎜
⎞⎠⎟
⎡
⎣⎢⎢
⎤
⎦⎥⎥
α β α αττ
ΛΛ
1
0
1
0
111
1,
82 a. c. pinheiro, r. bonelli, and s. de abreu pessôa
11630-03_CH03_rev2.qxd 6/2/09 4:02 PM Page 82
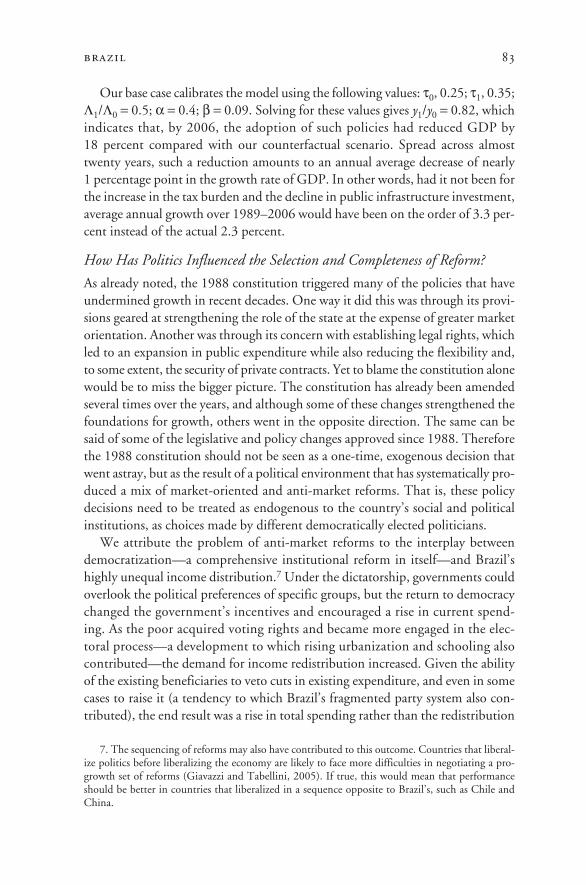
Our base case calibrates the model using the following values: τ0, 0.25; τ1, 0.35;Λ1/Λ0 = 0.5; α = 0.4; β = 0.09. Solving for these values gives y1/y0 = 0.82, whichindicates that, by 2006, the adoption of such policies had reduced GDP by 18 percent compared with our counterfactual scenario. Spread across almosttwenty years, such a reduction amounts to an annual average decrease of nearly 1 percentage point in the growth rate of GDP. In other words, had it not been forthe increase in the tax burden and the decline in public infrastructure investment,average annual growth over 1989–2006 would have been on the order of 3.3 per-cent instead of the actual 2.3 percent.
How Has Politics Influenced the Selection and Completeness of Reform?
As already noted, the 1988 constitution triggered many of the policies that haveundermined growth in recent decades. One way it did this was through its provi-sions geared at strengthening the role of the state at the expense of greater marketorientation. Another was through its concern with establishing legal rights, whichled to an expansion in public expenditure while also reducing the flexibility and,to some extent, the security of private contracts. Yet to blame the constitution alonewould be to miss the bigger picture. The constitution has already been amendedseveral times over the years, and although some of these changes strengthened thefoundations for growth, others went in the opposite direction. The same can besaid of some of the legislative and policy changes approved since 1988. Thereforethe 1988 constitution should not be seen as a one-time, exogenous decision thatwent astray, but as the result of a political environment that has systematically pro-duced a mix of market-oriented and anti-market reforms. That is, these policydecisions need to be treated as endogenous to the country’s social and politicalinstitutions, as choices made by different democratically elected politicians.
We attribute the problem of anti-market reforms to the interplay betweendemocratization—a comprehensive institutional reform in itself—and Brazil’shighly unequal income distribution.7 Under the dictatorship, governments couldoverlook the political preferences of specific groups, but the return to democracychanged the government’s incentives and encouraged a rise in current spend-ing. As the poor acquired voting rights and became more engaged in the elec-toral process—a development to which rising urbanization and schooling alsocontributed—the demand for income redistribution increased. Given the abilityof the existing beneficiaries to veto cuts in existing expenditure, and even in somecases to raise it (a tendency to which Brazil’s fragmented party system also con-tributed), the end result was a rise in total spending rather than the redistribution
brazil 83
7. The sequencing of reforms may also have contributed to this outcome. Countries that liberal-ize politics before liberalizing the economy are likely to face more difficulties in negotiating a pro-growth set of reforms (Giavazzi and Tabellini, 2005). If true, this would mean that performanceshould be better in countries that liberalized in a sequence opposite to Brazil’s, such as Chile andChina.
11630-03_CH03_rev2.qxd 6/2/09 4:02 PM Page 83
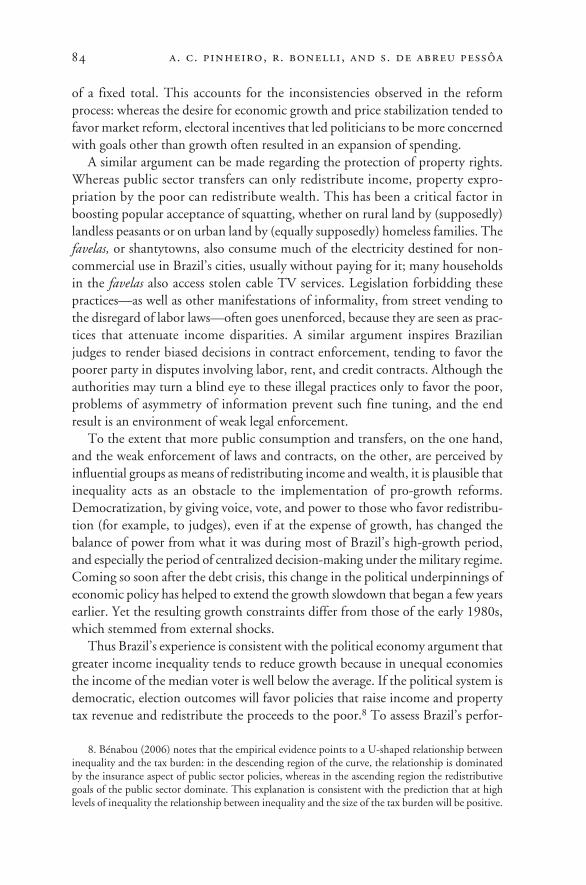
of a fixed total. This accounts for the inconsistencies observed in the reformprocess: whereas the desire for economic growth and price stabilization tended tofavor market reform, electoral incentives that led politicians to be more concernedwith goals other than growth often resulted in an expansion of spending.
A similar argument can be made regarding the protection of property rights.Whereas public sector transfers can only redistribute income, property expro-priation by the poor can redistribute wealth. This has been a critical factor inboosting popular acceptance of squatting, whether on rural land by (supposedly)landless peasants or on urban land by (equally supposedly) homeless families. Thefavelas, or shantytowns, also consume much of the electricity destined for non-commercial use in Brazil’s cities, usually without paying for it; many householdsin the favelas also access stolen cable TV services. Legislation forbidding thesepractices—as well as other manifestations of informality, from street vending tothe disregard of labor laws—often goes unenforced, because they are seen as prac-tices that attenuate income disparities. A similar argument inspires Brazilianjudges to render biased decisions in contract enforcement, tending to favor thepoorer party in disputes involving labor, rent, and credit contracts. Although theauthorities may turn a blind eye to these illegal practices only to favor the poor,problems of asymmetry of information prevent such fine tuning, and the endresult is an environment of weak legal enforcement.
To the extent that more public consumption and transfers, on the one hand,and the weak enforcement of laws and contracts, on the other, are perceived byinfluential groups as means of redistributing income and wealth, it is plausible thatinequality acts as an obstacle to the implementation of pro-growth reforms.Democratization, by giving voice, vote, and power to those who favor redistribu-tion (for example, to judges), even if at the expense of growth, has changed thebalance of power from what it was during most of Brazil’s high-growth period,and especially the period of centralized decision-making under the military regime.Coming so soon after the debt crisis, this change in the political underpinnings ofeconomic policy has helped to extend the growth slowdown that began a few yearsearlier. Yet the resulting growth constraints differ from those of the early 1980s,which stemmed from external shocks.
Thus Brazil’s experience is consistent with the political economy argument thatgreater income inequality tends to reduce growth because in unequal economiesthe income of the median voter is well below the average. If the political system isdemocratic, election outcomes will favor policies that raise income and propertytax revenue and redistribute the proceeds to the poor.8 To assess Brazil’s perfor-
84 a. c. pinheiro, r. bonelli, and s. de abreu pessôa
8. Bénabou (2006) notes that the empirical evidence points to a U-shaped relationship betweeninequality and the tax burden: in the descending region of the curve, the relationship is dominatedby the insurance aspect of public sector policies, whereas in the ascending region the redistributivegoals of the public sector dominate. This explanation is consistent with the prediction that at highlevels of inequality the relationship between inequality and the size of the tax burden will be positive.
11630-03_CH03_rev2.qxd 6/2/09 4:02 PM Page 84
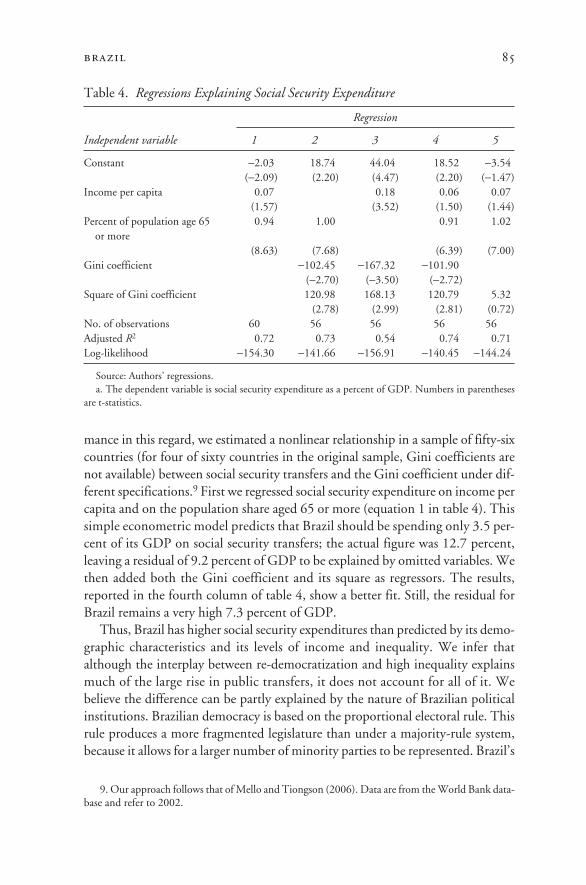
mance in this regard, we estimated a nonlinear relationship in a sample of fifty-sixcountries (for four of sixty countries in the original sample, Gini coefficients arenot available) between social security transfers and the Gini coefficient under dif-ferent specifications.9 First we regressed social security expenditure on income percapita and on the population share aged 65 or more (equation 1 in table 4). Thissimple econometric model predicts that Brazil should be spending only 3.5 per-cent of its GDP on social security transfers; the actual figure was 12.7 percent,leaving a residual of 9.2 percent of GDP to be explained by omitted variables. Wethen added both the Gini coefficient and its square as regressors. The results,reported in the fourth column of table 4, show a better fit. Still, the residual forBrazil remains a very high 7.3 percent of GDP.
Thus, Brazil has higher social security expenditures than predicted by its demo-graphic characteristics and its levels of income and inequality. We infer thatalthough the interplay between re-democratization and high inequality explainsmuch of the large rise in public transfers, it does not account for all of it. Webelieve the difference can be partly explained by the nature of Brazilian politicalinstitutions. Brazilian democracy is based on the proportional electoral rule. Thisrule produces a more fragmented legislature than under a majority-rule system,because it allows for a larger number of minority parties to be represented. Brazil’s
brazil 85
9. Our approach follows that of Mello and Tiongson (2006). Data are from the World Bank data-base and refer to 2002.
Table 4. Regressions Explaining Social Security Expenditure
Regression
Independent variable 1 2 3 4 5
Constant −2.03 18.74 44.04 18.52 −3.54(−2.09) (2.20) (4.47) (2.20) (−1.47)
Income per capita 0.07 0.18 0.06 0.07(1.57) (3.52) (1.50) (1.44)
Percent of population age 65 0.94 1.00 0.91 1.02or more
(8.63) (7.68) (6.39) (7.00)Gini coefficient −102.45 −167.32 −101.90
(−2.70) (−3.50) (−2.72)Square of Gini coefficient 120.98 168.13 120.79 5.32
(2.78) (2.99) (2.81) (0.72)No. of observations 60 56 56 56 56Adjusted R2 0.72 0.73 0.54 0.74 0.71Log-likelihood −154.30 −141.66 −156.91 −140.45 −144.24
Source: Authors’ regressions.a. The dependent variable is social security expenditure as a percent of GDP. Numbers in parentheses
are t-statistics.
11630-03_CH03_rev2.qxd 6/2/09 4:02 PM Page 85
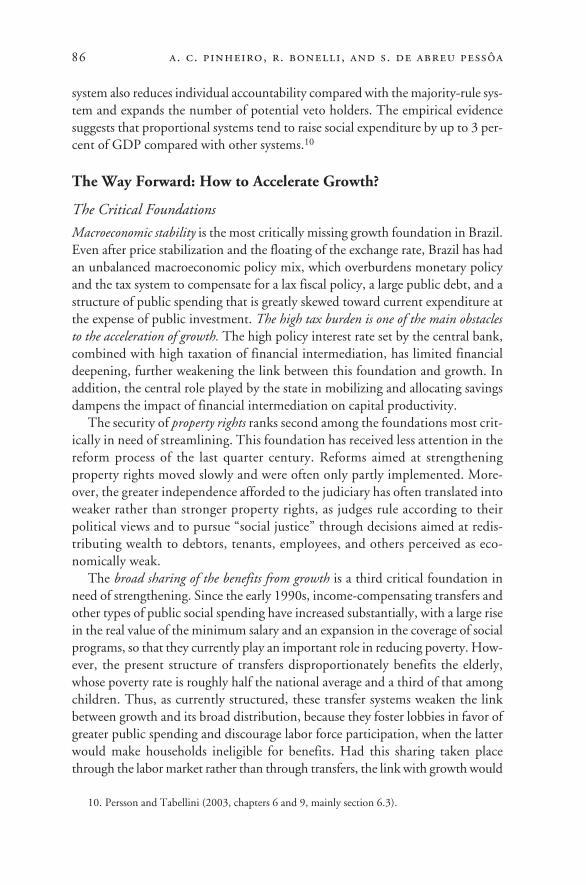
system also reduces individual accountability compared with the majority-rule sys-tem and expands the number of potential veto holders. The empirical evidencesuggests that proportional systems tend to raise social expenditure by up to 3 per-cent of GDP compared with other systems.10
The Way Forward: How to Accelerate Growth?
The Critical Foundations
Macroeconomic stability is the most critically missing growth foundation in Brazil.Even after price stabilization and the floating of the exchange rate, Brazil has hadan unbalanced macroeconomic policy mix, which overburdens monetary policyand the tax system to compensate for a lax fiscal policy, a large public debt, and astructure of public spending that is greatly skewed toward current expenditure atthe expense of public investment. The high tax burden is one of the main obstaclesto the acceleration of growth. The high policy interest rate set by the central bank,combined with high taxation of financial intermediation, has limited financialdeepening, further weakening the link between this foundation and growth. Inaddition, the central role played by the state in mobilizing and allocating savingsdampens the impact of financial intermediation on capital productivity.
The security of property rights ranks second among the foundations most crit-ically in need of streamlining. This foundation has received less attention in thereform process of the last quarter century. Reforms aimed at strengtheningproperty rights moved slowly and were often only partly implemented. More-over, the greater independence afforded to the judiciary has often translated intoweaker rather than stronger property rights, as judges rule according to theirpolitical views and to pursue “social justice” through decisions aimed at redis-tributing wealth to debtors, tenants, employees, and others perceived as eco-nomically weak.
The broad sharing of the benefits from growth is a third critical foundation inneed of strengthening. Since the early 1990s, income-compensating transfers andother types of public social spending have increased substantially, with a large risein the real value of the minimum salary and an expansion in the coverage of socialprograms, so that they currently play an important role in reducing poverty. How-ever, the present structure of transfers disproportionately benefits the elderly,whose poverty rate is roughly half the national average and a third of that amongchildren. Thus, as currently structured, these transfer systems weaken the linkbetween growth and its broad distribution, because they foster lobbies in favor ofgreater public spending and discourage labor force participation, when the latterwould make households ineligible for benefits. Had this sharing taken placethrough the labor market rather than through transfers, the link with growth would
86 a. c. pinheiro, r. bonelli, and s. de abreu pessôa
10. Persson and Tabellini (2003, chapters 6 and 9, mainly section 6.3).
11630-03_CH03_rev2.qxd 6/2/09 4:02 PM Page 86
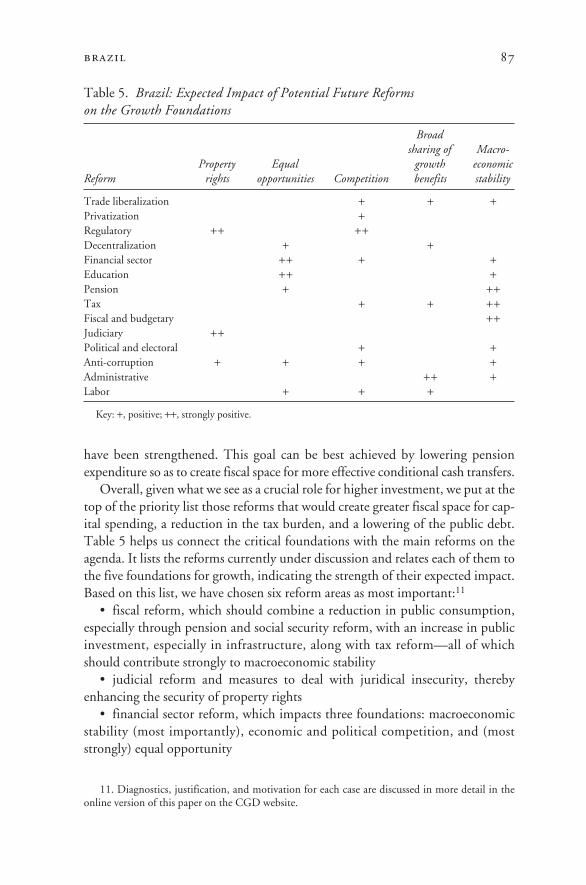
have been strengthened. This goal can be best achieved by lowering pensionexpenditure so as to create fiscal space for more effective conditional cash transfers.
Overall, given what we see as a crucial role for higher investment, we put at thetop of the priority list those reforms that would create greater fiscal space for cap-ital spending, a reduction in the tax burden, and a lowering of the public debt.Table 5 helps us connect the critical foundations with the main reforms on theagenda. It lists the reforms currently under discussion and relates each of them tothe five foundations for growth, indicating the strength of their expected impact.Based on this list, we have chosen six reform areas as most important:11
• fiscal reform, which should combine a reduction in public consumption,especially through pension and social security reform, with an increase in publicinvestment, especially in infrastructure, along with tax reform—all of whichshould contribute strongly to macroeconomic stability
• judicial reform and measures to deal with juridical insecurity, therebyenhancing the security of property rights
• financial sector reform, which impacts three foundations: macroeconomicstability (most importantly), economic and political competition, and (moststrongly) equal opportunity
brazil 87
11. Diagnostics, justification, and motivation for each case are discussed in more detail in theonline version of this paper on the CGD website.
Table 5. Brazil: Expected Impact of Potential Future Reforms on the Growth Foundations
Broad sharing of Macro-
Property Equal growth economic Reform rights opportunities Competition benefits stability
Trade liberalization + + +Privatization +Regulatory ++ ++Decentralization + +Financial sector ++ + +Education ++ +Pension + ++Tax + + ++Fiscal and budgetary ++Judiciary ++Political and electoral + +Anti-corruption + + + +Administrative ++ +Labor + + +
Key: +, positive; ++, strongly positive.
11630-03_CH03_rev2.qxd 6/2/09 4:02 PM Page 87
• education reform, to achieve greater equality of opportunities and, by mov-ing to tuition-based financing of higher education, to improve the fiscal balanceand so increase macroeconomic stability
• regulatory reform, which should have strong impacts on securing propertyrights and promoting economic and political competition, and
• political reform, to facilitate the enactment of policies that promote macro-economic stability and to improve the nature of political competition, while alsoaddressing several of the foundations by reducing corruption.
Fiscal Reform: Social Security and Taxation
The improvement in Brazil’s fiscal accounts can be seen in the maintenance of aprimary surplus in recent years large enough to stabilize the public debt-GDPratio. But even after almost a decade of consistently meeting primary surplus tar-gets, Brazil’s adjustment process is far from complete. The public debt remainsvery high, as does the real interest rate paid on that debt, so that a large primarysurplus is required just to keep the debt-GDP ratio from embarking on an explo-sive path. This introduces considerable political risk into any medium-term sce-nario for the economy: the size of the primary surplus, which is determined yearby year, depends on the micromanagement of different demands for higher spend-ing, a task that can only be accomplished with backing from the president him-self. The fiscal adjustment cannot be considered complete until the debt-GDPratio falls to around 30 percent of GDP, which in turn would allow for a substan-tial and sustained decline in interest rates.
Another sign of the poor quality of fiscal adjustment is its dependence on a ris-ing tax burden, which went from a relatively stable 25 percent of GDP in 1968–93to over 35 percent in 2006. This increase has exceeded the amount necessary tomeet the primary surplus target, and thus has also financed a major expansion inpublic primary spending. This higher spending did not, however, fall on items thatwould contribute to growth. Rather, it concentrated on pension payments. Pub-lic sector investment has fallen almost continuously, with negative consequencesfor the quality of infrastructure. Another problem is the pro-cyclical nature of fis-cal policy due to the earmarking of revenue to specific expenditure items.
Fiscal reform should therefore focus on reducing current expenditure so as toexpand public saving and investment and lower the tax burden, while also improv-ing the quality of the tax system. In particular, efforts should be aimed at cuttingsocial security expenditure, which has climbed to a level, relative to GDP, foundelsewhere only in developed economies with older populations.12
88 a. c. pinheiro, r. bonelli, and s. de abreu pessôa
12. Although we rank the social security system as the most critical area for expenditure reduction,it is hardly the only one. Other areas include the public sector’s payroll and procurement practices.Mention should also be made of the need to improve managerial practices and implement more effi-cient procedures through another round of administrative reform, continuing the (largely abandoned)reforms that took place just after President Fernando Henrique Cardoso came to power in early 1994.
11630-03_CH03_rev2.qxd 6/2/09 4:02 PM Page 88
Social Security Reform
The Brazilian social security system is well known for the generosity of itsretirement benefits; this generosity increased with the advent of the 1988 con-stitution. The main issue concerns the rules governing access to benefits, bothfor their impact on total expenditure and because they award large subsidies topolitically influential groups. There is no minimum retirement age for privatesector workers, and so a large proportion retire quite young by internationalstandards. Moreover, under present rules women can retire five years earlierthan men, and some professionals, such as teachers, can retire five years earlierthan regular workers.13 The other main issue is the generous way in which ben-efits are periodically adjusted: for most retirees, benefits increase at the same rateas the minimum wage, which rose by an average of 5.3 percent a year over1995–2007 in real terms, four times as fast as GDP per capita. The system’srules have combined with a major demographic transition to create a bleak out-look for its finances.
There are two ways to curb the trend toward larger social security deficits: cutexpenditure or collect additional revenue. Brazil has traditionally favored the lat-ter, which partly explains its high tax burden and high share of workers in theinformal sector. The reform proposals discussed next focus on curbing expendi-ture growth. This should be done along two main lines. The first concerns therules for the periodic adjustment of the minimum value of benefits; the seconddeals with changes in the rules that govern access to benefits, especially retirementbenefits. We have intentionally left out increases in individual contributions,because we see the system’s main problem as its large size rather than the deficitper se. Specifically, we propose that the backbone of a new round of social secu-rity reform consist of five measures:14
• De-link the value of pension benefits from the minimum wage. Pensions andincome transfers should be indexed to past inflation so as to keep the real value ofbenefits constant. Benefits will then more closely reflect the actual contributionmade by retired workers to the system, while freeing the minimum wage to incor-porate contemporaneous increases in productivity.
• Fix a minimum retirement age for access to INSS (Instituto Nacional deSeguridade Social) benefits and increase the minimum age over time, according to
brazil 89
13. A constitutional amendment approved in 2003 imposed minimum retirement ages for men(60) and women (55) in the civil service but continued to allow teachers to retire five years earlierthan other workers: in the public sector, male teachers can retire at 55 and female teachers, who com-prise the vast majority, at 50. This rule has no equivalent anywhere in the world, as far as we know,and it greatly burdens the fiscal accounts of state and municipal governments, while at the same timelimiting the possibility of better pay for teachers still in the work force, with negative repercussionson the quality of education.
14. See Pinheiro and Giambiagi (2006), Giambiagi (2006), and Tafner and Giambiagi (2007)for additional discussion of these proposals.
11630-03_CH03_rev2.qxd 6/2/09 4:02 PM Page 89
a pre-established rule, as average life expectancy increases. This would reduce theratio of beneficiaries to contributors and would reduce the subsidies given to(mostly formal sector) workers who retire relatively young.
• Move toward a single set of rules governing access to pensions for men andwomen. The present five-year difference should be reduced to two or even elimi-nated over a reasonable period. Because women’s life expectancy exceeds that ofmen, they would still enjoy a disproportional benefit, since they would receivebenefits for a longer period on average.
• Abolish the special retirement regime for teachers. We propose that the activelife of teachers of both sexes be extended by postponing their retirement, apply-ing to them the same rules adopted for other workers.
• Change the rules of access to benefits to older workers under the Lei Orgânica deAssistência Social. Present rules encourage participation in the informal sectoramong workers with incomes near the minimum wage: these workers have noincentive to join the social security system, since they will earn the same benefitwhether they contribute or not. Presently the benefit is unconditionally grantedto all persons 65 and older. We propose limiting future concession of old-age ben-efits to those who have reached the age of 70 and have contributed to the socialsecurity system for some time to be determined.
These suggestions, admittedly, have low political viability, in part because ofa general opposition to reforms that seek to reduce public expenditure. With-out broad public understanding of the link between cutting public spending andaccelerating economic growth, strong constituencies will remain against suchreform, and support will be very weak. In the case of social security reform,opposition comes mainly from those who benefit from the present rules (teach-ers, formal workers, pensioners, and women). For those already retired, thelikely benefits of reform, in the form of acceleration in output and employmentgrowth, will be relatively small. The main losers from present policy are theyounger generations and those not yet born, who do not yet participate in thepolitical process.
What is worse, the federal government, the major agent of change, is itself notconvinced that this reform should be pursued. It expects, perhaps self-servingly,that in due course a rise in formal employment will lower the system’s deficit,which it perceives to be the central problem. Besides, social security expenditureis regarded as part and parcel of social policy, a politically sensitive area. Yet theprospect for rising expenditure and deficits is such that the accumulated imbal-ances are bound to require some kind of action eventually.
The way to advance with social security reform in these circumstances is topursue a piecewise and gradual strategy. Some measures, such as establishing aminimum retirement age for private sector workers, enjoy some support and couldbe implemented separately. The fact that this rule (but not the sliding lower
90 a. c. pinheiro, r. bonelli, and s. de abreu pessôa
11630-03_CH03_rev2.qxd 6/2/09 4:02 PM Page 90
bound) already applies to civil servants should make approval easier. Although itis unlikely that Congress will allow the minimum salary to rise above the mini-mum pension benefit, legislation could be passed capping the rise in the real valueof the former. The other measures proposed above are even more unpopular, yeteven they may be politically feasible if approved only for those who have not yetentered the labor force. This would apply, in particular, to the special regimesbenefiting female workers and teachers. As with the remaining changes, politi-cal feasibility also hinges on efforts to increase public awareness about the reasonsfor reform.
Tax Reform
Tax reform should have three goals: lowering the tax burden, simplifying thetax structure, and reducing the earmarking of revenue. Although it is hard to sep-arate the lowering of the tax burden from measures to cut public spending, cau-sation between the two is far from obvious. We believe that capping taxes wouldhelp to limit current spending. The tax structure could be simplified by mergingvarious separate taxes and making them more uniform nationally, without theneed to devise a whole new regime. In particular, if the mix between indirect anddirect taxes is preserved, reform will be more politically palatable, since its impacton revenue will be less uncertain. Along these lines, our set of proposals includesthe following:15
• Adopt uniform ICMS (value added tax) legislation and tax brackets for all states,but with a range, to allow for some discretion by state governments.
• Establish the principle that the ICMS should be charged where goods are con-sumed, rather than where they are produced, with a small tax applied at the originto encourage compliance.
• Merge social security contributions (COFINS) with the public employees savingssystem (PIS-PASEP) into a single “contribution,” and the income tax on firms withthe Contribuição Social sobre o Lucro Líquido (a profits tax, with the same base asthe corporate income tax) into another single tax.16
• Modify the tax sharing system to encompass all taxes and contributionsinstead of just the current three (the income tax, the excise tax on manufactures,and the Contribução sobre Intervenção no Dominio Econômico, or CIDE, a taxon the sale and import of fuels), but without altering total transfers to states andmunicipalities.
• Transform the excise tax on manufactures into a tax on a limited range ofspecific goods (tobacco, alcoholic beverages, and passenger cars).
brazil 91
15. Some of these reforms have been suggested by Afonso and Varsano (2004).16. The resulting tax brackets would necessarily be high, but by making the high tax burden
explicit they might create a constituency in favor of reducing public sector expenditure.
11630-03_CH03_rev2.qxd 6/2/09 4:02 PM Page 91
An alternative, more radical, but also less politically palatable reform wouldfurther include the following:
• Reduce the tax burden by discontinuing taxes earmarked to expenditure thatcan be more easily eliminated or transferred to the private sector. Natural candi-dates are reductions in the FGTS (Fundo de Garantia por Tempo de Serviço)and in the contributions to the SESI, SENAI, and SEBRAE,17 or even their com-plete elimination (with the activities these taxes finance being paid for directlyby the private sector) and, partially, the PIS-PASEP. Direct and indirect taxes oninvestment expenditure and import duties should be drastically curtailed in themedium term.
• Replace a group of indirect taxes (ICMS, PIS-PASEP, COFINS, CIDE, andothers that together presently generate revenue of nearly 16 percent of GDP) witha single value added tax, the proceeds of which would be shared among the fed-eral, state, and municipal governments.
• Enlarge the DRU (Desvinculação de Receitas da União) so as to graduallydiscontinue the majority of existing provisions that earmark revenue for specificexpenditure items.
Changes in the tax system are rarely neutral from a distributive viewpoint, andthere is much uncertainty as to how each group in society will fare. This tends tostrengthen the constituency against almost any proposed measure. Since the statesand municipalities are most likely to lose under these reforms, the federal govern-ment should compensate them appropriately. The existence of state debts to thefederal government both provides a vehicle for such compensation and offers analternative mechanism for promoting regional policies, which is often cited as areason not to have a uniform national tax system.18 Thus one way to weaken theopposition to reform would be to compensate the states’ losses by lowering thedebt service on their loans from the federal government.
Judicial Reform
The weak protection of property rights in Brazil is a consequence of several fac-tors: judicial activism, breaches of contract by the government, slow enforce-ment of laws and regulations, extreme instability of the existing rules, and abroad bias against creditors, property owners, and employers. Paramountamong these are the last three. The traditional reaction to this dysfunctionalityhas been to expand the public resources allocated to the judiciary. Yet this has
92 a. c. pinheiro, r. bonelli, and s. de abreu pessôa
17. These are entities administered by unions of firms that aim at providing training, recreational,and other services to employees (SESI and SENAI) or to the creation and support of small andmedium-size firms (SEBRAE).
18. Another alternative is to create an equalization fund for revenue capable of guaranteeing alower bound for revenue per capita at the state level. The difference between each state’s revenuecapacity and the respective minimum tax revenue per capita would be paid out of the fund.
11630-03_CH03_rev2.qxd 6/2/09 4:02 PM Page 92
not improved matters, because the demand for judicial services has also grownquite rapidly, sometimes as a consequence of an endogenous rise in proceduralcomplexity. The demands on the judiciary have also increased as a result ofdemocratization and the economic reforms of the 1990s, such as the enactmentof a new consumer protection law, with the courts being asked to solve moreand more complex cases.
This worsening situation encouraged legislators to adopt more significantchanges. In December 2004 a constitutional amendment changed several norms,from rules concerning the selection of judges to the obligation of lower courts toabide by some Supreme Court rulings. Congress also approved a number of infra-constitutional reforms that greatly simplified the civil and procedural codes. Thesereforms aimed mostly at adopting legal measures to speed up the decision process,largely by reducing the endless opportunities for appeal, notably when involvingrepetitive legal demands. Other important, if less dramatic, measures adopted inthis period focused on improving management practices.
The area that has seen the least progress concerns the change in attitudestoward contract enforcement. Judicial decisions often reflect the judge’s politicalviews or intention to use the bench to redistribute income in favor of the less welloff. This stance, together with the freedom that judges enjoy to reach very differ-ent decisions on similar cases, and their power to paralyze government policies,has turned the judiciary into a key actor in most social and political conflicts. Thesystem has few mechanisms by which to mitigate the impact of these politicallymotivated decisions on property and contract rights, other than allowing univer-sal appeal to the higher courts, a procedure that itself is often abused and con-tributes to the increasing volume of litigation observed in Brazil. Moreover, erraticjudicial decisions become a fertile ground for corruption, as it becomes harderto identify cases in which factors other than the letter of the law or ideology areat play.
The measures adopted so far have been positive, but further changes areneeded. Administratively, there is still a need to improve information systems andcase flow, to transfer some responsibilities from the judges to professional man-agers, and to improve case management. Better management practices will speedup the judicial process and allow the judges to dedicate more time to the meritsof each case. Regarding legal reform, there is room for further effort to simplifyprocedures, including speedier notification of parties, maintaining the continuityof the process when a party shows up after its initiation, a reduction in formalism,and a change in the tendency of judges to decide based on procedural details ratherthan on the merits of the dispute. A greater reliance on verbal procedures andsmall claims courts would contribute to these goals.
The more challenging reform is to change the culture of the legal profession—lawyers, prosecutors, and judges—so that they place greater value on the speed,predictability, and impartiality of judicial decisions, which should be independent
brazil 93
11630-03_CH03_rev2.qxd 6/2/09 4:02 PM Page 93
of the identity or social status of the parties. One way to stimulate such changewould be to adopt performance indicators as a criterion in judicial promotion,replacing the present seniority-based system. The use of indicators to assess per-formance would reveal the differences among judges and tribunals and wouldencourage them to become more efficient. The National Council of Justice couldplay a central role in this initiative by developing, calculating, disseminating, andstimulating the use of such indicators. One indicator that could be used to fostergreater dispatch in judicial proceedings is the time elapsed between the beginningof each case and the final ruling, with cases appropriately grouped by type. Thepredictability of a given judge’s rulings could be assessed by the percentage of hisor her decisions that are confirmed on appeal.
In addition to poor judicial performance, the insecurity of property rightsreflects gaps in the quality of legislative output and the often opportunistic andideological stance of the executive. Measures to strengthen property rights inBrazil must therefore go beyond the judiciary. We propose the following addi-tional core set of measures:
• The executive branch should exercise greater self-discipline both in changingthe legal norms under its jurisdiction and in appealing to the judiciary to post-pone the enforcement of judicial decisions, especially in areas where the law is wellestablished. Implementing this recommendation would require a change in cul-ture and a discontinuance of the use of provisional measures.19 The executivebranch, including the state-owned enterprises, is by far the leading litigator inBrazil. Even more frequently than the private sector, it resorts to the intricacies ofBrazil’s procedural codes to extend the duration of judicial processes, even whenit knows it will eventually lose. This practice not only postpones spending and dis-courages some plaintiffs from suing in the first place, but also reflects the incen-tives facing public sector lawyers and managers. In recent years this posture haschanged somewhat, but more drastic action is necessary to both reduce caseloadsand encourage judges to be less lenient on private parties that follow the samestrategy.
• The quality of legislation needs to be improved. One of the consequences ofparty fragmentation and weak party discipline is that Congress has a hard timeresolving political disagreements, because it is easy for a minority to block theapproval of legislation. To deal with this problem, laws are often written ambigu-ously and in very general terms to make them palatable to all the different con-tending groups. This, of course, merely passes the responsibility for settlingpolitical conflicts to the courts, which have to clarify what the law has left vague.Even then, except where the Supreme Court enacts a súmula vinculante (a ruling
94 a. c. pinheiro, r. bonelli, and s. de abreu pessôa
19. Provisional measures are a type of presidential decree through which the government heavilyinfluences the legislative agenda and which becomes law upon being enacted, even before goingthrough legislative debate.
11630-03_CH03_rev2.qxd 6/2/09 4:02 PM Page 94
that is expressly binding on lower courts), insecurity tends to prevail even after thehigher courts have established jurisprudence on the matter.
• Judicial awards should be indexed to the SELIC,20 including those of the pub-lic sector (“precatórios”), so as to reduce the financial incentive to delay final courtrulings. One reason a party to a lawsuit will often spend resources to get a finalruling postponed, even when the outcome is not in doubt, is to secure in themeantime a return on the resources that it will eventually have to transfer to theother party. Raising the interest rate on contested debts would weaken this incen-tive and thus encourage the speedier conclusion of cases.
• The burden of proof should be reversed with respect to decisions made by theboard of regulatory agencies and the competition tribunal (CADE), which wouldcontinue to hold through the appeals process until a final ruling is handed downby the judiciary.
• The training of new judges should be extended and strengthened. Recent reformshave already improved matters by requiring lawyers to have at least three years ofpractice before being appointed to the bench. However, more training for newjudges on their specific responsibilities would improve the quality and predictabil-ity of judicial rulings.
• The syllabuses of law schools should be extended to include the study of eco-nomics, and to emphasize the importance of justice and a sound judicial systemfor the proper functioning of a market economy.
Experience suggests that the political disputes surrounding judicial reform tendto be argued only among legal professionals themselves. This is unfortunate,because it leaves the users of the judicial system out of the discussion, even thoughit is they who have the most to gain from improved performance. Increasing pop-ular awareness of the problem, while building on public discontent about thequality of judicial services and especially the slow pace at which decisions are cur-rently rendered, seems to be the best avenue for change. This process would haveto be led by business, academia, and the media, which indeed have shown increas-ing interest. A crucial element is to shed light on performance indicators and theconsequences of poor judicial performance for economic development and socialfairness.
Within the legal profession, lawyers as a group tend to be the fiercest oppo-nents to reforms that would streamline the judiciary. Lower court judges also tendto oppose reform, because they tend to be more ideologically committed and fearlosing the freedom to decide as they please, even if most judges tend to voluntar-ily abide by the jurisprudence established by higher courts. The Supreme Courtjustices, on the other hand, tend to be keener about pushing for reform, becausethey feel more accountable for the overall performance of the judiciary. They also
brazil 95
20. The SELIC (Sistema Especial de Liquidação e de Custódia) is the policy interest rate set bythe Commission on Monetary Policy at the central bank.
11630-03_CH03_rev2.qxd 6/2/09 4:02 PM Page 95
recognize that they are spending too much time deciding matters that should beresolved in the lower courts.
Financial Sector Reform
Brazil has a well-developed financial infrastructure but relatively shallow creditand capital markets, which have historically contributed only modestly to spur-ring long-term growth (Pinheiro and Bonelli, 2007). Finance is not only scarce,notably for small firms and households, but also expensive. And the incentivesfaced by financial institutions to select and monitor projects are distorted bynorms, institutional weaknesses, and high taxes, so that jurisprudence and pat-terns of judicial behavior play at least as important a role as the law itself in regu-lating credit disputes. As indicated in table 5, financial sector reform couldimprove and strengthen three of the growth foundations: equal opportunities,economic and political competition, and macroeconomic stability. Our reformmenu includes measures under five main headings:
• Improve the quality of information available to lenders and shareholders, sothat they can better evaluate the risks they face. This will require a revamping ofaccounting practices (a process started in early 2008), better registration of assets,and more stringent disclosure rules. Also important is enlarging credit informa-tion registries, which have a relatively wide coverage in Brazil, to include positiveinformation about borrowers as well as the negative information they currentlycarry. Also needed are better auditing, a strengthening of supervision by the cen-tral bank and the securities commission, and more stringent and faster sanctionsfor those who fail to comply. This may require changes in privacy laws and dis-cussions with judges so that they uphold these changes.
• Strengthen the rights of creditors and minority shareholders. Currently, fewtypes of guarantees operate well, in the sense of allowing for a quick and low-costrecovery of the loan. For loans extended with these guarantees as collateral, inter-est rate spreads are well below the average, which shows the potential for measuresin this direction to lower the cost of and expand access to credit, in particular forsmall firms and poor families. Here, too, cooperation of the judiciary is central,particularly so that collateral offered by the poor may actually be accepted as suchby financial institutions. Reforms along this line would be especially importantfor expanding housing credit.
• Reduce taxes on financial operations and avoid frequent tax changes. Implement-ing this reform would require only political will, but attempts at reducing these taxeswill likely be resisted by the executive, as it would force a decline in expenditure andmay seem to favor the banks. Moreover, taxes on financial transactions are easy tocollect and supervise, and this makes them popular with the tax authorities.
• Promote competition among financial institutions, and between them and thecapital markets, not least because the current consolidation of the banking sectorthrough concentration among the largest banks is likely to further reduce com-
96 a. c. pinheiro, r. bonelli, and s. de abreu pessôa
11630-03_CH03_rev2.qxd 6/2/09 4:02 PM Page 96
petition among banks, which also hold a dominant position in the capital mar-kets. The competition tribunal and the central bank should receive a clear man-date to improve competition in the banking sector. This should include a morerigorous analysis of mergers and acquisitions as well as pro-active policies of infor-mation dissemination and strengthening of guarantees. Another recommendedmeasure is to make it easier for bank clients to switch their accounts between insti-tutions, by lowering taxes on such changes, and by facilitating banks’ access toinformation on the account history of potential clients.
• Reduce and restructure the role of the public sector banks and of directed creditin the financial system. These banks are still responsible for a large share of finance,including many transactions that private institutions or the capital markets couldeasily handle, but for which they cannot compete because of the subsidies receivedby the public sector banks. Directed credit, on the other hand, operates as a meansof cross-subsidizing certain borrowers, but at the cost of higher interest ratespreads. Both instruments have become inefficient and largely unnecessary withthe growing sophistication of private financial institutions, the opening of the cap-ital account, and the expansion of capital markets. The main measures called forin this regard are to significantly lower the subsidies transferred though publicbanks and to increase the transparency with which they are allocated.Financial sector reform includes certain measures that are part of other reformareas. One of these is strengthening contract enforcement, which is critical to fos-tering long-term credit in housing and infrastructure, but in which financial sec-tor reform is just part of a larger effort to improve juridical security and regulation.Likewise, high taxes account for a significant part of bank spreads and financialrisk, but changes in this area would be dealt with more properly as part of taxreform. Other areas of reform, such as capital market regulation, access to infor-mation in credit bureaus, and better mechanisms for foreclosing on collateral incase of default, can be implemented with relatively less political resistance, as expe-rience in recent years has shown.
The area of strongest resistance will be in reforming the financial subsidy mech-anisms embedded in directed credit regulations and the workings of the public sec-tor banks. Recipients of subsidies (for example, large farmers and industrialcompanies), public sector bank employees, and the politicians connected to themwill be the main opponents of reform. The most promising strategy seems to be toconcentrate on demanding transparency and accountability in the application ofsuch subsidies and seeking the discontinuance of those that play no social or redis-tributive role. This would reduce the opposition of public bank employees and ofsome politicians, while attracting the support of the media and society in general.
Education Reform
Two features of the Brazilian labor market stand out in cross-country compar-isons, even with countries at similar development levels: high inequality of wages
brazil 97
11630-03_CH03_rev2.qxd 6/2/09 4:02 PM Page 97
and low average levels of schooling.21 The two problems are interconnected, andsolving both requires expanding the coverage and improving the quality ofbasic education. This would primarily foster greater equality of opportunities byextending access to a good education to many who now are deprived of it; it wouldalso have positive spillovers on other areas, such as public health and crime pre-vention. The average educational attainment of the population aged 15 and overhas improved since the 1980s, from 3.1 to 4.9 years, after remaining nearlyunchanged in the preceding twenty years. Yet as similar countries, such asArgentina and Chile, have made even greater progress, the gap between them andBrazil has widened.
In recent years several reforms have sought to accelerate the rise in averageeducational attainment. On the supply side, the FUNDEF (Fundo Nacionalpara o Desenvolvimento do Ensino Fundamental e Valorização do Magistério)was established to increase the resources allocated to primary education, espe-cially in the country’s poorest areas, with noticeably positive effects. Demand,meanwhile, was fostered through the Bolsa Escola program, created in 2001,which pays poor families a stipend to send up to three children aged 6 to 15 yearsto school. Each child must achieve at least an 85 percent attendance record. Alsoduring this period, several mechanisms were implemented to measure educa-tional performance and supply valuable information for future planning andother focused initiatives.
In the first term of the current president, Luiz Inácio “Lula” da Silva, the pol-icy emphasis shifted from basic to higher education. Leading initiatives includedthe Programa Universidade para Todos (University for All), which aims at facili-tating college entry conditions for poor students, and a proposed reform that,among other provisions, would have reserved 50 percent of vacancies in federaluniversities to students who attended public secondary schools. In December2006 the government also created the Fundo de Manutenção e Desenvolvimentoda Educação Básica (FUNDEB), which extended the FUNDEF program to pre-primary and secondary education.
These reforms have yielded significant gains, but the education system stillfaces important challenges, in particular the need to raise equity and efficiencyand improve learning. The quality of schooling varies considerably across Brazil.Children attending some public schools lack the basic educational opportunitiesavailable in other parts of the country, or even in better-endowed schools withintheir own jurisdictions. Almost everywhere, repetition and dropout rates remainexceedingly high: only 54 percent of students finish all eight years of primary edu-cation, taking an average of ten years to do so. The corresponding figures in theNorth and the Northeast regions are worse: 39 percent and eleven years.
98 a. c. pinheiro, r. bonelli, and s. de abreu pessôa
21. This section is based on Ferreira and Veloso (2007).
11630-03_CH03_rev2.qxd 6/2/09 4:02 PM Page 98
Even those who complete primary school by no means always receive a goodeducation. Standardized test results for 2001 showed that fewer than half offourth-graders performed at level 3 on a mathematics proficiency scale of 1 to 10,the same percentage as in 1995. In this context, the recent shift in focus from basicto higher education is an unwelcome development.
Our proposals for education reform seek to address the problems just summa-rized. Their main thrust is to enhance the coverage and quality of basic education,while reducing subsidies to higher education by shifting from universal free tuitionat public universities to a combination of paid tuition and student loans. Asalready noted, an expanded and improved basic education system would con-tribute to strengthening the equality of opportunities foundation. A shift totuition-based financing of higher education would improve the nation’s fiscalaccounts and so strengthen the macroeconomic stability foundation. The follow-ing specific actions are proposed:
• Achieve universal coverage from pre-school through upper secondary school byfully implementing the FUNDEB and including families with students aged 16through 19 in the Bolsa Família program. Indeed, benefits should rise as a func-tion of age, to compensate for the opportunity cost of students staying out of thelabor market. Particularly important is expanding coverage and improving thequality of early childhood care, including preschool education, in coordinationwith other initiatives directed at young children. Evidence shows that investmentsin early childhood lead to healthier cognitive and emotional development in theearly years, which translates into higher overall educational attainment (and hencea more competitive labor force), greater internal efficiency of the formal educa-tion system (reduced repetition and dropout rates), and better physical and men-tal health. All of these, in turn, make students more responsible citizens and betterparents as adults, and may produce externalities through role modeling for sib-lings, peers, and others.
• Improve the quality of primary education. Specific proposals include carefulperiodic evaluation of schools and teachers, possibly with the introduction of anaccreditation system, and increased competition among schools. Quasi-marketmechanisms, from concessions schools to vouchers, should be introduced at thestate and municipal levels, along with better governance structures.
• Increase efficiency and equity in university education. Competition among uni-versities should be increased. Facilities should be used more intensively, for exam-ple by increasing enrollment in night courses. Public universities should chargetuition and fees, and the federal program of scholarships should be expanded,especially for poor students.
The main advantage of the first proposal is also its main weakness: because itinvolves allocating more resources to the sector, none of the main interest groupsopposes it; on the other hand, its implementation would require the transfer offunds from other activities, which means fighting an uphill battle with mayors
brazil 99
11630-03_CH03_rev2.qxd 6/2/09 4:02 PM Page 99
and governors, who often argue that too much of their resources are already allo-cated to education. Yet if continued economic growth produces a parallel rise intax revenue, even the existing provisions, together with a projected decline in pri-mary enrollment, should allow for universalization at least of preschool educa-tion in the medium term. This, in turn, should raise the efficiency of the primaryschools, fostering the universalization of secondary education. Evidence suggeststhat Brazil’s high dropout rates in secondary education owe less to the opportu-nity cost of staying out of the labor market than to learning difficulties and lackof motivation.
The big problem with improving primary education is that its current lowquality appears to result mainly from administrative problems, so that merely allo-cating more resources is unlikely by itself to produce significant improvement(Menezes-Filho, 2003). However, the agenda outlined above is strongly opposedby public school teachers’ unions. These unions share a culture of victimizationthat portrays the low quality of education as due primarily to teachers being paidlow wages and working in poor conditions. In fact, although salaries in the pub-lic schools are not very high, they are higher than the average salary paid by theprivate sector (Barbosa-Filho et al., 2008) and are not low by international stan-dards as a share of GDP per capita (Barbosa-Filho and Pessoa, 2008). Further-more, this culture of teacher victimization has caused administration to be gearedto teachers’ needs rather than focused on the students. High rates of teacher absen-teeism are tolerated (in Sao Paulo state, 13 percent of teachers are absent on agiven day), and teachers move freely between workplaces, even in the middle ofthe school year, impeding rational management.
Fortunately, the public school system is highly decentralized—each state andmunicipality has its own system—which reduces the unions’ power, facilitatessupport from the federal government, and creates scope for piecewise, incremen-tal change: reform in one jurisdiction can create a constituency for reform in oth-ers. Alternative management practices are also possible, including public-privatepartnerships and the hiring of private firms to provide services.
The main potential ally of reform will be civil society; with its support, gover-nors and mayors will come along. Brazilian society in general has yet to under-stand that the problem is much more complex than simply a lack of resources, butthere are strong signs that this process has begun. Here the main strategy is to pro-vide greater transparency about the problems, to make them more understand-able to parents and society at large; in particular, the culture of seeing the teachersas the victims, rather than the children who are deprived of a good education,must be changed. For this it will be critical to enlist the media as an ally.
Finally, the reform of higher education will not be easy: there is no popularsupport for charging fees at public universities. However, we believe that as pri-mary and secondary education expand and improve, demand for higher educa-tion will grow exponentially, making competition for admission to the public
100 a. c. pinheiro, r. bonelli, and s. de abreu pessôa
11630-03_CH03_rev2.qxd 6/2/09 4:02 PM Page 100
universities even more intense. This will raise public awareness and force a discus-sion about whether a fortunate subset of the population should continue to attenduniversity for free. Either there will be a move to charge fees and so reducedemand, or entry barriers will have to be lowered, resulting in a sharp reductionin the teacher-student ratio, as has occurred, for example, in Argentina’s publicuniversities. The sacrifice in quality that the latter would entail may persuade thepublic to accept the concept that public universities should charge reasonabletuitions for the education they provide.
Regulatory Reform
Many important economic sectors, including telecommunications, electric power,railways, ports, roads, and water and sanitation, experienced not only extensiveprivatization but also substantial regulatory reform in the 1990s, dismantling aninstitutional framework that in some cases had been in place for over half a cen-tury. Although the reform process evolved independently in each of the varioussectors, the diagnosis that motivated it and the principles underscoring the newregulatory model were essentially the same. In particular, bringing privateinvestors in was seen as the best way to raise investment without sacrificing fiscaldiscipline; but for that to occur, the regulatory framework had to be revamped.
Following international practice, regulatory reform in the area of infrastructureinvolved the separation of commercial, regulatory, and policy activities. The state-owned enterprises continued to engage in commercial activities but were restruc-tured, often through privatization. As the new regulatory model stressed theintroduction of competition, privatization was often accompanied by the verticalor horizontal breakup of the enterprise and the dismantling of barriers to new pri-vate entry. To reduce the risk of expropriation, new regulatory agencies, with rel-ative financial and administrative independence from the government, wereentrusted with the responsibility of fixing rates, subject to rules set out in the con-cession contracts and the general principle of “financial and economic equilib-rium” established in the Concessions Law. Policy responsibilities were ascribed tothe appropriate sector ministry.
Although the evidence suggests that regulatory reform has succeeded in foster-ing productivity growth and improving the fiscal accounts, much less has beenaccomplished by way of raising investment. In particular, the new private ownersinvested in rehabilitation and modernization of facilities, but not as much wasinvested in greenfield projects, with the result that expansion of capacity wasrather limited. The telecommunications sector is apparently the only exception tothis rule, in the sense that not only did capacity increase significantly, but this wasachieved while the state successfully transferred all commercial activities to the pri-vate sector.
The regulatory reform agenda detailed below draws on the successful case of thetelecommunications sector. Its starting point is the view that since the state con-
brazil 101
11630-03_CH03_rev2.qxd 6/2/09 4:02 PM Page 101
tinues to lack the resources to invest directly in infrastructure, it needs to establisha regulatory framework that encourages private investors to do so, allowing themto operate at a reasonable level of risk. Thus our proposals aim at completing thetransition initiated in the 1990s, focusing largely on the strengthening of regula-tory agencies in infrastructure, but recognizing that these share common problemswith other, similar institutions. Thus, the antitrust agencies and, to some extent,the central bank also need strengthening. Specifically, we propose the following:
• Expand the number of board members in regulatory agencies to seven, with eachmember serving a seven-year term. (Every year the president would appoint onemember to each board, to take office the following year.) This would replace thepresent rule—five members serving for five years each—which has proved insuf-ficient to insulate the agencies from the political cycle. Board members would con-tinue to be approved by the legislature. The law should also establish provisionsfor replacing board members in case of vacancy, so that vacancies do not last indef-initely when the executive and Congress cannot agree. This has happened repeat-edly in the recent past, leaving the agencies with too few board members to makeformal decisions.
• A performance contract should be signed between the agency and theappropriate ministry, fixing performance targets and mechanisms for controland follow-up. This will require the objectives of the agencies to be clearly stated.The performance contract should respect agencies’ autonomy to decide on regu-latory matters, while obliging them to abide by transparency and administrativenorms common to other public institutions.
• Set fixed terms for central bank directors, which should not coincide with theterm of the president of the republic.
• Change the law to make mergers conditional on ex ante approval by the compe-tition tribunal.
• Complete the regulatory framework in the areas of transportation (for exam-ple, the ports), electric power, and especially sanitation. Conflicts of interest andthe overlapping of responsibilities should be carefully disentangled so as to expandthe network operated by private investors.
• In the electric power sector, move toward privatization as a long-term strategy,while in the medium run fostering competition and improving the quality of man-agement and the mechanisms for supervision and control, limiting political inter-ference, and strengthening the enterprises’ commercial ethos.
• Streamline the operations of the environmental protection agencies, includingspeeding up the licensing process. Strengthen cooperation among these agencies,the judiciary, and prosecutors, so as to reduce judicial insecurity and risk overenvironmental licenses. Improve coordination among the federal, state, andmunicipal environmental protection agencies.
• Strengthen coordination among the regulatory agencies, especially those deal-ing with the energy sector (the electric power, oil, and water agencies). Similarly,
102 a. c. pinheiro, r. bonelli, and s. de abreu pessôa
11630-03_CH03_rev2.qxd 6/2/09 4:02 PM Page 102
foster cooperation between the regulatory agencies and the consumer protectionand antitrust institutions.
• Develop financial instruments and secondary markets capable of supplyingmore financial resources and means of managing the risks of infrastructureprojects.
The main obstacles to regulatory reform are neither technical nor political, butideological. Some of the above proposals will require further refinement (forexample, those concerning financial instruments and the design of performancecontracts), but the complexities are few. Interest groups will oppose the privatiza-tion of the electric power companies and complicate the reaching of a compro-mise between state and municipal governments in water and sanitation, but theobstacles are not insurmountable. The key challenge, then, is to tilt the balancebetween pragmatism and ideology to favor the former. This may happen as infra-structure bottlenecks become more critical in the near future. In particular, as eco-nomic conditions improve and the cost of capital continues to decline, privateoperators will be willing to charge lower usage fees, weakening one of the areas ofresistance.
Political Reform
As argued above, one cannot fully understand the relationship between reformand economic growth in Brazil over the last two decades without taking thecountry’s politics and political institutions into account. In particular, two ofthe defining features of Brazil’s political system—the reliance on proportional rep-resentation and on open lists, rather than majority rule (voto majoritário) andclosed lists, in the election of Congress has favored the rapid rise in current pub-lic expenditure since the return to democracy. Controlling this spending is cru-cial to improving the quality of macroeconomic policy and thus to strengtheningthe macroeconomic stability foundation. Therefore one of the priorities of reformmust be to bring about change in these institutions.
Brazil is not alone in experiencing high public expenditure under a propor-tional representation system: the political science literature reports a robust rela-tionship between the two in countries around the world. Persson and Tabellini(2003) show that the ratio of public expenditure to GDP tends to be 5 percenthigher, and social security expenditure 3 percent higher, in democracies that relyon proportional representation than in those that do not.
What accounts for this relationship? Persson, Roland, and Tabellini (2003)develop a theoretical model that suggests that higher public spending is a conse-quence of the greater party fragmentation induced by proportional representation.This also makes intuitive sense. If the executive is elected without a strong legisla-tive majority, it will have to build legislative support for its initiatives issue byissue, constantly assembling new coalitions, if it is to accomplish anything. Themore fragmented the legislature, the harder the executive will have to work to
brazil 103
11630-03_CH03_rev2.qxd 6/2/09 4:02 PM Page 103
build these coalitions, and the more it will have to bargain. Some parties willalready be inclined to support a given measure, but others will be at best indiffer-ent; to win their support, the executive will have to engage in “logrolling,” givingthese parties concessions on issues of more importance to them in exchange fortheir support on the issue at hand. The cost of these concessions will, of course,be additional to the cost of the executive’s own initiative, so that a successful bar-gain will increase public expenditure above what it would be if logrolling wereunnecessary, and obviously it will exceed what it would be if the initiative failedfor lack of support. Persson et al. (2003) show that legislative fragmentation(which can be measured in much the same way as concentration in an industry,using Herfindahl’s index) is important empirically in explaining the level ofpublic expenditure: they find no direct relationship between the system of gov-ernment (presidential or parliamentary) and the electoral rule (majoritarian orproportional), on the one hand, and the level of public expenditure, on the other,once they control for the degree of party fragmentation in the lower house of thelegislature.
Political institutions also matter for the level of corruption in governmentand for the ability of the government to take steps to control corruption; anti-corruption reforms, in turn, should contribute to strengthening several of thefoundations for growth (table 5). Here, however, the theoretical results are lessrobust. Persson and Tabellini’s analysis would suggest that the best electoral sys-tem from the standpoint of minimizing corruption is a proportional representa-tion system with open lists (because it is easier to challenge incumbents) and largeelectoral districts. Yet this is precisely the system that Brazil already has, and Brazil,at least according to opinion polls and the frequent news reports of political scan-dal, is clearly a long way from minimizing corruption. Moreover, Italy also hadthe same system until 1994 yet was considered to have the most corrupt politicsin the developed world.
What Persson and Tabellini’s analysis seems to overlook is the fact that pro-portional systems with open lists and large districts tend to have strong intrapartycompetition, which leads to expensive political campaigns. The cost of financingcampaigns in turn makes politicians more dependent on wealthy donors, with cor-ruption the result as the winning politicians reward their contributors withpolitical favors once in office (Golden and Chang, 2001; Chang, 2005). Changand Golden (2006) also report evidence showing that corruption is greater (andincreasing) in larger districts (more than fifteen representatives) that use openrather than closed lists; in smaller districts, however, corruption tends to be lowerwith open lists. Shugart, Valdini, and Suominen (2005) corroborate this finding,showing that in larger districts, candidates have a greater interest in differentiat-ing themselves from other candidates under an open-list than under a closed-listsystem, and that they do this through pork-barrel spending and corrupt prac-tices. Finally, Tavits (2007) argues that party fragmentation reduces the clarity of
104 a. c. pinheiro, r. bonelli, and s. de abreu pessôa
11630-03_CH03_rev2.qxd 6/2/09 4:02 PM Page 104
responsibility for political outcomes, and that where responsibility is less clear,corruption will be greater. Thus political fragmentation may be a culprit both inBrazil’s excessive spending growth and in its level of corruption.
What do these results imply in terms of recommendations for political reformin Brazil? Although the results of Persson and his coauthors indicate that a shiftto majority voting might lead to reduced expenditure, this would be a fairly rad-ical change for Brazil. It also appears unnecessary, since the above discussion sug-gests that the potentially adverse outcomes of proportional representation can beimproved simply by changing the parameters of the proportional system. In par-ticular, improvement in government spending decisions might be achievablethrough a reform that aims at lowering party fragmentation, especially in Con-gress, so that elected administrations can form the base of support necessary toaccomplish their objectives with fewer parties.
A particularly important parameter in determining the degree of party frag-mentation is the size of the electoral district. Unless regional parties are strong(Brazilian law makes them almost impossible to form), a minor party will havegreater difficulty winning a seat in any given district, the less seats are contested.In Brazil seats in the lower house of Congress (the Câmara dos Deputados) areallotted by state, with the number of seats proportional to its population. But thisnumber is truncated from above and below, with a minimum of eight seats guar-anteed to each of the smallest states and a maximum of seventy seats allowed forSão Paulo, the most populous state. Even this wide range in number of seats perstate (8.75 to 1) is far less than the actual differences in state population: at 41 mil-lion in 2006, São Paulo has 100 times the population of the smallest state,Roraima. Thus each legislator from São Paulo represents about twelve times asmany voters as a legislator from Roraima.
The studies by Chang and Golden (2006) and by Shugart et al. (2005) indi-cate that the performance of open-list systems with respect to corruption is notunfavorable in sufficiently small districts. Thus we propose the following reform:
• Divide the states that currently have more than nine representatives in theCâmara dos Deputados into smaller districts (for purposes of congressionalvoting only) with a minimum of five representatives each. Keep the remaininginstitutions (proportional representation, open lists, and so forth) unchanged.
This reform would reduce the degree of party fragmentation substantially andthus should have beneficial impacts on public spending. Additionally, the reduc-tion in the number of seats per district in the larger states would reduce intra-party competition without too great an increase in entry barriers. The studiescited above suggest that under this reform, corruption would be reduced as well;measures to reform campaign financing could also help in this regard (Samuels,2006, pp. 133–53). As a side benefit, this reform would also strengthen therepresentation of metropolitan areas (Monroe and Rose, 2002). Although crit-ical, this reform should be implemented incrementally, because such changes
brazil 105
11630-03_CH03_rev2.qxd 6/2/09 4:02 PM Page 105
inevitably generate uncertainty, and it is difficult to predict how the populationwould react to this change and to other changes in the functioning of institutionsgenerally.
Final Remarks
Brazil has implemented many reforms since the 1980s, without, however, achiev-ing the expected increase in economic growth. These reforms caused a significantrise in total factor productivity growth and made growth more inclusive, but theyfailed to boost investment or accelerate the lackluster pace of human capital accu-mulation. Performance in these areas was particularly poor compared with mostother countries at similar levels of development. We explain this outcome by thefact that many of the reforms were only partly implemented or were sidetrackedinto pursuing other objectives, while others strengthened one growth foundationbut weakened others. More important, even as Brazil pursued market-orientedreforms in many areas, it also engaged in what we have termed “anti-marketreforms”: changes in norms, resource allocation, and policies that discouragedinvestment and productivity growth and weakened the links between the market-oriented reforms and growth. These anti-market reforms severely undermined theimpact of the pro-market reforms on growth.
We view the expansion in public expenditure and the change in its composition—with a decline in public investment and a rise in current outlays—as the mostimportant of these anti-market reforms. Rising public expenditure was initiallyfinanced by rising inflation, then by public sector borrowing, and most recentlyby expanding tax revenue, in all cases with adverse consequences for macroeco-nomic stability and with negative spillovers on capital accumulation and produc-tivity growth. The 1988 constitution, which produced a mix of market-orientedand anti-market reforms, was a landmark in this process. Yet the policies embed-ded in the constitution did not constitute an isolated event, but only the mostnoteworthy of a series of policy initiatives that continued through the followingtwo decades in the same vein.
This indicates that these policy decisions were endogenous to the country’ssocial and political institutions. In particular, we attribute the problem of poorselection of reforms to the interplay between democratization, itself a majorreform, and Brazil’s highly unequal income distribution. Democratizationallowed voters to express their preference for a large, protective state. The repeatedexpansion of current public expenditure, notably transfers, is also consistent witha key feature of Brazil’s political system, namely, political party fragmentation,notably in the government’s congressional support base. Problems of informationasymmetry further explain the preference for a large state, as characterized by thefact that the regressive nature of the tax system is less transparent than the pro-gressive character of the more advertised social programs. Voters can assess rela-
106 a. c. pinheiro, r. bonelli, and s. de abreu pessôa
11630-03_CH03_rev2.qxd 6/2/09 4:02 PM Page 106
tively easily how public funds are spent but find it more difficult to recognize theincidence of indirect taxes.
Looking forward, macroeconomic stability is the foundation for growth whoseweakness is the most critical. The weakness of this pillar results from an unbal-anced policy mix, which overburdens monetary policy and requires a rising taxburden and a low rate of public investment to ensure public solvency. It is crucialthat public saving be increased. Thus the most critical reforms are those thatreduce current expenditure. We have argued that pension reform is the best wayto achieve this goal, but it is extremely unpopular in Brazil: barring a major crisis,we do not see what could make a wholesale reform in this area viable in the shortterm. Thus, as with other reforms, we suggest that piecewise, incremental reformbe adopted. This last point underlines our conclusion that significant curbs oncurrent public spending will have to wait for a change in the political environ-ment, not only to make pension reform more viable, but also because Brazilianpolitical institutions favor party fragmentation, which in turn tends to boost cur-rent public spending. Thus, to bring about a political environment conducive tolowering public expenditure, Brazil should pursue a reduction in party fragmen-tation, particularly concerning the number of parties represented in Congress, sothat governments can form majorities with fewer participating parties. We see anexpansion in the size of electoral districts as the most promising way to achievethat goal.
The insecurity of property rights comes second in our list of weakest founda-tions. The problem in this case stems from a combination of the poor quality ofthe laws produced by Congress, an executive that exploits judicial delay as a fiscalpolicy instrument while underestimating the importance of stable legal norms,and a judiciary that suffers under a procedural code that, despite recent progress,remains cumbersome, and from judicial activism and inefficiencies in its ownadministrative practices. More broadly, we have identified a national culture thatfavors pursuing “social justice” over judicial consistency, and which needs to bechanged if the rule of law is to be significantly strengthened.
To conclude, we stress three lessons with respect to the challenge of advancinggrowth-enhancing but unpopular market-oriented reforms while at the same timepreventing or even undoing popular anti-market reforms. Needless to say, polit-ical will is a necessary condition for success.
First, it is crucial to be pragmatic and avoid risking all one’s political capitalon a politically unfeasible reform, no matter how sensible it may be from an eco-nomic standpoint. Likewise, it makes more sense to pursue piecewise, seeminglyuncoordinated reforms than to get bogged down promoting an all-encompass-ing but unfeasible reform package. The recommendation, then, is to stress thosereforms that are politically less sensitive, such as tax reform, or that allow thelosers from reform to be at least partly compensated or protected through tran-sition or grandfather clauses. As an example, new rules for pension reform could
brazil 107
11630-03_CH03_rev2.qxd 6/2/09 4:02 PM Page 107
be designed to apply only to workers entering the labor market after the reform.Nonetheless, it is important to have and follow a general master plan to helpensure consistency.
Second, although Brazil’s skewed income distribution is one leading explana-tion of voters’ preferences for big government, another is the fact that voters havean imperfect perception of the consequences of their policy choices. Here a goodexample is the small redistributive impact of fiscal policy reform. By increasingtransparency about the diagnosis that informs the reform proposals, one can likelybuild a constituency for at least some reforms, without having to wait for the dis-tribution of income to improve—something that will not happen quickly in anycase. This highlights the importance of further academic work and a close linkwith the media, so as to change perceptions about how the majority of voters areaffected by current policy choices.
Third, in the past when Brazil has faced severe crises, notably foreign exchangecrises, unpopular reforms were approved as necessary evils that helped bring abouta greater good. To seize these opportunities, should they recur in the future, it is crucial to have well-developed reform proposals ready on the shelf, well knownto the political leadership, that can be rapidly approved. Likewise, some of thereforms discussed here, such as regulatory reform, face a kind of ideological oppo-sition that may wane significantly in the event of a political transition, such as theelection of a more centrist president. In that event, too, it would help to have well-developed reform projects that could be brought swiftly before the considerationof legislators.
References
Afonso, J. R., and R. Varsano. 2004. “Reforma Tributária: Sonhos e Frustrações.” In F. Giambiagi, J. G. Reis, and A. Urani, eds., Reformas no Brasil: Balanço e Agenda. Rio deJaneiro: Editora Nova Fronteira.
Barbosa Filho, F. de H., and S. de A. Pessôa. 2008. “A Carreira de Professor Estadual noBrasil: Os Casos de São Paulo e Rio Grande do Sul.” Rio de Janeiro: Fundação GetúlioVargas.
Barbosa Filho, F. de H., L. A. Afonso, and S. de A. Pessôa. 2008. “Um Estudo Sobre os Difer-enciais de Remuneração Entre os Professores das Redes Pública e Privada de Ensino.” Rio deJaneiro: Fundação Getúlio Vargas.
Barro, Robert J. 1990. “Government Spending in a Simple Model of Endogenous Growth.”Journal of Political Economy 98, no. 5, pt. 2: S103–25.
Barros, R. P. de, and R. Mendonça. 1995. “A Evolução do Bem-Estar, Pobreza e Desigualdadeno Brasil ao longo das Últimas Três Décadas—1960/1990.” Pesquisa e PlanejamentoEconômico 25, no. 1: 115–63.
Barros, R. P. de, M. de Carvalho, S. Franco, and R. Mendonça. 2007. “Determinantes Ime-diatos da Queda da Desigualdade de Renda Brasileira.” In Ricardo Paes de Barros, MiguelNathan Foguel, and Gabriel Ulyssea, eds., Desigualdade de Renda no Brasil: Uma Análiseda Queda Recente. Rio de Janeiro: Instituto de Pesquisa Econômica Aplicada. www.ipea.gov.br/082/08201004.jsp?ttCD_CHAVE=2783.
108 a. c. pinheiro, r. bonelli, and s. de abreu pessôa
11630-03_CH03_rev2.qxd 6/2/09 4:02 PM Page 108
Bénabou, R. 2006. “Inequality, Technology and the Social Contract.” In P. Aghion and S. Durlauf, eds., Handbook of Economic Growth. Amsterdam: Elsevier, North-Holland.
Carvalho Filho, I., and M. Chamon. 2006. “The Myth of Post-Reform Income Stagnation inBrazil.” IMF Working Paper 06/275. Washington: International Monetary Fund, WesternHemisphere and Research Departments (December).
Chang, Eric C. C. 2005. “Electoral Incentives for Political Corruption under Open-List Pro-portional Representation.” Journal of Politics 67, no. 3: 716–30.
Chang, Eric C. C., and Miriam A. Golden. 2006. “Electoral Systems, District Magnitude andCorruption.” British Journal of Political Science 37: 115–37.
Ferreira, S., and F. Veloso. 2006. “A Reforma da Educação.” In A. C. Pinheiro and F. Giambiagi, eds., Rompendo o Marasmo: A Retomada do Desenvolvimento no Brasil. Rio deJaneiro: Campus/Elsevier.
Ferreira, F., P. Leite, and M. Ravallion. 2007. “Poverty Reduction without Economic Growth?Explaining Brazil’s Poverty Dynamics, 1985–2004.” Policy Research Working Paper 4431.Washington: World Bank (December).
Giambiagi, F. 2006. Reforma da Previdência: O Encontro Marcado. Rio de Janeiro: Campus/Elsevier.
Giavazzi, F., and G. Tabellini. 2005. “Economic and Political Liberalization.” Journal ofMonetary Economics 52: 1297–1330.
Golden, Miriam A., and Eric C. C. Chang. 2001. “Competitive Corruption: Factional Con-flict and Political Malfeasance in Postwar Italian Christian Democracy.” World Politics 53:588–622.
Kakwani, N., M. Neri, and H. H. Son. 2006. “Linkages between Pro-Poor Growth and theLabor Market.” In Anais do XXXV Encontro Nacional de Economia. Niterói, Brazil: AssociaçãoNacional dos Centros de Pósgraduação em Economia. www.anpec.org.br/encontro2007/artigos/A07A096.pdf.
Mello, L., and E. Tiongson. 2006. “Income Inequality and Redistributive Government Spend-ing.” Public Finance Review 34, no. 3: 282–305.
Menezes-Filho, N. 2003. “Trade Liberalization and Inequality in Brazil.” Paper presented atthe seminar Brazil: Risks and Opportunities of Integration into the World Economy, SãoPaulo, November 4.
Monroe, Burt L., and Amanda G. Rose. 2002. “Electoral System and Unimagined Conse-quences: Partisan Effect of District Proportional Rule.” American Journal of Political Science46, no. 1: 67–89.
Persson, T., and G. Tabellini. 2003. The Economic Effects of Constitutions. MIT Press.Persson, Torsten, Gérard Roland, and Guido Tabellini. 2003. “How Do Electoral Rules Shape
Party Structures, Government Coalitions, and Economic Policies?” Working Paper 10176.Cambridge, Mass.: National Bureau of Economic Research.
Pinheiro, A. C., and R. Bonelli. 2007. “Financial Development, Growth and Equity in Brazil.”In R. Ffrench-Davis and J. L. Machinea, eds., Economic Growth with Equity—Challenges forLatin America. Houndmills, Basingstoke, U.K.: Palgrave-Macmillan.
Pinheiro, A. C., R. Bonelli, and B. R. Schneider. 2007. “Pragmatism and Market Reforms inBrazil.” In J. M. Fanelli, ed., Understanding Market Reforms in Latin America. Houndmills,Basingstoke, U.K.: Palgrave-Macmillan.
Pinheiro, A. C., and F. Giambiagi. 2006. Rompendo o Marasmo: A Retomada do Desenvolvi-mento no Brasil. Rio de Janeiro: Campus/Elsevier.
Samuels, D. 2006. Financiamento de Campanhas no Brasil e Propostas de Reformas—ReformaPolítica, Lições da História Recente. Rio de Janeiro: Editora FGV.
Shugart, Matthew Soberg, Melody Ellis Valdini, and Kati Suominen. 2005. “Looking forLocals: Voter Information Demands and Personal Vote-Earning Attributes of Legislators
brazil 109
11630-03_CH03_rev2.qxd 6/2/09 4:02 PM Page 109
under Proportional Representation.” American Journal of Political Science 49, no. 2:437–49.
Tafner, P., and F. Giambiagi, eds. 2007, Previdência no Brasil–Debates, Dilemas e Escolhas. Riode Janeiro: Instituto de Pesquisa Econômica Aplicada.
Tavits, Margit. 2007. “Clarity of Responsibility and Corruption.” American Journal of Politi-cal Science 51, no. 1: 218–29.
110 a. c. pinheiro, r. bonelli, and s. de abreu pessôa
11630-03_CH03_rev2.qxd 6/2/09 4:02 PM Page 110
111
At the end of the 1980s, Colombia confronted a situation of slow economicgrowth and unsettled domestic security. To address these issues, a compre-
hensive reform effort was undertaken starting in 1990. The agenda comprised aset of market-driven reforms aimed at enhancing competition and the role of theprivate sector, as well as a vast array of institutional reforms aimed at strengthen-ing macroeconomic stability, promoting equality of opportunities in the politicaland judicial arenas, and sharing more broadly the benefits of growth across regionsand individuals. In this chapter we show that this ambitious reform drive provedvery challenging. Reforms aimed at strengthening some foundations for growthactually weakened others. Restrictions stemming from the local environment andissues of design prevented many of the reforms from fully delivering on theirpromise. In particular, the benefits of broadened opportunities achieved throughfiscal decentralization, increased social expenditure, and expanded access to thejudicial system must be contrasted with the fiscal deterioration and macroeco-nomic vulnerability that accompanied them.
Starting in 1999, a succession of three administrations tackled some of thesalient problems. Although this effort, coupled with a supportive external envi-ronment and improved security, delivered a favorable economic outcome, chal-
Colombia’s Efforts at Achieving Inclusive and Sustainable Growthroberto steiner, irene clavijo, and natalia salazar
4
We have received very useful comments from Liliana Rojas-Suárez, Nora Lustig, Ernesto Stein,Felipe Botero, Mauricio Cárdenas, and Mauricio Santamaria and from participants at a September2007 workshop at the Center for Global Development in Washington.
11630-04_CH04_rev2.qxd 6/2/09 4:11 PM Page 111
lenges remain in further strengthening the foundations for growth. This chapterwill offer some proposals to that effect, with an emphasis on the need to removesome of the limitations imposed by the local environment, particularly those aris-ing from a highly activist judicial system.
The Road to a Comprehensive Reform Effort
During the late 1960s and 1970s, Colombia’s economic performance was strong.Between 1965 and 1979 real GDP growth averaged 5.6 percent a year, and infla-tion, although seldom in the single digits, never experienced the sharp rises typi-cal of some other Latin American countries. Prudent macroeconomic policiesrather than a particularly stable external environment were behind these develop-ments.1 Growth in output per worker, which averaged 1.8 percent a year during1965–79, was led by increases in total factor productivity (TFP), which grew atan average rate of 1.1 percent a year (Cárdenas, 2007). The 1960s and 1970s werealso a period of political tranquility and of progress in social indicators. A 1958power sharing agreement between the two historically dominant political partieshad brought an end to political violence, and peace and economic prosperity facil-itated a decline in poverty and an improvement in the distribution of income.2
Although Colombia was, except for Chile, the only large regional economy notto be devastated by the 1980s debt crisis, performance during that decade was atbest mediocre. Average GDP growth declined to 3.4 percent a year, led by a dis-mal performance of TFP, which contracted at an annual rate of 1 percent duringthe decade.3 Most social indicators continued to improve, but at a slower pace.The salient feature of the 1980s was the deterioration in security.4
112 roberto steiner, irene clavijo, and natalia salazar
1. A study by the Inter-American Development Bank (1995) characterized Colombia’s economicpolicy as the most stable among twenty-two regional economies. Except during a short period in theearly 1980s, the fiscal deficit was always small. Until 1993, public debt had never surpassed 20 per-cent of GDP.
2. Income inequality declined during the 1960s and 1970s (Londoño, 1995). Recent estimations,although not strictly comparable to the earlier ones, suggest that the distribution of income improvedonly slightly during the 1980s.
3. As part of the policy package designed to confront the decline in net foreign transfers that fol-lowed the Mexican crisis, throughout the 1980s the Colombian economy became increasingly distortedand closed to foreign competition. Whereas in 1980 around a third of imports were prohibited or sub-ject to government approval, by 1984 that share had risen to 99.6 percent. Labor market regulation wasinflexible and obsolete. Restrictions and distortions were also prevalent in the financial sector. A vastarray of exchange controls supported a crawling peg exchange rate regime, and legislation governing for-eign direct investment appeared to be aimed at severing ties with the world economy. The tax system,meanwhile, featured double taxation of distributed earnings and a broad range of exemptions.
4. Drug money emboldened the cartels and Marxist guerrilla movements. In 1982, when the gov-ernment began to extradite drug traffickers to the United States, the drug mafia declared war. Theguerrillas, who had been somewhat active in remote regions in the 1970s, became important actorsduring the 1980s. It was during the early 1980s that the head of Colombia’s main business associa-tion memorably said, “even though the economy is doing well, the country is doing poorly.” By theend of the decade this decoupling seemed untenable.
11630-04_CH04_rev2.qxd 6/2/09 4:11 PM Page 112
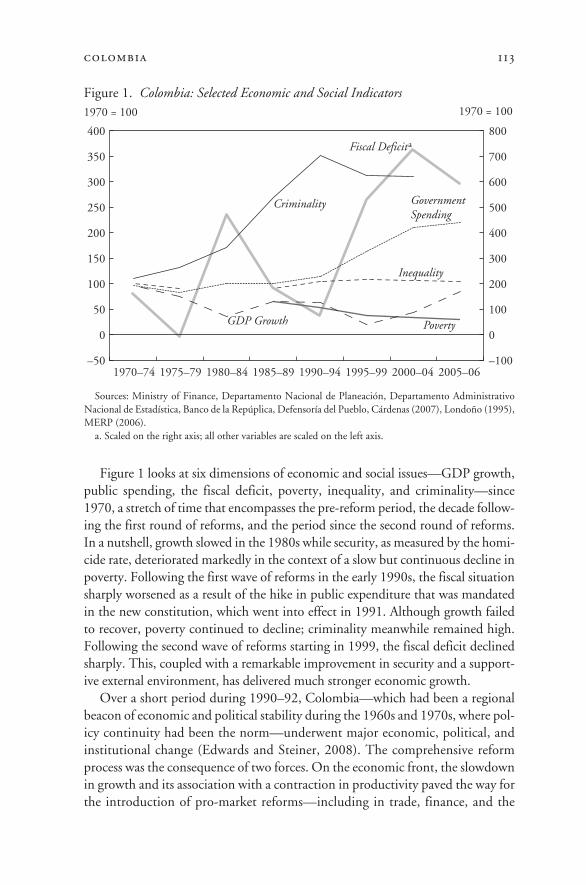
Figure 1 looks at six dimensions of economic and social issues—GDP growth,public spending, the fiscal deficit, poverty, inequality, and criminality—since1970, a stretch of time that encompasses the pre-reform period, the decade follow-ing the first round of reforms, and the period since the second round of reforms.In a nutshell, growth slowed in the 1980s while security, as measured by the homi-cide rate, deteriorated markedly in the context of a slow but continuous decline inpoverty. Following the first wave of reforms in the early 1990s, the fiscal situationsharply worsened as a result of the hike in public expenditure that was mandatedin the new constitution, which went into effect in 1991. Although growth failedto recover, poverty continued to decline; criminality meanwhile remained high.Following the second wave of reforms starting in 1999, the fiscal deficit declinedsharply. This, coupled with a remarkable improvement in security and a support-ive external environment, has delivered much stronger economic growth.
Over a short period during 1990–92, Colombia—which had been a regionalbeacon of economic and political stability during the 1960s and 1970s, where pol-icy continuity had been the norm—underwent major economic, political, andinstitutional change (Edwards and Steiner, 2008). The comprehensive reformprocess was the consequence of two forces. On the economic front, the slowdownin growth and its association with a contraction in productivity paved the way forthe introduction of pro-market reforms—including in trade, finance, and the
colombia 113
Figure 1. Colombia: Selected Economic and Social Indicators
Sources: Ministry of Finance, Departamento Nacional de Planeación, Departamento Administrativo Nacional de Estadística, Banco de la Repúplica, Defensoría del Pueblo, Cárdenas (2007), Londoño (1995), MERP (2006).
a. Scaled on the right axis; all other variables are scaled on the left axis.
1970 = 100 1970 = 100
–50
0
50
100
150
200
250
300
350
400
Poverty
Inequality
Criminality GovernmentSpending
GDP Growth
2005–062000–041995–991990–941985–891980–841975–791970–74–100
0
100
200
300
400
500
600
700
800Fiscal Deficita
11630-04_CH04_rev2.qxd 6/2/09 4:11 PM Page 113
114 roberto steiner, irene clavijo, and natalia salazar
labor market—during the second half of 1990. On the political-institutionalfront, in late 1990 a popularly elected Constitutional Assembly was entrusted withrewriting the country’s 100-year-old constitution, with the expectation that thenew constitution would enhance governance and facilitate both the containmentof the drug cartels and the negotiation of a peace agreement with the guerrillamovements. The new constitution significantly expanded expenditure in healthand education and broadened access to the judicial system and to the politicalprocess. These measures were aimed at sharing the benefits of growth morebroadly, so as to make growth more sustainable.
Several analyses of the new constitution support the following general descrip-tion of its contents:
• It commits the nation to a welfare state, in contrast to the market-orientedreforms being introduced at the same time.
• It mandates that the central government transfer a large and growing portionof tax revenue to subnational governments (departments and municipalities) inorder to finance a meaningful expansion of expenditure in health and education.
• It empowers citizens, particularly by establishing the acción de tutela, anexpeditious mechanism granting immediate access to the judicial system.
• It shifts the policymaking structure from one characterized by a powerfulpresident to one in which subnational governments, the Constitutional Court,and the central bank are key actors as well. In those areas that are “hard-wired” inthe constitution—such as the transfers to subnational governments to fund healthand education—the executive saw its discretion significantly reduced.
In terms of the CGD framework (see chapter 2), the early 1990s reform drivesought to affect four of the five foundations: fostering economic and political com-petition, promoting equality of opportunities, broader sharing of the benefits ofgrowth, and protecting macroeconomic stability, the last of these particularly bygranting independence to the central bank and introducing fully funded privatepension funds. Progress on the fifth foundation, securing property rights, mighthave occurred as a by-product of the pension reform. The prominence given tocompetition reflected the fact that lagging productivity was viewed as driving theslowdown in growth during the 1980s. Likewise, promoting competition andequality of opportunities on the economic, political, and judicial fronts was ameans of dealing with a much deteriorated political and security situation bybroadening the pool of beneficiaries from growth.
During the decade that followed the launch of the reforms, the economyunderperformed. The fiscal position weakened, the economy became more vul-nerable and volatile, poverty reduction slowed,5 and income distribution wors-
5. This statement applies when poverty is defined in terms of unsatisfied basic needs, as in figure 1.When poverty is defined as the percentage of the population living on less than x amount per day,poverty becomes highly pro-cyclical, increasing during the second half of the 1990s.
11630-04_CH04_rev2.qxd 6/2/09 4:11 PM Page 114
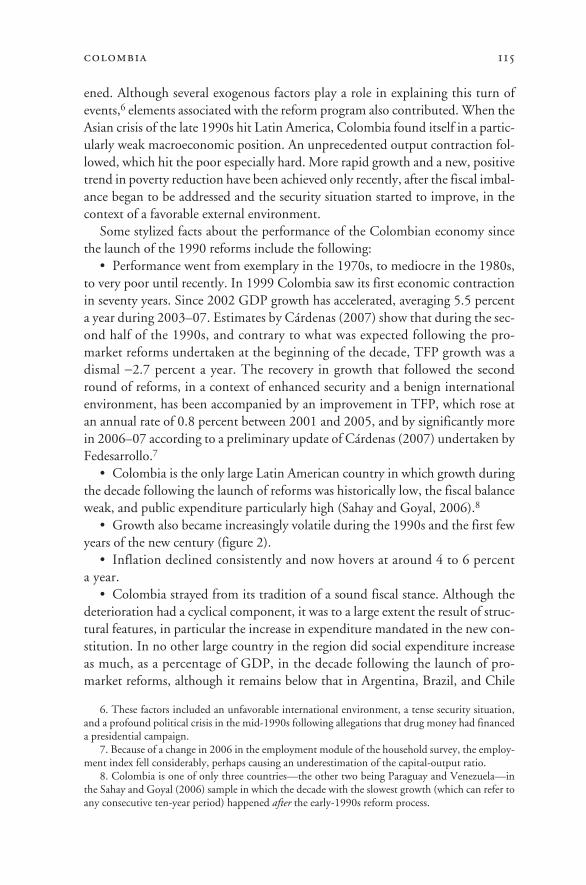
ened. Although several exogenous factors play a role in explaining this turn ofevents,6 elements associated with the reform program also contributed. When theAsian crisis of the late 1990s hit Latin America, Colombia found itself in a partic-ularly weak macroeconomic position. An unprecedented output contraction fol-lowed, which hit the poor especially hard. More rapid growth and a new, positivetrend in poverty reduction have been achieved only recently, after the fiscal imbal-ance began to be addressed and the security situation started to improve, in thecontext of a favorable external environment.
Some stylized facts about the performance of the Colombian economy sincethe launch of the 1990 reforms include the following:
• Performance went from exemplary in the 1970s, to mediocre in the 1980s,to very poor until recently. In 1999 Colombia saw its first economic contractionin seventy years. Since 2002 GDP growth has accelerated, averaging 5.5 percenta year during 2003–07. Estimates by Cárdenas (2007) show that during the sec-ond half of the 1990s, and contrary to what was expected following the pro-market reforms undertaken at the beginning of the decade, TFP growth was adismal −2.7 percent a year. The recovery in growth that followed the secondround of reforms, in a context of enhanced security and a benign internationalenvironment, has been accompanied by an improvement in TFP, which rose atan annual rate of 0.8 percent between 2001 and 2005, and by significantly morein 2006–07 according to a preliminary update of Cárdenas (2007) undertaken byFedesarrollo.7
• Colombia is the only large Latin American country in which growth duringthe decade following the launch of reforms was historically low, the fiscal balanceweak, and public expenditure particularly high (Sahay and Goyal, 2006).8
• Growth also became increasingly volatile during the 1990s and the first fewyears of the new century (figure 2).
• Inflation declined consistently and now hovers at around 4 to 6 percenta year.
• Colombia strayed from its tradition of a sound fiscal stance. Although thedeterioration had a cyclical component, it was to a large extent the result of struc-tural features, in particular the increase in expenditure mandated in the new con-stitution. In no other large country in the region did social expenditure increaseas much, as a percentage of GDP, in the decade following the launch of pro-market reforms, although it remains below that in Argentina, Brazil, and Chile
colombia 115
6. These factors included an unfavorable international environment, a tense security situation,and a profound political crisis in the mid-1990s following allegations that drug money had financeda presidential campaign.
7. Because of a change in 2006 in the employment module of the household survey, the employ-ment index fell considerably, perhaps causing an underestimation of the capital-output ratio.
8. Colombia is one of only three countries—the other two being Paraguay and Venezuela—inthe Sahay and Goyal (2006) sample in which the decade with the slowest growth (which can refer toany consecutive ten-year period) happened after the early-1990s reform process.
11630-04_CH04_rev2.qxd 6/2/09 4:11 PM Page 115
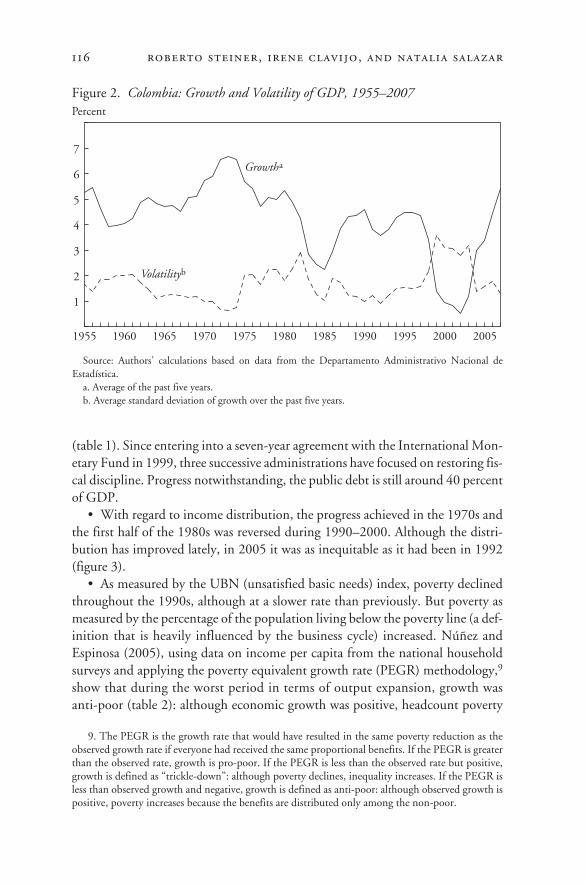
(table 1). Since entering into a seven-year agreement with the International Mon-etary Fund in 1999, three successive administrations have focused on restoring fis-cal discipline. Progress notwithstanding, the public debt is still around 40 percentof GDP.
• With regard to income distribution, the progress achieved in the 1970s andthe first half of the 1980s was reversed during 1990–2000. Although the distri-bution has improved lately, in 2005 it was as inequitable as it had been in 1992(figure 3).
• As measured by the UBN (unsatisfied basic needs) index, poverty declinedthroughout the 1990s, although at a slower rate than previously. But poverty asmeasured by the percentage of the population living below the poverty line (a def-inition that is heavily influenced by the business cycle) increased. Núñez andEspinosa (2005), using data on income per capita from the national householdsurveys and applying the poverty equivalent growth rate (PEGR) methodology,9
show that during the worst period in terms of output expansion, growth wasanti-poor (table 2): although economic growth was positive, headcount poverty
116 roberto steiner, irene clavijo, and natalia salazar
9. The PEGR is the growth rate that would have resulted in the same poverty reduction as theobserved growth rate if everyone had received the same proportional benefits. If the PEGR is greaterthan the observed rate, growth is pro-poor. If the PEGR is less than the observed rate but positive,growth is defined as “trickle-down”: although poverty declines, inequality increases. If the PEGR isless than observed growth and negative, growth is defined as anti-poor: although observed growth ispositive, poverty increases because the benefits are distributed only among the non-poor.
Figure 2. Colombia: Growth and Volatility of GDP, 1955–2007
Source: Authors’ calculations based on data from the Departamento Administrativo Nacional deEstadística.
a. Average of the past five years.b. Average standard deviation of growth over the past five years.
Percent
1
2
3
4
5
6
7
Volatilityb
1955 1960 1965 1970 1975 1980 1985 1990 1995 2000 2005
Growtha
11630-04_CH04_rev2.qxd 6/2/09 4:11 PM Page 116
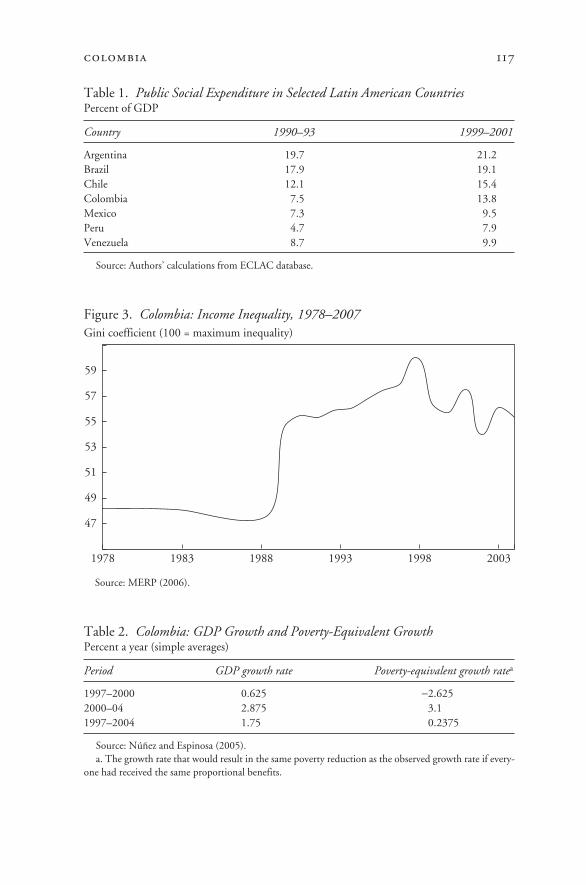
colombia 117
Table 1. Public Social Expenditure in Selected Latin American CountriesPercent of GDP
Country 1990–93 1999–2001
Argentina 19.7 21.2Brazil 17.9 19.1Chile 12.1 15.4Colombia 7.5 13.8Mexico 7.3 9.5Peru 4.7 7.9Venezuela 8.7 9.9
Source: Authors’ calculations from ECLAC database.
Figure 3. Colombia: Income Inequality, 1978–2007
Source: MERP (2006).
Gini coefficient (100 = maximum inequality)
47
49
51
53
55
57
59
200319981993198819831978
Table 2. Colombia: GDP Growth and Poverty-Equivalent GrowthPercent a year (simple averages)
Period GDP growth rate Poverty-equivalent growth ratea
1997–2000 0.625 −2.6252000–04 2.875 3.11997–2004 1.75 0.2375
Source: Núñez and Espinosa (2005).a. The growth rate that would result in the same poverty reduction as the observed growth rate if every-
one had received the same proportional benefits.
11630-04_CH04_rev2.qxd 6/2/09 4:11 PM Page 117
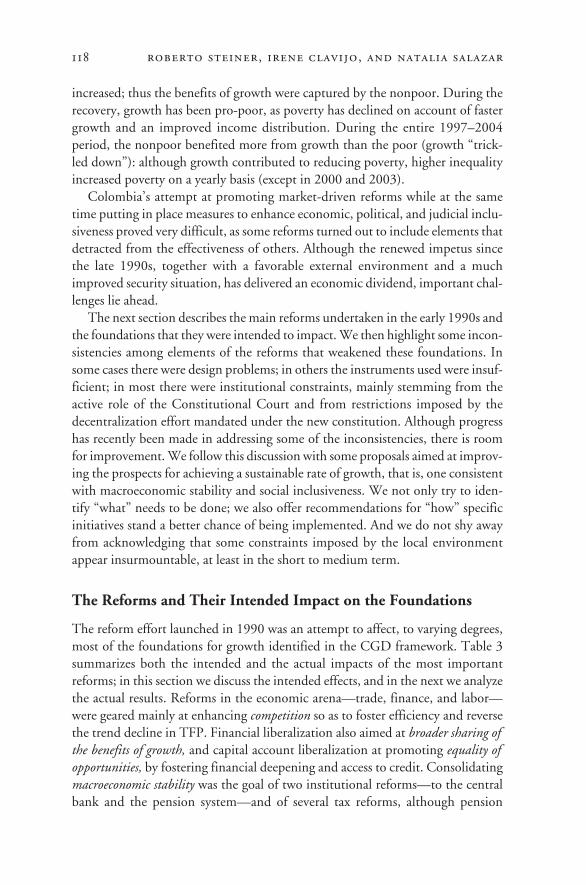
increased; thus the benefits of growth were captured by the nonpoor. During therecovery, growth has been pro-poor, as poverty has declined on account of fastergrowth and an improved income distribution. During the entire 1997–2004period, the nonpoor benefited more from growth than the poor (growth “trick-led down”): although growth contributed to reducing poverty, higher inequalityincreased poverty on a yearly basis (except in 2000 and 2003).
Colombia’s attempt at promoting market-driven reforms while at the sametime putting in place measures to enhance economic, political, and judicial inclu-siveness proved very difficult, as some reforms turned out to include elements thatdetracted from the effectiveness of others. Although the renewed impetus sincethe late 1990s, together with a favorable external environment and a muchimproved security situation, has delivered an economic dividend, important chal-lenges lie ahead.
The next section describes the main reforms undertaken in the early 1990s andthe foundations that they were intended to impact. We then highlight some incon-sistencies among elements of the reforms that weakened these foundations. Insome cases there were design problems; in others the instruments used were insuf-ficient; in most there were institutional constraints, mainly stemming from theactive role of the Constitutional Court and from restrictions imposed by thedecentralization effort mandated under the new constitution. Although progresshas recently been made in addressing some of the inconsistencies, there is roomfor improvement. We follow this discussion with some proposals aimed at improv-ing the prospects for achieving a sustainable rate of growth, that is, one consistentwith macroeconomic stability and social inclusiveness. We not only try to iden-tify “what” needs to be done; we also offer recommendations for “how” specificinitiatives stand a better chance of being implemented. And we do not shy awayfrom acknowledging that some constraints imposed by the local environmentappear insurmountable, at least in the short to medium term.
The Reforms and Their Intended Impact on the Foundations
The reform effort launched in 1990 was an attempt to affect, to varying degrees,most of the foundations for growth identified in the CGD framework. Table 3summarizes both the intended and the actual impacts of the most importantreforms; in this section we discuss the intended effects, and in the next we analyzethe actual results. Reforms in the economic arena—trade, finance, and labor—were geared mainly at enhancing competition so as to foster efficiency and reversethe trend decline in TFP. Financial liberalization also aimed at broader sharing ofthe benefits of growth, and capital account liberalization at promoting equality ofopportunities, by fostering financial deepening and access to credit. Consolidatingmacroeconomic stability was the goal of two institutional reforms—to the centralbank and the pension system—and of several tax reforms, although pension
118 roberto steiner, irene clavijo, and natalia salazar
11630-04_CH04_rev2.qxd 6/2/09 4:11 PM Page 118
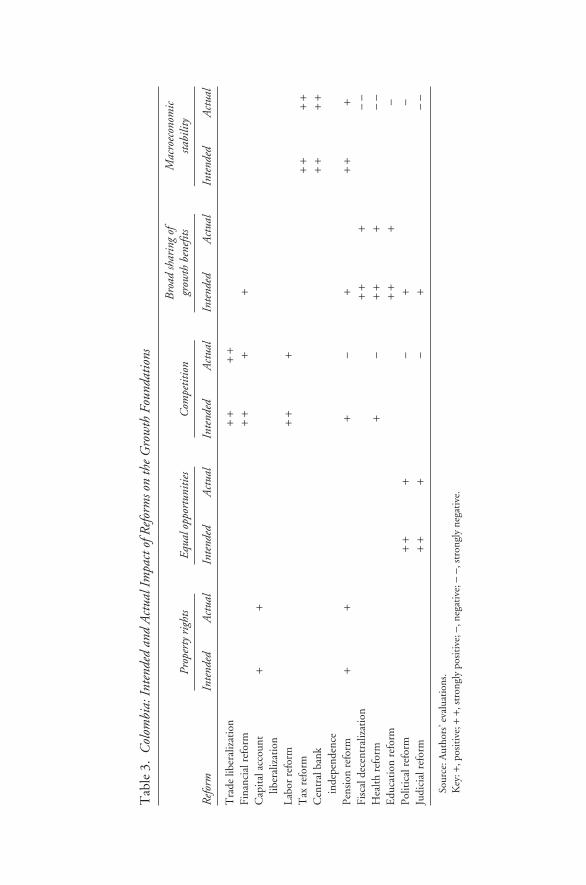
Tab
le 3
.C
olom
bia:
Int
ende
d an
d A
ctua
l Im
pact
of R
efor
ms o
n th
e G
row
th F
ound
atio
ns
Bro
ad sh
arin
g of
M
acro
econ
omic
Pr
oper
ty r
ight
sEq
ual o
ppor
tuni
ties
Com
petit
ion
grow
th b
enef
itssta
bilit
y
Ref
orm
Inte
nded
Act
ual
Inte
nded
Act
ual
Inte
nded
Act
ual
Inte
nded
Act
ual
Inte
nded
Act
ual
Tra
de li
bera
lizat
ion
++
++
Fina
ncia
l ref
orm
++
++
Cap
ital
acc
ount
+
+lib
eral
izat
ion
Labo
r re
form
++
+T
ax r
efor
m+
++
+C
entr
al b
ank
++
++
inde
pend
ence
Pens
ion
refo
rm+
++
−+
++
+Fi
scal
dec
entr
aliz
atio
n +
++
−−
Hea
lth r
efor
m+
−+
++
−−
Edu
cati
on r
efor
m+
++
−Po
litic
al r
efor
m+
++
−+
−Ju
dici
al r
efor
m+
++
−+
−−
Sour
ce: A
utho
rs’ e
valu
atio
ns.
Key
: +, p
osit
ive;
++,
str
ongl
y po
siti
ve; −
, neg
ativ
e; −
−, s
tron
gly
nega
tive
.
11630-04_CH04_rev2.qxd 6/2/09 4:11 PM Page 119
reform had other objectives as well. Broader sharing of the benefits of growth wasalso the main goal of decentralization, which was undertaken together with a hikein social expenditure. Equality of opportunities, and to a lesser extent the broadersharing of the benefits of growth, was the purpose of reforms in the judicial andpolitical arenas.10
Enhancing Competition and Lowering Barriers to Entry
The centerpiece of the economic reforms was trade liberalization. Launched as agradual reform in the late 1980s, it was significantly expanded in 1991. The driv-ing force behind this reform was the view that the economy should be exposedto foreign competition as a means of reversing the pattern of declining TFP wit-nessed throughout the 1980s, which, as noted above, explained most of thegrowth slowdown. The five-year program that began in early 1990 was gearedtoward eliminating quantitative restrictions, reducing tariff rates and the num-ber of tariff levels, implementing institutional reforms, and negotiating inter-national trade agreements. In October 1990 a new government issued a three-yearliberalization schedule, which included the agricultural sector. But instead ofincreasing as expected, imports actually declined. Together with an increase incapital inflows, this made monetary management exceedingly difficult. In June1991 it was decided that the initial liberalization schedule would be carried outby September 1991.
Trade liberalization was accompanied by financial liberalization. This reformsought to foster competition and efficiency and to strengthen and deepen thefinancial sector. It also aimed at a more level playing field in which foreign insti-tutions could compete on an equal footing with local ones, and in which allinvestors, not only those with connections, could allocate their portfolios acrossborders.11 With the enforcement of new capitalization standards and stronger reg-ulation and supervision, it was expected that the financial sector would contributeto economic stability. Specific features of the package included removal of barri-ers to entry, reduction and rationalization of reserve requirements, liberalizationof most interest rates, a reduction in forced investments, and the privatization ofsome banks. Law 9 of 1991 removed all entry restrictions and established nationaltreatment for foreign direct investment. It also eliminated limits on the profitsthat foreign firms could transfer abroad.
The authorities held the view that for the country to effectively compete in theglobal economy, a more flexible labor market was needed. The 1990 reform made
120 roberto steiner, irene clavijo, and natalia salazar
10. Other than through the introduction of private pension funds, the strengthening of propertyrights does not appear to have been an important goal of the reforms undertaken since the early 1990s.
11. An important component of financial liberalization was the dismantling of capital controlsthat had been in place for over twenty years. Also, a general amnesty was given to Colombians whohad kept foreign exchange abroad.
11630-04_CH04_rev2.qxd 6/2/09 4:11 PM Page 120
contracts more flexible and reduced labor costs. Importantly, it attempted toreduce the gap between formal sector workers and those working informally. Inorder to expand formalization, dismissal costs and nonwage labor costs werereduced and short-term contracts and flexibility in the definition of working hoursintroduced. At the same time, procedures for establishing a labor union were madesimpler, a regulation forbidding them from participating in politics was repealed,and liabilities to workers were granted seniority in the event of their employer’sbankruptcy.
Promoting Macroeconomic Stability
To enhance macroeconomic stability, the 1991 constitution granted indepen-dence to the central bank. Its board of directors is the authority in charge of monetary, exchange rate, and credit policy. The board is composed of sevenmembers: five of these are appointed by the government for concurrent four-year terms, but every four years only two of the five may be replaced;12 the min-ister of finance is a member of the board and together with the five appointedmembers elects the central bank governor for a four-year term that can berenewed twice. The central bank may not extend credit or offer guarantees tothe private nonfinancial sector and may extend direct credit to the governmentonly upon unanimous vote by its board. It must strive for a low and stable rateof inflation, in coordination with overall economic policy. In the event thatother goals conflict with achieving low and stable inflation, the bank must givepriority to the latter.
Another reform undertaken mainly with the purpose of promoting macro-economic stability was a major transformation of the pension system in 1993.The system previously in place exhibited all the limitations of a public pay-as-you-go (PAYGO) scheme: contributions and benefits differed across the vari-ous subsystems; the earliest retirees received huge transfers; contributions wereweakly linked to benefits; coverage was low; administration was inefficient; andthe system lacked adequate reserves and therefore depended on growing fiscaltransfers. The reform established a general scheme composed of two sub-systems: a public PAYGO regime and a subsidized individual savings schemeusing privately managed funds (administradoras de fondos de pensiones, or AFPs).Although the subsystems were separate from one another, transfers betweenthem were allowed. The system was made mandatory for employees in the pri-vate and public sectors. Until it was reformed again in 2003, participation wasoptional for the self-employed and for dependents of participants. Although along transition period was allowed, the reform increased the retirement age,
colombia 121
12. The tenure of the Colombian president is four years, and until 2005 the president could notseek a second term.
11630-04_CH04_rev2.qxd 6/2/09 4:11 PM Page 121
raised contribution rates and eligibility requirements, and rationalized benefits.In addition to placing the system in a more sustainable financial position, otherobjectives of the reform included exposing the public fund to competition, pro-moting the development of the capital market, and, in the case of the 2003reform, better targeting of subsidies. A by-product of the reform was greatersecurity of the pension rights of formal sector workers, with rights more clearlydefined in individual accounts.
Since the early 1990s Colombia has undergone several tax reforms. Unlike thereform of 1986, which brought about a major improvement in the quality of thetax code, the reforms undertaken since 1990 have aimed at increasing tax revenue,to finance the increase in public expenditure mandated, for the most part, in the1991 constitution.
Broader Sharing of the Benefits of Growth and Greater Equality of Opportunities
The second half of the 1980s saw a growing recognition that decentralizationshould play a major role in rebuilding trust in institutions, in the context of a crit-ical security situation. Self-government was seen as a means of consolidatingdemocracy while improving the efficiency of government intervention. The 1991constitution established the popular election of governors,13 as well as the abilityto remove them and mayors through popular vote. It increased the amount ofresources transferred from the central government to subnational governments—and, implicitly, from wealthier to poorer regions—in order to ensure broad accessto health and education. The constitution went into great detail regarding the dis-tribution of resources among government levels and expenditure categories;widened the base for calculating transfers and increased them significantly; gavelocal authorities the power to levy taxes; and established that income frommonopolies that are the property of regions may not be appropriated by the cen-tral government.
The 1993 reform of the health care system was mainly geared toward broadersharing of the benefits of growth, by promoting universal coverage and incorpo-rating elements of solidarity and fairness. It also aimed at fostering competitionbetween private and public providers to enhance quality and efficiency. Thereform changed the way public hospitals are financed (through the sale of servicesrather than through the budget), decentralized their administration, and forcedthem to compete with private hospitals, so that the efficient public hospitalsshould thrive and others close. The system uses vouchers to subsidize demand,with the costs distributed between employers and employees when the insured hasthe ability to pay, and the responsibility of the government otherwise. Cross sub-
122 roberto steiner, irene clavijo, and natalia salazar
13. Mayors had been elected, rather than appointed by the central government, since 1986.
11630-04_CH04_rev2.qxd 6/2/09 4:11 PM Page 122
sidies, both among those who can contribute and between them and those whocannot, promote solidarity.14
In addition to introducing the popular election of governors, the 1991 consti-tution included a major political reform focused on enhancing representation,weakening the two-party system, empowering voters, and shifting power awayfrom the executive.15 The reform aimed at improving equality of opportunitiesand may contribute to broader sharing of the benefits of growth as well. It estab-lished that the senate would be elected on a nationwide basis, on the premise thatcandidates of minority groups, all but unelectable in small districts, could gatherenough votes from across the different regions to win seats.16 Also, voting in anational district was expected to place at a disadvantage the small regional move-ments that had become prevalent during the Frente Nacional period (Botero,2000).17 The constitution lowered barriers to entry, empowered citizens to orga-nize political parties, and made it easier for voters to directly submit proposed leg-islation to Congress and to remove elected officials. The constitution also assignedto Congress additional legislative and control functions. An important provisionmade it much more complicated for the executive to use extraordinary powers tolegislate (Ungar, 2003), and Congress can now override a presidential veto with asimple majority.
The 1991 constitution promoted equality of opportunities by expanding accessto the justice system. All citizens are now in a better position to claim their consti-tutional rights, which also promotes the broader sharing of the benefits of growth.The constitution enshrined the concept of an estado social de derecho, geared
colombia 123
14. The system operates on the basis of an insurance premium (which is calibrated to reflect gen-der, age, and regional differences) and offers a standard package to workers and their dependents. Forself-employed and formal sector workers there is a contributory regime, funded by a contributionfrom wages. Health promotion firms affiliate individuals and receive contributions. Contributorsmay choose their own health promotion firm as well as their own service provider. Each firm trans-fers the contributions it collects in excess of entitled capitation payments to a public fund and is com-pensated by the fund when contributions fall short of entitled capitation payments. Individualswishing to enroll in the subsidized regime must come from a household at level 1 or 2 of Sisben (aproxy means test index stratifying households into six levels). One-twelfth of contributions are trans-ferred to the subsidized regime, and those eligible for coverage who remain uninsured (vinculados)receive services from public hospitals or from private ones that enter into contracts with subnationalgovernments.
15. Cárdenas, Junguito, and Pachón (2006) provide a good description of how the 1991 con-stitution redistributed power away from the executive and toward the legislative, the subnationalgovernments, the judiciary, and the central bank.
16. Two of the 102 Senate seats were reserved to those elected in a district reserved for indige-nous groups.
17. The Frente Nacional (FN) was a 1958 compromise to end civil unrest between the two his-torically dominant parties. Although the compromise formally ended in 1974, many of its provisionslasted longer. During the FN, 50 percent of seats in Congress were reserved for each party, exclud-ing all others. Elections thus became a personal contest within parties rather than an ideological con-test between them. When the FN formally ended, provisions allowing parties to present multiple listsin an election were preserved.
11630-04_CH04_rev2.qxd 6/2/09 4:11 PM Page 123
toward ensuring not only those rights labeled as “first generation” (that is, civilliberties, which are ensured through government restraint) but also “second gen-eration” rights (access to certain services that require positive action by the state).Although the constitution defines first-generation rights as “fundamental” andsecond-generation rights as “social and economic,”18 it also established a mecha-nism (the tutela) by which any citizen who feels his or her rights have been dis-regarded may go before any judge and seek restitution, which, if the judge rules in favor, must be provided immediately.19 The country’s highest court, theConstitutional Court, has developed the principle of connectivity (principio deconexidad ), according to which many rights not deemed “fundamental” in theconstitution are to be treated as such. For example, a connection has been estab-lished between access to health care (a second-generation right) and the funda-mental right to life.
The Reforms in Practice
Table 3 shows that many of the expected effects of the early-1990s reforms onthe foundations of growth were indeed achieved. However, in several cases—particularly with respect to decentralization of health and education expendi-ture, and political and judicial reform—there were also unintended consequences.Several inconsistencies had become evident by the late 1990s, including thefollowing:
• Some policies proved fiscally unsustainable; notable among these was themajor expansion of expenditure in the social sectors by subnational governments.
• Some social policies, financed through taxes on labor, fostered the move-ment of workers to the informal sector.
• Reforms in the political arena geared at broadening representation also fos-tered party fragmentation and increased political transaction costs.
• Reforms aimed at facilitating access to the justice system also empoweredjudges and made the Constitutional Court a veto player in economic policy.This section highlights some of the problems that characterized the reform effortand reports on corrective measures undertaken since. Reference will be made tolimitations stemming from the local environment, issues of design, and inconsis-tencies among elements of different reforms. The picture that emerges is one oftension between policies aimed at enhancing competition and promoting macro-
124 roberto steiner, irene clavijo, and natalia salazar
18. Chapter 1 of Title II is “On Fundamental Rights”: the right to life (article 11), to religiousfreedom (article 19), to free speech (article 20), and to due process (article 29). Chapter 2 is “OnSocial, Economic and Cultural Rights,” which include social security (article 48), health (article 49),dignified housing (article 51), and property (articles 58–61).
19. Tutelas need not be in writing, and the judge must rule within ten days. Appeals have to bedecided within twenty days. All decisions are sent to the Constitutional Court, which chooses thoseit will review.
11630-04_CH04_rev2.qxd 6/2/09 4:11 PM Page 124
economic stability, on the one hand, and institutional arrangements gearedtoward fostering equality of opportunities and promoting a broad sharing of thebenefits of growth, on the other.
The Judicial System: Greater Access to Justice, but at a High Fiscal Cost
Although the growing number of tutelas suggests that this new mechanism hasbroadened access to the legal system, it also raises issues of abuse and ineffi-ciency.20 The resulting judicial rulings, for example on the indexing of minimumsalaries, have redistributed income and thus contributed to the broader sharingof growth. But the added cost to the government of higher salaries and benefits,together with other judicial decisions that forced a lowering of taxes, threatensfiscal balance and thus macroeconomic stability, and much higher minimumsalaries tend to make labor markets less flexible, reducing economic competition.An activist judicial system, basing its decisions on a rather simplistic interpreta-tion of the concepts of equality and dignity, has had a profound influence on eco-nomic reform and has prevented some reforms from delivering on their promise.The Constitutional Court has gone beyond “legislating in the negative”; it oftenmodifies legislation in an attempt to ensure that the law, as the court sees it, com-plies with the constitution. It has extended its decisions to apply beyond the reg-ulation in question to others that had not been challenged. In so doing the courthas imposed peremptory deadlines on Congress to legislate in accordance withits rulings.21
Some of the most important interventions by the Constitutional Court in eco-nomic matters include the following:
• Wages. The task of establishing the monthly minimum salary is undertakenby a commission on which government, labor, and business are represented. If noagreement is reached, the government sets the minimum salary. Until 1998 it wasstandard practice to increase the minimum salary periodically in line with expectedinflation plus some allowance for productivity growth. In 1999, however, the courtdetermined that this procedure violated workers’ right to a minimum “vital andmobile” remuneration and determined that “the adjustment must never be lowerthan the previous year’s inflation.” In 2000 the court extended this rationale tomost public sector wages and determined that “any savings achieved from limit-ing wage hikes has to go to social investment,” even though the constitution estab-lishes that in time of peace only elected bodies may mandate public expenditure.
colombia 125
20. Between 1999 and April 2007, 1.6 million tutelas were filed, one-third of them in referenceto health care. The judiciary upheld 87 percent of the total (El Tiempo, August 31, 2007).
21. The court’s activism generates uncertainty and encourages the use of lawsuits to producechanges that politically disadvantaged groups are unable to accomplish through the legislative process,and which may deter many from participating in the political process (Kalmanovitz, 2003; Uprimny,2001). Politicians might, as a result, find it rational to defer to the Constitutional Court on topicalissues, transferring to it the political costs involved.
11630-04_CH04_rev2.qxd 6/2/09 4:11 PM Page 125
• Pensions. The court struck down a provision in the 2003 pension reformshortening the transition period. It opined that the reform affected not just work-ers’ expectations, but also their acquired rights. In upholding a tutela by teachersclaiming their right to a fourteenth monthly pension payment each year, the courtjustified its decision on equity grounds. This payment had been established in1993 to compensate some retirees whose pensions had not been fully adjustedfor inflation; the court extended the benefit to all pensioners, at a cost of around12.5 percent of GDP (Cadena, 2006).
• Taxes. Stating that it deemed the graduation of VAT rates across differentgoods to be insufficient, the court overturned a provision in a tax reform thatextended the VAT to previously excluded items, but at a very low rate.
• Health care. Although the health care law defines the manner in which citi-zens may exercise their health care rights, judges and the Constitutional Courthave allowed citizens to claim much broader rights, at public expense, on groundsof protecting the “right to life.”
Interventions by the Constitutional Court in the financial sector have beenby far the most controversial. In 1998, at a time when the country’s mortgagebanks were in crisis, the administration declared an economic emergency andissued decrees with the (temporary) force of law. Their review opened the doorfor the Constitutional Court to play a very active role in a range of financialmatters:
• The government introduced a financial transactions tax (FTT) but exemptedinterbank operations. The court overturned this provision on grounds that it violated the principle of equality. Until a much lower tariff was introduced,the interbank market, including the market for foreign exchange operations,dried up.
• A government proposal, upheld by the court, forced banks to accept, duringa twelve-month period, properties returned by mortgage holders in exchange forthe complete write-off of their mortgage. The government intended to target thisprovision to low-income owners, but again citing the principle of equality, thecourt extended it to all debtors.
• The administrative court ruled that the central bank could not continuelinking the corrección monetaria to interest rates, but the Constitutional Courtordered that it be fully linked to inflation.22 It opined that if indexed debtsincreased faster than inflation, citizens’ right to housing would be affected. As aresult, a 1999 law established that the real rate of interest (that is, the premium
126 roberto steiner, irene clavijo, and natalia salazar
22. Mortgages were defined in terms of a unit of account (UPAC), originally intended to remainconstant in terms of the consumer price index. The periodic adjustment of this unit was known ascorrección monetaria. All assets and liabilities in mortgage banks were indexed to the UPAC. At theinsistence of the mortgage banks, the corrección monetaria began to incorporate interest rates in addi-tion to inflation. Eventually, the UPAC became fully indexed to interest rates.
11630-04_CH04_rev2.qxd 6/2/09 4:11 PM Page 126
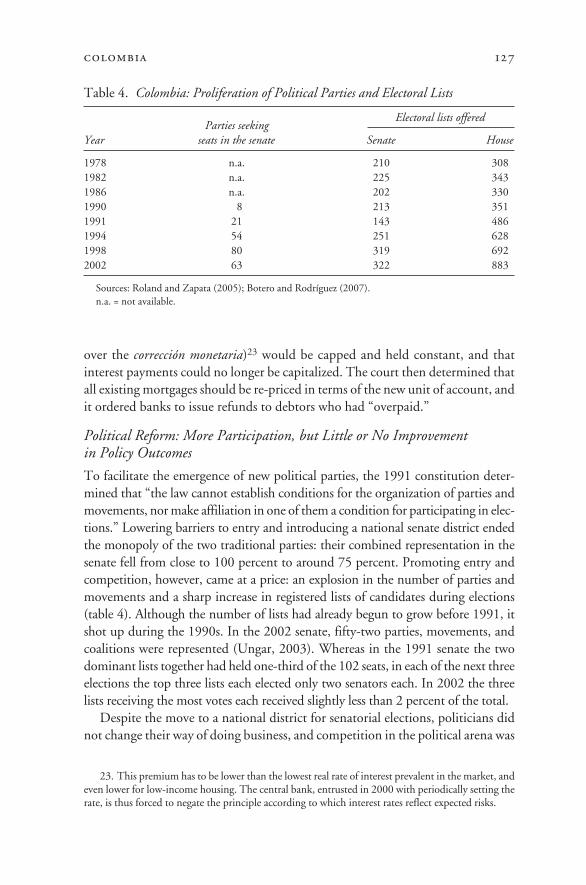
over the corrección monetaria)23 would be capped and held constant, and thatinterest payments could no longer be capitalized. The court then determined thatall existing mortgages should be re-priced in terms of the new unit of account, andit ordered banks to issue refunds to debtors who had “overpaid.”
Political Reform: More Participation, but Little or No Improvement in Policy Outcomes
To facilitate the emergence of new political parties, the 1991 constitution deter-mined that “the law cannot establish conditions for the organization of parties andmovements, nor make affiliation in one of them a condition for participating in elec-tions.” Lowering barriers to entry and introducing a national senate district endedthe monopoly of the two traditional parties: their combined representation in thesenate fell from close to 100 percent to around 75 percent. Promoting entry andcompetition, however, came at a price: an explosion in the number of parties andmovements and a sharp increase in registered lists of candidates during elections(table 4). Although the number of lists had already begun to grow before 1991, itshot up during the 1990s. In the 2002 senate, fifty-two parties, movements, andcoalitions were represented (Ungar, 2003). Whereas in the 1991 senate the twodominant lists together had held one-third of the 102 seats, in each of the next threeelections the top three lists each elected only two senators each. In 2002 the threelists receiving the most votes each received slightly less than 2 percent of the total.
Despite the move to a national district for senatorial elections, politicians didnot change their way of doing business, and competition in the political arena was
colombia 127
23. This premium has to be lower than the lowest real rate of interest prevalent in the market, andeven lower for low-income housing. The central bank, entrusted in 2000 with periodically setting therate, is thus forced to negate the principle according to which interest rates reflect expected risks.
Table 4. Colombia: Proliferation of Political Parties and Electoral Lists
Parties seekingElectoral lists offered
Year seats in the senate Senate House
1978 n.a. 210 3081982 n.a. 225 3431986 n.a. 202 3301990 8 213 3511991 21 143 4861994 54 251 6281998 80 319 6922002 63 322 883
Sources: Roland and Zapata (2005); Botero and Rodríguez (2007).n.a. = not available.
11630-04_CH04_rev2.qxd 6/2/09 4:11 PM Page 127
not enhanced. Most incumbents managed to obtain enough votes in their tradi-tional regions to retain a seat. Botero (2000) estimates a “regional concentrationindex” as the percentage of votes raised in their “preferred” department by allelected candidates. The average index value for 1991, 1994, and 1998 was a star-tling 66.7. Politicians were elected without having to compete beyond their tra-ditional areas of influence, and with no support from a party organization.24
Problems also emerged with regard to representation. Although the 1991 consti-tution did away with the practice of voting for alternates, it provided that perma-nent vacancies would be filled by unelected candidates on the same list as theelected candidate. Of the 263 seats in the 1998 Congress, by the end of 2001 some247 were held by someone other than the person elected. These were legislatorsfor whom nobody had voted; indeed, their names did not even appear on the bal-lot, which identifies only the head of the list. Also, assigning seats using the LR-Hare system in the context of list proliferation can lead to huge reallocations ofvotes. Botero (2000) estimates an index of deviations from proportionality tomeasure the extent of reassignment. This index, which averaged 23 in 1986 and1990, reached 60 in 2002.25 The D’Hondt system, introduced in 2003, broughtabout a sharp change; the four most voted lists in 2006 received 62.5 percent ofthe vote and won 68.6 percent of the seats.26
The emphasis given to providing equality of opportunities by lowering barri-ers to entry helped deliver a fragmented political system. This in turn raised trans-action costs, probably facilitated capture by interest groups, and undermined thepolitical system’s ability to undertake sound long-term policies, which amongother things endangers macroeconomic stability. When parties have almost nocontrol over who may run under the party’s banner, the result is to promote intra-party rather than interparty competition, leading to clientelism: those at the top ofthe list differentiate themselves from other candidates by catering to narrow localinterests (Roland and Zapata, 2005). The rules in place until 2003 for allocatingseats in Congress appear to have in fact lowered the quality of legislative work.The average number of bills introduced each year rose from 142 during 1982–91to 215 during 1992–2003, and around 80 percent of bills in the latter period wereintroduced by legislators with a clear regional orientation. This kind of legislative
128 roberto steiner, irene clavijo, and natalia salazar
24. Besides the flawed electoral rules, other factors that explain this outcome include the increasein fiscal resources at the local level due to decentralization; the influx of drug money into politics;public campaign financing through reimbursements to candidates rather than to parties; and newvoting procedures that reduced the value of the logistical capabilities provided by a party organiza-tion (Cárdenas et al., 2006).
25. The index is calculated as 0.5 times the sum of the absolute value of the difference, for eachlist, between the percentage of votes received and the percentage of seats gained. The index value iszero under perfect proportional representation. In 2002 some 60 percent of votes were reassignedamong lists in the process of translating electoral results into congressional seats.
26. See Roland and Zapata (2005) for an explanation of alternative electoral allocation systemsin a Colombian context.
11630-04_CH04_rev2.qxd 6/2/09 4:11 PM Page 128
“inflation” suggests party weakness: when there is no quality control, the bills sub-mitted by legislators lack financial and judicial rigor. Unsurprisingly, the approvalrate for legislation submitted by the executive is much higher.
After several failed attempts, a new reform was approved by Congress in 2003.The new electoral rules maintained a system of proportional representation butshifted to a D’Hondt rule with minimum thresholds: a 2 percent threshold in thesenate and 50 percent of the quota in the house, in the case of departments elect-ing more than two representatives, and 30 percent in the few departments that electonly two. Parties may present only one list for each chamber, there can be no morecandidates on the list than seats to be filled, and voters may not register with morethan one party. As a compromise, each party decides for itself whether voters maychoose the order of candidates within the list. In 2005 Congress passed a ley debancadas with several new provisions: it established that members of Congresselected from the same list must constitute a group; delegated to the parties theresponsibility of issuing rules to ensure that groups act in conformity with the law;and established procedures to enhance the efficiency of legislative proceedings.
The 2003 reform was put to the test at the congressional level in 2006. Theintroduction of a threshold induced consolidation: only 20 lists contested forthe senate, down from 322 in 2002;27 10 surpassed the threshold. Although thereform brought order to a situation that some had labeled chaotic, the fate of the2006 tax reform, perhaps the most important economic issue that Congress hasdealt with since, suggests that the greater electoral cohesion has yet to translateinto a more structured legislative process, one less prone to capture and better ableto deliver sound public policies.
Labor and Tax Reform
Although trade liberalization in Colombia has proceeded almost without inter-ruption, the country’s integration into the global economy has been hampered bytwo factors that should have enhanced it. First, labor reform failed to deliver onits promise of making the labor market more flexible. Second, in order to financea much higher level of public expenditure, the tax burden has increased quitemarkedly, to a level deemed at odds with greater private sector competitiveness.Meanwhile, for a host of reasons, financial liberalization has proved to be a morecomplex and protracted process than originally envisioned.
Labor Reform: Measures to Enhance Competition Neutralized by Reforms Elsewhere
The main goal of the 1990 labor reform was to support trade liberalizationby enhancing the flexibility and formalization of the labor force, thus making
colombia 129
27. More precisely, in the 2002 elections 63 parties and movements presented 322 lists, whereasfour years later 20 parties or movements presented 20 lists.
11630-04_CH04_rev2.qxd 6/2/09 4:11 PM Page 129
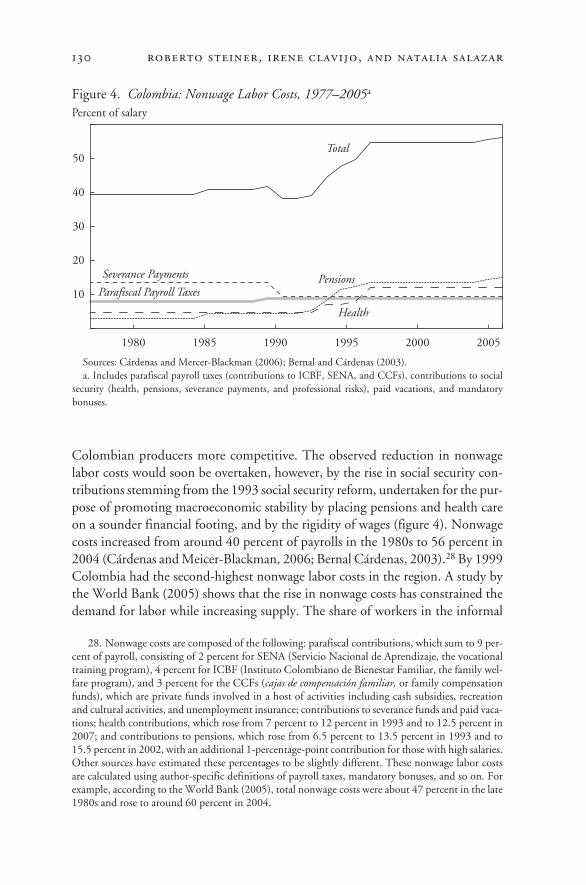
Colombian producers more competitive. The observed reduction in nonwagelabor costs would soon be overtaken, however, by the rise in social security con-tributions stemming from the 1993 social security reform, undertaken for the pur-pose of promoting macroeconomic stability by placing pensions and health careon a sounder financial footing, and by the rigidity of wages (figure 4). Nonwagecosts increased from around 40 percent of payrolls in the 1980s to 56 percent in2004 (Cárdenas and Meicer-Blackman, 2006; Bernal Cárdenas, 2003).28 By 1999Colombia had the second-highest nonwage labor costs in the region. A study bythe World Bank (2005) shows that the rise in nonwage costs has constrained thedemand for labor while increasing supply. The share of workers in the informal
130 roberto steiner, irene clavijo, and natalia salazar
28. Nonwage costs are composed of the following: parafiscal contributions, which sum to 9 per-cent of payroll, consisting of 2 percent for SENA (Servicio Nacional de Aprendizaje, the vocationaltraining program), 4 percent for ICBF (Instituto Colombiano de Bienestar Familiar, the family wel-fare program), and 3 percent for the CCFs (cajas de compensación familiar, or family compensationfunds), which are private funds involved in a host of activities including cash subsidies, recreationand cultural activities, and unemployment insurance; contributions to severance funds and paid vaca-tions; health contributions, which rose from 7 percent to 12 percent in 1993 and to 12.5 percent in2007; and contributions to pensions, which rose from 6.5 percent to 13.5 percent in 1993 and to15.5 percent in 2002, with an additional 1-percentage-point contribution for those with high salaries.Other sources have estimated these percentages to be slightly different. These nonwage labor costsare calculated using author-specific definitions of payroll taxes, mandatory bonuses, and so on. Forexample, according to the World Bank (2005), total nonwage costs were about 47 percent in the late1980s and rose to around 60 percent in 2004.
Figure 4. Colombia: Nonwage Labor Costs, 1977–2005a
Sources: Cárdenas and Mercer-Blackman (2006); Bernal and Cárdenas (2003).a. Includes parafiscal payroll taxes (contributions to ICBF, SENA, and CCFs), contributions to social
security (health, pensions, severance payments, and professional risks), paid vacations, and mandatory bonuses.
Percent of salary
10
20
30
40
50Total
Parafiscal Payroll Taxes
Severance Payments Pensions
Health
200520001995199019851980
11630-04_CH04_rev2.qxd 6/2/09 4:11 PM Page 130
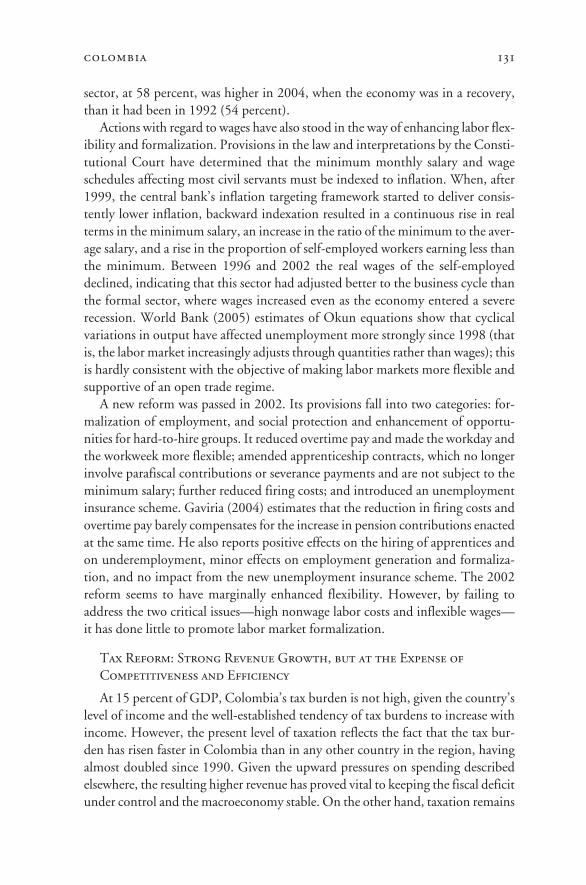
sector, at 58 percent, was higher in 2004, when the economy was in a recovery,than it had been in 1992 (54 percent).
Actions with regard to wages have also stood in the way of enhancing labor flex-ibility and formalization. Provisions in the law and interpretations by the Consti-tutional Court have determined that the minimum monthly salary and wageschedules affecting most civil servants must be indexed to inflation. When, after1999, the central bank’s inflation targeting framework started to deliver consis-tently lower inflation, backward indexation resulted in a continuous rise in realterms in the minimum salary, an increase in the ratio of the minimum to the aver-age salary, and a rise in the proportion of self-employed workers earning less thanthe minimum. Between 1996 and 2002 the real wages of the self-employeddeclined, indicating that this sector had adjusted better to the business cycle thanthe formal sector, where wages increased even as the economy entered a severerecession. World Bank (2005) estimates of Okun equations show that cyclicalvariations in output have affected unemployment more strongly since 1998 (thatis, the labor market increasingly adjusts through quantities rather than wages); thisis hardly consistent with the objective of making labor markets more flexible andsupportive of an open trade regime.
A new reform was passed in 2002. Its provisions fall into two categories: for-malization of employment, and social protection and enhancement of opportu-nities for hard-to-hire groups. It reduced overtime pay and made the workday andthe workweek more flexible; amended apprenticeship contracts, which no longerinvolve parafiscal contributions or severance payments and are not subject to theminimum salary; further reduced firing costs; and introduced an unemploymentinsurance scheme. Gaviria (2004) estimates that the reduction in firing costs andovertime pay barely compensates for the increase in pension contributions enactedat the same time. He also reports positive effects on the hiring of apprentices andon underemployment, minor effects on employment generation and formaliza-tion, and no impact from the new unemployment insurance scheme. The 2002reform seems to have marginally enhanced flexibility. However, by failing toaddress the two critical issues—high nonwage labor costs and inflexible wages—it has done little to promote labor market formalization.
Tax Reform: Strong Revenue Growth, but at the Expense of Competitiveness and Efficiency
At 15 percent of GDP, Colombia’s tax burden is not high, given the country’slevel of income and the well-established tendency of tax burdens to increase withincome. However, the present level of taxation reflects the fact that the tax bur-den has risen faster in Colombia than in any other country in the region, havingalmost doubled since 1990. Given the upward pressures on spending describedelsewhere, the resulting higher revenue has proved vital to keeping the fiscal deficitunder control and the macroeconomy stable. On the other hand, taxation remains
colombia 131
11630-04_CH04_rev2.qxd 6/2/09 4:11 PM Page 131
a source of uncertainty for businesses and workers, with no fewer than ten nationaltax reforms in the last seventeen years and ample discretion exercised by munici-pal authorities. The tax regime is also extremely inefficient, combining a shallowbase (fewer than 2 percent of the active labor force paid income taxes in 2004,according to Cárdenas and Mercer-Blackman, 2006) with high marginal tax rateson both income (the top marginal rate was 38.5 percent until 2007 and is now 35 percent) and consumption (the VAT). Moreover, the tax system is complicatedto administer, and the existence of multiple rates (eight in the case of the VAT,ranging from 2 to 45 percent) and an ever-increasing list of exemptions likely foster avoidance and evasion. Finally, all this is complemented by the second-highest tax rate on the wage bill in the region, the highest FTT, a technicallyflawed local tax on business turnover, and a distortionary tax on net wealth. Suc-cessive tax reforms, aimed at supporting fiscal and macroeconomic stability in thecontext of an ever-rising level of public expenditure, have had a negative effect oncompetition and efficiency.
Colombia’s business-unfriendly tax regime has its root cause in the fact that thetax burden has had to be raised frequently just to keep pace with growth in pub-lic expenditure—throughout the 1990s to comply with mandates in the 1991constitution, more recently to fund the costs of enhanced security. Although Con-gress has generally accommodated the executive’s need for additional resources,the latter has always found itself at the mercy of the legislature, and therefore ofinterest groups, regarding the quality of tax changes. A good example has been thefate of the highly distortionary FTT, introduced as a temporary provision at a rateof 0.2 percent in 1999. In each tax reform that the executive has submitted sincethen, it has requested the phasing out of this tax and its replacement with less dis-tortionary taxes. The results have been dismal: the FTT is now permanent, at arate of 0.4 percent. Even when Congress has supported attempts to improve thetax code—as in 2002, when it agreed to impose a VAT, at a low rate, on all food-stuffs—the Constitutional Court has ruled that such a move ran counter to anyconcept of fairness. The administration itself, for example in the failed 2006reform, has not shied away from making explicit its intention to maintain certainexemptions in order to promote private sector investment. This posture soon ledto numerous suggestions for additional exemptions and differential tariff rates,eventually leading the administration to withdraw its reform proposal altogether.
Financial Sector Reform: More Competition and Greater Efficiency, but Access Is Limited and Restrictions Remain
We present several approaches to assessing progress in the financial sector dur-ing the reform process to date: a financial repression index, a model gauging thedevelopment of competition, and the literature on financial efficiency all suggestroom for improvement. An update of Salazar’s (2005) repression index suggeststhat a period of continuous liberalization that began in the late 1980s was inter-
132 roberto steiner, irene clavijo, and natalia salazar
11630-04_CH04_rev2.qxd 6/2/09 4:11 PM Page 132
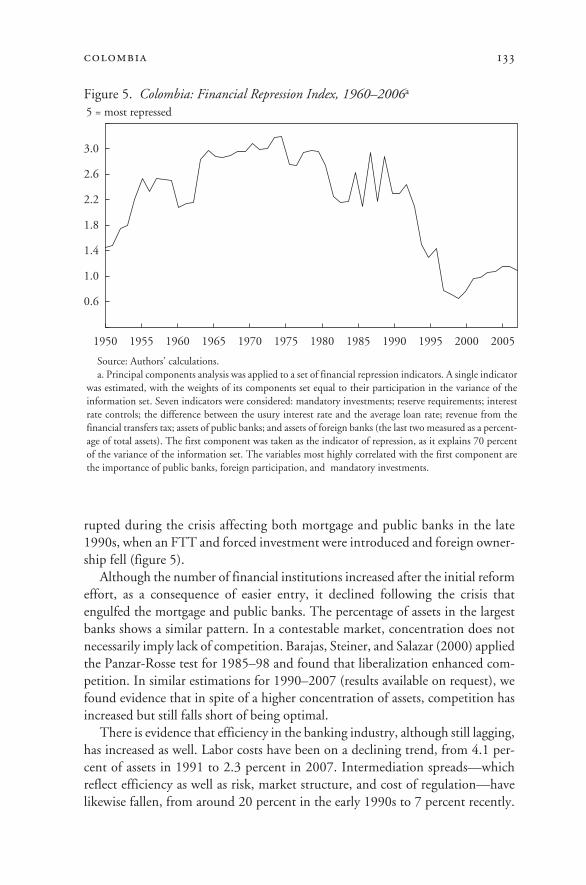
rupted during the crisis affecting both mortgage and public banks in the late1990s, when an FTT and forced investment were introduced and foreign owner-ship fell (figure 5).
Although the number of financial institutions increased after the initial reformeffort, as a consequence of easier entry, it declined following the crisis thatengulfed the mortgage and public banks. The percentage of assets in the largestbanks shows a similar pattern. In a contestable market, concentration does notnecessarily imply lack of competition. Barajas, Steiner, and Salazar (2000) appliedthe Panzar-Rosse test for 1985–98 and found that liberalization enhanced com-petition. In similar estimations for 1990–2007 (results available on request), wefound evidence that in spite of a higher concentration of assets, competition hasincreased but still falls short of being optimal.
There is evidence that efficiency in the banking industry, although still lagging,has increased as well. Labor costs have been on a declining trend, from 4.1 per-cent of assets in 1991 to 2.3 percent in 2007. Intermediation spreads—whichreflect efficiency as well as risk, market structure, and cost of regulation—havelikewise fallen, from around 20 percent in the early 1990s to 7 percent recently.
colombia 133
Figure 5. Colombia: Financial Repression Index, 1960–2006a
Source: Authors’ calculations.a. Principal components analysis was applied to a set of financial repression indicators. A single indicator
was estimated, with the weights of its components set equal to their participation in the variance of the information set. Seven indicators were considered: mandatory investments; reserve requirements; interest rate controls; the difference between the usury interest rate and the average loan rate; revenue from the financial transfers tax; assets of public banks; and assets of foreign banks (the last two measured as a percent-age of total assets). The first component was taken as the indicator of repression, as it explains 70 percent of the variance of the information set. The variables most highly correlated with the first component are the importance of public banks, foreign participation, and mandatory investments.
5 = most repressed
0.6
1.0
1.4
1.8
2.2
2.6
3.0
200520001995199019851980197519701965196019551950
11630-04_CH04_rev2.qxd 6/2/09 4:11 PM Page 133
Recent estimates report high levels of cost inefficiency, at anywhere between 30and 73 percent of total costs.29
Progress with regard to credit expansion (a factor potentially affecting thebroad sharing of the benefits of growth) has been modest. Bank credit is only 35 percent of GDP, and credit to the private sector barely 24 percent. Results ofa vector autoregression (available upon request) show that once capital flows areincluded, our repression index does not affect financial deepening. These resultssuggest that in a small, open economy, capital flows play a critical role, and thatalthough quite complex, our index fails to capture aspects that might be criticalin fostering financial deepening and access, such as the role of credit bureaus, anefficient guarantee system, and protection of creditor rights.
Although in the regional context Colombia apparently does not fare poorlywith regard to access, as of June 2007 only 35 percent of Colombians held at leastone financial product. On the other hand, credit to small and medium-size enter-prises has grown, but from a low base. Providing banking services to the poor iscostly for financial institutions and taxing on the poor themselves. Informationrequirements can overburden potential customers, particularly if they work in theinformal sector. In 2006 the government launched a program, called Banca de lasOportunidades, aimed at enhancing poor Colombians’ access to financial services.At the margin, the program has lessened some of the severe constraints that thepoor have faced.30
Just as macroeconomic stability was compromised by constitutional mandatesgeared toward broadening the pool of beneficiaries from growth, so the concernfor macroeconomic stability in the context of insufficient policy instruments hashampered financial liberalization and might have prevented financial reform frommeaningfully affecting the foundations as had been expected (see table 3). First,in response to a sharp rise in capital inflows, the central bank has establishedreserve requirements on foreign borrowing and increased overall reserve require-ments. This curtailed competition and efficiency in the financial sector andincreased financing costs. Second, limited budgetary flexibility played a role in thedecision to finance public intervention in the crisis engulfing mortgage and pub-lic banks through an FTT, a tax that retards financial deepening and access by thepoor to financial services. Third, unable to resort to the budget to promote spe-cific sectors, in 1999 the government reintroduced some forced investments, thistime in favor of low-income housing.
The expansion of bank credit has also been hampered by a deeply engrainedcultural bias favoring debtors over creditors, a bias that is evident in the minds ofthose who write the laws and of those in charge of upholding them; this arguably
134 roberto steiner, irene clavijo, and natalia salazar
29. See Asociación Nacional de Instituciones Financieras (2005) and the references therein.30. In addition to allowing the creation of nonbanking correspondents, the program established
different usury rates for different sectors, increased allowable commissions on microcredit, andexpanded FTT exemptions for withdrawals from savings accounts.
11630-04_CH04_rev2.qxd 6/2/09 4:11 PM Page 134
amounts to a populist interpretation of property rights by the legislative and judi-cial branches. We have already mentioned the Constitutional Court’s decisionswith regard to forcing mortgage banks to bail out debtors. In addition, Law 550 of1999 attempted to provide lenders and borrowers with incentives and mechanismsto negotiate restructuring programs that would allow businesses under stress tonormalize their activities. The bias against creditors became evident, however, andonly a few deals were finalized. A major hurdle faced by financial institutions in their attempts at recovering collateral has been the extreme complexity of thejudicial process. In addition, the legal system does not allow for the expeditious creation of guarantees, and the existing guarantee registries are technologicallyobsolete. A 2006 law improves matters but does not fully solve the main problems.
The expansion of credit in general, and to smaller borrowers in particular, is con-strained by caps on interest rates. We have already mentioned the decisions by theConstitutional Court that forced banks to decouple interest rates on mortgagesfrom any assessment of risk. In addition, credit operations are subjected to limitsimposed by the usury rate of interest, which lately might have become binding forcertain operations. Interpretations by the bank supervisory agency have determinedthat limits shall apply throughout the loan’s life span; in other words, if marketconditions change and the usury rate falls, the contract has to be renegotiated.Besides producing uncertainty, this inhibits the market for securitized assets.31 Inthe case of microcredit, banks may charge fixed commissions on top of the usuryrate. In practice, however, this flexibility is not significant. The system in placedoes not foster the expansion of microenterprises and does not allow banks tocover the operational costs and risks associated with small transactions with agentsin the informal sector.
The fact that credit bureaus are underdeveloped also helps explain the low levelof access to the financial sector. It was only recently that a “habeas data” law wasapproved, establishing a four-year permanence for all negative information. Thislaw is now under review by the Constitutional Court. Before the law was passed,the court had ruled favorably on numerous demands from citizens arguing that theirrights (to privacy and reputation) had been violated by credit bureaus—anotherexample of a judicial intervention that has impeded the development of the finan-cial sector. The negative view that many have regarding the financial sector, togetherwith widespread lack of knowledge about how information systems work, allowedthe notion that “the less information, the greater the access to credit” to flourish.
Fiscal and Budget Reform
During the decade following the launch of the reform program, Colombia strayedfrom its tradition of prudent fiscal policy and relative macroeconomic stability.
colombia 135
31. The authorities have attempted to introduce some flexibility into this restrictive regime.Recently, the government decided to establish the usury rate by type of credit and at a higher timefrequency.
11630-04_CH04_rev2.qxd 6/2/09 4:11 PM Page 135
Although having granted independence to the central bank would eventuallyprove to be a wise move—Colombia now enjoys historically low rates of inflation—the lack of a supportive fiscal policy stance during the 1990s deter-mined that when international financial conditions tightened after 1997, the cen-tral bank had to adopt an extremely tight monetary policy stance in order topursue its mandate of low inflation. To support the currency, during 1998 and1999 the central bank raised interest rates to unprecedented levels. This provedvery costly for economic activity in general and for the mortgage industry in par-ticular. The fiscal deterioration that engulfed Colombia in the second half of the1990s resulted from a confluence of factors, of which we highlight two: overesti-mation of the fiscal benefits of the 1993 pension reform, and the rise in expendi-ture, particularly in the social sectors at the subnational level, mandated in the newconstitution. In both cases the Constitutional Court played a critical role in mak-ing a difficult situation even worse. In late 1999, for the first time ever, Colom-bia entered into a financial arrangement with the International Monetary Fund.This IMF program involved some important reforms, mostly geared towardrestoring macroeconomic stability.
Pension Reform: Recent Adjustments Promise a Sounder, Fairer System
The 1993 reform adjusted the parameters of the pension system to put it ona sustainable footing more in accordance with demographic trends. The reform,however, provided for a long transition period: workers retiring before 2014would not be affected.32 Members of the armed forces, the police, the teacher’sunion pension fund, and the state-owned oil company were exempted from thegeneral system. It soon became evident that the reform had not achieved the goalof placing public pension liabilities on a sustainable path. After some failedattempts, important changes were introduced in 2003–05 to address this issue,while also improving equity and enhancing fairness:
• Subsidies now benefit only those unable to save enough to fund a minimumpension. Guaranteed minimum pensions in the AFPs are now fully funded.
• Contributions were raised, benefits were capped, and some degree of pro-gressivity was introduced in the determination of the replacement rate.
• The fourteenth monthly payment—an extra benefit for a few public employ-ees that, on grounds of equality, the Constitutional Court had extended to all—was eliminated for those earning more than three times the minimum salary, andfor all persons retiring after 2011; all privileged regimes (except for the military)
136 roberto steiner, irene clavijo, and natalia salazar
32. The reform involved a twenty-year transition and an increase in the retirement age of just twoyears, even though life expectancy had increased from 61 years at the beginning of the 1970s to 70at the end of the 1990s, and the conditional life expectancy of a 60-year-old had surpassed 80(Cadena, 2006).
11630-04_CH04_rev2.qxd 6/2/09 4:11 PM Page 136
were eliminated starting in 2010; and collective agreements may no longer estab-lish more favorable conditions than in the general system.
• The transition was brought forward to 2010 except for those very close toretirement. Congress approved bringing it forward to 2008, but, as noted above,this provision was watered down by the Constitutional Court on grounds thatthose affected had not only an “expectation” of receiving certain benefits but an“acquired right.”
The 2003–05 reforms reduced the unfunded liabilities of the PAYGO regimefrom over 200 percent of GDP to 140 percent in net present value terms. Yet pen-sion payments will continue to be a drag on the budget. Transfers from the cen-tral government are peaking in 2007–08 at slightly less than 5 percent of GDPand are expected to remain close to 4 percent of GDP until 2015 (Ministerio deHacienda, 2005). The pension regime is not only expensive; it has also proved tobe an inequitable use of taxpayer money. The system has involved huge subsidiesfor many beneficiaries, ranging from those who never contributed but were enti-tled to a modest pension, to those whose contributions were not enough to covertheir pension, to some egregious cases where no contributions were made butwhere benefits were nevertheless huge.33 Before the 2003 reform the governmentsubsidized two-thirds of the benefits of those receiving a minimum pension of onemonthly minimum salary, and around half of all others (Montenegro and Rivas,2005). Since coverage is low and biased in favor of the better off, the distributionof the subsidies has been appalling, with the lowest income quintile receiving nosubsidy and the highest capturing 80 percent of the total (Lasso, 2006). Notwith-standing the prolonged transition period, the 2003–05 reforms had a majorimpact on equity by doing away with most of the privileged regimes, the mainsource of inequality. Solidarity was also enhanced. At the margin, pension subsi-dies are now well targeted.
Fiscal Decentralization: A Broader Sharing of Wealth, but at the Expense of Budget Balance
Since the entry into force of the 1991 constitution, there has been a significanttransfer of resources from rich regions to poor ones, and the bulk of the resourcestransferred from the central government to subnational governments has beenused to fund expenditures in health and education, thereby broadening the poolof beneficiaries of growth. Transfers rose from around 5 percent of GDP in 1990to over 12 percent recently. In the initial stages, however, some subnational
colombia 137
33. For example, before the 2003 reform, public school teachers did not contribute to the pen-sion fund, could retire much earlier, and received significantly higher benefits. Borjas and Acosta(2000) estimated that in 2000 this program, benefiting 303,000 active teachers, had generated a lia-bility to the government equivalent to 30 percent of GDP. This was similar to the pension liabilitygenerated by 2.3 million nonteachers.
11630-04_CH04_rev2.qxd 6/2/09 4:11 PM Page 137
governments began running deficits and accumulating debt, thus compromisingmacroeconomic stability. Notwithstanding the rise in transfers, expenditureincreased even faster.34 The scheme put in place did not provide enough incen-tives for local tax effort and allowed for full discretion with regard to indebted-ness.35 Although views differ as to whether there has been “fiscal apathy,” taxcollection was clearly more dynamic at the national level.36 Because they werelinked to current central government revenue, transfers became highly pro-cyclical, making macroeconomic policy less flexible while tying expenditure onhealth and education to tax revenue that was sensitive to the business cycle. Dis-tribution formulas were complicated, and few subnational governments could reasonably predict their income flows. The rigidity of the formulas fostered over-provision of certain services in some areas and underprovision in others.
A second round of reforms was driven by the need to make the scheme sus-tainable, while introducing flexibility into the distribution of transfers so as toproduce a better match between the supply of fiscal resources and the effectivedemand for them. In 1997 borrowing by subnational governments was madecontingent on their meeting certain solvency and liquidity criteria. A 2000 lawclassified these governments into categories and established differing limits onoperational expenses, up to a given percentage of revenue (excluding transfers).Legislative Act 01 of 2000 created the Sistema General de Participaciones (SGP),which combined the three existing transfer mechanisms. The SGP will grow withinflation plus a mark-up, which has recently been raised.37 Law 715 in 2000made the allocation of transfers more flexible—without a regional dimension,and taking into account potential users as well as standardized costs—and intro-duced incentives for local taxation. A 2003 fiscal responsibility law affecting alllevels of government establishes that the primary surplus must be at least equalto debt service. Even if deficits at the subnational level have been averted, thecentral government still faces imbalances on account of decentralization. Over-lapping functions, a confusing distribution of responsibilities, and weak linksbetween expenditure and financing decisions abound. How expenditures are tobe assigned by level of government has never been made entirely clear. Althoughthe 1991 constitution called for Congress to pass a territorial organization law
138 roberto steiner, irene clavijo, and natalia salazar
34. There is evidence of a “flypaper effect,” according to which “money sticks were it hits,” themost interesting example being the education compensation fund.
35. Local governments with negative current saving were allowed to borrow by pledging transferreceipts, and provisioning rules gave banks incentives to lend to them.
36. A revealing case has to do with the surcharge on gasoline. This 20 percent tax was first estab-lished in Bogotá, and later in Medellín. It was expected that these success stories would be replicatedthroughout the country. Local authorities, however, balked and instead lobbied their congressionaldelegations to pass national legislation—whose political costs fell mainly on the central government—making the surcharge mandatory.
37. Because of political pressure from FECODE, the powerful teachers’ union, transfers to edu-cation will receive an additional mark-up on top of the general mark-up.
11630-04_CH04_rev2.qxd 6/2/09 4:11 PM Page 138
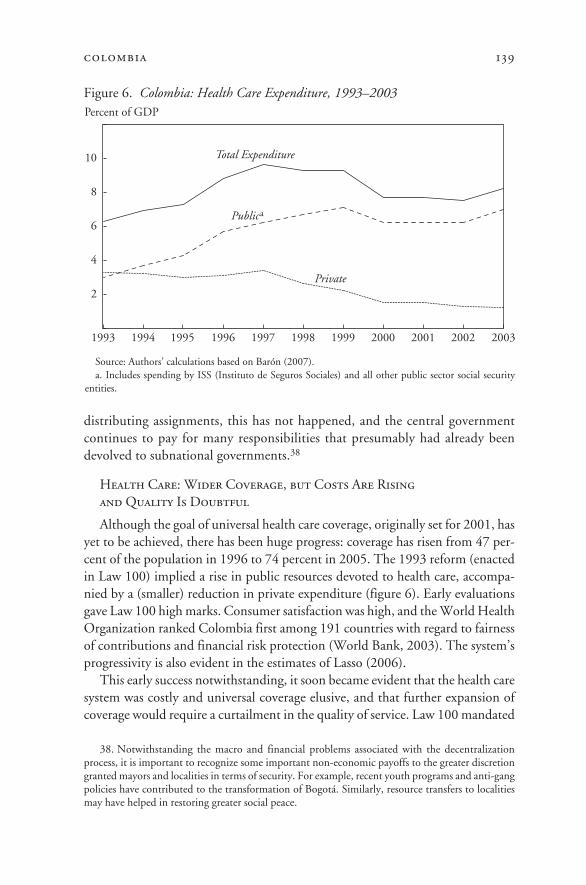
distributing assignments, this has not happened, and the central governmentcontinues to pay for many responsibilities that presumably had already beendevolved to subnational governments.38
Health Care: Wider Coverage, but Costs Are Rising and Quality Is Doubtful
Although the goal of universal health care coverage, originally set for 2001, hasyet to be achieved, there has been huge progress: coverage has risen from 47 per-cent of the population in 1996 to 74 percent in 2005. The 1993 reform (enactedin Law 100) implied a rise in public resources devoted to health care, accompa-nied by a (smaller) reduction in private expenditure (figure 6). Early evaluationsgave Law 100 high marks. Consumer satisfaction was high, and the World HealthOrganization ranked Colombia first among 191 countries with regard to fairnessof contributions and financial risk protection (World Bank, 2003). The system’sprogressivity is also evident in the estimates of Lasso (2006).
This early success notwithstanding, it soon became evident that the health caresystem was costly and universal coverage elusive, and that further expansion ofcoverage would require a curtailment in the quality of service. Law 100 mandated
colombia 139
38. Notwithstanding the macro and financial problems associated with the decentralizationprocess, it is important to recognize some important non-economic payoffs to the greater discretiongranted mayors and localities in terms of security. For example, recent youth programs and anti-gangpolicies have contributed to the transformation of Bogotá. Similarly, resource transfers to localitiesmay have helped in restoring greater social peace.
Figure 6. Colombia: Health Care Expenditure, 1993–2003
Source: Authors’ calculations based on Barón (2007).a. Includes spending by ISS (Instituto de Seguros Sociales) and all other public sector social security
entities.
Percent of GDP
Publica
Private
Total Expenditure
2
4
6
8
10
20032002200120001999199819971996199519941993
11630-04_CH04_rev2.qxd 6/2/09 4:11 PM Page 139
the shifting of subsidies from suppliers to consumers and established a preciseschedule by which this should happen.39 But the schedule was not met. Theprocess of transforming the subsidies into demand subsidies gave rise to a viciouscycle, since payments to suppliers had to be maintained in order to assist the poorand the uninsured. This reduced the resources available to subsidize demand,which in turn hindered the enrollment of new members and consequently pre-vented a reduction in supply subsidies (World Bank, 2003; Gaviria, Medina, andMejía, 2006). Although the number of potential users of supply subsidies fell by54 percent from 1994 to 2000, resources devoted to subsidizing supply increasedby 155 percent (Departamento Nacional de Planeación, 2002). These inconsis-tencies were compounded by the fact that closing an underutilized public facilityis always a challenging endeavor.40 With resources devoted to health care declin-ing after 1997, and coverage increasing, expenditure per capita fell.
To address some of these issues, Congress in 2001 approved Law 715, whichmore clearly defined responsibilities and rationalized the distribution of transfers.Resources for insurance coverage are now distributed across regions, taking intoaccount the number of beneficiaries and the estimated cost of providing the ser-vice. Resources for hospitals are estimated based on each department’s number ofuninsured. Departments are in charge of executing national policies, running thehospitals, and inspecting and regulating insurers; municipalities are entrusted withrunning the contributory and subsidized regimes, including selecting the benefi-ciaries of the latter.41
Compounding the problems stemming from poor design, there is ample evi-dence of system abuse. Being poor is not the only reason for being classified as Sisben 1 or 2 and eligible to participate in the subsidized regime. Individuals clas-sified in levels 4 to 6 have also joined,42 and political patronage seems to haveplayed a role (Gaviria et al., 2006). Sisben fails to expeditiously capture changesin a household’s true condition. A 2000 review found that type I errors (failure toclassify a poor household as such) happened 15 percent of the time, but type II
140 roberto steiner, irene clavijo, and natalia salazar
39. However, under the decentralization law (Law 60 of 1993), transfers to subnational govern-ments to fund health care were conceived as supply subsidies, with departments entrusted withadministering hospitals.
40. Law 100 had internal consistency problems. Although the idea was that there would be threemain actors acting independently from one another (the insured, the insurer, and the serviceprovider), in many instances the same entity acted as both insurer and provider, even though the inte-gration was hardly justified on efficiency grounds. Departments, which own the public hospitals,have been involved in insurance activities. This has given rise to conflicts of interest, reduced com-petition, and impaired accountability, and has generated demand for providers that otherwise wouldhave been redundant and should have been shut down.
41. In fact, only “certified municipalities” (those with 100,000 or more inhabitants) and smallerones with a proven track record play this role.
42. Gaviria et al. (2006) estimate that in 2003 more than half of individuals classified as Sisben1 or 2 were not affiliated with the system, whereas some 20 percent of those classified as Sisben 3 and4 were.
11630-04_CH04_rev2.qxd 6/2/09 4:11 PM Page 140
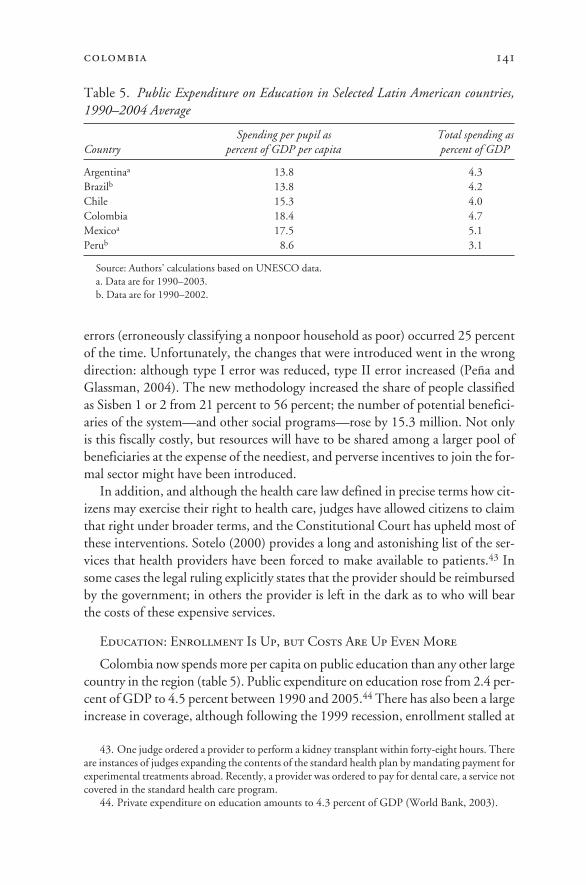
errors (erroneously classifying a nonpoor household as poor) occurred 25 percentof the time. Unfortunately, the changes that were introduced went in the wrongdirection: although type I error was reduced, type II error increased (Peña andGlassman, 2004). The new methodology increased the share of people classifiedas Sisben 1 or 2 from 21 percent to 56 percent; the number of potential benefici-aries of the system—and other social programs—rose by 15.3 million. Not onlyis this fiscally costly, but resources will have to be shared among a larger pool ofbeneficiaries at the expense of the neediest, and perverse incentives to join the for-mal sector might have been introduced.
In addition, and although the health care law defined in precise terms how cit-izens may exercise their right to health care, judges have allowed citizens to claimthat right under broader terms, and the Constitutional Court has upheld most ofthese interventions. Sotelo (2000) provides a long and astonishing list of the ser-vices that health providers have been forced to make available to patients.43 Insome cases the legal ruling explicitly states that the provider should be reimbursedby the government; in others the provider is left in the dark as to who will bearthe costs of these expensive services.
Education: Enrollment Is Up, but Costs Are Up Even More
Colombia now spends more per capita on public education than any other largecountry in the region (table 5). Public expenditure on education rose from 2.4 per-cent of GDP to 4.5 percent between 1990 and 2005.44 There has also been a largeincrease in coverage, although following the 1999 recession, enrollment stalled at
colombia 141
43. One judge ordered a provider to perform a kidney transplant within forty-eight hours. Thereare instances of judges expanding the contents of the standard health plan by mandating payment forexperimental treatments abroad. Recently, a provider was ordered to pay for dental care, a service notcovered in the standard health care program.
44. Private expenditure on education amounts to 4.3 percent of GDP (World Bank, 2003).
Table 5. Public Expenditure on Education in Selected Latin American countries,1990–2004 Average
Spending per pupil as Total spending asCountry percent of GDP per capita percent of GDP
Argentinaa 13.8 4.3Brazilb 13.8 4.2Chile 15.3 4.0Colombia 18.4 4.7Mexicoa 17.5 5.1Perub 8.6 3.1
Source: Authors’ calculations based on UNESCO data.a. Data are for 1990–2003.b. Data are for 1990–2002.
11630-04_CH04_rev2.qxd 6/2/09 4:11 PM Page 141
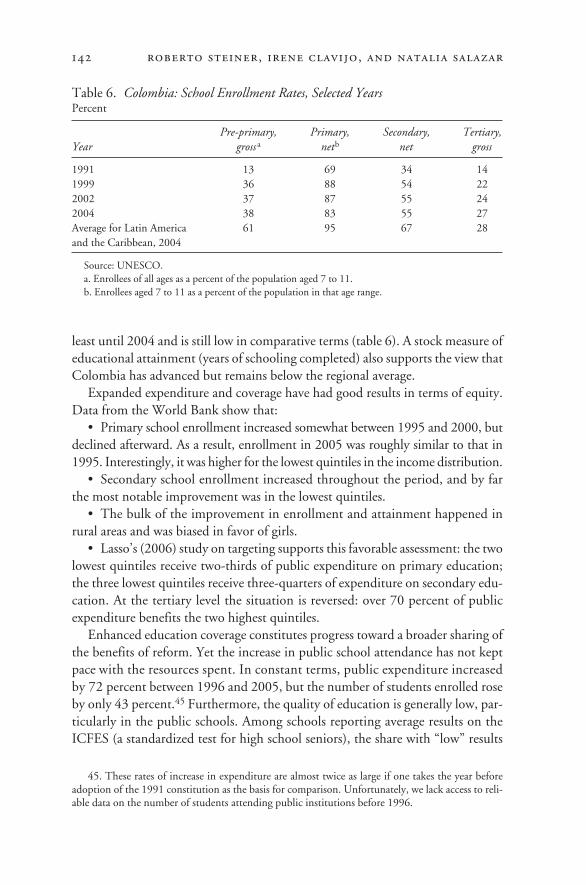
least until 2004 and is still low in comparative terms (table 6). A stock measure ofeducational attainment (years of schooling completed) also supports the view thatColombia has advanced but remains below the regional average.
Expanded expenditure and coverage have had good results in terms of equity.Data from the World Bank show that:
• Primary school enrollment increased somewhat between 1995 and 2000, butdeclined afterward. As a result, enrollment in 2005 was roughly similar to that in1995. Interestingly, it was higher for the lowest quintiles in the income distribution.
• Secondary school enrollment increased throughout the period, and by farthe most notable improvement was in the lowest quintiles.
• The bulk of the improvement in enrollment and attainment happened inrural areas and was biased in favor of girls.
• Lasso’s (2006) study on targeting supports this favorable assessment: the twolowest quintiles receive two-thirds of public expenditure on primary education;the three lowest quintiles receive three-quarters of expenditure on secondary edu-cation. At the tertiary level the situation is reversed: over 70 percent of publicexpenditure benefits the two highest quintiles.
Enhanced education coverage constitutes progress toward a broader sharing ofthe benefits of reform. Yet the increase in public school attendance has not keptpace with the resources spent. In constant terms, public expenditure increasedby 72 percent between 1996 and 2005, but the number of students enrolled roseby only 43 percent.45 Furthermore, the quality of education is generally low, par-ticularly in the public schools. Among schools reporting average results on theICFES (a standardized test for high school seniors), the share with “low” results
142 roberto steiner, irene clavijo, and natalia salazar
Table 6. Colombia: School Enrollment Rates, Selected YearsPercent
Pre-primary, Primary, Secondary, Tertiary,Year gross a netb net gross
1991 13 69 34 141999 36 88 54 222002 37 87 55 242004 38 83 55 27Average for Latin America 61 95 67 28and the Caribbean, 2004
Source: UNESCO.a. Enrollees of all ages as a percent of the population aged 7 to 11.b. Enrollees aged 7 to 11 as a percent of the population in that age range.
45. These rates of increase in expenditure are almost twice as large if one takes the year beforeadoption of the 1991 constitution as the basis for comparison. Unfortunately, we lack access to reli-able data on the number of students attending public institutions before 1996.
11630-04_CH04_rev2.qxd 6/2/09 4:11 PM Page 142
rose from 40 percent in 1986 to over 60 percent in 1999 (Fundación Corona,2003). The 2005 SABER test portrays a similarly worrisome picture in languageand math, nationally and across regions, for fifth and ninth graders.46 Colombianstudents have not fared well on international tests either.47 In 2003, 97 percent ofstudents in the lowest income quintile who enrolled in primary school attendedpublic institutions, while only 38 percent of children in the highest quintile didso. There is strong evidence suggesting that the quality of public education is lowerthan that offered by private schools, even after controlling for socioeconomic dif-ferences (Núñez et al., 2002).
Public school teachers are part of the problem. The bulk of the rise in educa-tion expenditure following the 1991 boost to decentralization has gone to payingwages.48 Although there are three types of teachers—municipal, departmental,and national (some 80 percent of public sector teachers were employed by the cen-tral government in 2000)—the wages of all are centrally determined. Given thatmost resources come in the form of transfers from the central government, thelevel of government that administers the teacher roster is not the same level thatnegotiates wages and pays for them. Moreover, Law 60 determined that transfersshould be based on the number of students and teachers as of 1993. This has per-petuated inefficiencies and kept in place whatever inequalities may have existedthen. In 2001 Law 715 brought about a major change, making transfers a func-tion of the number of students, with actual costs taken into consideration. Still,with wages set through centralized bargaining and with transfers paying for mostof the wage bill, the incentives for a governor to transfer teachers to places wherethey are most needed do not seem particularly strong.
Until 2002, teaching activities were governed by a 1979 statute that created aranking of categories in which time in grade and skill upgrading were the maindeterminants of promotions, together with other incentives that were prone toabuse. Although the 1994 General Education Law established a system to developprocedures to evaluate teachers, it was only in 2002 that a new statute, applicableto those hired after 2002, was enacted. It introduced teacher evaluations both forthose entering the system and for those remaining and being promoted. Some274,000 teachers out of a total of around 426,000—295,000 of them in the pub-lic schools—were evaluated in 2005.
colombia 143
46. Scatterplots (available upon request) with data for all thirty-one departments and special dis-tricts suggest no discernible association between the 2005 SABER test results and regional GDP.
47. In the 1995 math and science TIMSS exam, eighth and ninth graders ranked next-to-lastamong forty-one countries assessed. Colombian students ranked twenty-ninth out of thirty-fivecountries participating in the 2001 PIRLS reading literacy test. On a positive note, students now rou-tinely participate in international evaluations, including the 2005 PISA exam administered by theOrganization for Economic Cooperation and Development and in the 2006–07 versions of TIMSS.
48. Current expenditure (mainly wages) represented 92 percent of total expenditure on educa-tion in 1990–94 and 97 percent in 2000–05. Public teachers not only enjoyed a privileged pensionregime; they also received some of the most generous wage adjustments.
11630-04_CH04_rev2.qxd 6/2/09 4:11 PM Page 143
Regional and national authorities have embarked on efforts with the private sec-tor to enhance enrollment and increase the quality of public education. Because ofsupply limitations in the public sector, using public resources to take advantage ofprivate sector installed capacity has been a wise move. Recent initiatives includethe PACES program at the national level (1991–97), in which poor children wererandomly given vouchers to attend private schools; ongoing concession schools inBogotá and other major cities; and the Escuela Nueva program in rural areas. Allhave received positive evaluations.49
Some Proposals for Further Strengthening the Foundations for Growth
We have attempted to show throughout this chapter that although several of thereforms undertaken since 1990 strengthened some of the foundations for growth,other reforms had unintended consequences (see table 3). One of the most salientexamples is fiscal decentralization, particularly of expenditure on health and edu-cation, which had adverse effects on macroeconomic stability, even if it contributedto broader sharing of the benefits of growth. A similar judgment can be made withregard to judicial reform, where the welcome expansion of access to the justice sys-tem came with a high fiscal price tag. Likewise, several reforms—to health care andpensions, for example—as well as restrictions from the local environment emanat-ing from the political system and the justice system have been conducive to high anddistortionary taxes on business and labor, which have weakened competitiveness.
The past eight years have been devoted to making many of the reforms consis-tent with the goal of restoring fiscal sustainability, which is now widely under-stood to be a prerequisite for sustainable growth, and to avoid the spikes in povertyassociated with sharp economic contractions. The fine tuning of the reforms tomake them fiscally sustainable has included elements geared toward correctingdesign flaws that might have prevented the reforms from fully delivering on theirobjectives. But much remains to be done. In what follows we offer several recom-mendations for enhancing the quality of certain reforms, giving particular atten-tion to identifying the political and institutional constraints that have to be dealtwith to make the suggested changes feasible.
Removing Constraints from the Local Environment
The Justice System
No other single reform seems as important as a fundamental review of certainaspects of the acción de tutela and of the way the Constitutional Court operates.Although citizens’ right of access to the justice system must be upheld, it is also of
144 roberto steiner, irene clavijo, and natalia salazar
49. Angrist, Bettinger, and Kremer (2006) evaluate PACES, and Barrera (2006) the Bogotá con-cession schools.
11630-04_CH04_rev2.qxd 6/2/09 4:11 PM Page 144
paramount importance to curtail the system’s ability to tamper with economicpolicy matters in general and with macroeconomic stability in particular. Yet it isdifficult to envision a more complicated task, as these are two enormously popu-lar institutions, and the Constitutional Court is itself the final arbiter of any pro-posed change. The challenge is to creatively provide incentives for the highestcourt to entertain some of these proposals.
• Appointments to the Constitutional Court. Given how the court is organized andhow its justices are chosen, the latter face much the same incentives as politicians.There are nine justices on the court, each elected by the senate for a period of eightyears, without the possibility of reelection. The senate chooses from groups of threecandidates proposed by the executive, the Supreme Court, and the Consejo deEstado.50 After their term, justices face almost no restrictions on their involvementin politics, and indeed several have launched political careers. Some commentatorshave proposed that the justices be given life tenure and be nominated by the exec-utive and confirmed by the senate (Kugler and Rosenthal, 2005). We believe a lessambitious proposal would stand a better chance of passage: there should be a “cool-off” period of, say, five years before a justice may run for elected office; in exchangefor this concession, tenure on the court could be extended to, say, twelve years.
• The tutela and “fundamental rights.” In the current debate, economists gen-erally argue that justices should interpret and uphold the constitution rather thanrewrite it, whereas the legal profession believes justices may proclaim any right as“fundamental.” Common ground on this issue has yet to be found. An avenueworth exploring, therefore, is one put forward by former associate justice Uprimny(2001), who believes that Colombia’s level of development should inform Consti-tutional Court rulings. In his view, some rights should be achieved progressively,over time, rather than immediately. He proposes a consensual definition by allpowers of what should constitute an adequate health care plan, so that judges willno longer uphold tutelas demanding services beyond what the plan includes. Thecontent of such a program should be enhanced as the country becomes wealthier.
• Prior constitutional review. There is evidence that the existing political processroutinely produces low-quality legislation. Breaches of procedure often occur,which then become grounds for the Constitutional Court to overturn a law. Thecourt should review laws as soon as they are approved, so that if they are to be over-turned on procedural grounds, this is done before they become operational.
The Political System
Additional work is needed to ensure that the goal of political inclusion is madecompatible with a legislature that can deliver high-quality public policies in sucha manner that one foundation for growth is not strengthened at the expense of
colombia 145
50. Although terms are not concurrent, in 2001 seven out of nine justices were replaced at thesame time.
11630-04_CH04_rev2.qxd 6/2/09 4:11 PM Page 145
others. Although 20 parties is a much more reasonable number than 322, it is stilltoo many. To be sure, the biggest challenge is to translate the decline in elec-toral fragmentation into effective cohesion within Congress. We offer the follow-ing recommendations:
• Foster additional electoral consolidation. An obvious step is to graduallyincrease the threshold for winning representation, from 2 percent up to perhaps5 percent.
• Promote stronger political parties. Campaign finance reform should identifyways to strengthen the links between a member of Congress and his or her party.Public and private funds should go to the party rather than to the candidate. Also,a ley de bancadas with more teeth should be enacted, particularly to ensure thatthe law rather than the party determines the proper sanctions for free-riding mem-bers of Congress.
• Enhance legislative efficiency and transparency. Kugler and Rosenthal (2005)argue in favor of granting fast-track authority, whereby the president could submitto Congress nonamendable propositions on urgent economic matters for an up-or-down vote. This might be a good mechanism to avoid the watering down oflegislation, a recurrent problem in the case of laws related to taxes. The proposal’sfeasibility would be enhanced by a “sunset clause,” so that the authority expiresafter a set number of years if Congress chooses not to renew it. Transparency wouldbe enhanced if congressional voting were made by roll call and public, except per-haps on issues related to objections of conscience.
Enhancing Labor Flexibility, Promoting Formalization, and IncreasingPension Coverage
Colombia must persist in the elusive goal of enhancing labor market formaliza-tion, so as to enhance competition and ensure that all workers, not just those cur-rently in the formal sector, share in the benefits of growth.51 Here two constraintsseem insurmountable, at least in the short term: high contributions to the fund-ing of health and pensions, and full indexation of the minimum monthly salary.It is therefore essential to reduce nonwage labor costs other than social securitycontributions (contributions to ICBF, SENA, and CCFs). This is no easy task,given that together these programs administer resources that amount to 1 percentof GDP. In all three, unionization is prevalent, and they are backed by powerfulpolitical actors and provide employment to some 25,000 people (Echeverry andSantamaria, 2004). At first glance the solution seems simple: finance ICBF andSENA through user fees or the budget, and end the public funding of CCFs. Infact, this was one of the recommendations of a recent task force on public spend-
146 roberto steiner, irene clavijo, and natalia salazar
51. Bustamante (2006) estimates that 21 percent of the Colombian labor force was affiliated withthe pension system in 2002, with 89 percent of affiliates coming from urban areas and a similar per-centage from the top three deciles of the income distribution.
11630-04_CH04_rev2.qxd 6/2/09 4:11 PM Page 146
ing. The government, however, caved in to pressure from interest groups, whoargued that if ICBF and SENA were to be funded out of general taxation, theirexistence would be a matter of debate during each budget cycle. Therefore second-best options have to be considered. We propose the following:
• Earmark revenue from general taxation to ICBF and SENA. Funding wouldpreferably come from the VAT, rather than surcharges on formal sector wages.Although revenue earmarking is generally a questionable practice for several rea-sons, when it is unavoidable it should at least apply to less distortionary taxes.
• CCFs should be financed through user fees, particularly given that informal sec-tor workers do not benefit from them. The move away from a tax on labor wouldbe gradually phased in. The reduction in public financing of the CCFs should startby relieving them of the public policy tasks they now administer, such as theunemployment insurance program, which should be run by the government if itis indeed maintained at all.52
Promoting Financial Sector Deepening and Access and Further Developingthe Capital Market
The following reforms of the financial system and the capital market would con-tribute to a broader sharing of the benefits of growth throughout the economy:
• Adopt a more liberal policy with regard to the usury interest rate and a less restric-tive definition of microcredit. Although it is politically impractical to try to elimi-nate the usury rate, the executive has ample room to make it less restrictive.
• Strike a better balance between creditor and debtor rights. The legal systemshould facilitate the structuring of guarantees by removing restrictions on theassets that can serve as collateral, and foster the unification and updating of reg-istries. Expeditious legal and paralegal procedures that speed the execution of guar-antees should be put in place.
• Provide incentives that promote the expansion of data bases, once the Consti-tutional Court upholds the “habeas data” law. Utility companies should beallowed to report to credit bureaus the (generally favorable) information they haveon their subscribers.
• Better regulate AFP investments. Regulations have skewed investments towardpublic debt. As proposed by Laserna (2007), AFPs could be required to maintaina minimum degree of diversification. Given the long-term nature of their liabili-ties, they should be matched to long-term assets such as investments in infrastruc-ture (Asociación Nacional de Instituciones Financieras, 2007). A plausible wayforward is a scheme in which each AFP defines a reference portfolio against whichits performance can be assessed.
colombia 147
52. The World Bank (2005) raised concerns with regard to conflicts of interest involved in CCFsadministering the unemployment insurance program, and it questioned the merit of focusing thisinsurance on workers previously employed in the formal sector.
11630-04_CH04_rev2.qxd 6/2/09 4:11 PM Page 147
Designing a More Business-Friendly Tax Code
On no other topic does there seem to be greater consensus than with regard totaxes, and this is not the place to repeat the specifics of what a “good” tax systemshould look like. The problem is not with the “what,” but rather the “how.” Tobe sure, a less fragmented Congress should be of much help, as it would allow theexecutive to negotiate the reform with a few strong parties rather than with eachmember of Congress individually. Also, the administration has to negotiate froma position of strength. In our view a structural tax reform should be submittedonly in the context of a buoyant fiscal situation, so that the executive can proposeimproving the tax code while at the same time reducing the overall tax burden. Afairer and more business-friendly tax system would contribute to strengtheningcompetition in the economy.
Clarifying the Distribution of Responsibilities among Levels of Government
Putting in place a decentralized political system in a country with a long traditionof political and fiscal centralization has proved to be a challenge, and any furthereffort in that direction is bound to confront risks and costs. The changes intro-duced in 1997–2003 have addressed many of the problems that followed the1991–93 reforms. One key issue, however, remains unresolved, namely, thedelegation of responsibilities. Given the lack of a well-developed framework onterritorial organization—Congress has never passed a territorial organizationlaw—efforts to devolve responsibilities have become bogged down in details.53
Behind the label “public expenditure” stand all the intricacies of the business ofproviding public goods, particularly in the areas of health and education. Thereare many actors, among whom teachers are the most visible, who benefit fromduplicate expenditures and from ill-defined responsibilities.54 Without such aframework, full devolution will take a long time, and many of the benefits ofdecentralization for the broader sharing of growth and equality of opportunities willbe delayed, and macroeconomic stability will continue to be undermined. Inasmuch
148 roberto steiner, irene clavijo, and natalia salazar
53. The lack of a well-defined framework for devolution of resources and responsibilities has alsomade it all but impossible to entertain the possibility of sharing tax bases among levels of govern-ment, thus establishing a constraint on allowing subnational governments to have an important sayon tax issues.
54. An influential senator recently argued that “. . . a Congress with regional and national repre-sentation is in no position to approve a substantive law that affects regional interest with regard toterritory, financial resources and responsibilities” (Pérez, 2006, p. 76, our translation). Soon afterCongress approved Law 715, in 2001, the secretary general of FECODE wrote an interesting pieceobjecting to the new framework for decentralization (Arroyave, 2002). What emerges clearly fromthis document is the opposition of teachers to the decentralization of education. The document com-plains that “the [central government] will no longer administer nor provide educational services”;that “headmasters will be made responsible for the quality of education”; and that “the regional real-location of teachers is now at the discretion of each [subnational government].” The conclusion thatwe reach is that FECODE opposes decentralization because the union stands to obtain better work-ing conditions under a centralized decision-making process.
11630-04_CH04_rev2.qxd 6/2/09 4:11 PM Page 148
as many local public goods are provided by the central government, subnationalgovernments do not face a hard budget constraint; to instill discipline, therefore,the central government must have an important say in how expenditure is under-taken. Local governments are more accountable to the central government thanto their constituents, and voters hold the central government accountable forproblems with the provision of public goods, and they react by demanding moreresources from it.
Attempts at correcting the health care system’s structural flaws should addressthree issues: generating adequate incentives at the subnational level, improvingtargeting, and setting limits on the health care rights of individuals (as discussedabove in reference to the Constitutional Court):
• Increased accountability at the local level is a must. With the central govern-ment providing most of the resources, local authorities face weak incentives toenhance the efficiency of their health care institutions. Instead of being drivenout of the market, inefficient providers are kept in operation and become a fis-cal burden. In the end, the question boils down to enforcing responsibilitiesacquired by the governors. Public hospitals must be placed under close super-vision to pinpoint and correct efficiency problems and to avoid capture by elitesthrough corruption.
• Improving targeting systems is key for the sustainability and effectiveness of thesubsidized regime. Aside from creating a fiscal burden, flawed targeting is detri-mental to the quality of the assistance provided. Although it would be costly andtechnically demanding, an upgrade to the Sisben targeting system that allowshouseholds who have overcome poverty to be removed from the system should bea priority. The long-run cost of doing so will be far less than that of subsidizingthe nonpoor.
• Strengthen incentives to improve the quality of public education. Recent notableefforts to this effect—including with regard to the evaluation, training, and pro-motion of teachers; a better formula for distributing transfers; and the involve-ment of private schools in the provision of public education—can be constrainedby the fact that most teachers are paid at the national level, thus limiting theextent of devolution and enhancement of responsibilities and accountability atthe local level.
Concluding Remarks
In 1990 Colombia embarked on a comprehensive reform program that shouldhave had a positive impact on the foundations for growth, making economicgrowth both fiscally as well as politically sustainable. We have shown that the ini-tial drive for reform failed to deliver on many of its expected promises, and a number of reforms actually weakened some of the foundations, in particularColombia’s long-held adherence to macroeconomic stability. The 1990s were thus
colombia 149
11630-04_CH04_rev2.qxd 6/2/09 4:11 PM Page 149
a decade of unfulfilled promises. Starting in 1999, the reform agenda was rein-vigorated, and many of the design problems of the initial reform drive have beenaddressed. This process, coupled with a benign external environment and amuch-improved security situation, has of late produced enormous benefits interms of economic growth and a renewed decline in poverty. The job is far fromcomplete, however, and in many areas additional reforms need to be undertakenin order to make growth sustainable and even more inclusive. In this chapter wehave offered policy recommendations along many dimensions, taking care toacknowledge that what is technically advisable is not always politically or insti-tutionally feasible.
References
Angrist, J., E. Bettinger, and M. Kremer. 2006. “Long-Term Educational Consequences ofSecondary School Vouchers.” American Economic Review 96, no. 3: 847–62.
Arroyave, R. 2002. “La Ley 715 de 2001: Hacia la Privatización Total de la Educación.”Deslinde no. 30 (February).
Asociación Nacional de Instituciones Financieras. 2005. “Mergers and Acquisitions in theColombian Financial Sector: Impact on Efficiency (1990–2005).” Bogotá.
———. 2007. “Los Fondos de Pensiones y la Financiación de la Infraestructura.” CartaFinanciera 137: 7–12.
Barajas, A., R. Steiner, and N. Salazar. 2000. “The Impact of Liberalization and ForeignInvestment in Colombia’s Financial Sector.” Journal of Development Economics 63, no. 1:157–96.
Barón, G. 2007. “Cuentas de Salud de Colombia 1993–2002: El Gasto Nacional en Salud y suFinanciamiento.” Bogotá: Ministerio de la Protección Social.
Barrera, F. 2006. “The Impact of Private Provision of Public Education: Empirical Evidencefrom Bogotá’s Concession Schools.” World Bank Policy Research Report 4121. Washing-ton: World Bank.
Bernal, R., and M. Cárdenas. 2003. “Determinants of Labor Demand in Colombia: 1976–1996.” Working Paper 10077. Cambridge, Mass.: National Bureau of Economic Research.
Borjas, J., and O. L. Acosta. 2000. “Educational Reform in Colombia.” In A. Alesina, ed., Insti-tutional Reforms: The Case of Colombia. MIT Press.
Botero, F. 2000. “Circunscripción Nacional y Practicas Electorales.” In E. Bonilla, ed., Forma-ción de Investigadores II. Bogotá: Ediciones UniAndes-Colciencias-Tercer Mundo.
Botero, F., and J. C. Rodríguez. 2007. “Escepticismo Optimista: La Reforma Electoral Colom-biana de 2003.” In C. U. Santander and N. Penteado, eds., Os processos eleitorias na AméricaLatina. Brasilia: Editorial LGE.
Bustamante, J. P. 2006. “Factores que Inciden en la Cobertura del Sistema Pensional enColombia.” Archivos de Economía 312. Bogotá: Departamento Nacional de Planeación.
Cadena, X. 2006. “The Next Step for the Colombian Pension System.” Princeton University.Cárdenas, M. 2007. “Economic Growth in Colombia: A Reversal of ‘Fortune’?” Ensayos Sobre
Política Económica 25, no. 53: 220–59.Cárdenas, M., and V. Mercer-Blackman. 2006. Análisis del Sistema Tributario Colombiano y su
Impacto sobre la Competitividad. Cuadernos de Fedesarrollo no. 19. Bogotá: Fedesarrollo.Cárdenas, M., R. Junguito, and M. Pachón. 2006. “Political Institutions and Political Out-
comes in Colombia: The Effects of the 1991 Constitution.” Working Paper R-508. Wash-ington: Inter-American Development Bank.
150 roberto steiner, irene clavijo, and natalia salazar
11630-04_CH04_rev2.qxd 6/2/09 4:11 PM Page 150
Departamento Nacional de Planeación. 2002. “Autorización a la Nación para ContratarEmpréstitos con la Banca Multilateral.” Documento Conpes 3175. Bogotá.
Echeverry, J. C., and M. Santamaria. 2004. “The Political Economy of Labor Reform inColombia.” Documento CEDE 2004-22. Universidad de los Andes.
Edwards, S., and R. Steiner. 2008. La Revolución Incompleta: Las Reformas de Gaviria. Bogotá:Editorial Norma, Colección Vitral.
Fundación Corona, Corpoeducación. 2003. Informe del Progreso Educativo en Colombia. Bogotá:Preal.
Gaviria, A. 2004. “Ley 789 de 2002: Funcionó o No?” Documento CEDE 2004-45. Bogotá:Centro de Estudios sobre Desarrollo Económico.
Gaviria, A., C. Medina, and C. Mejía. 2006. “Assessing Health Reform in Colombia: FromTheory to Practice.” Economía 7, no. 1: 29–72.
Inter-American Development Bank. 1995. Overcoming Volatility. Economic and SocialProgress in Latin America series. Washington.
———. 2002. “Evaluación de la Política Económica en Colombia: Una Aproximación desdeel Análisis de las Políticas Públicas.” Washington (June).
Kalmanovitz, S. 2003. Ensayos sobre Banca Central: Comportamiento, Independencia e Historia.Cali: Grupo Editorial Norma.
Kugler, M., and H. Rosenthal. 2005. “Checks and Balances: An Assessment of the InstitutionalSeparation of Political Powers in Colombia.” In A. Alesina, ed., Institutional Reforms: TheCase of Colombia. MIT Press.
Laserna, J. M. 2007. “Una Propuesta para Mejorar el Manejo de Riesgo, la Diversificación y la Eficiencia de los Portafolios de los Fondos de Pensiones Obligatorios.” Banco de laRepública.
Lasso, F. J. 2006. “Incidencia del Gasto Público Social sobre la Distribución del Ingreso y laReducción de la Pobreza.” In Misión para la Erradicación de la Pobreza y Desigualdad, Mis-ión para el Diseño de una Estrategia para la Reducción de la Pobreza y la Desigualdad. Bogotá:Departamento Nacional de Planeación.
Londoño, J. L. 1995. Distribución del Ingreso y Desarrollo Económico: Colombia en el Siglo XX.Bogotá: Tercer Mundo.
MERP (Misión para la Erradicación de la Pobreza y Desigualdad). 2006. Misión para el Diseñode una Estrategia para la Reducción de la Pobreza y la Desigualdad. Bogotá: DepartamentoNacional de Planeación.
Ministerio de Hacienda. 2005. “Colombia, Surpassing Expectations: Growth, Pensions and theFiscal Deficit.” Bogotá.
Montenegro, A., and R. Rivas. 2005. Las Piezas del Rompecabezas: Desigualdad, Pobreza y Crec-imiento. Bogotá: Taurus.
Núñez, J., and S. Espinosa. 2005. “Pro-Poor Growth and Pro-Poor Programs in Colombia.”Documento CEDE 2005-51. Bogotá: Centro de Estudios sobre Desarrollo Económico.
Núñez, J., R. Steiner, X. Cadena, and R. Pardo. 2002. “Cuáles Colegios Ofrecen Mejor Edu-cación en Colombia?” Documento CEDE 3. Bogotá: Centro de Estudios sobre DesarrolloEconómico.
Peña, X., and A. Glassman. 2004. “Comparación entre Medidas de Pobreza en Colombia: LaNueva Metodología de Sisben.” Washington: Inter-American Development Bank.
Pérez, O. D. 2006. “El Saneamiento Fiscal de los Departamentos y Municipios.” In M. Cárdenas and C. Aguilar, eds., Reformas Fiscales para el Nuevo Siglo. Bogotá: Fedesarrollo.
Roland, G., and J. G. Zapata. 2005. “Colombia’s Electoral and Party System: Paths forReform.” In A. Alesina, ed., Institutional Reforms: The Case of Colombia. MIT Press.
Sahay, R., and S. Goyal. 2006. “Volatility and Growth in Latin America: An EpisodicApproach?” IMF Working Paper 06/287. Washington: International Monetary Fund.
colombia 151
11630-04_CH04_rev2.qxd 6/2/09 4:11 PM Page 151
Salazar, N. 2005. “Represión Financiera y Márgenes de Intermediación.” Carta Financiera 131(September).
Sotelo, L. C. 2000. “Los Derechos Constitucionales de Prestación y sus ImplicacionesEconómico-Políticas.” Archivos de Macroeconomía 133. Bogotá: Departamento Nacionalde Planeación.
Ungar, E. 2003. “Repensar el Congreso para Enfrentar la Crisis.” In A. Mason and L. J. Orjuela,eds., La Crisis Política Colombiana. Bogotá: Ediciones UniAndes.
Uprimny, R. 2001. “Legitimidad y Conveniencia del Control Constitucional de la Economía.”Revista de Derecho Público 12: 154–83.
World Bank. 2003. Colombia: The Economic Foundation of Peace. Washington.———. 2005. Colombia: Labor Market Adjustment, Reform and Productivity: What Are the Fac-
tors That Matter? Report 32068-CO. Washington.
152 roberto steiner, irene clavijo, and natalia salazar
11630-04_CH04_rev2.qxd 6/2/09 4:11 PM Page 152
153
From Near Success to Reform Paralysis
With a population of 4.4 million in 2006 in an area of just 51,000 square kilo-meters, Costa Rica is one of the smallest countries in Latin America. Yet it is aninteresting case to analyze in the context of the CGD project. In recent decadesCosta Rica has applied some but not all of the conventional policies pursued bythe rest of the region, with varying degrees of intensity, while protecting andenhancing social policies—including but not limited to welfare policies—thatwere not discussed as part of the Washington consensus, except perhaps as sourcesof fiscal deficit. The results can be characterized as a near success: steady but notspectacular growth; reduced but still comparatively high inflation; and a rapidreduction in poverty in the aftermath of the early-1980s crisis—all in a context ofeconomic and democratic stability.
Yet the pace of reform has consistently slowed in recent years, while the capac-ity of many public institutions to deliver essential services has diminished. The fallin the poverty rate has stagnated in recent years, and income inequality hasincreased. And, to add paradox to an already interesting story, recent growth hasbeen robust, foreign direct investment (FDI) is growing, the central bank isquickly accumulating reserves, and for the first time in decades there is a fiscal sur-plus—all precisely at the same time that the public sector seems to be verging on
Political and Institutional Obstacles to Reform in Costa Ricajorge cornick and alberto trejos
5
Laura Muñoz provided excellent research assistance throughout the whole project.
11630-05_CH05_rev2.qxd 6/2/09 4:06 PM Page 153
paralysis.1 Clearly, although the new reforms under discussion are extremely dif-ficult to approve and implement, the results of the old reforms, and of day-to-dayeconomic management, have been positive. Yet problems remain: the political sys-tem and public sector administration move very slowly and often ineffectively, asa result of self-imposed rules that have transformed “checks and balances” into“chokes and strangleholds.” Both for its achievements and for its failures, there-fore, Costa Rica seems to be a promising ground on which to apply the CGDframework.
Growth Performance since the Early 1980s
According to cross-country data from the International Monetary Fund, CostaRica recorded the second-highest economic growth rate, corrected for purchasingpower parity (PPP), in Latin America over the 1983–2007 period, lagging behindonly Chile. Real annual GDP growth averaged 5.1 percent and even reached 6.1percent in the last five years. GDP per capita in 2007 surpassed $5,560; correctedfor PPP, that figure is equivalent to almost $11,300, one of the four highest inLatin America. According to household survey data from the National Institutefor Statistics and Census, real wages more than doubled between 1983 and 2003;meanwhile the poverty rate fell from 55 percent during the 1982 crisis to 32 per-cent in 1986 and 17 percent in 2007. Compared with other countries in theregion, Costa Rica has enjoyed not only comparatively high but also quite stablegrowth. There has not been a single fiscal, balance of payments, exchange rate,banking, or political crisis since 1983, and growth has been positive in every single year during the same period.
Costa Rica’s economy has grown even though total factor productivity (TFP)has risen very little; the increase in output is due almost exclusively to the accu-mulation of inputs. Rodríguez, Sáenz, and Trejos (2002) performed a TFPdecomposition for the second half of the twentieth century and found that pro-ductivity increases were rarely a driving force over that long period, and in factTFP growth was negative for the sluggish 1995–2000 period. Although a similarexercise for the 2000–07 period would be far beyond the scope of this paper, thereis some evidence of TFP recovery after 2002.
Zettelmeyer (2006) highlights a number of stylized facts that characterize LatinAmerica’s disappointing growth of the last few decades. Costa Rica shares someof these features, notably the lackluster performance in TFP before 2000 thatLoayza, Fajnzylber, and Calderón (2005) found for the region as a whole. Withrespect to some other stylized facts, however, Costa Rica is an outlier: as alreadynoted, it has not shared with other countries in the region the pattern of frequent
154 jorge cornick and alberto trejos
1. These paragraphs were written in early 2008. As of July of the same year, the country’s eco-nomic prospects seem distinctly less positive, as a consequence of high international commodityprices and the global economic downturn.
11630-05_CH05_rev2.qxd 6/2/09 4:06 PM Page 154
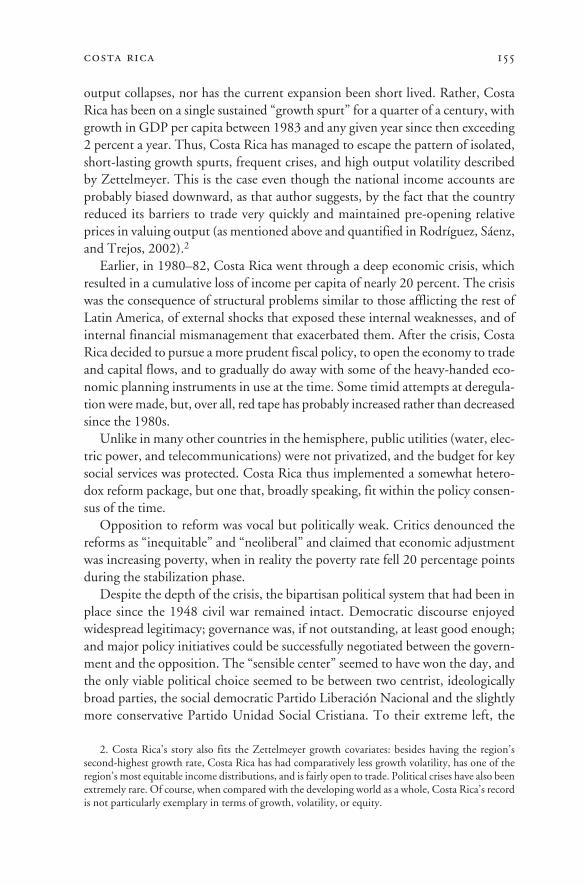
output collapses, nor has the current expansion been short lived. Rather, CostaRica has been on a single sustained “growth spurt” for a quarter of a century, withgrowth in GDP per capita between 1983 and any given year since then exceeding2 percent a year. Thus, Costa Rica has managed to escape the pattern of isolated,short-lasting growth spurts, frequent crises, and high output volatility describedby Zettelmeyer. This is the case even though the national income accounts areprobably biased downward, as that author suggests, by the fact that the countryreduced its barriers to trade very quickly and maintained pre-opening relativeprices in valuing output (as mentioned above and quantified in Rodríguez, Sáenz,and Trejos, 2002).2
Earlier, in 1980–82, Costa Rica went through a deep economic crisis, whichresulted in a cumulative loss of income per capita of nearly 20 percent. The crisiswas the consequence of structural problems similar to those afflicting the rest ofLatin America, of external shocks that exposed these internal weaknesses, and ofinternal financial mismanagement that exacerbated them. After the crisis, CostaRica decided to pursue a more prudent fiscal policy, to open the economy to tradeand capital flows, and to gradually do away with some of the heavy-handed eco-nomic planning instruments in use at the time. Some timid attempts at deregula-tion were made, but, over all, red tape has probably increased rather than decreasedsince the 1980s.
Unlike in many other countries in the hemisphere, public utilities (water, elec-tric power, and telecommunications) were not privatized, and the budget for keysocial services was protected. Costa Rica thus implemented a somewhat hetero-dox reform package, but one that, broadly speaking, fit within the policy consen-sus of the time.
Opposition to reform was vocal but politically weak. Critics denounced thereforms as “inequitable” and “neoliberal” and claimed that economic adjustmentwas increasing poverty, when in reality the poverty rate fell 20 percentage pointsduring the stabilization phase.
Despite the depth of the crisis, the bipartisan political system that had been inplace since the 1948 civil war remained intact. Democratic discourse enjoyedwidespread legitimacy; governance was, if not outstanding, at least good enough;and major policy initiatives could be successfully negotiated between the govern-ment and the opposition. The “sensible center” seemed to have won the day, andthe only viable political choice seemed to be between two centrist, ideologicallybroad parties, the social democratic Partido Liberación Nacional and the slightlymore conservative Partido Unidad Social Cristiana. To their extreme left, the
costa rica 155
2. Costa Rica’s story also fits the Zettelmeyer growth covariates: besides having the region’s second-highest growth rate, Costa Rica has had comparatively less growth volatility, has one of theregion’s most equitable income distributions, and is fairly open to trade. Political crises have also beenextremely rare. Of course, when compared with the developing world as a whole, Costa Rica’s recordis not particularly exemplary in terms of growth, volatility, or equity.
11630-05_CH05_rev2.qxd 6/2/09 4:06 PM Page 155
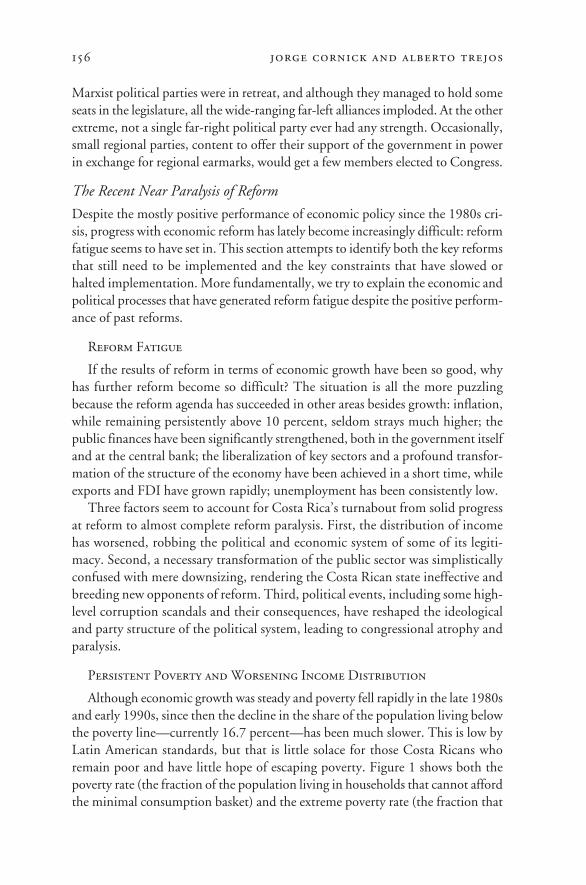
156 jorge cornick and alberto trejos
Marxist political parties were in retreat, and although they managed to hold someseats in the legislature, all the wide-ranging far-left alliances imploded. At the otherextreme, not a single far-right political party ever had any strength. Occasionally,small regional parties, content to offer their support of the government in powerin exchange for regional earmarks, would get a few members elected to Congress.
The Recent Near Paralysis of Reform
Despite the mostly positive performance of economic policy since the 1980s cri-sis, progress with economic reform has lately become increasingly difficult: reformfatigue seems to have set in. This section attempts to identify both the key reformsthat still need to be implemented and the key constraints that have slowed orhalted implementation. More fundamentally, we try to explain the economic andpolitical processes that have generated reform fatigue despite the positive perform-ance of past reforms.
Reform Fatigue
If the results of reform in terms of economic growth have been so good, whyhas further reform become so difficult? The situation is all the more puzzlingbecause the reform agenda has succeeded in other areas besides growth: inflation,while remaining persistently above 10 percent, seldom strays much higher; thepublic finances have been significantly strengthened, both in the government itselfand at the central bank; the liberalization of key sectors and a profound transfor-mation of the structure of the economy have been achieved in a short time, whileexports and FDI have grown rapidly; unemployment has been consistently low.
Three factors seem to account for Costa Rica’s turnabout from solid progressat reform to almost complete reform paralysis. First, the distribution of incomehas worsened, robbing the political and economic system of some of its legiti-macy. Second, a necessary transformation of the public sector was simplisticallyconfused with mere downsizing, rendering the Costa Rican state ineffective andbreeding new opponents of reform. Third, political events, including some high-level corruption scandals and their consequences, have reshaped the ideologicaland party structure of the political system, leading to congressional atrophy andparalysis.
Persistent Poverty and Worsening Income Distribution
Although economic growth was steady and poverty fell rapidly in the late 1980sand early 1990s, since then the decline in the share of the population living belowthe poverty line—currently 16.7 percent—has been much slower. This is low byLatin American standards, but that is little solace for those Costa Ricans whoremain poor and have little hope of escaping poverty. Figure 1 shows both thepoverty rate (the fraction of the population living in households that cannot affordthe minimal consumption basket) and the extreme poverty rate (the fraction that
11630-05_CH05_rev2.qxd 6/2/09 4:06 PM Page 156
cannot afford the minimal food basket), both baskets as defined by the NationalInstitute for Statistics and Census.
Inequality has always been a significant problem in Costa Rica, even if less sothan in neighboring countries. The country’s Gini coefficient,3 already high in the1970s, increased dramatically during the 1980–82 crisis, but then fell back belowhistorical levels during and immediately after the postcrisis stabilization. The Ginithen gradually crept up again during the 1990s, and in the last few years it hasoscillated wildly. Other indicators of income dispersion display similar patterns.
Does this mean that the relatively rapid growth enjoyed in the last two decadeswas not pro-poor? In a loose sense, following Leipziger (2005), growth has beenpro-poor by definition, given that the poverty rate fell; in the very strong senseused by Kakwani and Pernia (2000), however, growth was not pro-poor, becausethe segment of the population below the poverty line saw its income per capitagrow at a slower rate than average income per capita. To be precise, in the1988–2007 period, according to the family income data reported by the nationalhousehold survey, the poorest 40 percent of the population (the relevant groupfor this purpose, as the poverty rate varied between the current 16.7 percent and33.1 percent in that period) saw its income per capita grow by an average of about1.9 percent annually, while the population as a whole enjoyed average annual
costa rica 157
3. The following discussion is based on analyses by Juan Diego Trejos with data from the house-hold survey and the national census.
Figure 1. Costa Rica: Alternative Measures of Poverty, 1961–2008
Source: Annual Household Survey, National Institute for Statistics and Census.a. Fraction of the population living in households that cannot afford the minimal consumption basket.b. Fraction of the population living in households that cannot afford the minimal food basket.
Percent
Extreme povertyb
Povertya
10
20
30
40
50
200520001995199019851980
11630-05_CH05_rev2.qxd 6/2/09 4:06 PM Page 157
growth of 3.3 percent, and the richest 40 percent saw annual growth of 3.6 per-cent. Had all income brackets enjoyed the same rate of growth, the fall in thepoverty rate would have been larger, especially since a large number of peoplehad incomes within a few percentage points of the poverty line. But this resultdoes not hold throughout the period. For example, between 2004 and 2007—years of unusually rapid growth—average household income among the poorestquintile grew by 28 percent, while that for the population as a whole grew by 19.1 percent; thus, growth was extremely pro-poor in those years, even by thestrong definition.
One should be careful, however, in interpreting this result. On the one hand,comparison with other Latin American countries is not easy, because in some ofthose countries, unlike in Costa Rica, “the poor” (as conventionally defined) rep-resent a majority of the population. On the other hand, one should take intoaccount the immigration into Costa Rica of between 300,000 and 450,000Nicaraguans during precisely the same period (Consejo Monetario Centro-americano, 2004). According to Lizano and Monge (2006), 89.3 percent of immi-grants in 2005 were in the poorest fifth of the Costa Rican population andaccounted for 24.3 percent of Costa Rica’s poor. If one corrects for the effects ofimmigration, which include not only the numbers of poor immigrants but alsotheir competition for jobs with the poorest locals, the fall in the poverty rate inthe period under consideration was larger, and it is easier to argue that growth hasbeen pro-poor.
Even if one accepts the interpretation of the data that growth has not been pro-poor, it is not necessarily the case that the pro-growth reforms caused poverty. Inour opinion, the incomes of the poor would have been no higher in the absenceof these reforms; on the contrary, the poverty rate would have been higher. Andthe main reasons (besides immigration and the worldwide increase in the educa-tion premium) why income redistribution was not more successful are some of thesame ones we highlight below as limitations on growth: congressional institutionsthat delay the legislation required to further economic reform; low governmentrevenue that forces the postponement or cancellation of public investment, bothsocial and economic, required to strengthen the growth foundations; and admin-istrative restrictions that render the public sector, or at least large portions of it,increasingly ineffective.
A Weaker Public Sector and a More Contentious Political System
Costa Rica’s relatively strong economic growth record is more than matched byits remarkable record on social policy: literacy, at 97 percent, and life expectancyat birth, at 78.7 years, are at developed-world levels; 98 percent of the populationhas access to drinking water; net primary and secondary school enrollment ratesare 98.6 and 66.1 percent, respectively. Also, by our calculations 87.6 percent ofthe population has health insurance, 98.3 percent has electricity in their homes,
158 jorge cornick and alberto trejos
11630-05_CH05_rev2.qxd 6/2/09 4:06 PM Page 158
and there are 575 telephone lines (main and mobile combined) per 1,000 people.None of this could have been achieved without a public sector capable of bothdesigning and implementing effective public policies, including the constructionof large infrastructure projects. Strong institutions and a political system domi-nated by two political parties alternating in power, with sufficient commonground to reach agreements on the broad outlines of public policy, form the back-ground of these accomplishments.
However, in recent years Costa Rica’s public sector seems to be slowly collaps-ing. Many government agencies are less and less capable of discharging theirduties. Years of cost-cutting efforts and administrative atomization, the misdirec-tion of anti-corruption and other regulations, and financial and personnel prob-lems are taking their toll. Whole areas of government activity, especially those thatinvolve investment and a long-term mindset, have been weakened. The mostnotable examples are education and transportation infrastructure (the latter is dis-cussed in detail below).
Public sector reform in Costa Rica has too often been simplistically confusedwith downsizing. The resulting loss in public sector effectiveness has turned thesame public servants who would ordinarily be in charge of implementing policyand reform into an active and aggressive political force against reform. Meanwhilea drastic reduction in public sector capital expenditure, particularly in infrastruc-ture and education, ensured that after the crisis was over, public expenditurewould continue to be managed under a crisis mindset. Thus, a perception thatgovernment does not deliver became widespread, weakening the mandates ofreform-minded administrations.
To make matters worse, a new political reality emerged. Since the mid-1990s,Costa Rica has witnessed the emergence of a new political opposition, fiercelyglobaphobic, highly organized and vocal, electorally successful, and including aninfluential strand of what, in our opinion, can only be described as a hard core ofwell-organized groups that do not believe in the democratic system.
In the two-party political system that prevailed before this change, both sidesshared ample common ground, an ability and willingness to negotiate and exe-cute agreements, and an expectation of alternating in power. The executive alsopossessed some effective tools—such as control of disbursement of earmarks—toenforce party discipline. After the change, new parties have emerged to capitalizeon the anti-system mentality, while the old ones have been considerably weak-ened; there is now a multiparty Congress and very little basis for consensus. Yetmeanwhile the country has kept the same parliamentary procedures and politicalhabits as before. The combination of these old rules with the new composition of Congress has led to near paralysis, which can only be overcome through time-consuming and presumably costly negotiations, as each individual member ofCongress has the ability to delay any vote almost indefinitely. It is extremely hardfor both the executive and individual legislators to get any bill passed within a
costa rica 159
11630-05_CH05_rev2.qxd 6/2/09 4:06 PM Page 159
reasonable time frame, even if it enjoys the support of a strong majority: the sta-tus quo is king.4
How did this change in the country’s politics come about? Although the poorwere protected during the postcrisis stabilization phase, and in fact a broad seg-ment of the working classes thrived during the recovery, thus partly addressing thebroad sharing of the benefits of growth (one of the five growth foundations identi-fied by the CGD framework), a large portion of the middle class did not share inthe fruits of the rapid growth achieved in that period. These were mainly peoplewho worked or expected to work in the public sector, but also some professionalsand clerical workers in the private sector. As it happens, these middle class work-ers were the backbone of the Costa Rican political system. Neglect of their eco-nomic needs and aspirations, compounded by political mistakes, weakenedpolitical support for the traditional, “sensible center” political parties. This, in ouropinion, is the key element that explains both the emergence of the new, anti-reform political organizations that now enjoy broad electoral support and the cur-rent impasse in public policymaking.
Successes, Near Successes, and Failures: Which Policies Matter Most for Future Growth?
As argued above, Costa Rica has arrived at a juncture at which the design,approval, and implementation of growth-enhancing, middle class–strengtheningreforms are almost impossible, unless Congress somehow recovers its ability toproduce legislation at a reasonable pace and the rest of the public sector recoversits effectiveness. The congressional rules that worked, almost in spite of them-selves, for decades have ceased to work in the wake of the political realignment.Consequently, the legislature is paralyzed, and any reform requiring legislation isso likely to be delayed indefinitely that many proposed bills are simply shelvedwithout ever being put to a vote. To the extent that this problem can be solved, itis this reform that opens the door to many other areas of reform that address oneor more of the foundations of growth identified in the CGD framework. Hence,we will begin our analysis of reform by looking at legislative reform, because of itsimportance for progress across the whole spectrum of growth foundations.
Meanwhile the public sector, as a result of botched reforms in the past, is nolonger able to deliver the services expected from it efficiently and on time. Thus,administrative reform is the second area addressed in our analysis. This adminis-trative weakness is manifest in several areas, but none more important than theprovision of transportation infrastructure. Our discussion of administrativereform therefore focuses on that sector, both because the administrative difficul-
160 jorge cornick and alberto trejos
4. Recently, a “fast track” rule has been approved and now has been tested at the ConstitutionalCourt. Although not exactly “fast,” this rule allows Congress to set a definite number of sessions afterwhich a bill must be put up for a vote.
11630-05_CH05_rev2.qxd 6/2/09 4:06 PM Page 160
ties encountered there are emblematic of those observed across the whole publicsector, and because the poor present state of the country’s transportation infra-structure specifically affects performance on each of the growth foundations. Justas Costa Rica’s entire reform agenda today is being thwarted in Congress by pro-cedural potholes, detours, and gridlock, so, too, in the most literal sense, itsprogress on growth-enhancing reforms is being held up by an outdated and in-adequate transport network.
Once Congress, the executive, and the rest of the public sector are able at somepoint in the future to discharge their duties effectively, the most salient weaknessesin the Costa Rican growth foundations can be addressed. These have to do withlack of equality of opportunities, insufficient economic competition, and the fact thatthe gains in terms of macroeconomic stability have been significant but not com-plete. Thus, our other three priority reforms relate mainly to those weaknesses.
First, government needs more revenue, both to consolidate the macroeconomicstability already achieved and make it sustainable (for example, by reducing debt,absorbing the quasi-fiscal deficit of the central bank, and reducing inflation) andto strengthen the public networks and institutions that are critical to improving thecountry’s income distribution and thus to improving equality of opportunities andto sharing more broadly the benefits of the country’s growth. Improved tax collectionhas already not only reduced the public sector deficit but also, more recently, gen-erated fiscal surpluses. Nevertheless, existing revenue is still far from sufficient tofinance the country’s long-postponed and direly needed public sector investments.Thoroughgoing tax reform is necessary to attend to these needs while preservingstable public finances. Tax reform is therefore our third area of study.5
Second, an area of particular importance for greater economic competition anda more dynamic business environment is reform of the country’s antiquated andclearly inadequate telecommunications regime. Telecommunications is an area inwhich strong political sensitivities have prevented progress for years. As a conse-quence, the system’s performance is so poor that it is affecting most of the othergrowth foundations, including macroeconomic stability, because so large a share ofthe state’s resources is tied up in this public sector monopoly, and equality ofopportunity, because the existence of this monopoly excludes would-be entrants.On the bright side, the years of stagnation have left many low-hanging fruit forreform to pick. The current system clearly delivered major achievements in thepast, but standards in several parts of the market are very low; restoring a compet-itive telecommunications system is thus vital for a series of critical industries, rang-ing from software to business services, and from tourism to computing.
costa rica 161
5. It has been suggested to us that given the paramount importance of education in Costa Rica,this chapter should examine reform in that area as well. We agree that education is a high priority forthe growth foundations and that it has deteriorated in Costa Rica, but we believe that most of theproblem in this field, just as in infrastructure, is a manifestation of the country’s fiscal and adminis-trative problems rather than a separate problem with its own distinct origins.
11630-05_CH05_rev2.qxd 6/2/09 4:06 PM Page 161
Third, although the successful reform of the trade and investment regime hasbeen perhaps the most critical element in the country’s postcrisis recovery andgrowth, a significant pending agenda in trade liberalization remains, with over-whelming obstacles in its path. As with telecommunications, reform in this areais primarily aimed at strengthening economic competition, but by lowering entrybarriers to a range of activities, it is also important for enhancing equality of oppor-tunities. Success in the foreign markets opened to trade should also contribute pos-itively to Costa Rica’s balance of payments, thus assisting macroeconomic stability.
Table 1, which identifies the relationship between each of the above sets ofpolicies and the foundations of growth (following the authors’ admittedly some-what subjective judgments), is intended to clarify the connection between thesereforms and the CGD framework. The table groups a number of specific reformsinto several policy areas. We think this organization is useful for understandingsome of the paradoxes of Costa Rica’s economic performance. For example, rapideconomic growth in the country that possesses Latin America’s last remainingtelecommunications monopoly seems easier to understand when placed in a con-text of market-based policies in which, over all, the “progress score” is not bad,even if telecommunications reform lags behind the rest.
The question marks in table 1 identify those cases where the impact of reformis unknown or ambiguous. In many cases this ambiguity is the result of a defini-tion of reform that is, perhaps, a bit too broad. For example, privatization of thetelecommunications monopoly would be expected to strengthen macroeconomicstability, all else equal. But liberalization without privatization, leaving the publicutility to compete with private providers (and thus facing the possibility of bank-ruptcy), could create potentially large contingent liabilities that would workagainst macroeconomic stability.
Economic Reform and the Growth Foundations
In the previous section we used the CGD framework to identify five areas ofreform that are key to Costa Rica’s future economic performance. Here we pur-sue a deeper understanding of these reforms, their relevance to the foundations ofgrowth, the steps necessary to move them forward, and the barriers likely to beconfronted in the process. As already noted, we find that political and institutionalobstacles to implementation are particularly important, and therefore we beginwith those.
Legislative Reform
A coherent body of law and respect for the rule of law are obvious prerequisitesfor economic growth and development in a modern market economy. Onlyslightly less obvious is the need for an effective, representative, and efficient sys-tem for revising and updating the laws and promulgating new laws as needed. A
162 jorge cornick and alberto trejos
11630-05_CH05_rev2.qxd 6/2/09 4:06 PM Page 162
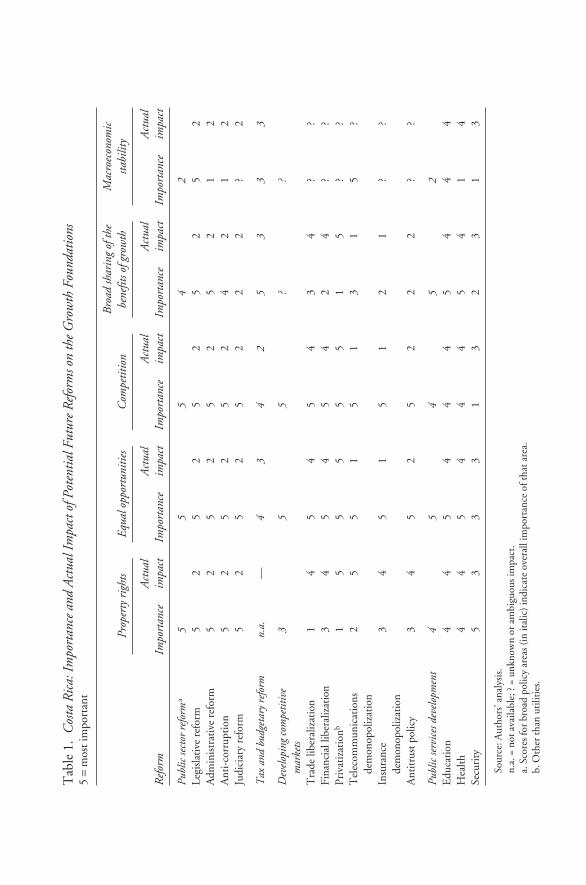
Tab
le 1
.C
osta
Ric
a: I
mpo
rtan
ce a
nd A
ctua
l Im
pact
of P
oten
tial F
utur
e R
efor
ms o
n th
e G
row
th F
ound
atio
ns5
=m
ost i
mpo
rtan
t
Bro
ad sh
arin
g of
the
Mac
roec
onom
ic
Prop
erty
rig
hts
Equa
l opp
ortu
nitie
sC
ompe
titio
nbe
nefit
s of g
row
thsta
bilit
y
Act
ual
Act
ual
Act
ual
Act
ual
Act
ual
Ref
orm
Impo
rtan
ceim
pact
Impo
rtan
ceim
pact
Impo
rtan
ceim
pact
Impo
rtan
ceim
pact
Impo
rtan
ceim
pact
Publ
ic se
ctor
ref
orm
a5
55
42
Legi
slat
ive
refo
rm5
25
25
25
25
2A
dmin
istr
ativ
e re
form
52
52
52
52
12
Ant
i-co
rrup
tion
5
25
25
24
21
2Ju
dici
ary
refo
rm5
25
25
22
2?
2
Tax
and
bud
geta
ry r
efor
mn.
a.—
43
42
53
33
Dev
elop
ing
com
petit
ive
35
5?
?m
arke
tsT
rade
libe
raliz
atio
n1
45
45
43
4?
?Fi
nanc
ial l
iber
aliz
atio
n3
45
45
42
4?
?Pr
ivat
izat
ionb
15
55
55
15
??
Tel
ecom
mun
icat
ions
2
55
15
13
15
?de
mon
opol
izat
ion
Insu
ranc
e 3
45
15
12
1?
?de
mon
opol
izat
ion
Ant
itru
st p
olic
y3
45
25
22
2?
?
Publ
ic se
rvic
es d
evel
opm
ent
45
45
2E
duca
tion
44
54
44
54
44
Hea
lth4
45
44
45
41
4Se
curi
ty5
33
31
32
31
3
Sour
ce: A
utho
rs’ a
naly
sis.
n.a.
= n
ot a
vaila
ble;
? =
unkn
own
or a
mbi
guou
s im
pact
.a.
Sco
res
for
broa
d po
licy
area
s (i
n it
alic
) ind
icat
e ov
eral
l im
port
ance
of t
hat a
rea.
b. O
ther
than
uti
litie
s.
11630-05_CH05_rev2.qxd 6/2/09 4:06 PM Page 163
well-functioning legislature is thus vital for the proper functioning of the econ-omy, which it affects through every one of the growth foundations. If the laws areflawed and cannot be rewritten without interminable delay, property rights are atrisk of being usurped, either outright or by exploiting that delay. A legislative bodywhose makeup is poorly aligned with the actual distribution of the population willbe prone to decisions that favor those who are better represented; this inevitablyimpacts both equality of opportunities and the broad sharing of the benefits of eco-nomic growth. The rules under which the legislature operates determine whetherpolitical competition leads to open debate and good-faith negotiation, and so tolegislation that serves the national interest, or to gridlock and paralysis. And bothmacroeconomic stability and healthy economic competition frequently depend ontimely and responsible legislative decisions on the government budget, fiscal stim-ulus, fair taxation, antitrust, and a host of other matters.
The existing congressional system in Costa Rica has two major problems. Oneis the inefficiency of the existing rules of order and parliamentary procedures andthe ease with which they can be used to delay or block action. The other is theunrepresentative manner in which members of Congress are elected.
Cumbersome Rules and Procedures
The formal parliamentary procedures of the Costa Rican Congress give polit-ical minorities enormous power to make themselves heard by indefinitely delay-ing votes that they oppose. This creates a power vacuum that is often then filledby judicial activism, as new interpretations of the existing law substitute for newlegislation. Delay also leads the executive to abandon efforts at reform that requirenew legislation, and instead to push reform through executive action, only to findthat its power to do so is extremely limited. Because most reforms require sup-porting legislation to some degree, the extreme difficulty in passing laws is obvi-ously an obstacle to growth.
The most controversial areas of political debate in the last few years have beenthe worst victims of congressional deadlock. These include a variety of laws toenhance economic competition, for example through telecommunications reformor trade liberalization. Also affected have been laws linked to macroeconomic sta-bility, such as fiscal initiatives. Finally, the existing programs that seek to alleviatepoverty and reduce the gap between the rich and poor, thus generating equalopportunities, were designed many years ago, in response to a different distribu-tional challenge in a very different country and economy. It is necessary not onlyto inject fresh resources into these programs, but also to create new programsdesigned for the new order. The topic is naturally controversial, and as long as par-liamentary procedures require near unanimity, it is very unlikely that changes ofthe necessary scope and magnitude will be enacted.
Among the most problematic of Congress’s rules and procedures are the fol-lowing. A two-thirds quorum is required not only when votes are cast but even
164 jorge cornick and alberto trejos
11630-05_CH05_rev2.qxd 6/2/09 4:06 PM Page 164
during debate: written discussion and submissions for the record are not allowed.Bills must be voted on once in committee and then twice by the full Congress.Questions concerning a law’s constitutionality are referred to the courts betweenthe first and the second vote; a minority of members may even send the bill tothe courts before the first vote. Every member may propose an unlimited num-ber of amendments to a bill and is allocated a certain amount of time to arguefor each proposal. Each motion to amend is debated and voted on separately, maybe raised and re-raised in committee, and then raised and re-raised again beforethe full house.
Bills before Congress are discussed on a first-come, first-served basis unless asupermajority agrees otherwise, so a new and urgent proposal may have to waityears before being discussed. During some months every year, bills are discussedin the order the executive requests, but, unlike in other countries with a similarrule, the executive cannot force a vote on those bills. The chair has some tools toaccelerate the proceedings, provided a two-thirds majority agrees, and even thenthe mechanics are very fickle and the dissenting minority can easily prevail. Anymember may question the procedure and raise it before the Supreme Court. If thecourt finds any procedural mistake, even in form, the process must go back to thepoint where the mistake happened, even if this implies the invalidation of a vote.
These rules, cumbersome though they are, did not impede decision making formany years because they operated in a bipartisan setting, in which the two majorparties used the rules of order as a bargaining tool, not as a means to paralyze apolarized Congress. The two leading parties held most of the seats in Congressand usually alternated the presidency. Because each party expected that it wouldsomeday be taking the place of the other, neither perceived any benefit fromobstructionist practices. Both parties had knowledge of how public sector institu-tions worked, and the skills necessary for effective public management were pre-served in a semi-professional political class. Although the parties had real andnontrivial ideological differences, they also shared core ideological values thatmade negotiation and agreement possible. Even the small regional parties thatoccasionally won seats in Congress could be brought to the table through the exec-utive’s authority to block the disbursement of local budgetary allocations. Anti-system parties, when they reached Congress, were weak enough to be easilyneutralized.
These same rules in a Congress that is both multipartisan and ideologicallypolarized lead not to negotiation but to near paralysis. Even if the major playersreach agreement on the agenda and on the content of key bills, any single mem-ber can filibuster any bill, because cloture requires a supermajority, which canrarely be achieved. Several parties in the current opposition are ideologically ratherthan regionally based, and so their agenda is nonnegotiable. Their members havevery little high-level government experience and little expectation of winningactual power, so they have no vested interest in keeping things moving. On the
costa rica 165
11630-05_CH05_rev2.qxd 6/2/09 4:06 PM Page 165
contrary, some members respond to a constituency that, finding no basis of agree-ment with the majority, wants to see things blocked and the system collapse.
A Representative Process that Does Not Represent
Congressional elections in Costa Rica take place every four years, concurrentlywith presidential elections. Incumbents may not run for reelection—Costa Ricais one of the very few countries in the world where this rule applies.
Each province is allotted a number of congressional seats in proportion to itscensus population. Parties field lists of candidates for each province, and eachparty is awarded seats roughly according to the fraction of the total vote that itslist receives.6 These seats are assigned starting from the top of the list, regardlessof how the votes are distributed across the province. Thus, members are notelected as individual representatives of a specific geographic area but represent theprovince at large.
Candidates on the lists are selected by party national assemblies, akin to partyconventions in the United States. Although it is not compulsory, the candidateswhose names end up on the list often have won nonbinding internal elections intheir counties or regions. Nevertheless, the final decision of who shall appear onthe list is made by the assembly as a whole, including the representatives electedfrom other regions. The all-important order of names on the list usually followsthe size of the counties represented. Hence, the largest city or county in eachprovince usually gets the top several spots on the list in each party, and thus sev-eral seats in Congress; candidates from smaller regions are usually put lower onthe list, and thus these regions get no representation.
In the case of San José, the largest province by far and the one where most gov-ernment, professional, and academic activity takes place, the top of the list is dom-inated not by local representatives, but rather by nationally known figures whoare not linked to a particular county or town. Once elected, these members areeven referred to as diputados nacionales, although on paper they represent San José.
What is wrong with these arrangements? One problem is that they make mem-bers of Congress largely unaccountable to the population. Most representativesare thought of as representing a county, and act accordingly, but in fact they areelected from a provincial party list. It is quite possible for a given candidate’s partyto lose in the candidate’s county but (thanks to the votes cast for the other mem-bers on the list) win the province as a whole, in which case that candidate is sentto Congress instead of the candidate who actually won in that county, and insteadof some of the candidate’s fellow party members who won in their counties. If thereader finds this totally confusing, that is the point—so does the electorate. Nor
166 jorge cornick and alberto trejos
6. The formula used to calculate how many seats are allocated to each list assigns them relativelyclose to proportionality among those parties that meet a certain minimum vote. The minimum voteis smaller, the larger the number of seats allocated to the province.
11630-05_CH05_rev2.qxd 6/2/09 4:06 PM Page 166
is it surprising that, under this system, the representative’s allegiance to his or hercounty often weakens once in Congress, all the more because the representativemay not run for reelection and thus will not be facing the voters again.
In addition to this lack of accountability, there are marked asymmetries inparty representation between different places in the country. The basic electoralunit is the province, and the country’s provinces vary greatly in population (andthus in the number of representatives). Limón, the province with the smallest pop-ulation, elects four members of Congress, and San José, with five times the pop-ulation, elects twenty. As a result, what it takes to get elected to Congress differsfrom one place to another: small parties are viable in San José, but not in the restof the country.
There are also large differences in the representation of different localities.Many places in Costa Rica effectively have no congressional representation at all,in the sense that nobody who actually campaigned there got elected. Thus, resi-dents of these places have no local leader to turn to for support or intercession,and the result is limited political competition, which in turn limits the broader shar-ing of the benefits of growth. In other countries, small towns may not have a con-gressional seat of their own but are part of larger geographic units that do. In partsof Costa Rica, for example the sparsely populated counties in the north of Ala-juela province, the answer to the question “Who is your congressman?” is, quitefrankly, “Nobody.”7
How to Deal with These Obstacles
The fundamental problem facing legislative reform in a system like Costa Rica’sis that any such reform would take power away from those now impeding action,and they will surely use the power they have to prevent that from happening. Leg-islative reform requires legislative action, which, ironically, is almost impossiblewithout legislative reform. The only way to resolve this catch-22 is through pub-lic awareness of the problems and their consequences, so that those who insist onpreserving the status quo realize the ultimate political cost. Costa Ricans in gen-eral know that their political system is not producing the results they desire, andthey are fairly discontented with it, but most are not well informed about the spe-cific problems or the possible solutions, which in our view include the following.
The rules for elections should be changed. Electoral units should be smallerand all of uniform size, rather than coinciding with provinces. Then candidateswho happen to come from smaller towns and counties will be running for officein a unit that is larger than their base community, rather than for unelectable spots
costa rica 167
7. As an illustration of these asymmetries, consider the contrast between Puntarenas, the largestcounty in the province of that name, and Tibás, a large suburb north of San José. Because Puntarenasis always at the top of the provincial list for each party, Puntarenas County usually has three or fourcongressional seats. Tibás, with the same population, rarely holds one.
11630-05_CH05_rev2.qxd 6/2/09 4:06 PM Page 167
on provincial lists. This would leave no doubt about which members of Congressrepresent which voters. Accountability would be strengthened, and each citizen,no matter where he or she is from, would have equal representation in Congress.There is no reason in such a scenario to forbid reelection.
If the institution of diputados nacionales is to be preserved, as is probably con-venient, these members should be explicitly elected from the country at large,rather than from the top of the San José list. This would require a separate ballotlisting candidates for a specified number of national at-large seats, with all voterschoosing individually from that list. The relationship between the citizen and thelocal member of Congress should apply no differently to residents of San José thanto the rest of the country.
The above proposals relate to how representatives are selected. Obviously,something also needs to be done about the rules under which they operate onceseated in Congress. First, bills before Congress should be subject to a fixed timeperiod within which a vote on the bill has to be held. This period could be short-ened under a cloture rule or extended, but only by explicit vote and with a super-majority; otherwise, debate should cease when time has expired. Rules limitingthe ability of members to filibuster or otherwise block legislation should bestrengthened.8 Filibustering should not be completely outlawed, as it provides ameans for a determined minority to be heard on matters of critical importance toit. But neither should it be easy, and in particular it should not be the mechanismthat routinely determines the outcome of any debate.
Second, the executive should have the authority not only to set the congres-sional agenda during part of the year, but also to require that any initiatives thatit introduces be voted on (not just debated) by the end of that period. The exec-utive should also have a limited power to declare certain bills urgent, and subjectto a shorter deadline, as is done in Chile, for example.
Third, members should be granted alternative ways of putting forward theirpositions on legislation before the house and of placing them on the record, forexample by filing their opinions in writing, or presenting them orally during ses-sions when a quorum is not present. A quorum should be required only for votes,not for debate. There should also be a mechanism for proposing amendments thatdoes not delay the proceedings of the full Congress.
Also in need of attention is the new law that allows matters to be settled by ref-erendum. This law passed its first test with flying colors on the CAFTA (CentralAmerican Free Trade Agreement) vote. Of course, because the law requires that aminimum of 30 percent of voters (40 percent for certain types of laws) participatein order for a referendum to be binding, as a practical matter few issues can be
168 jorge cornick and alberto trejos
8. Recently, Congress instituted a new practice (rule 41.bis) that allows a limited version of clo-ture to be applied when two-thirds of the members so decide. This is a step in the right direction butstill falls short of what is needed.
11630-05_CH05_rev2.qxd 6/2/09 4:06 PM Page 168
taken to a referendum between national elections.9 But a number of issues couldbe decided by referendum on the same day as a national election, thus securingthe minimum participation. The elections themselves may provide an opportuneenvironment for those matters to be discussed, and for the people to empower anew government by passing beforehand some of its desired legal reforms, or tolimit it by rejecting them. The advantage of a referendum is clear: the vote hap-pens on a fixed date with no possibility of filibuster, the results are binding andhighly legitimate in the eyes of the population, and, by construction, vocal minori-ties are less important than silent majorities.
Public Sector Administrative Reform
For all its past (and some current) achievements, the Costa Rican public sector hasbecome a slow, cumbersome, and inefficient machine. Whereas financing was thebinding constraint on the public sector in the immediate aftermath of the crisis ofthe 1980s, it is clear that an acute deterioration of managerial abilities, loss of talentto the private sector, a tangled web of regulations and audits, atomized authority,and overlapping jurisdictions are now crippling the public sector, even as thecountry’s fiscal constraints have eased considerably. As a result, the Costa Ricanpublic sector has lost much of its ability to deliver the services expected of it promptlyand efficiently. Insofar as public sector action is needed to strengthen the growthfoundations, the managerial and administrative problems just listed clearly havean impact on all of them.
Among the government agencies most affected by these problems are those incharge of education, public infrastructure, and social assistance. This has a directimpact on two of the foundations: equality of opportunities and the broad sharingof the benefits of growth, both of which are obviously connected to those areas ofpolicy. Economic competition is also affected: for example, in a country like CostaRica, which despite its small size has areas that are remote and physically isolated,the failure of the state to provide an adequate road network allows local providersof goods to enjoy considerable monopoly power. More generally, failure by thepublic sector to provide the essential services expected of it, and for which taxes havebeen paid, effectively dilutes property rights, as does arbitrary and time-consumingdecision making by government agencies on matters that affect business opera-tions. Inefficiencies in public administration also raise the cost of governmentitself, thus contributing adversely to macroeconomic stability.
How did this loss of public sector effectiveness come about? During the1980s, and to some degree during the 1990s, government expenditure wasseverely restricted as the government struggled to rescue the economy from the
costa rica 169
9. Initiating a referendum requires the signatures of at least 15 percent of the adult population,or a two-thirds vote of Congress, or the approval of the president and at least half of Congress. Taxbills and constitutional amendments may not be taken to referendum.
11630-05_CH05_rev2.qxd 6/2/09 4:06 PM Page 169
crisis of the 1980s and to restore fiscal and monetary equilibria. However, theindisputable fact that the public sector deficit had to be brought under control,together with the undeniable failure of heavy-handed state interventionism, wasconfused with the quite different and controversial thesis that government shouldsimply be made smaller. What was really needed was to make government moreefficient.
Making matters worse, it proved too difficult politically to conduct this down-sizing according to well-defined priorities. Instead, restrictions on expenditurewere imposed across the board, and a “voluntary labor mobility” program was putin place to reduce the number of public sector workers. Not surprisingly, thosewho decided to participate were by and large the best qualified, who had a reason-able chance of finding a good job in the private sector, and the most recentlyemployed, who did not benefit from the anualidades (annual bonuses) thatincrease public sector wages each year, independent of performance or inflationadjustments. As the best, the brightest, and the youngest left, the general percep-tion that public workers were less than competent was validated, thus supportinga trend toward government salaries dramatically lagging incomes in the privatesector. In turn, the reduced prestige and pay of a government position made itdifficult to recruit new talent into public service. Those workers who have remainedin the public sector are entrenched by civil service legislation that conspicuouslylacks performance-based incentives.
Only those institutions funded outside the general budget of the executivebranch, such as the health care system and the state enterprises, were spared fromthis drain of human resources, and then only partly: legislation was passed thatallowed the central government to put caps on investment and expenditure evenon theoretically decentralized or autonomous institutions. Meanwhile hostile sen-timent prevailed among those public servants who remained, prompted by feel-ings of persecution, the frustration of limited resources, and the stigma of beingseen as “the ones who could not leave.” Consequently, opinion among govern-ment workers started shifting toward the anti-reform camp, making it very diffi-cult to implement policy.
At the same time, in an effort to better control corruption and pursue moreadvanced management techniques, an increasingly complex set of horizontal con-trol regulations was put in place. Rules regarding public sector purchases becamestricter, and rules regarding the formulation and execution of public sector budg-ets became more sophisticated in theory, but increasingly unmanageable in prac-tice for a bureaucracy that was now much less talented than that for which the ruleshad been designed. Ironically, as the downsizing did not seem to follow a clearpattern, in some cases new institutions had to be created to manage the new con-trols and fill the most salient voids. These new supervisory agencies became polit-ically important, as a perception of generalized corruption within governmentbecame widespread. As a result, controls became more rigid, making the interac-
170 jorge cornick and alberto trejos
11630-05_CH05_rev2.qxd 6/2/09 4:06 PM Page 170
tion between private parties and the government more difficult.10 The result, inshort, has been paralysis, waste, and inefficiency, even in the provision of suchbasic functions of the state as public security and the administration of justice.
An Example: Bureaucratic Gridlock in Public Transportation Infrastructure
A case study will illustrate the kind of administrative ordeals that now afflictthe public sector. Although several examples could be used, perhaps none is moretelling than the case of the institutions that provide transportation infrastructure,and in particular the Ministry of Transportation and Public Works (Ministeriode Obras Públicas y de Transportación, or MOPT). The problems described hereare not unique to MOPT; rather, it is used here as an example of a malaise thataffects many agencies of government.
Historically, Costa Rica’s infrastructure has been quite acceptable for a countryat its level of development. The quality and density of roads, ports, power networks,telephone lines, and potable water systems were among the best in Latin Americaby the 1960s and 1970s. This infrastructure was built in a very bottom-up fashion,with the result that key “arteries” were often barely sufficient, but small-scale andregional “capillaries” were abundant, dense, and of high quality. Even today, whatremains of these works is a valuable national asset; for example, Costa Rica stillleads Latin America in kilometers of paved road per square kilometer of territory.
The slowdown and eventual halt of infrastructure development during andimmediately after the 1980s debt crisis was hardly unique to Costa Rica. Thebuilding of public works came to a standstill everywhere in Latin America. Whatis peculiar is that Costa Rica continued on a path of very low investment even afterthe crisis was over.
The poor quality of roads and other public works today is a commonlyexpressed concern.11 This is not surprising: between 1984 and 2005 the share ofhouseholds that own a car rose from 14.1 percent to 35.1 percent, the populationitself grew from 2.4 million to 4.5 million, and GDP climbed from $4.9 billionto $27 billion, yet not a single major road or highway was built. No one has gainedany political capital by creating this problem. Tourists’ complaints about potholesand road quality finally became so commonplace that the tourism industry,unable to do anything about the roads themselves, started advertising “adventuredriving” as an attraction.
costa rica 171
10. We are not arguing here that controls are unnecessary, but rather that the ones in place arevery poorly designed. To give an example: a public works project may not start as soon as a bid hasbeen awarded; instead, all grievances and appeals must first be resolved by the comptroller’s office.In other countries such damages are settled and any guilt assessed and punished after the project hasbeen completed.
11. According to the competitiveness index published annually by the World Economic Forum,Costa Rica ranked 52nd (among 125 countries) in overall competitiveness in 2006, but 73rd in infra-structure and 102nd in perceived road quality.
11630-05_CH05_rev2.qxd 6/2/09 4:06 PM Page 171
Not only are few road projects even attempted; those that are started frequentlyget frozen in their tracks. Public bids for the San José–San Ramón highway (thebusiest part of the Inter-American Highway as it crosses Costa Rica) have beensolicited several times, never to be completed. Perhaps even more dramatic is theconstruction of the highway from San José to Caldera, the country’s main port onthe Pacific. Half of the road (from San José to the exurb of Ciudad Colón) hasexisted for thirty years; the other half remains to be built, despite several attempts.Year after year has passed, and the section of the highway that connects CiudadColón with Caldera, plus all the main exchanges, remains unbuilt. Under a sepa-rate contract, several bridges were built (and paid for) and today stand idle, await-ing the road that someday will connect them. The project was funded by theInter-American Development Bank almost thirty years ago; the loan was dis-bursed and was, in principle, payable. The problem was not the money: the con-tract has been awarded—twice, to no avail. At the time of this writing, after thehighway has been contracted out for the third time in thirty years, there are rea-sons for mild optimism, yet the work has not begun.
Even small-scale projects are often delayed. After the need for a series of pedes-trian bridges on the main highways near San José was given priority and notori-ety in 2003, only in 2007 were the bridges finally built. Again the delay was causednot by lack of money, but rather by a series of institutional, legal, and administra-tive impediments that thwarted progress every time. The problem is the result ofa strategic shift in the operation of MOPT that was only partially implemented,and of a growing web of verifications and approvals, which a downsized publicsector lacks the capacity to handle.
During the downsizing of the public sector, the decision was made to trans-form the MOPT from a large construction company into a planning and super-vising agency, contracting out some projects and overseeing build-operate-transfer(BOT) contracts where feasible. It was expected that this would result in signifi-cant efficiencies and savings. The ministry would no longer need such a large pay-roll, as private contractors, not the ministry, would hire construction workers andcivil engineers. Nor would there be any need for the ministry to maintain a largestock of construction equipment.
This change in direction might have made perfect sense in a favorable fiscal sit-uation. However, many crucial elements needed to make the strategy successfulwere not put in place. In particular, it was easy to strip the ministry of the resourcesit had needed in its former role, but what proved much harder was setting out thelaws, rules, practices, and administrative capacities that would enable the institu-tion to perform its new functions.
Building a road is not just a matter of engineering. It is, first of all, an admin-istrative and legal problem. In Costa Rica the appeal of administrative decisionsis a particularly lengthy process, the cost of filing frivolous appeals is negligible,and often public works construction is halted until the issues are solved. In other
172 jorge cornick and alberto trejos
11630-05_CH05_rev2.qxd 6/2/09 4:06 PM Page 172
countries the works are continued and any damages paid ex post if the appeal issuccessful.
The operation of the legal system is costly and cumbersome. Until veryrecently, oral statements were invalid in civil matters; everything had to be in writ-ing. Private written documents are also generally invalid unless notarized, yet onlylawyers may notarize a document. Thus, a formality that costs about a dollar else-where can cost 1 percent of the value of the contract in Costa Rica. Requirementsabout form are unclear, and form very often prevails over content. The authori-ties may not, even for good reason, waive unneeded prerequisites or allow the cor-rection of clerical mistakes. Mistakes in form either invalidate a bidder or take theproject back to square one; efforts to expedite the process, even in good faith, putthe public officials responsible in danger of criminal prosecution.
Audit procedures have also become increasingly cumbersome, in the mistakenbelief that this makes them more effective. The Costa Rican public sector worksunder an ever-increasing and ever more complex set of horizontal verifications.The state comptrollers verify every aspect of policy and every step taken. Thebudget authority oversees everything and must preauthorize even the smallestexpenditures. The planning ministry publishes each year an intractable NationalDevelopment Plan, and by law every proposed investment must be justified inrelation to the priorities and designs of that plan. Every government agency hasits own internal auditor with extensive powers, with whom it is dangerous to hon-estly disagree. The National Secretariat for the Environment must approve manyeconomic initiatives, even if the environmental effect is negligible.
The cost and difficulty of compliance are constantly increasing, and consider-able administrative resources have to be devoted to these tasks alone. Whether ornot these controls are actually necessary, it is clear that they could be made simplerwith no loss of effectiveness. The requirements imposed on public sector manage-ment have been increasing at the same time that its capabilities have diminished.The result, quite predictably, is decreasing effectiveness of the public sector.
Finally, the personal and civil responsibilities and the potential for criminal lia-bility faced by poorly paid public sector workers (including those at the cabinetlevel) who make the final decisions are daunting. In an attempt to prevent corrup-tion, the law now punishes the bureaucrat who makes an honest mistake almostas harshly as one who profits illegally. The consequence is that even small deci-sions become daunting, and decision-makers are tempted to take any opportunityto annul or delay a public act, or to make decisions on formalistic grounds ratherthan on content.
Dealing with the Obstacles
There is universal agreement that the nation’s public services have serious prob-lems, but the solutions are controversial and cut across several political debates.Private sector participation in some services is a big part of the answer, but unfor-
costa rica 173
11630-05_CH05_rev2.qxd 6/2/09 4:06 PM Page 173
tunately, enough political power still lies with those who miss the old, state-centered system that any proposal along these lines becomes a matter for inter-minable dispute. At the same time, however, strengthening public institutions willrequire additional resources and perhaps a larger public sector payroll, both ofwhich are opposed by those who still regard the downsizing undertaken to date asan important and difficult achievement. Finally, freeing the process from unnec-essary audits and redundant rules might be perceived or portrayed by some as anattempt to facilitate corruption, especially in the context of recent, widely publi-cized scandals. Indeed, in the wake of these scandals, the conventional wisdomseems to be that even more regulation is needed, when in fact the reverse is true.
Nevertheless, it is clear that in order to recover the ability of the state to imple-ment policy and provide the services expected of it, actions need to be taken onseveral fronts. First, the administrative, managerial, and technical capacities of thepublic sector need to be strengthened. This will require a different system of selec-tion, recruitment, and retention of civil servants, one that facilitates the firing ofcorrupt and incompetent employees and the hiring of honest and capable ones.Among other things, this implies both paying higher wages and raising the pub-lic perception of government service.
Second, the legal framework needs to be modified. This includes, but is not lim-ited to, minimizing the number of opportunities for appeal; revising the proce-dures governing BOT and other public-private contracts along the lines that haveworked in other countries; and simplifying red tape by making all defects of formmore readily solvable, while encouraging officials to base their decisions more onsubstance and less on form. It also means making comptroller, audit, and courtdecisions punitive in nature rather than preventive: legal controversies should bedealt with through ex post settlement rather than ex ante delay, except in areas,such as the environment, where this would be dangerous.
Third, although the government no longer faces the same stringent fiscal con-straints as in the past (in part precisely because worthwhile public investmentswere delayed), increasing spending will not solve the problem by itself. Moreresources are needed, but it is also important to restore some notion of budgetarypriorities, so that direct provision of services by the state in key areas does not comeat the expense of hard-won fiscal stability. No solution is going to work if it hasto be applied across the board.
Tax and Budgetary Reform
Although Costa Rica has made significant progress toward macroeconomic sta-bility and has avoided financial crisis for over twenty-five years, the job is not com-plete. As we have already seen, fiscal balance has been achieved at the cost ofreducing and postponing capital expenditure, and the consequences have built upover the years. “No matter what we do, it is always a war economy,” complaineda former president. Even after enormous sacrifice, government finances have often
174 jorge cornick and alberto trejos
11630-05_CH05_rev2.qxd 6/2/09 4:06 PM Page 174
been frail. There is also a persistent quasi-fiscal problem in the form of a centralbank deficit; this has fueled inflation, which, although lower than in the past, stub-bornly remains between 10 and 15 percent year after year. Costa Rica went fromhaving the second-lowest inflation rate in Latin America in the mid-1980s, to thesecond-highest in 2005.
According to official data, Costa Rica emerged from the 1980–82 crisis with apublic debt in excess of 135 percent of GDP, most of which was owed abroad.This debt burden fell consistently in the 1980s and early 1990s and has fallen veryquickly since 2005, so the debt burden is expected to be under 40 percent by theend of this year, and only a third of that is foreign debt. Central governmentdeficits have averaged around 3 percent of GDP since stabilization—at the costof very tight budgeting—and have turned into surpluses in the last couple of years.As a consequence of administrative improvements in the tax authority, centralgovernment revenue as a fraction of GDP has risen consistently in the last tenyears, although it still barely reaches 15 percent.12 Despite this progress, revenuestill falls short of what is needed to raise infrastructure, education, and socialexpenditures to adequate levels and further secure financial stability.
Impact on the Growth Foundations
Stated quite simply, the revenues of the Costa Rican state are insufficient to itsneeds, and this fact has a negative impact on all of the growth foundations. In par-ticular, true macroeconomic stability, under a government that fulfills the expecta-tions of its population, will require that more resources be directed to thegovernment. A substantial tax reform is needed.
Some of the other growth foundations would benefit from tax and budgetaryreform. The broader sharing of the benefits of growth requires a government thatcan afford to make certain public investments, including in education and trans-portation infrastructure. An increasingly equitable income distribution willrequire expenditure on a variety of support and redistributive activities and theprovision of basic services. A government that can attend to those needs withoutsacrificing fiscal stability is perhaps the key to bringing about sufficiently equalopportunities. But it is precisely these types of investments and expenditures thatare being sacrificed in Costa Rica, at an enormous cost, in the pursuit of preserv-ing an erratic macroeconomic stability in the absence of higher tax collections.
Yet even that frugality is not enough. Congress has frequently passed small taxadjustments, barely enough to maintain the status quo, only to be followed by a
costa rica 175
12. This number does not include all parts of the Costa Rican public sector, which contains aseries of institutions that are funded separately from the central treasury and function somewhat bet-ter. Notable among these is the national health care and social security system, managed by the CajaCostarricense del Seguro Social, which gets its resources from a tax on wages and handles them inde-pendently of the central government. Another separately funded agency is the job training institu-tion (the Instituto Nacional de Aprendizaje, or INA).
11630-05_CH05_rev2.qxd 6/2/09 4:06 PM Page 175
new tax bill a few years later, usually at the beginning of a new administration:every new administration but one in the last twenty-four years has submitted a taxbill to Congress early in its tenure. The finances of the other nonfinancial publicinstitutions have also been kept under tight control, at the very significant cost ofpostponing for decades necessary investments in infrastructure as well as upgradesand improvements in social services, so as to keep public sector deficits within nar-row margins.
The pursuit of stable public finances without adequate tax collection also causespolitical difficulty. The government that most Costa Ricans expect, and that manyanti-reform forces—including public sector workers—remember fondly, is muchbigger than the government that the country can currently afford. The govern-ment of that earlier era also had the flexibility to budget strategically and accordingto priorities, which today’s government does not have.
This lack of flexibility is due to the fact that an overwhelming majority of fis-cal revenue is needed just to cover payroll, debt service, pensions, and other pre-allocated expenses that are fixed by law or, in some cases, by the constitution itself,and therefore difficult to change. Budgetary stability has thus been achieved at theexpense of any discretionary spending that can be postponed in the short run,including strategic projects and, of course, investments in sustained long-termgrowth. Preallocated expenditures include, among other things, not only spend-ing on social programs but also government salaries and collective action agree-ments with public sector unions; special, treasury-funded pension regimes; interestpayments; legal mandates (earmarks) to transfer certain percentages of specifictaxes to predetermined uses (such as road construction or certain special socialprograms); and constitutional mandates to transfer fixed percentages of revenueto the public university system, the judiciary, and local governments. Figure 2shows the fraction of tax revenue spent annually on these entitlements over thelast two decades. In many years over 90 percent of revenues were precommittedunder these provisions, and even then some of the constitutionally mandateditems were in fact not met.
Meanwhile the central bank has incurred losses every year since the mid-1980s,usually well above 1 percent of GDP. The government has been able to absorbonly part of the resulting quasi-fiscal debt, and these payments, together withgreater exchange rate flexibility, have allowed the central bank to bring down infla-tion somewhat in recent years. But it is becoming difficult for the central bank tosterilize the impact of its financial losses even to the tune of 1 percent of GDP,because it has had to adopt a more contractionary stance to offset other sources ofmoney creation in the economy. Either the government will have to absorb alarger share of the central bank’s losses, which means raising taxes since it cannotdo much to lower expenditure, or inflation will remain high. As with several otherreforms, the technical solution is plain, but the political solution has been so farimpossible to discern.
176 jorge cornick and alberto trejos
11630-05_CH05_rev2.qxd 6/2/09 4:06 PM Page 176
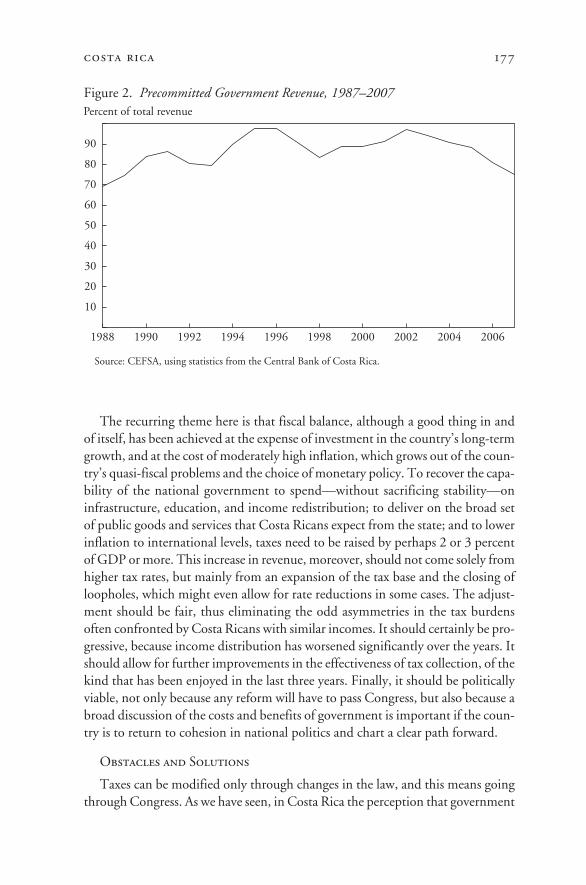
The recurring theme here is that fiscal balance, although a good thing in andof itself, has been achieved at the expense of investment in the country’s long-termgrowth, and at the cost of moderately high inflation, which grows out of the coun-try’s quasi-fiscal problems and the choice of monetary policy. To recover the capa-bility of the national government to spend—without sacrificing stability—oninfrastructure, education, and income redistribution; to deliver on the broad setof public goods and services that Costa Ricans expect from the state; and to lowerinflation to international levels, taxes need to be raised by perhaps 2 or 3 percentof GDP or more. This increase in revenue, moreover, should not come solely fromhigher tax rates, but mainly from an expansion of the tax base and the closing ofloopholes, which might even allow for rate reductions in some cases. The adjust-ment should be fair, thus eliminating the odd asymmetries in the tax burdensoften confronted by Costa Ricans with similar incomes. It should certainly be pro-gressive, because income distribution has worsened significantly over the years. Itshould allow for further improvements in the effectiveness of tax collection, of thekind that has been enjoyed in the last three years. Finally, it should be politicallyviable, not only because any reform will have to pass Congress, but also because abroad discussion of the costs and benefits of government is important if the coun-try is to return to cohesion in national politics and chart a clear path forward.
Obstacles and Solutions
Taxes can be modified only through changes in the law, and this means goingthrough Congress. As we have seen, in Costa Rica the perception that government
costa rica 177
Figure 2. Precommitted Government Revenue, 1987–2007
Source: CEFSA, using statistics from the Central Bank of Costa Rica.
Percent of total revenue
10
20
30
40
50
60
70
80
90
2006200420022000199819961994199219901988
11630-05_CH05_rev2.qxd 6/2/09 4:06 PM Page 177
should do more is so widespread that a majority of parties already agree in princi-ple to a progressive and comprehensive increase in the tax burden. Yet as we havealso seen, current parliamentary rules and procedures make it very easy to post-pone or even prevent a vote on any law that faces forceful opposition, even onethat has majority support.
And tax increases do face forceful opposition. At the very least, the Libertar-ian Party, for which lower taxes are the dominant issue on the agenda, is large(five members in Congress) and vocal enough to act as a severe bottleneck. Pastexperience also indicates that even when the two largest parties agree on the gen-eral principle (in this case, a progressive increase in the tax burden), they find itimpossible to agree on any of the important details. Other parties that haveacted as allies of the administration on other issues, but that have no expecta-tion of returning to the presidency any time soon, probably would not supporttax reform. These problems loom all the larger because tax laws cannot be passedby referendum.
Other obstacles lie ahead on the path to tax reform. First, such reforms tend tobe complex, because part of what is needed relates to administration, collectionprocedures, and the structure of the tax authority. Second, any tax reform alsotends to have large numbers of small winners (the many citizens who would likegovernment to do more) and small numbers of large losers (those who today enjoyexclusions and loopholes), and the latter usually win. Third, tax reforms easily runafoul of ideological divisions, and even parties that agree on the general principleof progressive taxation have never failed to disagree on which taxes are progressiveand which are not. Fourth, many Costa Ricans may feel that the problem will fixitself, given that tax revenue has grown faster than the economy since 2000, with-out any new taxes being enacted, because of administrative improvements in thetax authority, technological changes (collection becomes easier as more transac-tions involve credit cards, bank instruments, or international payments instead ofcash), and the virtuous cycle that sets in as government borrows less, interest ratesfall, the deficit falls further, and so on.
But even all these factors together will not be enough to provide the neededrevenue; new taxes are necessary. Their approval in Congress will depend, ofcourse, on the political attractiveness of their design and on finding a solution tothe legislative procedural problems discussed above. The following strategic con-siderations may help to make tax reform politically viable:
• It is important in any tax reform to create winners. There have to be identi-fiable groups that benefit from the expansion of the tax base, the lowering of thetax rate, or the funding and credibility of any earmarked expenses.
• It may be easier to pass tax changes individually rather than as a comprehen-sive reform. The argument that no government has enough political capital formore than one tax reform, and that therefore it is better to load everything intoone package, has yet to be validated in practice.
178 jorge cornick and alberto trejos
11630-05_CH05_rev2.qxd 6/2/09 4:06 PM Page 178
• The weaknesses of the current tax system allow some profound changes tothe system to be defended as “closing loopholes” (always a popular argument)rather than levying new taxes. For example, under current law a company payingsales tax on the purchase of an input may not claim a credit for that tax paymentwhen it sells the resulting output, and this creates incentives for both parties tohide the transaction. Allowing the credit would likely generate more net revenueby bringing more of these transactions into the open. It is also hard to defend thepresent exemption of several hundred products from sales tax. Another exampleis Costa Rica’s territorial tax treatment of foreign income: residents pay CostaRican income tax only on income generated in Costa Rica. This made sense whenthe country’s tight balance of payments situation provided a reason for the gov-ernment to encourage Costa Ricans to earn money abroad. But a move to world-wide taxation, in which all income is taxed whether generated in Costa Rica orabroad, would raise more needed revenue without raising tax rates or introducing“new” taxes. Although returns to offshore capital would be hard to identify,returns to labor would not be.
• Under the present income tax structure, each source of personal income istaxed separately, impeding true progressivity. For example, in Costa Rica, a workerwith a full-time job faces a higher marginal tax rate, and thus pays more tax, thananother worker who earns the same amount at two part-time jobs, because the taxsystem treats the latter the same as if he or she were two separate individuals. Thissystem needs to be replaced with a global personal income tax in which each indi-vidual reports all income from all sources on a single tax form and pays accordingly.
• The current corporate income tax regime has too many deductions andexemptions. Eliminating these would both make filing simple and allow a lowertax rate, which would be politically popular as well as easier to administer. Depend-ing on the rate chosen, it could also generate more revenue, especially if the basewere broadened at the same time.
• Taxing obvious displays of wealth and ostentatious consumption at higherrates would be popular, progressive, and a quick, effective way of raising revenue.A proposal is already before Congress to increase the tax rate paid on houses thatexceed a certain value and on second homes.
• Current penalties for tax evasion, even when it involves flagrant misrepre-sentation and perjury, are weaker than they should be, and limited to fines ratherthan prison sentences. Strengthening these penalties and their enforcement wouldbe not only politically tolerable but even popular, except of course among thosewho get caught.
Telecommunications Reform
Telecommunications is the most important economic activity still operating asa monopoly in Costa Rica, and therefore reform in this area is key to promotingeconomic competition. Reform should aim not only at increasing the number of
costa rica 179
11630-05_CH05_rev2.qxd 6/2/09 4:06 PM Page 179
participants in the provision of telecommunications services. It should also seekto improve market access, reduce risk, and lower transaction costs, so as to extendaccess to better telecommunications services to the general population, with pos-itive effects on competition throughout the economy. These reforms also wouldreinforce macroeconomic stability, as the contingent liability resulting from thestate monopoly’s operations currently poses a threat to fiscal balance.
Telecommunications is also one of the few areas in which a broad problem ofundefined property rights exists in Costa Rica. The effort to sustain a legal monop-oly in the sector after the economic and technical foundations of a natural monop-oly disappeared has led to the emergence of a gray (and in some cases a black)market. Operators in this market lack secure rights to conduct their business,whether through an explicit concession, for services that exploit goods in the pub-lic domain, or a clear-cut legal permit, for other services. Some of these servicesinclude Internet cafés, Internet telephone (VoIP) services, and direct satelliteaccess to the Internet.13
It now looks as if, finally, competition in some telecommunications serviceswill happen in 2009 or 2010, as part of the implementation of CAFTA. However,attempts to liberalize the sector go all the way back to the administration of JoséFigueres in 1994–98, which raises the question of what has taken Costa Rica solong to get rid of a technologically obsolete monopoly. By many measures, theperformance of the government monopoly, Telecomunicaciones ICE, in the moremodern telecommunications services, especially cellular phones and Internetaccess, has been quite disappointing. Freeing the company from some of its cur-rent financial and administrative constraints will quite probably not be enough,and it involves some risk. It is worth noting that the repeated attempts at telecom-munications reform under the last three administrations not only all failed butalso turned the issue into the most heated topic in the political debate.
Costa Ricans are Fond of Their Public Utilities
Reform efforts in the telecommunications sector have aimed at moving froma state monopoly to regulated competition. The arguments against a publiclyowned monopoly have been twofold: a privatization argument and an anti-monopoly argument:
• Privatization arguments are of different kinds: ideological (the government isincapable of running a large business efficiently), fiscal (the sale of public assets willreduce the public debt), and opportunity cost–based (if the private sector is will-ing to invest in telecommunications, public resources should not be devoted to thesector but instead focused on areas where private investment is not forthcoming).
180 jorge cornick and alberto trejos
13. DirectTV is offered in the country, but the company may not offer Internet access. Somecompanies set up their own antennas, and the telecommunications monopoly spends considerableresources trying to prevent such illegal connections.
11630-05_CH05_rev2.qxd 6/2/09 4:06 PM Page 180
• On the other hand, standard economic theory provides very sound efficiencyarguments against monopolies, which need not be repeated here, but these havenothing to do with privatization.Unfortunately, these two lines of argument have frequently been confused in dis-cussions of privatization in Latin America, and this helps explain why reform hasproved so difficult in Costa Rica.
Privatization arguments have not had much traction in Costa Rica, and forgood reason: the publicly owned telecommunications company delivered servicesof good quality cheaply, with extensive coverage and access to at least some ser-vices (public telephones) for a large percentage of the population. Meanwhile theopportunity cost argument had no merit: the telecommunications utility has con-sistently funded itself from its own operations, not from general government rev-enue. Nor has the fiscal argument had much relevance, or at least it has not today:the public sector debt is shrinking and the government finances are in surplus.
However, three factors eventually resulted in a growing sense of frustrationwith telecommunications services and in support for market liberalization (butnot for privatization):
• investment restrictions placed on the telecommunications utility as a meansof restraining central government deficits;
• changes in technology that turned a natural monopoly into a potentiallycompetitive market; and
• “capture” of the company both by its unions and by corrupt politicians,resulting in (to put it euphemistically) inefficient resource allocation.Technological change seems to have posed a particularly difficult challenge: in theabsence of competition, the public telecommunications company had no incen-tives to adapt, innovate, and learn. It even tried to prevent the adoption of newtechnologies (such as VoIP) and clung to old-fashioned technology (switchesinstead of routers). Mobile services were cheap but of low quality, cumbersome toacquire, and with long waiting lists.
Why hasn’t telecommunications reform advanced in Costa Rica at the pace ithas in other countries? First, since for most of its history the state monopoly hadprovided adequate service, especially in fixed lines and electricity (the same com-pany also operates the electric power monopoly), many assumed that the problemwas not the lack of competition, but rather the details of implementation. Mean-while, in the heated political debate, confusion was created between opening toregulated competition, on the one hand, and privatization, on the other. Awareof ill-designed and poorly executed privatizations in other countries, many CostaRicans opposed any reform, fearing it was a Trojan horse for privatization. Fur-thermore, corruption scandals involving two former presidents, among other pub-lic officials, raised suspicions about any and all reform proposals. All these reasonswere craftily exploited by a well-organized and well-funded union in the statemonopoly with a vested interest in preventing competition, and by disgruntled
costa rica 181
11630-05_CH05_rev2.qxd 6/2/09 4:06 PM Page 181
anti-reform leaders on the left and in the public sector, who saw the state monop-oly in such an important business as the most visible survivor of the former, morestatist economy they still venerated.
How to Deal with the Obstacles to Reform
With the approval of CAFTA by popular referendum on October 7, 2007, lib-eralization of some segments of telecommunications (mobile telephone services,private networks, Internet services) has become a legal mandate. The implement-ing legislation was passed on June 4, 2008. Because this came after a popular voteon this specific subject, and after a thorough debate, the political momentum indi-cates that regulated competition is finally going to happen. It is equally importantthat the implementation of this new legislation be technically flawless, that regu-lators perform the tasks prescribed in the laws, and that the leaders of the publiccompany, which will remain in business but no longer as a monopolist, prepare itto thrive under the new reality.
Transparency in this process is key. Any hint of wrongdoing in the liberaliza-tion process—in particular, in the assignment of the first concession for mobileservices—will be cited by opponents as proof that they were right and that liber-alization should be reversed. The necessary institutions are in place to make theprocess transparent, with no political tampering. If the authorities want thisprocess to succeed, they should exercise exceptionally close oversight to make surethe process works as expected, without so much as a hint of corruption.
Also, the introduction of one private operator does not by itself create a com-petitive market; true competition will emerge only with broad market entry. Inter-national experience demonstrates consistently that mobile telephone servicesretain a highly concentrated structure, especially, and for a longer period, whenthe starting point is a dominant operator with sole control of all the infrastructureand very strong incentives to deny, delay, or otherwise hinder interconnectionwith the backbone. Therefore, a strong regulatory authority that is not shy aboutusing its power is crucial to prevent abuses or anticompetitive practices on the partof either the incumbent or new entrants.
Finally, the key element that may tip the balance in favor of a liberalized mar-ket is customer education. Unlike foreign investors and locals with foreign exposure,most Costa Ricans have no experience of anything beyond the service that the gov-ernment monopoly now provides. They have nothing to compare it with and there-fore do not know what they have a right to expect and demand. A better-informedpublic will exert stronger market discipline on all participants in the sector.
Trade Policy Reform
Trade liberalization (in particular, export promotion) and the attraction of FDIhave been key policy initiatives over the last twenty years, and the results have beenmostly successful. Despite this progress, however, trade policy remains a critical
182 jorge cornick and alberto trejos
11630-05_CH05_rev2.qxd 6/2/09 4:06 PM Page 182
area for further reform, because it affects all of the growth foundations, althoughsome more than others.
Any business environment in which new products are constantly emerging,producers are forced to compete, and activities with high employment potentialare unleashed is conducive to greater equality of opportunities. Such an environ-ment is more likely to develop in a dynamic, diversified economy that is open toforeign trade. Unskilled workers in such an economy—for example, in the textilesector—find manufacturing employment where before they only had access tolower productivity jobs in the services or in agriculture; professionals in certainfields find private sector jobs where in the past only government jobs existed.
The First Fruits of Trade and Investment Reform
In Costa Rica, export-led growth has been accompanied over the last decade bywidespread job creation, and the emergence of dynamic, internationally competi-tive technology and services sectors has allowed a trained and educated workforceto command a higher premium for their human capital, thus allowing the benefitsof growth to be shared more broadly. A recent study by PROCOMER (Costa Rica’sexport promotion agency) indicates that out of a workforce of 1.5 million, 294,000workers have jobs in firms that export directly 20 percent or more of their output.According to the national income accounts, export value added accounted for50.6 percent of GDP in 2006. It is well established that labor, the relatively abun-dant factor in a poor country, is better rewarded under trade than under autarky.
High import barriers turn small markets into oligopolies, limiting economiccompetition. They also make the protection of those barriers the main driver ofprofitability, allowing concentration of political power and reducing political com-petition. Also, in several key services –telecommunications, electric power gener-ation, and insurance–where the government has monopoly rights and the lack ofcompetition is very damaging, the path to more competition goes through trade.Meanwhile export-led growth has helped improve the fiscal balance, stabilize theforeign exchange market, and allow the central bank to accumulate reserves, thusalso contributing to macroeconomic stability.
Costa Rica was a largely closed economy from the 1950s until the mid-1980s.Since then the country has pursued integration into international markets, pro-moted export-led growth, and sought to attract FDI. This shift in policy was orig-inally prompted by the urgency of the balance of payments situation during the1980s debt crisis, and by the aspiration toward export-led growth at times whenthe local market was under tight financial constraints. Over time these objectivesevolved, and Costa Rica came to focus more on the diversification and sophisti-cation of its exports and on using FDI to pursue the transition to a knowledge-based economy.
The results have been fairly impressive; indeed, trade has been the main driverof economic growth. Since the early 1980s, exports have multiplied twelvefold
costa rica 183
11630-05_CH05_rev2.qxd 6/2/09 4:06 PM Page 183
and have diversified and become much more sophisticated; FDI per capita isamong the highest in the hemisphere—and eight times China’s. Real growth ingoods exports accounted for 64.7 percent of total GDP growth between 1995 and2004, with exports of services accounting for an extra 19 percent.
Even as traditional exports (coffee, bananas, and sugar) doubled between 1982and 2007, a series of new agricultural products (mostly tropical fruits, tubers,ornamentals, fish, and processed foods) emerged, making Costa Rica the world’ssixth-largest agricultural exporter on a per capita basis. Manufacturing exportswere less than $300 million in 1982 and went entirely to the protected CentralAmerican Common Market; by 2007 they had grown to over $7 billion, includ-ing a number of high-technology products, both from local firms and from affiliates of foreign multinationals. Costa Rica has also become an importantworldwide provider of services ranging from ecological and adventure tourism tobusiness services, “nearsourcing,” and information technology. As they havegrown, exports have become more diversified: traditional commodities fell from61 percent of total exports in 1982 to only 13 percent today. They have alsobecome more sophisticated: many of Costa Rica’s goods and services exports areintensive in human capital, technology, and advanced inputs.14
The stock of FDI has been estimated at nearly $6.7 billion in 2006; FDIinflows rose from around $200 million annually in the 1980s, to $600 million inthe 1990s, to $1.4 billion in 2007. These flows have been of fairly high quality,involving relatively sophisticated companies, dominant in their markets, in sec-tors that are considered strategic for the country. Most of this FDI is greenfield—new capital entering the country to create new private productive capacities—rather than the acquisitions, purchases of mining rights, and privatizationsprevalent in the rest of Latin America.
Trade policy reform since the mid-1980s has been implemented gradually butconsistently through a variety of instruments. Much liberalization has taken placethrough unilateral reduction of import barriers: tariffs fell from an (unweighted)average of 54.9 percent in 1986 to 3.3 percent in 2005. Like many other coun-tries, Costa Rica offers tax incentives for investment in the form of a free tradezone (FTZ) regime, for mobile FDI that meets a minimum export performancerequirement. Companies in FTZs pay no indirect taxes on domestic purchases,international trade, profits, or dividends and have access to special, simplifiedadministrative procedures for all imports and exports. Exporters also have enjoyeda competitive exchange rate: to avoid overappreciation of the local currency andvolatility in export returns, from 1984 to 2007 the central bank maintained anearly constant real exchange rate by applying a system of daily small corrections
184 jorge cornick and alberto trejos
14. Lall, Weiss, and Zhang (2006) develop an index of export sophistication, which relates prod-ucts to the income per capita of the country that exports them. They find that Costa Rica’s exportsare more than one standard deviation more sophisticated than predicted by its income per capita—despite the fact that the index treats tropical agricultural products as unsophisticated.
11630-05_CH05_rev2.qxd 6/2/09 4:06 PM Page 184
in the nominal exchange rate, targeted to offset the differences in inflationbetween Costa Rica and its trading partners. Before 1998 there were also incen-tives for exports, in particular a subsidy (known as CAT) for exports of new prod-ucts equivalent to 15 percent of the gross exported value. This controversialinstrument eventually became too expensive and distortionary and a temptationfor corruption; early on, however, it was an effective incentive for local firms toenter international markets.
More strategically, the Costa Rican government has procured preferential mar-ket access to most of its major export markets, through participation in preferenceregimes established by developed nations, membership in the Central AmericanCommon Market, bilateral free trade agreements with a majority of its tradingpartners,15 two dozen bilateral investment treaties, and active engagement inmultilateral negotiations. It has also developed a series of support institutions fortrade, including a dedicated ministry (the Ministerio de Comercio Exterior, orCOMEX) for trade policy and international negotiations. Within COMEX a spe-cialized office oversees the implementation of the country’s international tradeagreements, and PROCOMER, a hybrid public-private institution, is in chargeof export promotion, logistics and tax collection in the export-import process, andthe administration of the FTZ regime. A private nonprofit institution, CINDE,is charged with the tasks of attracting FDI, promoting the country “brand,” iden-tifying and luring potential investors, and acting as a think tank on issues of busi-ness climate and competitiveness.
The Remaining Reform Agenda
Past achievements notwithstanding, the pending trade and investment agendais very important. National productivity and competitiveness require furtherattention and a fully articulated national policy where now only certain uncoor-dinated elements, for example in tourism and nontraditional exports, are in place.Also needed is an enhancement of PROCOMER’s activities in helping small andmedium-size producers reach the international market, as well as more technicalassistance from other agencies.
A variety of measures of bureaucratic costs and barriers indicate that theseare on the rise (see World Bank, 2007). Most important, the weakness of thegovernment agencies in charge of infrastructure and education, plus the lackof competition in telecommunications and problems with the national energystrategy, significantly increases the cost of doing business in Costa Rica and limits
costa rica 185
15. Free trade agreements are in place with Mexico, Canada, Chile, the Dominican Republic,and CARICOM; pending ratification with the United States; and pending implementation withPanama. Negotiations have been started with the European Union. These agreements have also beeninstrumental in obtaining commitment to some necessary reforms and establishing competitive rightsfor investors. Once all these agreements are implemented, Costa Rica will have secure, enhanced mar-ket access in the countries that currently absorb 93 percent of its exports.
11630-05_CH05_rev2.qxd 6/2/09 4:06 PM Page 185
competitiveness. A number of recent projects by the private sector offer some hopeof filling the gap left by the public sector’s lack of capacity. These projects include,among others, the analysis of competitive clusters by INCAE, a prestigious businessschool; efforts by CINDE to reduce the backlog in second-language education;and a strategy for national technological development proposed by a leading groupof scientists. But sufficient momentum is so far lacking.
A more pedestrian, but urgent, need is to fix the FTZ regime. Rulings by theWorld Trade Organization indicate that middle-income countries like CostaRica will no longer be in compliance with GATT regulations if they maintain aregime of tax incentives based on an export performance requirement after 2013.Although this presents a difficult legal problem, it also provides an opportunityto give the regime a needed overhaul. This could include differentiated incen-tives for firms established in less developed regions of the country: FDI (exceptfor tourism and agriculture) has tended to concentrate in the San José metropol-itan area, where infrastructure is better and human capital more abundant.Another important task is to eliminate the extra administrative burden wheninputs are of local origin, which acts as a disincentive for FTZ firms to sourcelocally. Finally, there are currently no instruments linked to training, R&D, orother strategic activities. The problem, here as elsewhere, is that any solution hasto go through Congress.
Some FTA negotiations are still pending. The Association Agreement with theEuropean Union has huge potential and promises to reduce dependence on theU.S. market. Central America is one of the world’s leading providers of bananas,sugar, fruits, and textiles, and the EU market is large. The challenge is not just toachieve an agreement, but to ensure that it provides adequate market access. Cen-tral America would be the first FTA partner of the European Union that directlycompetes with former European colonies, so there is pressure to avoid the erosionof their preferences. Another negotiation that will require much thought is thaton the transformation of the Central American Common Market into a customsunion. Although this is bound to be a lengthy process, recent progress has beenremarkable. Finally, the enactment of CAFTA is, as of this writing, almost com-plete but not guaranteed. Even after the popular vote ratified the agreement intolaw, the implementing legislation was successfully delayed by an opposition fili-buster in Congress.
Another challenge is to reduce market concentration in the logistics and com-mercialization of imported goods. The oligopolistic organization of these marketsimplies that some of the gains from the phase-out of trade barriers will be appro-priated by importers and fail to reach the final consumer. The government insti-tutions that oversee and regulate competition need to be strengthened, andanti-competitive practices in international trade need to be more clearly contained.
Finally, further success in international trade requires progress in the otherareas of reform discussed in this chapter. The legal and administrative constraints
186 jorge cornick and alberto trejos
11630-05_CH05_rev2.qxd 6/2/09 4:06 PM Page 186
choking much of the Costa Rican state affect specifically the provision of educa-tion and infrastructure. Certain plant-level manufacturing skills are becomingincreasingly scarce, because the education and training systems cannot churn outgraduates fast enough in areas such as metal mechanics. The scarcity of somewhite-collar skills, including in information technology, at both the professionaland the pre-college level, is also becoming acute. Also prominent is the need toenhance investment in the foreign language skills of the country’s technicians andprofessionals. Similar weaknesses afflict logistics and transportation infrastructure.
An important step toward maturity has been reached in some industries for abroad spectrum of firms, where it is no longer a case of looking for a pioneerinvestor or the first exporter, but rather trying to integrate backward or to developstrategic linkages. These broader industry objectives will require strategic policyaction.
In Costa Rica, as in all countries, there are opponents to market-orientedreform. They have a large variety of motivations and objectives but are increas-ingly focused on halting or reversing trade liberalization. Anti-globalization feel-ings seem to outrank other political objectives. Policy opposition to furthermarket-driven reform—and electoral opposition, in the form of new parties hop-ing to get elected by capturing the anti-reform vote—see trade reform as the frontline; to stop it is to stop other reforms.
Broad consultation within the country and internal negotiation with key localcommercial interests are key to overcoming these political obstacles. The consul-tation process must be conducted in a way that benefits participants, first of all,by listening to them, and then keeps them politically committed to what they havesaid and accepted. Documenting the process is perhaps just as important.
Meanwhile the opportunities generated by trade should be made more widelyaccessible. There has been significant progress: many small agricultural producersare now exporters, for example, and many jobs have been created, through tradeand investment, for professional, skilled, and unskilled workers alike. But geo-graphic barriers remain to be overcome: the dynamic new sectors have concentratedin the country’s central valley, because incentives, infrastructure, and trainingfacilities are lacking in the rest of the country. And those with access to better edu-cation certainly gain more than the rest.
Lessons from the Costa Rican Experience
The previous section analyzed five areas of reform that we consider particularlyrelevant and interesting, both in the context of explaining Costa Rica’s growthperformance and in the context of applying the CGD framework. We now focusour attention on the latter.
Latin America’s economic performance seems, at first glance, to fit theframework. In the case of Costa Rica, property rights are comparatively well
costa rica 187
11630-05_CH05_rev2.qxd 6/2/09 4:06 PM Page 187
established, even in the most complex areas such as intellectual property. CostaRica has also improved its macroeconomic performance quite dramatically sincethe crisis of the 1980s, achieving stability in terms of debt reduction, fiscal per-formance, financial market regulation, and balance of payments sustainability.The result has been twenty-five years without a macro-financial crisis. Moreimportant, Costa Rica built a broad network of infrastructure and governmentservices throughout the twentieth century, including significant investmentsin human capital, which allowed a much broader sharing of the benefits of growththan its neighbors enjoyed, as well as political stability and huge potential forraising productivity. Political competition has long existed in this old democ-racy, which is full of mechanisms for allowing minority opinions to be heard.Once a degree of economic liberalization had taken place, along with aggres-sive and successful trade and investment policies, Costa Rica also saw greatlyenhanced economic competition, whose benefits, through massive job creationand the higher valuation of human capital, were widely (but unevenly) shared.As a result, growth was relatively rapid. In these matters Costa Rica ranks, inour opinion, second only to Chile in the hemisphere in the post–debt crisisperiod. And the fact that Costa Rica also ranks second only to Chile in accu-mulated growth is a strong endorsement, again in our opinion, of the CGDframework.
Yet the paradox that we pointed out at the beginning of this chapter—how suc-cess at reform has been accompanied by strong (but still minority) hostility tofurther reform—also fits this theoretical framework. What explains the paradox,in our view, is the fact that, in the last few years, the two most salient characteris-tics that separate Costa Rica from the pack of Latin American countries—thebroad sharing of growth benefits and the country’s relatively equitable incomedistribution—have eroded.
As we have seen, Costa Rica did a fairly good job of protecting the poor andreducing the poverty rate in the aftermath of the 1980s crisis. Although progressin reducing poverty later stagnated, social programs were protected, so that eventhe poor had access to health care, education, potable water, and other supportservices. But pressures on the equality of income distribution have grown world-wide in the last few years, and policies aimed at confronting them have not emergedat the same pace.
We should underline that it is neither economic growth itself nor the policiesthat Costa Rica has enacted in the pursuit of that growth that have allowed theincome distribution to deteriorate. Other countries with more lackluster growthperformance have also suffered a rise in inequality. And in Costa Rica, as shownabove, the subperiod of the last twenty-five years that recorded the fastest growth(2003–07) was also one in which growth was pro-poor, even under a strong def-inition. Those with little human capital and serious social problems, who as a con-sequence find themselves in the bottom 20 percent of the income distribution,
188 jorge cornick and alberto trejos
11630-05_CH05_rev2.qxd 6/2/09 4:06 PM Page 188
require more than employment opportunities and overall economic growth toimprove their lot. We believe that reversing the policies that have increased growthwould do nothing to enhance equity; instead, what is needed is to complementthese policies with stronger and more innovative social policies aimed directly atthe distribution problem. This has not happened, perhaps in part because of thereal financial constraints faced by the Costa Rican state (and the perception onthe part of some that the state needs to remain small and neutral), but also inpart because of the institutional and political barriers to action that we havedescribed and that affected not only economic policy reform but reform of socialpolicy as well.
Although Costa Rica’s income distribution deteriorated during most if not allof the last twenty-five years, the broad sharing foundation also weakened, asanother group in the population besides the very poorest has failed to share fullyin the benefits of growth, namely, the segment of the middle class that works (orexpects to work) in the public sector. This group has been affected by the slow-down of job creation in the public payroll, by the relatively low wages that thegovernment pays its skilled workers, and by the weakening of their benefits andof their standing in society. Their active opposition to reform, their participationin the “globaphobic” sentiments now being widely voiced, and their attraction toanti-democratic political forces are easy to understand in these circumstances, andthese factors have given rise to new parties that could flourish in the country’sunique institutional and political milieu.
In conclusion, both the rapid and accelerating economic growth that CostaRica enjoyed during 1983–2007 and the political and institutional limitationsthat have hindered policy reform and challenged the prospects for future growthare successfully explained by the CGD framework. The framework is also a richone in that it allows an explicit role for profound changes in society, includingpolitical change, such as greater democratization; administrative change, such asthe fight against corruption; distributional change, such as improvements inhealth care and education; as well as technological and environmental and othertypes of change. Like mainstream economic theory, which assigns key roles toboth productivity and human capital, but unlike the political fashions of the1980s, the framework stresses these issues as key to achieving growth, rather thanas luxuries that a society can afford only after it achieves growth. On the contrary,Costa Rica—like Chile and Uruguay, the two other countries in the region withthe fastest growth over the last two decades—created institutions that put those“luxuries” first; Costa Rica’s experience is a reminder that fundamentals are fun-damental. They are not “second generation” matters that can come later.
We believe that the Costa Rican story offers some other lessons:• Although the framework does not address these explicitly, the timing,
sequencing, and pace of reform, and the interactions between reforms, are criti-cal. The Costa Rican story suggests that it is a good idea to do things sequentially
costa rica 189
11630-05_CH05_rev2.qxd 6/2/09 4:06 PM Page 189
and gradually, building on initial successes. The slow progression of the economictransformation after stabilization may have seemed frustrating, but it may haveprevented those reforms from being reversed.
• The framework gives due importance to macroeconomic stability, promi-nently including fiscal sustainability. This is, of course, correct, and without adoubt Costa Rica has benefited from the rapid improvement in and continuedattention to its macroeconomic indicators since the mid-1980s. But Costa Rica’sstory is also a reminder that not all macroeconomic equilibria are created equal.In the effort to cut expenditure and restore balance in the public finances, extrasacrifices were made in some areas to ensure that other public institutions andsocial services continued to function well even in times of austerity. Although thisstrategy might seem to be a sign of lukewarm commitment to achieving macro-economic stability, it proved in fact to be critical for the political sustainability ofreform and for keeping certain other essential growth foundations intact. Coun-tries that pursue fiscal probity and macroeconomic stability in the short run,perhaps under the encouragement and supervision of international financialinstitutions, without caring about the long-run political sustainability of theirreforms, will probably show good economic numbers only for a little while.
• Although Costa Rica preserved essential social services from the cutbacks ofthe early 1980s, its failure to boost tax revenue implied that fiscal stability couldonly be achieved by postponing key investments and weakening important insti-tutions. A well-functioning state requires the right people in positions of author-ity, working under the right incentives, laws, rules, and procedures. The lack ofthese capable people and sound institutions gave rise to institutional and admin-istrative problems, which became a serious obstacle to growth in Costa Rica. Inthis, as in all human endeavors, the devil is in the details.
Finally, although the framework does not address politics directly, because thepolitical context varies from country to country, reform will not happen if thepolitical groundwork is not laid correctly, as both Costa Rica’s successes and itsfailures illustrate:
• It is necessary to construct a base of short-term beneficiaries from the initia-tives of government. When a group of people can clearly and concretely see howthey themselves profit from a particular policy, they will lend it legitimacy, fightfor it, and increase the political cost of reversing it. They will also act as a bufferand first line of defense for the policy, ahead of the technocrats who originally pro-posed it for complex analytical reasons, and ahead of the politicians, whosemotives may be suspect.
• It is important for reform-minded political parties to maintain a link with aca-demia and with other groups in society, so that once in government, politicians canrely on a battery of intellectual support and take advantage of open channels tocommunicate, explain, and negotiate.
190 jorge cornick and alberto trejos
11630-05_CH05_rev2.qxd 6/2/09 4:06 PM Page 190
• Reform should have an ideological underpinning, and leaders should educate forchange. It is not only important for policy to be designed as an instrument toachieve a well-defined goal. It is also critical, if that policy is to be implementedsuccessfully and sustained in the long run, that those well-defined goals be agreedupon as stemming from a common set of values and worldviews.
Costa Rica’s economic performance has followed a unique course, full of con-trasts and paradoxes, successes and failures, and it is a tall order to understand itwell. It is a telling achievement of the CGD framework that it can be applied tounderstanding this story in a flexible and simple way. Nevertheless, this complexstory also requires focusing on issues of implementation, politics, and institutionaldevelopment that also deserve attention.
References
Consejo Monetario Centroamericano. 2004. “Naturaleza y Situación de las Remesas Familiaresen los Países Miembros.” Working paper (November).
Kakwani, N., and E. Pernia. 2000. “What is Pro-poor Growth?” Manila: Asian DevelopmentBank.
Lall, Sanjaya, John Weiss, and Jinkang Zhang. 2006. “The ‘Sophistication’ of Exports: A NewTrade Measure.” World Development 34, no. 2: 222–37.
Leipziger, Danny. 2005. “Pro-poor Growth in the 1990s: Lessons and Insights from 14 Coun-tries.” Washington: World Bank.
Lizano, Eduardo, and Ricardo Monge. 2006. “Bancarización de las Remesas de los InmigrantesNicaragüenses en Costa Rica.” Washington: Multilateral Investment Fund (October).
Loayza, Norman, Pablo Fajnzylber, and Cesár Calderón. 2005. Economic Growth in Latin Amer-ica and the Caribbean: Stylized Facts, Explanations, and Forecasts. Washington: World Bank.
Rodríguez Clare A., M. Sáenz, and A. Trejos. 2002. “Analysis of Economic Growth in CostaRica 1950–2000.” Washington: Inter-American Development Bank.
World Bank. 2007. “Doing Business in Costa Rica.” Washington.Zettelmeyer, Jeromin. 2006. “Growth and Reforms in Latin America: A Survey of Facts and
Arguments.” IMF Working Paper WP/06/210. Washington: International Monetary Fund(September).
costa rica 191
11630-05_CH05_rev2.qxd 6/2/09 4:06 PM Page 191
192
In the early 1980s, Mexico’s inward-looking development strategy collapsed. Bythen macroeconomic instability—high inflation rates, large fiscal deficits, bal-
ance of payments crises, and a huge external debt—had become pervasive, not justin Mexico but also in many other Latin American countries. In mid-1982 Mex-ico announced that it would default on its external debt, precipitating what cameto be known as the Latin American debt crisis and the “lost decade.”
The crisis made clear that the country had to modify its development strategy,from one based largely on trade protection and a heavily interventionist statetoward a more market-oriented, modern, deregulated economy. Since then Mexico, like many other Latin American countries, has been trying to return tosustainable economic growth by implementing a series of structural economicreforms and by moving toward a full-fledged market economy. During the sec-ond half of the 1980s and the early 1990s, the Mexican government managed toapprove and implement a series of important economic reforms, including an
How Can Reforms Help Deliver Growth in Mexico?gerardo esquivel and fausto hernández-trillo
6
We thank Liliana Rojas-Suarez for providing detailed comments on previous versions of thischapter. We also thank Guillermo Perry, Kurt Weyland, and participants in a seminar in Washing-ton for their very helpful comments on a preliminary version. We also thank Marcos Avalos, SergioLópez Ayllón, Jorge Chavez, Daniel Chiquiar, Pablo Cotler, Rafael del Villar, Carlos Elizondo, L. M.Galindo, Cesár Hernández, Juan Carlos Moreno, José Antonio Murillo, F. Suárez Dávila, AlejandroVillagomez, and Leo Zuckerman for their comments and contributions on different sections of thischapter. As usual, we are the only ones responsible for any remaining errors.
11630-06_CH06_rev2.qxd 6/2/09 4:09 PM Page 192
mexico 193
ambitious privatization program, a partial pension reform, and wide-ranging tradeliberalization and deregulation.
It is evident today, however, that Mexico’s economic reforms have had rela-tively disappointing results: income per capita since 1981 has grown at a dismalaverage rate of close to 0.5 percent a year. Such a low growth rate, together withthe generalized perception that economic growth has not been broadly shared, hasgenerated ample popular discontent with economic reforms in Mexico. For thatreason, any future reform proposals are likely to face much greater debate andopposition than in the past. In fact, disappointment with previous reforms, in analready difficult political context, has deterred recent administrations from pur-suing further economic reform. As a consequence, Mexico has entered onto thepath of reform inaction that currently characterizes most of Latin America.
At least two competing explanations have been advanced to explain the rela-tive failure of economic reform in Mexico.1 The first is that the reforms thus farhave been insufficient and incomplete (Gil-Díaz, 2003), and that deeper andbroader reforms are needed to achieve positive results. The second argues that, tothe contrary, the economic reform process has gone too far and that it has beenunable to break the stranglehold of existing economic interest groups, and mayeven have made them more powerful. This line of analysis concludes that thereform process should not continue and that some reforms may even need to bereversed. Although this point of view is not predominant in academic discussions,it is deeply entrenched in a large segment of the Mexican population.
We follow yet a third line of analysis. We claim that structural reform in Mex-ico has failed to contribute to more rapid growth because in some cases, such asthe initial pension reform of 1992, the reforms were driven by a sense of urgency,and therefore were not actually designed to promote economic growth, whereasin other cases the reforms could have had positive effects but either were badlyimplemented (for example, privatization) or remain incomplete (for example,financial reform). Some other important economic reforms have not even beenattempted, and, most important, in many other cases the sequencing of reformwas inappropriate. All of these factors could explain why structural reform in Mex-ico has had such a limited—sometimes even a negative—impact on the founda-tions for growth.
In some cases, moreover, powerful interest groups have played an importantrole in preventing implementation of what might otherwise have been a success-ful reform. The opponents of further reform were in some cases the winners fromthe initial wave of reforms and may perceive that further reform could deprivethem of those benefits (as described by Hellman, 1998). More recently, however,political and ideological confrontation among the three major political parties in
1. See Zettelmeyer (2006) for a recent summary of the evidence and debate on the relationshipbetween reform and economic growth in Latin America.
11630-06_CH06_rev2.qxd 6/2/09 4:09 PM Page 193
Mexico has also become an obstacle to further structural reform (Lehoucq andothers, 2005). The result has been a political situation in which each major partyhas veto power over the others, leading to reform inaction as an equilibrium out-come. These considerations, together with reform fatigue, are the main local con-straints on further reform in Mexico.
Nevertheless, we believe that reforms can still be implemented in Mexico on awide array of issues, and that these reforms can and should be designed so as tomaximize their impact on the foundations for growth. The reforms that we see asneeded in Mexico can be divided into two groups. The first consists of reformsthat involve substantial ideological differences and political trade-offs, and there-fore will require a much deeper level of discussion. In this group we include issuessuch as fiscal, energy, and labor reform. Achievement of any of these reforms willultimately depend upon some agreement being reached among the major politi-cal forces, or at least between two of the three leading political parties, so as toguarantee a simple majority in Congress.
We argue here that this set of reforms—especially the fiscal and energyreforms—needs first an underlying institutional framework in order to work; thismeans, in particular, judicial and competition reform. For example, if Pemex, thestate-owned oil company, were fully privatized under a weak competition frame-work, privatization might not yield the desired results. By the same token, as weargue later, without a judicial reform that includes the modification of the fiscalamparo, fiscal reform will not deliver the intended outcomes. For these reasons wefocus on these two reforms and emphasize that the sequencing of reforms isimportant.
This second group of reforms includes those on which there are no major polit-ical or ideological differences among the political parties; here we anticipate thata congressional majority could be achieved in the short run. Some of these reformshave not been attempted either because they were considered already completedor because politicians are unsure about their implications for economic growth.This chapter will concentrate on this second set of reforms, since they are the onesthat seem to be attainable in the short run and whose implementation dependsmostly on political will rather than on ideological compromise.
The main objective of this chapter is to identify why previous reforms failed togenerate a higher rate of sustainable economic growth in Mexico, and what canbe done to reactivate the process of economic reform in a way that leads to fastergrowth. We devote particular attention to the specific characteristics and idiosyn-cratic aspects of the Mexican situation, as well as to the sequencing of the reformsproposed.
We begin in the next section by reviewing recent trends in the Mexican econ-omy. Here we also develop a first approach to the recent evolution of some of thefoundations for growth as defined by the CGD framework (see chapter 2). Thenext section explores the reasons for reform fatigue in Mexico and how this
194 gerardo esquivel and fausto hernández-trillo
11630-06_CH06_rev2.qxd 6/2/09 4:09 PM Page 194
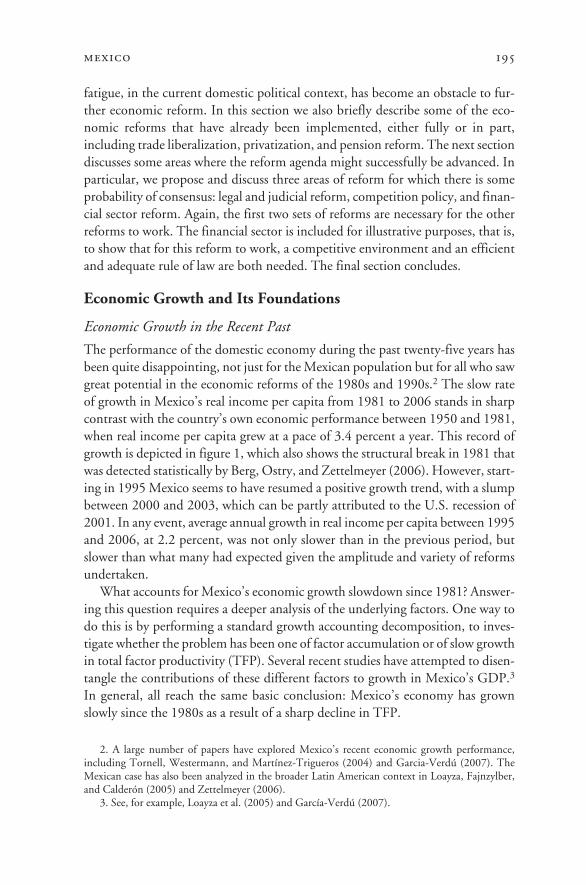
mexico 195
2. A large number of papers have explored Mexico’s recent economic growth performance,including Tornell, Westermann, and Martínez-Trigueros (2004) and Garcia-Verdú (2007). TheMexican case has also been analyzed in the broader Latin American context in Loayza, Fajnzylber,and Calderón (2005) and Zettelmeyer (2006).
3. See, for example, Loayza et al. (2005) and García-Verdú (2007).
fatigue, in the current domestic political context, has become an obstacle to fur-ther economic reform. In this section we also briefly describe some of the eco-nomic reforms that have already been implemented, either fully or in part,including trade liberalization, privatization, and pension reform. The next sectiondiscusses some areas where the reform agenda might successfully be advanced. Inparticular, we propose and discuss three areas of reform for which there is someprobability of consensus: legal and judicial reform, competition policy, and finan-cial sector reform. Again, the first two sets of reforms are necessary for the otherreforms to work. The financial sector is included for illustrative purposes, that is,to show that for this reform to work, a competitive environment and an efficientand adequate rule of law are both needed. The final section concludes.
Economic Growth and Its Foundations
Economic Growth in the Recent Past
The performance of the domestic economy during the past twenty-five years hasbeen quite disappointing, not just for the Mexican population but for all who sawgreat potential in the economic reforms of the 1980s and 1990s.2 The slow rateof growth in Mexico’s real income per capita from 1981 to 2006 stands in sharpcontrast with the country’s own economic performance between 1950 and 1981,when real income per capita grew at a pace of 3.4 percent a year. This record ofgrowth is depicted in figure 1, which also shows the structural break in 1981 thatwas detected statistically by Berg, Ostry, and Zettelmeyer (2006). However, start-ing in 1995 Mexico seems to have resumed a positive growth trend, with a slumpbetween 2000 and 2003, which can be partly attributed to the U.S. recession of2001. In any event, average annual growth in real income per capita between 1995and 2006, at 2.2 percent, was not only slower than in the previous period, butslower than what many had expected given the amplitude and variety of reformsundertaken.
What accounts for Mexico’s economic growth slowdown since 1981? Answer-ing this question requires a deeper analysis of the underlying factors. One way todo this is by performing a standard growth accounting decomposition, to inves-tigate whether the problem has been one of factor accumulation or of slow growthin total factor productivity (TFP). Several recent studies have attempted to disen-tangle the contributions of these different factors to growth in Mexico’s GDP.3
In general, all reach the same basic conclusion: Mexico’s economy has grownslowly since the 1980s as a result of a sharp decline in TFP.
11630-06_CH06_rev2.qxd 6/2/09 4:09 PM Page 195
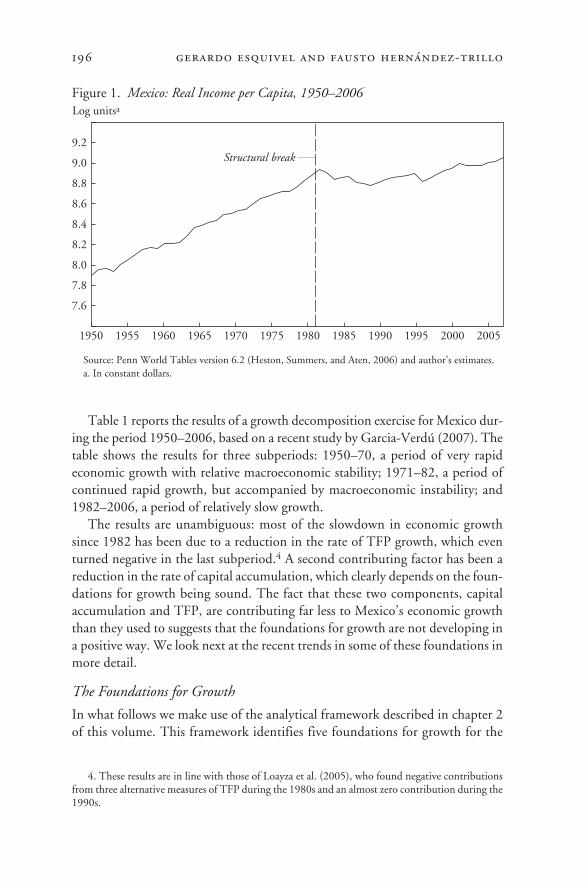
Table 1 reports the results of a growth decomposition exercise for Mexico dur-ing the period 1950–2006, based on a recent study by Garcia-Verdú (2007). Thetable shows the results for three subperiods: 1950–70, a period of very rapid economic growth with relative macroeconomic stability; 1971–82, a period ofcontinued rapid growth, but accompanied by macroeconomic instability; and1982–2006, a period of relatively slow growth.
The results are unambiguous: most of the slowdown in economic growthsince 1982 has been due to a reduction in the rate of TFP growth, which eventurned negative in the last subperiod.4 A second contributing factor has been areduction in the rate of capital accumulation, which clearly depends on the foun-dations for growth being sound. The fact that these two components, capitalaccumulation and TFP, are contributing far less to Mexico’s economic growththan they used to suggests that the foundations for growth are not developing ina positive way. We look next at the recent trends in some of these foundations inmore detail.
The Foundations for Growth
In what follows we make use of the analytical framework described in chapter 2of this volume. This framework identifies five foundations for growth for the
196 gerardo esquivel and fausto hernández-trillo
4. These results are in line with those of Loayza et al. (2005), who found negative contributionsfrom three alternative measures of TFP during the 1980s and an almost zero contribution during the1990s.
Source: Penn World Tables version 6.2 (Heston, Summers, and Aten, 2006) and author’s estimates.a. In constant dollars.
200520001995199019851980197519701965196019551950
Structural break9.2
9.0
8.8
8.6
8.4
8.2
8.0
7.8
7.6
Log unitsa
Figure 1. Mexico: Real Income per Capita, 1950–2006
11630-06_CH06_rev2.qxd 6/2/09 4:09 PM Page 196
mexico 197
Latin American economies: property rights, equal opportunities, competition,macroeconomic stability, and a broader sharing of the benefits of growth. Unfor-tunately, there are no obvious ways of measuring some of these concepts or ofcapturing them through proxy variables. However, we do have suitable proxiesfor three of these concepts, and in this section we briefly review and discuss theirtrack record in Mexico. In each case we use only those variables for which wehave data before and after 1982, the year when Mexico’s structural reforms gotunder way.
Property Rights
As a proxy measure for property rights, we use the Legal Structure and Secu-rity of Property Rights Index developed by the Cato Institute, which is one of thecomponents of the World Economic Freedom Index computed annually by thatorganization. Since 1995 the Cato property rights index has been based on fiveindicators: judicial independence, impartiality of the courts, protection of intel-lectual property, military interference in the political regime, and integrity of thelegal system. Values of all the indicators range from zero to 10, with zero indicat-ing maximum weakness.
Table 2 traces the Cato property rights index for Mexico since 1970. The pat-tern is erratic, with a slight improvement between 1975 and 1990 followed by asharp reversal between 1990 and 2000 and then a slight recovery after 2000. Theindex in 2004 was well below its value in 1980, which means that there was nonet progress at all over those twenty-five years; the index actually shows a slightdecline since the beginning of the structural reform process. This pattern, as dis-cussed later, could be associated with the negative performance of some of the pre-vious economic reforms.
Macroeconomic Stability
Mexico, like many other Latin American countries, has gone through severalmacroeconomic crises and has suffered from macroeconomic instability and highvulnerability to external shocks. Mexico has also experienced several devaluationsof the peso and has signed several letters of intent with the International Mone-
Table 1. Mexico: Accounting for Growth, 1950–2006Percent a year (annual averages)
Change Change in Change in composition Change in total Period in GDP capital stock of human capital factor productivity
1950–70 6.10 1.67 0.63 3.801971–82 5.97 2.54 1.94 1.491982–2006 2.42 1.22 2.07 −0.87
Source: Authors’ calculations based on Garcia-Verdú (2007).
11630-06_CH06_rev2.qxd 6/2/09 4:09 PM Page 197
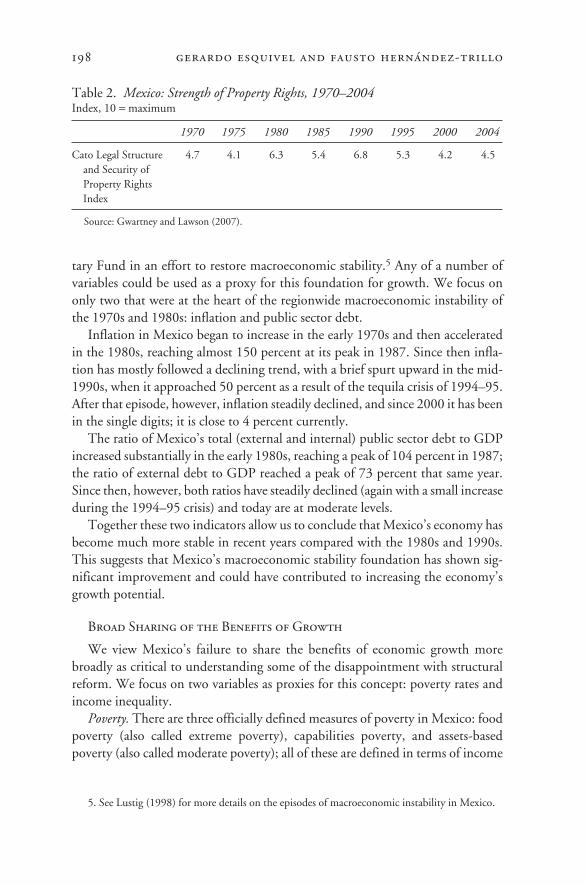
tary Fund in an effort to restore macroeconomic stability.5 Any of a number ofvariables could be used as a proxy for this foundation for growth. We focus ononly two that were at the heart of the regionwide macroeconomic instability ofthe 1970s and 1980s: inflation and public sector debt.
Inflation in Mexico began to increase in the early 1970s and then acceleratedin the 1980s, reaching almost 150 percent at its peak in 1987. Since then infla-tion has mostly followed a declining trend, with a brief spurt upward in the mid-1990s, when it approached 50 percent as a result of the tequila crisis of 1994–95.After that episode, however, inflation steadily declined, and since 2000 it has beenin the single digits; it is close to 4 percent currently.
The ratio of Mexico’s total (external and internal) public sector debt to GDPincreased substantially in the early 1980s, reaching a peak of 104 percent in 1987;the ratio of external debt to GDP reached a peak of 73 percent that same year.Since then, however, both ratios have steadily declined (again with a small increaseduring the 1994–95 crisis) and today are at moderate levels.
Together these two indicators allow us to conclude that Mexico’s economy hasbecome much more stable in recent years compared with the 1980s and 1990s.This suggests that Mexico’s macroeconomic stability foundation has shown sig-nificant improvement and could have contributed to increasing the economy’sgrowth potential.
Broad Sharing of the Benefits of Growth
We view Mexico’s failure to share the benefits of economic growth morebroadly as critical to understanding some of the disappointment with structuralreform. We focus on two variables as proxies for this concept: poverty rates andincome inequality.
Poverty. There are three officially defined measures of poverty in Mexico: foodpoverty (also called extreme poverty), capabilities poverty, and assets-basedpoverty (also called moderate poverty); all of these are defined in terms of income
198 gerardo esquivel and fausto hernández-trillo
5. See Lustig (1998) for more details on the episodes of macroeconomic instability in Mexico.
Table 2. Mexico: Strength of Property Rights, 1970–2004Index, 10 = maximum
1970 1975 1980 1985 1990 1995 2000 2004
Cato Legal Structure 4.7 4.1 6.3 5.4 6.8 5.3 4.2 4.5and Security of Property Rights Index
Source: Gwartney and Lawson (2007).
11630-06_CH06_rev2.qxd 6/2/09 4:09 PM Page 198
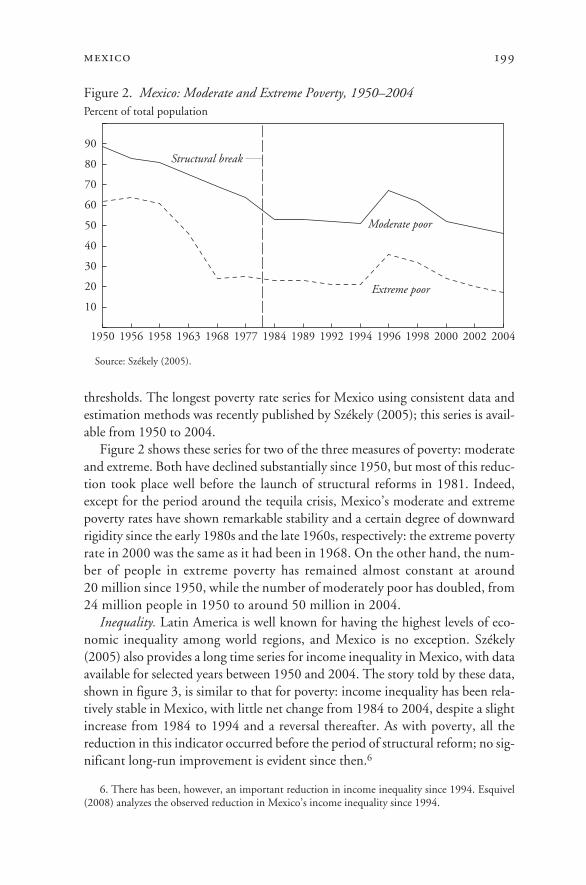
mexico 199
thresholds. The longest poverty rate series for Mexico using consistent data andestimation methods was recently published by Székely (2005); this series is avail-able from 1950 to 2004.
Figure 2 shows these series for two of the three measures of poverty: moderateand extreme. Both have declined substantially since 1950, but most of this reduc-tion took place well before the launch of structural reforms in 1981. Indeed,except for the period around the tequila crisis, Mexico’s moderate and extremepoverty rates have shown remarkable stability and a certain degree of downwardrigidity since the early 1980s and the late 1960s, respectively: the extreme povertyrate in 2000 was the same as it had been in 1968. On the other hand, the num-ber of people in extreme poverty has remained almost constant at around 20 million since 1950, while the number of moderately poor has doubled, from24 million people in 1950 to around 50 million in 2004.
Inequality. Latin America is well known for having the highest levels of eco-nomic inequality among world regions, and Mexico is no exception. Székely(2005) also provides a long time series for income inequality in Mexico, with dataavailable for selected years between 1950 and 2004. The story told by these data,shown in figure 3, is similar to that for poverty: income inequality has been rela-tively stable in Mexico, with little net change from 1984 to 2004, despite a slightincrease from 1984 to 1994 and a reversal thereafter. As with poverty, all thereduction in this indicator occurred before the period of structural reform; no sig-nificant long-run improvement is evident since then.6
6. There has been, however, an important reduction in income inequality since 1994. Esquivel(2008) analyzes the observed reduction in Mexico’s income inequality since 1994.
Figure 2. Mexico: Moderate and Extreme Poverty, 1950–2004
Source: Székely (2005).
Structural break
Percent of total population
10
20
30
40
50
60
70
80
90
Moderate poor
Extreme poor
200420022000199819961994199219891984197719681963195819561950
11630-06_CH06_rev2.qxd 6/2/09 4:09 PM Page 199
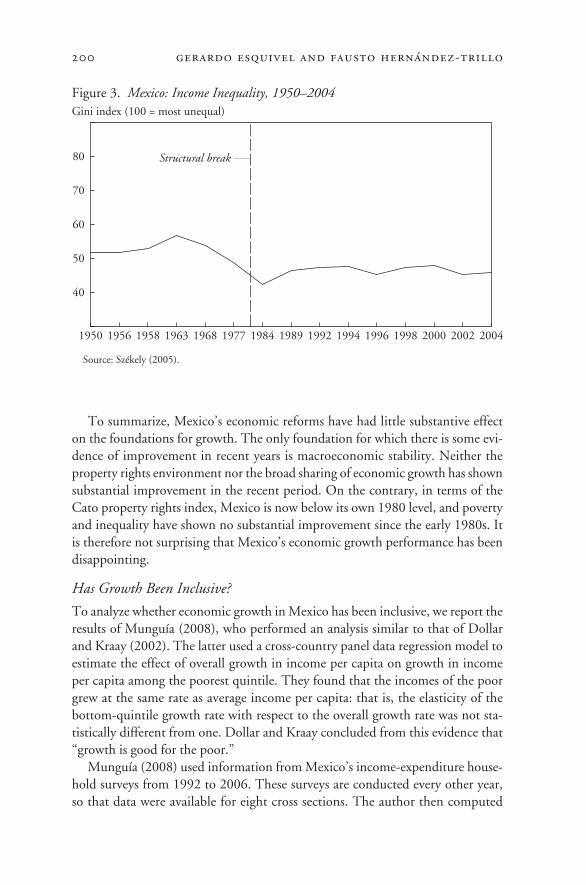
To summarize, Mexico’s economic reforms have had little substantive effecton the foundations for growth. The only foundation for which there is some evi-dence of improvement in recent years is macroeconomic stability. Neither theproperty rights environment nor the broad sharing of economic growth has shownsubstantial improvement in the recent period. On the contrary, in terms of theCato property rights index, Mexico is now below its own 1980 level, and povertyand inequality have shown no substantial improvement since the early 1980s. Itis therefore not surprising that Mexico’s economic growth performance has beendisappointing.
Has Growth Been Inclusive?
To analyze whether economic growth in Mexico has been inclusive, we report theresults of Munguía (2008), who performed an analysis similar to that of Dollarand Kraay (2002). The latter used a cross-country panel data regression model toestimate the effect of overall growth in income per capita on growth in incomeper capita among the poorest quintile. They found that the incomes of the poorgrew at the same rate as average income per capita: that is, the elasticity of the bottom-quintile growth rate with respect to the overall growth rate was not sta-tistically different from one. Dollar and Kraay concluded from this evidence that“growth is good for the poor.”
Munguía (2008) used information from Mexico’s income-expenditure house-hold surveys from 1992 to 2006. These surveys are conducted every other year,so that data were available for eight cross sections. The author then computed
200 gerardo esquivel and fausto hernández-trillo
Figure 3. Mexico: Income Inequality, 1950–2004
Source: Székely (2005).
Structural break
Gini index (100 = most unequal)
200420022000199819961994199219891984197719681963195819561950
40
50
60
70
80
11630-06_CH06_rev2.qxd 6/2/09 4:09 PM Page 200
mexico 201
both average income per capita and that of the poorest quintile using state-leveldata from all thirty-two of Mexico’s states, 256 observations in all. The authorregressed the log of income per capita of the poor on the log of overall averageincome per capita, controlling for such variables as education, foreign directinvestment, and the share of the maquiladora sector in the state. To reduce thebias associated with the model’s specification, following Dollar and Kraay’s (2002)methodology, Munguía estimated the model in both levels and first-differencesusing the system-GMM (generalized method of moments) approach.
Table 3, which summarizes his results, shows that the income growth elastic-ity of the poor is again very close to one in all specifications. In fact, none of theestimated coefficients is statistically different from one, suggesting that averageincome per capita at the state level grew at the same rate as income per capitaamong the poorest quintile. Thus, although economic growth in Mexico was notpro-poor, in the sense that the poorest did not benefit more than proportionallyfrom economic growth than the middle of the distribution, at least growth wasnot biased against them.
Using a different approach, Esquivel (2008) has shown that, at least since 1994,the income of the bottom part of the distribution has grown faster than that ofthe rest of the population. This fact explains the reduction in inequality that hasbeen observed since that year. This result, together with our previous discussion,suggests that the problem with the recent trend in income growth in Mexico ismainly its low level rather than its distribution.
Table 3. Mexico: Elasticity of Income Growth of the Poor with Respect to AverageIncome Growth a
States includedEstimated elasticity
Sample period in sample With time dummies Without time dummies
1992–2006 All 1.053 1.054(0.050) (0.041)
1992–1998 All 0.907 0.999(0.216) (0.102)
2000–2006 All 1.052 1.048(0.074) (0.063)
1992–2006 Poor states only 0.864 0.900(0.090) (0.087)
1992–2006 Rich states only 1.001 0.973(0.069) (0.054)
Source: Munguía (2008).a. Results of a regression of the log of growth in income per capita of the poor on the log of growth
in average income per capita, using the system-GMM (generalized method of moments) method. Allregressions include two lags of the dependent variable as instruments. Numbers in parentheses are stan-dard errors.
11630-06_CH06_rev2.qxd 6/2/09 4:09 PM Page 201
Reform Fatigue, the Political Constraint, and Previous Reforms
How did Mexico go from being one of the region’s leading reformers in the early1990s to the “reform paralysis” of recent years? Part of the answer lies in the dis-mal performance of the Mexican economy, discussed above, after the initial set ofreforms. However, this is not a convincing explanation for everyone, since somehave argued that the Mexican economy would have done better if further reformshad been implemented. Why, then, are further economic reforms not being as vig-orously pursued in Mexico as they were in the 1980s and 1990s? Why have recentadministrations been unable to pass a single important economic reform? We seethree reasons behind this outcome: first, a generalized perception that the reformagenda had failed to generate faster economic growth; second, a change in politi-cal conditions that have made it much harder to implement any further economicreform; and third, the actual failure of some of the first group of reforms. Weaddress each of these issues in turn.
Economic Growth and Reform
The relationship between reform and economic growth is not an obvious one.Often reforms affect growth only indirectly. In any event, Mexico’s reformswere expected to have a positive effect on growth, and indeed it was preciselyon those grounds that the government justified them. Yet, as we have seen, Mex-ico’s economic performance does not seem to have improved in the wake of thereforms. Indeed, an important segment of the population perceives their over-all effect to have been negative, and not without reason. Figure 4 compares anindex of structural reform with the ratio of Mexico’s GDP per capita to that ofthe United States for the period since 1970.7 The figure shows a surprising mir-ror image between these two variables: when the reform index started to increasein 1982, GDP per capita relative to the United States started to decline, andwhen the rise in the reform index began to slow around 1989, the GDP percapita ratio started to stabilize as well. Since 1997 both indices have been basi-cally constant.
Although this pattern obviously does not imply causation, that may not mat-ter to the general public, who perceives only the negative association betweenreform and economic performance. Given these results, it is not surprising thatimportant groups of the Mexican population are less than eager to support a con-tinued pro-reform agenda.
202 gerardo esquivel and fausto hernández-trillo
7. This index was originally calculated by Morley, Machado, and Pettinato (1999) and wasrecently updated and revised by Escaith and Paunovic (2004). We are assuming no changes in theindex between 2004 and 2006.
11630-06_CH06_rev2.qxd 6/2/09 4:09 PM Page 202
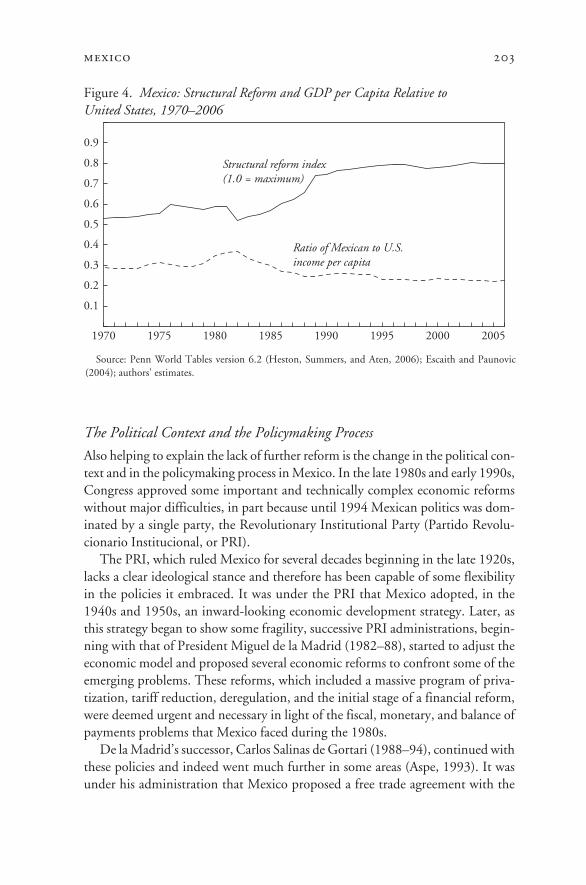
mexico 203
The Political Context and the Policymaking Process
Also helping to explain the lack of further reform is the change in the political con-text and in the policymaking process in Mexico. In the late 1980s and early 1990s,Congress approved some important and technically complex economic reformswithout major difficulties, in part because until 1994 Mexican politics was dom-inated by a single party, the Revolutionary Institutional Party (Partido Revolu-cionario Institucional, or PRI).
The PRI, which ruled Mexico for several decades beginning in the late 1920s,lacks a clear ideological stance and therefore has been capable of some flexibilityin the policies it embraced. It was under the PRI that Mexico adopted, in the1940s and 1950s, an inward-looking economic development strategy. Later, asthis strategy began to show some fragility, successive PRI administrations, begin-ning with that of President Miguel de la Madrid (1982–88), started to adjust theeconomic model and proposed several economic reforms to confront some of theemerging problems. These reforms, which included a massive program of priva-tization, tariff reduction, deregulation, and the initial stage of a financial reform,were deemed urgent and necessary in light of the fiscal, monetary, and balance ofpayments problems that Mexico faced during the 1980s.
De la Madrid’s successor, Carlos Salinas de Gortari (1988–94), continued withthese policies and indeed went much further in some areas (Aspe, 1993). It wasunder his administration that Mexico proposed a free trade agreement with the
Figure 4. Mexico: Structural Reform and GDP per Capita Relative to United States, 1970–2006
Source: Penn World Tables version 6.2 (Heston, Summers, and Aten, 2006); Escaith and Paunovic (2004); authors’ estimates.
0.1
0.2
0.3
0.4
0.5
0.6
0.7
0.8
0.9
Ratio of Mexican to U.S.income per capita
Structural reform index(1.0 = maximum)
20052000199519901985198019751970
11630-06_CH06_rev2.qxd 6/2/09 4:09 PM Page 203
204 gerardo esquivel and fausto hernández-trillo
United States and Canada, which was implemented as the North American FreeTrade Agreement (NAFTA) in 1994. One can appreciate the magnitude of thischange of perspective for Mexico by noting that as recently as 1980, the Mexicangovernment had rejected, on purely nationalistic grounds, membership in theGeneral Agreement on Tariffs and Trade (GATT).
The lackluster economic results of the 1980s and the failure (perceived or real)of some of the economic reforms of that period, together with a more open polit-ical environment, took their toll on the PRI’s popular support. Thus, althoughPRI candidates won the presidential elections of 1988 and 1994, they faced muchstronger competition and barely obtained an absolute majority of the popular vote(figure 5). In those two elections and in the mid-term elections of 1991, the PRIcontinued to win absolute majorities in both houses of Congress. This facilitatedpolicymaking, and some important economic reforms were implemented withoutstrong opposition in Congress during this period.8
However, during President Salinas’s administration the PRI had already lostenough seats in Congress that it could no longer make constitutional changeswithout the support of other parties. (These changes require a qualified majorityof two-thirds of the votes in both houses.) Therefore, in order to advance thereform agenda when constitutional reforms were needed, Salinas and the PRIformed a voting coalition with the right-of-center National Action Party (PartidoAcción Nacional, or PAN). The PRI could still pass other reforms without hav-ing to resort to compromise with other political forces. During this period the leftist-oriented political parties (which in figure 5 are generically labeled as PRD)opposed most of the reforms but were unable to prevent their passage.
In 1997, during President Ernesto Zedillo’s administration (1994–2000), thepolitical context underwent a dramatic and important change. For the first timein Mexico’s recent history, the governing party failed to achieve a simple major-ity in Congress, and the country entered an era of divided government. Not sur-prisingly, this change coincided with the beginning of the period of reforminaction shown in figure 4.
In 2000, for the first time after more than seven decades in power, the PRI lostthe presidential election to Vicente Fox, the PAN’s charismatic candidate. How-ever, the PAN failed to win either house of Congress, and thus President Foxfaced an even more complex situation than had his predecessor. Not only was thePAN unable to approve any reform proposal without support from other parties,but it lacked the PRI’s political expertise as well. Not surprisingly, then, the newadministration proved incapable of building a majority coalition with otherpolitical forces. The result of the mid-term elections in 2003 left the governing
8. This is not to say that economic reform was not debated. In fact, some reform proposals gen-erated a heated debate in the media, and others provoked public demonstrations of opposition.
11630-06_CH06_rev2.qxd 6/2/09 4:09 PM Page 204
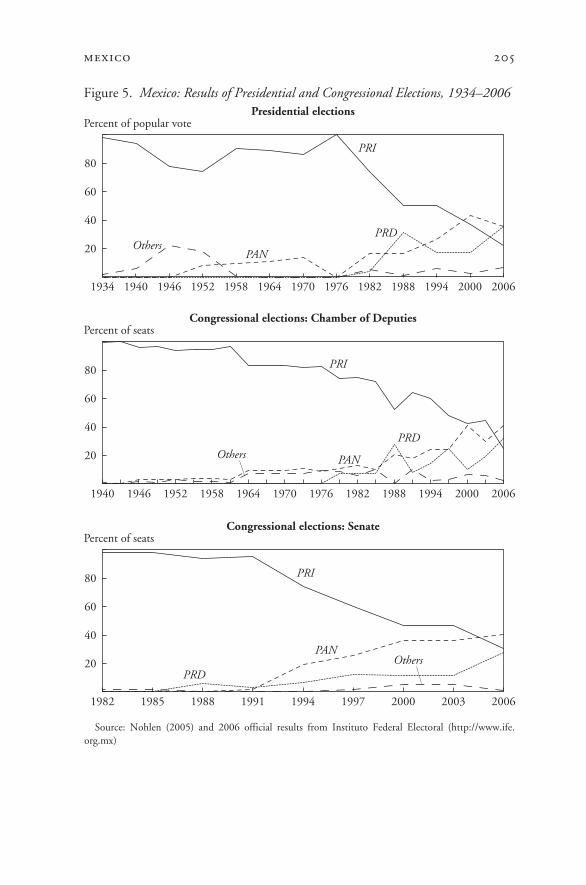
mexico 205
Figure 5. Mexico: Results of Presidential and Congressional Elections, 1934–2006
Source: Nohlen (2005) and 2006 official results from Instituto Federal Electoral (http://www.ife. org.mx)
Percent of popular votePresidential elections
20
40
60
80
OthersPRD
PAN
PRI
2006200019941988198219761970196419581952194619401934
Percent of seatsCongressional elections: Chamber of Deputies
20
40
60
80
OthersPRD
PAN
PRI
200620001994198819821976197019641958195219461940
Percent of seatsCongressional elections: Senate
20
40
60
80
OthersPRD
PAN
PRI
200620032000199719941991198819851982
11630-06_CH06_rev2.qxd 6/2/09 4:09 PM Page 205
party in an even worse situation, with only 30 percent of the seats in the Cham-ber of Deputies.
Following a very close presidential election in 2006, Mexico again has a dividedgovernment, with the new president, Felipe Calderón of the PAN, facing the sameproblems that his predecessor, President Fox, did. Nevertheless, as of 2008 tworeforms had passed, a public pension reform and a fiscal reform, with the supportof both the PRI and the PAN. The fiscal reform, however, is a very weak one, andshort of what had been anticipated. An energy reform has been proposed and asof this writing is being heatedly debated in Congress. This reform will probablybe either rejected or so diluted as to make it almost irrelevant.
As mentioned above, the new political situation seems to have preventedapproval of some important economic reforms that could have contributed toenhancing Mexico’s opportunities for economic growth. The next section reviewsthe performance of some of the reforms that were approved in the 1980s.
Results of Some Previous Reforms
Mexico’s recent reform inaction can partly be explained by the apparent lack ofeffectiveness of the previous reforms in delivering growth. What went wrong?Why did Mexico’s economic reforms fail to translate into stronger economicgrowth? Were they ineffective in terms of influencing the foundations for growth,or were they simply not aimed at influencing them? To answer these questions,we briefly review three of the most important previous reforms in Mexico: tradeliberalization, pension reform, and privatization.
Trade Liberalization
In 1985, in the midst of a macroeconomic crisis, the Mexican governmentannounced a unilateral reduction in tariffs on foreign goods as well as the elimi-nation of many trade barriers and import quotas. This surprising move repre-sented a substantial change from Mexico’s traditional protectionist policy andmarked the beginning of a new trade policy. During the early 1990s, to consoli-date this new approach to international trade, the Mexican government signed afree trade agreement, NAFTA, with the United States and Canada. Since thenMexico has established free trade agreements with many other Latin Americannations and with the European Union, Israel, and Japan.
The objectives of this reform were the following:• to improve efficiency and resource allocation in the economy• to attract more foreign direct investment (FDI) and contribute to generat-
ing employment• to contribute to macroeconomic stability by imposing price discipline
through lower import prices, and• to improve the broad sharing of the benefits of growth by reducing prices of
imported goods for everyone.
206 gerardo esquivel and fausto hernández-trillo
11630-06_CH06_rev2.qxd 6/2/09 4:09 PM Page 206
mexico 207
The reform succeeded in achieving many of its original objectives and, togetherwith the achievement of macroeconomic stability, can be considered as one of themost important reform successes in Mexico. Both trade flows and FDI increasedconsiderably after the launch of NAFTA; prices of imported goods helped keepMexico’s inflation in line; efficiency, resource allocation, and productivity in Mex-ico’s industry improved (see López-Córdova, 2003, and Lederman, Maloney, andServén, 2005).
However, it is also clear that the high expectations about the impact of trade lib-eralization in general, and NAFTA in particular, have not fully materialized. Thefollowing are some problems with the design and implementation of this reform:
• According to Easterly, Fiess, and Lederman (2003), the main factor con-tributing to the lack of convergence in income per capita between Mexico and theUnited States is the weaker quality of Mexico’s institutions: the rule of law,government integrity and effectiveness, and regulatory quality. Improvement inthese areas could help increase the beneficial effects of trade liberalization.
• Despite passage of several other free trade agreements, Mexico’s trade is stillhighly concentrated in the U.S. market. More than 80 percent of Mexico’s exportsgo to the United States, and close to 70 percent of Mexico’s imports come fromthat country. Inadequate infrastructure, together with high fees and lack of invest-ment in Mexico’s ports, undoubtedly played a role in this outcome.
• An unintended consequence of trade liberalization has been increasedregional inequality. The northern states, already relatively rich, have tended tobenefit the most from greater FDI flows, job creation, and lower income inequal-ity, whereas the relatively poor southern states have benefited little (Esquivel et al.,2002; Borraz and López-Córdova, 2007). Lack of adequate infrastructure andhuman capital in the southern states largely explain these results (see Esquivelet al., 2002).
To deal with these obstacles, we propose the following steps:• Implement a general reform of many of the institutional aspects of the Mex-
ican economy, including enforcement of the rule of law and regulatory quality.• Invest in education and infrastructure in Mexico’s southern region to help
that region catch up and to generate a better business environment there.• Improve and reform the operations of Mexico’s ports and invest in infra-
structure throughout the country. Stronger regulation and application of theantitrust laws in the ports’ operation may be needed.
• More generally, an adequate and consistent regional development policyneeds to be designed and implemented.
Pension Reform
In 1996 Congress approved a new social security law and a new law governingthe retirement savings system. This legislation brought about a radical change inthe retirement conditions of formal private sector workers (around 10 million
11630-06_CH06_rev2.qxd 6/2/09 4:09 PM Page 207
workers at the time the law was passed). Mexico had previously had a pay-as-you-go pension system, where current workers’ contributions were used to finance cur-rent pensions. However, demographic changes (especially a substantial increase inlife expectancy) and problems with the administration of pension funds in the pastmade it clear that this system would eventually collapse.
The new laws implemented a change toward a scheme based on individual sav-ings accounts. They mandated the creation of specialized pension fund manage-ment firms (administradoras de fondos para el retiro, or afores), which wouldadminister the workers’ savings accounts and invest the accumulated resources.
The main objectives of the pension reform were the following:9
• to solve the fiscal crisis associated with the previous system• to provide an opportunity for workers to increase their retirement income
through participation in financial markets• to increase the national saving rate by giving workers a sense of ownership
of their retirement savings, and• to contribute to the deepening of the domestic financial system.By helping to prevent a fiscal crisis, pension reform played a fundamental role
in ensuring macroeconomic stability and was thus indispensable. However, thereform cannot be considered completely successful, since it has not achieved manyof its other objectives, and indeed it is not obvious that most workers will benefitfrom the reform. Many workers will not save enough to pay for the minimumguaranteed pension. Many others perceive that their retirement savings are beingeroded by the high fees and commissions charged by the afores. The domesticfinancial system has not improved as a result of the reform, nor has financial inter-mediation increased. All this seems to be due to a number of problems of designand implementation, including the following:
• The high administrative costs of individual accounts reduce workers’ futureretirement income. These high costs will eventually lead to a large number ofworkers being unable to accumulate enough resources to pay for the minimumguaranteed pension, and this will increase the fiscal burden in the future (Sinhaand Rentería, 2005).
• The afores industry is highly concentrated, and the government antitrustagency claims that these firms seem to be acting in a noncompetitive manner(Comisión Federal de Competencia, 2006). For example, real net returns onaccounts managed by the largest firms over the 1997–2005 period averaged aminuscule 0.8 percent a year. Yet the afores themselves have been extremely prof-itable, with returns on equity much higher than those of most Mexican banks(which are quite high by international standards).
• From the perspective of two of the foundations for growth—the broad shar-ing of the benefits of reform and equality of opportunities—the reform was only
208 gerardo esquivel and fausto hernández-trillo
9. See Grandolini and Cerda (1998).
11630-06_CH06_rev2.qxd 6/2/09 4:09 PM Page 208
mexico 209
partial: it included only nongovernment workers in the formal sector, leaving outthe bureaucracy as well as the 60 percent of the population not covered by anypension scheme.
• The financial system faces inadequate incentives to increase its role in finan-cial intermediation and needs a reform of its own (see below).We propose the following steps to allow pension reform to better address thegrowth foundations:
• Promote competition in the afores sector. Remove obstacles to entry into thismarket. Enforce anticompetition laws in the sector.
• Increase transparency concerning the real costs incurred by workers, byrequiring afores to reveal complete and comparable information about the accountsthey manage and about their own risk position.
• Modify the pricing structure in order to better align incentives. Fees shouldonly be charged for account administration and returns to investment. There isno reason to charge fees on either the stocks or the flows of retirement accounts.
• Pursue a reform of the financial sector to increase its role in financial inter-mediation.
Privatization
In 1982 Mexico began a wide-ranging and ambitious privatization program:by 1988 the government had sold 155 public sector firms, and another 261 by1995.10 The first stage of the program focused on relatively small firms, and thesecond on bigger and more complex operations. Around 98 percent of the totalproceeds from privatization were obtained during the second stage. Privatiza-tion was part of a more general divestiture program that also included the dis-solution, liquidation, merger, and transfer to state governments of many otherpublic entities. The number of public sector entities fell from 1,155 in 1982 to219 in 1994. The largest privatized firms were Teléfonos de México (Telmex),three banks (Banamex, Bancomer, and Banca Serfín), and two airlines (Aeroméx-ico and Mexicana). An important infrastructure concession program proceededin parallel.
The main objectives of the privatization program were the following:• redefinition of the government’s role in the economy• improvements in efficiency and resource allocation• a temporary increase in government revenue, and• a new relationship with the private sector.Some authors (e.g., Chong and López-de-Silanes, 2005) view the Mexican pri-
vatization program as highly successful and beneficial. Although perhaps true inmany cases, there were also several cases of mismanagement leading to very pooreconomic outcomes. The main problem, however, was that the least successful
10. For more details on the privatization reform see Rogozinski (1998).
11630-06_CH06_rev2.qxd 6/2/09 4:09 PM Page 209
cases were those related to the largest firms or to key sectors of the economy: exam-ples include telecommunications, banks, ports, and highways. Problems of designor implementation included the following:
• The selection of bidders was often plagued by irregularities and was highlydiscretionary and opaque. In the case of bank privatization this was documentedin a report commissioned by Congress (the Mackey Report).
• Inadequate sequencing was also a problem. In some key cases, privatizationtook place with insufficient or even no regulation for the post-privatization stage.Again the privatized banks are a prominent example. The absence of appropriateprudential regulation and supervision led to extreme cases of “related lending”(Laporta, López-de-Silanes, and Zamarripa, 2003) and to an uncontrollable creditboom during the early 1990s (Sachs, Tornell, and Velasco, 1996). Both factorsplayed a key role in the 1994–95 tequila crisis.
• In other cases, such as telecommunications and the ports, a public monop-oly was transferred to the private sector without an appropriate regulatory andinstitutional framework. (As discussed later, the federal agency regulating compe-tition was established only at the end of 1993.) In the Telmex case, the results havebeen relatively high tariffs, predatory behavior, and the abuse of monopoly power(Del Villar, 2007). In the case of the ports, lack of regulation has led to high tar-iffs, underinvestment, and inefficient operation (Paredes, 2007).
• The National Highways Concession Program was a complete disaster.According to Rogozinski (1998), director in chief of the Office for Privatization,the program “was not a success. Owing to design flaws, costs were higher bothduring construction of the original design and during the post-construction phase.Fares and traffic volume were merely rough estimates and or were determined atdiscretion.”
• These problems eventually led to the renegotiation of the concessions’ orig-inal conditions, and the terms of half of the concessions (twenty-six out of fifty-two) were extended to the maximum length allowed. Later, with the onset of thecrisis, the government launched an extremely costly road recovery program.11
• After the tequila crisis, a large segment of the newly privatized banking sectorhad to be bailed out. The cost of the bailouts is very difficult to estimate, but someauthors put it at nearly 15 percent of GDP. The bailouts were the natural outcomeof a grossly mismanaged privatization process and contained important irregulari-ties of their own, according to the Mackey Report. Not surprisingly, the wholeprocess has been questioned for its opacity and abuse of discretion (Haber, 2005).
This brief review indicates that in some key sectors of the economy, privati-zation was far from successful, and in some cases it was a complete failure, with
210 gerardo esquivel and fausto hernández-trillo
11. Guasch (2004) has analyzed the determinants of renegotiation in concession contracts inLatin America. He finds that macroeconomic shocks, the quality of the regulatory framework, cor-ruption, and the timing of elections, among other variables, help explain the probability that a con-tract would be renegotiated.
11630-06_CH06_rev2.qxd 6/2/09 4:09 PM Page 210
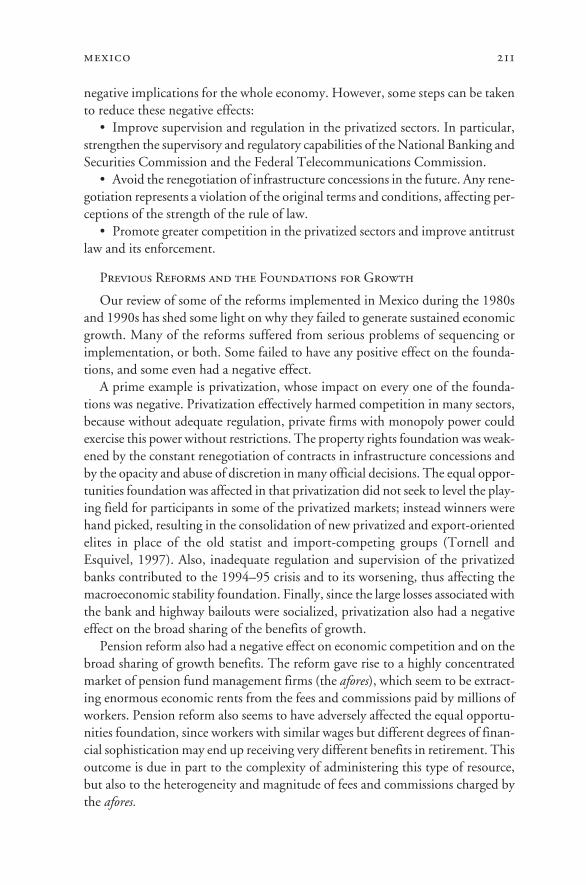
mexico 211
negative implications for the whole economy. However, some steps can be takento reduce these negative effects:
• Improve supervision and regulation in the privatized sectors. In particular,strengthen the supervisory and regulatory capabilities of the National Banking andSecurities Commission and the Federal Telecommunications Commission.
• Avoid the renegotiation of infrastructure concessions in the future. Any rene-gotiation represents a violation of the original terms and conditions, affecting per-ceptions of the strength of the rule of law.
• Promote greater competition in the privatized sectors and improve antitrustlaw and its enforcement.
Previous Reforms and the Foundations for Growth
Our review of some of the reforms implemented in Mexico during the 1980sand 1990s has shed some light on why they failed to generate sustained economicgrowth. Many of the reforms suffered from serious problems of sequencing orimplementation, or both. Some failed to have any positive effect on the founda-tions, and some even had a negative effect.
A prime example is privatization, whose impact on every one of the founda-tions was negative. Privatization effectively harmed competition in many sectors,because without adequate regulation, private firms with monopoly power couldexercise this power without restrictions. The property rights foundation was weak-ened by the constant renegotiation of contracts in infrastructure concessions andby the opacity and abuse of discretion in many official decisions. The equal oppor-tunities foundation was affected in that privatization did not seek to level the play-ing field for participants in some of the privatized markets; instead winners werehand picked, resulting in the consolidation of new privatized and export-orientedelites in place of the old statist and import-competing groups (Tornell andEsquivel, 1997). Also, inadequate regulation and supervision of the privatizedbanks contributed to the 1994–95 crisis and to its worsening, thus affecting themacroeconomic stability foundation. Finally, since the large losses associated withthe bank and highway bailouts were socialized, privatization also had a negativeeffect on the broad sharing of the benefits of growth.
Pension reform also had a negative effect on economic competition and on thebroad sharing of growth benefits. The reform gave rise to a highly concentratedmarket of pension fund management firms (the afores), which seem to be extract-ing enormous economic rents from the fees and commissions paid by millions ofworkers. Pension reform also seems to have adversely affected the equal opportu-nities foundation, since workers with similar wages but different degrees of finan-cial sophistication may end up receiving very different benefits in retirement. Thisoutcome is due in part to the complexity of administering this type of resource,but also to the heterogeneity and magnitude of fees and commissions charged bythe afores.
11630-06_CH06_rev2.qxd 6/2/09 4:09 PM Page 211
Finally, trade liberalization is the only reform that has had positive effects bothon the macroeconomic stability foundation and on competition and the broadsharing of growth benefits. However, this reform, too, had some negative effects—both unintended and unexpected—on the equal opportunities foundation, sinceit increased the already large regional disparities in Mexico.
Table 4 summarizes the effects of each reform on the foundations for growthin Mexico. For each reform, the first row shows the potential effect according tothe CGD framework, and the second row the actual effect as described above.
How to Advance the Reform Agenda?
Some additional reforms, if correctly implemented, could have important posi-tive effects, not just by themselves but also by helping the previous reforms havea real and positive impact on the foundations for growth. A careful reading of theimplementation and design problems of previous reforms suggests three areas thatneed to be addressed: the rule of law, competition, and the financial sector. Eachof these issues has already been mentioned in the discussion of at least two of thereforms above. For that reason, but also because they may strengthen some of thefoundations for growth that have been the most weakened, in the next section wediscuss three reforms that could, in our opinion, contribute to generating sus-tained economic growth.
What Reforms Should Be Pursued?
Three reforms that we consider both important and viable in the short run inMexico are legal reform, reform of competition policy, and financial reform. Againwe stress that the appropriate sequencing of these reforms is important.
212 gerardo esquivel and fausto hernández-trillo
Table 4. Mexico: Intended and Actual Impact of Reforms on the Growth Foundations
Broad sharing
Property Equal of growth Macroeconomic Reform rights opportunities Competition benefits stability
Trade liberalizationIntended + + + ? ?Actual ∼ + + +
Pension reformIntended + + + ? + +Actual ∼ − − − +
PrivatizationIntended + + + +Actual − − − − −
Key: +, positive; + +, strongly positive; −, negative; ∼, mixed; ?, unclear.
11630-06_CH06_rev2.qxd 6/2/09 4:09 PM Page 212
mexico 213
Legal and Judicial Reform
The Mexican legal system is well known for its complexity and inefficiency.12 Itscomplexity derives from the interaction of the three branches of government (leg-islative, executive, and judiciary) and the three levels of government (federal, state,and municipal). Its inefficiency is evident in the fact that a large number of casesgo unresolved or are subject to extremely long delays before a final decision isreached. In general, complexity in itself should not necessarily be regarded as dys-functional, since the existence of a diversity of actors, conflicting interests, andinstitutions is typical of any democracy. In Mexico, however, this complexity rein-forces the inefficiency of the legal system. As mentioned above, Mexico’s propertyrights index, which encompasses several aspects of the legal system, has not shownany significant improvement since 1980.
Legal enforcement in Mexico is also weak. This may be due to several factors,including an inefficient judicial structure, lack of resources, lack of independencefrom the executive branch (at both the federal and the state level), ineptitude, andcorruption. Even the Mexican Supreme Court, where eleven judges are responsi-ble for solving the most important disputes in the nation, usually lacks the neces-sary support of professionals specialized in certain areas. Furthermore, unlikemany other countries, Mexico lacks an adequate system of specialized tribunals ineconomic and regulatory matters, such as competition and regulation. This oftenleads tribunals to base their decisions on procedural aspects rather than on the sub-stance of the case.
As a federal republic, Mexico has courts at two levels of government: state andfederal. Here a recurring problem is the lack of independence of some state courtswith respect to the state’s executive power. In many cases the court’s appointmentsoverlap with gubernatorial terms of office, thus facilitating political intervention.In fact, such overlapping of appointments (the so-called sexenio judicial) is preva-lent in about half of Mexican states. This situation leads to excessive use of one ofthe key features of the Mexican legal system: the amparo.
The amparo is a multifaceted concept in Mexican law that summarizes severalprocedures designed to protect citizens from the authorities’ inappropriate appli-cation of the law. Some of these are the following:
• habeas corpus• the administrative amparo, which applies to the first- and second-level judi-
cial review of federal administrative cases, and• the judicial amparo, which serves as the third-level federal appeal for local
cases.Hence the lack of independence of the state courts accounts for the existence of athird-level federal appeals procedure, which leads some cases to drag on for years.
12. See López Ayllón and Fix-Fierro (2003) and Magaloni and Negrete (2000).
11630-06_CH06_rev2.qxd 6/2/09 4:09 PM Page 213
Members of the federal judiciary have no incentive to eliminate this appeal pro-cedure, since it allows them to oversee the state courts.
There is also a strong tendency toward excessive use of the administrativeamparos. These are used mainly in fiscal cases, where individuals dispute taxcharges, usually on the grounds that some tax law or regulation violates the defi-nition of equity and proportionality established in the constitution. The overuseof these amparos results in severe losses of tax revenue and high administrativecosts for the government.
There are two main explanations for the excessive use of this type of amparo.First, the Mexican Supreme Court, unlike its counterparts in other countries, hasaccepted the principle that it should rule on issues of equity and proportionalityand has adopted very shallow interpretations of these concepts; in other countries,such as the United States and Spain, the high court may decide on such a basisbut only in extreme situations (Elizondo and Pérez, 2006). Second, as a result ofan established legal principle called the “formula Otero,” amparos in Mexico donot establish a general precedent but apply only to the individual filing the case.This leads to the awkward situation where a fiscal regulation may be declaredunconstitutional for one or more individuals, but others in the same circumstancesstill have to pay the tax.
As a result of the growing demand for amparos in Mexico, they have becomeincreasingly complex and technical, and thus relatively expensive. As a conse-quence, they have tended to disproportionately benefit high-income people andlarge firms (Enrigue, 2006).
Objectives
A comprehensive legal reform in Mexico should aim at the following objec-tives, among others:
• improved efficiency of the judicial system• increased predictability of the legal process• enhanced access of the population to the judicial system• increased independence of the judicial branch with respect to both the local
and the federal executive powers, and• increased transparency and accountability of the judicial system.
Expected Effects on the Foundations for Growth
Legal reform could have important effects on several of the foundations forgrowth.
Property Rights. Legal reform could improve the definition and protection ofproperty rights, including greater protection against expropriation without faircompensation, a stronger guarantee of the efficient enforcement of contracts, andbetter protection for individuals against biased decisions by politically controlledjudiciaries. Improving the efficiency and predictability of the legal process could
214 gerardo esquivel and fausto hernández-trillo
11630-06_CH06_rev2.qxd 6/2/09 4:09 PM Page 214
mexico 215
have a significant impact on property rights in Mexico. Mexico has a long tradi-tion of expropriation (the whole banking system was expropriated in 1982, forexample), and individuals and firms have usually had limited rights to challengegovernment decisions.
Equal Opportunities. In principle, all legal systems are designed to protect every-one in society. However, participation in and access to the legal system in Mex-ico are relatively costly, and therefore access to the system is highly unequal, whichin turn reinforces economic inequality. One survey found that 40 percent of Mex-icans believe that the law is mainly used to “protect the interest of powerful peo-ple.” A legal reform that includes a reduction in the cost of access could increaseparticipation, reduce inequality, and increase trust in the legal system.
Competition. The legal system should promote competition by preventing cap-ture of regulatory authorities. It can also increase competition directly by improv-ing efficiency in the enforcement of regulatory rulings, such as those by the federalcompetition and telecommunications commissions. It may also help to improvethe regulatory process and to avoid regulatory capture by dominant firms in spe-cific markets. In fact, empirical evidence shows that the quality of the legal systemaffects firm size at the state level in Mexico (Laeven and Woodruff, 2007).
Macroeconomic Stability. Since the government loses tax revenue through theamparos and spends a fair amount of resources (both monetary and human) inlegal proceedings responding to them, a legal reform that would regulate anddiminish the incentives for excessive use of amparos could improve the fiscal bal-ance, by discouraging tax evasion and reducing the legal and administrative costsof enforcing the tax laws.
Obstacles to Successful Reform
Several obstacles may impede the successful implementation of legal reformand should be taken into account when designing any new reform:13
• the poor quality of public property registries: in 2003 the total value ofunregistered properties in Mexico was about $245 billion
• extremely long resolution periods in local judicial procedures, and an absenceof alternative dispute resolution mechanisms
• strong incentives for excessive use of the administrative amparo, as discussedabove
• a lack of specialized tribunals with jurisdiction over economic and regula-tory issues
• lack of independence of the state courts from the state executive• absence of an incentive for the federal judiciary to eliminate the federal
appeals procedure, and
13. Parts of this section draw on Hernández Ochoa (2006).
11630-06_CH06_rev2.qxd 6/2/09 4:09 PM Page 215
• lack of appropriate incentives for local judges to reform the existing disputeresolution mechanisms.
Overcoming the Obstacles
Successful implementation of legal reform will likely require the following steps:• Reform of the amparo law is needed to reduce incentives for the excessive use
of both administrative and judicial amparos. Stricter criteria for granting amparosand stronger sanctions for frivolous lawsuits are also needed.
• Amparos could be allowed to set general precedents, eliminating the “formulaOtero.” This could have important consequences for the Ministry of Finance. Allthree leading candidates in the most recent presidential election supported thisproposal, suggesting that a consensus on this issue can be built.
• The Supreme Court should avoid intervening in matters of equity and pro-portionality with respect to tax laws and regulations. This authority properlybelongs to the legislative power.
• Specialized tribunals in areas such as competition and economic regulationshould be created.
• State judicial branches should be granted independence from both the fed-eral judiciary and state executive authorities. The simultaneous appointments ofcourt members and state executive authorities should be eliminated.
• Public property registries should be modernized and updated with the latesttechnology. This is critical for adequate property rights protection and may pro-vide greater certainty in some economic transactions.
• The civil and commercial procedure codes should be reformed to allow dif-ferent tracks for simple and complex cases.
• Alternative dispute resolution mechanisms should be introduced, to reducethe cost of access to the legal system and shorten judicial delays. For example, com-mercial arbitration mechanisms and conciliation procedures could be used in theinitial stages of disputes.
Competition Policy Reform
In December 1992 Congress promulgated the Federal Law of Economic Compe-tition (Ley Federal de Competencia Económica, or LFCE).14 This law mandatedthe creation of the Federal Competition Commission (Comisión Federal de Com-petencia, or CFC), which began operating in 1993. The CFC is the Mexican federal agency in charge of competition policy, including the investigation of anti-competitive practices, the supervision of vertical and horizontal mergers, and thedefense and promotion of competition in the economy.
From the outset, the appropriate level of autonomy of the CFC has been sub-ject to debate. One option was to create an administrative entity within what is
216 gerardo esquivel and fausto hernández-trillo
14. Parts of this section draw on a background paper prepared by Marcos Avalos.
11630-06_CH06_rev2.qxd 6/2/09 4:09 PM Page 216
mexico 217
now the Ministry of Economy. This ministry, however, had a reputation for beingprotectionist, and some feared that it might tend to protect strong local monop-olies as part of an industrial policy program. Another option was to create a com-pletely autonomous competition authority, but no consensus could be reached.As a compromise, the CFC has been since its creation an administrative entityassociated with the Ministry of Economy, but enjoys technical and operatingautonomy.
Objectives
The main objective of the LFCE is to increase the overall efficiency of theeconomy. To that end, the law seeks to generate the appropriate conditions foreffective competition. It tries to protect and promote competition through theprevention and elimination of monopolies, monopolistic practices, and otherrestrictions that may hinder the efficient operation of markets. In some aspectsthe LFCE acts as a regulatory law, for example when evaluating whether verti-cal or horizontal mergers should be allowed. In other instances the LFCE is notstrictly speaking a regulatory law, in that it can only be applied ex post, after acompany or industry has violated some aspect of the competition law.
In applying the LFCE, the CFC interacts with other government agencies andregulatory bodies and must take into account many other Mexican laws and reg-ulations with important implications for economic competition. These laws andregulations must be applied along with the LFCE.
In 2004 the Organization for Economic Cooperation and Developmentreviewed the performance of Mexico’s competition policy during its first decadeof operation. The study (OECD, 2004) found that the CFC had been relativelysuccessful: “The accomplishments of the Commission have been noteworthy . . .taking into consideration the harsh conditions under which the Commissionoperates.” In recent years, however, the juridical and organizational frameworkgoverning competition policy in Mexico started to show some weaknesses. Imple-mentation of the LFCE also began to encounter problems when a series of judi-cial rulings revealed deficiencies in the law, in terms not only of its procedures butalso of its constitutionality. This situation led to a proposal to modify the legisla-tion, and a new LFCE was approved by Congress in mid-2006. This reform hadthree main objectives:
• to make the CFC’s recommendations (in terms of regulations, norms, andpolicies) binding on public sector institutions
• to strengthen the CFC’s authority to sanction anticompetitive marketbehavior
• to solve certain procedural deficiencies.The reform solved many of the problems identified under the old LFCE, but
the law remained far from perfect. In the next section we discuss how this reformmay affect the foundations for economic growth, and we identify some problems
11630-06_CH06_rev2.qxd 6/2/09 4:09 PM Page 217
of design and some local factors that may undermine its success. Finally, we dis-cuss some proposals that could improve the economic impact of this reform.
Expected Effects on the Foundations for Growth
As previous studies have shown, competition policy can enhance the intensityof competition in an economy and thus have a positive effect on economic growth.For example, Krakowski (2005) showed that competition policy strengthenedeconomic competition in a sample of more than 100 countries; Dutz and Hayri(2000) showed that the intensity of competition is positively associated with aneconomy’s rate of growth. Other studies have shown similar effects of competi-tion policy on economic growth, employment rates, the level of FDI, and incomedistribution (OECD, 2006).
In terms of the CGD framework, competition policy reform could have adirect effect on three of the five foundations: economic competition, equal oppor-tunities, and property rights. It could also have an indirect effect on the broadsharing of growth benefits.
This reform, if successful, will have a positive effect on economic competitionin Mexico, by guaranteeing the existence of competitive markets and adequaterules for a competitive economic environment. Today, the absence of effectiveantimonopoly legislation allows firms with monopoly power to exercise it in waysthat reduce both social welfare and economic efficiency. By strengthening theCFC and adjusting the LFCE to make it more effective, competition policyreform could increase competition, thereby having a positive impact on one of themain foundations for growth.
Competition reform would also benefit the equal opportunities foundation.The LFCE is designed to protect producers in cases where the behavior of one ormore competitors puts competition at risk. In other words, it does not protect pro-ducers if they lose market share because of lack of efficiency or innovation, butonly when they are being affected by anticompetitive behavior. A successfulreform would level the playing field for all competitors in markets where theabsence of an effective competition policy allows dominant firms to engage inanticompetitive behavior.
If successfully implemented, this reform could also have a positive effect onthe competition, equal opportunities, and property rights foundations in sev-eral key regulated sectors. This is a major issue since many of the CFC’s opin-ions on the regulations, procedures, legislation, and norms established by someregulatory authorities have been highly controversial. More important, the reg-ulatory authorities were not obliged to abide by the opinions or recommenda-tions of the CFC.
Under the new law that was approved in 2006, the CFC’s opinions regardingthe effects on competition of government programs, proposed legislation, or poli-cies became binding for these public sector institutions. Also, the regulatory
218 gerardo esquivel and fausto hernández-trillo
11630-06_CH06_rev2.qxd 6/2/09 4:09 PM Page 218
mexico 219
framework of various sectors of the economy now requires a favorable opinionfrom the CFC as a prerequisite for the authorization of concessions, permits, ortransfer of rights. Since the implementation of the LFCE, laws in key sectors suchas telecommunications, commercial aviation, airports, toll roads and bridges, trans-portation vehicles, and natural gas have been modified, so that any deregulationor privatization initiative in these sectors now requires the approval of the CFC.
In addition, the relevant federal regulatory agency will control rates if the CFCrules that the effective level of competition is insufficient. Finally, some laws nowrequire that potential bidders for public services franchises obtain the approval ofthe CFC. For all these regulated sectors, an efficient CFC and an effective imple-mentation of the LFCE are key to promoting competition, leveling the playingfield for participants, and protecting the rights of those already involved in (orwishing to enter) these markets.
Finally, the effectiveness of competition policy could also have had a positiveeffect on the broad sharing of growth benefits, since it is expected that enhancingcompetition in key sectors of the economy will have a disciplinary effect on pricesand on product quality, thus making it likely that larger segments of the popula-tion will participate in some of these markets.
Obstacles to Successful Reform
Some possible obstacles to and constraints on successful reform are the following:
• An institutionally weak competition agency. The CFC’s ability to promote andprotect competition is deeply constrained by several factors: a lack of full institu-tional autonomy, which could result in its capture by other government agencies;inadequate financial autonomy, which increases the risks of inefficient implemen-tation of competition policy; and lack of clarity in the allocation of responsibili-ties between the CFC and some other regulatory agencies, such as the FederalTelecommunications Commission.
• Lack of an appropriate design for collecting relevant market information. Asmentioned above, one of the main tasks of the CFC is to investigate possiblemonopolistic practices. There are two ways in which the CFC can begin a for-mal investigation of such practices. The first is by formal accusation (denuncia)by a firm operating in the relevant market that considers itself harmed by thepractices of another market participant. The second is by the CFC initiating itsown ex officio investigation if it considers that a firm is engaging in monopolis-tic practices.
Table 5 shows the number of monopolistic practices investigations, both thosefollowing accusations and those undertaken ex officio, since 1993. Between 1993and 1997, the numbers of accusations and of ex officio investigations were almostequal (72 and 70, respectively). Since 1997, however, investigations stemmingfrom accusations have far outnumbered ex officio investigations (380 versus 87).
11630-06_CH06_rev2.qxd 6/2/09 4:09 PM Page 219
Tab
le 5
.M
exic
o: R
esul
ts of
Inv
estig
atio
ns in
to A
nti-
Com
petit
ive
Beh
avio
r, b
y T
ype
of P
roce
dure
, 199
3–20
06
By
accu
satio
nEx
offi
cio
Inve
stiga
tions
res
ultin
g in
In
vesti
gatio
ns r
esul
ting
in
Tot
alN
o. o
f sa
nctio
n or
rec
omm
enda
tion
No.
of
sanc
tion
or r
ecom
men
datio
n
Peri
odin
vesti
gatio
nsin
vesti
gatio
nsN
umbe
rPe
rcen
tin
vesti
gatio
nsN
umbe
rPe
rcen
t
1993
–94
3019
421
.111
654
.519
94–9
516
61
16.7
106
60.0
1995
–96
2714
535
.713
1076
.919
96,
178
00.
09
222
.22n
d ha
lf19
9752
252
8.0
2713
48.1
1998
5033
927
.317
529
.419
9941
263
11.5
156
40.0
2000
6355
712
.78
450
.020
0164
466
13.0
187
38.9
2002
6859
2033
.99
333
.320
0338
336
18.2
50
0.0
2004
4234
617
.68
225
.020
0562
589
15.5
42
50.0
2006
3936
12.
83
266
.7T
otal
609
452
7917
.515
768
43.3
Sour
ce: C
omis
ión
Fede
ral d
e C
ompe
tenc
ia (2
007a
), s
tati
stic
al a
ppen
dix.
11630-06_CH06_rev2.qxd 6/2/09 4:09 PM Page 220
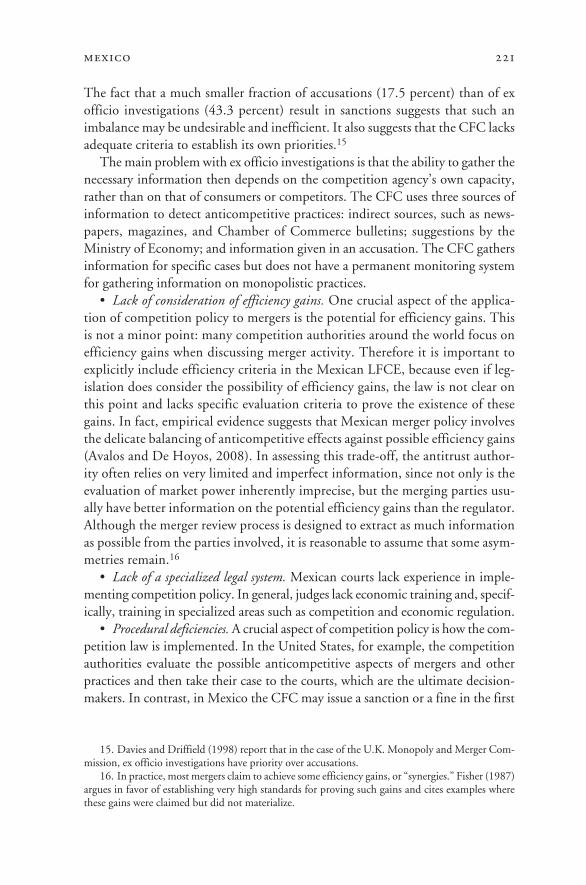
mexico 221
The fact that a much smaller fraction of accusations (17.5 percent) than of exofficio investigations (43.3 percent) result in sanctions suggests that such animbalance may be undesirable and inefficient. It also suggests that the CFC lacksadequate criteria to establish its own priorities.15
The main problem with ex officio investigations is that the ability to gather thenecessary information then depends on the competition agency’s own capacity,rather than on that of consumers or competitors. The CFC uses three sources ofinformation to detect anticompetitive practices: indirect sources, such as news-papers, magazines, and Chamber of Commerce bulletins; suggestions by theMinistry of Economy; and information given in an accusation. The CFC gathersinformation for specific cases but does not have a permanent monitoring systemfor gathering information on monopolistic practices.
• Lack of consideration of efficiency gains. One crucial aspect of the applica-tion of competition policy to mergers is the potential for efficiency gains. Thisis not a minor point: many competition authorities around the world focus onefficiency gains when discussing merger activity. Therefore it is important toexplicitly include efficiency criteria in the Mexican LFCE, because even if leg-islation does consider the possibility of efficiency gains, the law is not clear onthis point and lacks specific evaluation criteria to prove the existence of thesegains. In fact, empirical evidence suggests that Mexican merger policy involvesthe delicate balancing of anticompetitive effects against possible efficiency gains(Avalos and De Hoyos, 2008). In assessing this trade-off, the antitrust author-ity often relies on very limited and imperfect information, since not only is theevaluation of market power inherently imprecise, but the merging parties usu-ally have better information on the potential efficiency gains than the regulator.Although the merger review process is designed to extract as much informationas possible from the parties involved, it is reasonable to assume that some asym-metries remain.16
• Lack of a specialized legal system. Mexican courts lack experience in imple-menting competition policy. In general, judges lack economic training and, specif-ically, training in specialized areas such as competition and economic regulation.
• Procedural deficiencies. A crucial aspect of competition policy is how the com-petition law is implemented. In the United States, for example, the competitionauthorities evaluate the possible anticompetitive aspects of mergers and otherpractices and then take their case to the courts, which are the ultimate decision-makers. In contrast, in Mexico the CFC may issue a sanction or a fine in the first
15. Davies and Driffield (1998) report that in the case of the U.K. Monopoly and Merger Com-mission, ex officio investigations have priority over accusations.
16. In practice, most mergers claim to achieve some efficiency gains, or “synergies.” Fisher (1987)argues in favor of establishing very high standards for proving such gains and cites examples wherethese gains were claimed but did not materialize.
11630-06_CH06_rev2.qxd 6/2/09 4:09 PM Page 221
instance, after which the CFC allows the sanctioned firms to appeal the decision.This device used in the appeal is an administrative, not a legal, procedure, underwhich the CFC must review its own decision and then decide whether to ratify,modify, or revoke it. If the CFC decides to ratify or modify the original resolu-tion and the sanctioned firm remains unsatisfied, it can resort to a legal processcalled juicio de amparo (judicial review) through the local district court. However,this court may only challenge the legality or constitutionality of the commission’sdecision, not the merits. In any event, the court can give the firm an amparo,which suspends the application of the resolution. This process can take a long time(five to seven years),17 during which the CFC may not apply its resolution untilthe court decides either to ratify it or to challenge its constitutionality. The wholeprocedure is very costly and slow and absorbs a substantial amount of the CFC’sresources. Not surprisingly, this device has basically become a mechanism fordelaying enforcement.
• Further delays in the judicial process. Besides seeking a juicio de amparo, firmscan challenge a ratified resolution by presenting a formal appeal to the Federal Tri-bunal of Fiscal and Administrative Justice (Tribunal Federal de Justicia Fiscal yAdministrativa, TFJFA). These two alternatives have been used more intensivelyin recent years as a way of avoiding the effective application of fines by the CFC.Not only can the sanctioned firm contest the fine in the administrative court, butthe court can also evaluate the internal proceedings and the competition analysisthat justified the fine. Thus, the TFJFA has become an additional step in thereview of competition proceedings. This generates a vicious circle, where the revi-sion by the TFJFA generates additional paperwork, unnecessarily drawing out theprocedure and reducing the efficacy of the CFC’s system of fines. The fact thatjudges lack specific training on competition issues gives firms even stronger incen-tives to appeal, using either of these two legal channels. This has slowed the imple-mentation of competition policy in Mexico.
Overcoming the Obstacles
The following proposals may improve the effectiveness of competition policyreform:
• Grant full autonomy to the CFC. This should include financial autonomy,under which the CFC would request its own budget. Greater autonomy wouldmake the CFC less vulnerable to capture by other government agencies.18
• Create a specialized court. A court specializing in economic issues, and com-petition and regulation in particular, is necessary for the proper implementation
222 gerardo esquivel and fausto hernández-trillo
17. Sometimes it can even take longer. For example, judicial review in the case of the CFC ver-sus Telmex (the dominant firm in the telecommunications sector) took almost ten years.
18. There are several examples of autonomous competition authorities in less developed coun-tries, including El Salvador and Honduras (Rivera and Schatan, 2008).
11630-06_CH06_rev2.qxd 6/2/09 4:09 PM Page 222
mexico 223
of competition policy. Such a court would offer many benefits in the implemen-tation of competition policy, since it would eliminate long and costly administra-tive procedures and free up human, physical, and financial resources at the CFC.This court could be designed in a manner similar to Chile’s Tribunal for theDefense of Free Competition.
• If the preceding recommendation is not possible or would take too long toimplement, two others could be considered. The first would internalize judicialrisks in the design and implementation of competition policy. In practical terms, thejudicial system is the main obstacle to an effective competition policy. In the infa-mous Telmex case, the judicial process obstructed the proper implementation ofcompetition policy through procedural delays and through judicial protectionmechanisms (amparos). This case shows that there is always the risk that a case willbecome stalled in the judicial system, rendering the CFC ineffective. Legal prob-lems have also limited the collection of fines: only 10 percent of fines due havebeen paid since the CFC’s creation. This is disturbing, since fines are an impor-tant disincentive to monopolistic practices. The lesson is that judicial risks shouldbe internalized in the design and implementation of competition policy. Forexample, if monopolistic predatory pricing is difficult to prove in a given case, thecompetition authority must opt for a different approach.
• TFJFA proceedings should not constitute a review of LFCE procedures. TheTFJFA is not a specialized entity in anticompetitive policies and does not have anyformal authority in those matters, according to Article 28 of the constitution.Therefore its use as a mechanism for reviewing LFCE procedures should not beallowed.
• Improve the mechanism for conducting investigations of monopolistic practices.A monitoring system for the generation and gathering of information on monop-olistic practices should be created. Investigation of these practices should switchfrom the present reactive policy to a proactive one. At present the following are the main criteria used to determine whether to conduct an investigation:probability of success; the pursuit of certain anticompetitive practices that eco-nomic agents themselves have not reported; and the number of cases that theCFC can handle. This organizational scheme must be changed; the competitionagency should be able to define priorities in order to carry out relevant ex offi-cio investigations.
• Define appropriate and specific methodologies. Little is known about the eval-uation criteria or the weight given to each variable in the decisions of the com-petition authority. Competition policy can hinder rather than foster economicactivity if it increases transaction costs for both the government and economicagents. For instance, in trying to evaluate the potential efficiency gains of a merger,the CFC faces two limitations. The first is asymmetric information, in that thecompanies proposing the merger have an incentive to overestimate how much themerger will reduce marginal costs. The second is that the CFC lacks the instru-
11630-06_CH06_rev2.qxd 6/2/09 4:09 PM Page 223
ments and the methodology to estimate marginal costs on its own and to accu-rately evaluate the likely efficiency gains of a merger. The commission should takea more assertive stance on this matter and not leave the corroboration of thesepossible gains to the companies. Since its creation, the CFC has taken steps toimprove its methodology, but it has not yet developed the advanced quantitativetechniques that would help it make better decisions.
Financial Sector Reform
Financial sector reform in Mexico is essential, because it has the potential toimprove several of the weakest foundations for growth simultaneously, in par-ticular the broad sharing of growth benefits, equal opportunities, and competi-tion. The impact of this reform would be enhanced if it were preceded by legaland competition policy reform along the lines discussed above. These reforms are thus complementary; however, we believe that some measures can be takenindependently.
Mexico has already been through several stages of financial reform. The previ-ous reforms, however, were motivated by either macroeconomic stability or finan-cial deregulation concerns. The first set of reforms sought the deregulation of thesector and included the privatization of banks, as discussed above. The second was launched in reaction to the tequila crisis and included the recapitalization of banks, improvements in prudential regulation, and new legislation orientedtoward securing property rights and improving contract enforcement (in particu-lar, the ability to foreclose on collateral).19
As already mentioned, the first set of reforms actually had negative effects onseveral important foundations for growth, such as macroeconomic stability, eco-nomic competition, and property rights. Neither set of reforms impinged in anysignificant way on the broad sharing of growth or on equal opportunities. Thus,financial reform to date cannot be considered successful, since it has not had a pos-itive influence on the foundations for growth.
The financial sector in Mexico today is characterized by inadequate access andlow financial deepening. In what follows we focus on the banking sector, whichis still the most important source of financing and intermediation for the privatesector (Stephanou and Salinas, 2007).
In terms of access, Mexico’s financial sector ranks near the bottom worldwide.In a recent study (Beck, Demirgüç-Kunt, and Honohan, 2008) that measuredfinancial access as the share of the adult population with access to an account witha financial intermediary, Mexico ranked 101st out of 157 countries, with just 25 percent of adults having access to an account. Among upper-middle-incomecountries (by the World Bank classification), Mexico has the lowest level of finan-
224 gerardo esquivel and fausto hernández-trillo
19. See Aspe (1993) and Murillo (2005) for a description of the first and second reform stages,respectively.
11630-06_CH06_rev2.qxd 6/2/09 4:09 PM Page 224
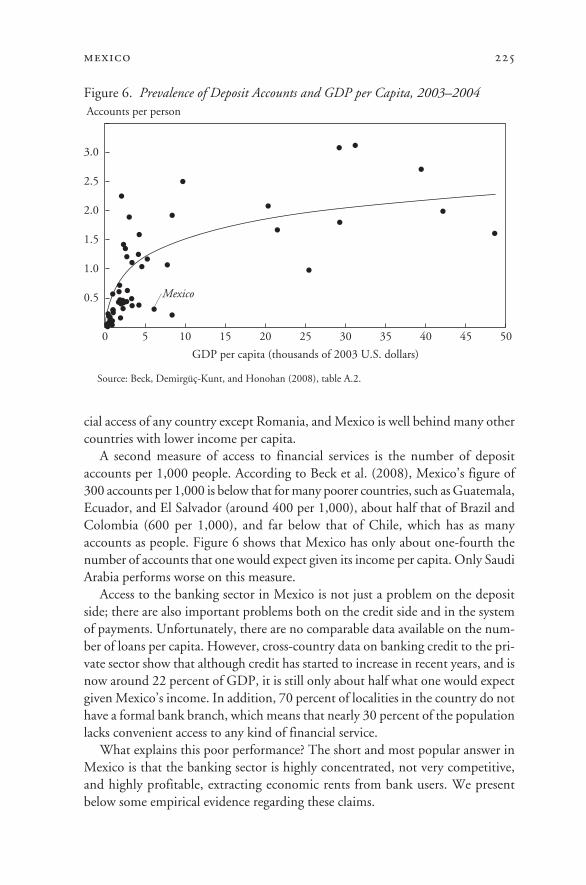
mexico 225
cial access of any country except Romania, and Mexico is well behind many othercountries with lower income per capita.
A second measure of access to financial services is the number of depositaccounts per 1,000 people. According to Beck et al. (2008), Mexico’s figure of300 accounts per 1,000 is below that for many poorer countries, such as Guatemala,Ecuador, and El Salvador (around 400 per 1,000), about half that of Brazil andColombia (600 per 1,000), and far below that of Chile, which has as manyaccounts as people. Figure 6 shows that Mexico has only about one-fourth thenumber of accounts that one would expect given its income per capita. Only SaudiArabia performs worse on this measure.
Access to the banking sector in Mexico is not just a problem on the depositside; there are also important problems both on the credit side and in the systemof payments. Unfortunately, there are no comparable data available on the num-ber of loans per capita. However, cross-country data on banking credit to the pri-vate sector show that although credit has started to increase in recent years, and isnow around 22 percent of GDP, it is still only about half what one would expectgiven Mexico’s income. In addition, 70 percent of localities in the country do nothave a formal bank branch, which means that nearly 30 percent of the populationlacks convenient access to any kind of financial service.
What explains this poor performance? The short and most popular answer inMexico is that the banking sector is highly concentrated, not very competitive,and highly profitable, extracting economic rents from bank users. We presentbelow some empirical evidence regarding these claims.
Figure 6. Prevalence of Deposit Accounts and GDP per Capita, 2003–2004
Source: Beck, Demirgüç-Kunt, and Honohan (2008), table A.2.
Accounts per person
Mexico
GDP per capita (thousands of 2003 U.S. dollars)
0 5 10 15 20 25 30 35 40 45 50
0.5
1.0
1.5
2.0
2.5
3.0
11630-06_CH06_rev2.qxd 6/2/09 4:09 PM Page 225
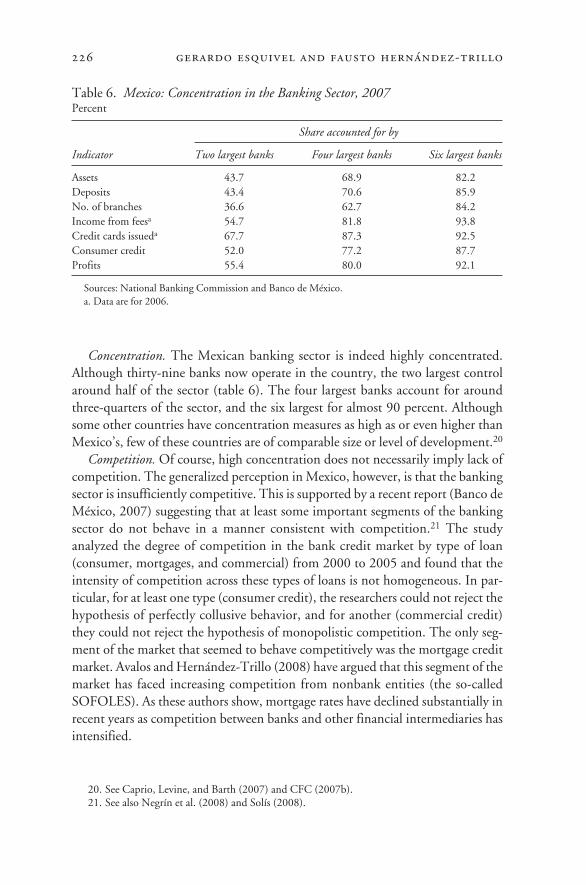
Concentration. The Mexican banking sector is indeed highly concentrated.Although thirty-nine banks now operate in the country, the two largest controlaround half of the sector (table 6). The four largest banks account for aroundthree-quarters of the sector, and the six largest for almost 90 percent. Althoughsome other countries have concentration measures as high as or even higher thanMexico’s, few of these countries are of comparable size or level of development.20
Competition. Of course, high concentration does not necessarily imply lack ofcompetition. The generalized perception in Mexico, however, is that the bankingsector is insufficiently competitive. This is supported by a recent report (Banco deMéxico, 2007) suggesting that at least some important segments of the bankingsector do not behave in a manner consistent with competition.21 The study analyzed the degree of competition in the bank credit market by type of loan (consumer, mortgages, and commercial) from 2000 to 2005 and found that theintensity of competition across these types of loans is not homogeneous. In par-ticular, for at least one type (consumer credit), the researchers could not reject thehypothesis of perfectly collusive behavior, and for another (commercial credit)they could not reject the hypothesis of monopolistic competition. The only seg-ment of the market that seemed to behave competitively was the mortgage creditmarket. Avalos and Hernández-Trillo (2008) have argued that this segment of themarket has faced increasing competition from nonbank entities (the so-calledSOFOLES). As these authors show, mortgage rates have declined substantially inrecent years as competition between banks and other financial intermediaries hasintensified.
226 gerardo esquivel and fausto hernández-trillo
20. See Caprio, Levine, and Barth (2007) and CFC (2007b).21. See also Negrín et al. (2008) and Solís (2008).
Table 6. Mexico: Concentration in the Banking Sector, 2007Percent
Share accounted for by
Indicator Two largest banks Four largest banks Six largest banks
Assets 43.7 68.9 82.2Deposits 43.4 70.6 85.9No. of branches 36.6 62.7 84.2Income from feesa 54.7 81.8 93.8Credit cards issueda 67.7 87.3 92.5Consumer credit 52.0 77.2 87.7Profits 55.4 80.0 92.1
Sources: National Banking Commission and Banco de México.a. Data are for 2006.
11630-06_CH06_rev2.qxd 6/2/09 4:09 PM Page 226
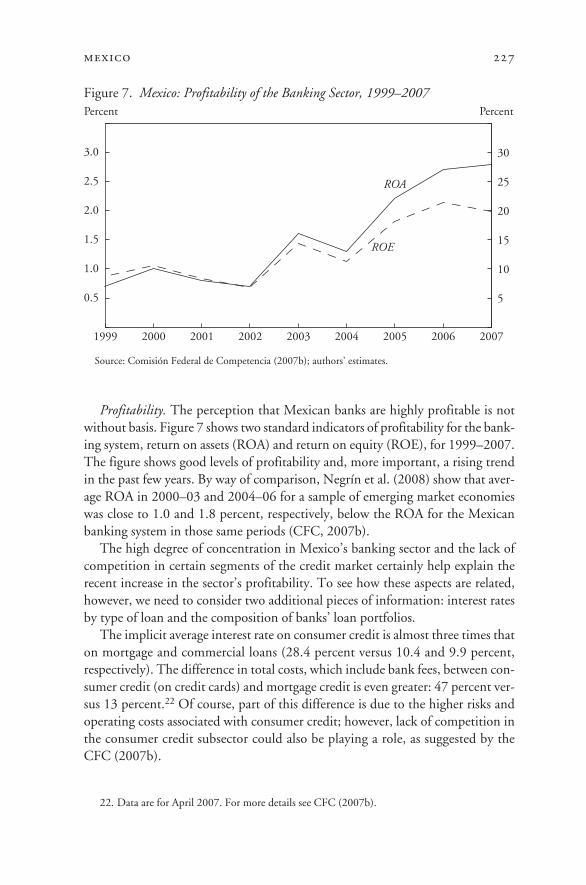
mexico 227
Profitability. The perception that Mexican banks are highly profitable is notwithout basis. Figure 7 shows two standard indicators of profitability for the bank-ing system, return on assets (ROA) and return on equity (ROE), for 1999–2007.The figure shows good levels of profitability and, more important, a rising trendin the past few years. By way of comparison, Negrín et al. (2008) show that aver-age ROA in 2000–03 and 2004–06 for a sample of emerging market economieswas close to 1.0 and 1.8 percent, respectively, below the ROA for the Mexicanbanking system in those same periods (CFC, 2007b).
The high degree of concentration in Mexico’s banking sector and the lack ofcompetition in certain segments of the credit market certainly help explain therecent increase in the sector’s profitability. To see how these aspects are related,however, we need to consider two additional pieces of information: interest ratesby type of loan and the composition of banks’ loan portfolios.
The implicit average interest rate on consumer credit is almost three times thaton mortgage and commercial loans (28.4 percent versus 10.4 and 9.9 percent,respectively). The difference in total costs, which include bank fees, between con-sumer credit (on credit cards) and mortgage credit is even greater: 47 percent ver-sus 13 percent.22 Of course, part of this difference is due to the higher risks andoperating costs associated with consumer credit; however, lack of competition inthe consumer credit subsector could also be playing a role, as suggested by theCFC (2007b).
22. Data are for April 2007. For more details see CFC (2007b).
Figure 7. Mexico: Profitability of the Banking Sector, 1999–2007
Source: Comisión Federal de Competencia (2007b); authors’ estimates.
Percent Percent
0.5
1.0
1.5
2.0
2.5
3.0
ROA
ROE
200720062005200420032002200120001999
5
10
15
20
25
30
11630-06_CH06_rev2.qxd 6/2/09 4:09 PM Page 227
In terms of portfolio composition, it is interesting to see how the Mexicanbanking sector has switched substantial resources away from commercial andmortgage loans and toward consumption lending (the segment in which the sec-tor seems to behave collusively). This segment, which used to represent about5 percent of the banks’ total loan portfolio, now accounts for about one-third.
To sum up, more resources are now devoted to consumer loans, where banksusually charge much higher fees and interest rates, resulting not only in a highlyprofitable banking sector, but also in one where commercial lending has lost rel-evance and where social exclusion is still quite important. In that sense the bank-ing system does not seem to be contributing to the development of the economy;this alone could justify a new financial reform.
Objectives of the Reform and Their Impact on the Foundations for Growth
Financial reform should seek to achieve the following objectives:• Enhance competition (which in turn could have positive effects on compe-
tition in many other sectors).• Increase access to both sides of the industry (deposits and loans), without
compromising financial stability.• Improve conditions of access to financial services and, more important, level
the playing field with respect to access to financial resources.As already mentioned, financial reform along these lines could have a positiveeffect on the following foundations: broad sharing of the benefits of growth, equalopportunities, and greater competition. Appropriate prudential regulation andsupervision are also important, so that achieving these objectives does not harmthe macroeconomic stability foundation.
Achieving the above objectives will undoubtedly have positive effects that gowell beyond the financial sector. Indeed, financial sector reform can be considereda prerequisite to faster economic growth.23 For example, providing greater andbetter access to financial resources for small and medium-size firms may con-tribute to reducing the gap between these and larger firms, which can usually borrow on better terms or in foreign financial markets. In fact, many large non-exporting companies are also in need of domestic currency credit. Leveling theplaying field for small and medium-size firms is therefore crucial so that thesefirms can not only survive, but also invest and grow and become more competi-tive in their own sectors (Beck and Demirgüç-Kunt, 2006).
For microenterprises, the fact of access to financial resources may be even moreimportant than improving the terms of that access. Most microentrepreneurs(60.8 percent) seeking start-up capital resort to their own savings; other sourcesof credit include savings and loan institutions (15.7 percent), friends and relatives
228 gerardo esquivel and fausto hernández-trillo
23. See, for example, Aghion, Howitt, and Mayer-Foulkes (2005).
11630-06_CH06_rev2.qxd 6/2/09 4:09 PM Page 228
mexico 229
24. For more details see Hernandez-Trillo, Pagán, and Paxton (2005).
(13.7 percent), carryover business capital (5.1 percent), moneylenders (2.1 per-cent), and suppliers and clients (2.0 percent). Only 0.6 percent seek financingfrom commercial banks.24
Obstacles to Successful Reform
At least three main local constraints or obstacles stand in the way of successfulreform: the judicial system, competition policy, and the potential for misguideddiagnosis. We review each of these in turn.
The Judicial System. The inefficiency and corruption of the judicial systemthreaten to undermine the efficacy of financial reform. Reform is likely to havebetter results if it is accompanied by a properly functioning judicial system.
An appropriately designed financial system will have a strong influence on theprotection of property rights. Making this happen will require not only sound lawbut also the ability to enforce it. For example, when extending a loan, a bank needsa strong legal and judicial system in order to be able to seize collateral in case ofdefault. Most banking and financial transactions take the form of contracts, whichthe judicial system has to be efficient at enforcing. This is particularly importantin situations of financial distress, when interest rates may become more volatileand financial risks increase. The protection of property rights and the efficiencyof the judicial system are therefore essential conditions for financial reform to beeffective.
The recent literature on financial reform emphasizes the relationship betweenfinancial and legal institutions. For example, Laeven and Majnoni (2005) foundthat an efficient judicial system helps reduce the costs of credit. Beck, Demirgüç-Kunt, and Maksimovic (2005, 2006) found that the interaction between legal andfinancial variables explains firm size in a sample of countries, and that weaknessin these variables may act as a constraint on the growth of small and medium-sizefirms. The interaction between financial reform and judicial reform is importantfor leveling the playing field for smaller firms.
Competition Policy. A strong CFC would be very helpful in implementingfinancial reform in Mexico, since it may have to confront one of the most impor-tant, concentrated, and powerful sectors of the Mexican economy: the banks. Aweak CFC could become an obstacle to successful implementation. It wouldtherefore be highly desirable to proceed with financial reform only after competi-tion policy has been reformed along the lines discussed above. This, however,should not become an impediment to proceeding with this reform.
Errors in Diagnosis. A wrong, incomplete, or misguided diagnosis of the situa-tion could lead to a poorly designed reform. Enhancing competition in the con-sumer credit market is a necessary but not sufficient condition for this reform tobe successful. Although improving the conditions of consumer credit is important
11630-06_CH06_rev2.qxd 6/2/09 4:09 PM Page 229
in and of itself, another fundamental issue should not be overlooked, namely, theneed to promote, through appropriate market incentives and regulations, thechanneling of additional resources toward productive and profitable projects ofsmall and medium-size firms. This is probably one of the most important chan-nels through which the financial sector can have an effect on economic growth,and it should not be underestimated.
Promoting competition in the financial sector actually has several dimensionsthat should be addressed simultaneously: promoting interbank competition, cre-ating a more pro-competitive environment within the banking sector, and pro-moting competition between banks and nonbank institutions in certain areas. Thelast of these is critical, since there is evidence, both international and domestic,that when nonbank institutions are able to contest the monopoly power of banks,margins are reduced and banks behave more competitively. This was the case inthe United States (Allen and Santomero, 2001), where pension and investmentfunds have been the main competitors with banks in recent decades. A similar sit-uation occurred recently in Mexico, where the appearance in 1996 of the institu-tions known as SOFOLES led to a substantial reduction in mortgage interest rates(Avalos and Hernández-Trillo, 2008).
A multidimensional approach to the promotion of competition in the finan-cial sector is justified not only by the evidence described above, but also becausecompetition is necessary to reduce banks’ incentives to use their resources in amanner that is relatively unproductive in terms of social welfare. Almost two-thirds of the profits of the Mexican banking system between 1999 and 2005 camefrom fees, commissions, and investments in securities (mainly government bonds),and only about one-third from interest on loans. Of the latter, almost 70 percentcame from consumer credit, where credit cards are the most important instrument.This means that banks have restricted their activities to those that are either risk-free (securities) or risky but highly profitable (consumer credit). This behavior hasundoubtedly taken a toll on commercial credit, which has largely disappearedfrom bank portfolios.
Of course, such behavior is absolutely rational and consistent with the incen-tives and regulation that banks face. For that reason, competition must be pro-moted on many fronts so that banks return to their original role as financialintermediaries between savers and firms willing to carry out productive and prof-itable projects.
Overcoming the Obstacles
What needs to be done to achieve the objectives of reform and to avoid theobstacles just identified? We offer the following specific suggestions:
• Promote competition throughout the financial sector, and specifically in com-mercial and consumer bank credit. In general, this competition should come fromvarious sources: from a larger number of banks, from a more pro-competitive envi-
230 gerardo esquivel and fausto hernández-trillo
11630-06_CH06_rev2.qxd 6/2/09 4:09 PM Page 230
mexico 231
ronment within the banking sector, and from nonbanking institutions. The fol-lowing are specific proposals in this direction.
• Reduce barriers to entry. Even after a recent 11 percent reduction, Mexico’sinitial capital requirements for new banks remain among the highest in the world,at around $330 million. As the CFC (2007b) has noted, this is about nine timesthe amount required in Canada, five times that in Europe, four times that in Chileand Brazil, and more than twice that in Japan. Although the so-called niche banksnow have separate requirements starting as low as $130 million, this is still a highfigure and may act as an important barrier to entry.
• Develop an appropriate framework of regulatory and prudential supervision forniche banks. This new type of bank was approved with a modification to the Lawof Credit Institutions in mid-2006. However, as of May 2008 the financialauthorities had not yet developed an appropriate regulatory framework for theseinstitutions. As a consequence, although many applications have been submitted,none has yet been approved. It is urgent that the appropriate regulatory frame-work for these banks be put in place.
• Improve the competitive environment in the banking sector. This could requirea much more decisive intervention by the competition authorities on issues suchas collusion in the consumer credit market, as well as in the determination ofbanking fees, which today appear quite high. If the competition authorities areunable to intervene directly and establish sanctions for noncompetitive behaviorin this sector, because of the absence of further competition policy reform, thencompelling testimony on this issue like that offered in CFC (2007b) could be veryhelpful in convincing the financial authorities to intervene.
• Promote the development of nonbank financial institutions. It has been shownthat when banks face competition, either from other banks or from other finan-cial intermediaries, they react as one would expect: they reduce their margins andcompete on the basis of both price and quality of service. It is therefore essentialto promote the development of new financial institutions.
• Eliminate or reduce monopoly power in certain activities. For example, thereseem to be important barriers to entry into specific activities such as credit cardissuance and government bond sales. Recently, some retail stores such as Wal-Mart have opened their own banks in order to participate in the consumercredit market, and in particular the credit card market. Although this outcome isdesirable from the point of view of greater competition, it raises an importantquestion: should it be necessary to become a formal bank in order to get access tothe credit card market? We believe that lowering barriers to entry into the creditcard industry is necessary. A similar story applies to government bond sales. Mostfinancial institutions require a minimum purchase of between $30,000 and$50,000. Of course, this excludes small savers from the market, who must thenpurchase mutual funds, where high fees and commissions are charged, in order toparticipate. Here a scheme similar to that in the United States could be imple-
11630-06_CH06_rev2.qxd 6/2/09 4:09 PM Page 231
232 gerardo esquivel and fausto hernández-trillo
mented, where government bonds are sold even over the Internet and participantscan invest as little as $1,000.
Conclusions
In this chapter we have analyzed the relationship between economic reform and eco-nomic growth in Mexico. We have discussed why some of the reforms of the 1980sand 1990s might have failed to generate rapid and sustained economic growth. Weargue that the main reason was that some of the reforms did not positively affectthe foundations for growth in Mexico, either because they were not intended todo so or because they failed in their design or implementation. That was the casewith both privatization and pension reform and, to a much lesser extent, withtrade liberalization. These outcomes, together with a negative popular perceptionof the reforms and the emergence of a more complex political environment, havegiven rise to reform inaction and reform fatigue in Mexico since the late 1990s.
The second part of the chapter analyzed how this inaction might be overcome,and how some specific reforms might help to restore economic growth in Mex-ico. We proposed and discussed reforms in three areas—legal reform, competi-tion policy reform, and financial reform—that we believe are politically viable andthat should positively affect the weakest foundations for growth in Mexico. Thesereforms, besides being relevant in their own right, may also help some of the ear-lier reforms work better. The proposed reforms may also interact with and rein-force each other, and together they could have a positive effect on the foundationsfor growth of the Mexican economy.
References
Aghion, Phillip, Peter Howitt, and David Mayer-Foulkes. 2005. “The Effect of FinancialDevelopment on Convergence: Theory and Evidence.” Quarterly Journal of Economics 120(February): 173–222.
Allen, Franklin, and Anthony M. Santomero. 2001. “What Do Financial Intermediaries Do?”Journal of Banking and Finance 25, no. 2 (February): 271–94.
Aspe, Pedro. 1993. Economic Transformation the Mexican Way. Lionel Robbins Lectures. MITPress.
Avalos, Marcos, and Rafael De Hoyos. 2008. “An Empirical Analysis of Mexican Merger Pol-icy.” Policy Research Working Paper 4527. Washington: World Bank.
Avalos, Marcos, and Fausto Hernández-Trillo. 2008. “Competencia Bancaria en México.” InE. Rivera and C. Schatan, eds., Centroamérica y México: Políticas de Competencia a Princip-ios del Siglo XXI. Mexico City: CEPAL.
Banco de México. 2007. Reporte sobre el Sistema Financiero 2006. Mexico City.Beck, Thorsten, and Asli Demirgüç-Kunt. 2006. “Small and Medium-Size Enterprises: Access
to Finance as a Growth Constraint.” Journal of Banking and Finance 30, no. 11: 2931–43.Beck, Thorsten, Asli Demirgüç-Kunt, and Patrick Honohan. 2008. Finance for All: Policies and
Pitfalls in Expanding Access. World Bank Policy Research Report. Washington: World Bank.
11630-06_CH06_rev2.qxd 6/2/09 4:09 PM Page 232
mexico 233
Beck, T., A. Demirgüç-Kunt, and V. Maksimovic. 2005. “Financial and Legal Constraints toGrowth: Does Firm Size Matter?” Journal of Finance 40, no. 1: 137–77.
———. 2006. “The Influence of Financial and Legal Insitutions on Firm Size.” Journal ofBanking and Finance 30: 2995–3015.
Berg, Andy, Jonathan Ostry, and Jeromin Zettelmeyer. 2006. “What Makes Growth Sus-tained?” Washington: International Monetary Fund.
Borraz, Fernando, and J. E. López-Córdova. 2007. “Has Globalization Deepened IncomeInequality in Mexico?” Global Economy Journal (International Trade and Finance Associa-tion) 7, no. 1: 1–55.
Caprio, G., R. E. Levine, and J. R. Barth. 2007. “Bank Regulation and Supervision Database.”Washington: World Bank.
Chong, Alberto, and Florencio López-de-Silanes. 2005. “Privatization in Mexico.” In Privati-zation in Latin America: Myths and Reality. Stanford University Press and Inter-AmericanDevelopment Bank.
Comisión Federal de Competencia (CFC). 2006. “Opinión con el Fin de Promover la Apli-cación de los Principios de Competencia y de Libre Concurrencia en el Sistema de Ahorropara el Retiro (SAR).” Mexico City (November).
———. 2007a. Annual Report 2006. Mexico City.———. 2007b. “Opinión con el Fin de Promover la Aplicación de los Principios de Compe-
tencia y de Libre Concurrencia en los Servicios Bancarios al Menudeo.” Mexico City (April).Davies, Stephen W., and Nigel L. Driffield. 1998. Monopoly Policy in the UK: Assessing the Evi-
dence. Cheltenham, U.K.: Edward Elgar.Del Villar, Rafael. 2007. “Competencia y Equidad en Telecomunicaciones.” Banco de México,
Mexico City (November).Dollar, David, and Aart Kraay. 2002. “Growth Is Good for the Poor.” Journal of Economic
Growth 7, no. 3: 195–225.Dutz, Mark, and Aydin Hayri. 2000. “Does More Intense Competition Lead to Higher
Growth?” Policy Research Working Paper 2320. Washington: World Bank.Easterly, William, Norbert Fiess, and Daniel Lederman. 2003. “NAFTA and Convergence in
North America: High Expectations, Big Events, Little Time.” Economia 4, no. 1: 1–54.Elizondo, Carlos, and Luis M. Pérez. 2006. “Separación de Poderes y Garantìas Individuales:
La Suprema Corte y los Derechos de los Contribuyentes.” Cuestiones Constitucionales: RevistaMexicana de Derecho Constitucional 14: 91–130.
Enrigue, Hilda G. 2006. “La Suprema Corte y la Desigualdad en el Acceso a la Justicia: ¿A QuiénSirve el Amparo en Materia Fiscal?” Thesis, Instituto Tecnológico Autónomo de México.
Escaith, Hubert, and Igor Paunovic. 2004. “Reformas Estructurales en América Latina y elCaribe en el Periodo 1970–2000: Indices y Notas Metodológicas.” Documento ElectrónicoLC/W.10. Santiago, Chile: CEPAL (October).
Esquivel, Gerardo. 2008. “The Dynamics of Income Inequality in Mexico since NAFTA.” ElColegio de México.
Esquivel, Gerardo, Daniel Lederman, Miguel Messmacher, and Renata Villoro. 2002. “WhyNAFTA Did Not Reach the South.” Office of the Chief Economist for Latin America andthe Caribbean, World Bank, Washington.
Fisher, Franklin M. 1987. “Horizontal Mergers: Triage and Treatment.” Journal of EconomicPerspectives 1, no. 2: 23–40.
García-Verdú, Rodrigo. 2007. “Demographics, Human Capital and Economic Growth inMexico: 1950–2005.” World Bank, Washington (June).
Gil-Díaz, Francisco. 2003. “Don’t Blame Our Failures on Reforms That Have Not TakenPlace.” In Fraser Forum. Calgary, Alberta, Canada: Fraser Institute.
11630-06_CH06_rev2.qxd 6/2/09 4:09 PM Page 233
Grandolini, Gloria, and Luis Cerda. 1998. “The 1997 Pension Reform in México.” PolicyResearch Working Paper 1933. Washington: World Bank.
Guasch, J. Luis. 2004. “Confirming Anecdote and Theory: Empirical Analysis of the Determi-nants of Renegotiation.” In J. L. Guasch, Granting and Renegotiating Infrastructure Conces-sions, chapter 6. WBI Development Studies. Washington: World Bank.
Gwartney, James, and Robert Lawson. 2007. Economic Freedom of the World 2007 AnnualReport. Economic Freedom Network.
Haber, Stephen. 2005. “Mexico’s Experiments with Bank Privatization and Liberalization,1991–2003.” Journal of Banking and Finance 29: 2325–53.
Hellman, Joel S. 1998. “Winners Take All: The Politics of Partial Reform in PostcommunistTransitions.” World Politics 50, no. 2: 203–34.
Hernández Ochoa, César E. 2006. “La Seguridad Jurídica en México: Seis Problemas y SeisPropuestas de Solución.” Mexico City: Centro de Investigación para el Desarrollo.
Hernández-Trillo, Fausto, José A. Pagán, and Julia Paxton. 2005. “Start-up Capital, Micro-enterprises and Technical Efficiency in Mexico.” Review of Development Economics 9, no. 3:434–47.
Heston, Alan, Robert Summers, and Bettina Aten. 2006. Penn World Table Version 6.2. Cen-ter for International Comparisons of Production, Income, and Prices at the University ofPennsylvania (September).
Krakowski, Michael. 2005. “Competition Policy Works: The Effect of Competition Policy onthe Intensity of Competition: An International Cross-Country Comparison.” HWWA Dis-cussion Paper 332. Hamburg Institute of International Economics.
Laeven, Luc, and Giovanni Majnoni. 2005. “Does Judicial Efficiency Lower the Cost ofCredit?” Journal of Banking and Finance 29, no. 7: 1791–1812.
Laeven, Luc, and Christopher Woodruff. 2007. “The Quality of the Legal System, Firm Own-ership and Firm Size.” Review of Economics and Statistics 89, no. 4: 601–14.
Laporta, Rafael, Florencio López-de-Silanes, and Guillermo Zamarripa. 2003. “Related Lend-ing.” Quarterly Journal of Economics 118, no. 1: 231–68.
Lederman, Daniel, William F. Maloney, and Luis Servén. 2005. Lessons from NAFTA. StanfordUniversity Press and World Bank.
Lehoucq, F., G. Negretto, F. Aparicio, B. Nacif, and A. Benton. 2005. “Political Institutions,Policymaking Processes, and Policy Outcomes in Mexico.” Working Paper R-512. Wash-ington: Inter-American Development Bank (September).
Loayza, Norman, Pablo Fajnzylber, and César Calderón. 2005. “Economic Growth in LatinAmerica and the Caribbean: Stylized Facts, Explanations and Forecasts.” World Bank LatinAmerican and the Caribbean Studies. Washington (April).
López Ayllón, Sergio, and Héctor Fix-Fierro. 2003. “‘Faraway, So Close!’ The Rule of Law andLegal Change in Mexico, 1970–2000.” In Lawrence M. Friedman and Rogelio Pérez-Perdomo, eds., Legal Culture in the Age of Globalization: Latin America and Latin Europe.Stanford University Press.
López-Córdova, José E. 2003. “NAFTA and Manufacturing Productivity in Mexico.”Economía 4, no. 1: 55–88.
Lustig, Nora. 1998. Mexico: The Remaking of an Economy, 2nd ed. Brookings.Magaloni, Ana Laura, and Layda Negrete. 2000. “Desafueros del Poder: La Política Judicial de
Decidir sin Resolver.” Trayectorias: Revista de Ciencias Sociales de la Universidad Autónomade Nuevo León, México no. 2.
Morley S., R. Machado, and S. Pettinato. 1999. “Indexes of Structural Reform in Latin Amer-ica.” Serie Reformas Económicas 12. Santiago, Chile: ECLAC.
Munguía, Luis. 2008. “Crecimiento Económico y Desigualdad de Ingresos en México.” Thesis, El Colegio de México.
234 gerardo esquivel and fausto hernández-trillo
11630-06_CH06_rev2.qxd 6/2/09 4:09 PM Page 234
mexico 235
Murillo, José Antonio. 2005. “La Banca Después de la Privatización. Auge, Crisis y Reorde-namiento.” In G. del Angel-Mobarak, C. Bazdresch, and F. Suárez, eds., Cuando el Estado seHizo Banquero. Mexico City: Fondo de Cultura Económica.
Negrín, J. L., E. Bátiz, D. Ocampo, and P. Struck. 2008. “Competition in the Mexican Bank-ing Credit Market.” Banco de México, Mexico City.
Nohlen, Dieter. (2005). “Mexico.” In D. Nohlen, ed., Election in the Americas: A Data Hand-book. Vol. 1. Oxford: Oxford University Press.
Organization for Economic Cooperation and Development. 2004. Report on Regulatory Reform:Regulatory Reform in Mexico. Paris.
———. 2006. OECD Economic Outlook. Paris.Paredes, Víctor. 2007. Privatización de Puertos en México. Estudios de Competencia y Regu-
lación. Mexico City: Centro de Investigación para el Desarrollo.Rivera, Eugenio, and Claudia Schatan. 2008. “Los Mercados en el Istmo Centroamericano y
México: ¿Qué Ha Pasado con la Competencia?” In E. Rivera and C. Schatan, eds., Cen-troamérica y México: Políticas de Competencia a Principios del Siglo XXI. Santiago, Chile:CEPAL.
Rogozinski, Jacques. 1998. High Price for Change: Privatization in Mexico. Washington: Inter-American Development Bank.
Sachs, Jeffrey D., Aarón Tornell, and Andrés Velasco. 1996. “Financial Crises in EmergingMarkets: The Lessons from 1995.” Brookings Papers on Economic Activity no. 1 (Spring).
Sinha, Tapen, and Alejandro Rentería. 2005. “The Cost of Minimum Pension Guarantee.”Instituto Tecnológico Autónomo de México.
Solís, Liliana. 2008. “Analysis of Banking Competition in Mexico.” Ph.D. dissertation. Uni-versidad Complutense de Madrid.
Stephanou, Constantinos, and Emanuel Salinas. 2007. “Financing of the Private Sector in Mex-ico, 2000–2005: Evolution, Composition and Determinants.” Policy Research WorkingPaper 4264. Washington: World Bank (June).
Székely, Miguel. 2005. “Pobreza y Desigualdad en México entre 1950 y 2004.” El TrimestreEconómico 72, no. 288 (October-December).
Tornell, Aarón, and Gerardo Esquivel. 1997. “The Political Economy of Mexico’s Entry intoNAFTA.” In T. Ito and A. O. Krueger, eds., Regionalism versus Multilateral Trade Arrange-ments. University of Chicago Press.
Tornell, Aaron, Frank Westermann, and Lorenza Martinez-Trigueros. 2004. “NAFTA andMexico’s Less-Than-Stellar Performance.” Working Paper 10289. Cambridge, Mass.:National Bureau of Economic Research.
Zettelmeyer, Jeromin. 2006. “Growth and Reforms in Latin America: A Survey of Facts and Arguments.” Working Paper WP/06/210. Washington: International Monetary Fund(September).
11630-06_CH06_rev2.qxd 6/2/09 4:09 PM Page 235
236
The performance of the Peruvian economy in the last half century has beenless than stellar in terms of achieving inclusive growth, even during the
recent boom. Although Peru has had spells of faster growth than the rest of theregion, none lasted long enough to significantly reduce poverty and inequality.For decades the majority of Peruvians have lived at or below the poverty line, andin the past twenty years social and economic inequalities have worsened, fuelingsocial discontent and leading to calls for radical change.
This is not to say that major economic reforms have not been attempted. Onthe contrary, dramatic swings between market-oriented and state-oriented poli-cies have been part of the problem. In the late 1960s and the 1970s, a military-led “revolution” attempted radical transformation of the country’s inequitableeconomic and social structures, but internal and external crises put an end to thatexperiment. In the 1980s the introduction of more heterodox policies ended updeepening the economic crisis and fomenting political violence. This episode wasfollowed by dramatic, market-oriented reforms under more authoritarian rule inthe 1990s; these, too, ultimately failed to put the country on a more sustained and
Helping Reforms Deliver Inclusive Growth in Perueduardo morón, juan francisco castro, and cynthia sanborn
7
We wish to acknowledge a very thoughtful discussion of an earlier version of this documentwith Martín Benavides, Mauricio Cárdenas, Elmer Cuba, Eduardo Fernández-Arias, Ana MaríaRodriguez, Mayen Ugarte, and Gustavo Yamada. As usual, these are our personal opinions andshould not necessarily be taken as the institutional view of the Centro de Investigación de la Uni-versidad del Pacífico.
11630-07_CH07_rev2.qxd 6/2/09 3:59 PM Page 236
peru 237
inclusive growth path. Growth in both decades was even more volatile than in theregion as a whole. Peru’s most recent growth spurt, which began in 2002, hasoccurred in the context of a world economic upturn of uncertain duration, accom-panied by a revival of political movements denouncing the lack of “trickle down”and advocating a return to more statist and nationalist policies.
This chapter uses the CGD framework to evaluate Peru’s recent reform effortsand determine their impact on the foundations for inclusive growth, and to ana-lyze how to proceed with further reform. To many observers, Peru today seemsready to join the ranks of Chile and Mexico, countries that have achieved consid-erable macroeconomic stability and embarked on a positive growth path. How-ever, we will argue that Peru still faces significant obstacles to truly inclusivegrowth.
The chapter is organized as follows. In the next section we present some styl-ized facts on growth, poverty, and inequality in Peru. We then discuss which ofthe growth foundations were addressed and which were ignored in the reforms ofrecent decades, and we select three areas for further analysis—public administra-tion reform, education reform, and political reform—that we believe are largely“missing ingredients” in Peru’s reform recipe to date. After summarizing thereforms of the 1990s, we discuss each of the above three areas in detail, analyzingtheir impact on the growth foundations. The final section offers some conclud-ing remarks.
Growth, Poverty, and Inequality: Some Stylized Facts
A key difference between Peru and other countries in the region is that Perureformed late, and when it did reform, often went to extremes (Frieden, 2007).But Peru’s reforms were not those of the Washington consensus, but rather morefundamental political and social reforms, involving the creation of a legitimatenational state and national identity, the extension of the voting franchise to alladults, basic land and labor reforms, and the provision of public education andhealth services, among others. Economic growth in the early twentieth centuryhad not resulted in the development and modernization of the country’s ruralareas, even when the sources of growth were located there. Economic and politi-cal power has always been concentrated in Lima; indeed, one notable characteris-tic of the country is the absence of other large cities.
Through most of the twentieth century, political exclusion and economic andsocial exclusion ran in parallel. During much of its history since independence, Peruhas been under military dictatorship; full political democracy with universal suffragewas achieved only in 1980. Throughout its modern history, Peru has had only onestrong political party, the Alianza Popular Revolucionaria Americana (APRA),which for long periods operated secretively. The party system has remained weakand fragmented, based on individual caudillos (strongmen) rather than lasting
11630-07_CH07_rev2.qxd 6/2/09 3:59 PM Page 237
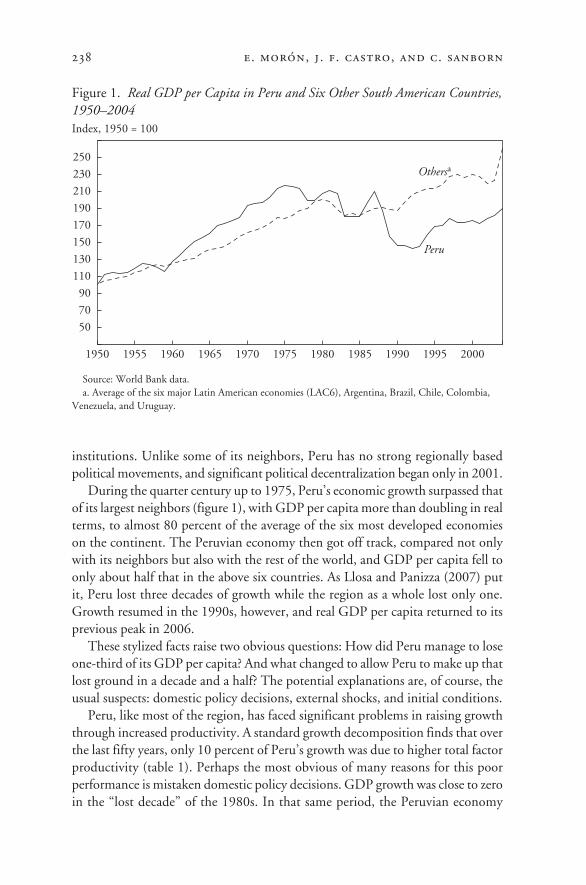
institutions. Unlike some of its neighbors, Peru has no strong regionally basedpolitical movements, and significant political decentralization began only in 2001.
During the quarter century up to 1975, Peru’s economic growth surpassed thatof its largest neighbors (figure 1), with GDP per capita more than doubling in realterms, to almost 80 percent of the average of the six most developed economieson the continent. The Peruvian economy then got off track, compared not onlywith its neighbors but also with the rest of the world, and GDP per capita fell toonly about half that in the above six countries. As Llosa and Panizza (2007) putit, Peru lost three decades of growth while the region as a whole lost only one.Growth resumed in the 1990s, however, and real GDP per capita returned to itsprevious peak in 2006.
These stylized facts raise two obvious questions: How did Peru manage to loseone-third of its GDP per capita? And what changed to allow Peru to make up thatlost ground in a decade and a half? The potential explanations are, of course, theusual suspects: domestic policy decisions, external shocks, and initial conditions.
Peru, like most of the region, has faced significant problems in raising growththrough increased productivity. A standard growth decomposition finds that overthe last fifty years, only 10 percent of Peru’s growth was due to higher total factorproductivity (table 1). Perhaps the most obvious of many reasons for this poorperformance is mistaken domestic policy decisions. GDP growth was close to zeroin the “lost decade” of the 1980s. In that same period, the Peruvian economy
238 e. morón, j. f. castro, and c. sanborn
Figure 1. Real GDP per Capita in Peru and Six Other South American Countries,1950–2004
Source: World Bank data.a. Average of the six major Latin American economies (LAC6), Argentina, Brazil, Chile, Colombia,
Venezuela, and Uruguay.
Index, 1950 = 100
50
70
90
110
130
150
170
190
210
230
250Othersa
Peru
20001995199019851980197519701965196019551950
11630-07_CH07_rev2.qxd 6/2/09 3:59 PM Page 238
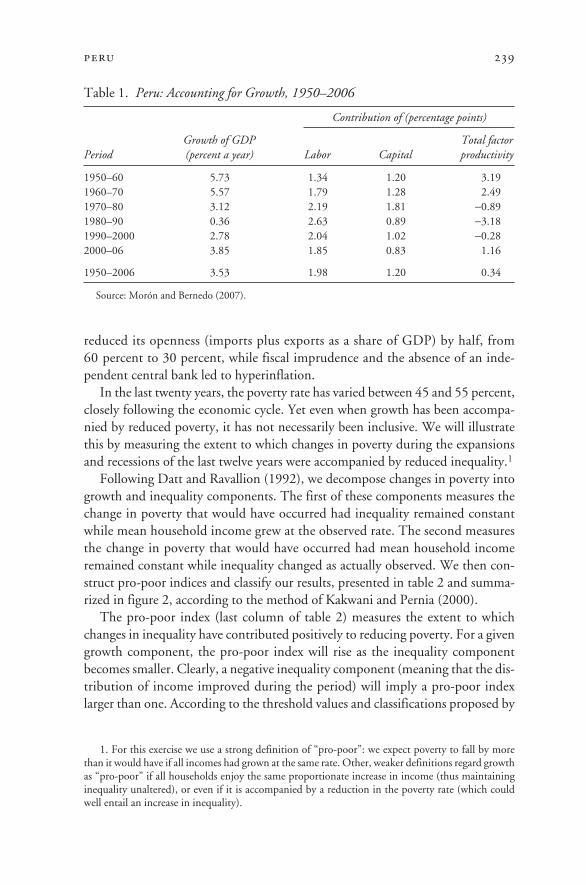
peru 239
1. For this exercise we use a strong definition of “pro-poor”: we expect poverty to fall by morethan it would have if all incomes had grown at the same rate. Other, weaker definitions regard growthas “pro-poor” if all households enjoy the same proportionate increase in income (thus maintaininginequality unaltered), or even if it is accompanied by a reduction in the poverty rate (which couldwell entail an increase in inequality).
reduced its openness (imports plus exports as a share of GDP) by half, from 60 percent to 30 percent, while fiscal imprudence and the absence of an inde-pendent central bank led to hyperinflation.
In the last twenty years, the poverty rate has varied between 45 and 55 percent,closely following the economic cycle. Yet even when growth has been accompa-nied by reduced poverty, it has not necessarily been inclusive. We will illustratethis by measuring the extent to which changes in poverty during the expansionsand recessions of the last twelve years were accompanied by reduced inequality.1
Following Datt and Ravallion (1992), we decompose changes in poverty intogrowth and inequality components. The first of these components measures thechange in poverty that would have occurred had inequality remained constantwhile mean household income grew at the observed rate. The second measuresthe change in poverty that would have occurred had mean household incomeremained constant while inequality changed as actually observed. We then con-struct pro-poor indices and classify our results, presented in table 2 and summa-rized in figure 2, according to the method of Kakwani and Pernia (2000).
The pro-poor index (last column of table 2) measures the extent to whichchanges in inequality have contributed positively to reducing poverty. For a givengrowth component, the pro-poor index will rise as the inequality componentbecomes smaller. Clearly, a negative inequality component (meaning that the dis-tribution of income improved during the period) will imply a pro-poor indexlarger than one. According to the threshold values and classifications proposed by
Table 1. Peru: Accounting for Growth, 1950–2006
Contribution of (percentage points)
Growth of GDP Total factor Period (percent a year) Labor Capital productivity
1950–60 5.73 1.34 1.20 3.191960–70 5.57 1.79 1.28 2.491970–80 3.12 2.19 1.81 −0.891980–90 0.36 2.63 0.89 −3.181990–2000 2.78 2.04 1.02 −0.282000–06 3.85 1.85 0.83 1.16
1950–2006 3.53 1.98 1.20 0.34
Source: Morón and Bernedo (2007).
11630-07_CH07_rev2.qxd 6/2/09 3:59 PM Page 239
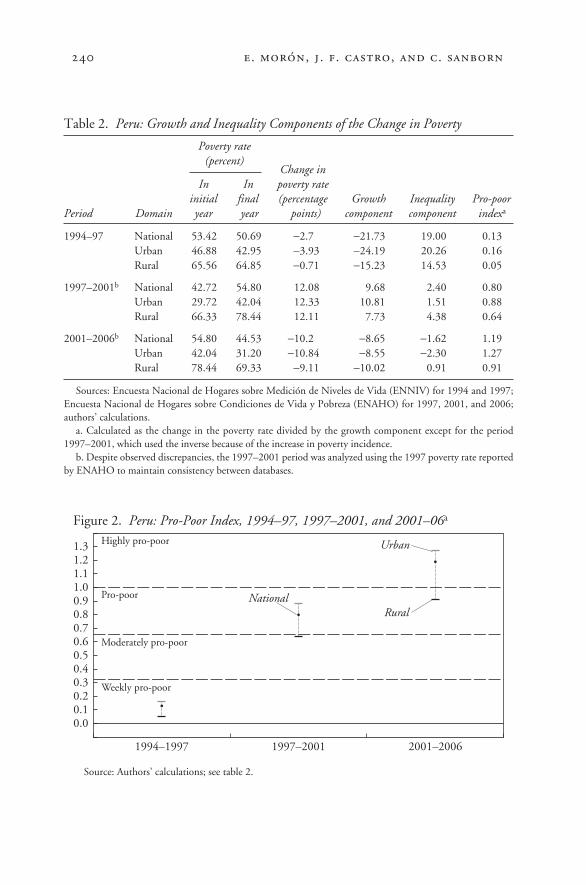
240 e. morón, j. f. castro, and c. sanborn
Figure 2. Peru: Pro-Poor Index, 1994–97, 1997–2001, and 2001–06a
Table 2. Peru: Growth and Inequality Components of the Change in Poverty
Change inIn In poverty rate
initial final (percentage Growth Inequality Pro-poorPeriod Domain year year points) component component indexa
1994–97 National 53.42 50.69 −2.7 −21.73 19.00 0.13Urban 46.88 42.95 −3.93 −24.19 20.26 0.16Rural 65.56 64.85 −0.71 −15.23 14.53 0.05
1997–2001b National 42.72 54.80 12.08 9.68 2.40 0.80Urban 29.72 42.04 12.33 10.81 1.51 0.88Rural 66.33 78.44 12.11 7.73 4.38 0.64
2001–2006b National 54.80 44.53 −10.2 −8.65 −1.62 1.19Urban 42.04 31.20 −10.84 −8.55 −2.30 1.27Rural 78.44 69.33 −9.11 −10.02 0.91 0.91
Sources: Encuesta Nacional de Hogares sobre Medición de Niveles de Vida (ENNIV) for 1994 and 1997;Encuesta Nacional de Hogares sobre Condiciones de Vida y Pobreza (ENAHO) for 1997, 2001, and 2006;authors’ calculations.
a. Calculated as the change in the poverty rate divided by the growth component except for the period1997–2001, which used the inverse because of the increase in poverty incidence.
b. Despite observed discrepancies, the 1997–2001 period was analyzed using the 1997 poverty rate reportedby ENAHO to maintain consistency between databases.
Poverty rate (percent)
Source: Authors’ calculations; see table 2.
0.00.10.20.30.40.50.60.70.80.91.01.11.21.3 Urban
Rural
Weekly pro-poor
Moderately pro-poor
Pro-poor
Highly pro-poor
National
2001–20061997–20011994–1997
11630-07_CH07_rev2.qxd 6/2/09 3:59 PM Page 240
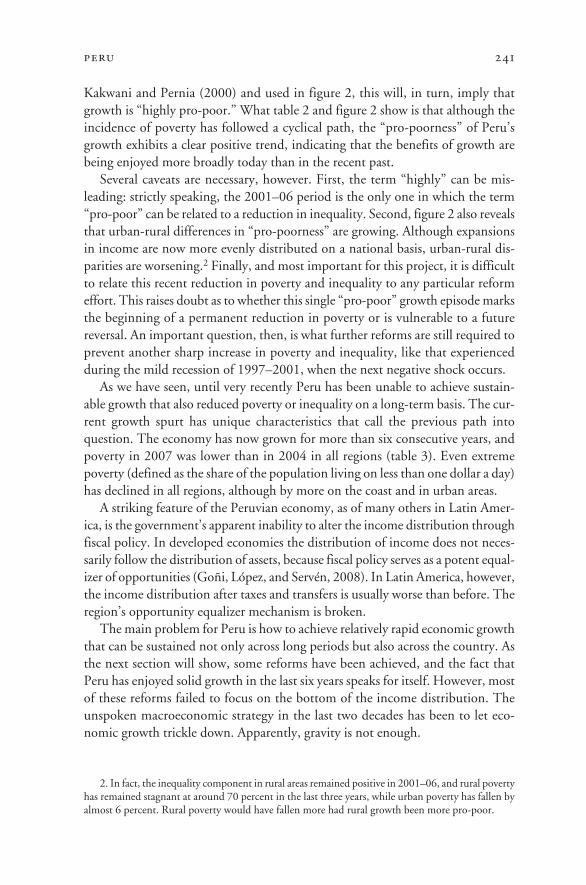
peru 241
Kakwani and Pernia (2000) and used in figure 2, this will, in turn, imply thatgrowth is “highly pro-poor.” What table 2 and figure 2 show is that although theincidence of poverty has followed a cyclical path, the “pro-poorness” of Peru’sgrowth exhibits a clear positive trend, indicating that the benefits of growth arebeing enjoyed more broadly today than in the recent past.
Several caveats are necessary, however. First, the term “highly” can be mis-leading: strictly speaking, the 2001–06 period is the only one in which the term“pro-poor” can be related to a reduction in inequality. Second, figure 2 also revealsthat urban-rural differences in “pro-poorness” are growing. Although expansionsin income are now more evenly distributed on a national basis, urban-rural dis-parities are worsening.2 Finally, and most important for this project, it is difficultto relate this recent reduction in poverty and inequality to any particular reformeffort. This raises doubt as to whether this single “pro-poor” growth episode marksthe beginning of a permanent reduction in poverty or is vulnerable to a futurereversal. An important question, then, is what further reforms are still required toprevent another sharp increase in poverty and inequality, like that experiencedduring the mild recession of 1997–2001, when the next negative shock occurs.
As we have seen, until very recently Peru has been unable to achieve sustain-able growth that also reduced poverty or inequality on a long-term basis. The cur-rent growth spurt has unique characteristics that call the previous path intoquestion. The economy has now grown for more than six consecutive years, andpoverty in 2007 was lower than in 2004 in all regions (table 3). Even extremepoverty (defined as the share of the population living on less than one dollar a day)has declined in all regions, although by more on the coast and in urban areas.
A striking feature of the Peruvian economy, as of many others in Latin Amer-ica, is the government’s apparent inability to alter the income distribution throughfiscal policy. In developed economies the distribution of income does not neces-sarily follow the distribution of assets, because fiscal policy serves as a potent equal-izer of opportunities (Goñi, López, and Servén, 2008). In Latin America, however,the income distribution after taxes and transfers is usually worse than before. Theregion’s opportunity equalizer mechanism is broken.
The main problem for Peru is how to achieve relatively rapid economic growththat can be sustained not only across long periods but also across the country. Asthe next section will show, some reforms have been achieved, and the fact thatPeru has enjoyed solid growth in the last six years speaks for itself. However, mostof these reforms failed to focus on the bottom of the income distribution. Theunspoken macroeconomic strategy in the last two decades has been to let eco-nomic growth trickle down. Apparently, gravity is not enough.
2. In fact, the inequality component in rural areas remained positive in 2001–06, and rural povertyhas remained stagnant at around 70 percent in the last three years, while urban poverty has fallen byalmost 6 percent. Rural poverty would have fallen more had rural growth been more pro-poor.
11630-07_CH07_rev2.qxd 6/2/09 3:59 PM Page 241
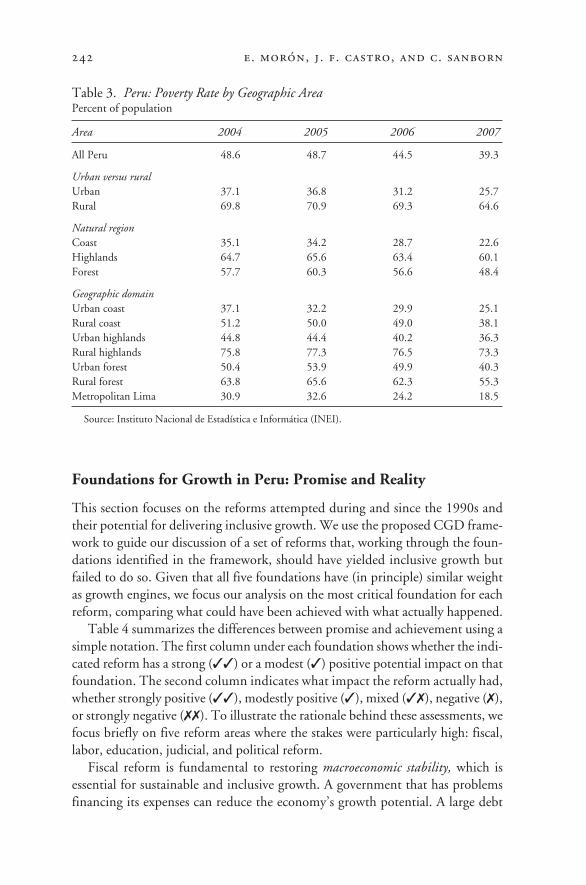
Foundations for Growth in Peru: Promise and Reality
This section focuses on the reforms attempted during and since the 1990s andtheir potential for delivering inclusive growth. We use the proposed CGD frame-work to guide our discussion of a set of reforms that, working through the foun-dations identified in the framework, should have yielded inclusive growth butfailed to do so. Given that all five foundations have (in principle) similar weightas growth engines, we focus our analysis on the most critical foundation for eachreform, comparing what could have been achieved with what actually happened.
Table 4 summarizes the differences between promise and achievement using asimple notation. The first column under each foundation shows whether the indi-cated reform has a strong (✓✓) or a modest (✓) positive potential impact on thatfoundation. The second column indicates what impact the reform actually had,whether strongly positive (✓✓), modestly positive (✓), mixed (✓✗), negative (✗),or strongly negative (✗✗). To illustrate the rationale behind these assessments, wefocus briefly on five reform areas where the stakes were particularly high: fiscal,labor, education, judicial, and political reform.
Fiscal reform is fundamental to restoring macroeconomic stability, which isessential for sustainable and inclusive growth. A government that has problemsfinancing its expenses can reduce the economy’s growth potential. A large debt
242 e. morón, j. f. castro, and c. sanborn
Table 3. Peru: Poverty Rate by Geographic AreaPercent of population
Area 2004 2005 2006 2007
All Peru 48.6 48.7 44.5 39.3
Urban versus ruralUrban 37.1 36.8 31.2 25.7Rural 69.8 70.9 69.3 64.6
Natural regionCoast 35.1 34.2 28.7 22.6Highlands 64.7 65.6 63.4 60.1Forest 57.7 60.3 56.6 48.4
Geographic domainUrban coast 37.1 32.2 29.9 25.1Rural coast 51.2 50.0 49.0 38.1Urban highlands 44.8 44.4 40.2 36.3Rural highlands 75.8 77.3 76.5 73.3Urban forest 50.4 53.9 49.9 40.3Rural forest 63.8 65.6 62.3 55.3Metropolitan Lima 30.9 32.6 24.2 18.5
Source: Instituto Nacional de Estadística e Informática (INEI).
11630-07_CH07_rev2.qxd 6/2/09 3:59 PM Page 242
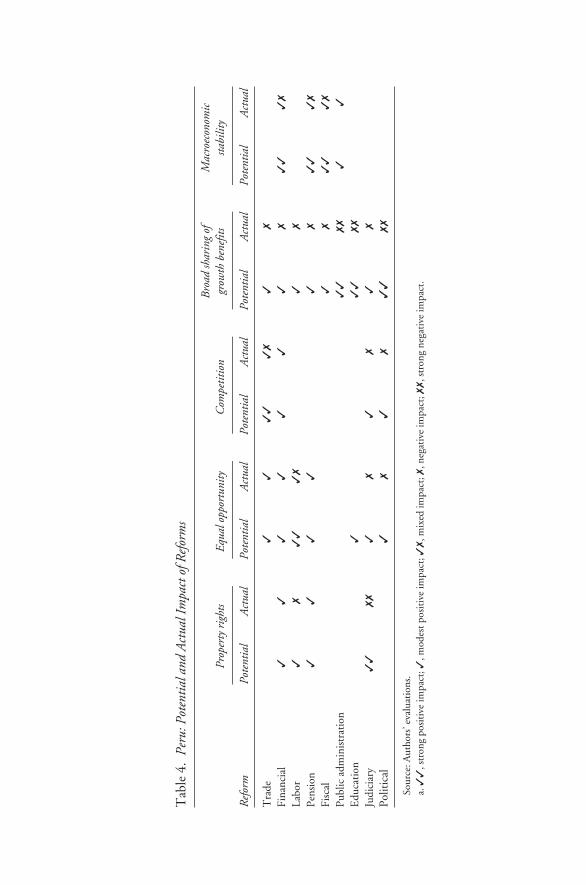
Tab
le 4
.Pe
ru: P
oten
tial a
nd A
ctua
l Im
pact
of R
efor
ms
Bro
ad sh
arin
g of
M
acro
econ
omic
Pr
oper
ty r
ight
sEq
ual o
ppor
tuni
tyC
ompe
titio
ngr
owth
ben
efits
stabi
lity
Ref
orm
Pote
ntia
lA
ctua
lPo
tent
ial
Act
ual
Pote
ntia
lA
ctua
lPo
tent
ial
Act
ual
Pote
ntia
lA
ctua
l
Tra
de✓
✓✓
✓✓
✗✓
✗
Fina
ncia
l✓
✓✓
✓✓
✓✓
✗✓
✓✓
✗
Labo
r✓
✗✓
✓✓
✗✓
✗
Pens
ion
✓✓
✓✓
✓✗
✓✓
✓✗
Fisc
al✓
✗✓
✓✓
✗
Publ
ic a
dmin
istr
atio
n✓
✓✗
✗✓
✓
Edu
cati
on✓
✓✓
✗✗
Judi
ciar
y✓
✓✗
✗✓
✗✓
✗✓
✗
Polit
ical
✓✗
✓✗
✓✓
✗✗
Sour
ce: A
utho
rs’ e
valu
atio
ns.
a. ✓
✓, s
tron
g po
siti
ve im
pact
; ✓, m
odes
t pos
itiv
e im
pact
; ✓✗
, mix
ed im
pact
; ✗, n
egat
ive
impa
ct; ✗
✗, s
tron
g ne
gati
ve im
pact
.
11630-07_CH07_rev2.qxd 6/2/09 3:59 PM Page 243
burden can likewise conspire against growth, by diverting the country’s resourcesto debt service. A growing debt also increases the risk of default, which in turnraises interest rates and the cost of financing the debt. This increases macroeco-nomic volatility and crowds out private investment.
Labor reform should work to increase equality of opportunity in society, byreducing the information asymmetries that hinder equal access to job opportuni-ties. If it does not, political or family connections, rather than skills, might dom-inate the matching of workers with job vacancies, leading to reduced productivityand ultimately slower growth.
The main promise of education reform in this framework is in promoting abroader sharing of the benefits of economic growth. A significant market failureoccurs when individuals cannot finance their education by borrowing against theirexpected higher future income stream. Without that education they cannot accu-mulate enough human capital to command high earnings in the labor market.This market failure and the strong positive externalities from the provision of edu-cation justify government intervention in the market for education.
The judicial system is both a guarantor of basic rights, including property rights,and a mechanism for resolving conflicts. To serve those functions, the judiciarymust be reliable, predictable, and accessible to all, or else individuals and firmswill seek alternative means of securing their rights. Failure of the judicial systemthus impairs a key element of growth, because property rights must be secure inorder for agents to find it profitable to accumulate capital.
The establishment of a democratic political regime should positively affect atleast three of the five growth foundations: equal opportunity, competition, and espe-cially the broad sharing of the benefits of growth. The essence of a democracy is equalrights and opportunities for all citizens in the public sphere. Through universalsuffrage, freedom of expression and association, and direct participation in poli-tics and the election of representatives, the less privileged members of society caninfluence the state and the market and achieve a fairer distribution of resourcesand opportunities. Democracy is also characterized by competition for publicoffice and for the definition of policy priorities, making it less likely that the statewill be captured by a privileged elite. For the same reason, democracies are morelikely than dictatorships to share the benefits from growth broadly, through greaterresponsiveness of government to voters and a stronger capacity of broad-based par-ties and interest groups to influence budgetary and other policies.
As table 4 suggests, the reforms since 1990 had the potential to transform Peru’seconomy. These reforms and the links between them and sustainable growth arequite standard and could apply to any emerging economy.3 What is distinctiveabout reform in Peru is not its potential but the real impact that reform has had.
244 e. morón, j. f. castro, and c. sanborn
3. As acknowledged in chapter 2 of this volume, the first three foundations apply to any marketeconomy, whereas the last two refer specifically to Latin America.
11630-07_CH07_rev2.qxd 6/2/09 3:59 PM Page 244
peru 245
Before summarizing the impact of the reforms undertaken (and avoided) since1990,4 it is worth highlighting that Peru’s reform process was not undertaken asa comprehensively thought out and fully detailed plan. The urgency of the coun-try’s situation profoundly influenced the choice of economic reforms. In fact, itwas only the widely shared sense of emergency that allowed President AlbertoFujimori to secure special legislative powers to implement the first set of reforms(Kenney, 2004), which were soon followed by the interruption of constitutionalrule and restrictions on democratic institutions and processes. Unsurprisingly, thebulk of the economic reforms were attempted in the first part of the decade. Afterthat, Fujimori became less enthusiastic about policy change and more concernedwith holding on to power. Only very recently, in June 2008, were new reformsadopted as part of the legislative package implementing the new free trade agree-ment with the United States. We do not include these reforms in our analysisbecause, as of this writing, the details have not been approved.
Table 4 presents a mixed overall picture of the impact of reform: although insome areas the reforms delivered as expected, in others they underperformed.Because some reforms are clearly more important than others, rather than assesseach individual reform, we will measure the gap between promise and results ona foundation-by-foundation basis. This will allow us to focus on what remains tobe done to secure growth and to assess a subset of reforms on this basis.
To begin, we can identify some progress in securing property rights, throughreform of the financial markets and the pension system. However, a broader con-cern for citizens’ rights and an adequate reform of the judicial system did notaccompany this process, leaving the majority of Peruvians without sufficientaccess. In fact, during the 1990s the executive branch manipulated the workingsof the judiciary for political ends. By the end of the decade, the judicial systemremained highly unpredictable, inefficient, exclusionary, and corrupt. (See theappendix at the end of this book for more details).
Some progress was also made toward equality of opportunity, as a result ofreforms in the trade regime and in financial, labor, and pension markets. How-ever, the net gain is unclear, as there was no progress in other areas, such as edu-cation and justice.
The picture is also mixed with regard to increasing competition. The partialgains from trade and financial reforms were again blurred by the lack of progressin the judiciary and the semiauthoritarian concentration of political power.
Perhaps the clearest picture emerges in terms of the last two growth founda-tions. The reforms of the 1990s did partly restore macroeconomic stability, a keypriority at that time, and were particularly successful in restoring fiscal and pricestability. On the other hand, it is striking how completely the reforms ignored the
4. The assessments in table 4 benefited from the discussions with the group of experts mentionedin the acknowledgments.
11630-07_CH07_rev2.qxd 6/2/09 3:59 PM Page 245
broad sharing of the benefits of growth. Despite widespread demand for more equi-table growth, none of the reforms took into consideration that progress on thisfoundation could avoid a backlash against the whole reform process and the neweconomic model. The apparent explanation is that the concerns at the time weremore basic, and the focus was on reshaping that part of the economy that was eas-ier to fix, namely, the more modern and urban part. The rest of the country wasleft mostly out of the picture.
Our attention to this foundation might seem at odds with the empirical evi-dence presented in the previous section, and in particular with the fact that Peru’scurrent growth is clearly more pro-poor than that of the previous decade. How-ever, reform thus far has done little to secure a permanent reduction in povertyand inequality; thus, the possibility of another sharp increase in these indicatorsremains. In fact, the absence of specific reform efforts aimed at greater inclusionin the long run suggests that the current “pro-poorness” of growth is more a con-sequence than a driver of growth. The latent risk of a negative shock reversingthese recent positive trends undermines the sustainability of growth, because ittranslates into a danger of backlash.
Thus, in what follows we analyze more deeply what was done and what werethe reasons behind the gap between promise and reality regarding this foundation.In particular, and given that the largest gaps in terms of this foundation are foundin administrative, education, and political reform, we focus our attention on thesethree areas. The framework suggests that such gaps might be explained either byfaulty design (technical inadequacies, inappropriate sequencing, lack of comple-mentary reforms, or inadequate fit to the local context) or by local obstacles (insti-tutional constraints, lack of legitimacy, or lack of implementing capacity). We willtry to explain on this basis why the above three reforms failed to achieve theirpotential.
First, however, a brief assessment of Peru’s reform successes is in order,because our analysis would be incomplete if we overlooked the importance ofpreserving what reform has already accomplished in terms of improving respectfor property rights, increasing competition, and, especially, stabilizing themacroeconomy. As explained in chapter 2, macroeconomic stability has provedto be a necessary (although not sufficient) condition for growth throughout theregion. Moreover, in Peru it is the accomplishments of reform with respect tothese other foundations that has allowed private investment to benefit from thecurrent boom.
Recent Economic Reforms: A Brief Assessment
In 1990 the Peruvian economy was in shambles. The monthly inflation rate wasrunning at a four-digit pace without any sign of coming under control. Govern-ment revenue plummeted by a full three-quarters, leaving roads without mainte-
246 e. morón, j. f. castro, and c. sanborn
11630-07_CH07_rev2.qxd 6/2/09 3:59 PM Page 246
peru 247
nance, public hospitals without basic supplies, and many civil servants having towork two jobs. Growth was completely out of the picture. GDP plunged 25 per-cent in real terms between 1988 and 1990. The outlook was bleak.
In a surprising turn of events, a political outsider, Alberto Fujimori, won thepresidential election without the support of any well-established political party.Even more surprising, he ended up implementing most of the economic plan out-lined by his right-wing opponent, Mario Vargas-Llosa. The plan was an aggres-sive bet on liberalizing the economy in order to spur growth, once an austerestabilization package had halted the hyperinflation.
Although the plan achieved dramatic turnarounds in terms of both stabiliza-tion and restoration of access to international capital markets, the most significantchanges came in the area of structural reform, which completely reshaped thePeruvian economy. Both labor and capital markets were liberalized, almost everyasset in public hands (except the water utilities and the oil companies) was priva-tized, and new laws were passed protecting and fostering private investment. For-eign investment was attracted through special contracts with specific clausesforbidding surprise changes in the tax code or in regulation. A new regulatory sys-tem was also put in place, including a new antitrust agency, a regulatory author-ity for each newly privatized sector, and a much stronger tax authority.
The political process that accompanied these economic reforms, however, wasincreasingly authoritarian. Although Fujimori enjoyed initial support for his hard-line postures, his concentration of power and the widespread corruption that waseventually revealed among top civil and military leaders ultimately tainted thewhole reform process. The process was further discredited when, in late 2001,Fujimori abandoned the presidency and left the country after being accused ofrunning a corruption ring through his spymaster, Vladimiro Montesinos.
These scandals and Fujimori’s departure notwithstanding, the governmentsthat succeeded him kept the main thrust of the macroeconomic reforms intact.After decades of government intervention and lackluster results, the common per-ception was that state intervention had been responsible not only for deterringgrowth, but also for provoking Peru’s worst economic crisis ever. The economicreforms of the 1990s focused on using market forces to restore growth. In somecases markets were created; in others market rules were entirely rewritten. Theproblem was that the reach of market institutions is not homogeneous through-out the country. The modern economy predominant in Peru’s coastal areas andmajor cities is quite different from the more traditional economy of its rural areasand highlands. Markets in these areas are full of rigidities, which explain why lib-eralization was not enough to spur growth in these areas, or indeed even for thechange to be noticed.
For example, the public pension system was overhauled, creating private fundadministrators (administradoras de fondos de pensiones, or AFPs) following theChilean blueprint. However, the labor markets of these two countries are dissim-
11630-07_CH07_rev2.qxd 6/2/09 3:59 PM Page 247
ilar. Whereas in Peru two-thirds of the working population is in the informal sec-tor, in Chile the figure is not more than a third. The reform failed to address theneeds of these workers, a problem inherited from the previous pension systemdesign. Now, almost twenty years after the reform, opinion about it is mixed. Thenew system works well for those with stable jobs in the formal sector. For otherformal sector workers, however, it is not delivering the promise of a pensionclosely related to their salary history. And for the majority of Peruvians, the newsystem was irrelevant, as they were never part of the reform.
Reform of the financial system had similar results at first. Before 1990, the sys-tem was severely affected by inflation and by financial repression, which, togetherwith legislation that did not guarantee the rights of lenders, produced a smallfinancial sector from which many individuals and firms were rationed out. Therewere few long-term transactions, even in the mortgage market.
The 1990s saw a radical change, with a new banking law and the lifting of allprice controls and restrictions. These changes attracted major international play-ers into the banking system. The improvement in macroeconomic conditionsallowed a credit boom, which, however, went bust with the Russian crisis of 1998.Yet even at the peak, many potential borrowers remained rationed out of the creditmarket, including many informal sector firms and many poor individuals with nocollateralizable assets. Fortunately, over time new microfinance institutions of var-ious kinds found ways to serve this market. It is unlikely that this could have hap-pened in the absence of stabilization and financial market reform.
The first efforts at reform were thus a steppingstone toward the improvedgrowth of later years. The most important reforms were the conquest of inflation,tariff reductions, financial sector reform, and a new framework for attracting pri-vate investment. However, rural poverty was not reduced at the same pace as inurban areas. The following section focuses on three areas that might be called the“missing ingredients” of future reform efforts: reform of public administration,education reform, and last but not least, political reform.
Missing Ingredient #1: Public Administration Reform
One of Peru’s main obstacles to achieving inclusive growth has been the lack of awell-functioning state apparatus. As is widely known, the Peruvian state beforethe reform process was bloated, bureaucratized, inefficient, and lacking in profes-sionalism. Its profusion of red tape represented a significant deterrent to privateinvestment. Above all, it was clearly biased against the rural population, as mostof the public sector was located in Lima, and no significant effort was made todecentralize its power to the provinces.
As argued by Ugarte (2000), the administrative reforms of the 1990s weremaintained only to the extent that they were viewed as necessary for keeping theconcurrent economic reforms in place. The central bank regained its indepen-
248 e. morón, j. f. castro, and c. sanborn
11630-07_CH07_rev2.qxd 6/2/09 3:59 PM Page 248
peru 249
dence, the tax authority was given budgetary and operational autonomy, the cus-toms office was completely overhauled, and new regulators began to oversee themany newly privatized enterprises. Three characteristics were common to all ofthese cases. First, salaries in these agencies were de-linked from those of the restof the public sector: employees were hired under rules similar to those in the pri-vate sector, with productivity bonuses and defined career tracks. Second, the insti-tutions were well funded through sources of revenue not connected with thegeneral government budget. Third, the new public officials were in most caseshighly qualified.
The intense macroeconomic volatility of previous decades was tamed not onlythrough much stricter macroeconomic policies but also through several mecha-nisms expressly designed for that purpose. These included the adoption of a multi-year budgeting framework and fiscal prudence legislation with explicit rules. Thegovernment also managed the public debt more actively, leading to Peru’s achiev-ing investment grade status. Although this turnaround was significant, so were thereforms still pending, including in particular the professionalization of the civilservice and effective mechanisms for national integration.
The Lack of a Professional Civil Service
Before 1990 there was no such thing as a public career within the Peruvian state,and the situation is hardly any better today. Most public sector entities (the cen-tral bank is an exception) have nothing resembling a merit-based hiring system.Throughout the 1990s, public servants were part of a minority within the laborforce whose paychecks may have been shrinking but who nevertheless enjoyed allbasic labor rights as well as virtually complete job stability.5 Therefore, politicianswere eager to use public employment as a source of patronage.
Another factor that has conspired against building a well-defined publiccareer is the short duration in office of the highest-ranking officials. The aver-age tenure of a cabinet minister since 1980 has been less than a year. Usuallyeach new minister comes with his or her own team and imposes a career ladder,with the steps reserved for political appointees, rather than a merit-based sys-tem. This discourages the best of the permanent employees, who are likely tosee their careers stagnate.
Finally, it is symptomatic of Peru’s problems that degree programs in publicadministration have historically been absent from the university system. None ofPeru’s eighty universities offers public administration as an undergraduate major,and only a few graduate programs in the field have opened since 2001.
5. Permanent job stability was introduced by the military government in 1970, after a three-month trial period. By 1978 the government had increased the trial period to three years, but in 1986this was reversed. See Saavedra (2000).
11630-07_CH07_rev2.qxd 6/2/09 3:59 PM Page 249
The last two decades have seen attempts to reform public administrationand introduce a professional civil service. The first attempt was aborted afterthe 1992 “self-coup,” when President Fujimori dissolved Congress and sus-pended the constitution. The group designing the reform quit, and the proj-ect was forgotten. None of the ministries was closed, and only a few smallpublic institutions (including the National Institute of Public Administration)were dismantled. Hyperinflation was the main incentive encouraging peopleto leave public employment: the real value of public sector salaries fell by morethan 75 percent in the 1980s. The most significant change in terms of reduc-ing the public payroll occurred in the state-owned enterprises, which were rap-idly privatized.
At the end of Fujimori’s first term, a major reform of public administration wasattempted, and Congress granted the executive branch broad powers in this area.A group of specialists prepared a serious proposal under the auspices of the primeminister’s office. However, the population was easily turned against the reform, asthe political opposition claimed it would lead to a series of massive layoffs. Therewas also opposition within the government, and by the end of 1996 the idea hadbeen abandoned. Eventually the impetus for reform faded, and all plans to reformpublic administration came to be perceived as too politically controversial.
Obstacles to Building an Integrated Nation
All governments in developing countries face a trade-off between reforms thatfocus on economic growth and those that focus on reducing inequality. When thestarting point is one of persistently slow growth, the focus is unlikely to be on thelatter. Once the economy is back on its feet, however, pressure to address inequal-ity increases. Peru has been in this situation for some time now, yet the gov-ernment’s actions to reduce inequality have been neither well articulated norsystematic, nor have they been very effective.
Because inequality in Peru has so much to do with the gap between the capi-tal and the rest of the country, perhaps the obvious first step is to decentralizepower and decision-making. The Peruvian state has embarked on a rather disor-ganized decentralization process since 2001. Although municipal authorities havebeen elected rather than appointed since 1981, and new regional-level authoritieswere elected in 2002, this was done without approval of the basic legislationintended to guide the process, and meanwhile another election was held in 2006.Decentralization today remains a work in progress. There have been none of themajor fiscal problems that many had feared, primarily because very strict fiscalrules were centrally imposed. However, there have been significant problems inbudget execution. Regional and municipal authorities lack the administrativecapacity to spend their allocated budgets, and this inhibits the sharing of respon-sibility across levels of government. Delays continue, and the perception is stillwidespread that money is not being well spent. The National System of Public
250 e. morón, j. f. castro, and c. sanborn
11630-07_CH07_rev2.qxd 6/2/09 3:59 PM Page 250
peru 251
Investment (SNIP) has its hands tied, as responsibility for most investment deci-sions lies with the regional governments.
But perhaps the most notorious problem is that Peru’s twenty-five regionalgovernments have not pursued any real integration. Decentralization merelychanged the names of the existing national departments to regional departments;the idea of combining the regions into macroregions, although built into the law,has not been carried out. The reality is that some regions are simply too small tobuild an effective government. Nor do all regions have mineral, gas, or other nat-ural resources to serve as a source of tax revenue, and so tension between poor andrich regions has increased substantially.
The main tool used by the government to reshape the income expectations ofpoorer families is social policy. Better nutrition, health, and education are key toimproving the living standards of these families, who rely on the state to help meettheir needs in these areas. But the role of the state goes beyond fulfilling these basicneeds. The state can become an obstacle to inclusive growth if it does not also pro-vide basic infrastructure, justice, and a minimum of peace and security. Althoughthe state must exercise its vital regulatory functions, excessive red tape and bureau-cracy can put a wrench in the wheels of growth. In sum, a growing economy needsan efficient and effective state apparatus, ready to work with the private sector inachieving economic growth.
Basic infrastructure is a powerful equalizer of opportunities, and given the dis-parities in public infrastructure across the country, there is much that publicexpenditure could do in this regard. It is hard to start a manufacturing business ifthere are no roads to connect with a larger market, no electricity, and no telephonenetwork. Yet the technological progress that Lima takes for granted is simplyabsent in large parts of the country, and as long as the government grappled withlarge fiscal deficits, it could not cope with the mounting problem.
The prolonged economic crisis actually caused public investment to decline asa share of the economy, as cuts in investment spending were used to fend off fis-cal deficits. From 55 percent of total investment outlays in 1975, public invest-ment plummeted to less than 20 percent in 1990. The consequences were asignificant deterioration of all public infrastructure (schools, roads, hospitals) andof the salaries of public employees. The collapse was even more pronounced in the1980s, when terrorist groups repeatedly attacked the public electricity network.
How to Move Forward?
This review of the challenges to public administration reform suggests several areaswhere the need is critical to work toward a better state apparatus.
Meritocracy Should Be the Rule
Peru has long lacked a professional civil service with merit-based career paths.Many reform efforts have been blocked as policymakers focused on the existing
11630-07_CH07_rev2.qxd 6/2/09 3:59 PM Page 251
stock of personnel instead of building up a new group of professional public ser-vants. A well-defined public career system would make it possible for the publicsector to retain the talent it needs.
In June 2006, under the legislative powers granted by Congress to implementthe free trade agreement with the United States, the executive issued a legislativedecree implementing a civil service system with many desirable features. This cir-cumvented the main obstacle, which was that the executive lacked a majority inCongress and therefore the reform had a slim chance of passage. The new systemis based on merit, and its governance structure establishes a politically indepen-dent board that will manage the whole civil service.
A complementary legislative decree in June 2008 breaks the link between thesalary structure of elected officials and that of a small group of key public man-agers, whose salaries as a result may now be set higher than the president’s. Untilnow, in the existing “islands of efficiency” in the state apparatus, employees wereoffered market-based salaries so as to attract the best talent, but the salary struc-ture for these public servants was tied to that of elected politicians. These twostructures should not be determined together, as only the market for the formerhas a relevant shadow price. Of course, it remains to be seen whether this reformwill get beyond the design stage.
Focus on Results, Not Just Procedures
Another problem is that the whole state system has been geared toward fulfill-ing a long list of procedures instead of a short list of goals. Bureaucrats feel pres-sured to follow every single requirement imposed by the rules, even if the desiredoutcome is accomplished less efficiently or not at all. If they deviate from the rules,public employees can face judicial scrutiny, even prosecution, whereas they willnever face prosecution for not meeting goals. This way of doing business gener-ates enormous inefficiencies at every step, from unnecessary procedures and doc-uments, to high administrative costs, to sluggishness and interminable delay. Thesystem makes bureaucrats accountable not to the citizens they serve, but to inter-nal audit bodies focused on procedures instead of goals.
The whole budgeting system should serve as a mechanism for making pub-lic expenditure more effective. For that to happen, budget programs should onlybe approved once a proper system of monitoring and evaluation is in place.Until then, bureaucrats will have little incentive to improve the quality of pub-lic expenditure.
One mechanism that has been implemented as a pilot process in recent yearsis results-based budgeting (Alvarado and Morón, 2007). A small group of pro-grams have been selected in priority areas (including nutrition and education) andgiven explicit goals. The idea is to get the bureaucracy to think about what isneeded to achieve those goals, instead of focusing on how much money is avail-able for each task. So far only 5 percent of the total budget is subject to this ini-
252 e. morón, j. f. castro, and c. sanborn
11630-07_CH07_rev2.qxd 6/2/09 3:59 PM Page 252
peru 253
tiative. The rest is basically driven by inertia and without any evaluation of effi-ciency or goal fulfillment.
Proper use of results-based budgeting could partly resolve many of the issuesrelated to lack of accountability. When clear outcome indicators are required, itwill be much easier to educate citizens about what they have a right to expect fromgovernment. Today, for example, the state’s “clients” have no clear idea how poorpublic education really is, or how inefficient the delivery of health services hasbecome. True accountability requires linking inputs with outputs, and outputswith outcomes. For that, a proper monitoring system must be put in place as partof the results-based budgeting system.
Decentralize Talent, Not Just Problems
The government needs to empower local and regional governments as a fun-damental step toward improving both the efficacy and the coverage of basic socialprograms. For that to happen, the capacities of these levels of government mustbe strengthened. A more pressing reform is to establish macroregions out of thecurrent smaller regions, as mentioned above. The central government can moreeasily focus on helping seven or ten macroregional governments than twenty-fiveat once. The distribution of public resources should be linked to the creation ofthese macroregions. Here incrementalism is the best strategy. For example, a sin-gle pilot macroregion could help deliver the message that consolidation is possi-ble, desirable, and replicable. Unfortunately, the current commodity boom hascreated a division between rich and poor regions. Ninety percent of the canon pro-ceeds (revenue levied based on the premise that those regions in which naturalresources are being extracted should receive part of the proceeds) go to just twelveregions, and more than half goes to just four. Thus, there are few incentives toreduce the number of regions.
Missing Ingredient #2: Education Reform
Several endogenous growth models rely on human capital to provide an analyti-cal link between economic growth and educational variables (Lucas, 1988). How-ever, empirical evidence at the aggregate level remains inconclusive. A strongerconsensus emerges when we connect educational attainment and quality withhouseholds’ ability to maintain a high, steady income (Hanushek and Wöbmann,2007; Castro, 2006). In fact, strong linkages can be found at the household levelbetween the stock of human capital and both the level and the variability ofincome and consumption.
As already mentioned, households seeking to accumulate human capital face asignificant market failure in their inability to pledge their increased future incomestream; this is what justifies public intervention in education. We therefore expecteducation reform to exert its growth potential through the broader sharing of the
11630-07_CH07_rev2.qxd 6/2/09 3:59 PM Page 253
benefits of growth,6 by expanding access to an asset that the market values but failsto offer on an egalitarian basis. Obviously, reform is not just a matter of guaran-teeing the existence of this valuable asset (public education of good quality) butalso of providing it to households with poor initial endowments.
Why Has Education Failed to Contribute to the Broader Sharing of Growth?
Public interventions in the education system may fail in their goal of spreadingmore broadly the benefits of growth in either of two ways. First, they may result inservices of little value delivered to those with poor initial endowments; second, theymay deliver valuable services, but only to those with an already large endowment.
Regarding basic education in Peru, we argue that the problem has been mainlyof the first type. As documented in Yamada and Castro (2007), attendance atpublicly provided primary and secondary schools is concentrated among thepoor.7 Coverage and attainment have increased, but because spending has beenunchanged relative to GDP (around 3 percent over the past ten years), the resulthas been lower educational quality.8 To accommodate all enrollees within theexisting physical and human infrastructure, public schools have resorted to teach-ing in three daily shifts of less than five hours each. Clearly, in these circum-stances the same nominal educational attainment implies less real human capitalaccumulation than before, and thus smaller future income gains.
In fact, national school performance measures for 2004 show that only 12 per-cent of students complete primary school with age-appropriate reading compre-hension, and only 8 percent can solve basic logical and mathematical problems(Ministerio de Educación, 2005). These students will need to extend their edu-cation if they are to command the same earnings as earlier graduates, thus com-pensating lower quality with larger quantity.
As documented in Yamada and Castro (2007), the flip side of this resultemerges when we examine the probability of being poor for a given educationalattainment: data from the national household surveys show that this probabil-ity was greater in 2004 than in 1985 for all levels of basic education (figure 3).This reveals to what extent the education sector has weakened as a mechanismof social mobility in the past twenty-five years. The average probabilities shownin figure 3, however, disguise strong differences between publicly and privately
254 e. morón, j. f. castro, and c. sanborn
6. The channel from education to growth can be traced analytically if we consider human capi-tal as a production factor. Within the proposed framework, the link we propose is between educa-tion reform (understood as reshaping public intervention in the education sector) and growth via the“broad sharing” foundation.
7. Among Peruvians with access to publicly provided primary education, 72 percent can beregarded as poor or extremely poor, as are 60 percent of those with access to publicly provided sec-ondary education.
8. As documented in Cotlear (2006), gross enrollment rates in primary and secondary educationare now nearly 100 percent and 90 percent, respectively.
11630-07_CH07_rev2.qxd 6/2/09 3:59 PM Page 254
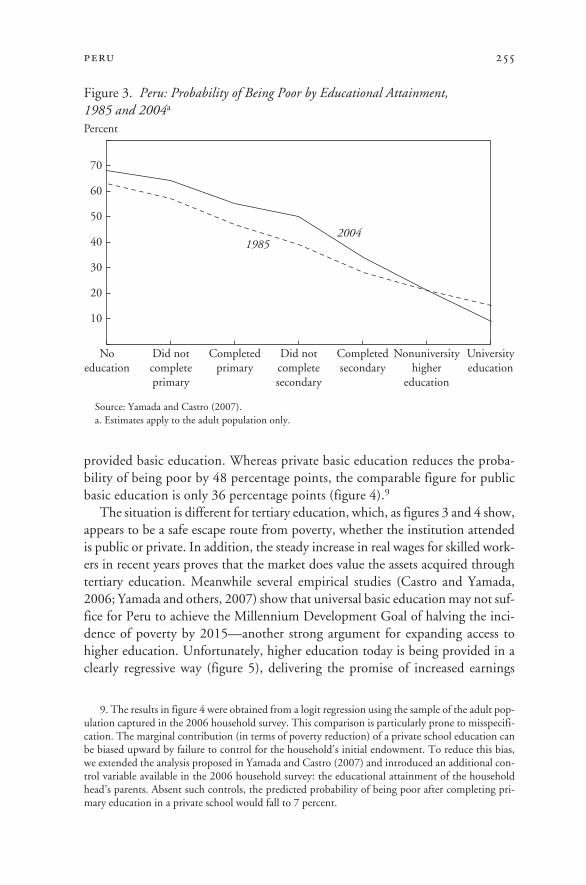
peru 255
provided basic education. Whereas private basic education reduces the proba-bility of being poor by 48 percentage points, the comparable figure for publicbasic education is only 36 percentage points (figure 4).9
The situation is different for tertiary education, which, as figures 3 and 4 show,appears to be a safe escape route from poverty, whether the institution attendedis public or private. In addition, the steady increase in real wages for skilled work-ers in recent years proves that the market does value the assets acquired throughtertiary education. Meanwhile several empirical studies (Castro and Yamada,2006; Yamada and others, 2007) show that universal basic education may not suf-fice for Peru to achieve the Millennium Development Goal of halving the inci-dence of poverty by 2015—another strong argument for expanding access tohigher education. Unfortunately, higher education today is being provided in aclearly regressive way (figure 5), delivering the promise of increased earnings
9. The results in figure 4 were obtained from a logit regression using the sample of the adult pop-ulation captured in the 2006 household survey. This comparison is particularly prone to misspecifi-cation. The marginal contribution (in terms of poverty reduction) of a private school education canbe biased upward by failure to control for the household’s initial endowment. To reduce this bias,we extended the analysis proposed in Yamada and Castro (2007) and introduced an additional con-trol variable available in the 2006 household survey: the educational attainment of the householdhead’s parents. Absent such controls, the predicted probability of being poor after completing pri-mary education in a private school would fall to 7 percent.
Figure 3. Peru: Probability of Being Poor by Educational Attainment, 1985 and 2004a
Source: Yamada and Castro (2007).a. Estimates apply to the adult population only.
10
20
30
40
50
60
70
Percent
19852004
Universityeducation
Nonuniversityhigher
education
Completedsecondary
Did notcompletesecondary
Completedprimary
Did notcompleteprimary
Noeducation
11630-07_CH07_rev2.qxd 6/2/09 3:59 PM Page 255
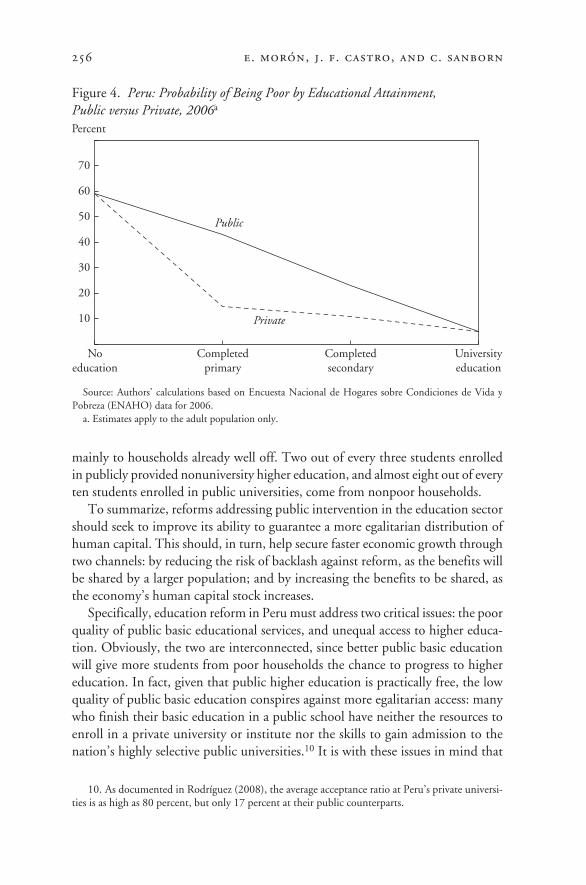
mainly to households already well off. Two out of every three students enrolledin publicly provided nonuniversity higher education, and almost eight out of everyten students enrolled in public universities, come from nonpoor households.
To summarize, reforms addressing public intervention in the education sectorshould seek to improve its ability to guarantee a more egalitarian distribution ofhuman capital. This should, in turn, help secure faster economic growth throughtwo channels: by reducing the risk of backlash against reform, as the benefits willbe shared by a larger population; and by increasing the benefits to be shared, asthe economy’s human capital stock increases.
Specifically, education reform in Peru must address two critical issues: the poorquality of public basic educational services, and unequal access to higher educa-tion. Obviously, the two are interconnected, since better public basic educationwill give more students from poor households the chance to progress to highereducation. In fact, given that public higher education is practically free, the lowquality of public basic education conspires against more egalitarian access: manywho finish their basic education in a public school have neither the resources toenroll in a private university or institute nor the skills to gain admission to thenation’s highly selective public universities.10 It is with these issues in mind that
256 e. morón, j. f. castro, and c. sanborn
Figure 4. Peru: Probability of Being Poor by Educational Attainment, Public versus Private, 2006a
Source: Authors’ calculations based on Encuesta Nacional de Hogares sobre Condiciones de Vida yPobreza (ENAHO) data for 2006.
a. Estimates apply to the adult population only.
10
20
30
40
50
60
70
Percent
Public
Private
Universityeducation
Completedsecondary
Completedprimary
Noeducation
10. As documented in Rodríguez (2008), the average acceptance ratio at Peru’s private universi-ties is as high as 80 percent, but only 17 percent at their public counterparts.
11630-07_CH07_rev2.qxd 6/2/09 3:59 PM Page 256
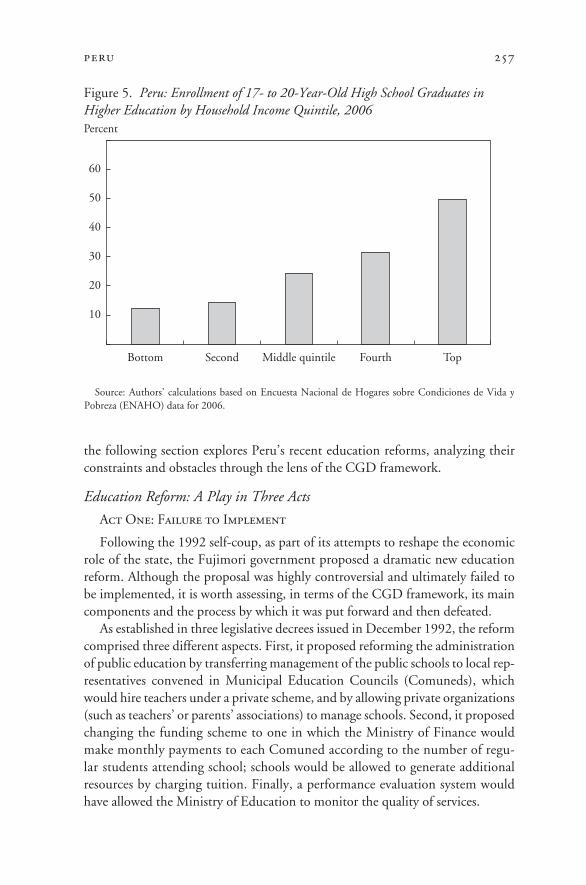
peru 257
the following section explores Peru’s recent education reforms, analyzing theirconstraints and obstacles through the lens of the CGD framework.
Education Reform: A Play in Three Acts
Act One: Failure to Implement
Following the 1992 self-coup, as part of its attempts to reshape the economicrole of the state, the Fujimori government proposed a dramatic new educationreform. Although the proposal was highly controversial and ultimately failed tobe implemented, it is worth assessing, in terms of the CGD framework, its maincomponents and the process by which it was put forward and then defeated.
As established in three legislative decrees issued in December 1992, the reformcomprised three different aspects. First, it proposed reforming the administrationof public education by transferring management of the public schools to local rep-resentatives convened in Municipal Education Councils (Comuneds), whichwould hire teachers under a private scheme, and by allowing private organizations(such as teachers’ or parents’ associations) to manage schools. Second, it proposedchanging the funding scheme to one in which the Ministry of Finance wouldmake monthly payments to each Comuned according to the number of regu-lar students attending school; schools would be allowed to generate additionalresources by charging tuition. Finally, a performance evaluation system wouldhave allowed the Ministry of Education to monitor the quality of services.
Figure 5. Peru: Enrollment of 17- to 20-Year-Old High School Graduates inHigher Education by Household Income Quintile, 2006
Source: Authors’ calculations based on Encuesta Nacional de Hogares sobre Condiciones de Vida yPobreza (ENAHO) data for 2006.
Percent
10
20
30
40
50
60
TopFourthMiddle quintileSecondBottom
11630-07_CH07_rev2.qxd 6/2/09 3:59 PM Page 257
As documented in Webb and Valencia (2006), by 1991 public school teachers’salaries had reached a historic low. After a short-lived expansion during the firstthree years of President Alan Garcia’s first administration (1985–88), salaries hadfallen by more than 75 percent as a result of the decline in public expenditure andthe hyperinflation of 1988–92. Webb and Valencia argue that low salaries, com-bined with weak demand, the government’s inability to enforce contracts, and anincreasingly powerful teachers’ union (SUTEP), led to a “low level equilibrium.”Teachers compensated for their low salaries by taking second jobs, which reducedthe time and effort they devoted to public school teaching. SUTEP’s leadersmeanwhile negotiated contract terms that reduced teachers’ obligations and thegovernment’s ability to impose discipline, while building an organization to servetheir own radical political agenda. Students and their parents failed to complain,since they remained unaware of how poor the services provided actually were.
Clearly, public education was failing to contribute to the broad sharing of thebenefits of growth. Again, coverage was not the problem: gross enrollment ratesat all levels were unaffected by the 1988–92 crisis and, as revealed in Cotlear(2006), have remained above the Latin American average for decades. Enrollmentin elementary and secondary schools actually experienced a steady increase from1970 onward. The problem, rather, was low quality, a direct consequence of the“low level equilibrium” described by Webb and Valencia.
The need for reform was thus compelling, and, in principle, the main featuresof the proposed reform arguably would have created the incentives to allow theeducational system to deliver on its potential, both through the “broad sharing”foundation and, indirectly, by facilitating competition and enhancing macroeco-nomic stability. The proposed transfer of management of public schools to localrepresentatives and the creation of a performance evaluation system were aimedat building a more efficient and accountable administration, where quality wouldemerge in response to local demand. In addition, decentralization would haveallowed for better management of resources, which could, in principle, have alle-viated the fiscal burden. In fact, the proposed reform of the funding scheme infavor of a voucher-type system was aimed at this objective. The scheme was alsoexpected to foster competition between privately managed schools. The resultingimprovement in quality would have helped the public schools deliver on their pri-mary goal as a driver of growth by equalizing access to human capital.
A critical view of the ability of decentralization to deliver on these objectivesmust address potential problems of design (related to technical inadequacies) andparticular obstacles arising from local conditions, such as lack of implementationcapacity. In particular, success will be compromised if the reform lacks a properbalance between greater local autonomy and stronger central administrative capac-ity. This equilibrium is required to guarantee several things: first, that the fund-ing scheme and contractual arrangements create effective incentives for schoolsand teachers on the basis of performance (and not just increased coverage and sen-
258 e. morón, j. f. castro, and c. sanborn
11630-07_CH07_rev2.qxd 6/2/09 3:59 PM Page 258
peru 259
iority, respectively); second, that information generated by the performance eval-uation system is used and disseminated so as to foster competition and demandfor quality; and third, that disparities in the managerial abilities of local actors(which are typically correlated with the local poverty rate in a regressive way) arerecognized so that capacities and funds can be transferred appropriately.
The proposed reform was flawed on some of these fronts, and this alone wouldhave compromised its success. Although the proposal was based largely on theChilean model, some effort was made to account for the poorer administrativecapacity of Peruvian municipalities and to favor the decentralization of responsi-bilities from state actors to school actors, and not across bureaucracies. (Comunedswere supposed to convene local representatives, not just local authorities.11) More-over, the idea was to transfer public school management to communities gradu-ally. However, the proposed funding scheme was based only on the number ofstudents in regular attendance, no incentives were provided to foster quality-oriented reform at the school level, and no detail was given about how the evalu-ation system would be implemented or whether further incentives would be givento schools and teachers on the basis of merit. Furthermore, no specific acknowl-edgment was made regarding potential disparities among beneficiary communi-ties. Thus, it seems the balance would have tilted in favor of local autonomy, withlittle emphasis on the need to strengthen administrative capacities or expand cen-tral funding. This bias probably stemmed from an excess of confidence in the mar-ket, combined with the compelling need to downsize the state and reshape its rolein the economy.
Although these design problems failed to manifest themselves because thereform was never implemented, they permeated into the main obstacle to thisreform, namely, its lack of political legitimacy. As documented in Ortiz deZevallos et al. (1999), educational experts and veto groups with different moti-vations joined ranks to oppose the reform, persuading the public that its main pur-pose was privatization rather than decentralization and that it threatened theconstitutional right to free and universal schooling.
The authoritarian nature of the regime, the top-down way in which the reformwas proposed, and the absence of any prior public debate or dissemination strat-egy involving potential beneficiaries (including parents) all contributed to thereform’s failure. In the public’s mind, the transfer of educational responsibilitiesto local governments, which were (and remain) hardly synonymous with efficientadministration, raised fears rather than enthusiasm. Further fueling these worrieswas the lack of any pilot experience that, if successful, could have reassured the
11. Some would argue that this decision was driven not only by the objective of overcomingobstacles from local conditions, but also by President Fujimori’s discontent with the 1993 munici-pal elections, where independent candidates won in the majority of provinces and districts (Ortiz deZevallos et al., 1999).
11630-07_CH07_rev2.qxd 6/2/09 3:59 PM Page 259
public of the reform’s potential. At the end of 1993, amid strong public opposi-tion that nearly cost the government the approval of the new constitution, Presi-dent Fujimori abandoned the effort, and in May 1994 Congress repealed the threedecrees that had launched the process.
It is worth noting that the rapid erosion of political capital observed in thisepisode is not a necessary attribute of education reform. In fact, Peru’s experiencecontrasts sharply with that of Argentina, where education reform helped bringtogether political actors from different factions within the ruling party, thusfostering cooperation on later economic reforms (Corrales, 2006). Argentina’s“provincialization” of education was packaged with promises of increased infra-structure spending, which helped soften the appearance of a reform that soughtto reduce the central government’s fiscal burden by delegating responsibilities.The political context in Peru was very different, and the general public came tobelieve that this reform was just another attempt to cut spending, this time byeroding a hard-won fundamental social right.
Act Two: Coping with the Status Quo
By mid-1993 the Fujimori government’s emphasis regarding public educationhad already changed in favor of the provision of basic infrastructure through therecently created Instituto Nacional de Infraestructura en Educación y Salud(INFES). The idea was to lower school dropout rates, especially in rural areas, byproviding new schools. Several empirical studies relying on cross-sectional data(Castro and Yamada, 2006; Yamada et al., 2007) have indeed found that the num-ber of students per school is a significant determinant of school achievement (interms of enrollment and graduation rates), and that the provision of infrastruc-ture and the quality of education can be highly correlated. But Peru’s low-qualityeducational equilibrium was not just a matter of inadequate infrastructure. In fact,alleviating disparities in access to basic education infrastructure is only a neces-sary, not a sufficient, condition for improving quality in an equitable manner,because strong complementarities exist between physical and human resources inproviding educational services. Moreover, mere provision of infrastructure canhelp perpetuate this perverse equilibrium, if users become contented with visibleoutputs and fail to develop a proper demand for overall quality.
In the years that followed, and especially during the administration of Presi-dent Alejandro Toledo (2001–06), emphasis was given to developing trainingprograms for teachers, accompanied by a revision of the national curriculum, pro-vision of standardized textbooks, and improvements in teachers’ salaries (by 57 to69 percent, depending on category and level served). However, the higher salarieswere largely due to pressure exerted by SUTEP, rather than a coordinated effortto reward performance and merit. Although low salaries were one of the main cul-prits behind Peru’s “low level equilibrium,” indiscriminate wage increases werenot the solution. Moreover, failure to link wage negotiations to performance will
260 e. morón, j. f. castro, and c. sanborn
11630-07_CH07_rev2.qxd 6/2/09 3:59 PM Page 260
peru 261
inevitably contribute to maintaining this undesirable equilibrium, by fueling theunion’s ability to negotiate contract terms in which obligations and discipline areof secondary importance.
The teacher training programs, the revised national curriculum, and the dis-semination of standardized textbooks, meanwhile, had problems of their own,related to technical inadequacies that led to inadequate implementation. As doc-umented in Benavides and Rodríguez (2006), little is known about the effective-ness of training programs, and several studies reveal that the new methodologieswere not articulated around the objectives and contents of the new curriculum.The training programs thus failed to transfer the capacities required to take fulladvantage of the distributed material, and many teachers ended up discardingthe official textbooks or “adapting” their content to their own pedagogical abil-ities and their students’ intellectual capacity. A comparison of 1998 and 2004performance evaluation results (Ministerio de Educación, 2005)12 reveals littleprogress, despite spending of nearly $500 million in more than 3,000 schoolsfrom 1992 to 2000.
Act Three: Reform Redux
Setting the urgency of education reform aside, one could argue that delayingreform for nearly fifteen years may yet have positive consequences, but only ifPeruvians take stock and learn from their experience and that of other Latin Amer-ican countries. Soon after returning to office in 2006, President Garcia revivedthe idea of a thorough reform of the education sector, and of decentralization(which he called “municipalization”) in particular. Three milestones characterizethe beginning of this third act, which is still under way: the introduction of a pilotdecentralization program in October 2006; the regulation in July 2007 of the Sis-tema Nacional de Evaluación, Acreditación y Certificación de la Calidad Educa-tiva (SINEACE), created in May 2006 under President Toledo; and the approvalof a new Teachers’ Labor Code (Ley de Carrera Pública Magisterial) that samemonth.
The pilot decentralization program involves fifty-six of the country’s more than1,800 municipalities during 2007–08. The proposed strategy involves creating ineach municipality a Municipal Education Council (Consejo Educativo Munici-pal), led by the local authority with representatives (school principals, teachers,students, and parents) from all public schools in the district. The usual disclaimersrelated to design and implementation capacity apply, and just how funds will betransferred to local governments remains unclear. But what is new about this ini-
12. As reported in Ministerio de Educación (2005), no significant differences were found between1998 and 2004 in the verbal communication performance of primary and secondary school students.In mathematics, primary school students performed no differently in the two years, and secondaryschool students did slightly worse in 2004.
11630-07_CH07_rev2.qxd 6/2/09 3:59 PM Page 261
tiative is precisely the fact that it is a pilot experience. This signals not only thatthe transfer will be gradual, but also, if correctly monitored and successful, that itwill provide evidence of the potential gains from delegating school managementto local actors.
The regulation of SINEACE is another important reform, since this office isnow charged with evaluating and certifying quality and determining standards atall educational levels. As discussed later, this office could play a crucial role by pro-viding the information required to tie incentives to quality and foster demand forbetter services.
Reviving the idea of decentralization led, not surprisingly, to the teachers’union again raising the privatization specter. Their concerns, however, were rap-idly diverted toward two other policy initiatives that impinged directly on theirinterests: the system of teacher evaluation and the new labor code. The mostimportant features of the new code are the recognition of merit and performanceas the main determinants of promotions and raises, and a new system of individ-ual evaluations to assess whether teachers should be retained and promoted.13 Inan atmosphere of increasing mistrust toward this type of policy initiative, fueledby low salaries, poor working conditions, a limited budget, and government’s fail-ure to meet the objectives established in the previous labor code, oppositiongroups and union leaders easily convinced many teachers that this new code wasnothing but an attempt to deprive them of their job stability. Massive publicdemonstrations nationwide followed passage of the law.
How to Move Forward?
We have already identified the two critical issues that any successful reform mustaddress if the education sector is to fulfill its role as a vehicle of social mobility: thequality of public basic education and equality of access to higher education. Onthe quality front, the recent initiatives just described seem to point in the rightdirection. However, their success will depend crucially on policymakers’ awarenessof and skill in avoiding several of the constraints and obstacles noted in chapter 2.
The first of these is the potential lack of legitimacy, made worse by the fact thatthe costs of reform will be concentrated on a group with considerable veto power(the teachers’ union), while the benefits will be dispersed throughout the popula-tion and difficult to observe and measure in the near term. A second issue is lackof adequate implementation capacity and problems of design related to technicalinadequacies, which make it difficult to attain a proper equilibrium between localautonomy and central administrative capacities. As already mentioned, the for-
262 e. morón, j. f. castro, and c. sanborn
13. The first type of evaluation is compulsory and takes place every three years. Teachers who failthis evaluation will be provided further training and up to two chances to be approved; those whofail three times at the same career level will be dismissed. The second type of evaluation is not com-pulsory, occurs every three years, and must be passed for promotion to the next career level.
11630-07_CH07_rev2.qxd 6/2/09 3:59 PM Page 262
peru 263
mer should promote efficiency and accountability, while the latter ties incentivesto quality, gathers and disseminates information regarding performance, and pro-motes equity by recognizing and correcting local disparities.
Several policy recommendations follow. First, further confrontations with theteachers’ union should be avoided, now that a new labor code that rewards meritand explicitly uses performance evaluation results has been approved. In fact, thecode is a major breakthrough,14 and any new elements that cause distress to teach-ers could put the whole reform at risk. The central authorities must acknowledgethat, given past experience, teachers will be wary of the new rules being abused,despite great efforts to ensure that the new code emphasizes training and rewardsgood performance. Second, efforts should now focus on defining the specific cri-teria and indicators to be used in monitoring quality and performance. Now thatlaws and basic regulations have been passed, this second, more technical stage isparticularly prone to design problems that can end up disconnecting incentivesfrom proposed objectives.
The primary objective of a basic education system is to provide children withthe essential cognitive skills to interact effectively in society and possibly to pur-sue a college degree. Thus, quality must be measured in terms of whether suchskills are being taught. The Ministry of Education, via its Quality MeasurementUnit, has already conducted several performance evaluations, measuring students’reading comprehension skills and their ability to solve logical and mathematicalproblems. Several well-defined benchmarks also already exist: for example, afterfinishing second grade, students should be able to read with understanding at arate of 60 words per minute. These benchmarks could be readily applied and theresults disseminated.
As mentioned, SINEACE is charged with designing indicators and standardsto measure educational quality nationwide. Here two important issues must beconsidered. First, visible outputs (training for teachers, textbooks, infrastructure,and even enrollment and completion rates) should not be confused with outcomes(learning of basic skills), although the two can be correlated. Second, SINEACEmust rapidly take stock of measurement techniques and simple standards alreadyavailable to proxy such learning. It is important to determine and publicize, assoon as possible, how many and which public schools are meeting the standards.
Once this has been established, special recognition in the form of bonusesshould be given promptly to well-performing schools, using the quality standardsestablished by SINEACE. Waiting to award these bonuses until decentralizationproceeds and funds are transferred to local governments could cause unnecessarydelay in tying incentives to quality. Such rewards will create incentives for schoolsto implement quality-oriented reforms, thus promoting local capacity building.
14. Corrales (2006) identifies the failure to reform teachers’ labor codes as one of the major designshortcomings of education reform in Latin America.
11630-07_CH07_rev2.qxd 6/2/09 3:59 PM Page 263
The rewards will also complement the reforms already introduced in the new laborcode. A system of rewards is also important because although SINEACE’s gov-erning regulation establishes incentives for school certification, the accreditationprocess will be time consuming and remains voluntary.
The new labor code also establishes that SINEACE will play a role, togetherwith the Ministry of Education, in designing indicators and measurement instru-ments for monitoring teachers’ performance. This provides an opportunity to tieteachers’ retention and promotion to the criteria and standards used to measurequality: well-performing teachers are those whose students demonstrate basicreading, mathematical, and logical skills. Giving more weight to these objectivecriteria will minimize the risk of corruption and help shelter the education systemfrom politics.
Finally, performance results should be disseminated as a means of encouraginghouseholds to demand higher quality. Transparency and simplicity are essentialto building public support: the expected benefits will become clearer, the betterthe population is informed about the outcomes they can expect from reform andthe progress made. A string of successful teacher and student performance evalu-ations evidencing the impact of new selection criteria, training, and decentraliza-tion efforts will then build legitimacy for further reforms.
In this regard, the Ministry of Education recently announced that parents andteachers will be given the results of students’ evaluations, and that parents will haveaccess to a guide explaining the skills that their children should attain in eachsemester. Policymakers should be aware that, initially, this can have some costs interms of parents’ perception of the quality of service. However, it remains crucialto foster consensus around the need to persist with the reform.
The recent reform milestones and the recommendations so far point towardimprovement in the quality of public basic education. Unfortunately, there hasbeen little discussion of the second reform front: equalizing access to higher edu-cation. In fact, SINEACE’s efforts currently emphasize the design of criteria forthe accreditation of higher education centers that train basic education teachers.Although this is also a priority given the mixed quality of the existing centers, thiseffort is focused on the first reform front.
The primary objective of higher education is to increase future consumptionby building a more highly skilled labor force. Unfortunately, performance evalu-ations and indicators like those available for basic education do not exist for highereducation. As proposed in Yamada and Castro (2007), efforts to assess the qual-ity of higher education must include not only periodic faculty evaluations, but alsotransparent, market-based indicators that reveal to all potential students the pos-sible economic gains from studying at a given institution for a particular career.
If the benefits of growth are to be broadly shared, however, the most compellingissue for higher education is unequal access. Nearly nine out of ten high schoolgraduates from the poorest 20 percent of Peru’s population are effectively excluded
264 e. morón, j. f. castro, and c. sanborn
11630-07_CH07_rev2.qxd 6/2/09 3:59 PM Page 264
peru 265
from higher education. Yet the empirical evidence demonstrates that access to sucheducation, whether public or private, offers the best chance of escaping poverty.
Although quality improvements in public basic education should help equal-ize access to higher education, this is a long-term endeavor. Some complementarymeasures are therefore needed in the near term. Given that public higher educa-tion in Peru is currently free for anyone who can access it, charging tuition to non-poor students would arguably be a sensible first step, because it would reducedemand from nonpoor households while also providing funds that could be usedto expand coverage.15
However, the lessons learned from past reforms and the obstacles identified bythe framework argue against this recommendation for the near term: legitimacyproblems would inevitably arise and generate confrontation. Instead we proposean expansion of higher education credits. Publicly provided credit for higher edu-cation is currently managed by the Ministry of Education’s Oficina de Becas yCredito Educativo, which currently offers close to $10 million in credits annually.However, a look at the schemes currently offered suggests that they fail to promotelong-term investment in higher education. Students must begin repayment onlya month after funds are transferred, making the current scheme more of a transi-tory shock absorber than an effective instrument for long-term financing.
An improved higher education credit scheme could help alleviate the problemof unequal access. In such a scheme, funds would be provided by the financial mar-ket and oriented to poorer households. Thus households would have to demon-strate their ability to repay not from current income, but rather from the increasein their future income stream resulting from the student’s higher education. Sec-ond, the state should play a subsidiary role by, for example, providing the collat-eral that poor households are unable to pledge, thus assuming a contingent liability.
Realizing the promise of a larger incremental income stream depends, of course,on the quality of the education provided. To ensure that borrowed funds are spenton high-quality education, countries such as Chile lend only to students admit-ted to accredited universities. Since Peru’s accreditation system is still in its incep-tion, some other risk-sharing mechanism would have to be devised: for example,the participating universities could be asked to share the burden of providing col-lateral; the better universities would then self-select. Incentives for doing so (froma private point of view) could be provided by guaranteeing that the credit schemewill cover all educational expenses. Private universities would find this attractive,since they would otherwise charge poor students a modest tuition. In fact, mostprivate universities in Peru already vary their tuition depending on the student’s
15. As documented in Bejar and Montero (2006), charging tuition fees to nonpoor students cansignificantly increase the resources available to public universities. Working with the University ofSan Marcos (the most important public university in Peru), the authors show that collecting tuitionfrom the richest 60 percent of the student population could secure up to $9.3 million a year, oraround 11 percent of the university’s annual budget.
11630-07_CH07_rev2.qxd 6/2/09 3:59 PM Page 265
socioeconomic background. Although this implies that the credit scheme wouldbe smaller in scope than one might wish, it could prove successful as a transitorymechanism until SINEACE can fulfill its larger role.
Finally, it is worth emphasizing that the legitimacy and design problemsstressed throughout this chapter are interconnected. Although the former arisemainly when the government first puts forward a reform, and the latter when it isimplemented, the latter also feed back into the former. Ambiguous messages abouthow the reform will be implemented and what outcomes are to be expected tendto foster impatience and discontent with the reform process.
In the 1990s both public administration reform and educational reform facedsignificant legitimacy problems related to the nature of the political regime, afterPresident Fujimori concentrated power and exercised it in an authoritarian andarbitrary manner. In both cases the weakness of representative democratic insti-tutions could itself be considered an obstacle to reform, and this helps make thecase for the third “missing reform,” which we take up next.
Missing Ingredient #3: Political Reform
Comparative research suggests that in addition to their intrinsic value, democraticpolitical systems tend to outperform dictatorships at adjusting to external shocks,investing in human development, protecting the property rights of the majority,and achieving economic stability and social equity over the long run. The elementsof democracy considered most important for these ends include universal suffrage,a bill of rights, separation of powers, respect for the rule of law, and the existenceof strong, autonomous institutions, including political parties, unions, and otherinterest groups (Karl, 1996; Rodrik, 1997; Sen, 1999).
Historically, of course, democracy in Peru has not worked this way. Author-itarianism has prevailed during most of Peruvian history, and until recentlydemocracy was considered by both conservatives and radicals an obstacle tovarious national development goals. Political power has been highly concentratedand at the same time highly unstable, exercised arbitrarily with only limitedchecks and balances. Although separation of powers is constitutionally man-dated, in practice both Congress and the judiciary have been weakly institution-alized and ineffective; political parties and most interest groups have also beenweak and fragmented.
In our view, the volatility of Peru’s politics and the weakness of its representa-tive institutions have been obstacles to laying the foundations for inclusive growth.They have made it difficult to enforce basic rules and rights, ensure governmentaccountability, and promote sustained collaboration among key actors towardmajor policy goals, whether they be reducing poverty, reforming the educationalsystem, or reforming the state apparatus. This situation, in turn, favors the emer-gence of popular “outsiders,” who propose to suspend democratic politics in order
266 e. morón, j. f. castro, and c. sanborn
11630-07_CH07_rev2.qxd 6/2/09 3:59 PM Page 266
peru 267
to establish order and attempt bold social change (Sanborn and Panfichi, 1996;Morón and Sanborn, 2007).
Can the reform of Peru’s political institutions improve the prospects for inclu-sive growth? If so, which institutions, and what kind of reforms? Over the lastquarter century, numerous changes have been made in the formal rules and insti-tutions of Peruvian politics, through new constitutions (1979 and 1993), elec-toral and party legislation, executive decrees, and extra-parliamentary agreements.Although diverse and piecemeal in nature, these changes have largely sought tostrengthen the executive, expand electoral participation and competition, andregulate the political party system. Some of these reforms directly or indirectlyaddressed the foundations for inclusive growth, but only a few have madeprogress toward that end, while others have been ineffective and some clearlycounterproductive.
Here we briefly examine the main challenges that political reformers havefaced in Peru in recent years, highlighting some problems of design as well asdifficulties in implementing institutional change in the volatile Peruvian con-text. The main question is: How has it been possible politically for Peru to con-tinue so long without significant economic and social inclusion, and why hasinclusion not been a top priority on the political agenda, at least between elec-tions? We examine how various institutions and rules may have helped prolongthis situation.
The Political Challenges to Building Inclusive Growth
Who Gets Elected? Weak Party Structures and What Sustains Them
Free and fair elections with universal suffrage were first held in Peru only in1980 and were interrupted during the 1990s. Hence, although voting is obliga-tory and turnout high, informed electoral participation and constructive compe-tition remain weak. Political parties in Peru have not served as effective vehiclesfor citizen education or representation of interests.
Although politics in the 1980s was marked by competition among three mainparties or blocs—the centrist APRA, Acción Popular, and the Partido PopularCristiano (PPC) on the right, and the Marxist United Left alliance—all werecharacterized by arbitrary and personalistic leadership and fraught with internaldisputes, and each was widely rejected by voters after failing to govern effectivelyduring its brief spells in power.16 During the 1990s these groups were over-taken by a plethora of smaller movements and splinter parties. The triumph of
16. In 1980–95 Acción Popular governed in alliance with the minority PPC, and APRA underAlan Garcia governed from 1985 to 1990; meanwhile the United Left held numerous municipal gov-ernments, including Lima’s. For more on Peru’s parties in the 1980s see Sanborn (1991) and Tanaka(1998).
11630-07_CH07_rev2.qxd 6/2/09 3:59 PM Page 267
Alberto Fujimori, a political outsider who refused to build a solid party of hisown, accelerated the downfall of the then-existing parties. Although low barriersto entry and other electoral rules facilitated this outcome, it was voter disgustwith party performance that created the opportunity (Morón and Sanborn,2007; Tanaka, 2006).
To varying degrees, Peruvian parties since 2001 have continued to revolvearound personalities rather than programs or ideology; they have few roots insociety and little institutional life between elections. They lack the ability toaggregate citizens’ interests effectively and represent them in the public sphere,and they lack the professional cadres and cohesion necessary to manage the stateor undertake effective oversight of government. Thus, although civic associationand collective action are relatively strong in Peru, partisan identification is low(around 5 percent of the population), and parties are highly unpopular even byLatin American standards. Indeed, comparative analyses rank Peru as having theweakest party system in the region (Mainwaring and Scully, 1995, pp. 16–17;Payne et al., 2002, p. 143).
Why have Peru’s political parties remained so weak? Part of the answer lies intheir lack of historical continuity and their ideological and political sectarianism(Sanborn, 1991; Morón and Sanborn, 2007). The rejection of market economicsby much of the Left, and the lack of consideration of human rights and equityconcerns by most of the Right, made it especially difficult to forge working agree-ments through the 1980s or to respond to the violence of the Shining Path guer-rilla movement. These factors have been compounded by electoral rules that, inthe interest of pluralism, continue to encourage personalistic politics and partyfragmentation.
Low legal barriers for the registration of parties and candidates, for example,encourage the proliferation of loosely knit movements with few lasting ties tovoters. The majority runoff election format also encourages small parties to runseparate candidates in the first round rather than form broad coalitions, andsecond-round alliances tend to be opportunistic and short-lived. The open-list,proportional representation electoral system without a threshold also encouragesa proliferation of contenders (only since 2006 have parties had to win at least4 percent of the total vote to gain a seat in Congress), as does the voto preferencialdoble, which allows voters to choose their two favorite candidates from a partyslate. These features, designed to enhance voter choice, also undermine party dis-cipline and reward personality politics. In 2001, thirteen parties competed forpower and eleven were represented in Congress.
Representatives That Do Not Represent
Once elected, Congress should serve as an intermediary between the citizensand the executive, while also producing legislation and preventing abuses ofpower by the other branches. Although presidents in Peru are also popularly
268 e. morón, j. f. castro, and c. sanborn
11630-07_CH07_rev2.qxd 6/2/09 3:59 PM Page 268
peru 269
elected, members of Congress should be empowered to challenge or modify theexecutive agenda if it strays from campaign promises, or if they believe their con-stituents’ voices are not being heard. For this to happen, several reforms areneeded.
To begin with, links between citizens and their elected representatives are weakor nonexistent. The downsizing of Congress after 1993 to just one chamber with120 members is cited by some analysts as contributing to its lack of popularresponsiveness. In 1990 there was one member of Congress for every 30,000 vot-ers, but by 2006 this had increased to 137,500, the highest ratio among theAndean countries. Because the number of members is constitutionally fixed, theratio will continue to widen. However, the creation of twenty-five separate elec-toral districts in 2001 was designed to offset this problem, reducing the ratio ofvoters to members in most of the country and ensuring that all regions have somerepresentation. Today twenty-two of the twenty-five districts are small, with twoto five representatives each, and 40,000 to 80,000 voters per representative; thesetwenty-two districts elect 60 percent of all members of Congress. There are alsotwo medium-size districts (La Libertad with seven members, and Piura with six),and one very large one, Lima, with thirty-five members, or 29 percent of the total,and over 152,000 voters per member. Proposals for dividing Lima into smallerdistricts are still on the drawing board.
Even in those districts with reasonable citizen-to-member ratios, membershave few incentives to be attentive and accountable to their constituents. Withfew exceptions, members elected from the provinces move to Lima and soonbecome engaged in the capital’s political life and in issues that may secure themmore media attention than the bread-and-butter needs of voters back home. Inpractice, they have little time to return home while Congress is in session,unlike in Chile, for example, where the plenary sessions of Congress leave oneweek of every month free so that representatives can stay in touch with theirdistricts.
Realistically, members of Congress can do very little to directly deliver whatmany voters back home want most, such as infrastructure projects or improvedsocial services. Peru’s last two constitutions stripped Congress of the “power of thepurse,” or the ability to amend the executive’s annual budget proposal. Membersmay propose changes in the budget’s composition, but not specific outlays. Thislimits their ability to transfer resources to their constituencies and encouragesthem to gain power and voter attention by other means.
In theory, an open-list, proportional electoral system should increase members’responsiveness and accountability. Accountability should be further enhanced bysuch elements as electronic voting boards and a congressional website, establishedin the late 1990s, where citizens can follow legislative decisions and members’ vot-ing records (Carey, 2003). In practice, however, Congress’s public approval ratingshave remained among the lowest for all public institutions, and turnover among
11630-07_CH07_rev2.qxd 6/2/09 3:59 PM Page 269
individual legislators remains high.17 Since 1980 the average legislative experienceof a member of Congress has been 4.4 years, and most current members have noprior experience in this arena.18 For the most part, the media pay little attentionto their voting records, and relatively few voters have access to the legislature’swebsite or the motivation to review it. The media have paid attention to “scan-dalous” increases in congressional salaries and benefits and questionable hiringpractices, which reinforce the public perception that members are basically rent-seekers rather than honest public servants.
Furthermore, Peruvians often do not view legislation as the best means toadvance their interests and proposals. Real power is seen as residing with the pres-ident and members of the cabinet. However, the power of the media to deliverpopular messages to the executive has increased substantially in recent years, andthe semi-autonomous ombudsman’s office (Defensoría del Pueblo) is widely seenas a more legitimate mechanism for investigating and documenting abuses ofpower, even though it lacks the authority to apply sanctions.
Legislators Who Prefer Not to Legislate
Under the 1993 constitution, Congress retains considerable formal authority.It can debate and pass legislation, including changes to taxes as well as approvalof the budget, and it can still amend the president’s budget proposal during theappropriations process. With a simple majority, Congress can also override a pres-idential veto of legislation and repeal decrees made under delegated authority, andthe constitution itself can be amended by a supermajority. Although the presidentselects the cabinet, ministers can be formally questioned and censured by Con-gress. The president, cabinet members, and other high officials can also beimpeached by a simple majority of the Permanent Commission (see below) andconvicted by a simple majority of the remaining legislators (Schmidt, 2004).
What do Peruvian legislators actually do? And why is their performance sopoorly evaluated? A lack of empirical research makes these questions difficult toanswer. What is known is that legislators do not even do most of the legislating;as table 5 shows, more than half of all legislation from 1980 to 2001 was issuedby executive decree, including most major initiatives affecting the economy, thelabor market, and the provision of social services.
When Congress does legislate, as in the more proactive 2001–06 period, it haspassed some important measures, including the legal framework for decentraliza-tion, public sector pension reform, a new law governing mining royalties, and the
270 e. morón, j. f. castro, and c. sanborn
17. In 2003 Congress had a public approval rating of 10 to 12 percent, which by 2006 had fallento 8 percent. Approval of the new Congress in mid-2008 was around 10 to 20 percent. Individualparties received approval ratings of just 6 to 9 percent in 2003. See Apoyo, Opinion y Mercado,Opinión data: Resumen de Encuestas de la Opinion Pública, año 6, número 83, December 11, 2006;año 8, número 101, June 23, 2008; and año 8, número 102, July 21, 2008.
18. Sixty-two percent of members in the 2001–06 Congress were newcomers, and 85 percenthad less than five years of experience. The majority of the 2006–11 Congress are also first-timers(Santiso, 2004).
11630-07_CH07_rev2.qxd 6/2/09 3:59 PM Page 270
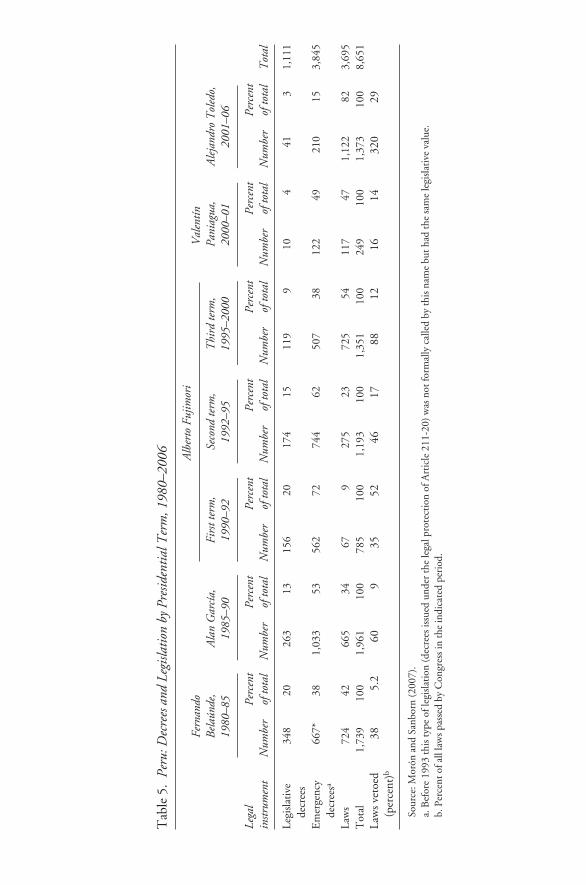
Tab
le 5
.Pe
ru: D
ecre
es a
nd L
egisl
atio
n by
Pre
siden
tial T
erm
, 198
0–20
06
Fern
ando
A
lber
to F
ujim
ori
Val
entín
B
elaú
nde,
A
lan
Gar
cía,
Fi
rst t
erm
,Se
cond
term
, T
hird
term
, Pa
niag
ua,
Ale
jand
ro T
oled
o,19
80–8
519
85–9
019
90–9
219
92–9
519
95–2
000
2000
–01
2001
–06
Lega
l Pe
rcen
tPe
rcen
tPe
rcen
tPe
rcen
tPe
rcen
tPe
rcen
tPe
rcen
tin
strum
ent
Num
ber
of to
tal
Num
ber
of to
tal
Num
ber
of to
tal
Num
ber
of to
tal
Num
ber
of to
tal
Num
ber
of to
tal
Num
ber
of to
tal
Tot
al
Legi
slat
ive
348
2026
313
156
2017
415
119
910
441
31,
111
decr
ees
Em
erge
ncy
667*
381,
033
5356
272
744
6250
738
122
4921
015
3,84
5de
cree
sa
Law
s72
442
665
3467
927
523
725
5411
747
1,12
282
3,69
5T
otal
1,73
910
01,
961
100
785
100
1,19
310
01,
351
100
249
100
1,37
310
08,
651
Law
s ve
toed
38
5.2
609
3552
4617
8812
1614
320
29(p
erce
nt)b
Sour
ce: M
orón
and
San
born
(200
7).
a. B
efor
e 19
93 th
is ty
pe o
f leg
isla
tion
(dec
rees
issu
ed u
nder
the
lega
l pro
tect
ion
of A
rtic
le 2
11-2
0) w
as n
ot fo
rmal
ly c
alle
d by
this
nam
e bu
t had
the
sam
e le
gisl
ativ
e va
lue.
b. P
erce
nt o
f all
law
s pa
ssed
by
Con
gres
s in
the
indi
cate
d pe
riod
.
11630-07_CH07_rev2.qxd 6/2/09 3:59 PM Page 271
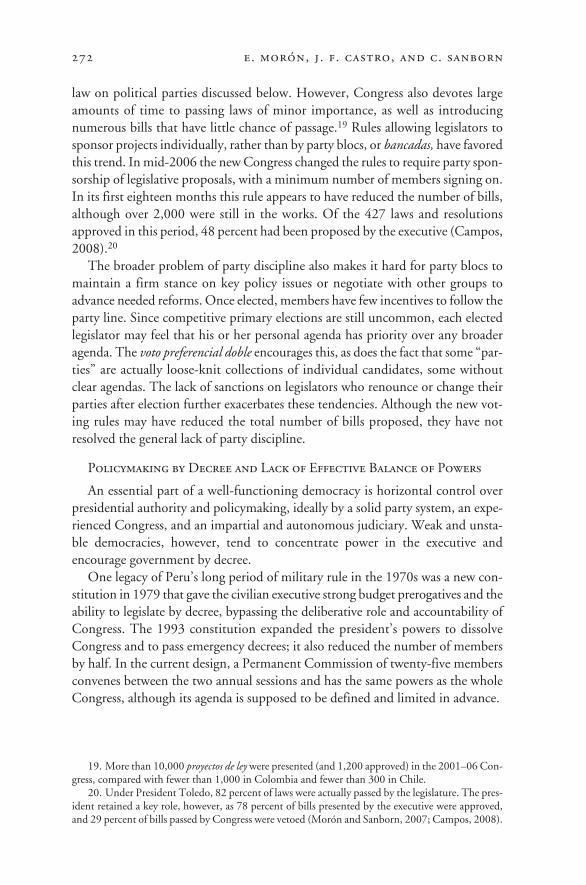
272 e. morón, j. f. castro, and c. sanborn
law on political parties discussed below. However, Congress also devotes largeamounts of time to passing laws of minor importance, as well as introducingnumerous bills that have little chance of passage.19 Rules allowing legislators tosponsor projects individually, rather than by party blocs, or bancadas, have favoredthis trend. In mid-2006 the new Congress changed the rules to require party spon-sorship of legislative proposals, with a minimum number of members signing on.In its first eighteen months this rule appears to have reduced the number of bills,although over 2,000 were still in the works. Of the 427 laws and resolutionsapproved in this period, 48 percent had been proposed by the executive (Campos,2008).20
The broader problem of party discipline also makes it hard for party blocs tomaintain a firm stance on key policy issues or negotiate with other groups toadvance needed reforms. Once elected, members have few incentives to follow theparty line. Since competitive primary elections are still uncommon, each electedlegislator may feel that his or her personal agenda has priority over any broaderagenda. The voto preferencial doble encourages this, as does the fact that some “par-ties” are actually loose-knit collections of individual candidates, some withoutclear agendas. The lack of sanctions on legislators who renounce or change theirparties after election further exacerbates these tendencies. Although the new vot-ing rules may have reduced the total number of bills proposed, they have notresolved the general lack of party discipline.
Policymaking by Decree and Lack of Effective Balance of Powers
An essential part of a well-functioning democracy is horizontal control overpresidential authority and policymaking, ideally by a solid party system, an expe-rienced Congress, and an impartial and autonomous judiciary. Weak and unsta-ble democracies, however, tend to concentrate power in the executive andencourage government by decree.
One legacy of Peru’s long period of military rule in the 1970s was a new con-stitution in 1979 that gave the civilian executive strong budget prerogatives and theability to legislate by decree, bypassing the deliberative role and accountability ofCongress. The 1993 constitution expanded the president’s powers to dissolveCongress and to pass emergency decrees; it also reduced the number of membersby half. In the current design, a Permanent Commission of twenty-five membersconvenes between the two annual sessions and has the same powers as the wholeCongress, although its agenda is supposed to be defined and limited in advance.
19. More than 10,000 proyectos de ley were presented (and 1,200 approved) in the 2001–06 Con-gress, compared with fewer than 1,000 in Colombia and fewer than 300 in Chile.
20. Under President Toledo, 82 percent of laws were actually passed by the legislature. The pres-ident retained a key role, however, as 78 percent of bills presented by the executive were approved,and 29 percent of bills passed by Congress were vetoed (Morón and Sanborn, 2007; Campos, 2008).
11630-07_CH07_rev2.qxd 6/2/09 3:59 PM Page 272
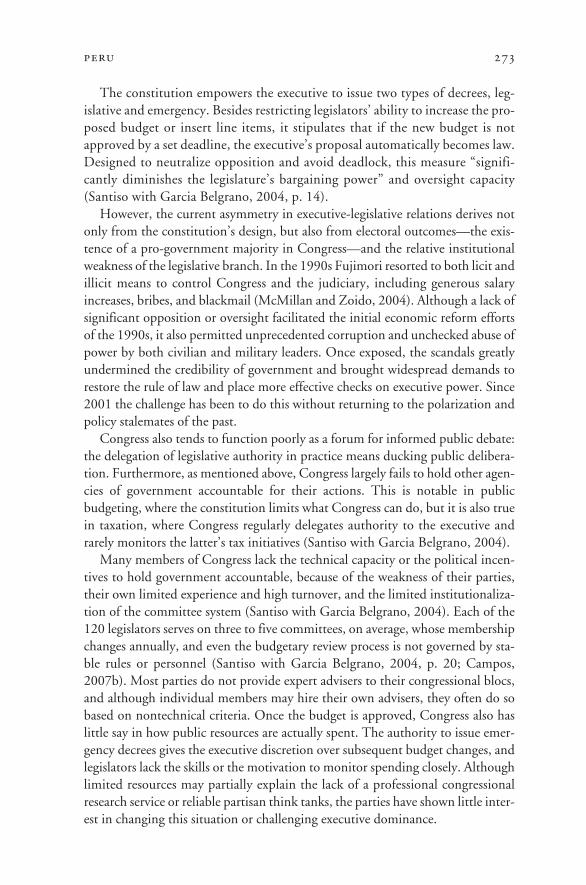
peru 273
The constitution empowers the executive to issue two types of decrees, leg-islative and emergency. Besides restricting legislators’ ability to increase the pro-posed budget or insert line items, it stipulates that if the new budget is notapproved by a set deadline, the executive’s proposal automatically becomes law.Designed to neutralize opposition and avoid deadlock, this measure “signifi-cantly diminishes the legislature’s bargaining power” and oversight capacity(Santiso with Garcia Belgrano, 2004, p. 14).
However, the current asymmetry in executive-legislative relations derives notonly from the constitution’s design, but also from electoral outcomes—the exis-tence of a pro-government majority in Congress—and the relative institutionalweakness of the legislative branch. In the 1990s Fujimori resorted to both licit andillicit means to control Congress and the judiciary, including generous salaryincreases, bribes, and blackmail (McMillan and Zoido, 2004). Although a lack ofsignificant opposition or oversight facilitated the initial economic reform effortsof the 1990s, it also permitted unprecedented corruption and unchecked abuse ofpower by both civilian and military leaders. Once exposed, the scandals greatlyundermined the credibility of government and brought widespread demands torestore the rule of law and place more effective checks on executive power. Since2001 the challenge has been to do this without returning to the polarization andpolicy stalemates of the past.
Congress also tends to function poorly as a forum for informed public debate:the delegation of legislative authority in practice means ducking public delibera-tion. Furthermore, as mentioned above, Congress largely fails to hold other agen-cies of government accountable for their actions. This is notable in publicbudgeting, where the constitution limits what Congress can do, but it is also truein taxation, where Congress regularly delegates authority to the executive andrarely monitors the latter’s tax initiatives (Santiso with Garcia Belgrano, 2004).
Many members of Congress lack the technical capacity or the political incen-tives to hold government accountable, because of the weakness of their parties,their own limited experience and high turnover, and the limited institutionaliza-tion of the committee system (Santiso with Garcia Belgrano, 2004). Each of the120 legislators serves on three to five committees, on average, whose membershipchanges annually, and even the budgetary review process is not governed by sta-ble rules or personnel (Santiso with Garcia Belgrano, 2004, p. 20; Campos,2007b). Most parties do not provide expert advisers to their congressional blocs,and although individual members may hire their own advisers, they often do sobased on nontechnical criteria. Once the budget is approved, Congress also haslittle say in how public resources are actually spent. The authority to issue emer-gency decrees gives the executive discretion over subsequent budget changes, andlegislators lack the skills or the motivation to monitor spending closely. Althoughlimited resources may partially explain the lack of a professional congressionalresearch service or reliable partisan think tanks, the parties have shown little inter-est in changing this situation or challenging executive dominance.
11630-07_CH07_rev2.qxd 6/2/09 3:59 PM Page 273
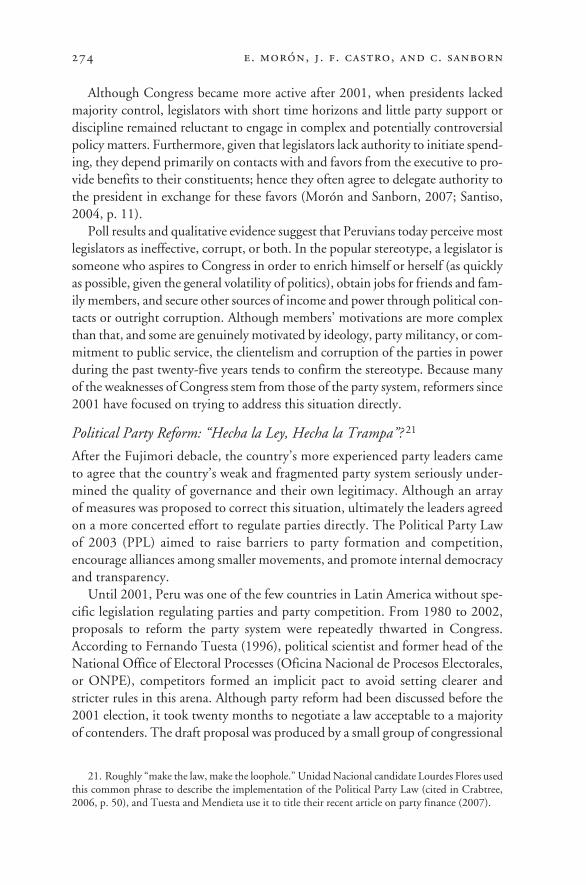
Although Congress became more active after 2001, when presidents lackedmajority control, legislators with short time horizons and little party support ordiscipline remained reluctant to engage in complex and potentially controversialpolicy matters. Furthermore, given that legislators lack authority to initiate spend-ing, they depend primarily on contacts with and favors from the executive to pro-vide benefits to their constituents; hence they often agree to delegate authority tothe president in exchange for these favors (Morón and Sanborn, 2007; Santiso,2004, p. 11).
Poll results and qualitative evidence suggest that Peruvians today perceive mostlegislators as ineffective, corrupt, or both. In the popular stereotype, a legislator issomeone who aspires to Congress in order to enrich himself or herself (as quicklyas possible, given the general volatility of politics), obtain jobs for friends and fam-ily members, and secure other sources of income and power through political con-tacts or outright corruption. Although members’ motivations are more complexthan that, and some are genuinely motivated by ideology, party militancy, or com-mitment to public service, the clientelism and corruption of the parties in powerduring the past twenty-five years tends to confirm the stereotype. Because manyof the weaknesses of Congress stem from those of the party system, reformers since2001 have focused on trying to address this situation directly.
Political Party Reform: “Hecha la Ley, Hecha la Trampa”? 21
After the Fujimori debacle, the country’s more experienced party leaders cameto agree that the country’s weak and fragmented party system seriously under-mined the quality of governance and their own legitimacy. Although an arrayof measures was proposed to correct this situation, ultimately the leaders agreedon a more concerted effort to regulate parties directly. The Political Party Lawof 2003 (PPL) aimed to raise barriers to party formation and competition,encourage alliances among smaller movements, and promote internal democracyand transparency.
Until 2001, Peru was one of the few countries in Latin America without spe-cific legislation regulating parties and party competition. From 1980 to 2002,proposals to reform the party system were repeatedly thwarted in Congress.According to Fernando Tuesta (1996), political scientist and former head of theNational Office of Electoral Processes (Oficina Nacional de Procesos Electorales,or ONPE), competitors formed an implicit pact to avoid setting clearer andstricter rules in this arena. Although party reform had been discussed before the2001 election, it took twenty months to negotiate a law acceptable to a majorityof contenders. The draft proposal was produced by a small group of congressional
274 e. morón, j. f. castro, and c. sanborn
21. Roughly “make the law, make the loophole.” Unidad Nacional candidate Lourdes Flores usedthis common phrase to describe the implementation of the Political Party Law (cited in Crabtree,2006, p. 50), and Tuesta and Mendieta use it to title their recent article on party finance (2007).
11630-07_CH07_rev2.qxd 6/2/09 3:59 PM Page 274
peru 275
leaders, including Jorge del Castillo of APRA and Henry Pease of Perú Posible,working with experts from ONPE and several nongovernmental organizations(Crabtree, 2006, p. 43). The final proposal was approved by a close vote in Con-gress and promulgated on October 1, 2003.
The new law covers three main issues: the constitution and recognition of par-ties, internal party democracy, and party finance and access to media. Under thelaw, to register for electoral competition, a party must have a set of internal rules,a government program, and a list of supporters totaling no fewer than 1 percentof voters in the last election (128,000 as of 2001). Parties are also required todemonstrate the existence of local committees in at least 65 of Peru’s 194 provincesand 17 of its 25 departments. Each party committee must have at least fifty mem-bers, who are legally inscribed in a padron partidario and have rights and obliga-tions in the organization; this list must be published on the party’s website(Tuesta, 2005). This rule was designed to discourage what Martín Tanaka hascalled “electoral franchises,” in which local personalities are temporarily recruitedto run on party slates—often paying for the opportunity—without being partyregulars or having established ties to the main organization. The PPL also intro-duced an electoral threshold (valla electoral): a party must receive at least 5 per-cent of the total vote cast in a general election to be awarded congressional seatsand retain its electoral registration.22
To promote internal party democracy, the PPL requires that parties hold dem-ocratic elections in which all registered affiliates have the right to participate, andthat they hold leadership elections at least once every four years. This was one ofthe more controversial provisions, and the original proposals had to be modifiedto win approval in Congress (Crabtree, 2006, p. 44). The law also expands a pre-existing gender quota—at least 30 percent of candidates on a party’s slate must bewomen—and extends it to internal party leadership positions as well. The lawrequires that parties present detailed reports of their income and expenditure, setsrestrictions on the amount and sources of private campaign finance, and for thefirst time establishes direct public financing for parties that attain congressionalrepresentation. Negative public opinion, however, forced Congress to postponethis measure indefinitely.
In the short term, the PPL did not have the desired effect of raising barriersto entry and reducing fragmentation. Before its passage, twenty-two parties andmovements were legally registered; in 2006, thirty-five were registered, andtwenty-four fielded candidates in that year’s elections. Although the mediareported deliberate falsification of signatures and nonexistent committees in atleast eleven organizations, the National Election Board (Jurado Nacional de Elec-
22. In September 2005 Congress lowered the barrier to 4 percent for the 2006 race (700,000votes), with an exception for parties winning at least two seats in separate jurisdictions. The differenceis important, since members can be elected from some departments with fewer than 10,000 votes.
11630-07_CH07_rev2.qxd 6/2/09 3:59 PM Page 275
ciones, JNE) ultimately approved the registration of all that applied (Keller,2006).23 The main problem was not the law itself, but the inability of the elec-toral authorities to implement it effectively and the lack of sanctions for non-compliance. Critics also charge that the JNE had little desire to confront theparties and therefore basically practiced conflict avoidance (Tuesta, 2005). Expertshave estimated that had the law been applied correctly, no more than eight par-ties would have been legally registered.
The effect of the electoral threshold is more ambiguous. Seven groups made itinto Congress in 2006, compared with eleven in 2001, and 111 of the 120 seatswere won by the four main blocs. However, the threshold itself apparently had lit-tle effect, as only one potential congressman was eliminated as a result of his partynot passing the bar. The small parties of the Left, which might have passed thethreshold had they formed a single alliance, nevertheless failed to do so.24 Four ofthe seven winning slates were formed hastily for the 2006 election, including theUPP-PNP coalition, created to back the “outsider” candidate and first-round win-ner, Ollanta Humala. Fujimori’s Alianza por el Futuro was also hastily forged bythree different fujimorista movements. Although seventeen parties failed to makethe cut and were de-registered, it remains to be seen whether this will have a last-ing effect on the next elections in 2011.25
Changing the rules also had little immediate effect on party cohesion or con-struction. Apparently, a considerable number of reported party committees werefraudulent or were deactivated soon after registration. The practice of selling partyslates to the highest bidder and making deals with local power brokers seeking atrampoline to Congress remained widespread. This was clearest in the case ofHumala’s electoral operation. Humala used the existing UPP to back his presi-dential bid and list of newcomers, after failing to register his own Partido Nacional-ista. Although they held the largest single voting bloc, the forty-five individualswho reached Congress on his coattails began to distance themselves even beforeinauguration, and the head of his list soon broke ranks to form a party of his own.
Various parties did hold internal elections to select or ratify their leaders, a pos-itive step that was encouraged by heightened media attention. However, themedia also reported numerous cases of party leaders ignoring or overturning theresults of internal elections. It was harder for civil society to monitor transparencyin campaign finances, because numerous parties delayed submitting their accounts
276 e. morón, j. f. castro, and c. sanborn
23. Only the Si Cumple movement was denied the right to compete, because its presidential can-didate, former president Alberto Fujimori, had been banned from holding public office until 2010.
24. According to Rici (2006), only César Acuña of Alianza para el Progreso in La Libertad waseliminated by the valla. Running separately, the leftist parties received 3.2 percent of the total vote.
25. By late 2007 eleven parties were represented in Congress in six parliamentary groups(Campos, 2007b). As of February 2008, 137 groups had requested party registration forms, includ-ing groups seeking re-registration after being excluded by the 2006 results, according to El Comer-cio, February 12, 2008.
11630-07_CH07_rev2.qxd 6/2/09 3:59 PM Page 276
peru 277
until well after the elections, and in many cases the information presented was ofdubious credibility. The electoral authorities were equally ill prepared to reviewand verify parties’ financial reports: ONPE had just three auditors to supervise allparty finances (Keller, 2006). Because the main sanction for noncompliance is theloss of public funding—under a rule that had yet to be approved as of late 2007,and that applies only to those parties with elected representatives—there are fewincentives for the rest to comply.
No Silver Bullet: How to Move Forward with Political Reform
Peruvian democracy today is certainly competitive. Civil liberties have been largelyrestored since 2000, free and fair elections are held, and dozens of parties andmovements have competed for and held public office in recent years. In this sensethe opportunity to participate in the electoral process is “broadly shared.” How-ever, the majority of citizens do not participate in or identify with any party, andvoter preferences remain highly volatile. Citizen discontent is reflected in the riseand fall of presidential approval ratings, in congressional turnover rates of 75to 80 percent each term, and in negative public opinion regarding virtually allrepresentative institutions.26 For many Peruvians, the institutions and rules ofdemocracy are not working, and many would be willing once again to trade themaway for a promise of greater social and economic benefits (see table 6; Programade las Naciones Unidas para el Desarrollo, 2005; Camacho and Sanborn, 2007).
Although it is not the only factor, the weakness of the party system contributesto political volatility, the recurrence of unpredictable “outsiders,” and a Con-gress characterized by inexperience and improvisation, in which the desire to bereelected apparently plays a limited role in shaping behavior. These traits, in turn,make government less accountable and less responsive to citizens’ needs anddemands.
Although few of the institutional reforms undertaken in the past quarter cen-tury can be called irrelevant, some did have design problems, and there were con-tradictions between different rules and reforms. For the most part, changes weremade piecemeal rather than as part of an integrated package. The granting ofgreater authority to the executive, for example, was not accompanied by measuresto guarantee the autonomy and effectiveness of the other branches. The virtues ofinclusion and pluralism were overshadowed by the weakness of the multiparty sys-tem and the frequent changes in leadership, traits that the electoral system andother factors tend to perpetuate. The effort to reform parties from the supply sideprovided inadequate incentives for voluntary compliance.
26. Latinobarómetro 2006 reported that only 20 percent of respondents said they thought thegovernment works for the well-being of the whole nation and not just the elite. By mid-2008,Garcia’s approval ratings placed him among the least popular presidents in the region. See the Con-sulta Mitovsky website, www.consulta.com.mx.
11630-07_CH07_rev2.qxd 6/2/09 3:59 PM Page 277
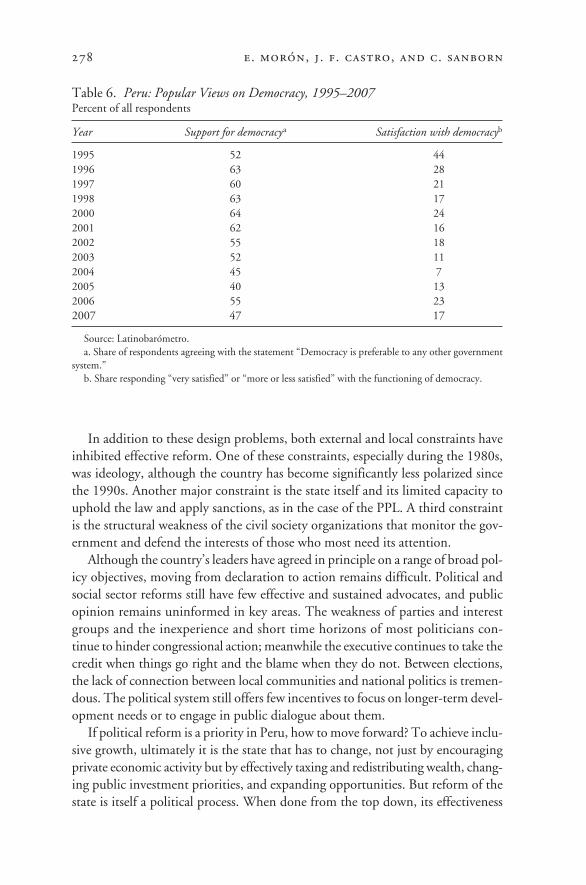
In addition to these design problems, both external and local constraints haveinhibited effective reform. One of these constraints, especially during the 1980s,was ideology, although the country has become significantly less polarized sincethe 1990s. Another major constraint is the state itself and its limited capacity touphold the law and apply sanctions, as in the case of the PPL. A third constraintis the structural weakness of the civil society organizations that monitor the gov-ernment and defend the interests of those who most need its attention.
Although the country’s leaders have agreed in principle on a range of broad pol-icy objectives, moving from declaration to action remains difficult. Political andsocial sector reforms still have few effective and sustained advocates, and publicopinion remains uninformed in key areas. The weakness of parties and interestgroups and the inexperience and short time horizons of most politicians con-tinue to hinder congressional action; meanwhile the executive continues to take thecredit when things go right and the blame when they do not. Between elections,the lack of connection between local communities and national politics is tremen-dous. The political system still offers few incentives to focus on longer-term devel-opment needs or to engage in public dialogue about them.
If political reform is a priority in Peru, how to move forward? To achieve inclu-sive growth, ultimately it is the state that has to change, not just by encouragingprivate economic activity but by effectively taxing and redistributing wealth, chang-ing public investment priorities, and expanding opportunities. But reform of thestate is itself a political process. When done from the top down, its effectiveness
278 e. morón, j. f. castro, and c. sanborn
Table 6. Peru: Popular Views on Democracy, 1995–2007Percent of all respondents
Year Support for democracya Satisfaction with democracyb
1995 52 441996 63 281997 60 211998 63 172000 64 242001 62 162002 55 182003 52 112004 45 72005 40 132006 55 232007 47 17
Source: Latinobarómetro.a. Share of respondents agreeing with the statement “Democracy is preferable to any other government
system.”b. Share responding “very satisfied” or “more or less satisfied” with the functioning of democracy.
11630-07_CH07_rev2.qxd 6/2/09 3:59 PM Page 278
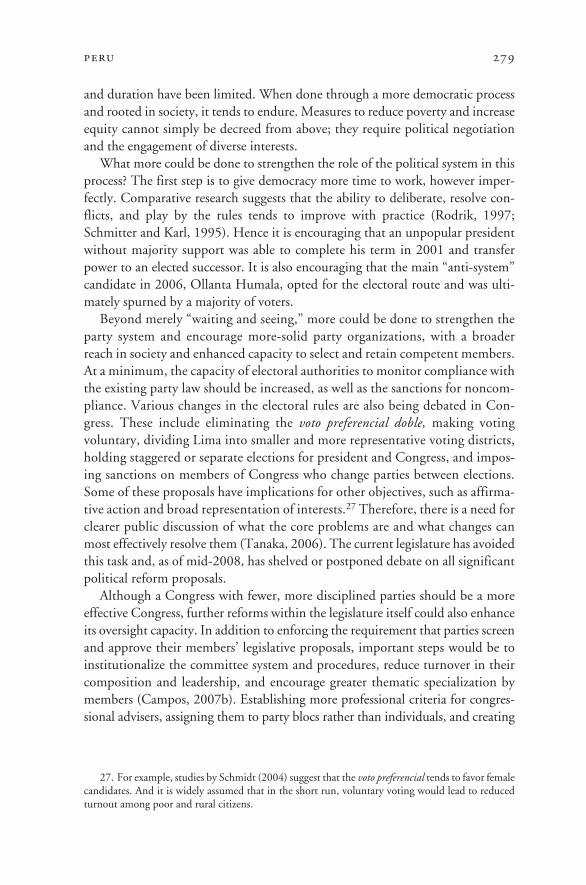
peru 279
and duration have been limited. When done through a more democratic processand rooted in society, it tends to endure. Measures to reduce poverty and increaseequity cannot simply be decreed from above; they require political negotiationand the engagement of diverse interests.
What more could be done to strengthen the role of the political system in thisprocess? The first step is to give democracy more time to work, however imper-fectly. Comparative research suggests that the ability to deliberate, resolve con-flicts, and play by the rules tends to improve with practice (Rodrik, 1997;Schmitter and Karl, 1995). Hence it is encouraging that an unpopular presidentwithout majority support was able to complete his term in 2001 and transferpower to an elected successor. It is also encouraging that the main “anti-system”candidate in 2006, Ollanta Humala, opted for the electoral route and was ulti-mately spurned by a majority of voters.
Beyond merely “waiting and seeing,” more could be done to strengthen theparty system and encourage more-solid party organizations, with a broaderreach in society and enhanced capacity to select and retain competent members.At a minimum, the capacity of electoral authorities to monitor compliance withthe existing party law should be increased, as well as the sanctions for noncom-pliance. Various changes in the electoral rules are also being debated in Con-gress. These include eliminating the voto preferencial doble, making votingvoluntary, dividing Lima into smaller and more representative voting districts,holding staggered or separate elections for president and Congress, and impos-ing sanctions on members of Congress who change parties between elections.Some of these proposals have implications for other objectives, such as affirma-tive action and broad representation of interests.27 Therefore, there is a need forclearer public discussion of what the core problems are and what changes canmost effectively resolve them (Tanaka, 2006). The current legislature has avoidedthis task and, as of mid-2008, has shelved or postponed debate on all significantpolitical reform proposals.
Although a Congress with fewer, more disciplined parties should be a moreeffective Congress, further reforms within the legislature itself could also enhanceits oversight capacity. In addition to enforcing the requirement that parties screenand approve their members’ legislative proposals, important steps would be toinstitutionalize the committee system and procedures, reduce turnover in theircomposition and leadership, and encourage greater thematic specialization bymembers (Campos, 2007b). Establishing more professional criteria for congres-sional advisers, assigning them to party blocs rather than individuals, and creating
27. For example, studies by Schmidt (2004) suggest that the voto preferencial tends to favor femalecandidates. And it is widely assumed that in the short run, voluntary voting would lead to reducedturnout among poor and rural citizens.
11630-07_CH07_rev2.qxd 6/2/09 3:59 PM Page 279
a well-endowed congressional research service available to all members would alsobe steps forward (Tanaka, 2006).
Important as it is to enforce and, where necessary, modify existing rules andinstitutions, that alone is not sufficient. Given the weakness of the current partiesand the reluctance of elected authorities to reform political institutions once theyare on the inside, nongovernmental organizations (NGOs) and the independentmedia must work to monitor politicians’ behavior and keep political reform onthe agenda. It is important to defend and enhance their capacity to do so. NGOsof different orientations involved in research and advocacy are monitoring publicagencies, trying to hold leaders accountable, and providing public education toimprove the quality of citizen demand. They have also provided dozens of trainedprofessionals to the public sector. In recent years NGOs have been created specif-ically to promote various aspects of good government, including fair elections,voter education, stronger parties, budget transparency, and the monitoring oflocal governments and Congress. Although these organizations share some of thesame traits as political parties, they may be better organized and more disposed toform alliances. Combining citizen vigilance with promotion of policy alternatives,and coordinating with the ombudsman and sympathetic members of Congress,such organizations teach citizens to defend their rights and monitor their author-ities. Ultimately, such empowerment of citizens is the best antidote to caudillismoand a necessary complement to reform from within.
Conclusions
The CGD framework has allowed us to identify the broad sharing of the benefitsof growth as the “missing foundation” in Peru and to focus our discussion ofadministrative, educational, and political reform accordingly. This in itself is amajor and novel contribution of the framework, in our view, as it prevents poli-cymakers from being swamped by a laundry list of reforms, all of them necessarybut in the aggregate surpassing the implementation capacity of the country’s insti-tutions. With these limitations in mind, we have proposed a short list of policyinitiatives that we believe can help advance reform. In closing we will rely on theframework once again to explain the potential role of each of these ingredients inthe reform “recipe.”
We argue that Peru finds itself today at the vulnerable equilibrium depicted infigure 6. As explained earlier, our analysis of Peru’s reform efforts starts from apoint when the economy was in a state of emergency. Much of the reform effortof the 1990s was driven (and justified) by this fact. The main concern of govern-ment was to return the economy to viability, restoring basic macroeconomic bal-ance and the ability of private business to ignite economic growth. This was theroute taken by the stabilization plan, which was accomplished by means of “unbri-dled presidentialism” (Morón and Sanborn, 2007).
280 e. morón, j. f. castro, and c. sanborn
11630-07_CH07_rev2.qxd 6/2/09 3:59 PM Page 280
peru 281
Figure 6. Peru’s Vulnerable Equilibrium
State was reformed to allow for proper functioning of markets → propertyrights, equal opportunity, competition, and macro stability are partially secured.
State was NOT reformed to address the delivery of social services → broadsharing is the missing foundation to secure growth.
Few obstacles to put forward economic program/ stabilization plan
Lack of legitimacy: veto groups concentrating demands from public servants → large perceived cost.
Partial success via islands of efficiency in key institutions:• Central Bank• Fiscal & tax authority• Market regulators
Failure to reform institutions in charge of delivering key social services:• Education• Health• Basic infrastructure
Lack of implementation capacity: lack of proper incentives to obtain better outcomes.
Today: ✓ Private investment
fuelling a 7% annual GDP growth.
✓ Urban poverty falling (2006: 31%).
Today:✗ Stagnant rural poverty
(2006: 69%).✗ Latent risk of backlash
against model.
1990: Urgency of situation → need to reform the role of the state was compelling
How to move forward?
Reform political system to foster
proper representation
Start reform focusing on those actions where
the gap between perceived costs and benefits is the least
Institutional constraints: lack of institutions to organize/channel societal demands → small perceived benefit.
Obviously, the reforms of that period could have also focused on distributiveissues or on policies aimed at improving the long-run potential of the less favoredshare of the population, but this path was not taken. The magnitude of the crisisleft by President Garcia and the longer-term failure of state-led development sincethe 1970s partly explain why the thrust of the reforms of the 1990s had to be thuscircumscribed. However, the main reason that the state was not reformed toimprove the delivery of social services and encourage expanded opportunities forthe majority was a combination of a lack of legitimacy and strong institutionalconstraints.
Our analysis of the attempted reforms in the education sector showed thatreforms that explicitly address the issue of exclusion have concentrated costs butdispersed benefits. From the supply side, reform implies designing the right incen-tives for a large number of public servants, and it is difficult to build legitimacyfor such changes in a public sector where salaries have always been disconnected
11630-07_CH07_rev2.qxd 6/2/09 3:59 PM Page 281
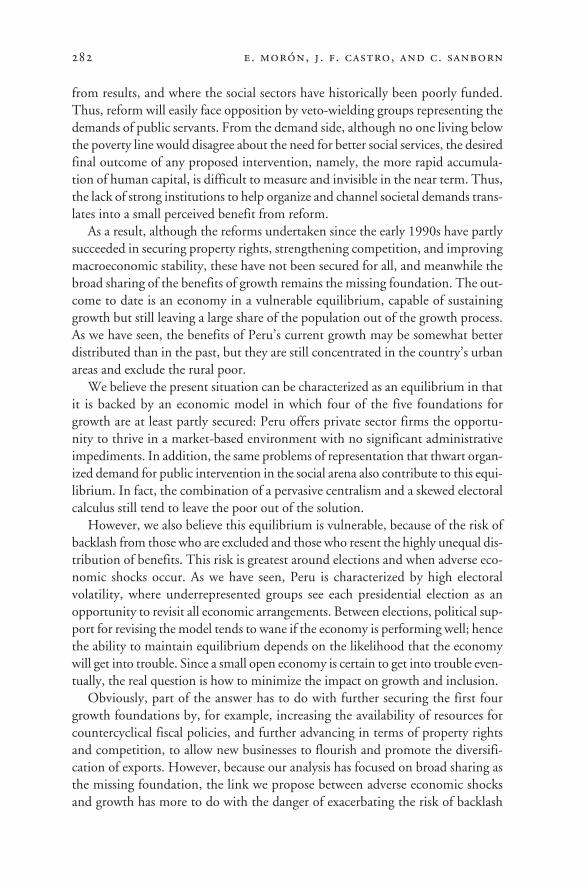
from results, and where the social sectors have historically been poorly funded.Thus, reform will easily face opposition by veto-wielding groups representing thedemands of public servants. From the demand side, although no one living belowthe poverty line would disagree about the need for better social services, the desiredfinal outcome of any proposed intervention, namely, the more rapid accumula-tion of human capital, is difficult to measure and invisible in the near term. Thus,the lack of strong institutions to help organize and channel societal demands trans-lates into a small perceived benefit from reform.
As a result, although the reforms undertaken since the early 1990s have partlysucceeded in securing property rights, strengthening competition, and improvingmacroeconomic stability, these have not been secured for all, and meanwhile thebroad sharing of the benefits of growth remains the missing foundation. The out-come to date is an economy in a vulnerable equilibrium, capable of sustaininggrowth but still leaving a large share of the population out of the growth process.As we have seen, the benefits of Peru’s current growth may be somewhat betterdistributed than in the past, but they are still concentrated in the country’s urbanareas and exclude the rural poor.
We believe the present situation can be characterized as an equilibrium in thatit is backed by an economic model in which four of the five foundations forgrowth are at least partly secured: Peru offers private sector firms the opportu-nity to thrive in a market-based environment with no significant administrativeimpediments. In addition, the same problems of representation that thwart organ-ized demand for public intervention in the social arena also contribute to this equi-librium. In fact, the combination of a pervasive centralism and a skewed electoralcalculus still tend to leave the poor out of the solution.
However, we also believe this equilibrium is vulnerable, because of the risk ofbacklash from those who are excluded and those who resent the highly unequal dis-tribution of benefits. This risk is greatest around elections and when adverse eco-nomic shocks occur. As we have seen, Peru is characterized by high electoralvolatility, where underrepresented groups see each presidential election as anopportunity to revisit all economic arrangements. Between elections, political sup-port for revising the model tends to wane if the economy is performing well; hencethe ability to maintain equilibrium depends on the likelihood that the economywill get into trouble. Since a small open economy is certain to get into trouble even-tually, the real question is how to minimize the impact on growth and inclusion.
Obviously, part of the answer has to do with further securing the first fourgrowth foundations by, for example, increasing the availability of resources forcountercyclical fiscal policies, and further advancing in terms of property rightsand competition, to allow new businesses to flourish and promote the diversifi-cation of exports. However, because our analysis has focused on broad sharing asthe missing foundation, the link we propose between adverse economic shocksand growth has more to do with the danger of exacerbating the risk of backlash
282 e. morón, j. f. castro, and c. sanborn
11630-07_CH07_rev2.qxd 6/2/09 3:59 PM Page 282
peru 283
against the model. The question then becomes how to distribute the benefits ofgrowth in a more egalitarian way, and a significant part of the answer has to dowith reforming the quality and delivery of critical social services.
Before summarizing our answers, we should mention that another consequenceof not having reformed the delivery of social services is the current lack of ade-quate implementation capacity in several key areas. In fact, problems on this frontare as much a consequence as a cause of the lack of reform in the social arena:although islands of efficiency were established within key institutions that servedthe main objectives of stabilization, other sectors, such as justice, education, health,and the provision of basic infrastructure, were virtually ignored, and this, in turn,has contributed to the lack of legitimacy of reform within those sectors.
In concluding, then, we return to the framework and try to take stock of whatwe have learned about the recent reform processes so as to organize our short listof priority reforms. As discussed above, failure to address the delivery of socialservices has led to a vulnerable equilibrium characterized by a potential risk ofbacklash from those excluded. Understanding the role of our proposed policy ini-tiatives requires organizing them in terms of the causes and consequences of thisdecision.
As explained above, reform in the social arena faced two major obstacles: weaklegitimacy and strong institutional constraints. We believe our earlier recom-mendations for political reform can play an important role by mitigating theseobstacles. In particular, working toward a party system that offers better repre-sentation should help organize and channel societal demands in a way that reducesfragmentation and raises the perceived benefit of embarking on a reform thataddresses the broad sharing foundation. All the individuals involved—politicians,government administrators, and citizens—tend to be short-sighted, and thereforeit is hard to set goals that require a longer horizon. In the absence of organizationsthat can channel societal demands in a responsible manner (and away from elec-toral calculus), the impatience of the potential beneficiaries can easily influencethe planner’s own behavior, who then succumbs to the temptation of avoidingpolicies that will deliver only in the long run.
Fine tuning the mechanisms through which the state communicates with itscitizens and attends to their demands must therefore be an essential part of anyserious attempt to reform the delivery of social services. Again, political reformcannot be simply decreed from above; it must be accomplished through a processrooted in society for it to endure.
The path toward a new, less vulnerable equilibrium where growth is morebroadly shared, however, also requires results in the near term. In fact, the longer-term trickle-down process will surely need more time than remains until the nextpresidential election, during which the probability of experiencing an adverseshock is rather high. Thus, policy actions aimed at building up legitimacy andreducing institutional constraints must be accompanied by interventions that
11630-07_CH07_rev2.qxd 6/2/09 3:59 PM Page 283
284 e. morón, j. f. castro, and c. sanborn
directly address the delivery of public services. In this respect, we believe our pol-icy recommendations addressing administrative reform and the education sectorshould play a vital supplementary role. For this to happen, however, reform mustbe decisive, focusing on those actions where the gap between perceived costs andbenefits is the smallest. As already discussed, good examples of such actionsinclude introducing a merit-based career path for new public servants, program-ming budgetary expansions in a results-based format, focusing decentralizationefforts on a pilot macroregion, and avoiding further confrontations with teachersin order to focus on realizing the results to be expected from education reform.
Reforms still pending that address the broad sharing foundation will requirechanging the process by which public services are delivered, and this, in turn, meansdealing with established bureaucracies at the different levels of government.Removing public intervention in markets and creating a new bureaucracy to dealwith regulatory issues is one thing; transforming the way the state provides servicesthat have historically come under its purview—and that employ a large numberof public servants—is quite another. Thus, if results are to be seen in the short term,it must be acknowledged that reform from within is not easy and that changes mustbe introduced incrementally. Focusing and persisting on a narrower set of reformsin the social arena, in turn, will make it much easier to avoid potential designproblems and foster implementation capacity at lower levels of government.
appendix
Judicial Reform in Peru
One of the main obstacles to inclusive growth in Peru is the lack of a well-functioning state, essential to which is an independent and efficient judicialsystem. A strong judiciary is indispensable for upholding the rule of law and therights of all citizens and for ensuring a stable investment climate in which prop-erty rights and contracts are respected. The separation of powers and governmentaccountability are incomplete if the judiciary is subordinated to other powers andinterests.
Peru’s judicial system has been historically weak, and the majority of citizensdo not use it to solve their problems. As documented in numerous studies, accessto justice is limited by longstanding economic, social, and institutional barriers,including ethnic and gender discrimination, the high cost (direct and indirect) ofusing the system, extreme delays, and corruption (Bhansali, 2007; Morón andSanborn, 2007). The judiciary has also been historically subject to external controland manipulation, making it difficult to undertake necessary institutional reformsand give the judiciary greater autonomy. This situation reached a climax in the1990s, when the executive formally intervened and subordinated the judiciary toits own political agenda.
11630-07_CH07_rev2.qxd 6/2/09 3:59 PM Page 284
Since 2001 the judiciary has regained formal autonomy, and some importantreforms have been initiated. These include the creation of special commercialcourts, increases in the judicial budget and the number of judges, and the introduc-tion of a new penal code in two pilot districts—all measures designed to reducethe excess caseload. Through other, extrajudicial measures, including the awardingof tax stability contracts and the promotion of alternative forms of conflict reso-lution, those with resources and power are now better able to defend their rights,within the courts or outside them. However, barriers to access remain in place for themajority of citizens—as does political resistance to a broader reform of the system.
Justice in Peru: The Basic Structure
Peru’s judicial branch comprises the Supreme Court, superior courts in each ofthe country’s twenty-nine judicial districts, courts of first instance, and justices of the peace. The latter, who account for approximately 76 percent of all judges inthe country, are not lawyers or career magistrates but respected community leaderswho serve voluntarily and resolve conflicts on the basis of local custom and culture.Their decisions tend to be widely accepted, but they lack the resources to operateeffectively in all parts of the country (Bhansali, 2007, p. 791).
The 1993 constitution created several new judicial institutions. The NationalJudicial Council is charged with monitoring the designation, promotion, anddismissal of judges. To ensure judicial independence, neither the executive northe legislative branch is represented on the council. A National Judicial Academyis responsible for selecting applicants to judgeships and training judges at all levels.The Tribunal of Constitutional Guarantees is an autonomous organ charged withruling on the constitutionality of all laws passed. The Public Ministry is responsi-ble for representing society in general and for investigating and prosecuting crimes.
The 1993 constitution also created the Public Defender or Ombudsman asan autonomous position entrusted with the defense and protection of civilrights and oversight of public administration and the provision of public services.Although enjoying broad public legitimacy, the Ombudsman is also politicallyvulnerable. He or she is elected by Congress, serves a five-year term, and can bedismissed or impeached by a congressional majority. The Ombudsman’s officealso faces considerable resource limitations that prevent its full presence in allregions.
The Ministry of Justice, which is part of the executive branch, not the judiciary,is charged with defending the interests and rights of the state, advising the executiveon legal matters, and overseeing the development and revision of the state’s legalframework. The ministry also establishes ad hoc prosecutors when necessary toinvestigate charges of corruption and abuse of power.
During the 1990s the Fujimori government intervened extensively in the judi-ciary. After the 1992 “self-coup,” the executive disbanded the existing judiciary,
peru 285
11630-07_CH07_rev2.qxd 6/2/09 3:59 PM Page 285
dismissed thirteen members of the Supreme Court, named a large number ofprovisional judges, and formally placed the judiciary under executive control. By1997, 73 percent of judges had been shifted to provisional status, making themsubject to dismissal at any time and hence highly susceptible to political and eco-nomic pressures (McMillan and Zoido, 2004, p. 13). Members of the judiciarywere coerced, intimidated, and bribed in order to advance the political objectivesof the president and his core advisers.
Although Peru’s Tribunal of Constitutional Guarantees enjoys broad publiclegitimacy, it, too, has been politically vulnerable, and it lacks the power to reversegovernment policies that its counterparts in Brazil and elsewhere enjoy. Congresselects the tribunal’s seven members, who serve five-year terms that coincide withthose of the president and Congress, may not be immediately reelected, and maybe impeached.
Under the interim government of President Valentín Paniagua (2000–01), theExecutive Commission in control of the judiciary was deactivated, and another,temporary council was charged with reforming this branch. Anticorruption pro-ceedings were also initiated against leading political and military figures of the1990s, led by respected special prosecutors named by the executive.
In 2003 judicial reform received a new impetus, led by a Comisión de Reestruc-turación del Poder Judicial (Ceriajus), and congressional commissions were createdto undertake constitutional reform of the system and draft new laws governingjudicial careers and public defenders. Yet so far relatively little progress has beenmade within the judiciary itself toward reducing the main barriers and problemsin the system. And according to judicial expert Fernando Eguiguren (2007), reformefforts by Congress have been stalled by disagreement among those who wantintegral reform of the 1993 constitution, a return to the 1979 constitution, theconvocation of a new constituent assembly, or no further reform at all. Hence,although overt executive intervention has been reduced, resource limitationsand case backlogs remain severe, many judges and attorneys are poorly qualified,and procedures and technology remain outdated. Incentives for corruptionremain great, and experts suggest that it will take considerable time before inde-pendent and efficient behavior by the courts can become the norm (Morón andSanborn, 2007).
Barriers to Access
As emphasized in a recent World Bank report (Bhansali, 2007) and other sources,there are at least three major types of barriers to access to justice in Peru: economic,social, and institutional.
Economic barriers include the official and unofficial costs of judicial servicesand the resulting systemwide corruption. Costs include the payment of judicialfees and lawyers’ fees, the opportunity cost of time involved in litigation, and the
286 e. morón, j. f. castro, and c. sanborn
11630-07_CH07_rev2.qxd 6/2/09 3:59 PM Page 286
cost of bribes for speeding up a case. These costs are especially onerous on the poorand on rural Peruvians generally, who may have to travel and miss work to pursuea case. The scarcity of free legal services exacerbates this situation: according toone recent study, of the 547 lawyers assigned to the justice ministry, only 55 workin the free legal clinics available to needy citizens (Hernandez Breña 2004, citedby Bhansali, 2007, p. 794). The typically long duration of legal proceedings is alsoa barrier for all users, especially the poor.
Costs are especially high for small and microenterprise owners. Studies showthat the costs of litigation are proportionally higher for those with smaller debts,which discourages them from using the system. According to the World Bankreport Doing Business 2005, it takes 381 days and 35 separate procedures to con-clude a commercial contract in Peru. One study cited by Bhansali (2007, p. 794)suggests that if access to justice for small businesses were improved, their economicactivity would increase by 25 to 50 percent.
Peru’s judiciary is rife with corruption, which is both a cause and an effect ofthe system’s inefficiency, and which undermines the system’s legitimacy. Accord-ing to Transparency International, Peru has one of the highest judicial corruptionindexes in the region, and the perception of corruption in the judiciary is the high-est of all public institutions (Bhansali, 2007, p. 794). Users with the necessaryresources can make informal payments to get a case assigned to a specific judge,speed up proceedings, and influence the judge’s sentence. Although several spe-cific cases of judicial corruption have been identified by the media and dealt with,those who benefit from the current situation resist proposals for broader anti-corruption reforms.
Social barriers to justice in Peru include language barriers and culture andgender disparities. As with other public services, indigenous people, the ruralpoor, and especially low-income women lack equal access to the courts. Thepredominant language in the judicial system is Spanish, and the system is formalis-tic, complex, and based heavily on written proceedings. Many rural and indigenousPeruvians have an inadequate grasp of Spanish to understand the legal technical-ities involved, and have difficulty presenting their cases to lawyers and judgesand exercising fully their right to a defense. Efforts to train translators in nativelanguages and to encourage use of such languages in the courts have been limited,as have efforts to incorporate cultural and gender sensitivities into legal andjudicial training.
Traditional forms of community justice, although widely respected by the pop-ulation, remain subordinated to a legal system that is not always appropriate forresolving conflicts. Although the 1993 constitution recognizes special jurisdictionfor peasant and indigenous communities, little attention has been paid to itseffective and fair implementation (Bhansali, 2007, p. 797). The media frequentlycover stories of exasperated community members “taking justice into their ownhands” in cases involving robbery, rape, or property disputes.
peru 287
11630-07_CH07_rev2.qxd 6/2/09 3:59 PM Page 287
Gender discrimination and the sexist application of laws are also a seriousproblem and are aggravated in the case of rural women. The inefficiencies of thesystem also affect women more, to the extent that they have lower incomes andless education and are less informed about their rights. Men and women in Perutend to have recourse to the judicial system for different needs, following the rolesassigned them by society. Women tend to be plaintiffs in cases related to childsupport, domestic violence, and the dissolution of marriage. The sheer volume ofunresolved cases of this type, the slowness of the proceedings, the lack of preparedjudges, and the vulnerability of the system to corruption all take a toll on the womeninvolved. One study shows that 75 percent of demands for child support presentedby women in 1998 were still unresolved in 2002 (Bhansali, 2007, p. 798). A recentmedia report (El Comercio, February 16, 2008, p. A2) suggests that a case ofdomestic violence takes a year or more on average just to get a hearing.
Institutional barriers to access to justice include lack of transparency in theselection of judges and lack of adequate training, resulting in inadequate knowl-edge of norms and jurisprudence in the material they must resolve. The excessivelyformalistic and bureaucratic behavior of judges and their often literal and closedinterpretation of laws create especially difficult obstacles to the execution of con-tracts. Many judges are unfamiliar with the fields of law that most affect privateeconomic activity, such as those pertaining to antitrust regulation, banking, insur-ance, and securities.
The excessive backlog of court cases is another major problem, causing longdelays and errors and encouraging corruption. As of June 2007 over 2.2 millioncases were pending, including civil and penal cases (and not including the SupremeCourt). The largest caseload is in the Superior Court of Lima, and the heaviestbacklog of cases is in the administrative area, which includes cases relating to pen-sion benefits. Family courts also have an especially excessive caseload, as do penalcourts in the low-income periphery of Lima (“Poder Judicial Emprende Plan deDescarga Procesal, Anuncia Távara,” ANDINA, February 14, 2008, citing Távara,2007). To catch up, each of the country’s 1,617 judicial entities would have toresolve 1,376 cases a year—a clearly impossible task.
The precarious, provisional status of most judges is another major problem.Although efforts have been made to formalize judicial hiring through the NationalJudicial Council and to extend to legal professionals the kind of job stabilitythat an independent judiciary requires, a report in December 2007 claimed that51 percent of judges and 34 percent of prosecutors still held provisional positions(Villavicencio, 2007). Among them are judges temporarily assigned to cover avacancy for which they may not be prepared, and judgeships temporarily assignedto lawyers who are not career judges or prosecutors. Although this precariousnessis partly the result of efforts to expand coverage and address the backlog of cases,it poses continued problems for judicial independence and leaves judges vulnerableto internal and external pressures
288 e. morón, j. f. castro, and c. sanborn
11630-07_CH07_rev2.qxd 6/2/09 3:59 PM Page 288
Reform Efforts and Their Limitations
One of the most celebrated recent reforms has been the creation of a set of com-mercial courts to resolve conflicts facing private business. According to variousreports, the initiation of negotiations toward a free trade agreement with theUnited States underscored the need for improvement in the administration ofcommercial justice, given the lack of specialization of civil judges in this area aswell as the excessive case backlog.
In 2005 a pilot program of seven commercial courts and one superior courtbegan in Lima, as part of a larger program supported by the U.S. Agency for Inter-national Development. Civil society organizations initially questioned the cre-dentials of these judges and the lack of transparency in their selection, and itremains unclear whether the judges hired have the skills and experience needed to resolve commercial, banking, and tax controversies involving large sums.Nonetheless, in their first year of operation these courts resolved 80 percent of the6,437 cases submitted to them, and after two years their superior efficiency andgreater transparency were cited by judicial experts and business leaders alike as amodel for the rest of the system (Bhansali, 2007, p. 803, reports that they havereduced the duration of commercial proceedings by 70 percent). According toDoing Business 2007, this is one of five reforms that have placed Peru among theten countries that have undertaken the most reforms to facilitate commercialactivity (“Firma del TLC Obliga a Estructura una Agenda Interna para su Imple-mentación, opinan,” ANDINA, December 25, 2007; “Premio 20007 BuenasPrácticas Gubermentales: Ganadores 2007” [www.ciudadanosaldia.org/premiobpg2007/ ganadores_2007.pdf]). The main limitation so far has been their lim-ited scope, and the challenge now is to expand their number and reach beyondthe capital.
Another recent reform, also in the pilot stage, is the introduction of a new penalcode that will replace the traditional, inquisitional system with a more agile sys-tem with impartial judges and both sides entitled to an equal and separate defense(Ideele no. 184, December 2007, pp. 42–43). This system was introduced in thedistricts of Huaura and La Libertad in 2007, with promising results, and is set togo into effect in Tacna, Moquegua, and Arequipa in 2008. It will not be intro-duced in Lima until 2013.
In May 2007 the judiciary launched a new National Plan for Caseload Reduc-tion, involving the review and updating of files on existing cases and the creationof 116 new judicial organs in the 29 superior courts, as well as 120 transitory juris-dictional organs. Yet it is widely recognized that creating more temporary courtsis not enough. The system also needs to be modernized and endowed with moreeffective controls.
In 2007 Congress also approved (but the president did not sign) new legisla-tion regulating the judicial career. That same year a respected female judge was
peru 289
11630-07_CH07_rev2.qxd 6/2/09 3:59 PM Page 289
named as the new anticorruption czar, but it is not clear what her jurisdiction willbe or how this office will interact with other public sector entities.
Meanwhile the majority of citizens remain excluded from the system, andlittle has been done to extend access to justice more broadly to the poor. Theprovisional and precarious nature of judgeships exacerbates the other ineffi-ciencies of the system and makes it harder to achieve reform from within.Salaries and working conditions for judges and judicial employees also remaina sore point, as demonstrated in a prolonged strike by judicial workers in late2007 and early 2008.
Policy Recommendations and Priorities
The need to reduce costs and other inefficiencies in the judicial system is widelyrecognized, and numerous reform proposals have been debated in recent years.External donors and lenders have also given judicial reform high priority, both inthe 1990s (ironically) and since 2001. Proposals on the books range from mech-anisms to improve judicial training, increase transparency, and increase sanctionson corruption to further initiatives to reduce caseloads directly by increasing thenumber of judges and courts.
There has been far less emphasis on efforts aimed at the broader sharing ofbenefits through reducing costs and increasing access for the low-income popula-tion, including individuals and small businesses. Proposals pending in this areainclude strengthening the justices of the peace and improving coordination betweenthem and other levels of the system; providing better training for the judges andcommunity leaders who exercise these functions; and including language, cultural,and gender understanding as part of that training. There is also an urgent need toinstall more basic institutions of justice in areas of high poverty, facilitate accessto legal assistance and orientation for the most vulnerable, and expand initiativessuch as the Centers for Free Legal Advice (Asistencia Legal Gratuita, or ALEGRA),which combine public defenders, legal consultants, and extra judicial conciliationservices in one place. Expanding the commercial courts to include other jurisdic-tions beyond Lima, with judges versed in the needs and rights of small businessesas well as of larger firms, would also be an important step forward. However, inorder to move from pilot efforts to broader systemic change, and to shift prioritiesto the most vulnerable sectors of society rather than the rich and powerful, con-siderably more political will is required than has been shown so far.
290 e. morón, j. f. castro, and c. sanborn
11630-07_CH07_rev2.qxd 6/2/09 3:59 PM Page 290
References
Alvarado, Betty, and Eduardo Morón. 2007. “Hacia un Presupuesto por Resultados: Afian-zando la Transparencia y la Rendición de Cuentas en el Perú.” Universidad del Pacífico.
Bhansali, Lisa L. 2007. “Justicia.” In Marcelo M. Guigale, Vicente Fretes-Cibils, and JohnL. Newman, eds., Perú: La Oportunidad de un País Diferente. Washington: World Bank.
Bejar, R., and R. Montero. 2006. “Equidad y Financiamiento de la Educación Superior Uni-versitaria Pública en el Peru: Análisis y Propuesta de Reforma.” Universidad del Pacifico.
Benavides, M., and J. Rodríguez. 2006. “Políticas de Educación Básica 2006–2011.” CIES,GRADE, Pontificia Universidad Católica del Perú.
Camacho, Luis, and Cynthia Sanborn. 2007. “Desempeño Institucional y SostenibilidadDemocrática: El Impacto de la Provisión Pública de Infraestructura sobre las PercepcionesPolíticas de la Ciudadanía.” Universidad del Pacífico.
Campos, Milagros. 2008. “El Presidente y las Leyes en Camino.” Diario Correo, February 13.———. 2007a. “Reformas en el Congreso: La de los Asesores.” Diario Correo, May 25.———. 2007b. “El Congreso y las Políticas Públicas.” Diario Correo, July 18.Carey, John M. 2003. “Transparency Versus Collective Action: Fujimori’s Legacy and the Peru-
vian Congress.” Comparative Political Studies 36, no. 9: 983–1006.Castro, J. F. 2006. “Política Fiscal y Gasto Social en el Perú: Cuánto Se Ha Avanzado y Qué
Más Se Puede Hacer para Reducir la Vulnerabilidad de los Hogares.” Documento de Dis-cusion CIUP DD/06/05. Lima: Ministerio de Economía y Finanzas and CorporaciónAndina de Fomento.
Castro, J. F., and G. Yamada. 2006. “Evaluación de Estrategias de Desarrollo para Alcanzar losObjetivos del Milenio en América Latina: El Caso del Perú.” Documento de Discusión CIUPDD/06/11. United Nations Development Program, World Bank, and Inter-AmericanDevelopment Bank.
Corrales, J. 2006. “Application of the Framework to Argentina’s Reform of Primary andSecondary Education.” Center for Global Development.
Cotlear, D., ed. 2006. Un Nuevo Contrato Social para el Perú. ¿Cómo Lograr un País MásEducado, Saludable y Solidario? Washington: World Bank.
Crabtree, J. 2006. “Partidos Políticos e Intermediación en el Peru.” In Construir Instituciones:Democracia, Desarrollo y Desigualdad en el Perú desde 1980, pp. 34–50. Lima: Centro de Inves-tigación de la Universidad del Pacífico and Red para el Desarrollo de las Ciencias Sociales.
Datt, G., and M. Ravallion. 1992. “Growth and Redistribution Components of Changes inPoverty Measures: A Decomposition with Applications to Brazil and India in the 1980s.”The Living Standards Measurement Study. Washington: World Bank.
Eguiguren, Francisco. 2007. “Reforma Judicial y Reforma de la Constitución.” Peru21, Feb-ruary 22.
Frieden, Jeffrey. 2007. “Peru in Latin America: Similarities and Differences, Causes andEffects.” In Ricardo Hausmann, Eduardo Morón, and Francisco Rodriguez, eds., The Peru-vian Growth Puzzle. Harvard University.
Goñi, Edwin, Humberto López, and Luis Servén. 2008. “Fiscal Redistribution and IncomeInequality in Latin America.” World Bank Policy Research Paper 4487. Washington: WorldBank.
Hanushek, E., and L. Wöbmann. 2007. “The Role of Education Quality in EconomicGrowth.” World Bank Policy Research Working Paper 4122. Washington: World Bank.
Hernández Breña, Wilson. 2004. “Implicancias entre la Insuficiencia Económica y la Demandade Recursos.” Informativo Justicia Viva no. 17. Lima.
Kakwani, N., and E. Pernia. 2000. “What Is Pro-poor Growth?” Manila: Asian DevelopmentBank.
peru 291
11630-07_CH07_rev2.qxd 6/2/09 3:59 PM Page 291
Karl, Terry. 1996. ¿Cuánta Democracia Acepta la Desigualdad? Lima: Instituto de Estudios Peru-anos, Materiales de Política, Cultura y Sociedad.
Keller, L. 2006. “La Ley de Partidos Políticos.” Lima: Centro de Investigación de la Universi-dad del Pacífico.
Kenney, Charles. 2004. Fujimori’s Coup and the Breakdown of Democracy in Latin America.Notre Dame University Press.
Llosa, Gonzalo, and Ugo Panizza. 2007. “Peru’s Great Depression: A Perfect Storm?” InRicardo Hausmann, Eduardo Morón, and Francisco Rodriguez, eds., The Peruvian GrowthPuzzle. Harvard University.
Lucas, R. 1988. “On the Mechanics of Economic Development.” Journal of Monetary Economics22: 3–42.
McMillan, John, and Pablo Zoido. 2004. “How to Subvert Democracy: Montesinos in Peru.”Journal of Economic Perspectives 18, no. 4 (Autumn): 69–92.
Mainwaring, S., and T. Scully. 1995. Building Democratic Institutions. Stanford University Press.Ministerio de Educación. 2005. “IV Evaluación Nacional del Rendimiento Estudiantil—2004
Resultados.” Lima.Morón, Eduardo, and María Bernedo. 2007. “La Productividad de la Economía Peruana:
1950–2006.” Centro de Investigación de la Universidad del Pacífico.Morón, Eduardo, and Cynthia Sanborn. 2007. “Los Desafíos del Policymaking en el Perú:
Actores, Instituciones y Reglas de Juego.” Universidad del Pacífico.Ortiz de Zevallos, G., H. Eyzaguirre, R. M. Palacios, and P. Pollarolo. 1999. “La Economía
Política de las Reformas Institucionales en el Peru: Los Casos de Educación, Salud, y Pen-siones.” Working Paper R-348. Washington: Inter-American Development Bank.
Payne, M., D. Zovatto, F. Carrillo, et al. 2002. Democracies in Development. Washington:Inter-American Development Bank and International Institute for Democracy and Elec-toral Assistance.
Programa de las Naciones Unidas para el Desarrollo. 2005. La Democracia en America Latina:Hacía una Democracia de Ciudadanos y Ciudadanas (democracia.undp.org).
Rici, C. 2006. “Effect of the Electoral Threshold.” Peru Elections 2006 (weblog). University ofBritish Columbia (weblogs.elearning.ubc.ca/peru/archives/025657.php).
Rodríguez, J. 2008. “La Educación Superior en el Perú.” Pontificia Universidad Católica delPerú.
Rodrik, Dani. 1997. “Democracy and Economic Performance.” Harvard University.Saavedra, Jaime. 2000. “La Flexibilización del Mercado Laboral.” In Roberto Abusada, Fritz
DuBois, Eduardo Morón, and José Valderrama, eds., La Reforma Incompleta. Lima: InstitutoPeruano de Economía y Universidad del Pacífico.
Sanborn, Cynthia. 1991. “The Democratic Left and the Persistence of Populism in Peru:1975–1990.” Ph.D. dissertation, Harvard University.
Sanborn, Cynthia, and Aldo Panfichi. 1996. “Fujimori y las Raíces del Neopopulismo.” InFernando Tuesta, ed., Los Enigmas del Poder: Fujimori 1990–1996. Lima: FundaciónFriedrich Ebert.
Santiso, Carlos. 2004. “Legislatures and Budget Oversight in Latin America: StrengtheningPublic Finance Accountability in Emerging Economies.” OECD Journal on Budgeting 4,no. 2: 47–76.
Santiso, Carlos, with Arturo Garcia Belgrano. 2004. “Politics of Budgeting in Peru: LegislativeBudget Oversight and Public Finance Accountability in Presidential Systems.” SAIS Work-ing Paper WP/01/04. Johns Hopkins School of Advanced International Studies (January).
Schmidt, G. 2004. “Peru: The Politics of Surprise.” Northern Illinois University.Schmitter, P., and T. Karl. 1995 “¿Qué Es y Qué No Es Democracia?” In R. Grompone, ed.,
Instituciones Políticas y Sociedad: Lecturas Introductorias. Lima: Instituto de Estudios Peruanos.
292 e. morón, j. f. castro, and c. sanborn
11630-07_CH07_rev2.qxd 6/2/09 3:59 PM Page 292
Sen, Amartya. 1999. “Democracy as an Universal Value.” Journal of Democracy 10, no. 3: 3–17.Tanaka, Martín. 1998. “Los Espejismos de la Democracia: El Colapso del Sistema de Partidos
en el Perú, 1980–1995, en Perspectiva Comparada.” Lima: Instituto de Estudios Peruanos.———. 2006. “La Reforma Política y el Nuevo Gobierno.” Argumentos 1, no. 6: 4–6.Távara, Francisco. 2007. “Los Juzgados Comerciales Registran Corrupción Cero.” El Peruano,
Lima (April 11).Tuesta, Fernando. 1996. “El Impacto del Sistema Electoral sobre el Sistema Político Peruano.”
In F. Tuesta, ed., Los Enigmas del Poder. Fujimori 1990–1996. Lima: Fundación FriedrichEbert.
———. 2005. Representación Política: Las Reglas También Cuentan. Sistemas Electorales y Par-tidos Políticos. Lima: Fundación Friedrich Ebert and Pontificia Universidad Católica del Perú.
Tuesta, Fernando, and Tatiana Mendieta. 2007. “Hecha la Ley ¿Hecha la Trampa?: Una Eval-uación del Financiamiento de los Partidos Políticos.” Derecho-PUCP, Revista de la Facultadde Derecho de la Pontificia Universidad Católica del Perú no. 59.
Ugarte, Mayen. 2000. “La Reforma del Estado: Alcances y Perspectivas.” In Roberto Abusada,Fritz DuBois, Eduardo Morón, and José Valderrama, eds., La Reforma Incompleta. Lima:Instituto Peruano de Economía and Universidad del Pacífico.
Villavicencio, Alfredo. 2007a. “Reforma de la Justicia: Como el Ir y Venir de las Olas del Mar.”Ideele no. 184 (December), p. 27.
———. 2007b. “Magistratura: Pocos Titulares y Muchos Precarios.”, Ideele no. 184 (December),p. 28–29.
Webb, R., and S. Valencia. 2006. “Recursos Humanos.” In M. Giugale, V. Fretes Cibilis, andJ. Newman, eds., Peru: La Oportunidad de un País Diferente. Washington: World Bank.
Yamada, G., and J. F. Castro. 2007. “Poverty, Inequality and Social Policies in Perú: As PoorAs It Gets.” Documento de Discusion CIUP DD/07/06. Corporación Andina de Fomentoand Harvard University Center for International Development.
Yamada, G., J. F. Castro, A. Beltrán, and M. De Cárdenas. 2007. “Educational Attainment,Growth and Poverty Reduction within the MDG Framework: Simulations and Costing forthe Peruvian Case.” PMMA Working Paper 2008–05. Quebec: Poverty and Economic PolicyResearch Network.
peru 293
11630-07_CH07_rev2.qxd 6/2/09 3:59 PM Page 293

11630-07_CH07_rev2.qxd 6/2/09 3:59 PM Page 294
295
REGIS BONELLI
ECOSTRAT Consultants and Instituteof Applied Economic Research
Brazil
MAURICIO CÁRDENAS
Brookings InstitutionUnited States
ARMANDO CASTELAR PINHEIRO
Institute of Applied Economic ResearchBrazil
JUAN FRANCISCO CASTRO
Universidad del PacificoPeru
IRENE CLAVIJO
FedesarrolloColombia
Contributors
JORGE CORNICK
Eureka Comunicación and AutoridadReguladora de los Servicios Públicos
Costa Rica
JAVIER CORRALES
Amherst College
SAMUEL DE ABREU PESSÔA
Getulio Vargas FoundationBrazil
JOSÉ DE GREGORIO
Central Bank of Chile
AUGUSTO DE LA TORRE
World Bank
GERARDO ESQUIVEL
El Colegio de Mexico
11630-08_Contributors.qxd 6/2/09 4:08 PM Page 295
FAUSTO HERNÁNDEZ-TRILLO
Centro de Investigación y DocenciaEconómicas
Mexico
SIMON JOHNSON
Sloan School of Management,Massachusetts Institute ofTechnology
EDUARDO LORA
Inter-American Development Bank
EDUARDO MORÓN
Universidad del PacificoPeru
CARMEN PAGÉS
Inter-American Development Bank
LILIANA ROJAS-SUAREZ
Center for Global Development
NATALIA SALAZAR
FedesarrolloColombia
296 contributors
CYNTHIA SANBORN
Universidad del PacificoPeru
ERNESTO STEIN
Inter-American Development Bank
ROBERTO STEINER
FedesarrolloColombia
ALBERTO TREJOS
Instituto Centroamericano deAdministración de Empresas
Costa Rica
KURT WEYLAND
University of Texas at Austin
JEROMIN ZETTELMEYER
International Monetary Fund
ABOUT THE EDITOR
LILIANA ROJAS-SUAREZ is a senior fellow at the Center for Global Developmentand chair of the Latin American Shadow Financial Regulatory Committee. Shehas previously served as managing director and chief economist for LatinAmerica at Deutsche Bank and as the principal advisor in the Office of ChiefEconomist at the Inter-American Development Bank. From 1984 to 1994, sheheld various positions at the International Monetary Fund, most recently asdeputy chief of the Capital Markets and Financial Studies Division of theResearch Department. Rojas-Suarez has published widely in the areas of macro-economic policy, international economics, and financial markets.
11630-08_Contributors.qxd 6/5/09 11:12 AM Page 296
Analytical framework for evaluation of LatinAmerican economies: assessment ofdemocratic governance, 12, 14–15;assessment of financial openness, 7–11;classification of reform strategies, 56–57;common features of recommendations,35; distinctive features, 17; findings fromcase studies, 23–32, 43–53, 63–65;foundations for growth, 20, 21–22,54–56; goals, 17–18, 34–35, 53–54;main elements, 17–23; need for, 5–6;reasons for poor reform outcomes,58–61; recommendations arising fromcase study findings, 32–34, 35. See alsoFoundations for economic growth
Argentina, 4, 7, 43
Basel Committee for Banking Supervision,58–59, 60, 61
Bolivia, 59Bonds, international, 9, 21Brady Plan, 9Brazil: anti-market aspects of reforms, 69,
78–83, 106; constitutional reforms, 69,83, 93, 106; corruption, 104–05; distri-
bution of wealth and benefits of growth,72–75, 77–78, 80–81, 86–87, 106–07;economic performance, 70–72; educa-tional reform, 88, 97–101; financial sec-tor reform, 87, 96–97; fiscal reform, 69,76, 81, 87, 88–92; future challenges andopportunities, 74, 107–08; growthdecomposition, 72; income per capita, 4;judicial system, 33, 87, 92–96; labor reg-ulation, 81; macroeconomic policy andperformance, 29–30, 79–80, 86, 107;motivation for income transfers, 24;policy reforms and outcomes, 23, 25,29–30, 43, 75–86, 106–07; politicalobstacles to reform implementation, 60,83–86, 103, 106–07; political reforms,103–06; poverty, 73; productivity,71–72, 78, 81, 106; property rightsregime, 28, 30, 33, 77, 79–80, 84, 86,94, 107; reasons for poor reform out-comes, 68–69, 71, 78, 79–82, 106–07;recent changes in pace of reform, 81–82;recommendations for reform agenda, 33,89–106; regulatory reform, 101–03; sig-nificance of reform experience, 68, 70;
Index
297
11630-09_Index.qxd 6/2/09 4:07 PM Page 297
social security and pension systems, 78,81, 88, 89–91; social spending, 74–75,78, 79, 80–81, 84–85, 106, 107; strate-gies to enhance foundations for growth,86–88; targeting of reforms, 68–69, 76;tax policy, 29, 74–75, 76, 79, 81, 88,91–92, 96; trade policies, 76, 77. See alsoLatin America
Capital account liberalization, 7–11, 21CGD framework. See Analytical framework
for evaluation of Latin Americaneconomies
Chile, 3, 4, 5, 41, 43, 49Colombia: constitutional reform, 114,
123–24; decentralization of governanceand social services, 114, 122, 137–39,148–49; distributive goals of reforms,118, 120; distributive outcomes ofreforms, 116, 122–24; economicdevelopment, 112–13; educationalsystem, 141–44; financial sectorregulation, 120, 121, 126–27, 132–35,147; fiscal policy, 115–16, 135–36,137–39; goals of 1990s reforms, 114,118–24; health care system, 122–23,126, 139–41, 149; infant mortality, 45;judicial system, 33–34, 123–24, 125–27,144–45; labor regulation, 120–21, 125,129–31, 146–47; macroeconomic policyand performance, 30–31, 118–20,121–22; motivation for income transfers,24; pension system, 121–22, 126,136–37; policy reforms and outcomes,25, 30–31, 112–18, 124–44, 149–50;political reforms and outcomes, 127–29,145–46; poverty, 45, 116–18; pro-ductivity, 112, 114; property rightspolicies, 114; reasons for poor reformoutcomes, 118, 124–25, 156–60;recommendations for policy reform,33–34, 118, 144–49; reforms to enhancecompetition, 114, 118, 120–21; socialservice delivery, 34; tax policies, 122,126, 131–32, 148; trade policies, 120.See also Latin America
Competition, economic and political:Brazil’s reform goals and outcomes,76–77, 79–80, 96–97; case studyreforms and outcomes, 24, 25;
Colombia’s reforms to enhance, 114,118, 120–21, 127–28, 132–33; CostaRica’s reform experience, 31, 161, 164,188; foundations for economic growth,21, 55; Mexico’s reforms and outcomes,29, 194, 216–24, 226, 227, 229–32;negative outcomes of reforms to improvepolitical access, 128–29; Peru’s reformoutcomes, 245; recommendations arisingfrom case study findings, 33. See alsoFoundations for economic growth
Corruption, 104–05Costa Rica: administrative reform in
government, 160–61, 169–74;distributive goals of reforms, 164;distributive outcomes of reforms,157–58, 188–89; electoral law, 166–68;exchange rate, 184–85; foreign directinvestment, 182, 183–84; futurechallenges and opportunities, 160,174–75; goals of reforms, 161–62;governance structure and performance,34; immigration into, 158; legislativereform, 160, 162–69; macroeconomicpolicies and performance, 31, 161, 164,188, 190; policy reforms and outcomes,23, 25, 31–32, 153, 155; politicalcontext of policy reforms, 31–32,155–56, 159–60, 177–78, 190–91;poverty, 156–57, 158, 188, 189;property rights regime, 26–28, 164,187–88; public debt, 175; recenteconomic performance, 154–56;recommendations for policy reform, 34,167–69, 173–74, 177–79, 182, 185–87;referenda, 168–69; reforms to enhancecompetition, 164, 188; significance ofreform experience, 153–54, 187–91;social service delivery, 158–59; taxpolicy, 161, 174–79; telecommu-nications industry, 161, 162, 179–82;trade policy, 162, 182–87; trans-portation infrastructure, 171–73. See also Latin America
Dominican Republic, 63
Economic development: analyticalapproaches, 17–18; Brazil, 70–72;Colombia, 112–13; Costa Rica, 154–56;
298 index
11630-09_Index.qxd 6/2/09 4:07 PM Page 298
distinctive features of Latin Americaneconomies, 6–7; educational reformlinkage, 253–54; financial openness ofnational economy and, 7–11; findingsfrom Latin American case studies, 23;future challenges and opportunities, 4–5,11–12, 41; identifying constraints to,18–19; income inequality and, 16–17,47–53; institutional capacity and, 18,21, 59, 60, 64; international comparison,40–41; Latin America’s experience, 1–2,38–41; Mexico, 195–96, 202; Peru, 236,237, 238–39, 241; reasons for reformfailures, 46–53; reform goals not relatedto economic growth, 43–46; secondgeneration reform strategies, 18; socialwelfare spending and, 30–31. See alsoAnalytical framework for evaluation ofLatin American economies; Foundationsfor economic growth; Gross domesticproduct; Income per capita
Educational attainment: disparities in LatinAmerica, 49–50, 53; economic growthlinkage, 253–54; poverty and, 254–56
Educational reform: Brazil, 88, 97–101;Colombia, 141–44; Costa Rica, 169;decentralization effort, 258, 261–62;government intervention rationale, 244;performance evaluation and meritrewards, 258–59, 263–64; Peru, 253–66
Energy sector, Brazil, 102–03Environmental protection, Brazil, 102
Financial services: access, 49, 62, 134, 135,214–15; Brazil, 87, 96–97; Colombia,120, 121, 126–27, 132–35, 147; judicialsystem as obstacle to reform, 229;Mexico, 214–15, 224–32; Peru, 248;property rights regime and, 229
Fiscal policy reforms: Brazil, 69, 81, 87,88–92; Colombia, 115–16, 135–36,137–39; Costa Rica, 174–79; Peru,242–44
Foreign direct investment in Costa Rica,182, 183–84
Foundations for economic growth: benefitsof trade liberalization, 183; Brazil’sreform policies and outcomes, 76–78,86–87; Colombia’s reform policies andoutcomes, 111, 114, 118–24; conceptual
evolution, 18–20; Costa Rica’s reformpolicies and outcomes, 161–62, 187–88;democratization and, 244; foundations,21–22, 54–56; goals for case studyanalyses, 53–54; government role, 54;importance of, 56; market economiesand, 54–55; Mexico’s policies andoutcomes, 196–200, 214–15, 218–19,228–29; obstacles to positive reformeffects, 58–61; public sector adminis-tration effects on, 169; reform outcomesin case studies, 23–32, 63–65; reformoutcomes in Peru, 242–46, 282–83;strategies for strengthening, 25–28,56–58; targeting, 68–69; weakening of,as reform outcome, 28–32. See alsoCompetition, economic and political;Inequities in income and access toopportunity; Macroeconomic policy;Property rights
Global Emerging Market Bond Index, 21Gross domestic product: Brazil, 70, 71–72;
Colombia, 112; Costa Rica, 154; Peru,247; recent performance in LatinAmerica, 1–2. See also Income/GDP per capita
Guatemala, 4
Health care system, Colombia, 45, 139–41,149
Honduras, 7Human Development Index, 3
Income/GDP per capita: Brazil, 70–71,73–74; Costa Rica, 155; Mexico, 193,195, 202; patterns and trends in LatinAmerica, 1–2, 4, 38–40; Peru, 238;reform goals not related to growth in,43–46. See also Inequities in income andaccess to opportunity
Inequities in income and access toopportunity: Brazil, 72–75, 77–78,80–81, 83–87, 106–07; causes, 16;Colombia, 114, 116, 118, 120, 122–24,134, 135; Costa Rica, 157–58, 161, 164,188–89; democratic governance in LatinAmerica and, 47–48, 83–86, 106;distinctive features of Latin Americaneconomies, 6–7, 16, 17; economic
index 299
11630-09_Index.qxd 6/2/09 4:07 PM Page 299
development and, 16–17; educationalattainment and, 254–56, 264–65;financial services access, 49, 62, 134,135, 214–15; foundations for economicgrowth and, 21, 22, 55–56; goals oflabor reform, 244; implications forpolicy development and performance,17, 47, 48–53, 64; internationalcomparison, 2–4, 48; judicial systemaccess, 123–24, 125; Mexico, 198, 199,200–01, 207, 214–15; obstacles tosuccessful reform, 60–61, 64, 84;patterns and trends, 2–4, 16, 40; Peru,28, 239–41, 245–46, 254–56, 264–65;political motivations for transfers, 24,30, 83–84, 106; public perception,55–56; social spending and, 74–75;strategies for improving, 64; tradeliberalization outcomes, 207; urban–rural,28. See also Foundations for economicgrowth
Institutional capacity, economicdevelopment and, 18, 21, 59, 60, 64
International comparison: access to servicesand benefits, 48–49; Brazil’s growthdecomposition, 72; democratic gover-nance, 12–14; economic performance,40–41; financial openness, 7; incomedistribution patterns and trends, 2–4, 48
Judicial system: Brazil, 87, 92–96;Colombia, 33–34, 123–24, 125–27,144–45; costs of improved access,125–27; goals, 244; legislative reviewfunction, 34; Mexico, 213–16, 221–22,229; obstacles to financial sector reform,229; performance indicators, 93–94;recommendations for reform, 33–34,94–95, 144–45, 214–16
Labor regulation: Brazil, 81; Colombia,120–21, 125, 129–31, 146–47; toincrease equality of opportunity, 244
Land ownership, 48–49Latin America: common features of reform
outcomes, 40; distinctive economicfeatures, 6–7; diversity among countriesof, 5, 54; economic performance, 1–2,38–41; financial openness, 7–12; future
challenges and opportunities, 4–5, 11–12,15–16, 41; governance trends, 12–14;income gap patterns and trends, 2–3,16–17, 48–49; land ownership patterns,48–49; political environment, 12–16,41; property rights regimes, 26–28;reasons for poor outcomes of reforms,43–53; recent reform history, 41–43;recommendations for reform, 35. See alsoAnalytical framework for evaluation ofLatin American economies; Brazil;Colombia; Costa Rica; Mexico; Peru
Legislative function of Government:Colombia’s reforms, 146; Costa Rica’sreforms, 160, 162–69; judicial systemreview, 34; shortcomings in Peru,270–74, 279–80. See also Politicalfunctioning
Macroeconomic policy: access to inter-national capital and, 9–11; Brazil,29–30, 79–80, 86, 107; case studyreforms and outcomes, 25–26, 29–31;central bank autonomy, 26; Colombia,114, 118–20, 121–22; Costa Rica, 161,164, 188, 190; foundations for economicgrowth, 21–22, 55; future challenges andopportunities, 11–12; Mexico, 197–98;Peru, 245–46. See also Foundations foreconomic growth
Market-based economy: anti-market aspectsof Brazil’s reforms, 78–83, 106; anti-market political movements, 42–43;foundations for growth in LatinAmerica, 54–55; Mexico’s reform goals,192–93; Peru’s structural reforms, 247;public perception of market liberal-ization, 15–16; social welfare programsand, 30–31, 63; targeting problems inBrazil’s reforms, 68–69
Market entry: barriers to, 55; case studyreforms and outcomes, 25; foundationsfor economic growth, 21, 55; recom-mendations for reform in Mexico, 231
Mexico: competition policy, 33, 194,216–24; distribution of wealth andaccess, 198, 199, 200–01; financialsector, 224–32; foundations for eco-nomic growth, 196–200, 214–15,218–19, 228–29; growth decomposition,
300 index
11630-09_Index.qxd 6/2/09 4:07 PM Page 300
196; income per capita, 4; legal andjudicial system, 213–16, 221–22, 229;lost decade, 192; macroeconomicpolicies, 197–98; obstacles to successfulreform, 215–16, 219–21, 229–30;pension system, 207–09, 211; politicalcontext of reforms, 193–94, 203–05;poverty, 198–99; privatization effort, 29,209–11; property rights regime, 28, 197,214–15; public sector debt, 198; reasonsfor poor reform outcomes, 193–94,202–12; recent economic performance,4, 195–96, 202; recommendations forreform, 33, 194, 195, 207, 212, 214–16,222–24, 230–32; significance of reformexperience, 192–95, 232; total factorproductivity, 195, 196; trade policy,203–04, 206–07, 212. See also LatinAmerica
Nicaragua, 4North American Free Trade Association,
204, 206–07
Panama, 4Pension reform: Brazil, 78, 81, 88, 89–91;
Colombia, 121–22, 126, 136–37;Mexico, 207–09, 211; minimumretirement age, 89–90; negative effects,59; Peru, 59, 62, 247–48
Peru: central bank autonomy, 26;decentralization of governance, 250–51,253, 258, 261–62; distribution ofincome and growth benefits, 239–41,245–46; economic performance, 236,237, 238, 241; education system,253–66; financial sector reforms, 248;fiscal policies, 242–44; foundations ofgrowth, 242–46; future prospects, 237,241; governance problems, 268–74;growth decomposition, 238–39;macroeconomic policies, 26; macro-economic stability, 242–44, 245–46;pension reform, 59, 62, 247–48; policyreforms and outcomes, 23, 25, 26, 43,236–37, 245–51, 254–62, 266, 280–81;political environment, 32–33, 237–38,259–60, 266–68, 274–77; poverty andpoverty reduction efforts, 28–29,239–41, 254–56; property rights regime,
28, 245; public administration and civilservice, 248–53; public service delivery,32, 283; reasons for poor reformoutcomes, 248–51, 253–56, 266–77,281–82; recommendations for policyreform and implementation, 32–33,251–53, 262–66, 277–80; successfulreforms, 246–48; urban–ruraldifferences, 237, 241, 247. See alsoLatin America
Pilot projects: recommendations for publicservice delivery reform in Peru, 32;strategies for successful policyimplementation, 35
Policy reforms and outcomes: analyticalframework for Latin Americaneconomies, 5–6; Brazil, 75–86; capitalaccount liberalization, 7–9; classificationof reform strategies, 56–57; Colombia,111–12, 113–18, 124–44, 149–50;consideration of local conditions, 46,58–59, 60–61, 62–63; Costa Rica, 153,155, 156–60; design problems, 59–60;financial openness of Latin Americaneconomies, 7–12; findings from LatinAmerican case studies, 23–32, 43–53,63–65; focus on constraints to growth,18–19; foundations for economicgrowth, 18, 19–20, 21–22, 54–56;income inequality and, 17, 49–53, 64;institutional capacity, 60; internationalmarket considerations, 21; Mexico,192–95, 202–12; Peru, 23, 25, 26,236–37, 245–51, 254–62, 266, 280–82;political context, 14–15, 203–05;reasons for reform failure or poorperformance, 43, 46–53, 58–61, 68–69,79–82; recommendations arising fromcase study findings, 32–34, 35; reformgoals not related to growth, 43–46;sequencing of reforms, 59, 189–90;social welfare programs, market-orientedreforms and, 30–31; strategies forsuccessful implementation, 35, 61–63;unintended consequences, 28. See alsoFoundations for economic growth;Macroeconomic policy; Trade policy
Political functioning: anti-marketmovement, 42–43; Brazil’s development,76, 103–06; Brazil’s reforms and
index 301
11630-09_Index.qxd 6/2/09 4:07 PM Page 301
outcomes, 83–86, 107–08; Colombia’sjudicial system, 33–34; Colombia’sreforms and outcomes, 127–29;communication between governmentand civil society, 35; corruption,104–05; Costa Rica’s reform experience,31–32, 155–56, 159–60, 177–78,181–82, 190–91; democratic governancein Latin America, 12–16, 47–48;distinctive features of Latin Americaneconomies, 6; economic policyformulation and, 14–15; foundations foreconomic growth, 21, 22, 55–56; futurechallenges for reform efforts, 41,107–08; income inequality in LatinAmerica and, 47–48, 83–86; indicatorsof democratic governance, 12; Mexico’sreform policies and, 193–94, 203–05;motivations for income transfers, 24, 30;need for administrative reform in CostaRica, 160–61, 169–74; need forgovernance reform in Peru, 32, 268–74,277–78; need for legislative reform inCosta Rica, 160, 162–69; obstacles toeffective reform implementation, 60,64–65, 266–67; obstacles to publicsector administrative reform, 170,173–74; obstacles to tax reform, 177–78;obstacles to telecommunications reform,181–82; party fragmentation, 104–05;Peru, 237–38, 259–60, 266–68,274–77; recommendations for reform inBrazil, 88; recommendations for reformin Colombia, 145–46; regulatory reformand, 103; trends in Latin America, 41.See also Competition, economic andpolitical; Legislative function ofgovernment; Public opinion andunderstanding
Poverty: Brazil, 73; Colombia, 45, 116–18;Costa Rica, 156–57, 158, 188, 189;education and, 254–56; measurement,45; Mexico, 198–99; Peru, 28–29,239–41, 254–56
Privatization, 60; Brazil, 102, 103; Mexico’sexperience, 29, 209–11; obstacles totelecommunications reform in CostaRica, 180–82
Productivity: Brazil, 71–72, 78, 81, 106;Colombia, 112, 114; Costa Rica, 154;
foundations of growth concept, 18, 189;Mexico, 195; Peru, 238
Property rights: Brazil’s policies andoutcomes, 77, 79–80, 84, 86, 94, 107;case study reforms and outcomes, 24,26–28, 30; Costa Rica, 164, 187–88;financial sector reform and, 229;foundations for economic growth, 21,54–55; goals of Colombia’s 1990sreforms, 114; judicial system functioningfor protection of, 244; land ownershippatterns in Latin America, 48–49;Mexico’s policies and outcomes, 197;Peru, 28, 245; recommendations forpolicy reform, 33, 107. See also Foun-dations for economic growth
Public perception and understanding:communication between governmentand civil society, 35; educational reformefforts in Peru, 259–60; foundations for economic growth, 55–56; futurechallenges for reform efforts, 41, 108;future prospects for Latin Americaneconomies, 15–16; judicial systemreform, 94–95; market economies, 15; of reform outcomes, 108; strategies forreform implementation, 190, 191;support for educational reform, 100–01
Public service delivery. See Welfare programsand public spending
Securitization of government liabilities, 9Spence Report, 20
Tax policy: Brazil, 29, 74–75, 79, 81, 88,91–92, 96; Colombia, 122, 126, 131–32,148; Costa Rica, 161, 174–79; distribu-tion effects of social spending and, 74–75
Telecommunications industry, Costa Rica,161, 162, 179–82
Trade policy: access to international capitaland, 10–11; Brazil, 76, 77; Colombia,120; Costa Rica, 162, 182–87; Mexico,203–04, 206–07, 212; sequencing ofreforms, 59
Transportation infrastructure, Costa Rica,171–73
Unintended consequences of policy reforms,28
302 index
11630-09_Index.qxd 6/2/09 4:07 PM Page 302
Urban–rural differences: income inequality,28; Peru, 237, 241, 247
Venezuela, 4, 5, 7, 43
Washington consensus, 18, 24, 153, 237Welfare programs and public spending:
Brazil, 74–75, 78, 80–81, 84–85, 107;
Colombia, 31, 122–23; consensualdefinition of adequate services, 34; Costa Rica, 31, 158–59, 169–74;market-oriented reform and, 30–31, 63;Peru, 32, 283; reform goals based onimproving, 43–46; regional approach,32; results-based budgeting, 252–53. See also Pension reform
index 303
11630-09_Index.qxd 6/2/09 4:07 PM Page 303

11630-09_Index.qxd 6/2/09 4:07 PM Page 304